UNITED STATES
SECURITIES AND EXCHANGE COMMISSION
Washington, D.C. 20549 |
CERTIFIED SHAREHOLDER REPORT OF REGISTERED
MANAGEMENT INVESTMENT COMPANIES |
Investment Company Act file number 811-08043
The Berkshire Funds
(Exact name of registrant as specified in charter) |
475 Milan Drive, Suite #103
San Jose, CA 95134-2453
(Address of principal executive offices) (Zip code) |
Malcolm R. Fobes III
The Berkshire Funds
475 Milan Drive, Suite #103
San Jose, CA 95134-2453
(Name and address of agent for service) |
1-408-526-0707
Registrant's telephone number, including area code |
| Date of fiscal year end: December 31 |
| Date of reporting period: June 30, 2016 |
Item 1. Reports to Stockholders.
This report is provided for the general information of the Berkshire Funds shareholders. It is not authorized for distribution unless preceded or accompanied by an effective Prospectus, which contains more complete information about the Berkshire Funds. Please read it carefully before you invest.
In recent years, returns have sustained significant gains and losses due to market volatility in the technology sector. Due to market volatility, current performance may be lower than the figures shown. Call 1-877-526-0707 or visit berkshirefunds.com for more current performance information. Past performance is no guarantee of future results and investment results and principal value will fluctuate so that shares, when redeemed, may be worth more or less than their original cost. The returns shown do not reflect the deduction of taxes that a shareholder would pay on Fund distributions or the redemption of Fund shares. Total return includes reinvestment of dividends and capital gain distributions.
The Dow Jones Industrial Average is a measurement of general market price movement for 30 widely-held stocks primarily listed on the New York Stock Exchange. The S&P 500® Index is a registered trademark of Standard & Poor’s Corporation and is a market-weighted index of common stock prices for 500 large U.S. companies. The Nasdaq Composite Index is a capitalization-weighted index of over 5,000 common stocks listed on the Nasdaq Stock Market. Each index represents an unmanaged, broad-based basket of stocks. These indices are typically used as benchmarks for overall market performance.
Portfolio composition is subject to change at any time and references to specific securities, industries and sectors are not recommendations to purchase or sell any particular security.
FUND OVERVIEW
June 30, 2016 (unaudited) |
PERFORMANCE COMPARISON (Average annual total returns as of 6/30/16)
| | | YTD | (1) | 1 Year | | 3 Year | | 5 Year | | 10 Year | | Since Inception | (2) |
| |
| Berkshire Focus Fund | | –10.28 | % | –10.90 | % | 10.78 | % | 8.53 | % | 10.97 | % | 4.21 | % |
|
| S&P 500® Index | | 3.84 | % | 3.99 | % | 11.66 | % | 12.10 | % | 7.42 | % | 6.58 | % |
| Dow Jones Industrial Average | | 4.31 | % | 4.50 | % | 8.99 | % | 10.41 | % | 7.66 | % | 6.96 | % |
| Nasdaq Composite Index | | –2.16 | % | –1.58 | % | 13.91 | % | 13.28 | % | 9.56 | % | 7.52 | % |
| NET ASSETS | |
| 6/30/16 | $55.1 Million |
| NET ASSET VALUE | | |
| Net Asset Value Per Share | $ | 16.32 |
| TOP TEN STOCK HOLDINGS(3) | |
| Amazon.com, Inc. | 17.39 | % |
| Facebook, Inc. (Class A) | 9.90 | % |
| Salesforce.com, Inc. | 7.88 | % |
| Applied Materials, Inc. | 7.56 | % |
| Broadcom Ltd. | 6.38 | % |
| Microsoft Corp. | 4.99 | % |
| Alphabet, Inc. (Class A) | 4.98 | % |
| Twitter, Inc. | 4.98 | % |
| Alibaba Group Holding Ltd. – ADR | 4.97 | % |
| Under Armour, Inc. (Class A) | 4.96 | % |
| |
| TOP TEN SECTORS(5) | | |
| Internet Software & Services | 27.92 | % |
| Semiconductor | 20.86 | % |
| Business Software & Services | 19.93 | % |
| Internet Social Media | 15.92 | % |
| Apparel Clothing | 4.96 | % |
| Retail | 4.82 | % |
| Networking Equipment | 2.01 | % |
| Computer Hardware | 0.51 | % |
| Automobile Manufacturers | 0.00 | % |
| Restaurants | 0.00 | % |
| (1) | Not annualized for periods of less than one full year. |
| |
| (2) | The Fund’s inception date was July 1, 1997. |
| |
| (3) | Stated as a percentage of total net assets as of 6/30/16. The holdings information provided should not be construed as a recommendation to purchase or sell a particular security and may not be representative of the Fund’s current or future investments. |
| |
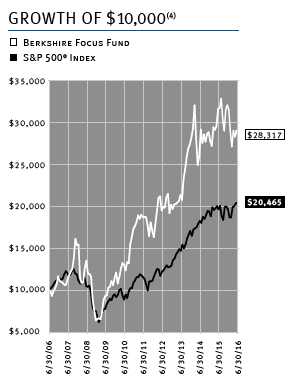
| (4) | This chart assumes an initial investment of $10,000 made on June 30, 2006. Past performance does not guarantee future results. Investment return and principal value will fluctuate so that shares, when redeemed, may be worth more or less than their original cost. All returns reflect reinvested dividends but do not reflect the impact of taxes. |
| |
| (5) | Stated as a percentage of total net assets as of 6/30/16. The holdings by sector are presented to illustrate examples of the sectors in which the Fund has bought securities and may not be representative of the Fund’s current or future investments. |
| |
| | This Fund concentrates its investments in the technology industry. As a result, the Fund is subject to greater risk than more diversified funds because of its concentration of investments in fewer companies and certain segments of a single industry. |
| |
1
Berkshire Focus Fund
Performance and Portfolio Discussion
6/30/2016
2
LETTER TO THE SHAREHOLDERS

Dear Fellow Shareholders,
For the six-month period ended June 30, 2016, the Berkshire Focus Fund underperformed its primary benchmark index. The Fund generated a total return of -10.28% while the S&P 500® Index – which we consider to be the Fund’s primary benchmark index – had a total return of +3.84% over the same period. For comparative purposes, the Dow Jones Industrial Average posted a return of +4.31% and the Nasdaq Composite Index generated a return of -2.61% during the first half of the year. Please see the Fund Overview section and the accompanying financial statements for more detailed information about the Fund’s longer-term performance. All return data includes reinvested dividends but do not reflect the impact of taxes.
Equity markets sold-off sharply at the beginning of the first quarter as investors grappled with persistent worries about whether the U.S. economy was sufficiently healthy enough to merit the cadence of rate hikes projected by the Fed. Making matters worse, a large devaluation of the yuan by the People’s Bank of China at the beginning of the period ignited sell-offs in the Chinese and global equity markets. Negative investor sentiment was further aggravated by fears of a slowdown of the world’s second largest economy and over new concerns that deflationary pressures may be exported from China to other world economies. Also adding to investor angst was an amalgam of other developments: including global growth concerns, manifested through a collapse in oil prices falling to levels not seen in over a decade, and questions about energy companies’ ability to repay their debts. Finally, worries over modest consumer spending in the U.S. despite strong job growth and low energy prices, and strength of the U.S. dollar – a negative for U.S. companies’ earnings prospects – weighed heavily on investor sentiment. Faced with a seemingly endless stream of negative events, U.S. equity markets succumbed to a crisis of confidence that would last until mid-February as stocks got off to one of the worst starts to a calendar year in history. Unnerved, U.S. stock markets came roaring back in late-February and March as equities reached extreme technically-oversold levels. The market’s strong move occurred alongside an advance in crude oil, with the commodity seeing a boost amid reports of a production freeze agreement between OPEC and non-OPEC members. Stocks ended the quarter in upbeat fashion, with the major U.S. indices recouping nearly all of the losses since the start of the year.
In the second quarter the health of the U.S. economy and its ability to sustain further interest rate hikes by the Federal Reserve remained in focus. Meanwhile, U.S. equity markets saw a continuation of oil and stocks moving largely in tandem – with crude oil rebounding from multi-year lows. Also during the period stability of the Chinese markets, dovish commentary from Fed Chair Janet Yellen and the ensuing shift of the market’s rate hike expectations – all helped to diminish investor’s concerns. Against this backdrop, market volatility declined and stocks generally traded in a narrow range. Going into the end of the June, however, U.S. and global equity markets plummeted once again as investors reacted to the potential implications to a surprise vote of the United Kingdom leaving the European Union (“Brexit”). U.S. stock markets alongside the global bourses remained near their lows into the last day of the quarter.
Looking at the portfolio, investments in Amazon.com (AMZN), Applied Materials (AMAT), Facebook (FB), Salesforce.com (CRM), and Ulta Salon (ULTA) were contributors to our performance. Some of our investments struggled however, which detracted from our performance during the period. These included Alphabet (GOOGL), LinkedIn (LNKD), Microsoft (MSFT), Netflix (NFLX), Nike (NKE), ServiceNow (NOW), Starbucks (SBUX), Tableau Software (DATA), Tesla (TSLA) and Twitter (TWTR).
Thank you for your confidence and continued investment in the Berkshire Focus Fund.

Malcolm R. Fobes III
Chairman and Chief Investment Officer
3
Financial Statements
(unaudited)
6/30/2016
4
PORTFOLIO OF INVESTMENTS
June 30, 2016 (unaudited) |
| Shares | | | Value |
| |
| | COMMON STOCKS – 96.93% | $ | 53,419,628 |
| | (Cost $45,650,994) | | |
| |
| | APPAREL CLOTHING – 4.96% | | 2,732,326 |
| 5 | NIKE, Inc. (Class B) | | 276 |
| 68,080 | Under Armour, Inc. (Class A)* | | 2,732,050 |
| |
| | AUTOMOBILE MANUFACTURERS – 0.00% | | 1,061 |
| 5 | Tesla Motors, Inc.* | | 1,061 |
| |
| | BUSINESS SOFTWARE & SERVICES – 19.93% | | 10,983,745 |
| 14,560 | Adobe Systems, Inc.* | | 1,394,702 |
| 53,690 | Microsoft Corp. | | 2,747,317 |
| 54,685 | Salesforce.com, Inc.* | | 4,342,536 |
| 5 | ServiceNow, Inc.* | | 332 |
| 46,110 | Splunk, Inc.* | | 2,498,240 |
| 5 | Tableau Software, Inc. (Class A)* | | 245 |
| 5 | Workday, Inc. (Class A)* | | 373 |
| |
| | COMPUTER HARDWARE – 0.51% | | 277,718 |
| 2,905 | Apple, Inc. | | 277,718 |
| |
| | INTERNET SOCIAL MEDIA – 15.92% | | 8,774,433 |
| 47,720 | Facebook, Inc. (Class A)* | | 5,453,442 |
| 162,190 | Twitter, Inc.* | | 2,742,633 |
| 19,050 | Yelp, Inc.* | | 578,358 |
| |
| | INTERNET SOFTWARE & SERVICES – 27.92% | | 15,388,113 |
| 34,440 | Alibaba Group Holding Ltd. – ADR* | | 2,739,013 |
| 3,900 | Alphabet, Inc. (Class A)* | | 2,743,767 |
| 13,390 | Amazon.com, Inc.* | | 9,582,152 |
| 5 | Expedia, Inc. | | 531 |
| 3,525 | Netflix, Inc.* | | 322,467 |
| 5 | PayPal Holdings, Inc.* | | 183 |
| |
| | NETWORKING EQUIPMENT – 2.01% | | 1,107,330 |
| 38,575 | Cisco Systems, Inc. | | 1,106,717 |
| 5 | Palo Alto Networks, Inc.* | | 613 |
| |
| | RESTAURANTS – 0.00% | | 286 |
| 5 | Starbucks Corp. | | 286 |
| |
| | RETAIL – 4.82% | | 2,658,112 |
| 10,910 | ULTA Salon, Cosmetics & Fragrance, Inc.* | | 2,658,112 |
| |
| | SEMICONDUCTOR – 20.86% | | 11,496,504 |
| 173,870 | Applied Materials, Inc. | | 4,167,664 |
| 22,640 | Broadcom Ltd. | | 3,518,256 |
| 81,000 | Micron Technology, Inc.* | | 1,114,560 |
| 57,350 | NVIDIA Corp. | | 2,696,024 |
| |
| |
| | *non-income producing | | |
| |
| |
| | (see accompanying notes to financial statements) | | |
5
PORTFOLIO OF INVESTMENTS (CONTINUED)
June 30, 2016 (unaudited) |
| Shares | | | Value |
| |
| | EXCHANGE TRADED FUNDS – 3.03% | | 1,669,209 |
| | (Cost $1,650,222) | | |
| 2,580 | Powershares QQQ | | 277,453 |
| 10 | ProShares Ultra QQQ | | 712 |
| 24,400 | VanEck Vectors Semiconductor ETF | | 1,391,044 |
| |
| |
| | TOTAL INVESTMENT SECURITIES – 99.96% | | 55,088,837 |
| | (Cost $47,301,216) | | |
| |
| | OTHER ASSETS IN EXCESS OF LIABILITIES – 0.04% | | 21,382 |
| |
| | NET ASSETS – 100.00% | $ | 55,110,219 |
| | Equivalent to $16.32 per share | | |
| |
| |
| |
| | *non-income producing | | |
| |
| |
| | (see accompanying notes to financial statements) | | |
6
STATEMENT OF ASSETS AND LIABILITIES
June 30, 2016 (unaudited) |
| ASSETS | | | |
| Investment securities: | | | |
| At cost | $ | 47,301,216 | |
| At value | $ | 55,088,837 | |
| Receivable for securities sold | | 1,864,229 | |
| Receivable for capital shares sold | | 10,143 | |
| Total Assets | | 56,963,209 | |
| |
| |
| LIABILITIES | | | |
| Payable for securities purchased | | 1,634,699 | |
| Payable for capital shares redeemed | | 34,833 | |
| Payable to affiliate (Note 5) | | 92,878 | |
| Payable to custodian | | 90,580 | |
| Total Liabilities | | 1,852,990 | |
| |
| |
| NET ASSETS | $ | 55,110,219 | |
| |
| |
| Net assets consist of: | | | |
| Paid-in capital | $ | 54,157,490 | |
| Undistributed net investment loss | | (424,306 | ) |
| Accumulated net realized losses from security transactions | | (6,410,586 | ) |
| Net unrealized appreciation on investments | | 7,787,621 | |
| Net Assets | $ | 55,110,219 | |
| |
| Shares of beneficial interest issued and outstanding | | | |
| (unlimited number of shares authorized, without par value) | | 3,376,931 | |
| |
| Net asset value and offering price per share | $ | 16.32 | |
| |
| Minimum redemption price per share* | $ | 15.99 | |
*The Fund will impose a 2.00% redemption fee on shares redeemed within 90 calendar days of purchase.
(see accompanying notes to financial statements)
7
STATEMENT OF OPERATIONS
For the Six Months Ended June 30, 2016 (unaudited)
| INVESTMENT INCOME | | | |
| Dividends | $ | 168,495 | |
| Total investment income | | 168,495 | |
| |
| EXPENSES | | | |
| Investment advisory fees (Note 5) | | 445,720 | |
| Administrative fees (Note 5) | | 146,182 | |
| Interest expense | | 899 | |
| Total Expenses | | 592,801 | |
| |
| NET INVESTMENT LOSS | | (424,306 | ) |
| |
| |
| REALIZED AND UNREALIZED | | | |
| GAINS (LOSSES) ON INVESTMENTS | | | |
| Net realized losses from security transactions | | (5,317,628 | ) |
| Net change in unrealized appreciation/depreciation on investments | | (1,308,530 | ) |
| |
| NET REALIZED AND UNREALIZED | | | |
| LOSSES ON INVESTMENTS | | (6,626,158 | ) |
| |
| NET DECREASE IN NET ASSETS | | | |
| FROM OPERATIONS | $ | (7,050,464 | ) |
| |
| |
| (see accompanying notes to financial statements) | | | |
8
STATEMENTS OF CHANGES IN NET ASSETS
For the Periods Ended June 30, 2016 (unaudited) and December 31, 2015
| | | Six Months | | | Year | |
| | | Ended | | | Ended | |
| | | 6/30/16 | | | 12/31/15 | |
| | | (unaudited) | | | | |
| FROM OPERATIONS: | | | | | | |
| Net investment loss | $ | (424,306 | ) | $ | (1,231,648 | ) |
| Net realized gains (losses) from security transactions | | (5,317,628 | ) | | 12,219,337 | |
| Net change in unrealized appreciation/ | | | | | | |
| depreciation on investments | | (1,308,530 | ) | | (3,374,470 | ) |
| Net increase (decrease) in net assets from operations | | (7,050,464 | ) | | 7,613,219 | |
| |
| |
| FROM DISTRIBUTIONS: | | | | | | |
| Net realized gains from security transactions | | – | | | (6,030,774 | ) |
| Net decrease in net assets resulting from | | | | | | |
| distributions paid | | – | | | (6,030,774 | ) |
| |
| |
| FROM CAPITAL SHARE TRANSACTIONS: | | | | | | |
| Proceeds from shares sold | | 3,979,720 | | | 15,132,842 | |
| Proceeds from reinvested distributions | | – | | | 5,951,649 | |
| Proceeds from redemption fees (Note 6) | | 17,866 | | | 18,141 | |
| Payments for shares redeemed | | (10,782,010 | ) | | (17,526,683 | ) |
| Net increase (decrease) in net assets from | | | | | | |
| capital share transactions | | (6,784,424 | ) | | 3,575,949 | |
| |
| |
| TOTAL INCREASE (DECREASE) IN NET ASSETS | | (13,834,888 | ) | | 5,158,394 | |
| |
| |
| NET ASSETS: | | | | | | |
| Beginning of period | | 68,945,107 | | | 63,786,713 | |
| End of period(a) | $ | 55,110,219 | | $ | 68,945,107 | |
| |
| |
| CAPITAL SHARE ACTIVITY: | | | | | | |
| Shares sold | | 244,940 | | | 766,207 | |
| Shares reinvested | | – | | | 327,193 | |
| Shares redeemed | | (658,805 | ) | | (930,422 | ) |
| Net increase (decrease) in shares outstanding | | (413,865 | ) | | 162,978 | |
| Shares outstanding, beginning of period | | 3,790,796 | | | 3,627,818 | |
| Shares outstanding, end of period | | 3,376,931 | | | 3,790,796 | |
(a) Accumulated undistributed net investment income is $0 for the year ended December 31, 2015.
(see accompanying notes to financial statements) |
9
FINANCIAL HIGHLIGHTS
Selected Per Share Data and Ratios for a Share Outstanding Throughout Each Year
| | | Six Months | Year | | | Year | | | Year | | | Year | | | Year | |
| | | Ended | | | | Ended | | | Ended | | | Ended | | | Ended | | | Ended | |
| | | 6/30/16 | | | 12/31/15 | | | 12/31/14 | | | 12/31/13 | | | 12/31/12 | | | 12/31/11 | |
| | | (unaudited) | | | | | | | | | | | | | | | | | |
| NET ASSET VALUE, | | | | | | | | | | | | | | | | | | | |
| BEGINNING OF PERIOD | $ | 18.19 | | $ | 17.58 | | $ | 17.83 | | $ | 14.05 | | $ | 11.67 | | $ | 12.61 | |
| |
| INCOME FROM INVESTMENT OPERATIONS: | | | | | | | | | | | | | | | | | | | |
| Net investment loss | | (0.12 | )(b) | | | (0.36 | )(b) | | (0.35 | )(b) | | (0.22 | )(a) | | (0.22 | )(a) | | (0.28 | )(a) |
| Net realized and unrealized gains | | | | | | | | | | | | | | | | | | | |
| (losses) on investments | | (1.76 | )(c) | | | 2.69 | (c) | | 0.08 | (c) | | 6.26 | | | 2.59 | | | (0.73 | ) |
| Total from investment operations | | (1.88 | ) | | | 2.33 | | | (0.27 | ) | | 6.04 | | | 2.37 | | | (1.01 | ) |
| |
| Proceeds from redemption fees | | .0.01 | | | | 0.01 | | | 0.03 | | | 0.01 | | | 0.01 | | | .0.07 | |
| |
| LESS DISTRIBUTIONS: | | | | | | | | | | | | | | | | | | | |
| Distributions from net realized gains | | 0.00 | | | | (1.73 | ) | | (0.01 | ) | | (2.27 | ) | | 0.00 | | | 0.00 | |
| Total disrtibutions | | 0.00 | | | | (1.73 | ) | | (0.01 | ) | | (2.27 | ) | | 0.00 | | | 0.00 | |
| |
| NET ASSET VALUE, | | | | | | | | | | | | | | | | | | | |
| END OF PERIOD | $ | 16.32 | | $ | 18.19 | | $ | 17.58 | | $ | 17.83 | | $ | 14.05 | | $ | 11.67 | |
| |
| |
| TOTAL RETURN(d) | | (10.28 | %)(h) | | | 13.32 | % | | (1.36 | %) | | 43.09 | % | | 20.39 | % | | (7.45 | %) |
| |
| |
| |
| SUPPLEMENTAL DATA AND RATIOS: | | | | | | | | | | | | | | | | | | | |
| Net assets at end of period (thousands) | $ | 55,110 | | $ | 68,945 | | $ | 63,787 | | $ | 71,484 | | $ | 53,903 | | $ | 30,191 | |
| |
| Ratio of expenses to average net assets(e) | | 1.99 | %(g) | | | 1.99 | % | | 1.99 | % | | 2.00 | % | | 2.00 | % | | 2.01 | % |
| Ratio of net investment loss to | | | | | | | | | | | | | | | | | | | |
| average net assets | | (1.43 | %)(g) | | | (1.88 | %) | | (1.95 | %) | | (1.60 | %) | | (1.64 | %) | | (1.88 | %) |
| |
| Portfolio turnover rate(f) | | 215.0 | %(h) | | | 455.6 | % | | 533.7 | % | | 464.1 | % | | 613.8 | % | | 796.3 | % |
| (a) | Net investment loss per share is calculated using ending balances prior to consideration or adjustment |
| | for permanent book and tax differences. |
| (b) | Net investment loss was calculated using the average shares outstanding method. |
| (c) | Net realized and unrealized gain on investments per share is a balancing amount necessary to reconcile |
| | the change in net asset value per share for the period, and may not reconcile with the net realized and |
| | unrealized loss on investments in the statement of operations. |
| (d) | Total return represents the rate that the investor would have earned or (lost) on an investment in the Fund |
| | assuming reinvestment of dividends. |
| (e) | The ratio of expenses to average net assets includes interest expense. The ratios excluding interest expense |
| | would be 1.99%, 1.99%, 1.98%, 1.99%, 2.00% and 2.00%, respectively. |
| (f) | Portfolio turnover is greater than most funds due to the investment style of the Fund. |
| (g) | Annualized for periods of less than one full year. |
| (h) | Not annualized for periods of less than one full year. |
| (see accompanying notes to financial statements) |
10
NOTES TO FINANCIAL STATEMENTS
June 30, 2016 (unaudited)
1. Organization
The Berkshire Focus Fund (the “Fund”) is a non-diversified series of The Berkshire Funds (the “Trust”), an open-end management investment company registered under the Investment Company Act of 1940, as amended (the “1940 Act”). The Trust was organized as a Delaware business trust on November 25, 1996. The Fund commenced operations on July 1, 1997. The Fund’s investment objective is to seek long-term growth of capital primarily through investments in equity securities.
2. Significant Accounting Policies
The Fund is an investment company and accordingly follows the investment company accounting and reporting guidance of the Financial Accounting Standards Board Accounting Standards Codification Topic 946 Financial Services – Investment Companies.
The following is a summary of the Trust’s significant accounting policies:
Securities valuation — The Fund's portfolio securities are valued as of the close of the regular session of trading on the New York Stock Exchange (the “NYSE”), normally 4:00 p.m., Eastern time. Securities which are traded on stock exchanges or are quoted by Nasdaq are valued at the last reported sale price as of the close of the regular session of trading on the NYSE, or, if not traded, at the most recent bid price. Securities which are traded in the over-the-counter market, and which are not quoted by Nasdaq, are valued at the most recent bid price, as obtained from one or more of the major market makers for such securities. Securities for which market quotations are not readily available are valued at their fair value as determined in good faith in accordance with consistently applied procedures established by and under the general supervision of the Board of Trustees.
The Trust has adopted accounting standards which establish an authoritative definition of fair value and set out a hierarchy for measuring fair value. These standards require additional disclosures about the various inputs and valuation techniques used to develop the measurements of fair value and a discussion of changes in valuation techniques and related inputs during the period. These standards define fair value as the price that would be received to sell an asset or paid to transfer a liability in an orderly transaction between market participants at the measurement date. The fair value hierarchy is organized into three levels based upon the assumptions (referred to as “inputs”) used in pricing the asset or liability. These standards state that “observable inputs” reflect the assumptions market participants would use in pricing the asset or liability based on market data obtained from independent sources and “unobservable inputs” reflect an entity's own assumptions about the assumptions market participants would use in pricing the asset or liability. These inputs are summarized in the three broad levels listed below:
Level 1 – quoted prices in active markets for identical securities.
Level 2 – other significant observable inputs (including quoted prices for similar securities, interest rates, prepayment speeds, credit risk, etc.).
11
NOTES TO FINANCIAL STATEMENTS
June 30, 2016 (unaudited)
Level 3 – significant unobservable inputs (including the Fund’s own assumptions in determining the fair value of investments).
The inputs or methodology used for valuing securities are not necessarily an indication of the risk associated with investing in those securities.
The following is a summary of the inputs used to value the Fund’s net assets as of June 30, 2016:
| | | Level 1 | Level 2 | Level 3 | | Total |
| Common Stocks | | | | | | |
| Internet Software & Services | $ | 15,388,113 | – | – | $ | 15,388,113 |
| Semiconductor | | 11,496,504 | – | – | | 11,496,504 |
| Business Software & Services | | 10,983,745 | – | – | | 10,983,745 |
| Internet Social Media | | 8,774,433 | – | – | | 8,774,433 |
| Apparel Clothing | | 2,732,326 | – | – | | 2,732,326 |
| Retail | | 2,658,112 | – | – | | 2,658,112 |
| Networking Equipment | | 1,107,330 | – | – | | 1,107,330 |
| Computer Hardware | | 277,718 | – | – | | 277,718 |
| Automobile Manufacturers | | 1,061 | – | – | | 1,061 |
| Restaurants | | 286 | – | – | | 286 |
| Total Common Stocks | | 53,419,628 | – | – | | 53,419,628 |
| Exchange Traded Funds | | 1,669,209 | – | – | | 1,669,209 |
| Total Investments | $ | 55,088,837 | – | – | $ | 55,088,837 |
There were no transfers into or out of Level 1, Level 2 or Level 3 fair value measurements during the reporting period, as compared to their classification from the most recent annual report. It is the Fund’s policy to consider transfers into or out of Level 1, Level 2 or Level 3 as of the end of the reporting period. The Fund did not hold any derivative instruments during the reporting period.
Investment income — Dividend income is recorded on the ex-dividend date. Interest income is accrued as earned.
Distributions to shareholders — Distributions to shareholders arising from net investment income and net realized capital gains, if any, are distributed at least once each year. Distributions to shareholders are recorded on the ex-dividend date. Dividends from net investment income and capital gain distributions are determined in accordance with income tax regulations, which may differ from accounting principles generally accepted in the United States of America (“GAAP”).
Security transactions — Security transactions are accounted for on the trade date. Securities sold are determined on a specific identification basis.
Estimates — The preparation of financial statements in conformity with GAAP requires management to make estimates and assumptions that affect the reported amounts of assets and liabilities and disclosure of contingent assets and liabilities at the date of the financial statements and the reported amounts of income and expenses during the reporting period. Actual results could differ from those estimates.
12
NOTES TO FINANCIAL STATEMENTS
June 30, 2016 (unaudited)
Federal income tax — The Fund intends to comply with the requirements of Subchapter M of the Internal Revenue Code (the “Code”) necessary to qualify as a regulated investment company. As provided therein, in any fiscal year in which the Fund so qualifies and distributes at least 90% of its taxable net income, the Fund (but not the shareholders) will be relieved of federal income tax on the income distributed. Accordingly, no provision for income taxes has been made.
As of and during the year ended December 31, 2015, the Fund did not have a liability for any unrecognized tax benefits. The Fund recognizes interest and penalties, if any, related to unrecognized tax benefits as other expense on the statement of operations. During the year, the Fund did not incur any tax-related interest or penalties.
In order to avoid imposition of the excise tax applicable to regulated investment companies, it is also the Fund’s intention to declare as dividends in each calendar year at least 98% of its net investment income and 98.2% of its net realized capital gains plus undistributed amounts from prior years.
Other — The treatment for financial reporting purposes of distributions made to shareholders during the year from net investment income or net realized capital gains may differ from their ultimate treatment for federal income tax purposes. These differences are caused primarily by differences in the timing of the recognition of certain components of income, expense or realized capital gain for federal income tax purposes. Where such differences are permanent in nature, they are reclassified in the components of the net assets based on their ultimate characterization for federal income tax purposes. Any such reclassifications will have no effect on net assets, results of operations or net asset value per share of the Fund. For the year ended December 31, 2015, the Fund reclassified the net investment loss of $1,231,648 to paid-in capital.
3. Investment Transactions
Purchases and sales of investment securities (excluding short-term instruments) for the six months ended June 30, 2016 were $131,492,286 and $138,223,438, respectively. There were no purchases or sales of U.S. Government securities for the Fund.
4. Tax Information
As of December 31, 2015, the components of accumulated earnings (deficit) on a tax basis were as follows:
| Federal income tax cost | $ | 60,514,287 | |
| Gross unrealized appreciation | $ | 9,857,526 | |
| Gross unrealized depreciation | | | (1,925,666 | ) |
| Net unrealized appreciation | | | 7,931,860 | |
| Undistributed ordinary income | | | – | |
| Undistributed long term gains | | | 71,333 | |
| Accumulated losses | | | – | |
| Total accumulated gains | $ | | 8,003,193 | |
13
NOTES TO FINANCIAL STATEMENTS
June 30, 2016 (unaudited)
The cost basis of investments for tax and financial reporting purposes differs primarily due to the deferral of capital losses from wash sales.
There was no distribution paid during for the six months ended June 30, 2016. There was a long-term capital gains distribution paid in the amount of $6,030,774 during the year ended December 31, 2015.
At December 31, 2015, the Fund had no accumulated net realized capital loss carryforwards. During the year ended December 31, 2015, the Fund utilized $4,686,738 of its outstanding loss carryforward.
5. Related Party Transactions, Investment Advisory and Administrative Fees
Certain Officers and Trustees of the Trust are also Officers and Directors of Berkshire Capital Holdings, Inc. (“Berkshire Capital”). The non-interested Trustees of the Fund were not paid any Trustee fees and expenses directly by Berkshire Capital during the six months ended June 30, 2016.
The Fund has an Investment Advisory Agreement (the “Advisory Agreement”) and a separate Administration Agreement with Berkshire Capital. Under the Advisory Agreement, Berkshire Capital will determine what securities will be purchased, retained or sold by the Fund on the basis of a continuous review of the portfolio. For the services it provides under the Advisory Agreement, Berkshire Capital receives a fee accrued each calendar day (including weekends and holidays) at a rate of 1.50% per annum of the daily net assets of the Fund. Under the Administration Agreement, Berkshire Capital renders all administrative and supervisory services of the Fund, as well as facilities furnished and expenses assumed. For these services, Berkshire Capital receives a fee at the annual rate of 0.50% of the Fund’s average daily net assets up to $50 million, 0.45% of average net assets from $50 million to $200 million, 0.40% of average net assets from $200 million to $500 million, 0.35% of average net assets from $500 million to $1 billion and 0.30% of average net assets in excess of $1 billion. Such fee is computed as a percentage of the Fund’s daily net assets and is accrued each calendar day (including weekends and holidays). For the six months ended June 30, 2016, Berkshire Capital was paid an investment advisory fee of $445,720 and an administration fee of $146,182 from the Fund. The amount due to Berkshire Capital for these fees at June 30, 2016 totaled $92,878.
6. Redemption Fee
The Fund may impose a redemption fee of 2.00% on shares held for 90 days or less. For the six months ended June 30, 2016, proceeds from redemption fees were $17,866.
14
NOTES TO FINANCIAL STATEMENTS
June 30, 2016 (unaudited)
7. Beneficial Ownership
The beneficial ownership, either directly or indirectly, of more than 25% of the voting securities of a fund creates a presumption of control of the Fund, under Section 2(a)(9) of the Investment Company Act of 1940. At June 30, 2016, National Financial Services Corp. and Charles Schwab & Co. beneficially owned, in aggregate, 38.06% and 31.45% of the Fund, respectively.
8. Subsequent Events
In preparing these financial statements, management has performed an evaluation of subsequent events after June 30, 2016 and determined that there were no significant subsequent events that would require adjustment to or additional disclosure in the financial statements.
15
ADDITIONAL INFORMATION
(unaudited) |
As a shareholder of the Fund, you incur two types of costs: (1) transaction costs, and (2) ongoing costs, including advisory fees, administrative fees and interest expense. This Example is intended to help you understand your ongoing costs (in dollars) of investing in the Fund and to compare these costs with the ongoing costs of investing in other mutual funds. The Example is based on an investment of $1,000 invested in the Fund on January 1, 2016 and held through June 30, 2016.
Actual Expenses
The first line of the table on the following page provides information about actual account values and actual expenses. Although the Fund charges no sales load or transaction fees, you will be assessed fees for outgoing wire transfers, returned checks and stop payment orders at prevailing rates charged by Mutual Shareholder Services, LLC, the Fund’s transfer agent. If you request that a redemption be made by wire transfer, currently a $20.00 fee is charged by the Fund’s transfer agent. IRA accounts will be charged an $8.00 annual maintenance fee. To the extent the Fund invests in shares of other investment companies as part of its investment strategy, you will indirectly bear your proportionate share of any fees and expenses charged by the underlying funds in which the Fund invests in addition to the expenses of the Fund. Actual expenses of the underlying funds are expected to vary among the various underlying funds. These expenses are not included in the example. The example includes advisory fees, administrative fees and interest expense. However, the example does not include portfolio trading commissions and related expenses and other extraordinary expenses as determined under generally accepted accounting principles. You may use the information in this line, together with the amount you invested, to estimate the expenses that you paid over the period. Simply divide your account value by $1,000 (for example, an $8,600 account value divided by $1,000 = 8.6), then multiply the result by the number in the first line under the heading entitled “Expenses Paid During Period” to estimate the expenses you paid on your account during this period.
Hypothetical Example for Comparison Purposes
The second line of the table provides information about hypothetical account values and hypothetical expenses based on the Fund’s actual expense ratio and an assumed rate of return of 5% per year before expenses, which is not the Fund's actual return. The hypothetical account values and expenses may not be used to estimate the actual ending account balance or expenses you paid for the period. You may use this information to compare the ongoing costs of investing in the Fund and other funds. To do so, compare this 5% hypothetical example with the 5%
16
ADDITIONAL INFORMATION
(unaudited) |
hypothetical examples that appear in the shareholder reports of the other funds. Please note that the expenses shown in the table are meant to highlight your ongoing costs only and do not reflect any transactional costs. Therefore, the second line of the table is useful in comparing ongoing costs only, and will not help you determine the relative total costs of owning different funds. In addition, if these transactional costs were included, your costs would have been higher.
| | | | | | | Expenses Paid |
| | | Beginning | | Ending | | During the Period* |
| | | Account Value | | Account Value | | January 1, 2016 to |
| | | January 1, 2016 | | June 30, 2016 | | June 30, 2016 |
| Actual | $ | 1,000.00 | $ | 897.20 | $ | 9.42 |
| |
| Hypothetical | $ | 1,000.00 | $ | 1,014.93 | $ | 10.01 |
| (5% annual return before expenses) | | | | |
*Expenses are equal to the Fund’s annualized expense ratio of 1.99%, multiplied by the average account value over the period, multiplied by 182/366 to reflect the one-half year period.
Proxy Voting Guidelines
Berkshire Capital Holdings, Inc., the Fund’s Adviser, is responsible for exercising the voting rights associated with the securities held by the Fund. A description of the policies and procedures used by the Adviser in fulfilling this responsibility and a record of the Fund’s proxy votes for the most recent twelve month period ended June 30, are available without charge, upon request, by calling toll free 1-877-526-0707. They are also available on the Securities and Exchange Commission’s (“SEC”) website at http://www.sec.gov.
Quarterly Filing of Portfolio Holdings
The Fund files its complete schedule of portfolio holdings with the SEC for the first and third quarters of each fiscal year on Form N-Q. The Fund’s Forms N-Q are available on the SEC’s website at http://www.sec.gov. The Fund’s Forms N-Q may also be reviewed and copied at the SEC’s Public Reference Room in Washington, DC. Information on the operation of the Public Reference Room may be obtained by calling 1-202-551-8090 (direct) or 1-800-SEC-0330 (general SEC number).
Tax Information
The percentage of taxable ordinary income distributions that are designated as short-term capital gain distributions under Internal Revenue Service Section 871(k)(2)(c) for the Fund was 0%.
17

Item 2. Code of Ethics.
Not applicable for semi-annual reports.
Item 3. Audit Committee Financial Expert.
Not applicable for semi-annual reports.
Item 4. Principal Accountant Fees and Services.
Not applicable for semi-annual reports.
Item 5. Audit Committee of Listed Registrants.
Not applicable to registrants who are not listed issuers (as defined in Rule 10A-3 under the Securities Exchange Act of 1934).
Item 6. Investments.
Schedule of Investments is included as part of the report to shareholders filed under Item 1 of this Form
Item 7. Disclosure of Proxy Voting Policies and Procedures for Closed-End Management Investment Companies.
Not applicable to open-end investment companies.
Item 8. Portfolio Managers of Closed-End Management Investment Companies.
Not applicable to open-end investment companies.
Item 9. Purchases of Equity Securities by Closed-End Management Investment Company and Affiliated Purchasers.
Not applicable to open-end investment companies.
Item 10. Submission of Matters to a Vote of Security Holders.
Not Applicable.
Item 11. Controls and Procedures.
| (a) | The Registrant’s President, Treasurer and Chief Financial Officer has reviewed the Registrant's disclosure controls and procedures (as defined in Rule 30a-3(c) under the Investment Company Act of 1940 (the “Act”)) as of a date within 90 days of the filing of this report, as required by Rule 30a-3(b) under the Act and Rules 13a- 15(b) or 15d-15(b) under the Securities Exchange Act of 1934. Based on their review, such officers have concluded that the disclosure controls and procedures are effective in ensuring that information required to be disclosed in this report is appropriately recorded, processed, summarized and reported and made known to them by others within the Registrant and by the Registrant’s service provider. |
| |
| (b) | There were no changes in the Registrant's internal control over financial reporting (as defined in Rule 30a-3(d) under the Act) that occurred during the second fiscal quarter of the period covered by this report that has materially affected, or is reasonably likely to materially affect, the Registrant's internal control over financial reporting. |
| |
| (a) | (1) Any code of ethics or amendment thereto, that is the subject of the disclosure required
by Item 2, to the extent that the registrant intends to satisfy Item 2 requirements through
filing an exhibit. 1) Not Applicable |
| |
| | (2) | A separate certification for each principal executive officer and principal financial officer |
|
| | pursuant to Section 302 of the Sarbanes-Oxley Act of 2002. Filed herewith. |
| |
| | (3) | Any written solicitation to purchase securities under Rule 23c-1 under the Act sent or |
|
| | given during the period covered by the report by or on behalf of the registrant to 10 or more
persons. Not applicable to open-end investment companies. |
| |
| (b) | Certifications pursuant to Section 906 of the Sarbanes-Oxley Act of 2002. Furnished herewith. |
| |
SIGNATURES
Pursuant to the requirements of the Securities Exchange Act of 1934 and the Investment Company Act of 1940, the registrant has duly caused this report to be signed on its behalf by the undersigned, thereunto duly authorized.
| The Berkshire Funds |
| |
| By /s/ Malcolm R. Fobes III |
| Malcolm R. Fobes III |
| President and Treasurer |
| |
| Date 9/1/16 |
Pursuant to the requirements of the Securities Exchange Act of 1934 and the Investment Company Act of 1940, this report has been signed below by the following persons on behalf of the registrant and in the capacities and on the dates indicated.
| By | /s/ Malcolm R. Fobes III |
| | Malcolm R. Fobes III |
| | President and Treasurer |
| |
| Date | 9/1/16 |