UNITED STATES
SECURITIES AND EXCHANGE COMMISSION
Washington, D.C. 20549 |
CERTIFIED SHAREHOLDER REPORT OF REGISTERED
MANAGEMENT INVESTMENT COMPANIES |
Investment Company Act file number 811-08043
The Berkshire Funds
(Exact name of registrant as specified in charter) |
475 Milan Drive, Suite #103
San Jose, CA 95134-2453
(Address of principal executive offices) (Zip code)
Malcolm R. Fobes III
The Berkshire Funds
475 Milan Drive, Suite #103
San Jose, CA 95134-2453
(Name and address of agent for service) |
1-408-526-0707
Registrant's telephone number, including area code |
| Date of fiscal year end: December 31 |
Date of reporting period: December 31, 2017
Item 1. Reports to Stockholders.
This report is provided for the general information of the Berkshire Funds shareholders. It is not authorized for distribution unless preceded or accompanied by an effective Prospectus, which contains more complete information about the Berkshire Funds. Please read it carefully before you invest.
In recent years, returns have sustained significant gains and losses due to market volatility in the technology sector. Due to market volatility, current performance may be lower than the figures shown. Call 877.526.0707 or visit www.berkshirefunds.com for more current performance information. Past performance is no guarantee of future results and investment results and principal value will fluctuate so that shares, when redeemed, may be worth more or less than their original cost. The returns shown do not reflect the deduction of taxes that a shareholder would pay on Fund distributions or the redemption of Fund shares. Total return includes reinvestment of dividends and capital gain distributions.
The Dow Jones Industrial Average is a measurement of general market price movement for 30 widely-held stocks primarily listed on the New York Stock Exchange. The S&P 500® Index is a registered trademark of Standard & Poor’s Corporation and is a market-weighted index of common stock prices for 500 large U.S. companies. The Nasdaq Composite Index is a capitalization-weighted index of over 5,000 common stocks listed on the Nasdaq Stock Market. Each index represents an unmanaged, broad-based basket of stocks. These indices are typically used as benchmarks for overall market performance.
Portfolio composition is subject to change at any time and references to specific securities, industries and sectors are not recommendations to purchase or sell any particular security.
FUND OVERVIEW
December 31, 2017 (unaudited)
PERFORMANCE COMPARISON (Average annual total returns as of 12/31/17)
| |
| | 1 Year | | 3 Year | | 5 Year | | 10 Year | |
Berkshire Focus Fund | 44.07 | % | 17.63 | % | 18.10 | % | 11.33 | % |
| S&P 500® Index | 21.83 | % | 11.41 | % | 15.79 | % | 8.50 | % |
| Dow Jones Industrial Average | 28.11 | % | 14.36 | % | 16.37 | % | 9.28 | % |
| Nasdaq Composite Index | 29.64 | % | 14.72 | % | 19.40 | % | 11.26 | % |
| NET ASSETS | | |
| 12/31/17 | $74.6 Million | |
| |
| |
| TOP TEN STOCK HOLDINGS (1) | |
| Amazon.com, Inc. | 15.28 | % |
| Alibaba Group Holding Ltd. - ADR | 10.04 | % |
| Microsoft Corp. | 8.62 | % |
| Apple, Inc. | 7.95 | % |
| Arista Networks, Inc. | 7.19 | % |
| Facebook, Inc. (Class A) | 4.95 | % |
| PayPal Holdings, Inc. | 4.92 | % |
| Salesforce.com, Inc. | 4.92 | % |
| NVIDIA Corp. | 4.91 | % |
| Adobe Systems, Inc. | 4.88 | % |
| |
| TOP TEN SECTORS (3) | | |
| Business Software & Services | 20.54 | % |
| Internet Services | 18.58 | % |
| China Internet Services | 14.89 | % |
| Semiconductor | 11.83 | % |
| Internet Social Media | 9.63 | % |
| Computer Hardware | 7.95 | % |
| IT Financial Services | 7.71 | % |
| Networking Equipment | 7.19 | % |
| Automobile Manufacturers | 1.42 | % |
| Exchange Traded Funds | 0.00 | % |
| NET ASSET VALUE | | |
| Net Asset Value Per Share | $ | 21.47 |
| (1) | Stated as a percentage of total net assets as of 12/31/17. The holdings information provided should not be construed as a recommendation to purchase or sell a particular security and may not be representative of the Fund’s current or future investments. |
| |
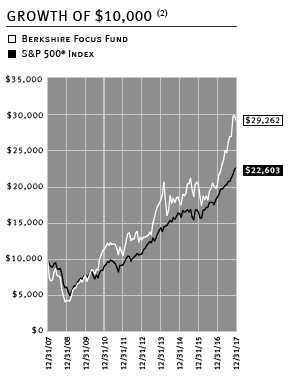
| (2) | This chart assumes an initial investment of $10,000 made on 12/31/07. Past performance does not guarantee future results. Investment return and principal value will fluctuate so that shares, when redeemed, may be worth more or less than their original cost. All returns reflect reinvested dividends but do not reflect the impact of taxes. |
| |
| (3) | Stated as a percentage of total net assets as of 12/31/17. The holdings by sector are presented to illustrate examples of the sectors in which the fund has bought securities and may not be representative of the fund’s current or future investments. |
| |
| (4) | This Fund concentrates its investments in the technology industry. As a result, the fund is subject to greater risk than more diversified funds because of its concentration of investments in fewer companies and certain segments of a single industry. |
| |
1
Berkshire Focus Fund
Performance and Portfolio Discussion
12/31/2017
2
| LETTER TO THE SHAREHOLDERS |

Dear Fellow Shareholders,
For the twelve month period ended December 31, 2017, the Berkshire Focus Fund outperformed its primary benchmark index. The Fund generated a total return of +44.07% while the S&P 500® Index—which we consider to be the Fund’s primary benchmark index—produced a total return of +21.83% over the same period. For comparative purposes, the Dow Jones Industrial Average posted a return of +28.11% and the Nasdaq Composite Index generated a return of +29.64% for the year. A $10,000 investment in our Fund over 10 years starting on December 31, 2007 grew to $29,262. This was a +11.33% average annual compounded return. A $10,000 investment in the S&P 500® over the same period grew to $22,603. This was a +8.50% average annual compounded return.
We are pleased to report the Berkshire Focus Fund delivered a year of truly exceptional performance. While we met our goal of delivering superior returns to our shareholders, we also significantly outperformed all of our equity market benchmarks. As a result, we hope you enjoyed the rewards for your patience as a long-term investor in the Fund. So even though we won the sprint in 2017, we remain confident that we will continue to win the marathon—just as reflected in our long-term record of outperformance over the past 10 years.
Robust corporate profits combined with the most synchronized global expansion in years, accommodative monetary policies, remarkably low levels of asset-market volatility, low inflation, a weakening dollar, strengthening labor markets, accelerating U.S. gross domestic product and continued optimism surrounding income tax reform, corporate tax cuts and increased infrastructure spending under the Trump administration—all took center stage in the news headlines over the past twelve months. Against this near-perfect backdrop, every major U.S. stock market index posted sharp double-digit gains for the year.
In the third quarter, equity markets extended their upward trajectory led by an outperformance of large-cap growth and technology stocks relative to their value counterparts. Underpinning the markets’ advance was an acceleration of U.S. gross domestic product (GDP), which grew at an annualized pace of 3.2% between July and September. It was the fastest pace in more than two years. Stocks continued their relentless climb higher in the fourth quarter in anticipation of an economic boost from new tax legislation. In mid-December the Federal Reserve raised interest rates by a quarter percentage point to a range of 1.25% to 1.50% —the third rate hike of the year. On December 22, President Trump signed into law the Tax Cuts and Jobs Act of 2017 which cut corporate tax rates to 21% from 35%, helping to propel U.S. equity market gains even further. Stocks ended the period in upbeat fashion with the trifecta of the Dow Jones Industrial Average, S&P 500® and the Nasdaq Composite delivering positive returns in every single month of the year.
Looking at the portfolio, 2017 was an exceptional year for the Fund not only in terms of absolute and relative outperformance, but also in terms of breadth. Every segment within the technology sector was a contributor to the Fund’s strong results. Some of the Fund’s biggest percentage gainers for the year were also concentrated in our largest investments—including Amazon.com (AMZN), Alibaba (BABA) and Apple (AAPL). Meanwhile, Adobe Systems (ADBE), Arista Networks (ANET), Facebook (FB), NVIDIA (NVDA), and Salesforce.com (CRM) all gave a boost to the Fund with outsized gains. New significant additions to the portfolio in the second-half were PayPal (PYPL), QUALCOMM (QCOM), Square (SQ), Tencent (TCEHY), Twitter (TWTR), and VMware (VMW).
Thank you for your confidence and continued investment in the Berkshire Focus Fund.

Malcolm R. Fobes III
Chairman and Chief Investment Officer |
3
Audited Financial Statements
12/31/2017
4
PORTFOLIO OF INVESTMENTS
December 31, 2017
| Shares | | | Value |
| |
| | COMMON STOCKS – 99.74% | $ | 74,366,822 |
| | (Cost $59,237,686) | | |
| |
| | AUTOMOBILE MANUFACTURERS – 1.42% | | 1,058,590 |
| 3,400 | Tesla, Inc.* | | 1,058,590 |
| |
| | BUSINESS SOFTWARE & SERVICES – 20.54% | | 15,315,863 |
| 20,760 | Adobe Systems, Inc.* | | 3,637,981 |
| 75,130 | Microsoft Corp. | | 6,426,620 |
| 35,850 | Salesforce.com, Inc.* | | 3,664,946 |
| 12,650 | VMware, Inc. (Class A)* | | 1,585,298 |
| 10 | Workday, Inc. (Class A)* | | 1,018 |
| |
| | CHINA INTERNET SERVICES – 14.89% | | 11,099,598 |
| 43,420 | Alibaba Group Holding Ltd. – ADR* | | 7,486,911 |
| 67,680 | Tencent Holdings Ltd. – ADR* | | 3,513,945 |
| 1,900 | Tencent Holdings Ltd. (Hong Kong)* | | 98,742 |
| |
| | COMPUTER HARDWARE – 7.95% | | 5,928,127 |
| 35,030 | Apple, Inc. | | 5,928,127 |
| |
| | INTERNET SERVICES – 18.58% | | 13,851,104 |
| 2,210 | Alphabet, Inc. (Class A)* | | 2,328,014 |
| 9,740 | Amazon.com, Inc.* | | 11,390,638 |
| 690 | Netflix, Inc.* | | 132,452 |
| |
| | INTERNET SOCIAL MEDIA – 9.63% | | 7,177,867 |
| 20,900 | Facebook, Inc. (Class A)* | | 3,688,013 |
| 145,350 | Twitter, Inc.* | | 3,489,854 |
| |
| | IT FINANCIAL SERVICES – 7.71% | | 5,750,632 |
| 49,880 | PayPal Holdings, Inc.* | | 3,672,166 |
| 59,950 | Square, Inc. (Class A)* | | 2,078,466 |
| |
| | NETWORKING EQUIPMENT – 7.19% | | 5,364,157 |
| 22,770 | Arista Networks, Inc.* | | 5,364,157 |
| |
| | SEMICONDUCTOR – 11.83% | | 8,820,884 |
| 11,530 | Broadcom Ltd. | | 2,962,057 |
| 18,920 | NVIDIA Corp. | | 3,661,020 |
| 34,330 | QUALCOMM, Inc. | | 2,197,807 |
| |
| |
| | *Non-Income Producing | | |
| | ADR – American Depositary Receipt | | |
| |
| |
| | (see accompanying notes to financial statements) | | |
5
PORTFOLIO OF INVESTMENTS (CONTINUED)
December 31, 2017
| Shares | | | Value |
| |
| | EXCHANGE TRADED FUNDS – 0.00% | | 2,291 |
| | (Cost $1,220) | | |
| 10 | PowerShares QQQ | | 1,558 |
| 10 | ProShares Ultra QQQ | | 733 |
| |
| |
| | TOTAL INVESTMENT SECURITIES – 99.74% | | 74,369,113 |
| | (Cost $59,238,906) | | |
| |
| | OTHER ASSETS IN EXCESS OF LIABILITIES – 0.26% | | 194,388 |
| |
| | NET ASSETS – 100.00% | $ | 74,563,501 |
| | Equivalent to $21.47 per share | | |
| |
| |
| |
| |
| | (see accompanying notes to financial statements) | | |
6
STATEMENT OF ASSETS AND LIABILITIES
December 31, 2017
| ASSETS | | | |
| Investment securities: | | | |
| At cost | $ | 59,238,906 | |
| At value | $ | 74,369,113 | |
| Cash | | 205,873 | |
| Receivable for dividends | | 5,490 | |
| Receivable for securities sold | | 502,433 | |
| Receivable for capital shares sold | | 195,486 | |
| Total Assets | | 75,278,395 | |
| |
| |
| LIABILITIES | | | |
| Payable for capital shares redeemed | | 587,312 | |
| Payable to affiliate (Note 5) | | 127,582 | |
| Total Liabilities | | 714,894 | |
| |
| |
| NET ASSETS | $ | 74,563,501 | |
| |
| |
| Net assets consist of: | | | |
| Paid-in capital | $ | 59,635,496 | |
| Accumulated net realized loss from investments | | (202,202 | ) |
| Net unrealized appreciation on investments | | 15,130,207 | |
| Net Assets | $ | 74,563,501 | |
| |
| Shares of beneficial interest issued and outstanding | | | |
| (unlimited number of shares authorized, without par value) | | 3,472,259 | |
| |
| Net asset value and offering price per share | $ | 21.47 | |
| |
| Minimum redemption price per share* | $ | 21.04 | |
*The Fund will impose a 2.00% redemption fee on shares redeemed within 90 calendar days of purchase.
(see accompanying notes to financial statements)
7
STATEMENT OF OPERATIONS
For the Year Ended December 31, 2017 |
| INVESTMENT INCOME | | | |
| Dividends | $ | 307,867 | |
| Total investment income | | 307,867 | |
| |
| EXPENSES | | | |
| Investment advisory fees (Note 5) | | 959,738 | |
| Administration fees (Note 5) | | 312,921 | |
| Federal excise tax | | 18,170 | |
| Interest expense | | 484 | |
| Total Expenses | | 1,291,313 | |
| |
| NET INVESTMENT LOSS | | (983,446 | ) |
| |
| |
| REALIZED AND UNREALIZED | | | |
| GAINS ON INVESTMENTS | | | |
| Net realized gains from investments | | 15,678,027 | |
| Net change in unrealized appreciation on investments | | 7,582,097 | |
| |
| NET REALIZED AND UNREALIZED | | | |
| GAINS ON INVESTMENTS | | 23,260,124 | |
| |
| NET INCREASE IN NET ASSETS | | | |
| FROM OPERATIONS | $ | 22,276,678 | |
| |
| |
| (see accompanying notes to financial statements) | | | |
8
STATEMENTS OF CHANGES IN NET ASSETS
For the Years Ended December 31, 2017 and December 31, 2016
| | | Year | | | | | Year | |
| | | Ended | | | | | Ended | |
| | | 12/31/17 | | | | | 12/31/16 | |
| |
| FROM OPERATIONS: | | | | | | | | |
| | | | | | |
| Net investment loss | $ | (983,446 | ) | $ | | | (790,221 | ) |
| Net realized gains from investments | | 15,678,027 | | | | | 1,164,901 | |
| Net change in unrealized appreciation/ | | | | | | | | |
| (depreciation) on investments | | 7,582,097 | | | | | (1,548,041 | ) |
| Net increase (decrease) in net assets from operations | | 22,276,678 | | | | | (1,173,361 | ) |
| |
| |
| FROM DISTRIBUTIONS: | | | | | | | | |
| Net realized gains from investments | | (13,491,581 | ) | | | | (71,349 | ) |
| Net decrease in net assets resulting from | | | | | | | | |
| distributions paid | | (13,491,581 | ) | | | | (71,349 | ) |
| |
| |
| FROM CAPITAL SHARE TRANSACTIONS: | | | | | | | | |
| Proceeds from shares sold | | 14,571,100 | | | | | 5,313,111 | |
| Proceeds from reinvested distributions | | 13,365,489 | | | | | 70,579 | |
| Proceeds from redemption fees (Note 6) | | 13,249 | | | | | 21,802 | |
| Payments for shares redeemed | | (14,549,980 | ) | | | | (20,727,343 | ) |
| Net increase (decrease) in net assets from | | | | | | | | |
| capital share transactions | | 13,399,858 | | | | | (15,321,851 | ) |
| |
| |
| TOTAL INCREASE (DECREASE) IN NET ASSETS | | 22,184,955 | | | | | (16,566,561 | ) |
| |
| |
| NET ASSETS: | | | | | | | | |
| Beginning of year | | 52,378,546 | | | | | 68,945,107 | |
| End of year(a) | $ | 74,563,501 | | $ | 52,378,546 | |
| |
| |
| CAPITAL SHARE ACTIVITY: | | | | | | | | |
| Shares sold | | 605,794 | | | | | 319,895 | |
| Shares reinvested | | 616,774 | | | | | 3,853 | |
| Shares redeemed | | (643,193 | ) | | | | (1,221,660 | ) |
| Net increase (decrease) in shares outstanding | | 579,375 | | | | | (897,912 | ) |
| Shares outstanding, beginning of year | | 2,892,884 | | | | | 3,790,796 | |
| Shares outstanding, end of year | | 3,472,259 | | | | | 2,892,884 | |
(a) Accumulated undistributed net investment income is $0 and $0 for the years ended December 31, 2017
and December 31, 2016, respectively. |
(see accompanying notes to financial statements)
9
FINANCIAL HIGHLIGHTS
Selected Per Share Data and Ratios for a Share Outstanding Throughout Each Period
| | | Year | | | Year | | | Year | | | Year | | | Year | |
| | | Ended | | | Ended | | | Ended | | | Ended | | | Ended | |
| | | 12/31/17 | | | 12/31/16 | | | 12/31/15 | | | 12/31/14 | | | 12/31/13 | |
|
| NET ASSET VALUE, | | | | | | | | | | | | | | | |
| BEGINNING OF YEAR | $ | 18.11 | | $ | 18.19 | | $ | 17.58 | | $ | 17.83 | | $ | 14.05 | |
| |
| INCOME FROM INVESTMENT OPERATIONS: | | | | | | | | | | | | | | | |
| Net investment loss | | (0.35 | )(b) | | (0.23 | )(b) | | (0.36 | )(b) | | (0.35 | )(b) | | (0.22 | )(a) |
| Net realized and unrealized gains | | | | | | | | | | | | | | | |
| on investments | | 8.37 | | | 0.16 | | | 2.69 | | | 0.08 | (c) | | 6.26 | |
| Total from investment operations | | 8.02 | | | (0.07 | ) | | 2.33 | | | (0.27 | ) | | 6.04 | |
| |
| Proceeds from redemption fees | | 0.00 | (g) | | 0.01 | | | 0.01 | | | 0.03 | | | 0.01 | |
| |
| LESS DISTRIBUTIONS: | | | | | | | | | | | | | | | |
| Distributions from net realized gains | | (4.66 | ) | | (0.02 | ) | | (1.73 | ) | | (0.01 | ) | | (2.27 | ) |
| Total distributions | | (4.66 | ) | | (0.02 | ) | | (1.73 | ) | | (0.01 | ) | | (2.27 | ) |
| |
| NET ASSET VALUE, | | | | | | | | | | | | | | | |
| END OF YEAR | $ | 21.47 | | $ | 18.11 | | $ | 18.19 | | $ | 17.58 | | $ | 17.83 | |
| |
| |
| TOTAL RETURN(d) | | 44.07 | % | | (0.31 | %) | | 13.32 | % | | (1.36 | %) | | 43.09 | % |
| |
| |
| |
| SUPPLEMENTAL DATA AND RATIOS: | | | | | | | | | | | | | | | |
| Net assets at end of year (thousands) | $ | 74,564 | | $ | 52,379 | | $ | 68,945 | | $ | 63,787 | | $ | 71,484 | |
| |
| Ratio of expenses to average net assets(e) | | 2.02 | % | | 2.01 | % | | 1.99 | % | | 1.99 | % | | 2.00 | % |
| Ratio of net investment loss to | | | | | | | | | | | | | | | |
| average net assets | | (1.54 | %) | | (1.37 | %) | | (1.88 | %) | | (1.95 | %) | | (1.60 | %) |
| |
| Portfolio turnover rate(f) | | 385.0 | % | | 442.8 | % | | 455.6 | % | | 533.7 | % | | 464.1 | % |
| (a) | Net investment loss per share is calculated using ending balances prior to consideration or adjustment |
| | for permanent book and tax differences. |
| (b) | Net investment loss was calculated using the average shares outstanding method. |
| (c) | Net realized and unrealized gain on investments per share is a balancing amount necessary to reconcile |
| | the change in net asset value per share for the period, and may not reconcile with the net realized and |
| | unrealized gain on investments in the statement of operations. |
| (d) | Total return represents the rate that the investor would have earned or (lost) on an investment in the Fund |
| | assuming reinvestment of dividends. |
| (e) | The ratio of expenses to average net assets includes federal excise tax and interest expense. The ratios |
| | excluding federal excise tax and interest expense would be 1.99%, 2.00%, 1.99%, 1.98% and 1.99%, respectively. |
| (f) | Portfolio turnover is greater than most funds due to the investment style of the Fund. |
| (g) | Less than $0.005 per share. |
(see accompanying notes to financial statements)
10
NOTES TO FINANCIAL STATEMENTS
December 31, 2017
1. Organization
The Berkshire Focus Fund (the “Fund”) is a non-diversified series of The Berkshire Funds (the “Trust”), an open-end management investment company registered under the Investment Company Act of 1940, as amended (the “1940 Act”). The Trust was organized as a Delaware business trust on November 25, 1996. The Fund commenced operations on July 1, 1997. The Fund’s investment objective is to seek long-term growth of capital primarily through investments in equity securities.
2. Significant Accounting Policies
The Fund is an investment company and accordingly follows the investment company accounting and reporting guidance of the Financial Accounting Standards Board (“FASB”) Accounting Standards Codification Topic 946 Financial Services – Investment Companies. The financial statements are prepared in conformity with accounting principles generally accepted in the United States of America (“GAAP”).
The following is a summary of the Trust’s significant accounting policies:
Securities valuation — The Fund's portfolio securities are valued as of the close of the regular session of trading on the New York Stock Exchange (the “NYSE”), normally 4:00 p.m., Eastern time. Securities which are traded on stock exchanges or are quoted by Nasdaq are valued at the last reported sale price as of the close of the regular session of trading on the NYSE, or, if not traded, at the most recent bid price. Securities which are traded in the over-the-counter market, and which are not quoted by Nasdaq, are valued at the most recent bid price, as obtained from one or more of the major market makers for such securities. Securities for which market quotations are not readily available are valued at their fair value as determined in good faith in accordance with consistently applied procedures established by and under the general supervision of the Board of Trustees.
The Trust has adopted accounting standards which establish an authoritative definition of fair value and set out a hierarchy for measuring fair value. These standards require additional disclosures about the various inputs and valuation techniques used to develop the measurements of fair value and a discussion of changes in valuation techniques and related inputs during the period. These standards define fair value as the price that would be received to sell an asset or paid to transfer a liability in an orderly transaction between market participants at the measurement date. The fair value hierarchy is organized into three levels based upon the assumptions (referred to as “inputs”) used in pricing the asset or liability. These standards state that “observable inputs” reflect the assumptions market participants would use in pricing the asset or liability based on market data obtained from independent sources and “unobservable
11
NOTES TO FINANCIAL STATEMENTS
December 31, 2017
inputs” reflect an entity's own assumptions about the assumptions market participants would use in pricing the asset or liability. These inputs are summarized in the three broad levels listed below:
Level 1 – Quoted prices in active markets for identical securities.
Level 2 – Other significant observable inputs (including quoted prices for similar securities, interest rates, prepayment speeds, credit risk, etc.).
Level 3 – Significant unobservable inputs (including the Fund’s own assumptions in determining the fair value of investments).
The inputs or methodology used for valuing securities are not necessarily an indication of the risk
associated with investing in those securities.
The following is a summary of the inputs used to value the Fund’s investments as of December 31, 2017:
| | | Level 1 | Level 2 | Level 3 | | Total |
| Common Stocks | | | | | | |
| Business Software & Services | $ | 15,315,863 | – | – | $ | 15,315,863 |
| Internet Services | | 13,851,104 | – | – | | 13,851,104 |
| China Internet Services | | 11,099,598 | – | – | | 11,099,598 |
| Semiconductor | | 8,820,884 | – | – | | 8,820,884 |
| Internet Social Media | | 7,177,867 | – | – | | 7,177,867 |
| Computer Hardware | | 5,928,127 | – | – | | 5,928,127 |
| IT Financial Services | | 5,750,632 | – | – | | 5,750,632 |
| Networking Equipment | | 5,364,157 | – | – | | 5,364,157 |
| Automobile Manufacturers | | 1,058,590 | – | – | | 1,058,590 |
| Total Common Stocks | | 74,366,822 | – | – | | 74,366,822 |
| Exchange Traded Funds | | 2,291 | – | – | | 2,291 |
| Total Investments | $ | 74,369,113 | – | – | $ | 74,369,113 |
The Fund did not hold any Level 3 securities during the fiscal year ended December 31, 2017. There were no transfers into or out of the levels during the reporting period, as compared to their classification from the most recent annual report. It is the Fund’s policy to consider transfers into or out of the levels as of the end of the reporting period. The Fund did not hold any derivative instruments during the reporting period.
Investment income — Dividend income is recorded on the ex-dividend date. Interest income is accrued as earned.
Distributions to shareholders — Distributions to shareholders arising from net investment income and net realized capital gains, if any, are distributed at least once each year. Distributions to shareholders are recorded on the ex-dividend date. The Fund may utilize earnings and profits distributed to shareholders on redemptions of shares as part of the dividends paid deduction. Dividends from net investment income and capital gain distributions are determined in accordance with income tax regulations, which may differ from GAAP.
12
NOTES TO FINANCIAL STATEMENTS
December 31, 2017
Security transactions — Security transactions are accounted for on the trade date for financial reporting purposes. Securities sold are determined on a specific identification basis.
Estimates — The financial statements are prepared in accordance with GAAP, which requires management to make estimates and assumptions that affect the reported amounts of assets and liabilities and disclosure of contingent assets and liabilities at the date of the financial statements and the reported amounts of increases and decreases in net assets from operations during the reporting period. Actual results could differ from those estimates.
Federal income tax — The Fund intends to comply with the requirements of Subchapter M of the Internal Revenue Code (the “Code”) necessary to qualify as a regulated investment company. As provided therein, in any fiscal year in which the Fund so qualifies and distributes at least 90% of its taxable net income, the Fund (but not the shareholders) will be relieved of federal income tax on the income distributed. Accordingly, no provision for income taxes has been made.
As of and during the year ended December 31, 2017, the Fund did not have a liability for any unrecognized tax benefits. The Fund recognizes interest and penalties, if any, related to unrecognized tax benefits as other expense on the statement of operations. During the year, the Fund did not incur any tax-related interest or penalties.
In order to avoid imposition of the excise tax applicable to regulated investment companies, it is also the Fund’s intention to declare as dividends in each calendar year at least 98% of its net investment income and 98.2% of its net realized capital gains plus undistributed amounts from prior years. However, during the fiscal year ended December 31, 2017, the Fund recognized $18,170 of Federal excise tax, which is reflected on the Statement of Operations.
Other — The treatment for financial reporting purposes of distributions made to shareholders during the year from net investment income or net realized capital gains may differ from their ultimate treatment for federal income tax purposes. These differences are caused primarily by differences in the timing of the recognition of certain components of income, expense or realized capital gain for federal income tax purposes. Where such differences are permanent in nature, they are reclassified in the components of the net assets based on their ultimate characterization for federal income tax purposes. Any such reclassifications will have no effect on net assets, results of operations or net asset value per share of the Fund. At December 31, 2017, the following permanent adjustments were recorded. Such adjustments were attributed to the reclassification of net investment loss and non-deductible Federal excise tax, as well as the usage of equalization for tax purposes:
| Paid-in capital | $ | 1,405,796 | |
| Accumulated undistributed net investment income | | 983,446 | |
| Accumulated net realized loss from investments | | (2,389,242 | ) |
13
NOTES TO FINANCIAL STATEMENTS
December 31, 2017
3. Investment Transactions
Purchases and sales of investment securities (excluding short-term instruments) for the year ended December 31, 2017 were $244,787,012 and $245,934,445, respectively. There were no purchases or sales of U.S. Government securities for the Fund.
4. Tax Information
As of December 31, 2017, the components of accumulated earnings (deficit) on a tax basis were as follows:
| Federal income tax cost | $ | 59,613,348 | |
| Gross unrealized appreciation | $ | 15,631,865 | |
| Gross unrealized depreciation | | | (876,100 | ) |
| Net unrealized appreciation | | | 14,755,765 | |
| Undistributed ordinary income | | | 172,240 | |
| Undistributed long term gains | | | – | |
| Accumulated losses | | | – | |
| Total accumulated gains | $ | | 14,928,005 | |
The cost basis of investments for tax and financial reporting purposes differs primarily due to wash sales.
There was a long-term capital gains distribution and a short-term capital gains distribution paid in the amounts of $2,270,071 and $11,221,510, respectively, during the year ended December 31, 2017. Also, there was a long-term capital gain distribution paid in the amount of $71,349 during the year ended December 31, 2016. Short-term capital gain distributions are considered ordinary income distributions for tax purposes.
5. Related Party Transactions, Investment Advisory and Administrative Fees
Certain Officers and Trustees of the Trust are also Officers and Directors of Berkshire Capital Holdings, Inc. (“Berkshire Capital”). The non-interested Trustees of the Fund were paid $16,640 in Trustee fees and expenses directly by Berkshire Capital during the fiscal year ended December 31, 2017.
The Fund has an Investment Advisory Agreement (the “Advisory Agreement”) and a separate Administration Agreement with Berkshire Capital. Under the Advisory Agreement, Berkshire Capital will determine what securities will be purchased, retained or sold by the Fund on the basis of a continuous review of the portfolio. For the services it provides under the Advisory Agreement, Berkshire Capital receives a fee accrued each calendar day (including weekends and holidays) at a rate of 1.50% per annum of the daily net assets of the Fund. Under the Administration Agreement, Berkshire Capital renders all administrative and supervisory services of the Fund, as well as facilities furnished and expenses assumed except for interest and taxes.
14
NOTES TO FINANCIAL STATEMENTS
December 31, 2017
For these services, Berkshire Capital receives a fee at the annual rate of 0.50% of the Fund’s average daily net assets up to $50 million, 0.45% of average net assets from $50 million to $200 million, 0.40% of average net assets from $200 million to $500 million, 0.35% of average net assets from $500 million to $1 billion and 0.30% of average net assets in excess of $1 billion. Such fee is computed as a percentage of the Fund’s daily net assets and is accrued each calendar day (including weekends and holidays). For the year ended December 31, 2017, Berkshire Capital was paid an investment advisory fee of $959,738 and an administration fee of $312,921 from the Fund. The amount due to Berkshire Capital for these fees at December 31, 2017 totaled $127,582.
6. Redemption Fee
The Fund may impose a redemption fee of 2.00% on shares held for 90 days or less. For the year ended December 31, 2017, proceeds from redemption fees were $13,249.
7. Beneficial Ownership
The beneficial ownership, either directly or indirectly, of more than 25% of the voting securities of a fund creates a presumption of control of the Fund, under Section 2(a)(9) of the Investment Company Act of 1940. At December 31, 2017, National Financial Services Corp. and Charles Schwab & Co. beneficially owned, in aggregate, 43.56% and 25.13% of the Fund, respectively.
8. Subsequent Events
In preparing these financial statements, management has performed an evaluation of subsequent events after December 31, 2017 and determined that there were no significant subsequent events that would require adjustment to or additional disclosure in the financial statements.
15
REPORT OF INDEPENDENT REGISTERED PUBLIC ACCOUNTING FIRM
TO THE SHAREHOLDERS OF BERKSHIRE FOCUS FUND AND
BOARD OF TRUSTEES OF THE BERKSHIRE FUNDS
The Berkshire Funds
San Jose, California
Opinion on the Financial Statements
We have audited the accompanying statement of assets and liabilities, including the portfolio of investments, of Berkshire Focus Fund (the “Fund”), a series of The Berkshire Funds, as of December 31, 2017, and the related statement of operations for the year then ended, the statements of changes in net assets for each of the two years in the period then ended, including the related notes, and the financial highlights for each of the five years in the period then ended, (collectively referred to as the “financial statements”). In our opinion, the financial statements present fairly, in all material respects, the financial position of Berkshire Focus Fund as of December 31, 2017, the results of its operations for the year then ended, the changes in its net assets for each of the two years in the period then ended, and the financial highlights for each of the five years in the period then ended, in conformity with accounting principles generally accepted in the United States of America.
Basis for Opinion
These financial statements are the responsibility of the Fund’s management. Our responsibility is to express an opinion on the Fund’s financial statements based on our audits. We are a public accounting firm registered with the Public Company Accounting Oversight Board (United States) (“PCAOB”) and are required to be independent with respect to the Fund in accordance with the U.S. federal securities laws and the applicable rules and regulations of the Securities and Exchange Commission and the PCAOB.
We conducted our audits in accordance with the standards of the PCAOB. Those standards require that we plan and perform the audit to obtain reasonable assurance about whether the financial statements are free of material misstatement, whether due to error or fraud.
Our audits include performing procedures to assess the risks of material misstatement of the financial statements, whether due to error or fraud, and performing procedures that respond to those risks. Such procedures include examining, on a test basis, evidence regarding the amounts and disclosures in the financial statements and confirmation of securities owned as of December 31, 2017, by correspondence with the custodian and broker. Our audits also included evaluating the accounting principles used and significant estimates made by management, as well as evaluating the overall presentation of the financial statements. We believe that our audits provide a reasonable basis for our opinion. We have served as the Fund’s auditor since 2004.

Cohen & Company, Ltd.
Milwaukee, Wisconsin
February 28, 2018
16
ADDITIONAL INFORMATION
(unaudited) |
As a shareholder of the Fund, you incur two types of costs: (1) transaction costs, and (2) ongoing costs, including advisory fees, administrative fees and other Fund expenses. This Example is intended to help you understand your ongoing costs (in dollars) of investing in the Fund and to compare these costs with the ongoing costs of investing in other mutual funds. The Example is based on an investment of $1,000 invested in the Fund on July 1, 2017 and held through December 31, 2017.
Actual Expenses
The first line of the table on the following page provides information about actual account values and actual expenses. Although the Fund charges no sales load or transaction fees, you will be assessed fees for outgoing wire transfers, returned checks and stop payment orders at prevailing rates charged by Mutual Shareholder Services, LLC, the Fund’s transfer agent. If you request that a redemption be made by wire transfer, currently a $20.00 fee is charged by the Fund’s transfer agent. IRA accounts will be charged an $8.00 annual maintenance fee. To the extent the Fund invests in shares of other investment companies as part of its investment strategy, you will indirectly bear your proportionate share of any fees and expenses charged by the underlying funds in which the Fund invests in addition to the expenses of the Fund. Actual expenses of the underlying funds are expected to vary among the various underlying funds. These expenses are not included in the example. The example includes advisory fees, administrative fees and other Fund expenses. However, the example does not include portfolio trading commissions and related expenses and other extraordinary expenses as determined under generally accepted accounting principles. You may use the information in this line, together with the amount you invested, to estimate the expenses that you paid over the period. Simply divide your account value by $1,000 (for example, an $8,600 account value divided by $1,000 = 8.6), then multiply the result by the number in the first line under the heading entitled “Expenses Paid During Period” to estimate the expenses you paid on your account during this period.
Hypothetical Example for Comparison Purposes
The second line of the table provides information about hypothetical account values and hypothetical expenses based on the Fund’s actual expense ratio and an assumed rate of return of 5% per year before expenses, which is not the Fund's actual return. The hypothetical account values and expenses may not be used to estimate the actual ending account balance or expenses you paid for the period. You may use this information to compare the ongoing costs of investing in the Fund and other funds. To do so, compare this 5% hypothetical example with the 5%
17
ADDITIONAL INFORMATION
(unaudited) |
hypothetical examples that appear in the shareholder reports of the other funds. Please note that the expenses shown in the table are meant to highlight your ongoing costs only and do not reflect any transactional costs. Therefore, the second line of the table is useful in comparing ongoing costs only, and will not help you determine the relative total costs of owning different funds. In addition, if these transactional costs were included, your costs would have been higher.
| | | | | | | Expenses Paid |
| | | Beginning | | Ending | | During the Period* |
| | | Account Value | | Account Value | | July 1, 2017 to |
| | | July 1, 2017 | | December 31, 2017 | | December 31, 2017 |
| Actual | $ | 1,000.00 | $ | 1,179.55 | $ | 10.88 |
| Hypothetical | $ | 1,000.00 | $ | 1,015.22 | $ | 10.06 |
| (5% annual return before expenses) | | | | |
*Expenses are equal to the Fund’s annualized expense ratio of 1.98%, multiplied by the average account value over the period, multiplied by 184/365 to reflect the one-half year period.
Proxy Voting Guidelines
Berkshire Capital Holdings, Inc., the Fund’s Adviser, is responsible for exercising the voting rights associated with the securities held by the Fund. A description of the policies and procedures used by the Adviser in fulfilling this responsibility and a record of the Fund’s proxy votes for the most recent twelve month period ended June 30, are available without charge, upon request, by calling toll free 1-877-526-0707. They are also available on the Securities and Exchange Commission’s (“SEC”) website at http://www.sec.gov.
Quarterly Filing of Portfolio Holdings
The Fund files its complete schedule of portfolio holdings with the SEC for the first and third quarters of each fiscal year on Form N-Q. The Fund’s Forms N-Q are available on the SEC’s website at http://www.sec.gov. The Fund’s Forms N-Q may also be reviewed and copied at the SEC’s Public Reference Room in Washington, DC. Information on the operation of the Public Reference Room may be obtained by calling 1-202-551-8090 (direct) or 1-800-SEC-0330 (general SEC number).
18
ADDITIONAL INFORMATION
(unaudited) |
Trustee and Officer Information
The business and affairs of the Fund are managed under the direction of the Fund’s Board of Trustees. Information pertaining to the Trustees and Officers of the Fund is set forth below. The SAI includes additional information about the Fund’s Trustees and Officers and is available without charge, upon request, by calling toll-free 1-877-526-0707.
Interested Trustees and Officers
| | | | | Number of | |
| | | Term of | | portfolios in | |
| | | office and | Principal | fund complex | Other directorships |
| | Position(s) held | length of | occupation during | overseen by | held by trustee |
| Name, address and age | with trust | time served | past five years | trustee | and officer |
| |
| Malcolm R. Fobes III* | Trustee, President, | Indefinite; | Chairman and CEO; | 1 | Independent Director; |
| 475MilanDrive | Treasurer, Secretary, | Since 1996 | Berkshire Capital | | United States |
| Suite#103 | Chief Investment | | Holdings, Inc. | | Commodity Funds, |
| San Jose, CA 95134 | Officer, Chief Financial | | (1993 – present) | | LLC |
| Age: 53 | Officer and Chief | | | | |
| | Compliance Officer | | | | |
* Trustees who are considered “interested persons” as defined in Section 2(a)(19) of the Investment Company Act of 1940 by virtue of their affiliation with the Investment Adviser.
Disinterested Trustees
| | | | | | Number of | |
| | | Term of | | | portfolios in | |
| | | office and | Principal | | fund complex | |
| | Position held | length of | occupation during | | overseen by | Other directorships |
| Name, address and age | with trust | time served | past five years | | trustee | held by trustee |
| |
| Leland F. Smith | Independent | Indefinite; | Chairman and CEO; | | 1 | None |
| 475MilanDrive | Trustee | Since 1997 | Elesco Ltd.* | | | |
| Suite#103 | | | (1989 – present) | | | |
| San Jose, CA 95134 | | | | | | |
| Age: 79 | | | | | | |
| |
| Andrew W. Broer | Independent | Indefinite; | Manager; | | 1 | None |
| 475MilanDrive | Trustee | Since 1998 | Data Center Tools | | | |
| Suite#103 | | | and Monitoring; | | | |
| San Jose, CA 95134 | | | Apple, Inc. | | | |
| Age: 52 | | | (2014 - present) | | | |
| |
| | | | Senior Manager; | | | |
| | | | Data Center | | | |
| | | | Operations; | | | |
| | | | Box, Inc. | | | |
| | | | (2013 – 2014) | | | |
| |
| | | | Member of | | | |
| | | | Technical Staff; | | | |
| | | | Cisco Systems, Inc. | | | |
| | | | (1996 - 2013) | | | |
* Elesco Ltd. provides consulting services for corporations and government agencies in the field of land-use management.
19
ADDITIONAL INFORMATION
(unaudited) |
APPROVAL OF INVESTMENT ADVISORY AGREEMENT
The Board of Trustees, including a majority of the Trustees who are not “interested persons” of the Trust (the “Independent Trustees”), approved the continuation of the Investment Advisory Agreement (the “Advisory Agreement”) with Berkshire Capital Holdings, Inc. (the “Adviser”) at a meeting on held December 9, 2017.
The Trustees were assisted by experienced independent legal counsel throughout the contract review process. The Independent Trustees discussed the proposed continuance in executive session with such counsel at which no representatives of the Adviser were present. The Independent Trustees relied upon the advice of independent legal counsel and their own business judgment in determining the material factors to be considered in evaluating the Advisory Agreement and the weight to be given to each such factor. Among other factors, the Trustees considered the Fund’s performance; the nature, extent and quality of the services provided; the costs of the services provided; any profits realized by the Adviser; the extent to which economies of scale will be realized as the Fund grows; and whether fees reflect those economies of scale. The conclusions reached by the Independent Trustees were based on a comprehensive evaluation of all of the information provided and were not the result of any one factor. Moreover, each Independent Trustee may have afforded different weight to the various factors in reaching his conclusions with respect to the Advisory Agreement.
At the December 9, 2017 Board meeting, a representative of the Adviser referred the Trustees to the materials that had been provided to them for purposes of their consideration of the Advisory Agreement. He summarized the services provided by the Adviser to the Fund and he reported that there were no material changes in the structure or relationships of the Adviser. The representative next reviewed with the Trustees the average total returns of the Fund through September 30, 2017 (year-to-date, 1-year, 3-years, 5-years, 10-years and 15-years), and the expense ratios and management fees of the Fund in comparison with funds in the Morningstar Technology Fund category (the “Category”), and a group of no-load Morningstar Technology Funds with net assets ranging from $20 million to $175 million (the “Peer Group”). He also reviewed comparisons of the Fund’s performance with its benchmark indices, as well as the Category and Peer Group. He noted that he had reviewed the Adviser’s balance sheet and income statement with the Trustees prior to the meeting. He then led a discussion regarding the Adviser’s profitability, indicating a profit margin at the time of analysis.
Investment Performance
The Trustees then considered the investment performance of the Fund over various periods of time ended September 30, 2017 as compared to its benchmark indices and the Category and Peer Group. The Trustees noted that the Fund had outperformed its benchmark indices over the year-to-date, 1-year, 3-year, 10-year and 15-year periods ended September 30, 2017, remarking in particular that the 1-year performance of the Fund relevant to the benchmark indices had been outstanding. The data also showed that the Fund outperformed its Category and Peer Group averages for the year-to-date, 1-year and 10-year periods. Based on this review, the Trustees concluded that the current and historical performance of the Fund, as managed by the Investment Adviser, was satisfactory.
20
ADDITIONAL INFORMATION
(unaudited) |
Nature, Extent and Quality of Services Provided by the Investment Adviser
The Trustees then reviewed the nature, quality and scope of current and anticipated services provided by the Adviser under the Advisory Agreement. The Trustees discussed the Adviser’s experience and the capabilities of the Adviser’s portfolio manager. For example, the Trustees reviewed and discussed the Adviser’s Form ADV and internal compliance policies, as well as the experience of the Adviser as investment adviser or sub-adviser to other investment companies. In addition to the above considerations, the Trustees reviewed and considered a description of the Adviser’s portfolio and brokerage transactions, noting that the Adviser received no soft dollars. Based on this review, the Trustees concluded that the range and quality of services to be provided by the Adviser to the Fund were appropriate and continued to support its original selection of the Adviser.
Costs of Services Provided
The Trustees next reviewed the terms of the Advisory Agreement and the Administration Agreement, concluding after discussion with independent counsel that it was appropriate to consider them together, given that the Adviser was performing all services under the agreements and that the Administration Agreement called for the Adviser to pay substantially all of the Fund’s expenses (except for the investment advisory fee). The Trustees concluded that it would be putting form over substance to treat the two agreements separately. The representative of the Adviser then reviewed the advisory fee and expense ratio for the Fund and compared the fee and expense ratio with the advisory fees and expense ratios of the Fund’s Category and Peer Group. He noted that the expense ratio was more meaningful than the actual advisory fee ratio because the agreements have a “universal fee” structure where the Adviser pays substantially all of the expenses of the Fund and is compensated with a higher fee. The representative further noted that most of the funds in the comparative data do not share this structure.
After discussion, the Trustees agreed that, instead of comparing actual advisory fees, it was more appropriate to compare net expense ratios, due to the universal fee structure. The Trustees further noted that some of the funds in the comparative data were one class of a fund that had many classes and, thus, benefit from economies of scale provided by the other classes. The Trustees noted that the Fund’s net expense ratio was near the top of the Peer Group, but within the range of the Peer Group.
At this point, the representative added that the work involved in running the Fund was significantly higher than for most other funds because of the extreme volatility of high-growth technology stocks. He stated that he is actively managing the Fund’s portfolio every day, using a time-intensive process to follow news regarding each of the stocks in the portfolio and stocks that he is considering for the portfolio. He estimated that a net positive performance of the Fund is generated by his doing trading “on the edges,” which he believes allows the Fund to take advantage of short-term movements in particular stock prices. The Trustees recognized the benefit of the Adviser’s active management of the Fund and, based on their review, concluded that the cost of services provided by the Adviser was appropriate.
21
ADDITIONAL INFORMATION
(unaudited) |
Profitability of the Adviser
The Trustees next considered an analysis of the profitability of the Adviser from the fees payable under the Advisory Agreement and the Administration Agreement. In addition, the Trustees reviewed the financial condition of the Investment Adviser, as well as information from a Management Practice, Inc. (“MPI”) 2017 profitability analysis of 18 publicly-reported asset managers. The representative of the Adviser reviewed the profitability analysis with the Trustees, noting that as no rent expenses and no payroll expenses were deducted, the Adviser’s profitability was significantly overstated. The Trustees remarked that the Adviser’s level of profitability was below the average pre-tax profit margins reported in the MPI analysis for equity funds after including the Adviser’s expected payroll expense for 2017, and therefore concluded that the Adviser’s profitability was in the acceptable range.
Economies of Scale
The Trustees next considered whether the Fund has appropriately benefitted from any economies of scale, and whether there is potential for realization of any further economies of scale. The representative of the Adviser reminded the Trustees that the Adviser’s fees under the Administration Agreement contain breakpoints and noted that the Fund was already receiving the benefit of the fee reduction at the first break point. The Trustees acknowledged that the Adviser was entitled to reasonable profits and indicated that the existing breakpoints should pass on the benefits of economies of scale to shareholders.
Conclusion
At this point, the Trustees indicated that it was their consensus that the information presented and the discussion of the information were adequate for making a determination regarding the renewal of the Advisory Agreement. As to the nature, extent and quality of services provided by the Adviser, the Trustees expressed their common opinion that the Adviser provides excellent services to the Fund and that the extent of the services is consistent with the Board’s expectations. They complimented the Adviser on the Fund’s outstanding relative performance over the last fifteen years. The Trustees then concluded that, based on their review of the fees and overall expense comparisons, as well as all information relating to the profitability of the Adviser, that the advisory and administration fees were reasonable and that the arrangements were not generating excessive profits to the Adviser. The Trustees further concluded that the existing fee breakpoints would make the Adviser’s fees reflective of economies of scale.
After further discussion, and based upon all of the above-mentioned factors and their related conclusions, with no single factor or conclusion being determinative and with each Trustee not necessarily attributing the same weight to each factor, the Trustees unanimously determined that the continuation of the Advisory Agreement for an additional year was in the best interests of the Fund and its shareholders.
22
Item 2. Code of Ethics.
The registrant has adopted a code of ethics that applies to the registrant’s principal executive officer and principal financial officer. The registrant has not made any substantive amendments to its code of ethics during the period covered by this report. The registrant has not granted any waivers from any provisions of the code of ethics during the period covered by this report.
The registrant undertakes to provide to any person without charge, upon request, a copy of its code of ethics by mail when they call the registrant at 1-877-526-0707.
Item 3. Audit Committee Financial Expert.
The registrant’s board of Trustees has determined that it does not have an audit committee financial expert serving on its audit committee. At this time, the registrant believes that the experience provided by each member of the audit committee together offers the registrant adequate oversight for the registrant’s level of financial complexity.
Item 4. Principal Accountant Fees and Services.
(a-d) The following table details the aggregate fees billed for each of the last two fiscal years for audit fees, audit-related fees, tax fees and other fees by the principal accountant to the registrant. The principal accountant has provided no services to the adviser or any entity controlled by, or under common control with the adviser that provides ongoing services to the registrant.
| | | FYE 12/31/17 | | FYE 12/31/16 |
| Audit Fees | | $14,500 | | $13,500 |
| Audit-Related Fees | | $0 | | $0 |
| Tax Fees | | $6,000 | | $1,000 |
| All Other Fees | | $0 | | $0 |
Nature of Tax Fees: preparation of Excise Tax Statement and 1120 RIC.
(e) (1) The audit committee approves all audit and non-audit related services and, therefore, has not adopted pre-approval policies and procedures described in paragraph (c)(7) of Rule 2-01 of Regulation S-X.
(e) (2) None of the services described in paragraph (b) through (d) of this Item were approved by the audit committee pursuant to paragraph (c)(7)(i)(C) of Rule 2-01 of Regulation S-X.
(f) All of the principal accountant’s hours spent on auditing the registrant’s financial statements were attributed to work performed by full-time permanent employees of the principal accountant.
(g) The following table indicates the aggregate non-audit fees billed by the registrant’s principal accountant for services to the registrant , the registrant’s investment adviser (not sub-adviser), and any entity controlling, controlled by, or under common control with the adviser that provides ongoing services to the registrant, for the last two years.
| Non-Audit Fees | | FYE 12/31/17 | | FYE 12/31/16 |
| Registrant | | $6,000 | | $1,000 |
| Registrant’s Investment Adviser | | $0 | | $0 |
(h) The principal accountant provided no services to the investment adviser or any entity controlling, controlled by, or under common control with the adviser that provides ongoing services to the registrant.
Item 5. Audit Committee of Listed Registrants.
Not applicable to registrants who are not listed issuers (as defined in Rule 10A-3 under the Securities Exchange Act of 1934).
Item 6. Investments.
Schedule of Investments is included as part of the report to shareholders filed under Item 1 of this Form.
Item 7. Disclosure of Proxy Voting Policies and Procedures for Closed-End Management Investment Companies.
Not applicable to open-end investment companies.
Item 8. Portfolio Managers of Closed-End Management Investment Companies.
Not applicable to open-end investment companies.
Item 9. Purchases of Equity Securities by Closed-End Management Investment Company and Affiliated Purchasers.
Not applicable to open-end investment companies.
Item 10. Submission of Matters to a Vote of Security Holders.
Not Applicable.
Item 11. Controls and Procedures.
| (a) | The registrant’s president and chief financial officer concluded that the disclosure controls and procedures (as defined in Rule 30a-3(c) under the Investment Company Act of 1940 (the “Act”)) were effective as of a date within 90 days of the filing date of this report, based on the evaluation of these controls and procedures required by Rule 30a-3(b) under the Act. |
| |
| (b) | There were no changes in the registrant’s internal control over financial reporting (as defined in Rule 30a-3(d) under the Act) that occurred during the registrant’s second fiscal quarter of the period covered by this report that have materially affected, or are reasonably likely to materially affect, the registrant’s internal control over financial reporting. |
| |
| (a) | (1) Any code of ethics or amendment thereto, that is the subject of the disclosure required by Item 2, to the extent that the registrant intends to satisfy Item 2 requirements through filing an exhibit. Incorporated by reference to the Registrant’s Form N-CSR filed March 1, 2004. |
|
| | | |
|
| | (2) A separate certification for each principal executive officer and principal financial officer pursuant to Section 302 of the Sarbanes-Oxley Act of 2002. Filed herewith. |
|
| | | |
|
| | (3) Any written solicitation to purchase securities under Rule 23c-1 under the Act sent or given during the period covered by the report by or on behalf of the registrant to 10 or more persons. Not applicable to open-end investment companies. |
| |
| (b) | Certifications pursuant to Section 906 of the Sarbanes-Oxley Act of 2002. Furnished herewith. |
| |
SIGNATURES
Pursuant to the requirements of the Securities Exchange Act of 1934 and the Investment Company Act of 1940, the registrant has duly caused this report to be signed on its behalf by the undersigned, thereunto duly authorized.
| The Berkshire Funds |
| |
| By /s/ Malcolm R. Fobes III |
| Malcolm R. Fobes III |
| President and Treasurer |
| |
| Date |
Pursuant to the requirements of the Securities Exchange Act of 1934 and the Investment Company Act of 1940, this report has been signed below by the following persons on behalf of the registrant and in the capacities and on the dates indicated.
| By | /s/ Malcolm R. Fobes III |
| | Malcolm R. Fobes III |
| | President and Treasurer |
| |
| Date | 3/6/2018 |