Exhibit 99.2
TECHNICAL REPORT on the RESOURCES of the
SILVER-ZINC SIERRA MOJADA PROJECT
COAHUILA, MEXICO
NAD 27 Zone 13 Mexico
Latitude 27°24' North and Longitude 103°43' West (Centre of Project)
Report Date: April 30, 2013
Effective Date: March 18, 2013
Prepared for:
Silver Bull
RESOURCES INC.
Silver Bull Resources Inc.
Suite 1908, 925 West Georgia St,
Vancouver, BC, Canada
V6C 3L2
Ph: (604) 687-5800
Qualified Persons Mr. Allan Reeves, P.Geo. Mr. Gilles Arseneau, Ph.D., P.Geo. | Company JDS Energy & Mining Inc. SRK Consulting (Canada) Inc.
|
Vancouver Office T 604.687.7545 F 604.689.5041 #860 - 625 Howe Street Vancouver, BC V6C 2T6 | Jdsmining.ca Kelowna Office T 250.763.6369 F 250.763.6302 #200 - 532 Leon Avenue, Kelowna, BC V1Y 6J6 |
Report Date: April 30, 2013
Effective Date: March 18, 2013
Report Date: April 30, 2013
Effective Date: March 18, 2013
Report Date: April 30, 2013
Effective Date: March 18, 2013
Report Date: April 30, 2013
Effective Date: March 18, 2013
Report Date: April 30, 2013
Effective Date: March 18, 2013
Report Date: April 30, 2013
Effective Date: March 18, 2013
NOTICE
This report was prepared as a National Instrument 43-101 Technical Report, in accordance with Form 43- 101F1, for Silver Bull Resources Inc. The quality of information, conclusions and estimates contained herein is based on: (i) information available at the time of preparation; (ii) data supplied by outside sources, and (iii) the assumptions, conditions and qualifications set forth in this report.
Silver Bull Resources Inc. is authorized to file this report as a Technical Report with the Canadian Securities Regulatory Authorities pursuant to provincial securities legislation. Except for the purposes legislated under provincial securities law, any other use of this report by any third party is at that party's sole risk.
Report Date: April 30, 2013
Effective Date: March 18, 2013
This Technical Report dated April 30, 2013, was prepared by JDS Energy & Mining Inc. (JDS) for Silver Bull Resources Inc. (Silver Bull or SBR) to provide a NI-43-101 compliant technical report (Technical Report) of the updated mineral resources at the Sierra Mojada Project in Coahuila state, Mexico.
Mr. Allan Reeves, P.Geo. of JDS managed the report preparation. Dr. Gilles Arseneau, P.Geo., of SRK Consulting (Canada) Inc. prepared the Termite/Long Hole Comparison Section 11.3.
The mineral resource estimate in this report replaces the mineral resource estimate from SRK Consulting Inc. (SRK) in July 2012. This report focuses on both the near surface silver mineralization that has been referred to as the "Shallow Silver Zone" (SSZ) and the historic red and white zinc zones that had been historically mined. Significant work has been done on structural and geologic mapping; modeling of the deposit and follow-up on previous work recommendations.
The Sierra Mojada Project has been the subject of previous technical reports which disclosed mineral resource estimates for the Shallow Silver Zone and the Red Zinc Zone respectively:
| ▪ | SRK in July 2012 and November of 2011 |
| ▪ | John Nilsson (and Ronald Simpson) in April 2011 |
| ▪ | Pincock Allan & Holt (PAH) in January 2010. |
This Technical Report was prepared in compliance with the requirements of the Canadian Securities Administrators' NI 43-101 and Form 43-101F1.
The Sierra Mojada Project is located in the northwestern part of Coahuila State, Mexico, close to the border with Chihuahua State.
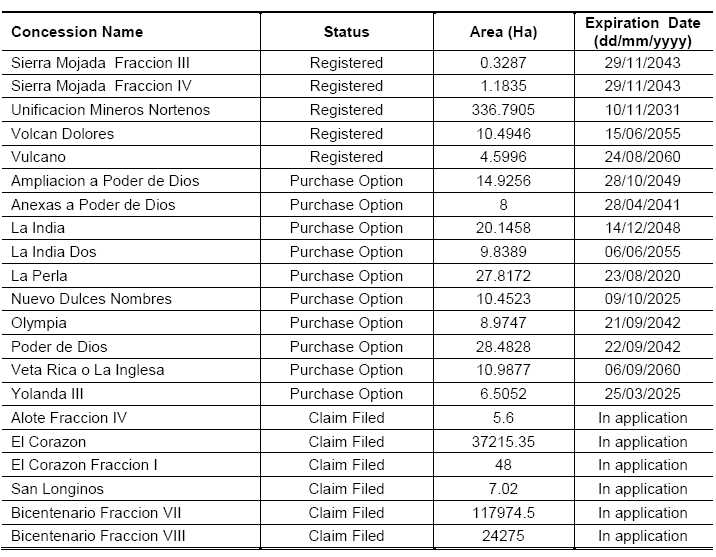
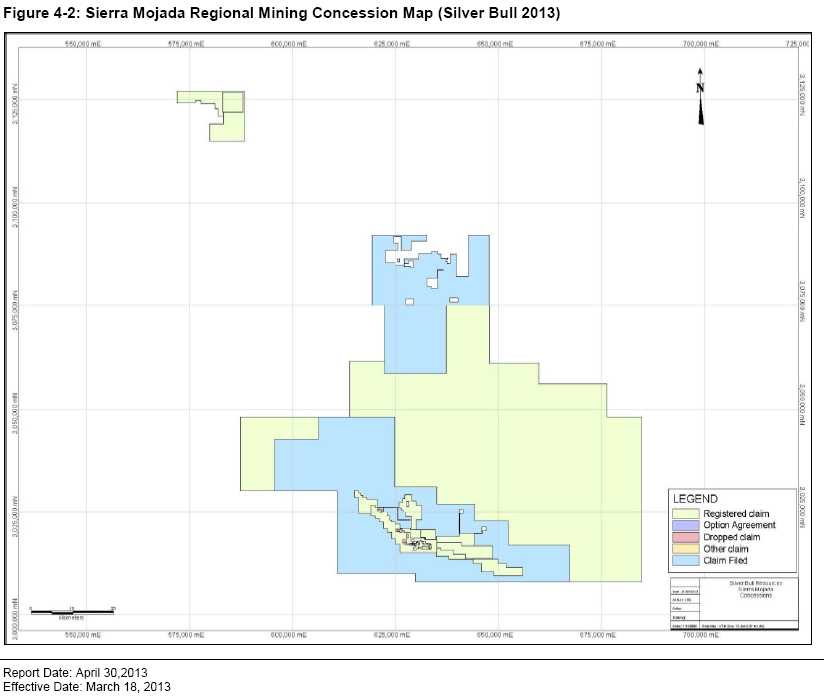
Silver Bull has 30 registered concessions, 10 concessions under option purchase agreements, and 6 concessions with claims filed for a total of 46 concessions. Total area for the mining concessions currently held by Silver Bull, excluding the "claim filed" concessions is 391,991.21 ha.
Silver Bull operates in Mexico through a wholly owned Mexican subsidiary; Minera Metalin S.A. de C.V. All minerals in Mexico are owned by the federal government and mineral rights are granted by soliciting mining concessions, which by law have priority over surface land use, but in practice the concessions owner must have an agreement with the surface owner.
As previously described by SRK (2012):
Report Date: April 30, 2013
Effective Date: March 18, 2013
"The Sierra Mojada Project area is situated in the northwestern part of Coahuila State, Mexico at latitude 27°24' North and longitude 103°43' West, close to the border with Chihuahua State, south of the village of Esmeralda. It is accessible by paved roads from the city of Torreon, Coahuila which lies about 250km to the southwest.
Most of the area adjacent to the project site is used for cattle ranching, however; the southeastern boundary of the project abuts the Penoles dolomite extraction and processing facility. The Penoles quarrying facility contains associated waste piles and a 1km long conveyor belt transporting crushed dolomitic carbonate aggregate of specific magnesium carbonate grade to the railroad spur for transportation to the Penoles process plant known locally as Quimica del Rey.
A rail line utilized by Penoles to transport material to its chemical plant extends west to La Esmeralda. The remains of an older section extend right up to old workings and a loading facility located south of La Mesa Blanca right in the center of the Sierra Mojada Camp. The spur line connects the main national line which connects Escalon and Monclova. Rail traffic to the east is through Frontera to the United States via Eagle Pass, Texas, or southward to Monterrey or the seaport at Altamira. Service to the west is available as well as to the western USA via El Paso, or to points south connected through Torreon. Although power levels are sufficient for current operations and exploration, any development of the project would potentially require additional power supplies to be sourced
Silver and lead were first discovered by a foraging party in 1879, and mining to 1886 consisted of native silver, silver chloride, and lead carbonate ores. After 1886 silver-lead-zinc-copper sulphate ores within limestone and sandstone units were produced. No accurate production history has been found for historical mining during this period."
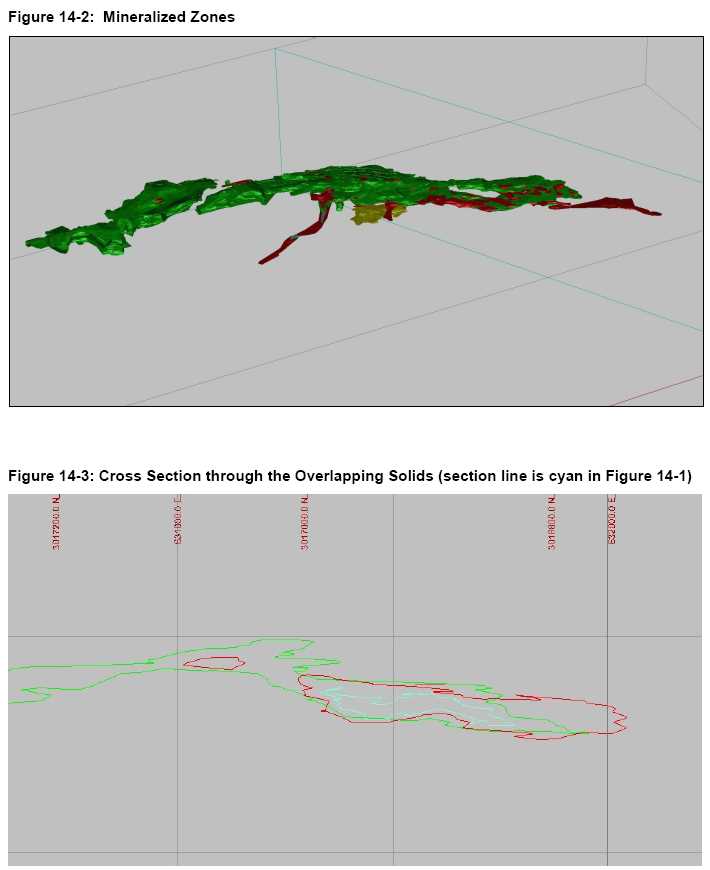
The Sierra Mojada project area is host to several mineralized zones varying from the 'red zinc' (hemimorphite-rich) manto; a 'white zinc' (smithsonite-rich) manto; and silver-lead rich zones. As reported by SRK (2012):
"Approximately 120 years ago, zinc silicate and zinc carbonate minerals (Zinc Manto Zone) were discovered underlying the silver-lead mineralized horizon. The zinc Manto is predominantly zinc dominated, but with subordinate lead-rich manto and is principally situated in the footwall rocks of the Sierra Mojada Fault System. Since discovery and up to 1990; zinc, silver, and lead ores were mined from various mines along the strike of the deposit, including from the Sierra Mojada property. Ores mined from within these areas were hand sorted and the concentrate shipped mostly to smelters in the United States.
Metalline Mining Company (Metalline) entered into a Joint Exploration and Development Agreement with USMX in July 1996, involving USMX's Sierra Mojada concessions. In October 1999, Metalline entered into a joint venture with North Limited of Melbourne, Australia (now Rio Tinto). Exploration by North Limited consisted of underground channel samples in addition to surface RC and diamond drilling. North Limited withdrew from the joint venture in October 2000.
Report Date: April 30, 2013
Effective Date: March 18, 2013
A joint venture agreement was made with Penoles in November 2001. The agreement allowed Penoles to acquire 60% of the project by completing a bankable Feasibility Study and making annual payments to Metalline.
During 2002, Penoles conducted an underground exploration program consisting of driving raises through the oxide zinc Manto, diamond drilling, continuation of the percussion drilling and channel sampling of the oxide zinc workings (stopes and drifts) previously started by Metalline in 1999, and continued by North in 2000 and Metalline during 2001.
In December 2003, the joint venture was terminated by mutual consent between Penoles and Metalline. Since 2003, Metalline continued sampling numerous underground workings through channel and grab samples.
In April 2010, Metalline merged with Dome Ventures, retaining the name Metalline Mining Inc. Subsequently, in April 2011, the company changed name to Silver Bull Resources. Silver Bull continued to diamond drill the project until June of 2012."
JDS has been providing project management services to the Sierra Mojada Project since the merger of Metalline Mining Inc. and Dome Ventures Inc. in 2010.
| 1.4 | Geology and Mineralization |
Sierra Mojada is located in the Eastern Tectonic Zone of Mexico, which represents a passive plate margin relative to the Western Zone which documents a convergent plate margin. The boundary between the Eastern and Western terrains is in Chihuahua State, just west of the Sierra Mojada project area. Within the Eastern Zone, the project is located in the Coahuila terrain which is composed of moderately metamorphosed flysch and un-metamorphosed andesitic volcanic rocks cut by granite and granodiorite intrusives of Permian to Triassic age. The district is located on passive margin type Cretaceous platform carbonate rocks of the Sabinas Basin, which have been structurally prepared from Jurassic through Tertiary time by the complex San Marcos fault system.
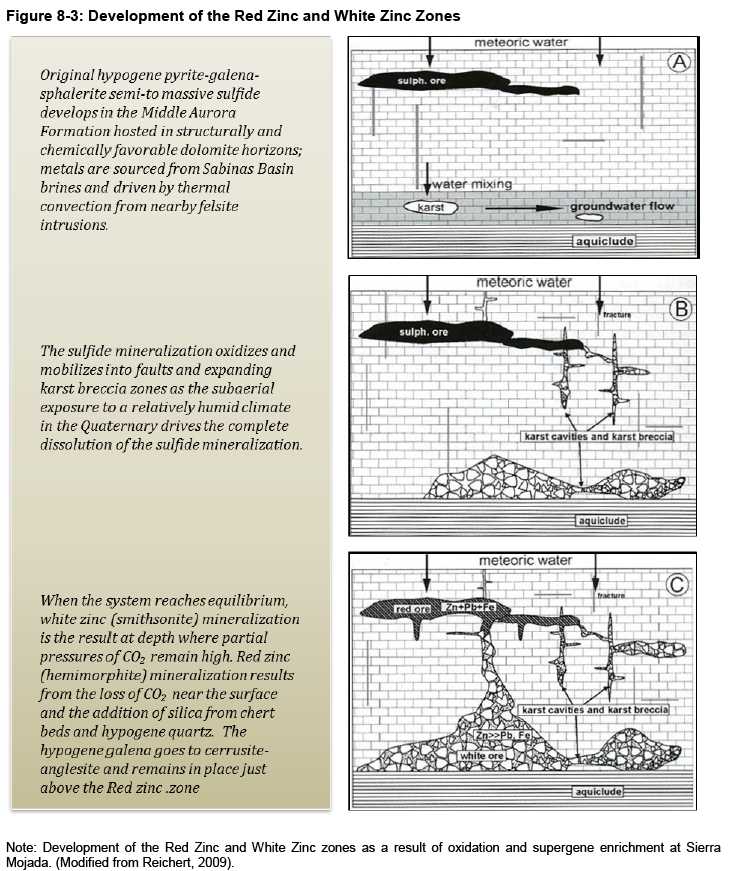
Along the San Marcos fault system are one or more mineralizing intrusions which are inferred from direct and indirect evidence in the district leading to the identification of the district as being a CRD (Carbonate Replacement Deposit). The district shows a complex history of hypogene sulfide mineralization followed by oxidation and supergene alteration of the mineral profile. Hydrothermal alteration follows a clear sequence of dolomitization, carbonate and silica alteration; followed by late carbonate, silica, argillic, and iron oxide alterations related to the oxidation-supergene events. Approximately 80% of the district mineralization is hosted by dolomite and the remainder in limestone.
The alteration-mineralizing events have generated two types of mineralization in the Sierra Mojada district; The Shallow Silver Zone (SSZ) and the Base Metal Manto Zone (BMM). Mineralization in the Shallow Silver Zone is dominated by acanthite, the silver halide solid solution of bromargyrite-chloragyrite, and tennantite. Silver occurs in early to late high grade structures,
Report Date: April 30, 2013
Effective Date: March 18, 2013
karst breccias, low-angle fault breccias, and mantos, and as disseminated replacements in porous hydrothermally altered dolomites.
The Base Metal mineralization is dominated by hemimorphite in the Red Zinc Zone and smithsonite in the White Zinc Zone. Mineralization primarily occurs as replacement of karst breccia and accessory faults which feed the breccia zones. Non-sulfide base metal mineralization is a result of oxidation and supergene enrichment of an original zone of semi-to massive pyrite-sphalerite-galena ore largely located in the Lead zone manto mineralization.
The result is a silver (copper) rich polymetallic zone of mineralization overlaying a large non- sulfide zinc-lead resource, both forming a linear zone of manto shaped mineralization which is cross cut by mineralized structures.
| 1.5 | Exploration Status & Drilling |
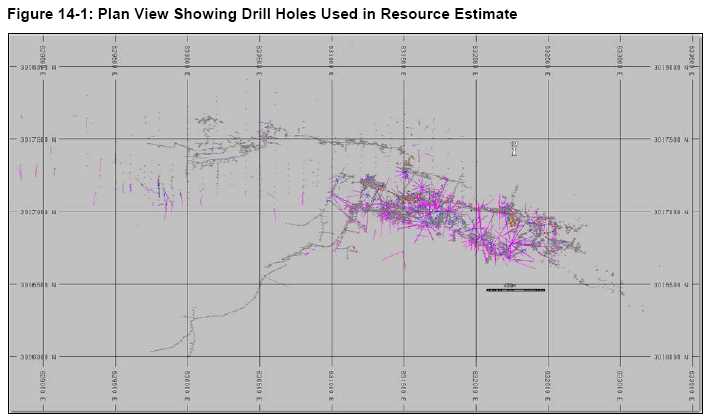
Since the previous technical report, underground geological and structural mapping has been completed to improve geological modeling and planning of exploration drill programs. Exploration drilling has been limited to an underground core drilling program intended to verify long hole assays from previous years. While designed to verify historic sludge sampled drill holes, some drill holes were added to supplement existing interpretations and improve grade estimation in areas that had been under-sampled.
| 1.6 | Sample Preparation, Analyses and Data Verification |
In the time JDS has provided management services there has been no change in the methodology of sample preparation and chain-of-custody. In 2010, the onsite assay lab was decommissioned to eliminate any questions of sampling bias. As noted by SRK (2012):
"All analytical work used in the project has been performed in the ALS laboratory ("ALS") in Vancouver, BC, Canada. ALS is a leading provider of assaying and analytical testing services for mining and exploration companies. The laboratory is ISO 9001:2000 and ISO/IEC 1702S:2005 certified. SRK is of the opinion that the sample preparation, security and analysis meets or exceeds industry standards and is adequate to support a mineral resource estimate as defined under NI43-101, but that better care should be taken in reviewing and analyzing the QA/QC.
SRK downloaded all available data from ALS and compared the digital database supplied by Silver Bull against original assay data provided by ALS. A total of 37,100 assays were checked against the digital database; about 23% of the total assay population. While some discrepancies were observed, most of the errors were considered not material and most were easily explained. A few samples that did not agree with the assay certificates were not used for the resource estimate."
JDS has been direct email copied from ALS-Chemex (now ALS-Global) with the assays and has had the opportunity to verify the assays against the loaded data. In addition, in 2011 IoGlobal (based in Australia) provided data verification services to Silver Bull Resources. For this
Report Date: April 30, 2013
Effective Date: March 18, 2013
program, emphasis has been upon verification of assays arising from the surface drilling (B-series 2012 holes not included by SRK, and the T-series 2012 holes (used for twinning and exploration).
JDS also examined the updated wireframing, and although some "roughness" is present, the wireframes are a reasonable representation of what has been observed underground and modified from previous modeling work.
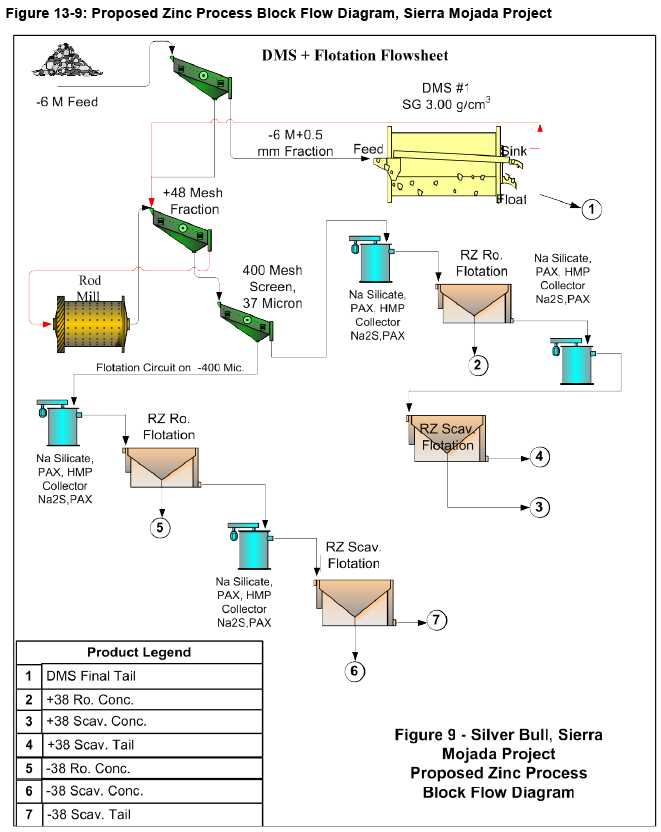
Metallurgical testing of the mineralization at Sierra Mojada in the early years of Metalline Mining Co. work focused on the oxidized zinc mineralization. Poor recoveries and low metal prices persuaded Silver Bull to consider newer technologies. Mr. Bill Pennstrom examined the SART Process and its application to Sierra Mojada Project mineralization. Improved recoveries and the ability to recover/reduce cyanide consumption suggest improved economics that will be further evaluated.
Classification has been done adhering to CIM Standards as defined below.
Mineral Resources are sub-divided, in order of increasing geological confidence, into Inferred, Indicated and Measured categories. An Inferred Mineral Resource has a lower level of confidence than that applied to an Indicated Mineral Resource. An Indicated Mineral Resource has a higher level of confidence than an Inferred Mineral Resource but has a lower level of confidence than a Measured Mineral Resource.
A Mineral Resource is a concentration or occurrence of diamonds, natural solid inorganic material, or natural solid fossilized organic material including base and precious metals, coal, and industrial minerals in or on the Earth's crust in such form and quantity and of such a grade or quality that it has reasonable prospects for economic extraction. The location, quantity, grade, geological characteristics and continuity of a Mineral Resource are known, estimated or interpreted from specific geological evidence and knowledge.
The term Mineral Resource covers mineralization and natural material of intrinsic economic interest which has been identified and estimated through exploration and sampling and within which Mineral Reserves may subsequently be defined by the consideration and application of technical, economic, legal, environmental, socio-economic and governmental factors. The phrase 'reasonable prospects for economic extraction' implies a judgement by the Qualified Person in respect of the technical and economic factors likely to influence the prospect of economic extraction. A Mineral Resource is an inventory of mineralization that under realistically assumed and justifiable technical and economic conditions might become economically extractable. These assumptions must be presented explicitly in both public and technical reports.
Report Date: April 30, 2013
Effective Date: March 18, 2013
1.8.1.2 Indicated Mineral Resource
An 'Indicated Mineral Resource' is that part of a Mineral Resource for which quantity, grade or quality, densities, shape and physical characteristics can be estimated with a level of confidence sufficient to allow the appropriate application of technical and economic parameters, to support mine planning and evaluation of the economic viability of the deposit. The estimate is based on detailed and reliable exploration and testing information gathered through appropriate techniques from locations such as outcrops, trenches, pits, workings and drill holes that are spaced closely enough for geological and grade continuity to be reasonably assumed.
Mineralization may be classified as an Indicated Mineral Resource by the Qualified Person when the nature, quality, quantity and distribution of data are such as to allow confident interpretation of the geological framework and to reasonably assume the continuity of mineralization. The Qualified Person must recognize the importance of the Indicated Mineral Resource category to the advancement of the feasibility of the project.
All silver and zinc resources are classified as Indicated while lead and copper are classified as Inferred. Although the lead and copper resources are within the distance and spacing criteria, the authors believe further work is required to develop confidence in the source data and economics prior to classifying these resources as Indicated.
The mineral resources are confined within an optimized Lerchs-Grossman (LG) pit shell to ensure reasonable prospects of economic extraction. The pit shell was generated using a silver, zinc, lead and copper prices of $29.20 per ounce silver, $0.95 per pound zinc, $1.00 per pound lead and $3.70 per pound copper, as defined by the 3-year trailing average as on January 31, 2013. Mining costs (ore and waste) of US$1.50/tonne, processing costs of US$13.00/tonne (including G&A) and an overall pit slope of 50° were used for the pit optimizations. Recoveries were assumed to be 100%.
For the purposes of determining a cutoff grade, JDS used a silver Recovery of 75% and a dilution factor of 80% with the following calculation:
(Processing Costs+ G&A Costs)/[(Ag Price)/31.1035 * %Rec * %Dilution]
Thus the Cut-off calculation is:
(12.00 - 1.00)/[29.20/31.104 * 75% *80%] = 23.08 g/t => USE 25.0 g/t
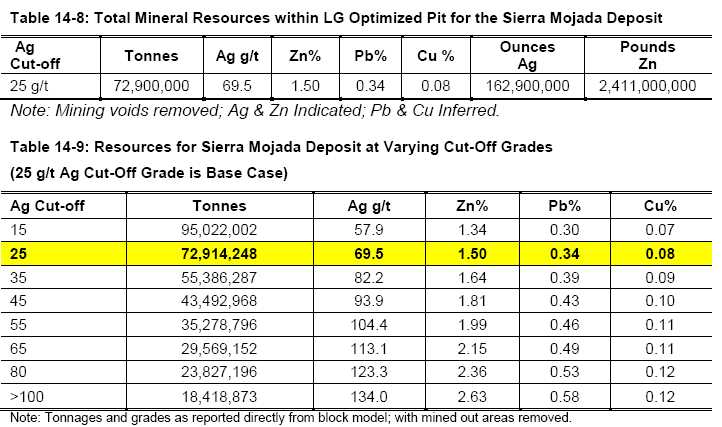
The combined mineral resources are listed at this base case cut-off grade of 25g/t Ag as shown in Table 1-1. In addition, Table 14-9 tabulates the resources at varying silver cut-off grades.
Report Date: April 30, 2013
Effective Date: March 18, 2013
Table 1-1 Mineral Resources within LG Optimized Pit Shell
Ag Cut Off | Tonnes | Ag g/t | Zn% | Pb% | Cu % | Ounces Ag | Pounds Zn |
| 25 g/t | 72,900,000 | 69.5 | 1.50 | 0.34 | 0.08 | 162,900,000 | 2,411,000,000 |
Note: Mining voids removed. Ag & Zn are Indicated; Pb & Cu are inferred.
1.9 Interpretations, Conclusions and Recommendations
JDS recommends that Silver Bull Resources:
| ● | Continue to drill-test the silver zones at the west end of the Sierra Mojada property. |
| ● | The next phase work program should include geotechnical drilling to confirm appropriate slope angles for future open pit design work. |
| ● | Continue to do limited programs of duplicate channel sampling to help eliminate the possibility that the channel sample bias is a result of a sampling bias. |
| ● | Complete the SART process metallurgical test work and confirm recovery parameters. |
| ● | Continue work on improved interpretation and modeling of domains. |
| ● | Revise the underground mined out solids and voids. |
| ● | Collect additional SG data. |
| ● | Detail power and water sources, requirements, and begin permit process |
| ● | Conduct a Preliminary Economic Assessment (PEA). |
JDS estimates that the total cost of the next phase work program is approximately US$2.5M.
Table 1-2: Estimated Cost of Recommended Work Programs
| Item | | Cost in US$ | |
| 5,000 meters of drilling (infill; geotechnical; metallurgical) | | | 1,250,000 | |
| Geotechnical analysis (equipment rentals; collection; analysis) | | | 500,000 | |
| Hydrological packer testing ( 8 @ ~$2500 each) | | | 20,000 | |
| Metallurgical testing -SART process | | | 250,000 | |
| Preliminary Economic Analysis study | | | 300,000 | |
| Initiation of Permitting and Environmental Studies | | | 200,000 | |
| Subtotal | | $ | 2,520,000 | |
Report Date: April 30, 2013
Effective Date: March 18, 2013
This Technical Report dated April 30, 2013, was prepared by JDS to provide a NI-43-101 compliant technical report (Technical Report) of the updated resources at the Sierra Mojada Project in Mexico. Silver Bull Resources Inc. (Silver Bull) has a 100% interest in the 46 concessions.
Mr. Allan Reeves, P.Geo., of JDS managed the report preparation. Dr. Gilles Arseneau, P.Geo., of SRK Consulting (Canada) Inc. prepared the Termite/Long Hole Comparison Section 11.3.
This Technical Report was prepared in compliance with the requirements of the Canadian Securities Administrators' NI 43-101 and Form 43-101F1.
The current mineral resource estimate presented in this report replaces the previous mineral resource estimate from SRK Consulting Inc. (SRK) in July 2012. JDS Energy & Mining Inc. has provided project management services since July 2010 and as part of these services have been further commissioned to prepare this NI 43-101 Resource Technical report, and a follow-up Preliminary Economic Assessment.
| 2.3 | Statement of Independence |
Neither JDS nor any of the authors of this Report have any beneficial interest in the outcome of the technical assessment being capable of affecting its independence. JDS's fee for completing this Report is based on its normal professional rates plus reimbursement of incidental expenses. The payment of that professional fee is not contingent upon the outcome of the Report.
Mr. Allan Reeves, P.Geo, a qualified person under the terms of NI 43-101, has spent a considerable amount of time at the Sierra Mojada site in the role of project manager and resource consultant. It is estimated that the time totalled: 62 days in 2010; 108 days in 2011; and 80 days in 2012.
The purpose of Mr. Reeves site visits varied from coverage as site manager during the Dome Ventures-Metalline Mining Company transition period; QA/QC review of data collection methods and quality; the implementation of safety systems and protocols; and to assist on surface/underground tours for visitors.
Silver Bull allowed JDS access to all digital and paper copy data collected over the years. JDS also had many opportunities to review the geology and mineralization encountered both on surface and underground as well as examining random drill core.
Report Date: April 30, 2013
Effective Date: March 18, 2013
Mr. Gilles Arseneau, P.Geo., has visited the site on July 27 and 28, 2011, on October 1 to October 3, 2011 and on February 21 to 23, 2012.
Unless otherwise stated all units used in this report are metric. Assay values are reported in grams per metric tonne (g/t) unless some other unit is specifically stated. The US$ is used throughout this report.
This report is based, in part, on internal Company technical reports, and maps, published government reports, Company letters and memoranda, and public information as listed in the References Section 27.0 at the conclusion of this Technical Report.
The Sierra Mojada Project has been the subject of two previous NI 43-101 compliant technical reports by SRK Consulting Inc. (SRK). Both reports were prepared by Dr. Gilles Arseneau, with the first in November 2011 and an update in July 2012.
Earlier reports consisted of the Nilsson report in April 2011 (authored by Ronald Simpson and John Nilsson). In January 2010 Pincock Allan & Holt (PAH) prepared a report which disclosed mineral resource estimates for the Shallow Silver Zone and the Red Zinc Zone respectively.
JDS has relied upon some of the previously disclosed reports along with newly collected information provided by Silver Bull Resources.
JDS has not conducted detailed land status evaluations, and has relied upon previous qualified reports, public documents and statements by the Company regarding Property status and legal title to the Sierra Mojada Project.
| 2.7 | Units of Measure, Calculations & Abbreviations |
A list of the main units, abbreviations and acronyms used throughout this report is presented in Table 2-2.
Report Date: April 30, 2013
Effective Date: March 18, 2013
Table 2-1: Units of Measure & Abbreviations Units of Measure
| um | Micron (micrometre) |
| Amp | Ampere |
| cm | Centimetre |
| g/t | Gram per tonne |
| hr | Hour |
| ha | Hectare |
| hp | Horsepower |
| kg | Kilogram |
| km | Kilometre |
km2 | Square kilometer |
| KPa | Kilopascal |
| kt | Thousand tonnes |
| Kw | Kilowatt |
| KWh | Kilowatt hour |
| L | Litre |
| lb or lbs | Pound(s) |
| m | Metre |
| M | Million |
| m2 | Square metre |
m3 | Cubic metre |
| min | Minute |
| mm | Millimetre |
| Mpa | Mega Pascal |
| mph | Miles per hour |
| Mtpa | Million tonnes per annum |
| Mt | Million tonnes |
| °C | Degree Celsius |
| oz | Troy ounce |
| ppb | Parts per billion |
| ppm | Parts per million |
| s | Second |
| t | Metric tonne |
| tpd | Tonnes per day |
| tph | Tonnes per hour |
| V | Volt |
| W | Watt |
| wmt | Wet metric tonne |
Report Date: April 30, 2013
Effective Date: March 18, 2013
Abbreviations & Acronyms
| % or pct | Percent |
| AAS | Atomic absorption spectrometer |
| Ag | Silver |
| Amsl | Above mean sea level |
| As | Arsenic |
| Au | Gold |
| C | Carbon |
| CAPEX | Capital Costs |
| CFE | Comision Federal de Electricidad |
| CIL | Carbon-in-leach |
| CIM | Canadian Institute of Mining |
| Elev | Elevation above sea level |
| GPS | Global positioning system |
| HG | High Grade |
| H:V | Horizontal to vertical |
| JDS | JDS Energy & Mining Inc. |
| LG | Low Grade |
| Ma | Million years ago |
| MMC | Metalline Mining Company |
| MXP | Mexican pesos |
| N,S,E,W | North, South, East, West |
| NPV | Net Present Value |
| NSR | Net Smelter Return |
| NI 43-101 | National Instrument 43-101 |
| OPEX | Operating costs |
| PA | Preliminary Assessment |
| PAX | Potassium Amyl Qanthate |
| Pb | Lead |
| PEA | Preliminary Economic Assessment |
| PFS | Prefeasibility Study |
| QA/QC | Quality Assurance/Quality Control |
| QMS | Quality Management System |
| RC | Reverse circulation |
| S | Sulfur |
| SEMARNAT | Secretaria de medio ambiente y recursos naturales |
| S.G. | Specific gravity |
| SBR | Silver Bull Berources Inc. |
| SRK | SRK Consulting Inc. |
| US$ | US dollars |
| Whittle | Gemcom Whittle- Strategic Mine Planning TM |
| X,Y,Z | Cartesian Coordinates, also Easting, Northing and Elevation |
| Zn | Zinc |
Report Date: April 30, 2013
Effective Date: March 18, 2013
| 3.0 | Reliance on Other Experts |
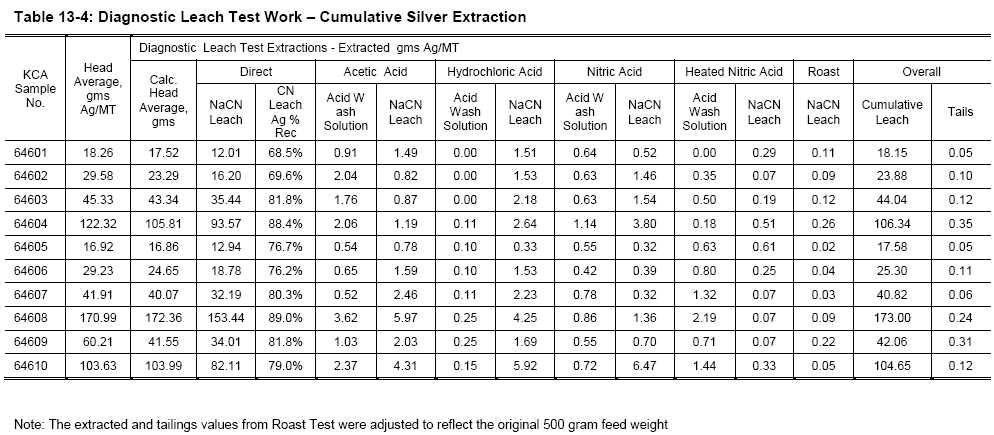
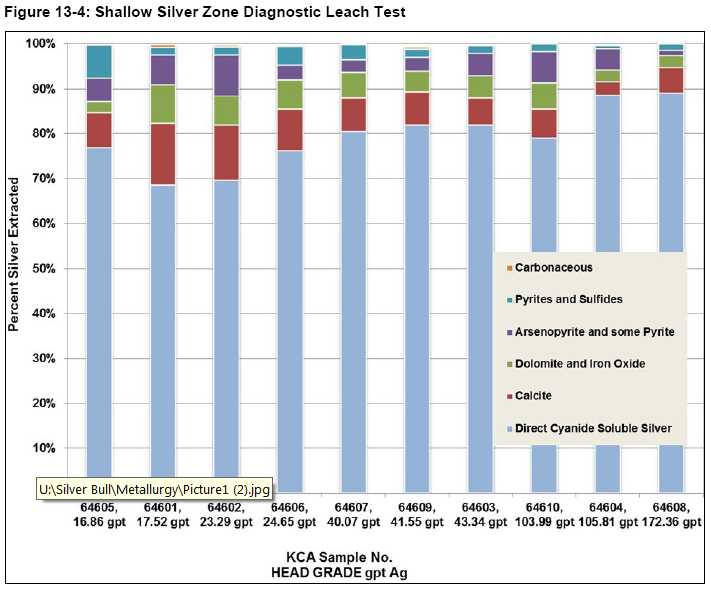
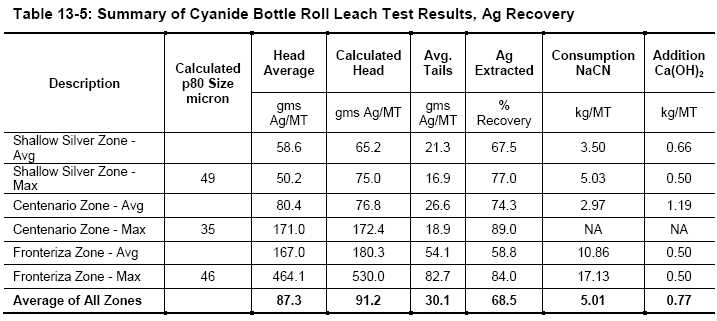
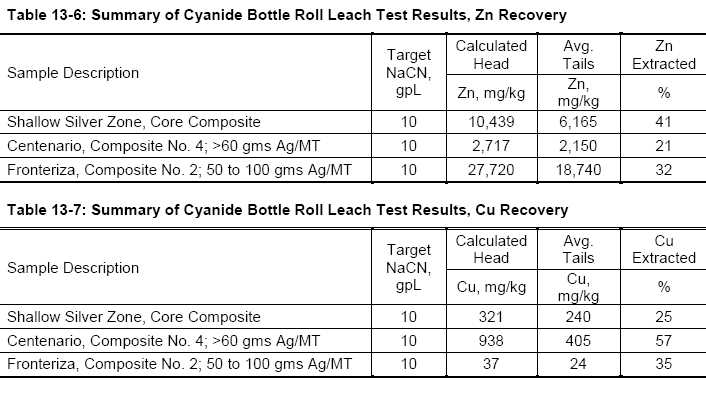
Independent metallurgical consultant Mr. William J. Pennstrom Jr., M.A.; QPMMSA of Pennstrom Consulting Inc. was contracted by Silver Bull to review the metallurgical testing programs conducted. Mr. Pennstrom's work was provided to JDS by Silver Bull and forms the basis of Section 13 - Mineral Processing and Metallurgical Testing. Responsibility for his work has been undertaken by Mr. Allan Reeves, a Qualified Person.
Although copies of the tenure documents, operating licenses, permits, and work contracts were reviewed, an independent verification of land title and tenure was not performed. JDS has not verified the legality of any underlying agreement(s) that may exist concerning the licenses or other agreement(s) between third parties but has relied on Silver Bull's solicitor to have conducted the proper legal due diligence. Information on tenure and permits was obtained from Silver Bull.
Based on Silver Bull's legal opinion the current mining law in Mexico allows for the concession to be issued for 50 years. This law was made effective April 29, 2005 and concessions issued prior to this change in mining law will have the expiration date of the concession amended to reflect the 50-year period. JDS has relied on representations and legal opinions provided by Silver Bull regarding the legal disposition of mining concessions.
JDS has relied completely on Silver Bull regarding all information related to the environmental, political and tax information about the project.
Report Date: April 30, 2013
Effecitve Date: March 18, 2013
| 4.0 | Property Description and Location |
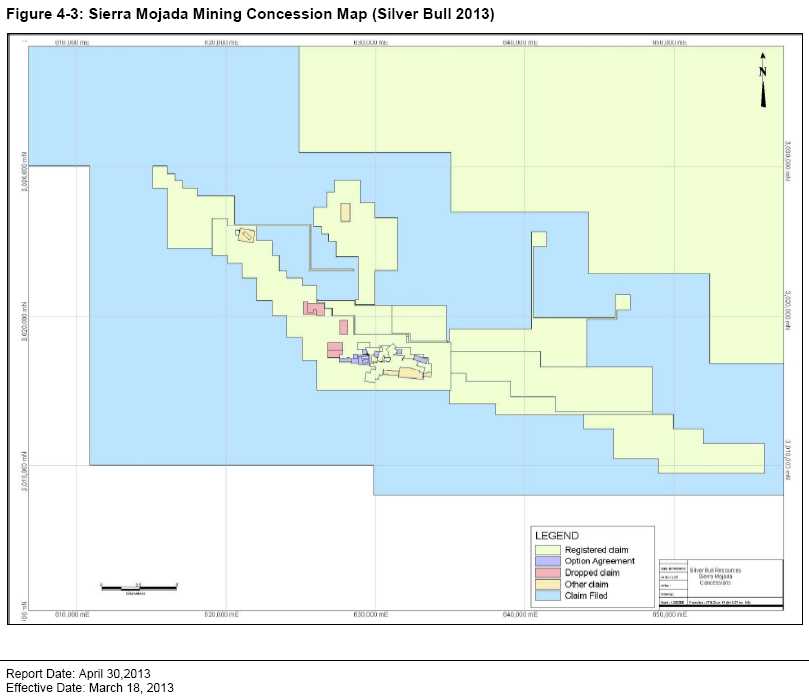
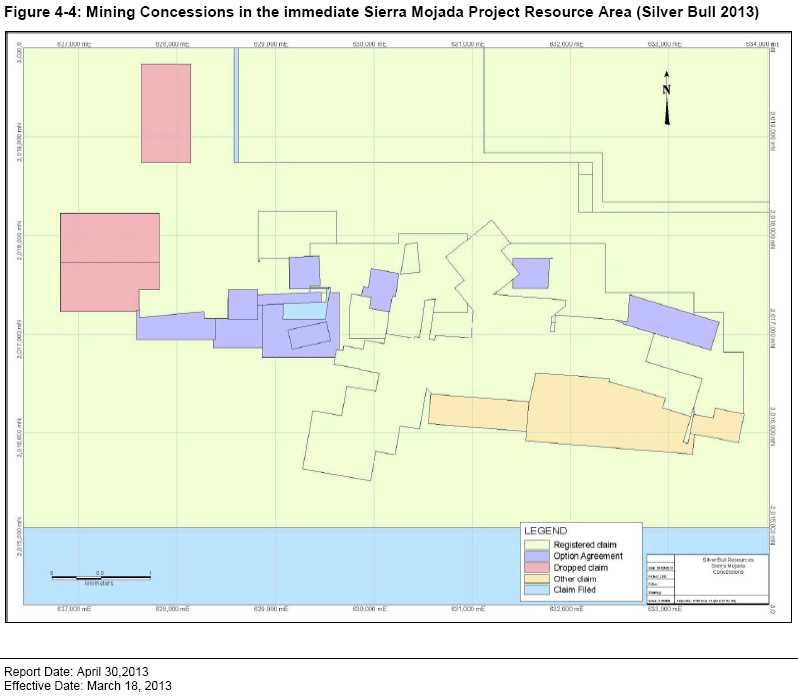
The Sierra Mojada project is located in the northwestern part of Coahuila State, Mexico, close to the border with Chihuahua State (Figure 4-1). Access is by paved Highway from the city of Torreon about 250km southwest of the project. The project site is situated about one km south of the village of Esmeralda.
The Sierra Mojada Project abuts a major escarpment that forms the northern margin of the Sierra Mojada range. The average elevation at the site is 1,500masl and is at latitude 27°24' North and longitude 103°43' West. Silver Bull Resources employs the NAD 27 Zone 13 survey coordinate system on the project.
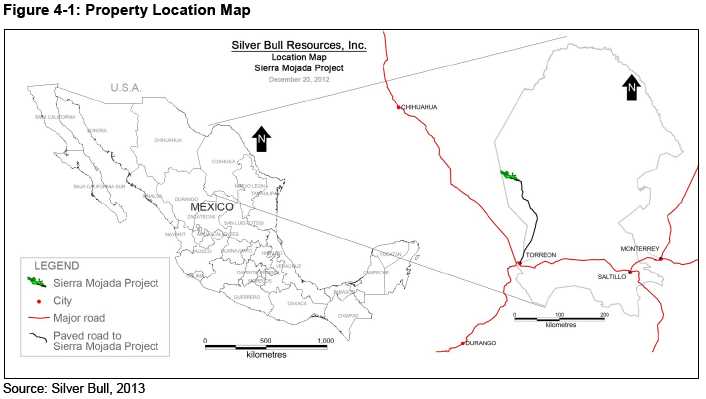
Silver Bull operates in Mexico through a wholly owned Mexican subsidiary; Minera Metalin S.A. de C.V. All minerals in Mexico are owned by the federal government and mineral rights are granted by soliciting mining concessions, which by law have priority over surface land use, but in practice the concessions owner must have an agreement with the surface owner. See Figure 4-2 for the location of the regional concessions.
JDS understands that all necessary agreements are in place and that the mining concessions are in good standing for the resource estimates presented in this report.
The Sierra Mojada Project contains all of the known reported historical silver-zinc resources in the area, and is composed of a number of mining concessions. Local mining concessions are shown in Figures 4-2, 4-3, and 4-4.
Report Date: April 30, 2013
Effective Date: March 18, 2013
Report Date: April 30, 2013
Effective Date: March 18, 2013
Report Date: April 30, 2013
Effective Date: March 18, 2013
Report Date: April 30, 2013
Effective Date: March 18, 2013
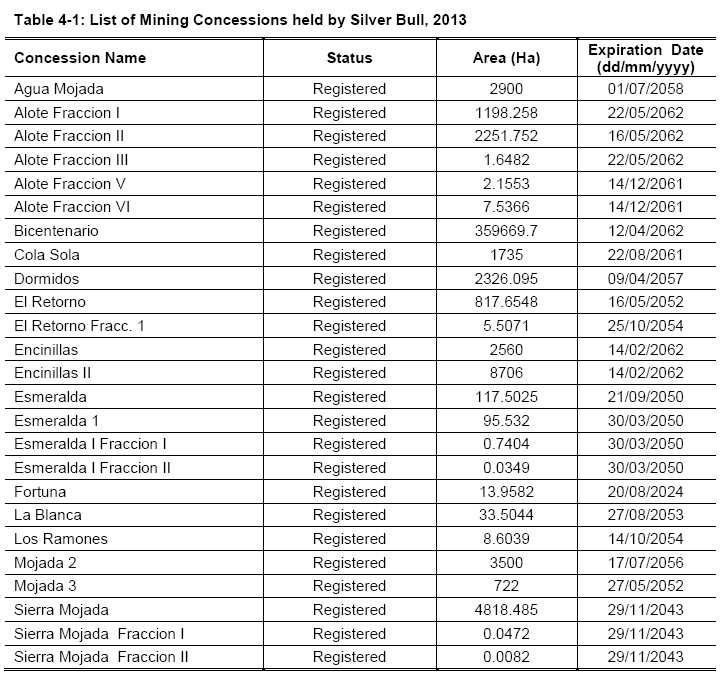
The mining concessions held by Silver Bull cover all the mineralized zones. No mining operations are currently active within the area, except for a dolomite quarry operated by Penoles near Esmeralda.
Table 4-1 shows the mining concessions currently held by Silver Bull. Total area for these licences excluding the "claim filed" concessions is 391,991.21 ha.
The "registered" concessions are 100% owned by a Silver Bull's wholly owned Mexican subsidiary; Minera Metalin S.A. de C.V. (Minera Metalin). In the concessions with the "purchase option" status, Minera Metalin has a 100% interest, and the "claim filed" concessions will be 100% owned once granted by the Mexican authorities.
Report Date: April 30, 2013
Effective Date: March 18, 2013
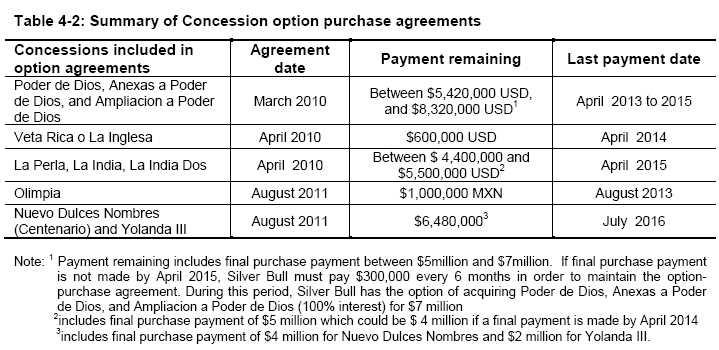
The Sierra Mojada property is subject to five concession option purchase agreements listed in the table below. Table 4-2 summarizes the obligations of each agreement.
Report Date: April 30, 2013
Effective Date: March 18, 2013
| 4.1 | Surface and Private Property Rights |
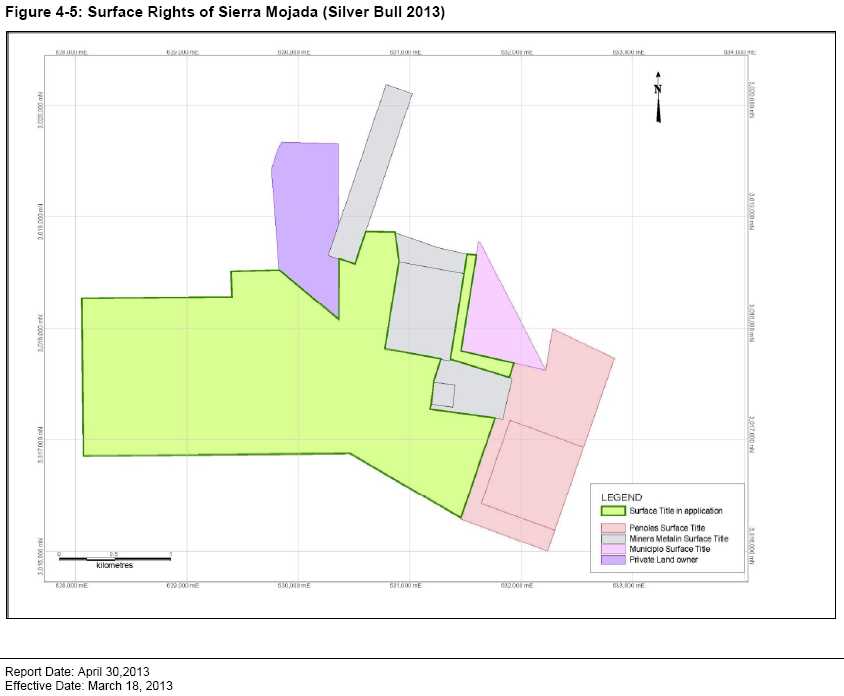
Approximately 80% of the area of interest labelled "Surface in Application" on Figure 4-5 (in green is currently owned by the Federal Government. The Municipality has applied to the Federal Government in order for the Federal Government to cede the rights to the Municipality (a formality since the Federal Government is not allowed to sell surface rights according to Mexican law). Silver Bull is already in discussions with the municipality of Sierra Mojada for acquisition of the surface rights once ceded. All of Silver Bull's fixed assets, including offices and buildings, are on land owned by Silver Bull.
| 4.2 | Environmental Liabilities |
There are no known environmental liabilities on the Sierra Mojada Project, and all necessary work permits are in good standing.
There are no known significant issues on the Sierra Mojada property.
I've brought this issue up before. We need to divulge the presence of an historic lead smelter under section 4.2 and the positive security situation under section 4.3.
Report Date: April 30, 2013
Effective Date: March 18, 2013
Report Date: April 30, 2013
Effective Date: March 18, 2013
| 5.0 | Accessibility, Climate, Local Resources, Infrastructure and Physiography |
The climate is arid and warm. Rainfall is scarce but more prominent in summer, whilst temperatures are very hot by day and cool at night. The average annual temperature is 14 °C to 16 °C, with rainfall of 400 to 500mm per year.
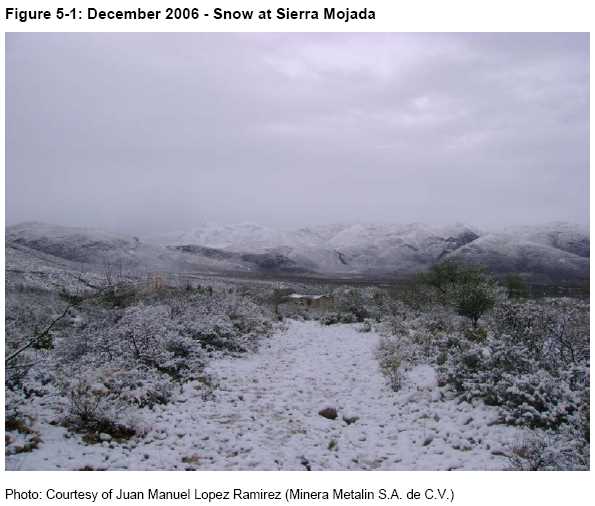
The highest daily temperatures are generally recorded in May, with maximum temperatures being moderated somewhat by rainfall during June through October. Freezing occurs from time to time during the winter - particularly in January and February - although this occurs less than 20 days out of the year in most years. Occasionally there is snow as can be seen in Figure 5-1.
Winds are highly variable, but strong southerly winds coming down from the mountains are common. Streams are ephemeral and wells with acceptable water quality are tens to hundreds of meters deep. (SRK 2012)
Report Date: April 30, 2013
Effective Date: March 18, 2013
Report Date: April 30, 2013
Effective Date: March 18, 2013
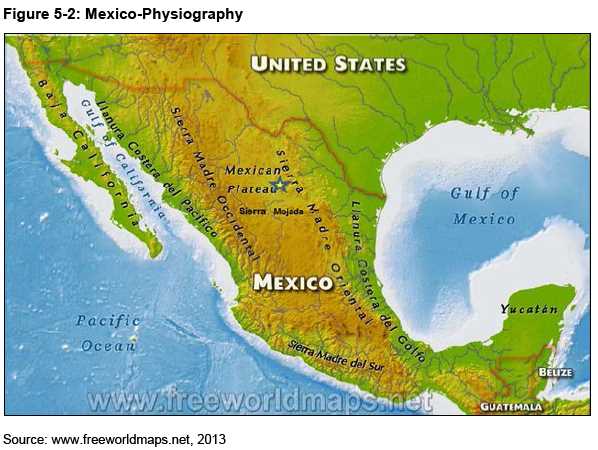
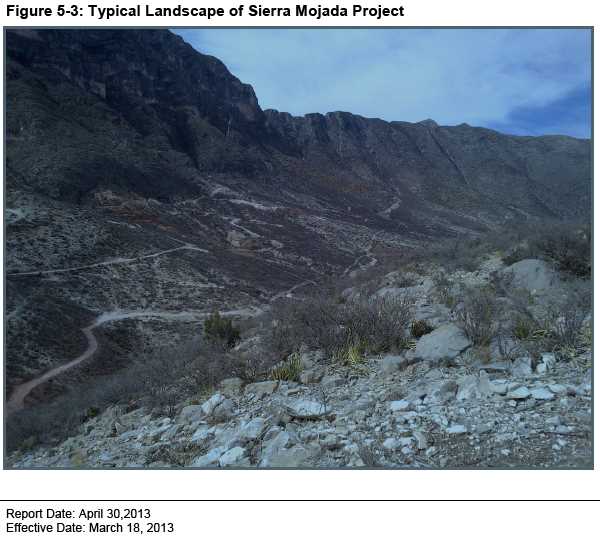
The project is located west of Sierra Madre Oriental on the Mexican Plateau as shown on Figure 5-2. The terrain is generally flat, with prominent relief formations of up to 1,500m along the southern boundary of the project site as shown on Figure 5-3.
The majority of the mineral concessions are located in areas at the base of the cliffs where there is moderate relief with numerous stream forming gullies that erode the surface alluvium. The area is high desert covered by scrub vegetation; comparable to the Basin and Range in Nevada. Mining operations are viable throughout the year (SRK 2012).
While most of the area peripheral to the project site is used for cattle ranching, the village of La Esmeralda and the town of Sierra Mojada (about 4km west of the project camp) can provide local workforce and minor supplies. Both communities offer basic services and for the project and are linked by paved road.
Mina Dolomita, the Penoles dolomite extraction and crushing facility is located at the southeastern boundary of the project. The mine contains waste piles and a 1km long conveyor belt that transports crushed dolomitic carbonate aggregate of specific magnesium carbonate grade to their railroad spur for bi-weekly transportation to the Penoles Quimica Del Rey plant in Laguna Del Rey.
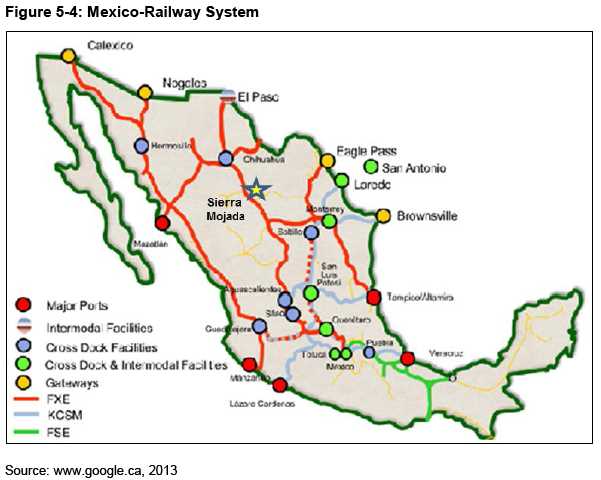
A rail line utilized by Penoles to transport material to its chemical plant extends west to La Esmeralda. The remains of an older section extend right up to old workings and loading facility located south of La Mesa Blanca right in the center of the Sierra Mojada Camp. The spur line connects the main national line which connects Escalon and Monclova. Rail traffic to the east is through Frontera to the United States, via Eagle Pass, Texas, southward to Monterrey, or via the seaport at Altamira/Tampico (Figure 5-3). Service to the west is also available, as well as to the western USA via El Paso, or to points south connected through Torreon.
Although power levels are sufficient for current operations and exploration, any development of the project would potentially require additional power supplies to be sourced. The Comision Federal de Electricidad (English: Federal Electricity Commission) is the Mexican state-owned electricity monopoly, widely known as CFE, which provides service to the area.
Report Date: April 30, 2013
Effective Date: March 18, 2013
Report Date: April 30, 2013
Effective Date: March 18, 2013
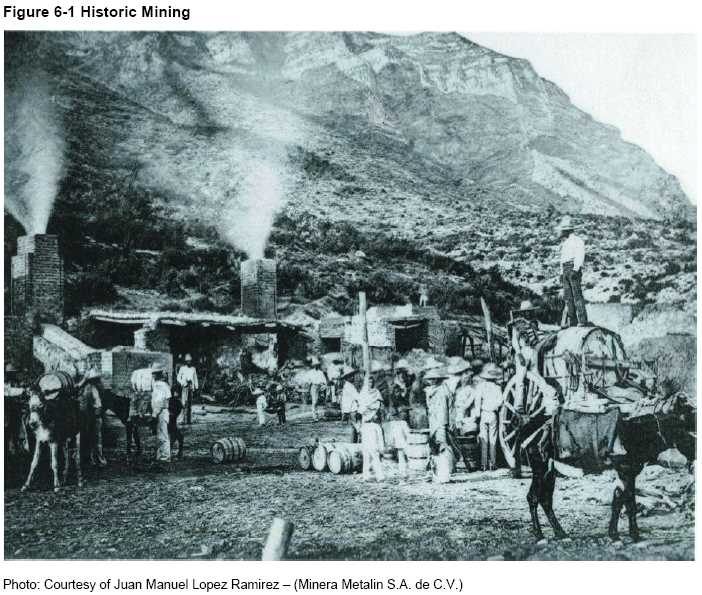
The following historical summary has been extracted from previous technical reports and information provided by Silver Bull.
Silver and lead were first discovered by a foraging party in 1879, and mining to 1886 consisted of native silver, silver chloride, and lead carbonate ores. Alter 1886, silver-lead-zinc-copper sulphate ores within limestone and sandstone units were produced. No accurate production history has been found for historical mining during this period.
Approximately 90 years ago, zinc silicate and zinc carbonate minerals ("Zinc Manto Zone") were discovered underlying the silver-lead mineralized horizon. The Zinc Manto Zone is predominantly zinc dominated, but with subordinate Lead - rich manto and is principally situated in the footwall rocks of the Sierra Mojada Fault System. Since discovery and up to 1990; zinc, silver, and lead ores were mined from various mines along the strike of the deposit including from the Sierra
Report Date: April 30, 2013
Effective Date: March 18, 2013
Mojada property. Ores mined from within these areas were hand sorted and the concentrate shipped mostly to smelters in the United States.
Activity during the period of 1956 to 1990 consisted of operations by the Mineros Nortenos Cooperativa and operations by individual owners and operators of pre-existing mines. The Mineros Nortenos operated the San Salvador, Encantada, Fronteriza, Esmeralda, and Parrena mines, and shipped oxide zinc ore to Zinc National's smelter in Monterrey, while copper and silver ore were shipped to smelters in Mexico and the United States.
The principal mines operated by individuals and lessors were the Veta Rica, Deonea, Juarez, Volcan I and II, Once, San Antonio, San Jose, San Buena, Monterrey, Vasquez III, Tiro K, El Indio and Poder de Dios. The individual operators were mainly local residents, such as the Farias, Espinoza, and Valdez families.
In the early 1990's, Kennecott Copper Corporation ("Kennecott") had a joint venture agreement involving USMX's Sierra Mojada concessions. Kennecott terminated the joint venture in approximately 1995.
Metalline entered into a Joint Exploration and Development Agreement with USMX in July 1996 involving USMX's Sierra Mojada concessions. In 1998, Metalline purchased the Sierra Mojada and the USMX concessions and the Joint Exploration and Development Agreement was terminated. Metalline also purchased the Esmeralda, Esmeralda I, Unificacion Mineros Nortenos, Volcan, La Blanca and Fortuna concessions, and conducted exploration for copper and silver mineralization from 1997 through 1999. During this period, exploration consisted of reverse circulation ("RC") drilling which intersected significant zinc mineralization.
In October of 1999, Metalline entered into a joint venture with North Limited of Melbourne, Australia (now Rio Tinto). Exploration by North Limited consisted of underground channel samples in addition to surface RC and diamond drilling. North Limited withdrew from the joint venture in October 2000.
A joint venture agreement was made with Penoles in November 2001. The agreement allowed Penoles to acquire 60% of the project by completing a bankable Feasibility Study and making annual payments to Metalline.
During 2002, Penoles conducted an underground exploration program consisting of driving raises through the oxide Zinc Manto, diamond drilling, continuation of the percussion drilling, and channel sampling of the oxide zinc workings (stopes and drifts) previously started by Metalline in 1999 and continued by North in 2000 and Metalline during 2001.
The workings operated by the Nortenos Cooperativa in the Zinc Manto allow access to the entire Zinc Manto in the San Salvador, Encantada, and Fronteriza mine operations. The objective of Penoles's 2002 program, in addition to evaluating the Zinc Manto mineralization, was to compare the quality and consistency of sampling methods. Penoles developed diamond drill sites in the San Salvador and Encantada mines. It also developed raises through the vertical extent of the Zinc Manto. Bulk samples of raise muck and channel samples of the raise walls were collected at
Report Date: April 30, 2013
Effective Date: March 18, 2013
one meter intervals. Percussion and diamond drill holes were drilled parallel to the raises and also sampled at one meter intervals.
The Penoles 2003 program continued the underground channel sampling and included percussion and diamond drilling from the surface. In addition to drilling the manto along its extent in the three mines, Penoles conducted step out drilling to the east and west. Penoles drilled holes on fences spaced 200 m apart east of the Fronteriza mine toward the Oriental mine, a distance of nearly 2 km. The holes were spaced 50 to 100 m in a north-south direction along the fences. To the west Penoles followed up the North Limited drilling in the vicinity of the San Antonio mine, 2 km west, which confirmed and extended the mineralization.
In December 2003, the joint venture was terminated by mutual consent between Penoles and Metalline. Penoles had other projects it preferred to fund and Metalline was interested in reacquiring a 100% interest in the project. From 2003 to April 2010, Metalline continued sampling numerous underground workings through channel and grab samples as well as completing underground and surface drill holes exploring the zinc-silver mineralization.
Subsequent to the merger with Dome Ventures in April 2010 underground exploration of the Zinc Zone was terminated. Focus was switched to a surface diamond drill program exploring near surface low grade bulk tonnage silver-zinc mineralization or the same style of mineralization above and up-dip from the hemimorphite zinc mineralization. (SRK 2012)
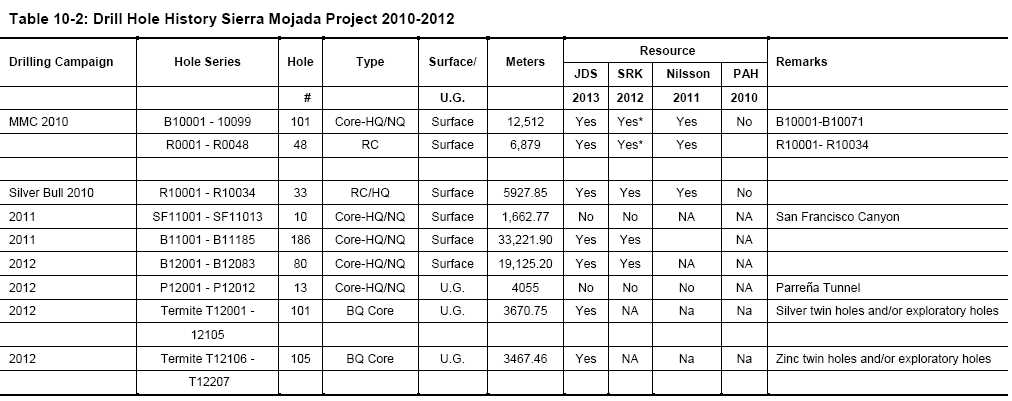
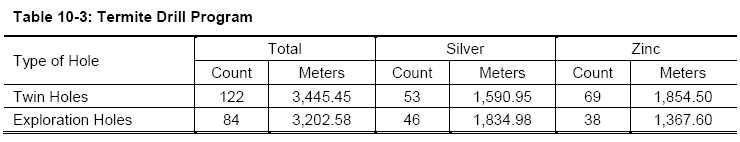
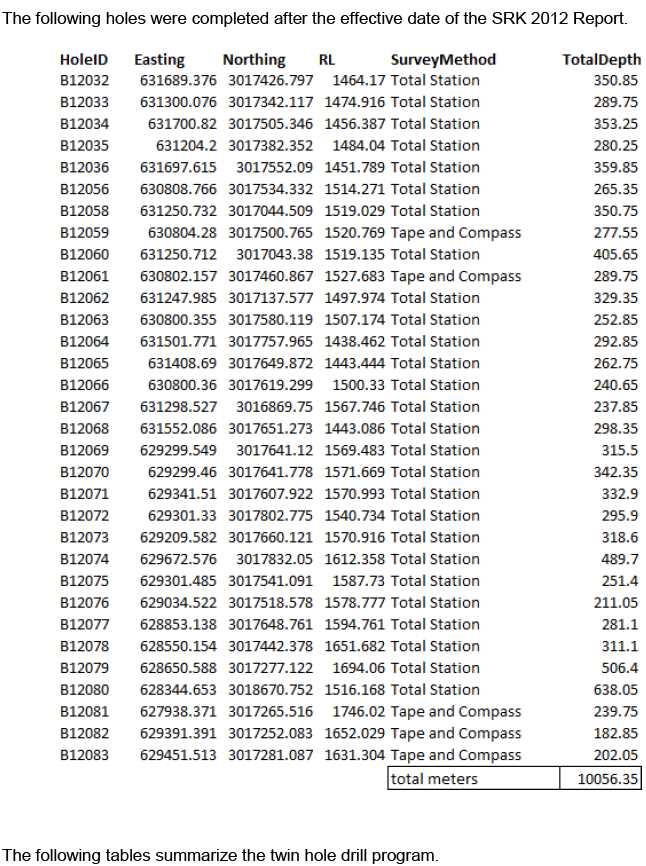
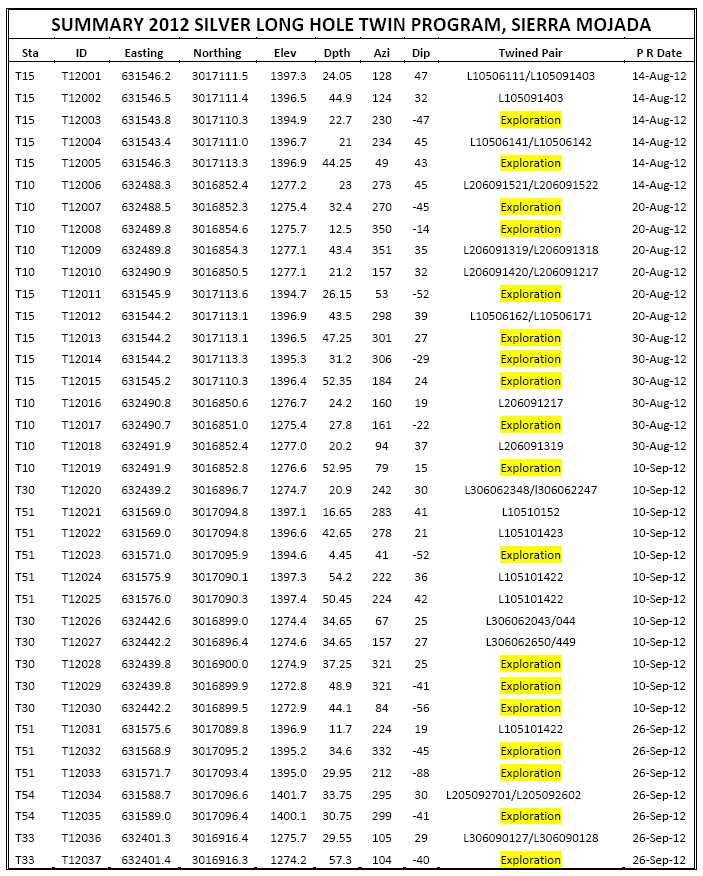
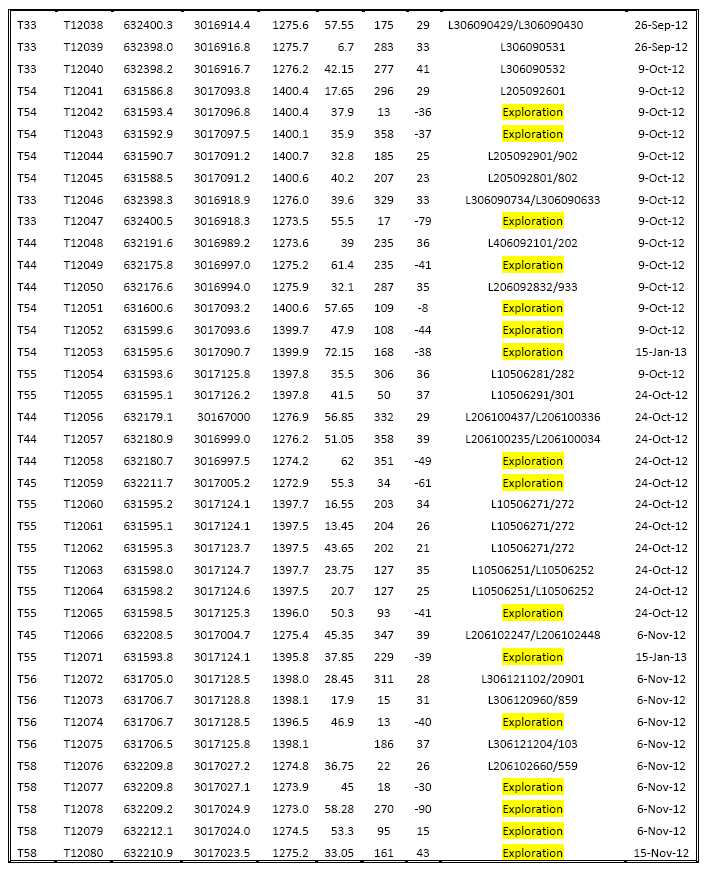
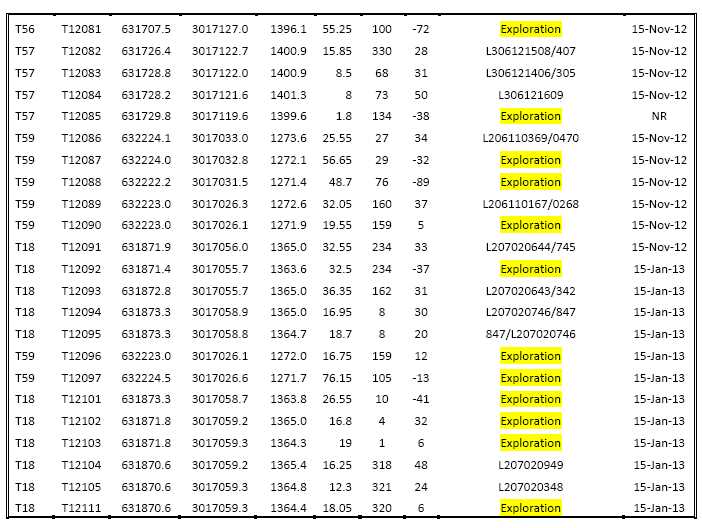
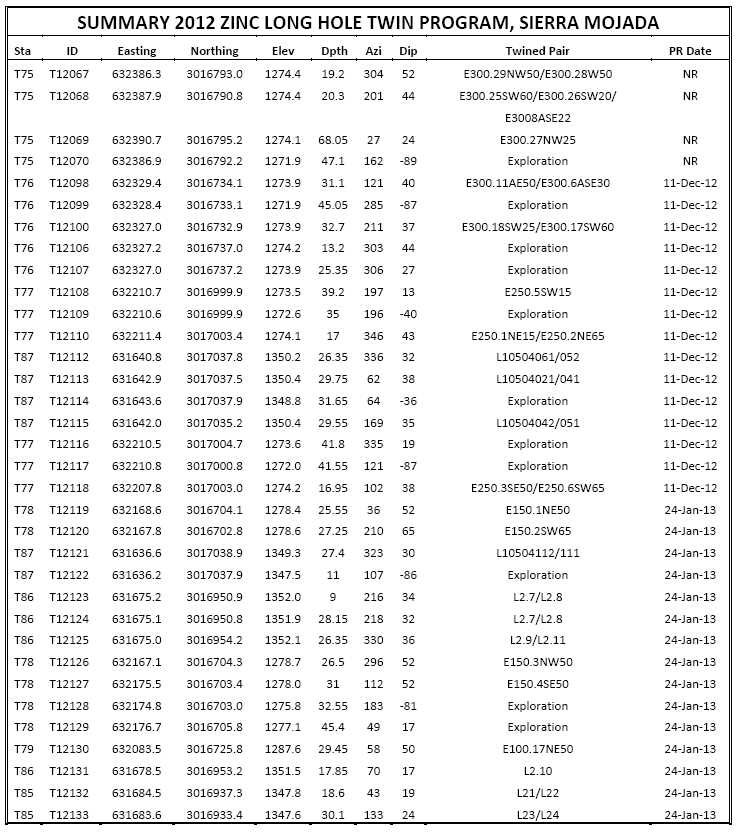
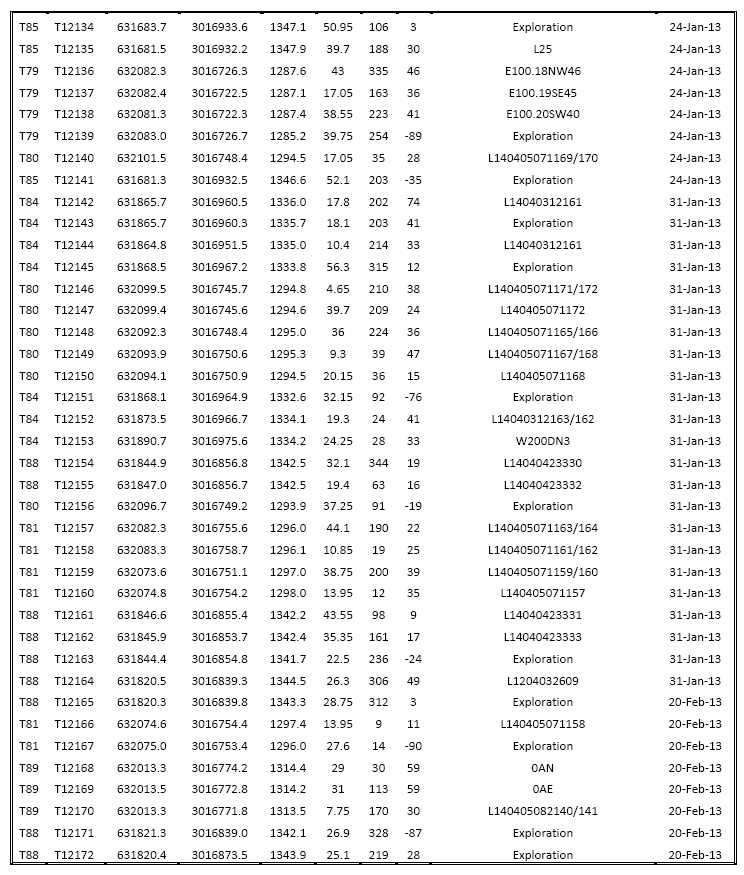
During the second half of 2012, assays from the remaining surface drill holes (B12-series) that had not made it into the last SRK technical report, were supplemented by a combined underground twin hole and exploration drill program in the silver, mixed Ag-Zn, and red zinc (hemimorphite) zones. Further u/g drill exploration of high grade silver areas to the west (Veta Rica) is planned for 2013.
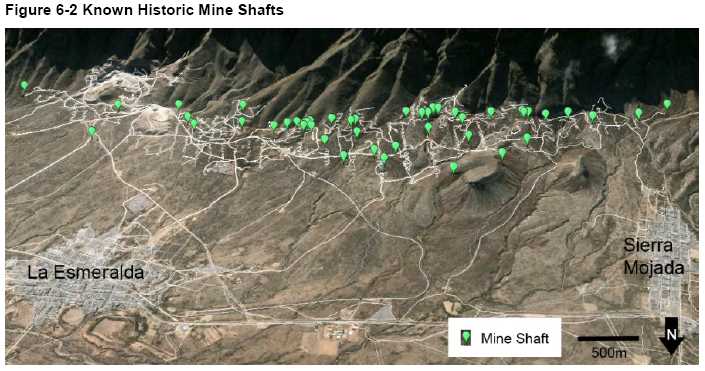
To date Silver Bull has estimated that over 150km of underground workings have been surveyed on the project. This represents approximately 4 million tonnes of development and 10 million short tons of silver, zinc, lead, and copper ores.
Estimates from 1931 put production along the mineralized trend, of which the Sierra Mojada property is a subset, at approximately 5 million short tons (all of the following will be short tons). That compares with Shaw, who in his 1922 AIME paper estimated that production to 1920 was 3 to 3.5 million tons of lead-silver ores; and 1.5 to 2 million tons of Ag and Cu-Ag ores. Based on fragmented records, anecdotal evidence and stope volumes, perhaps 900,000 tons of additional oxide zinc may have been mined from Red Zinc and White Zinc areas on the Sierra Mojada property. Significant production occurred between 1920 and 1950 from the district with the involvement of major international mining companies operating small daily tonnage mines during that period. (SRK 2012)
Most of the workings are accessed through vertical shafts although there are a few adits and open stopes also present. For safety reasons, shafts have been barricaded and locations
Report Date: April 30, 2013
Effective Date: March 18, 2013
surveyed. The head frames at San Salvador, Frontireza and Centenario have been maintained and are used regularly.
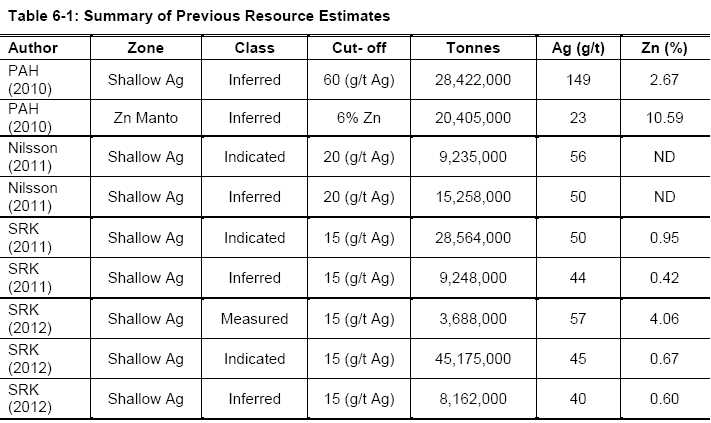
| 6.2 | Historical Resource Estimates |
While the area has hosted prolonged but small scale mining activity for over 100 years there is no existing reliable historical resource estimate for the various manto deposits.
Prior NI 43-101 compliant mineral resources have been prepared for the property; namely a mineral resource prepared by PAH in January 2010 covering the Shallow Silver Zone and the Zinc Manto Zone and a mineral resource estimate prepared by Simpson and Nilsson in April 2011 covering the Shallow Silver Zone only (Table 6-1). These estimates are documented in technical reports listed in the Reference section of this report and available on SEDAR. The estimates are reliable and relevant to the property. The Zinc Manto has been partially re-estimated by SRK, as such the PAH estimate for the Zinc Manto is no longer considered current and should not be relied upon. (SRK 2012)
From 1897 to about 1905, small quantities of lead ore were smelted on site, and remnants of the smelter are still visible near the core logging facility. At various times historically, zinc oxides ores were shipped to fertilizer plants in the U.S. and Mexico.
Report Date: April 30, 2013
Effective Date: March 18, 2013
Report Date: April 30, 2013
Effective Date: March 18, 2013
| 7.0 | Geological Setting and Mineralization |
The Chapters 7.1 through 7.3 have information modified from Stockhausen (2012), King (2012), Gryger (2010), Hodder (2010), Thorson (2010), and McKee (1990) with the original references cited within; as well as internal investigations conducted by Silver Bull Resources. Chapters 7.4 through 7.5 have information taken or modified from Stockhausen (2012), Megaw (1988, 1996, 2007), SRK (2012) and PAH (2010); as well as internal investigations conducted by Silver Bull Resources.
The Sierra Mojada Project is located in the Eastern Zone, one of the three principal geologic zones of Mexico defined by age, tectonics, and lithologies. The other two zones are the Western Zone and the Trans Mexican Volcanic belt. The Eastern Zone represents a passive plate margin relative to the Western Zone which documents a convergent plate margin, and is composed of three major lithostratigraphic terrains; the Coahuila, Maya, and Sierra Madre. The boundary between the Eastern and Western terrains is in Chihuahua just west of the Sierra Mojada project area. Within the Eastern Zone, the project is located in the Coahuila terrain.
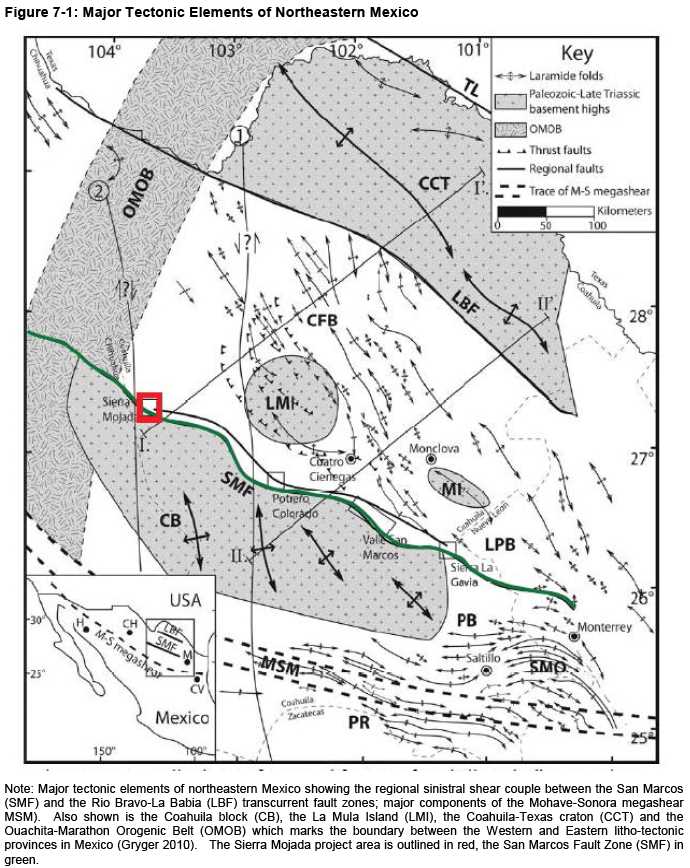
Basement rocks in the portion of the Coahuila terrain containing the Sierra Mojada district are Late Paleozoic in age. The Coahuila basement block is composed of moderately metamorphosed flysch and unmetamorphosed andesitic volcanic rocks, cut by granite and granodiorite intrusive rocks of Permian to Triassic age The Coahuila block is bounded to the northeast by the San Marcos fault system and to the south by the Torreon-Monterrey lineament, parallel to the Sonora-Mojave megashear (Figure 7-1).
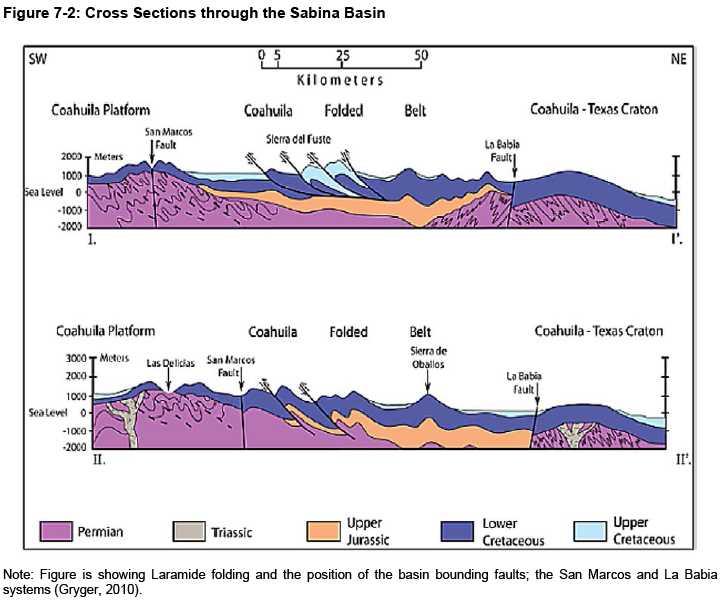
The basement rocks of the Coahuila block were cut by Permian to Triassic aged granitic and granodioritic intrusions. These intrusive units represent the roots of an island arc system produced south of the Ouachita-Marathon orogenic belt. Permian-Triassic intrusive rocks of similar composition to those found within the Coahuila block occur within the Sabinas basin along the La Mula and Monclava uplifts. The intrusive units likely acted as basement high within the basin during the Jurassic and Cretaceous. The Coahuila block was the source of siliciclastic detritus deposited along the Jurassic and Early Cretaceous in the Sabinas Basin following regional deformation along the San Marcos fault system (Figure 7-2).
The Sabinas basin formed during the Jurassic opening of the Gulf of Mexico and contains over 6,000 m of Jurassic to Cretaceous continental redbeds, evaporites, and carbonate rocks. The basin formed between the Coahuila block to the south and the Coahuila-Texas craton to the northeast. A post-rifting marine transgression resulted in deposition of extensive Middle Jurassic to Late Cretaceous carbonate rocks throughout the region. Although the orientations of sedimentary basins in northeastern Mexico were structurally controlled, basin-bounding structures were likely inactive during the time of carbonate deposition.
Report Date: April 30, 2013
Effective Date: March 18, 2013
The Sabinas Basin is prolific in its production and potential of hydrocarbon, primarily natural gas, coal, and coal-bed methane. It is also the source of metal-bearing brines linked to lead-zinc, copper- silver, barite, strontium, and fluorine mineralization in SEDEX related mineral deposits; in skarn related mineral deposits and Laramide age intrusive rocks; and in CRD type replacement deposits. The potential for sulfur and potash remains speculative.
The Coahuila region contains three major northwest-trending structures as presented in Figure 7-1 and 7-2:
| ● | Mojave-Sonora megashear |
| ● | Torreon-Monterrey lineament |
| ● | San Marcos-Rio Bravo (Babia) shear couple |
The Mojave-Sonora megashear was proposed by Silver and Anderson (1974) to explain an 800 km sinistral offset between basement rocks in northern Mexico and southern California. This shear zone is interpreted to have formed from a series of intracontinental transform faults that were active during the Late Triassic to Middle Jurassic.
The Torreon-Monterrey lineament is a west-northwest-trending structure that forms the southern boundary of the Coahuila basement block and is the southeastern extension of the Mojave-Sonora megashear. It displays regional scale left-lateral displacement of up to 400 km Movement along the Torreon-Monterrey lineament appears to have occurred primarily between the Middle Triassic and Late Jurassic.
The north-northwest striking San Marcos-Rio Bravo sinistral shear couple was active during the Jurassic, Early Cretaceous, and Tertiary and has a surface trace length of at least 1000km according to Flotte, et al 2008. This shear couple is responsible for a distinct system of conjugate normal faults in the region which strike north-south to north 70 degrees east.
The San Marcos fault component of this system exhibits a minimum of four recorded movements and begins with an early normal movement with later left-lateral strike-slip reverse movements beginning in the early Tertiary. Initial movement along the San Marcos fault has been attributed to deformation along the Torreon-Monterrey lineament and the Mojave-Sonora megashear together with subsequent isostatic adjustment due to crustal thickening during the Jurassic. The thrust component of the San Marcos fault is locally referred to as the Sierra Mojada thrust and the corresponding thrust movement on the Rio Bravo fault to the north is referred to as the Babia thrust zone. The San Marcos fault is northeast dipping and is believed to cut the entire crust while documented off sets are about 100m in the Sierra Mojada district, but variable region wide.
Movement along the San Marcos fault system resulted in the deposition of Cretaceous age continental redbed and carbonate units north of the fault. The redbed units include the San Marcos Formation and the Upper Conglomerate units. The carbonate units include the La Pena and Aurora
Report Date: April 30, 2013
Effective Date: March 18, 2013
Formation, all in the Sierra Mojada district. Reactivation of the San Marcos fault occurred during the Early Pliocene and resulted in a series of secondary faults with east-west to north-south orientations in western Coahuila and southeastern Chihuahua.
The deep seated San Marcos fault zone has also been the structural guide to Laramide - Pleistocene age igneous activity along its length including the Carmago volcanic field 100 km to the northwest of the Sierra Mojada district, the Quatro Cienegas thermal area 150 km to the southeast of the Sierra Mojada, as well as the igneous intrusions believed to be the source of the mineralization in the Sierra Mojada district.
The Seveir-Laramide orogeny marks a period of major mountain building along a northwest trending front throughout the North American continent. The timing of the Laramide orogeny varies across North America, but it is broadly attributed to the late Cretaceous to early Paleocene. In northeastern Mexico, the Laramide orogeny resulted in the reactivations of Early Mesozoic rift-related basement faults. Cretaceous strata situated on the Coahuila block experienced low intensity deformation forming a broad, southeast-plunging anticlinal dome. Laramide deformation also formed the Sierra Madre Oriental fold and thrust belt to the south of the Coahuila block and the Coahuila fold belt to the north of the Coahuila block in the Sabinas Basin
Report Date: April 30, 2013
Effective Date: March 18, 2013
Report Date: April 30, 2013
Effective Date: March 18, 2013
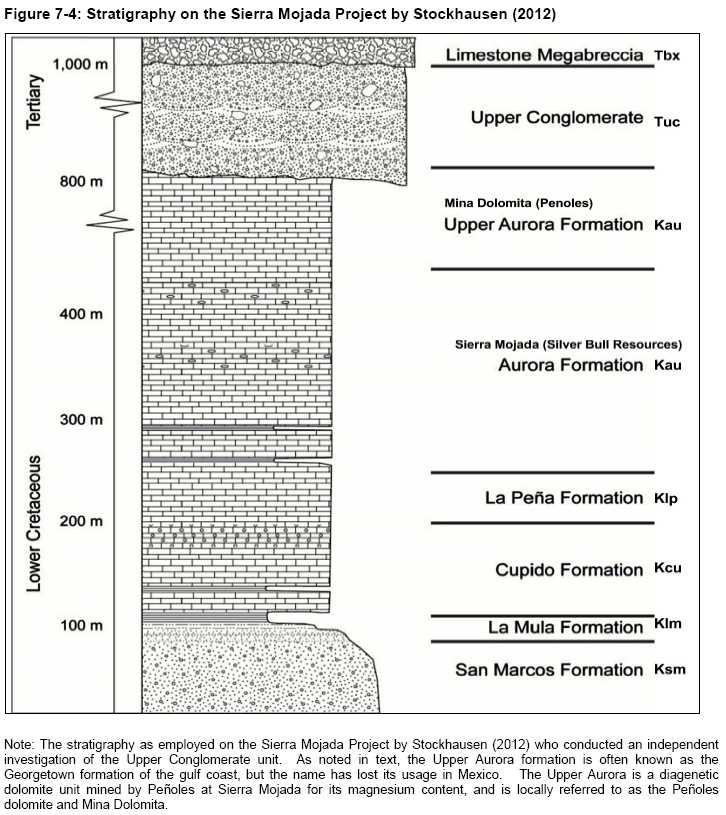
| 7.2.1 | Sierra Mojada Stratigraphy |
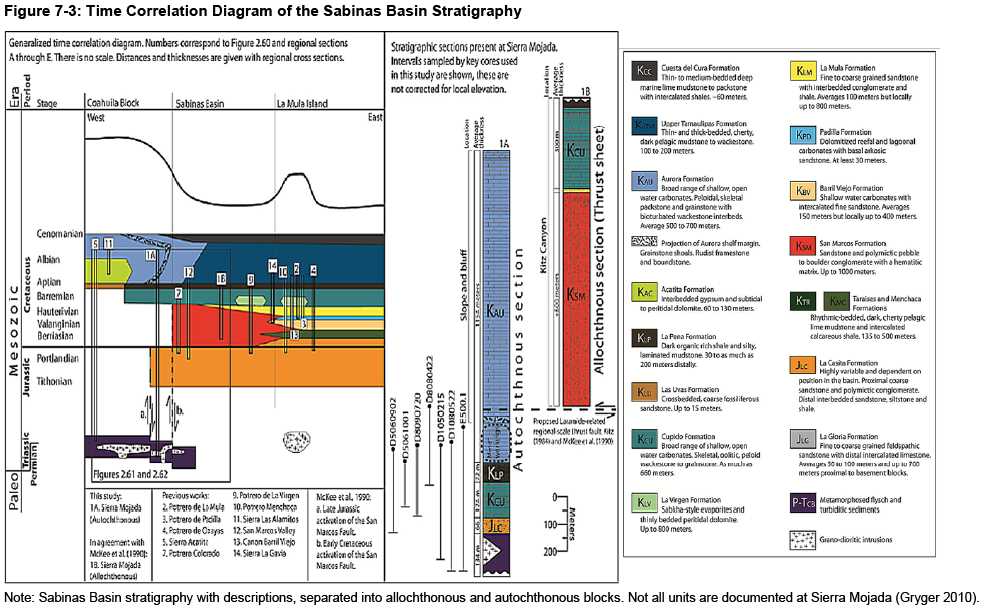
The rocks at Sierra Mojada record an Early Cretaceous transgression beginning with subaerial redbeds and near shore beach sandstones followed by carbonate rocks deposited in shoal, lagoonal, shelf, and platform environments. At Sierra Mojada, Lower Cretaceous rocks are overlain by younger redbed and breccia units as shown by Gryger in Figure 7-3, which separates the regional stratigraphy into the allochthonous and autochthonous blocks.
Stockhausen (2012) refines the local stratigraphy as employed on the Sierra Mojada Project in Figure 7-4 and renames a distinct and local portion of what was historically called the Cretaceous San Marcos formation, as the Tertiary Upper Conglomerate.
Report Date: April 30, 2013
Effective Date: March 18, 2013
7.2.2 | Allochthonous Stratigraphy |
The San Marcos Formation has been described throughout Coahuila and has been the focus of several investigations in the Sierra Mojada district as noted by Stockhausen (2012). Regionally within the Coahuila terrain, the San Marcos Formation is up to 1,000m thick with the thickest sections present north of the San Marcos fault which indicates that this fault was active during deposition of the unit. In the Sierra Mojada district, the San Marcos Formation has a thickness of approximately 70m in drill core. The unit consists of Lower Cretaceous alluvial strata composed of conglomerates containing andesitic volcanic pebbles within a siliceous matrix and several meter thick siltstone units (Figure 7-4).
The La Mula Formation occurs throughout northeastern Mexico and forms an unconformable surface above the San Marcos Formation. The La Mula is believed to represent a change from an alluvial depositional environment to a near shore beach environment. In the Sierra Mojada district the La Mula Formation is known as the Sierra Mojada Sandstone (Figure 7-4). It crops out within an overturned sequence south of the town of Sierra Mojada and consists of fine- to medium-grained, subrounded to rounded, well sorted quartz sandstone up to 25m in thickness. The siliciclastic rocks of the La Mula and San Marcos Formations have been historically targeted for sediment-hosted stratiform copper deposits by several companies.
The Cupido Formation is the lowest stratigraphic carbonate unit of Mesozoic age throughout much of northeastern Mexico. In the Sierra Mojada district the contact between the La Mula Formation and the overlying Cupido Formation is gradational and is approximately 90m thick. The basal portion of the unit contains medium grey colored skeletal grainstone and wackestone with local mudstones that display a moderate degree of bioturbation. These strata are thought to have been deposited in restricted lagoonal and peritidal environments. The upper portion of the Cupido Formation at Sierra Mojada contains brown-grey packstones and grainstones with some oolitic lenses suggestive of deposition in a high energy shoal depositional environment.
Report Date: April 30, 2013
Effective Date: March 18, 2013
Report Date: April 30, 2013
Effective Date: March 18, 2013
Report Date: April 30, 2013
Effective Date: March 18, 2013
| 7.2.2.4 | Upper Conglomerate |
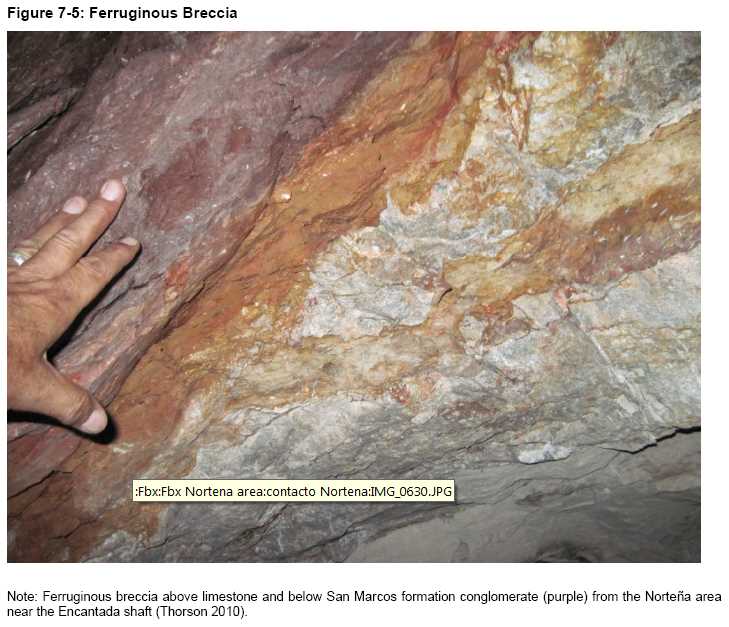
The Tertiary age Upper Conglomerate unit is arguably the most controversial lithology in the district (Figure 7-4). Various companies and authors have referred to the unit as the Menchaca formation, Upper San Marcos formation, ferrunginous breccia, limonite breccia, residual breccia, Ralph and "X". On the project, the Upper Conglomerate is defined and logged separately from the generic ferruginous breccia (Fbx) which is described as an alteration facies under section 7.4. The unit is significant in that it is a major host rock to high grade silver-copper mineralization in the Sierra Mojada district, Figure 7-5.
Stockhausen (2012) and Thorson (2010) refer to the Upper Conglomerate as an unconformable surface and interpret the unit to be a local scale, surface karst feature. Observations underground though, show a consistent association with low angle faulting. An alternative interpretation is that the unit is a karst surface-fault breccia related to the low-angle movement of the Sierra Mojada thrust (see section 7.3), with thicker sections represented by low-angle dilatational tension zones.
| 7.2.2.5 | Limestone Megabreccia |
The Limestone Megabreccia is the youngest stratigraphic unit observed at Sierra Mojada (Figure 74). The unit is a clast-supported breccia composed of variably weathered, angular to subrounded, pebble to boulder sized clasts of Aurora Formation and Upper Aurora Formation limestone in a matrix of calcite with lesser quartz. The Limestone Megabreccia differs from the Cretaceous carbonate units in displaying highly variable orientations of the limestone clasts and abundant joints, but does not appear to be cut by faults. Unlike Quaternary alluvium in the district, the Limestone Megabreccia contains only limestone blocks, lacks well-rounded clasts, contains minor to no shale to silt matrix material, and has a much higher resistance to weathering. It is separated from the Upper Conglomerate by a detachment or low angle fault.
| 7.2.3 | Autochthonous Stratigraphy |
| 7.2.3.1 | Coahuila Basement Complex |
Within the Coahuila basement complex at Sierra Mojada, the project lies at the juxtaposition of three important litho-tectonic elements; the Permian-Triassic Coahuila basement block, the Cretaceous Sabinas Basin, and the San Marcos-Rio Bravo Triassic-Tertiary transcurrent fault zone and associated conjugate structures. The Rio Bravo fault zone is also known as the La Babia fault zone.
The La Casita formation is not known in the Sierra Mojada district, but is well- known in the regional stratigraphy.
Report Date: April 30, 2013
Effective Date: March 18, 2013
The Cupido formation in the autochthonous block is the same lagoonal-peritidal facies as in the allochthonous block.
The La Pena Formation overlies the Cupido Formation throughout northern Mexico. In the Sierra Mojada district the formation consists of a series of coarsening-upward cyclical limestone units. The base of each cycle is typically a dark grey to black colored carbonaceous mudstone. Tops of individual cycles generally are brownish grey packstone or wackstone with coarser-grained strata and often contain large fossils. The upper portion of the La Pena Formation is less fossiliferous and consists of thick beds of light grey packstone and wackestone. The total thickness of the La Pena
Report Date: April 30, 2013
Effective Date: March 18, 2013
Formation at Sierra Mojada is approximately 60m. The cyclical nature and relative abundance of argillaceous material in the La Pena Formation carbonate rocks at Sierra Mojada suggest that they were deposited in a lagoonal environment.
The overlying Aurora Formation is the principal host rock for the sulfide and oxide mineral deposits at Sierra Mojada (Figure 7-4). The Aurora Formation crops out along the cliffs at the southern boundary of the Sierra Mojada valley. Structural deformation of the Aurora Formation at Sierra Mojada has made it difficult to determine the total thickness of the unit and it is thermally metamorphosed in thin section throughout the district. However geological mapping and drill sections suggest it has a thickness of approximately 500m. The basal portion of the Aurora Formation contains mostly grey to brown micritic mudstone and wackestone with some fine-grained fossil debris. The basal portion of the formation grades upwards to distinctly more fossiliferous, medium grey wackestone and grainstone with discontinuous intervals containing lobate chert nodules and minor mudstone. The Aurora Formation sequence is typical of open marine platform to shallow slope environments.
The Aurora Formation at Sierra Mojada is overlain by the Upper Aurora Formation. This unit contains fossiliferous grainstone and wackestone similar to much of the limestone in the Aurora Formation. The unit has previously been termed the Georgetown Formation in some reports (Hodder, 2001, internal report.). However, the Georgetown Formation is the stratigraphic equivalent to the Upper Aurora Formation along the Texas Gulf coast and this nomenclature is general not utilized in northeastern Mexico The Upper Aurora is regionally a diagenetic dolomite and is locally referred to as the Penoles Dolomite due to the local open pit magnesia mine operated by Penoles known as Mina Dolomita. There is no metallic mineralization know to be associated with this unit besides the magnesium.
| 7.3 | Sierra Mojada Structure |
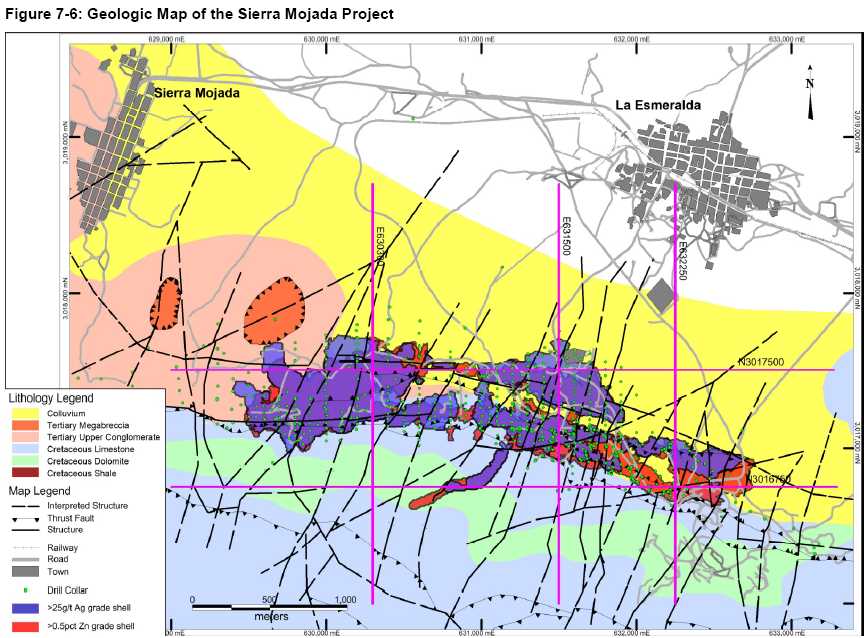
The Sierra Mojada district is dominated by three sets of structures, each with a unique influence on the geology and mineralization of the project. These structures are related to the San Marcos-La Babia shear couple regionally and later basin-and-range extension (Figure 7-6) and locally present a structurally "dense" architecture which has had a profound influence in the amount and styles of mineralization present.
The San Marcos fault zone is the oldest fault present in the district. The San Marcos, regionally, records at least four separate movements from the Jurassic to the early Tertiary. From Jurassic through early Cretaceous time, the San Marcos recorded three separate periods of normal movement, down-dip and stepping basin-ward towards the north. In the Sierra Mojada district, the San Marcos faults strike N78 West and dips at 65 degrees to the North. The northern most, and most recent step records a 100m down-drop.
Report Date: April 30, 2013
Effective Date: March 18, 2013
During the Laramide Orogeny the San Marcos reactivated as a reverse fault, with left lateral-oblique slip movement from the northeast. Locally, this reverse movement is referred to as the Sierra Mojada thrust fault, due to the prominent exposures underground. Some observers have suggested that the low-angle structures represent a detachment surface. In the Sierra Mojada district, the reverse movement surface varies from 0 to 60 degrees to the north and "roles" in several locations, along with back thrusts dipping to the south. Offsets are from 6 to 45 meters. The early normal faults related to the San Marcos system are thus over-ridden by the later reverse movements. This period of reverse movement was noted on the La Babia fault zone on the north side of the Sabinas Basin.
Cutting the San Marcos structures are a series of northeast trending structures exemplified by the Callavasas, Parrena, and Veta Rica faults, which are believed to be conjugate structures related to the San Marcos-La Babia shear couple. Throughout northern Mexico, northeast structures are associated with mineralization from depth and at Sierra Mojada these northeast structures are believed to be the original sources of hydrothermal mineralization in the district. The northeast structures a typically normal and high angle, dipping 90 to 65 degrees and down-dropped to the southeast. Off sets are not well documented due to later structural off sets and mineralization.
The youngest structures in the district are normal high angle structures varying from 0 to 20 degrees strike, 90 to 55 degrees dip and are down-dropped to the east and west, forming a series of horst and graben structures across the district. These structures a believed to be related to basin-and- range movements and typically show offsets of 5 to 25 meters. The North-South structures are important at Sierra Mojada as they are a major inheritor of remobilized supergene and oxide mineralization and many of the historic workings trace these structures.
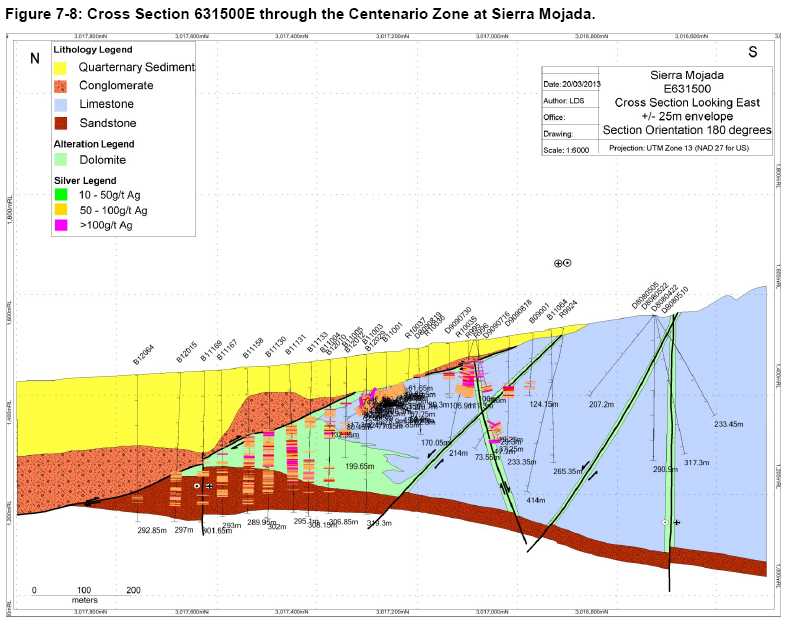
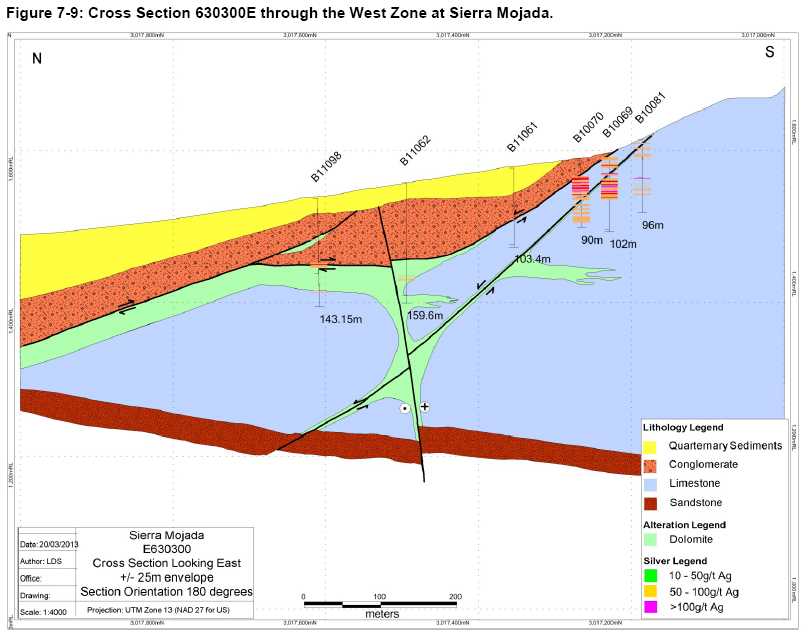
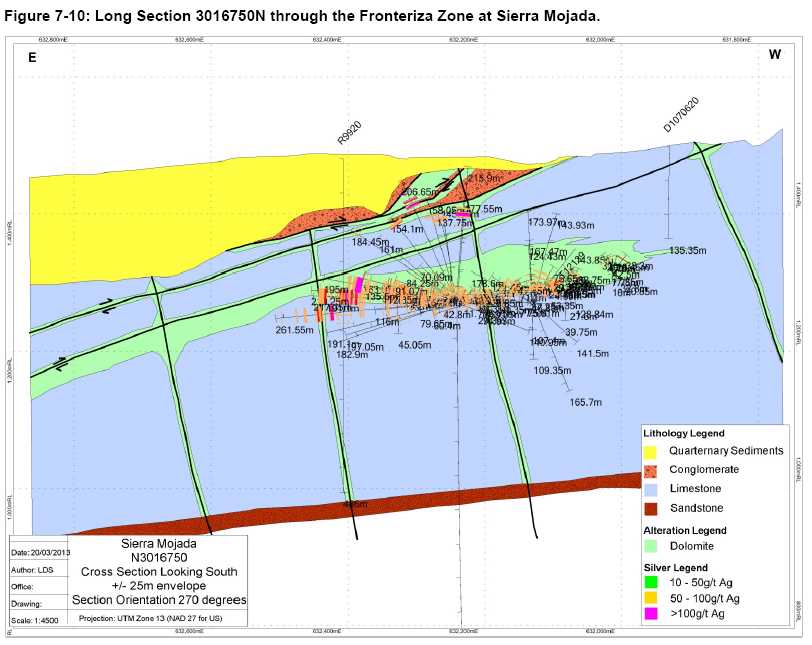
Figures 7-6 through 7-11 include a new and revised geologic map of the district with representative cross sections and long section through each of the three main portions of the mineralization.
Report Date: April 30, 2013
Effective Date: March 18, 2013
Report Date: April 30, 2013
Effective Date: March 18, 2013
Report Date: April 30, 2013
Effective Date: March 18, 2013
Report Date: April 30, 2013
Effective Date: March 18, 2013
Report Date: April 30, 2013
Effective Date: March 18, 2013
Report Date: April 30, 2013
Effective Date: March 18, 2013
Report Date: April 30, 2013
Effective Date: March 18, 2013
| 7.4 | Hydrothermal and Supergene Alteration |
Diagenetic dolomite is well documented in the petroleum literature of northeastern Mexico, particularly in the Cretaceous section, and is of interest to petroleum and metals resource explorers due to the fact that the dolomitization process can increase the porosity of the unit by 15-20%. Against this backdrop, mineralization at Sierra Mojada is directly associated with extensive, hydrothermal dolomitization and moderate to strong silicification, both of which occurred prior to and during primary hypogene sulfide mineralization. The hydrothermal alteration observed at Sierra Mojada is typical of many high-temperature, carbonate-hosted Ag-Pb-Zn-(Cu) deposits in northern Mexico (Megaw et al., 1988). Stockhausen (2012) documents distinct zones of intense sericite alteration associated with sulfide mineralization. This has been interpreted to represent the distal expression of felsite intrusive activity.
To the east of the Sierra Mojada district the carbonate section has been pervasively dolomitized, apparently along northeast-trending faults. This area is the site of the active Penoles dolomite quarry. The Aurora Formation is also pervasively dolomitized in the western portion of the district, in the area of overturned section near the Sierra Mojada village. Diagenetic dolomitization represents the introduction of brines from adjacent evaporite-rich basins and is not known to carry base or precious metal mineralization but is believed to be part of the host rock preparation stage for later metals mineralization.
Irregular pods of completely hydrothermally altered dolomitized limestone surrounded by zones of partially diaigenetic dolomitized limestone occur in outcrop throughout the Sierra Mojada district. These dolomitized zones may be up to tens of meters thick and occur both along northeast- trending faults and along the upper contact of the carbonate section with overlying Upper Conglomerate. The Sierra Mojada sulfide bodies occur primarily but not exclusively within dolomitized horizons. Hydrothermal dolomite represents the influx of higher temperature hydrothermal fluids prior to and during hypogene sulfide mineralization. At Sierra Mojada, hydrothermal dolomitization is expressed by a distinct tan to pink colored, fracture controlled alteration throughout the district.
Two phases of silicification are noted at Sierra Mojada, an early pre- sulfide mineral phase, and a late syn- to post sulfide mineral phase. The early phase affects carbonate rocks throughout the Sierra Mojada district, especially those within or adjacent to fault zones, and display varying degrees of silicification and jasparoid development. Limestone clasts in tectonic, dolomite, and karst breccias are frequently pervasively replaced by very fine-grained, light grey to dark blue, anhedral quartz, something noted in all petrographic work conducted on the project.
Report Date: April 30, 2013
Effective Date: March 18, 2013
Early fine-grained silicified limestone is locally cut by later medium- to coarse-grained, subhedral quartz veins that occur along faults and at the contact with the Upper Conglomerate. This coarsegrained quartz is commonly associated with lead, zinc, silver, copper, and iron sulfide and oxide minerals and is spatially associated with zones containing iron- and magnesium-rich replacive carbonate minerals and sulfides or their oxidized products. Typically there is a decrease in silica content moving outward from the structures, something noted in the district dating back to 1901 (Chisholm 1901)
Silicification is not common within high-temperature, carbonate-hosted Ag-Pb-Zn-(Cu) deposits in northern Mexico and is only noted at the Charcas, Santa Eulalia, La Encantada, and Sierra Mojada deposits (Megaw et al., 1988).
Sericite is commonly present in the ferruginous breccia and within the Upper Conglomerate. Areas containing abundant sericite occur above northeast-trending faults near the historic Veta Rica workings and in the deeper working below the San Salvador and Fronteriza shaft areas. The formation of sericitized zones well-up into the Upper Conglomerate indicates that this alteration clearly post-dates the major period of sulfide mineralization at Sierra Mojada. Sericitization of the Upper Conglomerate and ferruginous breccia may represent continued movement of hydrothermal fluids, or a second phase of hydrothermal alteration, along and above major structural pathways.
Sericitization is relatively uncommon in the Mexican high-temperature, carbonate-hosted Ag-Pb- Zn-(Cu) deposits. One of the few deposits with significant sericitization is Santa Eulalia where igneous rocks along mineralized faults are altered to massive sericite with arsenopyrite (Megaw, pers. comm.).
Two phases of carbonate alteration are noted at Sierra Mojada, and early pre-and syn-mineral phase and a late phase associated with ongoing supergene processes. The hydrothermal dolomite found throughout the district is cut by a later assemblage of ferroan to magnesian-rich replacement carbonate minerals, which occur along northeast-trending faults and at the upper contact of the carbonate section. This assemblage of ankerite, siderite, and magnesite locally cuts and replaces diagenetic dolomite and previously undolomitized limestone.
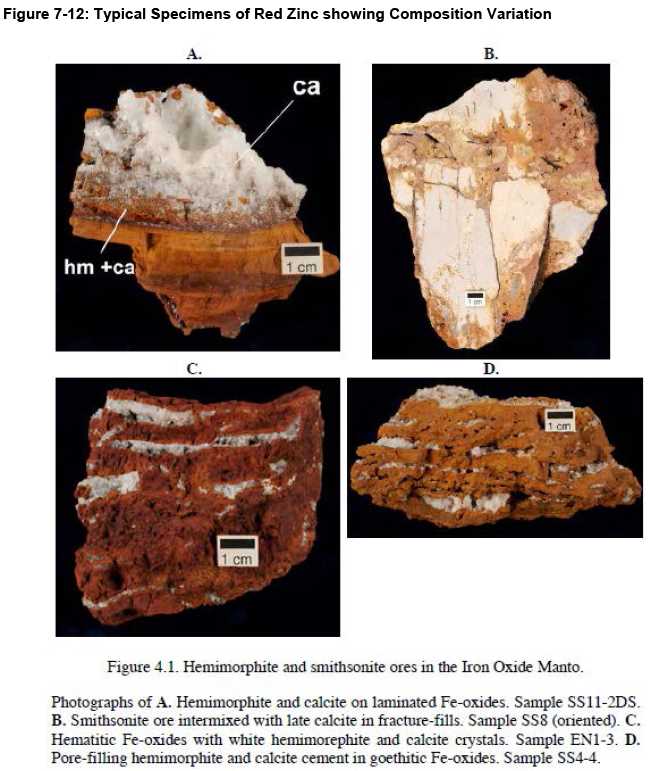
The carbonate minerals are fine-grained and are relatively similar in grain size to earlier diagenetic dolomite. They display pink to red colors at surface but have a pale grey color where unoxidized. These carbonate minerals also may be enriched in lead and strontium and commonly display abundant very fine-grained dendritic manganese oxide minerals. The iron- and magnesium-rich carbonate minerals are intergrown with iron and base metal sulfides and barite indicating they were precipitated during the initial mineralization event (Renaud and Pietrzak, 2010,). The red and pink carbonate minerals are commonly intergrown with iron- and zinc-oxide minerals.
Report Date: April 30, 2013
Effective Date: March 18, 2013
Late calcite veinlets occur throughout the Sierra Mojada district, but are most prevalent along the Sierra Mojada fault zone. The calcite veinlets are typically 1-20cm wide and cut carbonate rocks, the ferruginous breccia, and the Upper Conglomerate. The calcite in these veinlets is fine-grained, anhedral, and commonly intergrown with zinc-, lead-, and iron oxide minerals and acanthite; it may contain inclusions of barite (Renaud and Pietrzak, 2011). Coarse-grained calcite with normal to zincian compositions also locally replaces limestone, silicified limestone, dolomite, and iron- and magnesium-rich replacive carbonate rocks, as well as the matrix of the ferruginous breccia adjacent to zones containing late calcite veinlets. Calcite veinlets crosscut sericitized Upper Conglomerate rocks indicating that this alteration event occurred after sericitization. These calcite veinlets and replacive calcite zones were just recently formed and are interpreted to be ongoing supergene processes.
Argillic alteration zones are found throughout the Sierra Mojada district at the contact between Cretaceous carbonate rocks and the Upper Conglomerate. These light grey and tan to tan-brown zones are clay-rich. Based on x-ray diffraction (XRD) analyses these zones are composed of kaolinite, illite, and halloysite in addition to fine-grained quartz, limonite, hematite, and calcite. Tan- brown intervals contain more abundant clay relative to the light grey colored, fine-grained quartz- rich material. The ferruginous breccia contains varying abundances of interstitial kaolinite and illite with minor halloysite surrounding quartz and carbonate rock clasts, however the timing of formation of the ferruginous breccia and clay is unclear (Renaud and Pietrzak, 2010).
The Ferruginous Breccia is treated here as a distinct alteration facies even though in core logging it is treated as a separate lithology, due to its direct association with mineralization. The unit may actually be comprised of a mixture of Upper Conglomerate, Aurora Formation dolomite and limestone, karst breccia, and limonite breccia. Clasts of medium- to coarse-grained, sub-rounded limonite after sulfide contain elevated concentrations of silver and zinc. Clast shape suggests that they are detrital rather than representing in-situ sulfide precipitation. The presence of both sulfide- rich and oxide-rich clasts indicates that the ferruginous breccia formed after both the hydrothermal event responsible for sulfide precipitation and supergene weathering of portions of the sulfide replacement bodies.
The base of the ferruginous breccia is commonly highly irregular. Ferruginous breccia also fills fractures extending downward approximately 7m into the carbonate sequence. These fractures may contain large, angular, cobble-sized limestone and replacive carbonate mineral clasts. Additionally, the ferruginous breccia contains silicified carbonate clasts indicating that this finegrained silicification event took place prior to karstification. The ferruginous breccia also occurs beneath fine-grained travertine in karst cavities within the limestone sequence. Thus, the ferruginous breccia appears to represent both a surficial deposit formed by chemical and mechanical weathering of carbonate rocks and karst-fill material (Thorson, 2010).
Report Date: April 30, 2013
Effective Date: March 18, 2013
The ferruginous breccia is commonly overlain by the Upper Conglomerate. In some areas lenses of ferruginous breccia are interlayered with lenses of Upper Conglomerate suggesting these units formed synchronously. The ferruginous breccia has not been identified outside of the Sierra Mojada district.
The ferruginous breccia at Sierra Mojada is interpreted to represent surficial oxidation of exposed sulfide replacement bodies in the carbonate sequence as well as infill of karst cavities formed by both normal weathering and acid generated during sulfide oxidation.
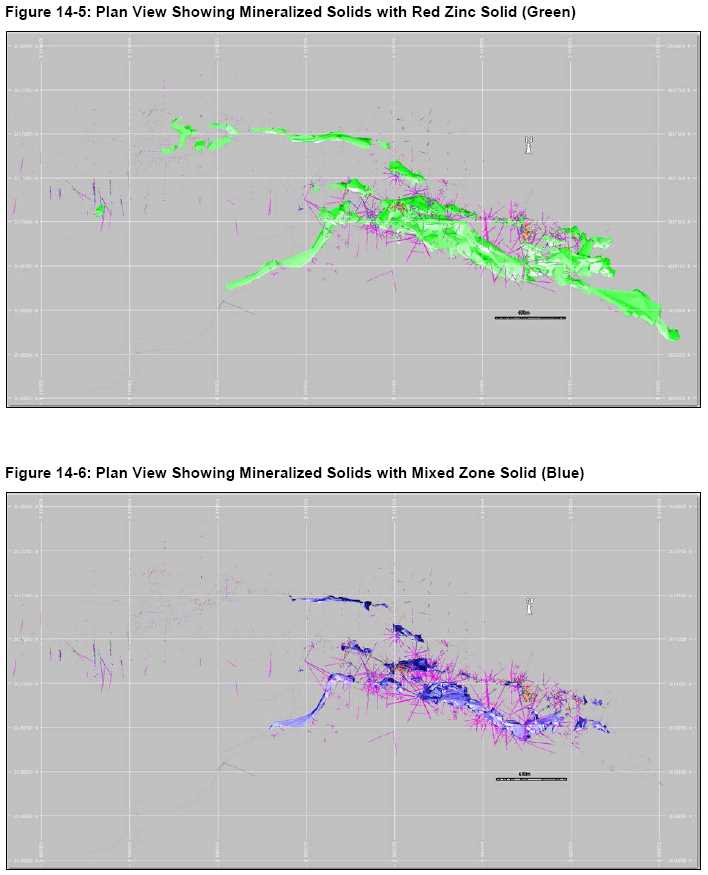
Sierra Mojada consists of two important and diverse mineralizing models, accentuated by a locally dense structural architecture and are detailed in Chapter 8.0, Deposit Type:
| ● | Development of a major Carbonate Replacement Deposit (CRD) of lead-zinc-silver (copper), distal to the source intrusion. |
| ● | The oxidation, supergene enrichment, and second oxidation of the original sulfide deposit leading to the mineralization of current interest and resource development. |
There are essentially two overlapping mineralized sections to the Sierra Mojada district:
| ● | The Shallow Silver Zone (SSZ), also known as the Polymetallic manto of historic reference. |
| ● | The Base Metal Mantos (BMM). The BMM is subdivided into three further zones for descriptive purpose; the Pb Manto (Carbonate Manto of historic reference), the Red Zinc Manto (Iron Oxide Manto of historic reference), and the White Zinc Manto. |
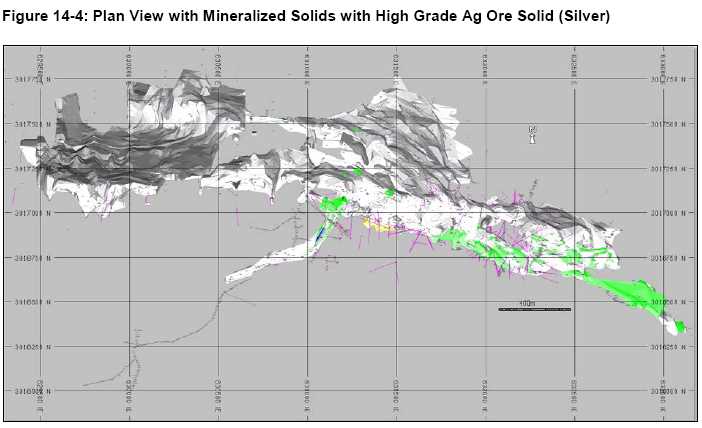
The Shallow Silver Zone (SSZ), outcrops on the surface on the west end of the district and dips under colluvial cover towards the east at about 10-degrees. The zone is 3.3km in length, up to 1km in width, and 100 to 300m thick. The SSZ is hosted in breccias of the Tertiary Upper Conglomerate unit, the ferruginous breccia, and in reactive dolomite and limestone of the Cretaceous Aurora Formation. Significantly, mineralization is also controlled by the dense array of structures in the district. Due to these structural and lithologic controls, mineralization develops into four configurations:
| ● | Stratiform mantos, primarily in reactive dolomite horizons and associated karst breccia features. |
| ● | High-grade (>100g/t) veins, primarily faults and chimneys related to the mixed structural architecture of low angle and high angle faults. |
| ● | Unconformity controlled breccia mineralization related to the Cretaceous-Tertiary weathering surface, although the unconformity demonstrates low-angle movement in many localities. |
| ● | Disseminated replacement mineralization between the mantos and structures. |
Report Date: April 30, 2013
Effective Date: March 18, 2013
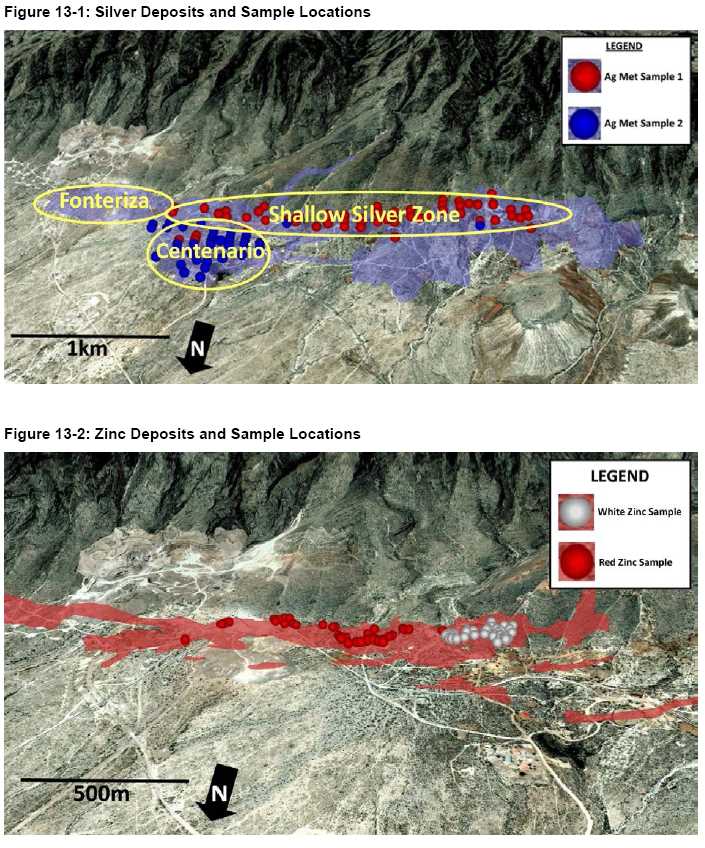
Silver mineralization is dominated by acanthite, the silver halide solid solution bromargyite - clorargyrite, and argentiferous tennantite. Silver mineralization shows a close affinity to the gangue minerals of barite, and celestine. As noted by Wyss (2013) the bromargyrite grains are consistently larger than the acanthite grains varying according to location in the three mineralized silver zones of Fronteriza, Centenario, and the West End.
| 7.5.2 | Base Metal Mineralization |
Mineralization within the BMM begins with the Lead zone in the highest stratigraphic position, followed by the Red Zinc zone, and the White Zinc zone. BMM mineralization is primarily in manto configurations and each zone contains subordinate amounts of mineralization related to the other mantos described. All of the manto mineralization dips towards the east at 10 degrees and are controlled by dolomite and subordinate limestone host rocks within the middle Aurora Formation. The manto mineralization developed first from pyrite-sphalerite-galena semi-to massive sulfide mineralization followed by oxidation and supergene enrichment by the processes detailed by Megaw (2009), Borg (2009), and Reichert (2009).
Discussion of the Lead zone is included to complete the geology and mineralization, as well as history of the project. Little of the Lead zone is included in the current resource calculation, but is considered a future underground exploration target for silver. Most supergene mineralization originated in the hypogene mineralization of the Lead zone mantos.
The Lead zone was the original mineral discovery in the Sierra Mojada district and sustained mining in the district for the first 20 years until its exhaustion in 1905. The manto was in what was historically known as the "Snake", "Manto", and "Scraggly" beds (Haywood and Tripplet, 1931) of the now defined middle Aurora Formation, and located stratigraphically above the Red Zinc zone. The Lead zone was mined continuously for 4km of strike length, 30 meters of width and up to 6m in height. The lead zone graded 15% lead, 12 ounces per ton of silver, and produced 3.5 million tons of ore (Shaw, 1922) from cerrusite-anglesite, chlorargyrite and native silver. Mineralization was centered on the northeast striking Parrena structure and was accessed through the Parrena tunnel located near the current core shack.
The Red Zinc zone is a continuous manto some 2,500m along strike, up to 200m wide, and up to 160 m thick. It averages about 80 m in thickness and about 130m in width. The mineralization follows reactive dolomite host rocks and karst fill breccia historically known as the "Santa Getrudia, Hallazgo, and North Encantada" (Haywood and Triplett, 1931) horizons in the middle Aurora Formation. The manto dips to the east at about 10 degrees following the dip of the local stratigraphy and is located in the footwall of the Sierra Mojada fault.
Mineralization consists of massive hemimorphite (Zn4Si2)O7(OH)2-H2O), with subordinate amounts of smithsonite (ZnCO3) and minor hydrozincite (Zn5(CO3)2(OH)6). The Red Zinc manto is admixed
Report Date: April 30, 2013
Effective Date: March 18, 2013
with strong iron-oxide with minor manganese oxide imparting a red color to the zone. Massive red zinc manto mineralization is surrounded by a halo of fault and fracture controlled red zinc a result of supergene processes, primarily but not restricted to the footwall.
The mineralization is vuggy and shows replacement of zebra textures as well as laminated cave- floor and soft-sediment deformation. Relic pyrite, galena, and sphalerite have been noted although the overall level of oxidation is strongly pervasive. The lead oxide platternite (PbO2) is common. Massive Red Zinc zone mineralization typically grades approximately 20 to 30% Zn and approximately 55g/t Ag. Typical examples of the Red Zinc are shown in Figure 7-12.
The full extent of the Red Zinc zone remains to be completely delineated. Multiple Red Zinc zones are noted in the district and one, the Yolanda, is currently being exploited on a small scale by a local mining cooperative.
The White Zinc zone (smithsonite manto) lies underneath the Red Zinc zone and forms a series of mantos, chimneys, and filled structures. The zone consists of two bodies approximately 100-200 meters across each and up to 70m in thickness. The two bodies of mineralization are separated by the Campamento fault which has down-thrown the east body relative to the west body. The thickest section of the Red Zinc zone directly overlies the White Zinc zone at about the 631700E section where total zinc mineralization is in excess of 200m thick.
The mineralization follows reactive limestone and dolomite host rocks and karst fill breccia historically known as the "Trinidad" horizon (Haywood and Triplett, 1931) in the lower Aurora Formation. Mineralization shows classic karst cave-floor accumulation and soft sediment deformation. Mineralization also shows a very strong structural component occupying steeply dipping faults in the zone and the full extent of the White Zinc manto remains to be determined.
Mineralization in the White Zinc zone consists primarily of smithsonite with very minor overprinting hemimorphite, and is slightly higher in zinc grade than the Red Zinc zone. There is very little iron oxide and low levels of lead. Massive White Zinc zone mineralization grades approximately 25 to 40% Zn and grades approximately 3g/t Ag. Typical examples of the White Zinc are shown in Figure 7-13.
Report Date: April 30, 2013
Effective Date: March 18, 2013
Report Date: April 30, 2013
Effective Date: March 18, 2013
Report Date: April 30, 2013
Effective Date: March 18, 2013
Section 8 data and information are taken from Megaw (1988, 1996, and 2009), Sillitoe (2009), Reichert (2009), Borg 2009, Sanchez et al (2009).
The Sierra Mojada deposit lies on within three known mineral provinces:
| ● | The eastern edge of what is termed the Mexican silver belt. |
| ● | The western edge of the MVT Province of NE Mexico and SW U.S. |
| ● | The middle of the northern Mexico CRD (Carbonate Replacement Deposits) belt. |
The currently accepted model for hypogene mineralization in the Sierra Mojada district is a CRD relatively distal from an intrusive source as diagramed in the district schematic showing Figure 8-1.
| 8.1 | Sierra Mojada Polymetallic Pb-Zn-Ag-Cu District |
Megaw (1988) classified Sierra Mojada as a CRD type of deposit and, following his classification system of CRD deposits in 1996, Sierra Mojada would be considered as a Type III CRD with no direct connection to an intrusive source. However, Megaw (1996) indicates that the major polymetallic Pb-Zn-Ag-Cu districts in northern Mexico show metal sourcing to be a mixture of basin brines and magmatic sources, and suggests that basin dewatering was a magmatic thermal driven event, as opposed to a strictly compressional event. Indeed, Sanchez, et al (2009) makes a strong argument that Sierra Mojada is part of the NE Mexico MVT province.
Abundant direct and circumstantial evidence exists at Sierra Mojada, based on 2011 and 2012 exploration drilling, that intrusive rocks are present and were likely the thermal drivers of basin brine sourced mineralization into a district wide metal zonation. This evidence includes:
| ● | The drill hole B12074 collared at the top of Mesa Blanca intersected 58m, from 432 to 490m depth, of felsite sills interleaved with metamorphosed dolomite, intense massive and stockwork silicification, and disseminated base metal sulfides. |
| ● | Breccia float in a zone 450m distance from the above drill site with angular chalcopyrite fragments, jasperoid, and mimetite (Pb5(AsO4)3Cl) more indicative of a hydrothermal breccia pipe than the local mapped Upper Conglomerate unit. The pipe is located along the main strand of the San Marcos fault. |
| ● | Chargeability highs in a zone trending east from Mesa Blanca to the historic and west towards the Volcan mine area, a distance of 2km. |
| ● | A distinct zone of sulfide mineralization surrounding and extending north from the historic Veta Rica mine which includes chalcopyrite, tennantite, argentiferous galena, arsenopyrite, and sphalerite; implying a formation temperature >300°C. |
| ● | A center of strong sericite alteration coincident with the chargeability highs and sulfide mineralization around the Veta Rica-San Jose-Deonea historic mine areas. Additional strong sericite alteration is noted with chalcopyrite in the deepest portions of the San Salvador, Encantada, and Fronteriza workings along the strike of the San Marcos fault. |
Report Date: April 30, 2013
Effective Date: March 18, 2013
| 8.2 | Sulfide Mineralization |
Megaw (2009) describes the typical distal sulfide mineralization in CRD districts, and that observation is directly applicable to Sierra Mojada. The original sulfide mineralization at Sierra Mojada consisted of pyrite, galena, sphalerite, chalcopyrite, arsenopyrite, and tennantite; in a gangue of quartz, carbonates, barite, and likely some fluorite with minor celestine. It is believed that up to 30% of the original mineralization was gangue minerals at Sierra Mojada.
The hypogene sulfide mineralization was fed into reactive dolomite horizons and karst features in the Upper Conglomerate and Aurora Formations by the San Marcos and Northeast fault systems. On a district zoning scale, likely based on an intrusive thermal driver located in the Veta Rica-Mesa Blanca area, the lead manto was deposited furthest from the center, followed by the zinc mantos, with district copper mineralization centered in veins and mantos around the historic Veta Rica mine. Figure 8-1
Silver zonation tends to begin in the copper zone and extent outward into the lead zones. The original hypogene silver mineralization was likely dominated by argentian varieties of galena, sphalerite, chalcocite, and tennantite; as well as acanthite-argentite. These minerals have all been documented by Renaud and Pietrzak (2011a and 2011b).
This style of district zoning has been noted CRD districts in Utah, Colorado, New Mexico, and Chihuahua and around numerous cordilleran porphyry districts. Due to the extreme oxidation of the Sierra Mojada sulfide mineralization, only minor remnants of galena, sphalerite, and pyrite have been noted in the zinc mantos, and geochemically immobile cerrusite and anglesite are all that remain in the galena mineralization in the lead mantos. Silver sulfide minerals are still present when they have not oxidized to halides Figure 8-1.
Report Date: April 30, 2013
Effective Date: March 18, 2013
Report Date: April 30, 2013
Effective Date: March 18, 2013
Reichert (2009) describes the oxidation-supergene enrichment sequence on the sulfide-nonsulfide zinc deposits at Mehdi-Abad and Koladahrvazeh in Iran. The non-sulfide zinc mineralization in the Sierra Mojada district is directly analogous to the Iranian deposits, while the oxidation of the silver mineralization at Sierra Mojada requires a separate discussion.
Report Date: April 30, 2013
Effective Date: March 18, 2013
Report Date: April 30, 2013
Effective Date: March 18, 2013
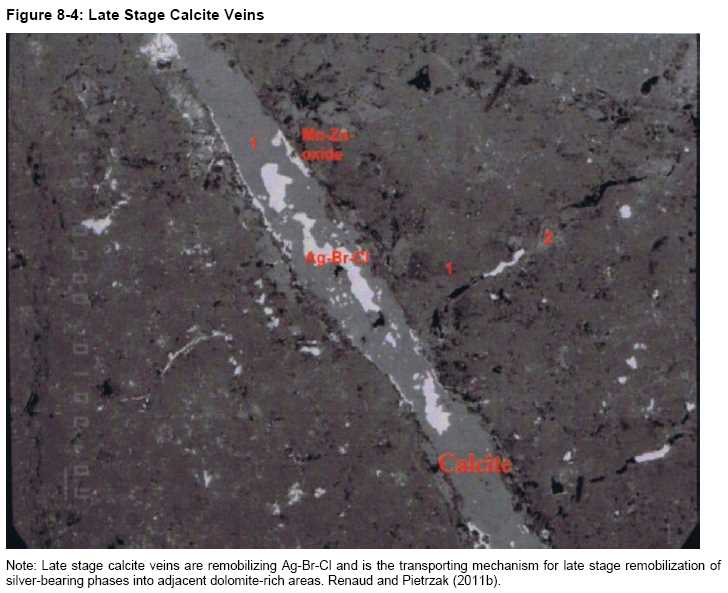
Hypogene Pb-Zn-Ag-Cu sulfide mineral mineralization in the Sierra Mojada district underwent intense oxidation, followed by supergene enrichment, followed by a second oxidation event. The Late Tertiary to Quaternary events were accelerated by the intense structural development during a period of rapid climate change as the region went from a savanna climate in the Pliocene to the cool-wet climates of the Pleistocene to the hyperaridity of the Present. The non-sulfide zinc mineralization at Sierra Mojada would classify as about 70% direct replacement and 30% wallrock replacement, primarily in structures; according to Hitzman (2003).
Under oxidizing conditions in limestone-dolomite host rocks Sphalerite (ZnS) readily oxidizes to its carbonate equivalent, Smithsonite (ZnCO3) under high partial pressure of CO2. Upon relaxation of the partial pressures of CO2, Smithsonite alters to hydrozincite (Zn5(CO3)2(OH)6 prior to the addition of silica leading to the formation of hemimorphite (Zn4Si2O7(OH)2-H2O), the most stable form of non- sulfide zinc. Note that as sphalerite (64% Zn) converts to smithsonite (52% Zn) and finally to hemimorphite (54% Zn) and that the true supergene enrichment is in the conversion of smithsonite
Report Date: April 30, 2013
Effective Date: March 18, 2013
to hemimorphite. The abundance of iron in the sphalerite and the presence of iron-sulfur bacteria accelerate the process tremendously.
As detailed by Sillitoe (2007) supergene enrichment of silver sulfides is a relatively rare phenomenon. Instead, the silver sulfides of argentite-acanthite (Ag2S) readily oxidize to silver halides (AgCl and AgBr) and native silver. Argentite-acanthite (87% Ag) converts to clorargyrite (75% Ag) and bromargyrite (57% Ag) leading to an "enrichment" by generating more grains of silver halide minerals, with the excess Ag taken up by the native form (Figure 8-4).
Report Date: April 30, 2013
Effective Date: March 18, 2013
The mineralization in the Sierra Mojada area was discovered in 1879, and early exploration was conducted by prospecting the outcropping ore. By the 1920's, diamond drilling was widely used in the district and the subsurface exploration and development included workings and drifting on structures. Underground diamond core and long hole percussion drilling using relatively short, small diameter "B" size holes, was widely used beginning in the 1930s through the 1990's.
Modern exploration of the Sierra Mojada district began with the Kennecott efforts in the early 1990s which included stratigraphic tests by surface diamond drilling and geophysical techniques. Kennecott conducted extensive regional Controlled Source Audio Frequency Magneto Telluric (CSAMT) and Resistivity-Induced Polarization (IP) surveys to the north of the Sierra Mojada Range from Palomas Negras to El Oro in the east. These surveys were performed by Zonge Engineering of Tucson.
The Mexican government has flown aeromagnetic and radiometric surveys for much of northern Mexico, but the data yields only regional structure information and a few obvious intrusions. There is not an abundance of igneous rocks, other than deep crystalline (Jurassic to Triassic) basement, known in the area, but subtle signatures of younger diorite to felsite rocks can be detected, including the various mineralized types, that are expected to have high magnetic or radiometric susceptibility.
Beginning in 1996, Metalline Mining began to collect and compile the historic mine maps, drill core assays to develop new surface and underground mine maps and samples. Channel samples were extensively used to identify areas of interest, followed by long hole percussion drilling to extend samples away from old workings, and finally, underground and surface core drilling to extend the sampling further. Surface trenching of bulk metallurgical samples was undertaken in 2010.
Bedrock exposures in the area are poor to excellent depending on slope and in areas that have been previously mined. As a result, geochemical methods have had mixed success as an exploration tool. High percent range background values for zinc and lead are common local to zinc- lead deposits, but gradients and vectors that lead to mineral concentrations are just now being recognized. Geochemical rock sampling of targeted stratigraphy in conjunction with structural analysis is the most important exploration and evaluation tool.
The hyperaridity of the area leads to mass physical dispersion rather than chemical dispersion of metals. Soil development is poor with little or no organic material and conventional soils and low- level trace element geochemical surveys are not useful in the area. The amount of carbonate and iron-manganese inhibits migration of metallic ions in this environment.
Report Date: April 30, 2013
Effective Date: March 18, 2013
| 9.3 | Silver Bull Exploration |
There are two aspects of Silver Bull's exploration effort to be addressed:
| ● | Silver Bull's regional exploration effort on existing licenses and prospects. |
| ● | Channel sampling in underground exploration and their use in the resource estimation of the Sierra Mojada Project. |
| 9.3.1 | Regional and Prospect Evaluation |
Silver Bull Resources is integrating the abundance of information, both public and private, in its' district and regional exploration efforts in Mexico. From the public side, the Mexican government's regional geophysical surveys in conjunction with its regional 1:250,000 scale stream sediment and geologic mapping surveys provide a usable base for prospect evaluation when used with targeted stratigraphy and structural analysis. In addition, Silver Bull has employed SRTM (Shuttle Radar Topography Mission) and Landsat ASTER images compiled by Sandra Perry of Perry Remote Sensing, Denver, Colorado, to develop remote sensed hydrothermal alteration models of select target areas. Silver Bull also flew a regional airborne EM (ZTEM) survey in 2011 to act as a base for regional license exploration.
Silver Bull engaged in a program of detailed structural analysis of the Sierra Mojada district as well as a detailed time, lithologic, and biostratigraphic compilation of the project area. Finally, the extensive use of petrography has aided considerably in the interpretation and paragenetic sequencing of mineralization. The use of outside specialists in this regard has been particularly useful in all aspects of the program. Table 9-1 outlines the prospects of interest to Silver Bull while Figures 9-1 and 9-2 shows the locations of the Sierra Mojada license with the associated license and prospect areas outlined in Table 9-1.
| 9.3.2 | San Francisco Canyon |
The San Francisco Canyon prospect (Figure 9-2) had long been recognized by companies working in the district, including Penoles, Kennecott, and Metalline. Based on a structural interpretation of the 2011 ZTEM survey, surface mapping, and sampling in the prospect area, Silver Bull drilled 13 short core holes into the area in late 2011 for 1662.77m. Five of the drill holes intersected vein-type mineralization over narrow intervals of 1 to 5 meters. An analysis of the program revealed that the structural intersections which were the source of the high grade (+100g/t Ag) surface sample values were missed in the drill holes. Given the widespread and clearly anomalous geochemical- geophysical expression of the San Francisco target, a follow-up program is planned after the evaluation of the Palomas Negras prospect in which detailed analysis is being performed and targets specifically modeled prior to drilling.
Report Date: April 30, 2013
Effective Date: March 18, 2013
The Palomas Negras prospect (Figure 9-2) located NW of San Francisco Canyon is a district with a long history and unrecorded but significant production. The district consists of a series of imbricate thrust fault slices of dolomite along the SW side of the canyon, cut by NE structures. Massive sulfide is reported from some underground exposures as is native sulfur around some current openings. The similarities to the Sierra Mojada district are significant, and the Palomas Negras district is about two-thirds the size of Sierra Mojada. Mapping is complete and detailed sampling and structural analysis is in progress.
A drilling plan which covers a major portion of the NW side of the Sierra Mojada license has been submitted to the environmental authorities (SEMARNAT) for approval and drilling is expected to take place in mid-2013 as planned at this time.
| 9.3.4 | Underground Channel Sample |
Channel sampling has historically and to the present, been a significant part of the underground exploration effort at Sierra Mojada. Channel samples are collected from the walls ("ribs") of underground workings by a supervising geologist who has selected the channel sample location, painted the position of the sample on the mine wall, and wrote the sample number on a sample sack which was suspended from a nail at the sample point. The sampler marks the approximate sample location on a mine map and reports the sample number of each sample on a daily sampling report. At the sample location, sampling crews spread a drop cloth, clean the face, and cut a sample about 2cm deep and 10 to 20cm wide. The sample was transferred to a large plastic sample sack and about 5 to 6 kilograms of sample are transported from the mine to the sample preparation area. Samples are typically 1-2 meters in length. Sample location, length and orientation are subsequently determined by the surveyor using tape and compass surveying tied to nearby spads located by first order surveying. After sampling the sample locations are surveyed and entered into the database. To the best extent possible, a representative and proportionate volume of material is collected in each sample of the composite vein, fault, breccia and wallrock material.
Sample density for channels is considerably greater than for diamond core at 2 to 20 m spacing. There are approximately 13,000 channel samples in the sample database covering an area of 180 hectares.
Approximately 95 percent of all channel samples were collected prior to Silver Bull's involvement in the project and about five percent of the samples have been re-sampled for verification and approximately 70% of the locations have been verified. There are now 8988 usable channel samples in the database with associated QA/QC and surveyed locations.
Report Date: April 30, 2013
Effective Date: March 18, 2013
Report Date: April 30, 2013
Effective Date: March 18, 2013
Report Date: April 30, 2013
Effective Date: March 18, 2013
Report Date: April 30, 2013
Effective Date: March 18, 2013
| 9.4 | Exploration Conclusions |
The mineralization in the Sierra Mojada area was discovered in 1879, and early exploration was conducted by prospecting the outcropping ore. By the 1920's, diamond drilling was widely used in the district and the subsurface exploration and development included workings and drifting on structures. Underground diamond core and long hole percussion drilling using relatively short, small diameter "B" size holes, was widely used beginning in the 1930s through the 1990's.
Modern exploration of the Sierra Mojada district began with the Kennecott efforts in the early 1990s which included stratigraphic tests by surface diamond drilling and geophysical techniques. Kennecott conducted extensive regional Controlled Source Audio Frequency Magneto Telluric (CSAMT) and Resistivity-Induced Polarization (IP) surveys to the north of the Sierra Mojada Range from Palomas Negras to El Oro in the east.
Beginning in 1996, Metalline Mining began to collect and compile the historic mine maps, drill core assays to develop new surface and underground mine maps and samples. Channel samples were extensively used to identify areas of interest, followed by long hole percussion drilling, and finally, underground and surface core drilling. Surface trenching of bulk metallurgical samples was undertaken beginning in 2010.
Silver Bull Resources is integrating the abundance of information, both public and private, in its' district and regional exploration efforts in Mexico. From the public side, the Mexican government's regional geophysical surveys in conjunction with its regional 1:250,000 scale stream sediment and geologic mapping surveys provide a usable base for prospect evaluation when used with targeted stratigraphy and structural analysis Silver Bull also flew a regional airborne EM (ZTEM) survey in 2011 to act as a base for regional license exploration.
Silver Bull engaged in a program of detailed structural analysis of the Sierra Mojada district as well as a detailed time, lithologic, and biostratigraphic compilation of the project area. Finally, the extensive use of petrography has aided considerably in the interpretation and paragenetic sequencing of mineralization.
Silver Bull's exploration efforts in and around the Sierra Mojada district have ben spearheaded by surface diamond drill core and RC drilling, and underground core drilling with multi-angled termite drill rigs and extensive use of channel samples for resource compilation. Twin sampling programs have been a major part of the effort. Outside of the main district, Silver Bull has explored the San Francisco district, and is currently preparing the Palomas Negras district for drilling in 2013.
Report Date: April 30, 2013
Effective Date: March 18, 2013
Chapter 10 is updated from Nilsson (2009), PAH (2010) and SRK (2012). Throughout its history, the Sierra Mojada deposit has been drilled extensively by surface diamond core, underground diamond core, surface reverse circulation and underground long hole percussion drilling. There are now 5382 drill holes in the database not all of which are suitable for resource calculations. Tables 10-1 and 10-2 document the extensive history of the drilling programs to the present.
| 10.1 | Historic Drilling Pre-1999 |
Numerous drill holes exist in the Sierra Mojada project area for which locations and or assays are missing and for which few records exist. One drill hole though, B6, completed in 1900, is a 150 meter surface drill hole which has consistently been included in resource calculations. Kennecott Exploration drilled 9 core holes in the area in 1995 (SM1 -SM9), for 3403.85m. Only 2 of the holes are within the district and those did not carry significant assays. The local Nortenos drilled 873 long holes between 1930 and 1950 for 22,435m. These holes were drilled from numerous underground stations in radiating fan patterns. The drilling was concentrated on four separate areas along the trend of silver mineralization. Within these four areas, underground stations are typically spaced 20m apart with average hole depths 25m resulting in very dense drilling. Areal coverage of these long holes is approximately 9 hectares and none of these drill holes are suitable for resource calculations. Many long hole locations are recorded, with assays, but verification is not possible.
| 10.2 | Metalline Mining Corporation (MMC) |
MMC purchased all of the available historic data from Penoles in 2000, much of which is still in usable condition. This included early 1900s underground maps, drill hole folio dating from 1930 to 1950 and a few late 1980s reports. The drill hole folio included the 873 long holes.
| 10.2.1 | MMC Drilling Campaign of 1999 |
Metalline drilled twenty-four holes from surface (R991 - R999) using reverse circulation for a total of 6,628 m. This drilling covers 28 hectares and intercepts the Red Zinc and Shallow Silver Zones. Approximately half of the holes were drilled vertically and the remaining holes were angled with inclinations ranging from vertical to 54 degrees. These drill holes have been used in resource calculations since 2011.
Report Date: April 30, 2013
Effective Date: March 18, 2013
Report Date: April 30, 2013
Effective Date: March 18, 2013
Report Date: April 30, 2013
Effective Date: March 18, 2013
| 10.2.2 | MMC and North Limited Campaign of 2000 |
MMC entered a joint venture with North Limited of Australia in 2000. North drilled a string of 26 reverse circulation holes (NSM1 - NSM27) over a linear distance of approximately 3.5km down the long axis of the known Red Zinc Manto for 6,783 meters. All holes were drilled vertically. These drill holes have been used since 2011 in project resource calculations.
| 10.2.3 | MMC Underground Drilling Campaign of 2001 |
MMC drilled 73 underground long holes for 1,068 meters in 2001 (L632500S45- L631855NE15). These holes were drilled from several underground stations in radiating fan patterns. This drilling is located at the western extent of the Red Zinc Manto. For reasons related to sample quality, these holes were not used for resource calculations until verification in 2012 by Silver Bull Resources.
| 10.3 | MMC and Penoles Joint Venture 2002-2003 |
A joint venture agreement was made with Penoles in November of 2001. Two different exploration teams from Penoles spearheaded the drilling activities. One team focused on the eastern end of the deposit targeting the Red Zinc Manto in 2002 and 2003. This consisted of both diamond core and long hole drilling from underground and diamond core drilling from surface. The second team drilled core holes from surface targeting SSZ on at the western end of the property. The joint venture dissolved in late 2003.
| 10.3.1 | Surface Diamond Core |
The joint venture completed thirty-nine diamond core holes drilled from the surface for 11,830m total. On the eastern end of the property 34 diamond core holes, generally labeled the E900 to E1200 series, were drilled on fences spaced 200m apart east of the Fronteriza mine toward the Oriental mine, a distance of 1km. The holes were spaced 50 to 100m in a north-south direction along the fences.
The Penoles program at the western end of the property followed up the North Limited drilling in the vicinity of the San Antonio mine, 2km west, which confirmed and extended the silver mineralization. Five core holes were drilled from surface for about 1,300m. The drill hole locations are irregularly spaced, and cover an area of approximately 7 hectares. The drill hole series are believed to be the W200 to W300 series, not to be confused with underground long holes with similar numbers.
| 10.3.2 | Underground Diamond Core |
Thirty-seven diamond core holes were drilled from underground for 2,557m. These holes were drilled from several underground drilling stations in radiating fan patterns and are of the A0 to M6 series. Drilling stations are typically spaced 50 to 100m apart in an irregular pattern. This drilling covered approximately 7 hectares, mostly over the Red Zinc mineralization.
Report Date: April 30, 2013
Effective Date: March 18, 2013
| 10.3.3 | Underground Long Hole |
Six-hundred eighty-five underground long holes were drilled for 10,729m primarily in 2002 and are generally labeled the E100 to E600, and W400 to W600 series. Typically, these holes are drilled from several underground stations in radiating fan patterns. Spacing of the underground stations is typically less than 20m and hole lengths average 13m resulting in very dense drilling. These holes intercept much of the Red Zinc Manto and SSZ mineralization east of Easting 630,700. The Silver Bull 2012 twinning program has verified the reliability of the majority of these drill holes and the data is now incorporated into the resource calculation.
| 10.4 | MMC Campaign of 2004 to 2009 |
Upon the termination of the Penoles joint venture, Metalline resumed district exploration with a very aggressive program of surface and underground core, underground long hole, and surface RC drilling primarily targeting the zinc resource.
MMC drilled 103 "N" size diamond drill holes from surface for 15,231m from 2006 - 2009 (D1080729 - D9090818 and B09001 - B09013). The surface drilling was completed along fences oriented north-south with 100 m spacing and drill hole spacing varying from 50 m to 200 m. The main concentration of drilling covers approximately 20 hectares intercepting the SSZ just west of the Red Zinc Manto. Vertical dip is commonly used, however, and due to location restrictions, some holes are angled, drilled with dips up to 60 degrees.
MMC updated the surface drilling practices employed during the MMC and Penoles drilling campaign of 2002 to 2003 and largely mitigated the core and sample recovery issues by employing sophisticated mud and bit selection, and employing a well-known contractor, Major Drilling de Mexico
MMC drilled 650 underground diamond drill holes for 65,052m (D01040124 - D9080807) in the 2004 - 2008 time periods. These holes were drilled from several underground drilling stations in radiating fan patterns. Drilling stations are typically spaced 50 to 100m apart in an irregular pattern. This drilling covers approximately 52 hectares intercepting most of the known Red Zinc Manto and Shallow Silver Zone mineralization east of Easting 631,200.
| 10.4.3 | Surface Reverse Circulation |
MMC drilled eight reverse circulation holes (R060707 - R060926) from the surface for 2,938 meters in 2006. These were water well and condemnation holes drilled in an irregular and widely spaced pattern testing areas east and north of the underground workings. Of these eight holes, only R060926 intercepted the known silver mineralization. For reasons related to sample quality, these holes were not used for grade interpolation.
Report Date: April 30, 2013
Effective Date: March 18, 2013
| 10.4.4 | Underground Long Hole |
Twenty-two hundred fifty three underground long holes were drilled by Metalline Mining in 20042009 for 31,272m. The drill hole series are variously numbered, typically prefixed with an "L". These holes were typically drilled from several underground stations in radiating fan patterns. Spacing of the underground stations was less than 50 meters and hole lengths average 17 meters, resulting in very dense drilling. The drill holes intercept much of the Red Zinc manto and Shallow Silver mineralization east of Easting 630,700.
In 2010, MMC completed 101 surface HQ/NQ drill holes (B10001 - B10099) for 12,512m property wide. Drilling was undertaken using three Metalline-owned diamond drill rigs and three drill rigs operated by drilling contractors. Contract drilling was performed by two companies. Baja Drilling S.A. de C.V. used a skid- mounted Longyear 48 machine to complete three holes. However, most contract drilling was performed by Landdrill International Mexico S.A. de C.V. with a skid-mounted HTM 225 machine.
The drilling was completed along fences oriented North-South with drill hole spacing of 50 to 200m. The principal concentration of drilling covers an area of approximately 40 ha, and intercepts the SSZ just west of the Red Zinc Manto. Vertical inclinations were used in the majority of holes with some holes angled up to 60°.
In 2010, MMC also drilled 48 reverse circulation holes (R0001 -R0048) for 6,879m. These were principally in-fill holes between core locations. A total of 48 RC pre- collar holes were drilled. Thirty one of these holes were completed by core drilling. In areas of deep quaternary cover RC pre- collar holes were drilled either close to the base of QAL contact or close to the Upper Conglomerate lower contact. RC drilling was performed using a Th-100 Tandem truck mounted drill used by contractor Layne de Mexico S.A. de C.V. and a smaller truck mounted CDR drill, owned and operated by Metalline.
| 10.6 | Silver Bull Resources Core Drilling Campaigns of 2011 - 2012 |
Procedures described for Silver Bull are modified and updated from Nilsson 2011. Beginning in April of 2011, Silver Bull Resources assumed full control of the Sierra Mojada Project and revamped all drilling, core handling, logging, and assay procedures. Drilling included surface and two underground campaigns. As part of their due diligence review of the Sierra Mojada Project, Silver Bull drilled 33 RC/Core holes (R100001 - R10034) for 5,927.85m.
| 10.6.1 | Surface Core Program |
Major Drilling de Mexico was the contractor employed to complete 186 HQ/NQ surface core holes in 2011 (B1101 - B11185) and 80 holes in early 2012 (B120001 - B12083) for a total of 52,347.1m.
Report Date: April 30, 2013
Effective Date: March 18, 2013
Major employed a UDR 650 drill rig with a reversible head and compressor which allowed the driller to drill RC to pre-determined depths and switch to HQ core when entering mineralized stratigraphy.
Of the 80 holes drilled in 2012, a total of 32 (totalling 10,056m) were not included in the previous resource estimate. These additional holes are summarized in Appendix B.
| 10.6.2 | Underground Core Programs |
In early 2012, Silver Bull turned its attention toward underground drilling in the district and completed two underground drilling campaigns by year's end. The first was in early 2012 when Silver Bull completed 13 drill holes in the Parrena Tunnel for 4055m of core. The program provided significant information regarding local structures and stratigraphy but did not materially add to the resource. The Parrena Tunnel remains a significant exploration target and will be reviewed for more drilling in mid-2013, but will require a significant amount of rehabilitation of the underground workings.
The second underground drilling program of 2012 was the long hole twinning program recommended by SRK in their 2012 resource statement. This program commenced in July 2012 and terminated on the Christmas break in mid-December 2012. The program targeted 105 drill holes for twinning and exploratory for 3,670.75m of drilling in the Shallow Silver Zone; and 88 drill holes for 3,467.46m in the Red and White Zinc mantos of the Base Metal Manto zone. The layout of the program is shown in Figure 10-1 and the holes summarized in Appendix B. Note that multiple holes were drilled from one setup or drill station.
A total of 207 termite holes were drilled with one (T12008) not included in the resource estimation due to very poor recovery.
Report Date: April 30, 2013
Effective Date: March 18, 2013
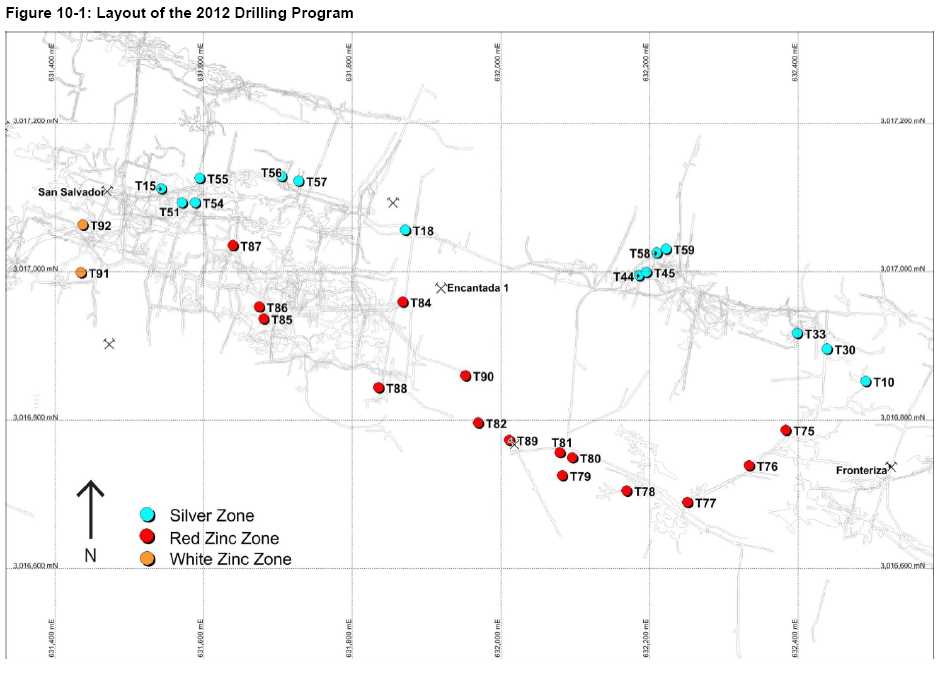
Report Date: April 30, 2013
Effective Date: March 18, 2013
The drilling was accomplished by Silver Bull Resources owned "Termite" drills which are small, hydraulic-electric core drills which are easily maneuvered underground. The drill produces a "BQ" size drill hole and is capable of up-hole drilling. The maximum length of a drill hole is about 70 m, depending on ground conditions. Core recovery for the entire program was excellent considering the structural complexity of the deposit. The geostatistical treatment of the twin-hole data will be examined in Chapter 12, Data Verification. Figure 10-2 demonstrates a typical underground drill station set-up.
Report Date: April 30, 2013
Effective Date: March 18, 2013
| 10.7 | Silver Bull Resources Core Drilling and Sampling Procedures |
Silver Bull Resources employs state of the art exploration procedures in all of its work at Sierra Mojada. All data is managed in Microsoft Excel or Access, with the Excel files imported directly into Gemcom Software's GEM's® for 3D modeling. Data is also transformed to a visual format in MapInfo.
All survey data is imported into AutoCAD, and the information required for the resource estimation is transferred to GEMS. The following procedures apply equally to the surface core drilling programs as well as the underground core drilling programs.
| 10.7.1 | Collar and Down Hole Surveys |
Drill holes were laid out on an approximate 100m x 50m grid. Drillhole locations were marked in the field by the company surveyor or geologist. Drill pads were then prepared and final collar locations were marked by the surveyor.
When collar locations were located on gravel sites a concrete pad with iron-rod attachment points were constructed. For pads on bedrock, jacklegs were used to create anchor points for the drill rigs. Drill pads varied in size from 5m x 5m in size to 10m X 20m in dimension, depending on the type and number of holes planned from that site.
After drill holes were completed, steel pipes were inserted to mark the locations and concrete pads with drill hole numbers were poured to hold the pipes in place. The final drill hole locations were then surveyed by the company surveyor using a total station survey instrument. Geologists approved the final collar surveys prior to entry into the database.
All drill holes were down hole surveyed using Reflex survey instruments. Surveys were done using an EZ-Shot single survey instrument. Some holes were surveyed with a Reflex EZ-Trac instrument. All Reflex results were recorded at the time of the survey. Surveys were performed by the driller, with a company representative present, either a geologist or drill supervisor.
| 10.7.2 | Core Drilling, Handling, and Transportation |
All coring by contractor was done with HQ or HQ3 core size, unless reduced to NQ size for operational reasons. Some holes with quaternary cover were predrilled using a tricone bit, drilling down to a level close to the base of the cover or solid ground, this varied from 3 - 30m.
Core was removed from wire line core barrels at the drill rig and placed into waxed fiberboard core boxes. Core boxes were 60cm in length with, 4, 5 or 6 divisions depending on core size. The driller's recorded end of run depth, drilled interval and core recovery on blocks placed in core boxes. Where possible drillers also inserted an additional block indicating where the "no recovery zones" were located' and if the "no recovery zones" were due to a void (old working or open space). Hole numbers and core box numbers were written on the core boxes and lids. Core boxes were then tied up and at the end of the shift core boxes were transported by truck to the core logging facility. Core transportation from drill rig to the core logging facility was the responsibility of the driller.
Report Date: April 30, 2013
Effective Date: March 18, 2013
When the core boxes were received at the core logging facility, the core was placed on logging tables where the core was cleaned to remove drilling muds and additives. A minimal amount of cleaning was performed on clay rich and poorly consolidated intervals. The core was reconstructed to ensure that the core was placed in the boxes correctly and so that there was structural continuity for logging and sampling.
After reconstruction, the cut line for core cutting/splitting was marked on the core. As far as possible this line was placed perpendicular to the main structural orientation - as indicated by responsible logging geologist. Core was also marked with dashed lines on the non-sample side to indicate that it should remain in the box.
All core was photographed after cleaning and orientation, generally before the recovery and geotechnical logging. Core was photographed using an indoor, special lighting and fixed camera. All photographs included hole name, box number, box start and end depths and a scale bar. Photographs were downloaded onto a computer at the logging facility for review by geologist before sampling. This was done to ensure photos were of good quality with no errors. Digital core photos were renumbered by hole and box number and placed into drill hole specific folders.
Recovery and geotechnical logging, including RQD was then performed by trained personnel. Any doubts or questions on recovery and core orientation were reviewed by the responsible core logging geologist with all recoveries being compared to those indicated by the driller. In those rare cases of discrepancy or core box errors that could not be corrected by the geologist, the responsible driller(s) were required to correct the problem. To assist with logging, down-hole depths were marked every meter.
Recovery and geotechnical information was recorded on a run-by-run (block-to-block) basis. Information was entered into a spreadsheet. Recovery was variable with "no recovery intervals" resulting from a variety of causes. Limestone rocks at Sierra Mojada contain many natural openings such as cavities and karst features, and in most areas of the Shallow Silver Zone, old workings are a common feature and these were represented by "no recovery intervals" as well as zones with backfill, which are harder to distinguish; and in clay, poorly consolidated karst breccia or rubble zones. In addition, the drill core has Niton™ thermal XRF measurements taken approximately every 20cm as a guide to the beginning and ending of silver mineralization, which can be difficult to discern with the naked eye.
After inspection, mark-up, geotechnical logging, and photography, geological core-logging was performed. Core logging formats evolved considerably when Silver Bull assumed control of the project. Silver Bull employs a combination of initial manual graphic logging followed by digital logging and subsequent data entry. Lithology types, alteration, mineralization and structural features were recorded on a 1:100 scale.
Core was marked for sampling by the geologist as part of the core logging procedure. Sample limits were marked on the core as well as the side of the core box. Sample intervals were also noted on
Report Date: April 30, 2013
Effective Date: March 18, 2013
cut sheets. Intervals and sample recoveries were entered directly into a spreadsheet, with cut sheets subsequently printed for core sawing. Samples were assigned a sample numbers based on hole number and a three or five digit sequential number; "no sample intervals" were also assigned a sample number and were included on the cut sheets.
Quality control samples consisting of blanks, core duplicates, and pulp standards were inserted in the sequential sample number sequence. Each sample number had the appropriate sample interval or control sample indicated on the cut sheet as well as the sample action to be taken for intervals of no recovery or contaminated material.
In addition to marking of samples for assay intervals, bulk density samples were selected during the logging process. The density samples were approximately 10cm in length with density measurements taken before the core is split with the core cutter. In total 3440 bulk density sample measurements were compiled by Silver Bull incorporating samples measured on site by the pycnometer method and verified by ALS, and by the Archimedes method and verified by SGS in Durango, Mexico
After logging and sample marking of the hole was completed, the core was split in half using a core cutter. Once the core was cut in half, specially trained samplers were used to sample the core. Based on the marking procedures, core was systematically sampled from the same side of the core which has helped to reduce the possibility of sample bias. The samples were placed in numbered sample bags, in which flagging tape with the sample number was also placed in the bag and barcoded. Bagged samples were placed in numbered sacks with the content of each sack recorded for shipment to the external laboratory. Sample sacks were placed in a locked storage area prior to shipment. Sample storage and shipments were controlled by Silver Bull's QA/QC manager.
All logging and sampling data is entered into spreadsheets. Density, recovery, and geotechnical data were entered into master spreadsheets, from which individual drill hole data could be extracted. Data is entered by the logging geologists and then rechecked by a data verifier. This procedure was implemented to allow geologists to concentrate more time on geologic logging and sampling Sample data was also entered into drill hole based spreadsheets. These were used to prepare cut- sheets for sampling. This data was prepared by the logging geologist.
Geological data was entered into the drill hole based spreadsheets. This data was prepared by the core logging geologist. Manual core logging with subsequent data entry into the Excel spreadsheet was implemented, with each of the logging geologists responsible for entering the data and passing it to the database manager who reviewed the entries for errors and database coding compatibility. Once the data had been checked the data was entered into the master database controlled by the database manager.
| 10.7.6 | Sample Security during Core Cutting |
Once the samples were taken from the core, they were bagged, organized and labeled by one specific person, signed off, and then kept under lock and key until shipped for assaying to ensure nothing was tampered with.
Report Date: April 30, 2013
Effective Date: March 18, 2013
After logging and sampling, the core boxes containing the split core were transported to the core storage facility, a locked, fenced, roofed structure. The core boxes were stored on commercially purchased core racks, with location identified on layout plans. The storage facilities were part of the security watchman's responsibilities, who are present 24 hours on site. The company has four secure core storage facilities on site.
All core and samples are retained on Silver Bull's property, except for samples sent to external laboratories for assaying. Access to the property is restricted by company security personnel and chain gated entries to the property. The core logging area always has company personnel present, in the form of core shed workers or company security personnel.
Coarse reject samples are stored in covered 200 liter steel drums in an outdoor storage area adjacent to the core shed. Sample pulps, grouped into boxes containing between 50 and 100 envelopes, are stored in the locked storage areas.
Report Date: April 30, 2013
Effective Date: March 18, 2013
| 11.0 | Sample Preparation, Analyses and Security |
JDS notes that there have been no changes to the sample preparation, analyses and security procedures utilized at the Sierra Mojada Project which have been described in detail in the previous technical reports. That information is reproduced in the following sections.
Prior to November 2003, all samples were shipped directly to ALS Chemex (ALS) for sample preparation and assay. Alter November 2003, samples were prepared to the pulp stage on site by MMC personnel. In 2007, MMC updated its laboratory equipment and sample preparation procedures following recommendations made by ALS. In 2010, Silver Bull abandoned the on-site sample preparation and began shipping samples to ALS for preparation and assay. (SRK 2012)
JDS personnel were present for the April 2010 due diligence site (Dome Ventures-MMC merger) and noted that there was a significant backlog of unprocessed samples stored at the site. Part of this was due to the inefficiencies of the onsite lab, and part a lack of funding. JDS recommended that the onsite lab be closed to eliminate any potential concerns regarding the QA/QC and assay validity.
With the closure of the onsite lab, efforts were made to ship them to a reliable and ISO-certified off site lab. A total of about 7,000 samples were shipped between August 2011 and April 2012 to ALS-Chemex Chihuahua. Many of the assay results were incorporated into the Nilsson and SRK resource estimates.
JDS was present for the closure, cleanup, and chemicals disposal of the onsite lab. Since that time, all sample preparation has been standard core-cutting, tagging and bagging for shipment offsite to the ALS-Chemex facility in Chihuahua. From there, pulps were shipped to the ALS- Global lab in Hermosillo for assaying. JDS has received copies of the assay files direct from ALS-Global labs since the introduction of the change, along with copies of the shipping files from Silver Bull site staff.
| 11.1.1 | MMC-Silver Bull Sample Preparation Procedures (2010 to present) |
Drill core is delivered by the drill contractor to the logging facility. The movement of the core, once delivered at the logging facility, is designed such that it is always in an easterly direction as it goes through each phase of the logging and sampling process, entering on the west side of the facility and leaving on the east side of the facility towards the sample storage area.
Initially, boxes are laid out in order on the logging tables by company staff. The meterage blocks inserted by the drill contractor are checked to ensure there are no errors. Drill core recovery between each of these blocks is calculated and recorded. Subsequently, the core is logged by a geologist who also marks the intervals to be sampled and prints out a "Sample Print Sheet", indicating sample numbers and the sample numbers for the QA/QC sample insertion. At this point, Niton® readings are taken in each sample interval and recorded.
Report Date: April 30, 2013
Effective Date: March 18, 2013
Once logged, and with the sample intervals marked, the core boxes are then taken to the photograph, density, and bar coding room. Here, each core box is photographed in a staged facility that ensures identical lighting for each photograph. Density samples are taken (the samples to be taken are indicated by the geologist) and the bar codes for each sample are then printed.
Following the photography, the boxes are carried and stacked, ready for the core to be cut by a rock saw. Half core samples are taken according to the sample intervals marked by the geologist and, when required (as indicated by the QA/QC program), quarter core field duplicates are also cut.
Samples for assay are placed in thick plastic sample bags with the sample number written on them and a strip of flagging with the sample number written on it is inserted into the sample bag. The bags are then stapled firmly shut. The samples are then placed into rice sacks, eight samples per sack.
From the start of the year until June 30, 2011, samples were shipped two or three times a week once one tonne of sample material had accumulated. The shipment was done with company personnel and a company vehicle. As of July 1, 2011, sample shipment to the ALS preparation facility in Chihuahua has been subcontracted. The subcontractor is a company that Silver Bull has used for a number of years for other services and is regarded as trustworthy and reliable. Shipments are programmed weekly.
Once received by ALS, they check the shipment and confirm via e-mail whether the samples shipped coincide with what is registered on the shipment form and analysis submittal. (SRK 2012)
| 11.1.2 | MMC Sample Preparation Procedures (2007-2010) |
From 2007 to 2010, sample preparation was done at the Sierra Mojada property by MMC personnel. Samples were first dried in a clean drying pan. After the samples were thoroughly dried, the pan and samples were transferred to the on-site preparation facility. The samples passed through a Rhino crusher and then a secondary crusher resulting in material that has been crushed to greater than 70 % passing -10 mesh (-2 mm). The crushed samples were split in a Jones splitter multiple times to generate a 250 to 300 g crushed sub-samples. The crushed sub- samples were then transferred to a puck mill and milled for three minutes to attain a size specification of greater than 95 % passing a -150 mesh screen. The pulverized material was passed through a riffle splitter to generate two pulp sub-samples (one for analysis and one for reference). The pulp sub-samples were transferred to individual sample bags.
The methods utilised by MMC were standard and adequate for generating assay data for use in resource estimation. (SRK 2012)
Report Date: April 30, 2013
Effective Date: March 18, 2013
| 11.1.3 | MMC Sample Preparation Procedures (2003-2007) |
All samples were weighed and their weight was recorded before processing. The entire samples were then crushed to nominal %-inch (in) sized samples using a Fraser & Chalmers jaw crusher. The crusher was cleaned after each sample using compressed air. Once first stage crushing was completed, the samples were then crushed to nominal %-in sized samples using a Roskamp rolls crusher. The rolls crusher was also cleaned with compressed air after each sample. All quality control was visual at both crushing stages and no testing for screen sizing was done at either stage. After the second crushing stage, the nominal %-in sample was split through a Jones type splitter to approximately 500 g, and placed in an aluminum pan, to be taken to the drying oven. Each pan was well labelled, with the contained sample number recorded on masking tape, attached to the pan.
Drying was conducted in a block building which has two propane space heaters, manufactured by Desa, Inc. The samples were placed upon drying racks, still in the aluminum pans, and a heater was activated. Once dry, the pans and contained samples were returned to the sample preparation area for pulverizing.
Pulverizing was conducted upon the %-in samples using one of four Bico disc pulverisers. The 500 g sample was pulverized to nominal 80 mesh, with visual and tactile inspection performed upon each sample after pulverizing to ensure that the nominal 80 mesh size was achieved. No screen size testing is done upon the pulverized samples on a regular basis. The pulverisers were cleaned with compressed air after each sample was processed. Once pulverising was completed, each 500 g sample was split into two sub-samples, with a maximum of 200 g kept for each sub sample. These two sub-samples were packaged in Kraft type envelopes; one 200 g sample was sent to the shipping area to be boxed and prepared for shipping to the ALS laboratory in Vancouver, BC, Canada. The remaining 200 g sample was stored in archive storage, as a reserve sample, should more analysis be required. All pulps were labelled with the sample number, which has all drill hole and interval data included, as well as the date the sample was drilled.
The sample preparation methods used from 2003 to 2007 are adequate for generating assay data for use in resource estimation. (SRK 2012)
Pincock, Allen Holt had reviewed the process and made several recommendations to improve reliability which ultimately led to their NI 43-101 compliant Technical Resource Report issued in January 2010.
| 11.1.4 | MMC Sample Preparation Procedures (pre-2003) |
Prior to 2003, all sample preparations were carried out by ALS laboratory using the following procedures:
Coarse crushing of rock chip and drill samples to 70 % nominal -6 mm was used if the material received was too coarse for introduction into the pulverizing mill, and as a preliminary step before
Report Date: April 30, 2013
Effective Date: March 18, 2013
fine crushing of larger samples. Fine crushing of rock chip and drill samples to 70 % -2 mm or better. Samples were split sample using a riffle splitter. The split sample was pulverized using a "flying disk" or "ring and puck" style grinding mills. Unless otherwise indicated, all pulverizing material was at least 85 % pulverized to 75 micron (200 mesh) or better.
These sample preparation procedures are adequate for generating assay data to be used in resource estimation. (SRK 2012)
| 11.2.1 | Quality Assurance/Quality Control (QA/QC) |
11.2.1.1 | Historical QA/QC Procedures |
PAH reviewed the QA/QC procedures implemented throughout the life of the project and concluded that they were insufficient relative to current industry standards of practice. As a result of these inadequate procedures, PAH was not able to classify its January 2010 resource estimate for Sierra Mojada as anything higher than an inferred mineral resource.
To resolve this issue, MMC and PAH developed and executed a re-sampling and assaying program to estimate the type, frequency, and magnitude of assay sample errors in the historical drill hole database for the Sierra Mojada Project. This plan was meant as a substitute of the QA/QC program that would resolve PAH's doubts about the validity of the Sierra Mojada assay data. Based on the execution of the program and a detailed review of the results, PAH concluded that the drill hole assay data for channel and core samples used in its January 2010 resource estimate were of sufficient quality to support measured and indicated resources. As a caveat, PAH notes that converting inferred resources to measured and indicated is contingent upon other factors not related to data quality (McMahon, 2010). SRK has reviewed the results of the additional sampling program carried out by PAH and concurs with their conclusions.
In 2010 a QA/QC program of certified standards, blanks and duplicates were instituted to monitor the integrity of all drilling assay results. Two sets of QA/QC procedures were used by Metalline since the time of a QA/QC review performed by PAH (McMahon, 2010) on pre-March 2008 drill hole assay data:
The first set of QAQC procedures was used for the submission of pulp samples for analysis by a certified laboratory. These pulps had previously been prepared and analyzed by the Metalline on- site laboratory facility as part of a pre-selection process. All samples for 2008 and 2009 drill campaigns and all 2010 drilled prior to August 2010 followed these procedures; and
The second set of QAQC procedures applies to samples sent directly to ALS for sample preparation and analysis. This procedure has been in place since August 2010 and includes drill holes submitted since this time. (SRK 2012)
Report Date: April 30, 2013
Effective Date: March 18, 2013
| 11.2.1.2 | Pulp Submission QAQC Procedures |
After sample preparation all samples selected for certified laboratory analysis were located and placed in boxes ready for shipment. The same pulp envelope used for the original analysis was selected for submission to the external laboratory. Each sample box contained between 60 and 120 pulp samples, including control samples. The QA/QC control samples submitted in each box consisted of:
A minimum of three standard samples were submitted, normally at least one of each of the three certified standards prepared for Metalline Mining by CDN Laboratories;
At least one blank pulp sample and often two;
At least one, and generally two, field duplicate samples (% or 1A core samples) prepared but not analyzed by Metalline onsite during 2010. In general % core samples were submitted so as to leave witness core in the core box, however in broken zones the complete remaining half core was selected for submission; and
At least one and generally two pulp duplicate samples, with splits made from the original pulp sample to be selected within the same box.(SRK 2012)
Information on the reference standards is provided in Appendix C.
| 11.2.1.3 | Core Submission QAQC Procedures |
Control samples were inserted approximately every 10 core samples. In addition, after every 25 core samples the following additional samples were inserted:
A minimum of one certified standard is included;
A minimum of one field duplicate sample is included; and
Normally one blank sample is included and occasionally blanks are preferentially inserted in a mineralized sequence outside of the normal 25 sample range.
In November 2010, the system was modified slightly to ensure that controls samples were inserted at a standard interval of every 10 sample numbers. (SRK 2012)
This procedure is still in place.
| 11.2.1.4 | Reference Standards |
JDS noted that Metalline/Silver Bull staff inserted certified reference standards as a quality check on the laboratory accuracy. The reference standards were prepared by CDN Resource Laboratories Ltd. which specializes in preparing site specific certified standards. The three
Report Date: April 30, 2013
Effective Date: March 18, 2013
standards prepared are identified as K10001, K10002 and K10003. The characteristics of the standards are summarized in Appendix C.
• Reference Standard K10001
A total of 245 standards were inserted into the sample stream and only one was reported below the reference 2SD's. All samples were within 3 SD's of the reference mean
Report Date: April 30, 2013
Effective Date: March 18, 2013
• Reference Standard K10002
A total of 223 samples of reference standard K10002 were used, with 9 samples outside of the standards report 2SD limits. Two of these were just above 3SD and will require follow-up checks by Silver Bull. The ALS-Chemex sample mean is also slightly higher than the reference mean by about 0.8g/t Ag but is not considered to have an impact on the resource estimation.
Report Date: April 30, 2013
Effective Date: March 18, 2013
• Reference Standard K10003
There were 199 samples of reference standard K10003 inserted into the sample stream. It is clear from Figure 11-3 that the ALS-Chemex mean is about 3.5g/t tonne higher than the reference standard mean. Even with this offset, all but three samples fell within 3SD. Silver Bull Resources will need to follow-up on the cause of the lab bias which is quite consistent in this standard.
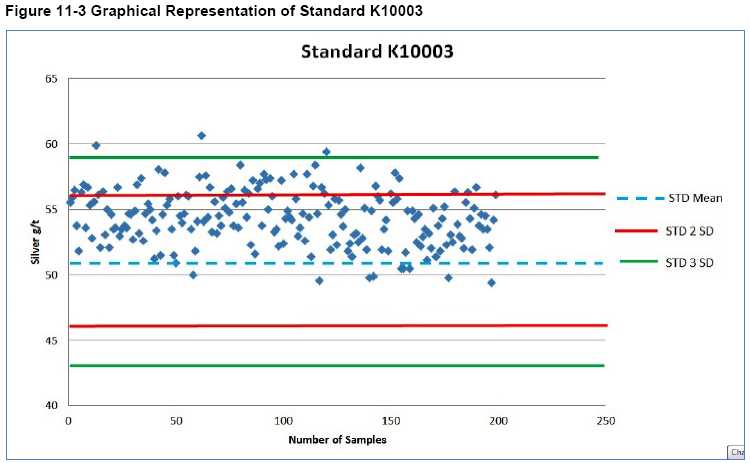
Blank samples were used to check for laboratory sample preparation issues and accuracy. These samples consisted of material that contained low but not below detection limits grades of elements to be analyzed. Four types of blank sample material were used by Metalline:
Pulverized blank material obtained from either rock samples or crushed material from the Penoles Dolomita mining operation. Pulverized blank samples were prepared and analyzed at the Metalline laboratory to confirm their blank nature;
Blank core samples were either % or ! core samples of barren or low grade intervals selected from old drill core;
Report Date: April 30, 2013
Effective Date: March 18, 2013
Blank crushed samples were typically prepared form RC samples or blank rock samples, coarse rejects are generally used for this purpose; and
Blank rock samples were prepared from rock samples, with part of the original sample analyzed by the Metalline laboratory when it was operating, to confirm the blank nature of the material.
Discrepancies with blank samples were resolved by re-assaying pulps or coarse rejects or both if material is available as well as selected samples in the nearby sample intervals.
Coarse blank material for the 2011 and 2012 drill holes were inserted at a rate of one in 40 samples. The "blank" sample came from drill core intercepts from previous drill campaigns with low level or null concentrations of silver, zinc, lead and copper. The problem with this methodology is that there is not a consistent grade range for the "blank" material selected.
There also is a lingering doubt as to just how inert some of the selected "blank" material is. Five samples returned values above 5 ppm silver. Of those, two were mislabeled standards. From the period of July 7 to July 20, 2011, fourteen blanks retuned values greater than 3 g/t including three samples that returned values above 5 g/t that appear to indicate a problem with the assay preparation laboratory.
As of drill hole B11099 onwards a different blank sample has been used and will be consistently used going forward. The sample BLANCO-DOL comes from a nearby dolomite mine. (SRK 2012)
JDS reviewed the blanks used in the drill program subsequent to the last resource report and found that 538 blanks had been inserted into the sample stream. Of these, only 9 samples returned greater than 0.6g/t with one reaching 1.8g/t Ag. The vast majority were at the detection limit of 0.1 g/t Ag.
Report Date: April 30, 2013
Effective Date: March 18, 2013
Duplicates are used to check on sample homogeneity and laboratory precision. They were also used to detect issues associated with sample preparation. Silver Bull submitted both pulp and coarse duplicate samples. Duplicate samples were submitted with a different sample number to that used for the original sample. Discrepancies and inconsistencies with duplicate samples were resolved by re-assaying pulp, reject or both. (SRK 2012)
Pulp samples submitted to a second certified laboratory were also used as a test of precision and accuracy. Pulp duplicates were submitted with the pulp samples, previously analyzed by the Metalline laboratory. They were also submitted after results were been received from ALS as a check on laboratory precision. (SRK 2012)
No pulp duplicates were run since the last resource estimate.
Field duplicate samples are set at every 20th sample and are bracketed by either a blank or a standard.
Report Date: April 30, 2013
Effective Date: March 18, 2013
Field duplicates are duplicate core samples taken from selected core interval initial % core was split into two % core samples, one of which was submitted as the original sample and one of which was submitted as the duplicate sample.
Nine hundred and twenty-eight field duplicate samples were taken as part of the QA/QC program for the 2012 drilling post-the SRK 2012 Resource report. A total of 124 samples assayed below detection limit of 0.2g/t with another 490 reporting less than 5g/t silver.
Silver and zinc results were analyzed for Relative Difference using the following formula:
| % Diff = | | xi - x2 | | x 100 | | |
| | | (x1+x2)/2 | | | | |
Of the remaining 314 samples assaying greater than 5g/t, ninety-nine samples displayed a relative difference greater than 20% (Figure 11-5).
Report Date: April 30, 2013
Effective Date: March 18, 2013
The results of the duplicate samples are acceptable given that the silver mineralization is to some extent fracture controlled and nuggety in nature.
For zinc, of the 938 samples four samples were below detection limit in both instances., Out of the remaining nine hundred and thirty-four pairs, 232 samples showed a Relative Difference >20%. The majority of those samples are below ~0.70% Zn (Figure 11-6).
In summary, Silver Bull has an Standard, Blank, or Field Duplicate QA/QC insertion rate of about every one in nine samples. JDS is of the opinion that the sample preparation, security and analysis meets industry standards and is adequate to support a mineral resource estimate as defined under NI 43-101.
Report Date: April 30, 2013
Effective Date: March 18, 2013
| 11.3 | Termite/Long Hole Comparison |
SRK Consulting (Canada) Inc. (SRK) was engaged by Silver Bull Resources Inc. (Silver Bull) to carry out an analysis of the recently completed diamond drilling (Termite drilling) at the Sierra Mojada Project in Mexico. Specifically, SRK was asked to evaluate if the Termite drilling (TH) could better define and document the apparent bias that appears to exist between Long Holes (LH) and surface diamond drill holes (DH) on the property. The analysis was carried out on 206 TH and LH drilled in the same general area. The comparison was carried out by Dr. Gilles Arseneau and Mr. Michael Johnson of SRK. This section is from that summary memo provided by Silver Bull Resources.
The Termite drill holes were all collared from underground platforms and are generally situated in areas with high concentration of LH. As was expected, comparing Termite holes and Long Holes on an assay to assay basis was not very successful (Figure 11-6). While there was general agreement between the two types of drilling, significant differences existed at the one to two metre assay intervals.
Report Date: April 30, 2013
Effective Date: March 18, 2013
For this reason, SRK decided to compare the average grade of TH and LH over larger volumes starting with 5X5X5m blocks, representing the block size used in the latest resource estimate. For this comparison, the grade of all capped composites that were within a block volume from both types of drill holes were averaged and compared on quartile/quartile (QQ) plots. The QQ comparison for zinc appeared to indicate that in general the distribution of LH assays is very similar to the distribution of LH assays (Figure 11-7).
Figure 11-8: Comparison of Zinc for LH and TH
However, silver grades in the LH appeared to be generally higher than in the TH, by about 25% (Figure 11-8 on the following page).
SRK cautions that the comparison is based on a small number of blocks, less than 300, and that the differences noted between LH and TH could be an artifact of the data.
SRK also compared the LH and TH using different block sizes from 10X10X10m to 20X20X10m and 50X25X10m. SRK noted that while the differences between LH and TH seemed to improve for silver the opposite was true for zinc. The apparent bias for silver dropped from 25% at a 5m blocks to less than 10% for the 20X20X10m blocks, however the zinc bias increased to about 30% for the 20X20X10m blocks (Figure 11-9).
Report Date: April 30, 2013
Effective Date: March 18, 2013
Report Date: April 30, 2013
Effective Date: March 18, 2013
Because of the difficulties with well-informed block to block comparisons and because of the small number of blocks available for comparison, SRK decided to estimate block grades using LH, TH and DH data and then compare only those blocks that had been estimated by the three types of data.
The blocks were estimated from a minimum of five and a maximum of 18 composites. The search was set to 90m along strike, 70m across strike and 50m down dip. The estimation resulted in over 10,000 blocks being estimated by the three data types. As presented in the previous study, the block estimated silver grades from LH assays on the QQ plot were on average twice the block estimated silver grades from DH assays (Figure 11-10).
Report Date: April 30, 2013
Effective Date: March 18, 2013
However the comparison of LH and TH estimated silver block grades showed a very good agreement for grades lower than 125g/t Ag (Figure 11-11).
A comparison of estimated block grades for zinc from LH and TH assays showed a generally good agreement for grades lower than 6% (Figure 11-12).
Report Date: April 30, 2013
Effective Date: March 18, 2013
Report Date: April 30, 2013
Effective Date: March 18, 2013
To further evaluate the differences between LH and TH, SRK evaluated the two data types by individual rock codes. The results of the analyses indicate that the differences between LH and TH are not consistent over the entire Sierra Mojada mineralization. Silver in the TH seemed to be higher than in the LH for rock 50 (above 70g/t) while the opposite is true for rock code 10. Correlations for silver were generally good for all rock types at lower grades (below 70g/t).
Zinc in the TH correlates well with the LH for grades lower than 7% in rock codes 20 and 50 see Table 11-1.
Report Date: April 30, 2013
Effective Date: March 18, 2013
In order to evaluate the lateral extent of the high grade zone explored by underground workings, SRK compared all LH and TH assays normalized to the drill collar (i.e. all assay data were averaged based on their distance from the collar at 2m increments).
Table 11-2 and Table 11-3 show the LH and TH average grades at specified distance from the collar. As can be seen from the tables, LH silver grade drops by about 35% over the first 20m of drilling and for the same distance TH silver grade drops by 60%. Similar decrease in grade is noted for zinc in rock code 20 (Table 11-4).
The grade appears to drop faster in the TH than in the LH, this could be an indication of down hole contamination for the LH assays (higher grades near the drill collars are being slightly smeared down the hole or being over sampled) (Figure 11-12).
Report Date: April 30, 2013
Effective Date: March 18, 2013
Report Date: April 30, 2013
Effective Date: March 18, 2013
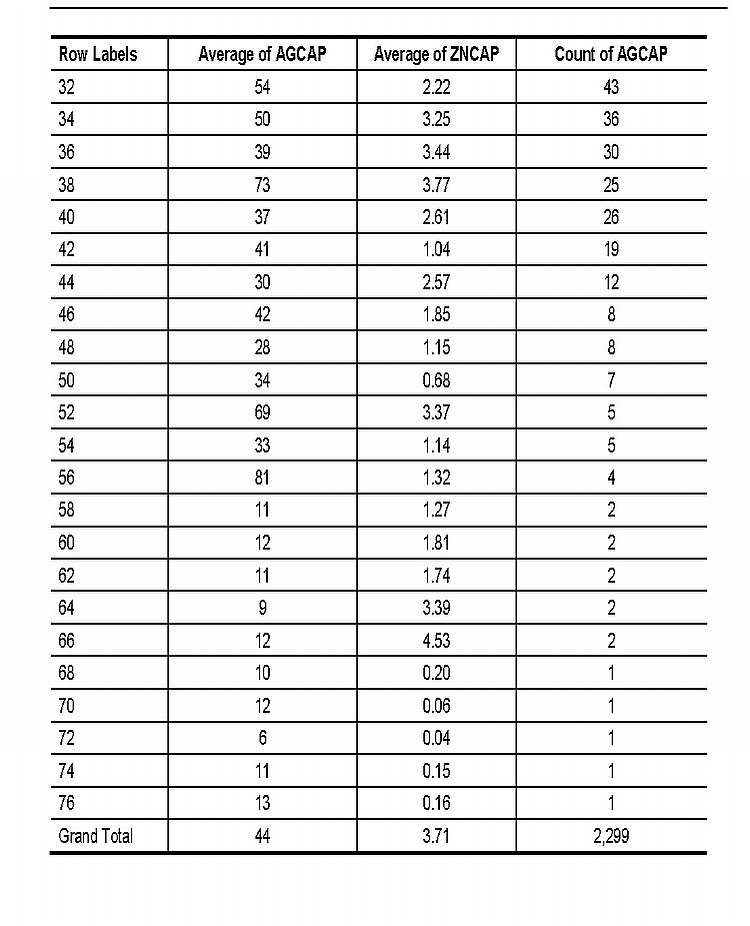
Report Date: April 30, 2013
Effective Date: March 18, 2013
Report Date: April 30, 2013
Effective Date: March 18, 2013
| 11.3.3 | Twin Hole Program Conclusions |
Overall, the exercise indicates that the Long Hole silver assay data are somewhat biased on the high side for the higher grades when compared to assays from Termite holes. The bias seems to be restricted to grade above 70 g/t or 100 g/t depending on the domain or rock code compared. Zinc grades above 7% should be restricted to 20m in rock codes 20 and 50
SRK recommended that special care be taken when using LH data in resource estimation and that a restriction be placed on high grade in the Long Holes. Initial findings from the analysis of the variation of grade with depth of drilling indicate that the high grade drops relatively quickly within 20 m of collars. SRK recommended that estimates from the high grades in the underground long holes should be limited to roughly 20m distance from underground workings.
The overall impact on the resource grades is anticipated to have a positive effect as the database contains a total of 2,345 long holes which are primarily within the tightly constrained high grade wireframes provided by Silver Bull. Tonnage is anticipated to increase as well as previously estimated blocks that fell below the SRK 2012 report cut-off grade could be increased.
Report Date: April 30, 2013
Effective Date: March 18, 2013
In addition to the data verification carried out by PAH; Nilsson; and SRK as part of the previous technical reports for Sierra Mojada, JDS has carried out data review and validation since becoming involved in July 2010. Data verification for drilling since the last SRK report has been undertaken by JDS. A total of 32 surface diamond core holes were added after the July 2012 report cut-off date, along with the 206 underground diamond core holes of the twin program discussed in the previously.
At random times and sites during the past three years, JDS has selected holes to check against hardcopy notes, spread sheet information and the database. Collars were also located in the field and check by hand-held GPS during these visits. JDS found no issues that would impact the resource estimation process.
PAH's initial review of downhole survey information indicated several issues relating to improper interpretation and processing of the survey data. To mitigate these issues PAH and MMC compiled all available survey data. SRK reviewed the digital downhole data and noted some minor data entry errors with the Long Hole database. These errors are not considered to be material to the resource estimation because of the relative short length of the long holes, on average less than 15 m. (SRK 2012)
Silver Bull audited the database and any survey discrepancies were checked by the on-staff surveyor. Edits were made to the database and all corrections audited by JDS.
Assay data were provided by MMC in the digital drill hole database as well as scanned images of assay certificates from ALS. PAH compared the digital database to the certificates for approximately 5% of the samples used to estimate resources at Sierra Mojada. No material discrepancies were noted.
Nilsson checked a total of 519 assay intervals against the ALS certificates. No errors were found. These samples represent 4.2% of the 2010 core drilling and 5.7% of the intervals used in the resource model
SRK downloaded all available data from ALS and compared the digital database supplied by Silver Bull against original assay data provided by ALS. A total of 37,100 assays were checked against the digital database, about 23% of the total assay population and while some discrepancies were observed most of the errors were considered not material and most were easily explained. A few samples that did not agree with the assay certificates were not for the resource estimate. (SRK 2012)
Report Date: April 30, 2013
Effective Date: March 18, 2013
JDS has had access to paper copies of original assay sheets and copies of new files were emailed directly to the author by ALS-Chemex. No errors were noted that would impact the resource estimate.
| 12.4 | Channel Samples, Collars, and Underground Workings |
Additional channel samples were taken in 2012 for the purpose of providing metallurgical test material. The methodology of the sample collection has been described earlier. There has been no additional survey work done on void delineation and this section summarizes the previous work.
Three dimensional locations of channel samples ("CH"), underground drill holes and surveyed underground workings were supplied by Silver Bull. SRK imported these data into Gems® software, which has the capability of displaying such data in three dimensions.
The channel samples and underground drill hole collars were visually compared against the underground workings. A number of inconsistencies were noted. Namely, some channel samples and collars were located several meters away from the surveyed underground workings. This implies erroneous survey data for either the channel sample/collar location or the underground workings. These data were excluded from the dataset prior to estimation. In areas where channel samples had been collected but no underground workings seem to exists in the Silver Bull survey database, SRK generated wireframes to capture the additional mined out areas (Figure 12.1) SRK 2012
JDS believes that the wireframes for the mined out areas need to be reassessed as there appear to be "Mobius strips" or short sections of drifts that are ribbons with no volume. Every effort has been made to ensure that the mined material has been adequately accounted for.
Report Date: April 30, 2013
Effective Date: March 18, 2013
| 13.0 | Mineral Processing and Metallurgical Testing |
This resource technical report summarizes and provides information on the metallurgical work that has been performed on the Sierra Mojada project through February 2013. This work included several activities which were:
| ● | Review of the metallurgical work previously performed on Sierra Mojada ores. |
| ● | Analysis of the program and current test work results. |
| ● | Incorporation of all of the results into a preliminary process flow diagram. |
| ● | Developing preliminary process operating and capital costs. |
| ● | Preparing to incorporate the information into a PEA level project study. |
This report is a discussion on past and recent metallurgical test programs, an analysis of the impacts to process options and costs, and a brief presentation on a proposed processing facility.
The main ore bodies identified at Sierra Mojada are the primary silver deposits and the primary zinc deposits.
The silver deposits can be broken down further into three distinct silver deposits (see Figure 131).
The zinc deposits can also be broken down into two deposit types (see Figure 13-2).
The current metallurgical program looks at each of the deposits separately, in order to obtain an understanding of the process parameters for each ore type. Process flow sheets have been developed to handle all of the silver ore types in one flow sheet and zinc deposits in a second flow sheet, with an understanding that one of the flow sheets may be converted to the other flow sheet if a mine plan can be developed for first mining the silver deposits and then mining the zinc deposits
Report Date: April 30, 2013
Effective Date: March 18, 2013
Report Date: April 30, 2013
Effective Date: March 18, 2013
The test work has occurred over several phases and in several mineral processing facilities over the last few years. Most recently the metallurgical work has been performed to an accuracy that satisfies the needs of a PEA Level Study
| 13.2.1 | Mountain States R&D- Silver Recoveries Tests |
Test work was initiated on Sierra Mojada ores in 2010 by Silver Bull at Mountain States Research and Development International, Inc. southeast of Tucson, Arizona. Three samples were taken from a trench, which was excavated along the surface of the Shallow Silver deposit (see Figure 13- 3).
The geology and sample location from the trench are shown above. Of the three metallurgical samples taken only samples Met Sample 1 and Met Sample 3 were tested, no cyanidation test work was performed on Met Sample 2 due to high plumbo-jarosite content. Met Sample 1 was later composited into 'Compol' and Met Sample 3 was composited into 'Compo2'.
Mountain States performed two series of tests on the Compol and Compo2 samples. The first series looked at a standard cyanide leach bottle roll test and compared grind size to silver recovery. The second series of tests looked at increasing cyanide concentrations in the leach solution versus the silver recovery. The test parameters and the results are shown in Tables 13-1 and 13-2, respectively.
Report Date: April 30, 2013
Effective Date: March 18, 2013
These early tests clearly showed cyanide leaching to recover the Sierra Mojada silver was effective and the influence of grind size and cyanide strength on the silver recovery was evident.
From this first test program a more detailed test program for the silver ores was developed. This program is shown in the following table, Table 13-3.
Report Date: April 30, 2013
Effective Date: March 18, 2013
In addition, samples from the zinc deposits were taken and a zinc recovery program was also developed.
The Mountain States work was subsequently determined to have been on non-representative samples. Silver Bull rejected the test work conclusions and developed a more comprehensive and representative program.
Report Date: April 30, 2013
Effective Date: March 18, 2013
| 13.2.2 | Kappes Cassidy and Associates |
| 13.2.2.1 | Silver Recoveries Tests |
Testing on the silver ore at Sierra Mojada has been conducted by Kappes, Cassidy and Associates (KCA), Reno, Nevada in 2011. Work has focused on cyanide leach recovery of the silver using "Bottle Roll" tests to simulate an agitation leach system common on many mine sites. Samples have been taken separately from drill core, mineralized outcrop, and trenches from the "Centenario", "Fronteriza" and "Shallow Silver" Zones of the deposit and have been crushed and mixed to create either a "composite" sample representative of each of the 3 zones, or a series of composite samples based on the silver grade for each of the three zones.
KCA began their test work by performing diagnostic leach test work on 5 composites from the Shallow Silver Zone and 5 composites on the North Shallow Silver Zone. Table 13-4 lists the results of this test work and Figure 13-4 shows the results graphically.
Report Date: April 30, 2013
Effective Date: March 18, 2013
Report Date: April 30, 2013
Effective Date: March 18, 2013
From these results it is apparent that the Sierra Mojada Shallow Silver Zone ores are amenable to direct cyanide leaching.
The information from the diagnostic leach tests at various silver head grades provides insight as to the relationship between silver recovery and silver head grade. Figure 13-5 shows a graphic display of this relationship.
Report Date: April 30, 2013
Effective Date: March 18, 2013
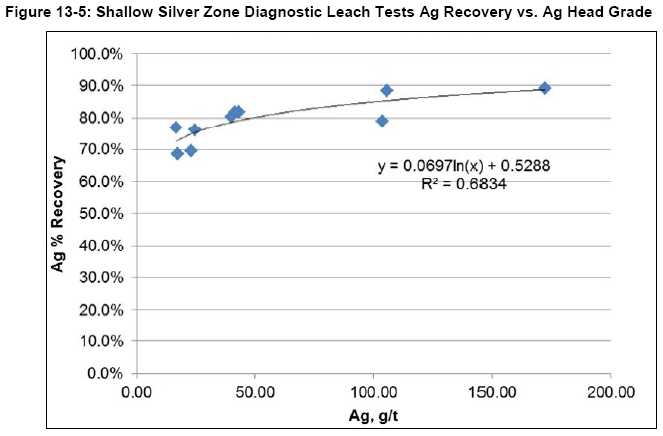
Additional test work on the silver deposits continued at KCA with work focusing on leach solution cyanide strength, pH, lead nitrate addition, grind size, and increased oxygen concentrations.
A summary of the cyanide leach test work results to date is shown in Table 13-5.
Report Date: April 30, 2013
Effective Date: March 18, 2013
KCA preliminary observations from these results include;
| ● | Silver recoveries generally show an increase with higher grade. |
| ● | Silver recovery is somewhat grind size sensitive with finer grinds giving higher recoveries. |
| ● | Varying levels of cyanide consumption (NaCN) are attributed to variable amounts of zinc and copper in the samples. |
| ● | Current target for grind size is 40 microns. |
| ● | Current target for NaCN concentration is 5.0gpl in the leach solution, maintained. |
| ● | Average silver recovery should approach 75% at a grind of 40 microns and a leach solution NaCN concentration of 5.0gpl. |
| 13.2.2.2 | Zinc and Copper Recoveries |
In addition to continuing tests assessing the silver recoveries via cyanidation, studies were also planned to begin in the first quarter of 2013 to confirm the Sulfidization, Acidification, Recycling and Thickening (SART) process and its application at the backend of the leaching circuit. If successful this will allow for the recycling of the cyanide in the silver leaching circuit -lowering cyanide costs, as well as potentially recovering a portion of the zinc and copper observed in the Sierra Mojada silver deposits. The following two tables provide an example of the zinc and copper recoveries being observed in the cyanide leach tests.
The SART process would produce a zinc sulfide concentrate and a copper sulfide concentrate that would be suitable for sale to smelters and providing by-product credits to the project. KCA
Report Date: April 30, 2013
Effective Date: March 18, 2013
produced 40 liters of barren leach solution (pregnant leach solution with the silver removed with zinc dust) for testing at BioteQ in BC, Canada. The SART test work was just getting started at the writing of this report.
| 13.2.3 | Hazen Test Work - Treatment of Zinc |
Hazen Research in Golden, CO, was tasked with looking at the potential for using a pyrometallurgical technique for treating the zinc ores. A process for producing ZnO from steel plants and other metal manufacturing facilities waste byproducts, known as the Waelz Kiln process, was tested at Hazen in 2012.
Hazen received composite samples from both the Red Zinc and White Zinc deposits at Sierra Mojada. This material was tested in one of Hazen's higher temperature kilns at temperatures between 1,100°C and 1,300°C. The process involves mixing into the ore a reducing material, such as carbon or coal, heating the ore mixture to the required temperature, fuming off the Zn, passing the fumed Zn gas to an oxygen atmosphere and cooling the gas, forming a ZnO precipitate.
In the Hazen test facility zinc fuming worked very well with zinc fumed from the ore at greater than 90 percent. However, difficulty in recovering the ZnO as the precipitate was evident as metal accounting for the tests were very poor. Zinc was found to precipitate on the test apparatus wherever the temperature was cool enough for the zinc to precipitate. Table 8 provides a summary of the results from the Hazen test program.
The Waelz Kiln concept was proven to work on the zinc ores. However, difficulties experienced by Hazen to capture the ZnO and difficulties in maintaining the kiln caused the program to be halted.
Report Date: April 30, 2013
Effective Date: March 18, 2013
Report Date: April 30, 2013
Effective Date: March 18, 2013
| 13.2.4 | SGS Lakefield - Separation of Red and White Zinc Ores |
Mineral Services (SGS), in Lakefield, ON, was tasked with developing a physical separation scheme for the Red Zinc and White Zinc ores in 2012. Work has focused on heavy media separation (HMS) and flotation recovery of the zinc minerals hemimorphite (Red Zinc) and smithsonite (White Zinc). Test work using bench scale heavy liquid separation and flotation tests were used to develop possible process parameters for a zinc HMS/flotation circuit. Samples have been taken from dill core and channel samples along the 1.5 kilometer strike length of the "Red Zinc Zone" and "White Zinc Zone" of the deposit. The samples have been crushed and mixed to form a composite sample representative of each of the material types present in the deposit.
The primary focus for the SGS test Work program has been the zinc materials. They have been tasked with finding a method to produce a saleable zinc product from the Red Zinc and White Zinc materials. The SGS program has focused on using Heavy Media Separation and Flotation to produce a concentrate. The following tests and results have been obtained by SGS to date:
| ● | White Zinc (smithsonite) Heavy Media Separation and Flotation is effective and can obtain a 42% Zn Concentrate. The heavy media separation was very effective as roughly 53% of the zinc was recovered in the HMS alone into a concentrate that assayed over 45% Zn. Additional test work to refine the heavy media and flotation recoveries is underway. |
| ● | Flotation results for the White Zinc were also very good, with a best case 40% Zn concentrate being produced while recovering 96.5% of the zinc. |
| ● | Test Work Reagents and Results for the best case test on White Zinc Master Composite are shown below in Tables 13-9 and 13-10. |
| ● | Figure 13-6 shows the Zn recovery versus concentrate Zn grade for the White Zinc best case test. |
Report Date: April 30, 2013
Effective Date: March 18, 2013
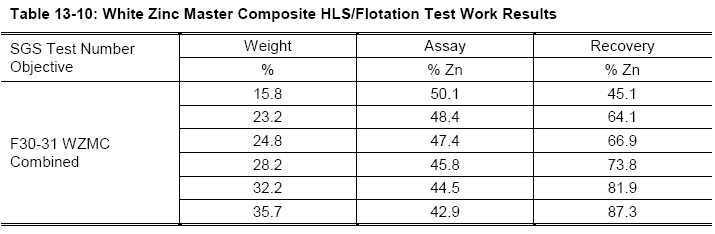
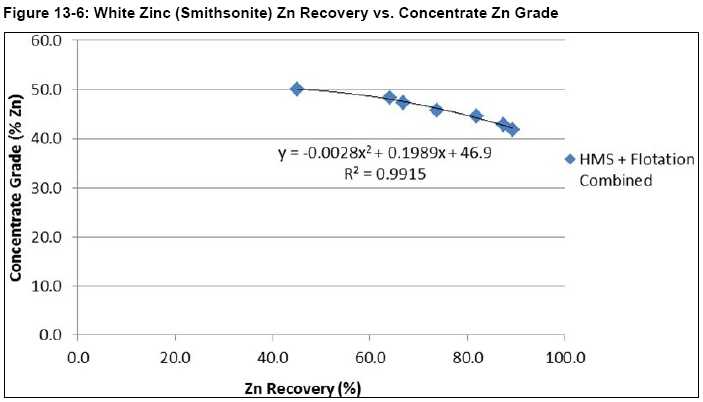
| ● | Red Zinc (hemimorphite) Heavy Media Separation and Flotation has been shown to be a bit more complicated due to slimes (< 38 um particle sizes) generation during grinding. Test work shows that the flotation of the + 38 um material is good with 72.5% of the zinc recovering to a 30% Zn concentrate. |
| ● | Red Zinc has a propensity to slime as the natural grain size of the material is very fine. As received material has been observed to have greater than 20% -38 um material. HMS of this material was somewhat effective as roughly 57% of the zinc was recovered to a concentrate that was above 22% zinc. More test work on HMS of the Red Zinc material should be performed to see if concentration ratios can be improved or if cleaning stages can improve concentrate grades. |
Report Date: April 30, 2013
Effective Date: March 18, 2013
| ● | The slimes performed poorly in flotation test work with only 55% of the zinc reporting to a 22% Zn concentrate. In the SGS test work roughly 45% of the Red Zinc ore ended up in the slimes making slimes mitigation a major concern in future test work. Options to consider include: |
| ● | Stage grinding with screening in between to reduce the amount of fines generation. |
| ● | Utilizing fine bubble flotation cell technology developed specifically for fines/slimes flotation. |
| ● | Sodium silicate addition as an aid in slimes flotation. |
| ● | Flash flotation in the grinding circuit to float material prior to fines generation. |
| ● | Test Work Reagents and Results for the best case test on the Red Zinc High Silver Composite are shown below in Tables 13-11 and 13-12. |
| ● | Figure 13-7 shows the Zn recovery versus concentrate Zn grade for the Red Zinc best case test. |
Report Date: April 30, 2013
Effective Date: March 18, 2013
Additional test work for SGS will include running a series of Dense Media Separation (DMS) tests at small scale to generate pre-concentrate. These tests will replace the HLS test work previously
Report Date: April 30, 2013
Effective Date: March 18, 2013
performed to better simulate an actual production flow sheet. The DMS concentrate should have fewer negative effects on downstream flotation. This test work will be followed by test work to find a way to reject Fe bearing materials, which appears to be the main impurity in the final DMS concentrate.
Test work to improve slimes flotation will also be performed using a Jameson or similar cell which utilizes fine bubble generation.
Based on current test work results the following conclusions about the zinc flotation can be made:
| ● | White Zinc performs very well in a standard flotation scheme. At zinc recovery of 87% a concentrate grade of 43% zinc can be achieved. |
| ● | Red Zinc is more difficult to float than the White Zinc due to the sliming characteristics of the Hemimorphite mineral. |
| ● | Red Zinc test work to date can produce a 30% zinc concentrate at a zinc recovery of 72.5%. |
| ● | Red Zinc is expected to perform better in a fine bubble flotation machine such as a Jameson Cell, specifically designed for slimes mitigation. |
The Sierra Mojada Project will require two distinct flow sheets and process facilities for the silver ores and the zinc ores. The silver ores will utilize cyanide leach technology and the zinc ores will utilize Heavy Media Separation and Flotation. Some of the unit operations can be used in both facilities, such as crushing and grinding. A discussion on how the equipment can be utilized for both process scenarios will be discussed at the end of this section.
Since the silver and zinc ore processing facilities are somewhat distinct, they are discussed separately in this report.
| 13.3.1 | Silver Ore Processing |
A simple flow diagram has been developed and is shown in the following Figure 13-8.
It is envisioned that the silver ores at Sierra Mojada will require a crushing and grinding circuit to produce a particle size P80 of 53 microns to maximize silver recovery and project economics. Following grinding, a cyanide leach and CCD circuit will be utilized with the pregnant leach solutions reporting to a Merrill Crowe silver recovery plant. Once the silver has been recovered, cyanide recovery, as well as, zinc and copper recovery will take place in a SART facility. Tailings from the leach circuit will be detoxified in a cyanide destruct circuit before reporting to a tailings storage facility.
Water will be reclaimed from the tailings storage facility for reuse.
Products produced will include silver dore, zinc sulfide precipitate, and copper sulfide precipitate.
Report Date: April 30, 2013
Effective Date: March 18, 2013
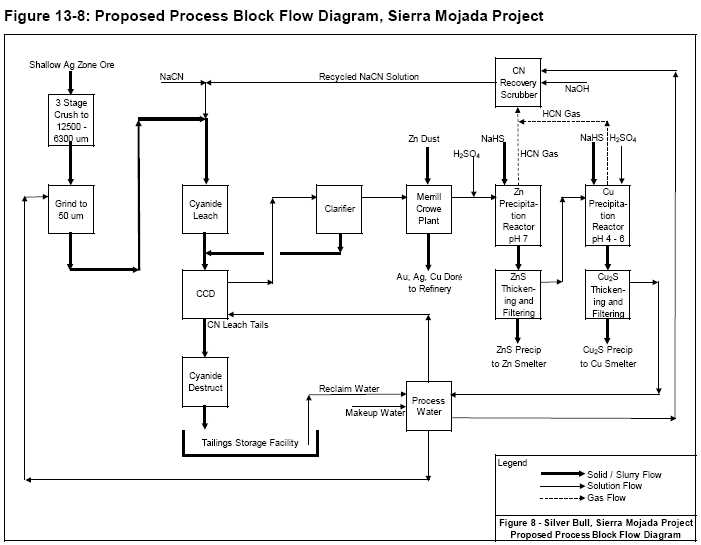
| 13.3.2 | Zinc Ore Processing |
A simple flow diagram has been developed and is shown in the following Figure 13-9.
It is envisioned that the zinc ores at Sierra Mojada will require a crushing circuit to produce a particle size P80 of 3.66mm to feed a dense media separation (DMS) unit with the +48 mesh sink fraction reporting to a rod mill for additional grinding prior to flotation. The final grind size is currently estimated at a P80 of 105 microns which should maximize zinc recovery, minimize slimes production, and maximize project economics. Following grinding, slimes separation will be performed with the slimes portion reporting to a fine bubble flotation cell, such as a Jameson cell. The coarser fraction will report to a standard flotation circuit. Both the slimes and coarse flotation circuits will incorporate one or more cleaning stages to improve the zinc content of the concentrate. Concentrates will be thickened, filtered, and dried followed by loading into train cars for bulk shipment to a zinc refinery. Tailings from the flotation circuit will be thickened before reporting to a tailings storage facility.
Water will be reclaimed from the tailings storage facility for reuse. The products produced will be a Hemimorphite and Smithsonite concentrate.
Report Date: April 30, 2013
Effective Date: March 18, 2013
Report Date: April 30, 2013
Effective Date: March 18, 2013
| 14. | Mineral Resource Estimates |
The following sections detail the methods, processes, and strategies used to calculate the mineral resource estimate for the Sierra Mojada deposit.
A total of 12,771 drill holes, channels samples, RC holes and LH holes were supplied for the Sierra Mojada Project which included 1,372 drill holes (DH), 9,025 channel (CH) samples, 2,345 long holes (LH), and 25 reverse circulation (RC) holes.
The drill hole database was supplied by Silver Bull Resources, Inc. in an electronic format as an EXCEL spreadsheet. This data included surveyed ddh collars, downhole surveys, lithology data, and assay data with down hole from and down hole to intervals in metric units. Figure 14-1 shows a plan view for the data used in the Sierra Mojada mineral resource estimate.
The sample data was then imported into the MSTorqueTM SQL Server Relational database for analysis and modelling with the MineSight™ System.
Report Date: April 30, 2013
Effective Date: March 18, 2013
JDS has provided Silver Bull staff guidance on the resource wire framing and notes that modeling is showing continuous improvement but still needs refinement. Currently there are four resource solids, one mined out voids solid and three surfaces as summarized in Table 14-1.
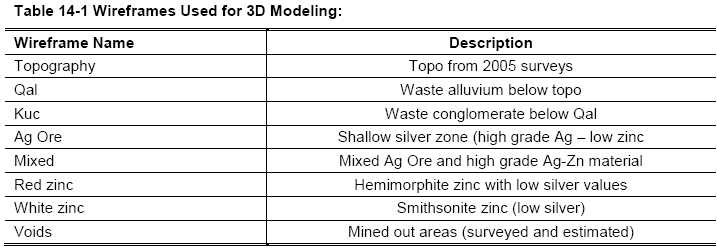
There have been no changes to the three surfaces since the last resource report. As noted in Section 12.4, the wireframes for the mined out areas need to be reassessed as there appear to be "Mobius strips" or short sections of drifts that are ribbons with no volume. Every effort has been made to ensure that the mined material has been adequately accounted for.
The four solids used for this report were given unique rock codes for grade modeling purposes. Wireframe work in 2010 was based upon 100m section windows. In 2011 and early 2012 infill drilling allowed the sectional interpretation to be tightened to 50m sections. For this resource estimate, the provided solids have been modified on 10m level plans to better honour the very tightly spaced channel and long hole sample data accessible from the underground workings.
A 3D view of the solids is shown in Figure 14-2 with a cross section shown in Figure 14-3. It is JDS's opinion that these solids are a better representation of the overall Silver Bull dataset and adequate for the purposes of the resource estimation work.
Previously the resource blocks were coded to the wireframe that contained greater than 50% of the wireframe volume. For the purposes of this report, a partial or percentage method was chosen so that a more accurate estimate of tonnes and grade by zone could be determined. The overlapping configuration of the solids imparts a degree of complexity.
The overlapping of solids is clear in Figure 14-3 and it is JDS opinion that the Ag ore and mixed zones could be simplified and modeled as one zone.
Report Date: April 30, 2013
Effective Date: March 18, 2013
Report Date: April 30, 2013
Effective Date: March 18, 2013
Solids models of the four principal mineralized zones: Ag Ore, Red Zinc, Mixed and White Zinc within the Sierra Mojada deposit was supplied by Silver Bull Resources and these zone solids or domains were then used to constrain the interpolation procedure.
Once the domain solids were created, they were used to code the drill hole assays and composites for subsequent geostatistical analysis. For the purpose of the mineral resource model, the solids were used to constrain the block model by matching composites to those within the zones in a process called geologic matching. This ensures that only composites that lie within a particular zone are used to interpolate the blocks within that zone.
Figures 14-4 through 14-7 show plan views of the sample data of the solids with drill holes for the Ag Ore, Red Zinc, Mixed and White Zinc zones in silver, green, blue and yellow, respectively.
Report Date: April 30, 2013
Effective Date: March 18, 2013
Report Date: April 30, 2013
Effective Date: March 18, 2013
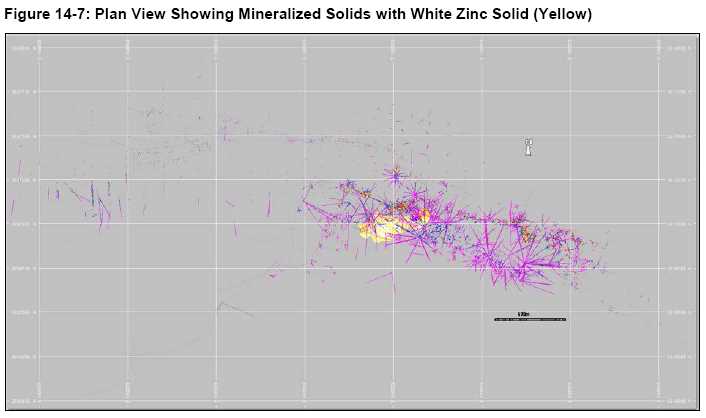
Figure 14-8 shows a portion of the assay database with silver in grams per tonne, zinc, lead and copper as percentages and XTRA1 which is the adjusted numeric coding for the mineralized solids: Ag Ore = 2, Red Zinc = 4, Mixed = 3 and White Zinc = 5.
Simple statistics for silver, zinc lead and copper assays, weighted by assay interval, are shown in Table 14-2.
The assay statistics in Table 14-2 indicate that the silver, zinc, lead and copper data appear to be reasonably distributed. The mean grade is 35.6g/t, 2.69%, 0.21% and 0.04% for silver, zinc, lead and copper within the ore zones, respectively.
All have a relatively high coefficient of variation (CV) ranging from 2.27 to 4.48. This indicates a high scatter of the raw data values. The coefficient of variation is defined as CV = o/m (standard deviation/mean), and represents a measure of variability that is unit-independent. This is a variability index that can be used to compare different and unrelated distributions.
Report Date: April 30, 2013
Effective Date: March 18, 2013
The topography was obtained from a number of files with both contours and digital solid surfaces. The solids and contours are in good agreement with the drill hole collar data and are sufficiently accurate to be used as the upper bounding surface of the deposit. Figures 14-9 and 14-10 show the DTM solid of the topography and the gridded surface model, respectively.
Report Date: April 30, 2013
Effective Date: March 18, 2013
Report Date: April 30, 2013
Effective Date: March 18, 2013
Figure 14-11 is a histogram showing the distribution of sample lengths in the assay database. It was determined that a 1.0m composite length minimizes the smoothing of the grades but also reduces the influence of typically narrow, very high grade samples. Figure 14-12 indicates that 1.0m appears to be the overall optimal interval length from the standpoint of regularization.
Table 14-3 shows the basic statistics for the 1.0m composites for silver, zinc, lead and copper with box plots for each shown in Figures 14-12 and 14-15.
The mean grades of the composites are markedly similar to those of the assay data. The CV's within the High Grade Silver zones remain relatively high however there is much less variability within the Mixed, White Zinc and Red Zinc (especially within the zinc grades)
Summary statistics are evaluated using a series of boxplots; these boxplots compare the individual zone domains as shown in Figures 14-12 through 14-15. There are differences between the individual zones, and these typically show higher metal content compared to the surrounding samples. Note the variability between some of the individual zones.
The High Grade Silver (Code 2) zone does in fact demonstrate high grade silver values, moderate lead, low zinc and most of the copper grades. The Red Zinc (Code 4) zone shows moderate silver, high zinc, moderate lead and negligible copper grades. The White Zinc (Code 5) zone contributes with high zinc and moderate silver grades but much else. The Mixed (Code 3) zone is relatively high in silver values, high in zinc, high in lead and low in copper.
Report Date: April 30, 2013
Effective Date: March 18, 2013
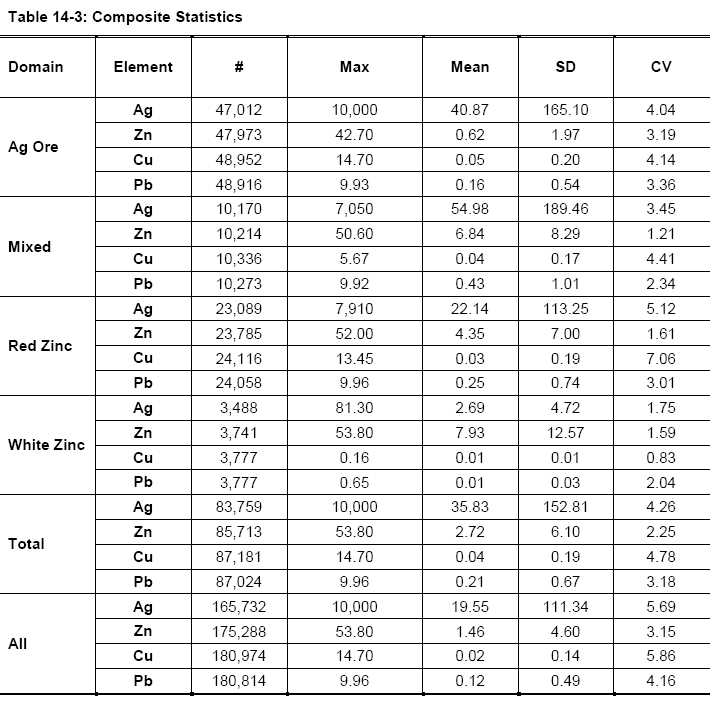
Report Date: April 30, 2013
Effective Date: March 18, 2013
Report Date: April 30, 2013
Effective Date: March 18, 2013
Report Date: April 30, 2013
Effective Date: March 18, 2013
In order to address the outlier values, it is recommended that a method be used to limit their influence, as opposed to capping the silver, zinc, lead and copper composites. Construction of probability plots show breaks which indicate multiple populations, as shown in Figures 14-16 through 14-19 for each of silver, zinc, lead and copper, respectively and for the High Grade Ag Zone as an example. In addition, probability plots were also analysed for the Red Zinc, Mixed and White Zinc Zones. Table 14-4 shows the thresholds chosen based on the probability plots for grade limiting for each metal and each zone respectively. It is important to note the method used for this study is not to cut out the high-grade outliers but, instead, to limit their influence. It was determined that the distance at which to limit grades greater than the outlier cut-off should be set at 20m or two block lengths would be prudent and conservative. In other words, composite grades greater than the threshold amounts would not be used in the estimation of blocks if those high-grade composites were outside the respective radius of that block.
The number of composites affected is from the 95th to the 99th percentile whilst the amount of metal lost is in the range of 1% which is relatively small. This suggests that the deposit is robust and that the very high grades are localized. In addition, the nearest neighbor models show a relatively good correlation to the inverse distance and kriged models which demonstrates that the high grades are not being smeared and not contributing to any over-estimation resulting from over contribution of the high grades.
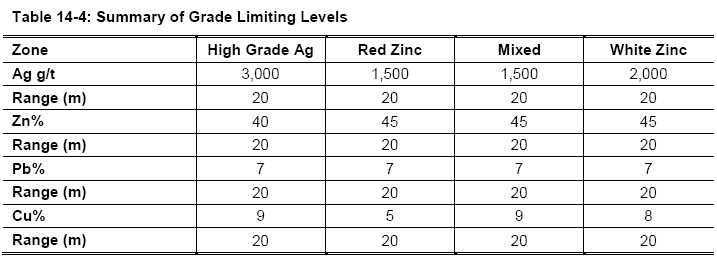
Report Date: April 30, 2013
Effective Date: March 18, 2013
Report Date: April 30, 2013
Effective Date: March 18, 2013
Report Date: April 30, 2013
Effective Date: March 18, 2013
The bulk densities used for the tonnage calculations for the resource estimate were based on approximately 3,500 samples of various rock types. For the ore zones, Table 14-20 shows the respective SG's used. The SG values were assigned on a block by block basis depending upon which ore zone, by majority.
| 14.9 | Block Model Definition |
The block model is orthogonal and non-rotated, reflecting the orientation of the deposit. Figure 14-20 shows the dimensions and Figure 14-21 shows the position and orientation of the block model used for this study. The chosen block size was 10x10x5m to roughly reflect the available drill hole spacing and to adequately discretize the deposit.
Report Date: April 30, 2013
Effective Date: March 18, 2013
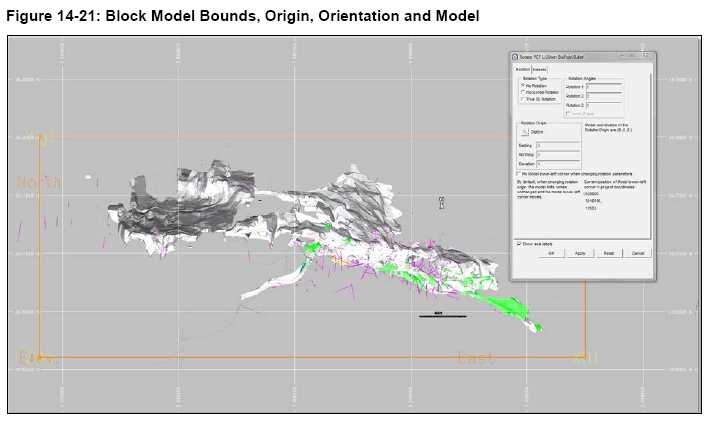
There has been extensive historic underground mining activity that must be accounted for and extracted from the resources. Figure 14-22 shows a plan view of the known historic workings. These volumes have been coded into the block model and their partial contribution to each block accounted for. Overlaps and erroneous surfaces have been identified however it is of the opinion of the author and previous reviewers that these openings are relatively accurate and adequate for estimation purposes.
The degree of spatial variability and continuity in a mineral deposit depend on both the distance and direction between points of comparison. Typically, the variability between samples is proportionate to the distance between samples. If the variability is related to the direction of comparison, then the deposit is said to exhibit anisotropic tendencies which can be summarized by an ellipse fitted to the ranges in the different directions. The semi-variogram is a common function used to measure the spatial variability within a deposit.
The components of the variogram include the nugget, the sill, and the range. Often samples compared over very short distances (including samples from the same location) show some degree of variability. As a result, the curve of the variogram often begins at a point on the y-axis above the origin; this point is called the nugget. The nugget is a measure of not only the natural variability of the data over very short distances, but also a measure of the variability which can be introduced due to errors during sample collection, preparation, and assaying.
Report Date: April 30, 2013
Effective Date: March 18, 2013

Typically, the amount of variability between samples increases as the distance between the samples increase. Eventually, the degree of variability between samples reaches a constant or maximum value; this is called the sill, and the distance between samples at which this occurs is called the range.
The spatial evaluation of the data was conducted using a correlogram instead of the traditional variogram. The correlogram is normalized to the variance of the data and is less sensitive to outlier values; and generally gives cleaner results.
Correlograms were generated for the distribution of gold in the various areas using the commercial software package Sage 2001© developed by Isaacs & Co. Due to a lack of available information in some areas, sample data from multiple structural zones was combined to generate correlograms. Multidirectional correlograms were generated from composited drill hole samples and the results are summarized in Table 14-6.
Correlograms were generated using relative distances from the trend planes rather than the true sample elevations. This approach essentially flattens out each structural zone during interpolation relative to the defined trend plane.
Report Date: April 30, 2013
Effective Date: March 18, 2013
Report Date: April 30, 2013
Effective Date: March 18, 2013
| 14.12 | Interpolation Parameters |
The block model grades for gold were estimated using ordinary kriging. Estimates were validated using the Hermitian Polynomial Change of Support model (Journel and Huijbregts, 1978), also known as the Discrete Gaussian Correction. The ordinary kriging models were generated with a relatively limited number of composites to match the change of support or Herco (Hermitian correction) grade distribution. This approach reduces the amount of smoothing (also known as averaging) in the model and, while there may be some uncertainty on a localized scale, this approach produces reliable estimates of the potentially recoverable grade and tonnage for the overall deposit. The interpolation parameters are summarized by domain in Table 14-7.
The estimation plan includes the storage of the mineralized zone code and percentage of mineralization. The methodology, referred to frequently as partials, results in a more precise representation of volume and tonnage. Each of zones has the codes and partials stored however an interim step is required to account for the overlaps, volume of intersection and union in order to accurately and sufficiently account the zone volumes accurately.
The resulting block model is shown in plan and section, long section and plan view in Figures 1423 to 14-24.
Report Date: April 30, 2013
Effective Date: March 18, 2013
Report Date: April 30, 2013
Effective Date: March 18, 2013
| 14.13 | Mineral Resource Classification |
The spatial variation pattern incorporated in the variogram and the drill hole spacing can be used to help predict the reliability of estimation for silver metal. (In this deposit where there are several potentially economic metals; silver shows the greatest spatial variation. Hence, silver variation will dominate estimation uncertainty, and ultimately determine optimal drill spacing.) The measure of estimation reliability or uncertainty is expressed by the width of a confidence interval or the confidence limits. Then by knowing how reliably metal content must be estimated to adequately plan, it is possible to calculate the drill hole spacing necessary to achieve the target level of reliability. For instance, indicated resources may be adequate for planning in most pre-feasibility work. For feasibility studies, it is not uncommon to require measured resources to define the production within the payback period and then indicated resources for scheduling beyond payback time.
In the case of the current deposit there is some information available from several domains and the spacing between holes varies from 10 to 50m. Results from this study should be validated against current and future drilling.
| 14.13.1 | Confidence Interval Estimation |
Confidence intervals are intended to estimate the reliability of estimation for different volumes and drill hole spacings. A narrower interval implies a more reliable estimate and attempts should be made to have enough closely spaced holes in the drilling to accurately determine the spatial correlation structure of silver samples less than 10 m apart.
The study is based on the ideas outlined in the next several paragraphs. Using hypothetical regular drill grids and the variograms from the composited drill hole sample data, confidence intervals or limits can be estimated for different drill hole spacings and production periods or equivalent volumes. The confidence limits for 90% relative confidence intervals should be interpreted as follows:
If the limit is given as 8%, then there is a 90 percent chance the actual value (tonnes and grade) of production is within ±8% of the estimated value for a volume equal to that required to produce enough ore tonnage in the specified period (e.g., quarter or year). This means it is unlikely the true value will be more than 8 percent different relative to the estimated value (either high or low) over the given production period.
The method of estimating confidence intervals is an approximate method that has been shown to perform well when the volume being predicted from samples is sufficiently large (Davis, B. M., Some Methods of Producing Interval Estimates for Global and Local Resources, SME Preprint 97-5, 4p.) In this case, the smallest volume where the method would most likely be appropriate is the production from one year. Using these guidelines, an idealized block configured to approximate the volume produced in one month is estimated by ordinary kriging using the idealized grids of samples.
Report Date: April 30, 2013
Effective Date: March 18, 2013
Relative variograms are used in the estimation of the block. (Relative variograms are used rather than ordinary variograms because the standard deviations from the kriging variances are expressed directly in terms of a relative percentage.)
The kriging variances from the ideal blocks and grids are divided by twelve (assuming approximate independence in the production from month to month) to get a variance for yearly ore output. The square root of this kriging variance is then used to construct confidence limits under the assumption of normally distributed errors of estimation. For example, if the kriging variance for a block is D2m then the kriging variance for a year is Qy = Qm/12. The 90 percent confidence limits are then C.L. = ±1.645 x Dy.
The confidence limits for a given production rate are a function of the spatial variation of the data and the sample or drill hole spacing.
| 14.13.2 | Drill Hole Grid Spacing |
For this exercise the drill hole grids tested were 75 x 75 metres, 50 x 50 metres, and 25 x 25 metres.
Further assumptions made for the confidence interval calculations are:
| ● | The variograms are appropriate representations of the spatial variability for presence of mineralization and metal grade. |
| ● | The bulk density for the domains is 2.7. |
| ● | Most of the uncertainty in metal production within veins is due to the fluctuation of metal grades and not to variation in the presence or absence of the unit. |
| ● | A capping grade of around 2,500g/t will be applied to future resource estimates. |
| ● | The possible production rate is 8,500tpd. |
Confidence limits for silver metal production are shown in the figure below. The curves show a graphical representation of how the uncertainty decreases with decreasing drill hole spacing. Based on the current information, yearly estimation uncertainty is very sensitive to the coefficient of variation (CV) or relative standard deviation of the composite data. The CV is influenced by the presence of several outlying or very high composite sample silver grades. When different capping levels are applied to the composite sample data, the CV decreases and corresponding uncertainty curves are generated as shown by the graph. The lowest CV in the graph represents the spatial variation for over 95% of the data.
Report Date: April 30, 2013
Effective Date: March 18, 2013
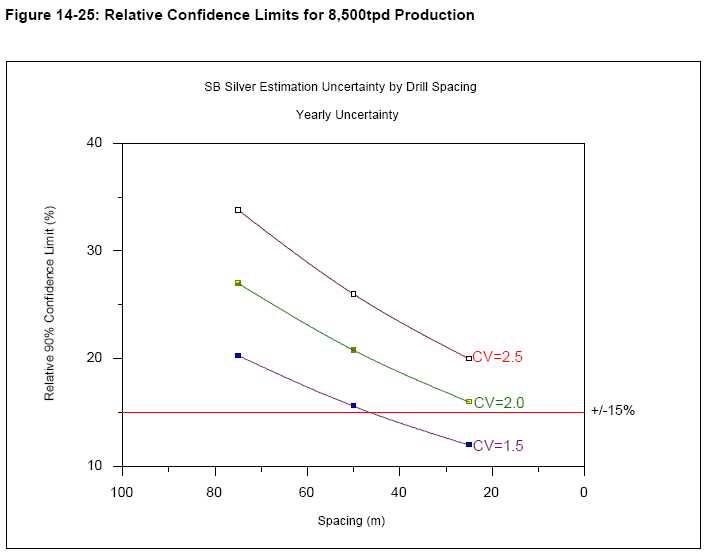
The uncertainty calculation results (CV = 1.5) above are consistent with the indicator variogram results that accompany this report. The indicator variogram ranges show that most of the continuity in grades above 60 g/t is lost before reaching 75 m. This does not mean the ultimate ranges are achieved just that 80 - 90% of the total variation is reached at separation distances in this range.
| 14.13.4 | Classification of Resources |
Classification has been done adhering to CIM Standards as defined below.
| 14.13.4.1 | Mineral Resource |
Mineral Resources are sub-divided, in order of increasing geological confidence, into Inferred, Indicated and Measured categories. An Inferred Mineral Resource has a lower level of confidence than that applied to an Indicated Mineral Resource. An Indicated Mineral Resource has a higher level of confidence than an Inferred Mineral Resource but has a lower level of confidence than a Measured Mineral Resource.
Report Date: April 30, 2013
Effective Date: March 18, 2013
A Mineral Resource is a concentration or occurrence of diamonds, natural solid inorganic material, or natural solid fossilized organic material including base and precious metals, coal, and industrial minerals in or on the Earth's crust in such form and quantity and of such a grade or quality that it has reasonable prospects for economic extraction. The location, quantity, grade, geological characteristics and continuity of a Mineral Resource are known, estimated or interpreted from specific geological evidence and knowledge.
The term Mineral Resource covers mineralization and natural material of intrinsic economic interest which has been identified and estimated through exploration and sampling and within which Mineral Reserves may subsequently be defined by the consideration and application of technical, economic, legal, environmental, socio-economic and governmental factors. The phrase 'reasonable prospects for economic extraction' implies a judgement by the Qualified Person in respect of the technical and economic factors likely to influence the prospect of economic extraction. A Mineral Resource is an inventory of mineralization that under realistically assumed and justifiable technical and economic conditions might become economically extractable. These assumptions must be presented explicitly in both public and technical reports.
| 14.13.4.2 | Indicated Mineral Resource |
An 'Indicated Mineral Resource' is that part of a Mineral Resource for which quantity, grade or quality, densities, shape and physical characteristics can be estimated with a level of confidence sufficient to allow the appropriate application of technical and economic parameters, to support mine planning and evaluation of the economic viability of the deposit. The estimate is based on detailed and reliable exploration and testing information gathered through appropriate techniques from locations such as outcrops, trenches, pits, workings and drill holes that are spaced closely enough for geological and grade continuity to be reasonably assumed.
Mineralization may be classified as an Indicated Mineral Resource by the Qualified Person when the nature, quality, quantity and distribution of data are such as to allow confident interpretation of the geological framework and to reasonably assume the continuity of mineralization. The Qualified Person must recognize the importance of the Indicated Mineral Resource category to the advancement of the feasibility of the project.
JDS use the criteria that Indicated resources must be estimated so the uncertainty of yearly production is no greater than ±15% with 90% confidence and Measured resources must be estimated so the uncertainty of quarterly production is no greater than ±15% with 90% confidence.
The results presented above indicate the usual reliability targets can be reached when the CV is around 1.5. A spacing of somewhere around 50m produces sufficiently reliable estimates for classifying Indicated resources.
It should also be noted that the confidence limits only consider the variability of grade within the veins. There may be other aspects of deposit geology and geometry as such as geological
Report Date: April 30, 2013
Effective Date: March 18, 2013
contacts or the presence of faults or offsetting structures that may impact the drill spacing. These factors should not be discounted or ignored when making a final choice concerning the drill grid.
The following lists the grid spacing for each resource category to classify resources assuming the 8,500tpd production rate and based on the other assumptions above:
| ● | Measured: Note that based on the CIM definitions, continuity must be demonstrated in the designation of Measured (and Indicated) resources. Therefore, no Measured resources can be declared based on one hole. The uncertainty based on current information suggests a spacing of 10m may be required to classify Measured resources. |
| ● | Indicated: Resources in this category could be delineated from multiple drill holes located on a nominal 50m square grid pattern provided a yearly uncertainty of around 15% does not significantly impact the potential viability of the project. |
| ● | Inferred: Any material not falling in the categories above and within a maximum 100m of one hole. |
The spacing distances are intended to define contiguous volumes and they should allow for some irregularities due to actual drill hole placement. The final classification volume results typically must be smoothed manually to come to a coherent classification scheme.
The analysis described above indicates a drill spacing of around 50m may be sufficient in delineating Indicated resources at 8,500tpd. The calculation of uncertainty should be monitored as drilling progresses.
Estimation of confidence intervals for smaller volumes such as those for monthly or weekly production requires the geostatistical procedure of conditional simulation (Davis, B. M., Some Methods of Producing Interval Estimates for Global and Local Resources, SME Preprint 97-5, 4p.). The use of conditional simulation can help to assess uncertainty and risk in short term mine planning. Conditional simulation applications would typically not be appropriate until sometime in the future when more drilling is available.
The mineral resources are listed in Table 14-8 for silver, zinc, lead and copper at the chosen 25 g/t Ag cut-off grade. Silver and Zinc values have been classified as Indicated. Although the lead and copper resources are within the distance and spacing criteria, the authors believe further work is required to develop confidence in the source data and economics prior to classifying these resources as Indicated and so considers them as Inferred. The mineral resources are listed at a base case cut-off grade of 25g/t Ag. Table 14-9 lists the resources at varying Ag cut-off grades.
For the purposes of determining a cutoff grade, JDS used a silver Recovery of 75% and a dilution factor of 80% with the following calculation:
(Processing Costs+ G&A Costs)/[(Ag Price)/31.1035 * %Rec * %Dilution]
Report Date: April 30, 2013
Effective Date: March 18, 2013
Thus the Cut-off calculation is:
(12.00 - 1.00)/[29.20/31.104 * 75% *80%] = 23.08 g/t => USE 25.0 g/t
The mineral resources are confined within an optimized Lerchs-Grossman (LG) pit shell to ensure reasonable prospects of economic extraction. The pit shell was generated using a silver, zinc, lead and copper price of $29.20 per ounce silver, $0.95 per pound zinc, $1.00 per pound lead and $3.70 per pound copper, as defined by the 3-year trailing average as on January 31, 2013. Mining costs (ore and waste) of US$1.50/tonne, processing costs of US$13.00/tonne (including G&A) and an overall pit slope of 50° were used for the pit optimizations.
Mineral resources are not mineral reserves until they have demonstrated economic viability. Mineral resource estimates do not account for the resource's mineability, selectivity, mining loss, or dilution.
Report Date: April 30, 2013
Effective Date: March 18, 2013
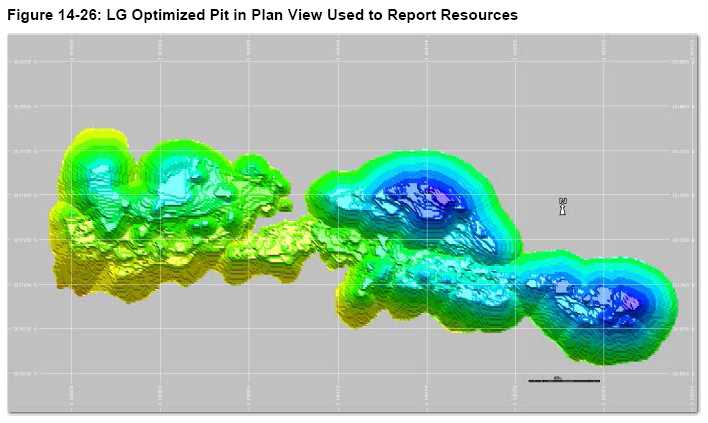
A graphical validation was done on the block model. The purpose of the graphical validation is to:
| ● | Check the reasonableness of the estimated grades, based on the estimation plan and the nearby composites. |
| ● | Check that, within the model blocks, the topography has been properly accounted for. |
| ● | Check the manual ballpark estimates for tonnage to determine reasonableness. |
| ● | Inspect the high-grade blocks created as a result of outliers. |
A full set of cross-sections, long sections, and plans were used to check the block model on the computer screen, showing the block grades and the composite. There was no evidence that any blocks were wrongly estimated. It appears that every block grade can be explained as a function of: the surrounding composites, the correlogram models used, and the estimation plan applied.
These validation techniques include, but are not limited to:
| ● | A visual inspection done on a section-by-section and plan-by-plan basis. |
| ● | The use of grade tonnage curves. |
| ● | Histograms of varying cut-off grades that demonstrate a relatively uniform, normal distribution. |
| ● | Swath Plots that compare the Ordinary Kriged blocks with the Inverse Distance and Nearest Neighbour estimates. |
Report Date: April 30, 2013
Effective Date: March 18, 2013
| ● | Inspection of histograms to determine the distance of the first composite to the nearest block and the average distance to blocks for all composites used. |
| 14.15.1 | Model Checks for Change of Support |
The relative degree of smoothing in the block estimates was evaluated using the Hermitian Polynomial Change of Support model, also known as the Discrete Gaussian Correction. With this method, the distribution of the hypothetical block grades can be directly compared to the estimated ordinary kriging model through the use of pseudo-grade/tonnage curves. Adjustments are made to the block model interpolation parameters until an acceptable match is made with the Herco distribution.
In general, the estimated model should be slightly higher in tonnage and slightly lower in grade when compared to the Herco distribution at the projected cut-off grade. These differences account for selectivity and other potential ore-handling issues which commonly occur during mining.
The Herco distribution is derived from the declustered composite grades which have been adjusted to account for the change in support moving from smaller drill hole composite samples to the larger blocks in the model. The transformation results in a less skewed distribution, but with the same mean as the original declustered samples. Examples of Herco plots from some of the models are shown in Figure 14-27.
Overall, correspondence between models is relatively good. The results indicate that the silver models are somewhat more conservative estimates.
It should be noted that the change of support model is a theoretical tool intended to direct model estimation. There is uncertainty associated with the change of support model, and its results should not be viewed as a final or correct value. In cases where the model grades are greater than the change of support grades, the model is relatively insensitive to any changes to the modelling parameters. Any extraordinary measures to force grade curves change are not warranted.
| 14.15.1 | Comparison of Interpolation Methods |
For comparison purposes, additional grade models were generated using the inverse distance squared weighted (ID2) and nearest neighbour (NN) interpolation methods. The nearest neighbour model was created using data composited to lengths equal to the short block axis. The results of these models are compared to the Ordinary Kriging (OK) models at various cut-off grades in a series of grade/tonnage graphs shown in Figure 14-28.
In general, the results indicate that the Ordinary Kriging model is more conservative and is smoother than the inverse distance model.
Report Date: April 30, 2013
Effective Date: March 18, 2013
| 14.15.1 | Swath Plots (Drift Analysis) |
A swath plot is a graphical display of the grade distribution derived from a series of bands, or swaths, generated in several directions throughout the deposit. Using the swath plot, grade variations from the ordinary kriging model are compared to the distribution derived from the declustered nearest neighbour grade model.
On a local scale, the nearest neighbour model does not provide reliable estimations of grade, but, on a much larger scale, it represents an unbiased estimation of the grade distribution based on the underlying data. Therefore, if the ordinary kriging model is unbiased, the grade trends may show local fluctuations on a swath plot, but the overall trend should be similar to the nearest neighbour distribution of grade.
Swath plots were generated in three orthogonal directions that compare the ordinary kriging and nearest neighbour gold estimates. Some examples of swath plots at various orientations are shown in Figure 14-29.
There is good correspondence between the models. The degree of smoothing in the ordinary kriging model is evident in the peaks and valleys shown in the swath plots
Report Date: April 30, 2013
Effective Date: March 18, 2013
Report Date: April 30, 2013
Effective Date: March 18, 2013
Report Date: April 30, 2013
Effective Date: March 18, 2013
Report Date: April 30, 2013
Effective Date: March 18, 2013
| 15.0 | Mineral Reserve Estimates |
This section does not apply to the Technical Report.
Report Date: April 30, 2013
Effective Date: March 18, 2013
This section does not apply to the Technical Report
Report Date: April 30, 2013
Effective Date: March 18, 2013
This section does not apply to the Technical Report.
Report Date: April 30, 2013
Effective Date: March 18, 2013
| 18.0 | Project Infrastructure |
This section does not apply to the Technical Report.
Report Date: April 30, 2013
Effective Date: March 18, 2013
| 19.0 | Market Studies and Contracts |
This section does not apply to the Technical Report.
Report Date: April 30, 2013
Effective Date: March 18, 2013
| 20.0 | Environmental Studies, Permitting and Social or Community Impact |
This section does not apply to the Technical Report.
Report Date: April 30, 2013
Effective Date: March 18, 2013
| 21.0 | Capital and Operating Costs |
This section does not apply to the Technical Report.
Report Date: April 30, 2013
Effective Date: March 18, 2013
This section does not apply to the Technical Report.
Report Date: April 30, 2013
Effective Date: March 18, 2013
While the Sierra Mojada District and the Sierra Mojada property has been the subject of past production, there are currently no adjacent properties or operators publicly reporting resources or reserves.
MMC holdings cover all the mineralized zones. No commercial mining operations are currently active within the area, except for a dolomite quarrying operation of Penoles near Esmeralda.
Report Date: April 30, 2013
Effective Date: March 18, 2013
| 24.0 | Other Relevant Data and Information |
There are no other relevant data that have not been addressed in this technical report.
Report Date: April 30, 2013
Effective Date: March 18, 2013
| 25.0 | Interpretations and Conclusions |
| 25.1. | Conclusions Geologic Setting and Mineralization |
The alteration-mineralizing events have generated two types of mineralization in the Sierra Mojada district; The Shallow Silver Zone (SSZ) and the Base Metal Manto Zone (BMM). Mineralization in the Shallow Silver Zone is dominated by acanthite, the silver halide solid solution of bromargyrite-chloragyrite, and tennantite. Silver occurs in early to late high grade structures, karst breccias, low-angle fault breccias, and mantos, and as disseminated replacements in porous hydrothermally altered dolomites.
The Base Metal mineralization is dominated by hemimorphite in the Red Zinc zone and smithsonite in the White Zinc zone. Mineralization primarily occurs as replacement of karst breccia and accessory faults which feed the breccia zones. Nonsulfide Base Metal mineralization is a result of oxidation and supergene enrichment of an original zone of semi-to massive pyrite- sphalerite-galena ore largely located in the Lead zone manto mineralization.
The result is a silver (copper) rich polymetallic zone of mineralization overlaying a large non- sulfide zinc-lead resource, both forming a linear zone of manto shaped mineralization cross cut by mineralized structures.
| 25.2. | Deposit Model Conclusions |
Sierra Mojada is a polymetallic Pb-Zn-Ag-Cu district and it represents the distal expression of Carbonate Replacement Deposit (CRD) mineralization which is well documented in northern Mexico. The Sierra Mojada district demonstrates a well-known base metal zoning pattern overprinted by silver mineralization.
| 25.3. | Resource Modelling Conclusions |
Silver Bull Resources employs state of the art exploration procedures in all of its work at Sierra Mojada. All data is managed in Microsoft Excel or Access, and all data is transformed to a visual format in MapInfo. That information going into the resource is first imported into AutoCAD and then modeled in Gemcom Software GEMS.
The sample data was then imported into the MSTorque™ SQL Server Relational database for analysis and modelling with the MineSight™ System. The use of 'partials' modeling allows improved combination of contributions from multiple wireframes that intersect the block being estimated.
Of significance is the recently completed Termite drilling program which was a twin program for the underground long holes, historically given little weight in Sierra Mojada project resource calculations. The positive impact of reducing the modeling constraints has increased both the tonnes and grade of the mineralized zones.
Report Date: April 30, 2013
Effective Date: March 18, 2013
JDS recommends that Silver Bull Resources that the next phase work program should include:
| ● | Wireframe work is showing continuous improvement but more work can be done to smooth and simplify the interpretations which have significant overlaps. For example, it does not appear necessary to create a separate mixed silver-zinc zone. The mixed zone should be included within the overall silver wireframe. |
| ● | Refine the models for the underground voids and openings to resolve triangulation issues. |
| ● | Continue to drill-test the silver zones at the west end of the Sierra Mojada property (Veta Rica area). This could be by utilization of the Termite drill and could add additional data for LH comparisons. |
| ● | Do geotechnical drilling to confirm appropriate slope angles for future open pit design work. |
| ● | Continue to do limited programs of duplicate channel sampling to resolve the impacts of the previously reported channel sample bias. |
| ● | Complete the SART process metallurgical testwork and confirm recovery parameters. |
| ● | Detail power and water sources, requirements, and begin permit process. |
| ● | Conduct a Preliminary Economic Assessment (PEA). |
| ● | Ensure that an environmental baseline study (beyond work done for drill permits) is initiated. |
JDS estimates that the total cost of the next phase work program is approximately US$2.5M.
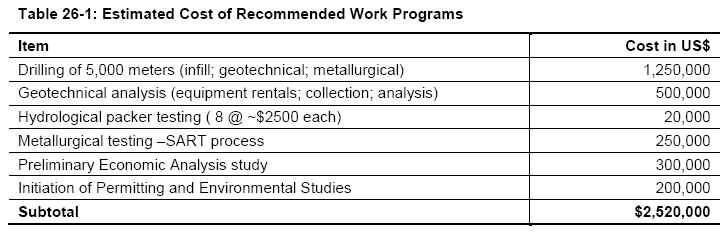
Report Date: April 30, 2013
Effective Date: March 18, 2013
Ahn, Hye In, 2010, Mineralogy and geochemistry of the non-sulfide Zn deposits in the Sierra Mojada district, Coahuila, Mexico, 179p. MSc. thesis, University of Texas-Austin, August, 2010.
Borg, G., 2009, The influence of fault structures on the genesis of supergene zinc deposits. Society of Economic Geologists, Special Publication No. 14, 2009, pp 121-132.
Clark, J. L., Conner, J. R., and McMahon, A. M., Pincock, Allen & Holt, 2010, Technical Report and Resource Estimate for the Sierra Mojada Project, Mexico. January 29, 2010.
Davis, B. M., Some Methods of Producing Interval Estimates for Global and Local Resources, SME Preprint 97-5, 4p.
Gonzalez-Sanchez, et al, 2009, Regional stratigraphy and distribution of epigenetic stratabound celestine, fluorite, barite and Pb-Zn deposits in the MVT province of northeastern Mexico. Mineralium Deposita, 2009, vol. 44, pp 343-361.
Gryger, S.M., 2010, Geologic framework of the Sierra Mojada mining district, Coahuila, Mexico; An integrative study of a Mesozoic platform-basin margin, 376p. MSc. thesis, University of Texas-Austin, December 2010.
Journel and Huijbregts, 1978, Hermitian Polynomial Change of Support model.
Hodder, R.W., 2001, Carbonate-hosted zinc deposits, Sierra Mojada district, State of Coahuila, Mexico; A review of potential, August 28, 2001, 66p Internal Metalline Mining Company report.
Kappes, Cassiday & Associates 2010c, Sierra Mojada Project, Report of Metallurgical Test Work, October 2010.
Kappes, Cassiday & Associates, 2010a, Coeur Mexico Project, Report on Metallurgical Test Work, February 2010.
Kappes, Cassiday & Associates, 2010b, Sierra Mojada Project, Report of Metallurgical Test Work, May 2010.
King, Martin, 2010, A geological review of the Sierra Mojada zinc-lead-silver-copper project, June 25, 2010. Internal Metalline Mining company report.
McGee, J.W, et al, 1990, Stratigraphy and provenance of strata along the San Marcos fault, central Coahuila, Mexico: Geological Society of America Bulletin v. 102, pp 593-614.
McKee, J. W. and Jones, N. W. 1979, A large Mesozoic fault in Coahuila, Mexico: Geological Society of America Abstracts with Programs, v. 11, p. 476.
Report Date: April 30, 2013
Effective Date: March 18, 2013
McKee, J. W., Jones, N. W. and Long, L. E., 1990, Stratigraphy and provenance of strat along the San Marcos fault, central Coahuila, Mexico: Geological Society of America Bulletin v. 102, pp 593-614.
McMahon, A. M. 2010, Pincock, Allen & Holt, Re-Sampling Program for the Sierra Mojada Project Coahuila State, Mexico, August 11, 2010.
Megaw, Peter, 2009, Evaluation of oxidized Pb-Zn carbonate replacement deposits of Mexico in light of supergene zinc and residual lead enrichment processes. Society of Economic Geologists, Special Publication No. 14, 2009, pp 51-58.
Megaw, Peter, et al, 1988, High temperature, carbonate hosted Ag-Pb-Zn (Cu) deposits of northern Mexico: Journal of Economic Geology, v 83, No 8, p 1856-1885.
Megaw, Peter, et al, 1996, Carbonate-hosted lead-zinc (Ag, Cu, Au) deposits of northern Chihuahua, Mexico. Society of Economic Geologists, Special Publication No. 4, 1996, pp 277289.
Mountain States R&D International, Inc., 2011, Progress Report No.1 Regarding Three Silver Ore Composites - Sierra Mojada. January 06, 2011.
Natalie Pietrzak and Jim Renaud, 2011, A petrographic and microprobe investigation of the carbonate mineral chemistry as it relates to silver grade at Sierra Mojada, February 11, 2011.
Nilsson J., and Simpson, R.G, 2009, Technical report "shallow silver zone" silver-zinc deposit, Sierra Mojada Project, Coahuila state, Mexico, 130p. NI-43-101 report prepared for Metalliine Mining Company and filed on SEDAR.
Pincock, Allen & Holt, 2010, Technical Report and Resource Estimate for the Sierra Mojada Project, Mexico, January 29, 2010. NI-43-101 technical report prepared for Metalline Mining Company and filed on SEDAR.
Process Engineering LLC, 2011, Sierra Mojada Project - Silver Oxide Sysyem Metallurgical Test Work Review, 14p.
Reichert, J., 2009, A geochemical model of supergene carbonate-hosted nonsulfide zinc deposits. Society of Economic Geologists, Special Publication No. 14, 2009, pp 69-76.
Sillitoe, Richard, 2009, Supergene silver enrichment reassessed. Society of Economic Geologists, Special Publication No. 14, 2009, pp 15-32.
Simpson, R., G., and Nilsson, J., 2011, Technical report Shallow Silver Zone Silver Zinc Deposit Sierra Mojada Project, Coahuila State, Mexico, 130p.
SRK Consulting (Canada) Inc., 2012, Technical Report on the Sierra Mojada Silver Project, Coahuila State, Mexico,Report No.2CS030.001, July 06, 2012.
Report Date: April 30, 2013
Effective Date: March 18, 2013
Stockhausen, Tim, 2012, The Upper Conglomerate and Its Importance to the Sierra Mojada Ag- Zn Deposit System, Coahuila, Mexico, 151 p. PhD. thesis, Colorado School of Mines, December 2012.
Thorson, J., 2010, Sierra Mojada, ferruginous breccia, Fbx, June 3, 2010. Internal Metalline Mining Company report, 18p.
Wyss, Gary, 2013, MLA Characterization of ore samples from Sierra Mojada, for Silver Bull Resources, Center for Advanced Mineral and Metallurgical Processing, Butte, Montana, January 23, 2013. 48p.
Report Date: April 30, 2013
Effective Date: March 18, 2013
Appendix A - Qualified Persons Certificates
Report Date: April 30, 2013
Effective Date: March 18, 2013
Report Date: April 30, 2013
Effective Date: March 18, 2013
Report Date: April 30, 2013
Effective Date: March 18, 2013
Appendix B - 2012 Drillholes added to Resource Estimate
Report Date: April 30, 2013
Effective Date: March 18, 2013
Report Date: April 30, 2013
Effective Date: March 18, 2013
Report Date: April 30, 2013
Effective Date: March 18, 2013
Report Date: April 30, 2013
Effective Date: March 18, 2013
Report Date: April 30, 2013
Effective Date: March 18, 2013
Report Date: April 30, 2013
Effective Date: March 18, 2013
Report Date: April 30, 2013
Effective Date: March 18, 2013
Report Date: April 30, 2013
Effective Date: March 18, 2013
Appendix C - Reference Standards
Report Date: April 30, 2013
Effective Date: March 18, 2013
Report Date: April 30, 2013
Effective Date: March 18, 2013
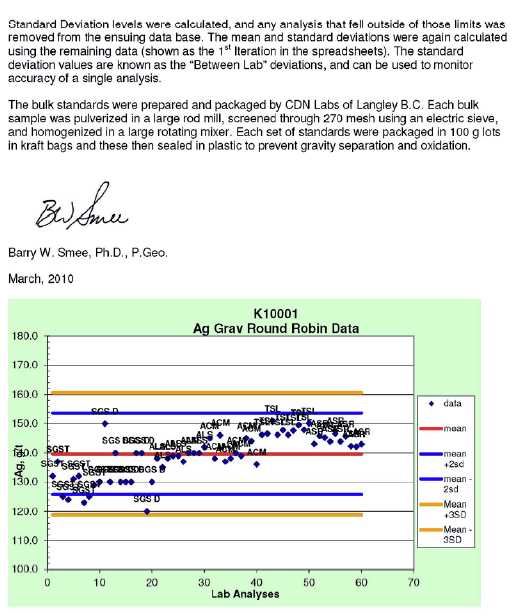
Report Date: April 30, 2013
Effective Date: March 18, 2013
Report Date: April 30, 2013
Effective Date: March 18, 2013
Report Date: April 30, 2013
Effective Date: March 18, 2013
Report Date: April 30, 2013
Effective Date: March 18, 2013
Report Date: April 30, 2013
Effective Date: March 18, 2013