UNITED STATES
SECURITIES AND EXCHANGE COMMISSION
Washington, D.C. 20549
FORM 10-K
| | | | | | | | |
| ☑ | ANNUAL REPORT PURSUANT TO SECTION 13 OR 15(d) OF THE SECURITIES EXCHANGE ACT OF 1934 |
For the fiscal year ended December 31, 2024
or
| | | | | | | | |
| ☐ | TRANSITION REPORT PURSUANT TO SECTION 13 OR 15(d) OF THE SECURITIES EXCHANGE ACT OF 1934 |
For the transition period from to
Commission file number: 001-13461
Group 1 Automotive, Inc.
(Exact name of registrant as specified in its charter)
| | | | | | | | | | | |
| Delaware | | 76-0506313 |
| (State or other jurisdiction of incorporation or organization) | | (I.R.S. Employer Identification No.) |
| 730 Town and Country Blvd | Suite 500 | | 77024 |
| Houston, | TX | | (Zip code) |
| (Address of principal executive offices) | | |
(713) 647-5700
(Registrant’s telephone number, including area code)
Not Applicable
(Former name, former address and former fiscal year, if changed since last report)
| | | | | | | | | | | | | | |
| Securities registered pursuant to Section 12(b) of the Act: |
| Title of each class | | Ticker symbol(s) | | Name of exchange on which registered |
| Common stock, par value $0.01 per share | | GPI | | New York Stock Exchange |
Securities registered pursuant to Section 12(g) of the Act: None.
Indicate by check mark if the registrant is a well-known seasoned issuer, as defined in Rule 405 of the Securities Act. Yes þ No ¨
Indicate by check mark if the registrant is not required to file reports pursuant to Section 13 or Section 15(d) of the Act. Yes ¨ No þ
Indicate by check mark whether the registrant (1) has filed all reports required to be filed by Section 13 or 15(d) of the Securities Exchange Act of 1934 during the preceding 12 months (or for such shorter period that the registrant was required to file such reports), and (2) has been subject to such filing requirements for the past 90 days. Yes þ No ¨
Indicate by check mark whether the registrant has submitted electronically every Interactive Data File required to be submitted pursuant to Rule 405 of Regulation S-T (§ 232.405 of this chapter) during the preceding 12 months (or for such shorter period that the registrant was required to submit such files). Yes þ No ¨
Indicate by check mark whether the registrant is a large accelerated filer, an accelerated filer, a non-accelerated filer, a smaller reporting company or an emerging growth company. See the definitions of “large accelerated filer,” “accelerated filer,” “smaller reporting company” and “emerging growth company” in Rule 12b-2 of the Exchange Act. (Check one):
| | | | | | | | | | | | | | |
| Large accelerated filer | þ | | ¨ | Accelerated filer |
| | | | |
| Non-accelerated filer | ¨ | | ☐ | Smaller reporting company |
| | | | |
| | | ☐ | Emerging growth company |
If an emerging growth company, indicate by check mark if that registrant has elected not to use the extended transition period for complying with any new or revised financial accounting standards provided pursuant to Section 13(a) of the Exchange Act. ¨
Indicate by check mark whether the registrant has filed a report on and attestation to its management’s assessment of the effectiveness of its internal control over financial reporting under Section 404(b) of the Sarbanes-Oxley Act (15 U.S.C. 7262(b)) by the registered public accounting firm that prepared or issued its audit report. ☑
If securities are registered pursuant to Section 12(b) of the Act, indicate by check mark whether the financial statements of the registrant included in the filing reflect the correction of an error to previously issued financial statements. ¨
Indicate by check mark whether any of those error corrections are restatements that required a recovery analysis of incentive-based compensation received by any of the registrant’s executive officers during the relevant recovery period pursuant to §240.10D-1(b). ¨
Indicate by check mark whether the registrant is a shell company (as defined in Rule 12b-2 of the Act). Yes ☐ No þ
The aggregate market value of common stock held by non-affiliates of the registrant was approximately $3.9 billion based on the reported last sale price of common stock on June 30, 2024, which was the last business day of the registrant’s most recently completed second quarter.
As of February 7, 2025, there were 13,244,315 shares of our common stock, par value $0.01 per share, outstanding.
DOCUMENTS INCORPORATED BY REFERENCE
Portions of the registrant’s definitive proxy statement for its 2025 Annual Meeting of Stockholders, which will be filed with the Securities and Exchange Commission within 120 days of December 31, 2024, are incorporated by reference into Part III of this Form 10-K.
TABLE OF CONTENTS
| | | | | | | | |
| | |
| |
| |
| |
| Item 1. | | |
| Item 1A. | | |
| Item 1B. | | |
| Item 1C. | | |
| Item 2. | | |
| Item 3. | | |
| Item 4. | | |
| |
| |
| Item 5. | | |
| | |
| Item 7. | | |
| Item 7A. | | |
| Item 8. | | |
| Item 9. | | |
| Item 9A. | | |
| Item 9B. | | |
| Item 9C. | | |
| |
| |
| Item 10. | | |
| Item 11. | | |
| Item 12. | | |
| Item 13. | | |
| Item 14. | | |
| |
| |
| Item 15. | | |
| Item 16. | | |
| |
GLOSSARY OF DEFINITIONS
The following are abbreviations and definitions of terms used within this report: | | | | | | | | |
| Terms | | Definitions |
| AOCI | | Accumulated other comprehensive income (loss) |
| ASU | | Accounting Standards Update |
| | |
| DMS | | Dealer management system |
| EBITDA | | Earnings before interest, taxes, depreciation and amortization |
| EPS | | Earnings per share |
| EV | | Electric vehicle |
| F&I | | Finance, insurance and other |
| FASB | | Financial Accounting Standards Board |
| FMCC | | Ford Motor Credit Company |
| GBP | | British Pound Sterling (£) |
| | |
| OEM | | Original equipment manufacturer |
| PII | | Personally Identifiable Information |
| PRU | | Per retail unit |
| PSU | | Performance stock unit |
| ROU | | Right-of-use |
| RSA | | Restricted stock award |
| RSU | | Restricted stock unit |
| SEC | | Securities and Exchange Commission |
| SG&A | | Selling, general and administrative |
| SOFR | | Secured Overnight Financing Rate |
| | |
| USD | | United States Dollar |
| U.K. | | United Kingdom |
| U.S. | | United States of America |
| U.S. GAAP | | Accounting principles generally accepted in the U.S. |
| | |
| | |
| | |
| | |
CAUTIONARY STATEMENT ABOUT FORWARD-LOOKING STATEMENTS
Unless the context requires otherwise, references to “we,” “us,” “our”, “Group 1” or the “Company” are intended to mean the business and operations of Group 1 Automotive, Inc. and its subsidiaries.
This Annual Report on Form 10-K (this “Form 10-K”) includes certain “forward-looking statements” within the meaning of the Private Securities Litigation Reform Act of 1995, Section 27A of the Securities Act of 1933, as amended (“Securities Act”) and Section 21E of the Securities Exchange Act of 1934, as amended (“Exchange Act”). These forward-looking statements include, but are not limited to, statements concerning the Company’s strategy, future operating performance, future liquidity and availability of financing, capital allocation, the completion of future acquisitions and divestitures, as well as the impact of cyberattacks or other privacy/data security incidents, business trends in the retail automotive industry, changes in regulations and potential changes in U.S. trade policy, including the imposition of tariffs and the resulting consequences. When used in this Form 10-K, the words “anticipate,” “believe,” “estimate,” “expect,” “intend,” “may” and similar expressions are intended to identify forward-looking statements.
These forward-looking statements are based on the Company’s expectations and beliefs as of the date of this Form 10-K concerning future developments and their potential effect on the Company. While management believes that these forward-looking statements are reasonable when and as made, there can be no assurance that future developments affecting the Company will be those that are anticipated. The Company’s forward-looking statements involve significant risks and uncertainties that could cause actual results to differ materially from those in the forward-looking statements, including, but not limited to, the risks set forth in Item 1A. Risk Factors of this Form 10-K.
Readers are cautioned not to place undue reliance on forward-looking statements, which speak only as of the date hereof. The Company undertakes no responsibility and expressly disclaims any duty, to update any such statements, whether as a result of new information, new developments or otherwise, or to publicly release the result of any revision the forward-looking statements after the date they are made, except to the extent required by law.
PART I
Item 1. Business
General
Group 1 Automotive, Inc. is a leading operator in the automotive retail industry. We sell and/or lease new and used cars and light trucks; arrange related vehicle financing; sell service and insurance contracts; provide automotive maintenance and repair services; and sell vehicle parts retail and wholesale. We have operations in geographically diverse markets that extend across 17 states in the U.S. and 72 towns and cities in the U.K. As of December 31, 2024, our retail network consists of 145 dealerships and 27 collision centers in the U.S. and 114 dealerships and 12 collision centers in the U.K.
Discontinued Operations
Discontinued operations within the Consolidated Statements of Operations consists of activity associated with our Brazil operations, which were disposed of during the year ended December 31, 2022. Refer to Note 4. Discontinued Operations and Other Divestitures within the Notes to Consolidated Financial Statements for additional information regarding business dispositions. Unless otherwise specified, disclosures in this Form 10-K reflect continuing operations only.
Dealership Operations
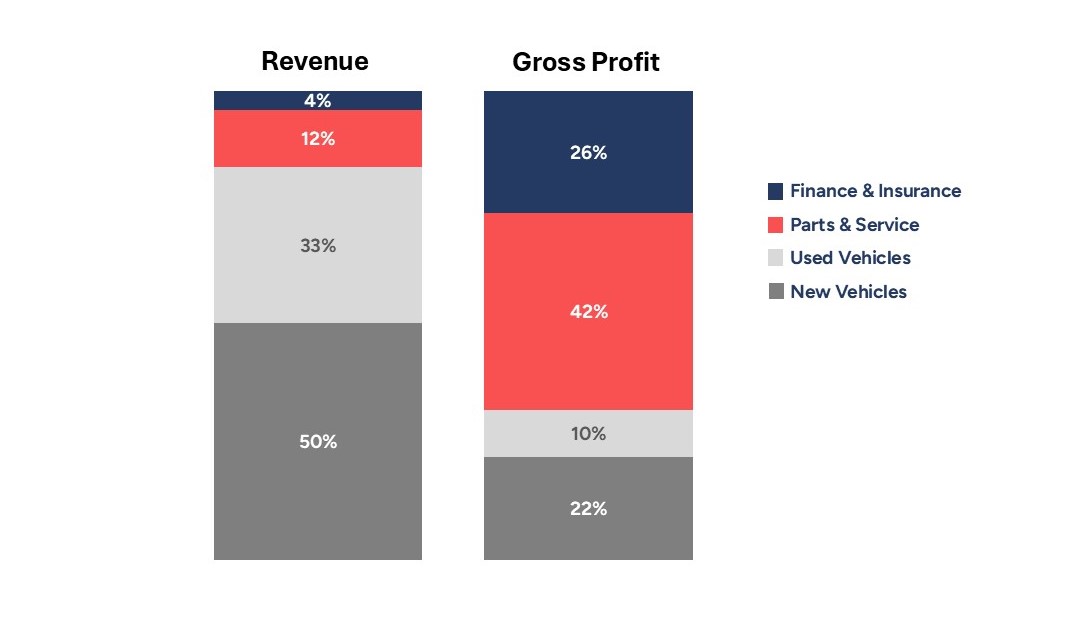
Our new vehicle revenues include new vehicle sales and lease transactions, completed at our dealerships or via our digital platform, AcceleRide®. We sell retail used vehicles directly to our customers at our dealerships and via AcceleRide® and wholesale our used vehicles at third-party auctions. We sell replacement parts and provide both warranty and non-warranty maintenance and repair services at each of our franchised dealerships, as well as provide collision repair services at the 39 collision centers that we operate. We also sell parts to wholesale customers. Revenues from our F&I operations consist primarily of fees for arranging financing and selling vehicle service and insurance contracts in connection with the retail sale of a new or used vehicle. We offer a wide variety of third-party finance, vehicle service and insurance products in a convenient manner at competitive prices.
The following charts present total revenues and gross profit contribution from our operations by new vehicles, used vehicles, parts and service and F&I for the year ended December 31, 2024 (“Current Year”):
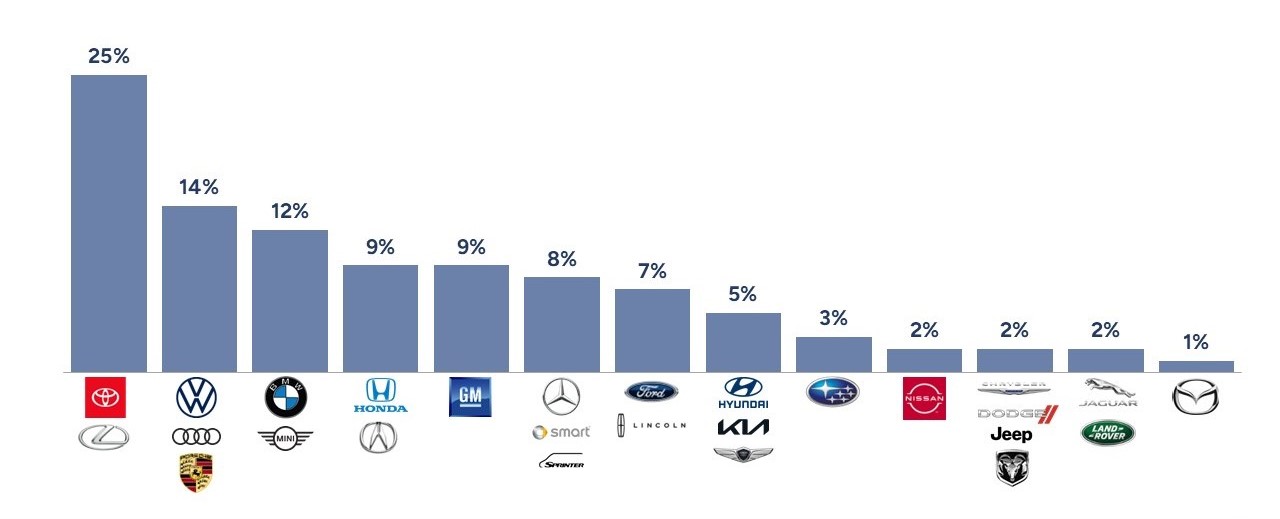
The following chart presents our diversity of new vehicle unit sales by manufacturer for the Current Year:
The following table shows our new vehicle unit sales geographic mix for the Current Year and our franchise count as of December 31, 2024:
| | | | | | | | | | | | | | | | | |
| | | New vehicle unit sales geographic mix (%) | | Franchises |
| Region | Geographic Market | | | | |
| U.S. | Texas | | 33.5 | % | | 70 |
| Massachusetts | | 7.8 | % | | 20 |
| California | | 7.2 | % | | 7 |
| Oklahoma | | 5.0 | % | | 19 |
| Georgia | | 3.5 | % | | 9 |
| Maryland | | 3.5 | % | | 7 |
| Florida | | 2.7 | % | | 5 |
| New Mexico | | 2.4 | % | | 7 |
| New Hampshire | | 2.3 | % | | 5 |
| South Carolina | | 2.1 | % | | 6 |
| New Jersey | | 2.0 | % | | 8 |
| Maine | | 1.5 | % | | 6 |
| Louisiana | | 1.3 | % | | 6 |
| Kansas | | 1.0 | % | | 3 |
| New York | | 0.8 | % | | 2 |
| Mississippi | | 0.4 | % | | 1 |
| Alabama | | 0.2 | % | | 1 |
| | | 77.4 | % | | 182 |
| | | | | |
| U.K. | United Kingdom | | 22.6 | % | | 153 |
| | | | | |
| | | 100.0 | % | | 335 | |
Business Strategy
Our business strategy is built on our commitment to maximize the return on investment for our stockholders. We intend to execute our business strategy through three interrelated pillars:
•Growth;
•Local Scale; and
•Full Rooftop Potential.
Growth
Allocating our shareholders’ capital in support of maximizing our return on investment is our highest priority. When evaluating an acquisition, we run disciplined valuation models, with expectations based on our experience, incorporating growth and investment. We then compare the projected acquisition return to the expected return of repurchasing shares of our common stock, repaying debt, or using the capital for other uses.
In 2024, we completed the acquisition of Inchcape Retail automotive operations (“Inchcape Retail”) in the U.K., consisting of 54 dealership locations, certain real estate and three collision centers (the “Inchcape Acquisition”). The Inchcape Acquisition approximately doubled our portfolio across the U.K.
Consistent with our acquisition activity completed in 2022 through 2024, we intend to pursue opportunities in growth-positioned markets that are economically accretive to our existing markets. Our focus is on brand, geographic fit, and large dealership operations and/or dealership clusters that will provide attractive returns to our portfolio. Acquisitions completed within our existing markets or large dealership groups allow us to capitalize on economies of scale and provide for cost saving opportunities in key expense areas such as used vehicle sourcing, advertising, purchasing, data processing and personnel utilization. In addition to cost savings opportunities, scale enables us to make the EV, facility, compliance, real estate, personnel development and training, and technology investments necessary to thrive in today’s retail automotive industry.
Acquisition success depends upon our relationship with our OEM partners. We work closely with our OEMs and regularly communicate with them regarding material sourcing, marketing, recalls, safety and other factors that influence our business relationship and the customer experience. We seek to perform well in the markets in which we operate, generally meeting or exceeding OEM metrics on market share and customer retention. Each OEM has acquisition eligibility criteria and our ability to meet these criteria across multiple brands provides an advantage to executing a growth strategy. We believe we can buy nearly any brand, so we can be selective with our acquisition target criteria. We believe we have access to a broader selection of assets and asset groups, some of which require the significant capital investment our scale allows, given our ability to operate successfully across multiple brand partners.
In addition to expanding our portfolio through acquisitions, from time to time, we make decisions to optimize our portfolio by disposing of certain assets or operations. In some instances, we dispose of underperforming dealerships which do not meet our return objectives. We may also dispose of certain dealerships in order to complete strategic acquisition opportunities. Specifically, we may dispose of a less significant dealership to allow us to acquire a more substantial dealership within the same or another geographic area based on the ownership limitations imposed in our franchise agreements.
Refer to Note 3. Acquisitions and Note 4. Discontinued Operations and Other Divestitures within the Notes to Consolidated Financial Statements, for additional information regarding our acquisitions and dispositions.
Local Scale
We believe capturing opportunities from building local scale will provide us a competitive advantage and leverage through greater market representation and facilitate an improved customer experience.
With our expansive portfolio of brands and service capabilities across significant geographical areas, we believe we can service the needs of our customers’ full families and friends. Using local scale, we will leverage our marketing prowess to drive business within our dealership clusters, while providing our customers a unique value proposition. We are growing and developing our retail talent internally by creating retail training academies within cluster markets. Our training is focused on creating consistent customer experiences across our rooftops. In addition to the enhancement of customer experience, local scale also allows us to reimagine how we handle our used vehicle inventory, including reconditioning and vehicle positioning. We are focused on reducing the cost and increasing throughput efficiency of our vehicle reconditioning operations, by establishing a more consistent approach to reconditioning. Lower costs drive higher shareholder returns and faster reconditioning gives our staff back a valuable resource, time, which can be spent improving customer retention through more customer interaction. Our business relies upon maximizing positive customer interactions to drive repeat and referral sales and service business. Disciplined inventory positioning, using our dealership clusters to best position used vehicles, allows us to drive the highest value.
Full Rooftop Potential
We seek to optimize our operations at each of our rooftops including leveraging our dealership’s full potential and local scale advantage to improve operational efficiency. This includes focusing on operational excellence at each dealership and other facilities, including, but not limited to, standardization of key common processes and taking advantage of shareable business resources. We believe our operations optimization efforts will provide a strategic advantage by structurally lowering our operating costs.
As innovative tools become available, we seek to quickly adopt those that provide a mutual benefit to our customers and Group 1. We want to replicate and grow our best practices across rooftops. Our scale amplifies the impact of replicating best practices and best practices lead to additional value extraction from existing stores and acquisition opportunities, which we believe to be a competitive advantage. We are prioritizing five areas for development in 2025.
F&I
We are piloting programs that enhance the in-store and online F&I experience, allowing our customers to shop how they want, when they want, while improving the speed of service within our dealerships. In addition, we believe we can extract further value from our top F&I performers by better managing their customer workflow, coupled with the assistance of virtual-based technology enhancements.
Procurement
We believe our scale provides us an advantage in the form of leverage to further improve our dealership costs. We continue to negotiate discounts, service level improvements and preferential pricing from suppliers to our dealerships through providers who can service multiple locations across more than one geographic market. We also routinely evaluate dealership processes with the purpose of identifying best practices which can be shared amongst our dealership operations.
Used Vehicle Purchasing and Transfers
Used vehicle profits are dependent on sourcing and our ability to fairly value the purchases we make. We have invested heavily in the technologies and processes we use to value used vehicle inventory. We have partnered with service providers to enable us to generate the most competitive market pricing available, across our dealership network.
We sell multiple brands in most markets in which we operate through our franchised dealer network. We have thousands of customers enter our stores daily. We have invested in the people and processes at many of our stores to enable used vehicle sourcing directly from the service drive. As a result, we are able to offer many of our customers a value for their car at every service visit, leading to significant organic sourcing. We are perfecting these best practices for replication across our dealerships.
In addition to sourcing, we have the ability to leverage our clusters of dealerships to sell our vehicles in the most advantageous location. We have developed disciplined processes to control the movement of our used vehicle inventory in order to maximize the selling price and throughput within our market clusters.
Customer Experience Center
We utilize central customer service centers to support our dealerships. We are investing in and developing new ways to support our customers and their dealership experience. We know that customers have challenges connecting with dealership personnel which is why we have developed processes to enable our centralized customer service centers to better assist our customers with their in-store needs. Whether that be vehicle service status or the availability of advertised vehicles, we believe our centralized customer service centers can further assist customers, improving the customer experience, if they are provided with the necessary tools and data.
Talent Management, Succession Planning and Workforce Evolution
To help our workforce feel heard and supported, we solicit employee feedback through multiple channels. We leverage our intracompany communication platform to bring our teams together digitally and provide our leadership team with the ability to interact in more frequent, engaging and direct communication with our employees. Our management team routinely visits our stores, meeting with and soliciting feedback from employees at all levels. The results of the annual engagement survey and employee discussions inform our overall human capital management methods and other growth strategies.
In addition to providing career growth pathways for employees, our Board of Directors annually reviews management’s succession planning for key positions throughout the organization. We routinely provide leadership training to key management personnel at varying levels within the organization in support of our employees. This training is designed to benefit the individual receiving the training as well as the workforce managed by those managers.
We are focused on attracting, developing, mentoring and retaining top talent. We routinely create and offer department or job-specific training and professional development opportunities to meet employees’ needs. Investments in our facilities and planned investments provide our employees working environments to meet their needs and the needs of the future.
In addition to our broader workforce, we are focused on retaining and hiring technicians. We believe we have sufficient facility capacity to support these technicians and do not view stall count as a limiter in growing our technician staffing. We have several stores where our technician headcount exceeds the stall count. Our scheduling methods and offering of a four day work week in many of our U.S. shops allow us to maximize our stall and technician utilization. Our technicians benefit from ongoing initiatives to provide air conditioning in shops with more difficult weather conditions, Group 1 training academies to support career growth and development and competitive wages and benefits.
Competition
The automotive retail industry is highly competitive across all our service lines. Consumers have a number of choices when deciding where and how to (i) purchase and/or lease a new or used vehicle as well as select related vehicle financing and insurance products; (ii) purchase related parts and accessories; and (iii) procure vehicle maintenance and repair services. We believe the principal competitive factors in the automotive retailing industry are location, service, price, selection, online capabilities, established customer relationships and reputation.
New Vehicles Sales
In the new vehicle market, our dealerships compete with other franchised dealerships in their market areas, as well as auto brokers, leasing companies and internet companies that provide referrals to, or broker vehicle sales with other dealerships or customers. Our principal new vehicle dealer competitors also have franchise agreements with the various vehicle manufacturers and, as such, generally have access to new vehicles on the same terms as we do. We do not have any cost advantage in purchasing new vehicles from vehicle manufacturers, and our current franchise agreements do not grant us the exclusive right to sell a manufacturer’s product within a given geographic area. Several companies are currently manufacturing EVs for sale primarily through the internet, under a direct-to-consumer model, without using the traditional dealer-network or are considering such a strategy, including some of our OEM partners. Certain of our vehicle manufacturers in the U.K. recently transitioned to an agency model for selling new vehicles. Under an agency model, our franchised dealerships receive a fee for facilitating the sale of a new vehicle to a customer but no longer record the vehicle sales price as revenue, record vehicles in inventory, incur loaner expense, or incur floorplan interest expense, as has been historical practice.
Used Vehicle Sales
In the used vehicle market, our dealerships compete both in their local markets and nationally with other franchised dealers, large multi-location used vehicle retailers, local independent used vehicle dealers, automobile rental agencies and private parties for the supply and resale of used vehicles.
Parts and Service
We believe the principal competitive factors in the parts and service business are the quality of customer service, timeliness of service, the use of factory-approved replacement parts, familiarity with a manufacturer’s brands and models, location, price, the availability and competence of technicians, and the availability of training programs to enhance such expertise. In the parts and service market, our dealerships compete with other franchised dealers to perform warranty maintenance and repairs, conduct manufacturer recall services and sell factory replacement parts. Our dealerships also compete with other automobile dealers, franchised and independent service center chains and independent repair shops for non-warranty repair and maintenance business. In addition, our dealerships sell replacement and aftermarket parts both locally and nationally in competition with franchised and independent retail and wholesale parts outlets. A number of regional or national chains offer selected parts and services at prices that may be lower than ours. Our collision centers compete with other large, multi-location companies, as well as local, independent, collision service operations.
F&I
We believe the principal competitive factors in the F&I business are convenience, interest rates, product availability and affordability, product knowledge, flexibility in contract length and ease of consumer understanding. We face competition in arranging financing for our customers’ vehicle purchases from a broad range of unaffiliated third-party financial institutions. Many financial institutions now offer their own menu of F&I products, providing an alternative to our product offering, which may reduce our profits from the sale of these products through reduced penetration. In certain cases, our customers in the normal course of business can cancel previously purchased F&I products resulting in the charge back to us by the product provider of a portion of the profit earned on the sale of those products.
Manufacturers’ Relationships and Agreements
Each of our U.S. dealerships operates under one or more franchise agreements with vehicle manufacturers or authorized distributors. The franchise agreements grant the franchised automobile dealership a non-exclusive right to sell the manufacturers or distributor’s brand of vehicles and offer related parts and service within a specified market area. These franchise agreements also grant franchised dealerships the right to use the manufacturer’s or distributor’s trademarks in connection with their operations, and impose numerous operational requirements and restrictions relating to, among other things, inventory levels, working capital levels, the sales process, sales performance requirements, customer satisfaction standards, marketing and branding, facility standards and signage, personnel, changes in management, change in control and monthly financial reporting.
Most of our U.S. dealerships’ franchise agreements continue indefinitely and those with finite terms are renewed or superseded by a new agreement. In the U.K., many of our agreements have two-year rolling terms. Each of our franchise agreements may be terminated or not renewed by the manufacturer for a variety of reasons, including network consolidation efforts, unapproved changes of ownership or management and performance deficiencies in such areas as sales volume, sales effectiveness and customer satisfaction. In most cases, manufacturers have renewed the franchises upon expiration so long as the dealership is in compliance with the terms of the agreement. We diligently work with our manufacturers to address any performance issues.
Our dealership service departments perform vehicle repairs and service for customers under manufacturer warranties. We are reimbursed for those repairs and service by the manufacturer. Some manufacturers offer rebates to new vehicle customers, which we are required, under specific program rules, to adequately document, support and collect. In addition, some manufacturers provide us with incentives to order and/or sell certain models and/or volumes of inventory over designated periods of time. Under the terms of our dealership franchise agreements, the respective manufacturers are able to perform warranty, incentive and rebate audits and charge us back for unsupported or non-qualifying warranty repairs, rebates or incentives.
In addition to the individual dealership franchise agreements discussed above, we have entered into framework agreements in the U.S. with most major vehicle manufacturers and distributors. These agreements impose a number of restrictions on our operations, including our ability to make acquisitions and obtain financing, and on our management. These agreements also contain change of control provisions related to the ownership of our common stock. For a discussion of these restrictions and the risks related to our relationships with vehicle manufacturers, please refer to Item 1A. Risk Factors.
Governmental Regulations
Automotive and Other Laws and Regulations
We operate in a highly regulated industry. A number of laws and regulations applicable to automotive companies affect our business and conduct, including, but not limited to our sales, operations, financing, insurance, advertising and employment practices. These laws and regulations include state franchise laws and regulations, consumer protection laws and other extensive laws and regulations applicable to new and used motor vehicle dealers. Additionally, in every jurisdiction in which we operate, we must obtain various permits and licenses in order to conduct our business.
In general, the U.S. jurisdictions in which we operate have automotive dealership franchise laws, which generally provide that it is unlawful for a manufacturer or distributor to terminate or not renew a franchise unless “good cause” exists. As a result, it generally is difficult, outside of bankruptcy, for a manufacturer or distributor to terminate, or not renew, a franchise under these laws, which were designed to protect dealers.
The U.K. generally does not have automotive dealership franchise laws and, as a result, our U.K. dealerships operate without these types of specific protections. However, similar protections may be available as a matter of general U.K. contractual law. In addition, our U.K. dealerships are subject to U.K. antitrust rules prohibiting certain restrictions on the sale of new vehicles and spare parts and on the provision of repairs and maintenance. For instance, authorized dealers are generally able to, subject to manufacturer facility requirements, relocate or add additional facilities, offer multiple brands in the same facility, allow the operation of service facilities independent of new car sales facilities and ease restrictions on cross supplies (including on transfers of dealerships) between existing authorized dealers within the network. However, under the U.K. Motor Vehicle Block Exemption Order 2023 (applicable until May 31, 2029) certain restrictions on dealerships are permissible in franchise agreements provided certain conditions are met.
In the U.K., the Financial Conduct Authority (the “FCA”) regulates financial services firms and financial markets, including our activities in acting as broker for the financing of vehicle sales. In January 2024, the FCA announced that it planned to undertake a formal review into the historic use of discretionary commission arrangements (“DCA”s) amid concerns that the practice of linking brokers’ commissions to the interest rate charged to customers may have been unfair to customers, resulting in customers paying too much for their car loans.
Additionally in the U.K., on October 25, 2024, the U.K. Court of Appeal issued a judgment in the three joint appeals for Johnson v Firstrand Bank Ltd, Wrench v Firstrand Bank Ltd and Hopcraft v Close Brothers Ltd (collectively, the “COA litigation”), finding that the claimants in those cases are entitled to be paid a sum equivalent to the undisclosed commission paid by their lenders to the dealerships from which they acquired their cars, plus interest. Underlying the Court’s judgment were the findings that, among other things, brokers owe fiduciary and/or disinterested duties to customers, which, among other things, require disclosure to the customer of the rate and amount of the commission paid and the basis for its calculation. As a result, the failure to provide such full commission disclosure effectively results in the failure to obtain a customer’s fully informed consent to the payment of commission. The judgment also appears to extend beyond DCAs to address all commission disclosures generally. Finally, the U.K. Court of Appeal held where there is a failure to disclose, lenders and dealerships who acted as brokers are jointly and severally liable for the repayment of the commission.
After the U.K. Court of Appeal denied an initial application for permission to appeal, the motor finance dealers involved requested, and were granted permission, to appeal the decision directly to the Supreme Court of the United Kingdom. The Supreme Court of the United Kingdom is scheduled to hear the appeal on April 1 – 3, 2025. The final outcomes of the FCA’s DCA review and the COA litigation, including the appeal thereof to the Supreme Court of the United Kingdom, are uncertain. Any judicial outcome or regulatory redress scheme, which ultimately results in a wider legal or regulatory requirement to refund historical commissions paid to us, could materially and adversely affect our U.K. operations.
Data Privacy
We are subject to numerous laws and regulations designed to protect the information of clients, customers, employees and other third parties that we collect and maintain. Some of the more significant regulations that we are required to comply with include the U.K.’s General Data Protection Regulation (“U.K. GDPR”) and, the California Consumer Privacy Act, as amended and enhanced effective January 1, 2023 by the California Privacy Rights Act (as so amended, the “CCPA”), and the Federal Trade Commission (“FTC”) Safeguards Rule. These regulations provide for various data protection requirements related to protection of customer’s PII, notice requirements related to data breaches and obligations to inform a consumer, at or before collection, of the purpose and intended use of the collection, and to delete a consumer’s personal information upon request. If an organization violates the U.K. GDPR, the organization can be fined up to 4% of annual global turnover or 20 million euros, whichever is greater. The CCPA allows the California Attorney General to bring actions against non-compliant businesses with fines of $2,500 per violation or, if intentional, up to $7,500 per violation and permits a private right of action for certain violations of laws. The FTC Safeguards Rule contains procedural, technical and personnel requirements that financial institutions, including dealers, must satisfy to meet their information security obligations.
Environmental and Occupational Health and Safety Laws and Regulations
Our business activities in the U.S. and the U.K. are subject to stringent federal, state and local laws, regulations and other controls governing specific health and safety criteria to address worker protection, the release of materials into the environment or otherwise relating to environmental protection. Our operations involve the use, handling and storage of materials such as motor oil and filters, transmission fluids, antifreeze, refrigerants, paints, thinners, batteries, cleaning products, lubricants, degreasing agents, tires and fuel. We contract for recycling and/or disposal of used fluids, filters and other waste materials generated by our operations.
These laws, regulations and controls may impose numerous obligations on our operations including the acquisition of permits to conduct regulated activities, the imposition of restrictions on where or how to manage or dispose of used products and wastes, the incurring of capital expenditures to limit or prevent releases of such material, and the imposition of substantial liabilities for pollution resulting from our operations or attributable to former operations. For example, in the U.S., most of our dealerships utilize storage tanks that are subject to testing, containment, upgrading and removal regulations under the federal Resource Conservation and Recovery Act, analogous state statutes and their implementing regulations. Failure to comply with these laws, regulations and permits may result in the assessment of sanctions, including administrative, civil and criminal penalties, the imposition of investigatory remedial and corrective action obligations or increase of capital expenditures, restrictions, delays and cancellations in permitting or in the performance or expansion of projects and the issuance of injunctions limiting or preventing some or all of our operations in affected areas. Additionally, certain environmental laws may result in imposition of joint and several strict liability, which could cause us to become liable as a result of our conduct that was lawful at the time it occurred or the conduct of, or conditions caused by, prior operators or other third parties. For instance, an accidental release from one of our storage tanks could subject us to substantial liabilities arising from environmental cleanup and restoration costs, claims made by neighboring landowners and other third parties for personal injury and property damage and fines or penalties for related violations of environmental laws or regulations.
Properties that we now or have in the past owned or leased in the U.S. are subject to the federal Comprehensive Environmental Response, Compensation and Liability Act and similar state statutes. These statutes can impose strict and joint and several liability for cleanup costs on those that are considered to have contributed to the release of a hazardous substance, including for historic spills that occurred prior to our ownership of our properties even if we did not know of, or did not cause the release of such hazardous substances. We also are subject to the Clean Water Act, analogous state statutes, and their implementing regulations which, among other things, prohibit discharges of pollutants into regulated waters, require containment of potential discharges of oil or hazardous substances, and require preparation of spill contingency plans. Air emissions from some of our operations, such as vehicle painting, may be subject to the federal Clean Air Act and analogous laws. Laws and regulations protecting the environment are complex and generally become more stringent over time, which may result in increased costs for future environmental compliance and remediation. Comparable laws and regulations have been enacted in the U.K. Certain health and safety standards promulgated by the Occupational Safety and Health Administration of the U.S. Department of Labor and related state agencies also apply to our operations.
In recent years, the threat of climate change has attracted considerable attention in the U.S., U.K. and elsewhere globally. As a result, numerous proposals have been made at the international, national and state levels of government, in locations affecting our business, to monitor and limit existing emissions of greenhouse gas (“GHG”), as well as to restrict or eliminate such future emissions. In December 2023, the United Arab Emirates hosted the 28th session of the Conference of the Parties where parties signed onto an agreement to transition “away from fossil fuels in energy systems in a just, orderly and equitable manner” and increase renewable energy capacity so as to achieve net zero by 2050, although no detailed timeline for doing so was set. Subsequent conferences have sought to build on the Paris Agreement, a United Nations-sponsored, non-binding agreement for nations to limit their GHG emissions through individually determined reduction goals every five years after 2020, by calling for various countries to phase out fossil fuels and subsidies related to the same, though none have been legally binding. President Donald Trump issued a series of executive orders since taking office in January 2025, including an executive order withdrawing from the Paris Agreement. Refer to Item 7. Management’s Discussion and Analysis of Financial Condition and Results of Operations — Recent Events, for additional information regarding these executive orders.
The U.K. is committed to the Paris Agreement, and announced that it plans to ban sales of new gasoline and diesel-powered vehicles after 2035. Similar planned bans have been announced in California, New Mexico, Massachusetts and New York. Additional regulation of GHG emissions could increase the cost of the vehicles sold to us. Government bans or restrictions on certain vehicle types could impact the mix of vehicles that we offer for sale. Consumer concerns regarding climate change could also alter consumer preferences and adversely affect our ability to market and sell vehicles. These developments could increase our costs of operation as well as reduce our volume of business. The full impact of these actions is uncertain at this time, though these international agreements have the potential to result in increased pressure from financial institutions and other stakeholders to eliminate or reduce fossil fuel use and GHG emissions related to the same.
Gas and diesel-powered automobiles are a source of GHG emissions and in the recent past, the U.S. Environmental Protection Agency (“EPA”), together with the National Highway Traffic Safety Administration (“NHTSA”), implemented GHG emissions limits on vehicles manufactured for operation in the U.S. Vehicle manufacturers in the U.S. are subject to regulations by the EPA and the NHTSA that establish corporate average fuel economy (“CAFE”) standards applicable to light-duty vehicles. These agencies have finalized more stringent standards for both heavy-duty and light-duty vehicles and for increased fuel economy for vehicles in upcoming model years. California and other states have indicated they would pursue more stringent CAFE and GHG standards than required by current EPA and NHTSA standards. Comparable laws and regulations have been enacted in the U.K, including updated standards for cars, vans and heavy-duty trucks for upcoming model years. Our OEMs require lead time to prepare new vehicle models and more stringent regulations could result in increased costs and time constraints or result in our OEMs deciding to increase production targets of EVs in anticipation of such regulations. These developments could also significantly increase our costs of operation as well as reduce our volume of business. For additional information, see Item 1A. Risk Factors.
On March 20, 2024, the EPA finalized new emissions standards for light and medium-duty vehicles, including passenger cars, vans, pickups, sedans and sport utility vehicles for model years 2027 through 2032 and beyond. The final rule sets new, strict standards intended to reduce air pollutant emissions, including GHG emissions; however, the new standards are now subject to legal challenge. The EPA projects the final rule will accelerate the transition to, and availability of, clean vehicle technologies, including hybrid EVs and plug-in hybrid EVs.
President Donald Trump issued a series of executive orders since taking office in January 2025, including executive orders impacting environmental regulations. Refer to Item 7. Management’s Discussion and Analysis of Financial Condition and Results of Operations — Recent Events, for additional information regarding these executive orders.
Insurance and Bonding
Our operations expose us to the risk of various liabilities, including:
•claims by employees, customers or other third parties for personal injury or property damage;
•natural disasters, such as hail, flood, tornadoes, hurricanes and wildfires; and
•potential fines and civil and criminal penalties resulting from alleged violations of federal and state laws, regulatory requirements and other local laws in the jurisdictions in which we operate.
The automotive retailing business is also subject to substantial risk of real and personal property loss as a result of significant concentration of real and personal property values at dealership locations. Under self-insurance programs, we retain various levels of risk associated with aggregate loss limits and per claim deductibles. In certain cases, we insure costs in excess of our retained risk under various contracts with third-party insurance carriers. Although we believe our insurance coverage is adequate, we cannot be assured that we will not be exposed to uninsured losses that could have a material adverse effect on our business, results of operations and financial condition. We are also subject to potential premium cost fluctuations and changes in loss retention limits with the annual renewal of these programs.
For further discussion, refer to Item 1A. Risk Factors.
Human Capital Management
Our human capital strategy is focused on attracting, developing, motivating and retaining top talent that will drive our success, enabling us to deliver market-leading business results. We strive to solidify Group 1 as the preferred employer of choice in automotive retail. We also believe that our workforce should be representative of the communities we serve. We foster a workplace culture around our core values of integrity, transparency, professionalism, teamwork and respect.
As of December 31, 2024, we had 20,413 employees (full-time, part-time and temporary), of which 13,398 were employed in the U.S. and 7,015 in the U.K.
Employee Engagement
Employee engagement is key to driving long-term business success and supporting our way towards becoming a truly customer-centric organization, which drives value for our investors. The annual Group 1 “Your Voice Matters” Engagement Survey has become our primary employee listening platform for gathering feedback and promoting a performance-based culture. That feedback provides us with valuable insight into employees’ perception of workplace culture and progress on our corporate mission. The results inform our overall human capital management methods and other growth strategies.
We maintain programs that offer safety and health and wellness initiatives. We provide competitive pay and employee benefits, routinely benchmarking ourselves against peers and the broader industry.
Training and Development
We routinely create and offer department or job-specific training, professional development opportunities, and leadership development training to meet employees’ needs. Employees have opportunities for various certification levels based on training completed and tenure. We have also developed a management training program and a technician training program to attract talent to the automotive industry. In addition to providing career growth pathways for employees, annually our Board of Directors reviews management’s succession planning for key positions throughout the organization.
Seasonality
Our operating results are generally subject to seasonal variations, as well as changes in the economic environment. In the U.S., we generally experience higher volumes of vehicle sales and service in the second and third calendar quarters of each year. In addition, in some regions of the U.S., vehicle purchases decline during the winter months due to inclement weather. In the U.K., the first and third quarters tend to be stronger, driven by the vehicle license plate change months of March and September. Other factors unrelated to seasonality, such as changes in economic conditions, manufacturer incentive programs, supply issues, seasonal weather events and/or changes in foreign currency exchange rates may exaggerate seasonal or cause counter-seasonal fluctuations in our revenues and operating income.
Internet Website and Availability of Public Filings
Our internet address is www.group1auto.com. We make the following information available free of charge on our website:
•Annual Report on Form 10-K;
•Quarterly Reports on Form 10-Q;
•Current Reports on Form 8-K;
•Amendments to the reports filed or furnished electronically with the SEC pursuant to Section 13(a) or 15(d) of the Exchange Act;
•Our Corporate Governance Guidelines;
•The charters for our Audit, Compensation & Human Resources, Finance/Risk Management and Governance & Corporate Responsibility Committees;
•Our Code of Conduct for Directors, Officers and Employees (“Code of Conduct”);
•Our Code of Ethics for our Chief Executive Officer, Chief Financial Officer and Controller (“Code of Ethics”); and
•Our Sustainability Report.
Within the time period required by the SEC and the New York Stock Exchange, as applicable, we will post on our website any modifications to the Code of Conduct and Code of Ethics and any waivers applicable to senior officers as defined in the Code of Conduct or Code of Ethics, as applicable, as required by the Sarbanes-Oxley Act of 2002. We make our filings with the SEC available on our website as soon as reasonably practicable after we electronically file such material with, or furnish such material to, the SEC. The SEC also maintains a website at http://sec.gov that contains reports, proxy and information statements, and other information regarding our company that we file and furnish electronically with the SEC.
References to the Company’s website in this Form 10-K are provided as a convenience and do not constitute, and should not be deemed, an incorporation by reference of the information contained on, or available through, the website, and such information should not be considered part of this Form 10-K.
Item 1A. Risk Factors
The following risks have had or in the future could have a material adverse effect on our business and results of operations.
Market and Industry Risks
Availability and demand for and pricing of our products and services may be adversely impacted by economic conditions, financial developments including rising inflation, high energy prices, increasing interest rates, a potential recessionary environment and other factors.
The automotive retail industry, and especially vehicle unit sales, is influenced by general economic conditions, particularly consumer confidence, the level of personal discretionary spending, interest rates, exchange rates, fuel prices, technology and business model changes, supply conditions, consumer transportation preferences, unemployment rates and credit availability. Consumer spending can be materially and adversely impacted by periods of economic uncertainty or by consumer concern about manufacturer viability. Increased tariffs may increase inflation, which would likely result in interest rates not decreasing as fast as expected and consumer demand declining as a result of increased costs of vehicle ownership.
The global economy experienced elevated levels of inflation beginning in 2022. In response to higher than historical average inflationary pressures and challenging macroeconomic conditions, the U.S. Federal Reserve (“the Federal Reserve”), along with other central banks, including in the U.K., maintained interest rates at elevated levels throughout 2023. In 2024, inflation began to return to historical norms. As a result, during the Current Year, the Federal Reserve and the Bank of England lowered their interest rates by 100 and 50 basis points, respectively, in an effort to stimulate economic activity and reduce unemployment. The impact of the lowering of interest rates on the levels of inflation and unemployment in the U.S., U.K. and Europe is uncertain. In Europe, rising energy costs as a result of supply disruptions and increased winter demand for heating could place strain on our suppliers’ ability to maintain current production levels of vehicles and vehicle parts. Across the European Union, these energy constraints could result in nations or regions enacting emergency energy related policies, limiting energy availability for manufacturers. The impact of these macroeconomic developments on our operations cannot be predicted with certainty. On January 29, 2025, the Federal Reserve held rates unchanged. On February 6, 2025, the Bank of England lowered interest rates by 25 basis points.
Additionally, President Donald Trump issued a series of executive orders since taking office in January 2025, including executive orders regarding tariffs. Refer to Item 7. Management’s Discussion and Analysis of Financial Condition and Results of Operations — Recent Events, for additional information regarding these executive orders.
Inflation, increased energy costs and a prolonged recession could adversely impact our operations, the operations of our suppliers and customer demand for our vehicles and services. The risk of slower future interest rate cuts or the maintenance of interest rates at current elevated levels could have a material adverse impact on our interest expense and ability to obtain financing through the debt markets, as well as consumers’ ability to obtain financing for the purchase of new and used vehicles. Refer to Item 7A. Quantitative and Qualitative Disclosures About Market Risk for additional analysis regarding our interest rate sensitivity.
A significant portion of our vehicles purchased by customers are financed. Tightening of the credit markets, increases in interest rates and credit conditions have and may continue to decrease the availability or increase the costs of automotive loans and leases and adversely impact our new and used vehicle sales and margins. In particular, if sub-prime finance companies apply further higher credit standards or if there is a further decline in the overall availability of credit in the sub-prime lending market, the ability of some consumers to purchase vehicles and F&I products could be even more limited, which could have a material adverse effect on our business and results of operations.
In addition, local economic, competitive and other conditions affect the performance of our dealerships. Our results of operations depend substantially on general economic conditions and spending habits in those regions of the U.S. and U.K. where we maintain our operations.
While EV sales continued to increase in the U.S. in 2024, challenges with EV technologies, including the development of the necessary charging infrastructure, continue to make headlines within the U.S. media market, raising concerns around consumer demand and interest in the products. Should EV demand decline at the same time as more OEMs transition to EV models, this could have a material adverse effect on our business and results of operations. In addition, President Donald Trump issued a series of executive orders since taking office in January 2025, including an executive order eliminating the EV mandate. Refer to Item 7. Management’s Discussion and Analysis of Financial Condition and Results of Operations — Recent Events, for additional information regarding these executive orders.
The U.K. government has established mandated targets for the sale of new zero emissions vehicles with increasing targets in future years. The overall U.K. market fell short of those mandated targets in 2024, with consumer preferences skewed towards traditional internal combustion engine vehicles. The government targets established for 2025 are higher than those previously required in 2024, and are expected to further challenge new vehicle sales in 2025 and beyond. These EV mandates could impact our vehicle manufacturers’ production mix and volumes, which in turn may impact our new vehicle sales and results of operations.
Deterioration in market conditions or changes in our credit profile could adversely affect our operations and financial condition.
We rely on the positive cash flow we generate from our operations and our access to the credit and capital markets to fund our operations, growth strategy, and return of cash to our shareholders through share repurchases and dividends. Changes in the credit and capital markets, including market disruptions, limited liquidity and interest rate fluctuations, may increase the cost of financing or restrict our access to these potential sources of future liquidity. Our continued access to liquidity sources on favorable terms depends on multiple factors, including our operating performance and credit ratings. Our debt securities currently are rated just below investment-grade and a downgrade of this rating likely would negatively impact our access to the debt markets and increase our cost of borrowing. Disruptions in the debt markets or any downgrade of our credit ratings could adversely affect our operations and financial condition and our ability to finance acquisitions or return cash to our shareholders. We can make no assurances that our ability to obtain additional financing through the debt markets will not be adversely affected by economic conditions or that we will be able to maintain or improve our current credit ratings.
Our floorplan notes payable, mortgages and other debt are benchmarked to SOFR, which can be highly volatile as a result of changing economic conditions. Although we utilize derivative instruments to partially mitigate our exposure to interest rate fluctuations, significant increases in SOFR or other variable interest rates could have a material adverse impact on our interest expense due to the significance of our debt and floorplan balances. Refer to Item 7A. Quantitative and Qualitative Disclosures About Market Risk for additional analysis regarding our interest rate sensitivity.
We are subject to risks associated with our dependence on manufacturer business relationships and agreements.
The success of our business is dependent on vehicle manufacturers on whom we rely exclusively on for our new vehicle inventory. Our ability to sell new vehicles is dependent on a vehicle manufacturer’s ability to produce and allocate to our dealerships an attractive, high quality and desirable product mix at the right time in order to satisfy customer demand.
Manufacturers generally support their franchisees by providing direct financial assistance in various areas, including, among others, incentives, floorplan assistance and advertising assistance. A discontinuation or change in our manufacturers’ warranty and incentive programs could adversely affect our business. Manufacturers also provide product warranties and, in some cases, service contracts to customers. Our dealerships perform warranty and service contract work for vehicles under manufacturer product warranties and service contracts and we bill the manufacturer directly, as opposed to invoicing the customer. In addition, we rely on manufacturers for various financing programs, OEM replacement parts, training, up-to-date product design, development of advertising materials and programs and other items necessary for the success of our dealerships.
Vehicle manufacturers may be adversely impacted by economic downturns or recessions, significant declines in the sales of their new vehicles, increases in interest rates, adverse fluctuations in currency exchange rates, declines in their credit ratings, reductions in access to capital or credit, labor strikes or similar disruptions (including within their major suppliers), supply shortages, rising raw material costs, rising employee benefit costs, adverse publicity that may reduce consumer demand for their products, including due to bankruptcy, product defects, litigation, ability to keep up with technology and business model changes, poor product mix or unappealing vehicle design, governmental laws and regulations, natural disasters or other adverse events. In particular, all of our OEMs are investing material amounts to develop electric and autonomous vehicles. These investments could cause financial strain on our OEMs or fail to deliver attractive vehicles for customers which could lead to adverse impacts on our business. The OEMs have been and could continue to be impacted by disruptions to the economy, lower than anticipated EV adoption, higher supply chain costs than emerging EV manufacturer competitors, delays in increasing factory production, labor negotiations, parts shortages, including semiconductor chips, and other disruptions. In the Current Year, a number of OEMs have announced write-offs of certain of their EV investments or scaled down electrification plans as EV demand slows, further contributing to the uncertainty of the EV market outlook and the long-term viability and profitability of OEM’s. These and other risks could materially adversely affect the financial condition of any manufacturer and impact its ability to profitably design, market, produce or distribute new vehicles, which in turn could have a material adverse effect on our business, results of operations and financial condition.
During the Current Year, the majority of our manufacturers’ production increased, driving an improvement in vehicles days’ supply. Our new vehicle days’ supply of inventory was approximately 44 days as of December 31, 2024, as compared to 37 days and 24 days for the years ended December 31, 2023 and 2022, respectively. It is impossible to predict with certainty when normalized production will resume at these manufacturers. If our manufacturers’ production remains at current reduced levels or in some cases continues to decline, diminishing our ability to meet the immediate needs of our customers, the production shortage could have a material adverse impact on our financial and operating results.
Additionally, President Donald Trump issued a series of executive orders since taking office in January 2025, including executive orders regarding tariffs. Refer to Item 7. Management’s Discussion and Analysis of Financial Condition and Results of Operations — Recent Events, for additional information regarding these executive orders. Many manufacturers of vehicles, parts and supplies are dependent on imported products and raw materials in their production. Any significant increase in existing tariffs on such goods and raw materials, or implementation of new tariffs, could increase production costs for OEM’s that would then be passed on to consumers, potentially leading to higher vehicle prices and reduced demand, which in turn could adversely affect our profits on the vehicles we sell. Additionally, the tariffs and other market developments could potentially cause our current OEM’s to lose market share to emerging EV-only OEM’s. Market share losses could not only impair our sales and profits but lead to potential impairments.
If we are unable to enter into new franchise agreements with manufacturers in connection with dealership acquisitions or maintain or renew our existing franchise agreements on favorable terms, our operations may be significantly impaired.
We are dependent on our relationships with manufacturers, which exercise a great degree of influence over our operations through the franchise and similar agreements. These agreements may be terminated or not renewed by the manufacturer for a variety of reasons, including network consolidation plans, any unapproved changes of ownership or management, sales and customer satisfaction performance deficiencies and other material breaches of the franchise agreements. For example, in the U.K., the Volkswagen Group has disclosed a five-year plan to reduce the number of partners in its dealer network. That plan may require us to dispose of, or close, up to thirteen of our Volkswagen and up to three Audi dealerships. Correspondingly, the plan may require us to purchase dealerships adjacent to our territories. In the U.S., manufacturers may also have a right of first refusal if we seek to sell dealerships. We also cannot guarantee that the terms of any renewals will be as favorable to us as our current agreements. Although we are generally protected in the U.S. by automotive dealership franchise laws requiring “good cause” be shown for such termination, if such an instance occurs, we cannot guarantee that the termination of the franchise will not be successful.
A manufacturer may also limit the number of its dealerships that we may own overall or in a particular geographic area. From time to time, we have not met all of the manufacturers’ requirements to make acquisitions and have received requests from manufacturers to dispose of certain of our dealerships. In the event one or more of our manufacturers sought to prohibit future acquisitions or imposed requirements to dispose of one or more of our dealerships, our acquisition and growth strategy could be adversely affected. Furthermore, if current manufacturers or future manufacturers are not required to conduct their business in accordance with state franchise laws and thereby circumvent the current dealer-network to sell directly to the customer, our results of operations may be materially and adversely affected.
Substantial competition in automotive sales, F&I and services could adversely impact our sales and our margins.
The automotive retail industry is highly competitive. Within our markets we are subject to competition from franchised automotive dealerships and other businesses as it relates to new and used vehicles, F&I, and parts and service. The internet has become a significant part of the advertising and sales process in our industry. Customers are using the internet to compare prices for new and used vehicles, automotive repair and maintenance services, finance and insurance products and other automotive products. If we are unable to effectively use the internet to attract customers to our own online channels, such as our AcceleRide® platform, and mobile applications, and, in turn, to our stores, our business, financial condition, results of operations and cash flows could be materially adversely affected. The use of social media by consumers increases the speed and extent that information and opinions can be shared, and negative posts or comments on social media about the Company or any of our dealerships could damage our reputation and brand names, which could have a material adverse effect on our business, financial condition, results of operations and cash flows.
We also face competition in arranging financing for our customers’ vehicle purchases from a broad range of financial institutions. Additionally, we do not have any cost advantage in purchasing new vehicles from vehicle manufacturers, and our franchise agreements do not grant us the exclusive right to sell a manufacturer’s product within a given geographic area. Subject to state laws in the U.S. that are generally designed to protect dealers, a manufacturer may grant another dealer a franchise to start a new dealership near one of our locations, or an existing dealership may move its dealership to a location that would more directly compete against us. The location of new dealerships near our existing dealerships could have a material and adverse effect on our operations and reduce the profitability of our existing dealerships. Increased competition can adversely impact our sales volumes and margins as well as our ability to acquire dealerships.
Please see Item 1. Business — Competition for further discussion of competition in our industry.
If we are unable to acquire and successfully integrate new dealerships into our business, the growth of our revenues and earnings could be adversely affected.
Growth in our revenues and earnings partially depends on our ability to acquire new dealerships and successfully integrate those dealerships into our existing operations. We cannot guarantee that we will be able to identify and acquire dealerships in the future. In addition, we cannot guarantee that any acquisitions will be successful or on terms and conditions consistent with past acquisitions. Restrictions imposed by our manufacturers, as well as covenants contained in our debt instruments, may directly or indirectly limit our ability to acquire additional dealerships. As competition for acquisitions increases that may result in fewer acquisition opportunities available to us and/or higher acquisition prices, and some of our competitors may have greater financial resources than us.
In addition, acquisitions involve a number of particular risks, including, among other things:
•incurring significantly higher capital expenditures and operating expenses;
•failing to obtain manufacturers’ consents to acquisitions of additional franchises;
•failing to integrate the operations and personnel of the acquired dealerships;
•entering new markets with which we are not familiar;
•incurring undiscovered liabilities at acquired dealerships, generally, in the case of stock acquisitions;
•disrupting our ongoing business;
•failing to retain key personnel of the acquired dealerships;
•failing to implement or improve controls and policies and information systems;
•impairing relationships with employees, manufacturers and customers; and
•incorrectly valuing acquired entities.
The integration process for acquisitions requires us to expand the scope of our operations and financial and other systems. Our management devotes a substantial amount of time and attention to the process of integrating the operations of acquired dealerships into our business. Additionally, the Company doubled its footprint in the U.K. during the Current Year through its acquisition of Inchcape Retail. Failure to effectively integrate the Inchcape Acquisition into the legacy U.K. operations could negatively impact our operating results in the U.K.
If any of these factors limit our ability to successfully integrate acquired dealerships into our operations or on a timely basis, our expectations regarding future results of operations, including certain run-rate revenue and expense synergies expected to result from acquisitions, might not be met. As a result, we may not be able to realize the expected benefits that we seek to achieve from the acquisitions. In addition, we may be required to spend additional time or money on integration that otherwise would be spent on the development and expansion of our business, including efforts to further expand our product portfolio.
Vehicle manufacturers may alter their distribution models.
In 2023, Mercedes Benz transitioned to an agency model for distribution of vehicles in the U.K. after collaborating with various automotive retailers and conducting pilot programs. In addition to the transition by Mercedes Benz in the U.K., certain of our other vehicle manufacturers serving the U.K. and U.S. markets have announced plans to explore an agency model for selling new vehicles. Under an agency model, our franchised dealerships receive a fee for facilitating the sale of a new vehicle to a customer but no longer record the vehicle sales price as revenue, record vehicles in inventory or incur floorplan interest expense, as has been historical practice. The agency model, as adopted by Mercedes Benz, resulted in reduced revenues, as we act as an agent of Mercedes Benz, receiving a commission for each sale and other expense fee support. We did not experience a material negative or positive impact to the U.K. region gross margin and consolidated results of operations as a result of the change to the Mercedes Benz agency model. Notwithstanding this fact, we cannot predict the actions of other manufacturers and whether the agency models proposed by them will have the same terms and conditions as those contracted by Mercedes Benz. The agency model, if adopted by other manufacturers, would reduce revenues with only the facilitation fee recorded as revenue. The other impacts to our U.K. and the U.S. regions and consolidated results of operations remain uncertain until such time as the other vehicle manufacturers provide additional details regarding their specific agency model plans. We are uncertain if agency models will be widely adopted in the U.K. or U.S.
Vehicle technology advancements and changes in consumer vehicle ownership preferences could adversely affect our new and used vehicle sales volumes, parts and service revenues and results of operations.
Vehicle technology advancements are occurring at an accelerating pace. These include driver assist functionality, autonomous vehicle development and rideshare and vehicle co-ownership business models. Many in the automotive industry believe that in the near future vehicles will be available to the automotive consumer at low usage costs, which may entice many vehicle owners, particularly in larger, highly populated areas, to abandon individual car ownership in favor of multiple co-ownership ride-sharing opportunities. Increased popularity in the ride-sharing subscription business model could adversely affect our new and used vehicle sales volumes, parts and service revenues and results of operations.
Operational Risks
We rely on third-party vendors and suppliers for key components of our business.
Many components of our business, including data management, key operational processes and critical customer systems, are provided by or licensed from various third-party vendors and suppliers. In addition, we also rely on third-party vendors to supply key products and services to us and our customers. One or more of these third-party vendors or suppliers may experience financial distress, technology challenges, cybersecurity incidents, staffing shortages or liquidity challenges, file for bankruptcy protection, go out of business, or suffer other disruptions in their business, each of which could affect their ability to serve us and our customers. For example, in June 2024, CDK Global LLC (“CDK”) experienced a cybersecurity event, which resulted in service outages on CDK’s dealers’ systems including our CDK DMS. If any of our vendors or suppliers fail to deliver their products or services for any reason, our business and results of operations and financial condition could be adversely impacted.
A failure of any of our information systems or those of our third-party service providers or a cybersecurity incident, including loss or unauthorized access of confidential information or PII about our customers or employees, could negatively affect our business, operations and financial condition.
We depend on the efficient operation of our information systems and those of our third-party service providers and rely on information systems at our dealerships in all aspects of our sales and service efforts, as well as in the preparation of our consolidated financial and operating data. All of our dealerships currently operate on two DMSs, one DMS for the U.S. and one DMS for the U.K. Additionally, in the ordinary course of business, we receive significant PII about our customers and our employees. PII is primarily collected at our dealerships and through our AcceleRide® platform via an online DMS. A cybersecurity attack to obtain such information could be caused by malicious insiders and third parties using sophisticated, targeted methods to circumvent firewalls, encryption and other security defenses, including hacking, malware, fraud, trickery, or other forms of deception. Although companies across all industries are affected by malicious efforts to obtain access to PII, the automotive dealership industry has been a particular target of identity thieves. The techniques used by cyber attackers change frequently and may be difficult to detect. We have implemented security measures that are designed to detect and protect against cyberattacks, as well as policies governing the deletion of PII, to limit the information exposed to a potential cyberattack.
Despite these measures and any additional measures we may implement or adopt in the future, our facilities and systems, and those of our third-party service providers, have been and are vulnerable to security breaches, computer viruses, malware, lost or misplaced data, programming errors, scams, ransomware, burglary, human errors, acts of vandalism, misdirected wire transfers or other events. If an unauthorized party is successful in obtaining trade secrets, PII, confidential, or otherwise protected information of our dealerships, our customers or our employees or in disrupting our operations through a cyberattack, the attack could result in loss of revenue, increase the costs of doing business, harm our competitiveness, reputation or customer or vendor relationships, satisfaction or loyalty. In addition, security breaches and other security incidents could expose us to a risk of loss or exposure of this information, which could result in potential liability, investigations, regulatory fines, penalties for violation of applicable laws or regulations, costs related to remediation or the payment of ransom, and litigation including individual claims or consumer class actions, administrative, civil or criminal investigations or actions, any of which could have a material adverse effect on our business, results of operations or financial condition. Likewise, our business could be significantly disrupted if (i) the DMS fails to integrate with other third-party information systems, customer relations management tools or other software, or to the extent that any of these systems become unavailable to us or fail to perform as designed for an extended period of time or (ii) our relationship with our DMS providers or any other third-party provider deteriorates.
Despite ongoing efforts to improve our ability to protect data from compromise, we may not be able to protect all of our data across our diverse systems and third-party vendors. For example, during the quarter ended June 30, 2024, we were informed of a cybersecurity incident experienced by CDK, which resulted in service outages on CDK’s dealers’ systems (the “CDK Incident”). CDK provides clients in the automotive industry, including our dealerships in the U.S., with a software as a service platform (“SaaS platform”) used by dealerships in managing customer relationships, sales, financing, service, inventory and back-office operations. In response to the CDK Incident, we immediately activated our cyber incident response procedures and proactively took measures to protect and isolate our systems from CDK’s platform. All of our U.S. dealerships continued to conduct business using alternative processes until CDK’s dealers’ systems were fully back online. We also do not believe that the CDK Incident resulted in a breach of any PII about our customers or employees. Our dealerships in the U.K. do not use CDK’s dealers’ systems and were therefore not impacted by the CDK service outage. As a consequence, we do not expect the CDK Incident to have a material impact on our overall financial condition or on its ongoing results of operations. However, if we, or any of our third-party services providers were to experience a material cybersecurity event, our business and results of operations and financial condition could be materially and adversely impacted.
A cybersecurity breach, including loss of confidential information or a breach of PII about our customers or employees, could negatively affect operations and result in high costs.
In the ordinary course of business, we receive significant PII about our customers and our employees. A cybersecurity attack to obtain such information could be caused by malicious insiders and third parties using sophisticated, targeted methods to circumvent firewalls, encryption and other security defenses, including hacking, fraud, trickery, or other forms of deception. Although many companies across many industries are affected by malicious efforts to obtain access to PII, the automotive dealership industry has been a particular target of identity thieves. The techniques used by cyber attackers change frequently and may be difficult to detect for long periods of time. We have implemented security measures that are designed to detect and protect against cyberattacks, as well as policies governing the deletion of PII, to limit the information exposed to a potential cyberattack.
Despite these measures and any additional measures we may implement or adopt in the future, our facilities and systems, and those of our third-party service providers, have been and are vulnerable to security breaches, computer viruses, lost or misplaced data, programming errors, scams, ransomware, burglary, human errors, acts of vandalism, misdirected wire transfers or other events. If an unauthorized party is successful in obtaining trade secrets, PII, confidential, or otherwise protected information of our dealerships, our customers or our employees or in disrupting our operations through a cyberattack, the attack could result in loss of revenue, increase costs of doing business, negatively affect customer satisfaction and loyalty, and expose us to negative publicity. In addition, security breaches and other security incidents could expose us to a risk of loss or exposure of this information, which could result in potential liability, investigations, regulatory fines, penalties for violation of applicable laws or regulations, costs related to remediation or the payment of ransom, and litigation including individual claims or consumer class actions, administrative, civil or criminal investigations or actions, any of which could have a material adverse effect on our business, results of operations or financial condition.
Further, advances in computer capabilities, new discoveries in the field of cryptography, inadequate facility security or other developments may result in a compromise or breach of the technology we use to safeguard confidential, personal, or otherwise protected information. As the breadth and complexity of the technologies we use continue to grow, including as a result of the use of mobile devices, cloud services, open-source software, social media and the increased reliance on devices connected to the internet, the potential risk of security breaches and cybersecurity attacks also increases. Despite ongoing efforts to improve our ability to protect data from compromise, we may not be able to protect all of our data across our diverse systems and third-party vendors. Our efforts to improve security and protect data result in increased capital and operating costs.
In addition, we are subject to numerous laws and regulations designed to protect the information of clients, customers, employees and other third parties that we collect and maintain. See Item 1. Business — Governmental Regulations for information on our risks related to compliance with such laws and regulations.
Our insurance does not fully cover all of our operational risks, and changes in the cost of insurance or the availability of insurance could materially increase our insurance costs or result in a decrease in our insurance coverage.
The operation of automobile dealerships is subject to a broad variety of risks. While we have insurance on our real property, comprehensive coverage for our vehicle inventory, general liability insurance, workers’ compensation insurance, employee dishonesty coverage, cybersecurity breach insurance, employment practices liability insurance, pollution coverage and errors and omissions insurance in connection with vehicle sales and financing activities, we are self-insured for a portion of our potential liabilities. We purchase insurance policies for worker’s compensation, liability, auto physical damage, property, pollution, employee medical benefits and other risks consisting of large deductibles and/or self-insured retentions.
In certain instances, our insurance may not fully cover an insured loss depending on the magnitude and nature of the claim. Additionally, changes in the cost of insurance or the availability of insurance in the future could substantially increase our costs to maintain our current level of coverage or could cause us to reduce our insurance coverage and increase the portion of our risks that we self-insure.
The insurance companies that underwrite our insurance require that we secure certain of our obligations for self-insured exposures with collateral. Our collateral requirements are set by the insurance companies and, to date, have been satisfied by posting surety bonds, letters of credit and/or cash deposits. Our collateral requirements may change from time to time based on, among other things, our total insured exposure and the related self-insured retention assumed under the policies. We are subject to potential premium cost fluctuations with the annual renewal of these programs.
Natural disasters and adverse weather events can disrupt our business and may adversely impact our results of operations, financial condition and cash flows.
Some of our dealerships are concentrated in states and regions in the U.S. and U.K., in which actual or threatened natural disasters and severe weather events (such as hurricanes, earthquakes, snowstorms, flooding, tornados and hailstorms) have in the past, and may in the future, disrupt our dealership operations. A disruption in our operations can adversely impact our business, results of operations, financial condition and cash flows. In addition to business interruption, the automotive retailing business is subject to substantial risk of property loss due to the significant concentration of property value at dealership locations. Natural disasters and severe weather events have in the past, and may in the future, impair the value of our dealership property and other assets. Although we have, subject to certain limitations and exclusions, substantial insurance, including business interruption insurance, we may be exposed to uninsured losses that could have a material adverse effect on our business, results of operations and financial condition. Additionally, should we suffer significant losses in a short period of time, we run the risk that our premiums and/or deductibles could increase, which could adversely affect our business.
Risks associated with our international operations could have a material adverse effect on our business, results of operations and financial condition.
We have operations in the U.K. and as a result, we face political and economic risks and uncertainties with respect to our international operations. These risks may include, but are not limited to:
•legal uncertainties, timing delays and expenses associated with tariffs, labor matters, import or export licenses and other trade barriers;
•transparency issues in general and, more specifically, the U.S. Foreign Corrupt Practices Act of 1974, as amended, the U.K. Bribery Act and other anti-corruption compliance laws and issues;
•inability to obtain or preserve franchise rights in the foreign countries in which we operate;
•fluctuations in foreign currency translations within our financial statements driven by exchange rate volatility; and
•infrastructure readiness for the U.K.’s transition to EVs.
We may fail to meet analyst and investor expectations, which could cause the price of our stock to decline.
Our common stock is traded publicly, and various securities analysts follow our financial results and frequently issue reports on the Company which include information about our historical financial results as well as their estimates of our future performance. These estimates are based on their own opinions and are often different from management’s estimates or expectations of our business. If our operating results are below the estimates or expectations of public market analysts and the expectations of our investors, our stock price could decline, adversely affecting, among other things, our access to capital and investor confidence in management and those charged with governance.
Legal, Regulatory and Compliance Risks
Regulatory requirements to reduce emissions in response to climate change, as well as changes in consumer demand towards fuel-efficient vehicles, and shifts in product offerings by manufacturers to meet such demand, could adversely affect our new and used vehicle sales volumes, parts and service revenues and our results of operations.
Volatile fuel prices have affected and may continue to affect consumer preferences in connection with the purchase of our vehicles. Rising fuel prices result in consumers being less likely to purchase larger, more expensive vehicles, such as sports utility vehicles or luxury automobiles, and more likely to purchase smaller, less expensive and more fuel-efficient vehicles. Conversely, lower fuel prices could have the opposite effect. Sudden changes in customer preferences make maintenance of an optimal mix of large and small vehicle inventory a challenge. Further increases or sharp declines in fuel prices could have a material adverse effect on our business and results of operations.
Changes in fuel prices, changes in customer preferences, government support, improvements in EVs and more EV options have increased the customer demand for more fuel-efficient vehicles and EVs. Significant increases in fuel economy requirements, new federal or state restrictions on emissions of carbon dioxide or new federal or state incentive programs that have or may be imposed on vehicles and automobile fuels could adversely affect demand for certain vehicles, annual miles driven or the products we sell. For example, on March 20, 2024, the EPA finalized new emissions standards establishing more stringent air emissions limits for light and medium-duty vehicles, which include passenger cars, vans, pickups, sedans and SUVs for model years 2027 through 2032. Representatives of the U.K. government have proposed a ban on the sale of gasoline engines in new cars and new vans that would take effect as early as 2035. These and similar proposals may have a significant impact on the future mix of vehicles provided by our manufacturers. Any future impact of these regulations on our operations cannot be predicted with certainty.
With a potential increase in demand by consumers for EVs, and the former Biden administration’s support for such actions, certain manufacturers announced plans to increase production of fuel-efficient vehicles and EVs. As more EVs potentially enter the market, and internal combustion or diesel engine vehicle production is reduced, it will be necessary to adapt to such changes by selling and servicing these units effectively in order to meet consumer demands and support the profitability of our dealerships. We may not be able to accurately predict, prepare for and respond to new kinds of technological innovations with respect to EV and other technologies that minimize emissions. If maintenance costs of EVs were to substantially decrease, this could have a material adverse effect on our parts and service revenues. If consumer demand increases for fuel efficient vehicles or EVs and our manufacturers are not able to adapt and produce vehicles that meet the customer demands or we are unable to align with the manufacturers of these vehicles, such events could adversely affect our new and used vehicle sales volumes, parts and service revenues and our results of operations. In addition, President Donald Trump issued a series of executive orders since taking office in January 2025, including an executive order eliminating the EV mandate. Refer to Item 7. Management’s Discussion and Analysis of Financial Condition and Results of Operations — Recent Events, for additional information regarding these executive orders.
Additionally, in October 2023, the Governor of California signed the Climate Corporate Data Accountability Act (“CCDAA”) and Climate-Related Financial Risk Act (“CRFRA”) into law. The CCDAA requires both public and private U.S. companies that are “doing business in California” and that have a total annual revenue of $1 billion to publicly disclose and verify, on an annual basis, Scope 1, 2 and 3 GHG emissions. In September 2024, the Governor of California signed into law the Climate Corporate Accountability: Climate-Related Financial Risk Act, which amends certain climate disclosure requirements in CCDAA. The CRFRA requires the disclosure of a climate-related financial risk report (in line with the Task Force on the Climate-related Financial Disclosures recommendations or equivalent disclosure requirements under the International Sustainability Standards Board’s climate-relate disclosure standards) every other year for public and private companies that are “doing business in California” and have total annual revenue of $500 million. Reporting under both laws would begin in 2026. Currently, we are assessing the impact of these laws on our business and there are legal challenges to be filed with respect to the scope of the law. However, absent clarification or revisions to the law, finalization and implementation may result in additional costs to comply with these disclosure requirements, as well as increased costs of and restrictions on access to capital for us or our customers.
Further, the SEC released its final rule on climate-related disclosures on March 6, 2024, requiring the disclosure of certain climate-related risks and financial impacts, as well as GHG emissions. Under the rule, large accelerated filers would be required to incorporate the applicable climate-related disclosures into their filings beginning in fiscal year 2025, with additional requirements relating to the disclosure of Scope 1 and 2 GHG emissions, if material, and attestation reports for certain large accelerated filers subsequently phasing in. However, the future of the SEC climate rule is uncertain at this time given that its implementation has been stayed pending the outcome of legal challenges; moreover, it is uncertain whether the Commission may seek to change or revoke the rule though we cannot predict whether such action will occur or its timing. In addition, the Trump Administration may take action with respect to these climate-related disclosures, the outcome of which we cannot predict with certainty. As a result, the ultimate impact of the SEC rule, or any similar climate-related disclosure requirements imposed in the future, on our business is uncertain and may result in increased compliance costs and increased costs of and restrictions on access to capital.
Changes to laws and regulations could adversely impact our operations and financial condition.
New laws and regulations at the state and federal level may be enacted which could materially adversely impact our business. For example, in December 2023, the FTC adopted new regulations for automotive dealers that would prohibit a wide range of current industry-accepted sales practices with regard to sales and advertising of our vehicles and products, require an extensive series of both oral and written disclosures to be made at the initial contact in regard to the sale price of vehicles, financial terms and voluntary protection products, mandate the posting of certain pricing and other information on dealer websites, and impose burdensome recordkeeping requirements. While the proposed rule has been vacated, if similar regulations were implemented, our failure to adhere to new policies could subject the Company to significant monetary and other penalties or require us to make adjustments to our products and services, any or all of which could result in lost revenues, increased expenses and substantial adverse publicity. These changes, if adopted as proposed, may lead to longer transaction times for the sale of vehicles, complicate the transaction process, decrease customer satisfaction, and impose recordkeeping burdens on our employees, among other effects. If these regulations were to be enacted, it could have an adverse effect on our business and profitability. Future legislation and regulations and changes in existing legislation and regulations, or interpretations thereof, could cause additional expenditures, tax liabilities, restrictions and delays in connection with our current business as well as future projects, the extent of which cannot be predicted.
We are subject to automotive and other laws and regulations, which, if we are found to have violated, may adversely affect our business and results of operations.
A number of laws and regulations applicable to automotive companies affect our business and conduct, including, but not limited to, our sales, operations, financing, insurance, advertising and employment practices. Other rules such as franchise laws and regulations, consumer protection laws and other extensive laws and regulations apply to new and used motor vehicle dealers. Additionally, in every jurisdiction in which we operate, we must obtain various permits and licenses in order to conduct our business. Any failure to comply with these laws and regulations may result in administrative, civil or criminal penalties, the imposition of investigatory remedial obligations or the limitations on certain aspects of our operations.
Refer to Item 1. Business — Governmental Regulations for further discussion of automotive and other laws and regulations impacting our business.
Operational risks associated with environmental laws and regulations may expose us to significant costs and liabilities.
Our business activities in the U.S. and U.K. are subject to stringent federal, state and local laws, regulations and other controls governing specific health and safety criteria to address worker protection, the release of materials into the environment or otherwise relating to environmental protection. These laws, regulations and controls may impose numerous obligations upon our operations including the acquisition of permits to conduct regulated activities, the imposition of restrictions on where or how to manage or dispose of used products and wastes, the occurrence of capital expenditures to limit or prevent releases of such material and the imposition of substantial liabilities for pollution resulting from our operations or attributable to former operations. Our compliance with these regulations may expose us to significant costs and liabilities.
With a potential increase in demand by consumers for EVs, we will incur costs and liabilities to sell and service EVs, including, but not limited to, personal protective equipment for employees, capital expenditures for specialized tools and equipment, service shop space and battery storage costs. In addition, President Donald Trump issued a series of executive orders since taking office in January 2025, including executive orders eliminating the EV mandate and impacting environmental regulations. Refer to Item 7. Management’s Discussion and Analysis of Financial Condition and Results of Operations — Recent Events, for additional information regarding these executive orders.
Additionally, vehicle manufacturers in the U.S. and U.K. are subject to varying guidelines, laws and regulations adopted by their applicable governmental and administrative agencies, which include GHG emissions and CAFE standards in the U.S. Such standards may affect our manufacturers’ ability to produce cost effective vehicles, which may have a material adverse effect on our sales.
Refer to Item 1. Business — Governmental Regulations for further discussion of environmental and regulations impacting our business.
Risks Related to Accounting Matters
The impairment of our goodwill and/or indefinite-lived intangibles could have a material adverse effect on our results of operations.
We assess goodwill and other indefinite-lived intangibles for impairment on an annual basis, or more frequently when events or circumstances indicate that an impairment may have occurred. Performance issues at individual dealerships, as well as adverse retail automotive industry and economic trends, increase the risk of an impairment charge, which could have a material adverse impact on our results of operations. No goodwill impairments were recorded during the years ended December 31, 2024, 2023 and 2022. During the years ended December 31, 2024, 2023 and 2022, we recognized $28.2 million, $25.1 million and $1.3 million, respectively, of intangible franchise rights impairment. We may be required to record impairment charges if market and industry conditions deteriorate to such a level whereby the fair value of our reporting units, individually, is less than the carrying value of the corresponding reporting unit. We are subject to several market and industry risks as outlined elsewhere herein this Item 1A. Risk Factors, which could have a material adverse impact on our cash flows. We cannot accurately predict the amount and timing of any additional impairment charge at this time; however, any such impairment charge could have an adverse effect on our results of operations. Refer to Note 13. Intangible Franchise Rights and Goodwill within our Notes to Consolidated Financial Statements for further discussion of impairment.
New accounting guidance or changes in the interpretation or application of existing accounting guidance could adversely affect our financial performance.
The implementation of new SEC rules and regulations and accounting standards could require certain systems, internal processes and controls and other changes that could increase our operating costs, and result in changes to our financial statements.
U.S. GAAP and related accounting pronouncements, implementation guidelines and interpretations with regard to a wide range of matters that are relevant to our business involve many subjective assumptions, estimates and judgments by our management. Changes in these rules or their interpretation or in underlying management assumptions, estimates or judgments could significantly change our reported or expected financial performance. The outcome of such changes could include litigation or regulatory actions which could adversely affect our financial condition and results of operations.
Our internal controls and procedures may fail or be circumvented.
Management has designed and implemented, and periodically reviews and updates, our internal controls, disclosure controls and procedures, and corporate governance policies and procedures. While we have not experienced a material failure of our internal controls, any system of controls, no matter how well designed and operated, can provide only reasonable, not absolute, assurance that the objectives of the system are met. Any failure or circumvention of our controls and procedures, or failure to comply with regulations related to controls and procedures, could have a material adverse effect on our business, results of operations and financial condition.
Item 1B. Unresolved Staff Comments
None.
Item 1C. Cybersecurity
Description of Processes for Assessing, Identifying and Managing Cybersecurity Risks
In the ordinary course of business, our information systems on which we run our business operations and store confidential or proprietary data, such as PII about our customers and our employees, are subject to potential cyber-attack. The techniques used by cyber attackers change frequently and may be difficult to detect for long periods of time. See Item 1A. Risk Factors for additional information about the risks to our business associated with a breach or compromise to our IT systems. We have implemented security measures that are designed to detect and protect against cyberattacks. Our processes and procedures align with the National Institute of Standards and Technology Cybersecurity Framework. In particular, we seek to assess, identify and manage cybersecurity risks through the processes described below:
Risk Assessment
A multi-layered system designed to protect and monitor data and cybersecurity risk has been implemented. Regular assessments and testing of our cybersecurity safeguards are conducted by independent third-party cybersecurity experts. Our internal audit department additionally conducts regular audits to assess management’s processes and controls employed to identify and manage material cybersecurity risks. We use a variety of layered applications to alert us to suspicious activity.
Incident Identification and Response
A security information and event management process (“SIEM”) has been implemented to help promptly identify cybersecurity incidents. In the event of any breach or cybersecurity incident, we have an incident response plan within our SIEM that is designed to provide for action to contain the incident, mitigate the impact and restore normal operations efficiently. We conduct annual reviews of our cyber incident response plan.
Cybersecurity Training and Awareness
Cybersecurity awareness among our employees is promoted with regular training and awareness programs. Employees who access our systems are required to undergo annual cybersecurity training and, each year, employees are required to test their understanding of our cybersecurity policies. Further, our employees that handle PII are required to undergo training, including phishing exercises and awareness programs on the appropriate management, use and protection of that information.
Access Controls
We have endeavored to implement physical access controls to prevent access to endpoints that may leave Company data vulnerable to attack. We have also sought to implement systems to prevent encrypted information from bypassing certain Company-defined information control mechanisms and have also sought to purge or wipe information from certain Company-defined endpoints after consecutive, unsuccessful logon attempts or other indicators of unauthorized access.
Finally, we have implemented encrypted virtual private networks in an effort to enhance the integrity of remote connections and have endeavored to protect wireless access points to our systems using authentication of users and/or devices. Segmented networks and user access controls are used to limit unauthorized access to sensitive information and systems. Employees are required to use multi-factor authentication and regularly update their passwords.
Encryption and Data Protection
Encryption methods are used to protect sensitive data in transit and at rest. This includes the encryption of customer data, financial information and other confidential data. We also have a program in place to monitor our retained data by identifying PII and ensuring it is not stored outside of approved locations and systems. We maintain policies that govern the deletion of PII to limit the information exposed to a potential cyberattack. We have endeavored to use strong, up-to-date encryption algorithms and to regularly update and patch systems in an effort to guard against vulnerabilities. Similarly, we have sought to manage encryption keys with use of a secure key management system and rotation of keys after use. We have implemented secure protocols, including, e.g., hypertext transfer protocol secure for web traffic and secure file transfer protocol for file transfers.
Processes designed to monitor cybersecurity incidents are also intended to protect our data. Our cybersecurity safeguards, including those provided by third parties, are designed to monitor for unauthorized access. These services are designed to monitor both internal and external threats.
We engage several third-party consultants in connection with our risk assessment and risk management, and we have established separate processes and procedures to oversee and identify cybersecurity risks associated with third parties.
Finally, we have implemented encrypted virtual private networks for remote connections. The above cybersecurity risk management processes are integrated into the Company’s overall enterprise risk management program. Cybersecurity risks are understood to be significant business risks, and as such, are considered as an important component of our enterprise-wide risk management approach.
Impact of Risks from Cybersecurity Threats
As of the date of this Form 10-K, though the Company and our service providers have experienced certain cybersecurity incidents, we are not aware of any cybersecurity threats that have materially affected or are reasonably likely to materially affect the Company. However, we acknowledge that cybersecurity threats are continually evolving, and the possibility of future cybersecurity incidents remains. Our processes designed to monitor cybersecurity incidents are also intended to protect our data. Our cybersecurity safeguards, including those provided by third parties, are designed to monitor for unauthorized access, extraction, and deletion of certain sensitive data, large quantities of data, and other anomalous network traffic. These services are designed to monitor both internal and external threats. Despite the implementation of our cybersecurity processes, our security measures cannot guarantee that a significant cyberattack will not occur. A successful attack on our IT systems could have significant consequences to our business. While we devote resources to our security measures to protect our systems and information, these measures cannot provide absolute security. See Item 1A. Risk Factors for additional information about the risks to our business associated with a breach or compromise to our IT systems.
Board of Directors’ Oversight of Risks from Cybersecurity Threats
The Board of Directors oversees risks from cybersecurity threats. The Board of Directors delegates oversight of our operations risk, including quarterly reviews of cybersecurity and data protection, to the Finance/Risk Management Committee, and delegates compliance with cybersecurity policies to the Audit Committee. Both the Finance/Risk Management Committee and the Audit Committee report to the full Board of Directors on cybersecurity matters. Additionally, on an annual basis, management reviews results from tests of key cybersecurity systems with the full Board of Directors and the steps taken to mitigate new cybersecurity risks which have been identified.
The Finance/Risk Management Committee oversees the formal process to identify risks company-wide, allocate them to the appropriate committee of the Board of Directors, and ensure that risk mitigation activities are being followed. At each of its meetings, the Finance/Risk Management Committee receives presentations from our Chief Information Officer (the “CIO”) on cybersecurity and information security risk, as well as our cybersecurity initiatives.
The Audit Committee oversees compliance with cybersecurity policies with guidance from members of management, including the Vice President of Internal Audit, who informs the Audit Committee on the audit results of cybersecurity controls.
Management’s Role in Assessing and Managing Cybersecurity Threats
Our IT and Security team, which is headed by our CIO, is responsible for our efforts to comply with cybersecurity standards, establish industry-recognized protocols and protect the integrity, confidentiality and availability of our IT infrastructure. Our CIO and various members of the IT and Security team, meet regularly with members of management to address key security and privacy issues. Our CIO has more than 25 years of infrastructure and cybersecurity experience. We also have formed a cyber event incident team, composed of our CIO, Chief Financial Officer, Corporate Controller, Chief Legal Officer and vice president of Internal Audit, who, upon the occurrence of a cybersecurity incident, convene to assess the materiality of the event as well as the appropriate remediation and escalation procedures, including escalation to our Chief Executive Officer, the Finance/Risk Management Committee, the Audit Committee and the Board of Directors. Our internal audit department additionally conducts regular audits to assess management’s processes and controls employed to identify and manage material cybersecurity risks.
Item 2. Properties
We lease our corporate headquarters, located at 730 Town and Country Blvd, Suite 500, Houston, Texas. We own our regional headquarters in the U.K. As of December 31, 2024, we had 259 dealerships as shown below by region and by whether the associated real estate is leased or owned: | | | | | | | | | | | | | | |
| | | Dealerships |
| Region | | Owned | | Leased |
| United States | | 113 | | | 32 | |
| United Kingdom | | 66 | | | 48 | |
| Total | | 179 | | | 80 | |
| | | | |
| | | | |
| | | | |
| | | | |
| | | | |
| | | | |
| | | | |
| | | | |
| | | | |
| | | | |
| | | | |
| | | | |
| | | | |
| | | | |
| | | | |
Item 3. Legal Proceedings
For discussion of our legal proceedings, refer to Note 18. Commitments and Contingencies within our Notes to Consolidated Financial Statements.
Item 4. Mine Safety Disclosures
Not Applicable.
PART II
Item 5. Market for Company’s Common Equity, Related Stockholder Matters and Issuer Purchases of Equity Securities
Our common stock is listed on the New York Stock Exchange under the symbol “GPI.” There were 33 holders of record of our common stock as of February 7, 2025. A substantially greater number of holders of our common stock are “street name” or beneficial holders, whose shares are held of record by banks, brokers and other financial institutions.
Issuer Purchases of Equity Securities
The following table sets forth information with respect to shares of common stock repurchased by us during the three months ended December 31, 2024: | | | | | | | | | | | | | | | | | | | | | | | | | | |
| Period | | Total Number of Shares Purchased | | Average Price Paid per Share | | Total Number of Shares Purchased as Part of Publicly Announced Plans or Programs (1) | | Approximate Dollar Value of Shares that May Yet Be Purchased Under the Plans or Programs (in millions) |
| October 1, 2024 — October 31, 2024 | | 23,200 | | | $ | 349.30 | | | 23,200 | | | $ | 166.7 | |
| November 1, 2024 — November 30, 2024 | | 5,790 | | | $ | 399.22 | | | 5,790 | | | $ | 497.7 | |
| December 1, 2024 — December 31, 2024 | | 51,310 | | | $ | 420.35 | | | 51,310 | | | $ | 476.1 | |
| Total | | 80,300 | | | | | 80,300 | | | |
| | | | | | | | |
(1) Our Board of Directors from time to time authorizes the repurchase of shares of our common stock up to a certain monetary limit. On November 12, 2024, our Board of Directors increased the Company’s share repurchase authorization to $500.0 million. Share repurchases may take place on the open market or otherwise, and all or part of the repurchases may be made pursuant to Rule 10b5-1 trading plans or in privately negotiated transactions. The timing of share repurchases are subject to the business judgment of our Board of Directors, taking into consideration our historical and projected results of operations, financial condition, cash flows, capital requirements, covenant compliance, changes in laws and regulations, current economic environment and other factors considered relevant.
As of December 31, 2024, we had $476.1 million available under our current share repurchase authorization. Our share repurchase authorization does not have an expiration date. Refer to Item 7. Management’s Discussion and Analysis of Financial Condition and Results of Operations for additional information on share repurchases.
Performance Graph
The following graph and table compares the performance of our common stock to the S&P 500 Index and to an industry peer group for our last five fiscal years. The members of the peer group are Asbury Automotive Group, Inc., AutoNation, Inc., Lithia Motors, Inc., Penske Automotive Group, Inc. and Sonic Automotive, Inc. The information contained in the table below was provided by Zack’s Investment Research, Inc.
The returns of each member of the peer group are weighted according to each member’s stock market capitalization. The graph assumes that the value of the investment in our common stock, the S&P 500 Index and the peer group was $100 on the last trading day of December 2019, and that all dividends were reinvested.
| | | | | | | | | | | | | | | | | | | | | | | | | | | | | | | | | | | | | | |
| | Base Period | | Indexed Returns for the Years Ended |
| Company /Index | | 12/31/2019 | | 12/31/2020 | | 12/31/2021 | | 12/31/2022 | | 12/31/2023 | | 12/31/2024 |
| Group 1 Automotive, Inc. | | $ | 100.00 | | | $ | 131.92 | | | $ | 197.92 | | | $ | 184.34 | | | $ | 313.70 | | | $ | 436.25 | |
| S&P 500 Index — Total Return | | $ | 100.00 | | | $ | 118.40 | | | $ | 152.39 | | | $ | 124.79 | | | $ | 157.59 | | | $ | 197.02 | |
| Peer Group | | $ | 100.00 | | | $ | 146.65 | | | $ | 205.17 | | | $ | 189.46 | | | $ | 268.62 | | | $ | 285.44 | |
| | | | | | | | | | | | |
| | | | | | | | | | | | |
| | | | | | | | | | | | |
| | | | | | | | | | | | |
Item 7. Management’s Discussion and Analysis of Financial Condition and Results of Operations
The following discussion should be read in conjunction with Part I, including the matters set forth in Item 1A. Risk Factors, and our Consolidated Financial Statements and notes thereto included elsewhere in this Form 10-K. Refer to Item 1. Business — General for an overview of our operations. Additionally, refer to Item 7. Management’s Discussion and Analysis of Financial Condition and Results of Operations in our 2023 Annual Report on Form 10-K for management’s discussion and analysis of financial condition and results of operations for the fiscal year 2023 compared to fiscal year 2022.
Overview
Our operating results reflect the combined performance of each of our interrelated business activities. Historically, various facets of our business have been directly or indirectly impacted by a variety of supply/demand factors, including vehicle inventories, consumer confidence, consumer transportation preferences, discretionary spending levels, availability and affordability of consumer credit, new vehicle introductions and innovations, manufacturer incentives, weather patterns, fuel prices, inflation and interest rates. For example, during periods of sustained economic downturn or significant supply/demand imbalances, new vehicle sales may be negatively impacted as consumers tend to shift their purchases to used vehicles. Some consumers may delay their purchasing decisions altogether, electing instead to continue to maintain and repair their existing vehicles. In such cases, however, we believe the new vehicle sales impact on our overall business is mitigated by our ability to offer other products and services, such as used vehicles and parts, as well as maintenance, repair and collision services. In addition, our ability to expediently adjust our cost structure in response to changes in new vehicle sales volumes also tempers any negative impact of such sales volume changes.
Recent Events
On February 1, 2025, President Donald Trump signed executive orders imposing a 25% tariff on most imports from Mexico and Canada and a 10% tariff on most imports from China. The tariffs were effective February 4, 2025, however that same day a 30-day pause was granted to Mexico and Canada. While the potential implications of these imposed tariffs remain uncertain for the auto industry, there may be a significant impact on the price of our products as well as the future mix and demand for vehicles provided by our manufacturers. We will continue to monitor the impact of the Trump administration’s policies on our manufacturers and dealership operations.
Since taking office on January 20, 2025, President Donald Trump has signed a series of executive orders. Through these executive orders, the Trump administration, among other initiatives, directed the U.S. to formally withdraw from the Paris Agreement, eliminate the EV mandate, put forth a federal energy policy to support traditional energy exploration and production, declared a national energy emergency to expedite energy and infrastructure projects, issued a regulatory freeze on all executive departments and agencies to review pending and existing laws and regulations and froze the hiring of federal civilian employees in the executive branch. The executive orders also rescinded certain previous executive orders of the former Biden administration. The impact of the Trump administration’s executive orders on our results of operations cannot be predicted with certainty.
On August 1, 2024, we completed the acquisition of Inchcape Retail automotive operations in the U.K. The Inchcape Acquisition, comprised of 54 dealership locations, certain real estate and three collision centers, substantially increased our portfolio across the U.K. Refer to Note 3. Acquisitions within our Notes to Consolidated Financial Statements for additional discussion of our acquisition of Inchcape Retail.
On June 19, 2024, we were informed of a cybersecurity incident experienced by CDK, which resulted in service outages on CDK’s dealers’ systems. CDK provides clients in the automotive industry, including Group 1 dealerships in the U.S., with a SaaS platform used by dealerships in managing customer relationships, sales, financing, service, inventory and back-office operations. The CDK Incident temporarily disrupted our business applications and processes in our U.S. operations that rely on CDK’s dealers’ systems. Despite the CDK Incident, all Group 1 U.S. dealerships continued to conduct business using alternative processes until CDK’s dealers’ systems were available. On June 26, 2024, CDK restored service to us for the core DMS, at which time, subject to certain modified procedures, we resumed processing transactions through the CDK DMS. The overall impact of the CDK Incident did not have a material impact on our overall financial condition or on our ongoing results of operations.
The global economy experienced elevated levels of inflation beginning in 2022. In response to higher than historical average inflationary pressures and challenging macroeconomic conditions, the Federal Reserve, along with other central banks, including in the U.K., maintained interest rates at elevated levels throughout 2023. In 2024, inflation began to return to historical norms. As a result, during the Current Year, the Federal Reserve and the Bank of England lowered their interest rates by 100 and 50 basis points, respectively, in an effort to stimulate economic activity and reduce unemployment. On January 29, 2025, the Federal Reserve held rates unchanged. On February 6, 2025, the Bank of England lowered interest rates by 25 basis points.
Although the Federal Reserve and Bank of England decreased interest rates and inflationary pressures moderated during 2024, existing elevated prices as a result of previous rates of inflation above historical levels continue to reduce the disposable income of our customers. In addition, volatility in new vehicle availability and higher interest rates over historical average rates have increased the monthly cost of financing vehicles as compared to prior periods. These factors have contributed to a continued decline in used vehicle prices during the Current Year as compared to the year ended December 31, 2023 (“Prior Year”).
Recent Accounting Pronouncements
Refer to Note 1. Basis of Presentation, Consolidation and Summary of Accounting Policies within our Notes to Consolidated Financial Statements.
Critical Accounting Policies and Accounting Estimates
The preparation of our financial statements in conformity with U.S. GAAP requires management to make certain estimates and assumptions. These estimates and assumptions affect the reported amounts of assets and liabilities, the disclosures of contingent assets and liabilities at the balance sheet date and the amounts of revenues and expenses recognized during the reporting period. Below are the accounting policies and estimates that have been determined to be critical to our business operations and the understanding of our results of operations.
Goodwill and Intangible Franchise Rights
We are organized into two geographic regions, the U.S. region and the U.K. region. Each region represents a reporting unit for the purpose of assessing goodwill for impairment. In addition to goodwill, we have identifiable intangibles in the form of rights under our franchise agreements with manufacturers, which are recorded at an individual dealership level.
We evaluate goodwill and intangible franchise rights for impairment annually as of October 31, or more frequently if events or circumstances indicate possible impairment has occurred. We have the option of performing a qualitative assessment of impairment to determine whether any further quantitative assessment for impairment is necessary. The option of whether or not to perform a qualitative assessment is made annually and may vary by reporting unit. If we elect to bypass the qualitative assessment or if we determine, on the basis of qualitative factors, that the fair value of the reporting unit is more likely than not less than the carrying amount, a quantitative test would be required.
In 2024, we elected to perform a quantitative test on the U.K. reporting unit and a qualitative test on the U.S. reporting unit. Based on the tests performed for the U.S. and U.K. reporting units in the fourth quarter of 2024, no impairments of goodwill were recorded during the Current Year. No goodwill impairments were recorded on any reporting units during the Prior Year. The quantitative goodwill impairment test is dependent on management estimates and assumptions used to determine the fair value of our reporting units. While no impairment was recognized in 2024 based on our quantitative assessment of the U.K. reporting unit, future sustained negative operating results, as well as the deterioration of the macroeconomic environment in the U.K., could result in impairment of the goodwill attributable to the U.K. reporting unit in future periods. Refer to Note 13. Intangible Franchise Rights and Goodwill within our Notes to Consolidated Financial Statements for further discussion of goodwill, including management’s use of estimates and assumptions.
During the Current Year, impairment charges of $28.2 million were recorded for intangible franchise rights. In the Prior Year, impairment charges of $25.1 million were recorded for intangible franchise rights. As our intangible franchise rights are tested for impairment at the dealership level, any impairments are specific to the performance and outlook of the respective dealership.
Refer to Note 13. Intangible Franchise Rights and Goodwill within our Notes to Consolidated Financial Statements for further discussion of our intangibles, including fair value assumptions.
Results of Operations
The “same store” amounts presented below include the results of dealerships and corporate headquarters for the identical months in each comparative period, commencing with the first full month in which we owned the dealership. Amounts related to divestitures are excluded from each comparative period, ending with the last full month in which we owned the dealership. Same store results provide a measurement of our ability to grow revenues and profitability of our existing stores and also provide a metric for peer group comparisons. For these reasons, same store results allow management to accurately manage and monitor the underlying performance of the business and is also useful to investors.
We evaluate our results of operations on both an as reported and a constant currency basis. The constant currency presentation, which is a non-GAAP measure, excludes the impact of fluctuations in foreign currency exchange rates. Our primary foreign currency exposure is to the GBP. We believe providing constant currency information provides valuable supplemental information regarding our underlying business and results of operations, consistent with how we evaluate our performance. We calculate constant currency percentages by converting our current period reported results for entities reporting in currencies other than USD using comparative period exchange rates rather than the actual exchange rates in effect during the respective periods. The constant currency performance measures should not be considered a substitute for, or superior to, the measures of financial performance prepared in accordance with U.S. GAAP. Additionally, we caution investors not to place undue reliance on non-GAAP measures, but also to consider them with the most directly comparable U.S. GAAP measures. Our management also uses constant currency and adjusted cash flows from operating, investing and financing activities in conjunction with U.S. GAAP financial measures to assess our business, including communication with our Board of Directors, investors and industry analysts concerning financial performance. We disclose these non-GAAP measures and the related reconciliations because we believe investors use these metrics in evaluating longer-term period-over-period performance. These metrics also allow investors to better understand and evaluate the information used by management to assess operating performance.
Certain amounts in the financial statements may not compute due to rounding. All computations have been calculated using unrounded amounts for all periods presented.
Retail new vehicle units sold include new vehicle agency units sold under agency arrangements with certain manufacturers in the U.K. The agency units and related revenues are excluded from the calculation of the average sales price per unit sold for new vehicles due to their net presentation within revenues as only the sales commission is reported in revenues for dealerships operating under an agency arrangement. The agency units and related net revenues are included in the calculation of gross profit per unit sold.
The following tables summarize our operating results on a reported basis and on a same store basis for the Current Year, as compared to the Prior Year.
Reported Operating Data — Consolidated
(In millions, except unit data)
| | | | | | | | | | | | | | | | | | | | | | | | | | | | | | | | | | | | | | | | |
| For the Years Ended December 31, | | |
| 2024 | | 2023 | | Increase/ (Decrease) | | % Change | | | Currency Impact on Current Period Results | | Constant Currency % Change | | |
| Revenues: | | | | | | | | | | | | | | |
| New vehicle retail sales | $ | 9,972.4 | | | $ | 8,774.6 | | | $ | 1,197.8 | | | 13.7 | % | | | $ | 59.6 | | | 13.0 | % | | |
| Used vehicle retail sales | 6,179.9 | | | 5,693.5 | | | 486.3 | | | 8.5 | % | | | 49.9 | | | 7.7 | % | | |
| Used vehicle wholesale sales | 462.4 | | | 441.4 | | | 21.0 | | | 4.7 | % | | | 4.1 | | | 3.8 | % | | |
| Total used | 6,642.3 | | | 6,135.0 | | | 507.3 | | | 8.3 | % | | | 54.0 | | | 7.4 | % | | |
| Parts and service sales | 2,491.0 | | | 2,222.3 | | | 268.7 | | | 12.1 | % | | | 13.6 | | | 11.5 | % | | |
| F&I, net | 828.7 | | | 741.9 | | | 86.8 | | | 11.7 | % | | | 3.0 | | | 11.3 | % | | |
| Total revenues | $ | 19,934.3 | | | $ | 17,873.7 | | | $ | 2,060.6 | | | 11.5 | % | | | $ | 130.1 | | | 10.8 | % | | |
| Gross profit: | | | | | | | | | | | | | | |
| New vehicle retail sales | $ | 717.9 | | | $ | 767.0 | | | $ | (49.1) | | | (6.4) | % | | | $ | 4.7 | | | (7.0) | % | | |
| Used vehicle retail sales | 330.0 | | | 300.9 | | | 29.1 | | | 9.7 | % | | | 2.5 | | | 8.8 | % | | |
| Used vehicle wholesale sales | (3.3) | | | (3.8) | | | 0.5 | | | 12.7 | % | | | (0.1) | | | 15.4 | % | | |
| Total used | 326.7 | | | 297.2 | | | 29.6 | | | 9.9 | % | | | 2.4 | | | 9.1 | % | | |
| Parts and service sales | 1,367.7 | | | 1,214.2 | | | 153.5 | | | 12.6 | % | | | 7.7 | | | 12.0 | % | | |
| F&I, net | 828.7 | | | 741.9 | | | 86.8 | | | 11.7 | % | | | 3.0 | | | 11.3 | % | | |
| Total gross profit | $ | 3,241.0 | | | $ | 3,020.3 | | | $ | 220.7 | | | 7.3 | % | | | $ | 17.9 | | | 6.7 | % | | |
| Gross margin: | | | | | | | | | | | | | | |
| New vehicle retail sales | 7.2 | % | | 8.7 | % | | (1.5) | % | | | | | | | | | |
| Used vehicle retail sales | 5.3 | % | | 5.3 | % | | 0.1 | % | | | | | | | | | |
| Used vehicle wholesale sales | (0.7) | % | | (0.9) | % | | 0.1 | % | | | | | | | | | |
| Total used | 4.9 | % | | 4.8 | % | | 0.1 | % | | | | | | | | | |
| Parts and service sales | 54.9 | % | | 54.6 | % | | 0.3 | % | | | | | | | | | |
| | | | | | | | | | | | | | |
| Total gross margin | 16.3 | % | | 16.9 | % | | (0.6) | % | | | | | | | | | |
| Units sold: | | | | | | | | | | | | | | |
| Retail new vehicles sold | 203,677 | | | 175,566 | | | 28,111 | | | 16.0 | % | | | | | | | |
| Retail used vehicles sold | 209,687 | | | 187,656 | | | 22,031 | | | 11.7 | % | | | | | | | |
| Wholesale used vehicles sold | 52,600 | | | 43,763 | | | 8,837 | | | 20.2 | % | | | | | | | |
| Total used | 262,287 | | | 231,419 | | | 30,868 | | | 13.3 | % | | | | | | | |
| Average sales price per unit sold: | | | | | | | | | | | | | | |
| New vehicle retail | $ | 49,817 | | | $ | 50,325 | | | $ | (508) | | | (1.0) | % | | | $ | 296 | | | (1.6) | % | | |
| Used vehicle retail | $ | 29,472 | | | $ | 30,340 | | | $ | (868) | | | (2.9) | % | | | $ | 238 | | | (3.6) | % | | |
| Gross profit per unit sold: | | | | | | | | | | | | | | |
| New vehicle retail sales | $ | 3,525 | | | $ | 4,369 | | | $ | (844) | | | (19.3) | % | | | $ | 23 | | | (19.9) | % | | |
| Used vehicle retail sales | $ | 1,574 | | | $ | 1,604 | | | $ | (30) | | | (1.9) | % | | | $ | 12 | | | (2.6) | % | | |
| Used vehicle wholesale sales | $ | (63) | | | $ | (86) | | | $ | 24 | | | 27.4 | % | | | $ | (2) | | | 29.7 | % | | |
| Total used | $ | 1,246 | | | $ | 1,284 | | | $ | (38) | | | (3.0) | % | | | $ | 9 | | | (3.7) | % | | |
| F&I PRU | $ | 2,005 | | | $ | 2,043 | | | $ | (38) | | | (1.9) | % | | | $ | 7 | | | (2.2) | % | | |
| Other: | | | | | | | | | | | | | | |
| | | | | | | | | | | | | | |
| | | | | | | | | | | | | | |
| | | | | | | | | | | | | | |
| | | | | | | | | | | | | | |
| | | | | | | | | | | | | | |
| SG&A expenses | $ | 2,179.2 | | | $ | 1,926.8 | | | $ | 252.4 | | | 13.1 | % | | | $ | 14.6 | | | 12.3 | % | | |
| | | | | | | | | | | | | | |
| | | | | | | | | | | | | | |
| | | | | | | | | | | | | | |
| SG&A as % gross profit | 67.2 | % | | 63.8 | % | | 3.4 | % | | | | | | | | | |
| | | | | | | | | | | | | | |
| | | | | | | | | | | | | | |
| | | | | | | | | | | | | | |
| | | | | | | | | | | | | | |
| | | | | | | | | | | | | | |
| Floorplan expense: | | | | | | | | | | | | | | |
| Floorplan interest expense | $ | 108.5 | | | $ | 64.1 | | | $ | 44.4 | | | 69.3 | % | | | $ | 0.6 | | | 68.4 | % | | |
Less: floorplan assistance (1) | 88.4 | | | 71.2 | | | 17.2 | | | 24.2 | % | | | 0.1 | | | 24.1 | % | | |
| Net floorplan expense | $ | 20.1 | | | $ | (7.1) | | | $ | 27.2 | | | | | | $ | 0.5 | | | | | |
| | | | | | | | | | | | | | |
(1) Floorplan assistance is included within Gross profit — New vehicle retail sales above and Cost of sales — New vehicle retail sales in our Consolidated Statements of Operations.
Same Store Operating Data — Consolidated
(In millions, except unit data)
| | | | | | | | | | | | | | | | | | | | | | | | | | | | | | | | | | | | | | | | | | | |
| | For the Years Ended December 31, | | |
| | 2024 | | 2023 | | Increase/ (Decrease) | | % Change | | | Currency Impact on Current Period Results | | Constant Currency % Change | | |
| Revenues: | | | | | | | | | | | | | | |
| New vehicle retail sales | $ | 8,785.0 | | | $ | 8,507.7 | | | $ | 277.4 | | | 3.3 | % | | | $ | 40.8 | | | 2.8 | % | | |
| Used vehicle retail sales | 5,454.4 | | | 5,499.0 | | | (44.6) | | | (0.8) | % | | | 32.7 | | | (1.4) | % | | |
| Used vehicle wholesale sales | 398.9 | | | 422.5 | | | (23.6) | | | (5.6) | % | | | 2.7 | | | (6.2) | % | | |
| Total used | 5,853.3 | | | 5,921.5 | | | (68.2) | | | (1.2) | % | | | 35.4 | | | (1.7) | % | | |
| Parts and service sales | 2,242.2 | | | 2,143.0 | | | 99.2 | | | 4.6 | % | | | 8.6 | | | 4.2 | % | | |
| F&I, net | 753.2 | | | 716.6 | | | 36.6 | | | 5.1 | % | | | 1.9 | | | 4.8 | % | | |
| Total revenues | $ | 17,633.7 | | | $ | 17,288.8 | | | $ | 344.9 | | | 2.0 | % | | | $ | 86.6 | | | 1.5 | % | | |
| Gross profit: | | | | | | | | | | | | | | |
| New vehicle retail sales | $ | 617.4 | | | $ | 745.3 | | | $ | (127.9) | | | (17.2) | % | | | $ | 2.9 | | | (17.6) | % | | |
| Used vehicle retail sales | 290.0 | | | 291.4 | | | (1.4) | | | (0.5) | % | | | 1.6 | | | (1.0) | % | | |
| Used vehicle wholesale sales | (3.3) | | | (3.6) | | | 0.3 | | | 7.8 | % | | | (0.1) | | | 10.8 | % | | |
| Total used | 286.7 | | | 287.8 | | | (1.1) | | | (0.4) | % | | | 1.5 | | | (0.9) | % | | |
| Parts and service sales | 1,222.0 | | | 1,169.8 | | | 52.2 | | | 4.5 | % | | | 4.9 | | | 4.0 | % | | |
| F&I, net | 753.2 | | | 716.6 | | | 36.6 | | | 5.1 | % | | | 1.9 | | | 4.8 | % | | |
| Total gross profit | $ | 2,879.3 | | | $ | 2,919.5 | | | $ | (40.2) | | | (1.4) | % | | | $ | 11.2 | | | (1.8) | % | | |
| Gross margin: | | | | | | | | | | | | | | |
| New vehicle retail sales | 7.0 | % | | 8.8 | % | | (1.7) | % | | | | | | | | | |
| Used vehicle retail sales | 5.3 | % | | 5.3 | % | | — | % | | | | | | | | | |
| Used vehicle wholesale sales | (0.8) | % | | (0.9) | % | | — | % | | | | | | | | | |
| Total used | 4.9 | % | | 4.9 | % | | — | % | | | | | | | | | |
| Parts and service sales | 54.5 | % | | 54.6 | % | | (0.1) | % | | | | | | | | | |
| | | | | | | | | | | | | | |
| Total gross margin | 16.3 | % | | 16.9 | % | | (0.6) | % | | | | | | | | | |
| Units sold: | | | | | | | | | | | | | | |
| Retail new vehicles sold | 175,397 | | | 170,119 | | | 5,278 | | | 3.1 | % | | | | | | | |
| Retail used vehicles sold | 185,494 | | | 180,946 | | | 4,548 | | | 2.5 | % | | | | | | | |
| Wholesale used vehicles sold | 45,410 | | | 42,141 | | | 3,269 | | | 7.8 | % | | | | | | | |
| Total used | 230,904 | | | 223,087 | | | 7,817 | | | 3.5 | % | | | | | | | |
| Average sales price per unit sold: | | | | | | | | | | | | | | |
| New vehicle retail | $ | 50,586 | | | $ | 50,368 | | | $ | 218 | | | 0.4 | % | | | $ | 234 | | | — | % | | |
| Used vehicle retail | $ | 29,405 | | | $ | 30,390 | | | $ | (986) | | | (3.2) | % | | | $ | 176 | | | (3.8) | % | | |
| Gross profit per unit sold: | | | | | | | | | | | | | | |
| New vehicle retail sales | $ | 3,520 | | | $ | 4,381 | | | $ | (861) | | | (19.7) | % | | | $ | 17 | | | (20.0) | % | | |
| Used vehicle retail sales | $ | 1,563 | | | $ | 1,611 | | | $ | (47) | | | (2.9) | % | | | $ | 8 | | | (3.5) | % | | |
| Used vehicle wholesale sales | $ | (74) | | | $ | (86) | | | $ | 12 | | | 14.4 | % | | | $ | (2) | | | 17.3 | % | | |
| Total used | $ | 1,242 | | | $ | 1,290 | | | $ | (49) | | | (3.8) | % | | | $ | 6 | | | (4.3) | % | | |
| F&I PRU | $ | 2,087 | | | $ | 2,041 | | | $ | 46 | | | 2.2 | % | | | $ | 5 | | | 2.0 | % | | |
| Other: | | | | | | | | | | | | | | |
| | | | | | | | | | | | | | |
| | | | | | | | | | | | | | |
| | | | | | | | | | | | | | |
| | | | | | | | | | | | | | |
| | | | | | | | | | | | | | |
| SG&A expenses | $ | 1,960.4 | | | $ | 1,873.6 | | | $ | 86.8 | | | 4.6 | % | | | $ | 8.9 | | | 4.2 | % | | |
| | | | | | | | | | | | | | |
| | | | | | | | | | | | | | |
| | | | | | | | | | | | | | |
| SG&A as % gross profit | 68.1 | % | | 64.2 | % | | 3.9 | % | | | | | | | | | |
| | | | | | | | | | | | | | |
| | | | | | | | | | | | | | |
| | | | | | | | | | | | | | |
| | | | | | | | | | | | | | |
| | | | | | | | | | | | | | |
| | | | | | | | | | | | | | |
| | | | | | | | | | | | | | |
| | | | | | | | | | | | | | |
Reported Operating Data — U.S.
(In millions, except unit data)
| | | | | | | | | | | | | | | | | | | | | | | | | | | | |
| | For the Years Ended December 31, | | |
| | 2024 | | 2023 | | Increase/(Decrease) | | % Change | | |
| Revenues: | | | | | | | | | | |
| New vehicle retail sales | | $ | 8,110.1 | | | $ | 7,433.6 | | | $ | 676.6 | | | 9.1 | % | | |
| Used vehicle retail sales | | 4,550.7 | | | 4,458.7 | | | 92.0 | | | 2.1 | % | | |
| Used vehicle wholesale sales | | 323.8 | | | 314.4 | | | 9.4 | | | 3.0 | % | | |
| Total used | | 4,874.5 | | | 4,773.1 | | | 101.4 | | | 2.1 | % | | |
| Parts and service sales | | 2,052.7 | | | 1,933.3 | | | 119.4 | | | 6.2 | % | | |
| F&I, net | | 735.6 | | | 674.3 | | | 61.3 | | | 9.1 | % | | |
| Total revenues | | $ | 15,772.9 | | | $ | 14,814.2 | | | $ | 958.7 | | | 6.5 | % | | |
| Gross profit: | | | | | | | | | | |
| New vehicle retail sales | | $ | 571.8 | | | $ | 646.1 | | | $ | (74.3) | | | (11.5) | % | | |
| Used vehicle retail sales | | 249.2 | | | 240.8 | | | 8.5 | | | 3.5 | % | | |
| Used vehicle wholesale sales | | 4.5 | | | 2.6 | | | 2.0 | | | 76.7 | % | | |
| Total used | | 253.7 | | | 243.3 | | | 10.4 | | | 4.3 | % | | |
| Parts and service sales | | 1,119.7 | | | 1,046.4 | | | 73.3 | | | 7.0 | % | | |
| F&I, net | | 735.6 | | | 674.3 | | | 61.3 | | | 9.1 | % | | |
| Total gross profit | | $ | 2,680.9 | | | $ | 2,610.1 | | | $ | 70.7 | | | 2.7 | % | | |
| Gross margin: | | | | | | | | | | |
| New vehicle retail sales | | 7.1 | % | | 8.7 | % | | (1.6) | % | | | | |
| Used vehicle retail sales | | 5.5 | % | | 5.4 | % | | 0.1 | % | | | | |
| Used vehicle wholesale sales | | 1.4 | % | | 0.8 | % | | 0.6 | % | | | | |
| Total used | | 5.2 | % | | 5.1 | % | | 0.1 | % | | | | |
| Parts and service sales | | 54.5 | % | | 54.1 | % | | 0.4 | % | | | | |
| | | | | | | | | | |
| Total gross margin | | 17.0 | % | | 17.6 | % | | (0.6) | % | | | | |
| Units sold: | | | | | | | | | | |
| Retail new vehicles sold | | 157,662 | | | 142,809 | | | 14,853 | | | 10.4 | % | | |
| Retail used vehicles sold | | 152,970 | | | 145,617 | | | 7,353 | | | 5.0 | % | | |
| Wholesale used vehicles sold | | 37,223 | | | 31,456 | | | 5,767 | | | 18.3 | % | | |
| Total used | | 190,193 | | | 177,073 | | | 13,120 | | | 7.4 | % | | |
| Average sales price per unit sold: | | | | | | | | | | |
| New vehicle retail | | $ | 51,440 | | | $ | 52,052 | | | $ | (613) | | | (1.2) | % | | |
| Used vehicle retail | | $ | 29,749 | | | $ | 30,619 | | | $ | (871) | | | (2.8) | % | | |
| Gross profit per unit sold: | | | | | | | | | | |
| New vehicle retail sales | | $ | 3,627 | | | $ | 4,524 | | | $ | (897) | | | (19.8) | % | | |
| Used vehicle retail sales | | $ | 1,629 | | | $ | 1,653 | | | $ | (24) | | | (1.5) | % | | |
| Used vehicle wholesale sales | | $ | 121 | | | $ | 81 | | | $ | 40 | | | 49.3 | % | | |
| Total used | | $ | 1,334 | | | $ | 1,374 | | | $ | (40) | | | (2.9) | % | | |
| F&I PRU | | $ | 2,368 | | | $ | 2,338 | | | $ | 30 | | | 1.3 | % | | |
| Other: | | | | | | | | | | |
| | | | | | | | | | |
| | | | | | | | | | |
| | | | | | | | | | |
| | | | | | | | | | |
| | | | | | | | | | |
| SG&A expenses | | $ | 1,704.0 | | | $ | 1,622.9 | | | $ | 81.1 | | | 5.0 | % | | |
| | | | | | | | | | |
| | | | | | | | | | |
| | | | | | | | | | |
| SG&A as % gross profit | | 63.6 | % | | 62.2 | % | | 1.4 | % | | | | |
| | | | | | | | | | |
| | | | | | | | | | |
| | | | | | | | | | |
| | | | | | | | | | |
| | | | | | | | | | |
Same Store Operating Data — U.S.
(In millions, except unit data)
| | | | | | | | | | | | | | | | | | | | | | | | | |
| For the Years Ended December 31, | | |
| 2024 | | 2023 | | Increase/(Decrease) | | % Change | | |
| Revenues: | | | | | | | | | |
| New vehicle retail sales | $ | 7,378.3 | | | $ | 7,166.7 | | | $ | 211.7 | | | 3.0 | % | | |
| Used vehicle retail sales | 4,263.5 | | | 4,264.2 | | | (0.7) | | | — | % | | |
| Used vehicle wholesale sales | 298.0 | | | 295.4 | | | 2.6 | | | 0.9 | % | | |
| Total used | 4,561.5 | | | 4,559.6 | | | 1.9 | | | — | % | | |
| Parts and service sales | 1,934.6 | | | 1,865.1 | | | 69.5 | | | 3.7 | % | | |
| F&I, net | 685.8 | | | 649.0 | | | 36.8 | | | 5.7 | % | | |
| Total revenues | $ | 14,560.2 | | | $ | 14,240.3 | | | $ | 319.8 | | | 2.2 | % | | |
| Gross profit: | | | | | | | | | |
| New vehicle retail sales | $ | 516.6 | | | $ | 624.5 | | | $ | (107.9) | | | (17.3) | % | | |
| Used vehicle retail sales | 233.3 | | | 231.3 | | | 2.0 | | | 0.9 | % | | |
| Used vehicle wholesale sales | 4.1 | | | 2.7 | | | 1.4 | | | 50.6 | % | | |
| Total used | 237.4 | | | 234.0 | | | 3.4 | | | 1.5 | % | | |
| Parts and service sales | 1,047.0 | | | 1,007.0 | | | 40.0 | | | 4.0 | % | | |
| F&I, net | 685.8 | | | 649.0 | | | 36.8 | | | 5.7 | % | | |
| Total gross profit | $ | 2,486.7 | | | $ | 2,514.4 | | | $ | (27.7) | | | (1.1) | % | | |
| Gross margin: | | | | | | | | | |
| New vehicle retail sales | 7.0 | % | | 8.7 | % | | (1.7) | % | | | | |
| Used vehicle retail sales | 5.5 | % | | 5.4 | % | | — | % | | | | |
| Used vehicle wholesale sales | 1.4 | % | | 0.9 | % | | 0.5 | % | | | | |
| Total used | 5.2 | % | | 5.1 | % | | 0.1 | % | | | | |
| Parts and service sales | 54.1 | % | | 54.0 | % | | 0.1 | % | | | | |
| | | | | | | | | |
| Total gross margin | 17.1 | % | | 17.7 | % | | (0.6) | % | | | | |
| Units sold: | | | | | | | | | |
| Retail new vehicles sold | 142,312 | | | 137,362 | | | 4,950 | | | 3.6 | % | | |
| Retail used vehicles sold | 143,226 | | | 138,907 | | | 4,319 | | | 3.1 | % | | |
| Wholesale used vehicles sold | 34,010 | | | 29,834 | | | 4,176 | | | 14.0 | % | | |
| Total used | 177,236 | | | 168,741 | | | 8,495 | | | 5.0 | % | | |
| Average sales price per unit sold: | | | | | | | | | |
| New vehicle retail | $ | 51,846 | | | $ | 52,173 | | | $ | (327) | | | (0.6) | % | | |
| Used vehicle retail | $ | 29,768 | | | $ | 30,698 | | | $ | (931) | | | (3.0) | % | | |
| Gross profit per unit sold: | | | | | | | | | |
| New vehicle retail sales | $ | 3,630 | | | $ | 4,546 | | | $ | (916) | | | (20.2) | % | | |
| Used vehicle retail sales | $ | 1,629 | | | $ | 1,665 | | | $ | (36) | | | (2.2) | % | | |
| Used vehicle wholesale sales | $ | 120 | | | $ | 91 | | | $ | 29 | | | 32.1 | % | | |
| Total used | $ | 1,339 | | | $ | 1,386 | | | $ | (47) | | | (3.4) | % | | |
| F&I PRU | $ | 2,402 | | | $ | 2,349 | | | $ | 52 | | | 2.2 | % | | |
| Other: | | | | | | | | | |
| | | | | | | | | |
| | | | | | | | | |
| | | | | | | | | |
| | | | | | | | | |
| | | | | | | | | |
| SG&A expenses | $ | 1,636.5 | | | $ | 1,571.2 | | | $ | 65.3 | | | 4.2 | % | | |
| | | | | | | | | |
| | | | | | | | | |
| | | | | | | | | |
| SG&A as % gross profit | 65.8 | % | | 62.5 | % | | 3.3 | % | | | | |
| | | | | | | | | |
| | | | | | | | | |
| | | | | | | | | |
U.S. Region — Year Ended December 31, 2024 compared to 2023
The following discussion of our U.S. operating results is on an as reported and same store basis. The difference between as reported amounts and same store amounts is related to acquisition and disposition activity, as well as new add-point openings.
Revenues
Total revenues in the U.S. during the Current Year increased $958.7 million, or 6.5%, as compared to the same period in the Prior Year, driven by the acquisition of stores and higher same store revenues.
Total same store revenues in the U.S. during the Current Year increased $319.8 million, or 2.2%, as compared to the Prior Year. This increase was driven by higher revenues across all business lines except used vehicle retail sales.
New vehicle retail same store revenues outperformed the Prior Year, driven by more units sold, partially offset by lower pricing. Manufacturer vehicle deliveries were higher in the Current Year and as a result, our inventory levels were higher than the Prior Year, providing for the increase in units sold. Higher new vehicle supply compared to the Prior Year created downward pressure on pricing and margins. We ended the Current Year with a U.S. new vehicle inventory supply of 43 days, 7 days higher than the Prior Year.
Used vehicle retail same store revenues slightly underperformed the Prior Year, driven by lower pricing, partially offset by more units sold. Used vehicle supply improved as a result of higher new vehicle supply. However, lingering impacts from above-historical average inflation over the past two years reducing the disposable income of our customers and higher interest rates compared to historical averages increasing the monthly cost of financing vehicles, continued to create downward pressure on pricing.
Parts and service same store revenues outperformed the Prior Year, driven by increases in customer pay and warranty revenues, partially offset by decreases in wholesale and collision revenues. This outperformance reflects increased business activity for warranty and customer pay services, supported by increased same store technician headcount through our technician recruiting and retention efforts, providing greater capacity to meet increased demand.
F&I same store revenues outperformed the Prior Year, primarily driven by higher same store new and used vehicle units sold, coupled with higher same store F&I gross profit per unit sold. Penetration rates for vehicle service contracts, new vehicle finance and other F&I products improved, contributing to the higher same store F&I gross profit per unit sold. OEM incentives have increased in the Current Year, leading to the improved new vehicle F&I penetration.
Gross Profit
Total gross profit in the U.S. during the Current Year increased $70.7 million, or 2.7%, as compared to the Prior Year, driven by the acquisition of stores, partially offset by lower same store gross profit.
Total same store gross profit in the U.S. during the Current Year decreased $27.7 million, or 1.1%, as compared to the Prior Year, driven by downward pressure on new vehicle margins, partially offset by increases from parts and service, F&I and used vehicle gross profit.
New vehicle retail same store gross profit underperformed the Prior Year, driven by a decrease in new vehicle retail same store gross profit per unit sold, partially offset by an increase in units sold. The decrease in new vehicle retail same store gross profit per unit sold is due to higher deliveries from our OEMs, leading to increasing inventory levels of new vehicles as described above.
Used vehicle retail same store gross profit outperformed the Prior Year, primarily driven by higher same store used vehicle retail units sold, partially offset by lower same store gross profit per unit sold, as described above for used vehicle retail same store revenues. Used vehicle wholesale same store gross profit outperformed the Prior Year, driven by an increase in same store gross profit per unit sold, coupled with an increase in same store units sold.
Parts and service same store gross profit outperformed the Prior Year, as described above for parts and service same store revenues.
F&I same store gross profit outperformed the Prior Year, as described above for F&I same store revenues.
Total same store gross margin in the U.S. decreased 58 basis points, primarily driven by an underperformance in new vehicle retail, for the reasons described above for same store gross profit per unit sold for new vehicle retail. This underperformance was partially offset by improvement in parts and service and used vehicle gross margins.
SG&A Expenses
SG&A as a percentage of gross profit increased 139 basis points and increased 332 basis points on an as reported and same store basis, respectively, compared to the Prior Year.
Total SG&A expenses in the U.S. during the Current Year increased $81.1 million, or 5.0%, as compared to the Prior Year, primarily driven by higher same store SG&A expenses. Total same store SG&A expenses in the U.S. during the Current Year increased $65.3 million or 4.2% as compared to the Prior Year, primarily driven by increased employee related costs, outside services, advertising expenses, loaner car and related expenses, and fees associated with the Inchcape Acquisition. SG&A expenses also included $5.9 million in pre-tax one-time compensation payments to retain our field employees during the CDK Incident.
Reported Operating Data — U.K.
(In millions, except unit data)
| | | | | | | | | | | | | | | | | | | | | | | | | | | | | | | | | | | | | | | | | | |
| For the Years Ended December 31, | | | | |
| 2024 | | 2023 | | Increase/ (Decrease) | | % Change | | | Currency Impact on Current Period Results | | Constant Currency % Change | | | | |
| Revenues: | | | | | | | | | | | | | | | | |
| New vehicle retail sales | $ | 1,862.3 | | | $ | 1,341.0 | | | $ | 521.3 | | | 38.9 | % | | | $ | 59.6 | | | 34.4 | % | | | | |
| Used vehicle retail sales | 1,629.2 | | | 1,234.8 | | | 394.4 | | | 31.9 | % | | | 49.9 | | | 27.9 | % | | | | |
| Used vehicle wholesale sales | 138.6 | | | 127.1 | | | 11.5 | | | 9.1 | % | | | 4.1 | | | 5.8 | % | | | | |
| Total used | 1,767.8 | | | 1,361.9 | | | 405.9 | | | 29.8 | % | | | 54.0 | | | 25.8 | % | | | | |
| Parts and service sales | 438.3 | | | 289.0 | | | 149.3 | | | 51.7 | % | | | 13.6 | | | 47.0 | % | | | | |
| F&I, net | 93.0 | | | 67.6 | | | 25.4 | | | 37.6 | % | | | 3.0 | | | 33.2 | % | | | | |
| Total revenues | $ | 4,161.5 | | | $ | 3,059.5 | | | $ | 1,102.0 | | | 36.0 | % | | | $ | 130.1 | | | 31.8 | % | | | | |
| Gross profit: | | | | | | | | | | | | | | | | |
| New vehicle retail sales | $ | 146.0 | | | $ | 120.8 | | | $ | 25.2 | | | 20.9 | % | | | $ | 4.7 | | | 16.9 | % | | | | |
| Used vehicle retail sales | 80.8 | | | 60.2 | | | 20.6 | | | 34.3 | % | | | 2.5 | | | 30.0 | % | | | | |
| Used vehicle wholesale sales | (7.8) | | | (6.3) | | | (1.5) | | | (23.4) | % | | | (0.1) | | | (21.7) | % | | | | |
| Total used | 73.0 | | | 53.9 | | | 19.1 | | | 35.5 | % | | | 2.4 | | | 31.0 | % | | | | |
| Parts and service sales | 248.0 | | | 167.8 | | | 80.2 | | | 47.8 | % | | | 7.7 | | | 43.2 | % | | | | |
| F&I, net | 93.0 | | | 67.6 | | | 25.4 | | | 37.6 | % | | | 3.0 | | | 33.2 | % | | | | |
| Total gross profit | $ | 560.1 | | | $ | 410.1 | | | $ | 150.0 | | | 36.6 | % | | | $ | 17.9 | | | 32.2 | % | | | | |
| Gross margin: | | | | | | | | | | | | | | | | |
| New vehicle retail sales | 7.8 | % | | 9.0 | % | | (1.2) | % | | | | | | | | | | | |
| Used vehicle retail sales | 5.0 | % | | 4.9 | % | | 0.1 | % | | | | | | | | | | | |
| Used vehicle wholesale sales | (5.6) | % | | (5.0) | % | | (0.7) | % | | | | | | | | | | | |
| Total used | 4.1 | % | | 4.0 | % | | 0.2 | % | | | | | | | | | | | |
| Parts and service sales | 56.6 | % | | 58.1 | % | | (1.5) | % | | | | | | | | | | | |
| | | | | | | | | | | | | | | | |
| Total gross margin | 13.5 | % | | 13.4 | % | | 0.1 | % | | | | | | | | | | | |
| Units sold: | | | | | | | | | | | | | | | | |
| Retail new vehicles sold | 46,015 | | | 32,757 | | | 13,258 | | | 40.5 | % | | | | | | | | | |
| Retail used vehicles sold | 56,717 | | | 42,039 | | | 14,678 | | | 34.9 | % | | | | | | | | | |
| Wholesale used vehicles sold | 15,377 | | | 12,307 | | | 3,070 | | | 24.9 | % | | | | | | | | | |
| Total used | 72,094 | | | 54,346 | | | 17,748 | | | 32.7 | % | | | | | | | | | |
| Average sales price per unit sold: | | | | | | | | | | | | | | | | |
| New vehicle retail | $ | 43,765 | | | $ | 42,488 | | | $ | 1,277 | | | 3.0 | % | | | $ | 1,401 | | | (0.3) | % | | | | |
| Used vehicle retail | $ | 28,725 | | | $ | 29,373 | | | $ | (648) | | | (2.2) | % | | | $ | 880 | | | (5.2) | % | | | | |
| Gross profit per unit sold: | | | | | | | | | | | | | | | | |
| New vehicle retail sales | $ | 3,174 | | | $ | 3,689 | | | $ | (515) | | | (14.0) | % | | | $ | 103 | | | (16.8) | % | | | | |
| Used vehicle retail sales | $ | 1,425 | | | $ | 1,432 | | | $ | (7) | | | (0.5) | % | | | $ | 45 | | | (3.6) | % | | | | |
| Used vehicle wholesale sales | $ | (508) | | | $ | (514) | | | $ | 6 | | | 1.3 | % | | | $ | (7) | | | 2.6 | % | | | | |
| Total used | $ | 1,013 | | | $ | 991 | | | $ | 22 | | | 2.2 | % | | | $ | 34 | | | (1.2) | % | | | | |
| F&I PRU | $ | 906 | | | $ | 904 | | | $ | 2 | | | 0.2 | % | | | $ | 29 | | | (3.0) | % | | | | |
| Other: | | | | | | | | | | | | | | | | |
| SG&A expenses | $ | 475.2 | | | $ | 303.9 | | | $ | 171.3 | | | 56.4 | % | | | $ | 14.6 | | | 51.5 | % | | | | |
| | | | | | | | | | | | | | | | |
| | | | | | | | | | | | | | | | |
| | | | | | | | | | | | | | | | |
| SG&A as % gross profit | 84.8 | % | | 74.1 | % | | 10.7 | % | | | | | | | | | | | |
| | | | | | | | | | | | | | | | |
| | | | | | | | | | | | | | | | |
| | | | | | | | | | | | | | | | |
| | | | | | | | | | | | | | | | |
| | | | | | | | | | | | | | | | |
Same Store Operating Data — U.K.
(In millions, except unit data)
| | | | | | | | | | | | | | | | | | | | | | | | | | | | | | | | | | | | | | | | | | | | |
| For the Years Ended December 31, | | | | | | |
| 2024 | | 2023 | | Increase/ (Decrease) | | % Change | | | Currency Impact on Current Period Results | | Constant Currency % Change | | | | | | |
| Revenues: | | | | | | | | | | | | | | | | | | |
| New vehicle retail sales | $ | 1,406.7 | | | $ | 1,341.0 | | | $ | 65.7 | | | 4.9 | % | | | $ | 40.8 | | | 1.9 | % | | | | | | |
| Used vehicle retail sales | 1,190.9 | | | 1,234.8 | | | (43.9) | | | (3.6) | % | | | 32.7 | | | (6.2) | % | | | | | | |
| Used vehicle wholesale sales | 100.9 | | | 127.1 | | | (26.2) | | | (20.6) | % | | | 2.7 | | | (22.7) | % | | | | | | |
| Total used | 1,291.8 | | | 1,361.9 | | | (70.1) | | | (5.1) | % | | | 35.4 | | | (7.7) | % | | | | | | |
| Parts and service sales | 307.7 | | | 278.0 | | | 29.7 | | | 10.7 | % | | | 8.6 | | | 7.6 | % | | | | | | |
| F&I, net | 67.4 | | | 67.6 | | | (0.2) | | | (0.3) | % | | | 1.9 | | | (3.1) | % | | | | | | |
| Total revenues | $ | 3,073.6 | | | $ | 3,048.5 | | | $ | 25.1 | | | 0.8 | % | | | $ | 86.6 | | | (2.0) | % | | | | | | |
| Gross profit: | | | | | | | | | | | | | | | | | | |
| New vehicle retail sales | $ | 100.8 | | | $ | 120.8 | | | $ | (20.0) | | | (16.6) | % | | | $ | 2.9 | | | (19.0) | % | | | | | | |
| Used vehicle retail sales | 56.7 | | | 60.2 | | | (3.5) | | | (5.8) | % | | | 1.6 | | | (8.4) | % | | | | | | |
| Used vehicle wholesale sales | (7.4) | | | (6.3) | | | (1.1) | | | (17.1) | % | | | (0.1) | | | (15.4) | % | | | | | | |
| Total used | 49.3 | | | 53.9 | | | (4.6) | | | (8.4) | % | | | 1.5 | | | (11.2) | % | | | | | | |
| Parts and service sales | 175.0 | | | 162.8 | | | 12.2 | | | 7.5 | % | | | 4.9 | | | 4.5 | % | | | | | | |
| F&I, net | 67.4 | | | 67.6 | | | (0.2) | | | (0.3) | % | | | 1.9 | | | (3.1) | % | | | | | | |
| Total gross profit | $ | 392.6 | | | $ | 405.1 | | | $ | (12.5) | | | (3.1) | % | | | $ | 11.2 | | | (5.8) | % | | | | | | |
| Gross margin: | | | | | | | | | | | | | | | | | | |
| New vehicle retail sales | 7.2 | % | | 9.0 | % | | (1.8) | % | | | | | | | | | | | | | |
| Used vehicle retail sales | 4.8 | % | | 4.9 | % | | (0.1) | % | | | | | | | | | | | | | |
| Used vehicle wholesale sales | (7.3) | % | | (5.0) | % | | (2.4) | % | | | | | | | | | | | | | |
| Total used | 3.8 | % | | 4.0 | % | | (0.1) | % | | | | | | | | | | | | | |
| Parts and service sales | 56.9 | % | | 58.6 | % | | (1.7) | % | | | | | | | | | | | | | |
| | | | | | | | | | | | | | | | | | |
| Total gross margin | 12.8 | % | | 13.3 | % | | (0.5) | % | | | | | | | | | | | | | |
| Units sold: | | | | | | | | | | | | | | | | | | |
| Retail new vehicles sold | 33,085 | | | 32,757 | | | 328 | | | 1.0 | % | | | | | | | | | | | |
| Retail used vehicles sold | 42,268 | | | 42,039 | | | 229 | | | 0.5 | % | | | | | | | | | | | |
| Wholesale used vehicles sold | 11,400 | | | 12,307 | | | (907) | | | (7.4) | % | | | | | | | | | | | |
| Total used | 53,668 | | | 54,346 | | | (678) | | | (1.2) | % | | | | | | | | | | | |
| Average sales price per unit sold: | | | | | | | | | | | | | | | | | | |
| New vehicle retail | $ | 44,849 | | | $ | 42,488 | | | $ | 2,361 | | | 5.6 | % | | | $ | 1,301 | | | 2.5 | % | | | | | | |
| Used vehicle retail | $ | 28,175 | | | $ | 29,373 | | | $ | (1,199) | | | (4.1) | % | | | $ | 774 | | | (6.7) | % | | | | | | |
| Gross profit per unit sold: | | | | | | | | | | | | | | | | | | |
| New vehicle retail sales | $ | 3,047 | | | $ | 3,689 | | | $ | (641) | | | (17.4) | % | | | $ | 88 | | | (19.8) | % | | | | | | |
| Used vehicle retail sales | $ | 1,342 | | | $ | 1,432 | | | $ | (90) | | | (6.3) | % | | | $ | 37 | | | (8.9) | % | | | | | | |
| Used vehicle wholesale sales | $ | (650) | | | $ | (514) | | | $ | (136) | | | (26.5) | % | | | $ | (10) | | | (24.6) | % | | | | | | |
| Total used | $ | 919 | | | $ | 991 | | | $ | (72) | | | (7.3) | % | | | $ | 27 | | | (10.0) | % | | | | | | |
| F&I PRU | $ | 895 | | | $ | 904 | | | $ | (9) | | | (1.0) | % | | | $ | 26 | | | (3.8) | % | | | | | | |
| Other: | | | | | | | | | | | | | | | | | | |
| SG&A expenses | $ | 323.9 | | | $ | 302.3 | | | $ | 21.6 | | | 7.1 | % | | | $ | 8.9 | | | 4.2 | % | | | | | | |
| | | | | | | | | | | | | | | | | | |
| | | | | | | | | | | | | | | | | | |
| | | | | | | | | | | | | | | | | | |
| SG&A as % gross profit | 82.5 | % | | 74.6 | % | | 7.9 | % | | | | | | | | | | | | | |
| | | | | | | | | | | | | | | | | | |
| | | | | | | | | | | | | | | | | | |
U.K. Region — Year Ended December 31, 2024 compared to 2023
Retail new vehicle units sold include new vehicle agency units. The agency units and related revenues are excluded from the calculation of the average sales price per unit sold for new vehicles as only the sales commission is reported within revenues. The agency units and related net revenues are included in the calculation of gross profit per unit sold. The GBP to USD foreign currency exchange rate has fluctuated from £1 to $1.273 at December 31, 2023, to £1 to $1.254 at December 31, 2024, or a slight decrease in the value of the GBP of 1.5%.
Revenues
Total revenues in the U.K. during the Current Year increased $1.1 billion, or 36.0%, as compared to the Prior Year, primarily driven by the acquisition of stores and changes in foreign currency exchange rates.
Total same store revenues in the U.K. during the Current Year increased $25.1 million, or 0.8%, as compared to the Prior Year, primarily driven by the positive impact of changes in foreign currency exchange rates, outperformances in new vehicle retail sales and parts and service, offset by lower used vehicle sales and F&I. On a constant currency basis, same store revenues decreased 2.0%, primarily driven by underperformances in used vehicle sales and F&I, offset by higher new vehicle retail sales and parts and service.
New vehicle retail same store revenues, on a constant currency basis, outperformed the Prior Year, driven by more units sold, coupled with higher pricing. We ended the Current Year with a U.K. new vehicle inventory supply of 45 days, three days lower than the Prior Year.
Used vehicle retail same store revenues, on a constant currency basis, underperformed the Prior Year, driven by lower used vehicle retail pricing, partially offset by more units sold.
Used vehicle wholesale same store revenues, on a constant currency basis, underperformed the Prior Year, primarily driven by a decrease in wholesale used vehicle units sold.
Parts and service same store revenues, on a constant currency basis, outperformed the Prior Year, driven by increases in customer pay, warranty and wholesale revenues reflecting increased business activity. We have invested in improvements to our U.K. customer contact center, streamlining operations to make scheduling appointments easier for customers, resulting in an increase in parts and service activity driving an increase in revenues as compared to the Prior Year.
F&I, net same store revenues, on a constant currency basis, underperformed the Prior Year, driven by decreases in income per contract for retail finance fees and service contracts.
Gross Profit
Total gross profit in the U.K. during the Current Year increased $150.0 million, or 36.6%, as compared to the Prior Year, primarily driven by the acquisition of stores, partially offset by lower same store gross profit.
Total same store gross profit in the U.K. during the Current Year decreased $12.5 million, or 3.1%, as compared to the Prior Year. On a constant currency basis, total same store gross profit decreased 5.8%, driven by downward pressures on margins across all lines of business.
New vehicle retail same store gross profit, on a constant currency basis, underperformed the Prior Year, primarily due to decrease in new vehicle retail gross profit per unit sold, partially offset by an increase in units sold, as a result of the increase in vehicle inventory production generating downward pressure on new vehicle margins.
Used vehicle retail same store gross profit, on a constant currency basis, underperformed the Prior Year, driven by a decrease in used vehicle retail same store gross profit per unit sold, partially offset by an increase in used vehicle retail units sold.
Parts and service same store gross profit, on a constant currency basis, outperformed the Prior Year, driven by increases in parts and service same store revenues, as discussed above.
F&I same store gross profit, on a constant currency basis, underperformed the Prior Year, as described above in F&I same store revenues.
Total same store gross margin in the U.K. decreased 52 basis points, driven by margin declines across all lines of business attributable to the factors as described above under gross profit.
SG&A Expenses
SG&A as a percentage of gross profit increased by 1,074 and 787 basis points on an as reported and same store basis, respectively, compared to the Prior Year.
Total SG&A expenses in the U.K. during the Current Year increased $171.3 million, or 56.4%, as compared to the Prior Year. Total same store SG&A expenses in the U.K. during the Current Year increased $21.6 million, or 7.1%, as compared to the Prior Year. On a constant currency basis, total same store SG&A expenses increased 4.2%. The increases on a total same store basis were primarily driven by fees associated with the Inchcape Acquisition, coupled with increased employee related costs, demonstration and loaner car expenses and advertising costs, offset by lower facilities costs compared to the Prior Year.
Consolidated Selected Comparisons — Year Ended December 31, 2024 compared to 2023
The following table (in millions) and discussion of our results of operations are on a consolidated basis, unless otherwise noted. | | | | | | | | | | | | | | | | | | | | | | | | |
| For the Years Ended December 31, | |
| 2024 | | 2023 | | Increase/ (Decrease) | | % Change | |
| Depreciation and amortization expense | $ | 113.1 | | | $ | 92.0 | | | $ | 21.1 | | | 22.9 | % | |
| Asset impairments | $ | 33.0 | | | $ | 32.9 | | | $ | 0.1 | | | 0.3 | % | |
| Restructuring charges | $ | 16.7 | | | $ | — | | | $ | 16.7 | | | 100.0 | % | |
| Other operating (income) expense | $ | (10.0) | | | $ | — | | | $ | (10.0) | | | (100.0) | % | |
| Floorplan interest expense | $ | 108.5 | | | $ | 64.1 | | | $ | 44.4 | | | 69.3 | % | |
| Other interest expense, net | $ | 141.3 | | | $ | 99.8 | | | $ | 41.5 | | | 41.6 | % | |
| | | | | | | | |
| Provision for income taxes | $ | 161.5 | | | $ | 198.2 | | | $ | (36.7) | | | (18.5) | % | |
Depreciation and Amortization Expense
Depreciation and amortization expense for the Current Year was higher compared to the Prior Year, primarily driven by acquired property and equipment in our U.S. and U.K. regions, as we continue to strategically add dealership related real estate and facilities to our investment portfolio and make improvements to our existing facilities intended to enhance the profitability of our dealerships and improve the overall customer experience.
Impairment of Assets
During the Current Year and the Prior Year, we recorded no goodwill impairments. During the Current Year and Prior Year we recorded impairments of franchise rights of $28.2 million and $25.1 million for franchise agreements in the U.S. region, respectively.
We review long-lived assets including property and equipment and ROU assets for impairment at the lowest level of identifiable cash flows whenever there is evidence that the carrying value of these assets may not be recoverable (i.e., triggering events). During the Current Year, there was no asset impairment charges associated with property and equipment and ROU assets. During the Prior Year, we recorded total property and equipment and ROU asset impairment charges of $6.8 million in the U.S. region.
During the Current Year, we recognized $4.8 million in intangible asset impairment associated with assets held for sale.
Refer to Note 13. Intangible Franchise Rights and Goodwill, Note 11. Property and Equipment, Net and Note 12. Leases within our Notes to Consolidated Financial Statements for further discussion of our assessment for impairments.
Restructuring Charges
During the Current Year, we incurred $16.7 million of restructuring charges. Restructuring charges primarily consist of planned workforce realignment, strategic closing of certain facilities and systems integrations, among other efforts to increase operational efficiency and profitability in connection with the integration of the Inchcape Retail acquisition with our U.K. business.
Refer to Note 5. Restructuring within our Notes to Consolidated Financial Statements for further discussion of our restructuring plan.
Other Operating Income
During the Current Year, we recognized $10.0 million of business interruption insurance recoveries as a result of the June 2024 cybersecurity incident experienced by CDK, which resulted in service outages on CDK’s dealers’ systems. The CDK Incident temporarily disrupted the Company’s business applications and processes in its U.S. operations that rely on CDK’s dealers’ systems. The CDK Incident did not have a material impact on our overall financial condition or on our ongoing results of operations.
Refer to Note 1. Basis of Presentation, Consolidation and Summary of Accounting Policies within our Notes to Consolidated Financial Statements for further discussion of the CDK Incident.
Floorplan Interest Expense
Our floorplan interest expense fluctuates with changes in our outstanding borrowings and associated interest rates, which are based on SOFR, the U.S. prime rate or other benchmark rates. Outstanding borrowings largely fluctuate based on our levels of new and used vehicle inventory. To mitigate the impact of interest rate fluctuations, we employ an interest rate hedging strategy, whereby we swap variable interest rate exposure on a portion of our borrowings for a fixed interest rate.
For the Current Year, floorplan interest expense increased $44.4 million, or 69.3%, as compared to the Prior Year, driven primarily by an increase in inventories added to our floorplan due to improvements in manufacturer production as well as acquisitions, partially offset by realized gains on our interest rate swap portfolio due to increases in corresponding interest rates.
Refer to Note 8. Financial Instruments and Fair Value Measurements within our Notes to Consolidated Financial Statements for additional discussion of interest rate swaps.
Other Interest Expense, Net
Other interest expense, net consists of interest charges primarily on our $750.0 million 4.00% Senior Notes due August 2028 (“4.00% Senior Notes”), $500.0 million 6.375% Senior Notes due January 2030 (“6.375% Senior Notes”), real estate related debt and other debt, partially offset by interest income.
For the Current Year, other interest expense, net, increased $41.5 million, or 41.6%, as compared to the Prior Year. The increase in other interest expense, net during the Current Year was primarily attributable to the issuance of the 6.375% Senior Notes during the Current Year, additional real estate related and other debt in our U.S. and U.K. regions, primarily due to acquisition activity. Additionally, the difference in the Current Year was partly due to a decrease in the gain recognized on the de-designation of a mortgage interest rate swap as compared to the Prior Year of approximately $3.8 million. Refer to Note 15. Debt within our Notes to Consolidated Financial Statements for additional discussion of our debt. Refer to Note 8. Financial Instruments and Fair Value Measurements within our Notes to the Consolidated Financial Statements for additional discussion of the de-designation of the mortgage interest rate swap.
Provision for Income Taxes
Provision for income taxes from continuing operations during the Current Year decreased $36.7 million, or 18.5%, as compared to the Prior Year. During the Current Year and Prior Year, we recorded a tax provision from continuing operations of $161.5 million and $198.2 million, respectively. The year-over-year tax expense decrease was primarily due to lower pre-tax book income.
The 2024 effective tax rate of 24.5% was lower than the 2023 effective tax rate of 24.8%. The tax rate decrease was primarily due to the mix of earnings and an increase in tax credits.
We believe that it is more-likely-than-not that our deferred tax assets, net of valuation allowances provided, will be realized, based primarily on assumptions of our future taxable income, considering future reversals of existing taxable temporary differences.
For further discussion, please refer to Note 16. Income Taxes within our Notes to Consolidated Financial Statements.
Liquidity and Capital Resources
Our liquidity and capital resources are primarily derived from cash on hand, cash temporarily invested as a pay down of our U.S. Floorplan Line and FMCC Facility levels (refer to Note 14. Floorplan Notes Payable within our Notes to Consolidated Financial Statements for additional information), cash from operations, borrowings under our credit facilities, working capital, dealership and real estate acquisition financing and proceeds from debt and equity offerings. We anticipate we will generate sufficient cash flows from operations, coupled with cash on hand and available borrowing capacity under our credit facilities, to fund our working capital requirements, service our debt and meet any other recurring operating expenditures.
Available Liquidity Resources
We had the following sources of liquidity available (in millions):
| | | | | |
| December 31, 2024 |
| Cash and cash equivalents | $ | 34.4 | |
| Floorplan offset accounts | 288.2 | |
| Available capacity under Acquisition Line | 893.2 | |
| Total liquidity | $ | 1,215.8 | |
Cash Flows
We arrange our new and used vehicle inventory floorplan financing through lenders affiliated with our vehicle manufacturers and our Revolving Credit Facility. In accordance with U.S. GAAP, we report floorplan financed with lenders affiliated with our vehicle manufacturers (excluding the cash flows from or to manufacturer-affiliated lenders participating in our syndicated lending group) within Cash Flows from Operating Activities in the Consolidated Statements of Cash Flows. We report floorplan financed with the Revolving Credit Facility (including the cash flows from or to manufacturer-affiliated lenders participating in the facility) and other credit facilities in the U.K. unaffiliated with our manufacturer partners, within Cash Flows from Financing Activities in the Consolidated Statements of Cash Flows. Refer to Note 14. Floorplan Notes Payable within our Notes to Consolidated Financial Statements for additional discussion of our Revolving Credit Facility.
However, we believe that all floorplan financing of inventory purchases in the normal course of business should correspond with the related inventory activity and be classified as an operating activity. As a result, we use the non-GAAP measure “Adjusted net cash provided by/used in operating activities” and “Adjusted net cash provided by/used in financing activities” to further evaluate our cash flows. We believe that this classification eliminates excess volatility in our operating cash flows prepared in accordance with U.S. GAAP. In addition, floorplan financing associated with dealership acquisitions and dispositions are classified as investing activities on an adjusted basis to eliminate excess volatility in our operating cash flows prepared in accordance with U.S. GAAP.
The following table reconciles cash flows on a U.S. GAAP basis to the corresponding adjusted amounts (in millions):
| | | | | | | | | | | | | | | | |
| | Years Ended December 31, |
| | 2024 | | 2023 | | |
| CASH FLOWS FROM OPERATING ACTIVITIES: | | | | | | |
| Net cash provided by operating activities: | | $ | 586.3 | | | $ | 190.2 | | | |
| Change in Floorplan notes payable — credit facility and other, excluding floorplan offset and net acquisitions and dispositions | | 133.3 | | | 504.6 | | | |
| Change in Floorplan notes payable — manufacturer affiliates associated with net acquisitions and dispositions and floorplan offset activity | | (36.6) | | | 25.2 | | | |
| Adjusted net cash provided by operating activities | | $ | 683.0 | | | $ | 720.0 | | | |
| CASH FLOWS FROM INVESTING ACTIVITIES: | | | | | | |
| Net cash used in investing activities: | | $ | (1,282.6) | | | $ | (366.1) | | | |
| Change in cash paid for acquisitions, associated with Floorplan notes payable | | 50.3 | | | 66.3 | | | |
| Change in proceeds from disposition of franchises, property and equipment, associated with Floorplan notes payable | | (31.9) | | | (48.8) | | | |
| Adjusted net cash used in investing activities | | $ | (1,264.2) | | | $ | (348.6) | | | |
| CASH FLOWS FROM FINANCING ACTIVITIES: | | | | | | |
| Net cash provided by financing activities: | | $ | 681.1 | | | $ | 185.2 | | | |
| Change in Floorplan notes payable, excluding floorplan offset | | (115.2) | | | (547.3) | | | |
| Adjusted net cash provided by (used in) financing activities | | $ | 565.9 | | | $ | (362.1) | | | |
Sources and Uses of Liquidity from Operating Activities — Year Ended December 31, 2024 compared to 2023
For the Current Year, net cash provided by operating activities increased by $396.1 million as compared to the Prior Year. On an adjusted basis for the same period, adjusted net cash provided by operating activities decreased by $36.9 million. The decrease on an adjusted basis was primarily driven by a $103.5 million decrease in net income, a $440.1 million decrease in floorplan notes payable – manufacturer affiliates, partially offset by a $313.2 million decrease in inventory levels, a $126.8 million decrease in contracts-in-transit and vehicle receivables and a $51.5 million increase in accounts payable and accrued expenses.
Sources and Uses of Liquidity from Investing Activities — Year Ended December 31, 2024 compared to 2023
For the Current Year, net cash used in investing activities increased by $916.5 million, as compared to the Prior Year. On an adjusted basis for the same period, adjusted net cash used in investing activities increased by $915.7 million, primarily due to a $926.8 million increase in acquisition activity, and a $59.7 million increase in purchases of property and equipment, including real estate, partially offset by a $52.8 million increase in proceeds from disposition of franchises and property and equipment.
Capital Expenditures
Our capital expenditures include costs to extend the useful lives of current dealership facilities, as well as to start or expand operations. In general, expenditures relating to the construction or expansion of dealership facilities are driven by dealership acquisition activity, new franchises being granted to us by a manufacturer, significant growth in sales at an existing facility, relocation opportunities or manufacturer imaging programs. We critically evaluate all planned future capital spending, working closely with our manufacturer partners to maximize the return on our investments.
For the Current Year, $245.1 million was used to purchase property and equipment.
Sources and Uses of Liquidity from Financing Activities — Year Ended December 31, 2024 compared to 2023
For the Current Year, net cash provided by financing activities increased by $495.9 million, as compared to the Prior Year. On an adjusted basis for the same period, adjusted net cash provided by financing activities increased by $928.1 million. The increase in net cash provided by financing activities on an adjusted basis was primarily driven by a $586.4 million increase in net borrowings of other debt, including real estate-related debt, the issuance of $500.0 million of 6.375% Senior Notes, and increases in net borrowings on our U.S. Floorplan line of $108.5 million (representing the net cash activity in our floorplan offset account). These increases were partially offset by a $249.6 million increase in net repayments on the Acquisition Line.
Credit Facilities, Debt Instruments and Other Financing Arrangements
Our various credit facilities, debt instruments and other financing arrangements are used to finance the purchase of inventory and real estate, provide acquisition funding and provide working capital for general corporate purposes.
The following table summarizes the commitment of our credit facilities as of December 31, 2024 (in millions):
| | | | | | | | | | | | | | | | | | | | | |
| | | As of December 31, 2024 | |
| | Total
Commitment | | Outstanding | | Available | |
U.S. Floorplan Line (1) | | $ | 1,500.0 | | | $ | 1,042.4 | | | $ | 457.6 | | |
Acquisition Line (2) | | 1,000.0 | | | 106.8 | | | 893.2 | | |
| Total Revolving Credit Facility | | 2,500.0 | | | 1,149.3 | | | 1,350.7 | | |
FMCC facility (3) | | 300.0 | | | 200.0 | | | 100.0 | | |
GM Financial Facility(4) | | 348.1 | | | 189.5 | | | 158.6 | | |
Total U.S. credit facilities (5) | | $ | 3,148.1 | | | $ | 1,538.8 | | | $ | 1,609.3 | | |
(1)The available balance at December 31, 2024, includes $286.3 million of immediately available funds. The remaining available balance can be used for vehicle inventory financing.
(2)The outstanding balance of $106.8 million is related to outstanding letters of credit of $11.8 million and $95.0 million in USD borrowings. The available borrowings may be limited from time to time, based on certain debt covenant calculations, and as a result, the outstanding balance plus available borrowings may not equal the total commitment.
(3)The available balance as of December 31, 2024, includes $2.0 million of immediately available funds. The remaining available balance can be used for Ford new vehicle inventory financing.
(4)The remaining available balance as of December 31, 2024, can be used for General Motors new and rental vehicle inventory financing.
(5)The outstanding balance excludes $590.1 million of borrowings with manufacturer-affiliates and third-party financial institutions for foreign and rental vehicle financing not associated with any of our U.S. credit facilities.
We have other credit facilities in the U.S. and the U.K. with third-party financial institutions, most of which are affiliated with the automobile manufacturers that provide financing for portions of our new, used and loaner vehicle inventories. In addition, we have outstanding debt instruments, including our 4.00% and 6.375% Senior Notes, as well as real estate related and other debt instruments. Refer to Note 15. Debt within our Notes to Consolidated Financial Statements for further information.
Covenants
Our Revolving Credit Facility, indentures governing our 4.00% and 6.375% Senior Notes and certain mortgage term loans contain customary financial and operating covenants that place restrictions on us, including our ability to incur additional indebtedness, create liens or to sell or otherwise dispose of assets and to merge or consolidate with other entities. Certain of our mortgage agreements contain cross-default provisions that, in the event of a default of certain mortgage agreements and of our Revolving Credit Facility, could trigger an uncured default.
As of December 31, 2024, we were in compliance with the requirements of the financial covenants under our debt agreements. We are required to maintain the ratios detailed in the following table: | | | | | | | | |
| | As of December 31, 2024 |
| | Required | Actual |
| Total adjusted leverage ratio | < 5.75 | 2.79 |
| Fixed charge coverage ratio | > 1.20 | 3.56 |
Based on our position as of December 31, 2024, and our outlook as discussed within Item 7. Management’s Discussion and Analysis of Financial Condition and Results of Operations to this Form 10-K, we believe we have sufficient liquidity and do not anticipate any material liquidity constraints or issues with our ability to remain in compliance with our debt covenants.
Refer to Note 14. Floorplan Notes Payable and Note 15. Debt within our Notes to Consolidated Financial Statements for further discussion of our debt instruments, credit facilities and other financing arrangements existing as of December 31, 2024.
Share Repurchases and Dividends
From time to time, our Board of Directors authorizes the repurchase of shares of our common stock up to a certain monetary limit. On November 12, 2024, our Board of Directors increased the share repurchase authorization to $500.0 million. For the Current Year, 518,465 shares were repurchased, at an average price of $311.67 per share, for a total of $161.6 million, excluding excise taxes of $1.4 million. As of December 31, 2024, we had $476.1 million available under our current share repurchase authorization.
During the Current Year, our Board of Directors approved quarterly cash dividends per share on all shares of our common stock totaling $1.88 per share, which resulted in $24.7 million paid to common shareholders and $0.5 million to unvested RSA holders.
Future share repurchases and the payment of any future dividends are subject to the business judgment of our Board of Directors, taking into consideration our historical and projected results of operations, financial condition, cash flows, capital requirements, covenant compliance, changes in laws and regulations, current economic environment and other factors considered relevant.
Item 7A. Quantitative and Qualitative Disclosures About Market Risk
We are exposed to a variety of market risks, including interest rate risk and foreign currency exchange rate risk. We address interest rate risks primarily through the use of interest rate swaps. We do not currently hedge foreign currency exchange risk, as discussed further below. The following quantitative and qualitative information is provided regarding our foreign currency exchange rates and financial instruments to which we are a party at December 31, 2024, and from which we may incur future gains or losses from changes in market interest rates and/or foreign currency exchange rates. We do not enter into derivative or other financial instruments for speculative or trading purposes.
Interest Rates
We have interest rate risk on our variable-rate debt obligations. Based on variable-rate borrowings outstanding of $2.9 billion and $2.4 billion during the Current Year and Prior Year, respectively, a 100 basis point change in interest rates would have resulted in an approximate $19.9 million and a $14.4 million change to our annual interest expense, respectively, after consideration of the average interest rate swaps in effect during the periods.
To mitigate the impact of interest rate fluctuations, we employ an interest rate hedging strategy, whereby we swap variable interest rate exposure on a portion of our borrowings for a fixed interest rate. In addition, our exposure to changes in interest rates with respect to our variable-rate floorplan borrowings is partially mitigated by manufacturers’ interest assistance, which in some cases is influenced by changes in market-based variable interest rates. We reflect interest assistance as a reduction of new vehicle inventory cost until the associated vehicle is sold. During the Current Year and Prior Year, we recognized $88.4 million and $71.2 million, respectively, of interest assistance as a reduction of new vehicle cost of sales.
Foreign Currency Exchange Rates
The functional currency of our U.K. subsidiaries is the GBP. Our exposure to fluctuating foreign currency exchange rates relates to the effects of translating financial statements of those subsidiaries into our reporting currency, which we do not hedge against based on our investment strategy in these foreign operations. From time to time we may enter into foreign currency exchange rate cash flow hedges in connection with pending acquisition-related payments denominated in a foreign currency. A 10% devaluation in average foreign currency exchange rates for GBP to USD would have resulted in a $378.3 million and $278.1 million decrease to our revenues for the Current Year and Prior Year, respectively.
For additional information about our market sensitive financial instruments, see Note 8. Financial Instruments and Fair Value Measurements within our Notes to Consolidated Financial Statements.
Item 8. Financial Statements and Supplementary Data
Refer to our Consolidated Financial Statements beginning on page F-1 for the information required by this Item and incorporated herein by reference.
Item 9. Changes in and Disagreements with Accountants on Accounting and Financial Disclosure
None.
Item 9A. Controls and Procedures
Evaluation of Disclosure Controls and Procedures
As required by Rule 13a-15(b) under the Exchange Act, we have evaluated, under the supervision and with the participation of our management, including our principal executive officer and principal financial officer, the effectiveness of the design and operation of our disclosure controls and procedures (as defined in Rules 13a-15(e) and 15d-15(e) under the Exchange Act) as of the end of the period covered by this Form 10-K. Our disclosure controls and procedures are designed to provide reasonable assurance that the information required to be disclosed by us in reports that we file under the Exchange Act is accumulated and communicated to our management, including our principal executive officer and principal financial officer, as appropriate, to allow timely decisions regarding required disclosure and is recorded, processed, summarized and reported within the time periods specified in the rules and forms of the SEC. Based upon that evaluation, our principal executive officer and principal financial officer concluded that our disclosure controls and procedures were effective as of December 31, 2024, at the reasonable assurance level.
Our management, including our principal executive officer and our principal financial officer, does not expect that our disclosure controls and procedures can prevent all possible errors or fraud. A control system, no matter how well conceived and operated, can provide only reasonable, not absolute, assurance that objectives of the control system are met. There are inherent limitations in all control systems, including the realities that judgments in decision-making can be faulty, and that breakdowns can occur because of simple errors or mistakes. Additionally, controls can be circumvented by the intentional acts of one or more persons. The design of any system of controls is based in part upon certain assumptions about the likelihood of future events, and while our disclosure controls and procedures are designed to be effective under circumstances where they should reasonably be expected to operate effectively, there can be no assurance that any design will succeed in achieving its stated goals under all potential future conditions. Because of the inherent limitations in any control system, misstatements due to possible errors or fraud may occur and not be detected.
Changes in Internal Control over Financial Reporting
During the three months ended December 31, 2024, there were no changes in our system of internal control over financial reporting (as defined in Rules 13a-15(f) and 15d-15(f) under the Exchange Act) that have materially affected, or are reasonably likely to materially affect, our internal control over financial reporting, except as otherwise described below.
Management’s Annual Report on Internal Control over Financial Reporting
Our management is responsible for establishing and maintaining adequate internal control over financial reporting (as defined in Rules 13a-15(f) or 15d-15(f) under the Exchange Act). Our internal control over financial reporting is a process designed by management, under the supervision of our principal executive officer and principal financial officer, to provide reasonable assurance regarding the reliability of financial reporting and the preparation of financial statements for external purposes in accordance with U.S. GAAP, and includes those policies and procedures that:
(i) pertain to the maintenance of records that in reasonable detail accurately and fairly reflect the transactions and dispositions of our assets;
(ii) provide reasonable assurance that transactions are recorded as necessary to permit preparation of financial statements in accordance with U.S. GAAP, and that our receipts and expenditures are being made only in accordance with authorizations of management and our directors; and
(iii) provide reasonable assurance regarding prevention or timely detection of unauthorized acquisition, use or disposition of our assets that could have a material effect on our Consolidated Financial Statements.
Because of its inherent limitations, internal control over financial reporting may not prevent or detect misstatements. Also, projections of any evaluation of effectiveness to future periods are subject to the risk that controls may become inadequate because of changes in conditions, or that the degree of compliance with the policies and procedures may deteriorate. Accordingly, even effective internal control over financial reporting can only provide reasonable assurance of achieving their control objectives.
Our management, under the supervision and with the participation of our principal executive officer and principal financial officer, assessed the effectiveness of our internal control over financial reporting as of December 31, 2024. In making this assessment, management used the 2013 framework set forth by the Committee of Sponsoring Organizations of the Treadway Commission in Internal Control — Integrated Framework.
As permitted by guidelines established by the SEC for newly acquired businesses, we excluded three of our recently acquired businesses in 2024, (the “Excluded Acquisitions”), from the scope of our annual report on internal controls over financial reporting for the year ended December 31, 2024. The Excluded Acquisitions comprise approximately $768.6 million of our consolidated total assets as of December 31, 2024, and $1.0 billion of our consolidated revenues for the year then ended. We are in the process of integrating these businesses into our overall internal controls over financial reporting and plan to include it in our scope for the year ended December 31, 2025.
Based on our evaluation under the framework in Internal Control — Integrated Framework, our management concluded that, as of December 31, 2024, our internal control over financial reporting was effective.
Deloitte & Touche LLP, the independent registered accounting firm who audited the Consolidated Financial Statements included in this Form 10-K, has issued an attestation report on our internal control over financial reporting. This report, dated February 14, 2025, appears on the following page.
Report of Independent Registered Public Accounting Firm
To the Stockholders and the Board of Directors of Group 1 Automotive, Inc.
Opinion on Internal Control over Financial Reporting
We have audited the internal control over financial reporting of Group 1 Automotive, Inc. and subsidiaries (the “Company”) as of December 31, 2024, based on criteria established in Internal Control — Integrated Framework (2013) issued by the Committee of Sponsoring Organizations of the Treadway Commission (COSO). In our opinion, the Company maintained, in all material respects, effective internal control over financial reporting as of December 31, 2024, based on criteria established in Internal Control — Integrated Framework (2013) issued by COSO.
We have also audited, in accordance with the standards of the Public Company Accounting Oversight Board (United States) (PCAOB), the consolidated financial statements as of and for the year ended December 31, 2024, of the Company and our report dated February 14, 2025, expressed an unqualified opinion on those financial statements.
As described in Management’s Annual Report on Internal Control over Financial Reporting, management excluded from its assessment the internal control over financial reporting at three acquired businesses (the “Excluded Acquisitions”). The Excluded Acquisitions constitute $768.6 million of consolidated total assets as of December 31, 2024, and $1.0 billion of consolidated revenues for the year then ended. Accordingly, our audit did not include the internal control over financial reporting at the Excluded Acquisitions.
Basis for Opinion
The Company’s management is responsible for maintaining effective internal control over financial reporting and for its assessment of the effectiveness of internal control over financial reporting, included in the accompanying Management’s Annual Report on Internal Control over Financial Reporting. Our responsibility is to express an opinion on the Company’s internal control over financial reporting based on our audit. We are a public accounting firm registered with the PCAOB and are required to be independent with respect to the Company in accordance with the U.S. federal securities laws and the applicable rules and regulations of the Securities and Exchange Commission and the PCAOB.
We conducted our audit in accordance with the standards of the PCAOB. Those standards require that we plan and perform the audit to obtain reasonable assurance about whether effective internal control over financial reporting was maintained in all material respects. Our audit included obtaining an understanding of internal control over financial reporting, assessing the risk that a material weakness exists, testing and evaluating the design and operating effectiveness of internal control based on the assessed risk, and performing such other procedures as we considered necessary in the circumstances. We believe that our audit provides a reasonable basis for our opinion.
Definition and Limitations of Internal Control over Financial Reporting
A company’s internal control over financial reporting is a process designed to provide reasonable assurance regarding the reliability of financial reporting and the preparation of financial statements for external purposes in accordance with generally accepted accounting principles. A company’s internal control over financial reporting includes those policies and procedures that (1) pertain to the maintenance of records that, in reasonable detail, accurately and fairly reflect the transactions and dispositions of the assets of the company; (2) provide reasonable assurance that transactions are recorded as necessary to permit preparation of financial statements in accordance with generally accepted accounting principles, and that receipts and expenditures of the company are being made only in accordance with authorizations of management and directors of the company; and (3) provide reasonable assurance regarding prevention or timely detection of unauthorized acquisition, use, or disposition of the company’s assets that could have a material effect on the financial statements.
Because of its inherent limitations, internal control over financial reporting may not prevent or detect misstatements. Also, projections of any evaluation of effectiveness to future periods are subject to the risk that controls may become inadequate because of changes in conditions, or that the degree of compliance with the policies or procedures may deteriorate.
/s/ Deloitte & Touche LLP
Houston, Texas
February 14, 2025
Item 9B. Other Information
Trading Plans
During the three months ended December 31, 2024, the following officer, as defined in Rule 16a-1(f), adopted a “Rule 10b5-1 trading arrangement,” as defined in Item 408(a) of Regulation S-K.
On November 26, 2024, Daryl A. Kenningham, our Chief Executive Officer, adopted a 10b5-1 trading arrangement that is intended to satisfy the affirmative defense of Rule 10b5-1(c) for the sale of up to 24,401 shares of the Company’s common stock until August 1, 2025.
No other officers or directors, as defined in Rule 16a-1(f), adopted or terminated a “Rule 10b5-1 trading arrangement” or “non-Rule 10b5-1 trading arrangement,” as each term is defined in Item 408(a) of Regulation S-K, during the three months ended December 31, 2024.
Item 9C. Disclosure Regarding Foreign Jurisdictions that Prevent Inspections
None.
PART III
Item 10. Directors, Executive Officers and Corporate Governance
Pursuant to Instruction G to Form 10-K, we incorporate by reference into this Item 10 the information to be disclosed in our definitive proxy statement prepared in connection with the 2025 Annual Meeting of Stockholders, which will be filed with the SEC within 120 days of December 31, 2024.
Item 11. Executive Compensation
Pursuant to Instruction G to Form 10-K, we incorporate by reference into this Item 11 the information to be disclosed in our definitive proxy statement prepared in connection with the 2025 Annual Meeting of Stockholders, which will be filed with the SEC within 120 days of December 31, 2024.
Item 12. Security Ownership of Certain Beneficial Owners and Management and Related Stockholder Matters
Pursuant to Instruction G to Form 10-K, we incorporate by reference into this Item 12 the information to be disclosed in our definitive proxy statement prepared in connection with the 2025 Annual Meeting of Stockholders, which will be filed with the SEC within 120 days of December 31, 2024.
Item 13. Certain Relationships and Related Transactions, and Director Independence
Pursuant to Instruction G to Form 10-K, we incorporate by reference into this Item 13 the information to be disclosed in our definitive proxy statement prepared in connection with the 2025 Annual Meeting of Stockholders, which will be filed with the SEC within 120 days of December 31, 2024.
Item 14. Principal Accounting Fees and Services
Pursuant to Instruction G to Form 10-K, we incorporate by reference into this Item 14 the information to be disclosed in our definitive proxy statement prepared in connection with the 2025 Annual Meeting of Stockholders, which will be filed with the SEC within 120 days of December 31, 2024.
PART IV
Item 15. Exhibits, Financial Statement Schedules
(a) List of documents filed as part of this Form 10-K:
(1)Financial Statements
The financial statements listed in the accompanying Index to Financial Statements are filed as part of this Form 10-K.
(2)Financial Statement Schedules
All schedules have been omitted since the required information is not present or not present in amounts sufficient to require submission of the schedule, or because the information required is included in the Consolidated Financial Statements and notes thereto.
(3) Index to Exhibits
Those exhibits required to be filed by Item 601 of Regulation S-K are listed in the Exhibit Index immediately preceding the exhibits filed herewith and such listing is incorporated herein by reference.
EXHIBIT INDEX
| | | | | | | | | | | | | | |
Exhibit
Number | | Description |
| | — | | Share Purchase Agreement, dated November 12, 2021, by and between Group 1 Automotive, Inc., Buyer and UAB as intervening party (English translation) (incorporated by reference to Exhibit 2.1 of Group 1 Automotive Inc.’s Current Report on Form 8-K (File No. 001-13461) filed November 15, 2021) |
| | — | | Third Amended and Restated Certificate of Incorporation of Group 1 Automotive, Inc. effective May 18, 2023 (incorporated by reference to Exhibit 3.1 of Group 1 Automotive, Inc.’s Quarterly Report on Form 10-Q (File No. 001-13461) for the quarter ended June 30, 2023) |
| | — | | Certificate of Designation of Series A Junior Participating Preferred Stock (incorporated by reference to Exhibit 3.2 of Group 1’s Quarterly Report on Form 10-Q (File No. 001-13461) for the quarter ended March 31, 2007) |
| | — | | Fourth Amended and Restated Bylaws of Group 1 Automotive, Inc. effective February 15, 2023 (incorporated by reference to Exhibit 3.1 of Group 1 Automotive, Inc.’s Current Report on Form 8-K (File No. 001-13461) filed July 28, 2023) |
| | — | | Specimen Common Stock Certificate (incorporated by reference to Exhibit 4.1 of Group 1 Automotive, Inc.’s Registration Statement on Form S-1 (Registration No. 333-29893)) |
| | — | | Description of the Registrant’s Securities Registered Pursuant to Section 12 of the Securities Exchange Act of 1934 (incorporated by reference to Exhibit 4.8 to Group 1 Automotive, Inc.’s Annual Report on Form 10-K (File No. 001-13461) for the year ended December 31, 2020) |
| | — | | Indenture, dated as of August 17, 2020, by and among Group 1 Automotive, Inc., the guarantors party thereto and Wells Fargo Bank, National Association, as trustee (incorporated by reference to Exhibit 4.1 of Group 1 Automotive, Inc.’s Current Report on Form 8-K (File No. 001-13461) filed August 17, 2020) |
| | — | | First Supplemental Indenture and Subsidiary Guarantee, by and among Group 1 Automotive, Inc., the guarantors party thereto and Computershare Trust Company, N.A., as trustee (incorporated by reference to Exhibit 4.1 of Group 1 Automotive, Inc.’s Quarterly Report on Form 10-Q (File No. 001-13461) for the quarter ended June 30, 2024) |
| | — | | Second Supplemental Indenture and Subsidiary Guarantee, by and among Group 1 Automotive, Inc., the guarantors party thereto and Computershare Trust Company, N.A., as trustee(incorporated by reference to Exhibit 4.2 of Group 1 Automotive, Inc.’s Quarterly Report on Form 10-Q (File No. 001-13461) for the quarter ended June 30, 2024) |
| | — | | Form of 4.000% Senior Notes due 2028 (incorporated by reference to Exhibit 4.1, Exhibit A, of Group 1 Automotive, Inc.’s Current Report on Form 8-K (File No. 001-13461) filed August 17, 2020) |
| | — | | Indenture, dated as of July 30, 2024, by and among Group 1 Automotive, Inc., the guarantors party thereto and Computershare Trust Company, N.A., as trustee (incorporated by reference to Exhibit 4.1 of Group 1 Automotive Inc.’s Current Report on Form 8-K (File No. 001-13461) filed July 30, 2024) |
| | — | | Form of 6.375% Senior Notes due 2030 (included as Exhibit A to Exhibit 4.1) (incorporated by reference to Exhibit 4.2 of Group 1 Automotive Inc.’s Current Report on Form 8-K (File No. 001-13461) filed July 30, 2024) |
| | — | | Form of Ford Motor Credit Company Automotive Wholesale Plan Application for Wholesale Financing and Security Agreement (incorporated by reference to Exhibit 10.2 of Group 1 Automotive, Inc.’s Quarterly Report on Form 10-Q (File No. 001-13461) for the quarter ended June 30, 2003) |
| | — | | Supplemental Terms and Conditions dated September 4, 1997 between Ford Motor Company and Group 1 Automotive, Inc. (incorporated by reference to Exhibit 10.16 of Group 1 Automotive, Inc.’s Registration Statement on Form S-1 Registration No. 333-29893) |
| | — | | Form of Indemnification Agreement of Group 1 Automotive, Inc. (incorporated by reference to Exhibit 10.1 of Group 1 Automotive, Inc.’s Current Report on Form 8-K (File No. 001-13461) filed November 13, 2007) |
| | — | | Group 1 Automotive, Inc. Deferred Compensation Plan, as Amended and Restated, effective January 1, 2021 (incorporated by reference to Exhibit 10.3 of Group 1 Automotive, Inc.’s Quarterly Report on Form 10-Q (File No. 001-13461) for the quarter ended September 30, 2020) |
| | — | | Group 1 Automotive, Inc. 2014 Long Term Incentive Plan (incorporated by reference to Appendix A to Group 1 Automotive, Inc.’s definitive proxy statement on Schedule 14A filed April 10, 2014) |
| | — | | First Amendment to the Group 1 Automotive, Inc. 2014 Long Term Incentive Plan, effective May 13, 2020 (incorporated by reference to Exhibit 10.4 of Group 1 Automotive, Inc.’s Quarterly Report on Form 10-Q (File No. 001-13461) for the quarter ended September 30, 2020) |
| | — | | Form of Restricted Stock Agreement with Qualified Retirement Provisions (incorporated by reference to Exhibit 10.1 of Group 1 Automotive, Inc.’s Quarterly Report on Form 10-Q (File No. 001-13461) for the quarter ended June 30, 2021) |
| | | | | | | | | | | | | | |
| | — | | Form of Phantom Stock Agreement for Non-Employee Directors (incorporated by reference to Exhibit 10.7 of Group 1 Automotive, Inc.’s Quarterly Report on Form 10-Q (File No. 001-13461) for the quarter ended September 30, 2014) |
| | — | | Form of Restricted Stock Agreement for Employees (incorporated by reference to Exhibit 10.5 of Group 1 Automotive, Inc.’s Quarterly Report on Form 10-Q (File No. 001-13461) for the quarter ended September 30, 2014) |
| | — | | Form of Restricted Stock Agreement for Non-Employee Directors (incorporated by reference to Exhibit 10.34 of Group 1 Automotive, Inc.’s Annual Report on Form 10-K (File No. 001-13461) for the year ended December 31, 2018) |
| | — | | Form of Phantom Stock Agreement (Cash Settlement) for Non-Employee Directors (incorporated by reference to Exhibit 10.33 of Group 1 Automotive, Inc.’s Annual Report on Form 10-K (File No. 001-13461 for the year ended December 31, 2018) |
| | — | | Form of Performance Share Unit Agreement (incorporated by reference to Exhibit 10.1 of Group 1 Automotive, Inc.’s Quarterly Report on Form 10-Q (File No. 001-13461) for the quarter ended March 31, 2019) |
| | — | | Incentive Compensation, Confidentiality, Non-Disclosure and Non-Compete Agreement dated June 6, 2011, between Group 1 Automotive, Inc. and Daryl Kenningham (incorporated by reference to Exhibit 10.1 of Group 1 Automotive, Inc.’s Quarterly Report on Form 10-Q (File No. 001-13461) for the quarter ended June 30, 2020) |
| | — | | First Amendment to Incentive, Compensation, Confidentiality, Non-Disclosure and Non-Compete Agreement, effective as of August 24, 2022, between Group 1 Automotive, Inc. and Daryl A. Kenningham (incorporated by reference to Exhibit 10.2 of Group 1 Automotive Inc.’s Quarterly Report on Form 10-Q (File No. 001-13461) for the quarter ended September 30, 2022). |
| | — | | Offer Letter, dated June 1, 2020, between Group 1 Automotive, Inc. and Daniel McHenry (incorporated by reference to Exhibit 10.3 of Group 1 Automotive, Inc.’s Quarterly Report on Form 10-Q (File No. 001-13461) for the quarter ended June 30, 2020) |
| | — | | Retention, Confidentiality and Non-Compete Agreement dated August 20, 2020 between Group 1 Automotive, Inc. and Daniel McHenry (incorporated by reference to Exhibit 10.1 of Group 1 Automotive, Inc.’s Quarterly Report on Form 10-Q (File No. 001-13461) for the quarter ended September 30, 2020) |
| | — | | Group 1 Automotive, Inc. Aircraft Usage Policy (incorporated by reference to Exhibit 10.49 of Group 1 Automotive, Inc.’s Annual Report on Form 10-K (File No. 001-13461) for the year ended December 31, 2020) |
| | — | | Twelfth Amended and Restated Revolving Credit Agreement dated as of March 9, 2022, among Group 1 Automotive, Inc., the Subsidiary Borrowers listed therein, the Lenders listed therein and U.S. Bank National Association, as Administrative Agent (incorporated by reference to Exhibit 10.1 of Group 1 Automotive, Inc.’s Current Report on Form 8-K (File No. 001-13461) filed on March 10, 2022). |
| | — | | First Amendment to the Twelfth Amended and Restated Revolving Credit Agreement dated effective as of August 18, 2022 (incorporated by reference to Exhibit 10.1 of Group 1 Automotive Inc.’s Current Report on Form 8-K (File No. 001-13461) filed August 23, 2022). |
| | — | | Second Amendment to the Twelfth Amended and Restated Revolving Credit Agreement dated effective December 8, 2023 (incorporated by reference to Exhibit 10.3 of Group 1 Automotive, Inc.’s Quarterly Report on Form 10-Q (File No. 001-13461) for the quarter ended March 31, 2024) |
| | — | | Third Amendment to the Twelfth Amended and Restated Revolving Credit Agreement dated effective April 30, 2024 (incorporated by reference to Exhibit 10.1 of Group 1 Automotive, Inc.’s Current Report on Form 8-K (File No. 001-13461) filed May 2, 2024) |
| | — | | Fourth Amendment to the Twelfth Amended and Restated Revolving Credit Agreement effective July 25, 2024 (incorporated by reference to Exhibit 10.1 of Group 1 Automotive, Inc.’s Quarterly Report on Form 10-Q (File No. 001-13461) for the quarter ended September 30, 2024) |
| | — | | Additional Borrower Addendum to Master Loan Agreement dated effective March 25, 2024 (incorporated by reference to Exhibit 10.1 of Group 1 Automotive Inc.’s Current Report on Form 8-K (File No. 001-13461) filed March 28, 2024). |
| | — | | Master Loan Agreement dated effective December 8, 2023 (incorporated by reference to Exhibit 10.1 of Group 1 Automotive Inc.’s Current Report on Form 8-K (File No. 001-13461) filed December 11, 2023) |
| | — | | Group 1 Automotive, Inc. 2024 Long Term Incentive Plan (incorporated by reference to Appendix B of Group 1 Automotive, Inc.’s definitive proxy statement on Schedule 14A filed on April 5, 2024) |
| | — | | Form of Restricted Stock Agreement (2024 Form)(incorporated by reference to Exhibit 10.27 of Group 1 Automotive, Inc.’s Annual Report on Form 10-K (File No. 001-13461) for the year ended December 31, 2023) |
| | | | | | | | | | | | | | |
| | — | | Form of Performance Share Unit Agreement (2024 Form) (incorporated by reference to Exhibit 10.28 of Group 1 Automotive, Inc.’s Annual Report on Form 10-K (File No. 001-13461) for the year ended December 31, 2023) |
| | — | | Form of Restricted Stock Agreement (2025 Form) |
| | — | | Form of Performance Share Unit Agreement (2025 Form) |
| | — | | Master Credit Agreement, dated February 12, 2024, by and among Group 1 Realty, Inc., AMR Real Estate Holdings, LLC, Group 1 Realty NE, LLC, G1R Clear Lake, LLC and LHM ATO, LLC, as Borrowers, and Wells Fargo Bank, National Association (incorporated by reference to Exhibit 10.1 of Group 1 Automotive, Inc.’s Current Report on Form 8-K (File No. 001-13461) filed on February 14, 2024). |
| | — | | First Amendment to Master Credit Agreement dated effective as of March 1, 2024 (incorporated by reference to Exhibit 10.6 of Group 1 Automotive, Inc.’s Quarterly Report on Form 10-Q (File No. 001-13461) for the quarter ended March 31, 2024) |
| | — | | Second Amendment to Master Credit Agreement dated effective as of March 11, 2024 (incorporated by reference to Exhibit 10.7 of Group 1 Automotive, Inc.’s Quarterly Report on Form 10-Q (File No. 001-13461) for the quarter ended March 31, 2024) |
| | — | | Third Amendment to Master Credit Agreement dated effective as of April 2, 2024 (incorporated by reference to Exhibit 10.8 of Group 1 Automotive, Inc.’s Quarterly Report on Form 10-Q (File No. 001-13461) for the quarter ended March 31, 2024) |
| | — | | Fourth Amendment to Master Credit Agreement dated effective as of April 25, 2024 (incorporated by reference to Exhibit 10.9 of Group 1 Automotive, Inc.’s Quarterly Report on Form 10-Q (File No. 001-13461) for the quarter ended March 31, 2024) |
| | — | | Fifth Amendment to Master Credit Agreement dated effective as of May 23, 2024 (incorporated by reference to Exhibit 10.4 of Group 1 Automotive, Inc.’s Quarterly Report on Form 10-Q (File No. 001-13461) for the quarter ended June 30, 2024) |
| | — | | Sixth Amendment to Master Credit Agreement dated effective as of June 26, 2024 (incorporated by reference to Exhibit 10.5 of Group 1 Automotive, Inc.’s Quarterly Report on Form 10-Q (File No. 001-13461) for the quarter ended June 30, 2024) |
| | — | | First Amendment to Term Note with Draw Period dated effective June 26, 2024 (incorporated by reference to Exhibit 10.6 of Group 1 Automotive, Inc.’s Quarterly Report on Form 10-Q (File No. 001-13461) for the quarter ended June 30, 2024) |
| | — | | Group 1 Automotive, Inc. Insider Trading Policy |
| | — | | Group 1 Automotive, Inc. Subsidiary List |
| | — | | Consent of Deloitte & Touche LLP |
| | — | | Certification of Chief Executive Officer Pursuant to Section 302 of the Sarbanes-Oxley Act of 2002 |
| | — | | Certification of Chief Financial Officer Pursuant to Section 302 of the Sarbanes-Oxley Act of 2002 |
| | — | | Certification of Chief Executive Officer Pursuant to Section 906 of the Sarbanes-Oxley Act of 2002 |
| | — | | Certification of Chief Financial Officer Pursuant to Section 906 of the Sarbanes-Oxley Act of 2002 |
| | — | | Group 1 Automotive Inc. Incentive-Based Compensation Recoupment Policy (incorporated by reference to Exhibit 97.1 to Group 1 Automotive, Inc.’s Annual Report on Form 10-K (File No. 001-13461) for the year ended December 31, 2023) |
| 101.INS | | — | | XBRL Instance Document |
| 101.SCH | | — | | XBRL Taxonomy Extension Schema Document |
| 101.CAL | | — | | XBRL Taxonomy Extension Calculation Linkbase Document |
| 101.DEF | | — | | XBRL Taxonomy Extension Definition Linkbase Document |
| 101.LAB | | — | | XBRL Taxonomy Extension Label Linkbase Document |
| 101.PRE | | — | | XBRL Taxonomy Extension Presentation Linkbase Document |
| 104 | | — | | Cover Page Interactive Data File (formatted as inline XBRL and contained in Exhibits 101) |
| † | Filed herewith |
| * | Management contract or compensatory plan or arrangement |
| ** | Furnished herewith |
| |
| + | Exhibits marked with a (+) exclude certain immaterial schedules and exhibits pursuant to the provisions of Regulation S-K, Item 601(a)(5). A copy of any of the omitted schedules and exhibits will be furnished to the Securities and Exchange Commission upon request. |
Item 16. Form 10-K Summary
None.
SIGNATURES
Pursuant to the requirements of Section 13 or 15(d) of the Securities Exchange Act of 1934, the registrant has duly caused this report to be signed on its behalf by the undersigned, thereunto duly authorized on February 14, 2025.
| | | | | | | | | | | |
| Group 1 Automotive, Inc. |
| | |
| By: | | /s/ Daryl A. Kenningham |
| | | Daryl A. Kenningham |
| | | President and Chief Executive Officer |
Pursuant to the requirements of the Securities Exchange Act of 1934, this report has been signed below by the following persons on behalf of the registrant in the capacities indicated on February 14, 2025. | | | | | | | | |
| Signature | | Title |
| |
| /s/ Daryl A. Kenningham | | President and Chief Executive Officer and Director |
| Daryl A. Kenningham | | (Principal Executive Officer) |
| |
| /s/ Daniel J. McHenry | | Senior Vice President and Chief Financial Officer |
| Daniel J. McHenry | | (Principal Financial and Accounting Officer) |
| |
| /s/ Charles L. Szews | | Chairman and Director |
| Charles L. Szews | | |
| | |
| /s/ Carin M. Barth | | Director |
| Carin M. Barth | | |
| | |
| /s/ Lincoln da Cunha Pereira Filho | | Director |
| Lincoln da Cunha Pereira Filho | | |
| |
| /s/ Steven C. Mizell | | Director |
| Steven C. Mizell | | |
| |
| /s/ Stephen D. Quinn | | Director |
| Stephen D. Quinn | | |
| | |
| /s/ Steven Stanbrook | | Director |
| Steven Stanbrook | | |
| | |
| /s/ Anne Taylor | | Director |
| Anne Taylor | |
| | |
| /s/ MaryAnn Wright | | Director |
| MaryAnn Wright | | |
INDEX TO FINANCIAL STATEMENTS
Report of Independent Registered Public Accounting Firm
To the Stockholders and the Board of Directors of Group 1 Automotive, Inc.
Opinion on the Financial Statements
We have audited the accompanying consolidated balance sheets of Group 1 Automotive, Inc. and subsidiaries (the “Company”) as of December 31, 2024 and 2023, the related consolidated statements of operations, comprehensive income, stockholders' equity, and cash flows, for each of the three years in the period ended December 31, 2024, and the related notes (collectively referred to as the “financial statements”). In our opinion, the financial statements present fairly, in all material respects, the financial position of the Company as of December 31, 2024 and 2023, and the results of its operations and its cash flows for each of the three years in the period ended December 31, 2024, in conformity with accounting principles generally accepted in the United States of America.
We have also audited, in accordance with the standards of the Public Company Accounting Oversight Board (United States) (PCAOB), the Company's internal control over financial reporting as of December 31, 2024, based on criteria established in Internal Control — Integrated Framework (2013) issued by the Committee of Sponsoring Organizations of the Treadway Commission and our report dated February 14, 2025, expressed an unqualified opinion on the Company's internal control over financial reporting.
Basis for Opinion
These financial statements are the responsibility of the Company's management. Our responsibility is to express an opinion on the Company's financial statements based on our audits. We are a public accounting firm registered with the PCAOB and are required to be independent with respect to the Company in accordance with the U.S. federal securities laws and the applicable rules and regulations of the Securities and Exchange Commission and the PCAOB.
We conducted our audits in accordance with the standards of the PCAOB. Those standards require that we plan and perform the audit to obtain reasonable assurance about whether the financial statements are free of material misstatement, whether due to error or fraud. Our audits included performing procedures to assess the risks of material misstatement of the financial statements, whether due to error or fraud, and performing procedures that respond to those risks. Such procedures included examining, on a test basis, evidence regarding the amounts and disclosures in the financial statements. Our audits also included evaluating the accounting principles used and significant estimates made by management, as well as evaluating the overall presentation of the financial statements. We believe that our audits provide a reasonable basis for our opinion.
Critical Audit Matters
The critical audit matters communicated below are matters arising from the current-period audit of the financial statements that were communicated or required to be communicated to the audit committee and that (1) relate to accounts or disclosures that are material to the financial statements and (2) involved our especially challenging, subjective, or complex judgments. The communication of critical audit matters does not alter in any way our opinion on the financial statements, taken as a whole, and we are not, by communicating the critical audit matters below, providing separate opinions on the critical audit matters or on the accounts or disclosures to which they relate.
Intangible Franchise Rights in Acquisitions and Impairment Assessments — Refer to Notes 1, 3 and 13 to the consolidated financial statements
Critical Audit Matter Description
During the year ended December 31, 2024, the Company acquired 67 dealerships. The acquisitions were accounted for as business combinations. Accordingly, the purchase price was allocated to the assets acquired and liabilities assumed based on their respective fair values, including indefinite-lived intangible assets, related to rights under franchise agreements with manufacturers. The fair value of acquired intangible franchise rights is estimated using the income approach.
The Company’s annual impairment assessment for intangible franchise rights is performed in the fourth quarter, or more frequently if events or circumstances indicate possible impairment. In evaluating intangible franchise rights for impairment, a qualitative assessment is initially performed to determine whether it is more-likely-than-not that an impairment exists. If it is concluded that it is more-likely-than-not that an impairment exists, a quantitative assessment is performed. The fair value is estimated using a discounted cash flow model, or income approach. The Company’s impairment assessments performed in fiscal year 2024 resulted in an impairment of $28.2 million of intangible franchise rights.
We identified the fair value of acquired intangible franchise rights for the acquisitions, the qualitative impairment assessments for certain franchise rights, as well as the fair value estimates used in the quantitative impairment assessments of intangible franchise rights as a critical audit matter because of the significant estimates and assumptions management makes related to forecasts of revenue growth rates, future EBITDA margins, weighted average cost of capital, and terminal growth rates. This required a high degree of auditor judgment and an increased extent of effort, including the need to involve our fair value specialists for the quantitative impairment assessments and acquired intangible franchise rights, when performing audit procedures to evaluate the reasonableness of management’s assumptions.
How the Critical Audit Matter Was Addressed in the Audit
Our audit procedures for the acquisitions and the impairment assessments related to the forecasts of revenue growth rates, future EBITDA margins, weighted average cost of capital and terminal growth rates included the following, among others:
•We tested the effectiveness of internal controls over the acquired intangible franchise rights and the intangible franchise rights impairment assessments, including those over the inputs, assumptions, and calculations used in determining fair value of the intangible franchise rights.
•We evaluated the reasonableness of management’s forecasts of revenue growth rates and future EBITDA margins by comparing the forecasts to:
◦The Company’s historical revenue and EBITDA margins.
◦Internal communications to management and the Board of Directors.
◦Current industry, market and economic trends.
•We performed a sensitivity analysis of certain assumptions such as revenue growth rates, future EBITDA margins, weighted average cost of capital, and terminal growth rates to evaluate the potential change in the fair value resulting from changes in underlying assumptions.
•With the assistance of our fair value specialists, for acquired intangible franchise rights and those intangible franchise rights where a quantitative impairment assessment was performed, we evaluated the reasonableness of the weighted average cost of capital and terminal growth rates by:
◦Developing a range of independent estimates and comparing those to the weighted average cost of capital selected by management.
◦Testing the source information underlying the determination of the terminal growth rates and testing the mathematical accuracy of the calculations.
Goodwill Impairment Assessment — Refer to Notes 1 and 13 to the consolidated financial statements
Critical Audit Matter Description
The Company’s annual impairment assessment for goodwill is performed in the fourth quarter, or more frequently if events or circumstances indicate possible impairment. The Company’s evaluation of goodwill for impairment involves the comparison of the fair value of each reporting unit to its carrying value. The fair value is estimated using the income approach and market approach, weighted equally. The goodwill balance for the U.K. reporting unit was $275.7 million as of December 31, 2024. The fair value of the U.K. reporting unit exceeded the carrying value as of the assessment date and, therefore, no impairment was recognized.
We identified the fair value estimates used in the U.K. reporting unit goodwill impairment assessment as a critical audit matter because of the significant estimates and assumptions management makes related to forecasts of revenue growth rates, future EBITDA margins, weighted average cost of capital, valuation multiples, and terminal growth rate. This required a high degree of auditor judgment and an increased extent of effort, including the need to involve our fair value specialists, when performing audit procedures to evaluate the reasonableness of management’s assumptions.
How the Critical Audit Matter Was Addressed in the Audit
Our audit procedures for the impairment assessment related to the forecasts of revenue growth rates, future EBITDA margins, weighted average cost of capital, valuation multiples, and terminal growth rate included the following, among others:
•We tested the effectiveness of internal controls over the goodwill impairment assessment, including those over the inputs, assumptions, and calculations used in determining fair value of the reporting unit.
•We evaluated the reasonableness of management’s forecasts of revenue growth rates and future EBITDA margins by comparing the forecasts to:
◦The Company’s historical revenue and EBITDA margins.
◦Internal communications to management and the Board of Directors.
◦Current industry, market and economic trends.
•We performed a sensitivity analysis of certain assumptions such as revenue growth rates, future EBITDA margins, weighted average cost of capital, valuation multiples, and terminal growth rate to evaluate the potential change in the fair value resulting from changes in underlying assumptions.
•With the assistance of our fair value specialists, we evaluated the reasonableness of the weighted average cost of capital, valuation multiples, and terminal growth rate by:
◦Developing a range of independent estimates and comparing those to the weighted average cost of capital and valuation multiples selected by management.
◦Testing the source information underlying the determination of the terminal growth rate and testing the mathematical accuracy of the calculations.
/s/ Deloitte & Touche LLP
Houston, Texas
February 14, 2025
We have served as the Company’s auditor since 2020.
GROUP 1 AUTOMOTIVE, INC.
CONSOLIDATED BALANCE SHEETS
(In millions, except share data) | | | | | | | | | | | | | | |
| | As of December 31, |
| | 2024 | | 2023 |
| ASSETS |
| CURRENT ASSETS: | | | | |
| Cash and cash equivalents | | $ | 34.4 | | | $ | 57.2 | |
| Contracts-in-transit and vehicle receivables, net | | 360.1 | | | 369.2 | |
| Accounts and notes receivables, net | | 303.0 | | | 238.4 | |
| Inventories | | 2,636.8 | | | 1,963.4 | |
| | | | |
| Prepaid expenses | | 67.9 | | | 38.9 | |
| Other current assets | | 18.8 | | | 25.1 | |
| Current assets classified as held for sale | | 76.2 | | | 99.1 | |
| TOTAL CURRENT ASSETS | | 3,497.3 | | | 2,791.3 | |
| Property and equipment, net | | 2,856.5 | | | 2,248.7 | |
| Operating lease assets | | 315.3 | | | 216.5 | |
| Goodwill | | 2,057.9 | | | 1,651.9 | |
| Intangible franchise rights | | 948.1 | | | 701.2 | |
| Other long-term assets | | 149.1 | | | 164.6 | |
| | | | |
| TOTAL ASSETS | | $ | 9,824.2 | | | $ | 7,774.1 | |
| | | | |
| LIABILITIES AND STOCKHOLDERS’ EQUITY |
| CURRENT LIABILITIES: | | | | |
| Floorplan notes payable — credit facility and other, net of offset account of $286.3 and $236.7, respectively | | $ | 1,255.3 | | | $ | 1,153.0 | |
| Floorplan notes payable — manufacturer affiliates, net of offset account of $2.0 and $38.5, respectively | | 766.7 | | | 412.4 | |
| Current maturities of long-term debt | | 175.3 | | | 109.4 | |
| Current operating lease liabilities | | 25.8 | | | 20.9 | |
| Accounts payable | | 738.0 | | | 499.3 | |
| Accrued expenses and other current liabilities | | 418.6 | | | 303.4 | |
| Current liabilities classified as held for sale | | 17.1 | | | 7.2 | |
| TOTAL CURRENT LIABILITIES | | 3,396.8 | | | 2,505.7 | |
| Long-term debt | | 2,737.9 | | | 1,989.4 | |
| Long-term operating lease liabilities | | 276.2 | | | 209.4 | |
| Deferred income taxes | | 295.8 | | | 256.6 | |
| | | | |
| Other long-term liabilities | | 143.3 | | 138.6 |
| | | | |
| Commitments and Contingencies (Note 18) | | | | |
| STOCKHOLDERS’ EQUITY: | | | | |
| Preferred stock, $0.01 par value, 1,000,000 shares authorized; none issued or outstanding | | — | | | — | |
| Common stock, $0.01 par value, 50,000,000 shares authorized; 24,989,807 and 25,131,460 issued, respectively | | 0.2 | | | 0.3 | |
| Additional paid-in capital | | 356.1 | | | 349.1 | |
| Retained earnings | | 4,122.4 | | | 3,649.8 | |
| Accumulated other comprehensive income (loss) | | 1.6 | | | 28.1 | |
| Treasury stock, at cost; 11,711,022 and 11,447,422 shares, respectively | | (1,506.2) | | | (1,352.8) | |
| TOTAL STOCKHOLDERS’ EQUITY | | 2,974.3 | | | 2,674.4 | |
| TOTAL LIABILITIES AND STOCKHOLDERS’ EQUITY | | $ | 9,824.2 | | | $ | 7,774.1 | |
The accompanying notes are an integral part of these consolidated financial statements.
GROUP 1 AUTOMOTIVE, INC.
CONSOLIDATED STATEMENTS OF OPERATIONS
(In millions, except per share data)
| | | | | | | | | | | | | | | | | | | | |
| | | Years Ended December 31, |
| | | 2024 | | 2023 | | 2022 |
| REVENUES: | | | | | | |
| New vehicle retail sales | | $ | 9,972.4 | | | $ | 8,774.6 | | | $ | 7,452.5 | |
| Used vehicle retail sales | | 6,179.9 | | | 5,693.5 | | | 5,673.3 | |
| Used vehicle wholesale sales | | 462.4 | | | 441.4 | | | 364.6 | |
| Parts and service sales | | 2,491.0 | | | 2,222.3 | | | 2,009.5 | |
| Finance, insurance and other, net | | 828.7 | | | 741.9 | | | 722.2 | |
| Total revenues | | 19,934.3 | | | 17,873.7 | | | 16,222.1 | |
| COST OF SALES: | | | | | | |
| New vehicle retail sales | | 9,254.5 | | | 8,007.6 | | | 6,627.0 | |
| Used vehicle retail sales | | 5,849.9 | | | 5,392.6 | | | 5,359.6 | |
| Used vehicle wholesale sales | | 465.7 | | | 445.2 | | | 364.6 | |
| Parts and service sales | | 1,123.2 | | | 1,008.0 | | | 905.8 | |
| Total cost of sales | | 16,693.3 | | | 14,853.4 | | | 13,256.9 | |
| GROSS PROFIT | | 3,241.0 | | | 3,020.3 | | | 2,965.2 | |
| Selling, general and administrative expenses | | 2,179.2 | | | 1,926.8 | | | 1,783.3 | |
| Depreciation and amortization expense | | 113.1 | | | 92.0 | | | 88.4 | |
| Asset impairments | | 33.0 | | | 32.9 | | | 2.1 | |
| Restructuring charges | | 16.7 | | | — | | | — | |
| Other operating (income) expense | | (10.0) | | | — | | | — | |
| INCOME FROM OPERATIONS | | 909.1 | | | 968.6 | | | 1,091.4 | |
| INTEREST EXPENSE: | | | | | | |
| Floorplan interest expense | | 108.5 | | | 64.1 | | | 27.3 | |
| Other interest expense, net | | 141.3 | | | 99.8 | | | 77.5 | |
| | | | | | |
| | | | | | |
| Other expense | | 0.7 | | | 4.5 | | | 1.2 | |
| INCOME BEFORE INCOME TAXES | | 658.5 | | | 800.2 | | | 985.3 | |
| Provision for income taxes | | 161.5 | | | 198.2 | | | 231.1 | |
| Net income from continuing operations | | 497.0 | | | 602.0 | | | 754.2 | |
| Net income (loss) from discontinued operations | | 1.2 | | | (0.4) | | | (2.7) | |
| NET INCOME | | $ | 498.1 | | | $ | 601.6 | | | $ | 751.5 | |
| BASIC EARNINGS PER SHARE: | | | | | | |
| Continuing operations | | $ | 36.88 | | | $ | 42.92 | | | $ | 47.46 | |
| Discontinued operations | | 0.09 | | | (0.03) | | | (0.17) | |
| Total | | $ | 36.96 | | | $ | 42.89 | | | $ | 47.29 | |
| DILUTED EARNINGS PER SHARE: | | | | | | |
| Continuing operations | | $ | 36.72 | | | $ | 42.75 | | | $ | 47.31 | |
| Discontinued operations | | 0.09 | | | (0.03) | | | (0.17) | |
| Total | | $ | 36.81 | | | $ | 42.73 | | | $ | 47.14 | |
| WEIGHTED AVERAGE COMMON SHARES OUTSTANDING: | | | | | | |
| Basic | | 13.2 | | | 13.7 | | | 15.4 | |
| Diluted | | 13.2 | | | 13.7 | | | 15.5 | |
The accompanying notes are an integral part of these consolidated financial statements.
GROUP 1 AUTOMOTIVE, INC.
CONSOLIDATED STATEMENTS OF COMPREHENSIVE INCOME
(In millions)
| | | | | | | | | | | | | | | | | | | | |
| | | Years Ended December 31, |
| | | 2024 | | 2023 | | 2022 |
| NET INCOME | | $ | 498.1 | | | $ | 601.6 | | | $ | 751.5 | |
| Other comprehensive income (loss), net of taxes: | | | | | | |
| Net foreign currency translation adjustments: | | | | | | |
| Unrealized foreign currency translation adjustments | | (19.1) | | | 23.7 | | | (27.2) | |
| Reclassification of cumulative foreign currency translation adjustments associated with the Brazil Disposal | | — | | | — | | | 122.8 | |
| Reclassification of other cumulative foreign currency translation adjustments | | — | | | — | | | 1.5 | |
| Foreign currency translation adjustments, net of reclassifications | | (19.1) | | | 23.7 | | | 97.1 | |
| Net unrealized gain (loss) on interest rate risk management activities, net of tax: | | | | | | |
| Unrealized gain arising during the period, net of tax provision of $(6.7), $(3.3) and $(25.8), respectively | | 21.5 | | | 10.4 | | | 84.1 | |
| | | | | | |
| Reclassification adjustment for gain included in interest expense, net of tax provision of $(9.0), $(7.9) and $(0.8), respectively | | (28.7) | | | (25.4) | | | (2.5) | |
| Reclassification related to de-designated interest rate swaps, net of tax provision of $(0.1), $(1.0) and $—, respectively | | (0.2) | | | (3.1) | | | — | |
| Unrealized (loss) gain on interest rate risk management activities, net of tax | | (7.4) | | | (18.0) | | | 81.6 | |
| OTHER COMPREHENSIVE (LOSS) INCOME, NET OF TAX | | (26.5) | | | 5.7 | | | 178.7 | |
| COMPREHENSIVE INCOME | | $ | 471.7 | | | $ | 607.3 | | | $ | 930.2 | |
The accompanying notes are an integral part of these consolidated financial statements.
GROUP 1 AUTOMOTIVE, INC.
CONSOLIDATED STATEMENTS OF STOCKHOLDERS’ EQUITY
(In millions, except share data)
| | | | | | | | | | | | | | | | | | | | | | | | | | | | | | | | | | | | | | | | | |
| | Common Stock | | Additional
Paid-in
Capital | | Retained
Earnings | | Accumulated Other Comprehensive Income (Loss) | | Treasury
Stock | | Total |
| | Shares | | Amount | |
| BALANCE, DECEMBER 31, 2021 | 25,336,054 | | | $ | 0.3 | | | $ | 325.8 | | | $ | 2,345.9 | | | $ | (156.2) | | | $ | (690.4) | | | $ | 1,825.2 | |
| Net income | — | | | — | | | — | | | 751.5 | | | — | | | — | | | 751.5 | |
| Other comprehensive income, net of taxes | — | | | — | | | — | | | — | | | 178.7 | | | — | | | 178.7 | |
| | | | | | | | | | | | | |
| Purchases of treasury stock | — | | | — | | | — | | | — | | | — | | | (521.2) | | | (521.2) | |
| Net issuance of treasury shares to stock compensation plans | (103,434) | | | — | | | (14.1) | | | — | | | — | | | 14.2 | | | 0.1 | |
| Stock-based compensation | — | | | — | | | 27.0 | | | — | | | — | | | — | | | 27.0 | |
| Dividends declared ($1.50 per share) | — | | | — | | | — | | | (23.9) | | | — | | | — | | | (23.9) | |
| | | | | | | | | | | | | |
| BALANCE, DECEMBER 31, 2022 | 25,232,620 | | | $ | 0.3 | | | $ | 338.7 | | | $ | 3,073.6 | | | $ | 22.5 | | | $ | (1,197.5) | | | $ | 2,237.5 | |
| Net income | — | | | — | | | — | | | 601.6 | | | — | | | — | | | 601.6 | |
| Other comprehensive income, net of taxes | — | | | — | | | — | | | — | | | 5.7 | | | — | | | 5.7 | |
| | | | | | | | | | | | | |
| Purchases of treasury stock, including excise tax | — | | | — | | | — | | | — | | | — | | | (174.2) | | | (174.2) | |
| Net issuance of treasury shares to stock compensation plans | (101,160) | | | — | | | (9.7) | | | — | | | — | | | 18.9 | | | 9.2 | |
| Stock-based compensation | — | | | — | | | 20.1 | | | — | | | — | | | — | | | 20.1 | |
| Dividends declared ($1.80 per share) | — | | | — | | | — | | | (25.4) | | | — | | | — | | | (25.4) | |
| BALANCE, DECEMBER 31, 2023 | 25,131,460 | | | $ | 0.3 | | | $ | 349.1 | | | $ | 3,649.8 | | | $ | 28.1 | | | $ | (1,352.8) | | | $ | 2,674.4 | |
| Net income | — | | | — | | | — | | | 498.1 | | | — | | | — | | | 498.1 | |
| Other comprehensive loss, net of taxes | — | | | — | | | — | | | — | | | (26.5) | | | — | | | (26.5) | |
| | | | | | | | | | | | | |
| Purchases of treasury stock, including excise tax | — | | | — | | | — | | | — | | | — | | | (163.0) | | | (163.0) | |
| Net issuance of treasury shares to stock compensation plans | (141,653) | | | — | | | (18.2) | | | — | | | — | | | 9.6 | | | (8.6) | |
| Stock-based compensation | — | | | — | | | 25.2 | | | — | | | — | | | — | | | 25.2 | |
| Dividends declared ($1.88 per share) | — | | | — | | | — | | | (25.5) | | | — | | | — | | | (25.5) | |
| | | | | | | | | | | | | |
| BALANCE, DECEMBER 31, 2024 | 24,989,807 | | | $ | 0.2 | | | $ | 356.1 | | | $ | 4,122.4 | | | $ | 1.6 | | | $ | (1,506.2) | | | $ | 2,974.3 | |
The accompanying notes are an integral part of these consolidated financial statements.
GROUP 1 AUTOMOTIVE, INC.
CONSOLIDATED STATEMENTS OF CASH FLOWS
(In millions)
| | | | | | | | | | | | | | | | | | | | |
| | | Years Ended December 31, |
| | | 2024 | | 2023 | | 2022 |
| CASH FLOWS FROM OPERATING ACTIVITIES: | | | | | | |
| Net income | | $ | 498.1 | | | $ | 601.6 | | | $ | 751.5 | |
| Adjustments to reconcile net income to net cash provided by operating activities: | | | | | | |
| Depreciation and amortization | | 113.1 | | | 92.0 | | | 89.3 | |
| Change in operating lease assets | | 27.2 | | | 25.3 | | | 29.5 | |
| Deferred income taxes | | 23.6 | | | 18.7 | | | 28.0 | |
| Asset impairments | | 34.8 | | | 32.9 | | | 8.5 | |
| Stock-based compensation | | 25.2 | | | 20.1 | | | 27.0 | |
| Amortization of debt discount and issue costs | | 4.0 | | | 3.0 | | | 3.0 | |
| Gain on disposition of assets | | (59.5) | | | (23.3) | | | (41.1) | |
| | | | | | |
| Unrealized loss (gain) on derivative instruments | | 0.3 | | | (3.7) | | | — | |
| Other | | (0.1) | | | (2.7) | | | 0.5 | |
| Changes in assets and liabilities, net of acquisitions and dispositions: | | | | | | |
| Accounts payable and accrued expenses | | 90.7 | | | 39.2 | | | 66.5 | |
| Accounts and notes receivable | | (32.9) | | | (37.4) | | | (17.4) | |
| Inventories | | (254.4) | | | (567.6) | | | (282.1) | |
| Contracts-in-transit and vehicle receivables | | 38.7 | | | (88.1) | | | (55.4) | |
| Prepaid expenses and other assets | | (18.1) | | | (21.2) | | | 0.4 | |
| Floorplan notes payable — manufacturer affiliates | | 119.6 | | | 126.7 | | | 7.5 | |
| Deferred revenues | | (1.3) | | | (0.9) | | | (0.4) | |
| Operating lease liabilities | | (22.9) | | | (24.4) | | | (29.4) | |
| Net cash provided by operating activities | | 586.3 | | | 190.2 | | | 585.9 | |
| CASH FLOWS FROM INVESTING ACTIVITIES: | | | | | | |
| Cash paid for acquisitions, net, including repayment of sellers’ floorplan notes payable of $50.3, $66.3 and $25.3, respectively | | (1,276.8) | | | (366.1) | | | (528.7) | |
| Proceeds from disposition of franchises, property and equipment | | 229.7 | | | 193.8 | | | 141.4 | |
| Purchases of property and equipment | | (245.1) | | | (185.4) | | | (155.5) | |
| Proceeds from sale of discontinued operations, net | | — | | | — | | | 59.4 | |
| Other | | 9.6 | | | (8.3) | | | (1.3) | |
| Net cash used in investing activities | | (1,282.6) | | | (366.1) | | | (484.6) | |
| CASH FLOWS FROM FINANCING ACTIVITIES: | | | | | | |
| Borrowings on credit facility — floorplan line and other | | 12,593.0 | | | 11,366.2 | | | 10,236.1 | |
| Repayments on credit facility — floorplan line and other | | (12,490.9) | | | (10,940.4) | | | (9,766.5) | |
| Borrowings on credit facility — acquisition line | | 1,325.3 | | | 200.0 | | | 406.6 | |
| Repayments on credit facility — acquisition line | | (1,553.1) | | | (178.2) | | | (429.6) | |
| Debt issuance costs | | (10.8) | | | (0.3) | | | (4.6) | |
| Borrowings of senior notes | | 500.0 | | | — | | | — | |
| | | | | | |
| Borrowings on other debt | | 706.4 | | | 150.2 | | | 315.5 | |
| Principal payments on other debt | | (193.3) | | | (223.6) | | | (286.4) | |
| Proceeds from employee stock purchase plan | | 24.4 | | | 21.3 | | | 19.5 | |
| Payments of tax withholding for stock-based compensation | | (33.0) | | | (12.1) | | | (11.8) | |
| | | | | | |
| Repurchases of common stock, amounts based on settlement date | | (161.6) | | | (172.8) | | | (521.2) | |
| Dividends paid | | (25.2) | | | (25.2) | | | (23.7) | |
| Other | | — | | | — | | | (1.2) | |
| Net cash provided by (used in) financing activities | | 681.1 | | | 185.2 | | | (67.3) | |
| Effect of exchange rate changes on cash | | (7.6) | | | 0.1 | | | (4.8) | |
| Net (decrease) increase in cash and cash equivalents | | (22.8) | | | 9.4 | | | 29.2 | |
| CASH AND CASH EQUIVALENTS, beginning of period | | 57.2 | | | 47.9 | | | 18.7 | |
| CASH AND CASH EQUIVALENTS, end of period | | $ | 34.4 | | | $ | 57.2 | | | $ | 47.9 | |
| | | | | | |
| | | | | | |
The accompanying notes are an integral part of these consolidated financial statements.
GROUP 1 AUTOMOTIVE, INC.
NOTES TO CONSOLIDATED FINANCIAL STATEMENTS
1. BASIS OF PRESENTATION, CONSOLIDATION AND SUMMARY OF ACCOUNTING POLICIES
Basis of Presentation and Consolidation
The accompanying Consolidated Financial Statements and notes thereto, have been prepared in accordance with U.S. GAAP and reflect the consolidated accounts of the parent company, Group 1 Automotive, Inc., and its subsidiaries, all of which are wholly owned. All intercompany balances and transactions have been eliminated in consolidation. Group 1 Automotive, Inc. and its subsidiaries are collectively referred to as the “Company” in these Notes to Consolidated Financial Statements.
On July 1, 2022, the Company completed the disposal of 100% of the issued and outstanding equity interests of the Company’s Brazilian operations (the “Brazil Disposal Group”). The Brazil Disposal Group met the criteria to be reported as discontinued operations. Therefore, the related assets, liabilities and operating results of the Brazil Disposal Group are reported as discontinued operations (the “Brazil Discontinued Operations”) for all periods presented. Unless otherwise specified, disclosures in these Consolidated Financial Statements reflect continuing operations only. Refer to Note 4. Discontinued Operations and Other Divestitures for additional information on the Brazil Discontinued Operations.
During the year ended December 31, 2024, the Company recognized $10.0 million of business interruption insurance recoveries as a result of the June 2024 cybersecurity incident experienced by CDK, which resulted in service outages on CDK’s dealers’ systems. The insurance recoveries were recognized within Other operating (income) expense in the Consolidated Statements of Operations.
Certain amounts in the Consolidated Financial Statements and the accompanying notes may not compute due to rounding. All computations have been calculated using unrounded amounts for all periods presented. These Consolidated Financial Statements reflect, in the opinion of management, all normal recurring adjustments necessary to fairly state, in all material respects, the Company’s financial position and results of operations for the periods presented.
Use of Estimates
The preparation of the Company’s financial statements in conformity with U.S. GAAP requires management to make certain estimates and assumptions. These estimates and assumptions affect the reported amounts of assets and liabilities, the disclosures of contingent assets and liabilities at the balance sheet date and the amounts of revenues and expenses recognized during the reporting period. Management analyzes the Company’s estimates based on historical experience and other assumptions that are believed to be reasonable under the circumstances, however, actual results could differ materially from such estimates. The significant estimates made by management in the accompanying Consolidated Financial Statements include, but are not limited to, inventory valuation adjustments, reserves for future chargebacks on finance, insurance and vehicle service contract fees, self-insured property and casualty insurance exposure, the fair value of assets acquired and liabilities assumed in business combinations, the valuation of goodwill and intangible franchise rights, and reserves for potential litigation.
Revenue Recognition
Refer to Note 2. Revenues for further discussion of the Company’s revenue streams and accounting policies related to revenue recognition.
Cash and Cash Equivalents
Cash and cash equivalents include demand deposits and various other short-term investments with original maturities of three months or less at the date of purchase.
Receivables
Refer to Note 9. Receivables, Net and Contract Assets for further discussion of the Company’s receivable accounts and related accounting policies.
Inventories
New and used retail vehicles are carried at the lower of specific cost or net realizable value. Specific cost consists of the amount paid to acquire the vehicle, plus the cost of reconditioning, equipment addition and transportation. In determining the lower of specific cost or net realizable value of new and used vehicles, the Company considers historical loss experience and current market trends.
GROUP 1 AUTOMOTIVE, INC.
NOTES TO CONSOLIDATED FINANCIAL STATEMENTS — (Continued)
Parts and accessories inventories are valued at the lower of cost or net realizable value and determined on a first-in, first-out basis. The Company incurs shipping costs in connection with selling parts to customers which is included in Cost of Sales in the Consolidated Statements of Operations.
Certain manufacturers offer vehicle rebates, in the form of purchase discounts, once applicable incentive targets are met. Incentive targets typically consist of volume incentives to order and/or sell certain models and/or volumes of inventory over designated periods of time. The Company also receives dealer rebates and incentive payments on parts purchases from the automobile manufacturers on new vehicle retail sales. Additionally, the Company receives interest assistance from certain automobile manufacturers that is reflected as a vehicle purchase price discount. The rebates, interest assistance and other dealer incentives reduce inventory costs in the Consolidated Balance Sheets and are reflected as a reduction to Cost of Sales in the Consolidated Statements of Operations as the vehicles are sold.
Refer to Note 10. Inventories for further discussion of the Company’s inventory accounts.
Property and Equipment, Net
Property and equipment, recorded at cost, is depreciated using the straight-line method over the estimated useful lives of the assets to estimated salvage values. Leasehold improvements are capitalized and amortized over the lesser of the estimated term of the lease or the estimated useful life of the asset.
Property and equipment estimated useful lives are as follows: | | | | | | | | |
| | | Estimated
Useful Lives
in Years |
| | |
| | |
| | |
| Buildings and leasehold improvements | | 25 to 50 |
| | |
| Machinery and dealership equipment | | 7 to 20 |
| Office equipment, furniture and fixtures | | 3 to 20 |
| Company vehicles | | 3 to 5 |
Expenditures for major additions or improvements, which improve or extend the useful lives of the assets are capitalized. Minor replacements and routine maintenance and repairs, which do not improve or extend the lives of the assets, are expensed as incurred. Disposals are removed at cost less accumulated depreciation, and any resulting gain or loss is reflected in Selling, general and administrative expenses in the Consolidated Statements of Operations.
The Company performs an impairment analysis on long-lived assets used in operations when events or circumstances indicate that the carrying value of such assets may not be recoverable. This review consists of comparing the carrying amount of the asset group with its expected future undiscounted cash flows. Estimates of expected future cash flows represent management’s best estimate based on currently available information and reasonable and supportable assumptions. If the asset group’s carrying amount exceeds its future undiscounted cash flows, an impairment charge is measured as the amount by which its carrying amount exceeds its fair value. Refer to Note 11. Property and Equipment, Net for further discussion. The fair value of property is typically based on a third-party appraisal which requires adjustments to market-based valuation inputs to reflect the different characteristics between the property being measured and comparable properties, which are considered level 3 inputs within the fair value hierarchy described further in Note 8. Financial Instruments and Fair Value Measurements.
Business Combinations
Business acquisitions are accounted for under the acquisition method of accounting, whereby the Company measures and recognizes the fair value of assets acquired and liabilities assumed at the date of acquisition. The operating results of entities acquired are included in the accompanying Consolidated Statements of Operations from the date of acquisition. For material acquisitions, the Company typically utilizes third-party experts to determine the fair values of property acquired.
The fair values of assets acquired and liabilities assumed in business combinations are estimated using various assumptions. The most significant assumptions, and those requiring the most judgment, involve the estimated fair values of property and intangible franchise rights.
If the initial accounting for a business combination has not been concluded by the end of the reporting period in which the acquisition occurs, an estimate will be recorded and disclosure of those open areas will be provided. The Company will record any material adjustments to the initial estimates based on new information obtained that would have existed as of the date of the acquisition within a year of the acquisition date.
Refer to Note 3. Acquisitions for further discussion of the Company’s business combinations.
GROUP 1 AUTOMOTIVE, INC.
NOTES TO CONSOLIDATED FINANCIAL STATEMENTS — (Continued)
Goodwill and Intangible Franchise Rights
Goodwill represents the excess, at the date of acquisition, of the purchase price of an acquired business over the fair value of the net tangible and intangible assets acquired. The Company is organized into two geographic regions, the U.S. region and the U.K. region. The Company has determined that each region represents a reporting unit for the purpose of assessing goodwill for impairment.
In addition to goodwill, the Company recognizes, at the dealership level, separately identifiable intangible assets for rights under franchise agreements with manufacturers. Most of the Company’s franchise agreements continue indefinitely. The Company believes that these agreements can be renewed without substantial cost based on the history with the manufacturer. As such, the Company’s intangible assets for rights under franchise agreements are considered non-amortizing indefinite lived intangible assets, expected to contribute to cash flows of the Company for an indefinite period of time.
The Company evaluates goodwill and intangible franchise rights for impairment annually as of October 31, or more frequently if events or circumstances indicate possible impairment has occurred.
Refer to Note 13. Intangible Franchise Rights and Goodwill for further discussion of the Company’s goodwill and intangibles, including results of its impairment testing.
Income Taxes
The Company is subject to income taxes at the U.S. federal level and in 17 states in the U.S., as well as in the U.K., each of which has unique tax calculations. As the amount of income generated in each jurisdiction varies from period to period, the Company’s effective tax rate can vary based on the proportion of taxable income generated in each jurisdiction.
The Company follows the liability method of accounting for income taxes. Under this method, deferred income taxes are recorded based on differences between the financial reporting and tax basis of assets and liabilities and are measured using the enacted tax rates and laws that will be in effect when the underlying assets are realized or liabilities are settled. A valuation allowance reduces deferred tax assets when it is more-likely-than-not that some or all of the deferred tax assets will not be realized. The Company has recognized deferred tax assets, net of valuation allowances, that it believes will be realized, based primarily on the assumption of future taxable income. Refer to Note 16. Income Taxes for further discussion.
Derivative Financial Instruments
The Company holds derivative financial instruments consisting of interest rate swaps that are designated as cash flow hedges. Refer to Note 8. Financial Instruments and Fair Value Measurements for further discussion of the Company’s accounting policies relating to its derivative financial instruments, including fair value measurements.
Advertising
The Company expenses the costs of advertising as incurred. Advertising expense is included in Selling, general and administrative expenses in the Consolidated Statements of Operations and totaled $96.2 million, $83.0 million and $76.5 million for the years ended December 31, 2024, 2023 and 2022, respectively. The Company receives advertising assistance from certain automobile manufacturers, which the Company is required to spend on qualified advertising, and which is subject to audit and chargeback by the manufacturer. The assistance is accounted for as a reduction to SG&A expenses as earned and amounted to $24.8 million, $22.3 million and $17.4 million for the years ended December 31, 2024, 2023 and 2022, respectively.
Statements of Cash Flows
With respect to all new vehicle floorplan borrowings, the vehicle manufacturers draft the funds directly from the Company’s credit facilities with no cash flow to or from the Company. With respect to borrowings for used vehicle financing in the U.S., the Company finances up to 85% of the value of the used vehicle inventory and the borrowed funds flow from the lender directly to the Company. In the U.K., the Company chooses which used vehicles to finance and the borrowings flow directly to the Company from the lender.
Excluding the cash flows from or to manufacturer affiliated lenders participating in the Company’s syndicated lending group under the Revolving Credit Facility as defined in Note 14. Floorplan Notes Payable, all borrowings from, and repayments to, lenders affiliated with the vehicle manufacturers are presented within Cash Flows from Operating Activities on the Consolidated Statements of Cash Flows. All borrowings from, and repayments to, the Company’s credit facilities (including the cash flows from or to manufacturer affiliated lenders participating in the Revolving Credit Facility) are presented within Cash Flows from Financing Activities.
GROUP 1 AUTOMOTIVE, INC.
NOTES TO CONSOLIDATED FINANCIAL STATEMENTS — (Continued)
Leases
Refer to the discussion of the Company’s leases and related accounting policies in Note 12. Leases.
Foreign Currency Translation
The functional currency for the Company’s U.K. subsidiaries is GBP. All assets and liabilities of foreign subsidiaries are translated into USD using period-end foreign currency exchange rates and all revenues and expenses are translated at average foreign currency exchange rates during the respective period. The gains and losses resulting from translation adjustments are recorded in AOCI in the Consolidated Statements of Stockholders’ Equity.
Recent Accounting Pronouncements
In December 2023, the FASB issued ASU 2023-09, Income Taxes (Topic 740): Improvements to Income Tax Disclosures. The amendments require the disclosure of a reconciliation between income tax expense from continuing operations and the amount computed by multiplying income from continuing operations before income taxes by the applicable statutory rate as well as an annual disaggregation of the income tax rate reconciliation between certain specified categories by both percentage and reported amounts, along with other changes to income tax disclosure requirements. The standard will be effective for fiscal years beginning after December 15, 2024. Early adoption is permitted and can be applied retrospectively. The Company is currently evaluating the impact that the adoption of the provisions of the ASU will have on its consolidated financial statements.
In November 2024, the FASB issued ASU 2024-03, Income Statement — Reporting Comprehensive Income — Expense Disaggregation Disclosures. The ASU requires that an entity disclose additional information about specific expense categories in the notes to financial statements. The standard will be effective for fiscal years beginning after December 15, 2026, and interim periods within fiscal years beginning after December 15, 2027. The Company is currently evaluating the impact that the adoption of the provisions of the ASU will have on its consolidated financial statements.
2. REVENUES
The Company derives its revenues primarily from the sale of new and used vehicles; sale of vehicle parts; performance of maintenance and repair services; and arrangement of vehicle financing and sale of service and other insurance contracts. Revenue recognition for each of these streams is discussed below. With respect to the cost of freight and shipping from the Company’s dealerships to its customers, the Company’s policy is to recognize such cost within Cost of Sales in the Consolidated Statements of Operations. Taxes collected from customers and remitted to governmental authorities are reported on a net basis in the Company’s Consolidated Financial Statements, thus excluded from revenues.
The following tables present the Company’s revenues disaggregated by its geographical segments (in millions): | | | | | | | | | | | | | | | | | | | | |
| | Year Ended December 31, 2024 |
| | U.S. | | U.K. | | Total |
| | | | | | |
| New vehicle retail sales | | $ | 8,110.1 | | | $ | 1,862.3 | | | $ | 9,972.4 | |
| Used vehicle retail sales | | 4,550.7 | | | 1,629.2 | | | 6,179.9 | |
| Used vehicle wholesale sales | | 323.8 | | | 138.6 | | | 462.4 | |
| Total new and used vehicle sales | | 12,984.6 | | | 3,630.1 | | | 16,614.7 | |
Parts and service sales (1) | | 2,052.7 | | | 438.3 | | | 2,491.0 | |
Finance, insurance and other, net (2) | | 735.6 | | | 93.0 | | | 828.7 | |
| Total revenues | | $ | 15,772.9 | | | $ | 4,161.5 | | | $ | 19,934.3 | |
| | | | | | | | | | | | | | | | | | | | |
| | Year Ended December 31, 2023 |
| | U.S. | | U.K. | | Total |
| | | | | | |
| New vehicle retail sales | | $ | 7,433.6 | | | $ | 1,341.0 | | | $ | 8,774.6 | |
| Used vehicle retail sales | | 4,458.7 | | | 1,234.8 | | | 5,693.5 | |
| Used vehicle wholesale sales | | 314.4 | | | 127.1 | | | 441.4 | |
| Total new and used vehicle sales | | 12,206.6 | | | 2,702.9 | | | 14,909.5 | |
Parts and service sales (1) | | 1,933.3 | | | 289.0 | | | 2,222.3 | |
Finance, insurance and other, net (2) | | 674.3 | | | 67.6 | | | 741.9 | |
| Total revenues | | $ | 14,814.2 | | | $ | 3,059.5 | | | $ | 17,873.7 | |
GROUP 1 AUTOMOTIVE, INC.
NOTES TO CONSOLIDATED FINANCIAL STATEMENTS — (Continued)
| | | | | | | | | | | | | | | | | | | | |
| | Year Ended December 31, 2022 |
| | U.S. | | U.K. | | Total |
| | | | | | |
| New vehicle retail sales | | $ | 6,238.5 | | | $ | 1,214.0 | | | $ | 7,452.5 | |
| Used vehicle retail sales | | 4,531.5 | | | 1,141.8 | | | 5,673.3 | |
| Used vehicle wholesale sales | | 238.8 | | | 125.8 | | | 364.6 | |
| Total new and used vehicle sales | | 11,008.8 | | | 2,481.6 | | | 13,490.4 | |
Parts and service sales (1) | | 1,761.4 | | | 248.2 | | | 2,009.5 | |
Finance, insurance and other, net (2) | | 656.9 | | | 65.2 | | | 722.2 | |
| Total revenues | | $ | 13,427.1 | | | $ | 2,795.1 | | | $ | 16,222.1 | |
(1) The Company has elected not to disclose revenues related to remaining performance obligations on its maintenance and repair services as the duration of these contracts is less than one year.
(2) Includes variable consideration recognized of $30.6 million, $24.1 million and $30.8 million during the years ended December 31, 2024, 2023 and 2022, respectively, relating to performance obligations satisfied in previous periods on the Company’s retrospective commission income contracts. Refer to Arrangement of Vehicle Financing and the Sale of Service and Other Insurance Contracts section within this Note for further discussion of these arrangements. Refer to Note 9. Receivables, Net and Contract Assets for the balance of the Company’s contract assets associated with revenues from the arrangement of financing and sale of service and insurance contracts.
New and Used Retail Vehicle Sales
Revenues from the sale of new and used vehicles is recognized upon delivery of the vehicle to the customer, which is the point at which transfer of control occurs and when the performance obligation is satisfied. In some cases, the Company uses a third-party transport company to facilitate delivery of used vehicles to the customer.
The transaction price for new and used vehicle sales is the stand-alone sales price of each individual vehicle and is generally settled within 30 days of the satisfaction of the performance obligation.
Used Vehicle Wholesale Sales
When the Company uses a third-party auction to facilitate the delivery of used vehicles to the customer, the Company has determined that the auction acts as an agent under the arrangement. Therefore, the Company recognizes revenues and cost of sales on a gross basis upon delivery of the vehicle at the auction to the customer, which is the point at which transfer of control occurs and when the performance obligation is satisfied.
The transaction price for wholesale vehicle sales is established by the winning bid under the auction process and is generally settled within 30 days of the satisfaction of the performance obligation.
Parts Sales
Revenues from the sale of vehicle parts is recognized upon delivery of the parts to the customer, which is the point at which transfer of control occurs and when the performance obligation is satisfied.
The transaction price for vehicle parts sales is the stand-alone sales price of each individual part and is generally settled within 30 days of the satisfaction of the performance obligation.
GROUP 1 AUTOMOTIVE, INC.
NOTES TO CONSOLIDATED FINANCIAL STATEMENTS — (Continued)
Service Sales
The Company performs maintenance and repair services, including collision restoration.
In certain jurisdictions, the Company has an enforceable right to payment for performance completed to date on open work orders and as such, the transfer of control of vehicle maintenance and repair services and satisfaction of the performance obligation to its customer occurs over time. For these contracts that qualify for revenue recognition over time, the Company uses the input method for the measurement of progress and recognition of revenues, utilizing labor cost incurred to estimate the services performed for which the Company has an enforceable right to payment. The Company believes this method is the most objective measure of progress and provides a faithful depiction of the Company’s transfer of services to the customer.
The transaction price for maintenance and repair services is the total of the labor and, if applicable, vehicle parts used in the performance of the service, as well as the margin above cost charged to the customer.
Arrangement of Vehicle Financing and the Sale of Service and Other Insurance Contracts
The Company receives commissions from F&I providers for the arrangement of vehicle financing and the sale of service and other insurance products. Within the context of these contracts with the F&I providers, the Company has determined that it is an agent for the F&I providers.
The Company has a single performance obligation associated with the F&I contracts, which is the facilitation of the financing of the vehicle or sale of the insurance product. Revenues from these contracts is recognized when the facilitated contract between the F&I provider and the customer is executed, which is when the performance obligation is satisfied.
With regards to the upfront commission for these contracts, the transaction price is the amount earned for each individual contract executed and is generally collected within 30 days of the satisfaction of the performance.
Charge Backs
The Company may be charged back in the future for commissions received on F&I contract or vehicle service contract fees in the event of early termination of the contracts by customers. A reserve for future amounts estimated to be charged back, representing variable consideration, is recorded as a reduction to Finance, insurance and other, net in the Consolidated Statements of Operations. The reserve is estimated based on the Company’s historical charge back results and the termination provisions of the applicable contracts, and was $76.1 million and $70.4 million at December 31, 2024 and 2023, respectively.
Retrospective Commissions and Associated Contract Assets
In some cases, the Company also earns retrospective commission income by participating in the future profitability of the portfolio of product contracts sold by the Company. This contingent consideration is variable and is generally settled over five to seven years from the satisfaction of the performance obligation. The Company utilizes the “expected value” method to predict the amount of consideration to which the Company will be entitled, subject to constraint in the estimate. The estimated amount under the expected value method is accrued upfront when the facilitated contract between the F&I provider and the customer is executed, which is when the performance obligation is satisfied. The estimated amount is reflected as a contract asset within Other current assets and Other long-term assets in the Consolidated Balance Sheets until the right to such consideration becomes unconditional, at which time amounts due are reclassified to accounts receivable. Changes in the estimated amount of variable consideration are adjusted through revenues.
The change in contract assets during the year ended December 31, 2024, is reflected in the table below (in millions): | | | | | | | | |
| | F&I, Net |
| Contract Assets, January 1, 2024 | | $ | 55.0 | |
| Changes related to revenue recognition during the period | | 30.6 | |
| Amounts invoiced during the period | | (26.6) | |
| Contract Assets, December 31, 2024 | | $ | 59.0 | |
GROUP 1 AUTOMOTIVE, INC.
NOTES TO CONSOLIDATED FINANCIAL STATEMENTS — (Continued)
3. ACQUISITIONS
The Company accounts for business combinations under the acquisition method of accounting, under which the Company allocates the purchase price to the assets acquired and liabilities assumed based on an estimate of fair value.
Inchcape Acquisition
On August 1, 2024 (the “Acquisition Date”), the Company completed the acquisition of Inchcape Retail automotive operations (“Inchcape Retail”), consisting of 54 dealership locations, certain real estate and three collision centers across the U.K. (collectively referred to as the “Inchcape Acquisition”), for aggregate consideration of approximately $517.0 million.
The accounting for the Inchcape Acquisition is considered to be preliminary. The Company is continuing to analyze and assess relevant information related to the valuation of certain property, equipment, intangible assets, property lease contracts and deferred tax assets. Due to the recent timing and complexity of the Inchcape Acquisition, these amounts are provisional and subject to change as the Company’s fair value assessments are finalized. The Company will reflect any such adjustments in subsequent filings. The results of the Inchcape Acquisition are included in the U.K. segment. The acquired goodwill is not deductible for income tax purposes.
The following table summarizes the consideration paid and aggregate amounts of assets acquired and liabilities assumed as of December 31, 2024 (in millions):
| | | | | | | | |
| Total consideration | | $ | 517.0 | |
| Identifiable assets acquired and liabilities assumed | | |
| Cash | | $ | 23.4 | |
| Contracts-in-transit and vehicle receivables, net | | 27.6 | |
| Accounts receivable, net | | 37.7 | |
| Inventories | | 384.3 | |
| Prepaid expenses and other current assets | | 13.0 | |
| Property and equipment | | 287.0 | |
| Operating lease assets | | 102.5 | |
| Intangible franchise rights | | 121.8 | |
| | |
| | |
| Total assets acquired | | 997.3 | |
| | |
| Floorplan notes payable | | 236.4 | |
| Accounts payable | | 204.6 | |
| Accrued expenses | | 54.5 | |
| Operating lease liabilities | | 75.4 | |
| Deferred income taxes | | 20.2 | |
| Other liabilities | | 3.9 | |
| Total liabilities assumed | | 595.1 | |
| Total identifiable net assets | | 402.2 | |
| | |
| Goodwill | | $ | 114.8 | |
The Company recorded $15.4 million of acquisition related costs attributable to the Inchcape Acquisition during the year ended December 31, 2024. These costs are included in Selling, general and administrative expenses in the Consolidated Statements of Operations.
The Company’s Consolidated Statements of Operations included revenues and net loss attributable to Inchcape Retail from the Acquisition Date through the year ended December 31, 2024, of $990.4 million and $3.1 million, respectively.
The following unaudited pro forma financial information presents consolidated information of the Company as if the Inchcape Acquisition had occurred on January 1, 2023 (in millions):
| | | | | | | | | | | | | | |
| | Year Ended December 31, |
| | 2024 | | 2023 |
| | |
| | (unaudited) |
| Revenues | | $ | 21,498.7 | | | $ | 20,503.1 | |
| Net income | | $ | 522.7 | | | $ | 584.6 | |
GROUP 1 AUTOMOTIVE, INC.
NOTES TO CONSOLIDATED FINANCIAL STATEMENTS — (Continued)
This pro forma information incorporates the Company’s accounting policies and adjusts the results of Inchcape Retail assuming that the fair value adjustments in connection with the Inchcape Acquisition occurred on January 1, 2023. They have also been adjusted to reflect the $15.4 million of acquisition-related costs incurred during the year ended December 31, 2024 as having occurred on January 1, 2023.
Pro forma data may not be indicative of the results that would have been obtained had these events actually occurred at the beginning of the period presented and is not intended to be a projection of future results.
Other Acquisitions
During the year ended December 31, 2024, the Company acquired nine dealerships in the U.S., including three Honda, two Lexus, one Toyota, one Kia, one Hyundai and one Mercedes-Benz dealerships. The Company also acquired one Toyota Certified pre-owned center and three collision centers in the U.S. Aggregate consideration paid for these dealerships, which were accounted for as business combinations, was $690.4 million. Goodwill associated with the acquisitions totaled $288.3 million.
During the year ended December 31, 2024, the Company acquired five additional dealerships in the U.K., including four Mercedes-Benz and one BMW/MINI dealerships. Aggregate consideration paid for these dealerships, which were accounted for as business combinations, was $110.1 million, net of cash acquired, consisting of cash paid of $111.1 million and a receivable of $1.1 million. Goodwill associated with the acquisitions totaled $46.3 million.
The accounting for these acquisitions is considered to be preliminary and subject to change as the Company’s fair value assessments are finalized. The Company is continuing to analyze and assess relevant information related to the valuation of property, equipment and intangible assets. The Company will reflect any required fair value adjustments in subsequent periods.
During the year ended December 31, 2023, the Company acquired six dealerships in the U.S. Aggregate consideration paid for these dealerships, which were accounted for as business combinations, was $365.8 million, net of cash acquired. Goodwill associated with these acquisitions totaled $49.7 million.
During the year ended December 31, 2022, the Company acquired six dealerships and a collision center in the U.S. Aggregate consideration paid for these dealerships, which were accounted for as business combinations, was $507.5 million, net of cash acquired. Goodwill associated with these acquisitions totaled $236.1 million.
During the year ended December 31, 2022, the Company acquired a dealership and related collision center in the U.K. Consideration paid, which was accounted for as a business combination, was $34.1 million, net of cash acquired. Goodwill associated with the acquisition totaled $10.2 million.
4. DISCONTINUED OPERATIONS AND OTHER DIVESTITURES
Brazil Discontinued Operations
On November 12, 2021, the Company entered into an agreement to effect the Brazil Disposal. The sale price of approximately Brazilian Real (“BRL”) 510.0 million included a holdback amount as of July 1, 2022 (the “Brazil Disposition Date”), for general representations and warranties, of BRL 115.0 million, to be held in escrow for a period of five years from the close of the transaction (the “Brazil Disposal Escrow”). At the conclusion of the five-year period, the remaining funds held in the Brazil Disposal Escrow will be released to the Company. This amount has been included in the proceeds received.
As of December 31, 2024, the Company had a remaining receivable balance of $16.8 million associated with the Brazil Disposal Escrow recorded in Other long-term assets on the Consolidated Balance Sheets, of which $2.4 million is expected to be paid to settle the Company’s portion of accrued liabilities retained subsequent to the Brazil Disposition Date.
Results of the Brazil Discontinued Operations were immaterial for the years ended December 31, 2024 and 2023. The assets and liabilities of the Brazil Discontinued Operations were immaterial as of December 31, 2024 and 2023 and primarily consist of the Brazil Disposal Escrow described above.
GROUP 1 AUTOMOTIVE, INC.
NOTES TO CONSOLIDATED FINANCIAL STATEMENTS — (Continued)
Results of the Brazil Discontinued Operations for the year ended December 31, 2022 were as follows (in millions):
| | | | | | | | | | | | |
| | | | Year Ended December 31, | | |
| | | | 2022 | | |
| REVENUES: | | | | | | |
| New vehicle retail sales | | | | $ | 109.0 | | | |
| Used vehicle retail sales | | | | 44.0 | | | |
| Used vehicle wholesale sales | | | | 10.1 | | | |
| Parts and service sales | | | | 23.8 | | | |
| Finance, insurance and other, net | | | | 3.3 | | | |
| Total revenues | | | | 190.2 | | | |
| COST OF SALES: | | | | | | |
| New vehicle retail sales | | | | 98.5 | | | |
| Used vehicle retail sales | | | | 41.2 | | | |
| Used vehicle wholesale sales | | | | 10.0 | | | |
| Parts and service sales | | | | 14.5 | | | |
| Total cost of sales | | | | 164.2 | | | |
| GROSS PROFIT | | | | 26.1 | | | |
| Selling, general and administrative expenses | | | | 15.1 | | | |
| Depreciation and amortization expense | | | | 0.9 | | | |
| Asset impairments | | | | 6.3 | | | |
| INCOME FROM DISCONTINUED OPERATIONS | | | | 3.7 | | | |
| | | | | | |
| Floorplan interest expense | | | | 1.4 | | | |
| Other interest income, net | | | | (1.8) | | | |
| | | | | | |
| Other expenses | | | | 1.5 | | | |
| INCOME BEFORE INCOME TAXES — DISCONTINUED OPERATIONS | | | | 2.6 | | | |
| Provision for income taxes | | | | 5.3 | | | |
| NET LOSS — DISCONTINUED OPERATIONS | | | | $ | (2.7) | | | |
Cash flows from operating and investing activities for the Brazil Discontinued Operations were immaterial for the years ended December 31, 2024 and 2023. Cash flows from operating and investing activities for the Brazil Discontinued Operations for the year ended December 31, 2022 were as follows (in millions):
| | | | | | | | | | | | |
| | Year Ended December 31, |
| | 2022 | | | | |
| Net cash provided by operating activities — discontinued operations | | $ | 26.6 | | | | | |
| Net cash provided by investing activities — discontinued operations | | $ | 59.1 | | | | | |
Other Divestitures
The Company’s dispositions generally consist of dealership assets and related real estate. Gains and losses on dispositions are recorded in Selling, general and administrative expenses in the Consolidated Statements of Operations.
During the year ended December 31, 2024, the Company recorded a net pre-tax gain totaling $52.9 million related to the disposition of eight dealerships and one collision center in the U.S. The dispositions reduced goodwill by $66.4 million. The Company also terminated three franchises in the U.S.
During the year ended December 31, 2023, the Company recorded a net pre-tax gain totaling $16.3 million related to the disposition of eleven dealerships in the U.S. The dispositions reduced goodwill by $52.9 million. The Company also terminated two franchises in the U.S.
During the year ended December 31, 2022, the Company recorded a net pre-tax gain totaling $30.8 million related to the disposition of five dealerships and one collision center in the U.S. The dispositions reduced goodwill by $37.3 million. The Company also terminated one franchise in the U.K.
Assets held for sale in the Consolidated Balance Sheets includes $11.5 million and $39.8 million of goodwill that has been reclassified to assets held for sale as of December 31, 2024 and 2023, respectively. During the year ended December 31, 2024, the Company recognized $4.8 million in intangible asset impairment associated with assets held for sale.
GROUP 1 AUTOMOTIVE, INC.
NOTES TO CONSOLIDATED FINANCIAL STATEMENTS — (Continued)
5. RESTRUCTURING
During the three months ended December 31, 2024, the Company initiated a U.K. wide restructuring plan (the “Restructuring Plan”) relating to the integration activities of Inchcape Retail with existing U.K. operations. The Restructuring Plan consisted of workforce realignment, strategic closing of certain facilities and systems integrations. The Restructuring Plan is expected to continue through 2025 and the Company expects to incur $7.7 million in additional restructuring costs. Any changes to the Company’s estimates or timing will be reflected in the Company’s results of operations in future periods.
The following table summarizes restructuring charges (in millions):
| | | | | | | | | | | | |
| | Year Ended December 31, |
| | 2024 | | | | |
| Contract termination costs | | $ | 10.1 | | | | | |
| Employee related costs | | 4.3 | | | | | |
| Asset impairments | | 1.8 | | | | | |
| System integration costs | | 0.4 | | | | | |
| Total restructuring charges | | $ | 16.7 | | | | | |
Charges associated with the Restructuring Plan are included within Restructuring Charges on the Consolidated Statements of Operations. Liabilities associated with restructuring charges are included in Accrued expenses and other current liabilities on the Consolidated Balance Sheets. As of December 31, 2024, the Company had $11.9 million of accrued restructuring charges related to the Restructuring Plan.
6. STOCK-BASED COMPENSATION PLANS
On May 15, 2024, the Company’s shareholders approved the amendment and restatement of the Company’s Long Term Incentive Plan (the “2024 Incentive Plan”). The aggregate maximum number of shares that may be issued or transferred under the 2024 Incentive Plan is 0.7 million. The Company currently grants RSAs, RSUs and PSUs provided to Company employees and non-employee directors pursuant to the 2024 Incentive Plan. The 2024 Incentive Plan expires on March 24, 2034. The terms of the awards (including vesting schedules) are established by the Compensation Committee of the Company’s Board of Directors. As of December 31, 2024, there were 0.7 million shares available for issuance under the 2024 Incentive Plan.
Restricted Stock Awards
The Company grants RSAs to employees and non-employee directors. RSAs qualify as participating securities as each award contains non-forfeitable rights to dividends. As such, the two-class method is required for the computation of EPS. RSAs contain voting rights and are considered outstanding at the date of grant. Refer to Note 7. Earnings Per Share for further details. RSAs are subject to vesting periods of up to five years. Compensation expense for RSAs is calculated based on the average market price of the Company’s common stock at the date of grant and recognized over the requisite vesting period on a straight-line basis. Forfeitures are estimated at the time of valuation and reduce expense ratably over the vesting period. This estimate is adjusted annually based on the extent to which actual or expected forfeitures differ from the previous estimate. The Company issues new shares of common stock or treasury shares, if available, to settle vested RSAs.
The following table summarizes RSA activity and related information for 2024:
| | | | | | | | | | | | | | |
| | Awards | | Weighted Average
Grant Date
Fair Value |
| Nonvested at January 1, 2024 | | 318,955 | | | $ | 145.83 | |
| Granted | | 54,657 | | | $ | 282.02 | |
| Vested | | (103,031) | | | $ | 144.22 | |
| Forfeited | | (9,587) | | | $ | 174.06 | |
| Nonvested at December 31, 2024 | | 260,994 | | | $ | 173.89 | |
The total fair value of RSAs that vested during the years ended December 31, 2024, 2023 and 2022, was $14.9 million, $14.2 million and $14.7 million, respectively.
As of December 31, 2024, there was $18.9 million of total unrecognized compensation cost related to RSAs which is expected to be recognized over a weighted-average period of 1.9 years.
GROUP 1 AUTOMOTIVE, INC.
NOTES TO CONSOLIDATED FINANCIAL STATEMENTS — (Continued)
Restricted Stock Units
The Company grants RSUs to non-employee directors. RSUs are vested 100% at the time of grant and settled on the date of the directors “separation of service,” as such term is defined in internal revenue service code §1.409A-1(h), and generally includes departure due to either death, disability, or retirement. RSUs convey no voting rights, and therefore are not considered outstanding when granted. Granted RSUs participate in dividends, however the dividends are not payable until a director’s separation of service with the Company. In the event a director terminates his or her directorship with the Company for reasons other than defined above, the RSUs granted and any accrued dividends will be forfeited.
RSUs settle in a cash payment equal to the average of the Company’s high and low stock price on the separation of service date and therefore constitute liability instruments, which require remeasurements to fair value each reporting period. The changes in fair value as a result of the changes in the Company’s stock price are recognized in Selling, general and administrative expenses within the Consolidated Statements of Operations. As of December 31, 2024, the total liability for unsettled cash-settled RSUs, recorded at fair value, was $14.4 million.
Performance Share Units
The Company grants PSUs to certain key employees. PSUs are evaluated over a two-year performance period based on actual performance targets achieved, as well as the market-based return of the Company’s common stock relative to that of their peer group. PSU payout percentages can range between 0% and 200% and are subject to vesting over a three-year service period, which at the end of year three, will convert into shares of the Company’s common stock. Compensation cost for PSUs is based on the Company’s closing stock price on the date of grant, forecasted achievement of performance targets and the estimated grant date per share value of market-based performance utilizing a Monte Carlo simulation model.
The following table summarizes PSU activity and related information for 2024:
| | | | | | | | | | | | | | |
| | Awards | | Weighted Average
Grant Date
Fair Value |
| Nonvested at January 1, 2024 | | 55,674 | | | $ | 188.82 | |
| Granted | | 15,146 | | | $ | 261.62 | |
| Vested | | (62,126) | | | $ | 424.14 | |
| Performance adjustment | | 23,352 | | | $ | 424.14 | |
| | | | |
| Nonvested at December 31, 2024 | | 32,046 | | | $ | 246.77 | |
The total fair value of PSUs that vested during the years ended December 31, 2024, 2023 and 2022, was $26.4 million, $3.3 million and $4.7 million, respectively.
The weighted average grant date fair value of PSUs granted during the years ended December 31, 2024, 2023 and 2022, was $4.0 million, $3.1 million and $5.0 million, respectively.
Employee Stock Purchase Plan
On May 15, 2024, the Company’s shareholders approved the amendment and restatement of the Employee Stock Purchase Plan (the “ESPP Plan”). As a result, the ESPP Plan authorizes the issuance of up to 4.75 million shares of common stock and provides that no options to purchase shares may be granted under the Purchase Plan after May 24, 2034. The ESPP Plan is available to all employees of the Company and its participating subsidiaries and is a qualified plan as defined by Section 423 of the Internal Revenue Code. At the end of each fiscal quarter (the “Option Period”) during the term of the ESPP Plan, employees can acquire shares of common stock from the Company at 85% of the fair market value of the common stock on the first or the last day of the Option Period, whichever is lower. As of December 31, 2024, there were 428,047 shares available for issuance under the ESPP Plan. During the years ended December 31, 2024, 2023 and 2022, the Company issued 92,787, 112,189 and 146,416 shares, respectively, of common stock to employees participating in the ESPP Plan. With respect to shares issued under the ESPP Plan, the Company’s Board of Directors has authorized specific share repurchases to fund the shares issuable under the ESPP Plan.
The weighted average per share fair value of employee stock purchase rights issued pursuant to the ESPP Plan was $68.92, $50.04 and $39.45 during the years ended December 31, 2024, 2023 and 2022, respectively. The fair value of employee stock purchase rights is calculated using the grant date stock price, the value of the embedded call option and the value of the embedded put option. Employees can contribute a maximum of 10% of their compensation, up to a maximum of $25,000 annually under the ESPP Plan. Cash received from the ESPP Plan purchases was $24.4 million, $21.3 million and $19.5 million for the years ended December 31, 2024, 2023 and 2022, respectively.
GROUP 1 AUTOMOTIVE, INC.
NOTES TO CONSOLIDATED FINANCIAL STATEMENTS — (Continued)
Stock-Based Compensation
Total stock-based compensation includes expenses for both equity and cash-settled awards and is recognized in Selling, general and administrative expenses within the Consolidated Statements of Operations. Stock-based compensation related to equity-settled awards was $25.2 million, $20.1 million and $27.0 million for the years ended December 31, 2024, 2023 and 2022, respectively. Stock-based compensation related to cash-settled awards was $5.0 million, $4.8 million and $0.5 million for the years ended December 31, 2024, 2023 and 2022, respectively. Tax benefits related to total stock-based compensation were $8.3 million, $8.5 million and $5.2 million for the years ended December 31, 2024, 2023 and 2022, respectively.
7. EARNINGS PER SHARE
The two-class method is utilized for the computation of the Company’s EPS. The two-class method requires a portion of net income to be allocated to participating securities, which are unvested awards of share-based payments with non-forfeitable rights to receive dividends that are paid in cash. The Company’s RSAs are participating securities. Income allocated to these participating securities is excluded from net earnings available to common shares, as shown in the table below. Basic EPS is computed by dividing net income available to basic common shares by the weighted average number of basic common shares outstanding during the period. Diluted EPS is computed by dividing net income available to diluted common shares by the weighted average number of dilutive common shares outstanding during the period.
The following table sets forth the calculation of EPS on total net income for the years ended December 31, 2024, 2023 and 2022 (in millions, except share and per share data): | | | | | | | | | | | | | | | | | | | | |
| | | Years Ended December 31, |
| | | 2024 | | 2023 | | 2022 |
| Weighted average basic common shares outstanding | | 13,192,518 | | | 13,681,660 | | | 15,441,292 | |
| Dilutive effect of stock-based awards and employee stock purchases | | 57,366 | | | 53,139 | | | 52,324 | |
| Weighted average dilutive common shares outstanding | | 13,249,884 | | | 13,734,799 | | | 15,493,616 | |
| Basic: | | | | | | |
| Net income | | $ | 498.1 | | | $ | 601.6 | | | $ | 751.5 | |
| Less: Earnings allocated to participating securities from continuing operations | | 10.5 | | | 14.8 | | | 21.3 | |
| Less: Earnings (loss) allocated to participating securities from discontinued operations | | — | | | — | | | (0.1) | |
| Net income available to basic common shares | | $ | 487.6 | | | $ | 586.8 | | | $ | 730.3 | |
| Basic earnings per common share | | $ | 36.96 | | | $ | 42.89 | | | $ | 47.29 | |
| Diluted: | | | | | | |
| Net income | | $ | 498.1 | | | $ | 601.6 | | | $ | 751.5 | |
| Less: Earnings allocated to participating securities from continuing operations | | 10.4 | | | 14.8 | | | 21.3 | |
| Less: Earnings (loss) allocated to participating securities from discontinued operations | | — | | | — | | | (0.1) | |
| Net income available to diluted common shares | | $ | 487.7 | | | $ | 586.9 | | | $ | 730.3 | |
| Diluted earnings per common share | | $ | 36.81 | | | $ | 42.73 | | | $ | 47.14 | |
GROUP 1 AUTOMOTIVE, INC.
NOTES TO CONSOLIDATED FINANCIAL STATEMENTS — (Continued)
8. FINANCIAL INSTRUMENTS AND FAIR VALUE MEASUREMENTS
Accounting standards define fair value as the price that would be received from selling an asset or paid to transfer a liability in the most advantageous market in an orderly transaction between market participants at the measurement date. Accounting standards establish a fair value hierarchy that requires an entity to maximize the use of observable inputs and minimize the use of unobservable inputs when measuring fair value and establishes the following three levels of inputs that may be used to measure fair value:
•Level 1 — Quoted prices for identical assets or liabilities in active markets.
•Level 2 — Observable inputs other than Level 1 prices such as quoted prices for similar assets and liabilities; quoted prices in markets that are not active; or model-derived valuations or other inputs that are observable or that can be corroborated by observable market data for substantially the full term of the assets or liabilities.
•Level 3 — Unobservable inputs that are supported by little or no market activity and that are significant to the fair value of the assets or liabilities.
Cash and Cash Equivalents, Contracts-In-Transit and Vehicle Receivables, Accounts and Notes Receivable, Accounts Payable, Variable Rate Long-Term Debt and Floorplan Notes Payable
The fair values of these financial instruments approximate their carrying values due to the short-term nature of these instruments and/or the existence of variable interest rates.
Fixed Rate Long-Term Debt
On July 30, 2024, the Company issued $500.0 million in aggregate principal of 6.375% Senior Notes due January 2030 (“6.375% Senior Notes”). The Company estimates the fair value of its $750.0 million 4.00% Senior Notes due August 2028 (“4.00% Senior Notes”) and the 6.375% Senior Notes using quoted prices for the identical liability (Level 1) and estimates the fair value of its fixed-rate mortgage facilities using a present value technique based on current market interest rates for similar types of financial instruments (Level 2). Refer to Note 15. Debt for further discussion of the Company’s long-term debt arrangements and the issuance of the 6.375% Senior Notes.
The carrying value and fair value of the Company’s fixed rate long-term debt were as follows (in millions): | | | | | | | | | | | | | | | | | | | | | | | | | | |
| | December 31, 2024 | | December 31, 2023 |
| | Carrying Value (1) | | Fair Value | | Carrying Value (1) | | Fair Value |
| 4.00% Senior Notes | | $ | 750.0 | | | $ | 701.5 | | | $ | 750.0 | | | $ | 697.5 | |
| 6.375% Senior Notes | | 500.0 | | | 502.4 | | | — | | | — | |
| Real estate related | | 140.6 | | | 136.4 | | | 90.9 | | | 83.1 | |
| Total | | $ | 1,390.6 | | | $ | 1,340.4 | | | $ | 840.9 | | | $ | 780.6 | |
(1) Carrying value excludes unamortized debt issuance costs. Derivative Financial Instruments
The Company holds interest rate swaps to hedge against variability of interest payments indexed to SOFR. The Company’s interest rate swaps are measured at fair value utilizing a SOFR forward yield curve matched to the identical maturity term of the instrument being measured. Observable inputs utilized in the income approach valuation method incorporate identical contractual notional amounts, fixed coupon rates, periodic terms for interest payments and contract maturity. The fair value of the interest rate swaps also considers the credit risk of the Company for instruments in a liability position or the counterparty for instruments in an asset position. The credit risk is calculated using the spread between the SOFR yield curve and the relevant interest rate according to rating agencies. The inputs to the fair value measurements reflect Level 2 of the hierarchy framework.
GROUP 1 AUTOMOTIVE, INC.
NOTES TO CONSOLIDATED FINANCIAL STATEMENTS — (Continued)
Assets associated with the Company’s interest rate swaps, as reflected gross in the Consolidated Balance Sheets, were as follows (in millions): | | | | | | | | | | | | | | |
| | | December 31, |
| | 2024 | | 2023 |
| Assets: | | | | |
Other current assets | | $ | 1.8 | | | $ | 1.2 | |
Other long-term assets (1) | | 77.5 | | | 88.1 | |
| Total assets | | $ | 79.3 | | | $ | 89.3 | |
| | | | |
| | | | |
| | | | |
| | | | |
(1) As of December 31, 2024 and December 31, 2023, the balance included gross fair value of $3.4 million and $3.7 million, respectively, related to the de-designated swaps as described below.
There were no liabilities associated with the Company’s interest rate swaps as of December 31, 2024 and December 31, 2023.
Interest Rate Swaps De-designated as Cash Flow Hedges
The Company de-designated one mortgage interest rate swap during each of the years ended December 31, 2024 and 2023, due to the Company settling the underlying mortgages associated with the swaps. As of December 31, 2024, the de-designated swaps had a total aggregate notional value of $34.0 million and a weighted average interest rate of 0.60%. The de-designated swaps will mature between January 4, 2025 and March 1, 2030.
The Company reclassified the entire previously deferred gains associated with the de-designated interest rate swaps of $0.2 million and $3.1 million, net of tax of $0.1 million and $1.0 million, during the years ended December 31, 2024 and 2023, respectively, from AOCI into income as an adjustment to Other interest expense, net, as the remaining forecasted hedged transactions associated with the interest rate swaps were probable of not occurring due to the settlement of the mortgages described above.
The Company recorded unrealized mark-to-market losses of $0.5 million and $0.3 million and realized gains of $1.6 million and $1.0 million associated with the de-designated interest rate swaps within Other interest expense, net, for the years ended December 31, 2024 and 2023, respectively.
Interest Rate Swaps Designated as Cash Flow Hedges
Interest rate swaps designated as cash flow hedges and the related gains or losses are deferred in stockholders’ equity as a component of AOCI in the Company’s Consolidated Balance Sheets. The deferred gains or losses are recognized in income in the period in which the related items being hedged are recognized in expense. Monthly contractual settlements of the positions are recognized as Floorplan interest expense or Other interest expense, net, in the Company’s Consolidated Statements of Operations. Gains or losses for periods where future forecasted hedged transactions are deemed probable of not occurring are reclassified from AOCI into income as Floorplan interest expense or Other interest expense, net.
As of December 31, 2024, the Company held 28 interest rate swaps designated as cash flow hedges with a total notional value of $889.3 million that fixed its underlying SOFR at a weighted average rate of 1.23%. As of December 31, 2023, the Company held 36 interest rate swaps designated as cash flow hedges with a total notional value of $909.6 million that fixed its underlying SOFR at a weighted average rate of 1.25%. The maturity dates of the Company’s designated interest rate swaps range between February 14, 2025 and December 31, 2031.
GROUP 1 AUTOMOTIVE, INC.
NOTES TO CONSOLIDATED FINANCIAL STATEMENTS — (Continued)
The following tables present the impact of the Company’s interest rate swaps designated as cash flow hedges (in millions): | | | | | | | | | | | | | | | | | | | | |
| | | Amount of Unrealized Income (Loss), Net of Tax, Recognized in Other Comprehensive Income (Loss) |
| | Years Ended December 31, |
| Derivatives in Cash Flow Hedging Relationship | | 2024 | | 2023 | | 2022 |
| Interest rate swaps | | $ | 21.5 | | | $ | 10.4 | | | $ | 84.1 | |
| | | | | | |
| | | | | | |
| | | Amount Reclassified from Other Comprehensive Income (Loss) into Statements of Operations |
| Statements of Operations Classification | | Years Ended December 31, |
| 2024 | | 2023 | | 2022 |
| Floorplan interest expense, net | | $ | 20.6 | | | $ | 15.4 | | | $ | 0.8 | |
| Other interest expense, net | | $ | 17.0 | | | $ | 17.9 | | | $ | 2.4 | |
The amount of gain expected to be reclassified out of AOCI into earnings as an offset to Floorplan interest expense or Other interest expense, net in the next twelve months is $24.6 million.
9. RECEIVABLES, NET AND CONTRACT ASSETS
Contracts-in-Transit and Vehicle Receivables
Contracts-in-transit and vehicle receivables consist primarily of amounts due from financing institutions on retail finance contracts from vehicle sales, and also includes receivables related to vehicle wholesale sales.
Accounts and Notes Receivables
Accounts and notes receivable consist primarily of amounts due from manufacturers related to dealer incentives, and also includes receivables related to parts and service sales.
The Company maintains an allowance for doubtful accounts that is calculated under the current expected credit loss (“CECL”) model. The CECL model applies to financial assets measured at amortized cost, as shown in the following table, and requires the Company to reflect expected credit losses over the remaining contractual term of the asset. As the large majority of the Company’s receivables settle within 30 days, the forecast period under the CECL model is a relatively short horizon. The Company uses an aging method to estimate allowances for doubtful accounts under the CECL model as the Company has determined that the aging method adequately reflects expected credit losses, as corroborated by historical loss rates.
GROUP 1 AUTOMOTIVE, INC.
NOTES TO CONSOLIDATED FINANCIAL STATEMENTS — (Continued)
The Company’s receivables, net and contract assets consisted of the following (in millions): | | | | | | | | | | | | | | |
| | | December 31, |
| | | 2024 | | 2023 |
| Contracts-in-transit and vehicle receivables, net: | | | | |
| Contracts-in-transit | | $ | 250.3 | | | $ | 259.2 | |
| Vehicle receivables | | 110.6 | | | 110.3 | |
| Total contracts-in-transit and vehicle receivables | | 360.9 | | | 369.5 | |
| Less: allowance for doubtful accounts | | 0.8 | | | 0.3 | |
| Total contracts-in-transit and vehicle receivables, net | | $ | 360.1 | | | $ | 369.2 | |
| | | | |
| Accounts and notes receivables, net: | | | | |
| Manufacturer receivables | | $ | 177.4 | | | $ | 128.3 | |
| Parts and service receivables | | 80.6 | | | 64.3 | |
| F&I receivables | | 39.7 | | | 35.6 | |
| Other | | 11.7 | | | 14.4 | |
| Total accounts and notes receivables | | 309.5 | | | 242.5 | |
| Less: allowance for doubtful accounts | | 6.4 | | | 4.2 | |
| Total accounts and notes receivables, net | | $ | 303.0 | | | $ | 238.4 | |
| | | | |
| Within Other current assets and Other long-term assets: | | | | |
Total contract assets (1) | | $ | 59.0 | | | $ | 55.0 | |
(1) See further discussion of the Company’s Contract Assets balance at Note 2. Revenues. No allowance for doubtful accounts was recorded for contract assets as of December 31, 2024, or December 31, 2023.
10. INVENTORIES
The Company’s inventories consisted of the following (in millions): | | | | | | | | | | | | | | |
| | | December 31, |
| | | 2024 | | 2023 |
| New vehicles | | $ | 1,509.0 | | | $ | 1,061.0 | |
| Used vehicles | | 729.4 | | | 549.0 | |
| Rental vehicles | | 246.7 | | | 217.2 | |
| Parts, accessories and other | | 151.8 | | | 136.2 | |
| Total inventories | | $ | 2,636.8 | | | $ | 1,963.4 | |
| | | | |
| | | | |
As described in Note 1. Basis of Presentation, Consolidation and Summary of Accounting Policies, inventories are valued at lower of cost or net realizable value. The lower of specific cost or net realizable value adjustments reduced total inventory cost by $14.1 million and $9.2 million at December 31, 2024 and 2023, respectively.
Interest assistance reduced inventory costs by $8.0 million and $7.0 million at December 31, 2024 and 2023, respectively, and reduced cost of sales by $88.4 million, $71.2 million and $56.0 million for the years ended December 31, 2024, 2023 and 2022, respectively.
Impairments of inventory, net of insurance proceeds, related to catastrophic events are included in Selling, general and administrative expenses in the Consolidated Statements of Operations. During the years ended December 31, 2024, 2023 and 2022, the Company recorded $2.7 million, $3.4 million and $0.3 million of impairment charges, respectively.
Refer to Note 1. Basis of Presentation, Consolidation and Summary of Accounting Policies for further discussion of the Company’s accounting policies for inventories.
GROUP 1 AUTOMOTIVE, INC.
NOTES TO CONSOLIDATED FINANCIAL STATEMENTS — (Continued)
11. PROPERTY AND EQUIPMENT, NET
The Company’s property and equipment consisted of the following (in millions):
| | | | | | | | | | | | | | |
| | | December 31, |
| | 2024 | | 2023 |
| Land | | $ | 1,177.5 | | | $ | 888.8 | |
| Buildings and leasehold improvements | | 1,842.6 | | | 1,516.6 | |
| Machinery and dealership equipment | | 204.4 | | | 181.6 | |
| Office equipment, furniture and fixtures | | 175.3 | | | 149.1 | |
| Company vehicles | | 15.7 | | | 14.6 | |
| Construction in progress | | 98.2 | | | 85.7 | |
| Total | | 3,513.8 | | | 2,836.4 | |
| Less: accumulated depreciation and amortization | | 657.3 | | | 587.7 | |
| Property and equipment, net | | $ | 2,856.5 | | | $ | 2,248.7 | |
No asset impairments were recorded for the year ended December 31, 2024. For the years ended December 31, 2023 and 2022, the Company recognized $6.8 million and $0.8 million, respectively, in asset impairment charges related to property and equipment in the Company’s U.S. segment. Property and equipment impairment charges are reflected in Asset impairments in the Consolidated Statements of Operations.
Depreciation and amortization expense totaled $113.1 million, $92.0 million and $88.4 million for the years ended December 31, 2024, 2023 and 2022, respectively.
The Company capitalized $2.5 million, $2.0 million and $1.1 million of interest on construction projects for the years ended December 31, 2024, 2023 and 2022, respectively.
12. LEASES
The Company leases real estate, office equipment and dealership operating assets under long-term lease agreements and subleases certain real estate to third parties.
The Company recognizes ROU assets and lease liabilities at commencement based on the present value of lease payments over the lease term. For such leases, the aggregate present value of the Company’s lease payments may include options to purchase the leased property or lease terms with options to renew or terminate the lease, when the option is at the Company’s sole discretion, and it is reasonably certain that the Company will exercise such an option. The Company’s leases may also include rental payments adjusted periodically for inflation. Payments based on a change in an index or rates are not considered in the determination of lease payments for purposes of measuring the related lease liability. The Company discounts lease payments using its incremental borrowing rate based on information available as of the measurement date. Subsequent to the recognition of its ROU assets and lease liabilities, the Company recognizes lease expense related to its operating lease payments on a straight-line basis over the lease term. None of the Company’s lease agreements contain material residual value guarantees or material restrictive covenants.
For the Company’s dealership operating leases, the Company has elected to separate lease and non-lease components and has allocated the consideration between the lease and non-lease components based on the estimated fair value of the leased component. For all other asset classes, the Company has elected to combine and account for both lease and non-lease components as a single component.
The Company has elected not to record leases with an initial term of 12 months or less on the balance sheet for all asset classes.
The Company reviews ROU assets for impairment at the lowest level of identifiable cash flows whenever evidence exists that the carrying value of an asset may not be recoverable (i.e., triggering events). This review consists of comparing the carrying amount of the asset group with its expected future undiscounted cash flows. Estimates of expected future cash flows represent management’s best estimate based on currently available information and reasonable and supportable assumptions. If the asset group’s carrying amount exceeds its future undiscounted cash flows, an impairment charge is measured as the amount by which its carrying amount exceeds its fair value. The fair value of the ROU asset is calculated based on the discounted market rent over the remaining lease period. The market rent reflects current lease rates on comparable properties and requires adjustments to reflect the different characteristics between the property being measured and the comparable property, which are considered level 3 inputs within the fair value hierarchy described further in Note 8. Financial Instruments and Fair Value Measurements.
GROUP 1 AUTOMOTIVE, INC.
NOTES TO CONSOLIDATED FINANCIAL STATEMENTS — (Continued)
No impairments of ROU assets were recorded during the year ended December 31, 2024. During the year ended December 31, 2023, the Company recorded $1.8 million of impairments of ROU assets related to the U.S. segment. No impairments of ROU assets were recorded during the year ended December 31, 2022. The impairment charges were recognized within Asset impairments in the Company’s Consolidated Statements of Operations. Additional information regarding the Company’s operating and finance leases is as follows (in millions, except for lease term and discount rate information):
| | | | | | | | | | | | | | | | | | | | |
| | | | December 31, |
| Leases | | Balance Sheet Classification | | 2024 | | 2023 |
| Assets: | | | | | | |
| Operating | | Operating lease assets | | $ | 315.3 | | | $ | 216.5 | |
| Finance | | Property and equipment, net | | 310.7 | | | 271.3 | |
| Total | | | | $ | 626.0 | | | $ | 487.7 | |
| Liabilities: | | | | | | |
| Current: | | | | | | |
| Operating | | Current operating lease liabilities | | $ | 25.8 | | | $ | 20.9 | |
| Finance | | Current maturities of long-term debt | | 41.1 | | | 6.5 | |
| Noncurrent: | | | | | | |
| Operating | | Operating lease liabilities, net of current portion | | 276.2 | | | 209.4 | |
| Finance | | Long-term debt, net of current maturities | | 270.3 | | | 266.1 | |
| Total | | | | $ | 613.4 | | | $ | 503.0 | |
| | | | | | | | | | | | | | | | | | | | | | | | | | |
| | | | Years Ended December 31, |
| Lease Expense | | Income Statement Classification | | 2024 | | 2023 | | 2022 |
| Operating | | Selling, general and administrative expenses | | $ | 42.1 | | | $ | 38.1 | | | $ | 42.4 | |
| Operating | | Asset impairments | | — | | | 1.8 | | | — | |
| Variable | | Selling, general and administrative expenses | | 7.3 | | | 6.6 | | | 4.5 | |
| Sublease income | | Selling, general and administrative expenses | | (2.1) | | | (1.3) | | | (2.3) | |
| Finance: | | | | | | | | |
| Amortization of lease assets | | Depreciation and amortization expense | | 10.1 | | | 9.9 | | | 9.1 | |
| Interest on lease liabilities | | Other interest expense, net | | 17.2 | | | 12.6 | | | 8.2 | |
| Net lease expense | | | | $ | 74.6 | | | $ | 67.6 | | | $ | 61.9 | |
| | | | | | | | | | | | | | |
| | December 31, 2024 |
| Maturities of Lease Liabilities | | Operating Leases | | Finance Leases |
| 2025 | | $ | 39.0 | | | $ | 46.9 | |
| 2026 | | 44.6 | | | 51.2 | |
| 2027 | | 42.7 | | | 55.3 | |
| 2028 | | 39.6 | | | 70.8 | |
| 2029 | | 32.7 | | | 83.8 | |
| Thereafter | | 272.0 | | | 74.4 | |
| Total lease payments | | 470.7 | | | 382.5 | |
| Less: lease payments representing interest | | (168.7) | | | (71.1) | |
| Present value of lease liabilities | | $ | 302.0 | | | $ | 311.4 | |
GROUP 1 AUTOMOTIVE, INC.
NOTES TO CONSOLIDATED FINANCIAL STATEMENTS — (Continued)
| | | | | | | | | | | | | | | | | | | | |
| | Years Ended December 31, |
| Weighted-Average Lease Term and Discount Rate | | 2024 | | 2023 | | 2022 |
| Weighted-average remaining lease terms: | | | | | | |
| Operating | | 13.7 | | 13.5 | | 13.6 |
| Finance | | 6.2 | | 7.2 | | 17.2 |
| Weighted-average discount rates: | | | | | | |
| Operating | | 5.7 | % | | 5.2 | % | | 5.1 | % |
| Finance | | 5.4 | % | | 5.3 | % | | 5.1 | % |
| | | | | | | | | | | | | | | | | | | | |
| | Years Ended December 31, |
| Other Information | | 2024 | | 2023 | | 2022 |
| Cash paid for amounts included in the measurement of lease liabilities: | | | | | | |
| Operating cash flows used in operating leases | | $ | 39.8 | | | $ | 36.6 | | | $ | 42.2 | |
| Operating cash flows used in finance leases | | $ | 7.3 | | | $ | 12.6 | | | $ | 8.2 | |
| Financing cash flows used in finance leases | | $ | 17.5 | | | $ | 26.4 | | | $ | 9.1 | |
| ROU assets obtained in exchange for lease obligations: | | | | | | |
| Operating leases, initial recognition | | $ | 112.9 | | | $ | 1.5 | | | $ | 12.9 | |
| Operating leases, modifications and remeasurements | | $ | 23.3 | | | $ | (0.2) | | | $ | 25.0 | |
| Finance leases, initial recognition | | $ | 77.8 | | | $ | 70.6 | | | $ | 39.3 | |
| Finance leases, modifications and remeasurements | | $ | 7.2 | | | $ | (3.6) | | | $ | 23.1 | |
13. INTANGIBLE FRANCHISE RIGHTS AND GOODWILL
The Company evaluates its intangible assets, including goodwill, for impairment annually, or more frequently if events or circumstances indicate possible impairment. Refer to Note 1. Basis of Presentation, Consolidation and Summary of Accounting Policies for further discussion of the Company’s accounting policies relating to impairment testing.
For the October 31, 2024 annual goodwill impairment testing, the Company elected to perform a quantitative assessment on the U.K. reporting unit and a qualitative assessment on the U.S. reporting unit to determine whether the fair values of the Company’s reporting units were less than their carrying values. Based on the results of the assessments, the Company did not record a goodwill impairment charge.
When a quantitative impairment assessment is performed, the Company estimates the fair value of goodwill using a combination of the market approach, and the discounted cash flow, or income approach. The Company weights the market approach and the income approach 50% and 50%, respectively, in the fair value model. For the market approach, the Company utilizes recent market multiples of guideline companies for both revenue and pre-tax net income weighted as appropriate by reporting unit. For intangible franchise rights, the fair value of the respective franchise right is also estimated using a discounted cash flow, or income approach. The income approach measures fair value by discounting expected future cash flows at a weighted average cost of capital (“WACC”) that proportionately weights the cost of debt and equity. Significant assumptions in the model include revenue growth rates, future EBITDA margins, the WACC and terminal growth rates. The Company applies a five-year projection period which aligns with the Company’s strategic plan. Key considerations in the assumed growth rates include industry seasonally adjusted annual rate of vehicle sales projections, macroeconomic conditions including consumer confidence levels, unemployment rates and gross domestic product growth, and internal measures such as historical financial performance, cost control and planned capital expenditures.
Beyond the five forecasted years, the terminal value is determined using a perpetuity growth rate based on long-term inflation projections for each reporting unit. Significant inputs to the WACC include the risk-free rate, an adjustment for stock market risk, an adjustment for company size risk and country risk adjustments for the U.K.
Each of the significant assumptions to the fair value model are considered level 3 inputs within the fair value hierarchy described further in Note 8. Financial Instruments and Fair Value Measurements. Developing these assumptions requires applying management’s knowledge of the industry, recent transactions and reasonable performance expectations for its operations.
GROUP 1 AUTOMOTIVE, INC.
NOTES TO CONSOLIDATED FINANCIAL STATEMENTS — (Continued)
For the October 31, 2024 annual intangible franchise rights assessment, the Company elected to perform a qualitative assessment. Based on the results of the qualitative assessment, certain dealerships required a quantitative assessment based on their actual results through October 31, 2024 and an update of the annual budget in the fourth quarter of 2024. To perform the intangible franchise rights quantitative assessment, the Company estimated the fair values of the respective franchise rights using a discounted cash flow, or income approach, following the income approach as described for Goodwill. This resulted in franchise rights impairment charges of $28.2 million in the U.S. segment and none in the U.K. segment for the year ended December 31, 2024. The impairment charges were recognized within Asset impairments in the Company’s Consolidated Statements of Operations.
During the year ended December 31, 2023, the Company recorded impairment charges of $25.1 million in the U.S. segment and none in the U.K. segment on intangible franchise rights. During the year ended December 31, 2022, the Company recorded impairment charges of $1.3 million in the U.S. segment and none in the U.K. segment on intangible franchise rights. The impairment charges were recognized within Asset impairments in the Company’s Consolidated Statements of Operations.
During the year ended December 31, 2024, the Company recorded additional indefinite-lived intangible franchise rights acquired through business combinations of $178.1 million in the U.S. segment and $121.8 million in the U.K. segment. During the year ended December 31, 2023, the Company recorded additional intangible franchise rights acquired through business combinations of $215.1 million in the U.S. segment and none in the U.K. segment.
Refer to Note 3. Acquisitions for further discussion of the Company’s acquisitions.
The following table presents the Company’s intangible franchise rights balances by segment as of December 31, 2024 and 2023 (in millions): | | | | | | | | | | | | | | | | | | | | |
| | Intangible Franchise Rights |
| | U.S. | | U.K. | | Total |
| | | | | | |
| | | | | | |
| | | | | | |
| | | | | | |
| | | | | | |
| | | | | | |
| | | | | | |
| Balance, December 31, 2023 | | $ | 682.0 | | | $ | 19.2 | | | $ | 701.2 | |
| | | | | | |
| | | | | | |
| | | | | | |
| | | | | | |
| | | | | | |
| | | | | | |
| Balance, December 31, 2024 | | $ | 809.8 | | | $ | 138.3 | | | $ | 948.1 | |
The following is a roll-forward of the Company’s goodwill accounts by reporting unit (in millions): | | | | | | | | | | | | | | | | | | | | |
| | Goodwill |
| | U.S. | | U.K. | | Total |
Balance, December 31, 2022 (1) | | $ | 1,549.9 | | | $ | 111.9 | | | $ | 1,661.8 | |
| Additions through acquisitions | | 49.7 | | | — | | | 49.7 | |
| Purchase price allocation adjustments | | 9.1 | | | 1.9 | | | 11.0 | |
| Disposals | | (52.9) | | | — | | | (52.9) | |
| Reclassified from (to) assets held for sale, net | | (23.6) | | | — | | | (23.6) | |
| Currency translation | | — | | | 6.0 | | | 6.0 | |
| | | | | | |
Balance, December 31, 2023 (1) | | $ | 1,532.1 | | | $ | 119.8 | | | $ | 1,651.9 | |
| Additions through acquisitions | | 288.3 | | | 161.1 | | | 449.4 | |
| Purchase price allocation adjustments | | — | | | — | | | — | |
| Disposals | | (66.4) | | | (0.1) | | | (66.5) | |
| Reclassified from (to) assets held for sale, net | | 28.3 | | | — | | | 28.3 | |
| | | | | | |
| Currency translation | | — | | | (5.2) | | | (5.2) | |
| | | | | | |
Balance, December 31, 2024(1) | | $ | 1,782.2 | | | $ | 275.7 | | | $ | 2,057.9 | |
(1) Net of accumulated impairments of $40.6 million in the U.S. reporting unit.
GROUP 1 AUTOMOTIVE, INC.
NOTES TO CONSOLIDATED FINANCIAL STATEMENTS — (Continued)
14. FLOORPLAN NOTES PAYABLE
The Company’s Floorplan Notes Payable consisted of the following (in millions): | | | | | | | | | | | | | | |
| | December 31, |
| | 2024 | | 2023 |
| Revolving Credit Facility — Floorplan notes payable | | $ | 1,328.7 | | | $ | 1,358.2 | |
| Revolving Credit Facility — Floorplan notes payable offset account | | (286.3) | | | (236.7) | |
| Revolving Credit Facility — Floorplan notes payable, net | | 1,042.4 | | | 1,121.6 | |
| Other non-manufacturer facilities | | 212.9 | | | 31.4 | |
| Floorplan notes payable — credit facility and other, net | | $ | 1,255.3 | | | $ | 1,153.0 | |
| | | | |
| FMCC facility | | $ | 202.0 | | | $ | 156.6 | |
| FMCC facility offset account | | (2.0) | | | (38.5) | |
| FMCC facility, net | | 200.0 | | | 118.1 | |
| GM Financial Facility | | 189.5 | | | 37.9 | |
| Other manufacturer affiliate facilities | | 377.2 | | | 256.4 | |
| Floorplan notes payable — manufacturer affiliates, net | | $ | 766.7 | | | $ | 412.4 | |
Floorplan Notes Payable — Credit Facility
Revolving Credit Facility
In the U.S., the Company has a revolving syndicated credit arrangement with 20 participating financial institutions that matures on March 9, 2027 (the “Revolving Credit Facility”). On April 30, 2024, the Company entered into an amendment to the Revolving Credit Facility that increased the availability from $2.0 billion to $2.5 billion, with the ability to increase to $3.0 billion, as further described below. The Revolving Credit Facility consists of two tranches: (i) a $1.5 billion maximum capacity tranche for U.S. vehicle inventory floorplan financing (“U.S. Floorplan Line”) which the outstanding balance, net of offset account discussed below, is reported in Floorplan notes payable — credit facility and other, net; and (ii) a $1.0 billion maximum capacity tranche (“Acquisition Line”), which is not due until maturity of the Revolving Credit Facility and is therefore classified in Long-term debt on the Consolidated Balance Sheets — refer to Note 15. Debt for additional discussion. The capacity under these two tranches can be re-designated within the overall $2.5 billion commitment. The Acquisition Line includes a $100 million sub-limit for letters of credit and a $50.0 million minimum capacity tranche. The Company had $11.8 million and $12.2 million in letters of credit outstanding as of December 31, 2024 and 2023, respectively.
The U.S. Floorplan Line bears interest at rates equal to SOFR plus 120 basis points for new vehicle inventory and SOFR plus 150 basis points for used vehicle inventory. The weighted average interest rate on the U.S. Floorplan Line was 5.69% as of December 31, 2024, excluding the impact of the Company’s interest rate swap derivative instruments. The Acquisition Line bears interest at SOFR or a SOFR equivalent plus 110 to 210 basis points, depending on the Company’s total adjusted leverage ratio, on borrowings in USD, Euros or GBP. The U.S. Floorplan Line requires a commitment fee of 0.15% per annum on the unused portion. Amounts borrowed by the Company under the U.S. Floorplan Line for specific vehicle inventory are to be repaid upon the sale of the vehicle financed and in no case is a borrowing for a vehicle to remain outstanding for greater than one year. The Acquisition Line requires a commitment fee ranging from 0.15% to 0.40% per annum, depending on the Company’s total adjusted leverage ratio, based on a minimum commitment of $50.0 million less outstanding borrowings.
In conjunction with the Revolving Credit Facility, the Company had $3.1 million and $3.8 million of unamortized debt issuance costs as of December 31, 2024 and 2023, respectively, which are included in Prepaid expenses and Other long-term assets in the Company’s Consolidated Balance Sheets and amortized over the term of the facility.
Under the Revolving Credit Facility, dividends are permitted to the extent that no event of default exists, and the Company is in compliance with the financial covenants contained therein.
GROUP 1 AUTOMOTIVE, INC.
NOTES TO CONSOLIDATED FINANCIAL STATEMENTS — (Continued)
Floorplan Notes Payable — Manufacturer Affiliates
FMCC Facility
The Company has a $300.0 million floorplan arrangement with FMCC for financing of new Ford vehicles in the U.S. (the “FMCC Facility”). The FMCC Facility bears interest at the U.S. prime rate which was 7.50% as of December 31, 2024.
GM Financial Facility
During 2023, the Company entered into a master loan agreement with General Motors Financial (the “GM Financial Facility”). During the year ended December 31, 2024, additional subsidiaries of the Company entered into the GM Financial Facility as additional borrowers and the borrowing base thereunder was increased. As of December 31, 2024 and December 31, 2023, the GM Financial Facility had a total capacity of $348.1 million and $84.5 million, respectively. The GM Financial Facility bears interest at the U.S. prime rate less 100 basis points.
Other Manufacturer Facilities
The Company has other credit facilities in the U.S. and the U.K., respectively, with financial institutions affiliated with manufacturers for financing of new, used and rental vehicle inventories. As of December 31, 2024, borrowings outstanding under these facilities totaled $377.2 million, comprised of $190.0 million in the U.S. and $187.2 million in the U.K., with annual interest rates ranging from 1% to approximately 8%. Interest rates on the Company’s manufacturer facilities vary across manufacturers.
Offset Accounts
Offset accounts consist of immediately available cash used to pay down the U.S. Floorplan Line and FMCC Facility, and therefore offset the respective outstanding balances in the Company’s Consolidated Balance Sheets. The offset accounts are the Company’s primary options for the short-term investment of excess cash.
GROUP 1 AUTOMOTIVE, INC.
NOTES TO CONSOLIDATED FINANCIAL STATEMENTS — (Continued)
15. DEBT
Long-term debt consisted of the following (in millions): | | | | | | | | | | | | | | |
| | December 31, |
| | 2024 | | 2023 |
| 4.00% Senior Notes due August 15, 2028 | | $ | 750.0 | | | $ | 750.0 | |
| 6.375% Senior Notes due January 15, 2030 | | 500.0 | | | — | |
| | | | |
| Acquisition Line | | 95.0 | | | 325.0 | |
| Other debt: | | | | |
| Real estate related | | 1,253.9 | | | 751.0 | |
| Finance leases | | 311.4 | | | 272.7 | |
| Other | | 19.0 | | | 8.8 | |
| Total other debt | | 1,584.3 | | | 1,032.5 | |
| Total debt | | 2,929.3 | | | 2,107.5 | |
| | | | |
| Less: unamortized debt issuance costs | | 16.1 | | 8.7 |
| Less: current maturities | | 175.3 | | 109.4 |
| Total long-term debt | | $ | 2,737.9 | | | $ | 1,989.4 | |
The aggregate annual maturities of debt for the next five years, excluding debt issuance costs, are as follows (in millions): | | | | | | | | |
| | | Total |
| Years Ended December 31, | | |
| 2025 | | $ | 176.2 | |
| 2026 | | 248.7 | |
| 2027 | | 331.5 | |
| 2028 | | 917.5 | |
| 2029 | | 309.0 | |
| Thereafter | | 946.4 | |
| Total | | $ | 2,929.3 | |
6.375% Senior Notes Issuance
On July 30, 2024, the Company issued the following notes, at par: | | | | | | | | | | | | | | | | | | | | | | | | | | |
| Description | | Principal Amount
(in millions) | | Maturity Date | | Effective Interest Rate (1) | | Interest Payment Dates |
| 6.375% Senior Notes | | $500.0 | | January 15, 2030 | | 6.661% | | January 15th, July 15th |
(1) The effective interest rate is after the impact of associated debt issuance costs.
The Company may redeem up to 40% of the original principal amount of the 6.375% Senior Notes, plus accrued and unpaid interest, at any time prior to July 15, 2026, subject to certain conditions. The Company, at its option, may redeem some or all of the 6.375% Senior Notes at the redemption prices (expressed as percentages of principal amount of the notes) set forth below, plus accrued and unpaid interest. | | | | | | | | |
| Redemption Period | | Redemption Price |
| July 15, 2026 | | 103.188% |
| July 15, 2027 | | 101.594% |
| July 15, 2028 and thereafter | | 100.000% |
The 6.375% Senior Notes are unsecured obligations and rank equal in right of payment to all of the Company’s existing and future senior unsecured debt and senior in right of payment to all of the Company’s future subordinated debt. The 6.375% Senior Notes are subordinated to all existing and future senior secured debt of the Company and subordinated to all existing and future liabilities (including trade payables) of any non-guarantor subsidiaries. The 6.375% Senior Notes are guaranteed by substantially all of the Company’s U.S. subsidiaries. The U.S. subsidiary guarantees rank equally in the right of payment to all of the Company’s guarantor’s existing and future senior debt and rank senior in right of payment to all of the Company’s guarantor’s existing and future subordinated debt.
GROUP 1 AUTOMOTIVE, INC.
NOTES TO CONSOLIDATED FINANCIAL STATEMENTS — (Continued)
The Company may be required to purchase the 6.375% Senior Notes if it sells certain assets or triggers the change in control provisions defined in the indenture governing the 6.375% Senior Notes. The indenture governing the 6.375% Senior Notes contains customary restrictions on the Company, including the ability to pay dividends, incur additional indebtedness, create liens, sell or otherwise dispose of assets and repurchase shares of outstanding common stock, which are consistent with those contained in the indenture governing the Company’s 4.00% Senior Notes.
Acquisition Line
The proceeds of the Acquisition Line (as defined in Note 14. Floorplan Notes Payable) are used for working capital, general corporate and acquisition purposes. As of December 31, 2024, borrowings under the Acquisition Line, a component of the Revolving Credit Facility (as defined in Note 14. Floorplan Notes Payable), totaled $95.0 million. The average interest rate on this facility was 5.92% as of December 31, 2024.
Real Estate Related
The Company has mortgage loans in the U.S. and the U.K. that are paid in installments. As of December 31, 2024, borrowings outstanding under these facilities totaled $1,253.9 million, gross of debt issuance costs, comprised of $843.4 million in the U.S. and $410.5 million in the U.K., respectively.
The Company’s mortgage loans are secured by real property owned by the Company. The carrying values of the related collateralized real estate as of December 31, 2024 and 2023 were $1,612.9 million and $1,153.2 million, respectively.
In February 2024, the Company entered into a master credit agreement with Wells Fargo Bank, National Association (the “Wells Fargo Credit Agreement”), which provides for delayed draw term loans with a maximum borrowing capacity of $258.3 million. The Wells Fargo Credit Agreement accrues interest at SOFR plus 175 basis points and matures on March 1, 2031. As of December 31, 2024, borrowings outstanding under the Wells Fargo Credit Agreement totaled $253.9 million and are included in the total U.S. mortgage loans described above.
Finance Leases
Refer to Note 12. Leases for further information regarding the Company’s finance leases.
16. INCOME TAXES
Income from continuing operations before income taxes by geographic area was as follows (in millions): | | | | | | | | | | | | | | | | | | | | |
| | | Years Ended December 31, |
| | | 2024 | | 2023 | | 2022 |
| Domestic | | $ | 652.2 | | | $ | 732.1 | | | $ | 897.4 | |
| Foreign | | 6.3 | | | 68.1 | | | 87.9 | |
| Total income before income taxes | | $ | 658.5 | | | $ | 800.2 | | | $ | 985.3 | |
Federal, state and foreign income tax provisions from continuing operations were as follows (in millions): | | | | | | | | | | | | | | | | | | | | |
| | | Years Ended December 31, |
| | | 2024 | | 2023 | | 2022 |
| Federal: | | | | | | |
| Current | | $ | 121.4 | | | $ | 142.9 | | | $ | 160.7 | |
| Deferred | | 14.7 | | | 11.8 | | | 24.6 | |
| State: | | | | | | |
| Current | | 19.2 | | | 23.8 | | | 24.5 | |
| Deferred | | 4.6 | | | 4.6 | | | 5.9 | |
| Foreign: | | | | | | |
| Current | | (2.7) | | | 12.8 | | | 18.0 | |
| Deferred | | 4.3 | | | 2.3 | | | (2.6) | |
| Provision for income taxes | | $ | 161.5 | | | $ | 198.2 | | | $ | 231.1 | |
GROUP 1 AUTOMOTIVE, INC.
NOTES TO CONSOLIDATED FINANCIAL STATEMENTS — (Continued)
A reconciliation of the statutory federal rate to the effective tax rate on income before income taxes from continuing operations was as follows (in millions): | | | | | | | | | | | | | | | | | | | | |
| | | Years Ended December 31, |
| | | 2024 | | 2023 | | 2022 |
| Provision at the U.S. federal statutory rate | | $ | 138.3 | | | $ | 168.0 | | | $ | 206.9 | |
| Increase (decrease) resulting from: | | | | | | |
| State income tax, net of benefit for federal deduction | | 21.0 | | | 25.2 | | | 22.3 | |
| Foreign income tax rate differential | | (2.1) | | | 0.6 | | | (2.3) | |
| | | | | | |
| Tax credits | | (3.9) | | | (0.5) | | | (0.4) | |
| Change in valuation allowance | | (1.6) | | | (2.6) | | | (2.1) | |
| | | | | | |
| | | | | | |
| | | | | | |
| | | | | | |
| Stock-based compensation | | (2.9) | | | (3.6) | | | (1.6) | |
| | | | | | |
| Deferred state tax effect | | — | | | (1.1) | | | 4.3 | |
| Gain on dispositions | | 3.2 | | | 5.5 | | | — | |
| Other | | 9.5 | | | 6.7 | | | 4.0 | |
| Provision for income taxes | | $ | 161.5 | | | $ | 198.2 | | | $ | 231.1 | |
The components of deferred tax assets and liabilities were as follows (in millions): | | | | | | | | | | | | | | |
| | | December 31, |
| | | 2024 | | 2023 |
| Deferred tax assets: | | | | |
| Accrued liabilities | | $ | 66.7 | | | $ | 62.6 | |
| Fixed asset basis differences | | 1.9 | | | — | |
| | | | |
| | | | |
| Net operating losses | | 9.0 | | | 13.0 | |
| | | | |
| | | | |
| Operating lease liabilities | | 89.6 | | | 65.5 | |
| | | | |
| | | | |
| Deferred tax assets | | 167.1 | | | 141.1 | |
| Less: valuation allowance on deferred tax assets | | 6.0 | | | 7.6 | |
| Net deferred tax assets | | $ | 161.1 | | | $ | 133.5 | |
| Deferred tax liabilities: | | | | |
| Goodwill and other intangibles | | $ | 239.9 | | | $ | 195.9 | |
| Fixed asset basis differences | | 119.5 | | | 114.7 | |
| | | | |
| Interest rate swaps | | 18.9 | | | 21.3 | |
| Operating lease ROU assets | | 77.6 | | | 53.8 | |
| Other | | 1.0 | | | 0.3 | |
| Deferred tax liabilities | | 456.9 | | | 386.0 | |
| Net deferred tax liability | | $ | 295.8 | | | $ | 252.5 | |
The classification of the continued operations of the Company’s net deferred tax liability within the Consolidated Balance Sheets is as follows (in millions): | | | | | | | | | | | | | | |
| | December 31, |
| | 2024 | | 2023 |
Deferred tax assets, included in Other long-term assets | | $ | — | | | $ | 4.1 | |
Deferred tax liability, included in Deferred income taxes | | 295.8 | | | 256.6 | |
| Net deferred tax liability | | $ | 295.8 | | | $ | 252.5 | |
GROUP 1 AUTOMOTIVE, INC.
NOTES TO CONSOLIDATED FINANCIAL STATEMENTS — (Continued)
As of December 31, 2024, the Company had state pre-tax net operating loss carryforwards in the U.S. of $182.8 million that will expire between 2025 and 2044 in certain states while some may be carried forward indefinitely. To the extent that the Company expects that net income will not be sufficient to realize these net operating losses in certain jurisdictions, a valuation allowance has been established.
The Company believes it is more-likely-than-not that its deferred tax assets, net of valuation allowances provided, will be realized, based primarily on its expectation of future taxable income and considering future reversals of existing taxable temporary differences.
As of December 31, 2024, the Company maintains a permanent reinvestment assertion on the Company’s foreign subsidiaries. An immaterial amount of tax would be payable upon any distribution of unremitted earnings or a recognition of any outside basis difference.
Based on the statutes of limitations in the applicable jurisdictions in which the Company operates, the Company is generally no longer subject to examinations by tax authorities in years prior to 2019.
A reconciliation of the Company’s unrecognized tax benefits is as follows (in millions): | | | | | | | | | | | | | | | | | |
| 2024 | | 2023 | | 2022 |
| Balance at January 1 | $ | 2.2 | | | $ | 2.0 | | | $ | 2.0 | |
| Additions for current tax | 0.4 | | | 0.6 | | | 0.5 | |
| Additions based on tax positions in prior years | — | | | — | | | — | |
| Reductions for tax positions | — | | | — | | | — | |
| Settlements with tax authorities | — | | | — | | | — | |
| Reductions due to lapse of statutes of limitations | (0.5) | | | (0.4) | | | (0.5) | |
| Balance at December 31 | $ | 2.1 | | | $ | 2.2 | | | $ | 2.0 | |
Included in the balance of unrecognized tax benefits as of December 31, 2024, 2023 and 2022, are $1.7 million, $1.9 million and $1.7 million, respectively, of tax benefits that would affect the effective tax rate if recognized.
For the years ended December 31, 2024, 2023 and 2022 the Company recorded approximately $0.4 million, $0.3 million and $0.3 million, respectively, of interest and penalty related to its uncertain tax positions. Consistent with prior practice, the Company recognizes interest and penalties related to uncertain tax positions within Provision for income taxes in the Consolidated Statements of Operations.
17. EMPLOYEE SAVINGS PLANS
The Company has a deferred compensation plan to provide select employees with the opportunity to accumulate additional savings for retirement on a tax-deferred basis (the “Deferred Compensation Plan”). Participants in the Deferred Compensation Plan are allowed to defer receipt of a portion of their salary, compensation or bonus. Participants receive a rate of return as determined by management and approved by the Board of Directors. The balances due to participants of the Deferred Compensation Plan as of December 31, 2024 and 2023, were $111.8 million and $108.4 million, respectively, with $7.9 million and $8.1 million classified as current for each respective period.
In the U.S., the Company offers a 401(k) plan to eligible employees and provides matching contribution to employees that participate in the plan. For the years ended December 31, 2024, 2023 and 2022, the matching contributions paid by the Company totaled $17.3 million, $11.7 million and $10.9 million, respectively.
In the U.K., the Company offers private personal pension plans and provides matching contributions to eligible employees that participate in the plan. For the years ended December 31, 2024, 2023 and 2022, the matching contributions paid by the Company totaled $8.5 million, $5.2 million and $4.5 million, respectively.
GROUP 1 AUTOMOTIVE, INC.
NOTES TO CONSOLIDATED FINANCIAL STATEMENTS — (Continued)
18. COMMITMENTS AND CONTINGENCIES
From time to time, the Company or its dealerships are named in various types of litigation involving customer claims, employment matters, class action claims, purported class action claims, claims involving the manufacturers of automobiles, contractual disputes, vehicle related incidents and other matters arising in the ordinary course of business. The Company may be involved in legal proceedings or suffer losses that could have a material adverse effect on the Company’s results of operations, financial condition or cash flows. In the normal course of business, the Company is required to respond to customer, employee and other third-party complaints. In addition, the manufacturers of the vehicles that the Company sells and services have audit rights allowing them to review the validity of amounts claimed for incentive, rebate or warranty-related items and charge the Company back for amounts determined to be invalid payments under the manufacturers’ programs, subject to the Company’s right to appeal any such decision.
Legal Proceedings
As of December 31, 2024, the Company was not party to any legal proceedings that, individually or in the aggregate, are reasonably expected to have a material adverse effect on the Company’s results of operations, financial condition or cash flows. However, the results of current or future matters cannot be predicted with certainty; an unfavorable resolution of one or more of such matters could have a material adverse effect on the Company’s results of operations, financial condition or cash flows.
Other Matters
In connection with dealership dispositions where the Company did not own the real estate and was a tenant, it assigned the lease to the purchaser but remained liable as a guarantor for the remaining lease payments in the event of non-payment by the purchaser. Although the Company has no reason to believe that it will be called upon to perform under any such assigned leases, the Company estimates that lessee remaining rental obligations were $40.9 million as of December 31, 2024.
19. ACCUMULATED OTHER COMPREHENSIVE INCOME (LOSS)
Changes in the balances of each component of AOCI for the years ended December 31, 2024, 2023 and 2022 were as follows (in millions):
| | | | | | | | | | | | | | | | | | | | | | |
| | Year Ended December 31, 2024 |
| | Accumulated Income (Loss) on Foreign Currency Translation | | | | Accumulated Income (Loss) on Interest Rate Swaps | | Total |
| Balance, December 31, 2023 | | $ | (37.4) | | | | | $ | 65.6 | | | $ | 28.1 | |
| Other comprehensive income (loss) before reclassifications: | | | | | | | | |
| Pre-tax | | (19.1) | | | | | 28.2 | | | 9.1 | |
| Tax effect | | — | | | | | (6.7) | | | (6.7) | |
| Amounts reclassified from accumulated other comprehensive income (loss): | | | | | | | | |
| Floorplan interest expense (pre-tax) | | — | | | | | (20.6) | | | (20.6) | |
| Other interest expense, net (pre-tax) | | — | | | | | (17.0) | | | (17.0) | |
| Reclassification related to de-designated interest rate swaps (pre-tax) | | — | | | | | (0.2) | | | (0.2) | |
| | | | | | | | |
| Provision for income taxes | | — | | | | | 9.0 | | | 9.0 | |
| Net current period other comprehensive loss | | (19.1) | | | | | (7.4) | | | (26.5) | |
| | | | | | | | |
| Balance, December 31, 2024 | | $ | (56.5) | | | | | $ | 58.2 | | | $ | 1.6 | |
GROUP 1 AUTOMOTIVE, INC.
NOTES TO CONSOLIDATED FINANCIAL STATEMENTS — (Continued)
| | | | | | | | | | | | | | | | | | | | | | |
| | Year Ended December 31, 2023 |
| | Accumulated Income (Loss) on Foreign Currency Translation | | | | Accumulated Income (Loss) on Interest Rate Swaps | | Total |
| Balance, December 31, 2022 | | $ | (61.1) | | | | | $ | 83.6 | | | $ | 22.5 | |
| Other comprehensive income (loss) before reclassifications: | | | | | | | | |
| Pre-tax | | 23.7 | | | | | 13.7 | | | 37.3 | |
| Tax effect | | — | | | | | (3.3) | | | (3.3) | |
| Amounts reclassified from accumulated other comprehensive income (loss): | | | | | | | | |
| Floorplan interest expense (pre-tax) | | — | | | | | (15.4) | | | (15.4) | |
| Other interest expense, net (pre-tax) | | — | | | | | (17.9) | | | (17.9) | |
| Reclassification related to de-designated interest rate swaps (pre-tax) | | — | | | | | (4.0) | | | (4.0) | |
| | | | | | | | |
| Provision for income taxes | | — | | | | | 8.9 | | | 8.9 | |
| Net current period other comprehensive income (loss) | | 23.7 | | | | | (18.0) | | | 5.7 | |
| | | | | | | | |
| Balance, December 31, 2023 | | $ | (37.4) | | | | | $ | 65.6 | | | $ | 28.1 | |
| | | | | | | | | | | | | | | | | | | | | | |
| | Year Ended December 31, 2022 |
| | Accumulated Income (Loss) on Foreign Currency Translation | | | | Accumulated Income (Loss) on Interest Rate Swaps | | Total |
| Balance, December 31, 2021 | | $ | (158.2) | | | | | $ | 2.0 | | | $ | (156.2) | |
| Other comprehensive income (loss) before reclassifications: | | | | | | | | |
| Pre-tax | | (27.2) | | | | | 110.0 | | | 82.7 | |
| Tax effect | | — | | | | | (25.8) | | | (25.8) | |
| Amounts reclassified from accumulated other comprehensive income (loss): | | | | | | | | |
| Floorplan interest expense (pre-tax) | | — | | | | | (0.8) | | | (0.8) | |
| Other interest expense, net (pre-tax) | | — | | | | | (2.4) | | | (2.4) | |
| Cumulative foreign currency translation adjustments associated with the Brazil Disposal | | 122.8 | | | | | — | | | 122.8 | |
| Other cumulative foreign currency translation adjustments | | 1.5 | | | | | — | | | 1.5 | |
| Provision for income taxes | | — | | | | | 0.8 | | | 0.8 | |
| Net current period other comprehensive income | | 97.1 | | | | | 81.6 | | | 178.7 | |
| | | | | | | | |
| Balance, December 31, 2022 | | $ | (61.1) | | | | | $ | 83.6 | | | $ | 22.5 | |
20. CASH FLOW INFORMATION
Non-cash Activities
The accrual for capital expenditures, was $9.0 million, $6.7 million and $4.7 million for the years ended December 31, 2024, 2023 and 2022, respectively.
Interest and Income Taxes Paid
Cash paid for interest, including the monthly settlement of the Company’s interest rate swaps, was $223.6 million, $154.3 million and $92.9 million for the years ended December 31, 2024, 2023 and 2022, respectively. Refer to Note 8. Financial Instruments and Fair Value Measurements for further discussion of the Company’s interest rate swaps.
Cash paid for income taxes, net of refunds, was $146.0 million, $183.8 million and $202.2 million for the years ended December 31, 2024, 2023 and 2022, respectively.
GROUP 1 AUTOMOTIVE, INC.
NOTES TO CONSOLIDATED FINANCIAL STATEMENTS — (Continued)
21. SEGMENT INFORMATION
The Company has adopted ASU 2023-07, Segment Reporting (Topic 820): Improvements to Reportable Segment Disclosures, effective retrospectively for the year ended December 31, 2024. As a result of this adoption, the Company’s segment disclosure below now includes significant expense categories. The Company’s segment performance measure remains unchanged.
As of December 31, 2024, the Company had two operating and reportable segments: the U.S. and the U.K. The Company defines its segments as those operations whose results the Company’s Chief Executive Officer, who is the Chief Operating Decision Maker (“CODM”), regularly reviews to analyze performance and allocate resources at the U.S. and U.K. geographic areas. Each segment is comprised of retail automotive franchises that sell new and used cars and light trucks; arrange related vehicle financing; sell service and insurance contracts; provide automotive maintenance and repair services; and sell vehicle parts. The CODM uses income before income taxes predominantly in making decisions about the allocation of operating and capital resources to each segment, evaluating annual budget and forecast, as well as determining compensation for certain employees.
The accounting policies of the segments are the same as those described in the Company’s summary of accounting policies. All intercompany balances and transactions have been eliminated in consolidation. Refer to Note 1. Basis of Presentation, Consolidation and Summary of Accounting Policies for further discussion of the Company’s accounting policies.
Selected reportable segment data for continuing operations as follows (in millions):
| | | | | | | | | | | | | | | | | |
| Year Ended December 31, 2024 |
| U.S. | | U.K. | | Total |
| Total revenues | $ | 15,772.9 | |
| $ | 4,161.5 | | | $ | 19,934.3 | |
| Cost of sales | $ | 13,092.0 | | | $ | 3,601.3 | | | $ | 16,693.3 | |
| | | | | |
| SG&A expenses | $ | 1,704.0 | |
| $ | 475.2 | | | $ | 2,179.2 | |
| Depreciation and amortization expense | $ | 88.2 | | | $ | 24.9 | | | $ | 113.1 | |
| Asset impairments | $ | 33.0 | | | $ | — | | | $ | 33.0 | |
| Restructuring charges | $ | — | | | $ | 16.7 | | | $ | 16.7 | |
| Other operating (income) expense | $ | (10.0) | | | $ | — | | | $ | (10.0) | |
| Floorplan interest expense | $ | 88.8 | | | $ | 19.8 | | | $ | 108.5 | |
| Other interest expense, net | $ | 124.8 | | | $ | 16.6 | | | $ | 141.3 | |
Other segment items (1) | $ | — | | | $ | 0.7 | | | $ | 0.7 | |
| Income before income taxes | $ | 652.2 | | | $ | 6.3 | | | $ | 658.5 | |
| Capital expenditures: | | | | | |
| Real estate related capital expenditures | $ | 42.8 | | | $ | 23.1 | | | $ | 65.9 | |
| Non-real estate related capital expenditures | 148.5 | | | 30.7 | | | 179.2 | |
| Total capital expenditures | $ | 191.3 | | | $ | 53.7 | | | $ | 245.1 | |
GROUP 1 AUTOMOTIVE, INC.
NOTES TO CONSOLIDATED FINANCIAL STATEMENTS — (Continued)
| | | | | | | | | | | | | | | | | |
| Year Ended December 31, 2023 |
| U.S. | | U.K. | | Total |
| Total revenues | $ | 14,814.2 | | | $ | 3,059.5 | | | $ | 17,873.7 | |
| Cost of sales | $ | 12,204.1 | | | $ | 2,649.4 | | | $ | 14,853.4 | |
| | | | | |
| SG&A expenses | $ | 1,622.9 | |
| $ | 303.9 | | | $ | 1,926.8 | |
| Depreciation and amortization expense | $ | 76.9 | | | $ | 15.1 | | | $ | 92.0 | |
| Asset impairments | $ | 32.9 | | | $ | — | | | $ | 32.9 | |
| Floorplan interest expense | $ | 53.5 | | | $ | 10.6 | | | $ | 64.1 | |
| Other interest expense, net | $ | 91.4 | | | $ | 8.4 | | | $ | 99.8 | |
Other segment items (1) | $ | 0.4 | | | $ | 4.1 | | | $ | 4.5 | |
| Income before income taxes | $ | 732.1 | | | $ | 68.1 | | | $ | 800.2 | |
| Capital expenditures: | | | | | |
| Real estate related capital expenditures | $ | 41.5 | | | $ | 4.7 | | | $ | 46.3 | |
| Non-real estate related capital expenditures | 114.6 | | | 24.5 | | | 139.2 | |
| Total capital expenditures | $ | 156.2 | | | $ | 29.3 | | | $ | 185.4 | |
| | | | | | | | | | | | | | | | | |
| Year Ended December 31, 2022 |
| U.S. | | U.K. | | Total |
| Total revenues | $ | 13,427.1 | | | $ | 2,795.1 | | | $ | 16,222.1 | |
| Cost of sales | $ | 10,844.7 | | | $ | 2,412.2 | | | $ | 13,256.9 | |
| | | | | |
| SG&A expenses | $ | 1,516.9 | |
| $ | 266.5 | | | $ | 1,783.3 | |
| Depreciation and amortization expense | $ | 73.1 | | | $ | 15.2 | | | $ | 88.4 | |
| Asset impairments | $ | 2.1 | | | $ | — | | | $ | 2.1 | |
| Floorplan interest expense | $ | 21.4 | | | $ | 5.9 | | | $ | 27.3 | |
| Other interest expense, net | $ | 71.0 | | | $ | 6.6 | | | $ | 77.5 | |
Other segment items (1) | $ | 0.4 | | | $ | 0.8 | | | $ | 1.2 | |
| Income before income taxes | $ | 897.4 | | | $ | 87.9 | | | $ | 985.3 | |
| Capital expenditures: | | | | | |
| Real estate related capital expenditures | $ | 17.7 | | | $ | 22.0 | | | $ | 39.6 | |
| Non-real estate related capital expenditures | 100.2 | | | 15.3 | | | 115.5 | |
| Total capital expenditures | $ | 117.8 | | | $ | 37.3 | | | $ | 155.1 | |
(1) Other segment items include other expenses, which primarily relate to currency translation losses.
| | | | | | | | | | | | | | | | | | | | |
| | December 31, 2024 |
| | U.S. | | U.K. | | Total |
| Property and equipment, net | | $ | 2,181.9 | | | $ | 674.6 | | | $ | 2,856.5 | |
| Total assets | | $ | 7,630.1 | | | $ | 2,176.6 | | | $ | 9,806.6 | |
| | | | | | | | | | | | | | | | | | | | |
| | December 31, 2023 |
| | U.S. | | U.K. | | Total |
| Property and equipment, net | | $ | 1,915.2 | | | $ | 333.5 | | | $ | 2,248.7 | |
| Total assets | | $ | 6,665.7 | | | $ | 1,086.6 | | | $ | 7,752.3 | |
Refer to Note 13. Intangible Franchise Rights and Goodwill for further discussion of the Company’s intangible franchise rights and goodwill by segment.