

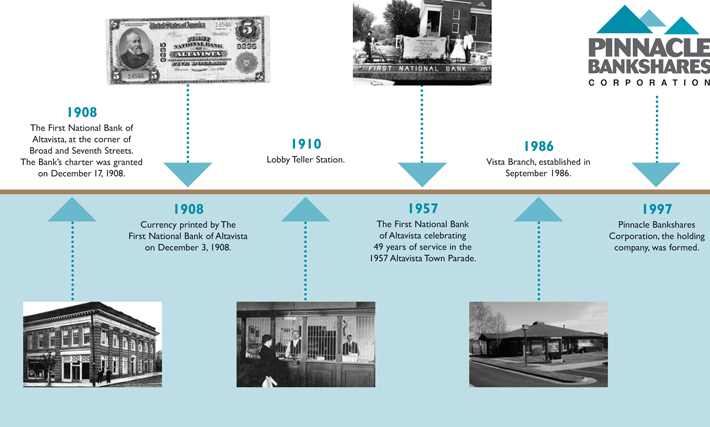
In the year 1908 when the Town of Altavista, Virginia was in its infancy, a group of local businessmen realized that the town, being located at the junction of two railroads, The Southern and the Virginian (soon to be completed) and the Staunton River, had prospects of great potential, but in order to grow and attract business, a bank was a necessity.
Mr. Henry L. Lane of the Lane Brothers Company, founders of the town, a local physician, Dr. W.O. Smith, and Mr. W. S. Frazier, a lumber mill owner and operator, proceeded with the organization of a bank and made application to the Treasury Department in Washington, D.C. for a charter which was granted on December 17, 1908 to “The First National Bank of Altavista,” Altavista, Virginia with a capitalization of $25,000. Mr. Lane was elected President, Dr. Smith, Vice President and Mr. E.T. Yeaman, Cashier, and banking was begun in a portion of a newly erected building of the Lane Brothers Company at the corner of Broad and Seventh Streets. Mr. Yeaman, the Cashier, operated the bank alone for some time and as business increased, the Board of Directors employed a bookkeeper, Miss Douglas Snow, in August, 1909.
In 1917, First National Bank purchased the building from Lane Brothers utilizing the same space in which it began and rented the space it did not use to several local businesses.
With the confidence and cooperation of its depositors, the bank continued to grow through the challenging years of the depression.
Through its one hundred years of business, The First National Bank of Altavista has operated under six presidents, Henry L. Lane, Dr. W.O. Smith, W.S. Frazier, Paul W. Tyree, S. Thomas Cox and Robert H. Gilliam, Jr. The bank is unique in that it has maintained the same name and has been headquartered on the same corner at Broad and Seventh in Altavista as when the bank opened in 1908.
From humble beginnings in 1908, the bank has grown in assets to $279,913,000 as of December 31, 2007 with capital of $26,816,000. The First National Bank of Altavista currently maintains a total of eight offices. The Main Office and Vista Branch are located in the Town of Altavista, the Airport Branch and Timberlake Branch in Campbell County, the Old Forest Road Branch in the City of Lynchburg, the Forest Branch in Bedford County, the Amherst Branch in the Town of Amherst and a Loan Production Office in Franklin County at Smith Mountain Lake.
A total of one-hundred full and part-time staff members serve the bank’s customers.

PINNACLE BANKSHARES CORPORATION
AND SUBSIDIARY
Table of Contents
| | |
| | | Page |
Board of Directors | | 2 |
| |
Office Locations | | 3 |
| |
President’s Letter | | 4 |
| |
Selected Consolidated Financial Information | | 6 |
| |
Management’s Discussion and Analysis of Financial Condition and Results of Operation | | 7 |
| |
Consolidated Balance Sheets | | 26 |
| |
Consolidated Statements of Income | | 27 |
| |
Consolidated Statements of Changes in Stockholders’ Equity and Comprehensive Income | | 28 |
| |
Consolidated Statements of Cash Flows | | 29 |
| |
Notes to Consolidated Financial Statements | | 31 |
| |
Management’s Report on Internal Control Over Financial Reporting | | 56 |
| |
Report of Independent Registered Public Accounting Firm | | 57 |
| |
Officers and Managers | | 58 |
| |
Robert H. Gilliam Jr.’s Election to the Federal Reserve Board of Directors | | 59 |
| |
Shareholder Information | | 60 and IBC |

| | |
| B O A R D O F D I R E C T O R S |
| A. Willard Arthur | | James P. Kent, Jr. |
| Chairman and Secretary | | Partner |
| Marvin V. Templeton & Sons, Inc. | | Kent & Kent, P.C. |
| |
| James E. Burton, IV | | William F. Overacre |
| Vice President, Operations | | Broker/Owner |
| Marvin V. Templeton & Sons, Inc. | | RE/MAX 1st Olympic, REALTORS |
| |
| John P. Erb | | Carroll E. Shelton |
| Assistant Superintendent | | Senior Vice President |
| Campbell County Schools | | The First National Bank of Altavista |
| | Pinnacle Bankshares Corporation |
| |
| Robert H. Gilliam, Jr. | | |
| President & CEO | | John L. Waller |
| The First National Bank of Altavista | | Owner & Operator |
| Pinnacle Bankshares Corporation | | Waller Farms, Inc. |
| |
| R. B. Hancock, Jr. | | Michael E. Watson |
| President & Owner | | Controller |
| R.B.H., Inc. | | Flippin, Bruce & Porter, Inc. |
2
PINNACLE BANKSHARES CORPORATION
AND SUBSIDIARY
The First National Bank of Altavista Office Locations
ALTAVISTA
MAIN OFFICE
622 Broad Street
Altavista, Virginia 24517
Telephone: (434) 369-3000
VISTA OFFICE
1301 N. Main Street
Altavista, Virginia 24517
Telephone: (434) 369-3001
LYNCHBURG
AIRPORT OFFICE
14580 Wards Road
Lynchburg, Virginia 24502
Telephone: (434) 237-3788
TIMBERLAKE OFFICE
20865 Timberlake Road
Lynchburg, Virginia 24502
Telephone: (434) 237-7936
OLD FOREST ROAD OFFICE
3309 Old Forest Road
Lynchburg, Virginia 24501
Telephone: (434) 385-4432
FOREST
FOREST OFFICE
14417 Forest Road
Forest, Virginia 24551
Telephone: (434) 534-0451
AMHERST
AMHERST OFFICE
130 South Main Street
Amherst, Virginia 24521
Telephone: (434) 946-7814
SMITH MOUNTAIN LAKE
LOAN PRODUCTION OFFICE
74 Scruggs Road, Suite 102
Moneta, Virginia 24121
Telephone: (540) 719-0193
3

TO OUR SHAREHOLDERS, CUSTOMERS AND FRIENDS:
This is a special time for all of us as The First National Bank of Altavista, the banking subsidiary of Pinnacle Bankshares Corporation, celebrates its 100th Anniversary in 2008. Achievement of this milestone has resulted from a combination of strong and conservative leadership, a committed staff, loyal customers and supportive ownership that has exhibited pride in being part of a successful community banking organization.
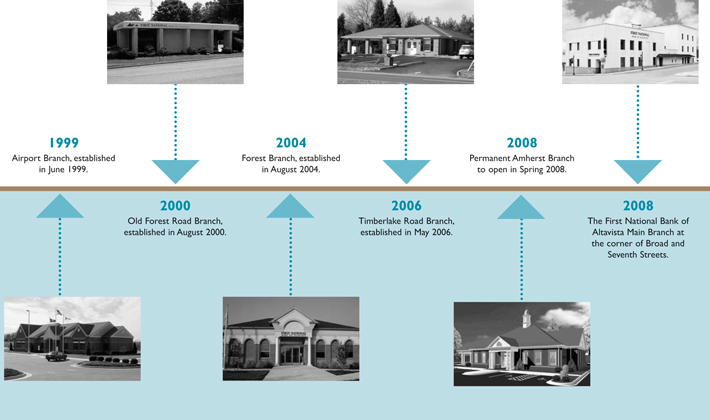
The First National Bank of Altavista is truly a unique company in that relatively few businesses of any sort can claim to have operated on the same corner and under the same name for one hundred years. From humble beginnings in 1908 in a town chartered only one year earlier, the Bank prospered for over ninety years within the town limits. It was not until 1999 that the Bank expanded outside the Town of Altavista to embark on what has become an objective of being the premier community financial institution in Region 2000. Today First National Bank has a total of eight office locations with only two of these being in Altavista.
We are fortunate that our growth in recent years has resulted in enhanced financial performance. 2007 saw a continuation of this trend. Income and assets once again reached new highs.
Net income for 2007 was $2,600,000, a 7.79% increase over net income of $2,412,000 for 2006. Return on average assets for 2007 was 0.97%, down slightly from the 1.00% threshold for 2006. Return on average equity grew from 10.10% in 2006 to 10.17% for 2007. Higher loan volume in 2007 was the primary reason for growth in net income, as interest margins decreased slightly for the year.
Total assets rose by 9.16% in 2007, ending the year at $279,913,000 compared with $256,421,000 at year-end 2006. Deposits grew 9.12% to $251,866,000 in 2007 and net loans increased 11.97% to $232,752,000 in 2007. Growth in deposits of $21,049,000 in 2007 funded all but $3,842,000 of the growth in net loans of $24,891,000. The difference was funded by maturing securities.
Stockholders’ equity at year-end 2007 was $26,816,000, an increase of $2,324,000 over the previous year. Book value per share was $17.95 as of the end of 2007. Average equity to average assets for the year was 9.51% and the Company continues to be “well capitalized” by all regulatory standards. The cash dividend rate for 2007 increased 9.09% to $0.60 per share and the dividend payout ratio for the year was 34.12%. 2007 marked the 31st consecutive year of an increase in the cash dividend rate.
With the strong growth we have realized in our loan portfolio over recent years, we have recognized the need for enhancement in our loan administration and loan operations functions. Restructuring our loan administration area became one of our top priorities and we accomplished a great deal toward this goal in 2007. Senior Vice President Carroll Shelton has filled the role of Chief Credit Officer,
4
Vice President Todd Hall has become Chief Lending Officer and Vice President Pam Adams has become Loan Operations Manager. Tracie Robinson is now Vice President and Mortgage Production Manager and Edgar Tuck has recently joined the bank as Vice President and Smith Mountain Lake Market Manager. We expect these changes to result in continued strong loan production, enhanced credit risk management practices and improved efficiency in loan administration and operations. Congratulations to each of these key officers in their new responsibilities.
Progress was made in 2007 toward our goal of continued orderly expansion. Construction of a permanent facility is nearing completion in the Town of Amherst to replace the temporary branch we opened there in November 2006. We expect to be in business in this attractive location prior to the end of March. We contracted to acquire a branch site in Rustburg in 2007 which we feel will help solidify our presence in Campbell County. We have now closed on this property, located on Village Highway in the Rustburg Marketplace Shopping Center, and are currently developing site and building plans so that we might begin construction of a branch office there by mid-year 2008.
Based upon weakness in the economy and the Federal Reserve’s lowering of interest rates in an attempt to stimulate the economy, we anticipate that 2008 will be a challenging year for us from the standpoint of both asset quality and earnings. In the fourth quarter of 2007, we experienced a loss on a commercial real estate loan in Lynchburg that required a special loan loss provision to replenish our reserves. We are now seeing evidence of borrowers becoming strained in their ability to service loans which may result in impairment of other credits. Although our balance sheet today is less sensitive to fluctuations in interest rates than in previous years, our interest margins will decline in 2008 from the precipitous cuts in interest rates that have already occurred plus the expectation that rates will decline further. We will manage through this environment but may incur some set-backs along the way.
As for now, we are focused on celebrating successes of the past and our rich one hundred year heritage. We invite you to join us for our Annual Meeting of Shareholders to be held at 11:30 a.m., Tuesday, April 8, 2008 in the Fellowship Hall of Altavista Presbyterian Church, 707 Broad Street, Altavista, Virginia, and for Customer Appreciation Days on May 2, August 1 and December 3 during 2008 at all of our office locations.
Thank you for the unique role you play in this special Company and for your continued support.
| | |
| | 
|
| | Robert H. Gilliam, Jr. |
| | President and Chief Executive Officer |
| |
| February 21, 2008 | | |
5
PINNACLE BANKSHARES CORPORATION
AND SUBSIDIARY
Selected Consolidated Financial Information
(In thousands, except ratios, share and per share data)
| | | | | | | | | | | | | | | | |
| | | Years ended December 31, | |
| | | 2007 | | | 2006 | | | 2005 | | | 2004 | | | 2003 | |
Income Statement Data: | | | | | | | | | | | | | | | | |
Net interest income | | $ | 10,181 | | | 9,192 | | | 7,983 | | | 7,400 | | | 7,083 | |
Provision for loan losses | | | 462 | | | 339 | | | 230 | | | 223 | | | 470 | |
Noninterest income | | | 2,632 | | | 2,500 | | | 2,396 | | | 2,255 | | | 2,578 | |
Noninterest expenses | | | 8,524 | | | 7,825 | | | 7,166 | | | 6,901 | | | 6,738 | |
Income tax expense | | | 1,227 | | | 1,116 | | | 876 | | | 712 | | | 681 | |
Net income | | | 2,600 | | | 2,412 | | | 2,107 | | | 1,819 | | | 1,772 | |
Per Share Data: | | | | | | | | | | | | | | | | |
Basic net income | | $ | 1.76 | | | 1.65 | | | 1.44 | | | 1.25 | | | 1.22 | |
Diluted net income | | | 1.75 | | | 1.64 | | | 1.43 | | | 1.23 | | | 1.21 | |
Cash dividends | | | 0.60 | | | 0.55 | | | 0.49 | | | 0.45 | | | 0.44 | |
Book value | | | 17.95 | | | 16.66 | | | 15.91 | | | 15.24 | | | 14.71 | |
Weighted-Average Shares Outstanding: | | | | | | | | | | | | | | | | |
Basic | | | 1,479,689 | | | 1,459,007 | | | 1,458,615 | | | 1,457,406 | | | 1,455,530 | |
Diluted | | | 1,489,377 | | | 1,471,806 | | | 1,476,288 | | | 1,473,442 | | | 1,469,739 | |
Balance Sheet Data: | | | | | | | | | | | | | | | | |
Assets | | $ | 279,913 | | | 256,421 | | | 233,490 | | | 219,813 | | | 206,344 | |
Loans, net | | | 232,752 | | | 207,861 | | | 181,268 | | | 158,846 | | | 147,883 | |
Securities | | | 19,635 | | | 24,866 | | | 29,261 | | | 34,224 | | | 37,108 | |
Cash and cash equivalents | | | 18,344 | | | 14,586 | | | 13,814 | | | 17,336 | | | 13,766 | |
Deposits | | | 251,866 | | | 230,817 | | | 209,246 | | | 196,639 | | | 183,865 | |
Stockholders’ equity | | | 26,816 | | | 24,492 | | | 23,212 | | | 22,207 | | | 21,435 | |
Performance Ratios: | | | | | | | | | | | | | | | | |
Return on average assets | | | 0.97 | % | | 1.00 | % | | 0.94 | % | | 0.86 | % | | 0.87 | % |
Return on average equity | | | 10.17 | % | | 10.10 | % | | 9.29 | % | | 8.33 | % | | 8.51 | % |
Dividend payout | | | 34.12 | % | | 33.25 | % | | 33.93 | % | | 36.06 | % | | 36.07 | % |
Asset Quality Ratios: | | | | | | | | | | | | | | | | |
Allowance for loan losses to total loans, net of unearned income and fees | | | 0.73 | % | | 0.84 | % | | 0.83 | % | | 0.94 | % | | 1.02 | % |
Net charge-offs to average loans, net of unearned income and fees | | | 0.23 | % | | 0.04 | % | | 0.13 | % | | 0.16 | % | | 0.16 | % |
Capital Ratios: | | | | | | | | | | | | | | | | |
Leverage | | | 9.54 | % | | 9.80 | % | | 9.88 | % | | 9.85 | % | | 9.79 | % |
Risk-based: | | | | | | | | | | | | | | | | |
Tier 1 capital | | | 10.55 | % | | 9.92 | % | | 10.54 | % | | 10.98 | % | | 11.57 | % |
Total capital | | | 11.24 | % | | 10.64 | % | | 11.23 | % | | 11.75 | % | | 12.45 | % |
Average equity to average assets | | | 9.51 | % | | 9.91 | % | | 10.07 | % | | 10.32 | % | | 10.20 | % |
6
Management’s Discussion and Analysis
of Financial Condition and Results of Operation
(in thousands, except ratios, share and per share data)
The following discussion is qualified in its entirety by the more detailed information and the consolidated financial statements and accompanying notes appearing elsewhere in this Annual Report. In addition to the historical information contained herein, this Annual Report contains forward-looking statements within the meaning of the Private Securities Litigation Reform Act of 1995. Forward-looking statements, which are based on certain assumptions and describe future plans, strategies, and expectations of management, are generally identifiable by use of words such as “believe,” “expect,” “intend,” “anticipate,” “estimate,” “project,” “may,” “will” or similar expressions. Although we believe our plans, intentions and expectations reflected in these forward-looking statements are reasonable, we can give no assurance that these plans, intentions, or expectations will be achieved. Our ability to predict results or the actual effect of future plans or strategies is inherently uncertain, and actual results, performance or achievements could differ materially from those contemplated. Factors that could have a material adverse effect on our operations and future prospects include, but are not limited to, changes in: interest rates; general economic conditions; the legislative/regulatory climate; monetary and fiscal policies of the U.S. government, including policies of the U.S. Treasury and the Board of Governors of the Federal Reserve System; the quality or composition of the loan and/or investment portfolios; demand for loan products; deposit flows; competition; demand for financial services in our market area; and accounting principles, policies and guidelines. These risks and uncertainties should be considered in evaluating forward-looking statements contained herein. Bankshares bases its forward-looking statements on management’s beliefs and assumptions based on information available as of the date of this report. You should not place undue reliance on such statements, because the assumptions, beliefs, expectations and projections about future events on which they are based may, and often do, differ materially from actual results. We undertake no obligation to update any forward-looking statement to reflect developments occurring after the statement is made.
Company Overview
Pinnacle Bankshares Corporation, a Virginia corporation (Bankshares), was organized in 1997 and is registered as a bank holding company under the Bank Holding Company Act of 1956, as amended. Bankshares is headquartered in Altavista, Virginia. Bankshares conducts all of its business activities through the branch offices of its wholly owned subsidiary bank, The First National Bank of Altavista (the Bank). Bankshares exists primarily for the purpose of holding the stock of its subsidiary, the Bank, and of such other subsidiaries as it may acquire or establish.
The First National Bank of Altavista currently maintains a total of eight offices to serve its customers. The Main Office and Vista Branch are located in the Town of Altavista, the Airport Branch and Timberlake Branch in Campbell County, the Old Forest Road Branch in the City of Lynchburg, the Forest Branch in Bedford County, the Amherst Branch in the Town of Amherst and a Loan Production Office in Franklin County at Smith Mountain Lake. The Bank also maintains an administrative and training facility in the Wyndhurst section of the City of Lynchburg.
A total of one-hundred full and part-time staff members serve the Bank’s customers.
With an emphasis on personal service, the Bank today offers a broad range of commercial and retail banking products and services including checking, savings and time deposits, individual retirement accounts, merchant bankcard processing, residential and commercial mortgages, home equity loans, consumer installment loans, agricultural loans, investment loans, small business loans, commercial lines of credit and letters of credit. The Bank also offers a full range of investment, insurance and annuity products through its association with BI Investment Group, and Banker’s Insurance, LLC. The Bank has two wholly-owned subsidiaries: FNB Property Corp., which holds title to Bank premises real estate; and First Properties, Inc., which holds title to other real estate owned from foreclosures.
7
The following discussion supplements and provides information about the major components of the results of operations and financial condition, liquidity and capital resources of Bankshares and its subsidiary (collectively the Company). This discussion and analysis should be read in conjunction with the Company’s consolidated financial statements and accompanying notes.
Executive Summary
The Company serves a trade area consisting primarily of Campbell County, northern Pittsylvania County, eastern Bedford County, northern Franklin County, Amherst County and the city of Lynchburg from facilities located in the town of Altavista and the city of Lynchburg, Virginia. In addition, in June 1999 the Company opened the Airport facility, located just outside the Lynchburg city limits. In August 2000, the Company opened the Old Forest Road facility, located on Old Forest Road in Lynchburg, and the Brookville Plaza facility, located on Timberlake Road in Lynchburg. The Company opened these offices to better serve the Lynchburg and northern Campbell County areas. To better service eastern Bedford County, the Company opened the Forest facility in August 2004 located at the intersection of Perrowville Road and Route 221. In July 2005, the Company opened the Smith Mountain Lake Loan Production Office located on Scruggs Road in Moneta. In May 2006, the Company moved the Brookville Plaza facility on Timberlake Road in Lynchburg to a new full service facility approximately 1.5 miles away on Timberlake Road in Campbell County now referred to as the Timberlake facility. This move was completed to better service our customers by providing drive-through teller lanes and an ATM, safe deposit boxes, night depository and the same good service given at the previous facility. In November 2006, the Company opened the Amherst Office at a temporary site located on Richmond Highway in Amherst to extend our services to Amherst County and further expand our footprint. The Bank is scheduled to open the permanent Amherst facility on South Main Street in Amherst in March 2008. In January of 2008, the Company acquired a branch site in Rustburg, Virginia located on Village Highway in the Rustburg Marketplace Shopping Center which will further increase our presence in Campbell County in the future. The Company is currently developing site and building plans in anticipation of beginning construction of a facility by mid-year 2008. The Company operates in a well-diversified industrial economic region that does not depend upon one or a few types of commerce.
The Company earns revenues on the interest margin between the interest it charges on loans it extends to customers and interest received on the Company’s securities portfolio net of the interest it pays on deposits to customers. The Company also earns revenues on service charges on deposit and loan products, gains on securities that are called or sold, fees from origination of mortgages, and other noninterest income items including but not limited to overdraft fees, commissions from investment, insurance and annuity sales, safe deposit box rentals, and automated teller machine surcharges. The Company’s revenue generating activities and related expenses are outlined in the consolidated statements of income and consolidated statements of changes in stockholders’ equity and comprehensive income and accompanying notes and in “Results of Operations” below.
The Company generates cash through its operating, investing and financing activities. The generation of cash flows is outlined more fully in the consolidated statements of cash flows and accompanying notes and in “Liquidity and Asset/Liability Management” below.
The Company’s balance sheet experienced strong growth in its loan and deposit portfolios and good growth overall in 2007 assisted by growth in the commercial loan portfolio, continued deposit and loan growth at the Forest facility and good initial growth at our new Amherst facility. The overall growth of the Company is outlined in the consolidated balance sheets and accompanying notes and the “Investment Portfolio,” “Loan Portfolio,” “Bank Premises and Equipment,” “Deposits” and “Capital Resources” discussions below.
The Company looks to continue growing in 2008 and plans to research further expansion opportunities. While growing, the Company is continually striving to leverage efficiencies from our reporting and imaging systems. The Company is also striving to make our customers’ lives more convenient by offering innovative products and services and providing many channels to bank with us including Internet banking, Internet bill pay, telephone banking, debit cards and real-time ATMs. The Company will continue to strive to identify and install convenient products and services in 2008 with the goal to better enhance the customer’s experience with the Company.
8
Overview of 2007 and 2006
Total assets at December 31, 2007 were $279,913, up 9.16% from $256,421 at December 31, 2006. The principal components of the Company’s assets at the end of the year were $18,344 in cash and cash equivalents, $19,635 in securities and $232,752 in net loans. During the year ended December 31, 2007, gross loans increased 11.83% or $24,818. The Company’s lending activities are a principal source of income.
Total liabilities at December 31, 2007 were $253,097, up 9.13% from $231,929 at December 31, 2006, with the increase reflective of an increase in total deposits of $21,049 or 9.12%. Noninterest-bearing demand deposits increased $3,613 or 15.29% and represented 10.82% of total deposits at December 31, 2007, compared to 10.24% at December 31, 2006. Savings and NOW accounts increased $5,072 or 7.27% and represented 29.73% of total deposits at December 31, 2007, compared to 30.24% at December 31, 2006. Time deposits increased $12,364 or 9.00% at December 31, 2007 and represented 59.45% of total deposits at December 31, 2007, compared to 59.52% at December 31, 2006. The Company’s deposits are provided by individuals and businesses located within the communities served.
Total stockholders’ equity at December 31, 2007 was $26,816 compared to $24,492 at December 31, 2006.
The Company had net income of $2,600 for the year ended December 31, 2007, compared to net income of $2,412 for the year ended December 31, 2006, an increase of 7.79%.
Profitability as measured by the Company’s return on average assets (ROA) was 0.97% in 2007, compared to 1.00% in 2006. Another key indicator of performance, the return on average equity (ROE), was 10.17% for 2007, compared to 10.10% for 2006.
Overview of 2006 and 2005
Total assets at December 31, 2006 were $256,421, up 9.82% from $233,490 at December 31, 2005. The principal components of the Company’s assets at the end of 2006 were $14,586 in cash and cash equivalents, $24,866 in securities and $207,861 in net loans. During the year ended December 31, 2006, gross loans increased 14.71% or $26,907.
Total liabilities at December 31, 2006 were $231,929, up 10.30% from $210,278 at December 31, 2005, with the increase reflective of an increase in total deposits of $21,571 or 10.31%. Noninterest-bearing demand deposits increased $1,717 or 7.84% and represented 10.24% of total deposits at December 31, 2006, compared to 10.47% at December 31, 2005. Savings and NOW accounts increased $5,137 or 7.94% and represented 30.24% of total deposits at December 31, 2006, compared to 30.90% at December 31, 2005. Time deposits increased $14,717 or 12.00% at December 31, 2006 and represented 59.52% of total deposits at December 31, 2006, compared to 58.63% at December 31, 2005.
Total stockholders’ equity at December 31, 2006 was $24,492 compared to $23,212 at December 31, 2005.
The Company had net income of $2,412 for the year ended December 31, 2006, compared to net income of $2,107 for the year ended December 31, 2005, an increase of 14.48%.
Profitability as measured by the Company’s return on average assets (ROA) was 1.00% in 2006, compared to 0.94% in 2005. Another key indicator of performance, the return on average equity (ROE), was 10.10% for 2006, compared to 9.29% for 2005.
9
Results of Operations
Net Interest Income. Net interest income represents the principal source of earnings for the Company. Net interest income is the amount by which interest and fees generated from loans, securities and other interest-earning assets exceed the interest expense associated with funding those assets. Changes in the amounts and mix of interest-earning assets and interest-bearing liabilities, as well as their respective yields and rates, have a significant impact on the level of net interest income. Changes in the interest rate environment and the Company’s cost of funds also affect net interest income.
The net interest spread decreased to 3.44% for the year ended December 31, 2007 from 3.56% for the year ended December 31, 2006. Net interest income was $10,181 ($10,345 on a tax-equivalent basis) for the year ended December 31, 2007, compared to $9,192 ($9,334 on a tax-equivalent basis) for the year ended December 31, 2006, and is attributable to interest income from loans, federal funds sold and securities exceeding the cost associated with interest paid on deposits and other borrowings. In 2007, our loans repriced at higher rates less rapidly than did our deposits, causing our interest rate spread to decrease. The Bank’s yield on interest-earning assets for the year ended December 31, 2007 was 0.34% higher than the year ended December 31, 2006 due to lower yielding assets being replaced by higher yielding ones in 2007. The Bank’s cost of funds rate on interest-bearing liabilities in 2007 was 0.46% higher compared to 2006.
The net interest spread increased to 3.56% for the year ended December 31, 2006 from 3.43% for the year ended December 31, 2005. Net interest income was $9,192 ($9,334 on a tax-equivalent basis) for the year ended December 31, 2006, compared to $7,983 ($8,156 on a tax-equivalent basis) for the year ended December 31, 2005, and is attributable to interest income from loans, federal funds sold and securities exceeding the cost associated with interest paid on deposits and other borrowings. In 2006, our loans repriced at higher rates more rapidly than did our deposits, causing our interest rate spread to increase. The Bank’s yield on interest-earning assets for the year ended December 31, 2006 was 0.84% higher than the year ended December 31, 2005 due to lower yielding assets being replaced by higher yielding ones in 2006. The Bank’s cost of funds rate on interest-bearing liabilities in 2006 was 0.71% higher compared to 2005.
The Company’s net interest margin decreased in 2007 from 2006 levels. The Company attempts to increase net interest margin by product pricing strategies. Many economic forecasts of interest rates for 2008 predict that interest rates may decrease if the overall economy shows signs of sluggishness. The Company expects its net interest margin to decline in 2008 from the precipitous cuts in interest rates that have occurred in January of 2008 plus the expectation that rates will decline further. While there is no guarantee of how rates may change in 2008, the Company will strive to price products that are competitive in the market, allow for growth and strive to maintain the net interest margin as much as possible. The Company also continues to strive to find new sources of noninterest income to combat the effects of volatility in the interest rate environment.
The following table presents the major categories of interest-earning assets, interest-earning liabilities and stockholders’ equity with corresponding average balances, related interest income or interest expense and resulting yield and rates for the periods indicated.
10
ANALYSIS OF NET INTEREST INCOME
| | | | | | | | | | | | | | | | | | | | | | | | | |
| | | Years ended December 31, | |
| | | 2007 | | | 2006 | | | 2005 | |
| | | Average
balance(1) | | | Interest
income/
expense | | Rate
earned/
paid | | | Average
balance(1) | | | Interest
income/
expense | | Rate
earned/
paid | | | Average
balance(1) | | | Interest
income/
expense | | Rate
earned/
paid | |
Assets | | | | | | | | | | | | | | | | | | | | | | | | | |
Interest-earning assets: | | | | | | | | | | | | | | | | | | | | | | | | | |
Loans (2)(3) | | $ | 222,412 | | | 16,748 | | 7.53 | % | | 194,819 | | | 13,979 | | 7.18 | % | | 171,388 | | | 10,847 | | 6.33 | % |
Investment securities: | | | | | | | | | | | | | | | | | | | | | | | | | |
Taxable | | | 17,178 | | | 831 | | 4.84 | % | | 20,111 | | | 988 | | 4.91 | % | | 23,540 | | | 1,150 | | 4.89 | % |
Tax-exempt (4) | | | 5,910 | | | 386 | | 6.53 | % | | 6,555 | | | 419 | | 6.39 | % | | 8,501 | | | 577 | | 6.79 | % |
Interest-earning deposits | | | 87 | | | 4 | | 4.60 | % | | 91 | | | 5 | | 5.49 | % | | 205 | | | 6 | | 2.93 | % |
Federal funds sold | | | 11,496 | | | 554 | | 4.82 | % | | 7,695 | | | 368 | | 4.78 | % | | 9,227 | | | 263 | | 2.85 | % |
| | | | | | | | | | | | | | | | | | | | | | | | | |
Total interest-earning assets | | | 257,083 | | | 18,523 | | 7.21 | % | | 229,271 | | | 15,759 | | 6.87 | % | | 212,861 | | | 12,843 | | 6.03 | % |
Other assets: | | | | | | | | | | | | | | | | | | | | | | | | | |
Allowance for loan losses | | | (1,802 | ) | | | | | | | (1,638 | ) | | | | | | | (1,556 | ) | | | | | |
Cash and due from banks | | | 5,132 | | | | | | | | 4,929 | | | | | | | | 6,115 | | | | | | |
Other assets, net | | | 7,792 | | | | | | | | 8,367 | | | | | | | | 7,691 | | | | | | |
| | | | | | | | | | | | | | | | | | | | | | | | | |
Total assets | | $ | 268,205 | | | | | | | | 240,929 | | | | | | | | 225,111 | | | | | | |
| | | | | | | | | | | | | | | | | | | | | | | | | |
| |
| | | Years ended December 31, | |
| | | 2007 | | | 2006 | | | 2005 | |
| | | Average
balance(1) | | | Interest
income/
expense | | Rate
earned/
paid | | | Average
balance(1) | | | Interest
income/
expense | | Rate
earned/
paid | | | Average
balance(1) | | | Interest
income/
expense | | Rate
earned/
paid | |
Liabilities and Stockholders’ equity | | | | | | | | | | | | | | | | | | | | | | | | | |
Interest-bearing liabilities: | | | | | | | | | | | | | | | | | | | | | | | | | |
Savings and NOW | | $ | 73,171 | | | 1,403 | | 1.92 | % | | 66,666 | | | 1,048 | | 1.57 | % | | 63,374 | | | 549 | | 0.87 | % |
Time | | | 143,769 | | | 6,771 | | 4.71 | % | | 127,185 | | | 5,367 | | 4.22 | % | | 116,895 | | | 4,119 | | 3.52 | % |
Other borrowings | | | 60 | | | 4 | | 6.67 | % | | 158 | | | 10 | | 6.33 | % | | 260 | | | 16 | | 6.15 | % |
Federal funds purchased | | | — | | | — | | | | | — | | | — | | — | | | 75 | | | 3 | | 4.00 | % |
| | | | | | | | | | | | | | | | | | | | | | | | | |
| | | 217,000 | | | 8,178 | | 3.77 | % | | 194,009 | | | 6,425 | | 3.31 | % | | 180,604 | | | 4,687 | | 2.60 | % |
Noninterest-bearing liabilities: | | | | | | | | | | | | | | | | | | | | | | | | | |
Demand deposits | | | 24,631 | | | | | | | | 22,008 | | | | | | | | 21,169 | | | | | | |
Other liabilities | | | 1,240 | | | | | | | | 1,054 | | | | | | | | 662 | | | | | | |
| | | | | | | | | | | | | | | | | | | | | | | | | |
| | | 242,871 | | | | | | | | 217,071 | | | | | | | | 202,435 | | | | | | |
Stockholders’ equity | | | 25,334 | | | | | | | | 23,858 | | | | | | | | 22,676 | | | | | | |
| | | | | | | | | | | | | | | | | | | | | | | | | |
| | | 268,205 | | | | | | | | 240,929 | | | | | | | | 225,111 | | | | | | |
| | | | | | | | | | | | | | | | | | | | | | | | | |
Net interest income | | | | | | 10,345 | | | | | | | | 9,334 | | | | | | | | 8,156 | | | |
| | | | | | | | | | | | | | | | | | | | | | | | | |
Net interest margin (5) | | | | | | | | 4.02 | % | | | | | | | 4.05 | % | | | | | | | 3.83 | % |
| | | | | | | | | | | | | | | | | | | | | | | | | |
Net interest spread (6) | | | | | | | | 3.44 | % | | | | | | | 3.56 | % | | | | | | | 3.43 | % |
| | | | | | | | | | | | | | | | | | | | | | | | | |
| (1) | Averages are daily averages. |
| (2) | Loan interest income includes amortization of loan fees of $23 in 2007, amortization of loan fees of $53 in 2006 and accretion of loan fees of $45 in 2005. |
11
| (3) | For the purpose of these computations, non-accrual loans are included in average loans. |
| (4) | Tax-exempt income from investment securities is presented on a tax-equivalent basis assuming a 34% U.S. Federal tax rate for 2007, 2006 and 2005. |
| (5) | The net interest margin is calculated by dividing net interest income by average total interest-earning assets. |
| (6) | The net interest spread is calculated by subtracting the interest rate paid on interest-bearing liabilities from the interest rate earned on interest-earning assets. |
As discussed above, the Company’s net interest income is affected by the change in the amounts and mix of interest-earning assets and interest-bearing liabilities, referred to as “volume change,” as well as by changes in yields earned on interest-earning assets and rates paid on deposits and other borrowed funds, referred to as “rate change.” The following table presents, for the periods indicated, a summary of changes in interest income and interest expense for the major categories of interest-earning assets and interest-bearing liabilities and the amounts of change attributable to variations in volumes and rates.
RATE/VOLUME ANALYSIS
| | | | | | | | | | | | | | | | | | | |
| | | Years ended December 31, | |
| | | 2007 compared to 2006
Increase (decrease) | | | 2006 compared to 2005
Increase (decrease) | |
| | | Volume | | | Rate | | | Net | | | Volume | | | Rate | | | Net | |
Interest earned on interest-earning assets: | | | | | | | | | | | | | | | | | | | |
Loans (1) | | $ | 1,986 | | | 783 | | | 2,769 | | | 1,601 | | | 1,531 | | | 3,132 | |
Investment securities: | | | | | | | | | | | | | | | | | | | |
Taxable | | | (177 | ) | | 20 | | | (157 | ) | | (129 | ) | | (32 | ) | | (161 | ) |
Tax-exempt (2) | | | (50 | ) | | 17 | | | (33 | ) | | (126 | ) | | (32 | ) | | (158 | ) |
Interest-earning deposits | | | — | | | (1 | ) | | (1 | ) | | 2 | | | (3 | ) | | (1 | ) |
Federal funds sold | | | 182 | | | 4 | | | 186 | | | (34 | ) | | 138 | | | 104 | |
| | | | | | | | | | | | | | | | | | | |
Total interest earned on interest-earning assets | | | 1,941 | | | 823 | | | 2,764 | | | 1,314 | | | 1,602 | | | 2,916 | |
| | | | | | | | | | | | | | | | | | | |
Interest paid on interest-bearing liabilities: | | | | | | | | | | | | | | | | | | | |
Savings and NOW | | | 70 | | | 285 | | | 355 | | | 30 | | | 469 | | | 499 | |
Time | | | 679 | | | 725 | | | 1,404 | | | 383 | | | 865 | | | 1,248 | |
Federal funds purchased | | | — | | | — | | | — | | | (3 | ) | | — | | | (3 | ) |
Other borrowings | | | (7 | ) | | 1 | | | (6 | ) | | (6 | ) | | — | | | (6 | ) |
| | | | | | | | | | | | | | | | | | | |
Total interest paid on interest-bearing liabilities | | | 742 | | | 1,011 | | | 1,753 | | | 404 | | | 1,334 | | | 1,738 | |
| | | | | | | | | | | | | | | | | | | |
Change in net interest income | | $ | 1,199 | | | (188 | ) | | 1,011 | | | 910 | | | 268 | | | 1,178 | |
| | | | | | | | | | | | | | | | | | | |
| (1) | Non-accrual loans are included in the average loan totals used in the calculation of this table. |
| (2) | Tax-exempt income from investment securities is presented on a tax equivalent basis assuming a 34% U.S. Federal tax rate. |
Provision for Loan Losses. The provision for loan losses is based upon the Company’s evaluation of the quality of the loan portfolio, total outstanding and committed loans, previous loan losses and current and anticipated economic conditions. The amount of the provision for loan losses is a charge against earnings. Actual loan losses are charges against the allowance for loan losses.
The Company’s allowance for loan losses is typically maintained at a level deemed adequate to provide for known and inherent losses in the loan portfolio. No assurance can be given that unforeseen adverse economic conditions or other circumstances will not result in increased provisions in the future. Additionally, regulatory examiners may require the Company to recognize additions to the allowance based upon their judgment about information available to them at the time of their examinations.
The provisions for loan losses for the years ended December 31, 2007, 2006 and 2005 were $462, $339 and $230, respectively. See “Allowance for Loan Losses” for further discussion.
12
Noninterest Income.Total noninterest income for the year ended December 31, 2007 increased $132, or 5.28% to $2,632 from $2,500 in 2006. The Company’s principal source of noninterest income is service charges and fees on deposit accounts, particularly transaction accounts, fees on sales of mortgage loans, and commissions and fees from investment, insurance, annuity and other bank products. The increase in 2007 is primarily attributable to an increase in service charges on deposits accounts and commissions on products sales. Service charges on deposit accounts increased $55 and commissions on investment product sales increased $39 for the year ended December 31, 2007, compared to 2006.
Total noninterest income for the year ended December 31, 2006 increased $104, or 4.34% to $2,500 from $2,396 in 2005. The increase in 2006 is primarily attributable to an increase in service charges on deposits accounts and commissions on products sales. Service charges on deposit accounts increased $64 and commissions on investment product sales increased $46 for the year ended December 31, 2006, compared to 2005.
Noninterest Expense.Total noninterest expense for the year ended December 31, 2007 increased $699 or 8.93% to $8,524 from $7,825 in 2006. The increase in noninterest expense is attributable to the effect of overall growth of the Company on personnel expenses and fixed asset costs. The Company has added seven new branches and a loan production facility to its operations since June 1999. The $276 increase in other expense is primarily due to an $83 loss on the Company’s investment in Bankers Investments Group, LLC. In December 2007, Bankers Investments Group, LLC, in which the Bank is a member, entered into merger agreement with Infinex Financial Group. The merger is expected to be completed in March 2008. Based upon the approved terms of the merger, the Bank recognized a permanent impairment loss of $83 in its investment in Bankers Investments Group, LLC in December 2007. Other expenses that contributed to the increase in other expense was a $48 expense associated with the sale of a charged-off property in December 2007, a $22 increase in telephone expense, a $13 increase in legal fees and a $22 increase in indirect loan chargebacks.
Total noninterest expense for the year ended December 31, 2006 increased $659 or 9.20% to $7,825 from $7,166 in 2005. The increase in noninterest expense is attributable to the effect of overall growth of the Company on personnel expenses and fixed asset costs. The $108 increase in other expense is primarily due to a $48 increase in consultant expenses, a $7 increase in costs associated with our overdraft privilege program, an $8 increase in legal fees, a $9 increase in fees paid to directors, and a $35 increase in indirect loan chargebacks.
Income Tax Expense. Applicable income taxes on 2007 earnings amounted to $1,227, resulting in an effective tax rate of 32.06% compared to $1,116, or 31.63% in 2006. The effective tax rate for 2007 is higher primarily because the level of tax-exempt interest income for 2007 was lower compared to 2006.
Applicable income taxes on 2006 earnings amounted to $1,116, resulting in an effective tax rate of 31.63% compared to $876, or 29.37% in 2005. The effective tax rate for 2006 is higher primarily because the level of tax-exempt interest income for 2006 was lower compared to 2005.
Liquidity and Asset/Liability Management
Effective asset/liability management includes maintaining adequate liquidity and minimizing the impact of future interest rate changes on net interest income. The responsibility for monitoring the Company’s liquidity and the sensitivity of its interest-earning assets and interest-bearing liabilities lies with the Asset Liability Committee of the Bank which meets at least quarterly to review liquidity and the adequacy of funding sources.
Cash Flows. The Company derives cash flows from its operating, investing and financing activities. Cash flows of the Company are primarily used to fund loans and securities and are provided by the deposits and borrowings of the Company.
The Company’s operating activities for the year ended December 31, 2007 resulted in net cash provided of $3,773, compared to net cash provided from operating activities of $3,218 in 2006. The increase is primarily attributable to the Company’s cash received from net interest income of $10,184, which was $1,020 higher than the net interest received in 2006 as a result of an increase in loan
13
volume and yield received of $2,210. Cash paid for noninterest expenses of $7,747 was $188 lower than 2006 primarily due to a lower pension contribution in 2007. Partially offsetting this was cash received from noninterest income in 2007 that was $71 lower than the noninterest income amount received in 2006. Also, the Company’s cash paid for income taxes totaled $1,019 in 2007 compared to $900 in 2006. Management expects any changes in the Company’s cash provided by operating activities to be partially offset through continued expansion of the Company’s loan origination programs, changes in deposit pricing strategies and continued focus on improving the efficiency of the Company’s operations.
The Company’s cash flows from investing activities for the year ended December 31, 2007 resulted in net cash used of $20,332, compared to net cash used in investing activities of $23,135 in 2006. The decrease is primarily attributable to a $2,012 decrease in cash used to make loans to customers as the Company increased its gross loans by 11.83% from 2006 to 2007 as compared to 14.71% from 2005 to 2006. The Company expects to continue to increase its loan portfolio in 2008. The Company also experienced fewer paydowns and maturities of available-for-sale mortgage-backed securities. The Company expects a slightly lower volume of paydowns in available-for-sale mortgage-backed securities in 2008 due to fewer mortgage-backed securities in the investment portfolio.
Net cash provided by financing activities for the year ended December 31, 2007 resulted in net cash provided of $20,317, compared to net cash provided by financing activities of $20,689 in 2006. The decrease in net cash provided is primarily attributable to the lower net increase in deposits from 2006 to 2007 compared to 2005 to 2006. The Company had success in attracting all different types of deposits to fund the growth in the loan portfolio although the cost of the deposits increased in 2007.
The Company’s operating activities for the year ended December 31, 2006 resulted in net cash provided of $3,218, compared to net cash provided from operating activities of $2,711 in 2005. The increase is primarily attributable to the Company’s cash received from net interest income of $9,164, which was $1,116 higher than the net interest received in 2005 as a result of an increase in loan volume and yield received of $2,423. Partially offsetting this was cash received from noninterest income in 2006 that was $34 lower than the noninterest income amount received in 2005 and cash paid for noninterest expenses of $7,935 that was $1,299 higher than 2005 primarily due to the Company’s increased personnel and fixed asset expenses associated with its continued growth. Also, the Company’s cash paid for income taxes totaled $900 in 2006 compared to $688 in 2005.
The Company’s cash flows from investing activities for the year ended December 31, 2006 resulted in net cash used of $23,135, compared to net cash used in investing activities of $18,044 in 2005. The increase is primarily attributable to a $4,788 increase in cash used to make loans to customers as the Company increased its gross loans by 14.71%. The Company also experienced fewer paydowns and maturities of available-for-sale mortgage-backed securities due to a rising interest rate environment in 2006.
Net cash provided by financing activities for the year ended December 31, 2006 resulted in net cash provided of $20,689, compared to net cash provided by financing activities of $11,811 in 2005. The increase in net cash provided is primarily attributable to the net increase in deposits. The Company had success in attracting all different types of deposits to fund the growth in the loan portfolio although the cost of the deposits increased in 2006.
Liquidity. Liquidity measures the ability of the Company to meet its maturing obligations and existing commitments, to withstand fluctuations in deposit levels, to fund its operations, and to provide for customers’ credit needs. Liquidity represents an institution’s ability to meet present and future financial obligations through either the sale or maturity of existing assets or the acquisition of additional funds from alternative funding sources.
The Company’s liquidity is provided by cash and due from banks, federal funds sold, investments available-for-sale, managing investment maturities, interest-earning deposits in other financial institutions and loan repayments. The Company’s ratio of liquid
14
assets to deposits and short-term borrowings was 13.66% as of December 31, 2007 as compared to 14.89% as of December 31, 2006. The Company sells excess funds as overnight federal funds sold to provide an immediate source of liquidity. Federal funds sold for the year ended December 31, 2007 was $11,562 as compared to $8,638 for the year ended December 31, 2006. The increase in federal funds sold in 2007 was primarily related to the net increase in deposits and paydowns and maturities of securities in 2007. Cash and due from banks of $6,782 as of December 31, 2007 was $834 higher when compared to December 31, 2006.
The level of deposits may fluctuate significantly due to seasonal business cycles of depository customers. Levels of deposits are also affected by convenience of branch locations and ATMs to the customer, the rates offered on interest-bearing deposits and the attractiveness of noninterest-bearing deposit offerings compared with the competition. Similarly, the level of demand for loans may vary significantly and at any given time may increase or decrease substantially. However, unlike the level of deposits, management has more direct control over lending activities and maintains the level of those activities according to the amounts of available funds. Loan demand may be affected by the overall health of the local economy, loan rates compared with the competition and other loan features offered by the Company.
As a result of the Company’s management of liquid assets and its ability to generate liquidity through alternative funding sources, management believes that the Company maintains overall liquidity that is sufficient to satisfy its depositors’ requirements and to meet customers’ credit needs. Additional sources of liquidity available to the Company include its capacity to borrow funds through correspondent banks and the Federal Home Loan Bank.
The Company obtains sources of funds through growth in deposits, scheduled payments and prepayments from the loan and investment portfolio, retained earnings growth, and may purchase or borrow funds through the Federal Reserve’s discount window. The Company also has sources of liquidity through three correspondent banking relationships. The Company uses its funds to fund loan and investment growth. Excess funds are sold daily to other institutions. The Company had one borrowing with the Federal Home Loan Bank during 2007 with an interest rate of 6.13%. The final principal payment of the borrowing was made in December 2007.
Interest Rates
While no single measure can completely identify the impact of changes in interest rates on net interest income, one gauge of interest rate sensitivity is to measure, over a variety of time periods, the differences in the amounts of the Company’s rate-sensitive assets and rate-sensitive liabilities. These differences or “gaps” provide an indication of the extent to which net interest income may be affected by future changes in interest rates. A “positive gap” exists when rate-sensitive assets exceed rate-sensitive liabilities and indicates that a greater volume of assets than liabilities will reprice during a given period. This mismatch may enhance earnings in a rising interest rate environment and may inhibit earnings in a declining interest rate environment. Conversely, when rate-sensitive liabilities exceed rate-sensitive assets, referred to as a “negative gap,” it indicates that a greater volume of liabilities than assets will reprice during the period. In this case, a rising interest rate environment may inhibit earnings and a declining interest rate environment may enhance earnings. The cumulative one-year gap as of December 31, 2007 was $(15,340), representing 5.48% of total assets. This negative gap falls within the parameters set by the Company.
The following table illustrates the Company’s interest rate sensitivity gap position at December 31, 2007.
| | | | | | | | | | | |
| | | 1 year | | | 1-3 years | | | 3-5 years | | 5-15 years |
ASSET/(LIABILITY): | | | | | | | | | | | |
Cumulative interest rate sensitivity gap | | $ | (15,340 | ) | | (21,220 | ) | | 16,263 | | 38,781 |
15
As of December 31, 2007, the Company was liability-sensitive in periods from one to three years and was asset-sensitive beyond three years. The foregoing table does not necessarily indicate the impact of general interest rate movements on the Company’s net interest yield, because the repricing of various categories of assets and liabilities is discretionary and is subject to competition and other pressures. As a result, various assets and liabilities indicated as repricing within the same period may in fact price at different times and at different rate levels. Management attempts to mitigate the impact of changing interest rates in several ways, one of which is to manage its interest rate-sensitivity gap. In addition to managing its asset/liability position, the Company has taken steps to mitigate the impact of changing interest rates by generating noninterest income through service charges, and offering products that are not interest rate-sensitive.
Effects of Inflation
The effect of changing prices on financial institutions is typically different from other industries as the Company’s assets and liabilities are monetary in nature. Interest rates are significantly impacted by inflation, but neither the timing nor the magnitude of the changes is directly related to price level indices. Impacts of inflation on interest rates, loan demand and deposits are not reflected in the consolidated financial statements.
Investment Portfolio
The Company’s investment portfolio is used primarily for investment income and secondarily for liquidity purposes. The Company invests funds not used for capital expenditures or lending purposes in securities of the U.S. Government and its agencies, mortgage-backed securities, and taxable and tax-exempt municipal bonds, corporate securities or certificates of deposit. Obligations of the U.S. Government and its agencies include treasury notes and callable or noncallable agency bonds. The mortgage-backed securities include mortgage-backed security pools that are diverse as to interest rates and guarantors. The Company has not invested in derivatives or other high-risk type securities.
Investment securities available-for-sale as of December 31, 2007 were $15,460, a decrease of $3,761 or 19.57% from $19,221 as of December 31, 2006. Investment securities held-to-maturity decreased to $4,175 as of December 31, 2007 from $5,645 as of December 31, 2006, a decrease of $1,470 or 26.04%.
The following table presents the composition of the Company’s investment portfolios as of the dates indicated.
| | | | | | | | | | | | | |
| | | December 31, |
| | | 2007 | | 2006 | | 2005 |
| | | Amortized
costs | | Fair
values | | Amortized
costs | | Fair
values | | Amortized
costs | | Fair
values |
Available-for-Sale | | | | | | | | | | | | | |
U.S. Treasury securities and obligations of U.S. Government corporations and agencies | | $ | 2,647 | | 2,657 | | 4,889 | | 4,843 | | 3,985 | | 3,921 |
Obligations of states and political subdivisions | | | 6,142 | | 6,178 | | 6,033 | | 6,025 | | 6,922 | | 6,934 |
Corporate securities | | | 2,498 | | 2,474 | | 3,502 | | 3,451 | | 6,055 | | 5,985 |
Mortgage-backed securities – government | | | 4,132 | | 4,101 | | 4,908 | | 4,852 | | 5,494 | | 5,461 |
Other securities | | | 50 | | 50 | | 50 | | 50 | | 50 | | 50 |
| | | | | | | | | | | | | |
Total available-for-sale | | $ | 15,469 | | 15,460 | | 19,382 | | 19,221 | | 22,506 | | 22,351 |
| | | | | | | | | | | | | |
| |
| | | December 31, |
| | | 2007 | | 2006 | | 2005 |
| | | Amortized
costs | | Fair
values | | Amortized
costs | | Fair
values | | Amortized
costs | | Fair
values |
Held-to-Maturity | | | | | | | | | | | | | |
Obligations of states and political subdivisions | | $ | 4,175 | | 4,213 | | 5,645 | | 5,673 | | 6,910 | | 6,982 |
| | | | | | | | | | | | | |
Total held-to-maturity | | $ | 4,175 | | 4,213 | | 5,645 | | 5,673 | | 6,910 | | 6,982 |
| | | | | | | | | | | | | |
16
The following table presents the maturity distribution based on fair values and amortized costs of the investment portfolios as of the dates indicated.
INVESTMENT PORTFOLIO – MATURITY DISTRIBUTION
| | | | | | | | |
| | | December 31, 2007 | |
| | | Amortized
Costs | | Fair
Values | | Yield | |
Available-for-Sale | | | | | | | | |
U.S. Treasury securities and obligations of U.S. Government corporations: | | | | | | | | |
Within one year | | $ | 1,000 | | 999 | | 3.99 | % |
After one but within five years | | | 1,647 | | 1,658 | | 4.55 | % |
Obligations of states and political subdivisions (1): | | | | | | | | |
Within one year | | | 1,130 | | 1,130 | | 4.41 | % |
After one but within five years | | | 3,502 | | 3,523 | | 4.65 | % |
After five years through ten years | | | 1,010 | | 1,026 | | 4.44 | % |
After ten years | | | 500 | | 499 | | 3.40 | % |
Corporate securities: | | | | | | | | |
Within one year | | | 1,500 | | 1,496 | | 4.39 | % |
After one but within five years | | | 998 | | 978 | | 4.23 | % |
Mortgage-backed securities – government | | | 4,132 | | 4,101 | | 5.12 | % |
Other securities (2) | | | 50 | | 50 | | — | |
| | | | | | | | |
Total available-for-sale | | $ | 15,469 | | 15,460 | | | |
| | | | | | | | |
Held-to-Maturity | | | | | | | | |
Obligations of states and political subdivisions (1): | | | | | | | | |
Within one year | | | 1,670 | | 1,670 | | 4.18 | % |
After one but within five years | | | 2,204 | | 2,245 | | 4.77 | % |
After five years through ten years | | | 301 | | 298 | | 3.45 | % |
| | | | | | | | |
Total held-to-maturity | | $ | 4,175 | | 4,213 | | | |
| | | | | | | | |
| (1) | Obligations of states and political subdivisions include yields of tax–exempt securities presented on a tax-equivalent basis assuming a 34% U.S. Federal tax rate. |
| (2) | Equity securities are assumed to have a life greater than ten years. |
Loan Portfolio
The Company’s net loans were $232,752 as of December 31, 2007, an increase of $24,891 or 11.97% from $207,861 as of December 31, 2006. This increase resulted primarily from increased volume of commercial loan originations during 2007 and loan volume from our loan production facility. The Company’s ratio of net loans to total deposits was 92.41% as of December 31, 2007 compared to 90.05% as of December 31, 2006.
Typically, the Company maintains a ratio of loans to deposits of between 70% and 90%. The loan portfolio primarily consists of commercial, real estate (including real estate term loans, construction loans and other loans secured by real estate), and loans to individuals for household, family and other consumer expenditures. However, the Company adjusts its mix of lending and the terms of its loan programs according to market conditions and other factors. The Company’s loans are typically made to businesses and individuals located within the Company’s market area, most of whom have account relationships with the Bank. There is no concentration of loans exceeding 10% of total loans that is not disclosed in the categories presented below. The Company has not made any loans to any foreign entities including governments, banks, businesses or individuals. Commercial and construction loans in the Company’s portfolio are primarily variable rate loans and have little interest rate risk.
17
The following table presents the composition of the Company’s loan portfolio as of the dates indicated.
LOAN PORTFOLIO
| | | | | | | | | | | | | | | | |
| | | December 31, | |
| | | 2007 | | | 2006 | | | 2005 | | | 2004 | | | 2003 | |
Real estate loans: | | | | | | | | | | | | | | | | |
Residential | | $ | 75,579 | | | 68,540 | | | 55,936 | | | 52,470 | | | 52,264 | |
Other | | | 92,102 | | | 72,797 | | | 53,039 | | | 43,877 | | | 34,697 | |
Loans to individuals for household, family and other consumer expenditures | | | 46,834 | | | 46,360 | | | 44,369 | | | 41,449 | | | 44,367 | |
Commercial and industrial loans | | | 19,909 | | | 21,694 | | | 28,659 | | | 21,680 | | | 17,635 | |
All other loans | | | 240 | | | 454 | | | 935 | | | 992 | | | 533 | |
| | | | | | | | | | | | | | | | |
Total loans, gross | | | 234,664 | | | 209,845 | | | 182,938 | | | 160,468 | | | 149,496 | |
Less unearned income and fees | | | (192 | ) | | (214 | ) | | (162 | ) | | (120 | ) | | (85 | ) |
| | | | | | | | | | | | | | | | |
Loans, net of unearned income and fees | | | 234,472 | | | 209,631 | | | 182,776 | | | 160,348 | | | 149,411 | |
Less allowance for loan losses | | | (1,720 | ) | | (1,770 | ) | | (1,508 | ) | | (1,502 | ) | | (1,528 | ) |
| | | | | | | | | | | | | | | | |
Loans, net | | $ | 232,752 | | | 207,861 | | | 181,268 | | | 158,846 | | | 147,883 | |
| | | | | | | | | | | | | | | | |
Commercial Loans. Commercial and industrial loans accounted for 8.48% of the Company’s loan portfolio as of December 31, 2007 compared to 15.62% as of December 31, 2006. Such loans are generally made to provide operating lines of credit, to finance the purchase of inventory or equipment, and for other business purposes. Commercial loans are primarily made at rates that adjust with changes in the prevailing prime interest rate, are generally made for a maximum term of five years (unless they are term loans), and generally require interest payments to be made monthly. The creditworthiness of these borrowers is reviewed, analyzed and evaluated on a periodic basis. Most commercial loans are collateralized with business assets such as accounts receivable, inventory and equipment. Even with substantial collateralization such as all of the assets of the business and personal guarantees, commercial lending involves considerable risk of loss in the event of a business downturn or failure of the business. Commercial loan volume has fallen from 2006 to 2007 as the Company has focused on commercial real estate and construction lending in 2008.
Real Estate Loans.Real estate loans accounted for 71.46% of the Company’s loan portfolio as of December 31, 2007 compared to 62.08% as of December 31, 2006. The Company makes commercial and industrial real estate term loans that are typically secured by a first deed of trust. As of December 31, 2007, 42.33% of the real estate loans were secured by 1-4 family residential properties compared to 50.52% at December 31, 2006. As of December 31, 2007, 26.47% of total real estate loans were construction loans compared to 14.22% at December 31, 2006. Real estate lending involves risk elements when there is lack of timely payment and/or a decline in the value of the collateral. The current local market in 2007 remained strong with real estate values maintaining value although many areas of the nation experienced decreasing real estate values in 2007. The Company is now seeing evidence of borrowers becoming strained in ability to service loans which may result in impairment of other credits. The Company will continue to monitor the real estate market in 2008 for signs of weakness in the local market.
Installment Loans. Installment loans are represented by loans to individuals for household, family and other consumer expenditures. Installment loans accounted for 19.96% of the Company’s loan portfolio as of December 31, 2007 compared to 22.09% as of December 31, 2006.
Loan Maturity and Interest Rate Sensitivity. The following table presents loan portfolio information related to maturity distribution of commercial and industrial loans and real estate construction loans based on scheduled repayments at December 31, 2007.
18
LOAN MATURITY
| | | | | | | | | |
| | | Due within
one year | | Due one to
five years | | Due after
five years | | Total |
Commercial and industrial loans | | $ | 13,892 | | 5,106 | | 911 | | 19,909 |
Real estate – construction | | | 33,755 | | 8,927 | | 1,706 | | 44,388 |
The following table presents the interest rate sensitivity of commercial and industrial loans and real estate construction loans maturing after one year or longer as of December 31, 2007.
INTEREST RATE SENSITIVITY
| | | |
Fixed interest rates | | $ | 5,503 |
Variable interest rates | | | 514 |
| | | |
Total maturing after one year | | $ | 6,017 |
| | | |
Restructured Loans.The Company had no restructured loans during the years ended December 31, 2007 and 2006.
Nonperforming Assets. Interest on loans is normally accrued from the date a disbursement is made and recognized as income as it is accrued. Generally, the Company reviews any loan on which payment has not been made for 90 days for potential non-accrual. The loan is examined and the collateral is reviewed to determine loss potential. If the loan is placed on non-accrual status, any prior accrued interest that remains unpaid is reversed. Loans on non-accrual status amounted to $634, $255 and $421 as of December 31, 2007, 2006 and 2005, respectively. Interest income that would have been earned on non-accrual loans if they had been current in accordance with their original terms and the recorded interest that was included in income on these loans was not significant for 2007, 2006 or 2005. There were no commitments to lend additional funds to customers whose loans were on non-accrual status at December 31, 2007. No foreclosed property was on hand as of December 31, 2007 and 2006. Foreclosed property as of December 31, 2005 consisted of one property totaling $150.
The following table presents information with respect to the Company’s nonperforming assets and nonaccruing loans 90 days or more past due by type as of the dates indicated.
NONPERFORMING ASSETS
| | | | | | | |
| | | December 31, |
| | | 2007 | | 2006 | | 2005 |
Nonaccrual loans | | $ | 634 | | 255 | | 421 |
Foreclosed properties | | | — | | — | | 150 |
| | | | | | | |
Total nonperforming assets | | $ | 634 | | 255 | | 571 |
| | | | | | | |
Nonperforming assets totaled $634 or 0.27% of total gross loans as of December 31, 2007, compared to $255 or 0.12% as of December 31, 2006 and $571 or 0.31% as of December 31, 2005. The following table presents the balance of accruing loans 90 days or more past due by type as of the dates indicated.
ACCRUING LOANS 90 DAYS OR MORE
PAST DUE BY TYPE
| | | | | | | |
| | | December 31, |
| | | 2007 | | 2006 | | 2005 |
Loans 90 days or more past due by type: | | | | | | | |
Real estate loans | | $ | 149 | | — | | 17 |
Loans to individuals | | | 7 | | 15 | | — |
Commercial loans | | | — | | — | | 51 |
| | | | | | | |
Total accruing loans 90 days or more past due | | $ | 156 | | 15 | | 68 |
| | | | | | | |
19
Allowance for Loan Losses. The Company maintains an allowance for loan losses, which it considers adequate to cover the risk of losses in the loan portfolio. The allowance is based upon management’s ongoing evaluation of the quality of the loan portfolio, total outstanding and committed loans, previous charges against the allowance and current and anticipated economic conditions. The allowance is also subject to regulatory examinations and determinations as to adequacy, which may take into account such factors as the methodology used to calculate the allowance. The Company’s management believes that as of December 31, 2007, 2006 and 2005, the allowance was adequate. The amount of the provision for loan losses is a charge against earnings. Actual loan losses are charged against the allowance for loan losses.
Management evaluates the reasonableness of the allowance for loan losses on a quarterly basis and adjusts the provision as deemed necessary. As of December 31, 2007, the allowance for loan losses totaled $1,720 or 0.73% of total loans, net of unearned income and fees compared to $1,770 or 0.84% of total loans, net of unearned income and fees as of December 31, 2006. The provision for loan losses for the years ended December 31, 2007 and 2006 was $462 and $339, respectively. Net charge-offs for the Company were $512 and $77 for the years ended December 31, 2007 and 2006, respectively. The ratio of net loan charge-offs during the period to average loans outstanding for the period was 0.23% and 0.04% for the years ended December 31, 2007 and 2006, respectively.
As of December 31, 2006, the allowance for loan losses totaled $1,770 or 0.84% of total loans, net of unearned income and fees compared to $1,508 or 0.83% of total loans, net of unearned income and fees as of December 31, 2005. The provision for loan losses for the years ended December 31, 2006 and 2005 was $339 and $230, respectively. Net charge-offs for the Company were $77 and $224 for the years ended December 31, 2006 and 2005, respectively. The ratio of net loan charge-offs during the period to average loans outstanding for the period was 0.04% and 0.13% for the years ended December 31, 2006 and 2005, respectively.
The following table presents charged off loans, provisions for loan losses, recoveries on loans previously charged off, allowance adjustments and the amount of the allowance for the years indicated.
ANALYSIS OF ALLOWANCE FOR LOAN LOSSES
| | | | | | | | | | | | | | | | |
| | | Years ended December 31, | |
| | | 2007 | | | 2006 | | | 2005 | | | 2004 | | | 2003 | |
Balance at beginning of year | | $ | 1,770 | | | 1,508 | | | 1,502 | | | 1,528 | | | 1,298 | |
Loan charge-offs: | | | | | | | | | | | | | | | | |
Real estate loans – other | | | — | | | — | | | — | | | — | | | — | |
Real estate loans – commercial | | | (223 | ) | | — | | | — | | | (24 | ) | | — | |
Commercial and industrial loans | | | (137 | ) | | — | | | (66 | ) | | (98 | ) | | — | |
Loans to individuals for household, family and other consumer expenditures | | | (286 | ) | | (206 | ) | | (314 | ) | | (229 | ) | | (367 | ) |
| | | | | | | | | | | | | | | | |
Total loan charge-offs | | | (646 | ) | | (206 | ) | | (380 | ) | | (351 | ) | | (367 | ) |
| | | | | | | | | | | | | | | | |
Loan recoveries: | | | | | | | | | | | | | | | | |
Loans to individuals for household, family and other consumer expenditures | | | 134 | | | 129 | | | 156 | | | 102 | | | 127 | |
| | | | | | | | | | | | | | | | |
Net loan charge-offs | | | (512 | ) | | (77 | ) | | (224 | ) | | (249 | ) | | (240 | ) |
Provisions for loan losses | | | 462 | | | 339 | | | 230 | | | 223 | | | 470 | |
| | | | | | | | | | | | | | | | |
Balance at end of year | | $ | 1,720 | | | 1,770 | | | 1,508 | | | 1,502 | | | 1,528 | |
| | | | | | | | | | | | | | | | |
The primary risk elements considered by management with respect to each installment and conventional real estate loan are lack of timely payment and the value of the collateral. The primary risk elements with respect to real estate construction loans are fluctuations in real estate values in the Company’s market areas, inaccurate estimates of construction costs, fluctuations in interest
20
rates, the availability of conventional financing, the demand for housing in the Company’s market area and general economic conditions. The primary risk elements with respect to commercial loans are the financial condition of the borrower, general economic conditions in the Company’s market area, the sufficiency of collateral, the timeliness of payment and, with respect to adjustable rate loans, interest rate fluctuations. Management has a policy of requesting and reviewing annual financial statements from its commercial loan customers and periodically reviews the existence of collateral and its value. Management also has a reporting system that monitors all past due loans and has adopted policies to pursue its creditor’s rights in order to preserve the Company’s position.
Loans are charged against the allowance when, in management’s opinion, they are deemed uncollectible, although the Bank continues to aggressively pursue collection. The Company considers a number of factors to determine the need for and timing of charge-offs including the following: whenever any commercial loan becomes past due for 120 days for any scheduled principal or interest payment and there is no recommendation to place the loan in non-accrual status; whenever foreclosure on real estate collateral or liquidation of other collateral does not result in full payment of the obligation and the deficiency or some portion thereof is deemed uncollectible, the uncollectible portion shall be charged-off; whenever any installment loan becomes past due for 120 days and has not been placed in non-accrual status; whenever any repossessed vehicle remains unsold for 60 days after repossession; whenever a bankruptcy notice is received on any installment loan and review of the facts results in an assessment that all or most of the balance will not be collected, the loan will be placed in non-accrual status; whenever a bankruptcy notice is received on a small, unsecured, revolving installment account; and whenever any other small, unsecured, revolving installment account becomes past due for 180 days.
Although management believes that the allowance for loan losses is adequate to absorb losses as they arise, there can be no assurance that (i) the Company will not sustain losses in any given period which could be substantial in relation to the size of the allowance for loan losses, (ii) the Company’s level of nonperforming loans will not increase, (iii) the Company will not be required to make significant additional provisions to its allowance for loan losses, or (iv) the level of net charge-offs will not increase and possibly exceed applicable reserves.
The following table presents the allocation of the allowance for loan losses as of the dates indicated. Notwithstanding these allocations, the entire allowance for loan losses is available to absorb charge-offs in any category of loans.
| | | | | | | | | | | | | | | | | | | | | | | | | | |
| | | December 31, 2007 | | | December 31, 2006 | | | December 31, 2005 | | | December 31, 2004 | | | December 31, 2003 | |
| | | Allowance
for loan
losses | | Percent of
loans in each
category to
total loans | | | Allowance
for loan
losses | | Percent of
loans in each
category to
total loans | | | Allowance
for loan
losses | | Percent of
loans in each
category to
total loans | | | Allowance
for loan
losses | | Percent of
loans in each
category to
total loans | | | Allowance
for loan
losses | | Percent of
loans in each
category to
total loans | |
Real estate loans: | | | | | | | | | | | | | | | | | | | | | | | | | | |
Residential | | $ | 57 | | 32.21 | % | | 17 | | 24.72 | % | | 75 | | 30.58 | % | | 20 | | 32.69 | % | | 71 | | 34.96 | % |
Other | | | 970 | | 39.25 | % | | 282 | | 36.75 | % | | 173 | | 28.99 | % | | 107 | | 27.34 | % | | 366 | | 23.21 | % |
Loans to individuals for households, family and other consumer expenditures | | | 416 | | 19.96 | % | | 502 | | 22.09 | % | | 417 | | 24.25 | % | | 333 | | 25.84 | % | | 333 | | 29.68 | % |
Commercial and industrial loans | | | 226 | | 8.48 | % | | 509 | | 16.22 | % | | 730 | | 15.66 | % | | 951 | | 13.52 | % | | 727 | | 11.79 | % |
All other loans | | | — | | 0.10 | % | | — | | 0.22 | % | | — | | 0.52 | % | | 43 | | 0.61 | % | | — | | 0.36 | % |
Unallocated | | | 51 | | — | | | 460 | | — | | | 113 | | — | | | 48 | | — | | | 31 | | — | |
| | | | | | | | | | | | | | | | | | | | | | | | | | |
Totals | | $ | 1,720 | | 100.00 | % | | 1,770 | | 100.00 | % | | 1,508 | | 100.00 | % | | 1,502 | | 100.00 | % | | 1,528 | | 100.00 | % |
| | | | | | | | | | | | | | | | | | | | | | | | | | |
21
While consumer related charge-offs represent a majority of total charge-offs over the last three years, they are of a low dollar amount on an individual loan basis. Commercial loans on the other hand, though few in terms of the number of charge-offs over the past two years, have the potential to greatly impact the allowance if a particular loan defaults. The Bank’s loan review team uses the principles of Statement of Financial Accounting Standard (SFAS) No. 5,Accounting for Contingencies and SFAS No. 114,Accounting by Creditors for Impairment of a Loan, an amendment of FASB Statements No. 5 and 15, when determining the allowance for loan losses between loan categories. The determination of a loan category’s allowance is based on the probability of a loan’s default and the probability of loss in the event of a default.
Credit Risk Management
The risk of nonpayment of loans is an inherent aspect of commercial banking. The degree of perceived risk is taken into account in establishing the structure of, and interest rates and security for, specific loans and various types of loans. The Company strives to minimize its credit risk exposure by its credit underwriting standards and loan policies and procedures. Management continually evaluates the credit risks of such loans and believes it has provided adequately for the credit risks associated with these loans. The Company has implemented and expects to continue to implement and update new policies and procedures to maintain its credit risk management systems.
Bank Premises and Equipment
Bank premises and equipment decreased 0.84% in 2007 compared to a decrease of 2.64% in 2006 due to depreciation and no major expenditures on new facilities or facility upgrades in 2007. The Company is leasing the Timberlake and temporary Amherst branch facilities that opened in 2006. The permanent Amherst facility is scheduled to open in March 2008. In early 2008, the Company began leasing a building in the Wyndhurst section of Lynchburg for administrative and training purposes.
Deposits
Average deposits were $241,571 for the year ended December 31, 2007, an increase of $25,712 or 11.91% from $215,859 of average deposits for the year ended December 31, 2006. As of December 31, 2007, total deposits were $251,866 representing an increase of $21,049 or 9.12% from $230,817 in total deposits as of December 31, 2006. The change in deposits during 2007 was primarily due to changes in previously existing accounts and new accounts opened as a result of relationship changes, new locations, pricing and products offered in 2007.
For the year ended December 31, 2007, average noninterest-bearing demand deposits were $24,631 or 10.20% of average deposits. For the year ended December 31, 2006, average noninterest-bearing demand deposits were $22,008 or 10.20% of average deposits. Average interest-bearing deposits were $216,940 for the year ended December 31, 2007, representing an increase of $23,089 or 11.91% over the $193,851 in average interest-bearing deposits for the year ended December 31, 2006.
The levels of noninterest-bearing demand deposits (including retail accounts) are influenced by such factors as customer service, service charges and the availability of banking services. No assurance can be given that the Company will be able to maintain its current level of noninterest-bearing deposits. Competition from other banks and thrift institutions as well as money market funds, some of which offer interest rates substantially higher than the Company, makes it difficult for the Company to maintain the current level of noninterest-bearing deposits. Management continually works to implement pricing and marketing strategies designed to control the cost of interest-bearing deposits and to maintain a stable deposit mix.
22
The following table presents the Company’s average deposits and the average rate paid for each category of deposits for the periods indicated.
AVERAGE DEPOSIT INFORMATION
| | | | | | | | | | | | | | | | |
| | | Year ended
December 31, 2007 | | | Year ended
December 31, 2006 | | | Year ended
December 31, 2005 | |
| | | Average
amount of
deposits(1) | | Average
rate
paid | | | Average
amount of
deposits(1) | | Average
rate
paid | | | Average
amount of
deposits(1) | | Average
rate
paid | |
Noninterest-bearing demand deposits | | $ | 24,631 | | N/A | | | 22,008 | | N/A | | | 21,169 | | N/A | |
Interest-bearing demand deposits | | | 43,056 | | 2.47 | % | | 34,436 | | 2.77 | % | | 28,218 | | 1.12 | % |
Savings deposits | | | 30,115 | | 1.13 | % | | 32,230 | | 0.45 | % | | 35,156 | | 0.55 | % |
Time deposits: | | | | | | | | | | | | | | | | |
Under $100,000 | | | 104,532 | | 4.99 | % | | 91,158 | | 4.51 | % | | 86,010 | | 3.66 | % |
$100,000 and over | | | 39,237 | | 3.96 | % | | 36,027 | | 3.48 | % | | 30,885 | | 3.16 | % |
| | | | | | | | | | | | | | | | |
Total average time deposits | | | 143,769 | | | | | 127,185 | | | | | 116,895 | | | |
| | | | | | | | | | | | | | | | |
Total average deposits | | $ | 241,571 | | | | | 215,859 | | | | | 201,438 | | | |
| | | | | | | | | | | | | | | | |
| (1) | Averages are daily averages. |
The following table presents the maturity schedule of time certificates of deposit of $100,000 and over and other time deposits of $100,000 and over as of December 31, 2007.
TIME DEPOSITS OF $100,000 AND OVER
| | | | | | | |
| | | Certificates of
deposit | | Other time
deposits | | Total |
Three months or less | | $ | 3,944 | | 542 | | 4,486 |
Over three through six months | | | 2,462 | | 1,161 | | 3,623 |
Over six through 12 months | | | 13,724 | | 3,200 | | 16,924 |
Over 12 months | | | 11,093 | | 3,802 | | 14,895 |
| | | | | | | |
Total time deposits of $100,000 and over | | $ | 31,223 | | 8,705 | | 39,928 |
| | | | | | | |
Financial Ratios
The following table presents certain financial ratios for the periods indicated.
RETURN ON EQUITY AND ASSETS
| | | | | | | | | |
| | | Years ended December 31, | |
| | | 2007 | | | 2006 | | | 2005 | |
Return on average assets | | 0.97 | % | | 1.00 | % | | 0.94 | % |
Return on average equity | | 10.17 | % | | 10.10 | % | | 9.29 | % |
Dividend payout ratio | | 34.12 | % | | 33.25 | % | | 33.93 | % |
Average equity to average assets | | 9.51 | % | | 9.91 | % | | 10.07 | % |
Capital Resources
The Company’s financial position at December 31, 2007 reflects liquidity and capital levels currently adequate to fund anticipated future business expansion. Capital ratios are well in excess of required regulatory minimums for a “well-capitalized” institution. The assessment of capital adequacy depends on a number of factors such as asset quality, liquidity, earnings performance, and changing competitive conditions and economic forces. The adequacy of the Company’s capital is reviewed by management on an ongoing basis. Management seeks to maintain a capital structure that will assure an adequate level of capital to support anticipated asset growth and to absorb potential losses.
23
The Company’s capital position continues to exceed regulatory requirements. The primary indicators relied on by bank regulators in measuring the capital position are the Tier 1 capital, total risk-based capital and leverage ratios. Tier 1 capital consists generally of common and qualifying preferred stockholders’ equity less goodwill. Total capital generally consists of Tier 1 capital, qualifying subordinated debt and a portion of the allowance for loan losses. Risk-based capital ratios are calculated with reference to risk-weighted assets. The Company’s Tier 1 capital ratio was 10.55% at December 31, 2007 and 9.92% at December 31, 2006. The total capital ratio was 11.24% at December 31, 2007 and 10.64% at December 31, 2006.
These ratios exceed the mandated minimum requirements of 4% and 8%, respectively. As of December 31, 2007 and 2006, the Company met all regulatory capital ratio requirements and was considered “well capitalized” in accordance with FDICIA.
Stockholders’ equity reached $26,816 at December 31, 2007 compared to $24,492 at December 31, 2006. The leverage ratio consists of Tier 1 capital divided by quarterly average assets. At December 31, 2007, the Company’s leverage ratio was 9.54% compared to 9.80% at December 31, 2006. Each of these exceeds the required minimum leverage ratio of 4%. The dividend payout ratio was 34.12% and 33.25% in 2007 and 2006, respectively. During 2007, the Company paid dividends of $0.60 per share, up 9.09% from $0.55 per share paid in 2006.
Off-Balance Sheet Arrangements
The Company did not use any financial derivatives during 2007 and 2006. However, the Company has off-balance sheet arrangements that may have a material effect on the results of operations in the future. The Company, in the normal course of business, may at times be a party to financial instruments such as standby letters of credit. Standby letters of credit as of December 31, 2007 equaled $875 compared with $2,014 as of December 31, 2006. Other commitments include commitments to lend money. Not all of these commitments will be acted upon; therefore, the cash requirements will likely be significantly less than the commitments themselves. As of December 31, 2007, the Company had unused loan commitments of $45,762 including $34,496 in unused commitments with an original maturity exceeding one year compared with $60,883 including $50,393 in unused commitments with an original maturity exceeding one year as of December 31, 2006. See Note 9 of the Notes to Consolidated Financial Statements.
Critical Accounting Policies
The reporting policies of the Company are in accordance with U.S. generally accepted accounting principles. Certain critical accounting policies affect the more significant judgments and estimates used in the preparation of the consolidated financial statements. The Company’s single most critical accounting policy relates to the Company’s allowance for loan losses, which reflects the estimated losses resulting from the inability of the Company’s borrowers to make required loan payments. If the financial condition of the Company’s borrowers were to deteriorate, resulting in an impairment of their ability to make payments, the Company’s estimates would be updated, and additional provisions for loan losses may be required. Further discussion of the estimates used in determining the allowance for loan losses is contained in the discussion on “Allowance for Loan Losses” on page 19 and “Loans and Allowance for Loan Losses” in Note 1 of the Notes to Consolidated Financial Statements.
24
Impact of Recently Issued Accounting Standards
In February 2006, the Financial Accounting Standards Board (the FASB) issued SFAS No. 155,Accounting for Certain Hybrid Financial Instruments, an amendment of FASB Statements No. 133 and 140. This Statement amends SFAS No. 133,Accounting for Derivative Instruments and Hedging Activities,and SFAS No. 140, Accounting for Transfers and Servicing of Financial Assets and Extinguishments of Liabilitiesand resolves issues in Statement No. 133 Implementation Issue D1, Application of Statement 133 to Beneficial Interests in Securitized Financial Assets. The provisions of this Statement are effective for all financial instruments acquired or issued after the beginning of an entity’s first fiscal year that begins after September 15, 2006. The adoption of SFAS No. 155 did not have a material impact on the consolidated financial statements of the Company.
In March 2006, the FASB issued SFAS No. 156, Accounting for Servicing of Financial Assets, an amendment of FASB Statement No. 140.This Statement amends SFAS No. 140, Accounting for Transfers and Servicing of Financial Assets and Extinguishments of Liabilities, a replacement of FASB Statement 125with respect to the accounting for separately recognized servicing assets and servicing liabilities. The provisions of this Statement are effective for fiscal years beginning after September 15, 2006. The adoption of SFAS No. 156 did not have a material impact on the consolidated financial statements of the Company.
In September 2006, the FASB issued SFAS No. 158,Employers’ Accounting for Defined Benefit Pension and Other Postretirement Plans – an amendment of FASB Statements No. 87, 88, 106, and 132(R).SFAS No. 158 and its impact on the Company are discussed in Note 1(k) of the Notes to Consolidated Financial Statements.
In September 2006, the FASB issued SFAS No. 157,Fair Value Measurements, which establishes a framework for measuring fair value in generally accepted accounting principles and expands disclosures about fair value measurements. SFAS No. 157 defines fair value as the price that would be received to sell an asset or paid to transfer a liability in an orderly transaction between market participants at the measurement date. SFAS No. 157 is effective for financial statements issued for fiscal years beginning after November 15, 2007, and interim periods within those fiscal years. The Company does not expect the adoption of this new standard to have a material effect on the Company’s consolidated results of operations or consolidated financial position.
In June 2006, the FASB issued FASB Interpretation No. 48 (FIN 48),Accounting for Uncertainty in Income Taxes—an interpretation of FASB Statement No. 109, which establishes that the financial statement effects of a tax position taken or expected to be taken in a tax return are to be recognized in the financial statements when it is more likely than not, based on the technical merits, that the position will be sustained upon examination. FIN 48 was adopted January 1 2007. The adoption of this new standard did not have a material effect on the Company’s consolidated results of operations or consolidated financial position.
25
PINNACLE BANKSHARES CORPORATION AND SUBSIDIARY
CONSOLIDATED BALANCE SHEETS
December 31, 2007 and 2006
(In thousands of dollars, except share data)
| | | | | | | | |
| | | 2007 | | | 2006 | |
Assets | | | | | | | | |
Cash and cash equivalents (note 2): | | | | | | | | |
Cash and due from banks | | $ | 6,782 | | | $ | 5,948 | |
Federal funds sold | | | 11,562 | | | | 8,638 | |
| | | | | | | | |
Total cash and cash equivalents | | | 18,344 | | | | 14,586 | |
| | |
Securities (note 3): | | | | | | | | |
Available-for-sale, at fair value | | | 15,460 | | | | 19,221 | |
Held-to-maturity, at amortized cost | | | 4,175 | | | | 5,645 | |
Federal Reserve Bank stock, at cost (note 1(c)) | | | 75 | | | | 75 | |
Federal Home Loan Bank stock, at cost (note 1(c)) | | | 476 | | | | 481 | |
Loans, net (notes 4, 9 and 10) | | | 232,752 | | | | 207,861 | |
Bank premises and equipment, net (note 5) | | | 5,220 | | | | 5,264 | |
Accrued interest receivable | | | 1,328 | | | | 1,250 | |
Other assets (notes 7, 8 and 15) | | | 2,083 | | | | 2,038 | |
| | | | | | | | |
Total assets | | $ | 279,913 | | | $ | 256,421 | |
| | | | | | | | |
Liabilities and Stockholders’ Equity | | | | | | | | |
Liabilities: | | | | | | | | |
Deposits (note 6): | | | | | | | | |
Demand | | $ | 27,244 | | | $ | 23,631 | |
Savings and NOW accounts | | | 74,870 | | | | 69,798 | |
Time | | | 149,752 | | | | 137,388 | |
| | | | | | | | |
Total deposits | | | 251,866 | | | | 230,817 | |
| | | | | | | | |
Note payable to Federal Home Loan Bank (note 1(d)) | | | — | | | | 100 | |
Accrued interest payable | | | 861 | | | | 764 | |
Other liabilities (note 7) | | | 370 | | | | 248 | |
| | | | | | | | |
Total liabilities | | | 253,097 | | | | 231,929 | |
| | | | | | | | |
Stockholders’ equity (notes 11 and 14): | | | | | | | | |
Common stock, $3 par value. Authorized 3,000,000 shares, issued and outstanding 1,485,089 shares in 2007 and 1,459,589 shares in 2006 | | | 4,455 | | | | 4,379 | |
Capital surplus | | | 787 | | | | 605 | |
Retained earnings | | | 21,685 | | | | 19,972 | |
Accumulated other comprehensive income (loss), net | | | (111 | ) | | | (464 | ) |
| | | | | | | | |
Total stockholders’ equity | | | 26,816 | | | | 24,492 | |
| | | | | | | | |
Commitments, contingencies and other matters (notes 9, 10 and 11) | | | | | | | | |
| | |
Total liabilities and stockholders’ equity | | $ | 279,913 | | | $ | 256,421 | |
| | | | | | | | |
See accompanying notes to consolidated financial statements.
26
PINNACLE BANKSHARES CORPORATION AND SUBSIDIARY
CONSOLIDATED STATEMENTS OF INCOME
Years ended December 31, 2007, 2006 and 2005
(In thousands of dollars, except per share data)
| | | | | | | | | |
| | | 2007 | | 2006 | | 2005 |
Interest income: | | | | | | | | | |
Interest and fees on loans | | $ | 16,748 | | $ | 13,979 | | $ | 10,847 |
Interest on securities: | | | | | | | | | |
U.S. Government agencies | | | 379 | | | 469 | | | 455 |
Corporate | | | 150 | | | 215 | | | 401 |
States and political subdivisions (taxable) | | | 235 | | | 272 | | | 292 |
States and political subdivisions (tax-exempt) | | | 255 | | | 277 | | | 382 |
Other | | | 38 | | | 37 | | | 30 |
Interest on federal funds sold | | | 554 | | | 368 | | | 263 |
| | | | | | | | | |
Total interest income | | | 18,359 | | | 15,617 | | | 12,670 |
| | | | | | | | | |
Interest expense: | | | | | | | | | |
Interest on deposits: | | | | | | | | | |
Savings and NOW accounts | | | 1,403 | | | 1,048 | | | 549 |
Time—under $100,000 | | | 5,220 | | | 4,113 | | | 3,144 |
Time—$100,000 and over | | | 1,551 | | | 1,254 | | | 975 |
Other interest expense | | | 4 | | | 10 | | | 19 |
| | | | | | | | | |
Total interest expense | | | 8,178 | | | 6,425 | | | 4,687 |
| | | | | | | | | |
Net interest income | | | 10,181 | | | 9,192 | | | 7,983 |
Provision for loan losses (note 4) | | | 462 | | | 339 | | | 230 |
| | | | | | | | | |
Net interest income after provision for loan losses | | | 9,719 | | | 8,853 | | | 7,753 |
Noninterest income: | | | | | | | | | |
Service charges on deposit accounts | | | 1,412 | | | 1,357 | | | 1,293 |
Net realized gain on securities | | | — | | | — | | | 2 |
Commissions and fees | | | 417 | | | 378 | | | 332 |
Mortgage loan fees | | | 204 | | | 234 | | | 265 |
Service charges on loan accounts | | | 292 | | | 254 | | | 218 |
Other operating income | | | 307 | | | 277 | | | 286 |
| | | | | | | | | |
Total noninterest income | | | 2,632 | | | 2,500 | | | 2,396 |
| | | | | | | | | |
Noninterest expense: | | | | | | | | | |
Salaries and employee benefits (note 7) | | | 4,813 | | | 4,540 | | | 4,134 |
Occupancy expense | | | 454 | | | 429 | | | 380 |
Furniture and equipment | | | 891 | | | 784 | | | 739 |
Office supplies and printing | | | 226 | | | 212 | | | 178 |
Capital stock tax | | | 191 | | | 181 | | | 180 |
Advertising expense | | | 115 | | | 121 | | | 105 |
Other operating expenses | | | 1,834 | | | 1,558 | | | 1,450 |
| | | | | | | | | |
Total noninterest expense | | | 8,524 | | | 7,825 | | | 7,166 |
| | | | | | | | | |
Income before income tax expense | | | 3,827 | | | 3,528 | | | 2,983 |
Income tax expense (note 8) | | | 1,227 | | | 1,116 | | | 876 |
| | | | | | | | | |
Net income | | $ | 2,600 | | $ | 2,412 | | $ | 2,107 |
| | | | | | | | | |
Basic net income per share (note 1(o)) | | $ | 1.76 | | $ | 1.65 | | $ | 1.44 |
Diluted net income per share (note1(o)) | | $ | 1.75 | | $ | 1.64 | | $ | 1.43 |
| | | | | | | | | |
See accompanying notes to consolidated financial statements.
27
PINNACLE BANKSHARES CORPORATION AND SUBSIDIARY
Consolidated Statements of Changes in Stockholders’ Equity and Comprehensive Income
Years ended December 31, 2007, 2006 and 2005
(In thousands, except share and per share data)
| | | | | | | | | | | | | | | | | | | | |
| | | Common Stock | | Capital
Surplus | | Retained
Earnings | | | Accumulated
Other
Comprehensive
Income (Loss) | | | Total | |
| | | Shares | | Par Value | | | | |
Balances, December 31, 2004 | | 1,457,406 | | $ | 4,372 | | $ | 562 | | $ | 16,970 | | | $ | 303 | | | $ | 22,207 | |
Net income | | — | | | — | | | — | | | 2,107 | | | | — | | | | 2,107 | |
Change in net unrealized gains on available-for-sale securities, net of deferred taxes of $208 | | — | | | — | | | — | | | — | | | | (406 | ) | | | (406 | ) |
| | | | | | | | | | | | | | | | | | | | |
Comprehensive income | | | | | | | | | | | | | | | | | | | 1,701 | |
Cash dividends declared by Bankshares ($0.49 per share) | | — | | | — | | | — | | | (715 | ) | | | — | | | | (715 | ) |
Issuance of common stock, stock option exercise | | 1,300 | | | 4 | | | 15 | | | — | | | | — | | | | 19 | |
| | | | | | | | | | | | | | | | | | | | |
Balances, December 31, 2005 | | 1,458,706 | | $ | 4,376 | | $ | 577 | | $ | 18,362 | | | $ | (103 | ) | | $ | 23,212 | |
| | | | | | | | | | | | | | | | | | | | |
Net income | | — | | | — | | | — | | | 2,412 | | | | — | | | | 2,412 | |
Change in net unrealized gains on available-for-sale securities, net of deferred taxes of $2 | | — | | | — | | | — | | | — | | | | (4 | ) | | | (4 | ) |
Adjustment to initially apply FASB Statement No. 158, net of tax of $183 | | | | | | | | | | | | | | | (357 | ) | | | (357 | ) |
| | | | | | | | | | | | | | | | | | | | |
Comprehensive income | | | | | | | | | | | | | | | | | | | 2,051 | |
Cash dividends declared by Bankshares ($0.55 per share) | | — | | | — | | | — | | | (802 | ) | | | — | | | | (802 | ) |
Issuance of common stock | | 883 | | | 3 | | | 19 | | | — | | | | — | | | | 22 | |
Stock option expense | | | | | — | | | 9 | | | — | | | | — | | | | 9 | |
| | | | | | | | | | | | | | | | | | | | |
Balances, December 31, 2006 | | 1,459,589 | | $ | 4,379 | | $ | 605 | | $ | 19,972 | | | $ | (464 | ) | | $ | 24,492 | |
| | | | | | | | | | | | | | | | | | | | |
Net income | | — | | | — | | | — | | | 2,600 | | | | — | | | | 2,600 | |
Change in net unrealized gains on available-for-sale securities, net of deferred tax benefit of $55 | | — | | | — | | | — | | | — | | | | 111 | | | | 111 | |
Adjustment to apply FASB Statement No. 158, net of tax of $124 | | | | | | | | | | | | | | | 242 | | | | 242 | |
| | | | | | | | | | | | | | | | | | | | |
Comprehensive income | | | | | | | | | | | | | | | | | | | 2,953 | |
Cash dividends declared by Bankshares ($0.60 per share) | | — | | | — | | | — | | | (887 | ) | | | — | | | | (887 | ) |
Issuance of common stock, stock option exercise | | 25,500 | | | 76 | | | 179 | | | — | | | | — | | | | 255 | |
Stock option expense | | | | | — | | | 3 | | | — | | | | — | | | | 3 | |
| | | | | | | | | | | | | | | | | | | | |
Balances, December 31, 2007 | | 1,485,089 | | $ | 4,455 | | $ | 787 | | $ | 21,685 | | | $ | (111 | ) | | $ | 26,816 | |
| | | | | | | | | | | | | | | | | | | | |
See accompanying notes to consolidated financial statements.
28
PINNACLE BANKSHARES CORPORATION AND SUBSIDIARY
CONSOLIDATED STATEMENTS OF CASH FLOWS
Years ended December 31, 2007, 2006 and 2005
(In thousands of dollars)
| | | | | | | | | | | | |
| | | 2007 | | | 2006 | | | 2005 | |
Cash flows from operating activities: | | | | | | | | | | | | |
Net income | | $ | 2,600 | | | $ | 2,412 | | | $ | 2,107 | |
Adjustments to reconcile net income to net cash provided by operating activities: | | | | | | | | | | | | |
Depreciation of bank premises and equipment | | | 413 | | | | 435 | | | | 473 | |
Amortization of intangible assets | | | — | | | | 3 | | | | 11 | |
Accretion (amortization) of unearned fees, net | | | (23 | ) | | | (53 | ) | | | 45 | |
Net amortization of premiums and discounts on securities | | | 7 | | | | 12 | | | | 30 | |
Provision for loan losses | | | 462 | | | | 339 | | | | 230 | |
Provision for deferred income taxes | | | (142 | ) | | | 161 | | | | 184 | |
Accrual of stock option vesting | | | 3 | | | | 9 | | | | — | |
Originations of mortgage loans held for sale | | | — | | | | (9,751 | ) | | | (13,552 | ) |
Sales of mortgage loans held for sale | | | — | | | | 10,208 | | | | 13,095 | |
Net realized gain on securities | | | — | | | | — | | | | (2 | ) |
Net decrease (increase) in: | | | | | | | | | | | | |
Accrued income receivable | | | (78 | ) | | | (175 | ) | | | (129 | ) |
Other assets | | | 70 | | | | (22 | ) | | | 54 | |
Net increase (decrease) in: | | | | | | | | | | | | |
Accrued interest payable | | | 97 | | | | 188 | | | | 119 | |
Other liabilities | | | 364 | | | | (548 | ) | | | 46 | |
| | | | | | | | | | | | |
Net cash provided by operating activities | | | 3,773 | | | | 3,218 | | | | 2,711 | |
| | | | | | | | | | | | |
Cash flows from investing activities: | | | | | | | | | | | | |
Purchases of held-to maturity securities | | | (249 | ) | | | — | | | | (500 | ) |
Purchases of available-for sale securities | | | — | | | | (1,503 | ) | | | (2,989 | ) |
Purchases of available-for sale-mortgage backed securities | | | — | | | | (500 | ) | | | (525 | ) |
Proceeds from maturities and calls of held-to-maturity securities | | | 1,470 | | | | 1,265 | | | | 1,427 | |
Proceeds from maturities and calls of available-for-sale securities | | | 3,387 | | | | 4,044 | | | | 5,248 | |
Proceeds from paydowns and maturities of available-for-sale mortgage-backed securities | | | 769 | | | | 1,071 | | | | 1,660 | |
Sale (purchase) of Federal Home Loan Bank stock | | | 5 | | | | (27 | ) | | | (27 | ) |
Collections on loan participations | | | 326 | | | | 493 | | | | 751 | |
Net increase in loans made to customers | | | (25,805 | ) | | | (27,815 | ) | | | (23,027 | ) |
Recoveries on loans charged off | | | 134 | | | | 129 | | | | 156 | |
Purchases of bank premises and equipment | | | (369 | ) | | | (292 | ) | | | (218 | ) |
| | | | | | | | | | | | |
Net cash used in investing activities | | | (20,332 | ) | | | (23,135 | ) | | | (18,044 | ) |
| | | | | | | | | | | | |
Continued
29
PINNACLE BANKSHARES CORPORATION AND SUBSIDIARY
CONSOLIDATED STATEMENTS OF CASH FLOWS
Years ended December 31, 2007, 2006 and 2005
(In thousands of dollars)
| | | | | | | | | | | | |
Cash flows from financing activities: | | | | | | | | | | | | |
Net increase in demand, savings and NOW deposits | | $ | 8,685 | | | $ | 6,854 | | | $ | 7,002 | |
Net increase in time deposits | | | 12,364 | | | | 14,717 | | | | 5,605 | |
Repayments of note payable to Federal Home Loan Bank | | | (100 | ) | | | (100 | ) | | | (100 | ) |
Proceeds from issuance of common stock | | | 255 | | | | 20 | | | | 19 | |
Cash dividends paid | | | (887 | ) | | | (802 | ) | | | (715 | ) |
| | | | | | | | | | | | |
Net cash provided by financing activities | | | 20,317 | | | | 20,689 | | | | 11,811 | |
| | | | | | | | | | | | |
Net increase (decrease) in cash and cash equivalents | | | 3,758 | | | | 772 | | | | (3,522 | ) |
Cash and cash equivalents, beginning of period | | | 14,586 | | | | 13,814 | | | | 17,336 | |
| | | | | | | | | | | | |
Cash and cash equivalents, end of period | | $ | 18,344 | | | $ | 14,586 | | | $ | 13,814 | |
| | | | | | | | | | | | |
Supplemental disclosure of cash flows information | | | | | | | | | | | | |
Cash paid during the year for: | | | | | | | | | | | | |
Income taxes | | $ | 1,019 | | | $ | 900 | | | $ | 688 | |
Interest | | | 8,106 | | | | 6,237 | | | | 4,568 | |
Supplemental schedule of noncash investing and financing activities: | | | | | | | | | | | | |
Transfer of loans to repossessed properties | | $ | 59 | | | $ | 81 | | | $ | 120 | |
Loans charged against the allowance for loan losses | | | 646 | | | | 206 | | | | 380 | |
Unrealized gains (losses) on available-for-sale securities | | | 152 | | | | (6 | ) | | | (614 | ) |
FASB Statement No. 158 Adjustment | | | 366 | | | | (540 | ) | | | — | |
See accompanying notes to consolidated financial statements.
30
PINNACLE BANKSHARES CORPORATION
AND SUBSIDIARY
Notes to Consolidated Financial Statements
(In thousands, except ratios, share and per share data)
| (1) | Summary of Significant Accounting Policies and Practices |
Pinnacle Bankshares Corporation, a Virginia corporation (Bankshares), was organized in 1997 and is registered as a bank holding company under the Bank Holding Company Act of 1956, as amended. Bankshares is headquartered in Altavista, Virginia. Bankshares conducts all of its business activities through the branch offices of its wholly owned subsidiary bank, The First National Bank of Altavista (the Bank). Bankshares exists primarily for the purpose of holding the stock of its subsidiary, the Bank, and of such other subsidiaries as it may acquire or establish. The Company has a single reportable segment for purposes of segment reporting.
The accounting and reporting policies of Bankshares and its wholly owned subsidiary (collectively, the Company), conform to accounting principles generally accepted in the United States of America and general practices within the banking industry. The following is a summary of the more significant accounting policies and practices:
The consolidated financial statements include the accounts of Bankshares and the Bank. All material intercompany balances and transactions have been eliminated.
The Bank classifies its securities in three categories: (1) debt securities that the Bank has the positive intent and ability to hold to maturity are classified as “held-to-maturity securities” and reported at amortized cost; (2) debt and equity securities that are bought and held principally for the purpose of selling them in the near term are classified as “trading securities” and reported at fair value, with unrealized gains and losses included in net income; and (3) debt and equity securities not classified as either held-to-maturity securities or trading securities are classified as “available-for-sale securities” and reported at fair value, with unrealized gains and losses excluded from net income and reported in accumulated other comprehensive income, a separate component of stockholders’ equity net of deferred taxes. Fair value is determined from quoted prices obtained from FT (Financial Times) Interactive Data in cooperation with Compass Bank, the Company’s third–party bond accountant. Held-to-maturity securities are stated at cost, adjusted for amortization of premiums and accretion of discounts on a basis, which approximates the level yield method. The Bank does not maintain trading securities. Gains or losses on disposition are based on the net proceeds and adjusted carrying values of the securities called or sold, using the specific identification method on a trade date basis. If a decline below cost in the market value of any available-for-sale or held-to-maturity security is deemed other than temporary, the decline is charged to net income, resulting in the establishment of a new cost basis for the security.
As a member of the Federal Reserve Bank (FRB) and the Federal Home Loan Bank (FHLB) of Atlanta, the Bank is required to maintain certain minimum investments in the common stock of the FRB and FHLB, which are carried at cost. Required levels of investment are based upon the Bank’s capital and a percentage of qualifying assets.
In addition, the Bank is eligible to borrow from the FHLB with borrowings collateralized by qualifying assets, primarily residential mortgage loans, and the Bank’s capital stock investment in the FHLB.
31
At December 31, 2007, the Bank’s available borrowing limit was approximately $36,320. The Bank had $0 and $100 in borrowings outstanding at December 31, 2007 and 2006, respectively. The note payable to the FHLB was paid off in December 2007 and had an interest rate of 6.13%.
| | (e) | Loans and Allowance for Loan Losses |
Loans are stated at the amount of unpaid principal, reduced by unearned income and fees on loans, and an allowance for loan losses. Income is recognized over the terms of the loans using methods that approximate the level yield method. The allowance for loan losses is a cumulative valuation allowance consisting of an annual provision for loan losses, plus any amounts recovered on loans previously charged off, minus loans charged off. The provision for loan losses charged to operating expenses is the amount necessary in management’s judgment to maintain the allowance for loan losses at a level it believes sufficient to cover losses in the collection of the Bank’s loans. Management determines the adequacy of the allowance based upon reviews of individual credits, recent loss experience, delinquencies, current economic conditions, the risk characteristics of the various categories of loans and other pertinent factors. Loans are charged against the allowance for loan losses when management believes the collectability of the principal is unlikely. While management uses available information to recognize losses on loans, future additions to the allowance for loan losses may be necessary based on changes in economic conditions. It is reasonably possible that management’s estimate of loan losses and the related allowance may change materially in the near term. However, the amount of change that is reasonably possible cannot be estimated. In addition, various regulatory agencies, as an integral part of their examination process, periodically review the Bank’s allowance for loan losses. Such agencies may require the Bank to recognize additions to the allowance for loan losses based on their judgments about information available to them at the time of their examinations.
Loans are charged against the allowance when, in management’s opinion, they are deemed uncollectible, although the Bank continues to aggressively pursue collection. The Company considers a number of factors to determine the need for and timing of charge-offs including the following: whenever any commercial transaction becomes past due for 120 days for any scheduled principal or interest payment and collection is considered unlikely; whenever foreclosure on real estate collateral or liquidation of other collateral does not result in full payment of the obligation and the deficiency or some portion thereof is deemed uncollectible, the uncollectible portion shall be charged-off; whenever any installment loan becomes past due for 120 days and collection is considered unlikely; whenever a bankruptcy notice is received on any installment loan and review of the facts results in an assessment that all or most of the balance will not be collected, the loan will be placed in non-accrual status; whenever a bankruptcy notice is received on a small, unsecured, revolving installment account; and whenever any other small, unsecured, revolving installment account becomes past due for 180 days.
Interest related to non-accrual loans is recognized on the cash basis. Loans are generally placed in non-accrual status when the collection of principal and interest is 90 days or more past due, unless the obligation relates to a consumer or residential real estate loan or is both well-secured and in the process of collection.
Impaired loans are required to be presented in the financial statements at the present value of the expected future cash flows or at the fair value of the loan’s collateral. Homogeneous loans such as real estate mortgage loans, individual consumer loans, home equity loans and bankcard loans are evaluated collectively for impairment. Management, considering current information and events regarding the borrower’s ability to repay their obligations, considers a loan to be impaired when it is probable that the Bank will be unable to collect all amounts due according to the contractual terms of the loan agreement. Impairment losses are included in the allowance for loan losses through a charge to the provision for loan losses. Cash receipts on impaired loans receivable are applied first to reduce interest on such loans to the extent of interest contractually due and any remaining amounts are applied to principal.
32
| | (f) | Loan Origination and Commitment Fees and Certain Related Direct Costs |
Loan origination and commitment fees and certain direct loan origination costs charged by the Bank are deferred and the net amount amortized as an adjustment of the related loan’s yield. The Bank amortizes these net amounts over the contractual life of the related loans or, in the case of demand loans, over the estimated life. Fees related to standby letters of credit are recognized over the commitment period.
| | (g) | Bank Premises and Equipment |
Bank premises and equipment are stated at cost, net of accumulated depreciation. Depreciation is computed by the straight-line and declining-balance methods over the estimated useful lives of the assets. Depreciable lives include 15 years for land improvements, 40 years for buildings, and 3 to 7 years for equipment, furniture and fixtures. The cost of assets retired and sold and the related accumulated depreciation are eliminated from the accounts and the resulting gains or losses are included in determining net income. Expenditures for maintenance and repairs are charged to expense as incurred, and improvements and betterments are capitalized.
Foreclosed properties consist of properties acquired through foreclosure or deed in lieu of foreclosure. These properties are carried at the lower of cost or fair value less estimated costs to sell. Losses from the acquisition of property in full or partial satisfaction of loans are charged against the allowance for loan losses. Subsequent write-downs, if any, are charged to expense. Gains and losses on the sales of foreclosed properties are included in determining net income in the year of the sale.
| | (i) | Impairment or Disposal of Long-Lived Assets |
The Company’s long-lived assets are reviewed for impairment whenever events or changes in circumstances indicate that the carrying amount of an asset may not be recoverable. Recoverability of assets to be held and used, such as bank premises and equipment, is measured by a comparison of the carrying amount of an asset to future net cash flows expected to be generated by the asset. If the carrying amount of an asset exceeds its estimated future cash flows, an impairment charge is recognized in the amount by which the carrying amount of the asset exceeds the fair value of the asset. Assets to be disposed of, such as foreclosed properties, are reported at the lower of the carrying amount or fair value less costs to sell.
| | (j) | Sale of Bankers Investments Group, LLC |
In December 2007, Bankers Investments Group, LLC, in which the Bank is a member, entered into a merger agreement with Infinex Financial Group. The merger is expected to be completed in March 2008. Based upon the approved terms of the merger, the Bank recognized a permanent impairment loss in its investment in Bankers Investments Group, LLC of $83 in December 2007. This amount is included in other operating expenses.
The Bank maintains a noncontributory defined benefit pension plan, which covers substantially all of its employees. The net periodic pension expense includes a service cost component, interest on the projected benefit obligation, a component reflecting the actual return on plan assets, the effect of deferring and amortizing certain actuarial gains and losses, and the amortization of any unrecognized net transition obligation on a straight-line basis over the average remaining service period of employees expected to receive benefits under the plan. The Bank’s funding policy is to make annual contributions in amounts necessary to satisfy the Internal Revenue Service’s funding standards, to the extent that they are tax deductible.
33
In September 2006, the FASB issued SFAS No. 158,Employers’ Accounting for Defined Benefit Pension and Other Postretirement Plans - an amendment of FASB Statements No. 87, 88, 106, and 132(R), which requires a business entity to recognize the overfunded or underfunded status of a single-employer defined benefit postretirement plan as an asset or liability in its statement of financial position and to recognize changes in that funded status in comprehensive income in the year in which the changes occur. SFAS 158 also requires a business entity to measure the funded status of a plan as of the date of its year-end statement of financial position, with limited exceptions. The recognition and disclosure provisions of SFAS 158 were adopted by the Bank beginning with the year ended December 31, 2006. The requirement to measure plan assets and benefit obligations as of the date of the Company’s fiscal year end statement of position will be adopted at December 31, 2008.
The Bank expenses advertising expenses as incurred.
Income taxes are accounted for under the asset and liability method, whereby deferred tax assets and liabilities are recognized for the future tax consequences attributable to differences between the financial statement carrying amounts of existing assets and liabilities and their respective tax bases. Deferred tax assets and liabilities are measured using enacted tax rates expected to apply to taxable income in the years in which those temporary differences are expected to be recovered or settled. The effect on deferred tax assets and liabilities of a change in tax rates is recognized in net income in the period that includes the enactment date.
Stock Based Compensation –In October 1995, the FASB issued SFAS No. 123,Accounting for Stock-Based Compensation, which encouraged companies to recognize expense for stock-based awards based on their estimated value on the date of grant. SFAS 123 permitted companies to account for stock-based compensation based on provisions prescribed in SFAS 123, or based on the authoritative guidance in Accounting Principles Board Opinion No. 25 (APB 25),Accounting for Stock Issued to Employees. The Company elected to account for its stock-based compensation in accordance with APB 25, which used the intrinsic value method; however, as required by SFAS 123, the Company disclosed the pro forma impact on the financial statements assuming the measurement provisions of SFAS 123 had been adopted.
In December 2004, the FASB issued SFAS No. 123R,Shared-Based Payment (SFAS 123R). SFAS 123R is a revision of SFAS No. 123,Accounting for Stock Based Compensation, supersedes APB Opinion No. 25 and amends FASB Statement No. 95,Statement of Cash Flows. SFAS 123R eliminated the ability to account for share-based compensation using APB Opinion No. 25 and requires that all share-based payments to employees, including grants of employee stock options, to be recognized as compensation in the financial statements using a fair value-based method.
SFAS 123R requires public companies to adopt the recognition requirements using either a “modified prospective” method or a “modified retrospective” method. Under the “modified prospective” method, compensation cost is recognized in the financial statements beginning with the effective date, based on the requirements of SFAS 123R for all shared-based payments granted after that date, and based on the requirements of SFAS 123R for all unvested awards granted prior to the effective date of SFAS 123R. Under the “modified retrospective” method, the requirements are the same as under the “modified prospective” method, but also permit entities to restate financial statements of previous periods based on pro forma disclosures made in accordance with SFAS 123.
34
The Company adopted SFAS 123R under the “modified prospective” method effective January 1, 2006, to recognize compensation expense for options that were issued but not yet vested as of January 1, 2006. In addition, options issued after January 1, 2006 will increase compensation expense for 2006 and afterward. Options that were issued prior to January 1, 2006 and vested during 2006 resulted in additional compensation expense of $3. There were no options granted in 2006 or 2007. Future levels of compensation cost recognized related to share-based compensation awards may be impacted by new awards and/or modification, repurchases and cancellations of existing awards after the adoption of this standard.
The following table illustrates the effect on net income and earnings per share if the Company had applied the fair value recognition provisions of SFAS 123 to options granted under the Company’s stock option plan. For the purposes of this pro forma disclosure, the value of the options is estimated using a Black-Scholes option-pricing formula and amortized to expense over the options’ vesting periods.
| | | | |
| | | 2005 | |
Net income, as reported | | | | |
Deduct: Total stock-based employee compensation | | $ | 2,107 | |
expense determined under SFAS No. 123, net of related tax effects | | | (9 | ) |
| | | | |
Pro forma net income | | $ | 2,098 | |
| | | | |
Basic net income per share: | | | | |
As reported | | $ | 1.44 | |
Pro forma | | | 1.44 | |
Diluted net income per share: | | | | |
As reported | | $ | 1.43 | |
Pro forma | | | 1.42 | |
The fair value of each option grant is estimated on the date of grant using the Black-Scholes option-pricing model with the following weighted average assumptions used: dividend yield of 4.00%, expected volatility of 27.30%, a risk-free interest rate of 4.63%, and expected lives of 7 years.
Basic net income per share excludes dilution and is computed by dividing income available to common stockholders by the weighted-average number of common shares outstanding for the period. Diluted net income per share reflects the potential dilution that could occur if securities or other contracts to issue common stock were exercised or converted into common stock or resulted in the issuance of common stock that then shared in the earnings of the Company.
35
The following is a reconciliation of the numerators and denominators of the basic and diluted net income per share computations for the periods indicated:
| | | | | | | | |
| Year ended December 31, 2007 | | Net income
(numerator) | | Shares
(denominator) | | Per share
amount |
Basic net income per share | | $ | 2,600 | | 1,479,689 | | $ | 1.76 |
| | | | | | | | |
Effect of dilutive stock options | | | — | | 9,688 | | | |
| | | | | | | | |
Diluted net income per share | | $ | 2,600 | | 1,489,377 | | $ | 1.75 |
| | | | | | | | |
| | | |
| Year ended December 31, 2006 | | Net income
(numerator) | | Shares
(denominator) | | Per share
amount |
Basic net income per share | | $ | 2,412 | | 1,459,007 | | $ | 1.65 |
| | | | | | | | |
Effect of dilutive stock options | | | — | | 12,799 | | | |
| | | | | | | | |
Diluted net income per share | | $ | 2,412 | | 1,471,806 | | $ | 1.64 |
| | | | | | | | |
| | | |
| Year ended December 31, 2005 | | Net income
(numerator) | | Shares
(denominator) | | Per share
amount |
Basic net income per share | | $ | 2,107 | | 1,458,615 | | $ | 1.44 |
| | | | | | | | |
Effect of dilutive stock options | | | — | | 17,673 | | | |
| | | | | | | | |
Diluted net income per share | | $ | 2,107 | | 1,476,288 | | $ | 1.43 |
| | | | | | | | |
| | (p) | Consolidated Statements of Cash Flows |
For purposes of the consolidated statements of cash flows, cash and cash equivalents include cash on hand, amounts due from banks (with original maturities of three months or less), and federal funds sold. Generally, federal funds are purchased and sold for one-day periods.
SFAS No. 130,Reporting Comprehensive Income, requires the Company to classify items of “Other Comprehensive Income” (such as net unrealized gains (losses) on available-for-sale securities) by their nature in a financial statement and present the accumulated balance of other comprehensive income separately from retained earnings and additional paid-in capital in the equity section of a statement of financial position. The Company’s other comprehensive income consists of net income and net unrealized gains (losses) on securities available-for-sale, net of income taxes.
SFAS No. 158,Employers’ Accounting for Defined Benefit Pension and Other Postretirement Plans - an amendment of FASB Statements No. 87, 88, 106, and 132(R), requires a business entity to recognize the overfunded or underfunded status of a single-employer defined benefit postretirement plan as an asset or liability in its statement of financial position and to recognize changes in that funded status in comprehensive income in the year in which the changes occur. SFAS 158 also requires a business entity to measure the funded status of a plan as of the date of its year-end statement of financial position, with limited exceptions.
In preparing the consolidated financial statements in accordance with U.S. generally accepted accounting principles, management is required to make estimates and assumptions that affect the reported amounts of assets and liabilities as of the dates of the consolidated balance sheets and revenues and expenses for the years ended December 31, 2007, 2006 and 2005. Actual results could differ from those estimates. Material estimates that are particularly susceptible to significant changes in the near term relate to the determination of the allowance for loan losses.
36
| | (s) | Impact of Recently Issued Accounting Standards |
In February 2006, the FASB issued SFAS No. 155,Accounting for Certain Hybrid Financial Instruments, an amendment of FASB Statements No. 133 and 140. This Statement amends SFAS No. 133,Accounting for Derivative Instruments and Hedging Activities,and SFAS No. 140, Accounting for Transfers and Servicing of Financial Assets and Extinguishments of Liabilitiesand resolves issues in Statement No. 133 Implementation Issue D1, Application of Statement 133 to Beneficial Interests in Securitized Financial Assets. The provisions of this Statement are effective for all financial instruments acquired or issued after the beginning of an entity’s first fiscal year that begins after September 15, 2006. The adoption of SFAS 155 is not expected to have a material impact on the consolidated financial statements of the Company.
In March 2006, the FASB issued SFAS No. 156, Accounting for Servicing of Financial Assets, an amendment of FASB Statement No. 140.This Statement amends SFAS No. 140, Accounting for Transfers and Servicing of Financial Assets and Extinguishments of Liabilities, a replacement of FASB Statement 125with respect to the accounting for separately recognized servicing assets and servicing liabilities. The provisions of this Statement are effective for fiscal years beginning after September 15, 2006. The adoption of SFAS 156 is not expected to have a material impact on the consolidated financial statements of the Company.
In September 2006, the FASB issued SFAS No. 158,Employers’ Accounting for Defined Benefit Pension and Other Postretirement Plans – an amendment of FASB Statements No. 87, 88, 106, and 132(R).SFAS 158 and its impact on the Company are discussed in Note 1(k) of the Notes to Consolidated Financial Statements.
In September 2006, the FASB issued SFAS No. 157,Fair Value Measurements, which establishes a framework for measuring fair value in generally accepted accounting principles and expands disclosures about fair value measurements. SFAS 157 defines fair value as the price that would be received to sell an asset or paid to transfer a liability in an orderly transaction between market participants at the measurement date. SFAS 157 is effective for financial statements issued for fiscal years beginning after November 15, 2007, and interim periods within those fiscal years. The Company does not expect the adoption of this new standard to have a material effect on the Company’s consolidated results of operations or consolidated financial position.
In June 2006, the FASB issued FASB Interpretation No. 48 (FIN 48),Accounting for Uncertainty in Income Taxes—an interpretation of FASB Statement No. 109, which establishes that the financial statement effects of a tax position taken or expected to be taken in a tax return are to be recognized in the financial statements when it is more likely than not, based on the technical merits, that the position will be sustained upon examination. FIN 48 is effective for fiscal years beginning after December 15, 2006. The Company does not expect the adoption of this new standard to have a material effect on the Company’s consolidated results of operations or consolidated financial position.
Certain amounts in the 2006 and 2005 consolidated financial statements have been reclassified to conform to the 2007 presentation. The reclassifications had no effect on net income or stockholders’ equity as previously reported.
37
To comply with Federal Reserve regulations, the Bank is required to maintain certain average reserve balances. The daily average reserve requirements were approximately $1,302 and $1,304 for the weeks including December 31, 2007 and 2006, respectively.
The amortized costs, gross unrealized gains, gross unrealized losses and fair values for securities at December 31, 2007 and 2006 are as follows:
| | | | | | | | | | |
| | | 2007 |
| Available-for-Sale | | Amortized
costs | | Gross
unrealized
gains | | Gross
unrealized
losses | | | Fair
values |
U.S. Treasury securities and obligations of U.S. Government corporations and agencies | | $ | 2,647 | | 12 | | (2 | ) | | 2,657 |
Obligations of states and political subdivisions | | | 6,142 | | 67 | | (31 | ) | | 6,178 |
Corporate securities | | | 2,498 | | — | | (24 | ) | | 2,474 |
Mortgage-backed securities – government | | | 4,132 | | 34 | | (65 | ) | | 4,101 |
Other securities | | | 50 | | — | | — | | | 50 |
| | | | | | | | | | |
Total available-for-sale | | $ | 15,469 | | 113 | | (122 | ) | | 15,460 |
| | | | | | | | | | |
| | | | | | | | | | |
| | | 2007 |
| Held-to-Maturity | | Amortized
costs | | Gross
unrealized
gains | | Gross
unrealized
losses | | | Fair
values |
Obligations of states and political subdivisions | | $ | 4,175 | | 52 | | (14 | ) | | 4,213 |
| | | | | | | | | | |
| | | | | | | | | | |
| | | 2006 |
| Available-for-Sale | | Amortized
costs | | Gross
unrealized
gains | | Gross
unrealized
losses | | | Fair
values |
U.S. Treasury securities and obligations of U.S. Government corporations and agencies | | $ | 4,889 | | 1 | | (47 | ) | | 4,843 |
Obligations of states and political subdivisions | | | 6,033 | | 74 | | (82 | ) | | 6,025 |
Corporate securities | | | 3,502 | | — | | (51 | ) | | 3,451 |
Mortgage-backed securities – government | | | 4,908 | | 27 | | (83 | ) | | 4,852 |
Other securities | | | 50 | | — | | — | | | 50 |
| | | | | | | | | | |
Total available-for-sale | | $ | 19,382 | | 102 | | (263 | ) | | 19,221 |
| | | | | | | | | | |
| | | | | | | | | | |
| | | 2006 |
| Held-to-Maturity | | Amortized
costs | | Gross
unrealized
gains | | Gross
unrealized
losses | | | Fair
values |
Obligations of states and political subdivisions | | $ | 5,645 | | 70 | | (42 | ) | | 5,673 |
| | | | | | | | | | |
38
The following table shows the gross unrealized losses and fair value of the Company’s investments, aggregated by investment category and length of time that individual securities have been in a continuous unrealized loss position, at December 31, 2007:
| | | | | | | | | | | | | |
| | | Less than 12 months | | 12 months or more | | Total |
| Description of Securities | | Fair
value | | Gross
unrealized
losses | | Fair
value | | Gross
unrealized
losses | | Fair
value | | Gross
Unrealized
losses |
U.S. Treasury securities and obligations of U.S. Government corporations and agencies | | $ | — | | — | | 1,498 | | 2 | | 1,498 | | 2 |
Obligations of states and political subdivisions | | | 1,840 | | 12 | | 3,361 | | 33 | | 5,201 | | 45 |
Corporate securities | | | | | | | 2,474 | | 24 | | 2,474 | | 24 |
Mortgage-backed securities- government | | | 42 | | — | | 2,412 | | 65 | | 2,454 | | 65 |
| | | | | | | | | | | | | |
Total temporarily impaired securities | | $ | 1,882 | | 12 | | 9,745 | | 124 | | 11,627 | | 136 |
| | | | | | | | | | | | | |
The Company does not consider the unrealized losses other-than-temporary losses based on the volatility of the securities market price involved, the credit quality of the securities, and the Company’s ability if necessary, to hold the securities until maturity. The securities include 5 bonds that have continuous losses for less than 12 months and 24 bonds that have continuous losses for more than 12 months. The $11,627 in securities in which there is an unrealized loss of $136 includes unrealized losses ranging from less than $1 to $19 or from 0.01% to 3.84% of the original cost of the investment.
The following table shows the gross unrealized losses and fair value of the Company’s investments, aggregated by investment category and length of time that individual securities have been in a continuous unrealized loss position, at December 31, 2006:
| | | | | | | | | | | | | |
| | | Less than 12 months | | 12 months or more | | Total |
| Description of Securities | | Fair
value | | Gross
unrealized
losses | | Fair
value | | Gross
unrealized
losses | | Fair
value | | Gross
unrealized
losses |
U.S. Treasury securities and obligations of U.S. Government corporations and agencies | | $ | 999 | | 1 | | 3,654 | | 46 | | 4,653 | | 47 |
Obligations of states and political subdivisions | | | 631 | | 1 | | 5,119 | | 123 | | 5,750 | | 124 |
Corporate securities | | | — | | — | | 3,451 | | 51 | | 3,451 | | 51 |
Mortgage-backed securities- government | | | 561 | | 1 | | 2,804 | | 82 | | 3,365 | | 83 |
| | | | | | | | | | | | | |
Total temporarily impaired securities | | $ | 2,191 | | 3 | | 15,028 | | 302 | | 17,219 | | 305 |
| | | | | | | | | | | | | |
39
The Company does not consider the unrealized losses other-than-temporary losses based on the volatility of the securities market price involved, the credit quality of the securities, and the Company’s ability to hold the securities until maturity. The securities include 6 bonds that have continuous losses for less than 12 months and 33 bonds that have continuous losses for more than 12 months. The $17,219 in securities in which there is an unrealized loss of $305 includes unrealized losses ranging from $1 to $22 or from 0.01% to 4.12% of the original cost of the investment.
The amortized costs and fair values of available-for-sale and held-to-maturity securities at December 31, 2007, by contractual maturity, are shown below. Expected maturities may differ from contractual maturities because borrowers may have the right to call or prepay obligations with or without call or prepayment penalties.
| | | | | | | | | |
| | | 2007 |
| | | Available-for-Sale | | Held-to-Maturity |
| | | Amortized
costs | | Fair
values | | Amortized
costs | | Fair
values |
Due in one year or less | | $ | 3,629 | | 3,625 | | 1,670 | | 1,670 |
Due after one year through five years | | | 6,147 | | 6,159 | | 2,204 | | 2,245 |
Due after five years through ten years | | | 1,011 | | 1,026 | | 301 | | 298 |
Due after ten years | | | 500 | | 499 | | — | | — |
| | | | | | | | | |
| | | 11,287 | | 11,309 | | 4,175 | | 4,213 |
Mortgage-backed securities | | | 4,132 | | 4,101 | | — | | — |
| | | | | | | | | |
Totals | | $ | 15,419 | | 15,410 | | 4,175 | | 4,213 |
| | | | | | | | | |
Securities with amortized costs of approximately $4,221 and $4,160 (fair values of $4,209 and $4,122, respectively) as of December 31, 2007 and 2006, respectively, were pledged as collateral.
A summary of loans at December 31, 2007 and 2006 follows:
| | | | | | | |
| | | 2007 | | | 2006 | |
Real estate loans: | | | | | | | |
Residential | | $ | 75,579 | | | 68,540 | |
Other | | | 92,102 | | | 72,797 | |
Loans to individuals for household, family and other consumer expenditures | | | 46,834 | | | 46,360 | |
Commercial and industrial loans | | | 19,909 | | | 21,694 | |
All other loans | | | 240 | | | 454 | |
| | | | | | | |
Total loans, gross | | | 234,664 | | | 209,845 | |
Less unearned income and fees | | | (192 | ) | | (214 | ) |
| | | | | | | |
Loans, net of unearned income and fees | | | 234,472 | | | 209,631 | |
Less allowance for loan losses | | | (1,720 | ) | | (1,770 | ) |
| | | | | | | |
Loans, net | | $ | 232,752 | | | 207,861 | |
| | | | | | | |
Non-accrual loans amounted to approximately $634, $255 and $421 at December 31, 2007, 2006 and 2005 respectively. Interest income that would have been earned on non-accrual loans if they had been current in accordance with their original terms and the recorded interest that was included in income on these loans was not significant for 2007, 2006 and 2005. There were no commitments to lend additional funds to customers whose loans were on non-accrual status at December 31, 2007.
40
In the normal course of business, the Bank has made loans to executive officers and directors. At December 31, 2007, loans to executive officers and directors were approximately $523 compared to $507 at December 31, 2006. During 2007, new loans to executive officers and directors amounted to approximately $215 and repayments amounted to approximately $199. Loans to companies in which executive officers and directors have an interest amounted to approximately $567 and $1,190 at December 31, 2007 and 2006, respectively. All such loans were made in the ordinary course of business on substantially the same terms and conditions, including interest rates and collateral, as those prevailing at the same time for comparable transactions with unrelated persons, and, in the opinion of management, do not involve more than normal risk or present other unfavorable features.
Activity in the allowance for loan losses for the years ended December 31, 2007, 2006 and 2005 is summarized as follows:
| | | | | | | | | | |
| | | 2007 | | | 2006 | | | 2005 | |
Balances at beginning of year | | $ | 1,770 | | | 1,508 | | | 1,502 | |
Provision for loan losses | | | 462 | | | 339 | | | 230 | |
Loans charged off | | | (646 | ) | | (206 | ) | | (380 | ) |
Loan recoveries | | | 134 | | | 129 | | | 156 | |
| | | | | | | | | | |
Balances at end of year | | $ | 1,720 | | | 1,770 | | | 1,508 | |
| | | | | | | | | | |
At December 31, 2007, 2006 and 2005, the recorded investment in loans for which impairment has been identified totaled approximately $634, $255 and $421, respectively, with corresponding valuation allowances of approximately $110, $3 and $66, respectively. The average recorded investment in impaired loans receivable during 2007, 2006 and 2005 was approximately $445, $333 and $389, respectively. Interest income recognized on a cash basis on impaired loans during 2007, 2006 and 2005 was approximately $61, $15 and $3 respectively.
| (5) | Bank Premises and Equipment |
Bank premises and equipment, net were comprised of the following as of December 31, 2007 and 2006:
| | | | | | | |
| | | 2007 | | | 2006 | |
Land improvements | | $ | 420 | | | 420 | |
Buildings | | | 4,628 | | | 4,628 | |
Equipment, furniture and fixtures | | | 3,371 | | | 3,002 | |
| | | | | | | |
| | | 8,419 | | | 8,050 | |
Less accumulated depreciation | | | (4,350 | ) | | (3,937 | ) |
| | | | | | | |
| | | 4,069 | | | 4,113 | |
Land | | | 1,151 | | | 1,151 | |
| | | | | | | |
Bank premises and equipment, net | | $ | 5,220 | | | 5,264 | |
| | | | | | | |
A summary of deposits at December 31, 2007 and 2006 follows:
| | | | | |
| | | 2007 | | 2006 |
Noninterest-bearing demand deposits | | $ | 27,244 | | 23,631 |
Interest-bearing: | | | | | |
Savings | | | 47,850 | | 44,794 |
NOW accounts | | | 27,020 | | 25,004 |
Time deposits – under $ 100,000 | | | 109,824 | | 98,330 |
Time deposits – $100,000 and over | | | 39,928 | | 39,058 |
| | | | | |
Total interest-bearing deposits | | | 224,622 | | 207,186 |
| | | | | |
Total deposits | | $ | 251,866 | | 230,817 |
| | | | | |
41
At December 31, 2007, the scheduled maturity of time deposits is as follows: $95,067 in 2008; $33,064 in 2009; $14,352 in 2010; $4,685 in 2011 and $2,584 in 2012.
In the normal course of business, the Bank has received deposits from executive officers and directors. At December 31, 2007 and 2006, deposits from executive officers and directors were approximately $3,755 and $2,426, respectively. All such deposits were received in the ordinary course of business on substantially the same terms and conditions, including interest rates, as those prevailing at the same time for comparable transactions with unrelated persons.
| (7) | Employee Benefit Plans |
The Bank maintains a noncontributory defined benefit pension plan that covers substantially all of its employees. Benefits are computed based on employees’ average final compensation and years of credited service. Pension expense amounted to approximately $329, $244 and $293 in 2007, 2006 and 2005, respectively. The change in benefit obligation, change in plan assets and funded status of the pension plan at September 30, 2007, 2006 and 2005 (most recent information available) and pertinent assumptions are as follows:
The remainder of this page intentionally left blank.
42
| | | | | | | | | | |
| | | Pension Benefits | |
| | | 2007 | | | 2006 | | | 2005 | |
Change in Benefit Obligation | | | | | | | | | | |
Benefit obligation at beginning of year | | $ | 4,907 | | | 5,111 | | | 4,571 | |
Service cost | | | 363 | | | 299 | | | 301 | |
Interest cost | | | 293 | | | 294 | | | 274 | |
Actuarial (gain) loss | | | (29 | ) | | (109 | ) | | 72 | |
Benefits paid | | | (94 | ) | | (688 | ) | | (107 | ) |
| | | | | | | | | | |
Benefit obligation at end of year | | $ | 5,440 | | | 4,907 | | | 5,111 | |
| | | | | | | | | | |
Change in Plan Assets | | | | | | | | | | |
Fair value of plan assets at beginning of year | | | 4,911 | | | 4,383 | | | 3,741 | |
Actual return on plan assets | | | 674 | | | 416 | | | 553 | |
Employer contribution | | | — | | | 800 | | | 196 | |
Benefit paid | | | (94 | ) | | (688 | ) | | (107 | ) |
| | | | | | | | | | |
Fair value of plan assets at end of year | | $ | 5,491 | | | 4,911 | | | 4,383 | |
| | | | | | | | | | |
Funded Status at the End of the Year | | | 51 | | | 4 | | | (728 | ) |
Amounts Recognized in the Balance Sheet | | | | | | | | | | |
Other liabilities, accrued pension | | | — | | | — | | | — | |
Other assets, prepaid pension | | $ | 51 | | | 4 | | | — | |
| | | | | | | | | | |
Amounts Recognized in Accumulated Other Comprehensive Income Net of Tax Effect | | | | | | | | | | |
Unrecognized net actuarial loss | | | 98 | | | 334 | | | — | |
Prior service cost | | | 10 | | | 13 | | | — | |
Net obligation in transition | | | 7 | | | 10 | | | — | |
| | | | | | | | | | |
Benefit obligation included in accumulated other comprehensive income | | $ | 115 | | | 357 | | | — | |
| | | | | | | | | | |
Funded Status | | | | | | | | | | |
Benefit obligation | | | (5,440 | ) | | (4,907 | ) | | (5,111 | ) |
Fair value of assets | | | 5,491 | | | 4,911 | | | 4,383 | |
Unrecognized net actuarial (gain) loss | | | 149 | | | 505 | | | 667 | |
Unrecognized net obligation at transition | | | 11 | | | 15 | | | 25 | |
Unrecognized prior service cost | | | 15 | | | 20 | | | 20 | |
| | | | | | | | | | |
(Accrued)/prepaid benefit cost included in the balance sheet | | $ | 226 | | | 544 | | | (16 | ) |
| | | | | | | | | | |
Components of Net Periodic Benefit Cost | | | | | | | | | | |
Service cost | | | 363 | | | 299 | | | 301 | |
Interest cost | | | 293 | | | 294 | | | 274 | |
Expected return on plan assets | | | (348 | ) | | (372 | ) | | (318 | ) |
Amortization of prior service cost | | | 5 | | | 5 | | | 5 | |
Amortization of net obligation at transition | | | 4 | | | 4 | | | 4 | |
Recognized net actuarial (gain)/ loss | | | 1 | | | 10 | | | 22 | |
| | | | | | | | | | |
Net periodic benefit cost | | $ | 318 | | | 240 | | | 288 | |
| | | | | | | | | | |
| |
| | | Pension Benefits | |
| | | 2007 | | | 2006 | | | 2005 | |
Weighted Average Assumptions as of September 30: | | | | | | | | | | |
Discount rate | | | 6.25 | % | | 6.00 | % | | 5.75 | % |
Expected long-term return on plan assets | | | 8.50 | % | | 8.50 | % | | 8.50 | % |
Rate of compensation increase | | | 5.00 | % | | 5.00 | % | | 5.00 | % |
43
| | | | | | | | |
| | | Pension Benefits |
| | | 2007 | | | 2006 | | 2005 |
Other Changes in Plan Assets and Benefit Obligation | | | | | | | | |
Recognized in Other Comprehensive | | | | | | | | |
Income Net of Tax Effect | | | | | | | | |
Net (gain)/loss | | $ | (236 | ) | | 334 | | — |
Prior service cost | | | — | | | 13 | | — |
Amortization of prior service cost | | | (3 | ) | | — | | — |
Net obligation at transition | | | — | | | 10 | | — |
Amortization of net obligation at transition | | | (3 | ) | | — | | — |
| | | | | | | | |
Total recognized in other comprehensive income | | $ | (242 | ) | | 357 | | — |
| | | | | | | | |
Total Recognized in Net Periodic Benefit Cost and Other Comprehensive Income | | $ | 76 | | | 597 | | 289 |
The estimated portion of prior service cost and net transition obligation included in accumulated other comprehensive income that will be recognized as a component of net periodic pension cost over the next fiscal year are $5 and $4, respectively.
The Company selects the expected long-term rate-of-return-on-assets assumption in consultation with its investment advisors and actuary. This rate is intended to reflect the average rate of return expected to be earned on the funds invested or to be invested to provide plan benefits. Historical performance is reviewed – especially with respect to real rates of return (net of inflation) – for the major asset classes held or anticipated to be held by the trust, and for the trust itself. Undue weight is not given to recent experience, which may not continue over the measurement period; and higher significance is placed on current forecasts of future long-term economic conditions.
Because assets are held in a qualified trust, anticipated returns are not reduced for taxes. Further – solely for this purpose – the plan is assumed to continue in force and not terminate during the period during which assets are invested. However, consideration is given to the potential impact of current and future investment policy, cash flow into and out of the trust, and expenses (both investment and non-investment) typically paid from plan assets (to the extent such expenses are not explicitly estimated within periodic cost).
The components of net pension benefit cost under the plan for the years ended December 31, 2007, 2006 and 2005 is summarized as follows:
| | | | | | | | | | |
| | | Pension Benefits | |
| | | 2007 | | | 2006 | | | 2005 | |
Service cost | | $ | 363 | | | 299 | | | 301 | |
Interest cost | | | 293 | | | 294 | | | 274 | |
Expected return on plan assets | | | (348 | ) | | (372 | ) | | (317 | ) |
Net amortization | | | 9 | | | 8 | | | 9 | |
Recognized net actuarial loss | | | 1 | | | 10 | | | 22 | |
| | | | | | | | | | |
Net pension benefit cost | | $ | 318 | | | 239 | | | 289 | |
| | | | | | | | | | |
44
Projected Benefit Payments
The projected benefit payments under the plan are summarized as follows for the years ending September 30:
| | | |
2008 | | $ | 42 |
2009 | | | 42 |
2010 | | | 44 |
2011 | | | 171 |
2012 | | | 179 |
2013-2017 | | | 1,364 |
Plan Asset Allocation
The pension plan’s weighted-average asset allocations at September 30, 2007 and 2006, by asset category, are as follows:
| | | | | | |
| | | Plan Assets at September 30, | |
| | | 2007 | | | 2006 | |
Asset Category: | | | | | | |
Mutual funds – fixed income | | 22 | % | | 21 | % |
Mutual funds – equity | | 74 | % | | 71 | % |
Cash and Equivalents | | 4 | % | | 8 | % |
| | | | | | |
Total | | 100 | % | | 100 | % |
| | | | | | |
Plan assets are held in a pooled pension trust fund administered by the Virginia Bankers Association. The pooled pension trust fund is sufficiently diversified to maintain a reasonable level of risk without imprudently sacrificing return, with a targeted asset allocation of 20% fixed income and 80% equities. The Investment Manager selects investment fund managers with demonstrated experience and expertise, and funds with demonstrated historical performance, for the implementation of the pension plan’s investment strategy. The Investment Manager will consider both actively and passively managed investment strategies and will allocate funds across the asset classes to develop an efficient investment structure.
It is the responsibility of the Virginia Bankers Association to administer the investments of the pooled pension trust fund within reasonable costs, being careful to avoid sacrificing quality. These costs include, but are not limited to, management and custodial fees, consulting fees, transaction costs and other administrative costs.
Contributions
The Company expects to contribute $243 to its pension plan in 2008.
The Company also has a 401(k) plan for which the Company does not currently match employee contributions to the plan.
45
Income tax expense attributable to income before income tax expense for the years ended December 31, 2007 and 2006 is summarized as follows:
| | | | | | | | |
| | | 2007 | | | 2006 | | 2005 |
Current | | $ | 1,311 | | | 955 | | 692 |
Deferred | | | (84 | ) | | 161 | | 184 |
| | | | | | | | |
Total income tax expense | | $ | 1,227 | | | 1,116 | | 876 |
| | | | | | | | |
Reported income tax expense for the years ended December 31, 2007, 2006 and 2005 differed from the amounts computed by applying the U.S. Federal income tax rate of 34% to income before income tax expense as a result of the following:
| | | | | | | | | | |
| | | 2007 | | | 2006 | | | 2005 | |
Computed “expected” income tax expense | | $ | 1,301 | | | 1,199 | | | 1,014 | |
Increase (reduction) in income tax expense resulting from: | | | | | | | | | | |
Tax-exempt interest | | | (93 | ) | | (102 | ) | | (138 | ) |
Disallowance of interest expense | | | 14 | | | 13 | | | 13 | |
Other, net | | | 5 | | | 6 | | | (13 | ) |
| | | | | | | | | | |
Reported income tax expense | | $ | 1,227 | | | 1,116 | | | 876 | |
| | | | | | | | | | |
The tax effects of temporary differences that give rise to significant portions of the deferred tax assets and deferred tax liabilities at December 31, 2007 and 2006 are as follows:
| | | | | | | |
| | | 2007 | | | 2006 | |
Deferred tax assets: | | | | | | | |
Loans, principally due to allowance for loan losses | | $ | 447 | | | 481 | |
Net unrealized losses on available-for-sale securities | | | 3 | | | 55 | |
Unrecognized net actuarial loss and prior service cost | | | 52 | | | — | |
Loans, due to unearned fees, net | | | 35 | | | 38 | |
Other | | | 78 | | | 67 | |
| | | | | | | |
Total gross deferred tax assets | | | 615 | | | 641 | |
| | | | | | | |
Deferred tax liabilities: | | | | | | | |
Bank premises and equipment, due to differences in depreciation | | | (151 | ) | | (153 | ) |
Accrued pension, due to actual pension contributions in excess of accrual for financial reporting purposes | | | (77 | ) | | (183 | ) |
Other | | | (83 | ) | | (85 | ) |
| | | | | | | |
Total gross deferred tax liabilities | | | (311 | ) | | (421 | ) |
| | | | | | | |
Net deferred tax asset, included in other assets | | $ | 304 | | | 220 | |
| | | | | | | |
The Bank has determined that a valuation allowance for the gross deferred tax assets is not necessary at December 31, 2007, 2006 and 2005, since realization of the entire gross deferred tax assets can be supported by the amounts of taxes paid during the carryback periods available under current tax laws.
| (9) | Financial Instruments with Off-Balance-Sheet Risk |
The Bank is a party to financial instruments with off-balance-sheet risk in the normal course of business to meet the financing needs of its customers. These financial instruments include commitments to extend credit and standby letters of credit. These instruments may involve, to varying degrees, credit risk in excess of the amount recognized in the balance sheets. The contract amounts of these instruments reflect the extent of involvement the Bank has in particular classes of financial instruments.
46
Credit risk is defined as the possibility of sustaining a loss because the other parties to a financial instrument fail to perform in accordance with the terms of the contract. The Bank’s maximum exposure to credit loss under commitments to extend credit and standby letters of credit is represented by the contractual amount of these instruments. The Bank uses the same credit policies in making commitments and conditional obligations as it does for on-balance-sheet instruments.
The Bank requires collateral to support financial instruments when it is deemed necessary. The Bank evaluates such customers’ creditworthiness on a case-by-case basis. The amount of collateral obtained upon extension of credit is based on management’s credit evaluation of the counterparty. Collateral may include deposits held in financial institutions, U.S. Treasury securities, other marketable securities, real estate, accounts receivable, inventory, and property, plant and equipment.
Financial instruments whose contract amounts represent credit risk:
| | | | | |
| | | Contract amounts at
December 31, |
| | | 2007 | | 2006 |
Commitments to extend credit | | $ | 45,762 | | 60,883 |
| | | | | |
Standby letters of credit | | $ | 875 | | 2,014 |
| | | | | |
Commitments to extend credit are agreements to lend to a customer as long as there is no violation of any condition established in the contract. Commitments generally have fixed expiration dates or other termination clauses and may require payment of a fee. Since many of the commitments are expected to expire without being drawn upon, the total commitment amounts do not necessarily represent future cash requirements.
Standby letters of credit are conditional commitments issued by the Bank to guarantee the performance of a customer to a third party. These guarantees are primarily issued to support public and private borrowing arrangements, including bond financing and similar transactions. Unless renewed, substantially all of the Bank’s standby letters of credit commitments at December 31, 2007 will expire within one year. Management does not anticipate any material losses as a result of these transactions. The credit risk involved in issuing letters of credit is essentially the same as that involved in extending loans to customers.
| (10) | Concentrations of Credit Risk |
The Bank grants commercial, residential, consumer and agribusiness loans to customers primarily in the central Virginia area. The Bank has a diversified loan portfolio that is not dependent upon any particular economic sector. As a whole, the portfolio could be affected by general economic conditions in the central Virginia region.
The Bank’s commercial and real estate loan portfolios are diversified, with no significant concentrations of credit. The installment loan portfolio consists of consumer loans primarily for automobiles and other personal property. Overall, the Bank’s loan portfolio is not concentrated within a single industry or group of industries, the loss of any one or more of which would generate a materially adverse impact on the business of the Bank.
The Bank has established operating policies relating to the credit process and collateral in loan originations. Loans to purchase real and personal property are generally collateralized by the related property. Credit approval is principally a function of collateral and the evaluation of the creditworthiness of the borrower based on available financial information.
47
At times, the Bank may have cash and cash equivalents at a financial institution in excess of insured limits. The Bank places its cash and cash equivalents with high credit quality financial institutions whose credit rating is monitored by management to minimize credit risk.
| (11) | Dividend Restrictions and Capital Requirements |
Bankshares’ principal source of funds for dividend payments is dividends received from its subsidiary Bank. For the years ended December 31, 2007 and 2006, dividends from the subsidiary Bank totaled $743 and $855, respectively.
Substantially all of Bankshares’ retained earnings consist of undistributed earnings of its subsidiary Bank, which are restricted by various regulations administered by federal banking regulatory agencies. Under applicable federal laws, the Comptroller of the Currency restricts, without prior approval, the total dividend payments of the Bank in any calendar year to the net profits of that year, as defined, combined with the retained net profits for the two preceding years. At December 31, 2007, retained net profits of the Bank that were free of such restriction approximated $5,642.
Bankshares and the Bank are subject to various regulatory capital requirements administered by the federal banking agencies. Failure to meet minimum capital requirements can initiate certain mandatory and possibly additional discretionary actions by regulators that, if undertaken, could have a direct material effect on Bankshares’ consolidated financial statements. Under capital adequacy guidelines and the regulatory framework for prompt corrective action, Bankshares and the Bank must meet specific capital guidelines that involve quantitative measures of their assets, liabilities and certain off-balance-sheet items as calculated under regulatory accounting practices. Bankshares and the Bank’s capital amounts and classification are also subject to qualitative judgments by the regulators about components, risk weightings and other factors.
Quantitative measures established by regulation to ensure capital adequacy require Bankshares and the Bank to maintain minimum amounts and ratios (set forth in the table below) of total and Tier 1 capital (as defined in the regulations) to risk-weighted assets (as defined), and of Tier 1 capital (as defined) to average assets (as defined). Management believes, as of December 31, 2007, that Bankshares and the Bank meets all capital adequacy requirements to which it is subject.
As of December 31, 2007, the most recent notification from Office of the Comptroller of the Currency categorized Bankshares and the Bank as “well capitalized” under the regulatory framework for prompt corrective action. To be categorized as “well capitalized,” Bankshares and the Bank must maintain minimum total risk-based, Tier 1 risk-based and Tier 1 leverage ratios as set forth in the table below. There are no conditions or events since that notification that management believes have changed Bankshares and the Bank’s category.
48
Bankshares and the Bank’s actual capital amounts and ratios are presented in the table below.
| | | | | | | | | | | | | | | | | | |
| | | Actual | | | For Capital
Adequacy Purposes | | | To Be “Well
Capitalized” Under
Prompt Corrective
Action Provisions | |
| | | Amount | | Ratio | | | Amount | | Ratio | | | Amount | | Ratio | |
As of December 31, 2007: | | | | | | | | | | | | | | | | | | |
Total Capital | | | | | | | | | | | | | | | | | | |
(to Risk Weighted Assets): | | | | | | | | | | | | | | | | | | |
Bankshares consolidated | | $ | 28,077 | | 11.24 | % | | $ | 19,990 | | 8.0 | % | | $ | N/A | | N/A | |
Bank | | | 27,852 | | 11.15 | % | | | 19,949 | | 8.0 | % | | | 23,938 | | 10.0 | % |
Tier 1 Capital | | | | | | | | | | | | | | | | | | |
(to Risk Weighted Assets): | | | | | | | | | | | | | | | | | | |
Bankshares consolidated | | | 26,357 | | 10.55 | % | | | 9,995 | | 4.0 | % | | | N/A | | N/A | |
Bank | | | 26,132 | | 10.46 | % | | | 9,974 | | 4.0 | % | | | 11,966 | | 6.0 | % |
Tier 1 Capital (Leverage) | | | | | | | | | | | | | | | | | | |
(to Average Assets): | | | | | | | | | | | | | | | | | | |
Bankshares consolidated | | | 26,357 | | 9.54 | % | | | 9,995 | | 4.0 | % | | | N/A | | N/A | |
Bank | | | 26,132 | | 9.45 | % | | | 11,059 | | 4.0 | % | | | 11,170 | | 5.0 | % |
| | | | | | | | | | | | | | | | | | |
| | | Actual | | | For Capital
Adequacy Purposes | | | To Be “Well
Capitalized” Under
Prompt Corrective
Action Provisions | |
| | | Amount | | Ratio | | | Amount | | Ratio | | | Amount | | Ratio | |
As of December 31, 2006: | | | | | | | | | | | | | | | | | | |
Total Capital | | | | | | | | | | | | | | | | | | |
(to Risk Weighted Assets): | | | | | | | | | | | | | | | | | | |
Bankshares consolidated | | $ | 26,197 | | 10.64 | % | | $ | 19,824 | | 8.0 | % | | $ | N/A | | N/A | |
Bank | | | 25,979 | | 10.55 | % | | | 19,706 | | 8.0 | % | | | 24,633 | | 10.0 | % |
Tier 1 Capital | | | | | | | | | | | | | | | | | | |
(to Risk Weighted Assets): | | | | | | | | | | | | | | | | | | |
Bankshares consolidated | | | 24,427 | | 9.92 | % | | | 9,864 | | 4.0 | % | | | N/A | | N/A | |
Bank | | | 24,209 | | 9.83 | % | | | 9,853 | | 4.0 | % | | | 14,780 | | 6.0 | % |
Tier 1 Capital (Leverage) | | | | | | | | | | | | | | | | | | |
(to Average Assets): | | | | | | | | | | | | | | | | | | |
Bankshares consolidated | | | 24,427 | | 9.80 | % | | | 9,980 | | 4.0 | % | | | N/A | | N/A | |
Bank | | | 24,209 | | 9.71 | % | | | 9,977 | | 4.0 | % | | | 12,471 | | 5.0 | % |
| (12) | Disclosures About Fair Value of Financial Instruments |
SFAS No. 107,Disclosures about Fair Value of Financial Instruments, requires the Company to disclose estimated fair values of its financial instruments.
The following methods and assumptions were used to estimate the approximate fair value of each class of financial instrument for which it is practicable to estimate that value.
| | (a) | Cash and Due from Banks and Federal Funds Sold |
The carrying amounts are a reasonable estimate of fair value.
The fair value of securities, except state and municipal securities, is estimated based on bid prices published in financial newspapers or bid quotations received from securities dealers. The fair value of certain state and municipal securities is not readily available through market sources other than dealer quotations; so fair value estimates are based on quoted market prices of similar instruments, adjusted for differences between the quoted instruments and the instruments being valued.
49
Fair values are estimated for portfolios of loans with similar financial characteristics. Loans are segregated by type such as commercial, real estate - residential, real estate - other, loans to individuals and other loans. Each loan category is further segmented into fixed and adjustable rate interest terms.
The fair value of fixed rate loans is calculated by discounting scheduled cash flows through the estimated maturity using estimated market discount rates that reflect the credit and interest rate risk inherent in the loan as well as estimates for prepayments. The estimate of maturity is based on the Company’s historical experience with repayments for each loan classification, modified, as required, by an estimate of the effect of current economic and lending conditions.
| | (d) | Deposits and Note Payable to Federal Home Loan Bank |
The fair value of demand deposits, NOW accounts, and savings deposits is the amount payable on demand. The fair value of fixed maturity time deposits, certificates of deposit and the note payable to the Federal Home Loan Bank is estimated by discounting scheduled cash flows through the estimated maturity using the rates currently offered for deposits or borrowings of similar remaining maturities.
| | (e) | Commitments to Extend Credit and Standby Letters of Credit |
The only amounts recorded for commitments to extend credit and standby letters of credit are the deferred fees arising from these unrecognized financial instruments. These deferred fees are not deemed significant at December 31, 2007 and 2006, and as such, the related fair values have not been estimated. The carrying amounts and approximate fair values of the Company’s financial instruments are as follows at December 31, 2007 and 2006:
| | | | | | | | | |
| | | Carrying
amounts | | Approximate
fair values | | Carrying
amounts | | Approximate
fair values |
Financial assets: | | | | | | | | | |
Cash and due from banks | | $ | 6,782 | | 6,782 | | 5,948 | | 5,948 |
Federal funds sold | | | 11,562 | | 11,562 | | 8,638 | | 8,638 |
Securities: | | | | | | | | | |
Available-for-sale | | | 15,460 | | 15,460 | | 19,221 | | 19,221 |
Held-to-maturity | | | 4,175 | | 4,204 | | 5,645 | | 5,673 |
Federal Reserve Bank Stock | | | 75 | | 75 | | 75 | | 75 |
Federal Home Loan Bank Stock | | | 476 | | 476 | | 481 | | 481 |
Loans, net of unearned income and fees | | | 234,472 | | 238,810 | | 209,631 | | 206,740 |
| | | | | | | | | |
Total financial assets | | $ | 273,002 | | 277,369 | | 249,639 | | 246,776 |
| | | | | | | | | |
Financial liabilities: | | | | | | | | | |
Deposits | | $ | 251,866 | | 254,217 | | 230,817 | | 230,615 |
Note payable to Federal Home Loan Bank | | | — | | — | | 100 | | 100 |
| | | | | | | | | |
Total financial liabilities | | $ | 251,866 | | 254,217 | | 230,917 | | 230,715 |
| | | | | | | | | |
50
Fair value estimates are made at a specific point in time, based on relevant market information and information about the financial instrument. These estimates do not reflect any premium or discount that could result from offering for sale at one time the Company’s entire holdings of a particular financial instrument. Because no market exists for a significant portion of the Company’s financial instruments, fair value estimates are based on judgments regarding future expected loss experience, current economic conditions, risk characteristics of various financial instruments and other factors. These estimates are subjective in nature and involve uncertainties and matters of significant judgment and therefore cannot be determined with precision. Changes in assumptions could significantly affect the estimates.
Fair value estimates are based on existing on and off-balance sheet financial instruments without attempting to estimate the value of anticipated future business and the value of assets and liabilities that are not considered financial instruments. Significant assets that are not considered financial assets include deferred tax assets and premises and equipment and other real estate owned. In addition, the tax ramifications related to the realization of the unrealized gains and losses can have a significant effect on fair value estimates and have not been considered in the estimates.
| (13) | Parent Company Financial Information |
Condensed financial information of Bankshares (Parent) is presented below:
Condensed Balance Sheets
| | | | | | | |
| | | December 31, | |
| | | 2007 | | | 2006 | |
| Assets | | | | | | | |
Cash due from subsidiary | | $ | 27 | | | 30 | |
Investment in subsidiary, at equity | | | 26,666 | | | 24,642 | |
Other assets | | | 259 | | | 218 | |
| | | | | | | |
Total assets | | $ | 26,952 | | | 24,890 | |
| | | | | | | |
| Liabilities and Stockholders’ Equity | | | | | | | |
Other liabilities | | $ | 21 | | | 40 | |
| | | | | | | |
| | |
Stockholders’ equity (notes 11 and 14): | | | | | | | |
Common stock of $3 par value. Authorized 3,000,000 shares; issued and outstanding 1,485,089 shares in 2007 and 1,459,589 shares in 2006 | | | 4,455 | | | 4,379 | |
Capital surplus | | | 795 | | | 604 | |
Retained earnings | | | 21,687 | | | 19,973 | |
Accumulated other comprehensive income (loss), net | | | (6 | ) | | (106 | ) |
| | | | | | | |
Total stockholders’ equity | | | 26,931 | | | 24,850 | |
Commitments, contingencies and other matters (notes 9, 10 and 11) | | | — | | | — | |
| | | | | | | |
Total liabilities and stockholders’ equity | | $ | 26,952 | | | 24,890 | |
| | | | | | | |
51
Condensed Statements of Income
| | | | | | | |
| | | Years ended
December 31, |
| | | 2007 | | 2006 | | 2005 |
Income: | | | | | | | |
Dividends from subsidiary (note 11) | | $ | 743 | | 855 | | 780 |
Expenses: | | | | | | | |
Other expenses | | | 97 | | 85 | | 68 |
| | | | | | | |
Income before income tax benefit and equity in undistributed net income of subsidiary | | | 646 | | 770 | | 712 |
Applicable income tax benefit | | | 33 | | 29 | | 34 |
| | | | | | | |
Income before equity in undistributed net income of subsidiary | | | 679 | | 799 | | 746 |
Equity in undistributed net income of subsidiary | | | 1,921 | | 1,613 | | 1,361 |
| | | | | | | |
Net income | | $ | 2,600 | | 2,412 | | 2,107 |
| | | | | | | |
Condensed Statements of Cash Flows
| | | | | | | | | | |
| | | Years ended
December 31, | |
| | | 2007 | | | 2006 | | | 2005 | |
Cash flows from operating activities: | | | | | | | | | | |
Net income | | $ | 2,600 | | | 2,412 | | | 2,107 | |
Adjustments to reconcile net income to net cash provided by operating activities: | | | | | | | | | | |
Equity in undistributed net income of subsidiary | | | (1,921 | ) | | (1,613 | ) | | (1,361 | ) |
Increase in other assets | | | (32 | ) | | (38 | ) | | (34 | ) |
| | | | | | | | | | |
Net cash provided by operating activities | | | 647 | | | 761 | | | 712 | |
| | | | | | | | | | |
Cash flows from financing activities: | | | | | | | | | | |
Proceeds from issuance of common stock | | | 255 | | | 30 | | | 19 | |
Cash dividends paid | | | (887 | ) | | (803 | ) | | (715 | ) |
Increase (decrease) in other liabilities | | | (18 | ) | | 20 | | | (1 | ) |
| | | | | | | | | | |
Net cash used in financing activities | | | (650 | ) | | (753 | ) | | (697 | ) |
| | | | | | | | | | |
Net increase (decrease) in cash due from subsidiary | | | (3 | ) | | 8 | | | 15 | |
Cash due from subsidiary, beginning of year | | | 30 | | | 22 | | | 7 | |
| | | | | | | | | | |
Cash due from subsidiary, end of year | | $ | 27 | | | 30 | | | 22 | |
| | | | | | | | | | |
The Company has two incentive stock option plans. The 1997 Incentive Stock Plan (the 1997 Plan), pursuant to which the Company’s Board of Directors may grant stock options to officers and key employees, was effective as of May 1, 1997. The 1997 Plan authorizes grants of options to purchase up to 50,000 shares of the Company’s authorized, but unissued common stock. Accordingly, 50,000 shares of authorized, but unissued common stock were reserved for use in the 1997 Plan. All stock options are granted with an exercise price equal to the stock’s fair market value at the date of grant. At December 31, 2007, there were no additional shares available for grant under the 1997 Plan as the plan expired on May 1, 2007.
52
The 2004 Incentive Stock Plan (the 2004 Plan), pursuant to which the Company’s Board of Directors may grant stock options to officers and key employees, was approved by shareholders on April 13, 2004 and became effective as of May 1, 2004. The 2004 Plan authorizes grants of options to purchase up to 100,000 shares of the Company’s authorized, but unissued common stock. Accordingly, 100,000 shares of authorized, but unissued common stock were reserved for use in the 2004 Plan. All stock options are granted with an exercise price equal to the stock’s fair market value at the date of the grant. At December 31, 2007, there were 100,000 shares available for grant under the 2004 Plan.
Stock options generally have 10-year terms, vest at the rate of 20% per year, and become fully exercisable five years from the date of grant.
During 2007, 25,500 stock options were exercised. During 2006, no stock options were exercised. During 2005, 1,300 stock options were exercised. During 2007, 2006 and 2005, there were no options granted to employees.
A summary of the status of the Bank’s unvested stock awards as of December 31, 2007 and changes during the year then ended is presented below:
| | | | | | |
Unvested Stock Awards | | Shares | | | Weighted Average
Grant Date Fair Value |
Unvested at January 1, 2007 | | 1,500 | | | $ | 3.08 |
Granted | | — | | | | — |
Vested | | (1,500 | ) | | | 3.08 |
Forefeitures | | — | | | | — |
| | | | | | |
Unvested at December 31, 2007 | | 0 | | | | — |
At December 31, 2007, options for 9,500 shares were exercisable at an exercise price of $14.00 per share, and 7,500 shares were exercisable at an exercise price of $14.75 per share. As of December 31, 2007, there was no unrecognized compensation costs related to unvested stock options. Stock option activity during the years ended December 31, 2007 and 2006 is as follows:
| | | | | |
| | | Number
of
shares | | Weighted
average
exercise price |
Balance at December 31, 2005 | | 42,500 | | $ | 11.78 |
Forfeited/Exercised | | — | | | — |
Granted | | — | | | — |
Balance at December 31, 2006 | | 42,500 | | $ | 11.78 |
Forfeited | | — | | | — |
Exercised | | 25,500 | | $ | 10.08 |
Granted | | — | | | — |
Balance at December 31, 2007 | | 17,000 | | $ | 14.33 |
53
The following table summarizes information about stock options outstanding at December 31, 2007:
| | | | | | | | | | | | |
| | | Options Outstanding | | Options Exercisable |
Exercise Price | | Number
Outstanding
at 12/31/07 | | Weighted-
Average
Remaining
Contractual
Life
(in years) | | Weighted-
Average
Exercise
Price | | Number
Exercisable at
12/31/2007 | | Weighted-
Average
Exercise
Price |
$ 14.00 | | 9,500 | | 3.5 | | $ | 14.00 | | 9,500 | | $ | 14.00 |
14.75 | | 7,500 | | 4.6 | | | 14.75 | | 7,500 | | | 14.75 |
| | | | | | | | | | | | |
| | 17,000 | | 4.0 | | $ | 14.33 | | 17,000 | | $ | 14.33 |
| | | | | | | | | | | | |
The aggregate intrinsic value of options outstanding was approximately $95, options exercisable was approximately $95, and options unvested and expected to vest was approximately $0 at December 31, 2007.
The total intrinsic value (market value on date of exercise less exercise price) of options exercised during the years ended December 31, 2007, 2006 and 2005 totaled $303, $0 and $4 respectively.
| (15) | Goodwill and Other Intangible Assets |
Included in other assets is goodwill of $539 as of December 31, 2007 and 2006. There was no change in the carrying amount of goodwill of $539 for the years ended December 31, 2007 and 2006.
| (16) | Quarterly Results of Operations (Unaudited) |
The following is a summary of the unaudited quarterly results of operations for the years ended December 31, 2007 and 2006:
54
| | | | | | | | | |
| | | 2007 |
| | | First
quarter | | Second
quarter | | Third
quarter | | Fourth
quarter |
Income statement data: | | | | | | | | | |
Interest income | | $ | 4,343 | | 4,574 | | 4,706 | | 4,736 |
Interest expense | | | 1,930 | | 2,049 | | 2,081 | | 2,118 |
| | | | | | | | | |
Net interest income | | | 2,413 | | 2,525 | | 2,625 | | 2,618 |
Provision for loan losses | | | 73 | | 118 | | 86 | | 185 |
Noninterest income | | | 608 | | 658 | | 680 | | 686 |
Noninterest expense | | | 2,117 | | 2,095 | | 2,056 | | 2,256 |
Income tax expense | | | 263 | | 310 | | 377 | | 277 |
| | | | | | | | | |
Net income | | $ | 568 | | 660 | | 786 | | 586 |
| | | | | | | | | |
Per share data: | | | | | | | | | |
Basic net income per share | | $ | 0.39 | | 0.44 | | 0.53 | | 0.40 |
Diluted net income per share | | | 0.38 | | 0.44 | | 0.53 | | 0.40 |
Cash dividends per share | | | 0.15 | | 0.15 | | 0.15 | | 0.15 |
Book value per share | | | 16.97 | �� | 17.13 | | 17.59 | | 18.06 |
| |
| | | 2006 |
| | | First
quarter | | Second
quarter | | Third
quarter | | Fourth
quarter |
Income statement data: | | | | | | | | | |
Interest income | | $ | 3,578 | | 3,781 | | 4,015 | | 4,243 |
Interest expense | | | 1,412 | | 1,498 | | 1,675 | | 1,840 |
| | | | | | | | | |
Net interest income | | | 2,166 | | 2,283 | | 2,340 | | 2,403 |
Provision for loan losses | | | 65 | | 81 | | 94 | | 99 |
Noninterest income | | | 561 | | 666 | | 628 | | 645 |
Noninterest expense | | | 1,823 | | 1,949 | | 1,955 | | 2,098 |
Income tax expense | | | 263 | | 295 | | 290 | | 268 |
| | | | | | | | | |
Net income | | $ | 576 | | 624 | | 629 | | 583 |
| | | | | | | | | |
Per share data: | | | | | | | | | |
Basic net income per share | | $ | 0.39 | | 0.43 | | 0.43 | | 0.40 |
Diluted net income per share | | | 0.39 | | 0.42 | | 0.43 | | 0.40 |
Cash dividends per share | | | 0.13 | | 0.13 | | 0.14 | | 0.15 |
Book value per share | | | 16.14 | | 16.30 | | 16.75 | | 16.78 |
| |
| | | 2005 |
| | | First
quarter | | Second
quarter | | Third
quarter | | Fourth
quarter |
Income statement data: | | | | | | | | | |
Interest income | | $ | 2,933 | | 3,061 | | 3,207 | | 3,469 |
Interest expense | | | 1,053 | | 1,074 | | 1,209 | | 1,352 |
| | | | | | | | | |
Net interest income | | | 1,880 | | 1,987 | | 1,998 | | 2,117 |
Provision for loan losses | | | 60 | | 82 | | 65 | | 23 |
Noninterest income | | | 549 | | 637 | | 655 | | 555 |
Noninterest expense | | | 1,699 | | 1,781 | | 1,831 | | 1,855 |
Income tax expense | | | 193 | | 224 | | 229 | | 230 |
| | | | | | | | | |
Net income | | $ | 477 | | 537 | | 528 | | 564 |
| | | | | | | | | |
Per share data: | | | | | | | | | |
Basic net income per share | | $ | 0.33 | | 0.37 | | 0.36 | | 0.39 |
Diluted net income per share | | | 0.32 | | 0.36 | | 0.36 | | 0.38 |
Cash dividends per share | | | 0.12 | | 0.12 | | 0.12 | | 0.13 |
Book value per share | | | 15.25 | | 15.60 | | 15.75 | | 15.91 |
55
Management’s Report on Internal Control over Financial Reporting.
The Company’s management is responsible for establishing and maintaining adequate internal control over financial reporting as defined in Rules 13a-15(f) and 15d-15(f) under the Exchange Act. The Company’s internal control over financial reporting is designed to provide reasonable assurance regarding the reliability of financial reporting and the preparation of financial statements for external purposes in accordance with generally accepted accounting principles.
Because of its inherent limitations, internal control over financial reporting may not prevent or detect misstatements. Therefore, even those systems determined to be effective can provide only reasonable assurance with respect to financial statement preparation and presentation.
Management assessed the effectiveness of the Company’s internal control over financial reporting as of December 31, 2007. In making this assessment, management used the criteria set forth by the Committee of Sponsoring Organizations of the Treadway Commission (COSO) inInternal Control – Integrated Framework. Based on this assessment, our management concluded that, as of December 31, 2007, the Company’s internal control over financial reporting was effective based on those criteria.
This annual report does not include an attestation report of the Company’s registered public accounting firm regarding internal control over financial reporting. Management’s report was not subject to attestation by the Company’s registered public accounting firm pursuant to temporary rules of the Securities and Exchange Commission that permit the Company to provide only management’s report in this annual report.
Changes in Internal Controls.
No changes in our internal control over financial reporting occurred during the quarter ended December 31, 2007 that have materially affected, or are reasonably likely to materially affect, our internal control over financial reporting.
56

Report of Independent Registered Public Accounting Firm
The Board of Directors and Stockholders
Pinnacle Bankshares Corporation
Altavista, Virginia
We have audited the accompanying consolidated balance sheets of Pinnacle Bankshares Corporation and subsidiary as of December 31, 2007 and 2006, and the related consolidated statements of income, changes in stockholders’ equity and comprehensive income, and cash flows for each of the years in the three-year period ended December 31, 2007. These consolidated financial statements are the responsibility of the Bank’s management. Our responsibility is to express an opinion on these consolidated financial statements based on our audits.
We conducted our audits in accordance with the standards of the Public Company Accounting Oversight Board (United States). Those standards require that we plan and perform the audit to obtain reasonable assurance about whether the financial statements are free of material misstatement. An audit includes examining, on a test basis, evidence supporting the amounts and disclosures in the financial statements. An audit also includes assessing the accounting principles used and significant estimates made by management, as well as evaluating the overall financial statement presentation. We believe that our audits provide a reasonable basis for our opinion.
In our opinion, the consolidated financial statements referred to above present fairly, in all material respects, the financial position of Pinnacle Bankshares Corporation and subsidiary as of December 31, 2007 and 2006, and the results of their operations and their cash flows for each of the years in the three-year period ended December 31, 2007, in conformity with accounting principles generally accepted in the United States of America.
|
 |
|
| Raleigh, North Carolina |
| March 3, 2008 |
57
PINNACLE BANKSHARES CORPORATION
AND SUBSIDIARY
| | |
| Officers of Pinnacle Bankshares Corporation |
| Robert H. Gilliam, Jr. | | President, Chief Executive Officer |
| Carroll E. Shelton | | Senior Vice President |
| Bryan M. Lemley | | Secretary, Treasurer & Chief Financial Officer |
|
| Officers and Managers of The First National Bank of Altavista |
| Robert H. Gilliam, Jr. | | President, Chief Executive Officer & Trust Officer |
| Carroll E. Shelton | | Senior Vice President & Chief Credit Officer |
| Lucy H. Johnson | | Senior Vice President & Data Processing Manager |
| Bryan M. Lemley | | Vice President, Cashier & Chief Financial Officer |
| Aubrey H. Hall, III | | Vice President & Chief Lending Officer |
| William J. Sydnor, II | | Vice President & Branch Administration Officer |
| Judith A. Clements | | Vice President & Director of Human Resources |
| Pamela R. Adams | | Vice President & Loan Operations Manager |
| Thomas R. Burnett, Jr. | | Vice President & Commercial Lending Officer |
| James M. Minear | | Vice President & Commercial Real Estate Lending Officer |
| Tracie A. Robinson | | Vice President & Mortgage Production Manager |
| Edgar R. Tuck | | Vice President & Smith Mountain Lake Market Manager |
| John E. Tucker | | Assistant Vice President & Investment Consultant |
| Albert N. Fariss | | Assistant Vice President, Facilities/Purchasing Manager & Security Officer |
| Ronald C. Clay | | Assistant Vice President & Recovery Manager |
| Brenda M. Eades | | Assistant Vice President & Real Estate Loan Officer |
| Tarry R. Pribble | | Assistant Vice President & Collection Manager |
| Tony J. Bowling | | Assistant Vice President & Network Administrator |
| Christine A. Hunt | | Assistant Vice President & Internal Auditor |
| Vicki G. Greer | | Assistant Vice President & Financial Analyst |
| Marian E. Marshall | | Assistant Vice President & Branch Manager (Old Forest) |
| Daniel R. Wheeler | | Assistant Vice President & Branch Manager (Airport) |
| Shawn D. Stone | | Assistant Vice President & Branch Manager (Main) |
| Vivian S. Brown | | Assistant Vice President & Branch Manager (Forest) |
| Nancy J. Holt | | Assistant Vice President & Branch Manager (Vista) |
| Janet H. Whitehead | | Assistant Vice President & Branch Manager (Timberlake) |
| M. Amanda Ramsey | | Assistant Vice President & Branch Manager(Amherst) |
| Calvin R. Short | | Assistant Vice President & Dealer Finance Manager |
| Anita M. Jones | | Loan Production Officer |
| Dianna C. Hamlett | | Compliance Officer & Bank Secrecy Act Officer |
| Lisa M. Landrum | | Dealer Finance Loan Officer |
| Lauren R. Michael | | Training Officer |
| Barbara H. Caldwell | | Assistant Branch Manager (Main) |
| Arin L. Brown | | Retail Business Development Officer (Main) |
| Doris N. Trent | | Retail Business Development Officer (Vista) |
| Andria C. Smith | | Retail Business Development Officer (Airport) |
| Courtney M. Woody | | Retail Business Development Officer (Timberlake) |
| Cynthia I. Gibson | | Bookkeeping Manager |
| Jennifer L. Edgell | | Investment Consultant |
58
GILLIAM ELECTED TO THE BOARD OF DIRECTORS
OF THE FEDERAL RESERVE BANK OF RICHMOND

Robert H. Gilliam, Jr., President and Chief Executive Officer of Pinnacle Bankshares Corporation and its subsidiary, The First National Bank of Altavista, has been elected to the Board of Directors of The Federal Reserve Bank of Richmond. Mr. Gilliam is one of three bankers serving on the nine member board.
The Richmond Federal Reserve Bank serves the Fifth Federal Reserve District, one of twelve in the United States, with the district being comprised of the states of Virginia, West Virginia, Maryland, North Carolina, South Carolina and the District of Columbia. The Richmond Bank has branch offices in Baltimore, Maryland and Charlotte, North Carolina. Mr. Gilliam was elected to the board by Fifth District member banks.
Mr. Gilliam joined First National Bank of Altavista as Vice President in 1970 and become President and CEO in 1980. He served as an Assistant National Bank Examiner with the Comptroller of the Currency from 1967 until joining First National Bank.
Mr. Gilliam has been active in the Virginia Bankers Association throughout his banking career. He is currently Chairman of Bankers Investments Group, LLC, a broker/dealer owned by a consortium of community banks and managed by VBA Management Services, Inc. He has served as Chairman of the VBA Benefits Corporation, the VBA BankPac Committee and Group IV. Mr. Gilliam was President of the Virginia Bankers Association for 1995-1996. The Association presented Mr. Gilliam with its Legislative Action Award in 2006.
Mr. Gilliam has served as a member of the Government Relations Council and the BankPac Committee of the American Bankers Association and has been a Director of the Virginia Association of Community Banks.
On a community level, Mr. Gilliam is a Director of Altavista Life Saving & First Aid Crew, Inc. and holds a seat on the Altavista Industrial Development Authority. He is a member and past President of the Altavista Lions Club and a past President of the Altavista Area Chamber of Commerce. Mr. Gilliam was honored as the Altavista Area Chamber of Commerce Business Person of the Year for 2006. He has served as a Director of the Altavista Area YMCA and the Greater Lynchburg Community Trust. Mr. Gilliam is an active member and ordained elder of Altavista Presbyterian Church.
Mr. Gilliam received his bachelor degree in Economics and Business Administration from Guilford College, Greensboro, North Carolina, and is a graduate of the Virginia Bankers School of Bank Management at the University of Virginia.
Mr. Gilliam’s three year term on the Richmond Fed Board will run through December 31, 2010.
59
PINNACLE BANKSHARES CORPORATION
AND SUBSIDIARY
Shareholder Information
PERFORMANCE GRAPH
The graph below compares total returns assuming reinvestment of dividends of Pinnacle Bankshares Common Stock, the NASDAQ Market Index, and an Industry Peer Group Index. The graph assumes $100 invested on December 31, 2002 in Pinnacle Bankshares Corporation Common Stock and in each of the indices. In 2007, the financial holding companies in the SIC Code Index consisted of 245 banks with the same standard industry code of 6022 as Pinnacle Bankshares Corporation.
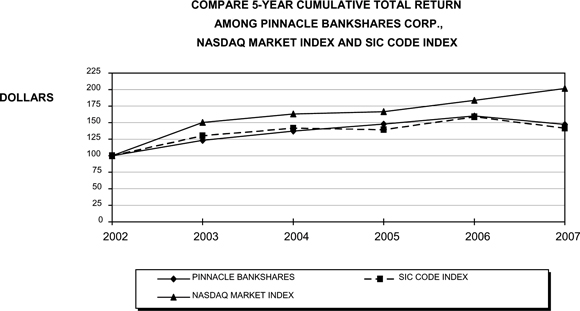
ASSUMES $100 INVESTED ON DEC. 31, 2002
ASSUMES DIVIDEND REINVESTED
FISCAL YEAR ENDING DEC. 31, 2007
| | | | | | | | | | | | |
| | | Cumulative Total Returns For Fiscal Year Ending |
| | | 2002 | | 2003 | | 2004 | | 2005 | | 2006 | | 2007 |
Pinnacle Bankshares Corporation | | 100.00 | | 123.04 | | 137.32 | | 147.80 | | 159.87 | | 147.46 |
SIC Code Index 6022 | | 100.00 | | 130.40 | | 141.81 | | 139.44 | | 158.68 | | 141.53 |
NASDAQ Market Index | | 100.00 | | 150.36 | | 163.00 | | 166.58 | | 183.68 | | 201.91 |
60
PINNACLE BANKSHARES CORPORATION
AND SUBSIDIARY
Shareholder Information
Annual Meeting
The 2008 Annual Meeting of Shareholders will be held on April 8, 2008, at 11:30 a.m. at the Fellowship Hall of Altavista Presbyterian Church, located at 707 Broad Street, Altavista, Virginia.
Market for Common Equity and Related Stockholder Matters
The Company’s Common Stock is quoted on the OTC Bulletin Board. The following table presents the high and low bid prices per share of the Common Stock, as reported on the OTC Bulletin Board, and dividend information of the Company for the quarters presented. The high and low bid prices of the Common Stock presented below reflect inter-dealer prices and do not include retail markups, markdowns or commissions, and may not represent actual transactions.
| | | | | | | | | | | | | | | | | | |
| | | 2007 | | 2006 |
| | | High | | Low | | Dividends | | High | | Low | | Dividends |
First Quarter | | $ | 28.00 | | $ | 22.10 | | $ | 0.15 | | $ | 22.00 | | $ | 21.00 | | $ | 0.13 |
Second Quarter | | $ | 25.90 | | $ | 22.70 | | $ | 0.15 | | $ | 23.00 | | $ | 21.05 | | $ | 0.13 |
Third Quarter | | $ | 24.60 | | $ | 23.80 | | $ | 0.15 | | $ | 22.00 | | $ | 20.05 | | $ | 0.14 |
Fourth Quarter | | $ | 24.75 | | $ | 19.91 | | $ | 0.15 | | $ | 25.40 | | $ | 20.75 | | $ | 0.15 |
Each share of Common Stock is entitled to participate equally in dividends, which are payable as and when determined by the Board of Directors after consideration of the earnings, general economic conditions, the financial condition of the business and other factors as might be appropriate. The Company’s ability to pay dividends is dependent upon its receipt of dividends from its subsidiary. Prior approval from the Comptroller of the Currency is required if the total of all dividends declared by a national bank, including the proposed dividend, in any calendar year will exceed the sum of the Bank’s net profits for that year and its retained net profits for the preceding two calendar years, less any required transfers to surplus. This limitation has not had a material impact on the Bank’s ability to declare dividends during 2007 and 2006 and is not expected to have a material impact during 2008.
As of December 31, 2007, there were approximately 377 shareholders of record of Bankshares’ Common Stock.
Requests for Information
Requests for information about the Company should be directed to Bryan M. Lemley, Secretary, Treasurer and Chief Financial Officer, P.O. Box 29, Altavista, Virginia 24517, telephone (434) 369-3000.A copy of the Company’s Annual Report on Form 10-K for the year ended December 31, 2007, will be furnished without charge to shareholders upon written request after March 31, 2008.
Shareholders seeking information regarding lost certificates and dividends should contact Registrar and Transfer Company in Cranford, New Jersey, telephone (800) 368-5948. Please submit address changes in writing to:
Registrar and Transfer Company
Investor Relations Department
10 Commerce Drive
Cranford, New Jersey 07016-9982