
Irene M. Prezelj
Vice President
Investor Relations
FirstEnergy Corp.
76 S. Main Street
Akron, Ohio 44308
Tel 330-384-3859
January 21, 2014
TO THE INVESTMENT COMMUNITY:
Today, FirstEnergy Corp. (FE) announced that its Board of Directors declared a quarterly dividend of $0.36 per share of outstanding common stock. The dividend will be payable March 1, 2014, to shareholders of record at the close of business on February 7, 2014.
This revised quarterly dividend rate equates to an annual dividend of $1.44 per share. The previous dividend rate was $0.55 per share quarterly and $2.20 per share annually.
The Board considered multiple objectives in determining the dividend level, including:
| ▪ | Aligning the dividend with FirstEnergy’s targeted business mix (80+% regulated and <20% competitive) |
| ▪ | Reflecting impacts of economic conditions, competitive market realities and requirements to continue to meet more costly regulatory and environmental mandates |
| ▪ | Providing shareholders with a solid, sustainable dividend fully supported by earnings from the regulated utility and transmission businesses |
| ▪ | Providing balance sheet capacity to invest in transmission growth initiatives and create value for shareholders |
2014 Operating Earnings Guidance
FirstEnergy also announced 2014 operating earnings2 guidance of $2.45 to $2.85 per share. The following chart provides operating earnings guidance by segment:
| Basic Operating Earnings | $/Share | % of EPS Contribution | |
| Regulated Distribution | $1.85 - $2.05 | 73% | |
| Regulated Transmission | 0.52 - 0.58 | 21% | |
| Sub-Total | $2.37 - $2.63 | 94% | |
| Competitive Energy Services | 0.35 - 0.49 | 6% | |
| Corporate/Other | (0.27) | ||
| FirstEnergy Corp. Consolidated | $2.45 - $2.85 | ||
_______________
1 Please see the Forward-looking Statements on page 3
2 See GAAP to Operating Earnings reconciliation on pages 2 and 25
Specific 2014 earnings drivers by segment are included on pages 8-10. In addition, high-level earnings drivers for 2015 and 2016 are included on pages 26-27.
2013 Operating Earnings Guidance
FirstEnergy is scheduled to report fourth quarter and full year 2013 results on February 25, 2014. For 2013, operating earnings guidance has been narrowed to $2.95 to $3.05 per share from $2.90 to $3.10 per share. The midpoint of 2013 operating earnings guidance is used as the starting point for the year-over-year earnings guidance comparisons that begin on page 7.
GAAP to Operating Earnings* Reconciliation
| Estimate for Year 2013 | Estimate for Year 2014 | ||
| Basic Earnings Per Share (GAAP) | $0.83-$0.99 | $2.19-$2.63 | |
Excluding Special Items: | |||
| Plant Closing Costs | 1.01 | 0.08 – 0.12 | |
| Regulatory Charges | 0.54 | 0.05 | |
| Merger Accounting-Commodity Contracts | 0.08 | 0.06 | |
| Impact of Non-Core Asset Sales/Impairments | 0.03 | 0.03 | |
| Debt Redemption Costs | 0.20 | -- | |
| WV Asset Transfer Charges | 0.51 | -- | |
| Restructuring Costs | 0.01 | -- | |
| Trust Securities Impairment | 0.12 | -- | |
| Mark-to-Market Adjustments | |||
| Pension/OPEB actuarial assumptions | (0.34-0.40) | -- | |
| Other | (0.04) | -- | |
| Basic Earnings Per Share (Operating*) | $2.95-$3.05 | $2.45-$2.85 | |
| Basic Average Shares Outstanding | 418M | 420M | |
* Operating earnings exclude special items as described in the reconciliation table above,
and are a non-GAAP financial measure
Upcoming Investor Events
February 25, 2014 – 4th Quarter Earnings Call
March 3, 2014 – Morgan Stanley Utilities Conference (New York)
March 4, 2014 – UBS 2014 Natural Gas & Utilities Conference (Boston)
If you have any questions concerning the information in this update, please contact me at (330) 384-3859, Meghan Beringer, director of Investor Relations, at (330) 384-5832 or Rey Jimenez, manager of Investor Relations, at (330) 761-4239.
Sincerely,

Irene M. Prezelj
Vice President, Investor Relations

Forward-looking Statements This letter includes forward-looking statements based on information currently available to management. Such statements are subject to certain risks and uncertainties. These statements include declarations regarding management's intents, beliefs and current expectations. These statements typically contain, but are not limited to, the terms “anticipate,” “potential,” “expect,” "will," "intend," “believe,” “estimate” and similar words. Forward-looking statements involve estimates, assumptions, known and unknown risks, uncertainties and other factors that may cause actual results, performance or achievements to be materially different from any future results, performance or achievements expressed or implied by such forward-looking statements. Actual results may differ materially due to the speed and nature of increased competition in the electric utility industry, in general, and the retail sales market in particular; the impact of the regulatory process on the pending matters before the Federal Energy Regulatory Commission and in the various states in which we do business including, but not limited to, matters related to rates and pending rate cases; the uncertainties of various cost recovery and cost allocation issues resulting from American Transmission Systems, Incorporated's realignment into PJM Interconnection LLC; economic or weather conditions affecting future sales and margins; regulatory outcomes associated with storm restoration, including but not limited to Hurricane Sandy, Hurricane Irene and the October snowstorm of 2011; changing energy, capacity and commodity market prices including, but not limited to, coal, natural gas and oil, and availability and their impact on retail margins; the continued ability of our regulated utilities to recover their costs; costs being higher than anticipated and the success of our policies to control costs and to mitigate low energy, capacity and market prices; other legislative and regulatory changes, and revised environmental requirements, including possible greenhouse gas emission, water discharge, water intake and coal combustion residual regulations, the potential impacts of Cross-State Air Pollution Rule, Clean Air Interstate Rule (CAIR), and/or any laws, rules or regulations that ultimately replace CAIR, and the effects of the United States Environmental Protection Agency's Mercury and Air Toxics Standards rules including our estimated costs of compliance; the uncertainty of the timing and amounts of the capital expenditures that may arise in connection with any litigation, including New Source Review litigation or potential regulatory initiatives or rulemakings (including that such expenditures could result in our decision to deactivate or idle certain generating units); the uncertainties associated with the deactivation of certain older regulated and competitive fossil units including the impact on vendor commitments, and the timing thereof as they relate to, among other things, Reliability Must-Run arrangements and the reliability of the transmission grid; adverse regulatory or legal decisions and outcomes with respect to our nuclear operations (including, but not limited to the revocation or non-renewal of necessary licenses, approvals or operating permits by the Nuclear Regulatory Commission or as a result of the incident at Japan's Fukushima Daiichi Nuclear Plant); issues arising from the indications of cracking in the shield building at Davis-Besse; the impact of future changes to the operational status or availability of our generating units; the risks and uncertainties associated with litigation, arbitration, mediation and like proceedings, including, but not limited to, any such proceedings related to vendor commitments; replacement power costs being higher than anticipated or not fully hedged; the ability to comply with applicable state and federal reliability standards and energy efficiency and peak demand reduction mandates; changes in customers' demand for power, including but not limited to, changes resulting from the implementation of state and federal energy efficiency and peak demand reduction mandates; the ability to accomplish or realize anticipated benefits from strategic and financial goals including, but not limited to, the successful implementation of our transmission plan, the ability to reduce costs and to successfully complete our announced financial plans designed to improve our credit metrics and strengthen our balance sheet, including but not limited to, the benefits from our announced dividend reduction and our proposed capital raising and debt reduction initiatives, and the proposed sale of non-core hydro assets; our ability to improve electric commodity margins and the impact of, among other factors, the increased cost of fuel and fuel transportation on such margins; the ability to experience growth in the Regulated Distribution and Regulated Transmission segments and to continue to successfully implement our direct retail sales strategy in the Competitive Energy Services segment; changing market conditions that could affect the measurement of liabilities and the value of assets held in our Nuclear Decommissioning Trusts, pension trusts and other trust funds, and cause us and our subsidiaries to make additional contributions sooner, or in amounts that are larger than currently anticipated; the impact of changes to material accounting policies; the ability to access the public securities and other capital and credit markets in accordance with our announced financial plan, the cost of such capital and overall condition of the capital and credit markets affecting us and our subsidiaries; actions that may be taken by credit rating agencies that could negatively affect us and our subsidiaries' access to financing, increase the costs thereof, and increase requirements to post additional collateral to support outstanding commodity positions, letters of credit and other financial guarantees; changes in national and regional economic conditions affecting us, our subsidiaries and our major industrial and commercial customers, and other counterparties including fuel suppliers, with which we do business; issues concerning the stability of domestic and foreign financial institutions and counterparties with which we do business; the risks and other factors discussed from time to time in our United States Securities and Exchange Commission filings, and other similar factors. Dividends declared from time to time on FirstEnergy Corp.'s common stock during any period may in the aggregate vary from prior periods due to circumstances considered by FirstEnergy Corp.'s Board of Directors at the time of the actual declarations. A security rating is not a recommendation to buy or hold securities and is subject to revision or withdrawal at any time by the assigning rating agency. Each rating should be evaluated independently of any other rating. The foregoing review of factors should not be construed as exhaustive. New factors emerge from time to time, and it is not possible for management to predict all such factors, nor assess the impact of any such factor on FirstEnergy's business or the extent to which any factor, or combination of factors, may cause results to differ materially from those contained in any forward-looking statements. FirstEnergy expressly disclaims any current intention to update, except as required by law, any forward-looking statements contained herein as a result of new information, future events or otherwise.
Non-GAAP Financial Matters This letter contains references to non-GAAP financial measures including, among others, Operating earnings, Adjusted EBITDA, and Funds from Operations (FFO). Operating earnings are not calculated in accordance with GAAP because they exclude the impact of "special items." Adjusted EBITDA also excludes the impact of special items and represents Operating earnings before interest expense, investment income, taxes, depreciation and amortization. Generally, a non-GAAP financial measure is a numerical measure of a company's historical or future financial performance, financial position, or cash flows that either excludes or includes amounts that are not normally excluded or included in the most directly comparable measure calculated and presented in accordance with accounting principles generally accepted in the United States (GAAP). Management uses non-GAAP financial measures, such as Operating earnings, Adjusted EBITDA, and FFO, to evaluate the company’s performance and manage its operations and frequently references these non-GAAP financial measures in its decision-making, using them to facilitate historical and ongoing performance comparisons. Management believes that the non-GAAP financial measures of “Operating earnings,” “Adjusted EBITDA,” and “FFO” provide consistent and comparable measures of performance of its businesses to help shareholders understand performance trends. All of these non-GAAP financial measures are intended to complement, and are not considered as an alternative to, the most directly comparable GAAP financial measures. Also, the non-GAAP financial measures may not be comparable to similarly titled measures used by other entities. Pursuant to the requirements of Regulation G, FirstEnergy has provided quantitative reconciliations within the presentation of the non-GAAP financial measures to the most directly comparable GAAP financial measures. Table of Contents FirstEnergy Corp. Segment Descriptions 5 2014 Operating Earnings Guidance by Segment 6 FirstEnergy Consolidated – 2014 Operating Earnings Guidance 7 Regulated Distribution – 2014 Operating Earnings Guidance 8 Regulated Transmission – 2014 Operating Earnings Guidance 9 Competitive Energy Services – 2014 Operating Earnings Guidance 10 Competitive Energy Services – Sales Targets, Outlook and Power Price Trends 11-13 Corporate/Other - 2014 Operating Earnings Guidance 14 Revised 2013 Operating Earnings Guidance by Segment 15 2014 vs. 2013 Operating Earnings Drivers by Segment 16 Capital Expenditures – 2013F and 2014F 17-18 Cash Flow – 2013F and 2014F 19-20 Funds from Operations Reconciliation – 2013F and 2014F 21 Competitive Energy Services – Net Income to Adjusted EBITDA Reconciliation 22 Competitive Energy Services – Special Items 23 GAAP to Operating Earnings Reconciliation – 2013 and 2014 24-25 Earnings Drivers – 2015 and 2016 26-27
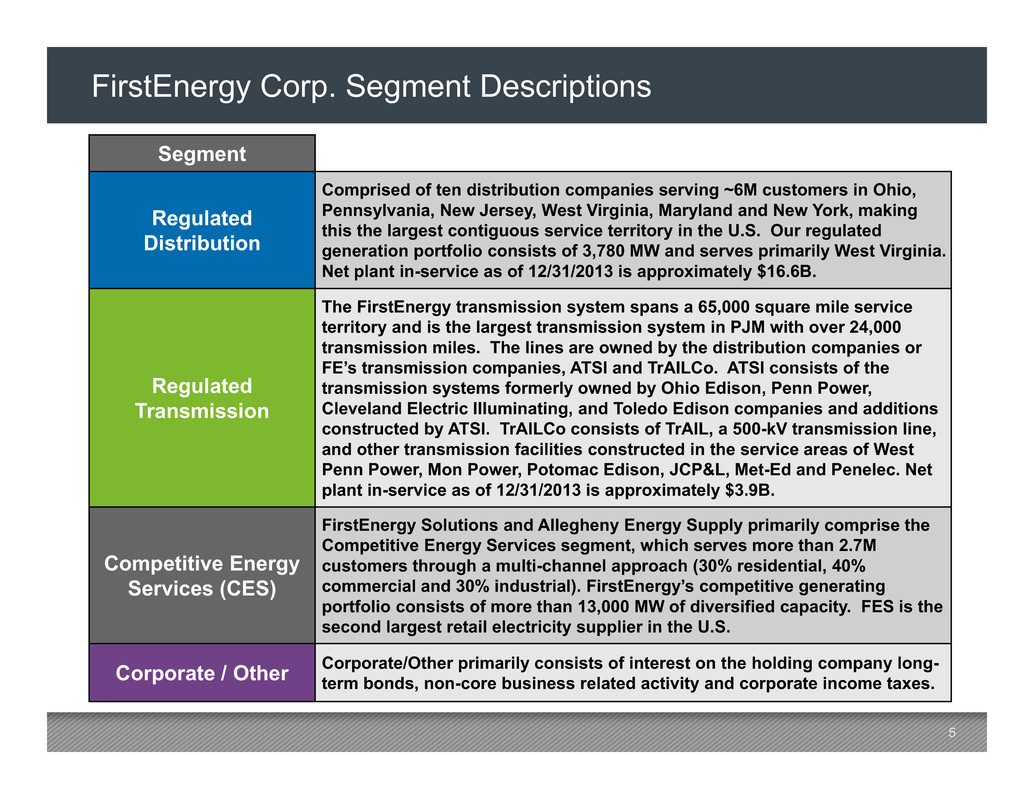
5 Segment Regulated Distribution Comprised of ten distribution companies serving ~6M customers in Ohio, Pennsylvania, New Jersey, West Virginia, Maryland and New York, making this the largest contiguous service territory in the U.S. Our regulated generation portfolio consists of 3,780 MW and serves primarily West Virginia. Net plant in-service as of 12/31/2013 is approximately $16.6B. Regulated Transmission The FirstEnergy transmission system spans a 65,000 square mile service territory and is the largest transmission system in PJM with over 24,000 transmission miles. The lines are owned by the distribution companies or FE’s transmission companies, ATSI and TrAILCo. ATSI consists of the transmission systems formerly owned by Ohio Edison, Penn Power, Cleveland Electric Illuminating, and Toledo Edison companies and additions constructed by ATSI. TrAILCo consists of TrAIL, a 500-kV transmission line, and other transmission facilities constructed in the service areas of West Penn Power, Mon Power, Potomac Edison, JCP&L, Met-Ed and Penelec. Net plant in-service as of 12/31/2013 is approximately $3.9B. Competitive Energy Services (CES) FirstEnergy Solutions and Allegheny Energy Supply primarily comprise the Competitive Energy Services segment, which serves more than 2.7M customers through a multi-channel approach (30% residential, 40% commercial and 30% industrial). FirstEnergy’s competitive generating portfolio consists of more than 13,000 MW of diversified capacity. FES is the second largest retail electricity supplier in the U.S. Corporate / Other Corporate/Other primarily consists of interest on the holding company long-term bonds, non-core business related activity and corporate income taxes. FirstEnergy Corp. Segment Descriptions
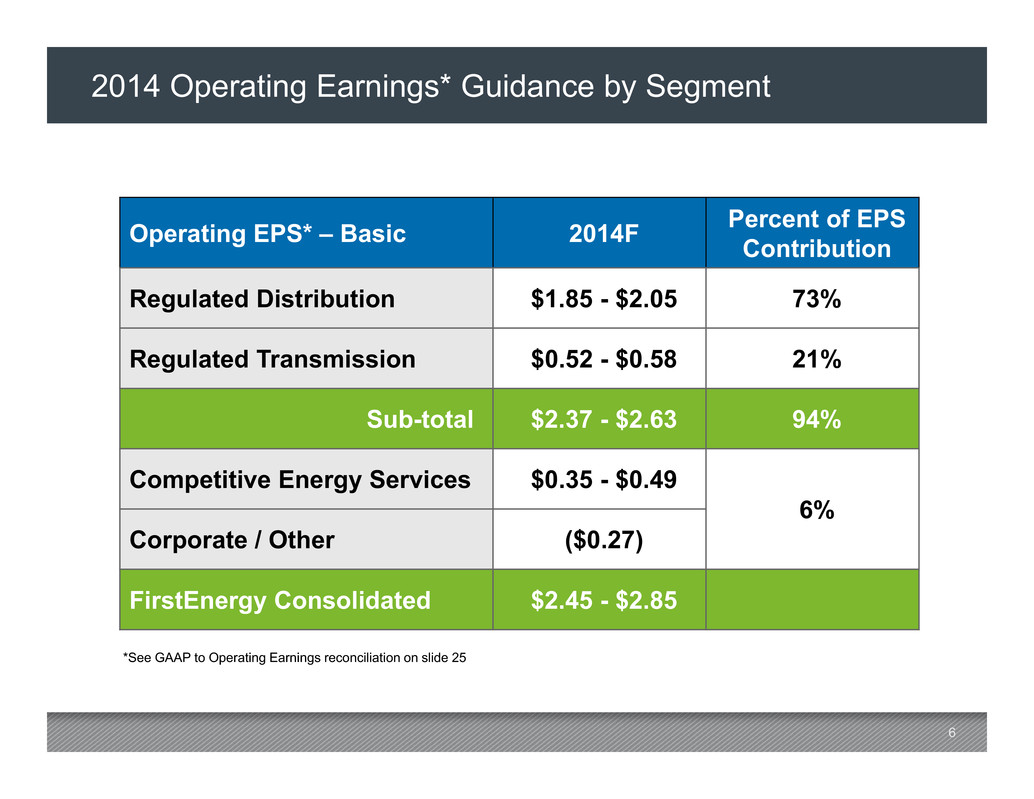
6 2014 Operating Earnings* Guidance by Segment Operating EPS* – Basic 2014F Percent of EPS Contribution Regulated Distribution $1.85 - $2.05 73% Regulated Transmission $0.52 - $0.58 21% Sub-total $2.37 - $2.63 94% Competitive Energy Services $0.35 - $0.49 6% Corporate / Other ($0.27) FirstEnergy Consolidated $2.45 - $2.85 *See GAAP to Operating Earnings reconciliation on slide 25

7 2014 Operating Earnings* Guidance $2.95 - $3.05 $/share FirstEnergy Consolidated – 2014 Operating Earnings* Guidance $2.45 - $2.85 2013 Operating Earnings* Guidance *See GAAP to Operating Earnings reconciliation on slides 24-25 $2.00 $2.50 $3.00 $3.50 Drivers Distribution Revenue $0.06 Transmission Revenue $0.06 Reg Gen Operating Margin $0.03 O&M $0.13 Effective Income Tax Rate $0.06 CES Commodity Margin ($0.55) Pension / OPEB ($0.05) General Taxes ($0.01) Net Financing Costs ($0.08)
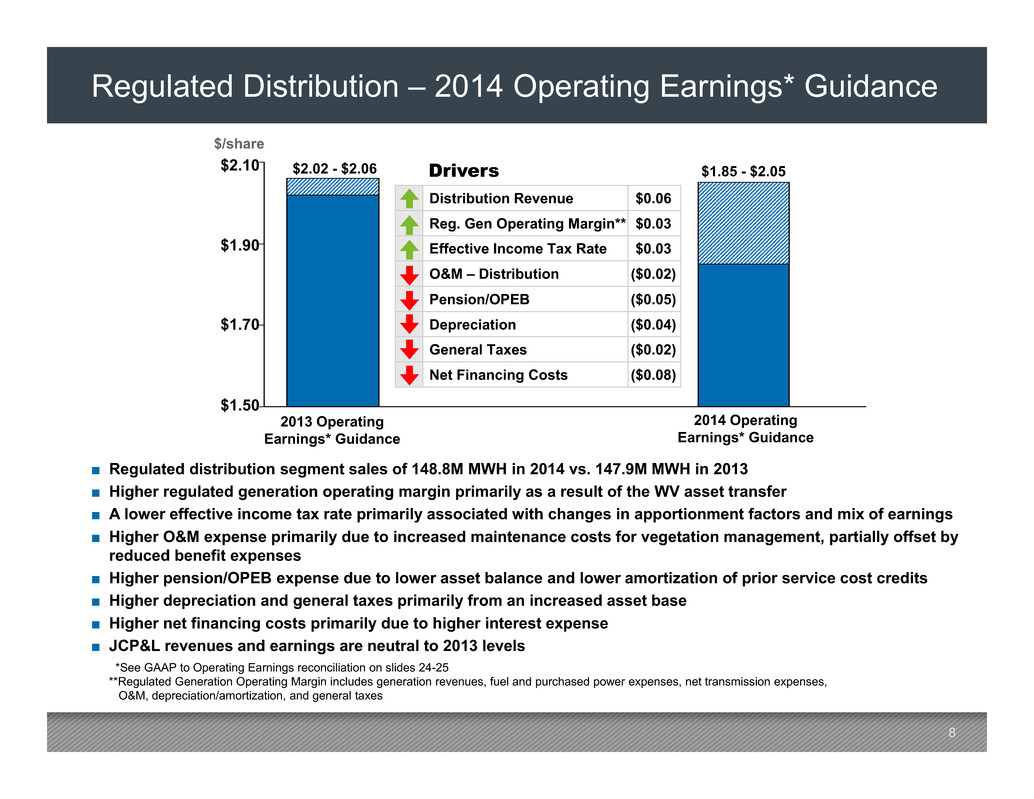
8 Regulated Distribution – 2014 Operating Earnings* Guidance ■ Regulated distribution segment sales of 148.8M MWH in 2014 vs. 147.9M MWH in 2013 ■ Higher regulated generation operating margin primarily as a result of the WV asset transfer ■ A lower effective income tax rate primarily associated with changes in apportionment factors and mix of earnings ■ Higher O&M expense primarily due to increased maintenance costs for vegetation management, partially offset by reduced benefit expenses ■ Higher pension/OPEB expense due to lower asset balance and lower amortization of prior service cost credits ■ Higher depreciation and general taxes primarily from an increased asset base ■ Higher net financing costs primarily due to higher interest expense ■ JCP&L revenues and earnings are neutral to 2013 levels *See GAAP to Operating Earnings reconciliation on slides 24-25 **Regulated Generation Operating Margin includes generation revenues, fuel and purchased power expenses, net transmission expenses, O&M, depreciation/amortization, and general taxes 2013 Operating Earnings* Guidance 2014 Operating Earnings* Guidance $2.02 - $2.06 $/share $1.85 - $2.05 $1.50 $1.70 $1.90 $2.10 Drivers Distribution Revenue $0.06 Reg. Gen Operating Margin** $0.03 Effective Income Tax Rate $0.03 O&M – Distribution ($0.02) Pension/OPEB ($0.05) Depreciation ($0.04) General Taxes ($0.02) Net Financing Costs ($0.08)
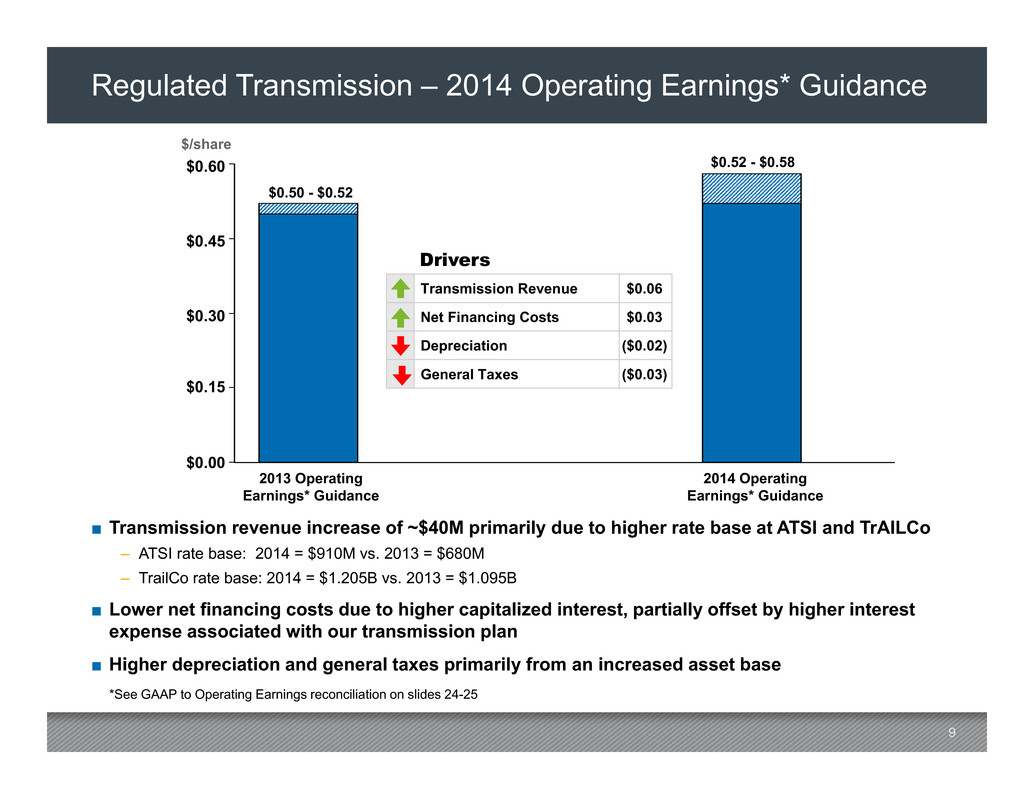
9 Regulated Transmission – 2014 Operating Earnings* Guidance ■ Transmission revenue increase of ~$40M primarily due to higher rate base at ATSI and TrAILCo – ATSI rate base: 2014 = $910M vs. 2013 = $680M – TrailCo rate base: 2014 = $1.205B vs. 2013 = $1.095B ■ Lower net financing costs due to higher capitalized interest, partially offset by higher interest expense associated with our transmission plan ■ Higher depreciation and general taxes primarily from an increased asset base *See GAAP to Operating Earnings reconciliation on slides 24-25 2013 Operating Earnings* Guidance 2014 Operating Earnings* Guidance $0.00 $0.15 $0.30 $0.45 $0.60 $/share Drivers Transmission Revenue $0.06 Net Financing Costs $0.03 Depreciation ($0.02) General Taxes ($0.03) $0.50 - $0.52 $0.52 - $0.58
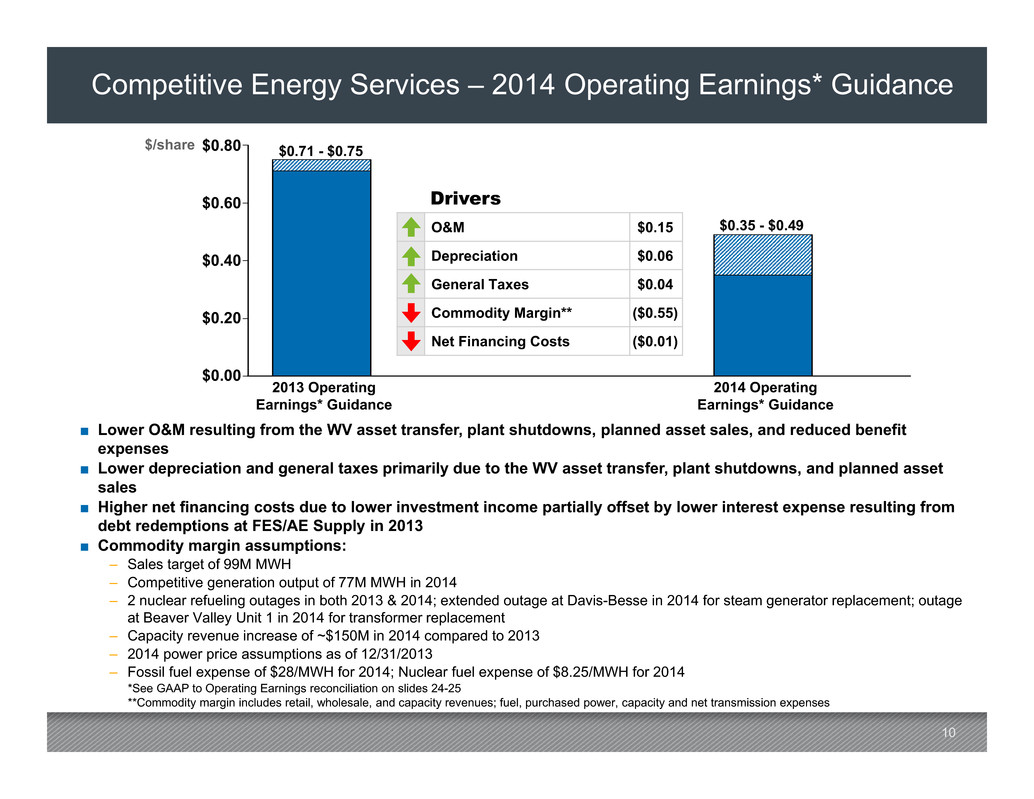
10 Competitive Energy Services – 2014 Operating Earnings* Guidance ■ Lower O&M resulting from the WV asset transfer, plant shutdowns, planned asset sales, and reduced benefit expenses ■ Lower depreciation and general taxes primarily due to the WV asset transfer, plant shutdowns, and planned asset sales ■ Higher net financing costs due to lower investment income partially offset by lower interest expense resulting from debt redemptions at FES/AE Supply in 2013 ■ Commodity margin assumptions: – Sales target of 99M MWH – Competitive generation output of 77M MWH in 2014 – 2 nuclear refueling outages in both 2013 & 2014; extended outage at Davis-Besse in 2014 for steam generator replacement; outage at Beaver Valley Unit 1 in 2014 for transformer replacement – Capacity revenue increase of ~$150M in 2014 compared to 2013 – 2014 power price assumptions as of 12/31/2013 – Fossil fuel expense of $28/MWH for 2014; Nuclear fuel expense of $8.25/MWH for 2014 *See GAAP to Operating Earnings reconciliation on slides 24-25 **Commodity margin includes retail, wholesale, and capacity revenues; fuel, purchased power, capacity and net transmission expenses 2013 Operating Earnings* Guidance 2014 Operating Earnings* Guidance $/share $0.00 $0.20 $0.40 $0.60 $0.80 Drivers O&M $0.15 Depreciation $0.06 General Taxes $0.04 Commodity Margin** ($0.55) Net Financing Costs ($0.01) $0.35 - $0.49 $0.71 - $0.75
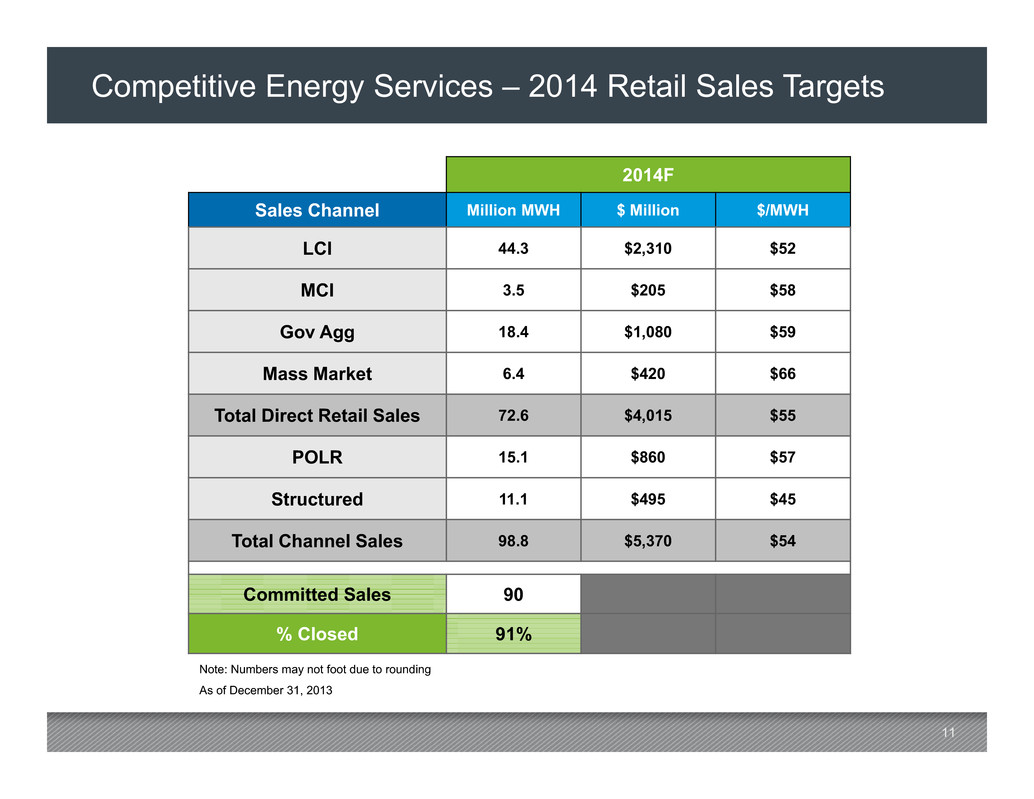
11 Competitive Energy Services – 2014 Retail Sales Targets 2014F Sales Channel Million MWH $ Million $/MWH LCI 44.3 $2,310 $52 MCI 3.5 $205 $58 Gov Agg 18.4 $1,080 $59 Mass Market 6.4 $420 $66 Total Direct Retail Sales 72.6 $4,015 $55 POLR 15.1 $860 $57 Structured 11.1 $495 $45 Total Channel Sales 98.8 $5,370 $54 Committed Sales 90 % Closed 91% Note: Numbers may not foot due to rounding As of December 31, 2013
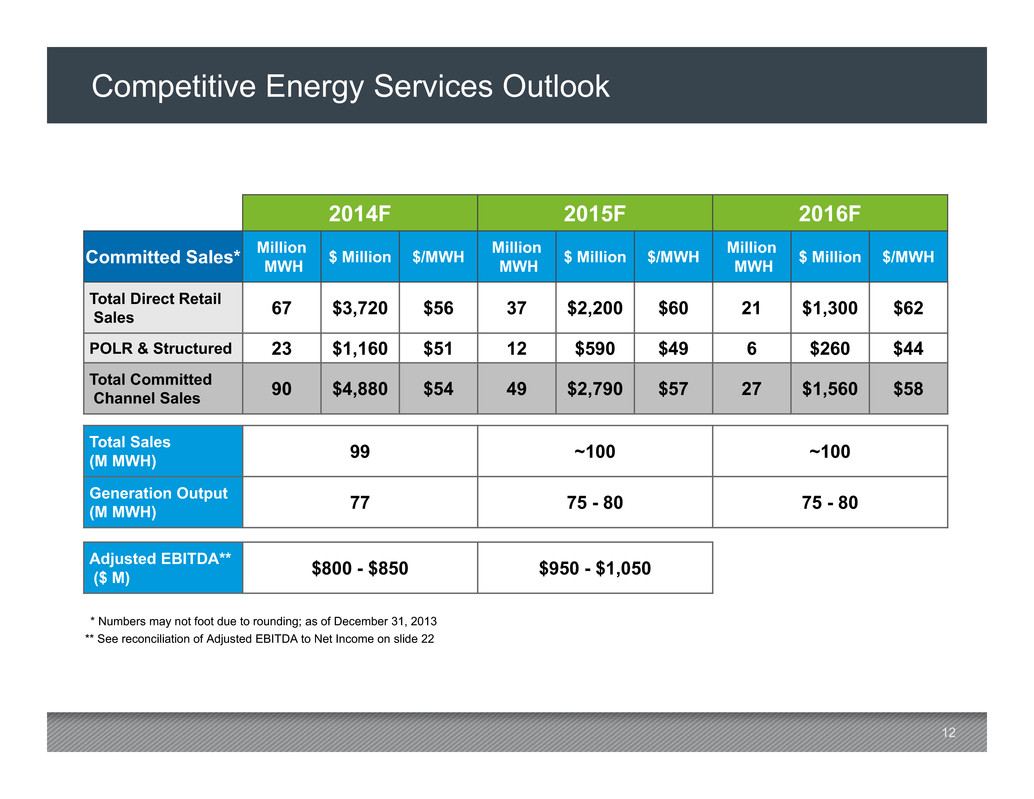
12 Competitive Energy Services Outlook 2014F 2015F 2016F Committed Sales* Million MWH $ Million $/MWH Million MWH $ Million $/MWH Million MWH $ Million $/MWH Total Direct Retail Sales 67 $3,720 $56 37 $2,200 $60 21 $1,300 $62 POLR & Structured 23 $1,160 $51 12 $590 $49 6 $260 $44 Total Committed Channel Sales 90 $4,880 $54 49 $2,790 $57 27 $1,560 $58 Total Sales (M MWH) 99 ~100 ~100 Generation Output (M MWH) 77 75 - 80 75 - 80 Adjusted EBITDA** ($ M) $800 - $850 $950 - $1,050 * Numbers may not foot due to rounding; as of December 31, 2013 ** See reconciliation of Adjusted EBITDA to Net Income on slide 22
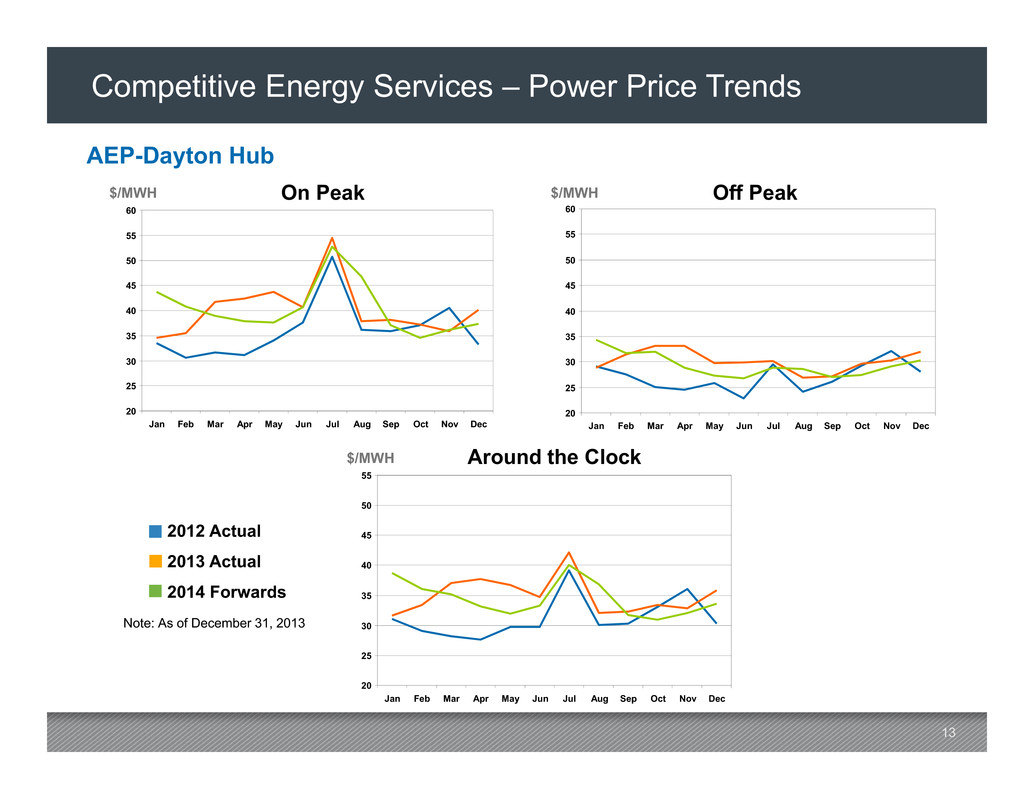
13 20 25 30 35 40 45 50 55 60 Jan Feb Mar Apr May Jun Jul Aug Sep Oct Nov Dec 20 25 30 35 40 45 50 55 60 Jan Feb Mar Apr May Jun Jul Aug Sep Oct Nov Dec 20 25 30 35 40 45 50 55 Jan Feb Mar Apr May Jun Jul Aug Sep Oct Nov Dec Competitive Energy Services – Power Price Trends 2012 Actual 2013 Actual 2014 Forwards Note: As of December 31, 2013 Around the Clock On Peak Off Peak AEP-Dayton Hub $/MWH $/MWH $/MWH
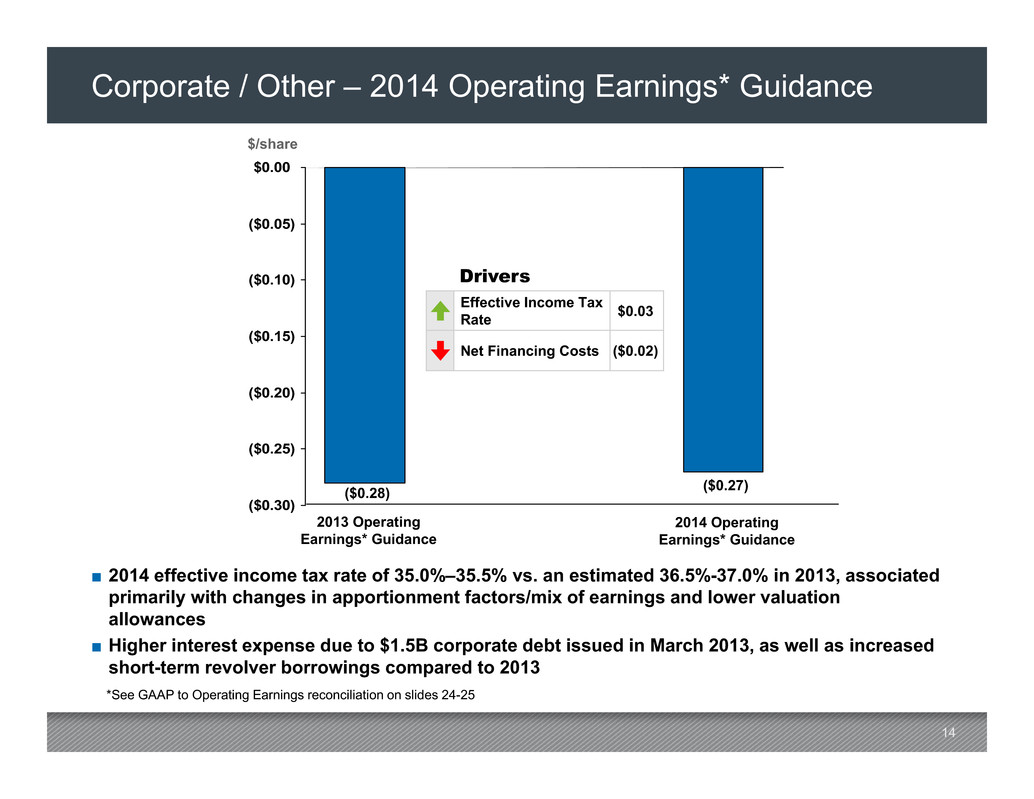
14 Corporate / Other – 2014 Operating Earnings* Guidance ■ 2014 effective income tax rate of 35.0%–35.5% vs. an estimated 36.5%-37.0% in 2013, associated primarily with changes in apportionment factors/mix of earnings and lower valuation allowances ■ Higher interest expense due to $1.5B corporate debt issued in March 2013, as well as increased short-term revolver borrowings compared to 2013 *See GAAP to Operating Earnings reconciliation on slides 24-25 ($0.30) ($0.25) ($0.20) ($0.15) ($0.10) ($0.05) $0.00 2013 Operating Earnings* Guidance 2014 Operating Earnings* Guidance ($0.28) $/share ($0.27) Drivers Effective Income Tax Rate $0.03 Net Financing Costs ($0.02)
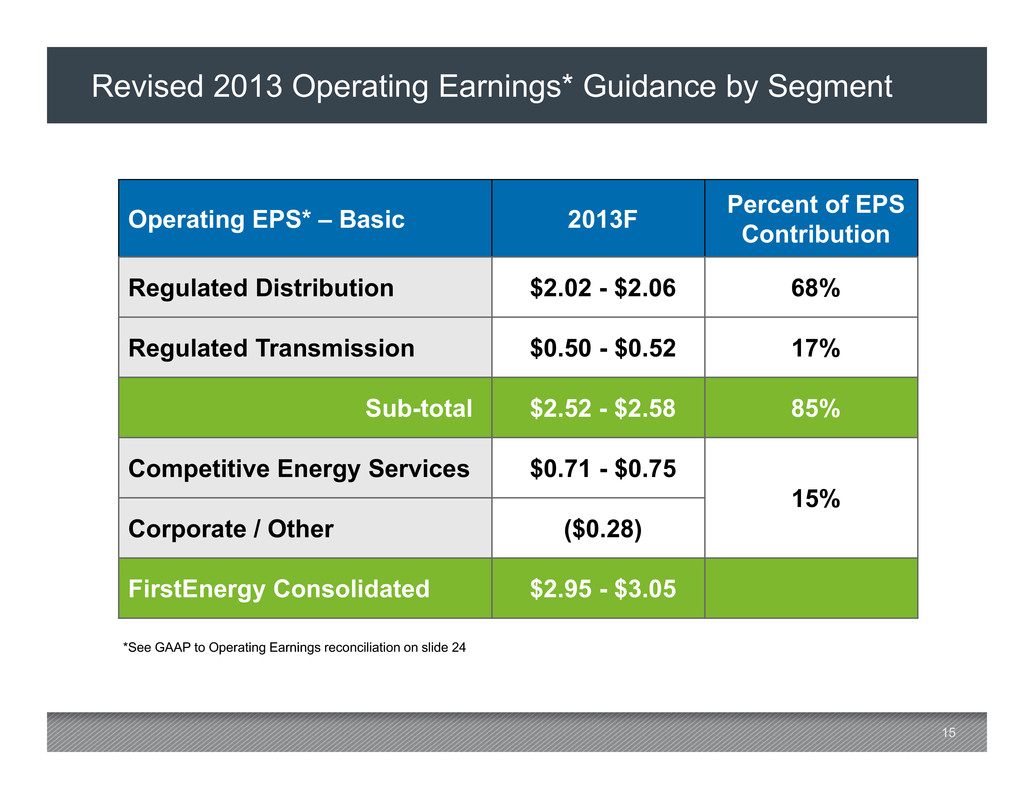
15 Revised 2013 Operating Earnings* Guidance by Segment Operating EPS* – Basic 2013F Percent of EPS Contribution Regulated Distribution $2.02 - $2.06 68% Regulated Transmission $0.50 - $0.52 17% Sub-total $2.52 - $2.58 85% Competitive Energy Services $0.71 - $0.75 15% Corporate / Other ($0.28) FirstEnergy Consolidated $2.95 - $3.05 *See GAAP to Operating Earnings reconciliation on slide 24
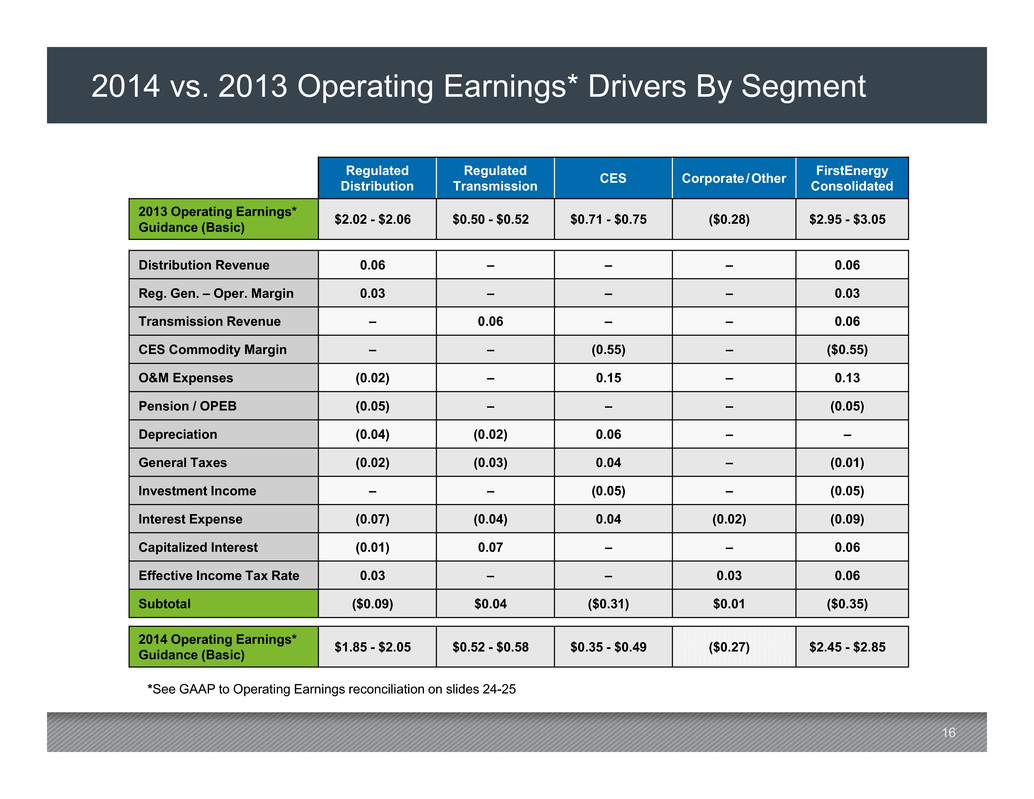
16 2014 vs. 2013 Operating Earnings* Drivers By Segment Regulated Distribution Regulated Transmission CES Corporate /Other FirstEnergy Consolidated 2013 Operating Earnings* Guidance (Basic) $2.02 - $2.06 $0.50 - $0.52 $0.71 - $0.75 ($0.28) $2.95 - $3.05 Distribution Revenue 0.06 – – – 0.06 Reg. Gen. – Oper. Margin 0.03 – – – 0.03 Transmission Revenue – 0.06 – – 0.06 CES Commodity Margin – – (0.55) – ($0.55) O&M Expenses (0.02) – 0.15 – 0.13 Pension / OPEB (0.05) – – – (0.05) Depreciation (0.04) (0.02) 0.06 – – General Taxes (0.02) (0.03) 0.04 – (0.01) Investment Income – – (0.05) – (0.05) Interest Expense (0.07) (0.04) 0.04 (0.02) (0.09) Capitalized Interest (0.01) 0.07 – – 0.06 Effective Income Tax Rate 0.03 – – 0.03 0.06 Subtotal ($0.09) $0.04 ($0.31) $0.01 ($0.35) 2014 Operating Earnings* Guidance (Basic) $1.85 - $2.05 $0.52 - $0.58 $0.35 - $0.49 ($0.27) $2.45 - $2.85 *See GAAP to Operating Earnings reconciliation on slides 24-25
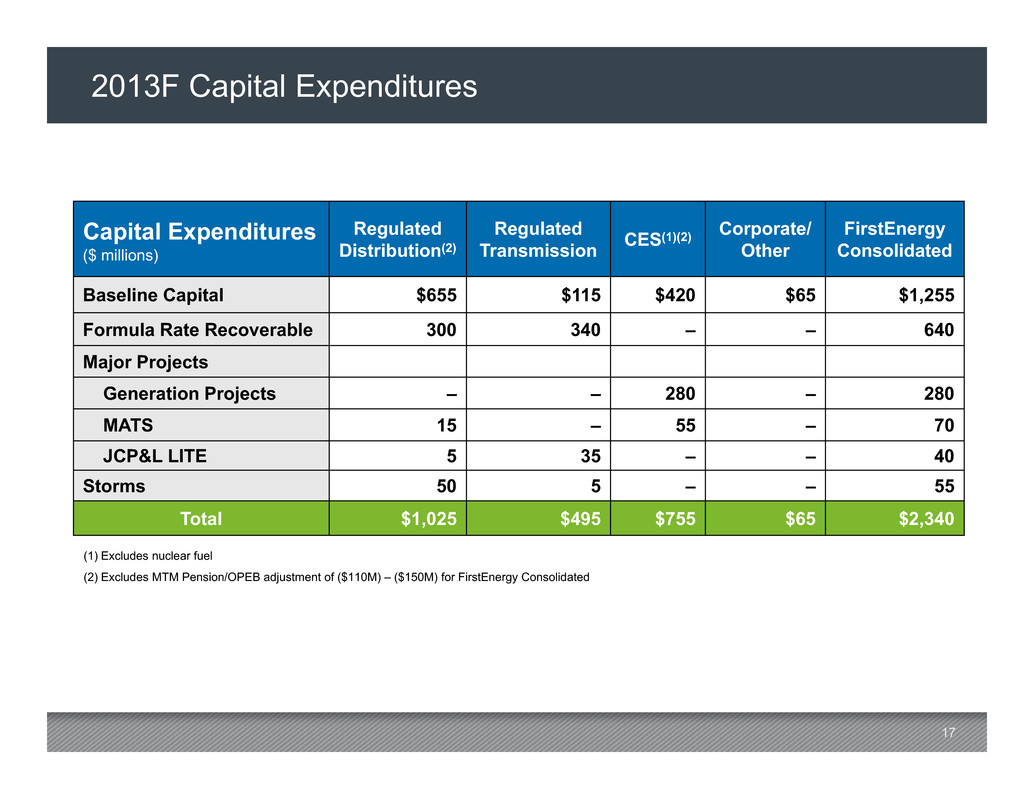
17 2013F Capital Expenditures (1) Excludes nuclear fuel (2) Excludes MTM Pension/OPEB adjustment of ($110M) – ($150M) for FirstEnergy Consolidated Capital Expenditures ($ millions) Regulated Distribution(2) Regulated Transmission CES (1)(2) Corporate/ Other FirstEnergy Consolidated Baseline Capital $655 $115 $420 $65 $1,255 Formula Rate Recoverable 300 340 – – 640 Major Projects Generation Projects – – 280 – 280 MATS 15 – 55 – 70 JCP&L LITE 5 35 – – 40 Storms 50 5 – – 55 Total $1,025 $495 $755 $65 $2,340
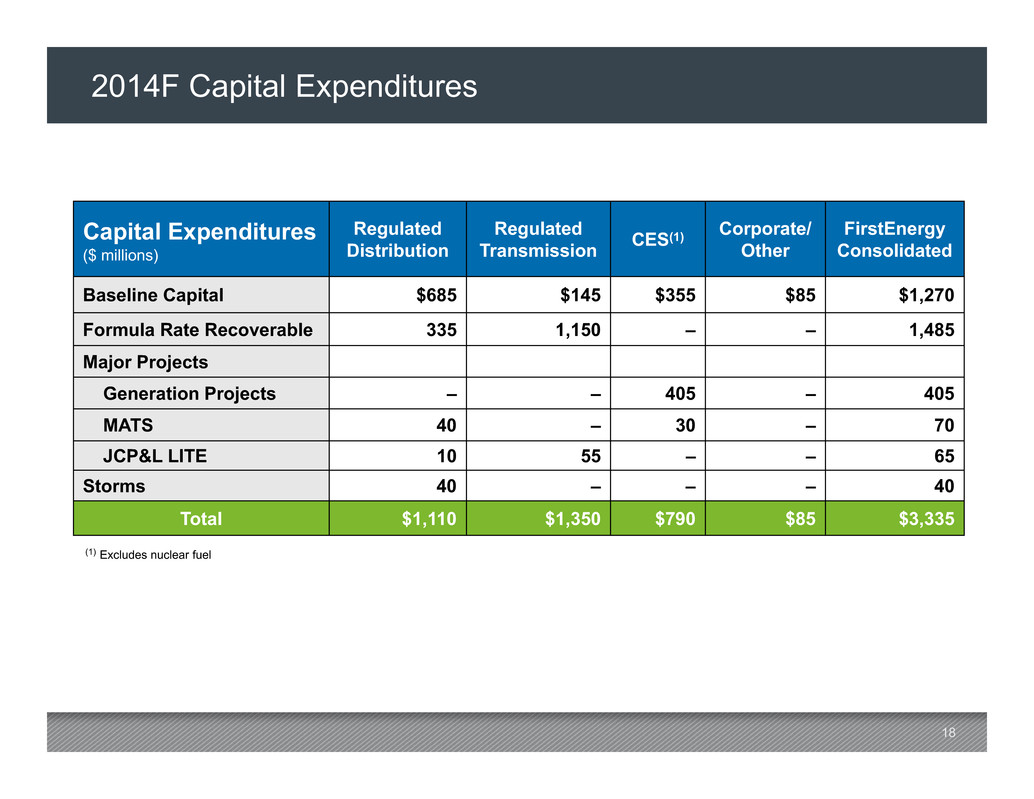
18 2014F Capital Expenditures Capital Expenditures ($ millions) Regulated Distribution Regulated Transmission CES (1) Corporate/ Other FirstEnergy Consolidated Baseline Capital $685 $145 $355 $85 $1,270 Formula Rate Recoverable 335 1,150 – – 1,485 Major Projects Generation Projects – – 405 – 405 MATS 40 – 30 – 70 JCP&L LITE 10 55 – – 65 Storms 40 – – – 40 Total $1,110 $1,350 $790 $85 $3,335 (1) Excludes nuclear fuel
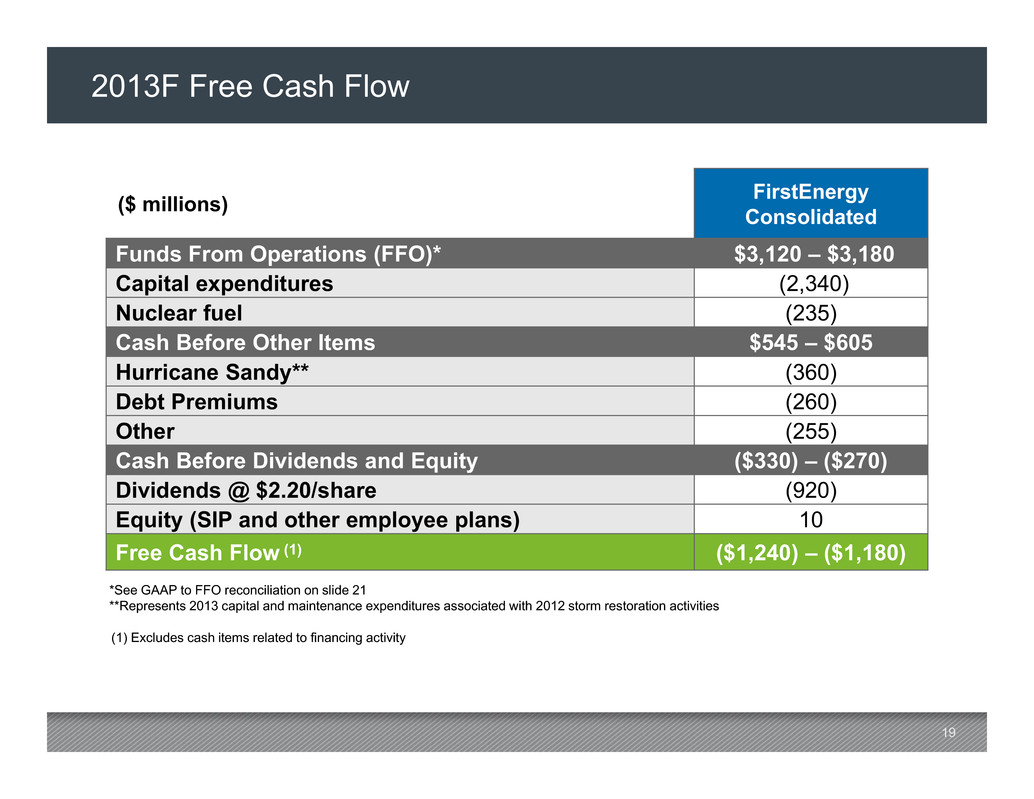
19 2013F Free Cash Flow ($ millions) FirstEnergy Consolidated Funds From Operations (FFO)* $3,120 – $3,180 Capital expenditures (2,340) Nuclear fuel (235) Cash Before Other Items $545 – $605 Hurricane Sandy** (360) Debt Premiums (260) Other (255) Cash Before Dividends and Equity ($330) – ($270) Dividends @ $2.20/share (920) Equity (SIP and other employee plans) 10 Free Cash Flow (1) ($1,240) – ($1,180) (1) Excludes cash items related to financing activity *See GAAP to FFO reconciliation on slide 21 **Represents 2013 capital and maintenance expenditures associated with 2012 storm restoration activities

20 2014F Free Cash Flow ($ millions) FirstEnergy Consolidated Funds From Operations (FFO)* $2,715 – $2,915 Capital expenditures (3,335) Nuclear fuel (290) Cash Before Other Items ($910) – ($710) Hydro Asset Sales 390 Other 50 Cash Before Dividends and Equity ($470) – ($270) Dividends @ $1.44/share (605) Equity (SIP and other employee plans) 80 Free Cash Flow (1) ($995) – ($795) (1) Excludes cash items related to financing activity *See GAAP to FFO reconciliation on slide 21
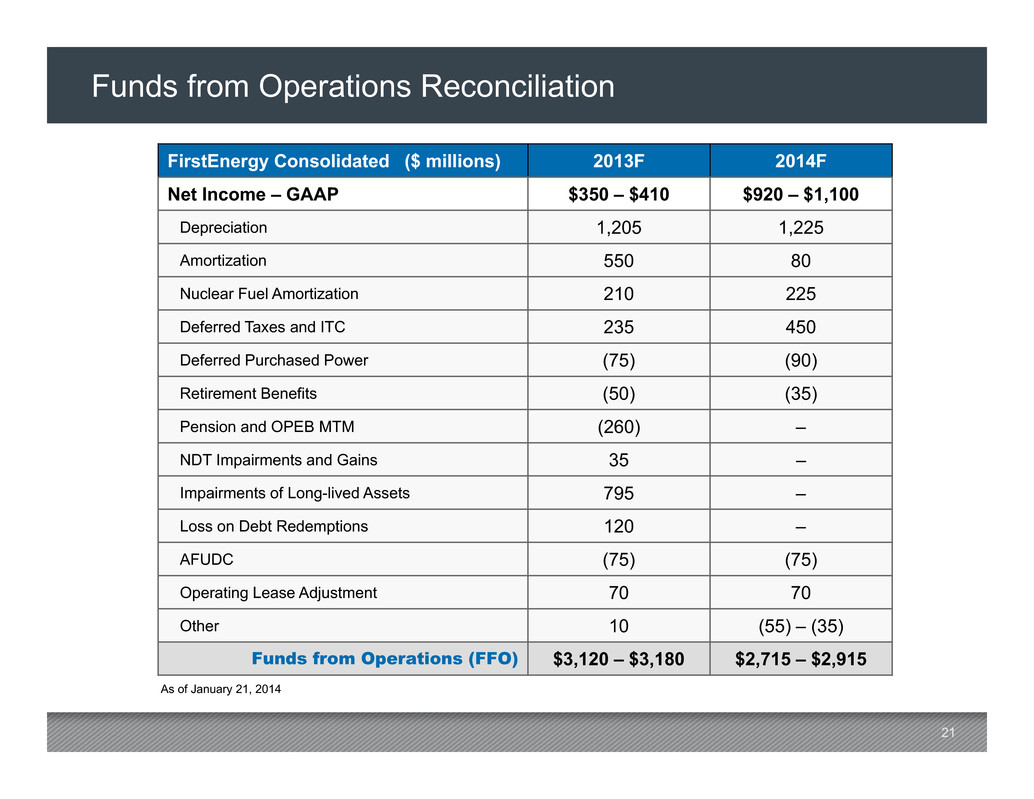
21 Funds from Operations Reconciliation As of January 21, 2014 FirstEnergy Consolidated ($ millions) 2013F 2014F Net Income – GAAP $350 – $410 $920 – $1,100 Depreciation 1,205 1,225 Amortization 550 80 Nuclear Fuel Amortization 210 225 Deferred Taxes and ITC 235 450 Deferred Purchased Power (75) (90) Retirement Benefits (50) (35) Pension and OPEB MTM (260) – NDT Impairments and Gains 35 – Impairments of Long-lived Assets 795 – Loss on Debt Redemptions 120 – AFUDC (75) (75) Operating Lease Adjustment 70 70 Other 10 (55) – (35) Funds from Operations (FFO) $3,120 – $3,180 $2,715 – $2,915

22 Competitive Energy Services – Net Income to Adjusted EBITDA* Reconciliation * Adjusted EBITDA represents GAAP net income adjusted for the special items listed on slide 23 and the addition of income taxes; interest expense, net; depreciation and amortization and other income **Does not include nuclear fuel amortization of approximately $225 million in 2014 and 2015 ($ millions) 2014F 2015F Net Income – GAAP $60 – $135 $160 – $290 Special Items* 90 – 70 80 – 50 Operating Earnings $150 - $205 $240 - $340 Income Taxes 85 – 125 145 – 200 Interest Expense, Net 170 – 160 165 – 150 Depreciation & Amortization ** 470 – 460 475 – 460 Other Income (75) – (100) (75) – (100) Adjusted EBITDA $800 – $850 $950 – $1,050
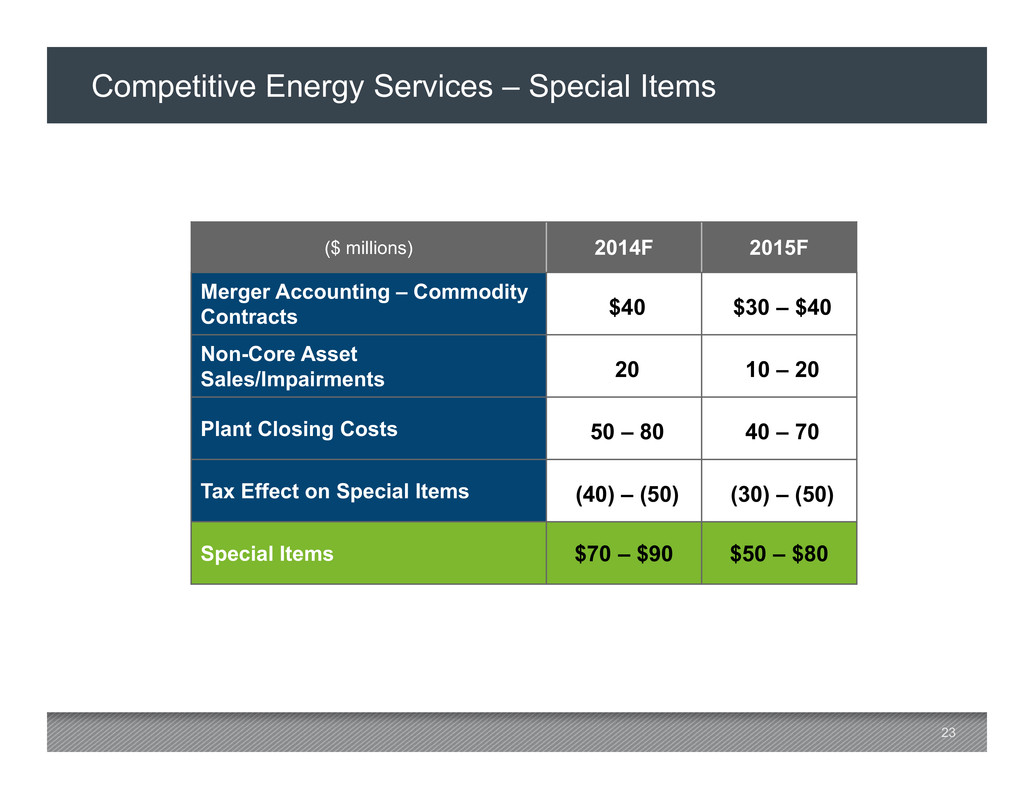
23 Competitive Energy Services – Special Items ($ millions) 2014F 2015F Merger Accounting – Commodity Contracts $40 $30 – $40 Non-Core Asset Sales/Impairments 20 10 – 20 Plant Closing Costs 50 – 80 40 – 70 Tax Effect on Special Items (40) – (50) (30) – (50) Special Items $70 – $90 $50 – $80
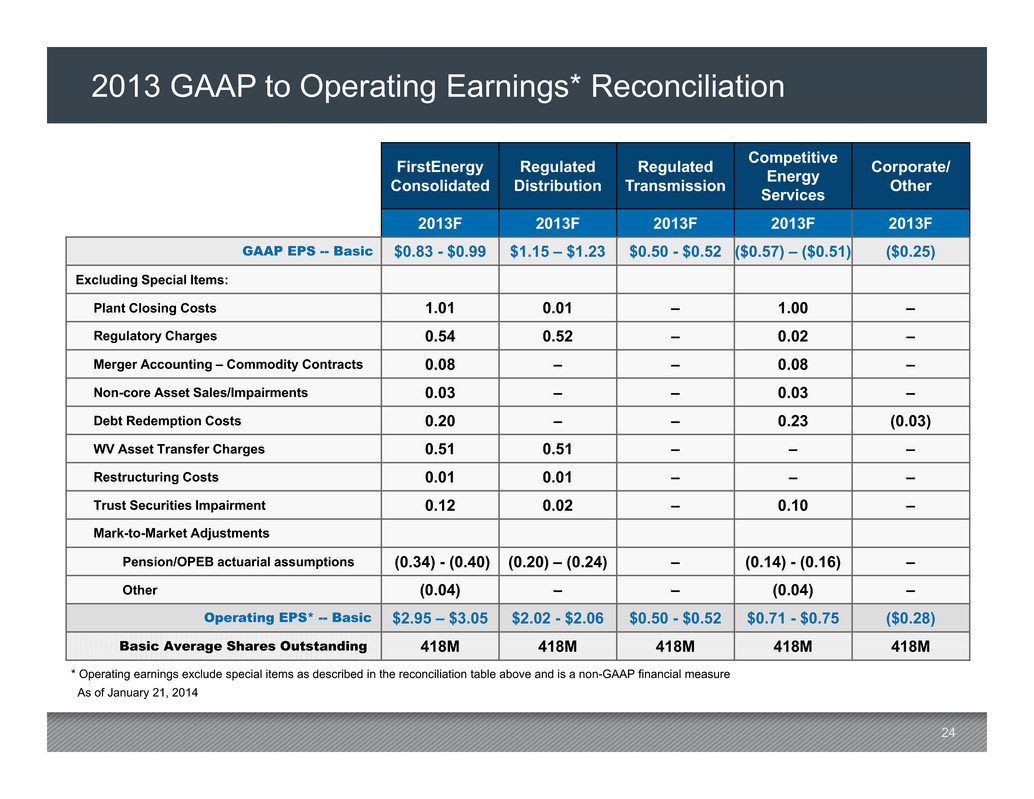
24 2013 GAAP to Operating Earnings* Reconciliation FirstEnergy Consolidated Regulated Distribution Regulated Transmission Competitive Energy Services Corporate/ Other 2013F 2013F 2013F 2013F 2013F GAAP EPS -- Basic $0.83 - $0.99 $1.15 – $1.23 $0.50 - $0.52 ($0.57) – ($0.51) ($0.25) Excluding Special Items: Plant Closing Costs 1.01 0.01 – 1.00 – Regulatory Charges 0.54 0.52 – 0.02 – Merger Accounting – Commodity Contracts 0.08 – – 0.08 – Non-core Asset Sales/Impairments 0.03 – – 0.03 – Debt Redemption Costs 0.20 – – 0.23 (0.03) WV Asset Transfer Charges 0.51 0.51 – – – Restructuring Costs 0.01 0.01 – – – Trust Securities Impairment 0.12 0.02 – 0.10 – Mark-to-Market Adjustments Pension/OPEB actuarial assumptions (0.34) - (0.40) (0.20) – (0.24) – (0.14) - (0.16) – Other (0.04) – – (0.04) – Operating EPS* -- Basic $2.95 – $3.05 $2.02 - $2.06 $0.50 - $0.52 $0.71 - $0.75 ($0.28) Basic Average Shares Outstanding 418M 418M 418M 418M 418M As of January 21, 2014 * Operating earnings exclude special items as described in the reconciliation table above and is a non-GAAP financial measure

25 2014 GAAP to Operating Earnings* Reconciliation FirstEnergy Consolidated Regulated Distribution Regulated Transmission Competitive Energy Services Corporate/ Other 2014F 2014F 2014F 2014F 2014F GAAP EPS -- Basic $2.19 - $2.63 $1.80 – $2.00 $0.52 - $0.58 $0.14 - $0.32 ($0.27) Excluding Special Items: Plant Closing Costs 0.08 – 0.12 – – 0.08 – 0.12 – Regulatory Charges 0.05 0.05 – – – Merger Accounting – Commodity Contracts 0.06 – – 0.06 – Non-core Asset Sales/Impairments 0.03 – – 0.03 – Operating EPS* -- Basic $2.45 – $2.85 $1.85 - $2.05 $0.52 - $0.58 $0.35 - $0.49 ($0.27) Basic Average Shares Outstanding 420M 420M 420M 420M 420M As of January 21, 2014 * Operating earnings exclude special items as described in the reconciliation table above and is a non-GAAP financial measure
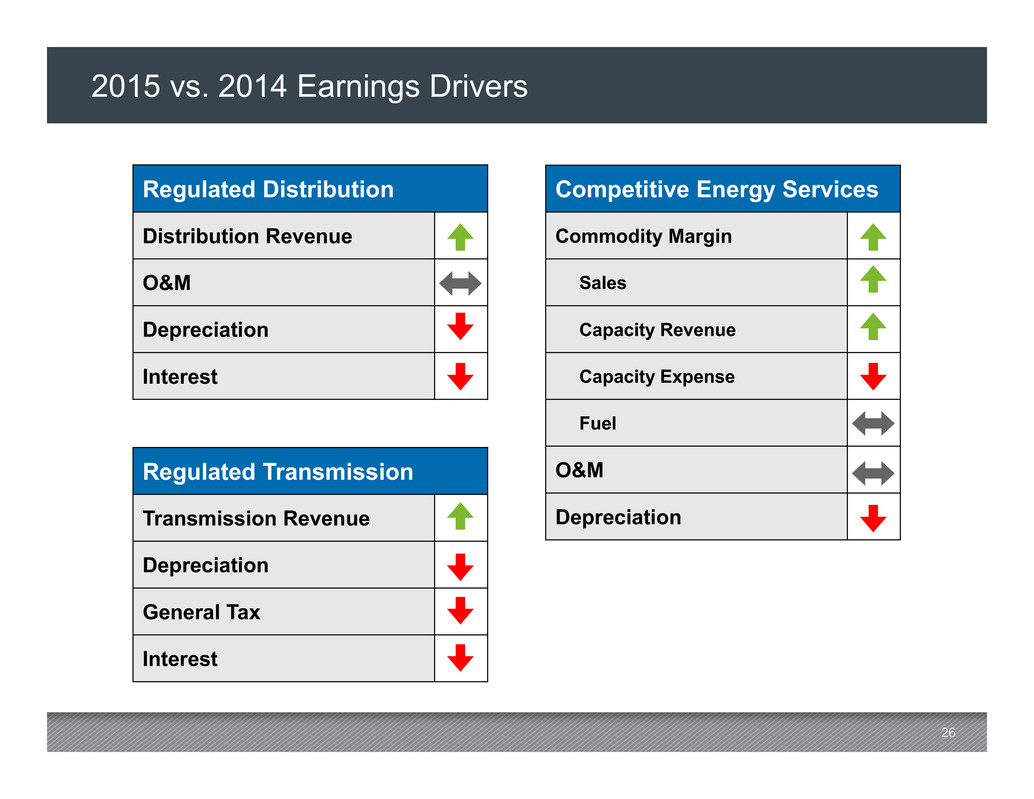
26 2015 vs. 2014 Earnings Drivers Regulated Distribution Distribution Revenue O&M Depreciation Interest Regulated Transmission Transmission Revenue Depreciation General Tax Interest Competitive Energy Services Commodity Margin Sales Capacity Revenue Capacity Expense Fuel O&M Depreciation
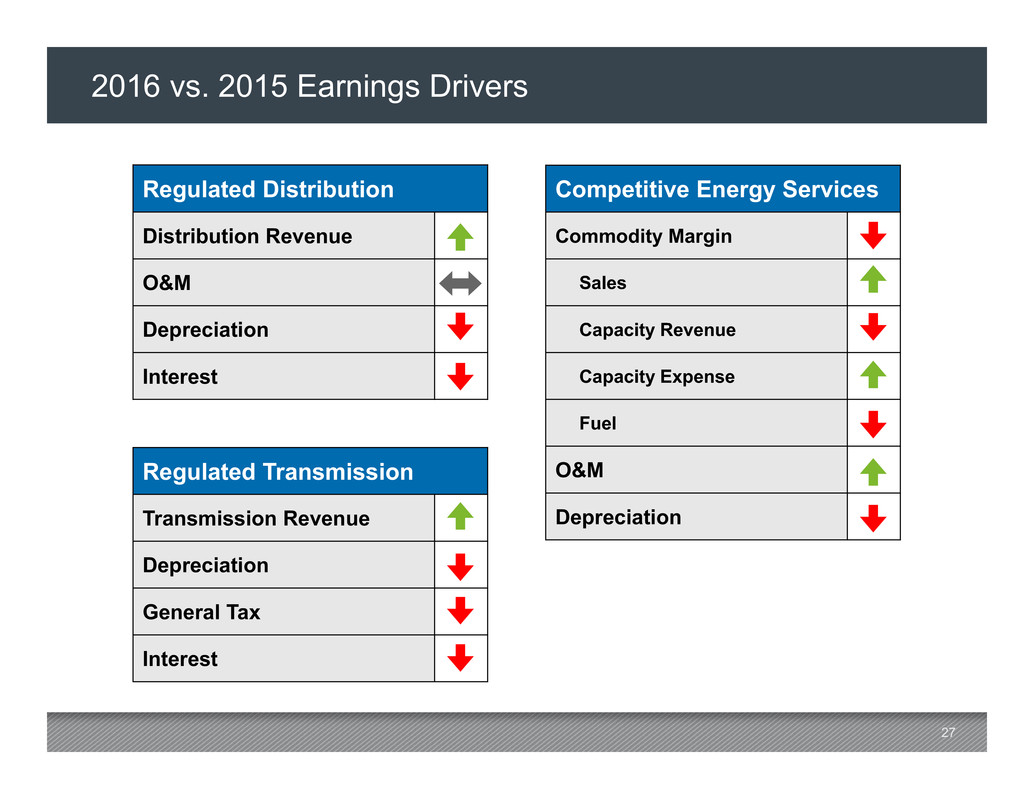
27 2016 vs. 2015 Earnings Drivers Regulated Distribution Distribution Revenue O&M Depreciation Interest Regulated Transmission Transmission Revenue Depreciation General Tax Interest Competitive Energy Services Commodity Margin Sales Capacity Revenue Capacity Expense Fuel O&M Depreciation