
Focused on Our Future 1Q 2021 Strategic & Financial Highlights John W. Somerhalder II, Vice-Chairperson and Executive Director Steven E. Strah, President and CEO K. Jon Taylor, SVP and CFO
Forward-Looking Statements Forward-Looking Statements: This presentation includes forward-looking statements within the meaning of the Private Securities Litigation Reform Act of 1995 based on information currently available to management. Such statements are subject to certain risks and uncertainties and readers are cautioned not to place undue reliance on these forward-looking statements. These statements include declarations regarding management’s intents, beliefs and current expectations. These statements typically contain, but are not limited to, the terms “anticipate,” “potential,” “expect,” “forecast,” “target,” “will,” “intend,” “believe,” “project,” “estimate,” “plan” and similar words. Forward-looking statements involve estimates, assumptions, known and unknown risks, uncertainties and other factors that may cause actual results, performance or achievements to be materially different from any future results, performance or achievements expressed or implied by such forward-looking statements, which may include the following: the effectiveness of our ongoing discussions with the U.S. Attorney’s Office of the S.D. Ohio to resolve its investigation with respect to us; the results of the internal investigation and evaluation of our controls framework and remediation of our material weakness in internal control over financial reporting; the risks and uncertainties associated with government investigations regarding Ohio House Bill 6 and related matters including potential adverse impacts on federal or state regulatory matters including, but not limited to, matters relating to rates; the potential of non-compliance with debt covenants in our credit facilities due to matters associated with the government investigations regarding Ohio House Bill 6 and related matters; the risks and uncertainties associated with litigation, arbitration, mediation and similar proceedings; legislative and regulatory developments, including, but not limited to, matters related to rates, compliance and enforcement activity; the ability to accomplish or realize anticipated benefits from strategic and financial goals, including, but not limited to, maintaining financial flexibility, overcoming current uncertainties and challenges associated with the ongoing government investigations, executing our transmission and distribution investment plans, greenhouse gas reduction goals, controlling costs, improving our credit metrics, strengthening our balance sheet and growing earnings; economic and weather conditions affecting future operating results, such as a recession, significant weather events and other natural disasters, and associated regulatory events or actions in response to such conditions; mitigating exposure for remedial activities associated with retired and formerly owned electric generation assets; the ability to access the public securities and other capital and credit markets in accordance with our financial plans, the cost of such capital and overall condition of the capital and credit markets affecting us, including the increasing number of financial institutions evaluating the impact of climate change on their investment decisions; the extent and duration of COVID-19 and the impacts to our business, operations and financial condition resulting from the outbreak of COVID-19 including, but not limited to, disruption of businesses in our territories, volatile capital and credit markets, legislative and regulatory actions, including the vaccine’s efficacy and the effectiveness of its distribution; the effectiveness of our pandemic and business continuity plans, the precautionary measures we are taking on behalf of our customers, contractors and employees, our customers’ ability to make their utility payment and the potential for supply-chain disruptions; actions that may be taken by credit rating agencies that could negatively affect either our access to or terms of financing or our financial condition and liquidity; changes in assumptions regarding economic conditions within our territories, the reliability of our transmission and distribution system, or the availability of capital or other resources supporting identified transmission and distribution investment opportunities; changes in customers’ demand for power, including, but not limited to, the impact of climate change or energy efficiency and peak demand reduction mandates; changes in national and regional economic conditions affecting us and/or our major industrial and commercial customers or others with which we do business; the risks associated with cyber-attacks and other disruptions to our information technology system, which may compromise our operations, and data security breaches of sensitive data, intellectual property and proprietary or personally identifiable information; the ability to comply with applicable reliability standards and energy efficiency and peak demand reduction mandates; changes to environmental laws and regulations, including, but not limited to, those related to climate change; changing market conditions affecting the measurement of certain liabilities and the value of assets held in our pension trusts and other trust funds, or causing us to make contributions sooner, or in amounts that are larger, than currently anticipated; labor disruptions by our unionized workforce; changes to significant accounting policies; any changes in tax laws or regulations, or adverse tax audit results or rulings; and the risks and other factors discussed from time to time in our SEC filings. Dividends declared from time to time on FirstEnergy Corp.’s common stock during any period may in the aggregate vary from prior periods due to circumstances considered by FirstEnergy Corp.’s Board of Directors at the time of the actual declarations. A security rating is not a recommendation to buy or hold securities and is subject to revision or withdrawal at any time by the assigning rating agency. Each rating should be evaluated independently of any other rating. These forward-looking statements are also qualified by, and should be read together with, the risk factors included in FirstEnergy Corp.’s filings with the SEC, including but not limited to the most recent Annual Report on Form 10-K and any subsequent Quarterly Reports on Form 10-Q and Current Reports on Form 8-K. The foregoing review of factors also should not be construed as exhaustive. New factors emerge from time to time, and it is not possible for management to predict all such factors, nor assess the impact of any such factor on FirstEnergy Corp.’s business or the extent to which any factor, or combination of factors, may cause results to differ materially from those contained in any forward-looking statements. FirstEnergy Corp. expressly disclaims any obligation to update or revise, except as required by law, any forward-looking statements contained herein or in the information incorporated by reference as a result of new information, future events or otherwise. Strategic & Financial Highlights – Published April 22, 20212

Non-GAAP Financial Matters This presentation contains references to non-GAAP financial measures including, among others, Operating earnings (loss), Operating earnings (loss) per share, Operating earnings (loss) per share by segment, and Adjusted cash from operations. Generally, a non-GAAP financial measure is a numerical measure of a company’s historical or future financial performance, financial position, or cash flows that either excludes or includes amounts that are not normally excluded or included in the most directly comparable measure calculated and presented in accordance with accounting principles generally accepted in the United States (GAAP). Operating earnings (loss), Operating earnings (loss) per share, Operating earnings (loss) per share by segment, and Adjusted cash from operations are not calculated in accordance with GAAP to the extent they exclude the impact of “special items.” Special items represent charges incurred or benefits realized that management believes are not indicative of, or may obscure trends useful in evaluating the company’s ongoing core activities and results of operations or otherwise warrant separate classification. FirstEnergy Corp. (FE or the Company) management cannot estimate on a forward-looking basis the impact of these items in the context of Operating earnings (loss) per share, because these items, which could be significant, are difficult to predict and may be highly variable. Special items are not necessarily non-recurring. Operating earnings (loss) per share and Operating earnings (loss) per share for each segment are calculated by dividing Operating earnings (loss), which excludes special items as discussed above, by 543 million shares for the first quarter of 2021, 544 million shares for full-year 2021, and 541 million shares for the first quarter of 2020. Basic earnings per share (EPS) (GAAP) is based on 541 million shares for the first quarter of 2020, and 543 million shares for the first quarter of 2021 and 544 million shares for full-year 2021. Management uses non-GAAP financial measures such as Operating earnings (loss), Operating earnings (loss) per share, and Adjusted cash from operations to evaluate the Company’s performance and manage its operations and frequently references these non-GAAP financial measures in its decision-making, using them to facilitate historical and ongoing performance comparisons. Additionally, management uses Operating earnings (loss) per share by segment to further evaluate the Company’s performance by segment and references this non-GAAP financial measure in its decision-making. Management believes that the non-GAAP financial measures of Operating earnings (loss), Operating earnings (loss) per share, Operating earnings (loss) per share, and Adjusted cash from operations by segment provide consistent and comparable measures of performance of the Company’s businesses on an ongoing basis. Management also believes that such measures are useful to shareholders and other interested parties to understand performance trends and evaluate the Company against its peer group by presenting period-over-period operating results without the effect of certain charges or benefits that may not be consistent or comparable across periods or across the Company’s peer group. All of these non-GAAP financial measures are intended to complement, and are not considered as alternatives to, the most directly comparable GAAP financial measures. Also, the non-GAAP financial measures may not be comparable to similarly titled measures used by other entities. Pursuant to the requirements of Regulation G, FE has provided, where possible without unreasonable effort, quantitative reconciliations within this presentation of the non-GAAP financial measures to the most directly comparable GAAP financial measures. Strategic & Financial Highlights – Published April 22, 20213

1Q 2021 Strategic & Financial Highlights Steve Strah, President and CEO Strategic & Financial Highlights – Published April 22, 20214 Priorities ■ Building a world-class compliance function and culture ■ Commitment to strong underlying financials ■ FE Forward: Transformative effort to support near-term resiliency, efficiencies, and deliver long-term value ■ Taking proactive steps to reduce the regulatory uncertainty affecting our utilities ■ Investigation, Regulatory Matters, FE Forward ■ Instilling a Culture of Compliance ■ 1Q21 Results and Other Financial Topics Focus for Today’s Call: Updating 2021 GAAP earnings forecast to $1,270M-$1,380M, or $2.33-$2.53 per share Affirming 2021 Operating (non-GAAP) earnings guidance of $2.40-$2.60 per share Introducing 2Q21 GAAP and Operating (non-GAAP) earnings guidance $0.48-$0.58 per share
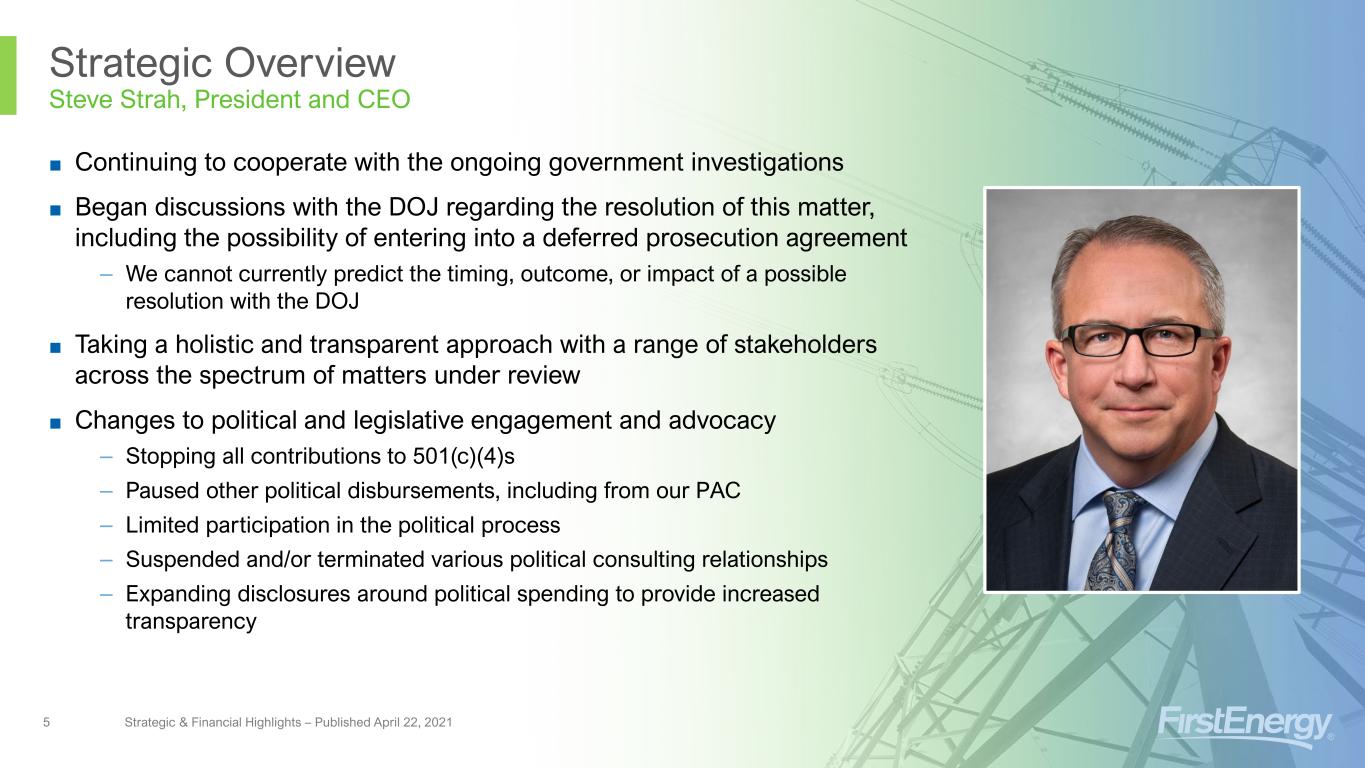
Strategic Overview Steve Strah, President and CEO ■ Continuing to cooperate with the ongoing government investigations ■ Began discussions with the DOJ regarding the resolution of this matter, including the possibility of entering into a deferred prosecution agreement – We cannot currently predict the timing, outcome, or impact of a possible resolution with the DOJ ■ Taking a holistic and transparent approach with a range of stakeholders across the spectrum of matters under review ■ Changes to political and legislative engagement and advocacy – Stopping all contributions to 501(c)(4)s – Paused other political disbursements, including from our PAC – Limited participation in the political process – Suspended and/or terminated various political consulting relationships – Expanding disclosures around political spending to provide increased transparency Strategic & Financial Highlights – Published April 22, 20215
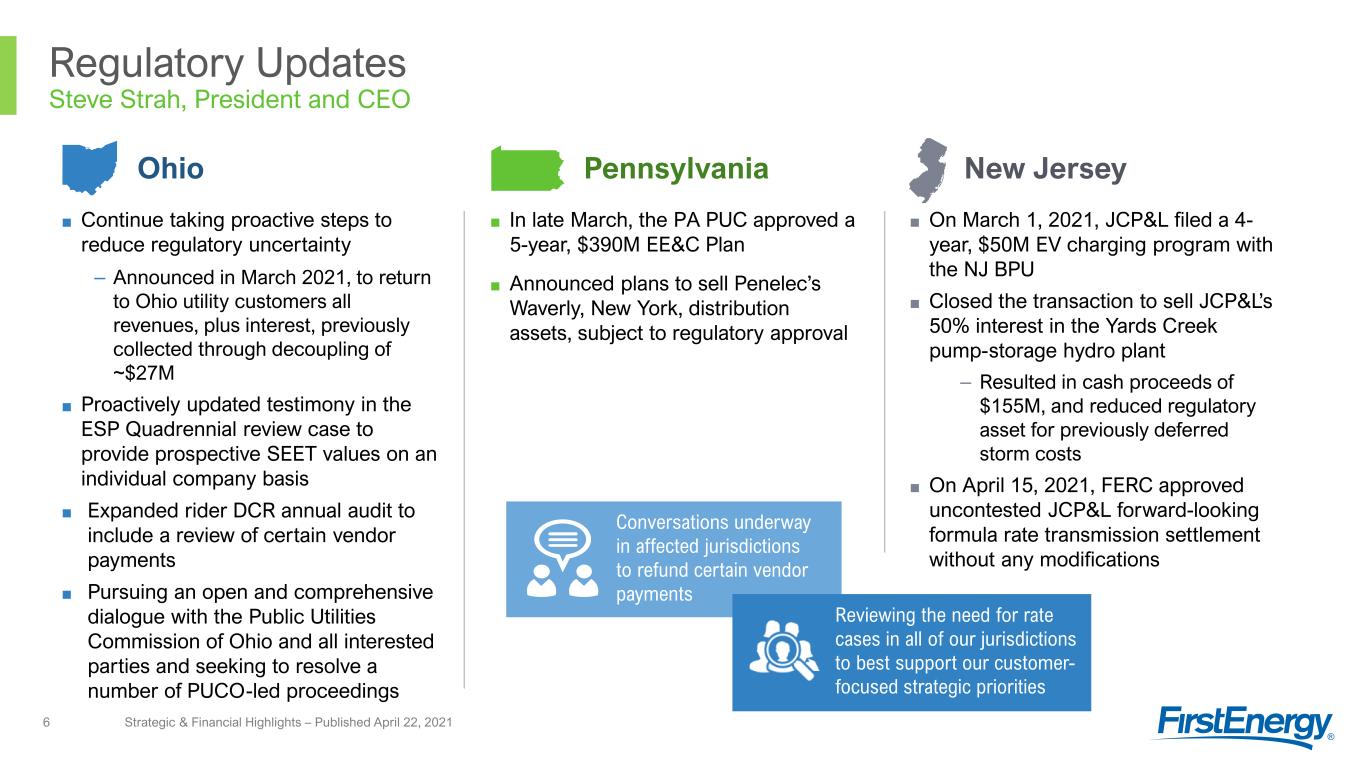
Regulatory Updates Steve Strah, President and CEO ■ Continue taking proactive steps to reduce regulatory uncertainty – Announced in March 2021, to return to Ohio utility customers all revenues, plus interest, previously collected through decoupling of ~$27M ■ Proactively updated testimony in the ESP Quadrennial review case to provide prospective SEET values on an individual company basis ■ Expanded rider DCR annual audit to include a review of certain vendor payments ■ Pursuing an open and comprehensive dialogue with the Public Utilities Commission of Ohio and all interested parties and seeking to resolve a number of PUCO-led proceedings ■ In late March, the PA PUC approved a 5-year, $390M EE&C Plan ■ Announced plans to sell Penelec’s Waverly, New York, distribution assets, subject to regulatory approval Strategic & Financial Highlights – Published April 22, 20216 Reviewing the need for rate cases in all of our jurisdictions to best support our customer- focused strategic priorities ■ On March 1, 2021, JCP&L filed a 4- year, $50M EV charging program with the NJ BPU ■ Closed the transaction to sell JCP&L’s 50% interest in the Yards Creek pump-storage hydro plant – Resulted in cash proceeds of $155M, and reduced regulatory asset for previously deferred storm costs ■ On April 15, 2021, FERC approved uncontested JCP&L forward-looking formula rate transmission settlement without any modifications Conversations underway in affected jurisdictions to refund certain vendor payments Ohio Pennsylvania New Jersey
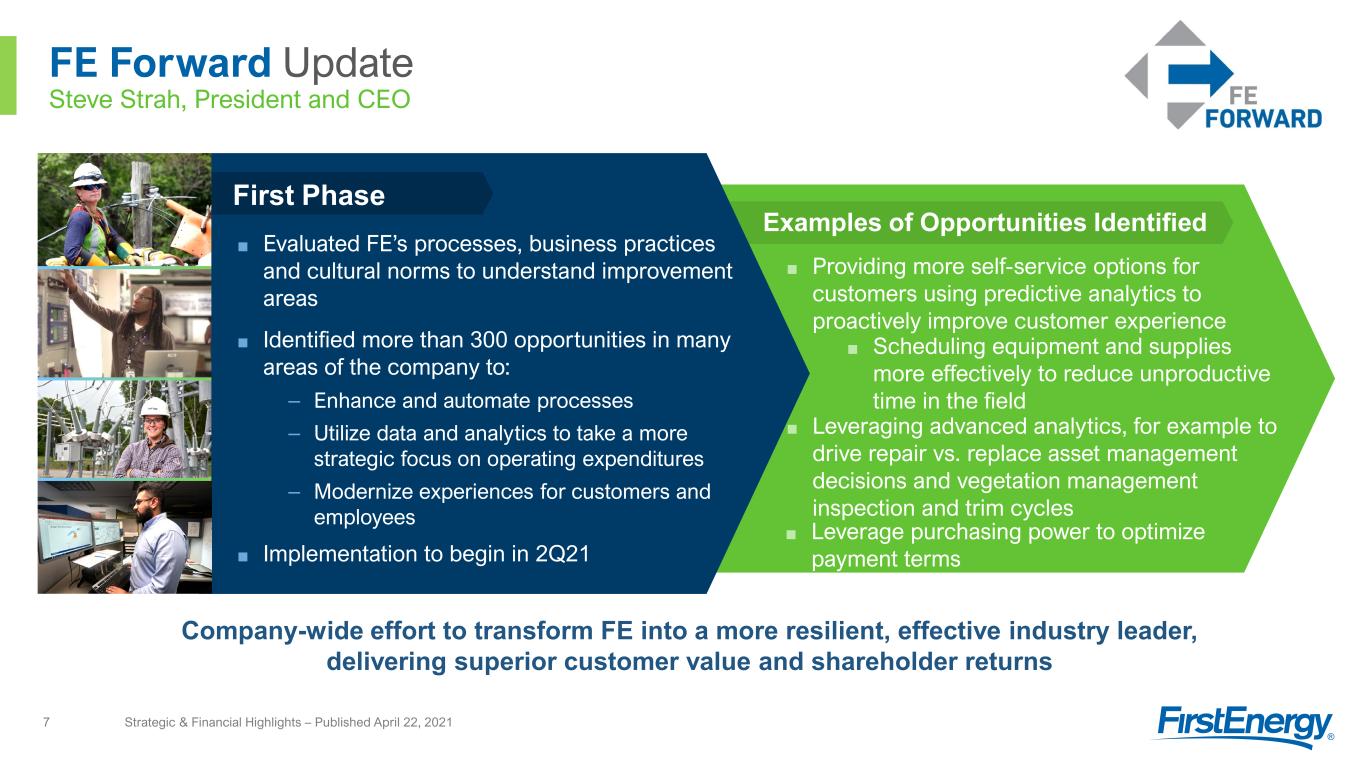
FE Forward Update Steve Strah, President and CEO ■ Evaluated FE’s processes, business practices and cultural norms to understand improvement areas ■ Identified more than 300 opportunities in many areas of the company to: – Enhance and automate processes – Utilize data and analytics to take a more strategic focus on operating expenditures – Modernize experiences for customers and employees ■ Implementation to begin in 2Q21 ■ Providing more self-service options for customers using predictive analytics to proactively improve customer experience Strategic & Financial Highlights – Published April 22, 20217 Company-wide effort to transform FE into a more resilient, effective industry leader, delivering superior customer value and shareholder returns Examples of Opportunities Identified First Phase ■ Scheduling equipment and supplies more effectively to reduce unproductive time in the field ■ Leveraging advanced analytics, for example to drive repair vs. replace asset management decisions and vegetation management inspection and trim cycles ■ Leverage purchasing power to optimize payment terms

Compliance Updates John Somerhalder II, Vice-Chairperson and Executive Director ■ Focused on advancing the company’s priorities, strengthening governance and compliance functions, and enhancing relationships with external stakeholders ■ The Board’s internal investigation has revealed no new material issues since the 4Q20 earnings call – Focus of the internal investigation has transitioned from a proactive investigation to continued cooperation with the ongoing government investigations ■ The leadership team and the Board are committed to working together to build a best-in-class compliance program Strategic & Financial Highlights – Published April 22, 20218 1) Governance 2) Risk management 3) Training and communications 4) Concerns management 5) Third-party management 5 Broad Opportunities to Improve FE’s Compliance Program
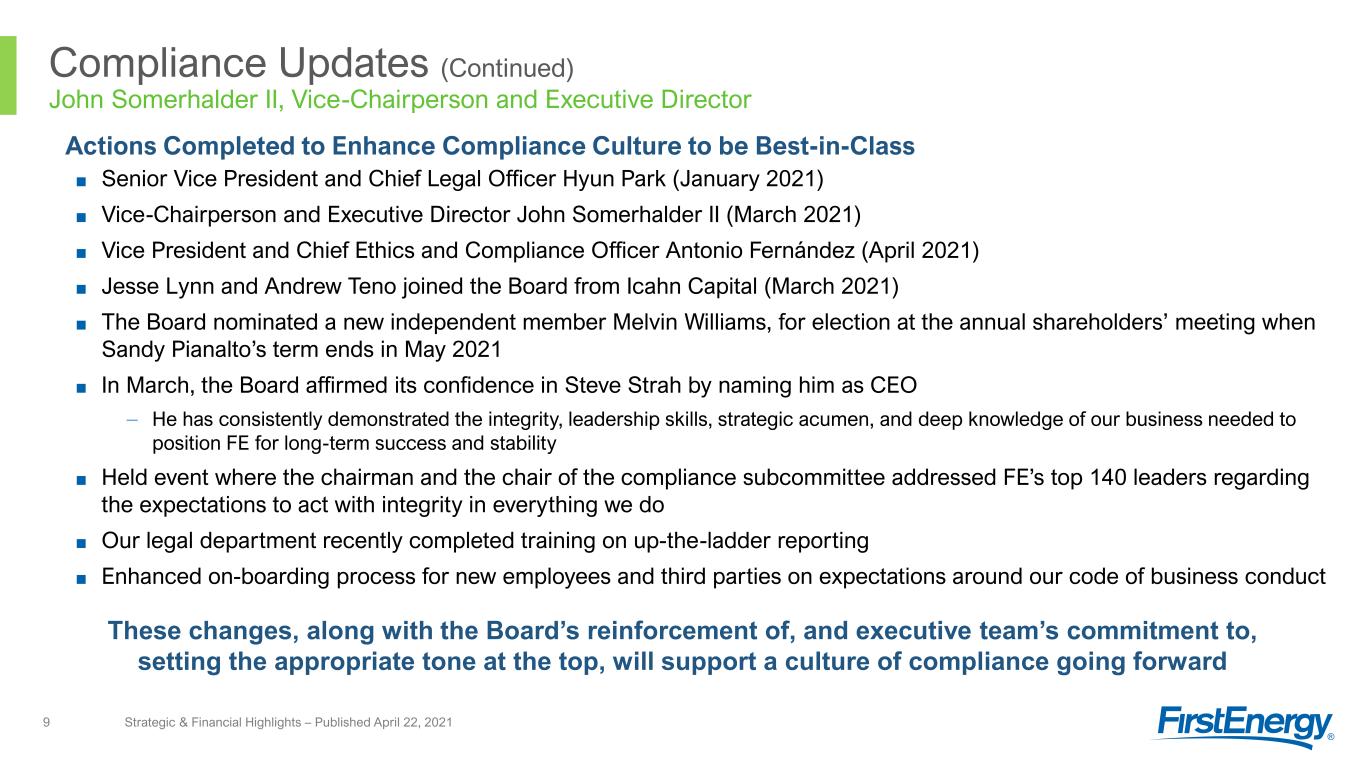
Compliance Updates (Continued) John Somerhalder II, Vice-Chairperson and Executive Director ■ Senior Vice President and Chief Legal Officer Hyun Park (January 2021) ■ Vice-Chairperson and Executive Director John Somerhalder II (March 2021) ■ Vice President and Chief Ethics and Compliance Officer Antonio Fernández (April 2021) ■ Jesse Lynn and Andrew Teno joined the Board from Icahn Capital (March 2021) ■ The Board nominated a new independent member Melvin Williams, for election at the annual shareholders’ meeting when Sandy Pianalto’s term ends in May 2021 ■ In March, the Board affirmed its confidence in Steve Strah by naming him as CEO – He has consistently demonstrated the integrity, leadership skills, strategic acumen, and deep knowledge of our business needed to position FE for long-term success and stability ■ Held event where the chairman and the chair of the compliance subcommittee addressed FE’s top 140 leaders regarding the expectations to act with integrity in everything we do ■ Our legal department recently completed training on up-the-ladder reporting ■ Enhanced on-boarding process for new employees and third parties on expectations around our code of business conduct Strategic & Financial Highlights – Published April 22, 20219 These changes, along with the Board’s reinforcement of, and executive team’s commitment to, setting the appropriate tone at the top, will support a culture of compliance going forward Actions Completed to Enhance Compliance Culture to be Best-in-Class

Compliance Updates (Continued) John Somerhalder II, Vice-Chairperson and Executive Director Strategic & Financial Highlights – Published April 22, 202110 ■ Continuing to build new, more centralized compliance organization under Antonio Fernández’s leadership ■ Enhancing processes, policies and controls ■ Continuing to emphasize our values and expectations in ongoing communications with employees; incorporating compliance into goals and performance metrics; and holding all employees to the same standards ■ Enhancing the channels for incident reporting and developing thorough and objective processes to investigate and address allegations of misconduct ■ Ensuring increased communication with, and training of, employees We are committed to ensuring that employees understand what is expected of them and are comfortable reporting ethical violations without fear of repercussions. We strive to bolster confidence among employees that the management team and Board are taking the proper, decisive actions to move FE forward. Key Areas of Enhancement from Previous Compliance Program ■ Enhanced internal controls around disbursements to require additional approvals, targeted reviews of any suspicious payments, and reassessed approval levels across the entire company – Will update and clarify policies and procedures, conduct training and institute a regular audit program that reviews payments and services performed

1Q 2021 Earnings Summary Jon Taylor, SVP and CFO Strategic & Financial Highlights – Published April 22, 202111 RD: $0.54 RT: $0.22 Corp: ($0.10) RD: $0.62 RT: $0.20 Corp: ($0.13) Includes ($0.02) from RCF Borrowings ■ Reported 1Q 2021 GAAP earnings of $0.62 per share vs. $0.14 in 1Q 2020 – 1Q 2021 results include ($0.07) of special items, including regulatory charges ($0.04) and investigation and other related costs ($0.03) – 1Q 2020 results include ($0.52) of special items, including the impact of the non-cash pension and OPEB mark-to-market adjustment upon Energy Harbor emergence ($0.59), regulatory charges ($0.01) and the exit of generation credits +$0.08 ■ Reported 1Q 2021 Operating (non-GAAP) earnings of $0.69 per share vs. $0.66 in 1Q 2020 Quarter-over-Quarter Operating EPS Summary • Delivered on our regulated growth strategy • Better than expected mix of weather-adjusted sales Vs. 1Q Guidance Midpoint (Range: $0.62 - $0.72) Note: Reconciliations between GAAP and Operating (non-GAAP) earnings and detailed information is available in the Earnings Supplement to the Financial Community and Investor FactBook
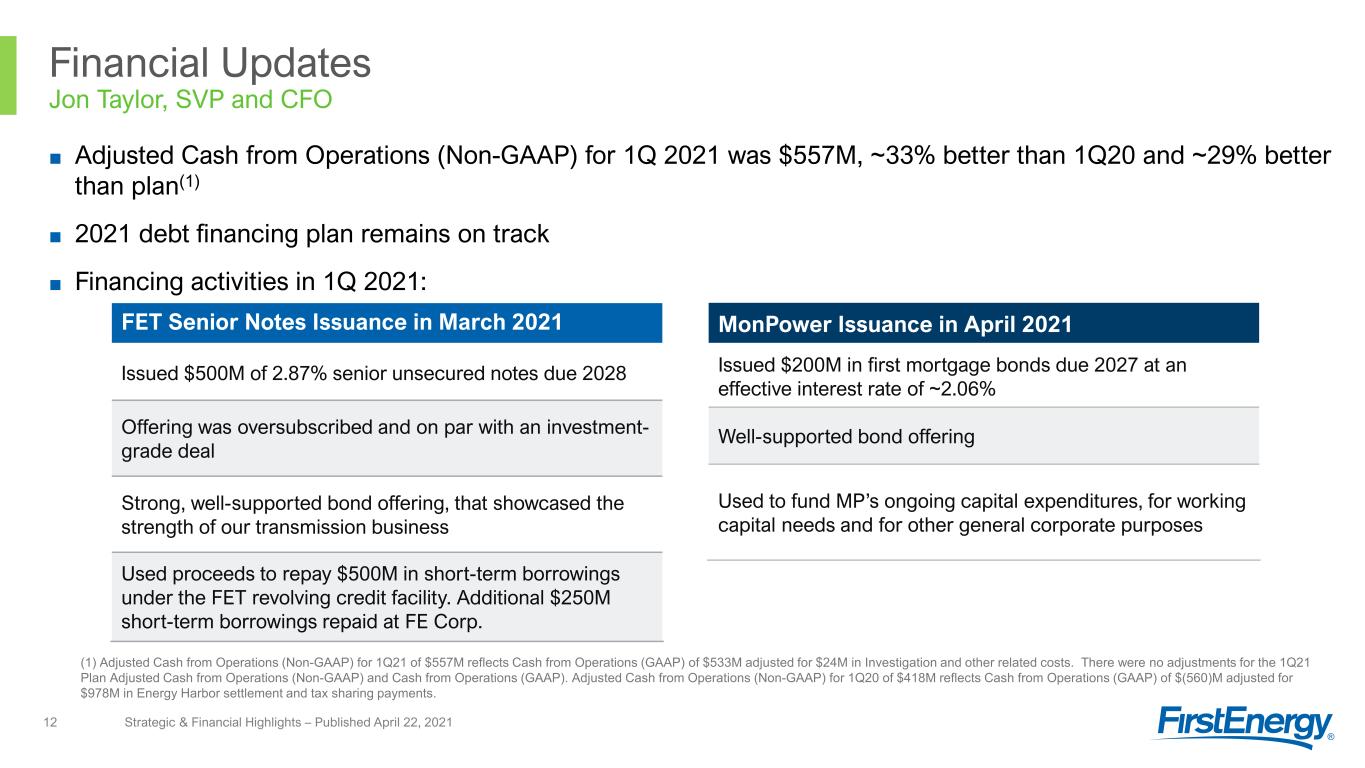
FET Senior Notes Issuance in March 2021 Issued $500M of 2.87% senior unsecured notes due 2028 Offering was oversubscribed and on par with an investment- grade deal Strong, well-supported bond offering, that showcased the strength of our transmission business Used proceeds to repay $500M in short-term borrowings under the FET revolving credit facility. Additional $250M short-term borrowings repaid at FE Corp. Financial Updates Jon Taylor, SVP and CFO ■ Adjusted Cash from Operations (Non-GAAP) for 1Q 2021 was $557M, ~33% better than 1Q20 and ~29% better than plan(1) ■ 2021 debt financing plan remains on track ■ Financing activities in 1Q 2021: Strategic & Financial Highlights – Published April 22, 202112 MonPower Issuance in April 2021 Issued $200M in first mortgage bonds due 2027 at an effective interest rate of ~2.06% Well-supported bond offering Used to fund MP’s ongoing capital expenditures, for working capital needs and for other general corporate purposes (1) Adjusted Cash from Operations (Non-GAAP) for 1Q21 of $557M reflects Cash from Operations (GAAP) of $533M adjusted for $24M in Investigation and other related costs. There were no adjustments for the 1Q21 Plan Adjusted Cash from Operations (Non-GAAP) and Cash from Operations (GAAP). Adjusted Cash from Operations (Non-GAAP) for 1Q20 of $418M reflects Cash from Operations (GAAP) of $(560)M adjusted for $978M in Energy Harbor settlement and tax sharing payments.

Financial Updates (Continued) Jon Taylor, SVP and CFO ■ Continue to provide rating agencies with regular updates on our business, and working with them to develop clear outline of what is needed to return FE to investment-grade credit ratings ■ Targeting funds-from-operations to debt ratio of 12-13% – Through FE Forward, we have reduced our debt financing plan by ~$1B through 2023, mainly at the FE and FET holding companies – Affirming plan to issue up to $1.2B of equity over 2022 and 2023, with flexibility to adjust as necessary – Exploring various alternatives to raise equity capital in a manner that could be more value-enhancing to all stakeholders – New rates at JCP&L and our capital investment program of 60%+ formula rate will generate $150-$200M of incremental cash flow each year, while maintaining relatively flat adjusted debt levels (net of cash) through 2023 ■ Pension funding status at 81% (March 31, 2021), up from 78% (December 31, 2020), resulting in $500M reduction in unfunded pension obligation – The American Rescue Plan was signed into law on March 11, 2021. Under this new law, FE currently does not expect any minimum required contributions to the pension plan for the foreseeable future, assuming our plan achieves 7.5% expected return on assets. ■ Probable FE will incur a loss in connection with a resolution of the DOJ investigation and currently cannot reasonably estimate the amount – No contingency has been reflected in our consolidated financial statements ■ Closely watching developments in the “American Jobs Plan” Strategic & Financial Highlights – Published April 22, 202113

Earnings Supplement to the Financial Community Strategic & Financial Highlights – Published April 22, 202114 15. 1Q Earnings Summary and Reconciliation 16. 1Q Earnings Drivers by Segment 17. Special Items Descriptions 18. 1Q 2021 Earnings Results 19. 1Q 2020 Earnings Results 20. Quarter-over-Quarter Earnings Comparison 21. 2021F GAAP to Operating (Non-GAAP) Earnings Reconciliation TABLE OF CONTENTS (Slide) Irene M. Prezelj, Vice President prezelji@firstenergycorp.com 330.384.3859 Gina E. Caskey, Senior Advisor caskeyg@firstenergycorp.com 330.761.4185 Jake M. Mackin, Consultant mackinj@firstenergycorp.com 330.384.4829

EPS Variance Analysis Regulated Regulated Corporate / FirstEnergy Corp. (in millions, except per share amounts) Distribution Transmission Other Consolidated 1Q 2020 Net Income (Loss) (GAAP) $136 $117 $(179) $74 1Q 2020 Basic Earnings (Loss) Per Share (avg. shares outstanding 541M) $0.25 $0.22 $(0.33) $0.14 Special Items - 2020 Regulatory charges 0.01 — — 0.01 Exit of generation credits (0.10) — 0.02 (0.08) Mark-to-market adjustments - Pension/OPEB actuarial assumptions 0.38 — 0.21 0.59 Total Special Items - 1Q 2020 0.29 — 0.23 0.52 1Q 2020 Operating Earnings (Loss) Per Share - Non-GAAP $0.54 $0.22 $(0.10) $0.66 Distribution - Rates & Riders 0.05 — — 0.05 Distribution Revenues - Weather-Adjusted Demand 0.02 — — 0.02 Distribution Revenues - Weather Demand 0.05 — — 0.05 Ohio Decoupling / Lost Distribution Revenue (0.10) — — (0.10) Regulated Generation Commodity Margin Demand 0.02 — — 0.02 Transmission Investment — 0.01 — 0.01 Operating Expenses 0.01 — 0.02 0.03 Pension/OPEB 0.03 — (0.03) — Net Financing Costs — (0.02) (0.02) (0.04) Other — (0.01) — (0.01) 1Q 2021 Operating Earnings (Loss) Per Share - Non-GAAP $0.62 $0.20 $(0.13) $0.69 Special Items - 2021 Regulatory charges (0.04) — — (0.04) Investigation and other related costs — — (0.03) (0.03) Total Special Items - 1Q 2021 (0.04) — (0.03) (0.07) 1Q 2021 Basic Earnings (Loss) Per Share (avg. shares outstanding 543M) $0.58 $0.20 $(0.16) $0.62 1Q 2021 Net Income (Loss) (GAAP) $313 $109 $(87) $335 Per share amounts for the special items and earnings drivers above and throughout this report are based on the after-tax effect of each item divided by the number of shares outstanding for the period. The current and deferred income tax effect was calculated by applying the subsidiaries' statutory tax rate to the pre-tax amount if deductible/taxable. The income tax rates range from 21% to 29% in the first quarter of 2021 and 2020. Quarterly Summary Quarterly Reconciliation 1Q 2021 1Q 2020 Change GAAP Earnings Per Basic Share $0.62 $0.14 $0.48 Special Items $0.07 $0.52 $(0.45) Operating (Non-GAAP) Earnings Per Share $0.69 $0.66 $0.03 Note: Refer to slide 3 for information on Non-GAAP Financial Matters. Strategic & Financial Highlights – Published April 22, 202115

Earnings Drivers: 1Q 2021 vs. 1Q 2020 Regulated Distribution (RD) ▪ Distribution - Rates & Riders: Incremental rider revenues in OH and PA, and the implementation of the NJ distribution base rate case, increased earnings by $0.05 per share. ▪ Distribution Revenues - Weather-Adjusted Demand: Higher weather-adjusted sales increased earnings by $0.02 per share. ▪ Distribution Revenues - Weather Demand: Higher weather-related usage increased earnings by $0.05 per share. Heating degree days were ~14% higher than the first quarter of 2020 and ~5% below normal. ▪ Ohio Decoupling / Lost Distribution Revenue: Lower revenues decreased earnings $0.10 per share resulting from the partial settlement with the Ohio Attorney General and decision to forego collection of lost distribution revenues from residential and commercial customers as authorized under the current Electric Security Plan. ▪ Regulated Generation Commodity Margin Demand: Higher weather-related usage and demand increased earnings by $0.02 per share. ▪ Operating Expenses: Lower expenses increased results by $0.01 per share. ▪ Pension/OPEB: Lower expenses increased earnings $0.03 per share. ▪ Special Items: In 1Q21 and 1Q20, special items totaled $0.04 per share and $0.29 per share, respectively Regulated Transmission (RT) ▪ Transmission Investment: Higher transmission margin increased earnings by $0.01 per share, primarily due to higher rate base at American Transmissions Systems, Incorporated (ATSI) and Mid-Atlantic Interstate Transmission, LLC (MAIT). ▪ Net Financing Costs: Higher interest on borrowings on the revolving credit facility and an adjustment to previously capitalized interest, decreased earnings by $0.02 per share. Corporate / Other (Corp) ▪ Operating Expenses: Lower expenses increased results by $0.02 per share. ▪ Pension/OPEB: The absence of first quarter 2020 accelerated Pension/OPEB amortization credits as a result of Energy Harbor emergence decreased results by $0.03 per share. ▪ Net Financing Costs: Higher interest expense due to increased long-term debt decreased earnings by $0.02 per share. ▪ Special Items: In 1Q21 and 1Q20, special items totaled $0.03 per share and $0.23 per share, respectively. 3.3% (5.8)% (1.8)% (0.8)% Residential Commercial* Industrial Total Q-o-Q Weather-Adjusted Distribution Deliveries (Adjusted for leap year) Q-o-Q Actual Distribution Deliveries 12.8% (3.0)% (2.1)% 3.2% Residential Commercial* Industrial Total *Commercial includes street lighting. Strategic & Financial Highlights – Published April 22, 202116
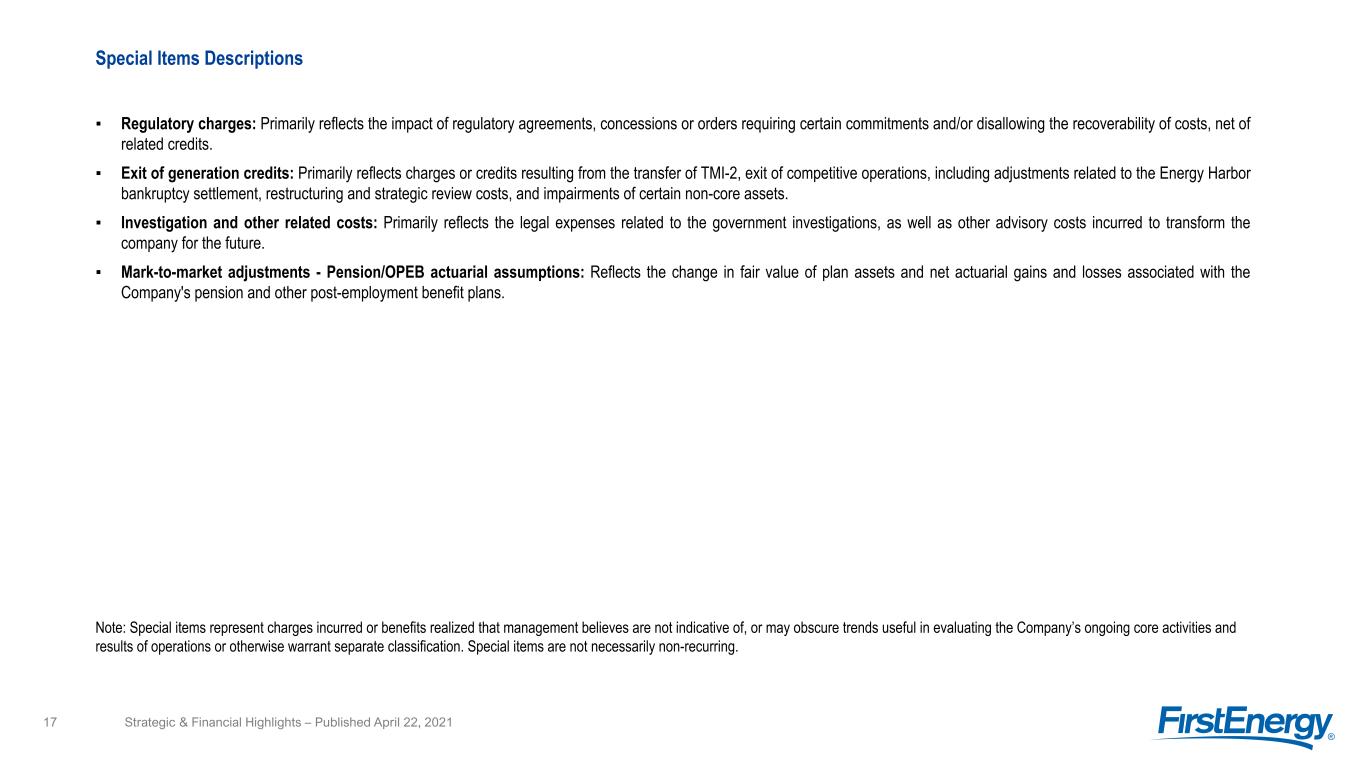
Special Items Descriptions ▪ Regulatory charges: Primarily reflects the impact of regulatory agreements, concessions or orders requiring certain commitments and/or disallowing the recoverability of costs, net of related credits. ▪ Exit of generation credits: Primarily reflects charges or credits resulting from the transfer of TMI-2, exit of competitive operations, including adjustments related to the Energy Harbor bankruptcy settlement, restructuring and strategic review costs, and impairments of certain non-core assets. ▪ Investigation and other related costs: Primarily reflects the legal expenses related to the government investigations, as well as other advisory costs incurred to transform the company for the future. ▪ Mark-to-market adjustments - Pension/OPEB actuarial assumptions: Reflects the change in fair value of plan assets and net actuarial gains and losses associated with the Company's pension and other post-employment benefit plans. Note: Special items represent charges incurred or benefits realized that management believes are not indicative of, or may obscure trends useful in evaluating the Company’s ongoing core activities and results of operations or otherwise warrant separate classification. Special items are not necessarily non-recurring. Strategic & Financial Highlights – Published April 22, 202117
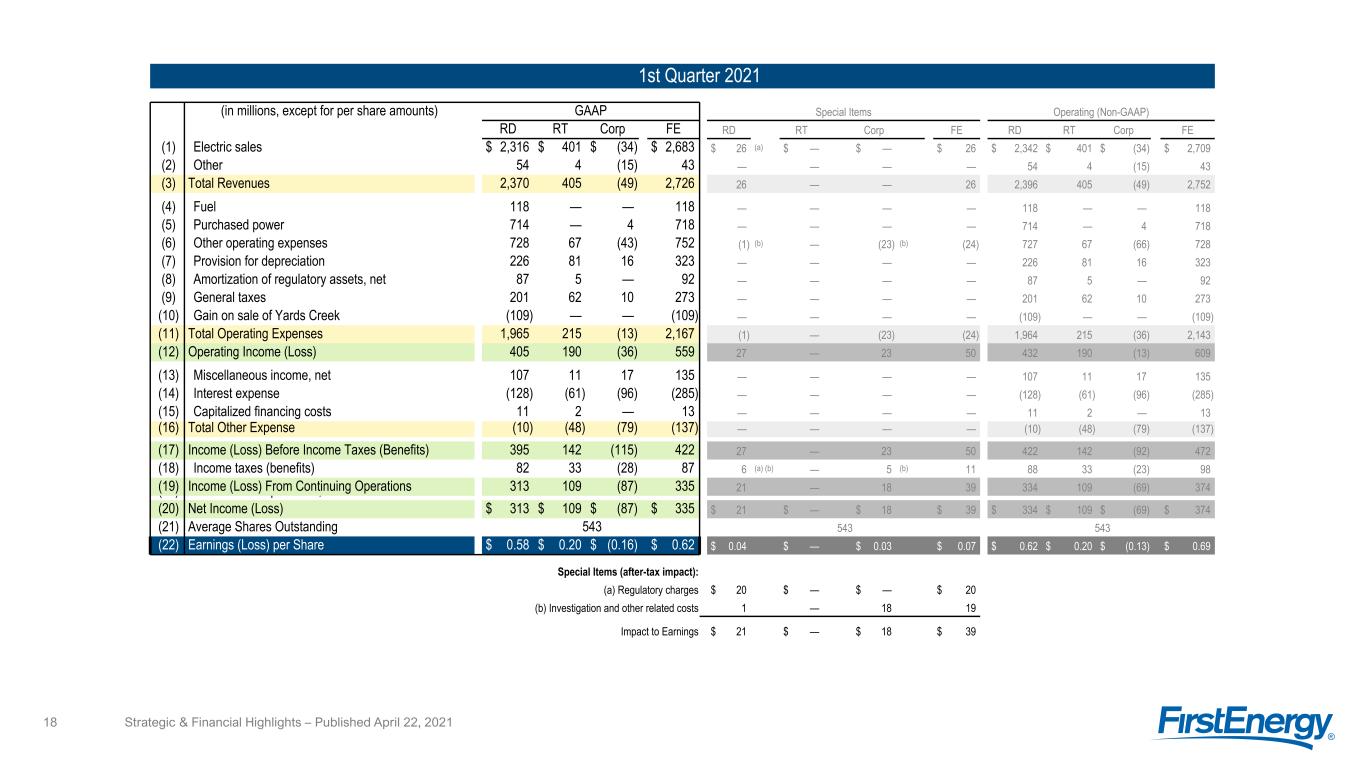
1st Quarter 2021 (in millions, except for per share amounts) GAAP Special Items Operating (Non-GAAP) RD RT Corp FE RD RT Corp FE RD RT Corp FE (1) Electric sales $ 2,316 $ 401 $ (34) $ 2,683 $ 26 (a) $ — $ — $ 26 $ 2,342 $ 401 $ (34) $ 2,709 (2) Other 54 4 (15) 43 — — — — 54 4 (15) 43 (3) Total Revenues 2,370 405 (49) 2,726 26 — — 26 2,396 405 (49) 2,752 (4) Fuel 118 — — 118 — — — — 118 — — 118 (5) Purchased power 714 — 4 718 — — — — 714 — 4 718 (6) Other operating expenses 728 67 (43) 752 (1) (b) — (23) (b) (24) 727 67 (66) 728 (7) Provision for depreciation 226 81 16 323 — — — — 226 81 16 323 (8) Amortization of regulatory assets, net 87 5 — 92 — — — — 87 5 — 92 (9) General taxes 201 62 10 273 — — — — 201 62 10 273 (10) Gain on sale of Yards Creek (109) — — (109) — — — — (109) — — (109) (11) Total Operating Expenses 1,965 215 (13) 2,167 (1) — (23) (24) 1,964 215 (36) 2,143 (12) Operating Income (Loss) 405 190 (36) 559 27 — 23 50 432 190 (13) 609 (13) Miscellaneous income, net 107 11 17 135 — — — — 107 11 17 135 (14) Interest expense (128) (61) (96) (285) — — — — (128) (61) (96) (285) (15) Capitalized financing costs 11 2 — 13 — — — — 11 2 — 13 (16) Total Other Expense (10) (48) (79) (137) — — — — (10) (48) (79) (137) (17) Income (Loss) Before Income Taxes (Benefits) 395 142 (115) 422 27 — 23 50 422 142 (92) 472 (18) Income taxes (benefits) 82 33 (28) 87 6 (a) (b) — 5 (b) 11 88 33 (23) 98 (19) Income (Loss) From Continuing Operations 313 109 (87) 335 21 — 18 39 334 109 (69) 374 (20) Discontinued operations, net of tax — — — — — — — — — — — — (20) Net Income (Loss) $ 313 $ 109 $ (87) $ 335 $ 21 $ — $ 18 $ 39 $ 334 $ 109 $ (69) $ 374 (21) Average Shares Outstanding 543 543 543 (22) Earnings (Loss) per Share $ 0.58 $ 0.20 $ (0.16) $ 0.62 $ 0.04 $ — $ 0.03 $ 0.07 $ 0.62 $ 0.20 $ (0.13) $ 0.69 Special Items (after-tax impact): (a) Regulatory charges $ 20 $ — $ — $ 20 (b) Investigation and other related costs 1 — 18 19 Impact to Earnings $ 21 $ — $ 18 $ 39 Strategic & Financial Highlights – Published April 22, 202118
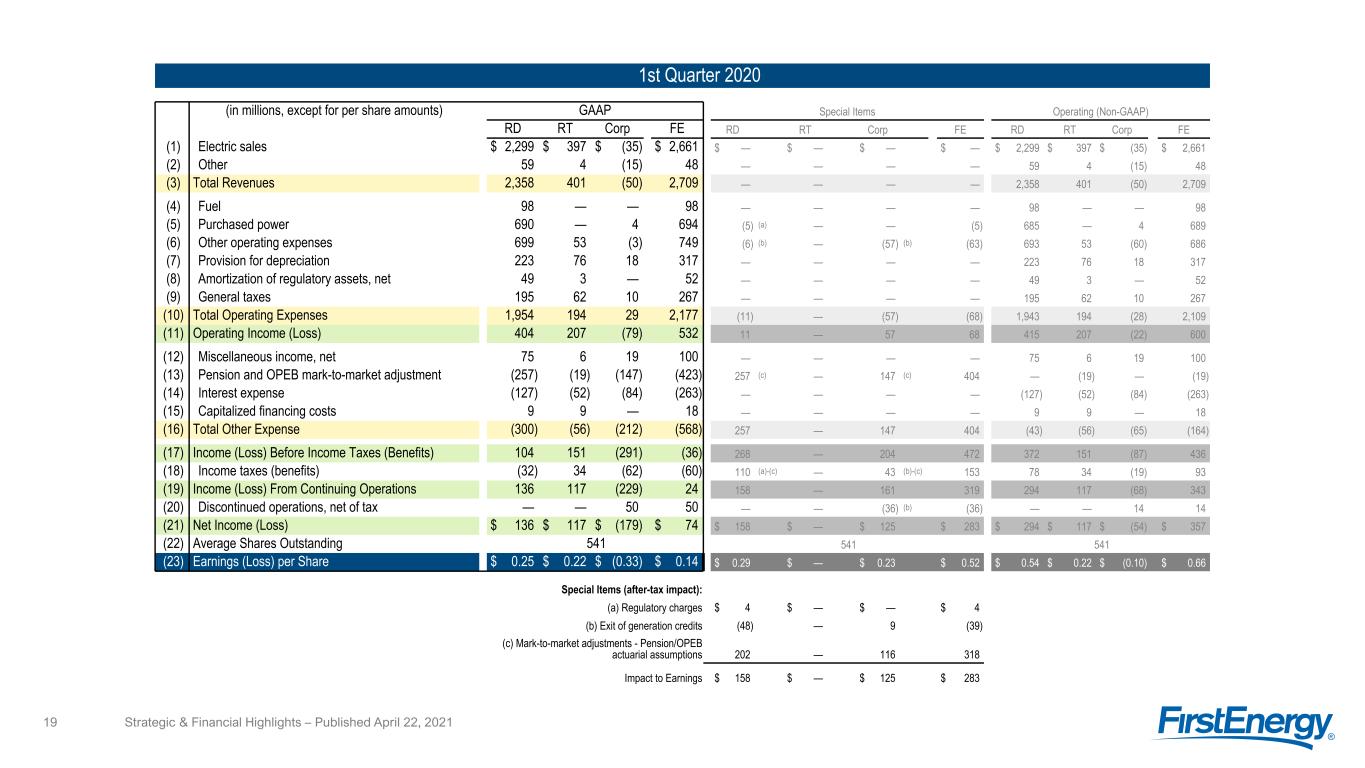
1st Quarter 2020 (in millions, except for per share amounts) GAAP Special Items Operating (Non-GAAP) RD RT Corp FE RD RT Corp FE RD RT Corp FE (1) Electric sales $ 2,299 $ 397 $ (35) $ 2,661 $ — $ — $ — $ — $ 2,299 $ 397 $ (35) $ 2,661 (2) Other 59 4 (15) 48 — — — — 59 4 (15) 48 (3) Total Revenues 2,358 401 (50) 2,709 — — — — 2,358 401 (50) 2,709 (4) Fuel 98 — — 98 — — — — 98 — — 98 (5) Purchased power 690 — 4 694 (5) (a) — — (5) 685 — 4 689 (6) Other operating expenses 699 53 (3) 749 (6) (b) — (57) (b) (63) 693 53 (60) 686 (7) Provision for depreciation 223 76 18 317 — — — — 223 76 18 317 (8) Amortization of regulatory assets, net 49 3 — 52 — — — — 49 3 — 52 (9) General taxes 195 62 10 267 — — — — 195 62 10 267 (10) Total Operating Expenses 1,954 194 29 2,177 (11) — (57) (68) 1,943 194 (28) 2,109 (11) Operating Income (Loss) 404 207 (79) 532 11 — 57 68 415 207 (22) 600 (12) Miscellaneous income, net 75 6 19 100 — — — — 75 6 19 100 (13) Pension and OPEB mark-to-market adjustment (257) (19) (147) (423) 257 (c) — 147 (c) 404 — (19) — (19) (14) Interest expense (127) (52) (84) (263) — — — — (127) (52) (84) (263) (15) Capitalized financing costs 9 9 — 18 — — — — 9 9 — 18 (16) Total Other Expense (300) (56) (212) (568) 257 — 147 404 (43) (56) (65) (164) (17) Income (Loss) Before Income Taxes (Benefits) 104 151 (291) (36) 268 — 204 472 372 151 (87) 436 (18) Income taxes (benefits) (32) 34 (62) (60) 110 (a)-(c) — 43 (b)-(c) 153 78 34 (19) 93 (19) Income (Loss) From Continuing Operations 136 117 (229) 24 158 — 161 319 294 117 (68) 343 (20) Discontinued operations, net of tax — — 50 50 — — (36) (b) (36) — — 14 14 (21) Net Income (Loss) $ 136 $ 117 $ (179) $ 74 $ 158 $ — $ 125 $ 283 $ 294 $ 117 $ (54) $ 357 (22) Average Shares Outstanding 541 541 541 (23) Earnings (Loss) per Share $ 0.25 $ 0.22 $ (0.33) $ 0.14 $ 0.29 $ — $ 0.23 $ 0.52 $ 0.54 $ 0.22 $ (0.10) $ 0.66 Special Items (after-tax impact): (a) Regulatory charges $ 4 $ — $ — $ 4 (b) Exit of generation credits (48) — 9 (39) (c) Mark-to-market adjustments - Pension/OPEB actuarial assumptions 202 — 116 318 Impact to Earnings $ 158 $ — $ 125 $ 283 Strategic & Financial Highlights – Published April 22, 202119
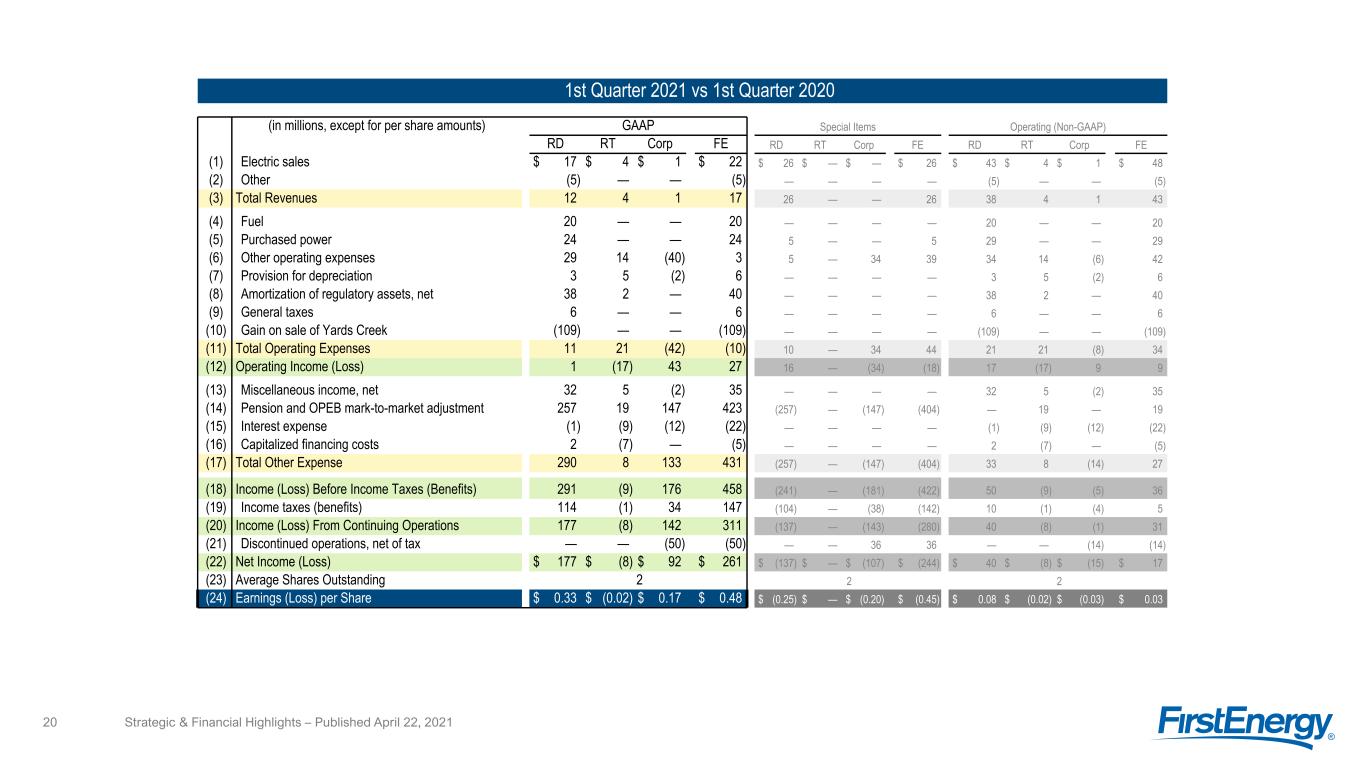
1st Quarter 2021 vs 1st Quarter 2020 (in millions, except for per share amounts) GAAP Special Items Operating (Non-GAAP) RD RT Corp FE RD RT Corp FE RD RT Corp FE (1) Electric sales $ 17 $ 4 $ 1 $ 22 $ 26 $ — $ — $ 26 $ 43 $ 4 $ 1 $ 48 (2) Other (5) — — (5) — — — — (5) — — (5) (3) Total Revenues 12 4 1 17 26 — — 26 38 4 1 43 (4) Fuel 20 — — 20 — — — — 20 — — 20 (5) Purchased power 24 — — 24 5 — — 5 29 — — 29 (6) Other operating expenses 29 14 (40) 3 5 — 34 39 34 14 (6) 42 (7) Provision for depreciation 3 5 (2) 6 — — — — 3 5 (2) 6 (8) Amortization of regulatory assets, net 38 2 — 40 — — — — 38 2 — 40 (9) General taxes 6 — — 6 — — — — 6 — — 6 (10) Gain on sale of Yards Creek (109) — — (109) — — — — (109) — — (109) (11) Total Operating Expenses 11 21 (42) (10) 10 — 34 44 21 21 (8) 34 (12) Operating Income (Loss) 1 (17) 43 27 16 — (34) (18) 17 (17) 9 9 (13) Miscellaneous income, net 32 5 (2) 35 — — — — 32 5 (2) 35 (14) Pension and OPEB mark-to-market adjustment 257 19 147 423 (257) — (147) (404) — 19 — 19 (15) Interest expense (1) (9) (12) (22) — — — — (1) (9) (12) (22) (16) Capitalized financing costs 2 (7) — (5) — — — — 2 (7) — (5) (17) Total Other Expense 290 8 133 431 (257) — (147) (404) 33 8 (14) 27 (18) Income (Loss) Before Income Taxes (Benefits) 291 (9) 176 458 (241) — (181) (422) 50 (9) (5) 36 (19) Income taxes (benefits) 114 (1) 34 147 (104) — (38) (142) 10 (1) (4) 5 (20) Income (Loss) From Continuing Operations 177 (8) 142 311 (137) — (143) (280) 40 (8) (1) 31 (21) Discontinued operations, net of tax — — (50) (50) — — 36 36 — — (14) (14) (22) Net Income (Loss) $ 177 $ (8) $ 92 $ 261 $ (137) $ — $ (107) $ (244) $ 40 $ (8) $ (15) $ 17 (23) Average Shares Outstanding 2 2 2 (24) Earnings (Loss) per Share $ 0.33 $ (0.02) $ 0.17 $ 0.48 $ (0.25) $ — $ (0.20) $ (0.45) $ 0.08 $ (0.02) $ (0.03) $ 0.03 Strategic & Financial Highlights – Published April 22, 202120
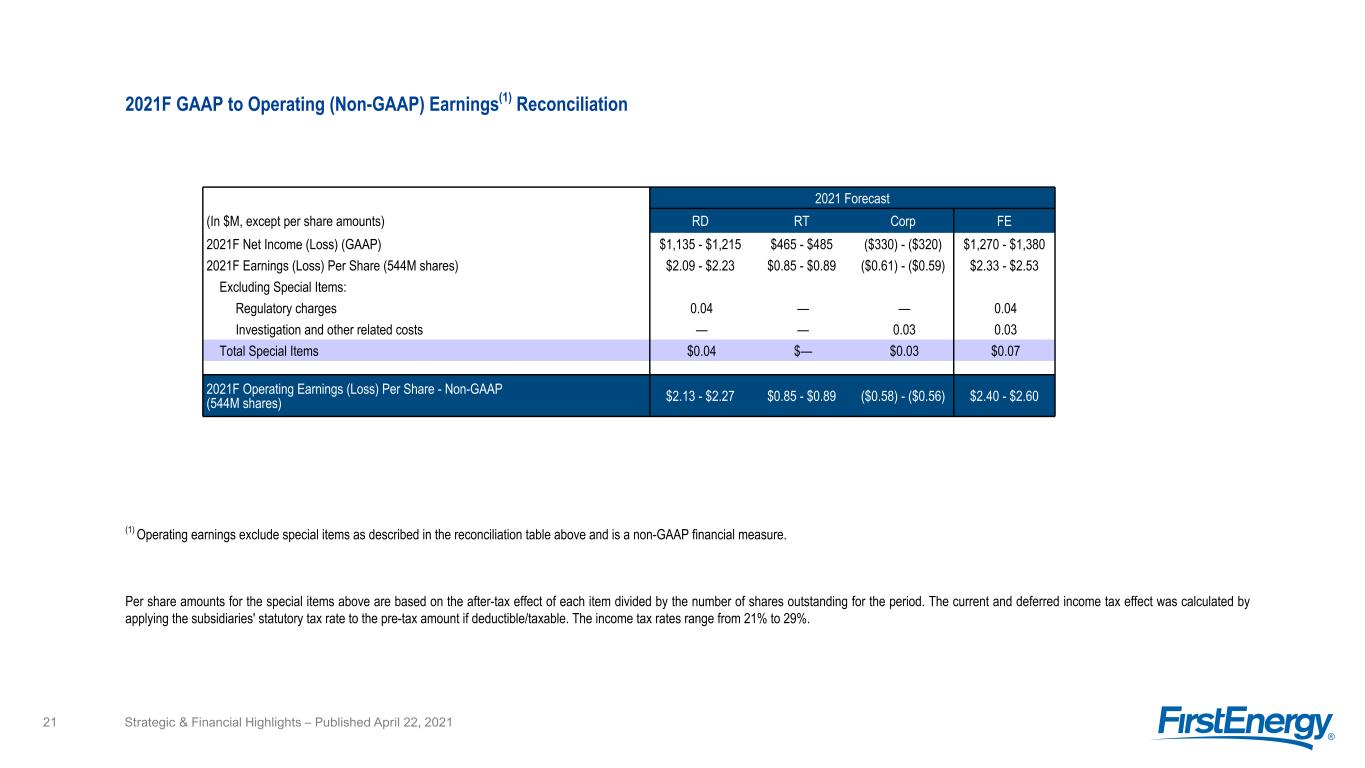
2021F GAAP to Operating (Non-GAAP) Earnings(1) Reconciliation (1) Operating earnings exclude special items as described in the reconciliation table above and is a non-GAAP financial measure. Per share amounts for the special items above are based on the after-tax effect of each item divided by the number of shares outstanding for the period. The current and deferred income tax effect was calculated by applying the subsidiaries' statutory tax rate to the pre-tax amount if deductible/taxable. The income tax rates range from 21% to 29%. 2021 Forecast (In $M, except per share amounts) RD RT Corp FE 2021F Net Income (Loss) (GAAP) $1,135 - $1,215 $465 - $485 ($330) - ($320) $1,270 - $1,380 2021F Earnings (Loss) Per Share (544M shares) $2.09 - $2.23 $0.85 - $0.89 ($0.61) - ($0.59) $2.33 - $2.53 Excluding Special Items: Regulatory charges 0.04 — — 0.04 Investigation and other related costs — — 0.03 0.03 Total Special Items $0.04 $— $0.03 $0.07 2021F Operating Earnings (Loss) Per Share - Non-GAAP (544M shares) $2.13 - $2.27 $0.85 - $0.89 ($0.58) - ($0.56) $2.40 - $2.60 Strategic & Financial Highlights – Published April 22, 202121


