UNITED STATES
SECURITIES AND EXCHANGE COMMISSION
Washington, D.C. 20549
FORM 10-K
(Mark One)
| x | ANNUAL REPORT PURSUANT TO SECTION 13 OR 15(d) OF THE SECURITIES EXCHANGE ACT OF 1934 |
For the fiscal year ended December 31, 2009
| o | TRANSITION REPORT PURSUANT TO SECTION 13 OR 15(d) OF THE SECURITIES EXCHANGE ACT OF 1934 |
For the transition period from ________ to ________
Commission File No. 001-32470
FRANKLIN STREET PROPERTIES CORP.
(Exact name of registrant as specified in its charter)
| Maryland | 04-3578653 |
(State or other jurisdiction of incorporation or organization) | (I.R.S. Employer Identification No.) |
| | |
| 401 Edgewater Place, Suite 200, Wakefield, Massachusetts | 01880-6210 |
| (Address of principal executive offices) | (Zip Code) |
Registrant’s telephone number, including area code: (781) 557-1300
Securities registered pursuant to Section 12(b) of the Act:
| Title of each class: | Name of each exchange on which registered: |
| Common Stock, $.0001 par value per share | NYSE Amex |
Securities registered pursuant to Section 12(g) of the Act: None
Indicate by check mark if the registrant is a well-known seasoned issuer, as defined in Rule 405 of the Securities Act. Yes |X| No |_|.
Indicate by check mark if the registrant is not required to file reports pursuant to Section 13 or Section 15(d) of the Act. Yes |_| No |X|.
UNITED STATES
SECURITIES AND EXCHANGE COMMISSION
Washington, D.C. 20549
FORM 10-K, Continued
Indicate by check mark whether the registrant (1) has filed all reports required to be filed by Section 13 or 15(d) of the Securities Exchange Act of 1934 during the preceding 12 months (or for such shorter period that the registrant was required to file such reports), and (2) has been subject to such filing requirements for the past 90 days. Yes |X| No |_|.
Indicate by check mark whether the registrant has submitted electronically and posted on its corporate Website, if any, every Interactive Data File required to be submitted and posted pursuant to Rule 405 of Regulation S-T (§ 232.405 of this chapter) during the preceding 12 months (or for such shorter period that the registrant was required to submit and post such files). Yes |_| No |_|.
Indicate by check mark if disclosure of delinquent filers pursuant to Item 405 of Regulation S-K (§ 229.405 of this chapter) is not contained herein, and will not be contained, to the best of registrant’s knowledge, in definitive proxy or information statements incorporated by reference in Part III of this Form 10-K or any amendment to this Form 10-K. |X|
Indicate by check mark whether the registrant is a large accelerated filer, an accelerated filer, a non-accelerated filer, or a smaller reporting company. See the definitions of “large accelerated filer,” “accelerated filer” and “smaller reporting company” in Rule 12b-2 of the Exchange Act.
Large accelerated filer |X| | | Accelerated filer |_| |
| Non-accelerated filer |_| | (Do not check if a smaller reporting company) | Smaller reporting company |_| |
Indicate by check mark whether the registrant is a shell company (as defined in Exchange Act Rule 12b-2). Yes |_| No |X|.
The aggregate market value of the voting and non-voting common equity held by non-affiliates based on the closing sale price as reported on NYSE Amex, as of the last business day of the registrant’s most recently completed second fiscal quarter, June 30, 2009,was approximately $796,786,802.
There were 79,680,705 shares of Common Stock outstanding as of February 22, 2010.
Documents incorporated by reference: The registrant intends to file a definitive proxy statement pursuant to Regulation 14A, promulgated under the Securities Exchange Act of 1934, as amended, to be used in connection with the registrant’s Annual Meeting of Stockholders to be held on May 14, 2010 (the “Proxy Statement”). The information required in response to Items 10 – 14 of Part III of this Form 10-K, other than that contained in Part I under the caption, “Directors and Executive Officers of FSP Corp.,” is hereby incorporated by reference to the Proxy Statement.
TABLE OF CONTENTS
| PART I | | 1 |
| Item 1. | Business | 1 |
| Item 1A. | Risk Factors | 6 |
| Item 1B. | Unresolved Staff Comments | 13 |
| Item 2. | Properties | 14 |
| Item 3. | Legal Proceedings | 21 |
| Item 4. | Submission of Matters to a Vote of Security Holders | 21 |
| | Directors and Executive Officers of FSP Corp. | 21 |
| | | |
| PART II | | 25 |
| Item 5. | Market For Registrant’s Common Equity, Related Stockholder Matters and Issuer Purchases of Equity Securities | 25 |
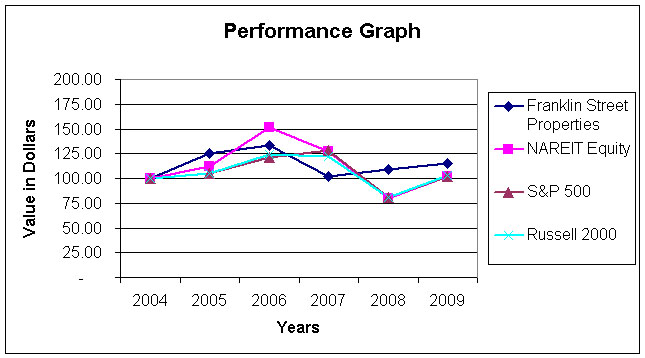
| | Stock Performance Graph | 27 |
| Item 6. | Selected Financial Data. | 28 |
| Item 7. | Management’s Discussion and Analysis of Financial Condition and Results of Operations | 29 |
| Item 7A. | Quantitative and Qualitative Disclosures About Market Risk | 48 |
| Item 8. | Financial Statements and Supplementary Data | 49 |
| Item 9. | Changes in and Disagreements With Accountants on Accounting and Financial Disclosure | 49 |
| Item 9A. | Controls and Procedures | 49 |
| Item 9B. | Other information | 50 |
| | | |
| PART III | | 51 |
| Item 10. | Directors, Executive Officers and Corporate Governance | 51 |
| Item 11. | Executive Compensation | 51 |
| Item 12. | Security Ownership of Certain Beneficial Owners and Management and Related Stockholder Matters | 51 |
| Item 13. | Certain Relationships and Related Transactions, and Director Independence | 51 |
| Item 14. | Principal Accounting Fees and Services | 51 |
| | | |
| PART IV | | 52 |
| Item 15. | Exhibits, Financial Statement Schedules | 52 |
| | | |
| SIGNATURES | | 53 |
History
Our company, Franklin Street Properties Corp., which we refer to as FSP Corp. or the Company, is a Maryland corporation that operates in a manner intended to qualify as a real estate investment trust, or REIT, for federal income tax purposes. Our common stock is traded on the NYSE Amex under the symbol “FSP”. FSP Corp. is the successor to Franklin Street Partners Limited Partnership, or the FSP Partnership, which was originally formed as a Massachusetts general partnership in January 1997 as the successor to a Massachusetts general partnership that was formed in 1981. On January 1, 2002, the FSP Partnership converted into FSP Corp., which we refer to as the conversion. As a result of this conversion, the FSP Partnership ceased to exist and we succeeded to the business of the FSP Partnership. In the conversion, each unit of both general and limited partnership interests in the FSP Partnership was converted into one share of our common stock. As a result of the conversion, we hold, directly and indirectly, 100% of the interest in three former subsidiaries of the FSP Partnership: FSP Investments LLC, FSP Property Management LLC, and FSP Holdings LLC. We operate some of our business through these subsidiaries.
On May 15, 2008, we acquired a real estate investment trust by merger, which we refer to as Park Ten Development. In this merger we paid cash consideration to the holders of preferred stock in Park Ten Development of approximately $127,290 per share for a total purchase price of approximately $35.4 million. As a result of the merger, we acquired all of the assets previously held by Park Ten Development.
On September 23, 2009, we completed an underwritten public offering of 9.2 million shares of our common stock (including 1.2 million shares issued as a result of the full exercise of an overallotment option by the underwriter) at a price to the public of $13.00 per share. The proceeds from this public offering, net of underwriter discounts and offering costs, totaled approximately $114.7 million (after payment of offering costs of approximately $0.7 million).
Our Business
We operate in two business segments and have two principal sources of revenue:
| | o | Real estate operations, including rental income from real estate leasing, interest income from secured loans made for interim acquisition or other purposes and fee income from asset/property management. |
| | o | Investment banking/investment services, which generate brokerage commissions, loan origination fees, development services and other fees related to the organization of single-purpose entities that own real estate and the private placement of equity in those entities. We refer to these entities which are organized as corporations and operated in a manner intended to qualify as real estate investment trusts, as Sponsored REITs. Previously these entities were called Sponsored Entities and were organized as partnerships. |
From time-to-time we may acquire real estate or invest in real estate by purchasing shares of preferred stock offered in the syndications of our Sponsored REITs, although we have no legal or any other enforceable obligation to acquire or to offer to acquire any Sponsored REIT. We may also pursue on a selective basis the sale of our properties to take advantage of the value creation and demand for our properties, or for geographic or property specific reasons. See Note 3 to our consolidated financial statements for additional information regarding our business segments.
Real Estate
We own and operate a portfolio of real estate consisting of 32 properties as of December 31, 2009, which includes 31 office buildings and one industrial use property. We derive rental revenue from income paid to us by tenants of these properties. From time-to-time we dispose of properties generating gains or losses in an ongoing effort to improve and upgrade our portfolio. See Item 2 of this Annual Report on Form 10-K for more information about our properties. We also held preferred stock investments in three Sponsored REITs as of December 31, 2009, as to which we record our share of income or loss under the equity method of accounting, and from which we received dividends.
We typically make an acquisition loan to each Sponsored REIT for its purchase of the underlying property, which is secured by a mortgage on the borrower’s real estate. These loans typically are repaid out of the proceeds of the borrower’s equity offering. We refer to these loans as Acquisition Loans. From time-to-time we may also make secured loans to Sponsored REITs to fund construction costs, capital expenditures, leasing costs and other purposes. We anticipate that these loans will be repaid at their maturity or earlier from long-term financings of the underlying properties, cash flows from the underlying properties or some other capital event. We refer to these loans as Sponsored REIT Loans.
We also provide asset management, property management, property accounting, and/or development services to our portfolio and certain of our Sponsored REITs through our subsidiary FSP Property Management LLC. FSP Corp. recognizes revenue from its receipt of fee income from Sponsored REITs that have not been consolidated or acquired by us. FSP Property Management LLC does not receive any rental income.
Investment Banking/Investment Services
Through our subsidiary FSP Investments LLC, which acts as a real estate investment banking firm and broker/dealer, we organize Sponsored REITs and sell equity in them through private placements exempt from registration under the Securities Act of 1933. These single-purpose entities each typically acquire a single real estate asset. FSP Investments LLC raises capital required to equitize these entities through best efforts offerings to “accredited investors” within the meaning of Regulation D of the Securities Act. We retain 100% of the common stock interest in the Sponsored REIT, though there is virtually no economic benefit or risk related to the common stock subsequent to the completion of the syndication. Since 1997, FSP Investments LLC has sponsored the syndication of 50 entities, 13 of which were Sponsored Entities, and 37 of which were Sponsored REITs.
FSP Investments LLC derives revenue from syndication and other transaction fees received in connection with the sale of preferred stock in the Sponsored REITs and from fees paid by the Sponsored REITs for its services in identifying, inspecting and negotiating to purchase real properties on their behalf. FSP Investments LLC is a registered broker/dealer with the Securities and Exchange Commission, or SEC, and is a member of the Financial Industry Regulatory Authority, or FINRA. We have made an election to treat FSP Investments LLC as a “taxable REIT subsidiary” for federal income tax purposes.
Investment Objectives
Our investment objectives are to create shareholder value by increasing revenue from rental, dividend and interest income, net gains from sales of properties and investment banking services and increase the cash available for distribution in the form of dividends to our stockholders. We expect that, through FSP Investments LLC, we will continue to organize and cause the offering of Sponsored REITs in the future and that we will continue to derive investment banking/investment services income from such activities, as well as real estate revenue from loan origination fees, interest income and fees from asset management, property management and development. We may also acquire additional real properties by direct cash purchase or by acquisition of Sponsored REITs, though we have no obligation to acquire or offer to acquire any Sponsored REIT in the future. In addition, we may invest in real estate by purchasing shares of preferred stock offered in the syndications of our Sponsored REITs.
From time to time, as market conditions warrant, we may sell properties owned by us. We did not sell any properties in 2009 or 2008. However, we did recognize a gain of approximately $424,000 on a small piece of land as a result of a land taking by the Commonwealth of Virginia in 2009. In 2007 we sold five properties. When we sell a property, we either distribute some or all of the sale proceeds to our stockholders as a distribution or retain some or all of such proceeds for investment in real properties or other corporate activities.
We may acquire, and have acquired, real properties in any geographic area of the United States and of any property type. We own 32 properties that are located in 14 different states. Of the 32 properties, 31 are office buildings and one is an industrial use property. See Item 2 of this Annual Report on Form 10-K for more information about our properties.
We rely on the following principles in selecting real properties for acquisition by FSP Corp. and managing them after acquisition:
| | · | we seek to buy or develop investment properties at a price which produces value for investors and avoid overpaying for real estate merely to outbid competitors; |
| | · | we seek to buy or develop properties in excellent locations with substantial infrastructure in place around them and avoid investing in locations where the future construction of such infrastructure is speculative; |
| | · | we seek to buy or develop properties that are well-constructed and designed to appeal to a broad base of users and avoid properties where quality has been sacrificed for cost savings in construction or which appeal only to a narrow group of users; |
| | · | we aggressively manage, maintain and upgrade our properties and refuse to neglect or undercapitalize management, maintenance and capital improvement programs; and |
| | · | we believe that we have the ability to hold properties through down cycles because we generally do not have significant leverage on the Company, which could place the properties at risk of foreclosure. As of February 22, 2010, none of our 32 properties was subject to mortgage debt. |
Revolver
We currently have an unsecured revolving line of credit, which we refer to as the Revolver, with a group of banks that provides for borrowings at our election of up to $250,000,000 and that matures on August 11, 2011. Borrowings under the Revolver bear interest at either the bank's prime rate (3.25% at December 31, 2009) or a rate equal to LIBOR plus 100 basis points (1.23% at December 31, 2009). There were borrowings of $109,008,000 and $67,468,000 at the LIBOR plus 100 basis point rate at a weighted average rate of 1.34% and 2.39% outstanding under the Revolver at December 31, 2009 and 2008, respectively. The weighted average interest rate on amounts outstanding during 2009 and 2008 was approximately 1.23% and 3.61%, respectively. As of December 31, 2009, we were in compliance with all bank covenants required under the Revolver.
We have drawn on the Revolver, and intend to draw on the Revolver in the future for a variety of corporate purposes, including the acquisition of properties that we acquire directly for our portfolio and the funding of loans to Sponsored REITs. We also use the Revolver to fund the Acquisition Loans we typically make to each Sponsored REIT, which are secured by a mortgage on the borrower’s real estate. These loans typically are repaid out of the proceeds of the borrower’s equity offering. From time-to-time we may also draw down from the Revolver to make the Sponsored REITs Loans, described further below to fund construction costs, capital expenditures, leasing costs and other purposes.
Term Loan
We also have a $75 million unsecured term loan facility, which we refer to as the Term Loan, with three banks. Proceeds from the Term Loan were used to reduce the outstanding principal balance on the Revolver. The Term Loan has an initial three-year term that matures on October 15, 2011. In addition, we have the right to extend the initial maturity date for up to two successive one-year periods, or until October 15, 2013 if both extensions are exercised. We fixed the interest rate for the initial three-year term of the Term Loan at 5.84% per annum pursuant to an interest rate swap agreement. As of December 31, 2009, we were in compliance with all bank covenants required under the Term Loan.
Hedging Activities
On October 15, 2008, we entered into an interest rate swap agreement that fixed the interest rate on our Term Loan at 5.84% for three years, which matches the initial three-year term of the Term Loan. We may engage in hedging transactions to protect us from interest rate fluctuations in the future. These transactions may include interest rate swaps, the purchase or sale of interest rate collars, caps or floors and other hedging instruments. These instruments may be used to hedge as much of the interest rate risk as we determine is in the best interest of our stockholders, given the cost of such hedges and the need to maintain our qualification as a REIT. We may elect to bear a level of interest rate risk that could otherwise be hedged when we believe based on all relevant facts, that bearing such risk is advisable.
Loans to Sponsored REITs
Acquisition Loans
We typically make an acquisition loan to each Sponsored REIT for its purchase of the underlying property, which is secured by a mortgage on the borrower’s real estate. These loans enable Sponsored REITs to acquire their respective properties prior to the consummation of the offerings of their equity interests. We refer to these loans as Acquisition Loans. We anticipate that each Acquisition Loan will be repaid at maturity or earlier from the proceeds of the Sponsored REIT’s equity offering. Each Acquisition Loan has a term of two years and bears interest at the same rate paid by FSP Corp. for borrowings under the Revolver. We had one Acquisition Loan outstanding for the syndication of FSP Centre Pointe V Corp., and one Acquisition Loan outstanding for the syndication of FSP Grand Boulevard Corp. as of December 31, 2009 and 2008, respectively. The Acquisition Loan for FSP Grand Boulevard Corp. was repaid on May 29, 2009. Acquisition Loans are classified as assets held for syndication.
Sponsored REIT Loans
From time-to-time we may also make secured loans to Sponsored REITs to fund construction costs, capital expenditures, leasing costs and other purposes. We refer to these loans as Sponsored REIT Loans. Since December 2007, we have provided Sponsored REIT Loans in the form of revolving lines of credit to five Sponsored REITs, or to wholly-owned subsidiaries of those Sponsored REITs, and a construction loan to one wholly-owned subsidiary of another Sponsored REIT. We anticipate that each Sponsored REIT Loan will be repaid at maturity or earlier from long term financing of the property securing the loan, cash flows from that underlying property or some other capital event. Each Sponsored REIT Loan is secured by a mortgage on the underlying property and has a term of approximately two to three years. Advances under each Sponsored REIT Loan bear interest at a rate equal to the 30-day LIBOR rate plus an agreed upon number of basis points and most advances also require a 50 basis point draw fee. We received a $210,000 loan commitment fee at the time of the closing of the Sponsored REIT Loan that is structured as a construction loan.
The following is a summary of the Sponsored REIT Loans outstanding as of December 31, 2009:
| (dollars in 000's) | | | Maximum | | | Amount | | | | | | | | Rate in | |
| | Maturity | | Amount | | | Drawn at | | | Interest | | Draw | | | Effect at | |
| Sponsored REIT | Date | | of Loan | | | 31-Dec-09 | | | Rate (1) | | Fee (2) | | | 31-Dec-09 | |
| Revolving lines of credit | | | | | | | | | | | | | | | |
| FSP Highland Place I Corp. | 31-Dec-10 | | $ | 5,500 | | | $ | 1,125 | | | | L+2% | | | n/a | | | | 2.24% | |
| FSP Satellite Place Corp. | 31-Mar-12 | | | 5,500 | | | | 1,902 | | | | L+3% | | | 0.5% | | | | 3.24% | |
| FSP 1441 Main Street Corp.(a) | 31-Mar-12 | | | 10,800 | | | | 5,000 | | | | L+3% | | | 0.5% | | | | 3.24% | |
| FSP 505 Waterford Corp. | 30-Nov-11 | | | 7,000 | | | | - | | | | L+3% | | | 0.5% | | | | | |
| FSP Phoenix Tower Corp. (b) | 30-Nov-11 | | | 15,000 | | | | 3,600 | | | | L+3% | | | 0.5% | | | | 3.24% | |
| | | | | | | | | | | | | | | | | | | | | |
| Construction loan | | | | | | | | | | | | | | | | | | | | |
| FSP 385 Interlocken | | | | | | | | | | | | | | | | | | | | |
| Development Corp. (c) (d) | 30-Apr-12 | | | 42,000 | | | | 24,908 | | | | L+3% | | | n/a | | | | 3.24% | |
| | | | $ | 85,800 | | | $ | 36,535 | | | | | | | | | | | | |
| (1) The interest rate is 30-Day LIBOR rate plus the additional rate indicated |
| (2) The draw fee is a percentage of each new advance, and is paid at the time of each new draw |
| |
| (a) The borrower is FSP 1441 Main Street LLC, a wholly-owned subsidiary |
| (b) The borrower is FSP Phoenix Tower Limited Partnership, a wholly-owned subsidiary |
| (c) The borrower is FSP 385 Interlocken LLC, a wholly-owned subsidiary |
| (d) The borrower paid a commitment fee of $210,000 at loan origination |
Equity Securities
On September 23, 2009, we completed an underwritten public offering of 9.2 million shares of our common stock (including 1.2 million shares issued as a result of the full exercise of an overallotment option by the underwriter) at a price to the public of $13.00 per share. The proceeds from this public offering, net of underwriter discounts and offering costs, totaled approximately $114.7 million. We used approximately $74.6 million of the net proceeds of the offering to repay outstanding borrowings under our $250 million Revolver, including an aggregate of approximately $51.6 million drawn down in June 2009 for the acquisition of properties in Eden Prairie, Minnesota and Chantilly, Virginia. We used the remainder of the net proceeds to fund a portion of the purchase price of a property in Falls Church, Virginia in September 2009.
As of December 31, 2009, we have an automatic shelf registration statement on Form S-3 on file with the SEC relating to the offer and sale, from time to time, of an indeterminate amount of our common stock. From time to time, we expect to issue additional shares of our common stock under our automatic shelf registration statement or a different registration statement to fund the acquisition of additional properties, to pay down any existing debt financing and for other corporate purposes.
Competition
The economy in the United States is continuing to experience significant disruptions, including increased levels of unemployment, the failure and near failure of a number of large financial institutions, reduced liquidity and increased credit risk premiums for a number of market participants. Economic conditions may be affected by numerous factors, including but not limited to, inflation and employment levels, energy prices, recessionary concerns, changes in currency exchange rates, the availability of debt and interest rate fluctuations. The current disruptions in the U.S. economy have affected our business, resulting in a decline in occupancy in our real estate portfolio in 2009, and REITs generally and may continue to affect real estate values, occupancy levels, property income levels and the propensity and the ability of investors to invest in our Sponsored REITs in the future. At this time, we cannot predict the extent or duration of any negative impact that the current disruptions in the U.S. economy will have on our business, our competitors’ businesses, on REITs generally or on financial institutions that provide capital to us or our competitors.
With respect to our real estate investments, we face competition in each of the markets where the properties are located. In order to establish, maintain or increase the rental revenues for a property, it must be competitive on location, cost and amenities with other buildings of similar use. Some of our competitors may have significantly more resources than we do and may be able to offer more attractive rental rates or services. On the other hand, some of our competitors may be smaller or have less fixed overhead costs, less cash or other resources that make them willing or able to accept lower rents in order to maintain a certain occupancy level. In markets where there is not currently significant existing property competition, our competitors may decide to enter the market and build new buildings to compete with our existing projects or those in a development stage. Our competition is not only with other developers, but also with property users who choose to own their building or a portion of the building in the form of an office condominium, and with larger market forces (including the current disruptions in the U.S. economy described above, changes in interest rates and tax treatment) that increase competition among landlords for quality tenants and individual decisions beyond our control.
With respect to our investment banking and investment services business, we face competition for investment dollars from every other kind of investment, including stocks, bonds, mutual funds, exchange traded funds and other real-estate related investments, including other REITs. Some of our competitors have significantly more resources than we do and are able to advertise their investment products. Because the offerings of the Sponsored REITs are made pursuant to an exemption from registration under the Securities Act, FSP Investments LLC may not advertise the Sponsored REITs or otherwise engage in any general solicitation of investors to purchase interests in the Sponsored REITs, which may affect our ability to compete for investment dollars. In addition, because we offer the Sponsored REITs only to accredited investors, our pool of potential investment clients is smaller than that available to some other financial institutions. Our competition is not only with alternative types of investments, but also with larger market forces (including the current disruptions in the U.S. economy described above, changes in interest rates and tax treatment) beyond our control that may affect the propensity and the ability of investors to invest in Sponsored REITs.
Employees
We had 43 employees as of February 22, 2010.
Available Information
We are subject to the informational requirements of the Securities Exchange Act of 1934, and, in accordance therewith, we file reports and other information with the SEC. The reports and other information we file can be inspected and copied at the SEC Public Reference Room at 100 F Street, N.E., Washington, D.C. 20549. Such reports and other information may also be obtained from the web site that the SEC maintains at http://www.sec.gov. Further information about the operation of the Public Reference Room may be obtained by calling the SEC at 1-800-SEC-0330.
We make available, free of charge through our website http://www.franklinstreetproperties.com our annual report on Form 10-K, quarterly reports on Form 10-Q, current reports on Form 8-K, and amendments to those reports filed or furnished pursuant to Section 13(a) or 15(d) of the Exchange Act as soon as reasonably practicable after we electronically file such material with the SEC.
Reports and other information concerning us may also be obtained electronically through a variety of databases, including, among others, the Electronic Data Gathering, Analysis, and Retrieval (EDGAR) program at http://www.sec.gov, Knight-Ridder Information Inc., Federal Filing/Dow Jones and Lexis/Nexis.
We will voluntarily provide paper copies of our filings and code of ethics upon written request received at the address on the cover of this Annual Report on Form 10-K, free of charge.
The following important factors, among others, could cause actual results to differ materially from those indicated by forward-looking statements made in this Annual Report on Form 10-K and presented elsewhere by management from time-to-time.
Economic conditions in the United States could have a material adverse impact on our earnings and financial condition.
Because economic conditions in the United States may affect real estate values, occupancy levels, property income and the propensity and the ability of investors to invest in Sponsored REITs, current and future economic conditions in the United States could have a material adverse impact on our earnings and financial condition. The economy in the United States is continuing to experience significant disruptions, including increased levels of unemployment, the failure and near failure of a number of large financial institutions, reduced liquidity and increased credit risk premiums for a number of market participants. These conditions may continue or worsen in the future. Economic conditions may be affected by numerous factors, including but not limited to, inflation and employment levels, energy prices, recessionary concerns, changes in currency exchange rates, the availability of debt and interest rate fluctuations. At this time we cannot predict the extent or duration of any negative impact that the current disruptions in the U.S. economy will have on our earnings and financial condition.
If a Sponsored REIT defaults on an Acquisition Loan or a Sponsored REIT Loan, we may be required to keep a balance outstanding on the Revolver or use our cash balance to repay the Revolver which may reduce cash available for distribution to our stockholders or for other corporate purposes.
We typically draw on the Revolver to make an acquisition loan to a Sponsored REIT. The acquisition loan enables the Sponsored REIT to acquire real property prior to the consummation of the offering of its equity interests and is typically secured by a first mortgage against the real property acquired. We refer to these loans as Acquisition Loans. Once the offering has been completed, the Sponsored REIT typically repays the Acquisition Loan out of the offering proceeds. From time-to-time, we may also draw on the Revolver to make secured loans to Sponsored REITs for the purpose of funding construction costs, capital expenditures, leasing costs and for other purposes. We refer to these loans as Sponsored REIT Loans. We anticipate that each Sponsored REIT Loan will be repaid at maturity or earlier from long term financing of the property securing the loan, cash flows from that underlying property or some other capital event. If we are unable to fully syndicate a Sponsored REIT or if a Sponsored REIT defaults on an Acquisition Loan or a Sponsored REIT Loan for any other reason, the Sponsored REIT could be unable to fully repay the Acquisition Loan or the Sponsored REIT Loan, as the case may be, and we would have to satisfy our obligation under the Revolver through other means. If we are required to use cash for this purpose, we would have less cash available for distribution to our stockholders or for other corporate purposes.
Covenants in our debt agreements could adversely affect our financial condition.
Our debt agreements contain customary restrictions, requirements and other limitations on our ability to incur indebtedness, including loan to value ratios, debt service coverage ratios, unencumbered liquidity requirements, account balance requirements, net worth requirements, total debt to asset ratios and secured debt to total asset ratios, which we must maintain. Our continued ability to borrow under the Revolver is subject to compliance with our financial and other covenants. Failure to comply with such covenants could cause a default under the applicable debt agreements, and we may then be required to repay such debt with capital from other sources. Under those circumstances, other sources of capital may not be available to us, or be available only on unattractive terms.
We may use debt financing to purchase properties directly for our real estate portfolio, to make Acquisition Loans, Sponsored REIT Loans or for other corporate purposes. If we are unable to obtain debt financing from these or other sources, or to refinance existing indebtedness upon maturity, our financial condition and results of operations could be materially adversely affected. If we breach covenants in our debt agreements, the lenders can declare a default. A default under our debt agreements could result in difficulty financing growth in both the investment banking/investment services and real estate segments of our business and could also result in a reduction in the cash available for distribution to our stockholders or for other corporate purposes. In addition, our debt agreements include cross-default provisions so that a default under one constitutes a default under the other. Defaults under our debt agreements could materially and adversely affect our financial condition and results of operations.
An increase in interest rates would increase our interest costs on variable rate debt and could adversely impact our ability to refinance existing debt or sell assets.
As of December 31, 2009, we had approximately $109.0 million of indebtedness that bears interest at variable rates, and we may incur more of such indebtedness in the future. Approximately $75 million of this variable rate debt is fixed through an interest rate swap contract at 5.84% per annum through October 15, 2011. If interest rates increase, then so will the interest costs on our unhedged variable rate debt, which could adversely affect our cash flow, our ability to pay principal and interest on our debt and our ability to make distributions to our stockholders. In addition, rising interest rates could limit our ability to both incur new debt and to refinance existing debt when it matures. This risk is currently heightened because the debt market is experiencing volatility, including reduced liquidity and increased credit risk premiums. These conditions, which increase the cost and reduce the availability of debt, may continue or worsen in the future. From time to time, we may enter into interest rate swap agreements and other interest rate hedging contracts, including swaps, caps and floors. While these agreements are intended to lessen the impact of rising interest rates on us, they also expose us to the risks that the other parties to the agreements will not perform, we could incur significant costs associated with the settlement of the agreements, the agreements will be unenforceable and the underlying transactions will fail to qualify as highly-effective cash flow hedges. In addition, an increase in interest rates could decrease the amount third parties are willing to pay for our assets, thereby limiting our ability to change our portfolio promptly in response to changes in economic or other conditions.
If we are not able to collect sufficient rents from each of our owned real properties, investments in Sponsored REITs or interest on Acquisition Loans or Sponsored REIT Loans we fund, we may suffer significant operating losses or a reduction in cash available for future dividends.
A substantial portion of our revenue is generated by the rental income of our real properties and investments in Sponsored REITs. If our properties do not provide us with a steady rental income or we do not collect interest income from Acquisition Loans or Sponsored REIT Loans we fund, our revenues will decrease, which may cause us to incur operating losses in the future and reduce the cash available for distribution to our stockholders.
We may not be able to find properties that meet our criteria for purchase.
Growth in our portfolio of real estate and our investment banking/investment services business is dependent on the ability of our acquisition executives to find properties for sale and/or development which meet the applicable investment criteria. To the extent they fail to find such properties, we will be unable to syndicate offerings of Sponsored REITs to investors, and this segment of our business could have lower revenue, and we would be unable to increase the size of our portfolio of real estate, which would reduce the cash available for distribution to our stockholders.
We face risks in continuing to attract investors for Sponsored REITs.
Our investment banking/investment services business continues to depend upon its ability to attract purchasers of equity interests in Sponsored REITs. Our success in this area will depend on the propensity and ability of investors who have previously invested in Sponsored REITs to continue to invest in future Sponsored REITs and on our ability to expand the investor pool for the Sponsored REITs by identifying new potential investors. This risk is currently heightened because the financial markets are experiencing volatility, including the failure and near failure of a number of financial institutions and reduced liquidity and increased credit risk premiums in the debt markets. These conditions may continue or worsen in the future. Moreover, our investment banking/investment services business may be affected to the extent existing Sponsored REITs incur losses or have operating results that fail to meet investors’ expectations.
We are dependent on key personnel.
We depend on the efforts of George J. Carter, our President and Chief Executive Officer and a Director; Barbara J. Fournier, our Chief Operating Officer, Treasurer, Secretary, an Executive Vice President and a Director; John G. Demeritt, our Chief Financial Officer and an Executive Vice President; Janet Prier Notopoulos, an Executive Vice President and a Director; Scott H. Carter, our General Counsel, Assistant Secretary and an Executive Vice President; R. Scott MacPhee, an Executive Vice President; and William W. Gribbell, an Executive Vice President. If any of our executive officers were to resign, our operations could be adversely affected. We do not have employment agreements with any of our executive officers.
Our level of dividends may fluctuate.
Because our real estate occupancy levels and rental rates can fluctuate and our investment banking/investment services business is transactional in nature, there is no predictable recurring level of revenue from such activities. As a result of this, the amount of cash available for distribution may fluctuate, which may result in our not being able to maintain or grow dividend levels in the future. On July 21, 2008, we announced that we had reduced our regular quarterly dividend from $0.31 per share of common stock to $0.19 per share of common stock in order to better align our regular quarterly dividends with the results of our current real estate operations only, without taking into account the results of our less predictable transactional operations.
We face risks from tenant defaults or bankruptcies.
If any of our tenants defaults on its lease, we may experience delays in enforcing our rights as a landlord and may incur substantial costs in protecting our investment. In addition, at any time, a tenant of one of our properties may seek the protection of bankruptcy laws, which could result in the rejection and termination of such tenant’s lease and thereby cause a reduction in cash available for distribution to our stockholders.
The real properties held by us may significantly decrease in value.
As of February 22, 2010, we owned 32 properties. Some or all of these properties may decline in value. To the extent our real properties decline in value, our stockholders could lose some or all of the value of their investments. The value of our common stock may be adversely affected if the real properties held by us decline in value since these real properties represent the majority of the tangible assets held by us. Moreover, if we are forced to sell or lease the real property held by us below its initial purchase price or its carrying costs or if we are forced to lease real property at below market rates because of the condition of the property, our results of operations would be adversely affected and such negative results of operations may result in lower dividends being paid to holders of our common stock.
New acquisitions may fail to perform as expected.
We may acquire new properties, whether by direct FSP Corp. purchase with cash or by drawing on the Revolver, by acquisition of Sponsored REITs or other entities by cash or through the issuance of shares of our stock or by investment in a Sponsored REIT. We acquired a property in Maryland in June 2007, a preferred stock interest in a Sponsored REIT that owns a property in Illinois in December 2007, a property in Texas by merger in May 2008, a property in Virginia in December 2008 and a property in Missouri in December 2008. We also acquired a preferred stock interest in a Sponsored REIT that owns a property in Missouri in May 2009, a property in Virginia in June 2009, a property in Minnesota in June 2009 and another property in Virginia in September 2009. Newly acquired properties, including preferred stock interests therein, may fail to perform as expected, in which case, our results of operations could be adversely affected.
We face risks in owning, developing and operating real property.
An investment in us is subject to the risks incident to the ownership, development and operation of real estate-related assets. These risks include the fact that real estate investments are generally illiquid, which may affect our ability to vary our portfolio in response to changes in economic and other conditions, as well as the risks normally associated with:
| | · | changes in general and local economic conditions; |
| | · | the supply or demand for particular types of properties in particular markets; |
| | · | changes in market rental rates; |
| | · | the impact of environmental protection laws; |
| | · | changes in tax, real estate and zoning laws; and |
| | · | the impact of obligations and restrictions contained in title-related documents. |
Certain significant costs, such as real estate taxes, utilities, insurance and maintenance costs, generally are not reduced even when a property’s rental income is reduced. In addition, environmental and tax laws, interest rate levels, the availability of financing and other factors may affect real estate values and property income. Furthermore, the supply of commercial space fluctuates with market conditions.
We may encounter significant delays in reletting vacant space, resulting in losses of income.
When leases expire, we may incur expenses and may not be able to re-lease the space on the same terms. Certain leases provide tenants the right to terminate early if they pay a fee. If we are unable to re-lease space promptly, if the terms are significantly less favorable than anticipated or if the costs are higher, we may have to reduce distributions to our stockholders. This risk is currently heightened because the economy in the United States is continuing to experience significant disruptions, including increased unemployment, the failure and near failure of a number of financial institutions, reduced liquidity and increased credit risk premiums for a number of market participants. These conditions may continue or worsen in the future. Typical lease terms range from five to ten years, so up to approximately 20% of our rental revenue from commercial properties could be expected to expire each year.
We face risks from geographic concentration.
The properties in our portfolio as of December 31, 2009, by aggregate square footage, are distributed geographically as follows: South – 38.2%, West – 17.8%, Midwest – 18.3%, East – 25.6%. However, within certain of those regions, we hold a larger concentration of our properties in Dallas, Texas – 15.6%, Greater Denver, Colorado – 11.5%, Northern Virginia – 10.7% and Houston, Texas – 9.4%. We are likely to face risks to the extent that any of these areas in which we hold a larger concentration of our properties suffer deteriorating economic conditions.
We compete with national, regional and local real estate operators and developers, which could adversely affect our cash flow.
Competition exists in every market in which our properties are currently located and in every market in which properties we may acquire in the future will be located. We compete with, among others, national, regional and numerous local real estate operators and developers. Such competition may adversely affect the percentage of leased space and the rental revenues of our properties, which could adversely affect our cash flow from operations and our ability to make expected distributions to our stockholders. Some of our competitors may have more resources than we do or other competitive advantages. Competition may be accelerated by any increase in availability of funds for investment in real estate. For example, decreases in interest rates tend to increase the availability of funds and therefore can increase competition. To the extent that our properties continue to operate profitably, this will likely stimulate new development of competing properties. The extent to which we are affected by competition will depend in significant part on both local market conditions and national and global economic conditions.
There is limited potential for revenue to increase from an increase in leased space in our properties.
We anticipate that future increases in revenue from our properties will be primarily the result of scheduled rental rate increases or rental rate increases as leases expire. While we cannot predict when existing vacancy will be leased or if existing tenants with expiring leases will renew their leases or what the terms and conditions of the lease renewals will be, we expect to renew or sign new leases at current market rates for locations in which the buildings are located, which in some cases may be below the expiring rates.
We are subject to possible liability relating to environmental matters, and we cannot assure you that we have identified all possible liabilities.
Under various federal, state and local laws, ordinances and regulations, an owner or operator of real property may become liable for the costs of removal or remediation of certain hazardous substances released on or in its property. Such laws may impose liability without regard to whether the owner or operator knew of, or caused, the release of such hazardous substances. The presence of hazardous substances on a property may adversely affect the owner’s ability to sell such property or to borrow using such property as collateral, and it may cause the owner of the property to incur substantial remediation costs. In addition to claims for cleanup costs, the presence of hazardous substances on a property could result in the owner incurring substantial liabilities as a result of a claim by a private party for personal injury or a claim by an adjacent property owner for property damage.
In addition, we cannot assure you that:
| | · | future laws, ordinances or regulations will not impose any material environmental liability; |
| | · | proposed legislation to address climate change will not increase utility and other costs of operating our properties which, if not offset by rising rental income and/or paid by tenants, would materially and adversely affect our financial condition and results of operations; |
| | · | the current environmental conditions of our properties will not be affected by the condition of properties in the vicinity of such properties (such as the presence of leaking underground storage tanks) or by third parties unrelated to us; |
| | · | tenants will not violate their leases by introducing hazardous or toxic substances into our properties that could expose us to liability under federal or state environmental laws; or |
| | · | environmental conditions, such as the growth of bacteria and toxic mold in heating and ventilation systems or on walls, will not occur at our properties and pose a threat to human health. |
We are subject to compliance with the Americans With Disabilities Act and fire and safety regulations, any of which could require us to make significant capital expenditures.
All of our properties are required to comply with the Americans With Disabilities Act (ADA), and the regulations, rules and orders that may be issued thereunder. The ADA has separate compliance requirements for “public accommodations” and “commercial facilities,” but generally requires that buildings be made accessible to persons with disabilities. Compliance with ADA requirements might require, among other things, removal of access barriers and noncompliance could result in the imposition of fines by the U.S. government or an award of damages to private litigants.
In addition, we are required to operate our properties in compliance with fire and safety regulations, building codes and other land use regulations, as they may be adopted by governmental agencies and bodies and become applicable to our properties. Compliance with such requirements may require us to make substantial capital expenditures, which expenditures would reduce cash otherwise available for distribution to our stockholders.
We face risks associated with our Tenants being designated “Prohibited Persons” by the Office of Foreign Assets Control.
Pursuant to Executive Order 13224 and other laws, the Office of Foreign Assets Control of the United States Department of the Treasury, or OFAC, maintains a list of persons designated as terrorists or who are otherwise blocked or banned, which we refer to as Prohibited Persons. OFAC regulations and other laws prohibit conducting business or engaging in transactions with Prohibited Persons (the “OFAC Requirements”). Our current leases and certain other agreements require the other party to comply with the OFAC Requirements. If a tenant or other party with whom we contract is placed on the OFAC list we may be required by the OFAC Requirements to terminate the lease or other agreement. Any such termination could result in a loss of revenue or a damage claim by the other party that the termination was wrongful.
Actual or threatened terrorist attacks may adversely affect our ability to generate revenues and the value of our properties.
We have significant investments in markets that may be the targets of actual or threatened terrorism attacks in the future. As a result, some tenants in these markets may choose to relocate their businesses to other markets or to lower-profile office buildings within these markets that may be perceived to be less likely targets of future terrorist activity. This could result in an overall decrease in the demand for office space in these markets generally or in our properties in particular, which could increase vacancies in our properties or necessitate that we lease our properties on less favorable terms or both. In addition, future terrorist attacks in these markets could directly or indirectly damage our properties, both physically and financially, or cause losses that materially exceed our insurance coverage. As a result of the foregoing, our ability to generate revenues and the value of our properties could decline materially. See also “We may lose capital investment or anticipated profits if an uninsured event occurs.”
We may lose capital investment or anticipated profits if an uninsured event occurs.
We carry, or our tenants carry, comprehensive liability, fire and extended coverage with respect to each of our properties, with policy specification and insured limits customarily carried for similar properties. There are, however, certain types of losses that may be either uninsurable or not economically insurable. Should an uninsured material loss occur, we could lose both capital invested in the property and anticipated profits.
Contingent or unknown liabilities acquired in mergers or similar transactions could require us to make substantial payments.
The properties which we acquired in mergers were acquired subject to liabilities and without any recourse with respect to liabilities, whether known or unknown. As a result, if liabilities were asserted against us based upon any of these properties, we might have to pay substantial sums to settle them, which could adversely affect our results of operations and financial condition and our cash flow and ability to make distributions to our stockholders. Unknown liabilities with respect to properties acquired might include:
| | · | liabilities for clean-up or remediation of environmental conditions; |
| | · | claims of tenants, vendors or other persons dealing with the former owners of the properties; and |
| | · | liabilities incurred in the ordinary course of business. |
Our employee retention plan may prevent changes in control.
During February 2006, our Board of Directors approved a change in control plan, which included a form of retention agreement and discretionary payment plan. Payments under the discretionary plan are capped at 1% of the market capitalization of FSP Corp. as reduced by the amount paid under the retention plan. The costs associated with these two components of the plan may have the effect of discouraging a third party from making an acquisition proposal for us and may thereby inhibit a change in control under circumstances that could otherwise give the holders of our common stock the opportunity to realize a greater premium over the then-prevailing market prices.
Further issuances of equity securities may be dilutive to current stockholders.
The interests of our existing stockholders could be diluted if additional equity securities are issued to finance future acquisitions, repay indebtedness or to fund other general corporate purposes. Our ability to execute our business strategy depends on our access to an appropriate blend of debt financing, including unsecured lines of credit and other forms of secured and unsecured debt, and equity financing.
The price of our common stock may vary.
The market prices for our common stock may fluctuate with changes in market and economic conditions, including the market perception of REITs in general, and changes in the financial condition of our securities. Such fluctuations may depress the market price of our common stock independent of the financial performance of FSP Corp. The market conditions for REIT stocks generally could affect the market price of our common stock.
We would incur adverse tax consequences if we failed to qualify as a REIT.
The provisions of the tax code governing the taxation of real estate investment trusts are very technical and complex, and although we expect that we will be organized and will operate in a manner that will enable us to meet such requirements, no assurance can be given that we will always succeed in doing so. In addition, as a result of our acquisition of the target REITs pursuant to the mergers, we might no longer qualify as a real estate investment trust. We could lose our ability to so qualify for a variety of reasons relating to the nature of the assets acquired from the target REITs, the identity of the stockholders of the target REITs who become our stockholders or the failure of one or more of the target REITs to have previously qualified as a real estate investment trust. Moreover, you should note that if one or more of the REITs that we acquired in May 2008, April 2006, April 2005 or June 2003 did not qualify as a real estate investment trust immediately prior to the consummation of its acquisition, we could be disqualified as a REIT as a result of such acquisition.
If in any taxable year we do not qualify as a real estate investment trust, we would be taxed as a corporation and distributions to our stockholders would not be deductible by us in computing our taxable income. In addition, if we were to fail to qualify as a real estate investment trust, we could be disqualified from treatment as a real estate investment trust in the year in which such failure occurred and for the next four taxable years and, consequently, we would be taxed as a regular corporation during such years. Failure to qualify for even one taxable year could result in a significant reduction of our cash available for distribution to our stockholders or could require us to incur indebtedness or liquidate investments in order to generate sufficient funds to pay the resulting federal income tax liabilities.
Provisions in our organizational documents may prevent changes in control.
Our Articles of Incorporation and Bylaws contain provisions, described below, which may have the effect of discouraging a third party from making an acquisition proposal for us and may thereby inhibit a change of control under circumstances that could otherwise give the holders of our common stock the opportunity to realize a premium over the then-prevailing market prices.
Ownership Limits. In order for us to maintain our qualification as a real estate investment trust, the holders of our common stock may be limited to owning, either directly or under applicable attribution rules of the Internal Revenue Code, no more than 9.8% of the lesser of the value or the number of our equity shares, and no holder of common stock may acquire or transfer shares that would result in our shares of common stock being beneficially owned by fewer than 100 persons. Such ownership limit may have the effect of preventing an acquisition of control of us without the approval of our board of directors. Our Articles of Incorporation give our board of directors the right to refuse to give effect to the acquisition or transfer of shares by a stockholder in violation of these provisions.
Staggered Board. Our board of directors is divided into three classes. The terms of these classes will expire in 2010, 2011 and 2012, respectively. Directors of each class are elected for a three-year term upon the expiration of the initial term of each class. The staggered terms for directors may affect our stockholders’ ability to effect a change in control even if a change in control were in the stockholders’ best interests.
Preferred Stock. Our Articles of Incorporation authorize our board of directors to issue up to 20,000,000 shares of preferred stock, par value $.0001 per share, and to establish the preferences and rights of any such shares issued. The issuance of preferred stock could have the effect of delaying or preventing a change in control even if a change in control were in our stockholders’ best interest.
Increase of Authorized Stock. Our board of directors, without any vote or consent of the stockholders, may increase the number of authorized shares of any class or series of stock or the aggregate number of authorized shares we have authority to issue. The ability to increase the number of authorized shares and issue such shares could have the effect of delaying or preventing a change in control even if a change in control were in our stockholders’ best interest.
Amendment of Bylaws. Our board of directors has the sole power to amend our Bylaws. This power could have the effect of delaying or preventing a change in control even if a change in control were in our stockholders’ best interests.
Stockholder Meetings. Our Bylaws require advance notice for stockholder proposals to be considered at annual meetings of stockholders and for stockholder nominations for election of directors at special meetings of stockholders. Our Bylaws also provide that stockholders entitled to cast more than 50% of all the votes entitled to be cast at a meeting must join in a request by stockholders to call a special meeting of stockholders. These provisions could have the effect of delaying or preventing a change in control even if a change in control were in the best interests of our stockholders.
Supermajority Votes Required. Our Articles of Incorporation require the affirmative vote of the holders of no less than 80% of the shares of capital stock outstanding and entitled to vote in order (i) to amend the provisions of our Articles of Incorporation relating to the classification of directors, removal of directors, limitation of liability of officers and directors or indemnification of officers and directors or (ii) to amend our Articles of Incorporation to impose cumulative voting in the election of directors. These provisions could have the effect of delaying or preventing a change in control even if a change in control were in our stockholders’ best interest.
| Item 1B. | Unresolved Staff Comments. |
None.
Set forth below is information regarding our properties as of December 31, 2009:
| | Date of
Purchase or | | | | | |
| | Merged Entity | | Percent | Approx. | | |
| | Date of | Approx. | Leased as | Number | | |
| Property Location | Purchase | Square Feet | of 12/31/09 | of Tenants | | Major Tenants1 |
| | | | | | | |
| Office | | | | | | |
| 1515 Mockingbird Lane | 8/1/97 | 109,550 | 86% | 63 | | Primary PhysicianCare |
| Charlotte, NC 28209 | | | | | | |
| | | | | | | |
| 678-686 Hillview Drive | 3/9/99 | 36,288 | 100% | 1 | | Headway Technologies, Inc. |
| Milpitas, CA 95035 | | | | | | |
| | | | | | | |
| 600 Forest Point Circle | 7/8/99 | 62,212 | 100% | 2 | | American National Red Cross |
| Charlotte, NC 28273 | | | | | | Cellco Partnership d/b/a |
| | | | | | | Verizon Wireless |
| | | | | | | |
| 18000 W. Nine Mile Rd. | 9/30/99 | 214,697 | 56% | 4 | | International Business Machines Corp. |
| Southfield, MI 48075 | | | | | | |
| | | | | | | |
| 4820 & 4920 Centennial Blvd. | 9/28/00 | 110,730 | 78% | 3 | | Comcast of ColoradoX, LLC |
| Colorado Springs, CO 80919 | | | | | | Walter Kidde Portable Equipment, Inc. |
| | | | | | | AMI Semiconductor, Inc |
| | | | | | | |
| 14151 Park Meadow Drive | 3/15/01 | 136,683 | 50% | 2 | | American Systems Corporation |
| Chantilly, VA 20151 | | | | | | |
| | | | | | | |
| 1370 & 1390 Timberlake | 5/24/01 | 232,766 | 99% | 5 | | RGA Reinsurance Company |
| Manor Parkway, | | | | | | AMDOCS, Inc. |
| Chesterfield, MO 63017 | | | | | | |
| | | | | | | |
501 & 505 South 336th Street | 9/14/01 | 117,010 | 26% | 5 | | SunGard Availability Services, LP |
| Federal Way, WA 98003 | | | | | | |
| | | | | | | |
| 50 Northwest Point Rd. | 12/5/01 | 176,848 | 100% | 1 | | Citicorp Credit Services, Inc. |
| Elk Grove Village, IL 60005 | | | | | | |
| | | | | | | |
| 1350 Timberlake Manor | 3/4/02 | 116,312 | 100% | 7 | | RGA Reinsurance Company |
| Parkway | | | | | | Metropolitan Life Insurance Company |
| Chesterfield, MO 63017 | | | | | | AB Mauri Food Inc. d/b/a Fleischmanns Yeast |
| | | | | | | |
_____________________
1 Major tenants are tenants who occupy 10% or more of the space in an individual property.
| | Date of
Purchase or | | | | | |
| | Merged Entity | | Percent | Approx. | | |
| | Date of | Approx. | Leased as | Number | | |
| Property Location | Purchase | Square Feet | of 12/31/09 | of Tenants | | Major Tenants1 |
| | | | | | | |
| 16285 Park Ten Place | 6/27/02 | 155,715 | 62% | 7 | | TMI, Inc. a/k/a Trendmaker Homes |
| Houston, TX 77084 | | | | | | PB Americas, Inc. |
| | | | | | | BAE Systems Land & Armaments, LP |
| | | | | | | |
| 2730-2760 Junction Avenue | 8/27/02 | 145,951 | 100% | 3 | | Techwell, Inc. |
| 408-410 East Plumeria | | | | | | County of Santa Clara |
| San Jose, CA 95134 | | | | | | AltiGen Communications, Inc. |
| | | | | | | |
| 15601 Dallas Parkway | 9/30/02 | 293,787 | 61% | 7 | | Behringer Harvard Holdings, LLC |
| Addison, TX 75001 | | | | | | Noble Royalties, Inc. |
| | | | | | | |
| 1500 & 1600 Greenville Ave. | 3/3/03 | 298,766 | 100% | 3 | | Tektronix Texas, LLC. |
| Richardson, TX 75080 | | | | | | ARGO Data Resource Corp. |
| | | | | | | |
| 6550 & 6560 Greenwood Plaza | 2/24/05 | 199,077 | 100% | 1 | | New Era of Networks, Inc. |
| Englewood, CO 80111 | | | | | | |
| | | | | | | |
| 3815-3925 River Crossing Pkwy | 7/6/05 | 205,059 | 95% | 14 | | Crowe, Chizek & Company, LLC |
| Indianapolis, IN 46240 | | | | | | Somerset CPAs, P.C. |
| | | | | | | The College Network, Inc. |
| | | | | | | |
| 5055 & 5057 Keller Springs Rd. | 2/24/06 | 218,934 | 72% | 26 | | See Footnote2 |
| Addison, TX 75001 | | | | | | |
| | | | | | | |
| 2740 North Dallas Parkway | 12/15/00 | 116,622 | 50% | 4 | | Masergy Communications, Inc. |
| Plano, TX 75093 | | | | | | Activant Solutions, Inc. |
| | | | | | | NelsonArchitectural Engineers, Inc. |
| | | | | | | |
| 5505 Blue Lagoon Drive | 11/6/03 | 212,619 | 100% | 1 | | Burger King Corporation |
| Miami, FL 33126 | | | | | | |
| | | | | | | |
| 5600, 5620 & 5640 Cox Road | 7/16/03 | 303,745 | 21% | 3 | | See Footnote2 |
| Glen Allen, VA 23060 | | | | | | |
| | | | | | | |
| 1293 Eldridge Parkway | 1/16/04 | 248,399 | 100% | 1 | | CITGO Petroleum Corporation |
| Houston, TX 77077 | | | | | | |
| | | | | | | |
| 380 Interlocken Crescent | 8/15/03 | 240,184 | 87% | 10 | | Cooley Godward, LLP |
| Broomfield, CO 80021 | | | | | | Montgomery Watson Americas, Inc. |
| | | | | | | VMWare, Inc. |
2 No Tenant occupies more than 10% of the space.
.
| | Date of
Purchase or | | | | | |
| | Merged Entity | | Percent | Approx. | | |
| | Date of | Approx. | Leased as | Number | | |
| Property Location | Purchase | Square Feet | of 12/31/09 | of Tenants | | Major Tenants1 |
| | | | | | | |
| 3625 Cumberland Boulevard | 6/27/06 | 387,267 | 90% | 26 | | Corporate Holdings, LLC |
| Atlanta, GA 30339 | | | | | | Century Business Services, Inc. |
| | | | | | | Bennett Thrasher PC |
| | | | | | | |
| 390 Interlocken Crescent | 12/21/06 | 241,516 | 98% | 14 | | Vail Holdings, Inc. |
| Broomfield, CO 80021 | | | | | | Leopard Communications, Inc. |
| | | | | | | MSI, LLC |
| | | | | | | |
| 120 East Baltimore St. | 6/13/07 | 325,410 | 95% | 19 | | Ober, Kaler, Grimes & Shriver |
| Baltimore, MD 21202 | | | | | | State Retirement and Pension Systems of Maryland |
| | | | | | | SunTrust Bank |
| | | | | | | |
| 16290 Katy Freeway | 9/28/05 | 156,746 | 98% | 4 | | Murphy Exploration and Production |
| Houston, TX 77094 | | | | | | Company |
| | | | | | | |
| 2291 Ball Drive | 12/11/08 | 127,778 | 100% | 1 | | Monsanto Company |
| St Louis, MO 63146 | | | | | | |
| | | | | | | |
| 45925 Horseshoe Drive | 12/26/08 | 135,888 | 100% | 1 | | Giesecke & Devrient America, Inc. |
| Sterling, VA 20166 | | | | | | |
| | | | | | | |
| 4807 Stonecroft Blvd. | 6/26/09 | 111,469 | 100% | 1 | | Northrup Grumman Systems Corp. |
| Chantilly, VA 20151 | | | | | | |
| | | | | | | |
| 14800 Charlson Road | 6/30/09 | 153,028 | 100% | 1 | | C.H. Robinson Worldwide, Inc. |
| Eden Praire, MN 55347 | | | | | | |
| | | | | | | |
| 3140, 3150 Fairview Park Drive | 9/30/09 | 252,613 | 100% | 1 | | Noblis, Inc. |
| Falls Church, VA 22042 | | | | | | |
| | | | | | | |
| Sub Total Office | | 5,843,669 | 84% | | | |
| | | | | | | |
| Industrial | | | | | | |
| 8730 Bollman Place | 12/14/99 | 98,745 | 100% | 1 | | Maines Paper and Foodservice, Inc. |
| Savage (Jessup), MD 20794 | | | | | | |
| | | | | | | |
| Sub Total Industrial | | 98,745 | 100% | | | |
| | | | | | | |
| Grand Total | | | 84% | | | |
All of the properties listed above are owned, directly or indirectly, by us. None of our properties are subject to any mortgage loans. We have no material undeveloped or unimproved properties, or proposed programs for material renovation, improvement or development of any of our properties. We believe that our properties are adequately covered by insurance as of December 31, 2009.
The following table provides certain information about our owned commercial properties as of December 31, 2009:
| | | | | | | | | | | | | | | | | | Average |
| | | | | | | | | | | | | | Percentage | | Annualized | | Annualized |
| | | | | | | | Year Built | | Net | | | | Leased as of | | Rent as of | | Rent per |
| | | | | | | | or | | Rentable | | Leased | | December 31, | | December 31, | | Leased |
| Property Name | | City | | State | Type | | Renovated | | Square Feet | | Sq. Ft. | | 2009 (a) | | 2009 (b) | | Sq. Ft. (c) |
| | | | | | | | | | | | | | | | | | |
| Park Seneca | | Charlotte | | NC | Office | | 1969 | | 109,550 | | 94,575 | | 86.33% | | 1,422,561 | | $ 15.04 |
| Forest Park | | Charlotte | | NC | Office | | 1999 | | 62,212 | | 62,212 | | 100.00% | | 855,162 | | 13.75 |
| Meadow Point | | Chantilly | | VA | Office | | 1999 | | 136,683 | | 68,725 | | 50.28% | | 186,732 | | 2.72 |
| Innsbrook | | Glen Allen | | VA | Office | | 1999 | | 303,745 | | 63,118 | | 20.78% | | 840,930 | | 13.32 |
| East Baltimore | | Baltimore | | MD | Office | | 1989 | | 325,410 | | 308,401 | | 94.77% | | 8,190,610 | | 26.56 |
| Loudoun Tech Center | | Dulles | | VA | Office | | 1999 | | 135,888 | | 135,888 | | 100.00% | | 1,685,767 | | 12.41 |
| Bollman Place | | Savage | | MD | Industrial | | 1984 | | 98,745 | | 98,745 | | 100.00% | | 611,232 | | 6.19 |
| Stonecroft | | Chantilly | | VA | Office | | 2008 | | 111,469 | | 111,469 | | 100.00% | | 4,095,160 | | 36.74 |
| Fairview Park | | Falls Church | | VA | | | 2001 | | 252,613 | | 252,613 | | 100.00% | | 6,523,980 | | 25.83 |
| East total | | | | | | | | | 1,536,315 | | 1,195,746 | | 77.83% | | 24,412,134 | | 20.42 |
| Southfield Centre | | Southfield | | MI | Office | | 1977 | | 214,697 | | 119,396 | | 55.61% | | 1,441,108 | | 12.07 |
| Northwest Point | | Elk Grove Village | | IL | Office | | 1999 | | 176,848 | | 176,848 | | 100.00% | | 3,205,146 | | 18.12 |
| River Crossing | | Indianapolis | | IN | Office | | 1998 | | 205,059 | | 194,246 | | 94.73% | | 4,721,704 | | 24.31 |
| Timberlake | | Chesterfield | | MO | Office | | 1999 | | 232,766 | | 230,347 | | 98.96% | | 4,690,866 | | 20.36 |
| Timberlake East | | Chesterfield | | MO | Office | | 2000 | | 116,312 | | 116,197 | | 99.90% | | 2,559,445 | | 22.03 |
| Lakeside Crossing | | St. Louis | | MO | Office | | 2008 | | 127,778 | | 127,778 | | 100.00% | | 2,883,950 | | 22.57 |
| Eden Bluff | | Eden Praire | | MN | Office | | 2006 | | 153,028 | | 153,028 | | 100.00% | | 3,884,765 | | 25.39 |
| Midwest total | | | | | | | | | 1,226,488 | | 1,117,840 | | 91.14% | | 23,386,983 | | 20.92 |
The following table is continued from the previous page and provides certain information about our owned commercial properties as of December 31, 2009:
| | | | | | | | | | | | | | | | | | Average | |
| | | | | | | | | | | | Percentage | | | Annualized | | | Annualized | |
| | | | Year Built | | Net | | | | | | Leased as of | | | Rent as of | | | Rent per | |
| | | | or | | Rentable | | | Leased | | | December 31, | | | December 31, | | | Leased | |
| Property Name | City | State | Renovated | | Square Feet | | | Sq. Ft. | | | 2009 (a) | | | 2009 (b) | | | Sq. Ft. (c) | |
| | | | | | | | | | | | | | | | | | | |
| Blue Lagoon Drive | Miami | FL | 2002 | | 212,619 | | | 212,619 | | | 100.00 | % | | | 4,597,571 | | | | 21.62 | |
| One Overton Place | Atlanta | GA | 2002 | | 387,267 | | | 349,728 | | | 90.31 | % | | | 9,211,587 | | | | 26.34 | |
| Willow Bend Office Center | Plano | TX | 1999 | | 116,622 | | | 58,071 | | | 49.79 | % | | | 1,003,904 | | | | 17.29 | |
| Park Ten | Houston | TX | 1999 | | 155,715 | | | 96,696 | | | 62.10 | % | | | 2,546,644 | | | | 26.34 | |
| Addison Circle | Addison | TX | 1999 | | 293,787 | | | 180,006 | | | 61.27 | % | | | 4,156,760 | | | | 23.09 | |
| Collins Crossing | Richardson | TX | 1999 | | 298,766 | | | 298,766 | | | 100.00 | % | | | 7,711,008 | | | | 25.81 | |
| Eldridge Green | Houston | TX | 1999 | | 248,399 | | | 248,399 | | | 100.00 | % | | | 6,655,927 | | | | 26.80 | |
| Park Ten Phase II | Houston | TX | 2006 | | 156,746 | | | 153,326 | | | 97.82 | % | | | 3,989,925 | | | | 26.02 | |
| Liberty Plaza | Addison | TX | 1985 | | 218,934 | | | 156,559 | | | 71.51 | % | | | 3,396,852 | | | | 21.70 | |
| South Total | | | | | 2,088,855 | | | 1,754,170 | | | 83.98 | % | | | 43,270,178 | | | | 24.67 | |
| Centennial Technology Center | Colorado Springs | CO | 1999 | | 110,730 | | | 86,910 | | | 78.49 | % | | | 1,316,959 | | | | 15.15 | |
| 380 Interlocken | Broomfield | CO | 2000 | | 240,184 | | | 208,844 | | | 86.95 | % | | | 7,362,819 | | | | 35.26 | |
| Greenwood Plaza | Englewood | CO | 2000 | | 199,077 | | | 199,077 | | | 100.00 | % | | | 8,097,285 | | | | 40.67 | |
| 390 Interlocken | Broomfield | CO | 2002 | | 241,516 | | | 237,837 | | | 98.48 | % | | | 6,089,039 | | | | 25.60 | |
| Hillview Center | Milpitas | CA | 1984 | | 36,288 | | | 36,288 | | | 100.00 | % | | | 527,681 | | | | 14.54 | |
| Federal Way | Federal Way | WA | 1982 | | 117,010 | | | 30,592 | | | 26.14 | % | | | 355,957 | | | | 11.64 | |
| Montague Business Center | San Jose | CA | 1982 | | 145,951 | | | 145,951 | | | 100.00 | % | | | 2,010,109 | | | | 13.77 | |
| West Total | | | | | 1,090,756 | | | 945,499 | | | 86.68 | % | | | 25,759,849 | | | | 27.24 | |
| | | | | | | | | | | | | | | | | | | | | |
| Grand Total | | | | | 5,942,414 | | | 5,013,255 | | | 84.36 | % | | $ | 16,829,143 | | | $ | 23.30 | |
| (a) Based on all leases in effect, including month-to-month tenants, divided by the Property's net rentable square footage. |
| (b) Represents gross rental charges for the month of December 2009 (including month-to-month leases) multiplied by 12, which can result in unusual per square foot amounts calculated when there are free rent periods (usually with new leases). |
| (c) Represents the annualized rent as of December 2009 divided by leased square feet. |
The following table provides a summary schedule of the lease expirations for the 20 tenants with the greatest amount of square feet leased in place for our owned properties as of December 31, 2009, assuming that none of the tenants exercise renewal options:
| | | | Remaining | Aggregate | % of Aggregate | Annualized | % of |
| | Tenant | Number of | Lease Term | Leased | Leased | Rent (a) | Aggregate |
| | Name | Leases | in Months | Square Feet | Square Feet | (in 000's) | Annualized Rent |
| 1 | Noblis, Inc. (e) | 1 | 85 | 252,613 | 4.25% | $ 6,524 | 5.59% |
| 2 | CITGO Petroleum Corporation (b) | 1 | 146 | 248,399 | 4.18% | 6,656 | 5.70% |
| 3 | Tektronix Texas, LLC | 1 | 6 | 241,372 | 4.06% | 6,385 | 5.47% |
| 4 | Burger King Corporation | 1 | 105 | 212,619 | 3.58% | 4,598 | 3.94% |
| 5 | New Era of Networks Inc | 1 | 4 | 199,077 | 3.35% | 8,097 | 6.93% |
| 6 | RGA Reinsurance Company | 1 | 60 | 185,501 | 3.12% | 3,604 | 3.09% |
| 7 | Citicorp Credit Services, Inc (c) | 1 | 84 | 176,848 | 2.98% | 3,158 | 2.70% |
| 8 | C.H. Robinson Worldwide, Inc. (d) | 1 | 138 | 153,028 | 2.58% | 3,885 | 3.33% |
| 9 | Geisecke & Devrient America, Inc. | 1 | 62 | 135,888 | 2.29% | 1,686 | 1.44% |
| 10 | Murphy Exploration & Production Company | 1 | 88 | 133,786 | 2.25% | 3,514 | 3.01% |
| 11 | Monsanto Company | 1 | 61 | 127,778 | 2.15% | 2,884 | 2.47% |
| 12 | Northrop Grumman Systems Corporation (d) | 1 | 100 | 111,469 | 1.88% | 4,095 | 3.51% |
| 13 | Maines Paper & Food Service, Inc. | 1 | 47 | 98,745 | 1.66% | 611 | 0.52% |
| 14 | Amdocs, Inc. | 1 | 17 | 91,928 | 1.55% | 2,062 | 1.77% |
| 15 | County of Santa Clara | 1 | 96 | 90,467 | 1.52% | 1,268 | 1.09% |
| 16 | Ober, Kaler, Grimes & Shriver | 1 | 15 | 89,885 | 1.51% | 2,490 | 2.13% |
| 17 | Vail Holdings, Inc. | 1 | 111 | 83,620 | 1.41% | 2,082 | 1.78% |
| 18 | International Business Machines Corp. | 1 | 31 | 83,209 | 1.40% | 978 | 0.84% |
| 19 | Corporate Holdings, LLC | 1 | 51 | 81,818 | 1.38% | 2,151 | 1.84% |
| 20 | Noble Royalties, Inc. | 1 | 59 | 78,344 | 1.32% | 2,039 | 1.75% |
| | | | | 2,876,394 | 48.40% | $ 68,766 | 58.88% |
| (a) | Annualized rent represents the monthly rent, including tenant reimbursements, for each lease in effect at December 31, 2009 mulitplied by 12. |
| | Tenant reimbursements generally include payment of real estate taxes, operating expenses and common area maintenance and utility charges. |
| (b) | On January 20, 2010, the Company signed a new lease at a Houston, Texas property, for approximately 248,000 square feet of space with one of |
| | its current tenants, CITGO Petroleum Corporation, effectively extending the lease expiration from February 29, 2012 to February 28, 2022. |
| (c) | The lease with Citicorp Credit Services, Inc. is guaranteed by Citigroup. |
| (d) | Acquired in June 2009. |
| (e) | Acquired in September 2009. |
The following table provides a summary schedule of the lease expirations for leases in place for our owned properties as of December 31, 2009, assuming that none of the tenants exercise renewal options:
| | | | | | | | | | |
| | | | Rentable | | | | Annualized | | Percentage |
| | Number of | | Square | | | | Rent | | of Total Final |
| Year of | Leases | | Footage | | Annualized | | Per Square | | Annualized |
| Lease | Expiring | | Subject to | | Rent Under | | Foot Under | | Rent Under |
| Expiration | Within the | | Expiring | | Expiring | | Expiring | | Expiring |
| December 31, | Year | | Leases | | Leases (a) | | Leases | | Leases |
| 2010 | 96 | (b) | 797,637 | | 22,824,562 | | 28.62 | | 19.54% |
| 2011 | 34 | | 402,779 | | 9,352,006 | | 23.22 | | 8.00% |
| 2012 | 39 | (c) | 433,197 | | 9,201,711 | | 21.24 | | 7.88% |
| 2013 | 27 | | 354,393 | | 6,472,017 | | 18.26 | | 5.54% |
| 2014 | 22 | | 585,420 | | 12,447,673 | | 21.26 | | 10.65% |
| 2015 | 16 | | 467,676 | | 8,778,595 | | 18.77 | | 7.51% |
| 2016 | 7 | | 487,849 | | 11,500,538 | | 23.57 | | 9.84% |
| 2017 | 5 | | 523,658 | | 12,370,759 | | 23.62 | | 10.59% |
| 2018 | 5 | | 394,913 | | 10,620,629 | | 26.89 | | 9.09% |
| 2019 | 2 | | 88,719 | �� | 2,302,286 | | 25.95 | | 1.97% |
| 2020 and thereafter | 4 | (c) | 477,014 | | 10,959,267 | | 22.97 | | 9.38% |
| | 257 | | 5,013,255 | | 116,830,043 | | 23.30 | | 100.00% |
| Vacancies as of 12/31/09 | | 929,159 | | | | | | |
| Total Portfolio Square Footage | | 5,942,414 | | | | | | |
| (a) | Annualized rent represents the monthly rent, including tenant reimbursements, for each lease in effect at December 31, 2009 mulitplied by 12. Tenant reimbursements generally include payment of real estate taxes, operating expenses and common area maintenance and utility charges. |
| (b) | 30 Leases are Month to Month |
| (c) | On January 20, 2010, the Company signed a new lease at a Houston, Texas property, for approximately 248,000 square feet of space with CITGO Petroleum Corporation, effectively extending the lease expiration from February 29, 2012 to February 28, 2022. |
From time to time, we may be subject to legal proceedings and claims that arise in the ordinary course of our business. Although occasional adverse decisions (or settlements) may occur, we believe that the final disposition of such matters will not have a material adverse effect on our financial position, cash flows or results of operations.
| Item 4. | Submission of Matters to a Vote of Security Holders |
No matters were submitted to a vote of security holders during the fourth quarter of the fiscal year covered by this report.
Directors and Executive Officers of FSP Corp.
The following table sets forth the names, ages and positions of all our directors and executive officers as of February 22, 2010.
Name | Age | Position |
| | | |
George J. Carter (5) | 61 | President, Chief Executive Officer and Director |
Barbara J. Fournier (4) | 54 | Executive Vice President, Chief Operating Officer, Treasurer, Secretary and Director |
Barry Silverstein (1) (2) (4) | 76 | Director |
Dennis J. McGillicuddy (1) (2) (3) | 68 | Director |
Georgia Murray (1) (2) (5) (7) | 59 | Director |
John N. Burke (1) (2) (4) (6) | 48 | Director |
| John G. Demeritt | 49 | Executive Vice President and Chief Financial Officer |
| William W. Gribbell | 50 | Executive Vice President |
| R. Scott MacPhee | 52 | Executive Vice President |
Janet Prier Notopoulos (3) | 62 | Executive Vice President and Director |
| Scott H. Carter | 38 | Executive Vice President, General Counsel and Assistant Secretary |
________________________________________
(1) Member of the Audit Committee
(2) Member of the Compensation Committee
(3) Class I Director
(4) Class II Director
(5) Class III Director
(6) Chair of the Audit Committee
(7) Chair of the Compensation Committee
George J. Carter, age 61, is President, Chief Executive Officer and has been a Director of FSP Corp. since 2002. Mr. Carter is responsible for all aspects of the business of FSP Corp. and its affiliates, with special emphasis on the evaluation, acquisition and structuring of real estate investments. Prior to the conversion, he was President of the general partner of the FSP Partnership (the “General Partner”) and was responsible for all aspects of the business of the FSP Partnership and its affiliates. From 1992 through 1996 he was President of Boston Financial Securities, Inc. (“Boston Financial”). Prior to joining Boston Financial, Mr. Carter was owner and developer of Gloucester Dry Dock, a commercial shipyard in Gloucester, Massachusetts. From 1979 to 1988, Mr. Carter served as Managing Director in charge of marketing at First Winthrop Corporation, a national real estate and investment banking firm headquartered in Boston, Massachusetts. Prior to that, he held a number of positions in the brokerage industry including those with Merrill Lynch & Co. and Loeb Rhodes & Co. Mr. Carter is a graduate of the University of Miami (B.S.). Mr. Carter is a FINRA General Securities Principal (Series 24) and holds a FINRA Series 7 general securities license.
Barbara J. Fournier, age 54, is Executive Vice President, Chief Operating Officer, Treasurer, Secretary and has been a Director of FSP Corp. since 2002. Ms. Fournier has as her primary responsibility, together with Mr. Carter, the management of all operating business affairs of FSP Corp. and its affiliates. Ms. Fournier was the Principal Financial Officer until March 2005. Prior to the conversion, Ms. Fournier was the Vice President, Chief Operating Officer, Treasurer and Secretary of the General Partner. From 1993 through 1996, she was Director of Operations for the private placement division of Boston Financial. Prior to joining Boston Financial, Ms. Fournier served as Director of Operations for Schuparra Securities Corp. and as the Sales Administrator for Weston Financial Group. From 1979 through 1986, Ms. Fournier worked at First Winthrop Corporation in administrative and management capacities; including Office Manager, Securities Operations and Partnership Administration. Ms. Fournier attended Northeastern University and the New York Institute of Finance. Ms. Fournier is a member of the NYSE Amex Listed Company Council. Ms. Fournier is a FINRA General Securities Principal (Series 24). She also holds other FINRA supervisory licenses including Series 4 and Series 53, and a FINRA Series 7 general securities license.
Barry Silverstein, age 76, has been a Director of the Company since May 2002. Mr. Silverstein took his law degree from Yale University in 1957 and subsequently held positions as attorney/officer/director of various privately-held manufacturing companies in Chicago, Illinois. In 1964, he moved to Florida to manage his own portfolio and to teach at the University of Florida Law School. In 1968, Mr. Silverstein became the principal founder and shareholder in Coaxial Communications, a cable television company. In 1998 and 1999, Coaxial sold its cable systems. Since January 2001, Mr. Silverstein has been a private investor.
Dennis J. McGillicuddy, age 68, has been a Director of the Company since May 2002. Mr. McGillicuddy graduated from the University of Florida with a B.A. degree and from the University of Florida Law School with a J.D. degree. In 1968, Mr. McGillicuddy joined Barry Silverstein in founding Coaxial Communications, a cable television company. In 1998 and 1999, Coaxial sold its cable systems. Mr. McGillicuddy has served on the boards of various charitable organizations. He is currently president of the Board of Trustees of Florida Studio Theater, a professional non-profit theater organization, and he serves as a Co-Chair, together with his wife, of Embracing Our Differences, an annual month-long art exhibit that promotes the values of diversity and inclusion. Mr. McGillicuddy is an officer and board member of The Florida Winefest and Auction Inc., a Sarasota-based charity, which funds programs of local charities that provide services to disadvantaged children and their families. Mr. McGillicuddy also is a member of the Advisory Board to the Center For Mindfulness In Medicine, Health Care & Society, University of Massachusetts Medical School.
Georgia Murray, age 59, has been a Director of the Company since April 2005 and Chair of the Compensation Committee since October 2006. Ms. Murray is retired from Lend Lease Real Estate Investments, Inc., where she served as a Principal from November 1999 until May 2000. From 1987 through October 1999, Ms. Murray served as Senior Vice President and Director of The Boston Financial Group, Inc. Boston Financial was an affiliate of the Boston Financial Group, Inc. She is a past Trustee of the Urban Land Institute and a past President of the Multifamily Housing Institute. Ms. Murray previously served on the Board of Directors of Capital Crossing Bank. She also serves on the boards of numerous non-profit entities. Ms. Murray is a graduate of Newton College.
John N. Burke, age 48, has been a Director of the Company and Chair of the Audit Committee since June 2004. Mr. Burke is a certified public accountant with approximately 25 years of experience in the practice of public accounting working with both private and publicly traded companies with extensive experience serving clients in the real estate industry. Such experience includes the independent analysis and evaluation of financial reporting, accounting systems, internal controls and audit committee matters. Mr. Burke has been involved as an advisor on several client public offering, private equity and debt financings and merger and acquisition transactions. Mr. Burke’s consulting experience includes Securities and Exchange Commission reporting, compliance with Sarbanes-Oxley, and business planning matters. Prior to starting his own accounting and consulting firm in 2003, Mr. Burke was an Assurance Partner in the Boston office of BDO Seidman, LLP, an international accounting and consulting firm. Mr. Burke is a member of the American Institute of Certified Public Accountants, the Massachusetts Society of CPAs and holds FINRA Series 6 and 63 security licensure in Massachusetts. Mr. Burke earned an M.S. in Taxation and studied undergraduate accounting and finance at Bentley College.
John G. Demeritt, age 49, is Executive Vice President and Chief Financial Officer of FSP Corp. and has been Chief Financial Officer since March 2005. Mr. Demeritt previously served as Senior Vice President, Finance and Principal Accounting Officer since September 2004. Prior to September 2004, Mr. Demeritt was a Manager with Caturano & Company, an independent accounting firm where he focused on Sarbanes Oxley compliance. Previously, from March 2002 to March 2004 he provided consulting services to public and private companies where he focused on SEC filings, evaluation of business processes and acquisition integration. During 2001 and 2002 he was Vice President of Financial Planning & Analysis at Cabot Industrial Trust, a publicly traded real estate investment trust, which was acquired by CalWest in December 2001. From October 1995 to December 2000 he was Controller and Officer of The Meditrust Companies, a publicly traded real estate investment trust (formerly known as the The La Quinta Companies, which was then acquired by the Blackstone Group), where he was involved with a number of merger and financing transactions. Prior to that, from 1986 to 1995 he had financial and accounting responsibilities at three other public companies, and was previously associated with Laventhol & Horwath, an independent accounting firm from 1983 to 1986. Mr. Demeritt is a Certified Public Accountant and holds a Bachelor of Science degree from Babson College.
William W. Gribbell, age 50, is an Executive Vice President of FSP Corp. and has as his primary responsibility the direct equity placement of the Sponsored REITs. Prior to the conversion, Mr. Gribbell was an Executive Vice President of the General Partner. From 1993 through 1996 he was an executive officer of Boston Financial. From 1989 to 1993 Mr. Gribbell worked at Winthrop Financial Associates. Mr. Gribbell is a graduate of Boston University (B.A.). Mr. Gribbell holds a FINRA Series 7 general securities license.
R. Scott MacPhee, age 52, is an Executive Vice President of FSP Corp. and has as his primary responsibility the direct equity placement of the Sponsored REITs. Prior to the conversion, Mr. MacPhee was an Executive Vice President of the General Partner. From 1993 through 1996 he was an executive officer of Boston Financial. From 1985 to 1993 Mr. MacPhee worked at Winthrop Financial Associates. Mr. MacPhee attended American International College. Mr. MacPhee holds a FINRA Series 7 general securities license.
Janet Prier Notopoulos, age 62, is an Executive Vice President of FSP Corp. and has been a Director of FSP Corp. and President of FSP Property Management since 2002. Ms. Notopoulos has as her primary responsibility the oversight of the management of the real estate assets of FSP Corp. and its affiliates. Prior to the conversion, Ms. Notopoulos was a Vice President of the General Partner. Prior to joining the FSP Partnership in 1997, Ms. Notopoulos was a real estate and marketing consultant for various clients. From 1975 to 1983, she was Vice President of North Coast Properties, Inc., a Boston real estate investment company. Between 1969 and 1973, she was a real estate paralegal at Goodwin, Procter & Hoar. Ms. Notopoulos is a graduate of Wellesley College (B.A.) and the Harvard School of Business Administration (M.B.A).
Scott H. Carter, age 38, is Executive Vice President, General Counsel and Assistant Secretary of FSP Corp. Mr. Carter has been General Counsel since February 2008. Mr. Carter joined FSP Corp. in October 2005 as Senior Vice President, In-house Counsel and was appointed to the position of Assistant Secretary in May 2006. Mr. Carter has as his primary responsibility the management of all of the legal affairs of FSP Corp. and its affiliates. Prior to joining FSP Corp. in October 2005, Mr. Carter was associated with the law firm of Nixon Peabody LLP, which he originally joined in 1999. At Nixon Peabody LLP, Mr. Carter concentrated his practice on the areas of real estate syndication, acquisitions and finance. Mr. Carter received a Bachelor of Business Administration (B.B.A.) degree in Finance and Marketing and a Juris Doctor (J.D.) degree from the University of Miami. Mr. Carter is admitted to practice law in the Commonwealth of Massachusetts. Mr. Carter’s father, George J. Carter, serves as President, Chief Executive Officer and a Director of FSP Corp.
With the exception of Scott H. Carter, each of the above executive officers has been a full-time employee of FSP Corp. for the past five fiscal years.
George J. Carter, Barbara J. Fournier and Janet Notopoulos is each also a director of each of the following public reporting companies, each of which is a Sponsored REIT: FSP Galleria North Corp.; FSP Phoenix Tower Corp; FSP 50 South Tenth Street Corp.; and FSP 303 East Wacker Drive Corp. Each of these directors holds office in these companies from the time of his or her election until the next annual meeting and until a successor is elected and qualified, or until such director's earlier death, resignation or removal.
PART II
| Item 5. | Market For Registrant’s Common Equity, Related Stockholder Matters and Issuer Purchases of Equity Securities |
Our common stock is listed on the NYSE Amex under the symbol “FSP”. The following table sets forth the high and low sales prices on the NYSE Amex (previously called the NYSE Alternext US, and the American Stock Exchange prior to its acquisition by the NYSE Euronext on October 1, 2008) for the quarterly periods indicated.
| Three Months | | Range |
| Ended | | High | | Low |
| December 31, 2009 | | $ 15.36 | | $ 10.35 |
| September 30, 2009 | | $ 15.20 | | $ 12.00 |
| June 30, 2009 | | $ 14.84 | | $ 11.43 |
| March 31, 2009 | | $ 14.88 | | $ 9.57 |
| | | | | |
| December 31, 2008 | | $ 15.00 | | $ 8.13 |
| September 30, 2008 | | $ 14.80 | | $ 11.05 |
| June 30, 2008 | | $ 16.19 | | $ 12.33 |
| March 31, 2008 | | $ 15.78 | | $ 11.40 |
As of February 10, 2010, there were 6,303 holders of our common stock, including both holders of record and participants in securities position listings.
On January 15, 2010, we declared a dividend of $0.19 per share of our common stock payable to stockholders of record as of January 29, 2010 that was paid on February 19, 2010. Set forth below are the distributions per share of common stock made by FSP Corp. in each quarter since 2008.
| Quarter | Distribution Per Share of |
| Ended | Common Stock of FSP Corp. |
| December 31, 2009 | $0.19 |
| September 30, 2009 | $0.19 |
| June 30, 2009 | $0.19 |
| March 31, 2009 | $0.19 |
| | |
| December 31, 2008 | $0.19 |
| September 30, 2008 | $0.19 |
| June 30, 2008 | $0.31 |
| March 31, 2008 | $0.31 |
While not guaranteed, we expect that cash dividends on our common stock comparable to our most recent quarterly dividend will continue to be paid in the future. See Part I, Item 1A Risk Factors, “Our level of dividends may fluctuate.”, for additional information.
The following table provides information about purchases by Franklin Street Properties Corp. during the quarter ended December 31, 2009 of equity securities that are registered by the Company pursuant to Section 12 of the Exchange Act:
ISSUER PURCHASES OF EQUITY SECURITIES
| Period | (a) Total Number of
Shares (or Units)
Purchased (1) (2) | (b) Average Price
Paid per Share
(or Unit) | (c) Total Number of
Shares (or Units)
Purchased as Part
of Publicly
Announced Plans or
Programs (1) (2) | (d) Maximum Number
(or Approximate
Dollar Value)
of Shares (or Units)
that May Yet Be
Purchased Under
the Plans or
Programs (1) (2) |
10/01/09-10/31/09 | 0 | N/A | 0 | $31,240,465 |
11/01/09-11/30/09 | 0 | N/A | 0 | $0 |
12/01/09-12/31/09 | 0 | N/A | 0 | $0 |
Total: | 0 | N/A | 0 | $0 |
(1) Our Articles of Incorporation provide that we will use our best efforts to redeem shares of our common stock from stockholders who request such redemption. Any FSP Corp. stockholder wishing to have shares redeemed must make such a request no later than July 1 of any year for a redemption that would be effective the following January 1. This obligation is subject to significant conditions. However, as our common stock is currently listed for trading on the NYSE Amex, we are no longer obligated to, and do not intend to, effect any such redemption.
(2) On October 28, 2005, FSP Corp. announced that the Board of Directors of FSP Corp. had authorized the repurchase of up to $35 million of the Company’s common stock from time to time in the open market or in privately negotiated transactions. On September 10, 2007, FSP Corp. announced that the Board of Directors of FSP Corp. had authorized certain modifications to this common stock repurchase plan, including increasing the repurchase authorization to up to $50 million of the Company’s common stock (inclusive of all repurchases previously made under the plan). This repurchase authorization expired on November 1, 2009.
STOCK PERFORMANCE GRAPH
The following graph compares the cumulative total stockholder return on the Company’s common stock between December 31, 2004 and December 31, 2009 with the cumulative total return of (1) the NAREIT Equity Index, (2) the Standard & Poor’s 500 Composite Stock Price Index (“S&P 500”) and (3) the Russell 2000 Total Return Index over the same period. This graph assumes the investment of $100.00 on December 31, 2004 and assumes that any distributions are reinvested.
| | | | | | | | | As of December 31, | | | | |
| | | 2004 | | | 2005 | | | 2006 | | | 2007 | | | 2008 | | | 2009 | |
| FSP | | $ | 100 | | | $ | 125 | | | $ | 133 | | | $ | 102 | | | $ | 109 | | | $ | 116 | |
| NAREIT Equity | | | 100 | | | | 112 | | | | 151 | | | | 128 | | | | 80 | | | | 102 | |
| S&P 500 | | | 100 | | | | 105 | | | | 121 | | | | 128 | | | | 81 | | | | 102 | |
| Russell 2000 | | | 100 | | | | 105 | | | | 124 | | | | 122 | | | | 81 | | | | 103 | |
Notes to Graph:
Because there was no market for the Company’s common stock prior to its listing on the American Stock Exchange (now the NYSE Amex) on June 2, 2005, the Board of Directors made a good faith determination of the price per share of Common Stock as of December 31, 2004 for purposes of the calculations set forth above. In order to make the Common Stock price more comparable to publicly traded indices, the Board of Directors did not apply any discount to reflect the lack of a trading market.
The above performance graph and related information shall not be deemed "soliciting material" or to be "filed" with the Securities and Exchange Commission, nor shall such information be incorporated by reference into any future filing under the Securities Act of 1933 or Securities Exchange Act of 1934, each as amended, except to the extent that we specifically incorporate it by reference into such filing.
| Item 6. | Selected Financial Data |
The following selected financial information is derived from the historical consolidated financial statements of FSP Corp. This information should be read in conjunction with “Management’s Discussion and Analysis of Financial Condition and Results of Operations” in Item 7 and with FSP Corp.’s consolidated financial statements and related notes thereto included in Item 8.
| | | Year Ended December 31, | |
| | | 2009 | | | 2008 | | | 2007 | | | 2006 | | | 2005 | |
| (In thousands, except per share amounts) | | | | | | | | | | | | | | | |
| | | | | | | | | | | | | | | | |
| Operating Data: | | | | | | | | | | | | | | | |
| Total revenue | | $ | 128,383 | | | $ | 120,416 | | | $ | 126,993 | | | $ | 107,245 | | | $ | 72,470 | |
| Income from: | | | | | | | | | | | | | | | | | | | | |
| Continuing operations | | | 27,448 | | | | 31,959 | | | | 36,106 | | | | 41,540 | | | | 30,137 | |
| Discontinued operations | | | - | | | | - | | | | 1,190 | | | | 7,951 | | | | 14,486 | |
| Gain on sale of land or properties | | | 424 | | | | - | | | | 23,789 | | | | 61,438 | | | | 30,493 | |
| Net income | | | 27,872 | | | | 31,959 | | | | 61,085 | | | | 110,929 | | | | 75,116 | |
| | | | | | | | | | | | | | | | | | | | | |
| Basic and diluted income per share: | | | | | | | | | | | | | | | | | | | | |
| Continuing operations | | | 0.38 | | | | 0.45 | | | | 0.51 | | | | 0.62 | | | | 0.53 | |
| Discontinued operations | | | - | | | | - | | | | 0.01 | | | | 0.12 | | | | 0.25 | |
| Gain on sale of land or properties | | | - | | | | - | | | | 0.34 | | | | 0.91 | | | | 0.54 | |
| Total | | | 0.38 | | | | 0.45 | | | | 0.86 | | | | 1.65 | | | | 1.32 | |
| | | | | | | | | | | | | | | | | | | | | |
| Distributions declared per | | | | | | | | | | | | | | | | | | | | |
| share outstanding (1): | | | 0.76 | | | | 1.00 | | | | 1.24 | | | | 1.24 | | | | 1.24 | |
| | | | | | | | | | | | | | | | | | | | | |
| | | As of December 31, | |
| | | | 2009 | | | | 2008 | | | | 2007 | | | | 2006 | | | | 2005 | |
| Balance Sheet Data: | | | | | | | | | | | | | | | | | | | | |
| Total assets | | $ | 1,155,766 | | | $ | 1,025,433 | | | $ | 1,003,466 | | | $ | 955,317 | | | $ | 677,173 | |
| Total liabilities | | | 218,492 | | | | 176,436 | | | | 112,848 | | | | 33,355 | | | | 15,590 | |
| Total shareholders' equity | | | 937,274 | | | | 848,997 | | | | 890,618 | | | | 921,962 | | | | 661,583 | |
(1) The 2005, 2006, 2007 and first half of 2008 quarterly distributions were each in the amount of $0.31 per share of common stock, or $1.24 on an annual basis. Commencing with FSP Corp.’s distribution payable for the quarter ended September 30, 2008, the amount of the distribution was decreased from $0.31 per share of common stock to $0.19 per share of common stock resulting in $1.00 in distributions being paid in 2008 and $0.76 in distributions in 2009.
The 2008, 2006 and 2005 financial statements reflect acquisition by merger of one, five and four Sponsored REITs, respectively. Prior to their acquisition, FSP Corp. held a non-controlling common stock interest with virtually no economic benefits or risks in each of these REITs, a preferred stock interest in Park Ten Development (which was acquired in 2008) and a preferred stock interest in one of the Sponsored REITS acquired by merger in 2006.
| Item 7. | Management’s Discussion and Analysis of Financial Condition and Results of Operations |
The following discussion should be read in conjunction with the financial statements and notes thereto appearing elsewhere in this report. Historical results and percentage relationships set forth in the consolidated financial statements, including trends which might appear, should not be taken as necessarily indicative of future operations. The following discussion and other parts of this Annual Report on Form 10-K may also contain forward-looking statements based on current judgments and current knowledge of management, which are subject to certain risks, trends and uncertainties that could cause actual results to differ materially from those indicated in such forward-looking statements. Accordingly, readers are cautioned not to place undue reliance on forward-looking statements. Investors are cautioned that our forward-looking statements involve risks and uncertainty, including without limitation, economic conditions in the United States, disruptions in the debt markets, economic conditions in the markets in which we own properties, changes in the demand by investors for investment in Sponsored REITs, risks of a lessening of demand for the types of real estate owned by us, changes in government regulations, and expenditures that cannot be anticipated such as utility rate and usage increases, unanticipated repairs, additional staffing, insurance increases and real estate tax valuation reassessments. See “Risk Factors” in Item 1A. Although we believe the expectations reflected in the forward-looking statements are reasonable, we cannot guarantee future results, levels of activity, performance or achievements. We may not update any of the forward-looking statements after the date this Annual Report on Form 10-K is filed to conform them to actual results or to changes in our expectations that occur after such date, other than as required by law.
Overview
FSP Corp., or the Company, operates in two business segments: real estate operations and investment banking/investment services. The real estate operations segment involves real estate rental operations, leasing, secured financing of real estate for interim acquisition or other property financing, and services provided for asset management, property management, property acquisitions, dispositions and development. The investment banking/investment services segment involves the structuring of real estate investments and broker/dealer services that include the organization of Sponsored REITs, the acquisition and development of real estate on behalf of Sponsored REITs and the raising of capital to equitize the Sponsored REITs through sale of preferred stock in private placements.
The main factor that affects our real estate operations is the broad economic market conditions in the United States. These market conditions affect the occupancy levels and the rent levels on both a national and local level. We have no influence on the national market conditions. We look to acquire and/or develop quality properties in good locations in order to lessen the impact of downturns in the market and to take advantage of upturns when they occur.
Our investment banking/investment services customers are primarily institutions and high net-worth individuals. To the extent that the broad capital markets affect these investors our business is also affected. These investors have many investment choices. We must continually search for real estate at a price and at a competitive risk/reward rate of return that meets our customer’s risk/reward profile for providing a stream of income and as a long-term hedge against inflation.
As of December 31, 2009, we have an automatic shelf registration statement on Form S-3 on file with the SEC relating to the offer and sale, from time to time, of an indeterminate amount of our common stock. From time to time, we expect to issue additional shares of our common stock under our automatic shelf registration statement or a different registration statement to fund the acquisition of additional properties, to pay down any existing debt financing and for other corporate purposes.
Trends and Uncertainties
Economic Conditions
The economy in the United States is continuing to experience significant disruptions, including increased levels of unemployment, the failure and near failure of a number of large financial institutions, reduced liquidity and increased credit risk premiums for a number of market participants. Economic conditions may be affected by numerous factors including but not limited to, inflation and employment levels, energy prices, recessionary concerns, changes in currency exchange rates, the availability of debt and interest rate fluctuations. The current disruptions in the U.S. economy have affected our business, resulting in a decline in occupancy in our real estate portfolio in 2009, and may affect real estate values, occupancy levels, property income and the propensity and the ability of investors to invest in our Sponsored REITs in the future. At this time, we cannot predict the extent or duration of any negative impact that the current disruptions in the U.S. economy will have on our business.
On July 21, 2008, we announced that we had reduced our regular quarterly dividend to $0.19 per share of common stock for the three months ended June 30, 2008, which was paid on August 20, 2008. In our July 21, 2008 announcement, we noted that we had experienced a significant slowing of activity in, and lower profit contribution from, two transactional components of our business, investment banking/investment services and property dispositions, since the onset of the current disruptions in the U.S. economy. We also noted that our ongoing/recurring real estate operations continued to show solid performance and that our board of directors believed it was prudent to better align our regular quarterly dividends with the results of our current real estate operations only, without taking into account the results of our less predictable transactional operations. Since the third quarter of 2008, we have continued to experience a significant slowing of activity in, and lower profit contribution from, two transactional components of our business, investment banking/investment services and property dispositions. However, since the third quarter of 2008, we have announced a dividend of $0.19 per share of common stock for each quarterly period.
Real Estate Operations
Our real estate portfolio was approximately 84% leased as of December 31, 2009 and approximately 93% leased as of December 31, 2008. New leasing activity remains slow in most of our markets and we do not expect to see an increase in the pace of leasing until the broader economic markets stabilize and there is new job growth. Approximately 13% of the square footage in our portfolio is scheduled to expire during 2010 and approximately 7% is scheduled to expire during 2011. While we cannot predict when existing vacancy will be leased or if existing tenants with expiring leases will renew their leases or what the terms and conditions of the lease renewals will be, we expect to renew or sign new leases at current market rates for locations in which the buildings are located, which in many cases may be below the expiring rates.
As the economic downturn continues, we believe the potential for any of our tenants to default on its lease or to seek the protection of bankruptcy laws has increased. If any of our tenants defaults on its lease, we may experience delays in enforcing our rights as a landlord and may incur substantial costs in protecting our investment. In addition, at any time, a tenant of one of our properties may seek the protection of bankruptcy laws, which could result in the rejection and termination of such tenant’s lease and thereby cause a reduction in cash available for distribution to our stockholders.
Investment Banking/Investment Services
Unlike our real estate operations business, which provides a rental revenue stream which is ongoing and recurring in nature, our investment banking/investment services business is transactional in nature. Equity raised for Sponsored REIT syndications for 2009 decreased 29.6% to $40.4 million compared to $57.4 million in 2008.
In August 2007, one of our Sponsored REITs, FSP Grand Boulevard Corp., purchased an office property located in Kansas City, Missouri. Permanent equity capitalization of the property was structured as a private placement preferred stock offering totaling $65 million, and was fully subscribed in the second quarter of 2009. We purchased a total of 175.5 shares of preferred stock in the Sponsored REIT at a net cost of approximately $15 million. The balance of the offering was subscribed for primarily by institutions and high net worth individuals, our traditional customer base. In May 2008, one of our Sponsored REITs, FSP 385 Interlocken Development Corp., began development of an office property located in Broomfield, Colorado. Permanent equity capitalization of the property was structured as a private placement offering of preferred stock totaling $38 million, $33.5 million of which had been closed in as of December 31, 2009. This private placement offering is ongoing as of the beginning of 2010. In December 2009, one of our Sponsored REITs, FSP Lakeside Crossing II Corp., purchased an office property located in Maryland Heights, Missouri. Permanent equity capitalization of the property was structured as a private placement stock offering totaling $21 million, and was fully subscribed in the fourth quarter of 2009. Also in December 2009, one of our Sponsored REITs, FSP Centre Pointe V Corp., purchased an office property located in West Chester, Ohio. Permanent equity capitalization of the property was structured as a private placement preferred stock offering totaling $25 million, of which $18.8 had been raised as of December 31, 2009. This private placement offering is ongoing as of the beginning of 2010.
The slowdown in our investment banking business actually began in the third quarter of 2007 and, at this point, it remains unclear when or if a higher volume of equity investment will return. Business in this area, while always uncertain, continues to be adversely affected by the current turmoil in the financial, debt and real estate markets. Investors who have historically participated in our private placement real estate offerings continue to express concern and uncertainty about investing in this environment. Recently, however, some investors have expressed cautious interest in investing some portion of their capital in specific property situations as evidenced by the investments in FSP Lakeside Crossing II Corp. and FSP Centre Pointe V Corp. described above.
In addition to difficulties in raising equity from potential real estate investors in this market, our property acquisition executives are now grappling with greater uncertainty surrounding the valuation levels for prime commercial investment real estate. We believe that the current turmoil in the debt markets, as well as perceptions about the future U.S. economy and interest rates, are producing a larger than normal divergence in the perception of value and future relative investment performance of commercial properties. While we generally believe that such an environment has the potential to produce some exceptional property acquisition opportunities, caution, perspective and disciplined underwriting standards can significantly impact the timing of any future acquisitions. Consequently, our ability to provide a regular stream of real estate investment product necessary to grow our overall investment banking/investment services business continues to remain uncertain as 2010 begins. We also continue to rely solely on our in-house investment executives to access interested investors who have capital they can afford to place in an illiquid position for an indefinite period of time (i.e., invest in a Sponsored REIT). We continue to evaluate whether our in-house sales force is capable, either through our existing client base or through new clients, of raising sufficient investment capital in Sponsored REITs to achieve future performance objectives.
Discontinued Operations and Property Dispositions
During the years ended December 31, 2009 and 2008, we sold no properties. However, we recognized a gain of approximately $424,000 on a small piece of land as a result of a land taking by the Commonwealth of Virginia in 2009. During the year ended December 31, 2007, we disposed of five office properties. The five office properties are located in Greenville, South Carolina; Alpharetta, Georgia; San Diego, California; Westford, Massachusetts and Austin, Texas. Accordingly, sold properties as of December 31, 2007 are classified as held for sale on our financial statements. The operating results for these real estate assets have been reflected as discontinued operations in the financial statements for the year ended December 31, 2007.
We continue to evaluate our portfolio, and in the future may decide to dispose of additional properties from time-to-time in the ordinary course of business. However, because of the current uncertainty surrounding the valuation levels for real estate and the current uncertainty in the capital and debt markets previously discussed, we do not expect the level of disposition activity to be as significant as it was in 2007.
Critical Accounting Policies
We have certain critical accounting policies that are subject to judgments and estimates by our management and uncertainties of outcome that affect the application of these policies. We base our estimates on historical experience and on various other assumptions we believe to be reasonable under the circumstances. On an on-going basis, we evaluate our estimates. In the event estimates or assumptions prove to be different from actual results, adjustments are made in subsequent periods to reflect more current information. The accounting policies that we believe are most critical to the understanding of our financial position and results of operations, and that require significant management estimates and judgments, are discussed below. Significant estimates in the consolidated financial statements include the allowance for doubtful accounts, purchase price allocations, useful lives of fixed assets and the valuation of the derivative.
Critical accounting policies are those that have the most impact on the reporting of our financial condition and results of operations and those requiring significant judgments and estimates. We believe that our judgments and estimates are consistently applied and produce financial information that fairly presents our results of operations. Our most critical accounting policies involve our investments in Sponsored REITs and our investments in real property. These policies affect our:
| | · | allocation of purchase prices; |
| | · | allowance for doubtful accounts; |
| | · | assessment of the carrying values and impairments of long lived assets; |
| | · | useful lives of fixed assets; |
| | · | valuation of derivatives; |
| | · | classification of leases; and |
| | · | revenue recognition in the syndication of Sponsored REITs. |
Allocation of Purchase Price
We have historically allocated the purchase prices of properties to land, buildings and improvements. Each component of purchase price generally has a different useful life. For properties acquired subsequent to June 1, 2001, we allocate the value of real estate acquired among land, buildings, improvements and identified intangible assets and liabilities, which may consist of the value of above market and below market leases, the value of in-place leases, and the value of tenant relationships. Purchase price allocations and the determination of the useful lives are based on management’s estimates. Under some circumstances we may rely upon studies commissioned from independent real estate appraisal firms in determining the purchase price allocations.
Purchase price allocated to land and building and improvements is based on management’s determination of the relative fair values of these assets assuming the property was vacant. Management determines the fair value of a property using methods similar to those used by independent appraisers. Purchase price allocated to above market leases is based on the present value (using an interest rate which reflects the risks associated with the leases acquired) of the difference between (i) the contractual amounts to be paid pursuant to the in-place leases and (ii) our estimate of fair market lease rates for the corresponding leases, measured over a period equal to the remaining non-cancelable terms of the respective leases. Purchase price allocated to in-place leases and tenant relationships is determined as the excess of (i) the purchase price paid for a property after adjusting existing in-place leases to market rental rates over (ii) the estimated fair value of the property as if vacant. This aggregate value is allocated between in-place lease values and tenant relationships is based on management’s evaluation of the specific characteristics of each tenant’s lease; however, the value of tenant relationships has not been separated from in-place lease value because such value and its consequence to amortization expense is immaterial for acquisitions reflected in our financial statements. Factors considered by us in performing these analyses include (i) an estimate of carrying costs during the expected lease-up periods, including real estate taxes, insurance and other operating income and expenses, and (ii) costs to execute similar leases in current market conditions, such as leasing commissions, legal and other related costs. If future acquisitions result in our allocating material amounts to the value of tenant relationships, those amounts would be separately allocated and amortized over the estimated life of the relationships.
Allowance for bad debts
We provide an allowance for doubtful accounts based on our estimate of a tenant’s ability to make future rent payments. The computation of this allowance is based in part on the tenants’ payment history and current credit status.
Impairment
We periodically evaluate our real estate properties for impairment indicators. These indicators may include declining tenant occupancy, weak or declining tenant profitability, cash flow or liquidity, our decision to dispose of an asset before the end of its estimated useful life or legislative, economic or market changes that permanently reduce the value of our investments. If indicators of impairment are present, we evaluate the carrying value of the property by comparing it to its expected future undiscounted cash flows. If the sum of these expected future cash flows is less than the carrying value, we reduce the net carrying value of the property to the present value of these expected future cash flows. This analysis requires us to judge whether indicators of impairment exist and to estimate likely future cash flows. If we misjudge or estimate incorrectly or if future tenant profitability, market or industry factors differ from our expectations, we may record an impairment charge which is inappropriate or fail to record a charge when we should have done so, or the amount of such charges may be inaccurate.
Depreciation Expense
We compute depreciation expense using the straight-line method over estimated useful lives of up to 39 years for buildings and improvements, and up to 15 years for personal property. Costs incurred in connection with leasing (primarily tenant improvements and leasing commissions) are capitalized and amortized over the lease period. The allocated cost of land is not depreciated. The value of above or below-market leases is amortized over the remaining non-cancelable periods of the respective leases as an adjustment to rental income. The value of in-place leases, exclusive of the value of above-market and below-market in-place leases, is also amortized over the remaining non-cancelable periods of the respective leases. If a lease is terminated prior to its stated expiration, all unamortized amounts relating to that lease are written off. Inappropriate allocation of acquisition costs, or incorrect estimates of useful lives, could result in depreciation and amortization expenses which do not appropriately reflect the allocation of our capital expenditures over future periods, as is required by generally accepted accounting principles.
Derivative Instruments
We recognize derivatives on the balance sheet at fair value. Derivatives that do not qualify, or are not designated as hedge relationships, must be adjusted to fair value through income. Derivative instruments designated in a hedge relationship to mitigate exposure to variability in expected future cash flows, or other types of forecasted transactions, are considered cash flow hedges. Cash flow hedges are accounted for by recording the fair value of the derivative instrument on the balance sheet as either an asset or liability. To the extent hedges are effective, a corresponding amount, adjusted for swap payments, is recorded in accumulated other comprehensive income within stockholders’ equity. Amounts are then reclassified from accumulated other comprehensive income to the income statement in the period or periods the hedged forecasted transaction affects earnings. Ineffectiveness, if any, is recorded in the income statement. We periodically review the effectiveness of each hedging transaction, which involves estimating future cash flows, at least quarterly. Derivative instruments designated in a hedge relationship to mitigate exposure to changes in the fair value of an asset, liability, or firm commitment attributable to a particular risk, such as interest rate risk, are considered fair value hedges. We currently have no fair value hedges outstanding. Fair values of derivatives are subject to significant variability based on changes in interest rates. The results of such variability could be a significant increase or decrease in our derivative assets, derivative liabilities, book equity, and/or earnings.
Lease Classification
Some of our real estate properties are leased on a triple net basis, pursuant to non-cancelable, fixed term, operating leases. Each time we enter a new lease or materially modify an existing lease we evaluate whether it is appropriately classified as a capital lease or as an operating lease. The classification of a lease as capital or operating affects the carrying value of a property, as well as our recognition of rental payments as revenue. These evaluations require us to make estimates of, among other things, the remaining useful life and market value of a property, discount rates and future cash flows. Incorrect assumptions or estimates may result in misclassification of our leases.
Revenue Recognition
We earn syndication and transaction fees in connection with the syndication of Sponsored REITs. We recognize syndication fees related to commissions when shares of the Sponsored REIT are sold and the investor’s funds have been transferred from escrow into our account. We recognize transaction fees related to loan commitment and acquisition fees upon an investor closing and the subsequent payment of the Sponsored REIT’s loan and fees payable to us. Other transaction fees are recognized upon the final closing of the syndication of the Sponsored REIT.
Ownership of Stock in a Sponsored REIT
Common stock investments in Sponsored REITs are consolidated while the entity is controlled by the Company. Following the commencement of syndication the Company exercises influence over, but does not control these entities and investments are accounted for using the equity method. Once under the equity method of accounting, our cost basis is adjusted by our share of the Sponsored REITs' earnings, if any, prior to completion of the syndication. Equity in losses or dividends received from Sponsored REITs generally are recognized as income once the investment balance is reduced to zero, unless there is an asset held for syndication from the Sponsored REIT entity. Equity in losses or distributions received in excess of investment is recorded as an adjustment to the carrying value of the asset held for syndication.
We recognize our share of the operations during the period we consolidate and when the equity method is appropriate, as opposed to classifying the Sponsored REITs as discontinued operations, because we earn an ongoing asset and/or property management fee from Sponsored REITs. These ongoing fees, in addition to the influence that we exercise over the Sponsored REIT, constitute a continuing involvement between the Company and the Sponsored REIT and preclude treatment as discontinued operations.
We currently hold preferred stock interest in three Sponsored REITs. As a result of our common stock interest and our preferred stock interest in these three Sponsored REITs, we exercise influence over, but do not control these entities. These preferred share investments are accounted for using the equity method. Under the equity method of accounting our cost basis is adjusted by our share of the Sponsored REITs' operations and distributions received. We also agreed to vote our preferred shares (i) with respect to any merger in the same manner that a majority of the other stockholders of the Sponsored REIT vote for or against the merger and (ii) with respect to any other matter presented to a vote by the stockholders of these Sponsored REITs in the same proportion as shares voted by other stockholders of that Sponsored REIT.
These policies involve significant judgments made based upon our experience, including judgments about current valuations, ultimate realizable value, estimated useful lives, salvage or residual value, the ability of our tenants to perform their obligations to us, current and future economic conditions and competitive factors in the markets in which our properties are located. Competition, economic conditions and other factors may cause occupancy declines in the future. In the future we may need to revise our carrying value assessments to incorporate information which is not now known and such revisions could increase or decrease our depreciation expense related to properties we own, result in the classification of our leases as other than operating leases or decrease the carrying values of our assets.
Recent Accounting Standards
In June 2009, the Financial Accounting Standards Board, or FASB, issued a pronouncement establishing the FASB Accounting Standards Codification as the source of authoritative accounting principles recognized by the FASB to be applied in the preparation of financial statements in conformity with GAAP. The standard explicitly recognizes rules and interpretive releases of the SEC under federal securities laws as authoritative GAAP for SEC registrants. This standard is effective for financial statements issued for fiscal years and interim periods ending after September 15, 2009. The Company has adopted this standard in accordance with GAAP.
In September 2006, the FASB issued a pronouncement that defines fair value, establishes a framework for measuring fair value in GAAP and provides for expanded disclosure about fair value measurements that will be applied prospectively, to all other accounting pronouncements that require or permit fair value measurements. The pronouncement excludes certain leasing transactions accounted for in accounting for leases and was effective for financial statements issued for fiscal years beginning after November 15, 2007, and interim periods within those fiscal years. The adoption did not have a material impact on the Company’s financial position, operations or cash flow. The FASB then issued a pronouncement to defer the effective date for all non-financial assets and non-financial liabilities except those that are recognized or disclosed at fair value in the financial statements on a recurring basis to fiscal years beginning after November 15, 2008. The adoption of this standard did not have a material impact on the Company’s financial position, results of operations or cash flows.
In December 2007, the FASB issued a pronouncement, which establishes principles and requirements for how the acquirer shall recognize and measure in its financial statements the identifiable assets acquired, liabilities assumed, any noncontrolling interest in the acquiree and goodwill acquired in a business combination. The pronouncement was effective for business combinations for which the acquisition date is on or after the beginning of the first annual reporting period beginning on or after December 15, 2008. The adoption of this standard did not have a material impact on the Company’s financial position, results of operations or cash flows.
In May 2009, the FASB issued a pronouncement which sets forth the period after the balance sheet date during which management of a reporting entity should evaluate events or transactions that may occur for potential recognition or disclosure in the financial statements, the circumstances under which an entity should recognize events or transactions occurring after the balance sheet date in its financial statements, and disclosures that an entity should make about events or transactions that occurred after the balance sheet date. This pronouncement requires the disclosure of the date through which an entity has evaluated subsequent events and the basis for that date. This disclosure should alert all users of financials statements that an entity has not evaluated subsequent events after that date in the set of financial statements being presented. The Company is adhering to the requirements of this pronouncement, which was effective for financial periods ending after June 15, 2009.
On June 12, 2009, the FASB issued a pronouncement that changes how a company determines when an entity that is insufficiently capitalized or is not controlled through voting (or similar rights) should be consolidated. The determination of whether a company is required to consolidate an entity is based on, among other things, an entity`s purpose and design and a company`s ability to direct the activities of the entity that most significantly impact the entity`s economic performance. The pronouncement is effective for fiscal years and interim periods within those fiscal years beginning on or after November 15, 2009. The Company is currently evaluating the impact of this pronouncement on the Company’s consolidated financial statements.
Results of Operations
Overview
During 2007 we acquired one property, made an $82.8 million investment in a Sponsored REIT and sold five properties. During 2008, we acquired one property by merger and two additional properties by direct acquisition. During 2009, we acquired three properties, made a $15 million investment in a Sponsored REIT and completed an underwritten public offering of 9.2 million shares of our common stock (including 1.2 million shares issued as a result of the full exercise of an overallotment option by the underwriter) at a price to the public of $13.00 per share. As a result of this activity, as of December 31, 2009, we owned 32 properties and had investments in three non-consolidated REITs.
Mergers and Acquisitions:
On June 13, 2007, we acquired a commercial property in Maryland. On May 15, 2008, we completed the acquisition by merger of Park Ten Development, on December 11, 2008 we acquired a commercial property in Missouri and on December 23, 2008 we acquired a commercial property in Virginia. On June 26, 2009, we acquired a commercial property in Virginia, on June 30, 2009 we acquired a commercial property in Minnesota and on September 30, 2009 we acquired another commercial property in Virginia. The results of operations for each of the acquired properties are included in our operating results as of their respective merger or purchase dates. Increases in rental revenues and expenses for the year ended December 31, 2009 compared to the year ended December 31, 2008, or the year ended December 31, 2008 compared to the year ended December 31, 2007 are primarily a result of the timing of these acquisitions and subsequent contribution of these acquired properties.
Sales of Real Estate:
On January 31, 2007, we sold a commercial property, located in Greenville, South Carolina, on June 21, 2007, we sold an office property in Alpharetta, Georgia, on June 27, 2007 we sold an office property in San Diego, California, on July 16, 2007 we sold an office property in Westford, Massachusetts, and on December 20, 2007 we sold an office property in Austin, Texas. We had no sales of real estate in 2008 or 2009. However, we recognized a gain of approximately $424,000 on a small piece of land as a result of a land taking by the Commonwealth of Virginia in 2009. The operating results of the properties sold in 2007 are classified as discontinued operations in our financial statements for all periods presented.
Investment Banking:
Revenue for the investment banking/investment services segment is primarily based on the gross proceeds from the sale of securities in the syndications of the Sponsored REITs. During 2007, we completed one syndication of a Sponsored REIT and began the process of syndicating another Sponsored REIT (which we completed in May 29, 2009), for which total gross proceeds aggregated $147.5 million in 2007. During 2008, we started syndication of another Sponsored REIT. Total gross proceeds from both syndications aggregated $57.4 million in 2008 and one remains currently in process. During 2009, we completed the syndication of two Sponsored REITs and began the process of syndicating another Sponsored REIT, for which total gross proceeds aggregated $40.4 million in 2009. We believe the decrease of $17.0 million in 2009 compared to 2008 and the decrease of $90.1 million in 2008 compared to 2007 were attributable to the recent turmoil in the financial, debt and real estate markets, which is discussed above in “Trends and Uncertainties – Economic Conditions”. Revenues and expenses for investment banking/investment services are directly related to the gross proceeds of these syndications.
Our acquisition executives continue to work on other property investment opportunities for our own portfolio and for syndication. However, business growth in the syndication area remains uncertain at the beginning of 2010.
The following table shows financial results for the years ended December 31, 2009 and 2008.
| (in thousands) | | | | | | | | | |
| Revenues: | | 2009 | | | 2008 | | | Change | |
| Rental | | $ | 122,074 | | | $ | 111,198 | | | $ | 10,876 | |
| Related party revenue: | | | | | | | | | | | | |
| Syndication fees | | | 2,428 | | | | 3,766 | | | | (1,338 | ) |
| Transaction fees | | | 2,080 | | | | 3,641 | | | | (1,561 | ) |
| Management fees and interest income from loans | | | 1,740 | | | | 1,739 | | | | 1 | |
| Other | | | 61 | | | | 72 | | | | (11 | ) |
| Total revenues | | | 128,383 | | | | 120,416 | | | | 7,967 | |
| | | | | | | | | | | | | |
| Expenses: | | | | | | | | | | | | |
| Real estate operating expenses | | | 30,822 | | | | 28,999 | | | | 1,823 | |
| Real estate taxes and insurance | | | 19,228 | | | | 17,740 | | | | 1,488 | |
| Depreciation and amortization | | | 36,293 | | | | 30,360 | | | | 5,933 | |
| Selling, general and administrative | | | 8,891 | | | | 8,268 | | | | 623 | |
| Commissions | | | 1,801 | | | | 2,151 | | | | (350 | ) |
| Interest | | | 6,570 | | | | 4,921 | | | | 1,649 | |
| Total expenses | | | 103,605 | | | | 92,439 | | | | 11,166 | |
| | | | | | | | | | | | | |
| Income before interest income, equity in earnings (losses) of non-consolidated REITs and taxes on income | | | 24,778 | | | | 27,977 | | | | (3,199 | ) |
| Interest income | | | 97 | | | | 745 | | | | (648 | ) |
| Equity in earnings (losses) of non-consolidated REITs | | | 1,994 | | | | 2,747 | | | | (753 | ) |
| Income before taxes on income | | | 26,869 | | | | 31,469 | | | | (4,600 | ) |
| Taxes on income | | | (579 | ) | | | (490 | ) | | | (89 | ) |
| | | | | | | | | | | | | |
| Income from continuing operations | | | 27,448 | | | | 31,959 | | | | (4,511 | ) |
| Discontinued operations: | | | | | | | | | | | | |
| Income from discontinued operations | | | - | | | | - | | | | - | |
| Gain on sale of properties, less applicable income tax | | | 424 | | | | - | | | | 424 | |
| Total discontinued operations | | | 424 | | | | - | | | | 424 | |
| | | | | | | | | | | | | |
| Net income | | $ | 27,872 | | | $ | 31,959 | | | $ | (4,087 | ) |
Comparison of the year ended December 31, 2009 to the year ended December 31, 2008
Revenues
Total revenues increased by $8.0 million to $128.4 million for the year ended December 31, 2009, as compared to $120.4 million for the year ended December 31, 2008. The increase was primarily a result of:
| | o | An increase to rental revenue of approximately $10.9 million arising primarily from the acquisition of a property in Texas in May 2008, the acquisition of two properties located in Virginia and Missouri in December 2008, the acquisition of two properties located in Virginia and Minnesota in June 2009, the acquisition of another property in Virginia in September 2009 and early termination fees of $0.8 million received during the year ended December 31, 2009. |
This increase was partially offset by:
| | o | A $2.9 million decrease in syndication fees and transaction fees, which was principally a result of the decrease in gross syndication proceeds for the year ended December 31, 2009 compared to the same period in 2008. |
Expenses
Total expenses increased by approximately $11.2 million to $103.6 million for the year ended December 31, 2009 compared to $92.4 million for the year ended December 31, 2008. The increase was primarily a result of:
| | o | An increase in real estate operating expenses and real estate taxes and insurance of approximately $3.3 million, and depreciation and amortization of $5.9 million, which were primarily from the acquisition of a property in Texas in May 2008, the acquisition of two properties located in Virginia and Missouri in December 2008, the acquisition of two properties located in Virginia and Minnesota that were acquired in June 2009 and the acquisition of another property in Virginia in September 2009. |
| | o | An increase in interest expense of approximately $1.6 million primarily as a result of the addition of the Term Loan, which was borrowed in October 2008; and was partially offset by lower average interest rates during the year ended December 31, 2009 compared to the year ended December 31, 2008. |
| | o | An increase in general and administrative expenses of $0.6 million, which was primarily the result acquisition costs of $643,000 that were recorded in during the year ended December 31, 2009 related to the acquisition of two properties in June 2009 and the acquisition of a property in September 2009. We had 43 and 41 employees as of December 31, 2009 and 2008, respectively, at our headquarters in Wakefield. |
These increases were partially offset by:
| | o | A decrease in commission expense of $350,000, which was principally a result of the decrease in gross syndication proceeds in the year ended December 31, 2009 compared to the same period in 2008. |
Interest income
Interest income decreased $0.6 million to $0.1 million during the year ended December 31, 2009, which was primarily a result of lower average interest rates on invested funds and lower average balances of cash and cash equivalents in 2009 compared to the same period in 2008.
Equity in earnings of non-consolidated REITs
Equity in earnings from non-consolidated REITs decreased approximately $0.8 million to $2.0 million, which was principally a result of our preferred stock investment in East Wacker during the year ended December 31, 2009 compared to the same period of 2008.
Taxes on income
Taxes on income decreased approximately $0.1 million to a tax benefit of $0.6 million during the year ended December 31, 2009 compared to the same period of 2008. The decrease was primarily due to a lower taxable income from the investment banking and investment services business in the 2009 period compared to 2008.
Income from continuing operations
The resulting income from continuing operations for the year ended December 31, 2009 compared to the year ended December 31, 2008 decreased $4.5 million to $27.4 million for the reasons described above.
Gain on sale
During 2009, we recognized a gain of approximately $424,000 on a small piece of land as a result of a land taking by the Commonwealth of Virginia. During 2008, we did not sell any properties.
Net income
Net income for the year ended December 31, 2009 decreased $4.1 million to $27.9 million compared to $32.0 million for the year ended December 31, 2008, for the reasons described above.
The following table shows financial results for the years ended December 31, 2008 and 2007.
| (in thousands) | | | | | | | | | |
| Revenues: | | 2008 | | | 2007 | | | Change | |
| Rental | | $ | 111,198 | | | $ | 100,961 | | | $ | 10,237 | |
| Related party revenue: | | | | | | | | | | | | |
| Syndication fees | | | 3,766 | | | | 8,986 | | | | (5,220 | ) |
| Transaction fees | | | 3,641 | | | | 9,898 | | | | (6,257 | ) |
| Management fees and interest income from loans | | | 1,739 | | | | 7,030 | | | | (5,291 | ) |
| Other | | | 72 | | | | 118 | | | | (46 | ) |
| Total revenues | | | 120,416 | | | | 126,993 | | | | (6,577 | ) |
| | | | | | | | | | | | | |
| Expenses: | | | | | | | | | | | | |
| Real estate operating expenses | | | 28,999 | | | | 26,171 | | | | 2,828 | |
| Real estate taxes and insurance | | | 17,740 | | | | 16,535 | | | | 1,205 | |
| Depreciation and amortization | | | 30,360 | | | | 29,334 | | | | 1,026 | |
| Selling, general and administrative | | | 8,268 | | | | 7,466 | | | | 802 | |
| Commissions | | | 2,151 | | | | 4,737 | | | | (2,586 | ) |
| Interest | | | 4,921 | | | | 7,684 | | | | (2,763 | ) |
| Total expenses | | | 92,439 | | | | 91,927 | | | | 512 | |
| | | | | | | | | | | | | |
| Income before interest income, equity in earnings (losses) of non-consolidated REITs and taxes on income | | | 27,977 | | | | 35,066 | | | | (7,089 | ) |
| Interest income | | | 745 | | | | 2,377 | | | | (1,632 | ) |
| Equity in earnings (losses) of non-consolidated REITs | | | 2,747 | | | | (464 | ) | | | 3,211 | |
| | | | | | | | | | | | | |
| Income before taxes on income | | | 31,469 | | | | 36,979 | | | | (5,510 | ) |
| Taxes on income | | | (490 | ) | | | 873 | | | | (1,363 | ) |
| | | | | | | | | | | | | |
| Income from continuing operations | | | 31,959 | | | | 36,106 | | | | (4,147 | ) |
| Discontinued operations: | | | | | | | | | | | | |
| Income from discontinued operations | | | - | | | | 1,190 | | | | (1,190 | ) |
| Gain on sale of properties, less applicable income tax | | | - | | | | 23,789 | | | | (23,789 | ) |
| Total discontinued operations | | | - | | | | 24,979 | | | | (24,979 | ) |
| | | | | | | | | | | | | |
| Net income | | $ | 31,959 | | | $ | 61,085 | | | $ | (29,126 | ) |
Comparison of the year ended December 31, 2008 to the year ended December 31, 2007
Revenues
Total revenues decreased by $6.6 million to $120.4 million for the year ended December 31, 2008, as compared to $127.0 million for the year ended December 31, 2007. The decrease was primarily a result of:
| | o | A $11.5 million decrease in syndication and transaction fees, which was principally a result of the decrease in gross syndication proceeds for the year ended December 31, 2008 compared to the same period in 2007. |
| | o | A $5.3 million decrease in interest income from loans, which was principally a result of lower interest income earned from lower average loan balances during the year ended December 31, 2008 as compared to the same period in 2007. This interest income is derived from mortgage loans on the properties in syndication. The impact of this decrease was slightly greater as a result of lower interest rates charged during 2008 compared to 2007. |
These decreases were partially offset by:
| | o | An increase to rental revenue of approximately $10.2 million from real estate arising primarily from the acquisitions of the following properties: a property in Maryland in June 2007, a property in Texas in May 2008, a property in Missouri in December 2008 and a property in Virginia in December 2008. |
Expenses
Total expenses were $92.4 million for the year ended December 31, 2008, or an increase of $0.5 million compared to the year ended December 31, 2007. The increase was primarily a result of:
| | o | The increase in real estate operating expenses, real estate taxes and insurance costs of $4.0 million, and depreciation of $1.0 million, which were primarily a result of the acquisitions discussed above. |
| | o | An increase in selling, general and administrative expenses of approximately $0.8 million for the year ended December 31, 2008, which was primarily a result of the cost of new employees hired in 2008, and increases in discretionary bonuses and professional fees. We had 41 and 38 employees as of December 31, 2008 and 2007 at our headquarters in Wakefield. |
These increases were partially offset by:
| | o | A decrease in interest expense of $2.8 million resulting primarily from a lower average loan balance outstanding during the year ended December 31, 2008 compared to the year ended December 31, 2007, and to a lesser extent lower interest rates in 2008 compared to 2007. |
| | o | A decrease in commission expenses of $2.6 million, which was principally a result of the decrease in gross syndication proceeds for the year ended December 31, 2008 compared to the year ended December 31, 2007. |
Interest income
Interest income decreased $1.6 million to $0.7 million for the year ended December 31, 2008 compared to the year ended December 31, 2007, which was primarily a result of a lower interest rates and a lower average balance of cash between 2008 and 2007.
Equity in earnings (losses) of non-consolidated REITs
Equity in earnings (losses) of non-consolidated REITs increased approximately $3.2 million to $2.7 million for the year ended December 31, 2008 compared to losses of $0.5 million for the year ended December 31, 2007, which was principally a result of income attributed to us from our investment in East Wacker.
Taxes on income
Taxes on income decreased $1.4 million for the year ended December 31, 2008 compared to the year ended December 31, 2007. The decrease was primarily due to lower taxable income from the investment banking and investment services business in the 2008 period compared to 2007, which was principally a result of the decrease in gross syndication proceeds from 2008 compared to 2007.
Income from continuing operations
The resulting income from continuing operations for the year ended December 31, 2008 compared to the year ended December 31, 2007 decreased $4.1 million to $32.0 million for the reasons discussed above.
Discontinued operations and gain on sale of assets
During 2008, we did not sell any properties. During 2007, we sold five properties which are reported as discontinued operations on our financial statements for the year ended December 31, 2007. Income from discontinued operations was $1.2 million for the year ended December 31, 2007.
During the year ended December 31, 2007, we reported $23.8 million as gain on sale of assets, which is summarized in the table below:
| (in thousands) | | | | | Net | | | | |
| | City/ | Property | Date of | | Sales | | | | |
| Property Address | State | Type | Sale | | Proceeds | | | Gain | |
| | | | | | | | | | |
| 33 & 37 Villa Road | Greenville, SC | Office | January 31, 2007 | | $ | 5,830 | | | $ | - | |
| 11680 Great Oaks Way | Alpharetta, GA | Office | June 21, 2007 | | | 32,535 | | | | 6,601 | |
| 17030 Goldentop Road | San Diego, CA | Office | June 27, 2007 | | | 36,199 | | | | 14,741 | |
| 10 Lyberty Way | Westford, MA | Office | July 16, 2007 | | | 10,861 | | | | 1,942 | |
| 11211 Taylor Draper Lane | Austin, TX | Office | December 20, 2007 | | | 10,429 | | | | 257 | |
| Settlement of escrows on | | | | | | | | | | | |
| prior property sales | | | | | | 248 | | | | 248 | |
| Net Sales Proceeds and Gain | | | | | | | | | | | |
| on sales of real estate | | | | | $ | 96,102 | | | $ | 23,789 | |
Net Income
The resulting net income for the year ended December 31, 2008 was $32.0 million compared to net income of $61.1 million for the year ended December 31, 2007.
Liquidity and Capital Resources
Cash and cash equivalents were $27.4 million and $29.2 million at December 31, 2009 and 2008, respectively. This decrease of $1.8 million is attributable to $69.4 million provided by operating activities less $172.1 million used by investing activities plus $100.9 million provided by financing activities. Management believes that existing cash, cash anticipated to be generated internally by operations, cash anticipated to be generated by the sale of preferred stock in future Sponsored REITs and our existing debt financing will be sufficient to meet working capital requirements and anticipated capital expenditures for at least the next 12 months. Although there is no guarantee that we will be able to obtain the funds necessary for our future growth, we anticipate generating funds from continuing real estate operations and from fees and commissions from the sale of shares in newly formed Sponsored REITs. We believe that we have adequate funds to cover unusual expenses and capital improvements, in addition to normal operating expenses. Our ability to maintain or increase our level of dividends to stockholders, however, depends in significant part upon the level of rental income from our real properties and the level of interest on the part of investors in purchasing shares of Sponsored REITs.
Operating Activities
The cash provided by our operating activities of $69.4 million is primarily attributable to net income of $27.9 million, excluding the recognized gain on the land taking of $0.4 million, plus the add-back of $36.1 million of non-cash activities, $5.6 million of distributions from non-consolidated REITs, an increase in accounts payable and accrued liabilities of approximately $2.5 million and an increase in prepaid and other assets of $0.9 million. These increases were partially offset by increases in tenant rent receivables of $0.5 million and payment of leasing commissions of $2.7 million.
Investing Activities
Our cash used for investing activities for the year ended December 31, 2009 of $172.1 million is primarily attributable to additions to real estate investments and office equipment of approximately $132.3 million and secured loans made to Sponsored REITs of approximately $35.4 million and an investment in preferred shares of a Sponsored REIT of $13.2 million, which were partially offset by a decrease in assets held for syndication of $8.1 million and proceeds from the sale of land of $0.7 million.
Financing Activities
Our cash provided by financing activities for the year ended December 31, 2009 of $100.9 million is primarily attributable to net proceeds from an equity offering of $114.7 million, net borrowings under our Revolver of $41.5 million and was partially offset by distributions paid to shareholders of $55.3 million.
Revolver
The Revolver is with a group of banks for borrowings at our election of up to $250 million and matures on August 11, 2011. Borrowings under the Revolver bear interest at either the bank's prime rate (3.25% at December 31, 2009) or a rate equal to LIBOR plus 100 basis points (1.23% at December 31, 2009). There were borrowings of $109,008,000 and $67,468,000 at the LIBOR plus 100 basis point rate at a weighted average rate of 1.23 and 2.39% outstanding under the Revolver at December 31, 2009 and 2008, respectively. The weighted average interest rate on amounts outstanding during 2009 and 2008 was approximately 1.34% and 3.61%, respectively. As of December 31, 2009, we were in compliance with all bank covenants under the Revolver.
We have drawn on the Revolver, and intend to draw on the Revolver in the future for a variety of corporate purposes, including the acquisition of properties that we acquire directly for our portfolio and the funding of loans to Sponsored REITs. We typically draw down on the Revolver to make an acquisition loan to each Sponsored REIT which is secured by a mortgage on the borrower’s real estate. These loans typically are repaid out of the proceeds of the borrower’s equity offering. We refer to these loans as Acquisition Loans. From time-to-time we may also make secured loans to Sponsored REITs to fund construction costs, capital expenditures, leasing costs and other purposes. We anticipate that these loans will be repaid at their maturity or earlier from long-term financings of the underlying properties, cash flows from the underlying properties or some other capital event. We refer to these loans as Sponsored REIT Loans.
Term Loan
On October 15, 2008, we closed on a $75,000,000 unsecured term loan facility with three banks. Proceeds from the Term Loan were used to reduce the outstanding principal balance on the Revolver. The Term Loan has an initial three-year term that matures on October 15, 2011. In addition, we have the right to extend the initial maturity date for up to two successive one-year periods, or until October 15, 2013 if both extensions are exercised. We fixed the interest rate for the initial three-year term of the Term Loan at 5.84% per annum pursuant to an interest rate swap agreement. As of December 31, 2009, we were in compliance with all bank covenants under the Term Loan.
Equity Securities
On September 23, 2009, we completed an underwritten public offering of 9.2 million shares of our common stock (including 1.2 million shares issued as a result of the full exercise of an overallotment option by the underwriter) at a price to the public of $13.00 per share. The proceeds from this public offering, net of underwriter discounts and offering costs, totaled approximately $114.7 million. We used approximately $74.6 million of the net proceeds of the offering to repay outstanding borrowings under our Revolver, including an aggregate of approximately $51.6 million drawn down in June 2009 for the acquisition of properties in Eden Prairie, Minnesota and Chantilly, Virginia. We used the remainder of the net proceeds to fund a portion of the purchase price of a property in Falls Church, Virginia in September 2009.
As of December 31, 2009, we have an automatic shelf registration statement on Form S-3 on file with the SEC relating to the offer and sale, from time to time, of an indeterminate amount of our common stock. From time to time, we expect to issue additional shares of our common stock under our automatic shelf registration statement or a different registration statement to fund the acquisition of additional properties, to pay down any existing debt financing and for other corporate purposes.
Contingencies
From time to time, we may provide financing to Sponsored REITs in the form of a construction loan and/or a revolving line of credit secured by a mortgage. As of December 31, 2009, we were committed to fund up to $85.8 million to six Sponsored REITs under such arrangements for the purpose of funding construction costs, capital expenditures, leasing costs or for other purposes, of which $36.5 million has been drawn and is outstanding. We anticipate that advances made under these facilities will be repaid at their maturity date or earlier from long-term financings of the underlying properties, cash flows from the underlying properties or another other capital event.
We may be subject to various legal proceedings and claims that arise in the ordinary course of our business. Although occasional adverse decisions (or settlements) may occur, we believe that the final disposition of such matters will not have a material adverse effect on our financial position or results of operations.
Assets Held for Syndication
As of December 31, 2009, we had one asset held for syndication for a property in West Chester, Ohio. As of December 31, 2008 and 2007, we had one asset held for syndication for a property in Kansas City, Missouri, which was completed on May 29, 2009.
Assets Held for Sale
As of December 31, 2009, 2008 and 2007, there were no assets held for sale.
Related Party Transactions
On May 15, 2008, we acquired Park Ten Development by merger for a total purchase price of approximately $35.4 million. The acquisition was effected by merging a wholly owned acquisition subsidiary of the Company with and into Park Ten Development. The holders of preferred stock in Park Ten Development received cash consideration of approximately $127,290 per share.
In November 2009, we commenced the syndication of FSP Centre Pointe V Corp., which is still in process as of December 31, 2009. In September 2009, we commenced the syndication of FSP Lakeside Crossing II Corp., which was completed December 15, 2009. In May 2008, we commenced the syndication of FSP 385 Interlocken Development Corp., which is still in process as of December 31, 2009. During 2007, we commenced the syndication of FSP Grand Boulevard Corp., which was completed May 29, 2009. As part of this syndication, we purchased the final 175.5 shares of its preferred stock for approximately $15 million on May 29, 2009, representing an approximately 27% interest.
We have drawn on the Revolver, and intend to draw on the Revolver in the future for a variety of corporate purposes, including the acquisition of properties that we acquire directly for our portfolio and for loans to Sponsored REITs, including the Acquisition Loans and the Sponsored REIT Loans described below. Additional Information about our Acquisition Loans and our Sponsored REIT Loans outstanding as of December 31, 2009, including a summary table of the Sponsored REIT Loans, is incorporated herein by reference to Note 4, “Related Party Transactions – Management fees and interest income from loans”, in the Notes to Consolidated Financial Statements.
Loans to Sponsored REITs
Acquisition Loans
We typically make an acquisition loan to each Sponsored REIT which is secured by a mortgage on the borrower’s real estate. These loans enable Sponsored REITs to acquire their respective properties prior to the consummation of the offerings of their equity interests. We refer to these loans as Acquisition Loans. We anticipate that each Acquisition Loan will be repaid at maturity or earlier from the proceeds of the Sponsored REIT’s equity offering. Each Acquisition Loan has a term of two years and bears interest at the same rate paid by FSP Corp. for borrowings under the Revolver. We had one Acquisition Loan outstanding for the syndication of FSP Centre Pointe V Corp., and one Acquisition Loan outstanding for the syndication of FSP Grand Boulevard Corp. as of December 31, 2009 and 2008, respectively. The Acquisition Loan for FSP Grand Boulevard Corp. was repaid on May 29, 2009. Acquisition Loans are classified as assets held for syndication.
Sponsored REIT Loans
From time-to-time we may also make secured loans to Sponsored REITs to fund construction costs, capital expenditures, leasing costs and other purposes. We refer to these loans as Sponsored REIT Loans. Since December 2007, we have provided Sponsored REIT Loans in the form of revolving lines of credit to five Sponsored REITs, or to wholly-owned subsidiaries of those Sponsored REITs, and a construction loan to one wholly-owned subsidiary of another Sponsored REIT. We anticipate that each Sponsored REIT Loan will be repaid at maturity or earlier from long term financing of the property securing the loan, cash flows from that underlying property or some other capital event. Each Sponsored REIT Loan is secured by a mortgage on the underlying property and has a term of approximately two to three years. Advances under each Sponsored REIT Loan bear interest at a rate equal to the 30-day LIBOR rate plus an agreed upon number of basis points and most advances also require a 50 basis point draw fee. We received a $210,000 loan commitment fee at the time of the closing of the Sponsored REIT Loan that is structured as a construction loan. As of December 31, 2009, we were committed to fund Sponsored REIT Loans up to $85.8 million to six Sponsored REITs, of which $36.5 million was drawn and outstanding.
Additional Information about our Acquisition Loans and our Sponsored REIT Loans outstanding as of December 31, 2009, including a summary table of our Sponsored REIT Loans, is incorporated herein by reference to Note 4, “Related Party Transactions – Management fees and interest income from loans”, in the Notes to Consolidated Financial Statements.
Other Considerations
We generally pay the ordinary annual operating expenses of our properties from the rental revenue generated by the properties. For the years ended December 31, 2009 and 2008, the rental income exceeded the expenses for each individual property, with the exception of our property located at Federal Way, Washington and our property located at Southfield, Michigan.
Our property located in Federal Way, Washington had a single tenant lease, which expired September 14, 2006. During 2007 and 2008, we signed leases with three tenants and in 2009 with an additional two for an aggregate total of approximately 26% of the space, which generated rental income of $334,000 and $335,000 for the years ended December 31, 2009 and 2008, respectively, and had operating expenses of $556,000 and $592,000 for the years ended December 31, 2009 and 2008, respectively.
Our property located in Southfield, Michigan with approximately 215,000 square feet of rentable space, had rental revenue that covered ordinary annual operating expenses for the year ended December 31, 2009. However, the property had a lease with a tenant for approximately 138,000 square feet of space that expired on July 31, 2009. The tenant re-leased approximately 83,000 square feet and vacated approximately 55,000 square feet. On September 15, 2009, a lease with a different tenant at the property expired and approximately 17,000 square feet of space was vacated. As a result, for the three months ended September 30, 2009, the leases in place generated rental income of $526,000 and operating expenses of $630,000 and for the three months ended December 31, 2009, the leases in place generated rental income of $347,000 and operating expenses of $450,000.
Rental Income Commitments
Our commercial real estate operations include the leasing of office buildings and industrial properties subject to leases with terms greater than one year. The leases thereon expire at various dates through 2022. Approximate future minimum rental income from non-cancelable operating leases as of December 31, 2009 is:
| (in thousands) | Year ended
December 31, | |
| | | |
| 2010 | $ | 86,942 | |
| 2011 | | 75,641 | |
| 2012 | | 65,286 | |
| 2013 | | 59,248 | |
| 2014 | | 54,501 | |
| Thereafter (2015-2022) | | 115,243 | |
| | $ | 456,861 | |
Contractual Obligations
The following table sets forth our contractual obligations as of December 31, 2009.
| | Payment due by period |
| Contractual | (in thousands) |
| Obligations | Total | 2010 | 2011 | 2012 | 2013 | 2014 | 2015 |
| Revolver | $ 109,008 | $ - | $ 109,008 | $ - | $ - | $ - | $ - |
| Term Loan | 75,000 | 150 | 74,850 | - | - | - | - |
| Operating Leases | 196 | 196 | - | - | - | - | - |
| Total | $ 184,204 | $ 346 | $ 183,858 | $ - | $ - | $ - | $ - |
The operating leases in the table above consist of our lease of corporate office space, which was amended in 2007, expires on July 31, 2010 and has one three-year renewal option. The lease includes a base annual rent and additional rent for our share of taxes and operating costs.
In addition to the amounts in the table above, from time to time, we may provide Acquisition Loans and Sponsored REIT Loans to our Sponsored REITs. As of December 31, 2009, we had one Acquisition Loan outstanding, which is classified as an asset held for syndication and were committed to fund Sponsored REIT Loans up to $85.8 million to six Sponsored REITs, of which $36.5 million was drawn and outstanding. Additional Information about our Acquisition Loans and our Sponsored REIT Loans outstanding as of December 31, 2009, including a summary table or our Sponsored REIT Loans, is incorporated herein by reference to Note 4, “Related Party Transactions – Management fees and interest income from loans”, in the Notes to Consolidated Financial Statements.
Off-Balance Sheet Arrangements
Investments in Sponsored REITs
As part of our business model we organize single-purpose entities that own real estate, purchases of which are financed through the private placement of equity in those entities, typically through syndication. We call these entities Sponsored REITs, and they are operated in a manner intended to qualify as real estate investment trusts. We earn fees related to the sale of preferred stock in the Sponsored REITs in these syndications. The Sponsored REITs issue both common stock and preferred stock. The common stock is owned by FSP Corp. Generally the preferred stock is owned by unaffiliated investors, however, we acquired an interest in preferred shares of five Sponsored REITs. In addition, directors and officers of FSP Corp., have from time to time invested in Sponsored REITs and may do so again in the future. Following consummation of the offerings, the preferred stockholders in each of the Sponsored REITs are entitled to 100% of the Sponsored REIT’s cash distributions. Subsequent to the completion of the offering of preferred shares, except for the preferred stock we own, we do not share in any of the Sponsored REIT’s earnings, or any related dividend, and the common stock ownership interests have virtually no economic benefit or risk. Prior to the completion of the offering of preferred shares, we share in a Sponsored REIT’s earnings (and related dividends) to the extent of our ownership interest in the Sponsored REIT.
As a common stockholder, upon completion of the syndication, we have no rights to the Sponsored REIT’s earnings or any related cash distributions. However, upon liquidation of a Sponsored REIT, we are entitled to our percentage interest as a common stockholder in any proceeds remaining after the preferred stockholders have recovered their investment. Our common stock percentage interest in each Sponsored REIT is less than 1%. The affirmative vote of the holders of a majority of the Sponsored REIT’s preferred stockholders is required for any actions involving merger, sale of property, amendment to charter or issuance of additional capital stock. In addition, all of the Sponsored REITs allow the holders of more than 50% of the outstanding preferred shares to remove (without cause) and replace one or more members of that Sponsored REIT’s board of directors.
Common stock investments in Sponsored REITs are consolidated while the entity is controlled by us. Following the commencement of syndication we exercise influence over, but do not control these entities and investments are accounted for using the equity method. Under the equity method of accounting, the cost basis is increased by its share of the Sponsored REITs' earnings, if any, prior to completion of the syndication. Equity in losses of Sponsored REITs is not recognized to the extent that the investment balance would become negative and distributions received are recognized as income once the investment balance is reduced to zero, unless there are assets held for syndication from the Sponsored REIT entity. Equity in losses or distributions received in excess of investment is recorded as an adjustment to the carrying value of the asset held for syndication.
We have acquired a preferred stock interest in five Sponsored REITs, including one we acquired on May 15, 2008 by cash merger and another we acquired on April 30, 2006 by merger. As a result of our common stock interest and our preferred stock interest in the remaining three Sponsored REITs, we exercise influence over, but do not control these entities. These preferred share investments are accounted for using the equity method. Under the equity method of accounting our cost basis is adjusted by our share of the Sponsored REITs' operations and distributions received. We also agreed to vote our preferred shares in any matter presented to a vote by the stockholders of these Sponsored REITs in the same proportion as shares voted by other stockholders of the Sponsored REITs.
At December 31, 2009, we held a common stock interest in 14 Sponsored REITs, 12 of which were fully syndicated and in which we no longer share economic benefit or risk. The two that were not fully syndicated at December 31, 2009 include one that commenced in May 2008, and another that commenced in November 2009. The value of the entities that were not fully syndicated was approximately $4.8 million and was shown on the consolidated balance sheets as assets held for syndication. At December 31, 2008, we held a common stock interest in 12 Sponsored REITs, 10 of which were fully syndicated and from which we no longer share economic benefit or risk. The two that were not fully syndicated at December 31, 2008 include one that commenced in September 2007, and another that commenced in May 2008. The value of the entities that were not fully syndicated was approximately $13.3 million and was shown on the consolidated balance sheets as assets held for syndication.
The table below shows our income and expenses from Sponsored REITs. Management fees of $2,000 and $20,000 for the years ended December 31, 2009 and 2007, respectively, and interest expense related to the Company’s mortgage on properties is eliminated in consolidation. There was no income or expenses from Sponsored REITs that were consolidated during the year ended December 31, 2008.
| | Year Ended December 31, | |
| (in thousands) | | 2009 | | | 2007 | |
| Operating Data: | | | | | | |
| Rental revenues | | $ | 74 | | | $ | 3,510 | |
| Operating and maintenance expenses | | | 50 | | | | 1,834 | |
| Depreciation and amortization | | | 6 | | | | 855 | |
| Interest expense: permanent mortgage loan | | | - | | | | 179 | |
| Interest expense: acquisition loan | | | 6 | | | | 1,448 | |
| Interest income | | | - | | | | 51 | |
| | | $ | 12 | | | $ | (755 | ) |
During the year ended December 31, 2009, we recorded equity in income from three Sponsored REITs following commencement of the syndication of $153,000 and during the year ended December 31, 2009, we recorded equity in losses from two Sponsored REITs following the commencement of syndication of $211,000 and during the year ended December 31, 2007 we recorded equity in losses from two Sponsored REITs following the commencement of syndication of $627,000.
From time to time, we may provide Acquisition Loans and Sponsored REIT Loans to our Sponsored REITs. As of December 31, 2009, we had one Acquisition Loan outstanding, which is classified as an asset held for syndication and were committed to fund Sponsored REIT Loans up to $85.8 million to six Sponsored REITs, of which $36.5 million was drawn and outstanding. Additional Information about our Acquisition Loans and our Sponsored REIT Loans outstanding as of December 31, 2009, including a summary table of our Sponsored REIT Loans, is incorporated herein by reference to Note 4, “Related Party Transactions – Management fees and interest income from loans”, in the Notes to Consolidated Financial Statements.
| Item 7A. | Quantitative and Qualitative Disclosures About Market Risk. |
Market Rate Risk
We are exposed to changes in interest rates primarily from our floating rate borrowing arrangements. We use interest rate derivative instruments to manage exposure to interest rate changes. As of December 31, 2009 and 2008, if market rates on borrowings under our Revolver increased by 10% at maturity, or approximately 12 and 24 basis points, respectively, over the current variable rate, the increase in interest expense would decrease future earnings and cash flows by $0.1 million and $0.2 million annually. The interest rate on our Revolver as of December 31, 2009 was LIBOR plus 100 basis points. We do not believe that the interest rate risk represented by borrowings under our Revolver is material as of December 31, 2009.
Our Term Loan of $75 million bears interest at a variable rate of LIBOR plus 200 basis points, with a 2% floor on LIBOR, which was fixed at 5.84% per annum for its initial three year term with an interest rate swap agreement, and therefore, the fair value of this instrument is affected by changes in market interest rates. We believe that we have mitigated interest rate risk with respect to the Term Loan through the interest rate swap agreement for the initial three year term of the loan. This interest rate swap agreement was our only derivative instrument as of December 31, 2009 and 2008.
The Term Loan has an initial three year term that matures on October 15, 2011. In addition, we have the right to extend the initial maturity date for up to two successive one-year periods, or until October 15, 2013 if both extensions are exercised. Upon maturity, our future income, cash flows and fair values relevant to financial instruments will be dependent upon the balance then outstanding and prevalent market interest rates.
The table below lists our derivative instrument, which is hedging variable cash flows related to interest on our Term Loan as of December 31, 2009 (in thousands):
| (in 000’s) | Asset Hedged | | Benchmark Rate | | Notional Value | | | Strike Rate | | | Effective Date | | | Expiration Date | | | Fair Value | |
| Interest Rate Swap | Term Loan | | LIBOR | | $ | 75,000 | | | | 5.840 % | | | | 10/2008 | | | | 10/2011 | | | $ | (2,076 | ) |
The Revolver matures in August 2011 and has a variable rate of interest. Upon maturity, our future income, cash flows and fair values relevant to financial instruments will be dependent upon the balance then outstanding and prevalent market interest rates.
We borrow from time-to-time under the Revolver. These borrowings bear interest at the bank’s base rate (3.25% at December 31, 2009) or a 30 day LIBOR plus 100 basis points (1.23% at December 31, 2009), as elected by us when requesting funds. Generally the borrowings are for 30 day LIBOR plus 100 Basis points. There were borrowings totaling $109,008,000 and $67,468,000 in the aggregate at the 30 day LIBOR plus 100 basis point rate, representing a weighted average rate of 1.23% and 2.39% outstanding under the Revolver at December 31, 2009 and 2008, respectively. We have drawn on the Revolver, and intend to draw on the Revolver in the future for a variety of corporate purposes, including the funding of Acquisition Loans and Sponsored REIT Loans. As of December 31, 2009, we had one Acquisition Loan outstanding , which is classified as an asset held for syndication and were committed to fund Sponsored REIT Loans up to $85.8 million to six Sponsored REITs, of which $36.5 million was drawn and outstanding. Additional Information about our Acquisition Loans and our Sponsored REIT Loans outstanding as of December 31, 2009, including a summary table of our Sponsored REIT Loans, is incorporated herein by reference to Note 4, “Related Party Transactions – Management fees and interest income from loans”, in the Notes to Consolidated Financial Statements.
The following table presents as of December 31, 2009 our contractual variable rate borrowings under our Revolver, which matures on August 11, 2011, and under our Term Loan, which matures on October 15, 2011. Under the Term Loan we have the right to extend the initial maturity date for up to two successive one-year periods, or until October 15, 2013 if both extensions are exercised:
| | Payment due by period |
| | (in thousands) |
| | Total | 2010 | 2011 | 2012 | 2013 | 2014 | 2015 |
| Revolver | $ 109,008 | $ - | $ 109,008 | $ - | $ - | $ - | $ - |
| Term Loan | 75,000 | 150 | 74,850 | - | - | - | - |
| Total | $ 184,008 | $ 150 | $ 183,858 | $ - | $ - | $ - | $ - |
| Item 8. | Financial Statements and Supplementary Data |
The information required by this item is included in the financial pages following the Exhibit index herein and incorporated herein by reference. Reference is made to the Index to Consolidated Financial Statements in Item 15 of Part IV.
| Item 9. | Changes in and Disagreements With Accountants on Accounting and Financial Disclosure |
Not applicable.
| Item 9A. | Controls and Procedures |
Disclosure Controls and Procedures
Our management, with the participation of our chief executive officer and chief financial officer, evaluated the effectiveness of our disclosure controls and procedures as of December 31, 2009. The term “disclosure controls and procedures,” as defined in Rules 13a-15(e) and 15d-15(e) under the Securities Exchange Act of 1934, means controls and other procedures of a company that are designed to ensure that information required to be disclosed by a company in the reports that it files or submits under the Exchange Act is recorded, processed, summarized and reported, within the time periods specified in the SEC's rules and forms. Disclosure controls and procedures include, without limitation, controls and procedures designed to ensure that information required to be disclosed by a company in the reports that it files or submits under the Exchange Act is accumulated and communicated to the company’s management, including its principal executive and principal financial officers, as appropriate to allow timely decisions regarding required disclosure. Management recognizes that any controls and procedures, no matter how well designed and operated, can provide only reasonable assurance of achieving their objectives and management necessarily applies its judgment in evaluating the cost-benefit relationship of possible controls and procedures. Based on the evaluation of our disclosure controls and procedures as of December 31, 2009, our chief executive officer and chief financial officer concluded that, as of such date, our disclosure controls and procedures were effective at the reasonable assurance level.
Management’s Annual Report on Internal Control Over Financial Reporting
The management of the Company is responsible for establishing and maintaining adequate internal control over financial reporting. Internal control over financial reporting is defined in Rules 13a-15(f) or 15d-15(f) promulgated under the Securities Exchange Act of 1934 as a process designed by, or under the supervision of, the Company’s principal executive and principal financial officer and effected by the Company’s board of directors, management and other personnel, to provide reasonable assurance regarding the reliability of financial reporting and the preparation of financial statements for external purposes in accordance with generally accepted accounting principles and includes those policies and procedures that:
| · | Pertain to the maintenance of records that in reasonable detail accurately and fairly reflect the transactions and dispositions of the assets of the Company; |
| · | Provide reasonable assurance that transactions are recorded as necessary to permit preparation of financial statements in accordance with generally accepted accounting principles, and that receipts and expenditures of the Company are being made only in accordance with authorizations of management and directors of the Company; and |
| · | Provide reasonable assurance regarding prevention or timely detection of unauthorized acquisition, use or disposition of the Company’s assets that could have a material effect on the financial statements. |
Because of its inherent limitations, internal control over financial reporting may not prevent or detect misstatements. Projections of any evaluation of effectiveness to future periods are subject to the risk that controls may become inadequate because of changes in conditions, or that the degree of compliance with the policies or procedures may deteriorate.
The Company’s management assessed the effectiveness of the Company’s internal control over financial reporting as of December 31, 2009. In making this assessment, the Company’s management used the criteria set forth by the Committee of Sponsoring Organizations of the Treadway Commission (COSO) in Internal Control-Integrated Framework.
Based on our assessment, management concluded that, as of December 31, 2009, the Company’s internal control over financial reporting is effective based on those criteria.
Ernst & Young LLP, the independent registered public accounting firm that audited our financial statements included elsewhere in this annual report on Form 10-K, has issued an attestation report on our internal control over financial reporting as of December 31, 2009. Please see page F-3.
Changes in Internal Control Over Financial Reporting
No change in our internal control over financial reporting occurred during the quarter ended December 31, 2009 that has materially affected, or is reasonably likely to materially affect, our internal control over financial reporting.
| Item 9B. | Other Information |
None.
Certain information required by Part III of this Form 10-K will be contained in our definitive proxy statement pursuant to Regulation 14A (the “Proxy Statement”) which we plan to file not later than 120 days after the end of the fiscal year covered by this Annual Report on Form 10-K, and is incorporated herein by reference.
| Item 10. | Directors, Executive Officers and Corporate Governance |
The response to this item is contained under the caption “Directors and Executive Officers of FSP Corp.” in Part I hereof and in the Proxy Statement under the captions “CORPORATE GOVERNANCE PRINCIPLES AND BOARD MATTERS,” “PROPOSAL 1: ELECTION OF DIRECTORS” and “SECTION 16(A) BENEFICIAL OWNERSHIP REPORTING COMPLIANCE” and is incorporated herein by reference.
Our board of directors has adopted a code of business conduct and ethics that applies to all of our executive officers, directors and employees. The code was approved by the audit committee of our board of directors and by the full board of directors. We have posted a current copy of our code under “Corporate Governance” in the “Investor Relations” section of our website at http://www.franklinstreetproperties.com. To the extent permitted by applicable rules of the NYSE Amex, we intend to satisfy the disclosure requirements under Item 5.05 of Form 8-K regarding an amendment to, or waiver from, a provision of the code of business conduct and ethics with respect to our principal executive officer, principal financial officer, principal accounting officer or controller, or persons performing similar functions, by posting such information on our website.
| Item 11. | Executive Compensation |
The response to this item is contained in the Proxy Statement under the captions “EXECUTIVE COMPENSATION” and “COMPENSATION OF DIRECTORS” and is incorporated herein by reference.
The “Compensation Committee Report” contained in the Proxy Statement under the caption “EXECUTIVE COMPENSATION” shall not be deemed “soliciting material” or “filed” with the SEC or otherwise subject to the liabilities of Section 18 of the Securities Exchange Act of 1934, nor shall it be deemed incorporated by reference in any filing under the Securities Act of 1933 or the Exchange Act, except to the extent we specifically request that such information be treated as soliciting material or specifically incorporate such information by reference into a document filed under the Securities Act or the Exchange Act.
| Item 12. | Security Ownership of Certain Beneficial Owners and Management and Related Stockholder Matters |
The response to this item is contained in the Proxy Statement under the captions “BENEFICIAL OWNERSHIP OF VOTING STOCK” and “SECURITIES AUTHORIZED FOR ISSUANCE UNDER EQUITY COMPENSATION PLANS” and is incorporated herein by reference.
| Item 13. | Certain Relationships and Related Transactions, and Director Independence |
The response to this item is contained in the Proxy Statement under the captions “PROPOSAL 1: ELECTION OF DIRECTORS” and “TRANSACTIONS WITH RELATED PERSONS” and is incorporated herein by reference.
| Item 15. | Principal Accounting Fees and Services |
The response to this item is contained in the Proxy Statement under the caption “PROPOSAL 2: RATIFICATION OF APPOINTMENT OF INDEPENDENT REGISTERED PUBLIC ACCOUNTING FIRM” and is incorporated herein by reference.
PART IV
| Item 15. | Exhibits, Financial Statement Schedules. |
| | (a) | The following documents are filed as part of this report: |
The Financial Statements listed in the accompanying Index to Consolidated Financial Statements are filed as part of this Annual Report on Form 10-K.
| | 2. | Financial Statement Schedules: |
The Financial Statement Schedules listed on the accompanying Index to Consolidated Financial Statements are filed as part of this Annual Report on Form 10-K.
The Exhibits listed in the Exhibit Index are filed as part of this Annual Report on Form 10-K.
SIGNATURES
Pursuant to the requirements of Section 13 or 15(d) of the Securities Exchange Act of 1934, the registrant has duly caused this report to be signed on its behalf as of February 23, 2010 by the undersigned, thereunto duly authorized.
| | FRANKLIN STREET PROPERTIES CORP. |
| | | |
| | By: | /s/ George J. Carter |
| | | George J. Carter |
| | | President and Chief Executive Officer |
Pursuant to the requirements of the Securities Exchange Act of 1934, this report has been signed by the following persons on behalf of the registrant and in the capacities and on the dates indicated.
| Signature | Title | | Date |
| | | | |
/s/ George J. Carter George J. Carter | President, Chief Executive Officer and Director (Principal Executive Officer) | | February 23, 2010 |
| | | | |
/s/ Barbara J. Fournier Barbara J. Fournier | Executive Vice President, Chief Operating Officer, Treasurer, Secretary and Director | | February 23, 2010 |
| | | | |
/s/ John G. Demeritt John G. Demeritt | Executive Vice President and Chief Financial Officer (Principal Financial Officer and Principal Accounting Officer) | | February 23, 2010 |
| | | | |
/s/ Janet P. Notopoulos Janet P. Notopoulos | Director, Executive Vice President | | February 23, 2010 |
| | | | |
/s/ Barry Silverstein Barry Silverstein | Director | | February 23, 2010 |
| | | | |
/s/ Dennis J. McGillicuddy Dennis J. McGillicuddy | Director | | February 23, 2010 |
| | | | |
/s/ John Burke John Burke | Director | | February 23, 2010 |
| | | | |
/s/ Georgia Murray Georgia Murray | Director | | February 23, 2010 |
| | | | |
EXHIBIT INDEX
| Exhibit No. | Description |
| | |
| | |
| 2.2 (1)** | Agreement and Plan of Merger by and among FSP Corp., Park Ten Phase II Acquisition Corp. and FSP Park Ten Development Corp. dated as of March 19, 2008. |
| | |
| 3.1 (2) | Articles of Incorporation. |
| | |
| 3.2 (3) | Amended and Restated By-laws. |
| | |
10.1+ (4) | 2002 Stock Incentive Plan of FSP Corp. |
| | |
| 10.2 (5) | Third Amended and Restated Loan Agreement dated as of October 19, 2007 by and among the Company, certain wholly-owned subsidiaries of the Company, RBS Citizens, National Association, Bank of America, N.A., Wachovia Bank, National Association and Chevy Chase Bank, F.S.B. |
| | |
| 10.3 (6) | First Amendment to Third Amended and Restated Loan Agreement dated as of October 15, 2008 by and among the Company, certain wholly-owned subsidiaries of the Company, RBS Citizens, National Association, Bank of America, N.A., Wachovia Bank, National Association and Chevy Chase Bank, F.S.B. |
| | |
| 10.4 (6) | Term Loan Agreement dated as of October 15, 2008 by and among the Company, certain of its wholly-owned subsidiaries, RBS Citizens, National Association and Wachovia Bank, National Association. |
| | |
| 10.5 (6) | ISDA Master Agreement dated as of October 15, 2008, by and between the Company and RBS Citizens, National Association, together with the schedule relating thereto. |
| | |
| 10.6+ (7) | Form of Retention Agreement. |
| | |
| 10.7+ (8) | Change in Control Discretionary Plan. |
| | |
| 10.8 (9) | Underwriting Agreement dated September 17, 2009 by and between the Company and Robert W. Baird & Co. Incorporated. |
| | |
| 14.1 (10) | Code of Business Conduct and Ethics. |
| | |
| 21.1* | Subsidiaries of the Registrant. |
| | |
| 23.1* | Consent of Ernst & Young LLP. |
| | |
| 31.1* | Certification of FSP Corp.’s President and Chief Executive Officer pursuant to Section 302 of the Sarbanes-Oxley Act of 2002. |
| | |
| 31.2* | Certification of FSP Corp.’s Chief Financial Officer pursuant to Section 302 of the Sarbanes-Oxley Act of 2002. |
| | |
EXHIBIT INDEX, continued
| 32.1* | Certification of FSP Corp.’s President and Chief Executive Officer pursuant to 18 U.S.C. Section 1350, as adopted pursuant to Section 906 of the Sarbanes-Oxley Act of 2002. |
| | |
| 32.2* | Certification of FSP Corp.’s Chief Financial Officer pursuant to 18 U.S.C. Section 1350, as adopted pursuant to Section 906 of the Sarbanes-Oxley Act of 2002. |
| | |
________________
| | |
| (1) | Incorporated by reference to FSP Corp.’s Current Report on Form 8-K, filed on March 21, 2008 (File No. 001-32470). |
| | |
| (2) | Incorporated by reference to FSP Corp.’s Form 8-A, filed April 5, 2005 (File No. 001-32470). |
| | |
| (3) | Incorporated by reference to FSP Corp.’s Current Report on Form 8-K, filed on May 15, 2006 (File No. 001-32470). |
| | |
| (4) | Incorporated by reference to FSP Corp.’s Annual Report on Form 10-K, filed on March 29, 2002 (File No. 0-32615). |
| | |
| (5) | Incorporated by reference to FSP Corp.’s Current Report on Form 8-K, filed on October 22, 2007 (File No. 001-32470). |
| | |
| (6) | Incorporated by reference to FSP Corp.’s Current Report on Form 8-K, filed on October 15, 2008 (File No. 001-32470). |
| | |
| (7) | Incorporated by reference to FSP Corp.’s Annual Report on Form 10-K, filed on February 24, 2006 (File No. 001-32470). |
| | |
| (8) | Incorporated by reference to FSP Corp.’s Current Report on Form 8-K, filed on February 8, 2006 (File No. 001-32470). |
| | |
| (9) | Incorporated by reference to FSP Corp.’s Current Report on Form 8-K, filed on September 23, 2009 (File No. 001-32470). |
| | |
| (10) | Incorporated by reference to FSP Corp.’s Current Report on Form 8-K, filed on August 3, 2004 (File No. 0-32615). |
| | |
| + | Management contract or compensatory plan or arrangement filed as an Exhibit to this Form 10-K pursuant to Item 15(b) of Form 10-K. |
| | |
| * | Filed herewith. |
| | |
| ** | FSP Corp. agrees to furnish supplementally a copy of any omitted schedules to this agreement to the Securities and Exchange Commission upon its request. |
Franklin Street Properties Corp.
Index to Consolidated Financial Statements
| Reports of Independent Registered Public Accounting Firm | F-2 |
| | |
| Consolidated Financial Statements: | |
| | |
Consolidated Balance Sheets as of December 31, 2009 and 2008 | F-4 |
| | |
Consolidated Statements of Income for each of the three years in the period ended December 31, 2009 | F-6 |
| | |
Consolidated Statements of Stockholders’ Equity for each of the three years in the period ended December 31, 2009 | F-7 |
| | |
Consolidated Statements of Cash Flows for each of the three years in the period ended December 31, 2009 | F-8 |
| | |
| Notes to the Consolidated Financial Statements | F-10 |
| | |
| Financial Statement Schedules – Schedule II and III | F-31 |
All other schedules for which a provision is made in the applicable accounting resolutions of the Securities and Exchange Commission are not required under the related instructions or are inapplicable, and therefore have been omitted.
Report of Independent Registered Public Accounting Firm
To the Board of Directors and
Stockholders of Franklin Street Properties Corp.:
We have audited the accompanying consolidated balance sheets of Franklin Street Properties Corp. as of December 31, 2009 and 2008, and the related consolidated statements of income, stockholders’ equity, and cash flows for each of the three years in the period ended December 31, 2009. Our audits also included the financial statement schedules listed in the Index at Item 15(a)(2). These financial statements and schedules are the responsibility of the Company's management. Our responsibility is to express an opinion on these financial statements and schedules based on our audits.
We conducted our audits in accordance with the standards of the Public Company Accounting Oversight Board (United States). Those standards require that we plan and perform the audit to obtain reasonable assurance about whether the financial statements are free of material misstatement. An audit includes examining, on a test basis, evidence supporting the amounts and disclosures in the financial statements. An audit also includes assessing the accounting principles used and significant estimates made by management, as well as evaluating the overall financial statement presentation. We believe that our audits provide a reasonable basis for our opinion.
In our opinion, the financial statements referred to above present fairly, in all material respects, the consolidated financial position of Franklin Street Properties Corp. at December 31, 2009 and 2008, and the consolidated results of its operations and its cash flows for each of the three years in the period ended December 31, 2009, in conformity with U.S. generally accepted accounting principles. Also, in our opinion, the related financial statement schedules, when considered in relation to the basic financial statements taken as a whole, present fairly in all material respects the information set forth therein.
We also have audited, in accordance with the standards of the Public Company Accounting Oversight Board (United States), Franklin Street Properties Corp.’s internal control over financial reporting as of December 31, 2009, based on criteria established in Internal Control – Integrated Framework issued by the Committee of Sponsoring Organizations of the Treadway Commission and our report dated February 23, 2010 expressed an unqualified opinion thereon.
� 0; /s/ Ernst & Young LLP
Boston, Massachusetts
February 23, 2010
Report of Independent Registered Public Accounting Firm
To the Board of Directors and
Stockholders of Franklin Street Properties Corp.:
We have audited Franklin Street Properties Corp.’s internal control over financial reporting as of December 31, 2009, based on criteria established in Internal Control—Integrated Framework issued by the Committee of Sponsoring Organizations of the Treadway Commission (the COSO criteria). Franklin Street Properties Corp.’s management is responsible for maintaining effective internal control over financial reporting, and for its assessment of the effectiveness of internal control over financial reporting included in Item 9A of Franklin Street Properties Corp.’s Annual Report on Form 10-K under the heading Management’s Annual Report on Internal Control Over Financial Reporting. Our responsibility is to express an opinion on the company’s internal control over financial reporting based on our audit.
We conducted our audit in accordance with the standards of the Public Company Accounting Oversight Board (United States). Those standards require that we plan and perform the audit to obtain reasonable assurance about whether effective internal control over financial reporting was maintained in all material respects. Our audit included obtaining an understanding of internal control over financial reporting, assessing the risk that a material weakness exists, testing and evaluating the design and operating effectiveness of internal control based on the assessed risk, and performing such other procedures as we considered necessary in the circumstances. We believe that our audit provides a reasonable basis for our opinion.
A company’s internal control over financial reporting is a process designed to provide reasonable assurance regarding the reliability of financial reporting and the preparation of financial statements for external purposes in accordance with generally accepted accounting principles. A company’s internal control over financial reporting includes those policies and procedures that (1) pertain to the maintenance of records that, in reasonable detail, accurately and fairly reflect the transactions and dispositions of the assets of the company; (2) provide reasonable assurance that transactions are recorded as necessary to permit preparation of financial statements in accordance with generally accepted accounting principles, and that receipts and expenditures of the company are being made only in accordance with authorizations of management and directors of the company; and (3) provide reasonable assurance regarding prevention or timely detection of unauthorized acquisition, use, or disposition of the company’s assets that could have a material effect on the financial statements.
Because of its inherent limitations, internal control over financial reporting may not prevent or detect misstatements. Also, projections of any evaluation of effectiveness to future periods are subject to the risk that controls may become inadequate because of changes in conditions, or that the degree of compliance with the policies or procedures may deteriorate.
In our opinion, Franklin Street Properties Corp. maintained, in all material respects, effective internal control over financial reporting as of December 31, 2009, based on the COSO criteria.
We also have audited, in accordance with the standards of the Public Company Accounting Oversight Board (United States), the 2009 consolidated financial statements of Franklin Street Properties Corp. and our report dated February 23, 2010 expressed an unqualified opinion thereon.
� 0; /s/ Ernst & Young LLP
Boston, Massachusetts
February 23, 2010
Franklin Street Properties Corp.
Consolidated Balance Sheets
| | | December 31, | |
| (in thousands) | | 2009 | | | 2008 | |
| | | | | | | |
| Assets: | | | | | | |
| Real estate assets: | | | | | | |
| Land | | $ | 126,447 | | | $ | 107,153 | |
| Buildings and improvements | | | 894,012 | | | | 810,732 | |
| Fixtures and equipment | | | 328 | | | | 299 | |
| | | | 1,020,787 | | | | 918,184 | |
| Less accumulated depreciation | | | 98,954 | | | | 74,126 | |
| Real estate assets, net | | | 921,833 | | | | 844,058 | |
| | | | | | | | | |
Acquired real estate leases, less accumulated amortization of $34,592 and $29,200, respectively | | | 44,757 | | | | 28,518 | |
| Investment in non-consolidated REITs | | | 92,910 | | | | 83,046 | |
| Asset held for syndication, net | | | 4,827 | | | | 13,254 | |
| Cash and cash equivalents | | | 27,404 | | | | 29,244 | |
| Restricted cash | | | 334 | | | | 336 | |
| Tenant rent receivables, less allowance for doubtful accounts | | | | | | | | |
| of $620 and $509, respectively | | | 1,782 | | | | 1,329 | |
Straight-line rent receivable, less allowance for doubtful accounts of $100 and $261, respectively | | | 10,754 | | | | 8,816 | |
| Prepaid expenses | | | 2,594 | | | | 2,206 | |
| Related party mortgage loan receivable | | | 36,535 | | | | 1,125 | |
| Other assets | | | 844 | | | | 2,406 | |
Office computers and furniture, net of accumulated depreciation of $1,233 and $1,108, respectively | | | 384 | | | | 281 | |
Deferred leasing commissions, net of accumulated amortization of $4,995, and $3,416, respectively | | | 10,808 | | | | 10,814 | |
| | | | | | | | | |
| Total assets | | $ | 1,155,766 | | | $ | 1,025,433 | |
The accompanying notes are an integral part of these consolidated financial statements.
Franklin Street Properties Corp.
Consolidated Balance Sheets
| | | December 31, | |
| (in thousands, except share and par value amounts) | | 2009 | | | 2008 | |
| | | | | | | |
| Liabilities and Stockholders’ Equity: | | | | | | |
| Liabilities: | | | | | | |
| Bank note payable | | $ | 109,008 | | | $ | 67,468 | |
| Term loan payable | | | 75,000 | | | | 75,000 | |
| Accounts payable and accrued expenses | | | 23,787 | | | | 22,297 | |
| Accrued compensation | | | 1,416 | | | | 1,654 | |
| Tenant security deposits | | | 1,808 | | | | 1,874 | |
| Other liabilities: derivative termination value | | | 2,076 | | | | 3,099 | |
| Acquired unfavorable real estate leases, less accumulated amortization of $2,492, and $1,779, respectively | | | 5,397 | | | | 5,044 | |
| | | | | | | | | |
| Total liabilities | | | 218,492 | | | | 176,436 | |
| | | | | | | | | |
| Commitments and contingencies | | | | | | | | |
| | | | | | | | | |
| Stockholders’ Equity: | | | | | | | | |
Preferred stock, $.0001 par value, 20,000,000 shares authorized, none issued or outstanding | | | - | | | | - | |
| Common stock, $.0001 par value, 180,000,000 shares authorized, 79,680,705 and 70,480,705 shares issued and outstanding, respectively | | | 8 | | | | 7 | |
| Additional paid-in capital | | | 1,003,713 | | | | 889,019 | |
| Accumulated other comprehensive loss | | | (2,076 | ) | | | (3,099 | ) |
| Earnings (distributions) in excess of accumulated earnings/distributions | | | (64,371 | ) | | | (36,930 | ) |
| | | | | | | | | |
| Total stockholders’ equity | | | 937,274 | | | | 848,997 | |
| | | | | | | | | |
| Total liabilities and stockholders’ equity | | $ | 1,155,766 | | | $ | 1,025,433 | |
The accompanying notes are an integral part of these consolidated financial statements.
Franklin Street Properties Corp.
Consolidated Statements of Income
| | | For the Year Ended | |
| | | December 31, | |
| (in thousands, except per share amounts) | | 2009 | | | 2008 | | | 2007 | |
| | | | | | | | | | |
| Revenues: | | | | | | | | | |
| Rental | | $ | 122,074 | | | $ | 111,198 | | | $ | 100,961 | |
| Related party revenue: | | | | | | | | | | | | |
| Syndication fees | | | 2,428 | | | | 3,766 | | | | 8,986 | |
| Transaction fees | | | 2,080 | | | | 3,641 | | | | 9,898 | |
| Management fees and interest income from loans | | | 1,740 | | | | 1,739 | | | | 7,030 | |
| Other | | | 61 | | | | 72 | | | | 118 | |
| Total revenues | | | 128,383 | | | | 120,416 | | | | 126,993 | |
| Expenses: | | | | | | | | | | | | |
| Real estate operating expenses | | | 30,822 | | | | 28,999 | | | | 26,171 | |
| Real estate taxes and insurance | | | 19,228 | | | | 17,740 | | | | 16,535 | |
| Depreciation and amortization | | | 36,293 | | | | 30,360 | | | | 29,334 | |
| Selling, general and administrative | | | 8,891 | | | | 8,268 | | | | 7,466 | |
| Commissions | | | 1,801 | | | | 2,151 | | | | 4,737 | |
| Interest | | | 6,570 | | | | 4,921 | | | | 7,684 | |
| Total expenses | | | 103,605 | | | | 92,439 | | | | 91,927 | |
| | | | | | | | | | | | | |
| Income before interest income, equity in earnings (losses) of non-consolidated REITs and taxes on income | | | 24,778 | | | | 27,977 | | | | 35,066 | |
| Interest income | | | 97 | | | | 745 | | | | 2,377 | |
| Equity in earnings (losses) of non-consolidated REITs | | | 1,994 | | | | 2,747 | | | | (464 | ) |
| | | | | | | | | | | | | |
| Income before taxes on income | | | 26,869 | | | | 31,469 | | | | 36,979 | |
| Taxes on income | | | (579 | ) | | | (490 | ) | | | 873 | |
| | | | | | | | | | | | | |
| Income from continuing operations | | | 27,448 | | | | 31,959 | | | | 36,106 | |
| Discontinued operations: | | | | | | | | | | | | |
| Income from discontinued operations | | | - | | | | - | | | | 1,190 | |
| Gain on sale of of land in 2009 and properties in 2007, less applicable income tax | | | 424 | | | | - | | | | 23,789 | |
| Total discontinued operations | | | 424 | | | | - | | | | 24,979 | |
| | | | | | | | | | | | | |
| Net income | | $ | 27,872 | | | $ | 31,959 | | | $ | 61,085 | |
| | | | | | | | | | | | | |
| Weighted average number of shares outstanding, basic and diluted | | | 73,001 | | | | 70,481 | | | | 70,651 | |
| | | | | | | | | | | | | |
| Earnings per share, basic and diluted, attributable to: | | | | | | | | | | | | |
| Continuing operations | | $ | 0.38 | | | $ | 0.45 | | | $ | 0.51 | |
| Discontinued operations | | | - | | | | - | | | | 0.35 | |
| Net income per share, basic and diluted | | $ | 0.38 | | | $ | 0.45 | | | $ | 0.86 | |
The accompanying notes are an integral part of these consolidated financial statements.
Franklin Street Properties Corp.
Consolidated Statements of Stockholders’ Equity
| | | | | | | | | | | | | | | Earnings/ | | | | |
| | | | | | | | | | | | | | | (distributions) | | | | |
| | | | | | | | | | | | Accumulated | | | in excess of | | | | |
| | | | | | | | | Additional | | | other | | | accumulated | | | Total | |
| | | Common Stock | | | Paid-In | | | comprehensive | | | earnings/ | | | Stockholders' | |
| (in thousands) | | Shares | | | Amount | | | Capital | | | loss | | | distributions | | | Equity | |
| | | | | | | | | | | | | | | | | | | |
| Balance, December 31, 2006 | | 70,766 | | | $ | 7 | | | $ | 893,786 | | | $ | - | | | $ | 28,169 | | | $ | 921,962 | |
| Repurchased shares | | (285 | ) | | | - | | | | (4,767 | ) | | | - | | | | - | | | | (4,767 | ) |
| Net income | | - | | | | - | | | | - | | | | - | | | | 61,085 | | | | 61,085 | |
| Distributions | | - | | | | - | | | | - | | | | - | | | | (87,662 | ) | | | (87,662 | ) |
| Balance, December 31, 2007 | | 70,481 | | | | 7 | | | | 889,019 | | | | - | | | | 1,592 | | | | 890,618 | |
| Comprehensive income | | - | | | | - | | | | - | | | | (3,099 | ) | | | 31,959 | | | | 28,860 | |
| Distributions | | - | | | | - | | | | - | | | | - | | | | (70,481 | ) | | | (70,481 | ) |
| Balance, December 31, 2008 | | 70,481 | | | | 7 | | | | 889,019 | | | | (3,099 | ) | | | (36,930 | ) | | | 848,997 | |
| Comprehensive income | | - | | | | - | | | | - | | | | 1,023 | | | | 27,872 | | | | 28,895 | |
| Shares issued for: | | | | | | | | | | | | | | | | | | | | | | | |
| Equity Offering | | 9,200 | | | | 1 | | | | 114,694 | | | | - | | | | - | | | | 114,695 | |
| Distributions | | - | | | | - | | | | - | | | | - | | | | (55,313 | ) | | | (55,313 | ) |
| Balance, December 31, 2009 | | 79,681 | | | $ | 8 | | | $ | 1,003,713 | | | $ | (2,076 | ) | | $ | (64,371 | ) | | $ | 937,274 | |
The accompanying notes are an integral part of these consolidated financial statements.
Franklin Street Properties Corp.
Consolidated Statements of Cash Flows
| | | For the Year Ended December 31, | |
| (in thousands) | | 2009 | | | 2008 | | | 2007 | |
| Cash flows from operating activities: | | | | | | | | | |
| Net income | | $ | 27,872 | | | $ | 31,959 | | | $ | 61,085 | |
| Adjustments to reconcile net income to net cash provided by operating activities: | | | | | | | | | | | | |
| Depreciation and amortization expense | | | 36,561 | | | | 30,444 | | | | 30,563 | |
| Amortization of above market lease | | | 3,359 | | | | 4,283 | | | | 4,948 | |
| Gain on sale of real estate assets | | | (424 | ) | | | - | | | | (23,789 | ) |
| Equity in earnings (losses) of non-consolidated REITs | | | (2,012 | ) | | | (2,747 | ) | | | 472 | |
| Distributions from non-consolidated REITs | | | 5,628 | | | | 5,348 | | | | 1,806 | |
| Increase (decrease) in bad debt reserve | | | 111 | | | | 79 | | | | (3 | ) |
| Changes in operating assets and liabilities: | | | | | | | | | | | | |
| Restricted cash | | | 2 | | | | - | | | | 425 | |
| Tenant rent receivables | | | (564 | ) | | | 64 | | | | 971 | |
| Straight-line rents | | | (1,879 | ) | | | (1,406 | ) | | | (3,359 | ) |
| Prepaid expenses and other assets | | | 907 | | | | (901 | ) | | | 374 | |
| Accounts payable, accrued expenses and other items | | | 2,760 | | | | 448 | | | | 1,884 | |
| Accrued compensation | | | (238 | ) | | | 90 | | | | (1,079 | ) |
| Tenant security deposits | | | (66 | ) | | | - | | | | 130 | |
| Payment of deferred leasing commissions | | | (2,659 | ) | | | (3,353 | ) | | | (4,314 | ) |
| Net cash provided by operating activities | | | 69,358 | | | | 64,308 | | | | 70,114 | |
| Cash flows from investing activities: | | | | | | | | | | | | |
| Purchase of real estate assets and office computers and furniture, capitalized merger costs | | | (104,544 | ) | | | (73,888 | ) | | | (77,894 | ) |
| Acquired real estate leases | | | (27,779 | ) | | | (4,508 | ) | | | (3,726 | ) |
| Investment in non-consolidated REITs | | | (13,218 | ) | | | (10 | ) | | | (82,831 | ) |
| Investment in related party mortgage loan receivable | | | (35,410 | ) | | | (1,125 | ) | | | - | |
| Redemption of (investment in) certificate of deposit | | | - | | | | - | | | | 5,143 | |
| Changes in deposits on real estate assets | | | - | | | | (1,300 | ) | | | - | |
| Investment in assets held for syndication | | | 8,159 | | | | 12,236 | | | | (22,093 | ) |
| Proceeds received on sales of real estate assets | | | 672 | | | | - | | | | 96,102 | |
| Net cash used in investing activities | | | (172,120 | ) | | | (68,595 | ) | | | (85,299 | ) |
| Cash flows from financing activities: | | | | | | | | | | | | |
| Distributions to stockholders | | | (55,313 | ) | | | (70,481 | ) | | | (87,662 | ) |
| Purchase of treasury shares | | | - | | | | - | | | | (4,767 | ) |
| Proceeds from equity offering | | | 119,600 | | | | - | | | | - | |
| Offering costs | | | (4,905 | ) | | | - | | | | - | |
| Borrowings under bank note payable | | | - | | | | - | | | | 84,750 | |
| Repayments of bank note payable | | | 41,540 | | | | (17,282 | ) | | | - | |
| Borrowings under term loan payable | | | - | | | | 75,000 | | | | - | |
| Deferred financing costs | | | - | | | | (694 | ) | | | (121 | ) |
| Net cash provided by (used in) financing activities | | | 100,922 | | | | (13,457 | ) | | | (7,800 | ) |
| Net decrease in cash and cash equivalents | | | (1,840 | ) | | | (17,744 | ) | | | (22,985 | ) |
Cash and cash equivalents, beginning of year | | | 29,244 | | | | 46,988 | | | | 69,973 | |
Cash and cash equivalents, end of year | | $ | 27,404 | | | $ | 29,244 | | | $ | 46,988 | |
The accompanying notes are an integral part of these consolidated financial statements.
Franklin Street Properties Corp.
Consolidated Statements of Cash Flows
| | | For the Year Ended December 31, | |
| (in thousands) | | 2009 | | | 2008 | | | 2007 | |
| | | | | | | | | | |
| Supplemental disclosure of cash flow information: | | | | | | | | | |
| Cash paid for: | | | | | | | | | |
| Interest | | $ | 6,354 | | | $ | 4,754 | | | $ | 6,667 | |
| Taxes on income | | $ | 255 | | | $ | 257 | | | $ | 730 | |
| Non-cash investing and financing activities: | | | | | | | | | | | | |
| Accrued costs for purchase of real estate assets | | $ | 1,936 | | | $ | 3,206 | | | $ | 1,613 | |
| Deposits on real estate assets converted to investments in assets | | | | | | | | | | | | |
| held for syndication | | $ | - | | | $ | - | | | $ | 5,010 | |
| Investment in non-consolidated REITs converted to real estate | | | | | | | | | | | | |
| assets and acquired real estate leases in conjunction with merger | | $ | - | | | $ | 846 | | | $ | - | |
The accompanying notes are an integral part of these consolidated financial statements.
Franklin Street Properties Corp.
Notes to the Consolidated Financial Statements
1. Organization
Franklin Street Properties Corp. (“FSP Corp.” or the “Company”), holds, directly and indirectly, 100% of the interest in FSP Investments LLC, FSP Property Management LLC, and FSP Holdings LLC. The Company also has a non-controlling common stock interest in 14 corporations organized to operate as real estate investment trusts ("REITs").
On May 15, 2008, the Company acquired one of its Sponsored REITs, FSP Park Ten Development Corp. (“Park Ten Development”) by merging a wholly-owned subsidiary of the Company with and into Park Ten Development for a total purchase price of approximately $35.4 million. The holders of preferred stock in Park Ten Development received cash consideration of approximately $127,290 per share. The merger was accounted for as a purchase and the acquired assets and liabilities were recorded at their fair value.
On September 23, 2009, the Company completed an underwritten public offering of 9.2 million shares of our common stock (including 1.2 million shares issued as a result of the full exercise of an overallotment option by the underwriter) at a price to the public of $13.00 per share. The proceeds from this public offering, net of underwriter discounts and offering costs, totaled approximately $114.7 million (after payment of offering costs of approximately $0.7 million).
The Company operates in two business segments: real estate operations and investment banking/investment services. FSP Investments LLC provides real estate investment and broker/dealer services. FSP Investments LLC's services include: (i) the organization of REIT entities (the "Sponsored REITs"), which are syndicated through private placements; (ii) sourcing of the acquisition of real estate on behalf of the Sponsored REITs; and (iii) the sale of preferred stock in Sponsored REITs. FSP Investments LLC is a registered broker/dealer with the Securities and Exchange Commission and is a member of the Financial Industry Regulatory Authority, or FINRA. FSP Property Management LLC provides asset management and property management services for the Sponsored REITs.
2. Significant Accounting Policies
Basis of Presentation
The accompanying consolidated financial statements include all of the accounts of the Company and its majority-owned subsidiaries. All significant intercompany accounts and transactions have been eliminated in consolidation.
Estimates and Assumptions
The Company prepares its financial statements and related notes in conformity with accounting principles generally accepted in the United States of America (“GAAP”). These principles require management to make estimates and assumptions that affect the reported amounts of assets and liabilities and disclosure of contingent assets and liabilities at the date of the financial statements and the reported amounts of revenue and expenses during the reporting period. Actual results could differ from those estimates. Significant estimates in the consolidated financial statements include the allowance for doubtful accounts, purchase price allocations, useful lives of fixed assets and the valuation of the derivative.
Investments in Sponsored REITs
Common stock investments in Sponsored REITs are consolidated while the entity is controlled by the Company. Following the commencement of syndication the Company exercises influence over, but does not control these entities and investments are accounted for using the equity method. Under the equity method of accounting, the Company's cost basis is adjusted by its share of the Sponsored REITs' earnings, if any, prior to completion of the syndication. Equity in losses of Sponsored REITs is not recognized to the extent that the investment balance would become negative. Distributions received are recognized as income once the investment balance is reduced to zero, unless there is a loan receivable from the Sponsored REIT entity. Equity in losses or distributions received in excess of common stock investment is recorded as an adjustment up to the carrying value of the assets held for syndication.
Subsequent to the completion of the syndication of preferred shares, the Company does not share in any of the Sponsored REITs’ earnings, or any related distributions, as a result of its common stock ownership.
Franklin Street Properties Corp.
Notes to the Consolidated Financial Statements
2. Significant Accounting Policies (continued)
On September 22, 2006, the Company purchased 48 preferred shares (approximately 4.6%) of a Sponsored REIT, FSP Phoenix Tower Corp. (“Phoenix Tower”), for $4,116,000. The Company agreed to vote its shares in any matter presented to a vote by the stockholders of Phoenix Tower in the same proportion as shares voted by other stockholders of Phoenix Tower. The investment in Phoenix Tower is accounted for under the equity method.
On December 27, 2007, the Company purchased 965.75 preferred shares (approximately 43.7%) of a Sponsored REIT, FSP 303 East Wacker Drive Corp. (“East Wacker”), for $82,813,000. The Company agreed to vote its shares in any matter presented to a vote by the stockholders of East Wacker in the same proportion as shares voted by other stockholders of East Wacker. The investment in East Wacker is accounted for under the equity method.
Prior to May 15, 2008, the Company held a preferred stock investment in FSP Park Ten Development Corp. (“Park Ten Development”), which was acquired by merger on May 15, 2008, and accordingly was eliminated when recording the merger. On September 29, 2005, the Company acquired 8.5 preferred shares (approximately 3.05%) of Park Ten Development in exchange for the contribution of 2.9 acres of developable land. The Company agreed to vote its shares in any matter presented to a vote by the stockholders of Park Ten Development in the same proportion as shares voted by other stockholders of Park Ten Development. The investment in Park Ten Development is accounted for under the equity method.
On May 29, 2009, the Company purchased 175.5 preferred shares (approximately 27.0%) of a Sponsored REIT, FSP Grand Boulevard Corp. (“Grand Boulevard”), for $15,049,000. The Company agreed to vote its shares in any matter presented to a vote by the stockholders of Grand Boulevard in the same proportion as shares voted by other stockholders of Grand Boulevard. The investment in Grand Boulevard is accounted for under the equity method.
Real Estate and Depreciation
Real estate assets are stated at the lower of cost, less accumulated depreciation.
Costs related to property acquisition and improvements are capitalized. Typical capital items include new roofs, site improvements, various exterior building improvements and major interior renovations. Costs incurred in connection with leasing (primarily tenant improvements and leasing commissions) are capitalized and amortized over the lease period.
Routine replacements and ordinary maintenance and repairs that do not extend the life of the asset are expensed as incurred. Funding for repairs and maintenance items typically is provided by cash flows from operating activities. Depreciation is computed using the straight-line method over the assets' estimated useful lives as follows:
| Category | Years |
| Commercial Buildings | 39 |
| Building improvements | 15-39 |
| Fixtures and equipment | 3-7 |
The Company reviews its properties to determine if their carrying amounts will be recovered from future operating cash flows if certain indicators of impairment are identified at those properties. The evaluation of anticipated cash flows is highly subjective and is based in part on assumptions regarding future occupancy, rental rates and capital requirements that could differ materially from actual results in future periods. Since cash flows are considered on an undiscounted basis in the analysis that the Company conducts to determine whether an asset has been impaired, the Company’s strategy of holding properties over the long term directly decreases the likelihood of recording an impairment loss. If the Company’s strategy changes or market conditions otherwise dictate an earlier sale date, an impairment loss may be recognized. If the Company determines that impairment has occurred, the affected assets must be reduced to their fair value.
Acquired Real Estate Leases and Amortization
The Company recorded a value relating to the leases acquired as a result of the acquisition by merger of one Sponsored REIT in 2008. The Company also recorded a value as a result of three direct acquisitions in 2009, two direct acquisitions in 2008 and one direct acquisition in 2007. Acquired real estate leases represent costs associated with acquiring an in-place lease (i.e., the market cost to execute a similar lease, including leasing commission, legal, vacancy and other related costs) and the value
Franklin Street Properties Corp.
Notes to the Consolidated Financial Statements
2. Significant Accounting Policies (continued)
relating to leases with rents above the market rate. Amortization is computed using the straight-line method over the life of the leases, which range from 27 months to 147 months. Amortization expense was approximately $12,885,000, $11,201,000 and $12,520,000 for the years ended December 31, 2009, 2008 and 2007, respectively.
Amortization related to costs associated with acquiring an in-place lease is included in depreciation and amortization on the consolidated statements of income. Amortization related to leases with rents above the market rate is offset against the rental revenue in the consolidated statements of income. The estimated annual amortization expense for the five years succeeding December 31, 2009 are as follows:
| (in thousands) | | | |
| 2010 | | $ | 11,335 | |
| 2011 | | | 6,641 | |
| 2012 | | | 5,493 | |
| 2013 | | | 4,986 | |
| 2014 | | | 4,821 | |
| 2015 and thereafter | | | 11,481 | |
Acquired Unfavorable Real Estate Leases and Amortization
The Company recorded a value relating to the leases acquired as a result of the acquisition by merger of one Sponsored REIT in 2008. The Company also recorded a value as a result of three direct acquisitions in 2009, two direct acquisitions in 2008 and one direct acquisition in 2007. Acquired unfavorable real estate leases represent the value relating to leases with rents below the market rate. Amortization is computed using the straight-line method over the life of the leases, which range from 27 months to 147 months. Amortization expense was approximately $992,000, $887,000 and $856,000 for the years ended December 31, 2009, 2008 and 2007, respectively.
Amortization related to leases with rents below the market rate is included with rental revenue in the consolidated statements of income. The estimated annual amortization for the five years succeeding December 31, 2009 are as follows:
| (in thousands) | | | |
| 2010 | | $ | 997 | |
| 2011 | | | 862 | |
| 2012 | | | 817 | |
| 2013 | | | 726 | |
| 2014 | | | 622 | |
| 2015 and thereafter | | | 1,373 | |
Discontinued Operations
The Company accounts for properties as held for sale, which typically occurs upon the execution of a purchase and sale agreement and belief by management that the sale or disposition is probable of occurrence within one year. Upon determining that a property is held for sale, the Company discontinues depreciating the property and reflects the property in its consolidated balance sheets at the lower of its carrying amount or fair value less the cost to sell. The Company presents property related to discontinued operations on its consolidated balance sheets as “Assets held for sale”, on a comparative basis. The Company reports the results of operations of its properties classified as discontinued operations in its consolidated statements of income if no significant continuing involvement exists after the sale or disposition.
Cash and Cash Equivalents
The Company considers all highly liquid instruments purchased with an original maturity of three months or less to be cash equivalents.
Franklin Street Properties Corp.
Notes to the Consolidated Financial Statements
2. Significant Accounting Policies (continued)
Restricted Cash
Restricted cash consists of tenant security deposits, which are required by law in some states or by contractual agreement and escrows arising from property sales. Tenant security deposits are refunded when tenants vacate, provided that the tenant has not damaged the property. Cash held in escrow is paid when the related issue is resolved.
Tenant Rent Receivables
Tenant rent receivables are expected to be collected within one year. The Company provides an allowance for doubtful accounts based on its estimate of a tenant’s ability to make future rent payments. The computation of this allowance is based in part on the tenants’ payment history and current credit status. The Company charged off $20,000 in receivables and increased its allowance by $131,000 during 2009; and increased its allowance by $79,000 during 2008 based on such analysis.
Concentration of Credit Risks
Financial instruments that potentially subject us to concentrations of credit risk consist primarily of cash investments, derivatives and accounts receivable. The Company maintains its cash balances principally in two banks which the Company believes to be creditworthy. The Company periodically assesses the financial condition of the banks and believes that the risk of loss is minimal. Cash balances held with various financial institutions frequently exceed the insurance limit of $250,000 provided by the Federal Deposit Insurance Corporation. The derivative we have is from an interest rate swap agreement that is discussed in Note 6. The Company performs ongoing credit evaluations of our tenants and require certain tenants to provide security deposits or letters of credit. Though these security deposits and letters of credit are insufficient to meet the total value of a tenant’s lease obligation, they are a measure of good faith and a source of funds to offset the economic costs associated with lost rent and the costs associated with re-tenanting the space. The Company has no single tenant which accounts for more than 10% of its annualized rent.
Financial Instruments
The Company estimates that the carrying value of cash and cash equivalents, restricted cash, and the bank note payable approximate their fair values based on their short-term maturity and prevailing interest rates.
Straight-line Rent Receivable
Certain leases provide for fixed rent increases over the life of the lease. Rental revenue is recognized on a straight-line basis over the related lease term; however, billings by the Company are based on the lease agreements. Straight-line rent receivable, which is the cumulative revenue recognized in excess of amounts billed by the Company, is $10,754,000 and $8,816,000 at December 31, 2009 and 2008, respectively. The Company provides an allowance for doubtful accounts based on its estimate of a tenant’s ability to make future rent payments. The computation of this allowance is based in part on the tenants’ payment history and current credit status. The Company charged off $99,000 in receivables and decreased its allowance by $62,000 during 2009 and the reserve balance was not changed during 2008 based on such analysis.
Deferred Leasing Commissions
Deferred leasing commissions represent direct and incremental external leasing costs incurred in the leasing of commercial space. These costs are capitalized and are amortized on a straight-line basis over the terms of the related lease agreements. Amortization expense was approximately $2,665,000, $1,725,000 and $1,371,000 for the years ended December 31, 2009, 2008 and 2007, respectively.
Franklin Street Properties Corp.
Notes to the Consolidated Financial Statements
2. Significant Accounting Policies (continued)
The estimated annual amortization for the five years following December 31, 2009 is as follows:
| (in thousands) | | | |
| 2010 | | $ | 2,125 | |
| 2011 | | | 2,011 | |
| 2012 | | | 1,730 | |
| 2013 | | | 1,445 | |
| 2014 | | | 1,256 | |
| 2015 and thereafter | | | 2,241 | |
Common Share Repurchases
The Company recognizes the gross cost of the common shares it repurchases as a reduction in stockholder’s equity using the treasury stock method. Maryland law does not recognize a separate treasury stock account but provides that shares repurchased are classified as authorized but unissued shares. Accordingly, the Company reduces common stock for the par value and the excess of the purchase price over the par value is a reduction to additional paid-in capital.
Revenue Recognition
Rental revenue includes income from leases, certain reimbursable expenses, straight-line rent adjustments and other income associated with renting the property. A summary of rental revenue is shown in the following table:
| | | Year Ended | |
| (in thousands) | | December 31, | |
| | | 2009 | | | 2008 | | | 2007 | |
| Income from leases | | $ | 96,132 | | | $ | 88,199 | | | $ | 79,916 | |
| Reimbursable expenses | | | 27,422 | | | | 25,876 | | | | 22,563 | |
| Straight-line rent adjustment | | | 1,879 | | | | 1,406 | | | | 3,305 | |
| Amortization of favorable leases | | | (3,359 | ) | | | (4,283 | ) | | | (4,823 | ) |
| | | $ | 122,074 | | | $ | 111,198 | | | $ | 100,961 | |
Rental Revenue — The Company has retained substantially all of the risks and benefits of ownership of the Company's commercial properties and accounts for its leases as operating leases. Rental income from leases, which includes rent concessions (including free rent and tenant improvement allowances) and scheduled increases in rental rates during the lease term, is recognized on a straight-line basis. The Company does not have any significant percentage rent arrangements with its commercial property tenants. Reimbursable costs are included in rental income in the period earned.
Syndication Fees — Syndication fees ranging from 4% to 8% of the gross offering proceeds from the sale of securities in Sponsored REITs are generally recognized upon an investor closing; at that time the Company has provided all required services, the fee is fixed and collected, and no further contingencies exist. Commission expense ranging from 2% to 4% of the gross offering proceeds is recorded in the period the related syndication fee is earned. There is typically more than one investor closing in the syndication of a Sponsored REIT.
Transaction Fees — Transaction fees relating to loan commitment fees, development fees and acquisition fees are recognized upon an investor closing and the subsequent payment of the Sponsored REIT’s loan to the Company. Development fees are recognized upon an investor closing and once the service has been provided. Fees related to organizational, offering and other expenditures are recognized upon the final investor closing of the Sponsored REIT. The final investor closing is the last admittance of investors into a Sponsored REIT; at that time, required funds have been received from the investors and charges relating to the syndication have been paid or accrued.
Other – Other income, including property and asset management fees, is recognized when the related services are performed and the earnings process is complete.
Franklin Street Properties Corp.
Notes to the Consolidated Financial Statements
2. Significant Accounting Policies (continued)
Income Taxes
Taxes on income for the years ended December 31, 2009, 2008 and 2007 represent taxes incurred by FSP Investments, which is a taxable REIT subsidiary. In 2006, the State of Texas enacted a new franchise tax applicable to FSP Corp., which started in 2007 and is classified as an income tax for reporting purposes.
Net Income Per Share
Basic net income per share is computed by dividing net income by the weighted average number of shares outstanding during the period. Diluted net income per share reflects the potential dilution that could occur if securities or other contracts to issue shares were exercised or converted into shares. There were no potential dilutive shares outstanding at December 31, 2009, 2008, and 2007. The denominator used for calculating basic and diluted net income per share was 73,001,000, 70,481,000, and 70,651,000, for the years ended December 31, 2009, 2008, and 2007, respectively.
Derivative Instruments
The Company recognizes derivatives on the balance sheet at fair value. Derivatives that do not qualify, or are not designated as hedge relationships, must be adjusted to fair value through income. Derivative instruments designated in a hedge relationship to mitigate exposure to variability in expected future cash flows, or other types of forecasted transactions, are considered cash flow hedges. Cash flow hedges are accounted for by recording the fair value of the derivative instrument on the balance sheet as either an asset or liability. To the extent hedges are effective, a corresponding amount, adjusted for swap payments, is recorded in accumulated other comprehensive income within stockholders’ equity. Amounts are then reclassified from accumulated other comprehensive income to the income statement in the period or periods the hedged forecasted transaction affects earnings. Ineffectiveness, if any, is recorded in the income statement. The Company periodically reviews the effectiveness of each hedging transaction, which involves estimating future cash flows, at least quarterly. Derivative instruments designated in a hedge relationship to mitigate exposure to changes in the fair value of an asset, liability, or firm commitment attributable to a particular risk, such as interest rate risk, are considered fair value hedges. The Company currently has no fair value hedges outstanding. Fair values of derivatives are subject to significant variability based on changes in interest rates. The results of such variability could be a significant increase or decrease in our derivative assets, derivative liabilities, book equity, and/or earnings.
Fair Value Measurements
Fair value is defined as the exchange price that would be received for an asset or paid to transfer a liability (an exit price) in the principal or most advantageous market for the asset or liability in an orderly transaction between market participants on the measurement date. There is also an established fair value hierarchy which requires an entity to maximize the use of observable inputs and minimize the use of unobservable inputs when measuring fair value. The standard describes three levels of inputs that may be used to measure fair value. Financial assets and liabilities recorded on the consolidated balance sheets at fair value are categorized based on the inputs to the valuation techniques as follows:
Level 1 inputs are quoted prices (unadjusted) in active markets for identical assets or liabilities that the Company has the ability to access. Level 2 inputs are inputs other than quoted prices included in Level 1 that are observable for the asset or liability, either directly or indirectly. Level 2 inputs may include quoted prices for similar assets and liabilities in active markets, as well as inputs that are observable for the asset or liability (other than quoted prices), such as interest rates, foreign exchange rates, and yield curves that are observable at commonly quoted intervals. Level 3 inputs are unobservable inputs for the asset or liability, which is typically based on an entity’s own assumptions, as there is little, if any, related market activity or information. In instances where the determination of the fair value measurement is based on inputs from different levels of the fair value hierarchy, the level in the fair value hierarchy within which the entire fair value measurement falls is based on the lowest level input that is significant to the fair value measurement in its entirety. The Company’s assessment of the significance of a particular input to the fair value measurement in its entirety requires judgment, and considers factors specific to the asset or liability. These inputs were considered and applied to the Company’s outstanding derivative, and Level 2 inputs were used to value the interest rate swap.
Franklin Street Properties Corp.
Notes to the Consolidated Financial Statements
2. Significant Accounting Policies (continued)
Subsequent Events
In preparing these consolidated financial statements the Company evaluated events that occurred through the date of issuance of these financial statements for potential recognition or disclosure.
Recent Accounting Standards
Accounting Standards Codification
In June 2009, the Financial Accounting Standards Board (“FASB”) issued a pronouncement establishing the FASB Accounting Standards Codification as the source of authoritative accounting principles recognized by the FASB to be applied in the preparation of financial statements in conformity with GAAP. The standard explicitly recognizes rules and interpretive releases of the SEC under federal securities laws as authoritative GAAP for SEC registrants. This standard is effective for financial statements issued for fiscal years and interim periods ending after September 15, 2009. The Company has adopted this standard in accordance with GAAP.
In September 2006, the FASB issued a pronouncement that defines fair value, establishes a framework for measuring fair value in GAAP and provides for expanded disclosure about fair value measurements that will be applied prospectively, to all other accounting pronouncements that require or permit fair value measurements. The pronouncement excludes certain leasing transactions accounted for in accounting for leases and was effective for financial statements issued for fiscal years beginning after November 15, 2007, and interim periods within those fiscal years. The adoption did not have a material impact on the Company’s financial position, operations or cash flow. The FASB then issued a pronouncement to defer the effective date for all non-financial assets and non-financial liabilities except those that are recognized or disclosed at fair value in the financial statements on a recurring basis to fiscal years beginning after November 15, 2008. The adoption of this standard did not have a material impact on the Company’s financial position, results of operations or cash flows.
In December 2007, the FASB issued a pronouncement, which establishes principles and requirements for how the acquirer shall recognize and measure in its financial statements the identifiable assets acquired, liabilities assumed, any noncontrolling interest in the acquiree and goodwill acquired in a business combination. The pronouncement is effective for business combinations for which the acquisition date is on or after the beginning of the first annual reporting period beginning on or after December 15, 2008. The adoption of this standard did not have a material impact on the Company’s financial position, results of operations or cash flows.
In May 2009, the FASB issued a pronouncement which sets forth the period after the balance sheet date during which management of a reporting entity should evaluate events or transactions that may occur for potential recognition or disclosure in the financial statements, the circumstances under which an entity should recognize events or transactions occurring after the balance sheet date in its financial statements, and disclosures that an entity should make about events or transactions that occurred after the balance sheet date. This pronouncement requires the disclosure of the date through which an entity has evaluated subsequent events and the basis for that date. This disclosure should alert all users of financials statements that an entity has not evaluated subsequent events after that date in the set of financial statements being presented. The Company is adhering to the requirements of this pronouncement, which was effective for financial periods ending after June 15, 2009.
On June 12, 2009, the FASB issued a pronouncement that changes how a company determines when an entity that is insufficiently capitalized or is not controlled through voting (or similar rights) should be consolidated. The determination of whether a company is required to consolidate an entity is based on, among other things, an entity`s purpose and design and a company`s ability to direct the activities of the entity that most significantly impact the entity`s economic performance. The pronouncement is effective for fiscal years and interim periods within those fiscal years beginning on or after November 15, 2009. The Company is currently evaluating the impact of this pronouncement on the Company’s consolidated financial statements.
Franklin Street Properties Corp.
Notes to the Consolidated Financial Statements
3. Business Segments
The Company operates in two business segments: real estate operations (including real estate leasing, interest income on interim acquisition and other financing and asset/property management) including discontinued operations and investment banking/investment services (including real estate acquisition, development services and broker/dealer services). The Company has identified these segments because this information is the basis upon which management makes decisions regarding resource allocation and performance assessment. The accounting policies of the reportable segments are the same as those described in the “Significant Accounting Policies”. The Company’s operations are located entirely in the United States of America.
The Company evaluates the performance of its reportable segments based on Funds From Operations (“FFO”) as management believes that FFO represents the most accurate measure of the reportable segment’s activity and is the basis for distributions paid to equity holders. The Company defines FFO as net income (computed in accordance with GAAP), excluding gains (or losses) from sales of property and acquisition costs of newly acquired properties that are not capitalized, plus depreciation and amortization, and after adjustments to exclude non-cash income (or losses) from non-consolidated or Sponsored REITs, plus distributions received from non-consolidated or Sponsored REITs.
FFO should not be considered as an alternative to net income (determined in accordance with GAAP), as an indicator of the Company’s financial performance, nor as an alternative to cash flows from operating activities (determined in accordance with GAAP), nor as a measure of the Company’s liquidity, nor is it necessarily indicative of sufficient cash flow to fund all of the Company’s needs. Other real estate companies may define this term in a different manner. The Company believes that in order to facilitate a clear understanding of the results of the Company, FFO should be examined in connection with net income and cash flows from operating, investing and financing activities in the consolidated financial statements. The calculation of FFO by business segment is shown in the following table:
| | | | | | Investment | | | | |
| | | Real | | | Banking/ | | | | |
| | | Estate | | | Investment | | | | |
| (in thousands): | | Operations | | | Services | | | Total | |
| Year ended December 31, 2009: | | | | | | | | | |
| Net income | | $ | 28,519 | | | $ | (647 | ) | | $ | 27,872 | |
| Gain on sale of land | | | (424 | ) | | | - | | | | (424 | ) |
| Equity in earnings of non-consolidated REITs | | | (2,012 | ) | | | - | | | | (2,012 | ) |
| Distribution from non-consolidated REITs | | | 5,628 | | | | - | | | | 5,628 | |
| Acquisition costs | | | 643 | | | | - | | | | 643 | |
| Depreciation and amortization | | | 39,529 | | | | 123 | | | | 39,652 | |
| Funds From Operations | | $ | 71,883 | | | $ | (524 | ) | | $ | 71,359 | |
| | | | | | | | | | | | | |
| Year ended December 31, 2008: | | | | | | | | | | | | |
| Net income | | $ | 30,008 | | | $ | 1,951 | | | $ | 31,959 | |
| Equity in earnings of non-consolidated REITs | | | (2,747 | ) | | | - | | | | (2,747 | ) |
| Distribution from non-consolidated REITs | | | 5,348 | | | | - | | | | 5,348 | |
| Depreciation and amortization | | | 34,505 | | | | 138 | | | | 34,643 | |
| Funds From Operations | | $ | 67,114 | | | $ | 2,089 | | | $ | 69,203 | |
| | | | | | | | | | | | | |
| Year ended December 31, 2007: | | | | | | | | | | | | |
| Net income | | $ | 51,646 | | | $ | 9,439 | | | $ | 61,085 | |
| Gain on sale of properties | | | (23,789 | ) | | | - | | | | (23,789 | ) |
| Equity in earnings of non-consolidated REITs | | | 472 | | | | - | | | | 472 | |
| Distribution from non-consolidated REITs | | | 1,806 | | | | - | | | | 1,806 | |
| Depreciation and amortization | | | 35,340 | | | | 135 | | | | 35,475 | |
| Funds From Operations | | $ | 65,475 | | | $ | 9,574 | | | $ | 75,049 | |
Franklin Street Properties Corp.
Notes to the Consolidated Financial Statements
3. Business Segments (continued)
The Company’s cash distributions for the years ended December 31, 2009, 2008 and 2007 are summarized as follows:
| Quarter paid | | Distribution Per Share/Unit | | | Total Cash
Distributions | |
| | | | | | (in thousands) | |
| Second quarter of 2009 | | $ | 0.19 | | | $ | 13,391 | |
| Third quarter of 2009 | | | 0.19 | | | | 13,391 | |
| Fourth quarter of 2009 | | | 0.19 | | | | 15,140 | |
| First quarter of 2010 (A) | | | 0.19 | | | | 15,139 | |
| | | $ | 0.76 | | | $ | 57,061 | |
| | | | | | | | | |
| Second quarter of 2008 | | $ | 0.31 | | | $ | 21,849 | |
| Third quarter of 2008 | | | 0.19 | | | | 13,391 | |
| Fourth quarter of 2008 | | | 0.19 | | | | 13,391 | |
| First quarter of 2009 (A) | | | 0.19 | | | | 13,391 | |
| | | $ | 0.88 | | | $ | 62,022 | |
| | | | | | | | | |
| Second quarter of 2007 | | $ | 0.31 | | | $ | 21,937 | |
| Third quarter of 2007 | | | 0.31 | | | | 21,938 | |
| Fourth quarter of 2007 | | | 0.31 | | | | 21,849 | |
| First quarter of 2008 (A) | | | 0.31 | | | | 21,849 | |
| | | $ | 1.24 | | | $ | 87,573 | |
(A) Represents distributions declared and paid in the first quarter related to the fourth quarter of the prior year.
Cash distributions per share are declared and paid based on the total outstanding shares as of the record date and are typically paid in the quarter following the quarter that FFO is generated.
Franklin Street Properties Corp.
Notes to the Consolidated Financial Statements
3. Business Segments (continued)
The following table is a summary of other financial information by business segment:
| | | Real Estate Operations | | | Investment Banking/ Investment Services | | | Total | |
| | | | | | (in thousands) | | | | |
| December 31, 2009: | | | | | | | | | |
| Revenue | | $ | 123,875 | | | $ | 4,508 | | | $ | 128,383 | |
| Interest income | | | 93 | | | | 4 | | | | 97 | |
| Interest expense | | | 6,570 | | | | - | | | | 6,570 | |
| Income from discontinued operations, net | | | - | | | | - | | | | - | |
| Capital expenditures | | | 8,641 | | | | 228 | | | | 8,869 | |
| Investment in non-consolidated REITs | | | 92,910 | | | | - | | | | 92,910 | |
| Identifiable assets | | | 1,150,806 | | | | 4,960 | | | | 1,155,766 | |
| | | | | | | | | | | | | |
| December 31, 2008: | | | | | | | | | | | | |
| Revenue | | $ | 113,009 | | | $ | 7,407 | | | $ | 120,416 | |
| Interest income | | | 709 | | | | 36 | | | | 745 | |
| Interest expense | | | 4,921 | | | | - | | | | 4,921 | |
| Income from discontinued operations, net | | | - | | | | - | | | | - | |
| Capital expenditures | | | 7,013 | | | | 102 | | | | 7,115 | |
| Investment in non-consolidated REITs | | | 83,046 | | | | - | | | | 83,046 | |
| Identifiable assets | | | 1,020,456 | | | | 4,977 | | | | 1,025,433 | |
| | | | | | | | | | | | | |
| December 31, 2007: | | | | | | | | | | | | |
| Revenue | | $ | 108,070 | | | $ | 18,923 | | | $ | 126,993 | |
| Interest income | | | 2,317 | | | | 60 | | | | 2,377 | |
| Interest expense | | | 7,684 | | | | - | | | | 7,684 | |
| Income from discontinued operations, net | | | 1,190 | | | | - | | | | 1,190 | |
| Capital expenditures | | | 11,031 | | | | 69 | | | | 11,100 | |
| Investment in non-consolidated REITs | | | 85,663 | | | | - | | | | 85,663 | |
| Identifiable assets | | | 997,145 | | | | 6,321 | | | | 1,003,466 | |
4. Related Party Transactions
Investment in Sponsored REITs
At December 31, 2009, the Company held an interest in 14 Sponsored REITs, of which twelve were fully syndicated and two were underway. At December 31, 2008, the Company held an interest in 12 Sponsored REITs, of which ten were fully syndicated and two were underway. At December 31, 2007, the Company held an interest in 12 Sponsored REITs, of which eleven were fully syndicated and one was underway that commenced in September 2007. The syndication of Grand Boulevard was completed in May 2009 and the Company purchased a preferred stock investment in it. The syndication of East Wacker was completed in December 2007 and the Company purchased a preferred stock investment in it.
The table below shows the Company’s income and expenses from Sponsored REITs. Management fees of $2,000 and $20,000 for the years ended December 31, 2009 and 2007, respectively, and interest expense related to the Company’s mortgages on properties owned by these entities are eliminated in consolidation. There was no income or expenses from Sponsored REITs that were consolidated during the year ended December 31, 2008.
Franklin Street Properties Corp.
Notes to the Consolidated Financial Statements
4. Related Party Transactions (continued)
| | | Year Ended December 31, | |
| (in thousands) | | 2009 | | | 2007 | |
| Operating Data: | | | | | | |
| Rental revenues | | $ | 74 | | | $ | 3,510 | |
| Operating and maintenance expenses | | | 50 | | | | 1,834 | |
| Depreciation and amortization | | | 6 | | | | 855 | |
| Interest expense: permanent mortgage loan | | | - | | | | 179 | |
| Interest expense: acquisition loan | | | 6 | | | | 1,448 | |
| Interest income | | | - | | | | 51 | |
| | | $ | 12 | | | $ | (755 | ) |
Equity in earnings of investment in non-consolidated REITs:
The following table includes equity in earnings of investments in non-consolidated REITs:
| | | Year Ended December 31, | |
| (in thousands) | | 2009 | | | 2008 | | | 2007 | |
| | | | | | | | | | |
| Equity in earnings (losses) of Sponsored REITs | | $ | 153 | | | $ | 211 | | | $ | (627 | ) |
| Equity in earnings of Park Ten Development | | | - | | | | 9 | | | | 6 | |
| Equity in earnings of Phoenix Tower | | | 30 | | | | 28 | | | | 201 | |
| Equity in earnings (losses) of East Wacker | | | 1,673 | | | | 2,499 | | | | (44 | ) |
| Equity in earnings of Grand Boulevard | | | 138 | | | | - | | | | - | |
| | | $ | 1,994 | | | $ | 2,747 | | | $ | (464 | ) |
Equity in earnings (losses) of investments in Sponsored REITs is derived from the Company’s share of income following the commencement of syndication of Sponsored REITs. Following the commencement of syndication the Company exercises influence over, but does not control these entities, and investments are accounted for using the equity method.
Equity in earnings of Park Ten Development was derived from the Company’s preferred stock investment in the entity. In September 2005, the Company acquired 8.5 preferred shares or 3.05% of the authorized preferred shares of Park Ten Development via a non-monetary exchange of land valued at $850,000. The Company acquired Park Ten Development by merger on May 15, 2008, which merger was accounted for as a purchase, and the acquired assets and liabilities were recorded at their fair value.
Equity in earnings of Phoenix Tower is derived from the Company’s preferred stock investment in the entity. In September 2006, the Company purchased 48 preferred shares or 4.6% of the outstanding preferred shares of Phoenix Tower for $4,116,000 (which represented $4,800,000 at the offering price net of commissions of $384,000 and fees of $300,000 that were excluded).
Equity in earnings (losses) of East Wacker is derived from the Company’s preferred stock investment in the entity. In December 2007, the Company purchased 965.75 preferred shares or 43.7% of the outstanding preferred shares of East Wacker for $82,813,000 (which represented $96,575,000 at the offering price net of commissions of $7,726,000, loan fees of $5,553,000 and acquisition fees of $483,000 that were excluded).
Equity in earnings of Grand Boulevard is derived from the Company’s preferred stock investment in the entity. In May 2009, the Company purchased 175.5 preferred shares or 27.0% of the outstanding preferred shares of Grand Boulevard for $15,049,000 (which represented $17,550,000 at the offering price net of commissions of $1,404,000, loan fees of $1,009,000 and acquisition fees of $88,000 that were excluded).
Franklin Street Properties Corp.
Notes to the Consolidated Financial Statements
4. Related Party Transactions (continued)
The following table includes distributions received from non-consolidated REITs:
| | | Year Ended December 31, | |
| (in thousands) | | 2009 | | | 2008 | | | 2007 | |
| | | | | | | | | | |
| Distributions from Sponsored REITs | | $ | 442 | | | $ | 1,031 | | | $ | 1,441 | |
| Distributions from Park Ten Development | | | - | | | | 16 | | | | 1 | |
| Distributions from Phoenix Tower | | | 125 | | | | 171 | | | | 364 | |
| Distributions from East Wacker | | | 4,661 | | | | 4,130 | | | | - | |
| Distributions from Grand Boulevard | | | 400 | | | | - | | | | - | |
| | | $ | 5,628 | | | $ | 5,348 | | | $ | 1,806 | |
Non-consolidated REITs
The Company has in the past acquired by merger entities similar to the Sponsored REITs, including on on May 15, 2008, Park Ten Development. The Company’s business model for growth includes the potential acquisition by merger in the future of Sponsored REITs. However, the Company has no legal or any other enforceable obligation to acquire or to offer to acquire any Sponsored REIT. In addition, any offer (and the related terms and conditions) that might be made in the future to acquire any Sponsored REIT would require the approval of the boards of directors of the Company and the Sponsored REIT and the approval of the shareholders of the Sponsored REIT.
The operating data below for 2009 includes operations of the 14 Sponsored REITs the Company held an interest in as of December 31, 2009. The operating data below for 2008 includes operations of the 12 Sponsored REITs the Company held an interest in as of December 31, 2008, and Park Ten Development from January through May 14, 2008. The Company acquired Park Ten Development by merger on May 15, 2008. The operating data below for 2007 includes operations of the 12 Sponsored REITs the Company held an interest in as of December 31, 2007.
Summarized financial information for the Sponsored REITs is as follows:
| | | December 31, | | | December 31, | | | | |
| (in thousands) | | 2009 | | | 2008 | | | | |
| | | | | | | | | | |
Balance Sheet Data (unaudited): | | | | | | | | | |
| Real estate, net | | $ | 724,517 | | | $ | 683,218 | | | | |
| Other assets | | | 104,199 | | | | 114,015 | | | | |
| Total liabilities | | | (216,102 | ) | | | (189,435 | ) | | | |
| Shareholders' equity | | $ | 612,614 | | | $ | 607,798 | | | | |
| | | | | | | | | | | | |
| | | | For the Year Ended | |
| | | | | | | December 31, | | | | |
| (in thousands) | | | 2009 | | | | 2008 | | | | 2007 | |
| | | | | | | | | | | | | |
| Operating Data (unaudited): | | | | | | | | | | | | |
| Rental revenues | | $ | 95,918 | | | $ | 100,915 | | | $ | 94,406 | |
| Other revenues | | | 386 | | | | 1,834 | | | | 3,410 | |
| Operating and maintenance expenses | | | (50,080 | ) | | | (51,463 | ) | | | (45,072 | ) |
| Depreciation and amortization | | | (24,359 | ) | | | (24,122 | ) | | | (23,843 | ) |
| Interest expense | | | (9,412 | ) | | | (10,194 | ) | | | (23,038 | ) |
| Net income | | $ | 12,453 | | | $ | 16,970 | | | $ | 5,863 | |
Franklin Street Properties Corp.
Notes to the Consolidated Financial Statements
4. Related Party Transactions (continued)
Syndication fees and Transaction fees:
The Company provided syndication and real estate acquisition advisory services for Sponsored REITs. Syndication, development and transaction fees from non-consolidated entities amounted to approximately $4,508,000, $7,407,000, and $18,884,000 for the years ended December 31, 2009, 2008 and 2007, respectively.
Management fees and interest income from loans:
Asset management fees range from 1% to 5% of collected rents and the applicable contracts are cancelable with 30 days’ notice. Asset management fee income from non-consolidated entities amounted to approximately $902,000, $928,000, and $867,000 for the years ended December 31, 2009, 2008 and 2007, respectively.
The Company typically makes an acquisition loan (“Acquisition Loans”) to each Sponsored REIT which is secured by a mortgage on the borrower’s real estate. These loans enable Sponsored REITs to acquire their respective properties prior to the consummation of the offerings of their equity interests. The Company anticipates that each Acquisition Loan will be repaid at maturity or earlier from the proceeds of the Sponsored REIT’s equity offering. Each Acquisition Loan has a term of two years and bears interest at the same rate paid by FSP Corp. for borrowings under the Revolver. The Company had one Acquisition Loan outstanding for the syndication of FSP Centre Pointe V Corp., and one Acquisition Loan outstanding for the syndication of FSP Grand Boulevard Corp. as of December 31, 2009 and 2008, respectively. The Acquisition Loan for FSP Grand Boulevard Corp. was repaid on May 29, 2009. Acquisition Loans are classified as assets held for syndication.
From time-to-time the Company may also make secured loans (“Sponsored REIT Loans”) to Sponsored REITs to fund construction costs, capital expenditures, leasing costs and other purposes. Since December 2007, the Company has provided Sponsored REIT Loans in the form of revolving lines of credit to five Sponsored REITs, or to wholly-owned subsidiaries of those Sponsored REITs, and a construction loan to one wholly-owned subsidiary of another Sponsored REIT. The Company anticipates that each Sponsored REIT Loan will be repaid at maturity or earlier from long term financings of the underlying properties, cash flows from the underlying properties or some other capital event. Each Sponsored REIT Loan is secured by a mortgage on the underlying property and has a term of approximately two to three years. Advances under each Sponsored REIT Loan bear interest at a rate equal to the 30-day LIBOR rate plus an agreed upon amount of basis points and most advances also require a 50 basis point draw fee. The Company received a $210,000 loan commitment fee at the time of the closing of the Sponsored REIT Loan that is structured as a construction loan.
The following is a summary of the Sponsored REIT Loans outstanding as of December 31, 2009:
| (dollars in 000's) | | | Maximum | | | Amount | | | | | | | Rate in | |
| | Maturity | | Amount | | | Drawn at | | | Interest | | Draw | | Effect at | |
| Sponsored REIT | Date | | of Loan | | | 31-Dec-09 | | | Rate (1) | | Fee (2) | | 31-Dec-09 | |
| Revolving lines of credit | | | | | | | | | | | | | | |
| FSP Highland Place I Corp. | 31-Dec-10 | | $ | 5,500 | | | $ | 1,125 | | | L+2% | | n/a | | 2.24% | |
| FSP Satellite Place Corp. | 31-Mar-12 | | | 5,500 | | | | 1,902 | | | L+3% | | 0.5% | | 3.24% | |
| FSP 1441 Main Street Corp.(a) | 31-Mar-12 | | | 10,800 | | | | 5,000 | | | L+3% | | 0.5% | | 3.24% | |
| FSP 505 Waterford Corp. | 30-Nov-11 | | | 7,000 | | | | - | | | L+3% | | 0.5% | | | |
| FSP Phoenix Tower Corp. (b) | 30-Nov-11 | | | 15,000 | | | | 3,600 | | | L+3% | | 0.5% | | 3.24% | |
| | | | | | | | | | | | | | | | | |
| Construction loan | | | | | | | | | | | | | | | | |
| FSP 385 Interlocken | | | | | | | | | | | | | | | | |
| Development Corp. (c) (d) | 30-Apr-12 | | | 42,000 | | | | 24,908 | | | L+3% | | n/a | | 3.24% | |
| | | | $ | 85,800 | | | $ | 36,535 | | | | | | | | |
| (1) The interest rate is 30-Day LIBOR rate plus the additional rate indicated |
| (2) The draw fee is a percentage of each new advance, and is paid at the time of each new draw |
| |
| (a) The borrower is FSP 1441 Main Street LLC, a wholly-owned subsidiary |
| (b) The borrower is FSP Phoenix Tower Limited Partnership, a wholly-owned subsidiary |
| (c) The borrower is FSP 385 Interlocken LLC, a wholly-owned subsidiary |
| (d) The borrower paid a commitment fee of $210,000 at loan origination |
Franklin Street Properties Corp.
Notes to the Consolidated Financial Statements
4. Related Party Transactions (continued)
The Company recognized interest income and fees from the Sponsored REIT Loans of approximately $838,000, $811,000, and $6,163,000 for the years ended December 31, 2009, 2008 and 2007, respectively, relating to these loans.
5. Bank note payable and term note payable
As of December 31, 2009 the Company has a bank note payable, which is an unsecured revolving line of credit (the “Revolver”) for advances up to $250 million that matures on August 11, 2011, and a term note payable, which is an unsecured term loan (the “Term Loan”) of $75 million that matures in October 2011 with two one-year extensions available at the Company’s election. The Revolver and the Term Loan are with a group of banks.
The Revolver and Term Loan include restrictions on property liens and require compliance with various financial covenants. Financial covenants include the maintenance of at least $1,500,000 in operating cash accounts, a minimum unencumbered cash and liquid investments balance and tangible net worth; limitations on permitted secured debt and compliance with various debt and operating income ratios, as defined in the loan agreement. The Company was in compliance with the Revolver and Term Loan financial covenants as of December 31, 2009 and 2008, respectively.
Revolver
The Company’s Revolver is an unsecured revolving line of credit with a group of banks that provides for borrowings at our election of up to $250,000,000. The Revolver matures on August 11, 2011. Borrowings under the Revolver bear interest at either the bank's prime rate (3.25% at December 31, 2009) or a rate equal to LIBOR plus 100 basis points (1.23% at December 31, 2009). There were borrowings of $109,008,000 and $67,468,000 at the LIBOR plus 100 basis point rate at a weighted average rate of 1.23% and 2.39% outstanding under the Revolver at December 31, 2009 and 2008, respectively. The weighted average interest rate on amounts outstanding during 2009 and 2008 was approximately 1.34% and 3.61%, respectively.
The Company has drawn on the Revolver and intends to draw on the Revolver in the future for a variety of corporate purposes, including the funding of interim mortgage loans to Sponsored REITs and the acquisition of properties that it acquires directly for its portfolio. The Company typically causes mortgage loans to Sponsored REITs to be secured by a first mortgage against the real property owned by the Sponsored REIT. The Company makes these loans to enable a Sponsored REIT to acquire real property prior to the consummation of the offering of its equity interests, and the loan is repaid out of the offering proceeds. The Company also may make secured loans to Sponsored REITs for the purpose of funding capital expenditures, costs of leasing or for other purposes which would be repaid from long-term financing of the property, cash flows from the property or a capital event.
Term Loan
The Company also has a $75 million unsecured Term Loan with three banks. Proceeds from the Term Loan were used to reduce the outstanding principal balance on the Revolver. The Term Loan has an initial three-year term that matures on October 15, 2011. In addition, the Company has the right to extend the Term Loan’s initial maturity date for up to two successive one-year periods, or until October 15, 2013 if both extensions are exercised. The Term Loan has an interest rate option equal to LIBOR (subject to a 2% floor) plus 200 basis points and a requirement that the Company fix the interest rate for the initial three-year term of the Term Loan pursuant to an interest rate swap agreement which the Company did at an interest rate of 5.84% per annum pursuant to an interest rate swap agreement.
The principal repayments in subsequent years succeeding December 31, 2009 are as follows:
| (in thousands) | | Year ended
December 31, | |
| | | | |
| 2010 | | $ | 150 | |
| 2011 | | | 183,858 | |
| | | $ | 184,008 | |
Franklin Street Properties Corp.
Notes to the Consolidated Financial Statements
6. Financial Instruments: Derivatives and Hedging
On October 15, 2008, the Company fixed the interest rate for the initial three-year term of the Term Loan at 5.84% per annum pursuant to an interest rate swap agreement. The variable rate that was fixed under the interest rate swap agreement is described in Note 5.
The interest swap agreement qualifies as a cash flow hedge and has been recognized on the consolidated balance sheet at fair value. If a derivative qualifies as a hedge, depending on the nature of the hedge, changes in the fair value of the derivative will either be offset against the change in fair value of the hedged asset, liability, or firm commitment through earnings, or recognized in other comprehensive income until the hedged item is recognized in earnings. The ineffective portion of a derivative’s change in fair value will be immediately recognized in earnings, which may increase or decrease reported net income and stockholders’ equity prospectively, depending on future levels of interest rates and other variables affecting the fair values of derivative instruments and hedged items, but will have no effect on cash flows.
The following table summarizes the notional and fair value of our derivative financial instrument at December 31, 2009. The notional value is an indication of the extent of our involvement in these instruments at that time, but does not represent exposure to credit, interest rate or market risks (in thousands).
| | | Notional Value | | | Strike Rate | | | Effective Date | | | Expiration Date | | | Fair Value | |
| | | | | | | | | | | | | | | | |
| Interest Rate Swap | | $ | 75,000 | | | 5.840% | | | 10/2008 | | | 10/2011 | | | $ | (2,076 | ) |
| | | | | | | | | | | | | | | | | | |
On December 31, 2009, the derivative instrument was reported as an obligation at its fair value of approximately $2.1 million. This is included in other liabilities: derivative termination value on the consolidated balance sheet at December 31, 2009. Offsetting adjustments are represented as deferred gains or losses in accumulated other comprehensive income of $1.0 million.
Over time, the unrealized gains and losses held in accumulated other comprehensive income will be reclassified into earnings as a reduction to interest expense in the same periods in which the hedged interest payments affect earnings. We estimate that approximately $1.1 million of the current balance held in accumulated other comprehensive income will be reclassified into earnings within the next 12 months.
We are hedging exposure to variability in future cash flows for forecasted transactions in addition to anticipated future interest payments on existing debt.
7. Stockholders’ Equity
Equity-Based Compensation
On May 20, 2002, the stockholders of the Company approved the 2002 Stock Incentive Plan (the "Plan"). The Plan is an equity-based incentive compensation plan, and provides for the grants of up to a maximum of 2,000,000 shares of the Company's common stock ("Awards"). All of the Company's employees, officers, directors, consultants and advisors are eligible to be granted awards. Awards under the Plan are made at the discretion of the Company's Board of Directors, and have no vesting requirements. Upon granting an Award, the Company will recognize compensation cost equal to the fair value of the Company's common stock, as determined by the Company's Board of Directors, on the date of the grant.
The Company has not issued any shares under the Plan since 2005, and there are currently 1,944,428 shares available for grant under the Plan.
Repurchase of Common Shares
On October 28, 2005, the Board of Directors of the Company authorized the repurchase of up to $35 million, over a two year period, of the Company’s common stock from time to time on the open market or in privately negotiated transactions. The Company subsequently repurchased approximately 732,000 shares of common stock during the fourth quarter of 2005 at an aggregate cost of $13,992,000 at an average cost of $19.14 per share.
Franklin Street Properties Corp.
Notes to the Consolidated Financial Statements
7. Stockholders’ Equity (continued)
On September 10, 2007, FSP Corp. announced that the Board of Directors of FSP Corp. had authorized certain modifications to the Company’s October 28, 2005 common stock repurchase plan, including authorization to repurchase of up to $50 million of the Company’s common stock (inclusive of all repurchases made pursuant to the October 28, 2005 plan) from time to time in the open market or in privately negotiated transactions. The repurchase authorization expires at the earlier of (i) November 1, 2009 or (ii) a determination by the Board of Directors of FSP Corp. to discontinue repurchases. The Company subsequently repurchased approximately 286,000 shares of common stock during the third quarter of 2007 at an aggregate cost of $4,767,000 at an average cost of $16.69 per share. The excess of the purchase price over the par value of the shares repurchased is applied to reduce additional paid-in capital. There were no repurchases during 2008 or 2009 and the common stock repurchase plan expired on November 1, 2009.
A summary of the repurchase of common shares by the Company is shown in the following table:
| (Dollars in thousands) | | | | | | |
| | | Shares | | | Cost | |
| Balance December 31, 2006 | | | 731,898 | | | $ | 14,008 | |
| Repurchase of shares | | | 285,600 | | | | 4,767 | |
| Balance December 31, 2007 and 2008 | | | 1,017,498 | | | $ | 18,775 | |
Accumulated Other Comprehensive Income or Loss
The table below sets forth activity in the accumulated other comprehensive loss component of stockholders’ equity and reconciles net income to total comprehensive income for the years ended December 31, 2009 and 2008. There were no other comprehensive income or loss components for the year ended December 31, 2007.
| Accumulated other comprehensive loss | | | | | | |
| (in thousands) | | 2009 | | | 2008 | |
| | | | | | | |
| Beginning balance | | $ | (3,099 | ) | | $ | - | |
| Unrealized income (loss) on derivative | | | 1,023 | | | | (3,099 | ) |
| Ending balance | | $ | (2,076 | ) | | $ | (3,099 | ) |
| | | | | | | | | |
| Total comprehensive income | | | | | | | | |
| | | | | | | | | |
| (in thousands) | | | 2009 | | | | 2008 | |
| | | | | | | | | |
| Net income | | $ | 27,872 | | | $ | 31,959 | |
| Unrealized loss on derivative | | | 1,023 | | | | (3,099 | ) |
| Total comprehensive income | | $ | 28,895 | | | $ | 28,860 | |
8. Federal Income Tax Reporting
General
The Company has elected to be taxed as a REIT under the Internal Revenue Code of 1986, as amended (the "Code"). As a REIT, the Company generally is entitled to a tax deduction for distributions paid to its shareholders, thereby effectively subjecting the distributed net income of the Company to taxation at the shareholder level only. The Company must comply with a variety of restrictions to maintain its status as a REIT. These restrictions include the type of income it can earn, the type of assets it can hold, the number of shareholders it can have and the concentration of their ownership, and the amount of the Company’s taxable income that must be distributed annually.
Franklin Street Properties Corp.
Notes to the Consolidated Financial Statements
8. Federal Income Tax Reporting (continued)
One such restriction is that the Company generally cannot own more than 10% of the voting power or value of the securities of any one issuer unless the issuer is itself a REIT or a taxable REIT subsidiary (“TRS”). In the case of TRSs, the Company’s ownership of securities in all TRSs generally cannot exceed 20% prior to 2009 and 25% beginning in 2009 of the value of all of the Company’s assets and, when considered together with other non-real estate assets, cannot exceed 25% of the value of all of the Company’s assets. Effective January 1, 2002, a subsidiary of the Company, FSP Investments, became a TRS. As a result, FSP Investments, which is part of the Company’s investment banking/investment services segment, operates as a taxable corporation under the Code.
Income taxes are recorded based on the future tax effects of the difference between the tax and financial reporting bases of the Company’s assets and liabilities. In estimating future tax consequences, potential future events are considered except for potential changes in income tax law or in rates.
The Company adopted an accounting pronouncement related to uncertainty in income taxes effective January 1, 2007, which did not result in recording a liability, nor was any accrued interest and penalties recognized with the adoption. Accrued interest and penalties will be recorded as income tax expense, if the Company records a liability in the future. The Company’s effective tax rate was not affected by the adoption. The Company and one or more of its subsidiaries files income tax returns in the U.S federal jurisdiction and various state jurisdictions. The statute of limitations for the Company’s income tax returns is generally three years and as such, the Company’s returns that remain subject to examination would be primarily from 2006 and thereafter.
Net operating losses
Section 382 of the Code restricts a corporation's ability to use net operating losses (“NOLs") to offset future taxable income following certain "ownership changes." Such ownership changes occurred with past mergers and accordingly a portion of the NOLs incurred by the Sponsored REITs available for use by the Company in any particular future taxable year will be limited. To the extent that the Company does not utilize the full amount of the annual NOLs limit, the unused amount may be carried forward to offset taxable income in future years. NOLs expire 20 years after the year in which they arise, and the last of the Company’s NOLs will expire in 2027. A valuation allowance is provided for the full amount of the NOLs as the realization of any tax benefits from such NOLs is not assured. In 2006, the Company used $3,722,000 of NOLs in connection with its 2005 tax return. The gross amount of NOLs available to the Company were $13,041,000, $13,041,000, and $12,376,000 as of December 31, 2009, 2008 and 2007, respectively.
Tax Rates
The income tax expense reflected in the consolidated statements of income relates only to the TRS. The expense differs from the amounts computed by applying the Federal statutory rate to income before taxes as follows:
| | | For the years ended December 31, | |
| (Dollars in thousands) | | 2009 | | | 2008 | | | 2007 | |
| | | | | | | | | | | | | | | | | | | |
| Federal income tax at statutory rate | | $ | (821 | ) | | | 34.0 | % | | $ | (736 | ) | | | 34.0 | % | | $ | 546 | | | | 34.0 | % |
| Increase (decrease) in taxes resulting from: | | | | | | | | | | | | | | | | | | | | | | | | |
| State income taxes, net of federal impact | | | (159 | ) | | | 6.3 | % | | | (136 | ) | | | 6.3 | % | | | 101 | | | | 6.3 | % |
| Valuation allowance on state tax credit | | | 159 | | | | n/a | | | | 136 | | | | n/a | | | | | | | | | |
| Revised Texas franchise tax | | | 242 | | | | n/a | | | | 246 | | | | n/a | | | | 226 | | | | n/a | |
| Taxes on income | | $ | (579 | ) | | | 40.3 | % | | $ | (490 | ) | | | 40.3 | % | | $ | 873 | | | | 40.3 | % |
Taxes on income are a current tax expense. No deferred income taxes were provided as there were no material temporary differences between the financial reporting basis and the tax basis of the TRS. FSP Investments has approximately an $821,000 and $736,000 federal tax benefit arising from losses in 2009 and 2008, respectively. The 2009 loss should be fully utilized by carrying the loss back to the tax years 2004 and 2005. The 2008 loss was utilized by carrying that loss back to tax years 2006 and 2007. A valuation allowance of approximately $159,000 and $136,000 was recorded to reduce the tax benefit from the 2009 and 2008 loss from FSP Investments due to recent tax legislation in Massachusetts that will most likely hinder the ability to use the loss carry-forwards.
Franklin Street Properties Corp.
Notes to the Consolidated Financial Statements
8. Federal Income Tax Reporting (continued)
In May 2006, the State of Texas enacted a new business tax (the “Revised Texas Franchise Tax”) that replaced its existing franchise tax which the Company became subject to. The Revised Texas Franchise Tax is a tax at a rate of approximately 0.7% of revenues at Texas properties commencing with 2007 revenues. Some of the Company’s leases allow reimbursement by tenants for these amounts because the Revised Texas Franchise Tax replaces a portion of the property tax for school districts. Because the tax base on the Revised Texas Franchise Tax is derived from an income based measure it is considered an income tax. The Company recorded a provision in income taxes on its income statement of $242,000, $246,000 and $226,000 for the years ended December 31, 2009, 2008 and 2007, respectively.
At December 31, 2009 and 2008, the Company’s net tax basis of its real estate assets is less than the amount set forth in the Company’s consolidated balance sheets by $54,629,000 and $87,877,000, respectively.
Reconciliation Between GAAP Net Income and Taxable Income
The following reconciles book net income to taxable income for the years ended December 31, 2009, 2008 and 2007.
| | | For the year ended December 31, | |
| (in thousands) | | 2009 | | | 2008 | | | 2007 | |
| | | | | | | | | | |
| Net income per books | | $ | 27,872 | | | $ | 31,959 | | | $ | 61,085 | |
| Adjustments to book income: | | | | | | | | | | | | |
| Book depreciation and amortization | | | 39,652 | | | | 34,643 | | | | 35,474 | |
| Tax depreciation and amortization | | | (25,057 | ) | | | (21,426 | ) | | | (21,236 | ) |
| Tax basis less book basis of properties sold, net | | | - | | | | - | | | | 5,622 | |
| Straight line rent adjustment, net | | | (1,879 | ) | | | (1,406 | ) | | | (3,126 | ) |
| Deferred rent, net | | | 34 | | | | 88 | | | | (26 | ) |
| Non-taxable distributions | | | (2,435 | ) | | | (1,075 | ) | | | (107 | ) |
| Other, net | | | 5,445 | | | | 4,526 | | | | 1,453 | |
| Taxable income | | | 43,632 | | | | 47,309 | | | | 79,139 | |
| Less: Capital gains recognized | | | (55 | ) | | | (1,031 | ) | | | (30,835 | ) |
| Taxable income subject to distribution requirement | | $ | 43,577 | | | $ | 46,278 | | | $ | 48,304 | |
Tax Components
The following summarizes the tax components of the Company’s common distributions paid per share for the years ended December 31, 2009, 2008 and 2007:
| | 2009 | | 2008 | | 2007 |
| | Per Share | | % | | Per Share | | % | | Per Share | | % |
| Ordinary income | $ 0.61 | | 80.56% | | $ 0.67 | | 66.98% | | $ 0.81 | | 65.24% |
| Qualified dividends | - | | - | | - | | - | | - | | - |
| Capital gain (1) | 0.00 | | 0.10% | | 0.01 | | 1.46% | | 0.43 | | 34.76% |
| Return of capital | 0.15 | | 19.34% | | 0.32 | | 31.56% | | - | | - |
| | | | | | | | | | | | |
| Total | $ 0.76 | | 100% | | $ 1.00 | | 100% | | $ 1.24 | | 100% |
| | (1) | For 2009, the 0.10% is taxed at 15%. For 2008, the 1.46% is taxed at 15%. For 2007, the 34.76% consists of 26.58% and 8.18% taxed at 15% and 25%, respectively. |
Franklin Street Properties Corp.
Notes to the Consolidated Financial Statements
9. Commitments
The Company's commercial real estate operations include the leasing of office buildings and industrial properties subject to leases with terms greater than one year. The leases expire at various dates through 2020. The following is a schedule of approximate future minimum rental income on non-cancelable operating leases as of December 31, 2009:
| (in thousands) | Year ended
December 31, | |
| | | |
| 2010 | $ | 86,942 | |
| 2011 | | 75,641 | |
| 2012 | | 65,286 | |
| 2013 | | 59,248 | |
| 2014 | | 54,501 | |
| Thereafter (2015-2022) | | 115,243 | |
| | $ | 456,861 | |
The Company leases its corporate office space under an operating lease that was amended in 2007 and has a three-year renewal option. The lease includes a base annual rent and additional rent for the Company's share of taxes and operating costs and expires in 2010. Future minimum lease payments are as follows:
| (in thousands) | Year ended
December 31, | |
| 2010 | $ | 196 | |
| | $ | 196 | |
Rent expense was approximately $353,000, $339,000 and $284,000 for the years ended December 31, 2009, 2008 and 2007, respectively, and is included in selling, general and administration expenses in the consolidated statements of income.
The Company has entered into the Sponsored REIT Loans described in Note 4, which provide for up to $85.8 million in borrowings of which $36.5 million have been drawn and is outstanding. The Company anticipates that any advances made will be repaid at their maturity or earlier from long term financing of the underlying properties, cash flows of the underlying properties or some other capital events.
10. Retirement Plan
In 2006, the Company established a 401(k) plan to cover eligible employees, which permits deferral of up to $16,500 per year (indexed for inflation) into the 401(k) plan, subject to certain limitations imposed by the Internal Revenue Code. An employee’s elective deferrals are immediately vested upon contribution to the 401(k) plan. The Company matches employee contributions to the 401(k) plan dollar for dollar up to 3% of each employee’s annual compensation up to $200,000. In addition, we may elect to make an annual discretionary profit-sharing contribution. The Company’s total contribution under the 401(k) plan amounted to $115,000, $115,000 and $138,000 for the years ended December 31, 2009, 2008 and 2007, respectively.
11. Discontinued Operations
During 2006, the Company reached an agreement to sell a commercial property, located in Greenville, South Carolina, which sold on January 31, 2007. In May 2007, the Company reached an agreement to sell a property located in Westford, Massachusetts, which sold on July 16, 2007. During June 2007, the Company sold a property located in Alpharetta, Georgia at a gain and a property located in San Diego, California. During December 2007, the Company sold a property located in Austin, Texas.
Franklin Street Properties Corp.
Notes to the Consolidated Financial Statements
11. Discontinued Operations (continued)
Accordingly, all of the properties sold were classified as discontinued operations on our financial statements for the year ended December 31, 2007. Income from discontinued operations of the sold properties was approximately $1.2 million for the year ended December 31, 2007. For the year ended December 31, 2007, the Company reported a $23.8 million gain on sale of properties. There was no property sales during the year ended December 31, 2008. The Company recognized a gain on a small piece of land as a result of a land taking of approximately $424,000 during the year ended December 31, 2009.
During the year ended December 31, 2007, gains on sales of properties are summarized below:
| (in thousands) | | | | | Net | | | | |
| | City/ | Property | Date of | | Sales | | | | |
| Property Address | State | Type | Sale | | Proceeds | | | Gain | |
| | | | | | | | | | |
| 33 & 37 Villa Road | Greenville, SC | Office | January 31, 2007 | | $ | 5,830 | | | $ | - | |
| 11680 Great Oaks Way | Alpharetta, GA | Office | June 21, 2007 | | | 32,535 | | | | 6,601 | |
| 17030 Goldentop Road | San Diego, CA | Office | June 27, 2007 | | | 36,199 | | | | 14,741 | |
| 10 Lyberty Way | Westford, MA | Office | July 16, 2007 | | | 10,861 | | | | 1,942 | |
| 11211 Taylor Draper Lane | Austin, TX | Office | December 20, 2007 | | | 10,429 | | | | 257 | |
| Settlement of escrows on | | | | | | | | | | | |
| prior property sales | | | | | | 248 | | | | 248 | |
| Net Sales Proceeds and Gain | | | | | | | | | | | |
| on sales of real estate | | | | | $ | 96,102 | | | $ | 23,789 | |
The operating results for the real estate assets sold are summarized below.
| | For the
Year Ended | |
| (in thousands) | December 31, | |
| | 2007 | |
| Rental revenue | $ | 4,284 | |
| Rental operating expenses | | (1,248 | ) |
| Real estate taxes and insurance | | (662 | ) |
| Depreciation and amortization | | (1,192 | ) |
| Interest income | | 8 | |
| Net income from discontinued operations | $ | 1,190 | |
12. Subsequent Events
On January 15, 2010, the Board of Directors of the Company declared a cash distribution of $0.19 per share of common stock payable on February 19, 2010 to stockholders of record on January 29, 2010.
The Company has evaluated all subsequent events through February 23, 2010, the date of issuance of these consolidated financial statements, for potential recognition or disclosure.
Franklin Street Properties Corp.
Notes to the Consolidated Financial Statements
13. Selected Unaudited Quarterly Information
Selected unaudited quarterly information is shown in the following table:
| | | 2009 | |
| | | First | | | Second | | | Third | | | Fourth | |
| | Quarter | | | Quarter | | | Quarter | | | Quarter | |
| | | (in thousands, except per share data) | |
| | | | | | | | | | | | | |
| Revenue | | $ | 30,419 | | | $ | 30,132 | | | $ | 32,092 | | | $ | 35,740 | |
| | | | | | | | | | | | | | | | | |
| Income from continuing operations | | $ | 7,808 | | | $ | 4,865 | | | $ | 6,941 | | | $ | 7,834 | |
| Gain on sale of properties | | | - | | | | - | | | | - | | | | 424 | |
| Net income | | $ | 7,808 | | | $ | 4,865 | | | $ | 6,941 | | | $ | 8,258 | |
| | | | | | | | | | | | | | | | | |
| Basic and diluted net income per share | | $ | 0.11 | | | $ | 0.07 | | | $ | 0.10 | | | $ | 0.10 | |
| | | | | | | | | | | | | | | | | |
| Weighted average number of shares outstanding | | | 70,481 | | | | 70,481 | | | | 71,281 | | | | 79,681 | |
| | | 2008 | |
| | | First | | | Second | | | Third | | | Fourth | |
| | Quarter | | | Quarter | | | Quarter | | | Quarter | |
| | | (in thousands, except per share data) | |
| | | | | | | | | | | | | |
| Revenue | | $ | 27,610 | | | $ | 34,537 | | | $ | 28,924 | | | $ | 29,345 | |
| | | | | | | | | | | | | | | | | |
| Income from continuing operations | | $ | 7,386 | | | $ | 10,535 | | | $ | 7,419 | | | $ | 6,619 | |
| Net income | | $ | 7,386 | | | $ | 10,535 | | | $ | 7,419 | | | $ | 6,619 | |
| | | | | | | | | | | | | | | | | |
| Basic and diluted net income per share | | $ | 0.10 | | | $ | 0.15 | | | $ | 0.11 | | | $ | 0.09 | |
| | | | | | | | | | | | | | | | | |
| Weighted average number of shares outstanding | | | 70,481 | | | | 70,481 | | | | 70,481 | | | | 70,481 | |
Schedule II
Franklin Street Properties Corp.
Valuation and qualifying accounts:
| (in thousands) | | | | | Additions | | | | | | | | | | |
| | | | | | (Decreases) | | | | | | | | | | |
| | | Balance at | | | charged to | | | | | | | | | Balance | |
| | | beginning | | | costs and | | | | | | | | | at end | |
| Classification | | of year | | | expenses | | | Deductions | | | Other | | | of year | |
| | | | | | | | | | | | | | | | |
| Allowance for doubtful accounts | | | | | | | | | | | | | | | |
| 2007 | | $ | 433 | | | $ | - | | | $ | (3 | ) | | $ | - | | | $ | 430 | |
| 2008 | | | 430 | | | | 79 | | | | - | | | | - | | | | 509 | |
| 2009 | | | 509 | | | | 131 | | | | (20 | ) | | | - | | | | 620 | |
| | | | | | | | | | | | | | | | | | | | | |
| Straight-line rent allowance | | | | | | | | | | | | | | | | | | | | |
| for doubtful accounts | | | | | | | | | | | | | | | | | | | | |
| 2007 | | $ | 163 | | | $ | 98 | | | $ | - | | | $ | - | | | $ | 261 | |
| 2008 | | | 261 | | | | - | | | | - | | | | - | | | | 261 | |
| 2009 | | | 261 | | | | (62 | ) | | | (99 | ) | | | - | | | | 100 | |
SCHEDULE III
FRANKLIN STREET PROPERTIES CORP.
REAL ESTATE AND ACCUMULATED DEPRECIATION
December 31, 2009
| | | | | | Initial Cost | | | Historical Cost | | | | | | | | | | |
| Description | | Encumbrances (1) | | | Land | | | Buildings Improvements and Equipment | | | Costs Capitalized (Disposals) Subsequent to Acquisition | | | Land | | | Buildings Improvements and Equipment | | | Total (2) | | | Accumulated Depreciation | | | Total Costs, Net of Accumulated Depreciation | | | Depreciable Life Years | | | Year Built | | | Date of Acquisition (3) | |
| | | | | | (in thousands) | | | | | | | | | | |
| Commercial Properties: | | | | | | | | | | | | | | | | | | | | | | | | | | | | | | | | | | | | |
| Park Seneca, Charlotte, NC | | — | | | $ | 1,815 | | | $ | 7,917 | | | $ | 493 | | | $ | 1,812 | | | $ | 8,413 | | | $ | 10,225 | | | $ | 2,540 | | | $ | 7,685 | | | 5-39 | | | 1969 | | | 1997 | |
| Hillview Center, Milpitas, CA | | — | | | | 2,203 | | | | 2,813 | | | | 7 | | | | 2,203 | | | | 2,820 | | | | 5,023 | | | | 778 | | | | 4,245 | | | 5-39 | | | 1984 | | | 1999 | |
| Southfield Centre, Southfield, MI | | — | | | | 4,344 | | | | 11,455 | | | | 2,446 | | | | 4,344 | | | | 13,901 | | | | 18,245 | | | | 3,377 | | | | 14,868 | | | 5-39 | | | 1977 | | | 1999 | |
| Bollman Place, Savage, MD | | — | | | | 1,585 | | | | 4,121 | | | | 420 | | | | 1,585 | | | | 4,541 | | | | 6,126 | | | | 1,099 | | | | 5,027 | | | 5-39 | | | 1984 | | | 1999 | |
| Forest Park, Charlotte, NC | | — | | | | 1,559 | | | | 5,672 | | | | 170 | | | | 1,559 | | | | 5,842 | | | | 7,401 | | | | 991 | | | | 6,410 | | | 5-39 | | | 1999 | | | 1999 | |
| Centennial Center, Colorado Springs, CO | | — | | | | 1,549 | | | | 11,877 | | | | 1,080 | | | | 1,549 | | | | 12,957 | | | | 14,506 | | | | 2,594 | | | | 11,912 | | | 5-39 | | | 1999 | | | 2000 | |
| Meadow Point, Chantilly, VA | | — | | | | 2,634 | | | | 18,911 | | | | 742 | | | | 2,634 | | | | 19,653 | | | | 22,287 | | | | 3,192 | | | | 19,095 | | | 5-39 | | | 1999 | | | 2001 | |
| Timberlake, Chesterfield, MO | | — | | | | 2,984 | | | | 38,661 | | | | 2,308 | | | | 2,984 | | | | 40,969 | | | | 43,953 | | | | 7,589 | | | | 36,364 | | | 5-39 | | | 1999 | | | 2001 | |
| Northwest Point, Elk Grove Village, IL | | — | | | | 2,914 | | | | 26,295 | | | | 7,218 | | | | 2,914 | | | | 33,513 | | | | 36,427 | | | | 6,328 | | | | 30,099 | | | 5-39 | | | 1999 | | | 2001 | |
| Timberlake East, Chesterfield, MO | | — | | | | 2,626 | | | | 17,608 | | | | 2,002 | | | | 2,626 | | | | 19,610 | | | | 22,236 | | | | 3,661 | | | | 18,575 | | | 5-39 | | | 2000 | | | 2002 | |
| Park Ten, Houston, TX | | — | | | | 1,061 | | | | 21,303 | | | | 609 | | | | 569 | | | | 22,404 | | | | 22,973 | | | | 4,022 | | | | 18,951 | | | 5-39 | | | 1999 | | | 2002 | |
| Federal Way, Federal Way, WA | | — | | | | 2,518 | | | | 13,212 | | | | 1,512 | | | | 2,518 | | | | 14,724 | | | | 17,242 | | | | 2,496 | | | | 14,746 | | | 5-39 | | | 1982 | | | 2001 | |
| Addison, Addison, TX | | — | | | | 4,325 | | | | 48,040 | | | | 2,493 | | | | 4,325 | | | | 50,533 | | | | 54,858 | | | | 6,617 | | | | 48,241 | | | 5-39 | | | 1999 | | | 2002 | |
| Collins, Richardson, TX | | — | | | | 4,000 | | | | 42,598 | | | | 1,693 | | | | 4,000 | | | | 44,291 | | | | 48,291 | | | | 5,451 | | | | 42,840 | | | 5-39 | | | 1999 | | | 2003 | |
| Montague, San Jose, CA | | — | | | | 10,250 | | | | 5,254 | | | | 2,592 | | | | 10,250 | | | | 7,846 | | | | 18,096 | | | | 908 | | | | 17,188 | | | 5-39 | | | 1982 | | | 2002 | |
| Greenwood, Englewood, CO | | — | | | | 3,100 | | | | 30,201 | | | | 0 | | | | 3,100 | | | | 30,201 | | | | 33,301 | | | | 3,742 | | | | 29,559 | | | 5-39 | | | 2000 | | | 2005 | |
| River Crossing, Indianapolis, IN | | — | | | | 3,000 | | | | 36,926 | | | | 1,310 | | | | 3,000 | | | | 38,236 | | | | 41,236 | | | | 4,556 | | | | 36,680 | | | 5-39 | | | 1998 | | | 2005 | |
| Willow Bend, Plano, TX | | — | | | | 3,800 | | | | 14,842 | | | | 1,044 | | | | 3,800 | | | | 15,886 | | | | 19,686 | | | | 1,589 | | | | 18,097 | | | 5-39 | | | 1999 | | | 2000 | |
| Innsbrook, Glenn Allen, VA | | — | | | | 5,000 | | | | 40,216 | | | | 1,216 | | | | 5,000 | | | | 41,432 | | | | 46,432 | | | | 4,180 | | | | 42,252 | | | 5-39 | | | 1999 | | | 2003 | |
| 380 Interlocken, Bloomfield, CO | | — | | | | 8,275 | | | | 34,462 | | | | 4,602 | | | | 8,275 | | | | 39,064 | | | | 47,339 | | | | 4,073 | | | | 43,266 | | | 5-39 | | | 2000 | | | 2003 | |
| Blue Lagoon, Miami, FL | | — | | | | 6,306 | | | | 46,124 | | | | 8 | | | | 6,306 | | | | 46,132 | | | | 52,438 | | | | 4,337 | | | | 48,101 | | | 5-39 | | | 2002 | | | 2003 | |
| Eldridge Green, Houston, TX | | — | | | | 3,900 | | | | 43,791 | | | | 61 | | | | 3,900 | | | | 43,852 | | | | 47,752 | | | | 4,128 | | | | 43,624 | | | 5-39 | | | 1999 | | | 2004 | |
| Liberty Plaza, Addison, TX | | — | | | | 4,374 | | | | 21,146 | | | | 3,100 | | | | 4,374 | | | | 24,246 | | | | 28,620 | | | | 3,247 | | | | 25,373 | | | 5-39 | | | 1985 | | | 2006 | |
| One Overton, Atlanta, GA | | — | | | | 3,900 | | | | 77,229 | | | | 1,933 | | | | 3,900 | | | | 79,162 | | | | 83,062 | | | | 7,470 | | | | 75,592 | | | 5-39 | | | 2002 | | | 2006 | |
| FSP 390 Interlocken, Broomfield, CO | | — | | | | 7,013 | | | | 37,751 | | | | 1,960 | | | | 7,013 | | | | 39,711 | | | | 46,724 | | | | 3,476 | | | | 43,248 | | | 5-39 | | | 2002 | | | 2006 | |
| East Baltimore, Baltimore, MD | | — | | | | 4,600 | | | | 55,267 | | | | 405 | | | | 4,600 | | | | 55,672 | | | | 60,272 | | | | 3,683 | | | | 56,589 | | | 5-39 | | | 1989 | | | 2007 | |
| Park Ten II, Houston, TX | | — | | | | 1,300 | | | | 31,712 | | | | 74 | | | | 1,300 | | | | 31,786 | | | | 33,086 | | | | 1,366 | | | | 31,720 | | | 5-39 | | | 2006 | | | 2006 | |
| Lakeside Crossing, Maryland Heights, MO | | — | | | | 1,900 | | | | 16,192 | | | | 2 | | | | 1,900 | | | | 16,194 | | | | 18,094 | | | | 450 | | | | 17,644 | | | 5-39 | | | 2008 | | | 2008 | |
| Dulles Virginia, Sterling, VA | | — | | | | 4,813 | | | | 13,285 | | | | 0 | | | | 4,813 | | | | 13,285 | | | | 18,098 | | | | 342 | | | | 17,756 | | | 5-39 | | | 1999 | | | 2008 | |
| Stonecroft, Chantilly, VA | | — | | | | 2,102 | | | | 18,003 | | | | 0 | | | | 2,102 | | | | 18,003 | | | | 20,105 | | | | 231 | | | | 19,874 | | | 5-39 | | | 2008 | | | 2009 | |
| Eden Bluff, Eden Prairie, MN | | — | | | | 5,422 | | | | 9,294 | | | | 0 | | | | 5,422 | | | | 9,294 | | | | 14,716 | | | | 119 | | | | 14,597 | | | 5-39 | | | 2006 | | | 2009 | |
| Fairview, Falls Church, VA | | — | | | | 12,018 | | | | 50,167 | | | | (248 | ) | | | 11,770 | | | | 50,167 | | | | 61,937 | | | | 322 | | | | 61,615 | | | 5-39 | | | 2001 | | | 2009 | |
| Balance – Real Estate | | — | | | $ | 127,190 | | | $ | 852,345 | | | $ | 41,252 | | | $ | 126,447 | | | $ | 894,340 | | | $ | 1,020,787 | | | $ | 98,954 | | | $ | 921,833 | | | | | | | | | | |
| | (1) | There are no encumbrances on the above properties. |
| | (2) | The aggregate cost for Federal Income Tax purposes is $865,890 |
| | (3) | Original date of acquisition by Sponsored Entity. |
The following table summarizes the changes in the Company's real estate investments and accumulated depreciation:
| | December 31, | |
| (in thousands) | 2009 | | | 2008 | | | 2007 | |
| Real estate investments, at cost: | | | | | | | | |
| Balance, beginning of year | $ | 918,184 | | | $ | 842,379 | | | $ | 854,440 | |
| Acquisitions | | 97,006 | | | | 69,202 | | | | 59,867 | |
| Improvements | | 5,845 | | | | 6,603 | | | | 11,030 | |
| Dispositions | | (248 | ) | | | - | | | | (82,958 | ) |
| Balance, end of year | $ | 1,020,787 | | | $ | 918,184 | | | $ | 842,379 | |
| Accumulated depreciation: | | | | | | | | | | | |
| Balance, beginning of year | $ | 74,126 | | | $ | 52,060 | | | $ | 45,120 | |
| Depreciation | | 24,828 | | | | 22,066 | | | | 21,450 | |
| Dispositions | | - | | | | - | | | | (14,510 | ) |
| Balance, end of year | $ | 98,954 | | | $ | 74,126 | | | $ | 52,060 | |