Exhibit 99.2
 | | Presentation for REITWeek 2010 NAREIT’s Investor Forum® June 2010 |
Franklin Street Properties Corp. ● 401 Edgewater Place ● Wakefield, MA 01880 ● (781) 557-1300
www.franklinstreetproperties.com
| |  | Table of Contents |
| | Page | | | Page |
| Financial information & Safe Harbor Statement | 3 | | Total Return Comparisons | |
| Company Overview & Management Team | 4‐5 | | 2009 Total Return Comparisons | 20 |
| | | | 2008 Total Return Comparisons | 21 |
| FSP Profit Centers | 6 | | 2008‐2009 Total Return Comparisons | 22 |
| Sources of Income and Core FFO* Growth | 7 | | | |
| Historical Profit Perspectives | 8 | | | |
| Real Estate Management Philosophy | 9 | | Strategic Considerations | |
| Map: Geographically Diverse Portfolio | 10 | | Approach to Debt | 23 |
| Balanced Market Exposure | 11 | | Outstanding Balance Sheet & Liquidity | 24 |
| Occupancy in Owned Portfolio | 12 | | | |
| 20 Largest Tenants with Annualized Rent and Remaining Term | 13 | | FFO and FFO+GOS Reconciliations | 25 |
| Owned Portfolio Lease Expirations | 14 | | FFO and FFO+GOS Definitions | 26 |
| 20 Largest Tenants, Industry Profile | 15 | | | |
| | | |  | |
| Leasing and Real Estate | | |
| Lease Roll in 2010 | 16 | |
| Acquisition Targets | 17 | |
| | | |
| Investment Banking | | |
| Investment Banking Segment | 18 | |
| Gross Syndication Proceeds | 19 | |
| | | | |
| | | | |
| | | | |
| | | | |
| | | | |
| | | | |
| | | | |
| * | Please refer to page 25 for a reconciliation of GAAP net income to FFO and FFO+GOS and to page 26 for definitions of FFO and FFO+GOS and for information on the use of non-GAAP financial measures. |
Presentation for REITWeek 2010 NAREIT’s Investor Forum® June 2010 | 2 |
| | | Financial Information & Safe Harbor Statement |
Financial information
| | Unless otherwise indicated, all information contained in this presentation is as of March 31, 2010. This presentation contains references to Funds from Operations (“FFO”) and FFO plus Gains on Sales (“FFO+GOS”). Such measurements are not generally accepted accounting principles (“GAAP”). Please refer to page 25 for a reconciliation of GAAP net income to FFO and FFO+GOS and to page 26 for definitions of FFO and FFO+GOS and for information on the use of non-GAAP financial measures. Past financial performance is not a guarantee of future financial performance. Franklin Street Properties Corp. (“FSP”) assumes no obligation to update or revise the financial information contained in this presentation. |
Safe Harbor Statement
| | This presentation may contain forward-looking statements based on current judgments and current knowledge of management, which are subject to certain risks, trends and uncertainties that could cause actual results to differ materially from those indicated in such forward-looking statements. Accordingly, readers are cautioned not to place undue reliance on forward-looking statements. Investors are cautioned that our forward-looking statements involve risks and uncertainty including, without limitation, our continued qualification as a real estate investment trust, the ability to enter into new leases or renew existing leases on favorable terms, dependence on the financial condition of our tenants, changes in economic conditions in the markets in which we own properties, changes in the demand by investors for investment in our sponsored real estate investment trusts, risks of a lessening of demand for the types of real estate owned by us, changes in government regulations, expenditures that cannot be anticipated such as utility rate and usage increases, unanticipated repairs, additional staffing, insurance increases and real estate tax valuation reassessments. Readers are advised to refer to the “Risk Factors” section of our quarterly reports on Form 10-Q and our Annual Report on Form 10-K for additional information concerning these risks and uncertainties. Although we believe the expectations reflected in the forward looking statements are reasonable, we cannot guarantee future results, levels of activity, performance or achievements. We do not undertake a duty to update or revise any forward-looking statements contained in this presentation, whether as a result of new information, future events or otherwise. |
Presentation for REITWeek 2010 NAREIT’s Investor Forum® June 2010 | 3 |
| | | Company Overview |
Platform • Nationally focused office REIT • Integrated acquisition, financing and disposition capabilities • Investment banking franchise syndicates equity private placements for sponsored REITs • Asset manager of sponsored REITs Balance Sheet • Clean balance sheet with low leverage and no permanent long-term debt • Total market capitalization of approximately $1.15 billion (1) • Debt to total capitalization of approximately 14.5% (1)(2) | | Assets • Owns 32 properties totaling approximately 5.9 million sq. feet (1) • Manages 14 additional properties totaling approximately 4.4 million sq. feet (1)(3) • Focus on core suburban and select CBD markets • Investment in some sponsored REITs; no joint ventures History/Ownership • Listed shares and began trading on American Stock Exchange (now NYSE Amex) on June 2, 2005 • Raised $114.7 million in a public offering September 2009 • Institutional ownership of 57.0% (4) • Insider ownership of approximately 13.0% (5) |
| (2) | Calculated by dividing debt by debt plus total market capitalization at March 31, 2010. |
| (3) | Excludes property under construction in Broomfield, CO of approximately 285,000 sq. feet. |
| (4) | Per SNL Financial as of 3/31/2010. |
Presentation for REITWeek 2010 NAREIT’s Investor Forum® June 2010 | 4 |
| | | Management Team |
Presentation for REITWeek 2010 NAREIT’s Investor Forum® June 2010 | 5 |
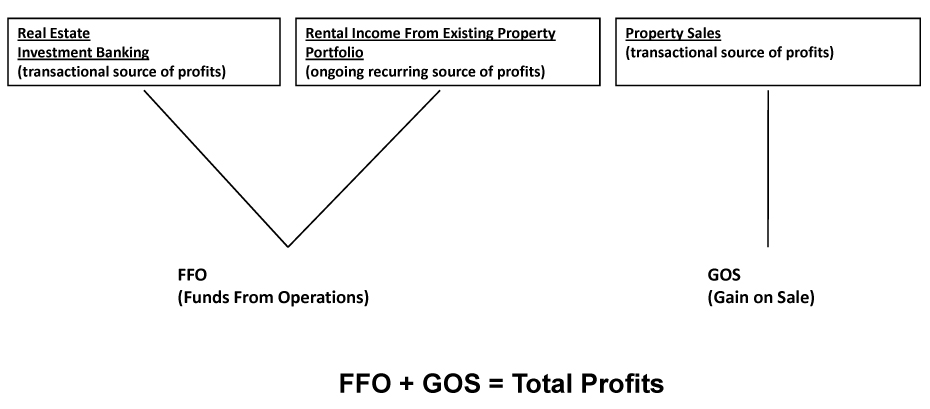
| | | FSP Profit Centers* |
| * | Please refer to page 25 for a reconciliation of GAAP net income to FFO and FFO+GOS and to page 26 for definitions of FFO and FFO+GOS and for information on the use of non-GAAP financial measures. |
Presentation for REITWeek 2010 NAREIT’s Investor Forum® June 2010 | 6 |
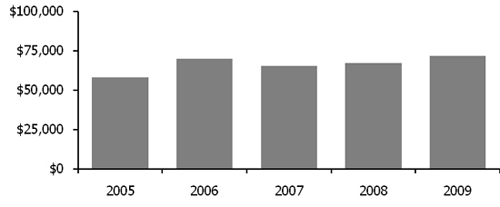
| | | Sources of Income and Core FFO* Growth ($ amounts in 000’s) |
Three Sources of Income
Core FFO* – CAGR 5.6%
*Core FFO excludes Investment Banking segment FFO and Gains on Sale. Please refer to page 25 for a reconciliation of GAAP net income to FFO and FFO+GOS and to page 26 for definitions of FFO and FFO+GOS.
Presentation for REITWeek 2010 NAREIT’s Investor Forum® June 2010 | 7 |
| | | Historical Profit Perspectives |
| (in 000's except per share data) | | Actual Results for the Year Ended | |
| | | 31-Dec-09 | | | 31-Dec-08 | | | 31-Dec-07 | | | 31-Dec-06 | | | 31-Dec-05 | |
| | | | | | | | | | | | | | | | |
| Total profits (or FFO+GOS*) | | $ | 71,783 | | | $ | 69,203 | | | $ | 98,838 | | | $ | 142,716 | | | $ | 97,155 | |
| | | | | | | | | | | | | | | | | | | | | |
| Weighted Average Shares | | | 73,001 | | | | 70,481 | | | | 70,651 | | | | 67,159 | | | | 56,847 | |
| | | | | | | | | | | | | | | | | | | | | |
| Total profits per Share | | $ | 0.98 | | | $ | 0.98 | | | $ | 1.40 | | | $ | 2.13 | | | $ | 1.71 | |
| | | | | | | | | | | | | | | | | | | | | |
| Distributions per Share | | | 0.76 | | | | 1.00 | | | | 1.24 | | | | 1.24 | | | | 1.24 | |
| | | | | | | | | | | | | | | | | | | | | |
| Total profits exceed distributions per Share by: | | $ | 0.22 | | | $ | (0.02 | ) | | $ | 0.16 | | | $ | 0.89 | | | $ | 0.47 | |
| | | | | | | | | | | | | | | | | | | | | |
| | | | | | | | | | | | | | | | | | | | | |
| % of Distributions to total profits | | | 77 | % | | | 102 | % | | | 89 | % | | | 58 | % | | | 73% | |
| | | | | | | | | | | | | | | | | | | | | |
| | | | | | | | | | | | | | | | | | | | | |
| Total profits per share consist of: | | | | | | | | | | | | | | | | | | | | |
| FFO* From: | | | | | | | | | | | | | | | | | | | | |
| Properties | | $ | 0.98 | | | $ | 0.95 | | | $ | 0.93 | | | $ | 1.05 | | | $ | 1.02 | |
| Investment Banking | | | - | | | | 0.03 | | | | 0.13 | | | | 0.17 | | | | 0.15 | |
| Combined | | | 0.98 | | | | 0.98 | | | | 1.06 | | | | 1.22 | | | | 1.17 | |
| GOS per Share | | | - | | | | - | | | | 0.34 | | | | 0.91 | | | | 0.54 | |
| Total profits | | $ | 0.98 | | | $ | 0.98 | | | $ | 1.40 | | | $ | 2.13 | | | $ | 1.71 | |
| * | Please refer to page 25 for a reconciliation of GAAP net income to FFO and FFO+GOS and to page 26 for definitions of FFO and FFO+GOS and for information on the use of non-GAAP financial measures. |
Presentation for REITWeek 2010 NAREIT’s Investor Forum® June 2010 | 8 |
| | | Real Estate Management Philosophy |
| | • | Invest in exceptional long-term performance potential properties at value prices |
| | – | Markets that we know from current or prior experience |
| | – | Attract high caliber tenants and manage tenant-landlord relationships well for long-term common value |
| | – | Targeted capital improvements to keep property relevant for targeted market |
| | • | Unlevered returns have less downside risk |
| | – | We minimize use of leverage |
| | – | Achieve meaningful unlevered return on investment by taking advantage of natural cyclical acquisitions and dispositions |
| | • | Track record of selling assets to recycle capital into higher return investments |
| | • | Sell at the appropriate time: |
| | – | Exit overheated markets where price substantially exceeds replacement cost and underwriting standards have become too aggressive |
| | – | Size / age considerations |
| | • | Realize / maximize return on investment life cycle/IRR |
| | – | Very low leverage/capital risk profile maintained while continuing broad-based positioning of new and existing property assets for the next commercial property cyclical upturn |
| | – | Increased square footage owned by 56% and under management by 59% between 12/31/05 and 12/31/09 |
| | – | Market equity capitalization at 3/31/10 was $1.15 Billion |
Presentation for REITWeek 2010 NAREIT’s Investor Forum® June 2010 | 9 |
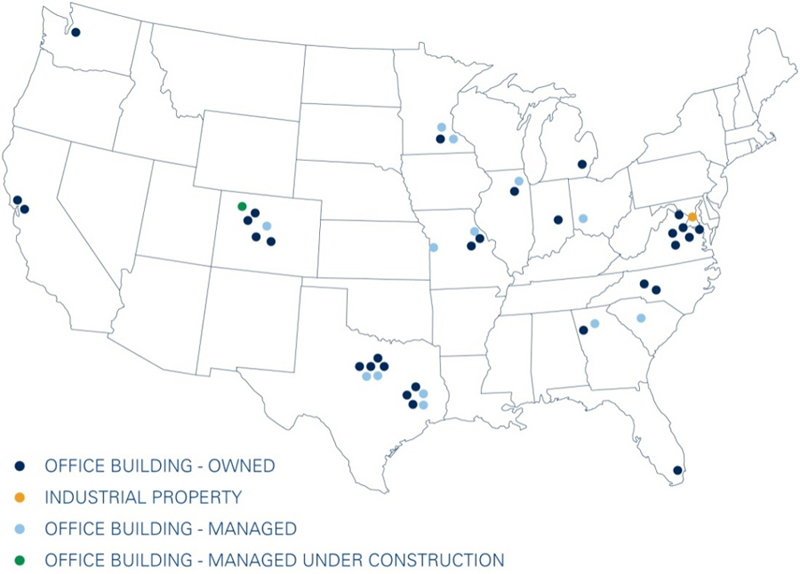
| | | Map: Geographically Diverse Portfolio As of March 31, 2010 |
Presentation for REITWeek 2010 NAREIT’s Investor Forum® June 2010 | 10 |
| | | Balanced Market Exposure % of Owned Portfolio in Square Feet as of March 31, 2010 |
Presentation for REITWeek 2010 NAREIT’s Investor Forum® June 2010 | 11 |
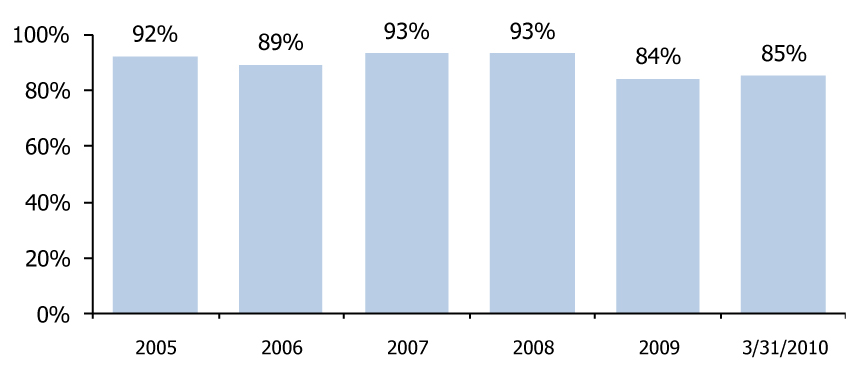
| | | Occupancy in Owned Portfolio As of the calendar year-end indicated and March 31, 2010 |
Presentation for REITWeek 2010 NAREIT’s Investor Forum® June 2010 | 12 |
| | | 20 Largest Tenants with Annualized Rent and Remaining Term |
| | | | | | |
| | | | Remaining | Aggregate | % of Aggregate | Annualized | % of |
| | Tenant | Number of | Lease Term | Leased | Leased | Rent (a) | Aggregate |
| | Name | Leases | in Months | Square Feet | Square Feet | (in 000's) | Annualized Rent |
| 1 | Noblis, Inc. | 1 | 82 | 252,613 | 4.25% | 6,645 | 5.65% |
| 2 | CITGO Petroleum Corporation | 1 | 143 | 248,399 | 4.18% | 7,075 | 6.02% |
| 3 | Tektronix Texas, LLC | 1 | 3 | 241,372 | 4.06% | 6,277 | 5.34% |
| 4 | Burger King Corporation | 1 | 102 | 212,619 | 3.58% | 4,506 | 3.83% |
| 5 | New Era of Networks, Inc. | 1 | 1 | 199,077 | 3.35% | 7,868 | 6.69% |
| 6 | Citicorp Credit Services, Inc (b) | 1 | 81 | 176,848 | 2.98% | 3,334 | 2.84% |
| 7 | RGA Reinsurance Company | 1 | 57 | 185,501 | 3.12% | 3,645 | 3.10% |
| 8 | C.H. Robinson Worldwide, Inc. | 1 | 135 | 153,028 | 2.58% | 3,977 | 3.38% |
| 9 | Geisecke & Devrient America, Inc. | 1 | 59 | 135,888 | 2.29% | 1,736 | 1.48% |
| 10 | Murphy Exploration & Production Company | 1 | 85 | 133,786 | 2.25% | 3,515 | 2.99% |
| 11 | Monsanto Company | 1 | 58 | 127,778 | 2.15% | 2,948 | 2.51% |
| 12 | Vail Holdings, Inc. (c) | 1 | 156 | 121,913 | 2.05% | 3,209 | 2.73% |
| 13 | Northrop Grumman Information Technology, Inc. | 1 | 97 | 111,469 | 1.88% | 3,981 | 3.39% |
| 14 | Maines Paper & Food Service, Inc. | 1 | 44 | 98,745 | 1.66% | 611 | 0.52% |
| 15 | Amdocs, Inc. | 1 | 14 | 91,928 | 1.55% | 2,139 | 1.82% |
| 16 | County of Santa Clara | 1 | 93 | 90,467 | 1.52% | 1,347 | 1.15% |
| 17 | Ober, Kaler, Grimes & Shriver | 1 | 12 | 89,885 | 1.51% | 2,470 | 2.10% |
| 18 | International Business Machines Corp. | 1 | 28 | 83,209 | 1.40% | 978 | 0.83% |
| 19 | Corporate Holdings, LLC | 1 | 48 | 81,818 | 1.38% | 2,161 | 1.84% |
| 20 | Noble Royalties, Inc. | 1 | 56 | 78,344 | 1.32% | 2,045 | 1.74% |
| | | | | 2,914,687 | 49.05% | $ 70,468 | 59.92% |
| (a) | Annualized rent represents the monthly rent, including tenant reimbursements, for each lease in effect at March 31, 2010 mulitplied by 12. Tenant reimbursements generally include payment of real estate taxes, operating expenses and common area maintenance and utility charges. |
| (b) | The lease with Citicorp Credit Services, Inc. is guaranteed by Citigroup. |
| (c) | On March 22, 2010, the Company signed a lease for an additional 38,000 square feet of space with one of its tenants, Vail Holdings, Inc. |
Presentation for REITWeek 2010 NAREIT’s Investor Forum® June 2010 | 13 |
| | | Owned Portfolio Lease Expirations As of March 31, 2010 |
| | | Total | % of |
| Year | | Square Feet | Portfolio (1) |
| 2010 | | 732,934 | 12.3% |
| 2011 | | 460,349 | 7.8% |
| 2012 | | 439,496 | 7.4% |
| 2013 | | 361,867 | 6.1% |
| 2014 | | 585,420 | 9.9% |
| 2015 | | 482,830 | 8.1% |
| Thereafter (2) | | 2,879,403 | 48.4% |
| | | 5,942,299 | 100.0% |
| (1) | Percentages are determined based upon square footage of expiring commercial leases. |
| (2) | Includes 867,325 square feet of current vacancies. |
Presentation for REITWeek 2010 NAREIT’s Investor Forum® June 2010 | 14 |
| | | 20 Largest Tenants, Industry Profile (as a % of square feet at March 31, 2010) |
Presentation for REITWeek 2010 NAREIT’s Investor Forum® June 2010 | 15 |
| | | Lease Roll in 2010 |
| | • | 2010 is a significant year for lease roll |
| | • | Highly active re-leasing efforts currently on-going at all properties, especially those with big lease roll during 2010 |
| | • | Vacancies are generally in company’s highest-quality and most attractive properties, helping FSP to be in a very competitive position to achieve efficient re-leasing activity |
Presentation for REITWeek 2010 NAREIT’s Investor Forum® June 2010 | 16 |
| | | Acquisition Targets |
| • | Properties with credit tenants and longer term leases at value prices |
| • | CBD or large in-fill suburban property types with growth opportunity and/or other attractive options |
| • | Strong economic fundamentals in the local market |
| • | Markets we are already in, know, or have been in previously |
| • | In active discussions and anticipate acquisitions in 2010 (three in 2009) |
Presentation for REITWeek 2010 NAREIT’s Investor Forum® June 2010 | 17 |
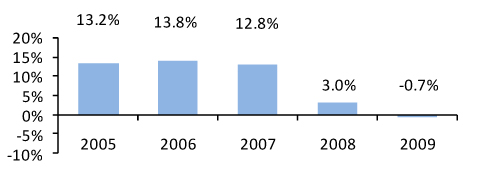
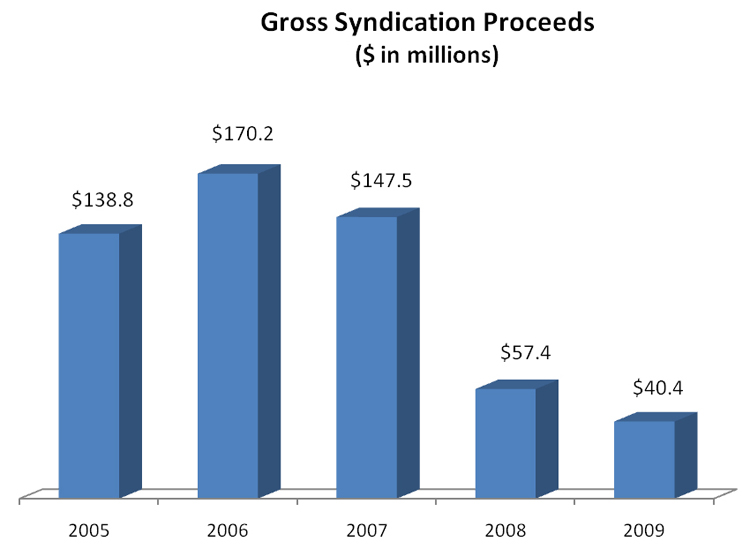
| | | Investment Banking Segment |
Investment Banking FFO* as a % of Total FFO*
| | • | Investment banking segment employs eight in-house brokers and generates syndication and transaction fees from non-traded REITs sponsored by FSP |
| | • | Non-traded REITs sponsored by FSP target opportunities which in many instances have a different risk/reward profile than properties acquired directly into the FSP portfolio |
| | • | Sponsored REITs provide fee and other income to FSP in addition to transactional investment banking revenue |
| | – | Interest income from loans to sponsored REITs |
| * | Please refer to page 25 for a reconciliation of GAAP net income to FFO and FFO+GOS and to page 26 for definitions of FFO and FFO+GOS and for information on the use of non-GAAP financial measures. |
Presentation for REITWeek 2010 NAREIT’s Investor Forum® June 2010 | 18 |
| | | Investment Banking Performance |
Presentation for REITWeek 2010 NAREIT’s Investor Forum® June 2010 | 19 |
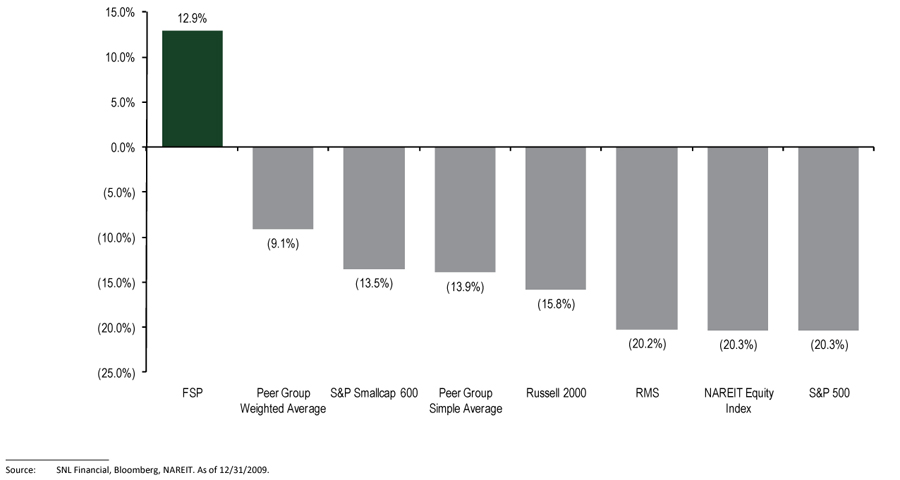
| | | 2009 Total Return Comparisons |
FSP and “Peer Group” total returns assume reinvestment of dividends to allow for true comparison to total return indices, whose daily values account for reinvestment of dividends. Index prices of total return indices account for dividends, while index prices of S&P 500, SmallCap 600 and Russell 2000 do not. For purposes of this chart, FSP’s Peer Group consists of the following REITs: BXP, BDN, OFC, DEI, DRE, HIW, HRP, KRC, LRY, CLI, MPG, PKY, PSB, SLG, WRE.
Presentation for REITWeek 2010 NAREIT’s Investor Forum® June 2010 | 20 |
| | | 2008 Total Return Comparisons |

FSP and “Peer Group” total returns assume reinvestment of dividends to allow for true comparison to total return indices, whose daily values account for reinvestment of dividends. Index prices of total return indices account for dividends, while index prices of S&P 500, SmallCap 600 and Russell 2000 do not. For purposes of this chart, FSP’s Peer Group consists of the following REITs: BXP, BDN, OFC, DEI, DRE, HIW, HRP, KRC, LRY, CLI, MPG, PKY, PSB, SLG, WRE.
Presentation for REITWeek 2010 NAREIT’s Investor Forum® June 2010 | 21 |
| | | 2008-2009 Total Return Comparisons |
FSP and “Peer Group” total returns assume reinvestment of dividends to allow for true comparison to total return indices, whose daily values account for reinvestment of dividends. Index prices of total return indices account for dividends, while index prices of S&P 500, SmallCap 600 and Russell 2000 do not. For purposes of this chart, FSP’s Peer Group consists of the following REITs: BXP, BDN, OFC, DEI, DRE, HIW, HRP, KRC, LRY, CLI, MPG, PKY, PSB, SLG, WRE.
Presentation for REITWeek 2010 NAREIT’s Investor Forum® June 2010 | 22 |
| | | Approach to Debt |
| We consider debt cost and balance sheet flexibility a priority | |
| | | | |
| Exploring various debt options | |
| | • | Unsecured debt via our current bank group or other opportunities in the market |  |
| | • | Secured debt potential with new acquisitions |
| | | |
| Stair step approach to growth through conservative use of debt and equity |
| | • | Use of leverage to invest in long-term assets |
| | • | Accordion overall leverage in a target range of 10-40% |
| | • | At suitable times raise equity capital to reduce debt levels and continue overall growth strategy |
| | | |
| | | |
| | | |
| | | |
Presentation for REITWeek 2010 NAREIT’s Investor Forum® June 2010 | 23 |
| | | Outstanding Balance Sheet & Liquidity As of March 31, 2010 |
| Capital Structure | | Liquidity |
| | | | | |
| Equity Market Cap: | $1,150.0 M | | Cash on Hand: | $ 22.8 M |
| | | | | |
| Debt: | 195.0 M | | Undrawn Revolver: | 130.0M |
| | | | | |
| Total Market Capitalization: | $1,345.0 M | | Total Available Liquidity: | $ 152.8M |
| Unsecured Revolver | | Unsecured Term Loan |
| | | | | |
| Outstanding: | $120.0 M | | Outstanding: | $75.0M |
| | | | | |
| Capacity: | $250.0M | | Maturity: | October 15, 2011 |
| | | | | Can be extended to 2013 |
| Maturity: | August 11, 2011 | | | |
| | | | Rate: | Swapped to fixed at 5.84% |
| Rate: | LIBOR + 100 bps, | | | |
| | 1.25% at 3/31/2010 | | | |
Presentation for REITWeek 2010 NAREIT’s Investor Forum® June 2010 | 24 |
| | | Reconciliation of GAAP Net Income to FFO* and FFO+GOS* |
| | | For the Year Ended | |
| | | 2009 | | | 2008 | | | 2007 | | | 2006 | | | 2005 | |
| | | | | | | | | | | | | | | | |
| Net income | | $ | 27,872 | | | $ | 31,959 | | | $ | 61,085 | | | $ | 110,929 | | | $ | 75,116 | |
| (Gain) Loss on sale of assets | | | (424 | ) | | | - | | | | (23,789 | ) | | | (61,438 | ) | | | (30,493 | ) |
| GAAP income from non-consolidated REITs | | | (2,011 | ) | | | (2,747 | ) | | | 472 | | | | (1,043 | ) | | | (1,418 | ) |
| Distributions from non-consolidated REITs | | | 5,628 | | | | 5,348 | | | | 1,806 | | | | 783 | | | | 1,217 | |
| Acquisition costs | | | 643 | | | | - | | | | - | | | | - | | | | - | |
| Depreciation & amortization | | | 39,651 | | | | 34,643 | | | | 35,475 | | | | 32,047 | | | | 22,240 | |
| Funds From Operations (FFO) | | | 71,359 | | | | 69,203 | | | | 75,049 | | | | 81,278 | | | | 66,662 | |
| Plus gains on sales of assets (GOS) | | | 424 | | | | - | | | | 23,789 | | | | 61,438 | | | | 30,493 | |
| FFO+GOS (Total Profits) | | $ | 71,783 | | | $ | 69,203 | | | $ | 98,838 | | | $ | 142,716 | | | $ | 97,155 | |
| | | | | | | | | | | | | | | | | | | | | |
| Per Share Data: | | | | | | | | | | | | | | | | | | | | |
| EPS | | $ | 0.38 | | | $ | 0.45 | | | $ | 0.86 | | | $ | 1.65 | | | $ | 1.32 | |
| FFO | | | 0.98 | | | | 0.98 | | | | 1.06 | | | | 1.22 | | | | 1.17 | |
| GOS | | | - | | | | - | | | | 0.34 | | | | 0.91 | | | | 0.54 | |
| FFO+GOS | | | 0.98 | | | | 0.98 | | | | 1.40 | | | | 2.13 | | | | 1.71 | |
| | | | | | | | | | | | | | | | | | | | | |
| Weighted Average Shares (basic and diluted) | | | 73,001 | | | | 70,481 | | | | 70,651 | | | | 67,159 | | | | 56,847 | |
| | | | | | | | | | | | | | | | | | | | | |
*Definitions of FFO and FFO+GOS can be found on page 26.
Presentation for REITWeek 2010 NAREIT’s Investor Forum® June 2010 | 25 |
| | | FFO and FFO+GOS Definitions |
The Company evaluates the performance of its reportable segments based on several measures including, Funds From Operations (“FFO”) and FFO plus Gains on Sales (“FFO+GOS” or “Total Profits”) as management believes they represent important measures of activity and are an important consideration in determining distributions paid to equity holders. The Company defines FFO as net income (computed in accordance with generally accepted accounting principles, or GAAP), excluding gains (or losses) from sales of property and acquisition costs of newly acquired properties that are not capitalized, plus depreciation and amortization, and after adjustments to exclude non-cash income (or losses) from non-consolidated or Sponsored REITs, plus distributions received from non-consolidate d or Sponsored REITs. The Company defines FFO+GOS as FFO as defined above, plus gains (or losses) from sales of properties and provisions for assets held for sale, if applicable.
FFO and FFO+GOS should not be considered as alternatives to net income (determined in accordance with GAAP), as indicators of the Company’s financial performance, nor as alternatives to cash flows from operating activities (determined in accordance with GAAP), nor as measures of the Company’s liquidity, nor are they necessarily indicative of sufficient cash flow to fund all of the Company’s needs. Other real estate companies may define these terms in a different manner. We believe that in order to facilitate a clear understanding of the results of the Company, FFO and FFO+GOS should be examined in connection with net income and cash flows from operating, investing and financing activities in the consolidated financial statements.
Presentation for REITWeek 2010 NAREIT’s Investor Forum® June 2010 | 26 |