Franklin Street Properties
Supplemental Operating
and Financial Data
First Quarter 2018
| | |

| Franklin Street Properties Corp. 401 Edgewater Place ● Wakefield, MA 01880 (781) 557-1300 ● www.fspreit.com | 
|

| Table of Contents |
| | | | |
| Page | | | Page |
| | | | |
Company Information | 3 | | Tenant Analysis and Leasing Activity | |
| | | Tenants by Industry | 18 |
Key Financial Data | | | 20 Largest Tenants with Annualized Rent and Remaining Term | 19 |
Financial Highlights | 4 | | Leasing Activity | 20 |
Income Statements | 5 | | Lease Expirations by Square Feet | 21 |
Balance Sheets | 6 | | Lease Expirations with Annualized Rent per Square Foot | 22 |
Cash Flow Statements | 7 | | Capital Expenditures | 23 |
Property Net Operating Income (NOI) | 8 | | | |
| | | Transaction Activity | 24 |
Reconciliation | | | | |
FFO & AFFO | 9 | | Loan Portfolio of Secured Real Estate | 25 |
EBITDA | 10 | | | |
Property NOI | 11 | | Net Asset Value Components | 26 |
| | | | |
Debt Summary | 12 | | Appendix: Definitions of Non-GAAP Measures | |
| | | FFO | 27 |
Capital Analysis | 13 | | EBITDA and NOI | 28 |
| | | AFFO | 29 |
Owned and Managed Portfolio Overview | 14-17 | | | |
| | |
All financial information contained in this supplemental information package is unaudited. In addition, certain statements contained in this supplemental information package may be deemed to be forward-looking statements within the meaning of the federal securities laws. Although FSP believes that the expectations reflected in such forward-looking statements are based upon reasonable assumptions, it can give no assurance that its expectations will be achieved. Factors that could cause actual results to differ materially from FSP’s current expectations include general economic conditions, uncertainties relating to fiscal policy, changes in government regulations, regulatory uncertainty, geopolitical events, local real estate conditions, the performance of properties that FSP has acquired or may acquire, the timely lease-up of properties and other risks, which are detailed from time to time in FSP’s reports filed with the Securities and Exchange Commission. FSP assumes no obligation to update or supplement forward-looking statements that become untrue because of subsequent events. | | 
|
| | |
| | 801 Marquette |
| |
| Company Information |
Overview | | | | | Snapshot (as of March 31, 2018) |
Franklin Street Properties Corp. (“FSP”, “we”, “our” or the “Company”) (NYSE American: FSP) is investing in institutional-quality office properties in the U.S. FSP’s strategy is to invest in select urban infill and central business district (CBD) properties, with primary emphasis on our five core markets of Atlanta, Dallas, Denver, Houston, and Minneapolis. FSP seeks value-oriented investments with an eye towards long-term growth and appreciation, as well as current income. FSP is a Maryland corporation that operates in a manner intended to qualify as a real estate investment trust (REIT) for federal income tax purposes. FSP’s real estate operations include property acquisitions and dispositions, short-term financing, leasing, development and asset management. | | | | | Corporate Headquarters | Wakefield, MA |
| | | | Fiscal Year-End | 31-Dec |
| | | | Total Properties | 34 |
| | | | Total Square Feet | 9.8 Million |
| | | | Trading Symbol | FSP |
| | | | Exchange | NYSE American |
| | | | Common Shares Outstanding | 107,231,155 |
| | | | Quarterly Dividend | $0.09 |
Our Business | | | | | Dividend Yield | 4.3% |
As of March 31, 2018, the Company owned and operated a portfolio of real estate consisting of 34 properties, one property that has been redeveloped and is classified as non-operating and six managed Sponsored REITs, and held four promissory notes secured by mortgages on real estate owned by Sponsored REITs. From time-to-time, the Company may acquire, develop or redevelop real estate, make additional secured loans or acquire one of its Sponsored REITs. The Company may also pursue, on a selective basis, the sale of its properties in order to take advantage of the value creation and demand for its properties, or for geographic or property specific reasons. | | | | | Total Market Capitalization | $2.0 Billion* |
| | | | Insider Holdings | 4.0% |
| | | | 
|
| | | | | |
Management Team | | | | | |
| | | | | |
George J. Carter | Jeffrey B. Carter | | | | |
Chief Executive Officer and | President and Chief Investment | | | | |
Chairman of the Board | Officer | | | | |
| | | | | |
John G. Demeritt | Scott H. Carter | | | | |
Executive Vice President, Chief | Executive Vice President, General | | | | |
Financial Officer and Treasurer | Counsel and Secretary | | | | |
| | | | | |
John F. Donahue | Eriel Anchondo | | | | |
Executive Vice President | Executive Vice President and Chief Operating Officer | | | | | Greenwood Plaza, Englewood, CO |
| | | | | | |
Inquiries | | | | | | |
Inquiries should be directed to: Georgia Touma | | | | | | |
877.686.9496 or InvestorRelations@fspreit.com * Total Market Capitalization is the closing share price multiplied by the number of shares outstanding plus total debt outstanding. | | | | | | |
| |
| Summary of Financial Highlights |
| | | | | | | | | | | | | | | | |
(in thousands except per share amounts, SF & number of properties) | | | | | | | | | | | | | | | | |
| | 31-Mar-18 | | 31-Dec-17 | | 30-Sep-17 | | 30-Jun-17 | | 31-Mar-17 | |
Income Items: | | | | | | | | | | | | | | | | |
Rental revenue | | $ | 65,628 | | $ | 65,555 | | $ | 67,339 | | $ | 66,995 | | $ | 67,376 | |
Total revenue | | | 66,893 | | | 66,835 | | | 68,626 | | | 68,371 | | | 68,756 | |
Adjusted EBITDA* | | | 34,943 | | | 34,033 | | | 35,354 | | | 35,525 | | | 35,036 | |
Equity in losses of non-consolidated REITs | | | (105) | | | (2,885) | | | (121) | | | (201) | | | (397) | |
Net income (loss) | | | 1,425 | | | (4,932) | | | 1,903 | | | (17,395) | | | 4,480 | |
FFO* | | | 26,364 | | | 26,347 | | | 27,991 | | | 28,571 | | | 28,528 | |
AFFO* | | | 16,930 | | | 13,044 | | | 17,110 | | | 18,919 | | | 17,884 | |
| | | | | | | | | | | | | | | | |
Per Share Data: | | | | | | | | | | | | | | | | |
EPS | | $ | 0.01 | | $ | (0.05) | | $ | 0.02 | | $ | (0.16) | | $ | 0.04 | |
FFO* | | $ | 0.25 | | $ | 0.25 | | $ | 0.26 | | $ | 0.27 | | $ | 0.27 | |
AFFO* | | $ | 0.16 | | $ | 0.12 | | $ | 0.16 | | $ | 0.18 | | $ | 0.17 | |
Weighted Average Shares (diluted) | | | 107,231 | | | 107,231 | | | 107,231 | | | 107,231 | | | 107,231 | |
Closing share price | | $ | 8.41 | | $ | 10.74 | | $ | 10.62 | | $ | 11.08 | | $ | 12.14 | |
Dividend declared | | $ | 0.09 | | $ | 0.19 | | $ | 0.19 | | $ | 0.19 | | $ | 0.19 | |
AFFO Payout Ratio: | | | 57% | | | 156% | | | 119% | | | 108% | | | 114% | |
| | | | | | | | | | | | | | | | |
Balance Sheet Items: | | | | | | | | | | | | | | | | |
Real estate, net | | $ | 1,627,941 | | $ | 1,632,692 | | $ | 1,635,706 | | $ | 1,640,551 | | $ | 1,686,154 | |
Other assets, net | | | 358,254 | | | 357,820 | | | 395,979 | | | 402,016 | | | 392,132 | |
Total assets, net | | | 1,986,195 | | | 1,990,512 | | | 2,031,685 | | | 2,042,567 | | | 2,078,286 | |
Total liabilities, net | | | 1,127,277 | | | 1,119,220 | | | 1,142,299 | | | 1,134,723 | | | 1,130,263 | |
Shareholders' equity | | | 858,918 | | | 871,292 | | | 889,386 | | | 907,844 | | | 948,023 | |
| | | | | | | | | | | | | | | | |
Market Capitalization and Debt: | | | | | | | | | | | | | | | | |
Total Market Capitalization (a) | | $ | 1,969,814 | | $ | 2,199,663 | | $ | 2,208,795 | | $ | 2,253,121 | | $ | 2,366,786 | |
Total debt outstanding (excluding unamortized financing costs) | | | 1,068,000 | | | 1,048,000 | | | 1,070,000 | | | 1,065,000 | | | 1,065,000 | |
Debt to Total Market Capitalization | | | 54.2% | | | 47.6% | | | 48.4% | | | 47.3% | | | 45.0% | |
Net Debt to Adjusted EBITDA* | | | 7.5 | | | 7.6 | | | 7.5 | | | 7.4 | | | 7.5 | |
| | | | | | | | | | | | | | | | |
Owned Portfolio Leasing Statistics (b): | | | | | | | | | | | | | | | | |
Owned portfolio assets | | | 34 | | | 34 | | | 35 | | | 35 | | | 35 | |
Portfolio total SF | | | 9,760,657 | | | 9,761,984 | | | 10,085,889 | | | 10,084,710 | | | 10,118,112 | |
Portfolio % leased | | | 88.5% | | | 89.7% | | | 88.7% | | | 88.1% | | | 89.6% | |
| (a) | | Total Market Capitalization is the closing share price multiplied by the number of shares outstanding plus total debt outstanding on that date. |
| (b) | | For periods in 2018 and 2017, excludes one property that was redeveloped and is classified as non-operating, which is located in Minneapolis, Minnesota. |
*See pages 9 & 10 for reconciliations of Net income or loss to FFO, AFFO and Adjusted EBITDA, respectively, and the Appendix for Definitions of these Non-GAAP Measures beginning on page 27.
| Condensed Consolidated Income Statements ($ in thousands, except per share amounts) |
| | | | | | | | | | | | | | | | | | |
| | | | | | | | | | | | | | | | | For the |
| | Three Months Ended | | For the Three Months Ended | | Year Ended |
| | 31-Mar-18 | | 31-Mar-17 | | 30-Jun-17 | | 30-Sep-17 | | 31-Dec-17 | | 31-Dec-17 |
| | | | | | | | | | | | | | | | | | |
Revenue: | | | | | | | | | | | | | | | | | | |
Rental | | $ | 65,628 | | $ | 67,376 | | $ | 66,995 | | $ | 67,339 | | $ | 65,555 | | $ | 267,265 |
Related party revenue: | | | | | | | | | | | | | | | | | | |
Management fees and interest income from loans | | | 1,256 | | | 1,370 | | | 1,366 | | | 1,278 | | | 1,271 | | | 5,285 |
Other | | | 9 | | | 10 | | | 10 | | | 9 | | | 9 | | | 38 |
Total revenue | | | 66,893 | | | 68,756 | | | 68,371 | | | 68,626 | | | 66,835 | | | 272,588 |
| | | | | | | | | | | | | | | | | | |
Expenses: | | | | | | | | | | | | | | | | | | |
Real estate operating expenses | | | 17,151 | | | 17,308 | | | 17,286 | | | 17,898 | | | 18,720 | | | 71,212 |
Real estate taxes and insurance | | | 11,177 | | | 12,403 | | | 11,595 | | | 11,882 | | | 9,961 | | | 45,841 |
Depreciation and amortization | | | 24,035 | | | 25,332 | | | 25,279 | | | 24,988 | | | 25,659 | | | 101,258 |
General and administrative | | | 3,432 | | | 3,443 | | | 3,077 | | | 3,286 | | | 3,665 | | | 13,471 |
Interest | | | 9,486 | | | 7,579 | | | 7,893 | | | 8,258 | | | 8,657 | | | 32,387 |
Total expenses | | | 65,281 | | | 66,065 | | | 65,130 | | | 66,312 | | | 66,662 | | | 264,169 |
| | | | | | | | | | | | | | | | | | |
Income before equity in losses of non-consolidated REITs, other, gain (loss)
on sale of properties and properties held for sale, less applicable income tax and taxes | | | 1,612 | | | 2,691 | | | 3,241 | | | 2,314 | | | 173 | | | 8,419 |
Equity in losses of non-consolidated REITs | | | (105) | | | (397) | | | (201) | | | (121) | | | (2,885) | | | (3,604) |
Other | | | — | | | 22 | | | 129 | | | 67 | | | (2,096) | | | (1,878) |
Gain (loss) on sale of properties and provision for loss on properties held for sale, less applicable income tax | | | — | | | 2,289 | | | (20,492) | | | (257) | | | (21) | | | (18,481) |
| | | | | | | | | | | | | | | | | | |
Income (loss) before taxes on income | | | 1,507 | | | 4,605 | | | (17,323) | | | 2,003 | | | (4,829) | | | (15,544) |
Income tax expense | | | 82 | | | 125 | | | 72 | | | 100 | | | 103 | | | 400 |
| | | | | | | | | | | | | | | | | | |
Net income (loss) | | $ | 1,425 | | $ | 4,480 | | $ | (17,395) | | $ | 1,903 | | $ | (4,932) | | $ | (15,944) |
| | | | | | | | | | | | | | | | | | |
Weighted average number of shares outstanding, basic and diluted | | | 107,231 | | | 107,231 | | | 107,231 | | | 107,231 | | | 107,231 | | | 107,231 |
| | | | | | | | | | | | | | | | | | |
Net income (loss) per share, basic and diluted | | $ | 0.01 | | $ | 0.04 | | $ | (0.16) | | $ | 0.02 | | $ | (0.05) | | $ | (0.15) |
| $ in thousands, except per share amounts) |
| Condensed Consolidated Balance Sheets (in thousands) |
| | | | | | | | | | | | | | | | | |
| | March 31, | | | March 31, | | June 30, | | September 30, | | December 31, | |
| | 2018 | | | 2017 | | 2017 | | 2017 | | 2017 | |
Assets: | | | | | | | | | | | | | | | | | |
Real estate assets: | | | | | | | | | | | | | | | | | |
Land | | $ | 191,578 | | | $ | 196,178 | | $ | 191,578 | | $ | 191,578 | | $ | 191,578 | |
Buildings and improvements | | | 1,821,035 | | | | 1,836,073 | | | 1,792,784 | | | 1,800,831 | | | 1,811,631 | |
Fixtures and equipment | | | 5,909 | | | | 4,600 | | | 4,841 | | | 5,017 | | | 5,614 | |
| | | 2,018,522 | | | | 2,036,851 | | | 1,989,203 | | | 1,997,426 | | | 2,008,823 | |
Less accumulated depreciation | | | 390,581 | | | | 350,697 | | | 348,652 | | | 361,720 | | | 376,131 | |
Real estate assets, net | | | 1,627,941 | | | | 1,686,154 | | | 1,640,551 | | | 1,635,706 | | | 1,632,692 | |
| | | | | | | | | | | | | | | | | |
Acquired real estate leases, net | | | 78,729 | | | | 115,471 | | | 105,811 | | | 96,282 | | | 86,520 | |
Investment in non-consolidated REITs | | | 69,703 | | | | 74,423 | | | 73,876 | | | 73,405 | | | 70,164 | |
Asset held for sale | | | — | | | | — | | | 31,868 | | | 31,615 | | | — | |
Cash, cash equivalents and restricted cash | | | 14,355 | | | | 11,174 | | | 11,623 | | | 12,710 | | | 9,819 | |
Tenant rent receivables, net | | | 3,411 | | | | 3,785 | | | 4,706 | | | 3,990 | | | 3,123 | |
Straight-line rent receivable, net | | | 53,430 | | | | 52,304 | | | 51,590 | | | 52,272 | | | 53,194 | |
Prepaid expenses and other assets | | | 8,355 | | | | 4,946 | | | 5,124 | | | 6,282 | | | 8,387 | |
Related party mortgage loan receivable | | | 71,455 | | | | 81,515 | | | 72,250 | | | 71,985 | | | 71,720 | |
Other assets: derivative asset | | | 18,740 | | | | 13,603 | | | 11,333 | | | 10,771 | | | 13,925 | |
Office computers and furniture, net of accumulated depreciation | | | 261 | | | | 275 | | | 287 | | | 319 | | | 289 | |
Deferred leasing commissions, net | | | 39,815 | | | | 34,636 | | | 33,548 | | | 36,348 | | | 40,679 | |
Total assets | | $ | 1,986,195 | | | $ | 2,078,286 | | $ | 2,042,567 | | $ | 2,031,685 | | $ | 1,990,512 | |
| | | | | | | | | | | | | | | | | |
Liabilities and Stockholders’ Equity: | | | | | | | | | | | | | | | | | |
Liabilities: | | | | | | | | | | | | | | | | | |
Bank note payable | | $ | 98,000 | | | $ | 295,000 | | $ | 295,000 | | $ | 300,000 | | $ | 78,000 | |
Term loan payable, net of unamortized financing costs | | | 765,259 | | | | 765,539 | | | 765,861 | | | 766,183 | | | 764,901 | |
Series A & Series B Senior Notes | | | 198,727 | | | | — | | | — | | | — | | | 198,692 | |
Accounts payable and accrued expenses | | | 53,327 | | | | 50,529 | | | 55,241 | | | 57,593 | | | 61,039 | |
Accrued compensation | | | 1,112 | | | | 1,259 | | | 1,929 | | | 3,000 | | | 3,641 | |
Tenant security deposits | | | 5,588 | | | | 5,441 | | | 5,367 | | | 5,431 | | | 5,383 | |
Other liabilities: derivative liabilities | | | — | | | | 4,351 | | | 4,364 | | | 3,721 | | | 1,759 | |
Acquired unfavorable real estate leases, net | | | 5,264 | | | | 8,144 | | | 6,961 | | | 6,371 | | | 5,805 | |
Total liabilities | | | 1,127,277 | | | | 1,130,263 | | | 1,134,723 | | | 1,142,299 | | | 1,119,220 | |
| | | | | | | | | | | | | | | | | |
Commitments and contingencies | | | | | | | | | | | | | | | | | |
| | | | | | | | | | | | | | | | | |
Stockholders’ Equity: | | | | | | | | | | | | | | | | | |
Preferred stock | | | - | | | | - | | | - | | | - | | | - | |
Common stock | | | 11 | | | | 11 | | | 11 | | | 11 | | | 11 | |
Additional paid-in capital | | | 1,356,457 | | | | 1,356,457 | | | 1,356,457 | | | 1,356,457 | | | 1,356,457 | |
Accumulated other comprehensive income (loss) | | | 18,740 | | | | 7,351 | | | 4,940 | | | 4,954 | | | 12,166 | |
Accumulated distributions in excess of accumulated earnings | | | (516,290) | | | | (415,796) | | | (453,564) | | | (472,036) | | | (497,342) | |
Total stockholders’ equity | | | 858,918 | | | | 948,023 | | | 907,844 | | | 889,386 | | | 871,292 | |
Total liabilities and stockholders’ equity | | $ | 1,986,195 | | | $ | 2,078,286 | | $ | 2,042,567 | | $ | 2,031,685 | | $ | 1,990,512 | |
| Condensed Consolidated Statements of Cash Flows (in thousands) |
| | | | | | | | | | | | |
| | Three Months ended March 31, | | | Twelve Months Ended December 31, | |
| | 2018 | | 2017 | | | 2017 | | 2016 | |
Cash flows from operating activities: | | | | | | | | | | | | |
Net income (loss) | $ | 1,425 | $ | 4,480 | | | $ | (15,944) | | $ | 8,378 | |
Adjustments to reconcile net income or loss to net cash provided by operating activities: | | | | | | | | | | | | |
Depreciation and amortization expense | | 24,748 | | 25,937 | | | | 103,743 | | | 95,243 | |
Amortization of above and below market leases | | (85) | | (168) | | | | (1,031) | | | (496) | |
Hedge ineffectiveness | | — | | (22) | | | | 1,878 | | | (1,878) | |
(Gain) loss on sale of properties and properties held for sale, less applicable income tax | | — | | (2,289) | | | | 18,481 | | | 2,938 | |
Equity in earnings (losses) from non-consolidated REITs | | 105 | | 397 | | | | 3,604 | | | 831 | |
Increase (decrease) in allowance for doubtful accounts | | 75 | | — | | | | 150 | | | (30) | |
Changes in operating assets and liabilities: | | | | | | | | | | | | |
Tenant rent receivables | | (363) | | (672) | | | | (160) | | | (185) | |
Straight-line rents | | 40 | | (1,082) | | | | (1,767) | | | (1,977) | |
Lease acquisition costs | | (276) | | (292) | | | | (2,052) | | | (1,095) | |
Prepaid expenses and other assets | | (274) | | 1 | | | | (403) | | | (721) | |
Accounts payable and accrued expenses | | (6,911) | | (10,219) | | | | 3,870 | | | 5,751 | |
Accrued compensation | | (2,529) | | (2,525) | | | | (143) | | | 58 | |
Tenant security deposits | | 205 | | 86 | | | | 28 | | | 526 | |
Payment of deferred leasing commissions | | (1,082) | | (1,606) | | | | (14,309) | | | (12,965) | |
Net cash provided by operating activities | | 15,078 | | 12,026 | | | | 95,945 | | | 94,378 | |
| | | | | | | | | | | | |
Cash flows from investing activities: | | | | | | | | | | | | |
Property acquisitions | | — | | — | | | | — | | | (221,119) | |
Acquired real estate leases | | — | | — | | | | — | | | (51,509) | |
Property improvements, fixtures and equipment | | (10,774) | | (11,615) | | | | (54,306) | | | (37,490) | |
Distributions in excess of earnings from non-consolidated REITs | | 355 | | 346 | | | | 1,396 | | | 1,023 | |
Investment in related party mortgage loan receivable | | — | | — | | | | — | | | (3,000) | |
Repayment of related party mortgage loan receivable | | 265 | | 265 | | | | 10,060 | | | 39,861 | |
Proceeds received on sales of real estate assets | | — | | 6,160 | | | | 37,756 | | | 27,262 | |
Net cash used in investing activities | | (10,154) | | (4,844) | | | | (5,094) | | | (244,972) | |
| | | | | | | | | | | | |
Cash flows from financing activities: | | | | | | | | | | | | |
Distributions to stockholders | | (20,374) | | (20,374) | | | | (81,496) | | | (77,481) | |
Proceeds (costs) from equity offering, net | | — | | — | | | | — | | | 82,902 | |
Borrowings under bank note payable | | 30,000 | | 30,000 | | | | 75,000 | | | 175,000 | |
Repayments of bank note payable | | (10,000) | | (15,000) | | | | (277,000) | | | (185,000) | |
Borrowing from Series A & Series B Senior Notes | | — | | — | | | | 200,000 | | | — | |
Borrowing of term loan payable | | — | | — | | | | — | | | 150,000 | |
Deferred Financing Costs | | (14) | | — | | | | (6,902) | | | (3,647) | |
Net cash provided by (used in) financing activities | | (388) | | (5,374) | | | | (90,398) | | | 141,774 | |
Net increase (decrease) in cash, cash equivalents and restricted cash | | 4,536 | | 1,808 | | | | 453 | | | (8,820) | |
Cash, cash equivalents and restricted cash, beginning of period | | 9,819 | | 9,366 | | | | 9,366 | | | 18,186 | |
Cash, cash equivalents and restricted cash, end of period | $ | 14,355 | $ | 11,174 | | | $ | 9,819 | | $ | 9,366 | |
| Property Net Operating Income (NOI)* with Same Store Comparison (in thousands) |
| | | | | | | | | | | | | | |
| | Rentable | | | | | | | | | | | | |
| | Square Feet | | Three Months Ended | Three Months Ended | Inc | | % | |
(in thousands) | | or RSF | | 31-Mar-18 | | 31-Mar-17 | | (Dec) | | Change | |
Region | | | | | | | | | | | | | | |
East | | 1,007 | | $ | 3,991 | | $ | 3,917 | | $ | 74 | | 1.9 | % |
MidWest | | 1,549 | | | 6,257 | | | 4,365 | | | 1,892 | | 43.3 | % |
South | | 4,597 | | | 15,431 | | | 17,008 | | | (1,577) | | (9.3) | % |
West | | 2,608 | | | 10,958 | | | 10,958 | | | — | | — | % |
Same Store | | 9,761 | | | 36,637 | | | 36,248 | | | 389 | | 1.1 | % |
| | | | | | | | | | | | | | |
Acquisitions | | — | | | — | | | — | | | — | | — | % |
Property NOI* from the continuing portfolio | | 9,761 | | | 36,637 | | | 36,248 | | | 389 | | 1.1 | % |
Dispositions, Non-Operating, Development or Redevelopment | | - | | | 79 | | | 625 | | | (546) | | (1.5) | % |
Property NOI* | | 9,761 | | $ | 36,716 | | $ | 36,873 | | $ | (157) | | (0.4) | % |
| | | | | | | | | | | | | | |
Same Store | | | | $ | 36,637 | | $ | 36,248 | | $ | 389 | | 1.1 | % |
| | | | | | | | | | | | | | |
Less Nonrecurring | | | | | | | | | | | | | | |
Items in NOI* (a) | | | | | 761 | | | 65 | | | 696 | | (1.9) | % |
| | | | | | | | | | | | | | |
Comparative | | | | | | | | | | | | | | |
Same Store | | | | $ | 35,876 | | $ | 36,183 | | $ | (307) | | (0.8) | % |
| (a) | | Nonrecurring items in NOI include proceeds from bankruptcies, lease termination fees or other significant nonrecurring income or expenses, which may affect comparability. |
*See the Appendix for Definition of Non-GAAP Measures beginning on page 27.
| FFO* & AFFO* Reconciliation (in thousands, except per share amounts) |
| | | | | | | | | | | | | | | | | | | | | |
| | | | | | | | | | | | | | | | | | Year | |
| | Three Months Ended | | | Three Months Ended | | Ended | |
| | 31-Mar-18 | | | | 31-Mar-17 | | 30-Jun-17 | | 30-Sep-17 | | 31-Dec-17 | | 31-Dec-17 | |
| | | | | | | | | | | | | | | | | | | | | |
Net income (loss) | | $ | 1,425 | | | | $ | 4,480 | | $ | (17,395) | | $ | 1,903 | | $ | (4,932) | | $ | (15,944) | |
| | | | | | | | | | | | | | | | | | | | | |
(Gain) loss on sale of properties and properties held for sale, less applicable income tax | | | — | | | | | (2,289) | | | 20,492 | | | 257 | | | 21 | | | 18,481 | |
GAAP income from non-consolidated REITs | | | 105 | | | | | 397 | | | 201 | | | 121 | | | 2,885 | | | 3,604 | |
FFO from non-consolidated REITs | | | 884 | | | | | 791 | | | 800 | | | 874 | | | 708 | | | 3,173 | |
Depreciation & amortization | | | 23,950 | | | | | 25,163 | | | 24,592 | | | 24,903 | | | 25,569 | | | 100,227 | |
NAREIT FFO* | | | 26,364 | | | | | 28,542 | | | 28,690 | | | 28,058 | | | 24,251 | | | 109,541 | |
Hedge ineffectiveness | | | — | | | | | (22) | | | (129) | | | (67) | | | 2,096 | | | 1,878 | |
Acquisition costs | | | — | | | | | 8 | | | 10 | | | — | | | — | | | 18 | |
Funds From Operations (FFO)* | | $ | 26,364 | | | | $ | 28,528 | | $ | 28,571 | | $ | 27,991 | | $ | 26,347 | | $ | 111,437 | |
| | | | | | | | | | | | | | | | | | | | | |
| | | | | | | | | | | | | | | | | | | | | |
Adjusted Funds From Operations (AFFO)* | | | | | | | | | | | | | | | | | | | | | |
Funds From Operations (FFO)* | | $ | 26,364 | | | | $ | 28,528 | | $ | 28,571 | | $ | 27,991 | | $ | 26,347 | | $ | 111,437 | |
Reverse FFO from non-consolidated REITs | | | (884) | | | | | (791) | | | (800) | | | (874) | | | (708) | | | (3,173) | |
Distributions from non-consolidated REITs | | | 355 | | | | | 346 | | | 345 | | | 350 | | | 355 | | | 1,396 | |
Amortization of deferred financing costs | | | 711 | | | | | 606 | | | 606 | | | 606 | | | 667 | | | 2,485 | |
Straight-line rent | | | 40 | | | | | (1,082) | | | (792) | | | (147) | | | 254 | | | (1,767) | |
Tenant improvements | | | (6,777) | | | | | (6,474) | | | (5,363) | | | (4,474) | | | (4,166) | | | (20,477) | |
Leasing commissions | | | (1,021) | | | | | (1,579) | | | (1,963) | | | (4,482) | | | (5,869) | | | (13,893) | |
Non-investment capex | | | (1,858) | | | | | (1,670) | | | (1,685) | | | (1,860) | | | (3,836) | | | (9,051) | |
Adjusted Funds From Operations (AFFO)* | | $ | 16,930 | | | | $ | 17,884 | | $ | 18,919 | | $ | 17,110 | | $ | 13,044 | | $ | 66,957 | |
| | | | | | | | | | | | | | | | | | | | | |
Per Share Data: | | | | | | | | | | | | | | | | | | | | | |
EPS | | $ | 0.01 | | | | $ | 0.04 | | $ | (0.16) | | $ | 0.02 | | $ | (0.05) | | $ | (0.15) | |
FFO* | | | 0.25 | | | | | 0.27 | | | 0.27 | | | 0.26 | | | 0.25 | | | 1.04 | |
AFFO* | | | 0.16 | | | | | 0.17 | | | 0.18 | | | 0.16 | | | 0.12 | | | 0.62 | |
| | | | | | | | | | | | | | | | | | | | | |
Weighted Average Shares (basic and diluted) | | | 107,231 | | | | | 107,231 | | | 107,231 | | | 107,231 | | | 107,231 | | | 107,231 | |
*See the Appendix for Definitions of these Non-GAAP Measures beginning on page 27
| EBITDA* & Adjusted EBITDA* Reconciliation (in thousands, except ratio amounts) |
| | | | | | | | | | | | | | | | | | | | |
| | | | | | | | | | | | | | | | | Year |
| | Three Months Ended | | | Three Months Ended | | Ended |
| | 31-Mar-18 | | | | 31-Mar-17 | | 30-Jun-17 | | 30-Sep-17 | | 31-Dec-17 | | 31-Dec-17 |
| | | | | | | | | | | | | | | | | | | | |
Net income (loss) | | $ | 1,425 | | | | $ | 4,480 | | $ | (17,395) | | $ | 1,903 | | $ | (4,932) | | $ | (15,944) |
Interest expense | | | 9,486 | | | | | 7,579 | | | 7,893 | | | 8,258 | | | 8,657 | | | 32,387 |
Depreciation and amortization | | | 23,950 | | | | | 25,163 | | | 24,592 | | | 24,903 | | | 25,569 | | | 100,227 |
Income taxes | | | 82 | | | | | 125 | | | 72 | | | 100 | | | 103 | | | 400 |
EBITDA* | | | 34,943 | | | | | 37,347 | | | 15,162 | | | 35,164 | | | 29,397 | | | 117,070 |
(Gain) loss on sale of properties and provisions for loss on properties held for sale or equity investments, less applicable income tax | | | — | | | | | (2,289) | | | 20,492 | | | 257 | | | 2,540 | | | 21,000 |
Hedge ineffectiveness | | | — | | | | | (22) | | | (129) | | | (67) | | | 2,096 | | | 1,878 |
Adjusted EBITDA* | | $ | 34,943 | | | | $ | 35,036 | | $ | 35,525 | | $ | 35,354 | | $ | 34,033 | | $ | 139,948 |
| | | | | | | | | | | | | | | | | | | | |
Interest expense | | $ | 9,486 | | | | $ | 7,579 | | $ | 7,893 | | $ | 8,258 | | $ | 8,657 | | $ | 32,387 |
Scheduled principal payments | | | — | | | | | — | | | — | | | — | | | — | | | — |
Interest and scheduled principal payments | | $ | 9,486 | | | | $ | 7,579 | | $ | 7,893 | | $ | 8,258 | | $ | 8,657 | | $ | 32,387 |
| | | | | | | | | | | | | | | | | | | | |
Interest coverage ratio | | | 3.68 | | | | | 4.62 | | | 4.50 | | | 4.28 | | | 3.93 | | | 4.32 |
| | | | | | | | | | | | | | | | | | | | |
Debt service coverage ratio | | | 3.68 | | | | | 4.62 | | | 4.50 | | | 4.28 | | | 3.93 | | | 4.32 |
| | | | | | | | | | | | | | | | | | | | |
Debt excluding unamortized financing costs | | $ | 1,068,000 | | | | $ | 1,065,000 | | $ | 1,065,000 | | $ | 1,070,000 | | $ | 1,048,000 | | | |
Cash, cash equivalents and restricted cash | | | 14,355 | | | | | 11,174 | | | 11,623 | | | 12,710 | | | 9,819 | | | |
Net Debt ( Debt less Cash, cash equivalents and restricted cash) | | $ | 1,053,645 | | | | $ | 1,053,826 | | $ | 1,053,377 | | $ | 1,057,290 | | $ | 1,038,181 | | | |
| | | | | | | | | | | | | | | | | | | | |
Adjusted EBITDA* | | $ | 34,943 | | | | $ | 35,036 | | $ | 35,525 | | $ | 35,354 | | $ | 34,033 | | | |
Annualized | | $ | 139,772 | | | | $ | 140,144 | | $ | 142,100 | | $ | 141,416 | | $ | 136,132 | | | |
| | | | | | | | | | | | | | | | | | | | |
Net Debt-to-Adjusted EBITDA* | | | 7.5 | | | | | 7.5 | | | 7.4 | | | 7.5 | | | 7.6 | | | |
*See the Appendix for Definitions of these Non-GAAP Measures beginning on page 27. Amounts in the EBITDA and Adjusted EBITDA reconciliation do not reflect our proportionate share of interest expense, depreciation, amortization, income taxes, gains or losses on sales and debt from our investments in non-consolidated REITs, which are accounted for under the equity method.
| |
| Reconciliation of Net Income (Loss) to Property NOI* (in thousands) |
| | | | | | | |
Reconciliation of Net income to Property NOI* | | | | | | | |
| | Three Months Ended | | Three Months Ended |
| | 31-Mar-18 | | 31-Mar-17 | |
Net income (loss) | | $ | 1,425 | | $ | 4,480 | |
Add (deduct): | | | | | | | |
(Gain) loss on sale of properties and properties held for sale, less applicable income taxes | | | — | | | (2,289) | |
Hedge ineffectiveness | | | — | | | (22) | |
Management fee income | | | (746) | | | (794) | |
Depreciation and amortization | | | 24,035 | | | 25,332 | |
Amortization of above/below market leases | | | (85) | | | (168) | |
General and administrative | | | 3,432 | | | 3,443 | |
Interest expense | | | 9,486 | | | 7,579 | |
Interest income | | | (1,120) | | | (1,214) | |
Equity in losses of non-consolidated REITs | | | 105 | | | 397 | |
Non-property specific items, net | | | 184 | | | 129 | |
Property NOI* | | $ | 36,716 | | $ | 36,873 | |
*See the Appendix for Definition of Non-GAAP Measures beginning on page 27.
| Debt Summary (in thousands) |
| | | | | | | | | | | | | | | | | |
| | | | Maximum | | Amount | | Interest | | Interest | | | |
| | Maturity | | Amount | | Drawn at | | Rate (a) | | Rate at | | Facility | |
| | Date | | of Loan | | 31-Mar-18 | | Components | | 31-Mar-18 | | Fee | |
| | | | | | | | | | | | | | | | | |
BAML Revolver | | 12-Jan-22 | | $ | 600,000 | | $ | 98,000 | | L | + | 1.20% | | 3.08% | | 0.25% | |
JPM Term Loan | | 30-Nov-18 | | | 150,000 | | | 150,000 | | L | + | 1.35% | | 3.29% | | | |
BAML Term Loan | | 12-Jan-23 | | | 400,000 | | | 400,000 | | 1.12% | + | 1.35% | | 2.47% | | | |
BMO Term Loan | | 26-Aug-20 | | | 220,000 | | | 220,000 | | 2.32% | + | 1.65% | | 3.97% | | | |
Series A Senior Notes | | 20-Dec-24 | | | 116,000 | | | 116,000 | | | | | | 3.99% | | | |
Series B Senior Notes | | 20-Dec-27 | | | 84,000 | | | 84,000 | | | | | | 4.26% | | | |
| | | | | | | | | | | | | | | | | |
| | | | $ | 1,570,000 | | $ | 1,068,000 | | | | | | 3.26% | | | |
| · | | On October 18, 2017, we recast our credit facility with Bank of America, N.A., as administrative agent, to, among other things, (i) increase the borrowing capacity of the revolving line of credit from $500 million to $600 million, (ii) extend the maturity date applicable to the revolving line of credit from October 29, 2018 to January 12, 2022 (with two optional six month extensions), (iii) extend the maturity date applicable to the term loan from September 27, 2021 to January 12, 2023, (iv) modify certain financial covenants, including a reset of minimum tangible net worth, and (v) increase the accordion feature from $350 million to $500 million. Pricing is based on our investment grade rating. At our investment grade rating from Moody’s of Baa3, pricing on the borrowing spread decreased by five basis points for the revolving line of credit and by ten basis points for the term loan. We also simultaneously amended our term loan with Bank of Montreal, as administrative agent, and our term loan with JPMorgan Chase Bank, N.A., as administrative agent, to conform the financial covenants and certain other provisions. |
| · | | The BAML Revolver is subject to a 25 basis point facility fee at our investment grade rating and when applied to our new availability of $600 million would be $1.5 million annually. |
| · | | On October 24, 2017, we entered into a note purchase agreement relating to a private placement of $200 million in an aggregate principal amount of unsecured senior notes, consisting of $116 million in aggregate principal amount of 3.99% Series A Senior Notes with a 7-year maturity and $84 million in aggregate principal amount of 4.26% Series B Senior Notes with a 10-year maturity. On December 20, 2017, we drew the proceeds from the private placement and reduced the outstanding balance on our revolving line of credit. |
| · | | We incurred financing costs to close the BAML Revolver, BAML Term Loan and the BMO Term Loan and the credit facilities that preceded them. We also incurred financing costs in connection with the JPM Term Loan and with the Series A and Series B Senior Notes. These costs are deferred and amortized into interest expense during the terms of the loans. Following the amendments on October 18, 2017 and the note purchase agreement on October 24, 2017, we estimate the annual run rate for amortization to interest expense from these deferred financing costs is approximately $2.9 million. |
| · | | Additional information on these transactions can be found in a Current Report on Form 8-K that the Company filed with the U.S. Securities and Exchange Commission on October 24, 2017. |
| (a) | | Interest rate excludes amortization of deferred financing costs and facility fees, which is discussed in the notes above. |
| |
| Capital Analysis (in thousands, except per share amounts) |
| | | | | | | | | | | | | | | | | |
| | 31-Mar-18 | | | 31-Mar-17 | | 30-Jun-17 | | 30-Sep-17 | | 31-Dec-17 | |
Market Data: | | | | | | | | | | | | | | | | | |
Shares Outstanding | | | 107,231 | | | | 107,231 | | | 107,231 | | | 107,231 | | | 107,231 | |
Closing market price per share | | $ | 8.41 | | | $ | 12.14 | | $ | 11.08 | | $ | 10.62 | | $ | 10.74 | |
Market capitalization | | $ | 901,814 | | | $ | 1,301,786 | | $ | 1,188,121 | | $ | 1,138,795 | | $ | 1,151,663 | |
Total debt outstanding excluding unamortized financing costs | | | 1,068,000 | | | | 1,065,000 | | | 1,065,000 | | | 1,070,000 | | | 1,048,000 | |
Total Market Capitalization | | $ | 1,969,814 | | | $ | 2,366,786 | | $ | 2,253,121 | | $ | 2,208,795 | | $ | 2,199,663 | |
| | | | | | | | | | | | | | | | | |
Dividend Data: | | | | | | | | | | | | | | | | | |
Total dividends declared for the quarter | | $ | 9,650.80 | | | $ | 20,374 | | $ | 20,374 | | $ | 20,374 | | $ | 20,374 | |
Common dividend declared per share | | $ | 0.09 | | | $ | 0.19 | | $ | 0.19 | | $ | 0.19 | | $ | 0.19 | |
Declared dividend as a % of Net income (loss) per share | | | 677% | | | | 455% | | | -117% | | | 1071% | | | -413% | |
Declared dividend as a % of AFFO* per share | | | 57% | | | | 114% | | | 108% | | | 119% | | | 156% | |
| | | | | | | | | | | | | | | | | |
Liquidity: | | | | | | | | | | | | | | | | | |
Cash, cash equivalents and restricted cash | | $ | 14,355 | | | $ | 11,174 | | $ | 11,623 | | $ | 12,710 | | $ | 9,819 | |
Revolver: | | | | | | | | | | | | | | | | | |
Gross potential available under the BAML Revolver | | | 600,000 | | | | 500,000 | | | 500,000 | | | 500,000 | | | 600,000 | |
Less: | | | | | | | | | | | | | | | | | |
Outstanding balance | | | (98,000) | | | | (295,000) | | | (295,000) | | | (300,000) | | | (78,000) | |
Total Liquidity | | $ | 516,355 | | | $ | 216,174 | | $ | 216,623 | | $ | 212,710 | | $ | 531,819 | |
*See page 9 for a reconciliation of Net Income (Loss) to AFFO and the Appendix for Definitions of Non-GAAP Measures beginning on page 27.
| |
| Owned Portfolio Overview |
| | | | | | | | | | | |
| | As of the Quarter Ended | |
| | 31-Mar-18 | | 31-Dec-17 | | 30-Sep-17 | | 30-Jun-17 | | 31-Mar-17 | |
Owned portfolio of commercial real estate: | | | | | | | | | | | |
Number of properties (a) | | 34 | | 34 | | 35 | | 35 | | 35 | |
Square feet | | 9,760,657 | | 9,761,984 | | 10,085,889 | | 10,084,710 | | 10,118,112 | |
Leased percentage | | 88.5% | | 89.7% | | 88.7% | | 88.1% | | 89.6% | |
| | | | | | | | | | | |
Investments in non-consolidated commercial real estate: | | | | | | | | | | | |
Number of properties | | 2 | | 2 | | 2 | | 2 | | 2 | |
Square feet | | 1,396,493 | | 1,396,071 | | 1,396,071 | | 1,396,071 | | 1,396,071 | |
Leased percentage | | 74.4% | | 75.3% | | 79.2% | | 78.9% | | 78.9% | |
| | | | | | | | | | | |
Single Asset REITs (SARs) managed: | | | | | | | | | | | |
Number of properties | | 4 | | 4 | | 4 | | 4 | | 5 | |
Square feet | | 810,278 | | 810,278 | | 810,278 | | 810,278 | | 1,075,135 | |
Leased percentage | | 96.1% | | 93.0% | | 89.9% | | 90.1% | | 89.6% | |
| | | | | | | | | | | |
Total owned, investments and managed properties: | | | | | | | | | | | |
Number of properties | | 40 | | 40 | | 41 | | 41 | | 42 | |
Square feet | | 11,967,428 | | 11,968,333 | | 12,292,238 | | 12,291,059 | | 12,589,318 | |
Leased percentage | | 87.4% | | 88.2% | | 87.7% | | 87.2% | | 88.5% | |
| | | | | | | | | | | |
(a) Excludes one property that was redeveloped and is classified as non-operating. | | | | | | | | | | | |
| |
| Owned Portfolio Overview |
| | | | | | | | | | | | | | | | | | | | | | | | | | | | | | |
| | | | | | | | Percent | | Wtd Occupied | | GAAP | | | | | | | | | | | Percent | | Wtd Occupied | | GAAP | |
MSA / Property Name | | City | | State | | Square Feet | | Leased | | Percentage (a) | | Rent (b) | | | MSA / Property Name | | City | | State | | Square Feet | | Leased | | Percentage (a) | | Rent (b) | |
| | | | | | | | | | | | | | | | | | | | | | | | | | | | | | |
East Region | | | | | | | | | | | | | | | | Midwest Region | | | | | | | | | | | | | | |
| | | | | | | | | | | | | | | | | | | | | | | | | | | | | | |
Washington, D.C. | | | | | | | | | | | | | | | | Chicago | | | | | | | | | | | | | | |
Meadow Point | | Chantilly | | VA | | 138,537 | | 100.0% | | 100.0% | | $ | 27.13 | | | Northwest Point | | Elk Grove Village | | IL | | 177,095 | | 100.0% | | 100.0% | | $ | 33.15 | |
Stonecroft | | Chantilly | | VA | | 111,469 | | 100.0% | | 100.0% | | $ | 38.84 | | | 909 Davis Street | | Evanston | | IL | | 195,098 | | 92.3% | | 78.2% | | $ | 36.79 | |
Loudoun Tech Center | | Dulles | | VA | | 136,658 | | 95.7% | | 95.8% | | $ | 18.64 | | | | | | | | | | | | | | | | | |
| | | | | | | | | | | | | | | | Indianapolis | | | | | | | | | | | | | | |
Richmond | | | | | | | | | | | | | | | | River Crossing | | Indianapolis | | IN | | 205,059 | | 96.1% | | 95.6% | | $ | 23.77 | |
Innsbrook | | Glen Allen | | VA | | 298,456 | | 100.0% | | 100.0% | | $ | 15.15 | | | | | | | | | | | | | | | | | |
| | | | | | | | | | | | | | | | St. Louis | | | | | | | | | | | | | | |
Charlotte | | | | | | | | | | | | | | | | Timberlake | | Chesterfield | | MO | | 234,496 | | 100.0% | | 100.0% | | $ | 30.08 | |
Forest Park | | Charlotte | | NC | | 62,212 | | 100.0% | | 100.0% | | $ | 13.63 | | | Timberlake East | | Chesterfield | | MO | | 117,036 | | 100.0% | | 100.0% | | $ | 30.29 | |
| | | | | | | | | | | | | | | | | | | | | | | | | | | | | | |
Raleigh-Durham | | | | | | | | | | | | | | | | Minneapolis | | | | | | | | | | | | | | |
Emperor Boulevard | | Durham | | NC | | 259,531 | | 100.0% | | 100.0% | | $ | 34.51 | | | 121 South 8th Street | | Minneapolis | | MN | | 293,422 | | 77.7% | | 74.8% | | $ | 21.69 | |
| | | | | | | | | | | | | | | | Plaza Seven | | Minneapolis | | MN | | 326,483 | | 85.9% | | 93.2% | | $ | 34.61 | |
| | | | | | | | | | | | | | | | | | | | | | | | | | | | | | |
| | | | | | | | | | | | | | | | | | | | | | | | | | | | | | |
| | | | | | | | | | | | | | | | | | | | | | | | | | | | | | |
East Region Total | | | | | | 1,006,863 | | 99.4% | | 99.4% | | $ | 24.83 | | | Midwest Region Total | | | | | | 1,548,689 | | 91.3% | | 90.5% | | $ | 30.00 | |
| (a) | | Weighted Occupied Percentage for the three months ended March 31, 2018. |
| (b) | | Weighted Average GAAP Rent per Occupied Square Foot. |
| |
| Owned Portfolio Overview |
| | | | | | | | | | | | | | | | | | | | | | | | | | | | | | |
| | | | | | | | Percent | | Wtd Occupied | | GAAP | | | | | | | | | | | Percent | | Wtd Occupied | | GAAP | |
MSA / Property Name | | City | | State | | Square Feet | | Leased | | Percentage (a) | | Rent (b) | | | MSA / Property Name | | City | | State | | Square Feet | | Leased | | Percentage (a) | | Rent (b) | |
| | | | | | | | | | | | | | | | | | | | | | | | | | | | | | |
South Region | | | | | | | | | | | | | | | | West Region | | | | | | | | | | | | | | |
| | | | | | | | | | | | | | | | | | | | | | | | | | | | | | |
Dallas-Fort Worth | | | | | | | | | | | | | | | | Denver | | | | | | | | | | | | | | |
Legacy Tennyson Center | | Plano | | TX | | 202,600 | | 86.4% | | 69.4% | | $ | 19.13 | | | 380 Interlocken | | Broomfield | | CO | | 240,358 | | 86.2% | | 86.2% | | $ | 30.32 | |
One Legacy Circle | | Plano | | TX | | 214,110 | | 100.0% | | 100.0% | | $ | 37.67 | | | 1999 Broadway | | Denver | | CO | | 676,379 | | 80.6% | | 77.5% | | $ | 30.21 | |
Addison Circle | | Addison | | TX | | 288,794 | | 100.0% | | 89.3% | | $ | 33.50 | | | Greenwood Plaza | | Englewood | | CO | | 196,236 | | 100.0% | | 100.0% | | $ | 25.13 | |
Collins Crossing | | Richardson | | TX | | 300,887 | | 100.0% | | 100.0% | | $ | 24.32 | | | 390 Interlocken | | Broomfield | | CO | | 241,512 | | 97.8% | | 97.8% | | $ | 30.78 | |
Liberty Plaza | | Addison | | TX | | 218,934 | | 84.5% | | 88.6% | | $ | 22.22 | | | 1001 17th Street | | Denver | | CO | | 655,413 | | 96.8% | | 92.8% | | $ | 35.26 | |
| | | | | | | | | | | | | | | | 600 17th Street | | Denver | | CO | | 598,626 | | 84.6% | | 85.1% | | $ | 32.63 | |
Houston | | | | | | | | | | | | | | | | West Region Total | | | | | | 2,608,524 | | 89.2% | | 87.4% | | $ | 31.73 | |
Park Ten | | Houston | | TX | | 157,460 | | 75.8% | | 68.6% | | $ | 29.13 | | | | | | | | | | | | | | | | | |
Eldridge Green | | Houston | | TX | | 248,399 | | 100.0% | | 100.0% | | $ | 30.51 | | | Total Owned | | | | | | 9,760,657 | | 88.5% | | 87.1% | | $ | 29.05 | |
Park Ten Phase II | | Houston | | TX | | 156,746 | | 1.4% | | 1.4% | | $ | 2.80 | | | | | | | | | | | | | | | | | |
Westchase I & II | | Houston | | TX | | 629,025 | | 86.0% | | 83.4% | | $ | 28.65 | | | | | | | | | | | | | | | | | |
| | | | | | | | | | | | | | | | | | | | | | | | | | | | | | |
Miami-Ft. Lauderdale-West Palm Beach | | | | | | | | | | | | | | | | | | | | | | | | | | | | | | |
Blue Lagoon Drive | | Miami | | FL | | 212,619 | | 100.0% | | 100.0% | | $ | 22.49 | | | | | | | | | | | | | | | | | |
| | | | | | | | | | | | | | | | | | | | | | | | | | | | | | |
Atlanta | | | | | | | | | | | | | | | | | | | | | | | | | | | | | | |
One Overton Park | | Atlanta | | GA | | 387,267 | | 61.1% | | 61.1% | | $ | 23.71 | | | | | | | | | | | | | | | | | |
One Ravinia | | Atlanta | | GA | | 386,602 | | 92.4% | | 91.1% | | $ | 25.31 | | | | | | | | | | | | | | | | | |
Two Ravinia | | Atlanta | | GA | | 411,047 | | 76.0% | | 74.0% | | $ | 27.07 | | | | | | | | | | | | | | | | | |
Pershing Plaza | | Atlanta | | GA | | 160,145 | | 97.4% | | 97.4% | | $ | 35.75 | | | | | | | | | | | | | | | | | |
999 Peachtree | | Atlanta | | GA | | 621,946 | | 88.6% | | 90.5% | | $ | 31.46 | | | | | | | | | | | | | | | | | |
South Region Total | | | | | | 4,596,581 | | 84.9% | | 83.0% | | $ | 28.20 | | | | | | | | | | | | | | | | | |
| (a) | | Weighted Occupied Percentage for the three months ended March 31, 2018. |
| (b) | | Weighted Average GAAP Rent per Occupied Square Foot. |
| |
| Managed Portfolio Overview |
| | | | | | | | | | | | | | | | | |
MSA / Property Name | | City | | State | | Square Feet | | | | MSA / Property Name | | City | | State | | Square Feet | |
| | | | | | | | | | | | | | | | | |
Southeast Region | | | | | | | | | | Midwest Region | | | | | | | |
| | | | | | | | | | | | | | | | | |
Atlanta | | | | | | | | | | Chicago | | | | | | | |
Satellite Place | | Duluth | | GA | | 134,785 | | | (a) | East Wacker | | Chicago | | IL | | 861,422 | |
| | | | | | | | | | | | | | | | | |
| | | | | | | | | | Indianapolis | | | | | | | |
| | | | | | | | | | Monument Circle | | Indianapolis | | IN | | 213,760 | |
Southeast Region Total | | | | | | 134,785 | | | | | | | | | | | |
| | | | | | | | | | Kansas City | | | | | | | |
| | | | | | | | | (b) | Grand Boulevard | | Kansas City | | MO | | 535,071 | |
| | | | | | | | | | | | | | | | | |
Southwest Region | | | | | | | | | | Cincinnati | | | | | | | |
| | | | | | | | | | Centre Pointe V | | West Chester | | OH | | 135,936 | |
Houston | | | | | | | | | | | | | | | | | |
Energy Tower I | | Houston | | TX | | 325,797 | | | | | | | | | | | |
| | | | | | | | | | | | | | | | | |
| | | | | | | | | | | | | | | | | |
| | | | | | | | | | | | | | | | | |
Southwest Region Total | | | | | | 325,797 | | | | Midwest Region Total | | | | | | 1,746,189 | |
| | | | | | | | | | | | | | | | | |
| | | | | | | | | | Total Managed | | | | | | 2,206,771 | |
| | | | | | | | | | | | | | | | | |
| | | | | | | | | | Total Owned & Managed | | | | | | 11,967,428 | |
| (a) | | FSP has a Preferred Share Interest of 43.7% in the entity that owns this property. |
| (b) | | FSP has a Preferred Share Interest of 27.0% in the entity that owns this property. |
| |
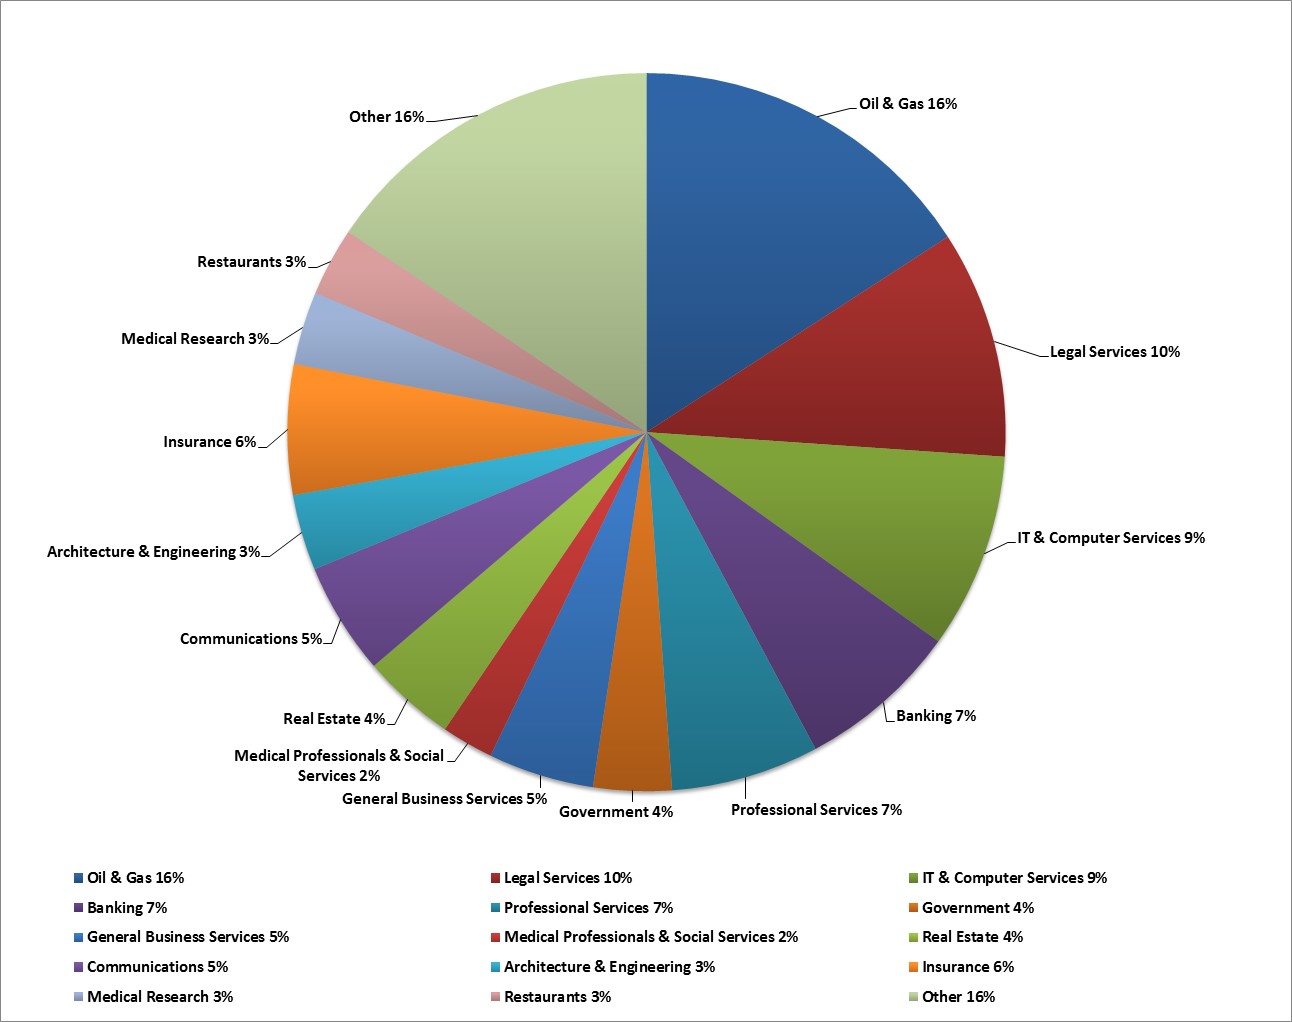
| Tenants by Industry (By Square Feet) |
| |
| 20 Largest Tenants with Annualized Rent and Remaining Term |
| | | | | | | | | | | | | | | | |
| | | | | | Remaining | | Aggregate | | | | | | % of Aggregate | |
| | Tenant | | Number of | | Lease Term | | Leased | | % of Total | | Annualized | | Leased | |
| | Name | | Leases | | in Months | | Square Feet | | Square Feet | | Rent | | Annualized Rent | |
| | | | | | | | | | | | | | | | |
1 | | Quintiles IMS Healthcare Incorporated | | 1 | | 98 | | 259,531 | | 2.7% | | $ | 9,168,715 | | 3.7% | |
2 | | US Government (a) | | 4 | | 2, 17, 30, 34 | | 250,520 | | 2.6% | | | 7,718,222 | | 3.1% | |
3 | | CITGO Petroleum Corporation | | 1 | | 47 | | 248,399 | | 2.5% | | | 8,385,950 | | 3.4% | |
4 | | Newfield Exploration Company | | 1 | | 47 | | 234,495 | | 2.4% | | | 9,164,598 | | 3.7% | |
5 | | Centene Management Company, LLC | | 3 | | 63, 63, 63 | | 216,879 | | 2.2% | | | 5,582,310 | | 2.2% | |
6 | | Burger King Corporation | | 1 | | 6 | | 212,619 | | 2.2% | | | 5,351,620 | | 2.2% | |
7 | | Eversheds Sutherland (US) LLP | | 1 | | 97 | | 179,868 | | 1.8% | | | 5,334,134 | | 2.1% | |
8 | | EOG Resources, Inc. | | 1 | | 105 | | 160,937 | | 1.6% | | | 5,268,843 | | 2.1% | |
9 | | T-Mobile South, LLC dba T-Mobile | | 1 | | 11 | | 151,792 | | 1.6% | | | 3,969,427 | | 1.6% | |
10 | | Citicorp Credit Services, Inc. | | 1 | | 113 | | 146,260 | | 1.5% | | | 4,886,547 | | 2.0% | |
11 | | Petrobras America, Inc. | | 1 | | 20 | | 144,813 | | 1.5% | | | 5,372,562 | | 2.2% | |
12 | | Jones Day | | 1 | | 32 | | 140,342 | | 1.4% | | | 4,919,841 | | 2.0% | |
13 | | Argo Data Resource Corporation | | 1 | | 65 | | 140,246 | | 1.4% | | | 3,973,169 | | 1.6% | |
14 | | Vail Corp d/b/a Vail Resorts (b) | | 3 | | 12, 60, 60 | | 132,229 | | 1.4% | | | 4,028,722 | | 1.6% | |
15 | | SunTrust Bank | | 1 | | 6 | | 127,500 | | 1.3% | | | 4,623,150 | | 1.9% | |
16 | | Federal National Mortgage Association | | 1 | | 6 | | 123,144 | | 1.3% | | | 4,483,673 | | 1.8% | |
17 | | Kaiser Foundation Health Plan | | 1 | | 74 | | 120,979 | | 1.2% | | | 3,262,715 | | 1.3% | |
18 | | Giesecke & Devrient America | | 1 | | 81 | | 112,110 | | 1.1% | | | 2,071,793 | | 0.8% | |
19 | | Northrup Grumman Systems Corp. | | 1 | | 21 | | 111,469 | | 1.1% | | | 4,702,115 | | 1.9% | |
20 | | ADS Alliance Data Systems, Inc. | | 1 | | 99 | | 107,698 | | 1.1% | | | 3,872,654 | | 1.6% | |
| | | | | | | | | | | | | | | | |
| | | | | | Total | | 3,321,830 | | 34.0% | | $ | 106,140,759 | | 42.7% | |
| (a) | | Includes 180,444 square feet, which expire in 2018. The remaining 70,060 square feet expire between 2019 and 2021. |
| (b) | | Includes 38,293 square feet, which expire 3/31/19. The remaining 93,936 square feet expire 3/31/23. |
| |
| Leasing Activity (Owned Portfolio) |
| | | | | | | | | | | | | |
| | | | | | | Year | | Year |
| | Three Months Ended | | | Ended | | Ended |
Leasing Activity | | | 31-Mar-18 | | | 31-Mar-17 | | | | 31-Dec-17 | | | 31-Dec-16 |
(in Square Feet - SF) | | | | | | | | | | | | | |
New leasing | | | 84,000 | | | 62,000 | | | | 460,000 | | | 299,000 |
Renewals and expansions | | | 25,000 | | | 144,000 | | | | 1,011,000 | | | 895,000 |
| | | 109,000 | | | 206,000 | | | | 1,471,000 | | | 1,194,000 |
| | | | | | | | | | | | | |
Other information per SF | | | | | | | | | | | | | |
(Activity on a year-to-date basis) | | | | | | | | | | | | | |
GAAP Rents on leasing | | $ | 30.42 | | $ | 28.36 | | | $ | 30.43 | | $ | 29.64 |
Weighted average lease term | | | 5.9 Years | | | 5.6 Years | | | | 6.8 Years | | | 6.6 Years |
| | | | | | | | | | | | | |
Increase or decrease over average GAAP rents in prior year (1) | | | -2.9% | | | 7.4% | | | | 12.3% | | | 10.4% |
| | | | | | | | | | | | | |
Average free rent | | | 2 Months | | | 3 Months | | | | 4 Months | | | 3 Months |
Tenant Improvements | | $ | 26.35 | | $ | 23.02 | | | $ | 22.22 | | $ | 18.71 |
Leasing Costs | | $ | 8.18 | | $ | 8.32 | | | $ | 9.92 | | $ | 10.05 |
| | | | | | | | | | | | | |
(1) The increase or decrease percentage is calculated by comparing average GAAP rents at | | | | | | | | | | | | | |
properties that had leasing activity in the current year to average GAAP rents at the same | | | | | | | | | | | | | |
properties in the prior year. | | | | | | | | | | | | | |
| |
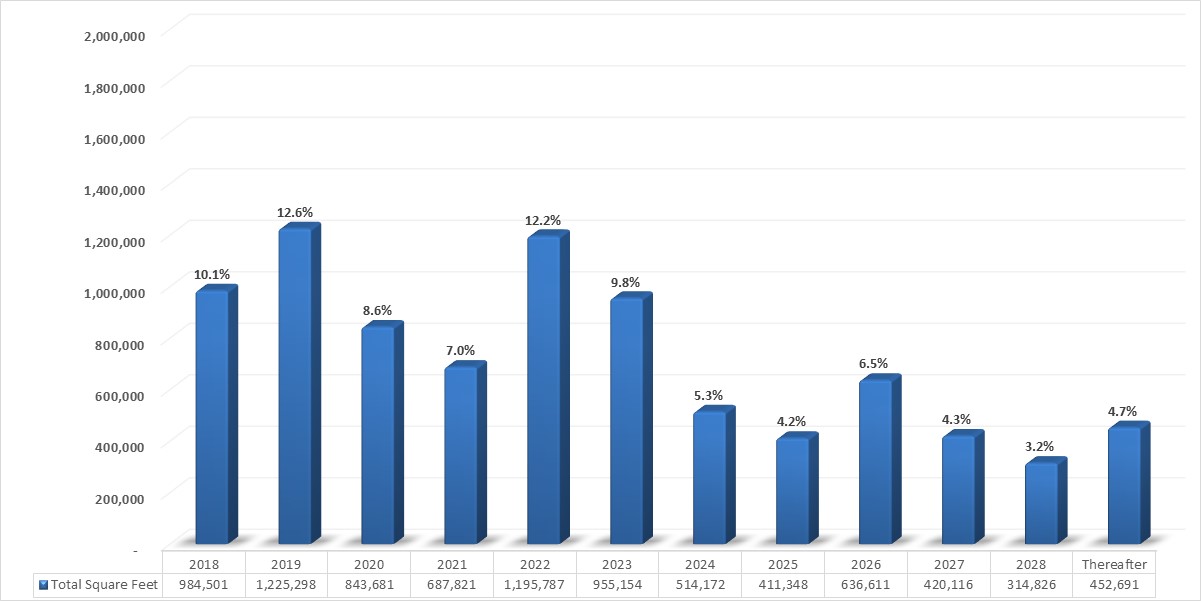
| Lease Expirations by Square Feet (Owned Portfolio) |
| |
| Lease Expirations with Annualized Rent per Square Foot (Owned Portfolio) |
| | | | | | | | | | | | | | |
| | | | Rentable | | | | | Annualized | | Percentage | | |
| | Number of | | Square | | | | | Rent | | of Total | | |
Year of | | Leases | | Footage | | Annualized | | Per Square | | Annualized | | |
Lease | | Expiring | | Subject to | | Rent Under | | Foot Under | | Rent Under | | |
Expiration | | Within the | | Expiring | | Expiring | | Expiring | | Expiring | Cumulative | |
December 31, | | Year (a) | | Leases | | Leases (b) | | Leases | | Leases | Total | |
| | | | | | | | | | | | | | |
2018 | | 52 | (c) | 984,501 | | $ | 31,402,783 | | $ | 31.90 | | 12.6% | 12.6% | |
2019 | | 65 | | 1,225,298 | | | 36,272,642 | | | 29.60 | | 14.6% | 27.2% | |
2020 | | 66 | | 843,681 | | | 27,964,284 | | | 33.15 | | 11.2% | 38.4% | |
2021 | | 59 | | 687,821 | | | 18,844,368 | | | 27.40 | | 7.6% | 46.0% | |
2022 | | 63 | | 1,195,787 | | | 38,685,025 | | | 32.35 | | 15.6% | 61.6% | |
2023 | | 58 | | 955,154 | | | 23,617,849 | | | 24.73 | | 9.5% | 71.1% | |
2024 | | 26 | | 514,172 | | | 15,474,895 | | | 30.10 | | 6.2% | 77.3% | |
2025 | | 19 | | 411,348 | | | 10,302,904 | | | 25.05 | | 4.1% | 81.4% | |
2026 | | 11 | | 636,611 | | | 20,625,233 | | | 32.40 | | 8.3% | 89.7% | |
2027 | | 6 | | 420,116 | | | 13,162,617 | | | 31.33 | | 5.3% | 95.0% | |
2028 and thereafter | | 89 | | 767,517 | (d) | | 12,403,633 | | | 16.16 | | 5.0% | 100.0% | |
| | 514 | | 8,642,006 | | $ | 248,756,234 | | $ | 28.78 | | 100.0% | | |
Vacancies as of 3/31/18 | | | | 1,118,651 | | | | | | | | | | |
Total Portfolio Square Footage | | | | 9,760,657 | | | | | | | | | | |
| (a) | | The number of leases approximates the number of tenants. Tenants with lease maturities in different years are included in annual totals for each lease. Tenants may have multiple leases in the same year. |
| (b) | | Annualized rent represents the monthly rent charged, including tenant reimbursements, for each lease in effect at March 31, 2018 multiplied by 12. Tenant reimbursements generally include payment of real estate taxes, operating expenses and common area maintenance and utility charges. |
| (c) | | Includes 10 leases that are month-to-month. |
| (d) | | Includes 115,452 square feet that are non-revenue producing building amenities. |
| |
| Capital Expenditures |
| | | |
(in thousands) | | |
| | For the Three Months Ended |
| | 31-Mar-18 |
| | | |
Tenant improvements | | $ | 6,777 |
Deferred leasing costs | | | 1,021 |
Non-investment capex | | | 1,858 |
Total Capital Expenditures | | $ | 9,656 |
| | | | | | | | | | | | | | | |
| | For the Three Months Ended | | Year ended |
| | 31-Mar-17 | | 30-Jun-17 | | 30-Sep-17 | | 31-Dec-17 | | 31-Dec-17 |
| | | | | | | | | | | | | | | |
Tenant improvements | | $ | 6,474 | | $ | 5,363 | | $ | 4,474 | | $ | 4,166 | | $ | 20,477 |
Deferred leasing costs | | | 1,579 | | | 1,963 | | | 4,482 | | | 5,869 | | | 13,893 |
Non-investment capex | | | 1,670 | | | 1,685 | | | 1,860 | | | 3,836 | | | 9,051 |
Total Capital Expenditures | | $ | 9,723 | | $ | 9,011 | | $ | 10,816 | | $ | 13,871 | | $ | 43,421 |
First generation leasing and investment capital was $1.4 million for the first quarter ended March 31, 2018 and $25.0 million for the year ended December 31, 2017.
| |
| Transaction Activity (in thousands except for Square Feet) |
| | | | | | | | | | | | |
| | City | | State | | Square Feet | | Date Acquired | | Purchase Price | |
2016 | | | | | | | | | | | | |
Plaza Seven | | Minneapolis | | MN | | 325,796 | | 6/6/16 | | $ | 82,000 | |
Pershing Plaza | | Atlanta | | GA | | 160,145 | | 8/10/16 | | | 45,450 | |
600 17th Street | | Denver | | CO | | 613,527 | | 12/1/16 | | | 154,260 | |
| | | | | | | | | | | | |
2015 | | | | | | | | | | | | |
Two Ravinia | | Atlanta | | GA | | 442,130 | | 4/8/15 | | $ | 78,000 | |
| | | | | | | | | | | | |
| | | | | | | | | | | | |
| | | | | | | | | | | | | | | |
| | | | | | | | | | Gross Sale | | Gain (loss) | |
| | City | | State | | Square Feet | | Date Sold | | Proceeds | | on Sale | |
2017 | | | | | | | | | | | | | | | |
Hillview | | Milpitas | | CA | | 36,288 | | 1/6/17 | | $ | 6,342 | | $ | 2,289 | |
East Baltimore | | Baltimore | | MD | | 325,445 | | 10/20/17 | | | 32,547 | | | (20,770) | |
| | | | | | | | | | | | | | | |
2016 | | | | | | | | | | | | | | | |
Lakeside I | | Maryland Heights | | MO | | 127,778 | | 4/5/16 | | $ | 20,189 | | $ | 4,154 | |
Federal Way | | Federal Way | | WA | | 117,010 | | 12/16/16 | | | 7,500 | | | (7,092) | |
| | | | | | | | | | | | | | | |
2015 | | | | | | | | | | | | | | | |
Willow Bend | | Plano | | TX | | 117,050 | | 2/23/15 | | $ | 20,750 | | $ | 1,462 | |
Eden Bluff | | Eden Prairie | | MN | | 153,028 | | 3/31/15 | | | 28,000 | | | 9,000 | |
Park Seneca | | Charlotte | | NC | | 109,699 | | 5/13/15 | | | 8,150 | | | 949 | |
Montague | | San Jose | | CA | | 145,561 | | 12/9/15 | | | 30,250 | | | 12,251 | |
| |
| Loan Portfolio of Secured Real Estate (in thousands) |
| | | | | | | | | | | | | | | | | | | |
(dollars in thousands) | | | | | | Maximum | | Amount | | | | | | | | Interest | |
| | | | Maturity | | Amount | | Drawn at | | Interest | | Draw | | Rate at | |
Sponsored REIT | | Location | | Date | | of Loan | | 31-Mar-18 | | Rate (1) | | Fee (2) | | 31-Mar-18 | |
| | | | | | | | | | | | | | | | | | | |
Secured revolving lines of credit | | | | | | | | | | | | | | | | | | | |
FSP Satellite Place Corp. | | Duluth, GA | | 31-Dec-19 | | $ | 5,500 | | $ | 1,855 | | L | + | 4.40% | | 0.5% | | 6.09% | |
FSP Energy Tower I Corp. | | Houston, TX | | 30-Jun-19 | | | 20,000 | | | 15,600 | | L | + | 5.00% | | 0.5% | | 6.69% | |
| | | | | | | | | | | | | | | | | | | |
Mortgage loan secured by property | | | | | | | | | | | | | | | | | | | |
FSP Monument Circle LLC (3) | | Indianapolis, IN | | 7-Dec-18 | | | 21,000 | | | 21,000 | | | | 4.90% | | n/a | | 4.90% | |
FSP Energy Tower I Corp. (4) | | Houston, TX | | 30-Jun-19 | | | 33,000 | | | 33,000 | | | | 6.41% | | n/a | | 6.41% | |
| | | | | | | | | | | | | | | | | | | |
| | | | | | $ | 79,500 | | $ | 71,455 | | | | | | | | | |
| (1) | | The interest rate is 30-day LIBOR rate plus the additional rate indicated, otherwise a fixed rate. |
| (2) | | The draw fee is a percentage of each new advance, and is paid at the time of each new draw. |
| (3) | | Includes an origination fee of $164,000 and an exit fee of $38,000 when repaid by the borrower. |
| (4) | | This mortgage includes an annual extension fee of $108,900 paid by the borrower. |
| |
| Net Asset Value Components |
| | | | | | | | | | | | | | | |
(in thousands except per share data) | | | | | | | | | | | | | | | |
| | As of | | | Assets: | | | | | | Other information: | | | |
| | 31-Mar-18 | | | Loans outstanding on secured RE | | $ | 71,455 | | | Leased SF to be FFO producing | | | |
Total Market Capitalization Values | | | | | | Investments in SARs (book basis) | | | 69,703 | | | During 2018 (in 000's) | | | 172 |
Shares outstanding | | | 107,231.2 | | | Straight-line rent receivable | | | 53,430 | | | | | | |
Closing price | | $ | 8.41 | | | Asset held for sale | | | — | | | Straight-line rental revenue current quarter | | $ | (40) |
Market capitalization | | $ | 901,814 | | | Cash, cash equivalents and restricted cash | | | 14,355 | | | | | | |
Debt | | | 1,068,000 | | | Tenant rent receivables | | | 3,411 | | | Management fee income current quarter | | $ | 136 |
Total Market Capitalization | | $ | 1,969,814 | | | Prepaid expenses | | | 3,623 | | | Interest income from secured loans | | | 1,120 |
| | | | | | Office computers and furniture | | | 261 | | | Management fees and interest income from loans | | $ | 1,256 |
| | | | | | Other assets: | | | | | | | | | |
| | 3 Months | | | Deferred financing costs, net | | | 10,746 | | | FFO from non-consolidated REITs - Q4 2017 (6): | | | |
| | Ended | | | Other assets: Derivative Market Value | | | 18,740 | | | East Wacker | | $ | 685 |
NOI Components | | 31-Mar-18 | | | Other assets | | | — | | | Grand Boulevard | | | 23 |
| | | | | | | | $ | 245,724 | | | Total | | $ | 708 |
Same Store NOI (1) | | $ | 36,637 | | | | | | | | | | | | |
Acquisitions (1) (2) | | | — | | | Liabilities: | | | | | | Footnotes to the components | | | |
Property NOI (1) | | | 36,637 | | | Debt (excluding contra for unamortized financing costs) | | $ | 1,068,000 | | | | | | |
Full quarter adjustment (3) | | | — | | | Accounts payable & accrued expenses | | | 54,439 | | | (1) See pages 11 & 28 for definitions and reconciliations. |
Stabilized portfolio | | $ | 36,637 | | | Tenant security deposits | | | 5,588 | | | |
| | | | | | Other liabilities: derivative liability | | | — | | | (2) Includes NOI from acquisitions not in Same Store. |
| | | | | | | | $ | 1,128,027 | | | |
Financial Statement Reconciliation: | | | | | | | | | | | | (3) Adjustment to reflect property NOI for a full quarter in the quarter acquired, if necessary. |
Rental Revenue | | $ | 65,628 | | | | | | | | | |
Rental operating expenses | | | (17,151) | | | | | | | | | (4) HB3 Tax in Texas is classified as an income tax, though we treat it as a real estate tax in Property NOI. |
Real estate taxes and insurance | | | (11,177) | | | | | | | | | |
NOI on assets sold | | | (79) | | | | | | | | | (5) Management & other fees are eliminated in consolidation but included in Property NOI. |
Taxes (4) | | | (82) | | | | | | | | | |
Management fees & other (5) | | | (502) | | | | | | | | | (6) We report FFO from non-consolidated REITs for the previous quarter as their financial statements are not yet complete for the current quarter. |
Property NOI (1) | | $ | 36,637 | | | | | | | | | | | | |
| |
| Appendix: Non-GAAP Financial Measure Definitions |
Definition of Funds From Operations (“FFO”)
The Company evaluates performance based on Funds From Operations, which we refer to as FFO, as management believes that FFO represents the most accurate measure of activity and is the basis for distributions paid to equity holders. The Company defines FFO as net income or loss (computed in accordance with GAAP), excluding gains (or losses) from sales of property, hedge ineffectiveness and acquisition costs of newly acquired properties that are not capitalized, plus depreciation and amortization, including amortization of acquired above and below market lease intangibles and impairment charges on properties or investments in non-consolidated REITs, and after adjustments to exclude equity in income or losses from, and, to include the proportionate share of FFO from, non-consolidated REITs.
FFO should not be considered as an alternative to net income or loss (determined in accordance with GAAP), nor as an indicator of the Company’s financial performance, nor as an alternative to cash flows from operating activities (determined in accordance with GAAP), nor as a measure of the Company’s liquidity, nor is it necessarily indicative of sufficient cash flow to fund all of the Company’s needs.
Other real estate companies and the National Association of Real Estate Investment Trusts, or NAREIT, may define this term in a different manner. We have included the NAREIT FFO definition as of May 17, 2016 in the table on page 9 and note that other REITs may not define FFO in accordance with the current NAREIT definition or may interpret the current NAREIT definition differently than we do.
We believe that in order to facilitate a clear understanding of the results of the Company, FFO should be examined in connection with net income or loss and cash flows from operating, investing and financing activities in the consolidated financial statements.
| |
| Appendix: Non-GAAP Financial Measure Definitions |
Definition of Earnings before Interest, Taxes, Depreciation and Amortization (EBITDA)
and Adjusted EBITDA
EBITDA is defined as net income or loss plus interest expense, income tax expense and depreciation and amortization expense. Adjusted EBITDA is defined as EBITDA excluding hedge ineffectiveness, gains and losses on sales of properties or shares of equity investments or provisions for losses on assets held for sale or equity investments. EBITDA and Adjusted EBITDA are not intended to represent cash flow for the period, are not presented as an alternative to operating income as an indicator of operating performance, should not be considered in isolation or as a substitute for measures of performance prepared in accordance with GAAP and are not indicative of operating income or cash provided by operating activities as determined under GAAP. EBITDA and Adjusted EBITDA are presented solely as a supplemental disclosure with respect to liquidity because the Company believes it provides useful information regarding the Company's ability to service or incur debt. Because all companies do not calculate EBITDA or Adjusted EBITDA the same way, this presentation may not be comparable to similarly titled measures of other companies. The Company believes that net income or loss is the financial measure calculated and presented in accordance with GAAP that is most directly comparable to EBITDA and Adjusted EBITDA.
Definition of Property Net Operating Income (Property NOI)
The Company provides property performance based on Net Operating Income, which we refer to as NOI. Management believes that investors are interested in this information. NOI is a non-GAAP financial measure that the Company defines as net income or loss (the most directly comparable GAAP financial measure) plus general and administrative expenses, depreciation and amortization, including amortization of acquired above and below market lease intangibles and impairment charges, interest expense, less equity in earnings of nonconsolidated REITs, interest income, management fee income, hedge ineffectiveness, gains or losses on the sale of assets and excludes non-property specific income and expenses. The information presented includes footnotes and the data is shown by region with properties owned in the periods presented, which we call Same Store. The comparative Same Store results include properties held for the periods presented and exclude properties that are non-operating, being developed or redeveloped, dispositions and significant nonrecurring income such as bankruptcy settlements and lease termination fees. NOI, as defined by the Company, may not be comparable to NOI reported by other REITs that define NOI differently. NOI should not be considered an alternative to net income or loss as an indication of our performance or to cash flows as a measure of the Company's liquidity or its ability to make distributions.
| |
| Appendix: Non-GAAP Financial Measure Definitions |
Definition of Adjusted Funds From Operations (AFFO)
The Company also evaluates performance based on Adjusted Funds From Operations, which we refer to as AFFO. The Company defines AFFO as (1) FFO, (2) excluding our proportionate share of FFO and including distributions received, from non-consolidated REITs, (3) excluding the effect of straight-line rent, (4) plus deferred financing costs and (5) less recurring capital expenditures that are generally for maintenance of properties, which we call non-investment capex or are second generation capital expenditures. Second generation costs include re-tenanting space after a tenant vacates, which include tenant improvements and leasing commissions.
We exclude development/redevelopment activities, capital expenditures planned at acquisition and costs to reposition a property. We also exclude first generation leasing costs, which are generally to fill vacant space in properties we acquire or were planned for at acquisition.
AFFO should not be considered as an alternative to net income or loss (determined in accordance with GAAP), nor as an indicator of the Company’s financial performance, nor as an alternative to cash flows from operating activities (determined in accordance with GAAP), nor as a measure of the Company’s liquidity, nor is it necessarily indicative of sufficient cash flow to fund all of the Company’s needs. Other real estate companies may define this term in a different manner. We believe that in order to facilitate a clear understanding of the results of the Company, AFFO should be examined in connection with net income or loss and cash flows from operating, investing and financing activities in the consolidated financial statements.
Investor Relations Contact
Georgia Touma | 877.686.9496
InvestorRelations@fspreit.com
| Franklin Street Properties Corp. 401 Edgewater Place ● Wakefield, MA 01880 (781) 557-1300 ● www.fspreit.com |
|