Searchable text section of graphics shown above
[LOGO] | | Solutions for a nanoscale world. | |
[GRAPHIC] | | VEECO’S 2005
FINANCIAL MODEL
Updated 10/24/05 | |
| | • Revenue (by Business Segment) | |
| | | |
| | • Gross Margin | |
| | | |
| | • Profitability | |
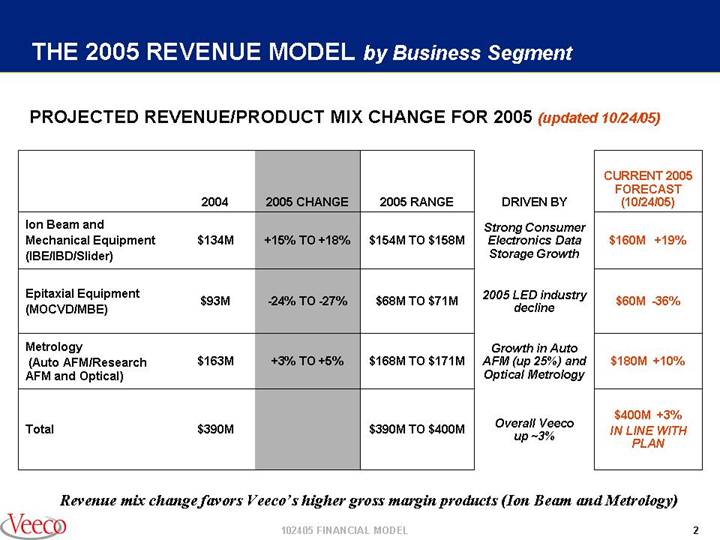
THE 2005 REVENUE MODEL by Business Segment
PROJECTED REVENUE/PRODUCT MIX CHANGE FOR 2005 (updated 10/24/05)
| | | | | | | | | | CURRENT 2005 |
| | | | | | | | | | FORECAST |
| | 2004 | | 2005 CHANGE | | 2005 RANGE | | DRIVEN BY | | (10/24/05) |
| | | | | | | | | | |
Ion Beam and
Mechanical Equipment
(IBE/IBD/Slider) | | $ | 134M | | +15% TO +18% | | $154M TO $158M | | Strong Consumer
Electronics Data
Storage Growth | | $160M +19% |
| | | | | | | | | | | |
Epitaxial Equipment
(MOCVD/MBE) | | $ | 93M | | -24% TO -27% | | $68M TO $71M | | 2005 LED industry
decline | | $60M -36% |
| | | | | | | | | | | |
Metrology
(Auto AFM/Research
AFM and Optical) | | $ | 163M | | +3% TO +5% | | $168M TO $171M | | Growth in Auto
AFM (up 25%) and
Optical Metrology | | $180M +10% |
| | | | | | | | | | | |
Total | | $ | 390M | | | | $390M TO $400M | | Overall Veeco
up ~3% | | $400M +3%
IN LINE WITH
PLAN |
Revenue mix change favors Veeco’s higher gross margin products (Ion Beam and Metrology)
[LOGO] | 102405 FINANCIAL MODEL | |
2
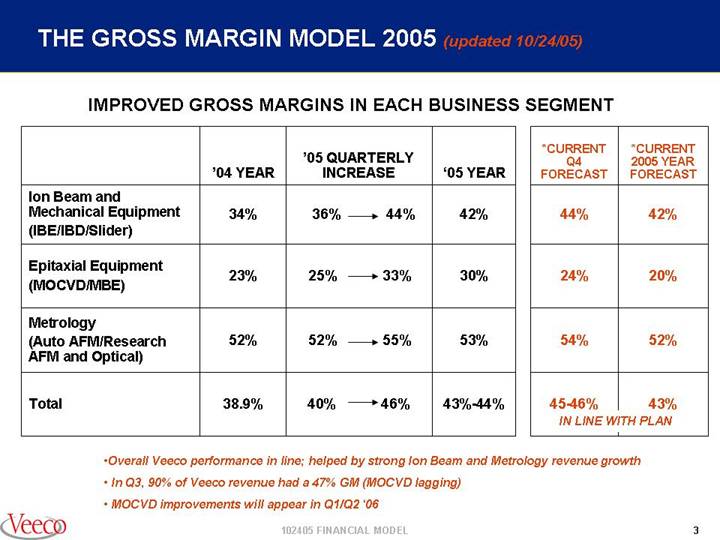
THE GROSS MARGIN MODEL 2005 (updated 10/24/05)
IMPROVED GROSS MARGINS IN EACH BUSINESS SEGMENT
| | | | | | | | *CURRENT | | *CURRENT |
| | | | ’05 QUARTERLY | | | | Q4 | | 2005 YEAR |
| | ’04 YEAR | | INCREASE | | ‘05 YEAR | | FORECAST | | FORECAST |
| | | | | | | | | | |
Ion Beam and
Mechanical Equipment
(IBE/IBD/Slider) | | 34% | | 36% --> 44% | | 42% | | 44% | | 42% |
| | | | | | | | | | |
EpitaxialEquipment
(MOCVD/MBE) | | 23% | | 25% --> 33% | | 30% | | 24% | | 20% |
| | | | | | | | | | |
Metrology
(Auto AFM/Research
AFM and Optical) | | 52% | | 52% --> 55% | | 53% | | 54% | | 52% |
| | | | | | | | | | |
Total | | 38.9% | | 40% --> 46% | | 43%-44% | | 45-46% | | 43% |
| | | | | | | | IN LINE WITH PLAN |
• Overall Veeco performance in line; helped by strong Ion Beam and Metrology revenue growth
• In Q3, 90% of Veeco revenue had a 47% GM (MOCVD lagging)
• MOCVD improvements will appear in Q1/Q2 ‘06
3
“THE 2005 INCOME MODEL” | | Q3 marks the fourth consecutive quarter of improved GROSS
MARGIN, while EBITA has improved each quarter of 2005 |
IMPROVE GROSS MARGINS 2% PER QUARTER
| | Q1 | | Q2 | | Q3 | | Q4 | | 2005 YR | | 2004 YR | |
| | | | | | | | | | | | | |
Sales | | 100% | | 100% | | 100% | | 100% | | 100% | | 100% | |
| | | | | | | | | | | | | |
Gross Margin | | 40% | | 42% | | 44% | | 46% | | 44% | | 40% | |
| | | | | | | | | | | | | |
Operating Expenses | | 37% | | 37% | | 36% | | 36% | | 36% | | 36% | |
| | | | | | | | | | | | | |
EBITA | | 3%
2.8%
Actual | | 6%
6%
Actual | | 8%
8.2%
Actual | | 10%
Forecast | | $25M-$27M
7%-8%
Forecast | | $13.9M
4%
Actual | |
Forecasted EBITA nearly doubles (’05 vs ’04)
Quarterly profitability improves consistent with original profit growth initiative
4
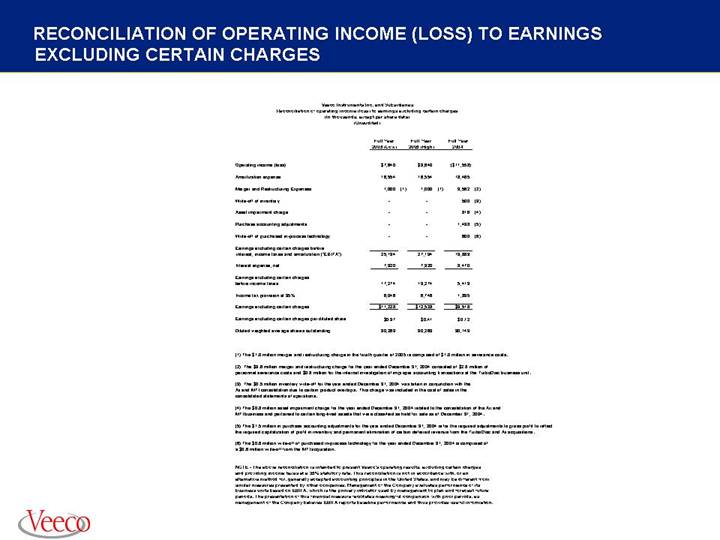
RECONCILIATION OF OPERATING INCOME (LOSS) TO EARNINGS EXCLUDING CERTAIN CHARGES
Veeco Instruments Inc. and Subsidiaries
Reconciliation of operating income (loss) to earnings excluding certain charges
(In thousands, except per share data)
(Unaudited)
| | Full Year
2005 (Low) | | Full Year
2005 (High) | | Full Year
2004 | |
| | | | | | | |
Operating income (loss) | | $ | 7,640 | | $ | 9,640 | | $ | (11,558 | ) |
| | | | | | | |
Amortization expense | | 16,554 | | 16,554 | | 18,465 | |
| | | | | | | |
Merger and Restructuring Expenses | | 1,000 | (1) | 1,000 | (1) | 3,562 | (2) |
| | | | | | | |
Write-off of inventory | | — | | — | | 500 | (3) |
| | | | | | | |
Asset impairment charge | | — | | — | | 816 | (4) |
| | | | | | | |
Purchase accounting adjustments | | — | | — | | 1,498 | (5) |
| | | | | | | |
Write-off of purchased in-process technology | | — | | — | | 600 | (6) |
| | | | | | | |
Earnings excluding certain charges before interest, income taxes and amortization (“EBITA”) | | 25,194 | | 27,194 | | 13,883 | |
| | | | | | | |
Interest expense, net | | 7,920 | | 7,920 | | 8,470 | |
| | | | | | | |
Earnings excluding certain charges before income taxes | | 17,274 | | 19,274 | | 5,413 | |
| | | | | | | |
Income tax provision at 35% | | 6,046 | | 6,746 | | 1,895 | |
| | | | | | | |
Earnings excluding certain charges | | $ | 11,228 | | $ | 12,528 | | $ | 3,518 | |
| | | | | | | |
Earnings excluding certain charges per diluted share | | $ | 0.37 | | $ | 0.41 | | $ | 0.12 | |
| | | | | | | |
Diluted weighted average shares outstanding | | 30,269 | | 30,269 | | 30,143 | |
(1) The $1.0 million merger and restructuring charge in the fourth quarter of 2005 is comprised of $1.0 million in severance costs.
(2) The $3.6 million merger and restructuring charge for the year ended December 31, 2004 consisted of $2.8 million of personnel severance costs and $0.8 million for the internal investigation of improper accounting transactions at the TurboDisc business unit.
(3) The $0.5 million inventory write-off for the year ended December 31, 2004 was taken in conjunction with the Aii and MTI consolidation due to certain product overlaps. This charge was included in the cost of sales in the consolidated statements of operations.
(4) The $0.8 million asset impairment charge for the year ended December 31, 2004 related to the consolidation of the Aii and MTI business and pertained to certain long-lived assets that were classified as held for sale as of December 31, 2004.
(5) The $1.5 million in purchase accounting adjustments for the year ended December 31, 2004 is for the required adjustments to gross profit to reflect the required capitalization of profit in inventory and permanent elimination of certain deferred revenue from the TurboDisc and Aii acquisitions.
(6) The $0.6 million write-off of purchased in-process technology for the year ended December 31, 2004 is comprised of a $0.6 million write-off from the MTI acquisition.
NOTE - The above reconciliation is intended to present Veeco’s operating results, excluding certain charges and providing income taxes at a 35% statutory rate. This reconciliation is not in accordance with, or an alternative method for, generally accepted accounting principles in the United States, and may be different from similar measures presented by other companies. Management of the Company evaluates performance of its business units based on EBITA, which is the primary indicator used by management to plan and forecast future periods. The presentation of this financial measure facilitates meaningful comparison with prior periods, as management of the Company believes EBITA reports baseline performance and thus provides useful information.
5