Searchable text section of graphics shown above
Exhibit 99.1
[LOGO] | Solutions for a nanoscale world. |
[GRAPHIC]
Investor Presentation
April 2006
Veeco Instruments Inc.
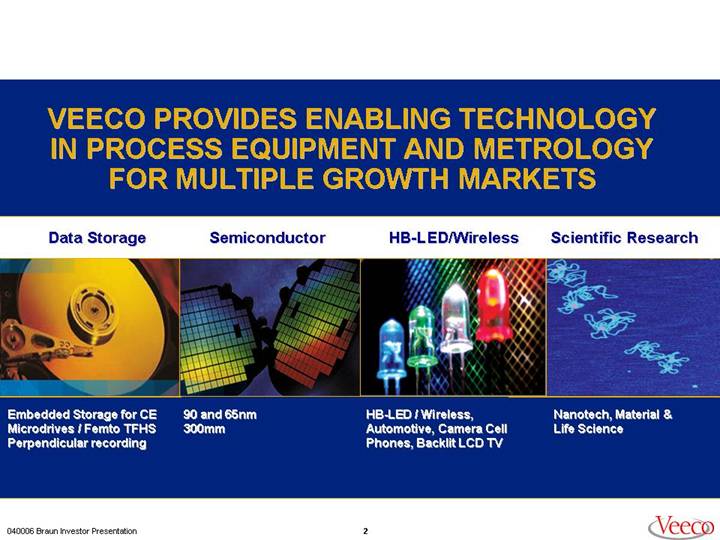
VEECO PROVIDES ENABLING TECHNOLOGY IN PROCESS EQUIPMENT AND METROLOGY FOR MULTIPLE GROWTH MARKETS
Data Storage | Semiconductor | HB-LED/Wireless | Scientific Research |
| | | |
[GRAPHIC] | [GRAPHIC] | [GRAPHIC] | [GRAPHIC] |
| | | |
Embedded Storage for CE | 90 and 65nm | HB-LED / Wireless, | Nanotech, Material & |
Microdrives / Femto TFHS | 300mm | Automotive, Camera Cell | Life Science |
Perpendicular recording | | Phones, Backlit LCD TV | |
040006 Braun Investor Presentation | | [LOGO] |
2
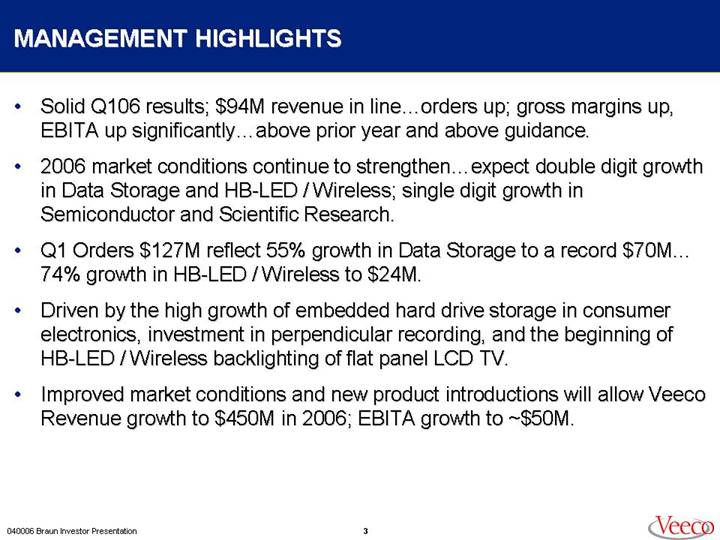
MANAGEMENT HIGHLIGHTS
• Solid Q106 results; $94M revenue in line…orders up; gross margins up, EBITA up significantly…above prior year and above guidance.
• 2006 market conditions continue to strengthen…expect double digit growth in Data Storage and HB-LED / Wireless; single digit growth in Semiconductor and Scientific Research.
• Q1 Orders $127M reflect 55% growth in Data Storage to a record $70M… 74% growth in HB-LED / Wireless to $24M.
• Driven by the high growth of embedded hard drive storage in consumer electronics, investment in perpendicular recording, and the beginning of HB-LED / Wireless backlighting of flat panel LCD TV.
• Improved market conditions and new product introductions will allow Veeco Revenue growth to $450M in 2006; EBITA growth to ~$50M.
3
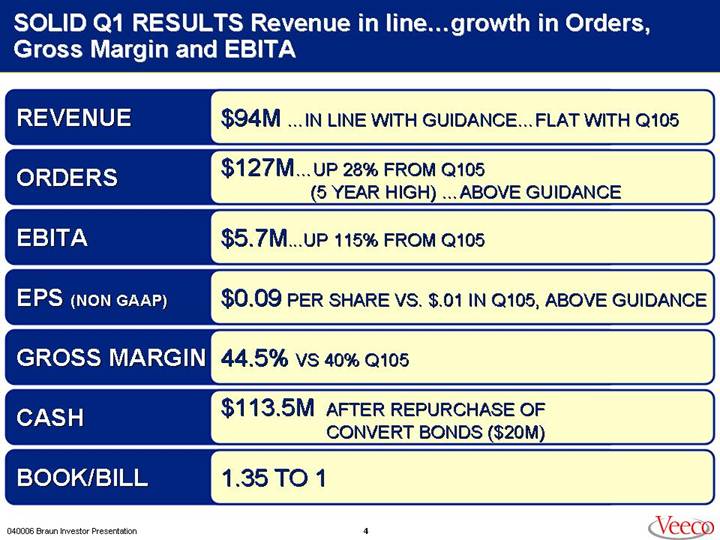
SOLID Q1 RESULTS Revenue in line…growth in Orders, Gross Margin and EBITA
REVENUE | $94M …IN LINE WITH GUIDANCE…FLAT WITH Q105 |
| |
ORDERS | $127M… | UP 28% FROM Q105 |
| | (5 YEAR HIGH) …ABOVE GUIDANCE |
| |
EBITA | $5.7M...UP 115% FROM Q105 |
| |
EPS (NON GAAP) | $0.09 PER SHARE VS. $.01 IN Q105, ABOVE GUIDANCE |
| |
GROSS MARGIN | 44.5% VS 40% Q105 |
| |
CASH | $113.5M AFTER REPURCHASE OF CONVERT BONDS ($20M) |
| |
BOOK/BILL | 1.35 TO 1 |
4
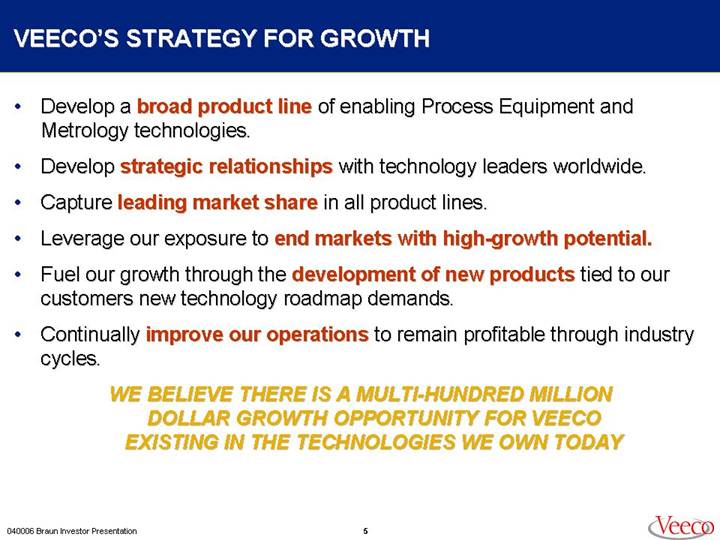
VEECO’S STRATEGY FOR GROWTH
• Develop a broad product line of enabling Process Equipment and Metrology technologies.
• Develop strategic relationships with technology leaders worldwide.
• Capture leading market share in all product lines.
• Leverage our exposure to end markets with high-growth potential.
• Fuel our growth through the development of new products tied to our customers new technology roadmap demands.
• Continually improve our operations to remain profitable through industry cycles.
WE BELIEVE THERE IS A MULTI-HUNDRED MILLION DOLLAR GROWTH OPPORTUNITY FOR VEECO EXISTING IN THE TECHNOLOGIES WE OWN TODAY
5
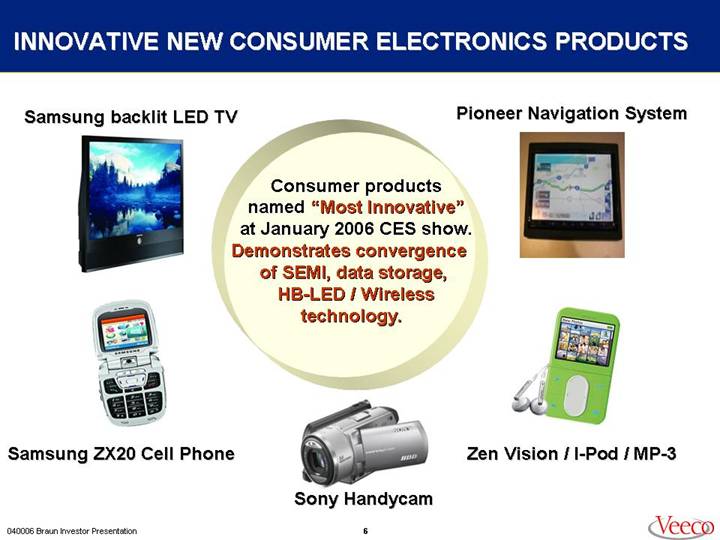
INNOVATIVE NEW CONSUMER ELECTRONICS PRODUCTS
[GRAPHIC] | Consumer products named “Most Innovative” at January 2006 CES show. Demonstrates convergence of SEMI, data storage, HB-LED / Wireless technology. | [GRAPHIC] |
Samsung backlit LED TV | Pioneer Navigation System |
| |
[GRAPHIC] | [GRAPHIC] |
Samsung ZX20 Cell Phone | Zen Vision / I-Pod / MP-3 |
| |
| [GRAPHIC] | |
| Sony Handycam | |
6
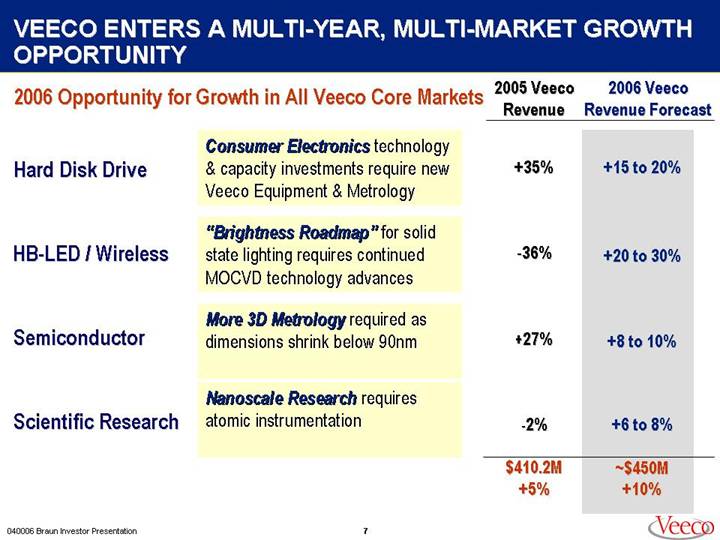
VEECO ENTERS A MULTI-YEAR, MULTI-MARKET GROWTH OPPORTUNITY
2006 Opportunity for Growth in All Veeco Core Markets
| | | | 2005 Veeco | | 2006 Veeco | |
| | | | Revenue | | Revenue Forecast | |
Hard Disk Drive | | Consumer Electronics technology & capacity investments require new Veeco Equipment & Metrology | | +35% | | +15 to 20% | |
| | | | | | | |
HB-LED / Wireless | | “Brightness Roadmap” for solid state lighting requires continued MOCVD technology advances | | -36% | | +20 to 30% | |
| | | | | | | |
Semiconductor | | More 3D Metrology required as dimensions shrink below 90nm | | +27% | | +8 to 10% | |
| | | | | | | |
Scientific Research | | Nanoscale Research requires atomic instrumentation | | -2% | | +6 to 8% | |
| | | | | | | |
| | | | $410.2M | | ~$450M | |
| | | | +5% | | +10% | |
7
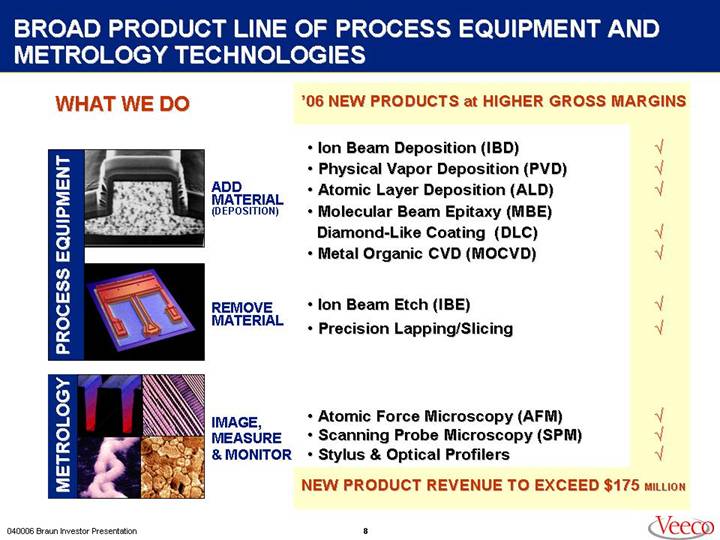
BROAD PRODUCT LINE OF PROCESS EQUIPMENT AND METROLOGY TECHNOLOGIES
WHAT WE DO
PROCESS EQUIPMENT
[GRAPHIC]
ADD MATERIAL
(DEPOSITION)
[GRAPHIC]
REMOVE MATERIAL
METROLOGY
[GRAPHIC]
IMAGE, MEASURE & MONITOR
‘06 NEW PRODUCTS at HIGHER GROSS MARGINS
• | Ion Beam Deposition (IBD) | 
|
• | Physical Vapor Deposition (PVD) |
|
• | Atomic Layer Deposition (ALD) |
|
• | Molecular Beam Epitaxy (MBE) | |
| Diamond-Like Coating (DLC) |
|
• | Metal Organic CVD (MOCVD) |
|
| | |
• | Ion Beam Etch (IBE) |
|
• | Precision Lapping/Slicing |
|
| | |
• | Atomic Force Microscopy (AFM) |
|
• | Scanning Probe Microscopy (SPM) |
|
• | Stylus & Optical Profilers |
|
NEW PRODUCT REVENUE TO EXCEED $175 MILLION
8
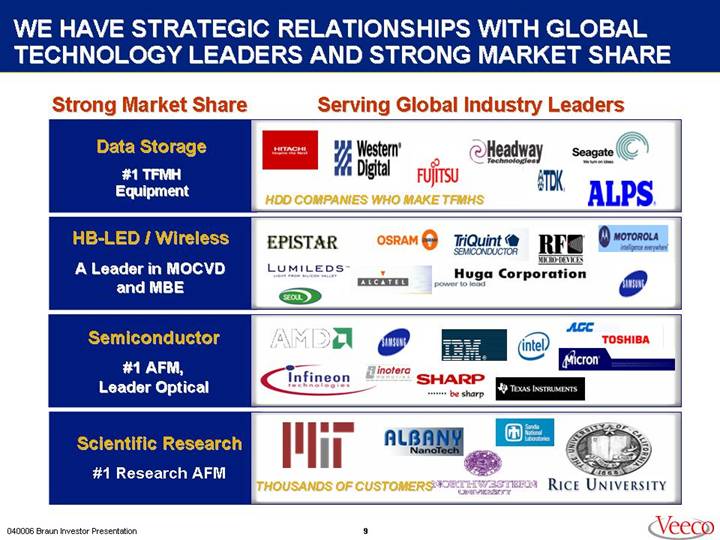
WE HAVE STRATEGIC RELATIONSHIPS WITH GLOBAL TECHNOLOGY LEADERS AND STRONG MARKET SHARE
Strong Market Share | Serving Global Industry Leaders |
| |
Data Storage | |
| |
#1 TFMH | [LOGO] |
Equipment | |
| |
| |
HB-LED / Wireless | |
| |
A Leader in MOCVD | |
and MBE | |
| |
Semiconductor | |
| |
#1 AFM, | |
Leader Optical | |
| |
Scientific Research | |
| |
#1 Research AFM | |
9
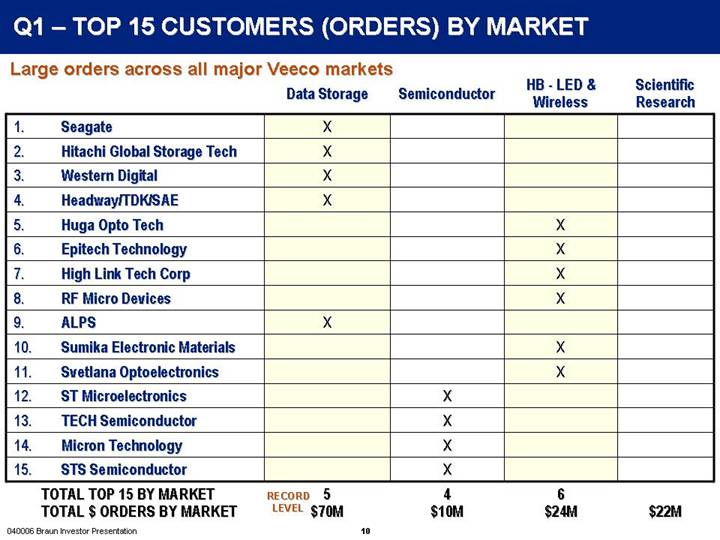
Q1 – TOP 15 CUSTOMERS (ORDERS) BY MARKET
Large orders across all major Veeco markets
| | | | | | | | HB - LED & | | Scientific | |
| | | | Data Storage | | Semiconductor | | Wireless | | Research | |
| | | | | | | | | | | |
1. | | Seagate | | X | | | | | | | |
2. | | Hitachi Global Storage Tech | | X | | | | | | | |
3. | | Western Digital | | X | | | | | | | |
4. | | Headway/TDK/SAE | | X | | | | | | | |
5. | | Huga Opto Tech | | | | | | X | | | |
6. | | Epitech Technology | | | | | | X | | | |
7. | | High Link Tech Corp | | | | | | X | | | |
8. | | RF Micro Devices | | | | | | X | | | |
9. | | ALPS | | X | | | | | | | |
10. | | Sumika Electronic Materials | | | | | | X | | | |
11. | | Svetlana Optoelectronics | | | | | | X | | | |
12. | | ST Microelectronics | | | | X | �� | | | | |
13. | | TECH Semiconductor | | | | X | | | | | |
14. | | Micron Technology | | | | X | | | | | |
15. | | STS Semiconductor | | | | X | | | | | |
| | | | | | | | | | | |
TOTAL TOP 15 BY MARKET | RECORD | 5 | | 4 | | 6 | | | |
TOTAL $ ORDERS BY MARKET | LEVEL | $70M | | $10M | | $24M | | $22M | |
10
VEECO HAS A DIVERSE REVENUE BASE . . . multi-product . . . multi-market . . . worldwide exposure
Q106 Revenue $93.9M
[CHART] | [CHART] | [CHART] |
| | |
Revenue by Product | Revenue by Market | Revenue by Geography |
(Equipment up 6%) | (Data Storage up 56%) | (APAC growth +24%) |
Veeco benefits from product, market and geographic diversity
12
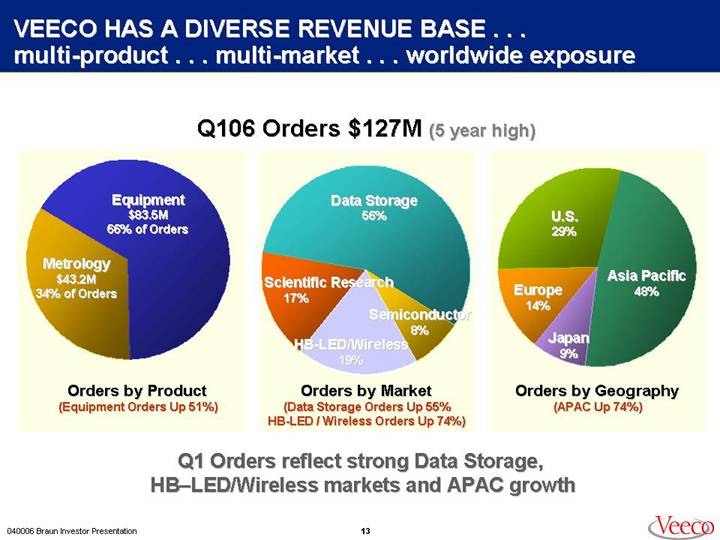
VEECO HAS A DIVERSE REVENUE BASE . . . multi-product . . . multi-market . . . worldwide exposure
Q106 Orders $127M (5 year high)
[CHART] | [CHART] | [CHART] |
| | |
Orders by Product | Orders by Market | Orders by Geography |
(Equipment Orders Up 51%) | (Data Storage Orders Up 55% | (APAC Up 74%) |
| HB-LED / Wireless Orders Up 74%) | |
| | |
Q1 Orders reflect strong Data Storage, |
HB-LED/Wireless markets and APAC growth |
13
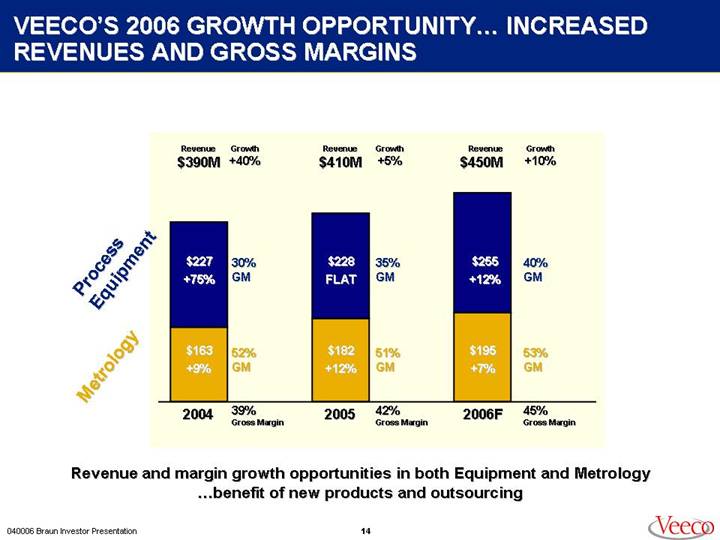
VEECO’S 2006 GROWTH OPPORTUNITY… INCREASED REVENUES AND GROSS MARGINS
[CHART]
Revenue and margin growth opportunities in both Equipment and Metrology…benefit of new products and outsourcing
14
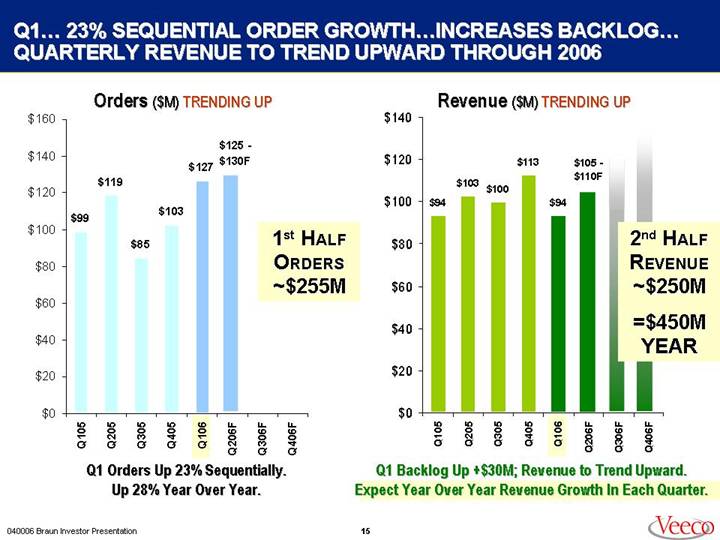
Q1… 23% SEQUENTIAL ORDER GROWTH…INCREASES BACKLOG… QUARTERLY REVENUE TO TREND UPWARD THROUGH 2006
Orders ($M) TRENDING UP
[CHART]
1st HALF ORDERS ~$255M
Q1 Orders Up 23% Sequentially.
Up 28% Year Over Year.
Revenue ($M) TRENDING UP
[CHART]
2nd HALF REVENUE ~$250M
=$450M YEAR
Q1 Backlog Up +$30M; Revenue to Trend Upward.
Expect Year Over Year Revenue Growth In Each Quarter.
15
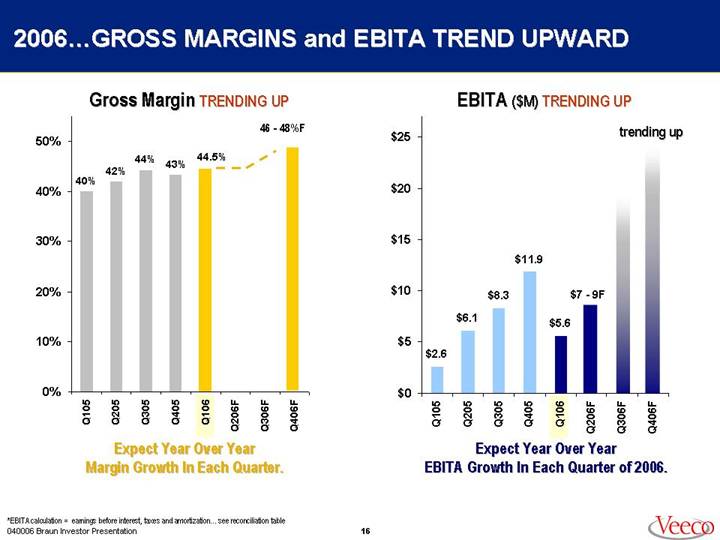
2006…GROSS MARGINS and EBITA TREND UPWARD
Gross Margin TRENDING UP
[CHART]
Expect Year Over Year
Margin Growth In Each Quarter.
EBITA ($M) TRENDING UP
[CHART]
Expect Year Over Year
EBITA Growth In Each Quarter of 2006.
*EBITA calculation = earnings before interest, taxes and amortization…see reconciliation table
16
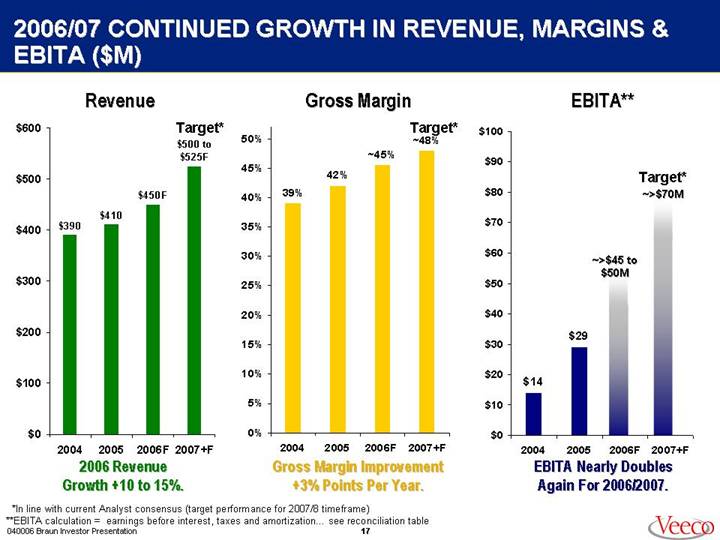
2006/07 CONTINUED GROWTH IN REVENUE, MARGINS & EBITA ($M)
Revenue
[CHART]
2006 Revenue
Growth +10 to 15%.
Gross Margin
[CHART]
Gross Margin Improvement
+3% Points Per Year.
EBITA**
[CHART]
EBITA Nearly Doubles
Again For 2006/2007.
*In line with current Analyst consensus (target performance for 2007/8 timeframe)
**EBITA calculation = earnings before interest, taxes and amortization…see reconciliation table
17
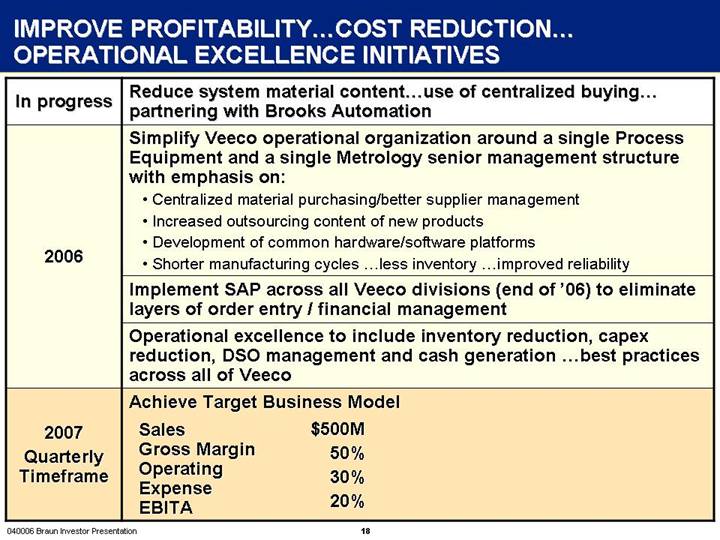
IMPROVE PROFITABILITY…COST REDUCTION… OPERATIONAL EXCELLENCE INITIATIVES
In progress | Reduce system material content…use of centralized buying…partnering with Brooks Automation |
| |
2006 | Simplify Veeco operational organization around a single Process Equipment and a single Metrology senior management structure with emphasis on: |
|
• Centralized material purchasing/better supplier management |
• Increased outsourcing content of new products |
• Development of common hardware/software platforms |
• Shorter manufacturing cycles …less inventory …improved reliability |
|
Implement SAP across all Veeco divisions (end of ‘06) to eliminate layers of order entry / financial management |
|
Operational excellence to include inventory reduction, capex reduction, DSO management and cash generation …best practices across all of Veeco |
| |
2007
Quarterly
Timeframe | Achieve Target Business Model |
|
Sales | $ | 500 | M | |
Gross Margin | 50 | % | |
Operating Expense | 30 | % | |
EBITA | 20 | % | |
18
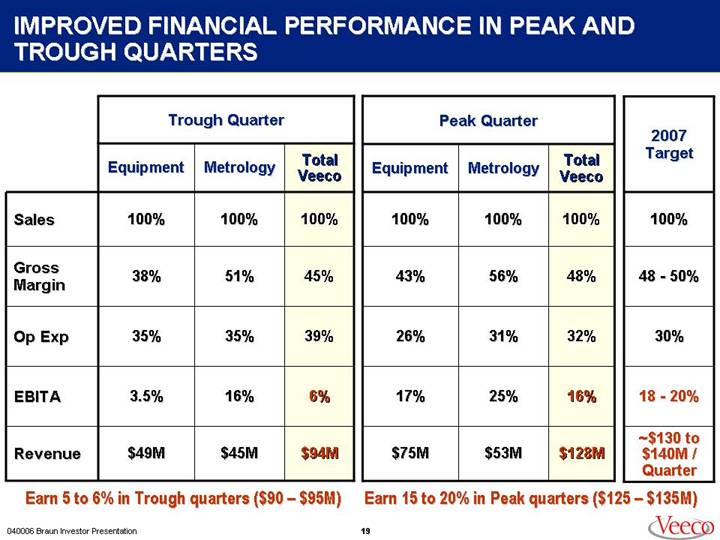
IMPROVED FINANCIAL PERFORMANCE IN PEAK AND TROUGH QUARTERS
| | Trough Quarter | | Peak Quarter | | | |
| | | | | | Total | | | | | | Total | | 2007 | |
| | Equipment | | Metrology | | Veeco | | Equipment | | Metrology | | Veeco | | Target | |
| | | | | | | | | | | | | | | |
Sales | | 100 | % | 100 | % | 100 | % | 100 | % | 100 | % | 100 | % | 100% | |
| | | | | | | | | | | | | | | |
Gross Margin | | 38 | % | 51 | % | 45 | % | 43 | % | 56 | % | 48 | % | 48 - 50% | |
| | | | | | | | | | | | | | | |
Op Exp | | 35 | % | 35 | % | 39 | % | 26 | % | 31 | % | 32 | % | 30% | |
| | | | | | | | | | | | | | | |
EBITA | | 3.5 | % | 16 | % | 6 | % | 17 | % | 25 | % | 16 | % | 18 - 20% | |
| | | | | | | | | | | | | | | |
Revenue | | $ | 49 | M | $ | 45 | M | $ | 94 | M | $ | 75 | M | $ | 53 | M | $ | 128 | M | ~$130 to
$140M /
Quarter | |
| | | | | | | | | | | | | | | | | | | | | |
Earn 5 to 6% in Trough quarters ($90 – $95M) | | Earn 15 to 20% in Peak quarters ($125 – $135M) | |
19
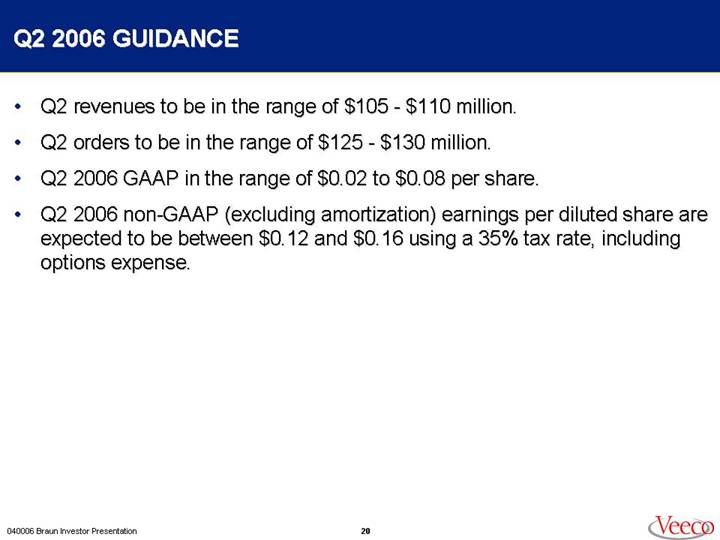
Q2 2006 GUIDANCE
• Q2 revenues to be in the range of $105 - $110 million.
• Q2 orders to be in the range of $125 - $130 million.
• Q2 2006 GAAP in the range of $0.02 to $0.08 per share.
• Q2 2006 non-GAAP (excluding amortization) earnings per diluted share are expected to be between $0.12 and $0.16 using a 35% tax rate, including options expense.
20
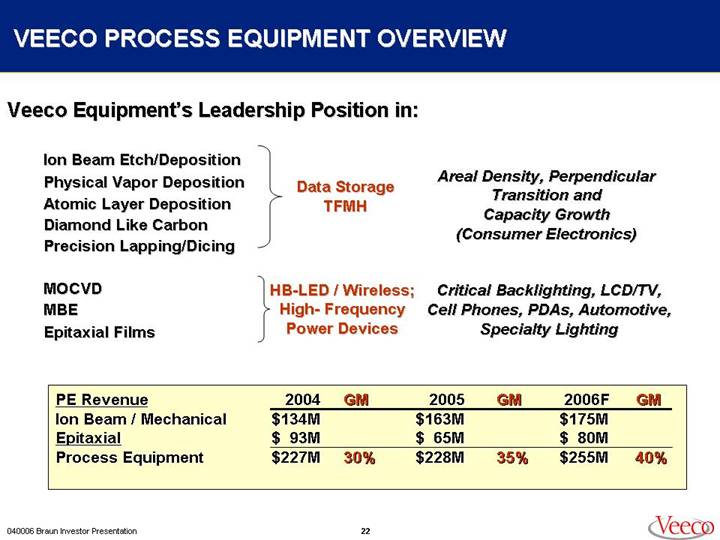
VEECO PROCESS EQUIPMENT OVERVIEW
Veeco Equipment’s Leadership Position in:
Ion Beam Etch/Deposition | Data Storage
TFMH | Areal Density, Perpendicular Transition and Capacity Growth (Consumer Electronics) |
Physical Vapor Deposition |
Atomic Layer Deposition |
Diamond Like Carbon |
Precision Lapping/Dicing |
| | |
MOCVD | HB-LED / Wireless;
High - Frequency
Power Devices | Critical Backlighting, LCD/TV,
Cell Phones, PDAs, Automotive,
Specialty Lighting |
MBE |
Epitaxial Films |
PE Revenue | | 2004 | | GM | | 2005 | | GM | | 2006F | | GM | |
Ion Beam / Mechanical | | $ | 134 | M | | | $ | 163 | M | | | $ | 175 | M | | |
Epitaxial | | $ | 93 | M | | | $ | 65 | M | | | $ | 80 | M | | |
Process Equipment | | $ | 227 | M | 30 | % | $ | 228 | M | 35 | % | $ | 255 | M | 40 | % |
22
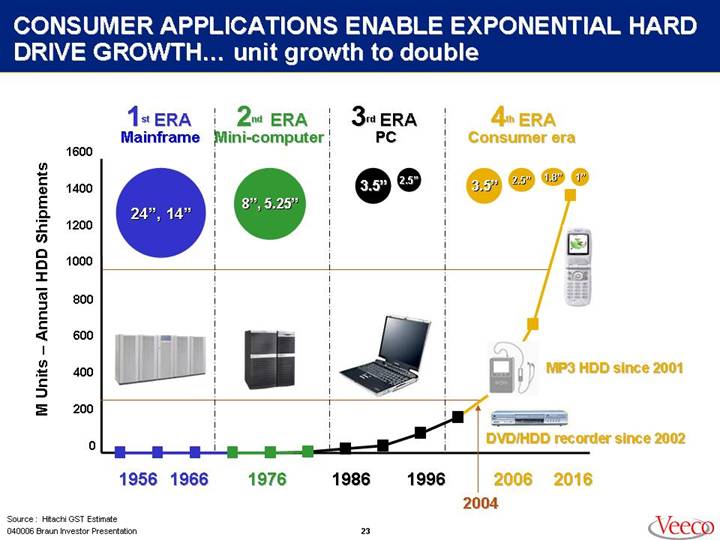
CONSUMER APPLICATIONS ENABLE EXPONENTIAL HARD DRIVE GROWTH… unit growth to double
[CHART]
Source : Hitachi GST Estimate
23
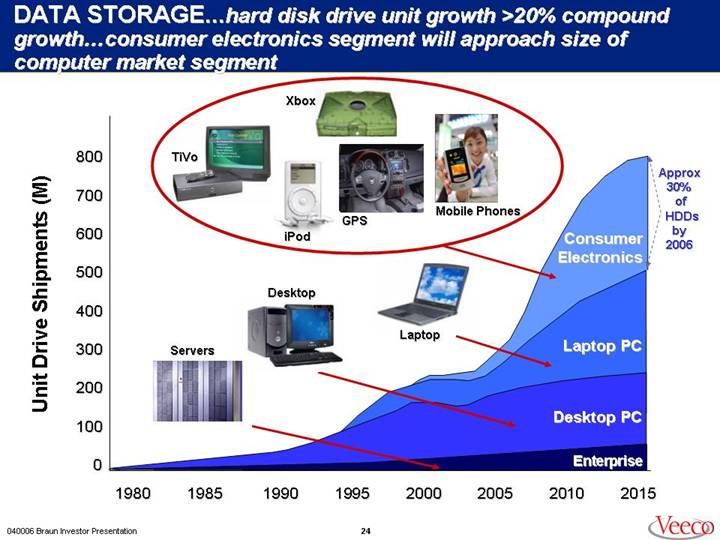
DATA STORAGE…hard disk drive unit growth >20% compound growth…consumer electronics segment will approach size of computer market segment
[CHART]
24
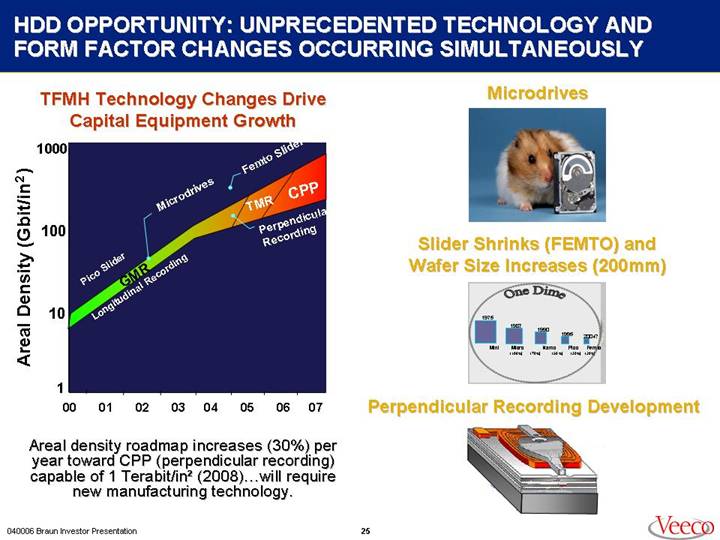
HDD OPPORTUNITY: UNPRECEDENTED TECHNOLOGY AND FORM FACTOR CHANGES OCCURRING SIMULTANEOUSLY
TFMH Technology Changes Drive Capital Equipment Growth
[CHART]
Areal density roadmap increases (30%) per year toward CPP (perpendicular recording) capable of 1 Terabit/in² (2008)…will require new manufacturing technology.
Microdrives
[GRAPHIC]
Slider Shrinks (FEMTO) and Wafer Size Increases (200mm)
[GRAPHIC]
Perpendicular Recording Development
[GRAPHIC]
25
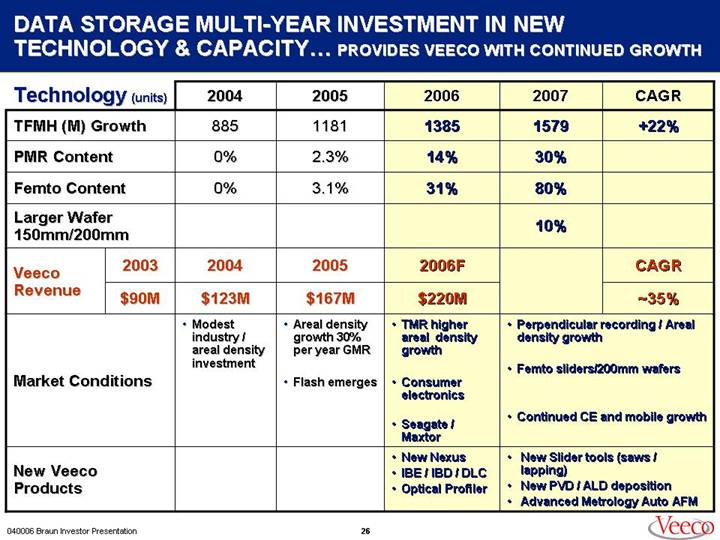
DATA STORAGE MULTI-YEAR INVESTMENT IN NEW TECHNOLOGY & CAPACITY… PROVIDES VEECO WITH CONTINUED GROWTH
Technology (units) | | 2004 | | 2005 | | 2006 | | 2007 | | CAGR | |
TFMH (M) Growth | | 885 | | 1181 | | 1385 | | 1579 | | +22 | % |
PMR Content | | 0 | % | 2.3 | % | 14 | % | 30 | % | | |
Femto Content | | 0 | % | 3.1 | % | 31 | % | 80 | % | | |
Larger Wafer 150mm/200mm | | | | | | | | 10 | % | | |
| | | | | | | | | | | |
| | 2003 | | 2004 | | 2005 | | 2006F | | | | CAGR | |
Veeco Revenue | | $ | 90M | | $ | 123M | | $ | 167M | | $ | 220M | | | | ~35 | % |
| | | | | | | | | | | | | | | | | |
Market Conditions | | | | • Modest industry / areal density investment | | • Areal density growth 30% per year GMR • Flash emerges | | • TMR higher areal density growth • Consumer electronics • Seagate / Maxtor | | • Perpendicular recording / Areal density growth • Femto sliders/200mm wafers • Continued CE and mobile growth | |
| | | | | | | | | | | |
New Veeco Products | | | | | | | | • New Nexus • IBE / IBD / DLC • Optical Profiler | | • New Slider tools (saws / lapping) • New PVD / ALD deposition • Advanced Metrology Auto AFM | |
26
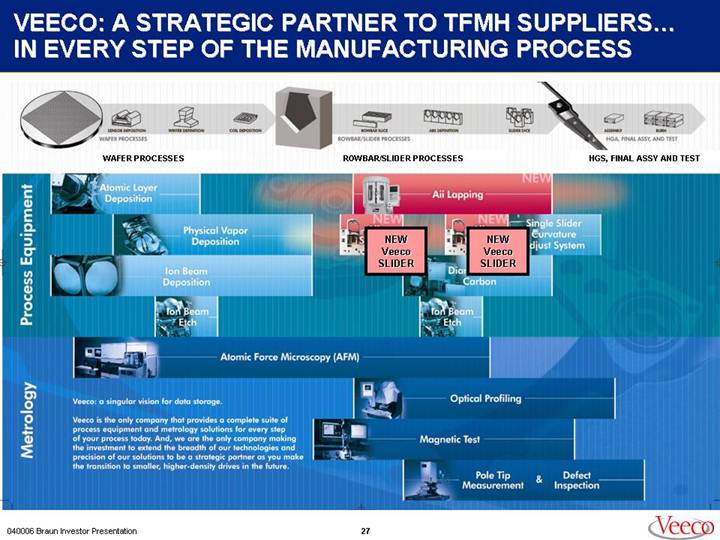
VEECO: A STRATEGIC PARTNER TO TFMH SUPPLIERS… IN EVERY STEP OF THE MANUFACTURING PROCESS
[GRAPHIC] | [GRAPHIC] | [GRAPHIC] |
| | |
WAFER PROCESSES | ROWBAR/SLIDER PROCESSES | HGS, FINAL ASSY AND TEST |
[GRAPHIC]
Veeco: a singular vision for data storage.
Veeco is the only company that provides a complete suite of process equipment and metrology solutions for every step of your process today. And, we are the only company making the investment to extend the breadth of our technologies and precision of our solutions to be a strategic partner as you make the transition to smaller, higher-density drives in the future.
27
HB-LED / Wireless Opportunity
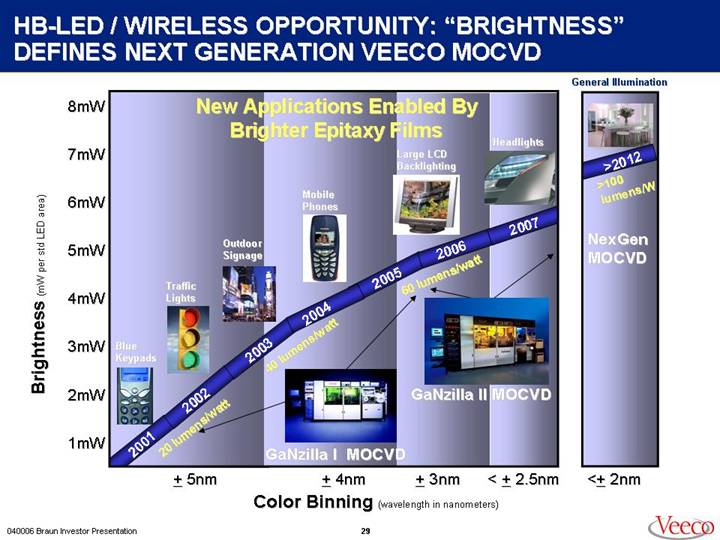
HB-LED / WIRELESS OPPORTUNITY: “BRIGHTNESS”
DEFINES NEXT GENERATION VEECO MOCVD
[CHART]
29
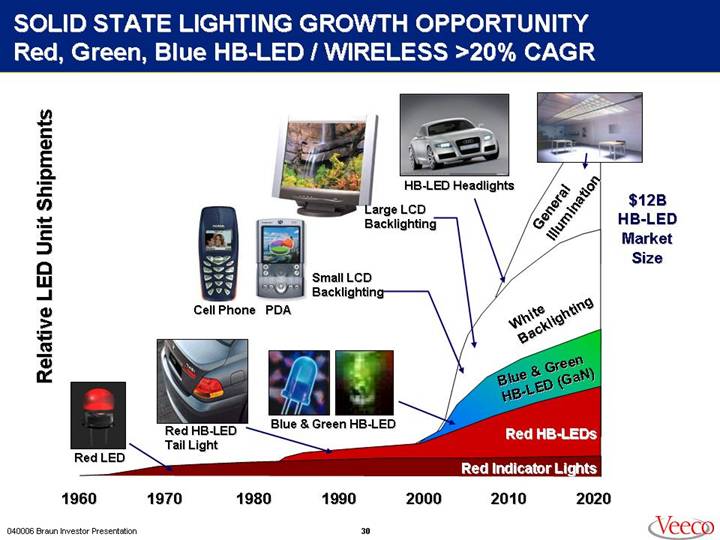
SOLID STATE LIGHTING GROWTH OPPORTUNITY
Red, Green, Blue HB-LED / WIRELESS >20% CAGR
[CHART]
30
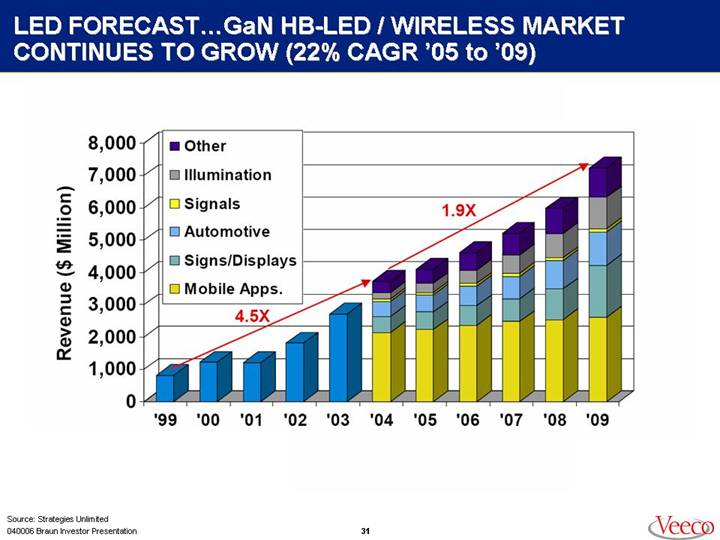
LED FORECAST…GaN HB-LED / WIRELESS MARKET CONTINUES TO GROW (22% CAGR ‘05 to ‘09)
[CHART]
Source: Strategies Unlimited
31
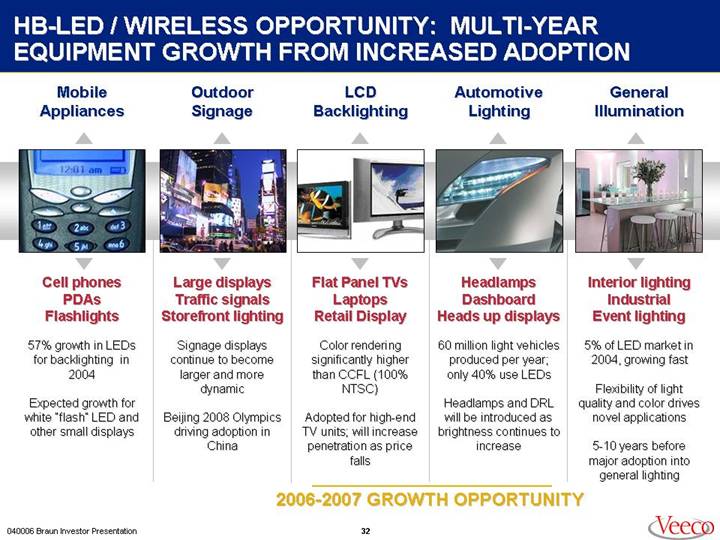
HB-LED / WIRELESS OPPORTUNITY: MULTI-YEAR EQUIPMENT GROWTH FROM INCREASED ADOPTION
Mobile | Outdoor | LCD | Automotive | General |
Appliances | Signage | Backlighting | Lighting | Illumination |
| | | | |
[GRAPHIC] | [GRAPHIC] | [GRAPHIC] | [GRAPHIC] | [GRAPHIC] |
| | | | |
Cell phones | Large displays | Flat Panel TVs | Headlamps | Interior lighting |
PDAs | Traffic signals | Laptops | Dashboard | Industrial |
Flashlights | Storefront lighting | Retail Display | Heads up displays | Event lighting |
| | | | |
57% growth in LEDs | Signage displays | Color rendering | 60 million light vehicles | 5% of LED market in |
for backlighting in | continue to become | significantly higher | produced per year; | 2004, growing fast |
2004 | larger and more | than CCFL (100% | only 40% use LEDs | |
| dynamic | NTSC) | | Flexibility of light |
Expected growth for | | | Headlamps and DRL | quality and color drives |
white “flash” LED and | Beijing 2008 Olympics | Adopted for high-end | will be introduced as | novel applications |
other small displays | driving adoption in | TV units; will increase | brightness continues to | |
| China | penetration as price | increase | 5-10 years before |
| | falls | | major adoption into |
| | | | general lighting |
| | | | |
| | 2006-2007 GROWTH OPPORTUNITY | |
32
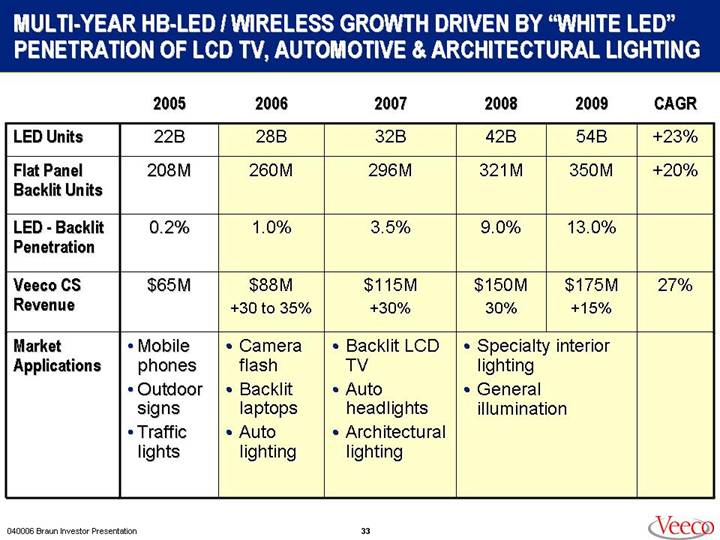
MULTI-YEAR HB-LED / WIRELESS GROWTH DRIVEN BY “WHITE LED” PENETRATION OF LCD TV, AUTOMOTIVE & ARCHITECTURAL LIGHTING
| | 2005 | | 2006 | | 2007 | | 2008 | | 2009 | | CAGR | |
LED Units | | 22B | | 28B | | 32B | | 42B | | 54B | | +23% | |
Flat Panel | | | | | | | | | | | | | |
Backlit Units | | 208M | | 260M | | 296M | | 321M | | 350M | | +20% | |
LED - Backlit | | | | | | | | | | | | | |
Penetration | | 0.2% | | 1.0% | | 3.5% | | 9.0% | | 13.0% | | | |
Veeco CS Revenue | | $65M | | $88M +30 to 35% | | $115M +30% | | $150M 30% | | $175M +15% | | 27% | |
| | | | | | | | | | | | | |
Market Applications | | • Mobile phones | | • Camera flash | | • Backlit LCD TV | | • Specialty interior lighting | | | |
| • Outdoor signs | | • Backlit laptops | | • Auto headlights | | • General illumination | | | |
| • Traffic lights | | • Auto lighting | | • Architectural lighting | | | | | | | |
33
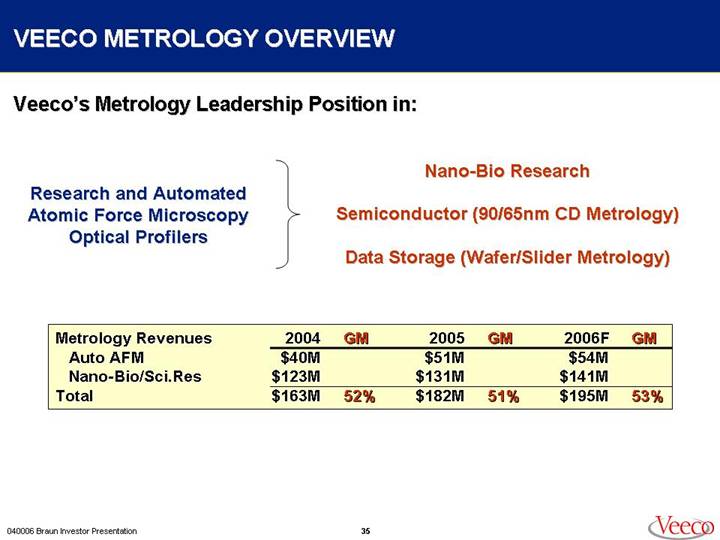
VEECO METROLOGY OVERVIEW
Veeco’s Metrology Leadership Position in:
| Nano-Bio Research |
Research and Automated | |
Atomic Force Microscopy | Semiconductor (90/65nm CD Metrology) |
Optical Profilers | |
| Data Storage (Wafer/Slider Metrology) |
Metrology Revenues | | 2004 | | GM | | 2005 | | GM | | 2006F | | GM | |
Auto AFM | | $ | 40 | M | | | $ | 51 | M | | | $ | 54 | M | | |
Nano-Bio/Sci.Res | | $ | 123 | M | | | $ | 131 | M | | | $ | 141 | M | | |
Total | | $ | 163 | M | 52 | % | $ | 182 | M | 51 | % | $ | 195 | M | 53 | % |
35
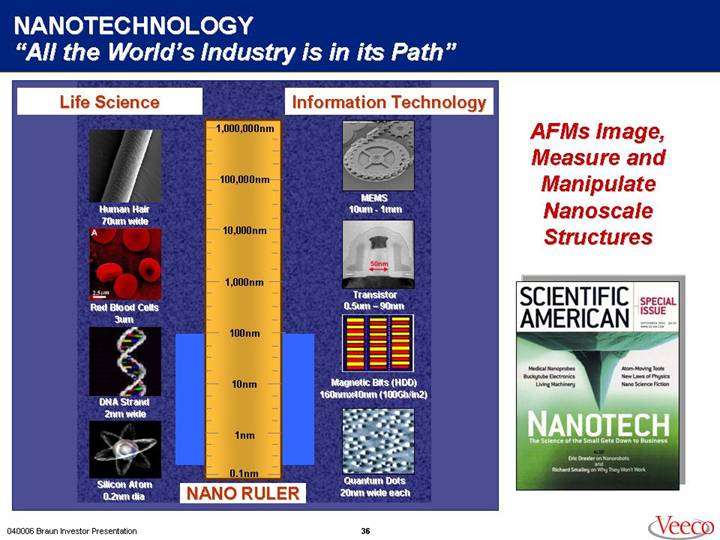
NANOTECHNOLOGY “All the World’s Industry is in its Path”
Life Science | | | | Information Technology |
| | | | |
[GRAPHIC] | | | | [GRAPHIC] |
| | | | |
Human Hair | | | | MEMS |
70um wide | | | | 10um - 1mm |
| | | | |
[GRAPHIC] | | | | [GRAPHIC] |
| | | | |
Red Blood Cells | | | | Transistor |
3um | | | | 0.5um - 90nm |
| | | | |
[GRAPHIC] | | | | [GRAPHIC] |
| | | | |
DNA Strand | | | | Magnetic Bits (HDD) |
2nm wide | | | | 160nmx40nm (100Gb/in2) |
| | | | |
[GRAPHIC] | | | | [GRAPHIC] |
| | | | |
Silicon Atom | | [GRAPHIC] | | Quantum Dots |
0.2nm dia | | NANO RULER | | 20nm wide each |
AFMs Image, Measure and Manipulate Nanoscale Structures
[GRAPHIC]
36
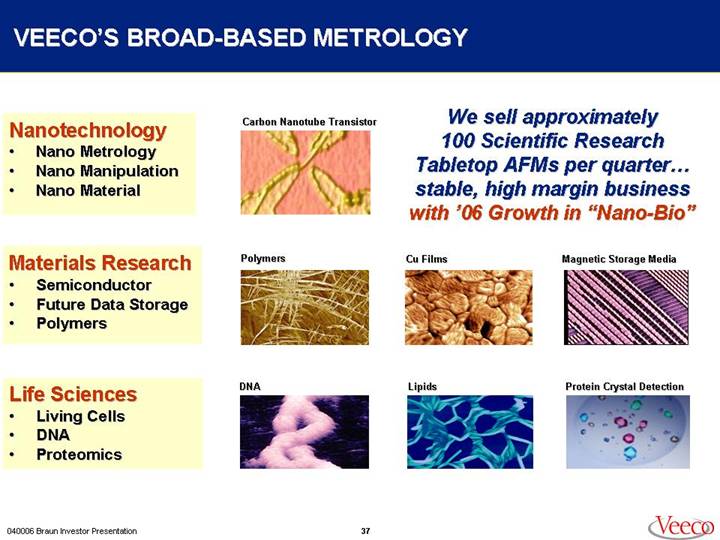
VEECO’S BROAD-BASED METROLOGY
Nanotechnology
• Nano Metrology
• Nano Manipulation
• Nano Material
Materials Research
• Semiconductor
• Future Data Storage
• Polymers
Life Sciences
• Living Cells
• DNA
• Proteomics
We sell approximately 100 Scientific Research Tabletop AFMs per quarter… stable, high margin business with ‘06 Growth in “Nano-Bio”
Carbon Nanotube Transistor
[GRAPHIC]
Polymers
[GRAPHIC]
Cu Films
[GRAPHIC]
Magnetic Storage Media
[GRAPHIC]
DNA
[GRAPHIC]
Lipids
[GRAPHIC]
Protein Crystal Detection
[GRAPHIC]
37
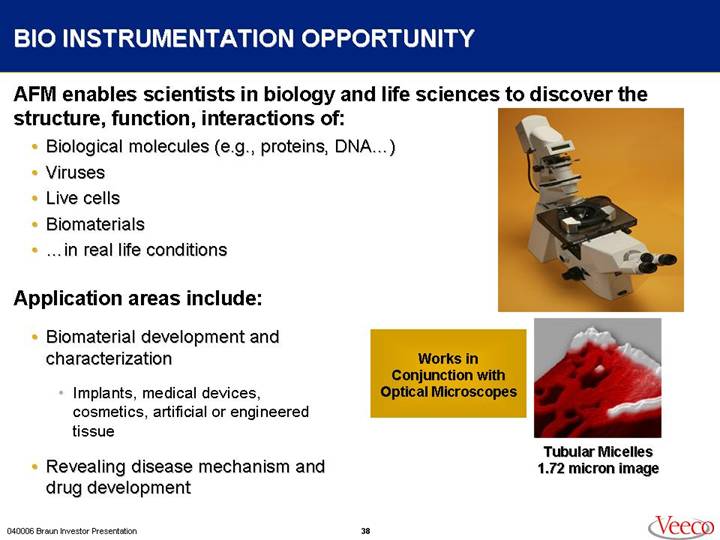
BIO INSTRUMENTATION OPPORTUNITY
AFM enables scientists in biology and life sciences to discover the structure, function, interactions of:
• Biological molecules (e.g., proteins, DNA…)
• Viruses
• Live cells
• Biomaterials
• …in real life conditions
Application areas include:
• Biomaterial development and characterization
• Implants, medical devices, cosmetics, artificial or engineered tissue
• Revealing disease mechanism and drug development
[GRAPHIC]
Works in Conjunction with Optical Microscopes
[GRAPHIC]
Tubular Micelles 1.72 micron image
38
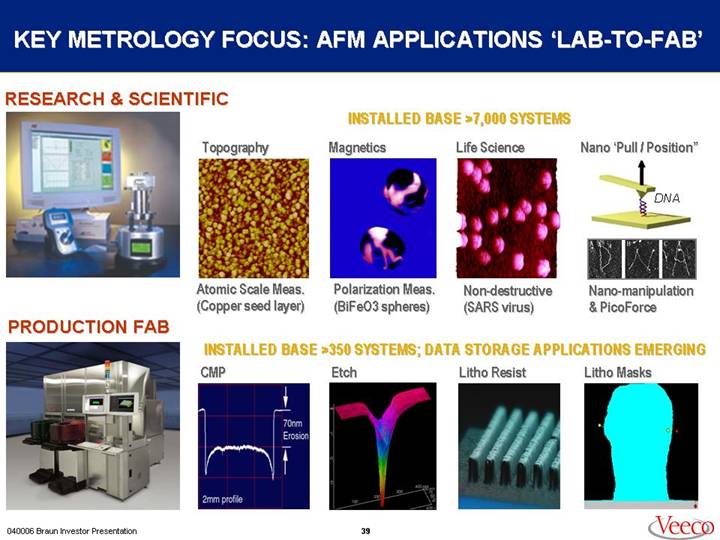
KEY METROLOGY FOCUS: AFM APPLICATIONS ‘LAB-TO-FAB’
RESEARCH & SCIENTIFIC
[GRAPHIC]
INSTALLED BASE >7,000 SYSTEMS
Topography | Magnetics | Life Science | Nano ‘Pull / Position” |
| | | |
[GRAPHIC] | [GRAPHIC] | [GRAPHIC] | [GRAPHIC] |
| | | |
Atomic Scale Meas. | Polarization Meas. | Non-destructive | Nano-manipulation |
(Copper seed layer) | (BiFeO3 spheres) | (SARS virus) | & PicoForce |
PRODUCTION FAB
[GRAPHIC]
INSTALLED BASE >350 SYSTEMS; DATA STORAGE APPLICATIONS EMERGING
CMP | Etch | Litho Resist | Litho Masks |
| | | |
[GRAPHIC] | [GRAPHIC] | [GRAPHIC] | [GRAPHIC] |
39
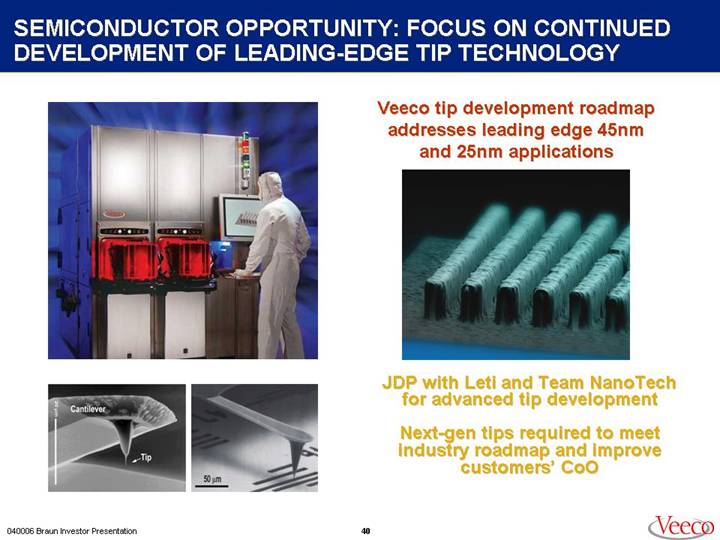
SEMICONDUCTOR OPPORTUNITY: FOCUS ON CONTINUED DEVELOPMENT OF LEADING-EDGE TIP TECHNOLOGY
[GRAPHIC]
Veeco tip development roadmap addresses leading edge 45nm and 25nm applications
[GRAPHIC]
JDP with Leti and Team NanoTech for advanced tip development
Next-gen tips required to meet industry roadmap and improve customers’ CoO
40
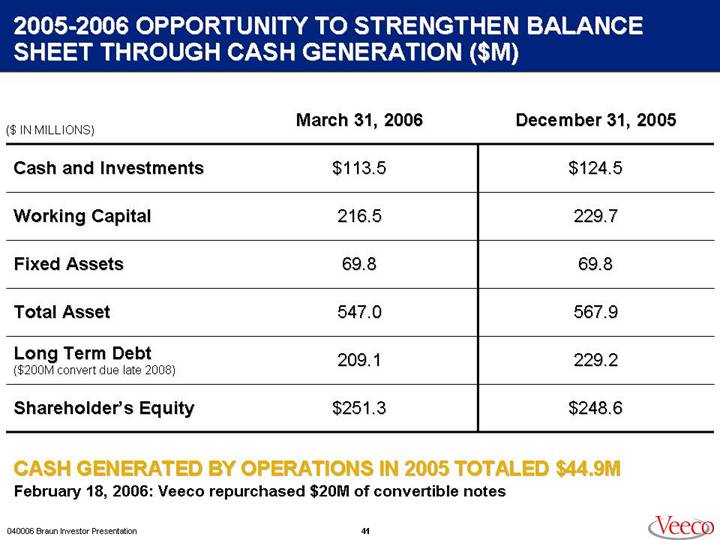
2005-2006 OPPORTUNITY TO STRENGTHEN BALANCE SHEET THROUGH CASH GENERATION ($M)
($ IN MILLIONS) | | March 31, 2006 | | December 31, 2005 | |
| | | | | |
Cash and Investments | | $ | 113.5 | | $ | 124.5 | |
| | | | | |
Working Capital | | 216.5 | | 229.7 | |
| | | | | |
Fixed Assets | | 69.8 | | 69.8 | |
| | | | | |
Total Asset | | 547.0 | | 567.9 | |
| | | | | |
Long Term Debt | | 209.1 | | 229.2 | |
($200M convert due late 2008) | | | | | |
| | | | | |
Shareholder’s Equity | | $ | 251.3 | | $ | 248.6 | |
CASH GENERATED BY OPERATIONS IN 2005 TOTALED $44.9M
February 18, 2006: Veeco repurchased $20M of convertible notes
41
VEECO’S HISTORICAL FINANCIALS AND OUTLOOK
2006 Forecast …potential record SALES and PROFITABILITY
[CHART]
[CHART]
• Founded in 1990 with Sales of $30M . . . IPO in 1994
• 12 year Sales growth (1994 – 2005) from $86M to $410.2M . . . with +14% CAGR per year
*Exclusive of non-recurring charges
42
SAFE HARBOR STATEMENT
To the extent that this presentation discusses expectations about market conditions, market acceptance and future sales of Veeco’s products, Veeco’s future financial performance, future disclosures, or otherwise makes statements about the future, such statements are forward-looking and are subject to a number of risks and uncertainties that could cause actual results to differ materially from the statements made. These factors include the challenges of volatility in end market conditions and the cyclical nature of the data storage, semiconductor, HB-LED/wireless and scientific research markets, risks associated with integrating acquired businesses and the acceptance of new products by individual customers and by the marketplace and other factors discussed in the Business Description and Management’s Discussion and Analysis sections of Veeco’s Annual Report on Form 10-K for the year ended December 31, 2005, subsequent Quarterly Reports on Form 10-Q and current reports on Form 8-K. Veeco does not undertake any obligation to update any forward-looking statements to reflect future events or circumstances after the date of such statements.
In addition, this presentation may review non-GAAP financial measures. For GAAP reconciliation, please refer to the reconciliation section in this presentation as well as Veeco’s financial press releases and 10K and 10Q filings available on www.veeco.com
43
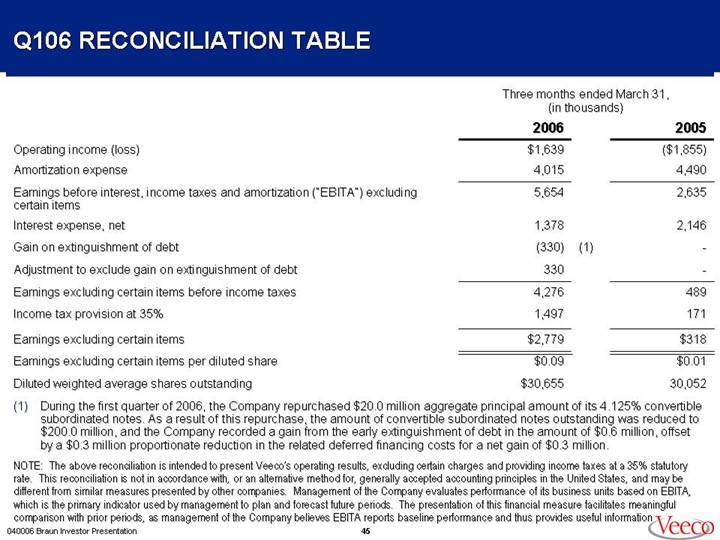
Q106 RECONCILIATION TABLE
| | Three months ended March 31, | |
| | (in thousands) | |
| | 2006 | | 2005 | |
Operating income (loss) | | $ | 1,639 | | $ | (1,855 | ) |
Amortization expense | | 4,015 | | 4,490 | |
Earnings before interest, income taxes and amortization (“EBITA”) excluding certain items | | 5,654 | | 2,635 | |
Interest expense, net | | 1,378 | | 2,146 | |
Gain on extinguishment of debt | | (330 | )(1) | — | |
Adjustment to exclude gain on extinguishment of debt | | 330 | | — | |
Earnings excluding certain items before income taxes | | 4,276 | | 489 | |
Income tax provision at 35% | | 1,497 | | 171 | |
Earnings excluding certain items | | $ | 2,779 | | $ | 318 | |
Earnings excluding certain items per diluted share | | $ | 0.09 | | $ | 0.01 | |
Diluted weighted average shares outstanding | | $ | 30,655 | | 30,052 | |
(1) During the first quarter of 2006, the Company repurchased $20.0 million aggregate principal amount of its 4.125% convertible subordinated notes. As a result of this repurchase, the amount of convertible subordinated notes outstanding was reduced to $200.0 million, and the Company recorded a gain from the early extinguishment of debt in the amount of $0.6 million, offset by a $0.3 million proportionate reduction in the related deferred financing costs for a net gain of $0.3 million.
NOTE: The above reconciliation is intended to present Veeco’s operating results, excluding certain charges and providing income taxes at a 35% statutory rate. This reconciliation is not in accordance with, or an alternative method for, generally accepted accounting principles in the United States, and may be different from similar measures presented by other companies. Management of the Company evaluates performance of its business units based on EBITA, which is the primary indicator used by management to plan and forecast future periods. The presentation of this financial measure facilitates meaningful comparison with prior periods, as management of the Company believes EBITA reports baseline performance and thus provides useful information
45
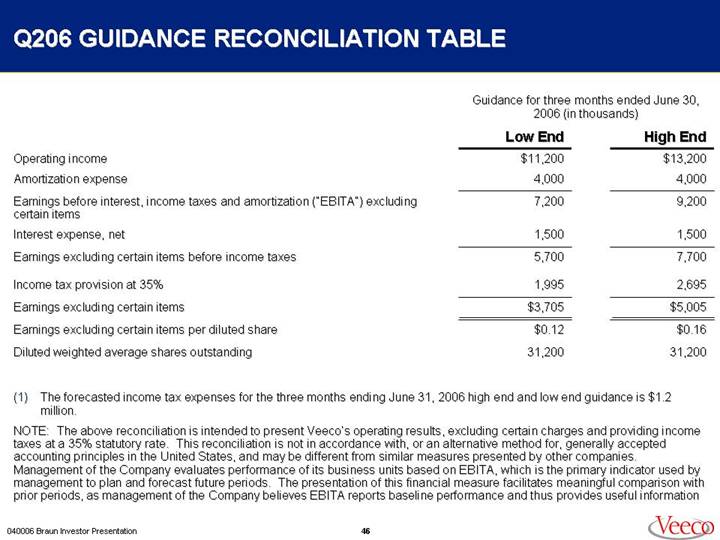
Q206 GUIDANCE RECONCILIATION TABLE
| | Guidance for three months ended June | |
| | 30, 2006 (in thousands) | |
| | Low End | | High End | |
Operating income (loss) | | $ | 11,200 | | $ | 13,200 | |
Amortization expense | | 4,000 | | 4,000 | |
Earnings before interest, income taxes and amortization (“EBITA”) excluding certain items | | 7,200 | | 9,200 | |
Interest expense, net | | 1,500 | | 1,500 | |
Earnings excluding certain items before income taxes | | 5,700 | | 7,700 | |
Income tax provision at 35% | | 1,995 | | 2,695 | |
Earnings excluding certain items | | $ | 3,705 | | $ | 5,005 | |
Earnings excluding certain items per diluted share | | $ | 0.12 | | $ | 0.16 | |
Diluted weighted average shares outstanding | | 31,200 | | 31,200 | |
| | | | | | | | | |
(1) The forecasted income tax expenses for the three months ending June 31, 2006 high end and low end guidance is $1.2 million.
NOTE: The above reconciliation is intended to present Veeco’s operating results, excluding certain charges and providing income taxes at a 35% statutory rate. This reconciliation is not in accordance with, or an alternative method for, generally accepted accounting principles in the United States, and may be different from similar measures presented by other companies. Management of the Company evaluates performance of its business units based on EBITA, which is the primary indicator used by management to plan and forecast future periods. The presentation of this financial measure facilitates meaningful comparison with prior periods, as management of the Company believes EBITA reports baseline performance and thus provides useful information
46
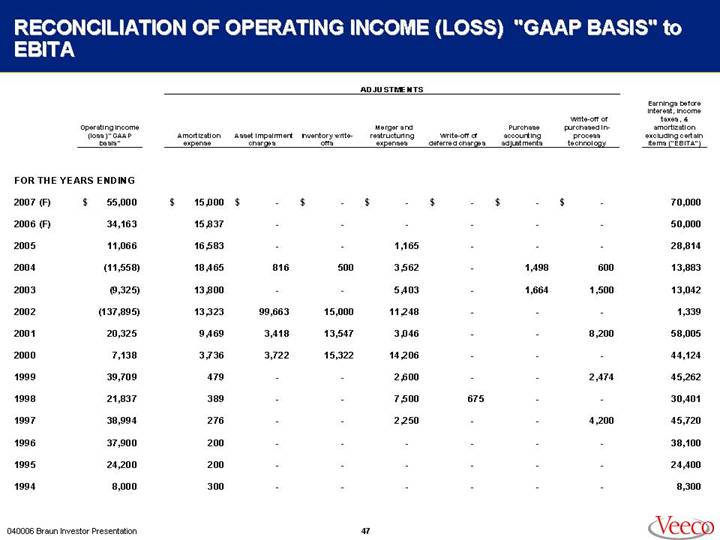
RECONCILIATION OF OPERATING INCOME (LOSS) "GAAP BASIS" to EBITA
| | | | ADJUSTMENTS | | | |
| | Operating income (loss) "GAAP basis" | | Amortization expense | | Asset impairment charges | | Inventory write-offs | | Merger and restructuring expenses | | Write-off of deferred charges | | Purchase accounting adjustments | | Write-off of purchased in-process technology | | Earnings before interest, income taxes, & amortization excluding certain items ("EBITA") | |
FOR THE YEARS ENDING | | | | | | | | | | | | | | | | | | | |
| | | | | | | | | | | | | | | | | | | |
2007 (F) | | $ | 55,000 | | $ | 15,000 | | $ | — | | $ | — | | $ | — | | $ | — | | $ | — | | $ | — | | 70,000 | |
| | | | | | | | | | | | | | | | | | | |
2006 (F) | | 34,163 | | 15,837 | | — | | — | | — | | — | | — | | — | | 50,000 | |
| | | | | | | | | | | | | | | | | | | |
2005 | | 11,066 | | 16,583 | | — | | — | | 1,165 | | — | | — | | — | | 28,814 | |
| | | | | | | | | | | | | | | | | | | |
2004 | | (11,558 | ) | 18,465 | | 816 | | 500 | | 3,562 | | — | | 1,498 | | 600 | | 13,883 | |
| | | | | | | | | | | | | | | | | | | |
2003 | | (9,325 | ) | 13,800 | | — | | — | | 5,403 | | — | | 1,664 | | 1,500 | | 13,042 | |
| | | | | | | | | | | | | | | | | | | |
2002 | | (137,895 | ) | 13,323 | | 99,663 | | 15,000 | | 11,248 | | — | | — | | — | | 1,339 | |
| | | | | | | | | | | | | | | | | | | |
2001 | | 20,325 | | 9,469 | | 3,418 | | 13,547 | | 3,046 | | — | | — | | 8,200 | | 58,005 | |
| | | | | | | | | | | | | | | | | | | |
2000 | | 7,138 | | 3,736 | | 3,722 | | 15,322 | | 14,206 | | — | | — | | — | | 44,124 | |
| | | | | | | | | | | | | | | | | | | |
1999 | | 39,709 | | 479 | | — | | — | | 2,600 | | — | | — | | 2,474 | | 45,262 | |
| | | | | | | | | | | | | | | | | | | |
1998 | | 21,837 | | 389 | | — | | — | | 7,500 | | 675 | | — | | — | | 30,401 | |
| | | | | | | | | | | | | | | | | | | |
1997 | | 38,994 | | 276 | | — | | — | | 2,250 | | — | | — | | 4,200 | | 45,720 | |
| | | | | | | | | | | | | | | | | | | |
1996 | | 37,900 | | 200 | | — | | — | | — | | — | | — | | — | | 38,100 | |
| | | | | | | | | | | | | | | | | | | |
1995 | | 24,200 | | 200 | | — | | — | | — | | — | | — | | — | | 24,400 | |
| | | | | | | | | | | | | | | | | | | |
1994 | | 8,000 | | 300 | | — | | — | | — | | — | | — | | — | | 8,300 | |
| | | | | | | | | | | | | | | | | | | | | | | | | | | |
47