Exhibit 99.1
Investor Presentation February 12, 2007 |
Embedded Storage for CE Microdrives / Femto TFMH Perpendicular recording 90 and 65nm 300mm HB-LED / Wireless, Automotive, Camera Cell Phones, Backlit LCD TV Nanotech, Material & Life Science Veeco Provides Enabling Technology in Process Equipment and Metrology for Multiple Growth Markets Data Semiconductor HB-LED Scientific Storage Wireless Research |
Veeco’s Strategy For Growth Offer a broad product line of well differentiated enabling Process Equipment and Metrology technologies Establish strategic relationships with technology leaders worldwide Capture leading market share in all product lines Leverage our exposure to high-growth end markets Fuel our growth through internal development of multi generational new products aligned to our customers’ new technology strategic roadmaps Continually improve our operations to remain profitable through industry cycles WE BELIEVE THERE IS A MULTI-HUNDRED MILLION DOLLAR GROWTH OPPORTUNITY FOR VEECO EXISTING IN THE TECHNOLOGIES WE OWN TODAY |
2006 Highlights 2006 Revenue $441M up 8%; EBITA up 38% from 2005 2006 Bookings $493.8M, up 22% from 2005 Gross Margin improvement continues; up 200 basis points to 44% in 2006 EPS (excluding certain items) $0.74 vs. $0.46, up 61% vs 2005 Increased revenue and profitability in each quarter of 2006 Continued strong cash generation All Veeco business units profitable in Q3 and Q4 Increased market share; strong pipeline of new products Broadened Veeco product line in Process Equipment (PVD, ALD, Slider, MOCVD, BioAFM). Expect > $200M of new product revenue in 2007. Improved worldwide Distribution and Service organization Named senior Veeco executive, Benjamin Loh, to newly created position of Executive VP, Worldwide Field Operations (Sales & Service) |
Veeco 2006 Multi-Market Growth... Double Digit Growth in Data Storage and HB-LED/Wireless Perpendicular Recording technology & consumer electronics require new Veeco Equipment & Metrology Brightness Roadmap for new LCD-TV backlighting requires new MOCVD tools 3D Metrology required as dimensions shrink below 90nm Nanoscale Research requires atomic instrumentation 2005 Veeco Revenue 2006 Veeco Revenue Data Storage HB-LED/ Wireless Semi-conductor Scientific Research $167M $184M +10% $63M $89M $69M $58M $111M $111M $410M $441M Double digit growth in Data Storage and HB-LED/Wireless +42% -17% Flat +8% |
We Have Strategic Relationships With Global Technology Leaders & Strong Market Share Semiconductor #1 AFM, Leader Optical HB-LED / Wireless A Leader in MOCVD and MBE Scientific Research #1 Research AFM Data Storage #1 TFMH Equipment THOUSANDS OF CUSTOMERS HDD COMPANIES WHO MAKE TFMHS SERVING GLOBAL INDUSTRY LEADERS STRONG MARKET SHARE |
Veeco Has Diverse... Multi-Product... Multi-Market... Worldwide Exposure Revenue by Product Equipment up 18% Metrology down 6% Revenue by Market Data Storage up 10% HB-LED/Wireless up 42% Revenue by Region APAC/ROW growth 34% Veeco benefits from product, market and geographic diversity 2006 REVENUE $441M up 8% Equipment 61% Rev $268.9M GM 39%* Metrology 39% Rev $172.2M GM 52%* HB-LED /Wireless 20% Scientific Research 25% Data Storage 42% Semiconductor 13% Europe 16% U.S. 33% Asia Pacific/ROW 38% Japan 13% *Note: GMs are approximate |
Veeco Has Diverse... Multi-Product... Multi-Market... Worldwide Exposure Orders by Product Equipment up 38% Metrology up 2% Orders by Market Data Storage up 26% HB-LED/Wireless up 78% Orders by Region APAC/ROW growth 53% Veeco benefits from product, market and geographic diversity 2006 ORDERS $494M; up 22% Equipment 63% Orders $314.7M Metrology 37% Orders $179.1M HB-LED /Wireless 23% Scientific Research 22% Data Storage 42% Semiconductor 13% Europe 13% U.S. 33% Asia Pacific/ROW 42% Japan 12% |
Veeco’s Financial Model |
2006 Continued Growth in... Revenue, Margins and EBITA *EBITA calculation = earnings before interest, taxes and amortization... see reconciliation table Gross Margin EBITA* Revenue 2006 Revenue Growth +8% Gross Margin Improvement +200 Basis Points Per Year EBITA Growth Greater than 30% for Year 39% 42% ~44% 0% 10% 20% 30% 40% 50% 2004 2005 2006 $410M $390M $441M $0 $100 $200 $300 $400 $500 2004 2005 2006 $29M $14M $40M $0 $10 $20 $30 $40 $50 2004 2005 2006 |
Continued Initiatives... Improve Margins, Operational Excellence, Reduced Cycle Times Simplify Veeco operational organization around a single Process Equipment and a single Metrology senior management structure with emphasis on: Development of common hardware/software platforms Increased outsourcing content of new products Shorter manufacturing cycles ...less inventory ...improved reliability Supply chain management ...reduced number of vendors Implement SAP across all Veeco divisions to eliminate redundant support functions. Operational excellence to include inventory reduction, capex reduction, DSO management and cash generation ...best practices across all of Veeco |
Veeco’s 2006 Growth Opportunity... Increased Revenues and Gross Margins $163M +9% $182M +12% $172M -6% $227M +75% $228M FLAT $269M +18% 2004 2005 2006 Metrology Process Equipment Revenue $390M Revenue $410M 30% GM 52% GM 39% GM 35% GM 51% GM 42% GM 39% GM 52% GM 44% GM Growth +8% Growth +5% Growth +40% Revenue and margin growth opportunities in both Equipment and Metrology Revenue $441M |
Improved Financial Performance in Trough and Peak Quarters $53M 4% 38% Equipment Trough Quarter $41M 14% 51% Metrology Revenue EBITA Oper Expense Gross Margin 44-45% 39% $94M 6% Total Veeco ~$135 to $145M 14-17% 32% 46-48% Target $80M 12% 40% Equipment Peak Quarter $45M 16% 53% Metrology 44-46% 34% $125-135M 10-12% Total Veeco Earn 5 to 6% in Trough quarters ($90 – 95M) Earn 10 to 12% in Peak quarters ($125 – $135M) Earn 14 – 17% at Target Revenue ($135M - $145M) |
Q1 2007 GUIDANCE (February 12, 2007) Q1 revenues to be in the range of $95 - $105 million. Q1 orders to be in the range of $110 million +/- 5% . Q1 2007 GAAP in the range of ($0.10) to $0.03 per share. Q1 2007 non-GAAP (excluding amortization and the $0.6 million gain on the repurchase of our convertible notes) earnings per diluted share are expected to be between $0.02 to $0.10 using a 35% tax rate, including options expense. |
Data Storage Opportunity |
0 200 400 600 800 1000 1200 1400 1600 1956 1966 1976 1986 1996 2006 M Units – Annual HDD Shipments PC 3.5” 2.5” 3rd ERA 2016 Mainframe 24”, 14” 1st ERA Mini-computer 8”, 5.25” 2nd ERA 2004 Consumer era 2.5” 1.8” 1” 3.5” DVD/HDD recorder MP3 HDD 4th ERA Source : Hitachi GST Estimate Consumer Applications Enable Dramatic Hard Drive Growth... Unit Growth to Double Personal Storage Personal Video recorder Cell Phone |
Data Storage... Hard Disk Drive Unit >20% CG... Consumer Electronics Segment Will Approach Size of Computer Market Segment 1980 1985 1990 1995 2000 2005 2010 2015 Unit Drive Shipments (M) 800 700 600 500 400 300 200 100 0 Consumer Electronics Laptop PC Desktop PC Enterprise Servers Desktop Laptop TiVo iPod GPS Mobile Phones Approx 30% of HDDs by 2006 Xbox |
Record Breaking Years Lie Ahead 0 100 200 300 400 500 600 700 800 1992 1993 1994 1995 1996 1997 1998 1999 2000 2001 2002 2003 2004 2005 2006 2007 2008 2009 2010 $0B $5B $10B $15B $20B $25B $30B $35B $40B $45B Units Revenue Millions Source: IDC, Storage Mechanisms - Disk IDC current forecast is over 730M HDDs in 2010 and $41B in revenue |
Rapid adoption of PMR and TMR technology and transition to Femto sliders Areal Density Growth 125 to 500 Gbits/in2 Femto, PMR and TMR technologies have stringent requirements for Process Equipment and Metrology Technology Advances to Meet Market Requirements... Requires Continued Investment 20% 40% 60% 80% 100% 2005 2006 2007 2008 2009 2010 Year Adoption [%] 0 200 400 600 800 1000 GBits/in 2 PMR Areal Density TMR CPP-GMR Femto 0% |
Data Storage Capital Intensity Increases... 10% of HDD Revenue *Source: Tom Coughlin, Coughlin Associates 10.6% $5.68 B $53.6 B 2010 10.1% (avg.) $21.45 $211.9 B Total (2006-2010) 8.9% $2.87 B $32.4 B 2006 9.9% $3.62 B $36.6 B 2007 10.3% $4.29 B $41.5 B 2008 10.4% $4.96 B $47.7 B 2009 7.9% $2.23 B $28.1 B 2005 HDD CapEx % of Revenue HDD CapEx $B Total HDD Revenue Year HDD CapEx % of Revenue* 0 1 2 3 4 5 6 2005 2006 2007 2008 2009 2010 HDD CapEx $B HDD CapEx $B |
Data Storage Multi-Year Growth in New Technology and Capacity... Provides Veeco with Continued Growth 2004 $123M ~26% $184M $167M $90M 2003 30% 90% 2076 2009 10% Larger Wafer 150mm/200mm Veeco Revenue CAGR 2005 2006 60% 30% 14% 3% PMR Content 100% 80% 30% 10% Femto Content Perpendicular recording / Areal density growth Femto sliders/200mm wafers Continued CE & mobile growth TMR higher areal density growth Consumer electronics Seagate / Maxtor Areal density growth 30% per year GMR Flash emerges Market Conditions 12% CAGR New Slider tools (saws/lapping) New PVD / ALD deposition Advanced Metrology Auto AFM New Nexus IBE / IBD / DLC Optical Profiler New Veeco Products 1898 1787 1532 1232 TFMH (M) Growth 2008 2007 2006 2005 Technology (units) Source Trend Focus 8/2006 |
Veeco HDD Strong Y/Y Growth Trends... Quarters Remain Volatile Veeco to Continue our Commitment to HDD Well Positioned to Remain the TFMH Equipment Industry Leader Veeco HDD Revenues ($M) 30% CAGR 2003-2006 $91 $124 $167 $184 $0 $20 $40 $60 $80 $100 $120 $140 $160 $180 $200 2003 2004 2005 2006 ~26% CAGR 2003-2006 |
Veeco... A Strategic Partner in Every Step of the Manufacturing Process Our strategy has been to provide tool and process technology, improved productivity, and a broad range of products to be the world-wide strategic supplier to the TFMH industry. |
Data Storage Current Market Conditions Q3 and Q406 slowdown in new purchases as Customers digested equipment orders from Veeco in first half 2006. Customers remain committed to technology programs, specifically PMR... Femto... early investment in wafer size change. “Consumables” pick-up indicates tight capacity (Equipment utilization over 90%) at key customers. 2007 continued double digit Veeco growth opportunityexpect order rate pick-up by Q2. |
HB-LED/Wireless Opportunity |
Early Stage, High-Growth Opportunity LED market opportunity in its infancy – traffic lights, key pads, LCD monitors We have key enabling technology, MOCVD Each LED generation requires new MOCVD equipment Our focus on process technology development, support and strategic customer relationships |
1960 1970 1980 1990 2000 2010 2020 Relative LED Unit Shipments Enterprise Red Indicator Lights Red HB-LEDs Blue & Green HB-LED (GaN) White Backlighting General Illumination Red LED Blue & Green HB-LED Red HB-LED Tail Light HB-LED Headlights Small LCD Backlighting Cell Phone PDA Large LCD Backlighting $12B HB-LED Market Size Solid State Lighting Growth Opportunity Red, Green, Blue HB-LED / Wireless >20% CAGR |
Brightness and Cost Improvements Drive Growth Cost per 1000 Lumens Efficiency Lumens/Watt 150 130 110 90 70 50 30 20 15 5 Large LCD Backlighting Mobile Phones Traffic Lights Outdoor Signage General Lighting GaNzilla I MOCVD GaNzilla II MOCVD Turbo Disc K-Series MOCVD Next Gen +1 MOCVD 2002 2003 2005 2006 2007 2004 >2010 2000 $10 $17 $25 $35 $50 $70 $95 $125 $150 Blue Keypads Automotive |
Multi Year HB-LED/Wireless Growth... Driven By “White LED” Penetration of LCD TV, Automotive & Architectural Lighting 138M 10B 2004 27% +23% +20% CAGR $175M +15% 13.0% 395M 25B 2009 Mobile phones Outdoor signs Traffic lights Camera flash Backlit laptops Auto lighting Specialty interior lighting General illumination Backlit LCD TV Auto headlights Architectural lighting 9.0% 3.5% 1.0% 0.2% LED - Backlit Penetration $150M 30% $115M +30% $85M +30 to 35% $65M Veeco CS Revenue 353M 308M 264M 215M Flat Panel Backlit Units (2) Market Applications 21B 2008 18B 15B 12.5B LED Units* (1) 2007 2006 2005 * For emerging applications such as signs/displays, signals, automotive and illumination. (1) Source: Strategies Unlimited (2) Source: Display Search |
0 10,000 20,000 30,000 40,000 50,000 60,000 2005 2006 2007 2008 2009 # Devices (Millions) Multi-Year Growth Opportunity... HB-LED Units Forecast: 23% CAGR Red/Orange/Yellow Blue/Green/UV 23% CAGR Source: Strategies Unlimited and Veeco Estimates |
HB-LED Opportunity... Multi-Year Equipment Growth From Increased Adoption Automotive Lighting General Illumination Outdoor Signage Mobile Appliances Headlamps Dashboards Displays Architectural and General Illumination Large Displays Traffic Signals Storefront Lighting Cell Phones PDAs Flashlights LCD Backlighting Flat Panel TVs Laptops Retail Displays 2006-2007 GROWTH OPPORTUNITY |
Emerging Applications... First Wave Small Panel Displays (’06/’07 MOCVD) HB-LEDs are capturing small panel display backlighting Cost and brightness now meet requirements Replaces CCFL backlight, no mercury Provide weight, power and panel thickness advantage “Every small LCD panel maker in Taiwan is qualifying HB-LED backlighting now” – Taiwan HB-LED Mfg. GaNzilla II Meets Cost and Performance Requirements LEDs provide “slimmer and more efficient” LCDs |
Emerging Applications... Second Wave TV Backlighting (’08/’09 MOCVD) Adoption driver: color quality, depth, contrast Cost competitive LED backlighting expected for 32” LCD TV in 2007 – sooner than expected CCFL covers 85% of NTSC color gamut... LEDs cover 105% *Source: Insight Media, DigiTimes.com, Press Release, May 26, 2006 Backlighting Unit Shipment Forecast 40-44” LCD TV Segment 0 5 10 15 20 2006 2007F 2008F 2009F 2010F Units (M) CCFL LED Penetration |
LEDs Catching Up To Traditional Light Sources 10,000 $5 50 Compact Fluorescent 1,000 $1 15 Incandescent 35,000 $50 Production: 50 Lab: 150 LED Useful Life Hours Cost per 1K Lumens Efficiency Lumens/Watt Sources: US DOE PNNL-SA-45784, Company Press Releases |
Latest Developments in HB-LEDs Samsung unveils 40 inch LED backlit LCD TV Audi announces R8 w/ LED headlights by end of 2007 Wal-Mart installing LEDs in 500 stores, $2.6M/year saved Samsung launches 20-inch LCD monitor w/ LED BLU Samsung says all LCD monitors will be LED-based by 2008 Nichia achieves 150lm/W (1.7x efficiency of Fluorescent) TI introduces LED-backlit DLP RPTV LG's introduces battery powered LED projector @ 100lm Apple & HP to launch notebooks w/ LED BLU’s by Q2’07 |
LED Advances Drive Need for MOCVD Improvements MOCVD Requirement LED Requirement 2.5nm 2” $17 Batch 65-85 17 50 2006 1.5nm 2, 4, 6” $4 Wafer 2nm 2, 4” $8 Batch Film Uniformity Wafer Sizes Consumable Cost/Wafer Automation Level 120-145 3 10 80-100 8 25 Lumens/Watt $/1K Lumens Standard $/1K Lumens Power 2009 2007 New MOCVD Capability Required with Each LED Generation |
Introduced Next-Generation K-Series MOCVD Production Platform K-Series Platform Received orders in Q4 for 5 K-Series; Total = $10 million. Modular, upgradeable platform Common across GaN & As/P product lines Only platform capable of continuous operation More runs per day than any other platform K465 Features Our most advanced reactor technology Better uniformity Better source efficiency 50% greater throughput than competition Largest reactor capacity |
GaNzilla II: Improved Uniformity Driving Share Gains in 2006; K-Series with Improved Thruput and Larger Chamber Size To Be Introduced in 2007 LEDs are binned based on wavelength Wavelength uniformity key measure of Yield Tighter distribution is better More good die per wafer New K Series, multi- generational platform offers further improvement in thruput and larger reactor size (received orders for $10M first 5 units in Q4) GaNzilla II GaNzilla I |
Metrology Opportunity: Semiconductor and Scientific Research |
Veeco’s Leading Metrology Solutions NT9800 Dimension V AFM Dektak 150 BioScope II Leadership positions in Semiconductor, Data Storage, General Industrial, MEMS Metrology Nano/Bio Research – university & nano-center focused business 2007 Focus for Nano-Bio Research AFM and Optical Launch Next Generation Products and Drive Market Expansion 2007 Focus for Automated AFM Launch New Platform Drive Next Level of Market Adoption via new Key Apps in Semi & DS Dimension AFP |
Successfully Launch M&I New Products To Capture Market Share 2006 New Products 2007 New Products BioScope II SP3250 V Series AFM DMEMS Optical Caliber AFM D150Stylus Profiler Dimension AFP NT Optical Profiler BioScope II Extensions Fast-Scan AFM Vx200 PTR SP4900 New Auto AFM diCaliber II NT/HD Series |
Veeco Created the Semi AFM Market Opportunity and Remains the Clear Market Leader... More than 350 Automated AFM Systems Shipped Automated Pole Tip Recession Metrology Markets Data Storage Non destructive, accurate Metrology Markets Semiconductor CCD Advanced 3D AFM Metrology Markets Data Storage Mask New AFP For CMP & Etch Metrology Markets Semiconductor Data Storage |
Growing Application Space for Automated AFMs Auto-AFMs used for in-line metrology in CMP, Etch, Litho and Mask modules Auto-AFM continues penetration at 65 & 45nm with new Veeco solutions Fab-based Reference Metrology for TEM replacement Advanced Mask Metrology for 45nm and below Advanced Lithography for Line Edge Roughness & Line Width Variation Next-Gen, Higher Thruput Platform, in 2007 Polygate TEM Etched Polygate X3D Image Advanced Mask Structure X3D Image 28nm Isolated Line |
Nano Ruler World Leader in Surface Science and Metrology Magnetic Bits (HDD) 160nmx40nm (100Gb/in2). MEMS 10um – 1mm Transistor 0.5um – 90nm Quantum Dots 20nm wide ea. Silicon Atom 0.2nm dia Human Hair 70um wide Red Blood Cells 3um dia DNA Strand 2nm wide Nanotech 1,000,000nm 100,000nm 10,000nm 1,000nm 100nm 10nm 1nm 0.1nm Bio Nano Microtech Thin Films TFH, IC Veeco Has the Broadest Line of Tools For Micro to Nano Applications DMEMS Optical Dimension V Dektak Stylus Multimode V Installed Base of ~8,000 AFMs and ~2,000 Optical Profilers |
Nano Metrology Nano Manipulation Nano Material Carbon Nanotube Transistor Veeco’s Scientific Research Business (approximately 100 Research AFMs per quarter) Nanotechnology Materials Research Life Sciences Semiconductor Future Data Storage Polymers Living Cells DNA Proteomics Polymers Cu Films Magnetic Storage Media DNA Lipids Protein Crystal Detection We Sell Over 100 Tabletop AFMS Per Quarter Stable, High Margin Business |
Nanotechnology “All The World’s Industry Is In Its Path” AFMs Image, Measure and Manipulate Nanoscale Structures Life Science Info Technology Nano Ruler Magnetic Bits (HDD) 160nmx40nm (100Gb/in2). MEMS 10um – 1mm Transistor 0.5um – 90nm Quantum Dots 20nm wide ea. Silicon Atom 0.2nm dia Human Hair 70um wide Red Blood Cells 3um dia DNA Strand 2nm wide 1,000,000nm 100,000nm 10,000nm 1,000nm 100nm 10nm 1nm 0.1nm Magnetic Bits (HDD) 160nmx40nm (100Gb/in2). MEMS 10um – 1mm MEMS 10um – 1mm Transistor 0.5um – 90nm Quantum Dots 20nm wide ea. Silicon Atom 0.2nm dia Human Hair 70um wide Red Blood Cells 3um dia DNA Strand 2nm wide Silicon Atom 0.2nm dia Human Hair 70um wide Red Blood Cells 3um dia DNA Strand 2nm wide 1,000,000nm 100,000nm 10,000nm 1,000nm 100nm 10nm 1nm 0.1nm |
BioAFM Microscopy Market in its Infancy The potential of the SPM in biology remains largely untapped. Quantitative research, followed by clinical applications, will drive adoption. Rate of Adoption for Biological Imaging Technologies vs. Time Innovators Early Majority Late Majority Early Adopters Laggards Time (Not to Scale) Optical Microscopy SEM Confocal Biological AFM Present 100 nm 100 mm 100 mm AFM Optical Microscopes DNA Cell Proteins & single Molecules 1 Å BioScope II AFM |
Safe Harbor Statement To the extent that this presentation discusses expectations about market conditions, market acceptance and future sales of Veeco’s products, Veeco’s future financial performance, future disclosures, or otherwise makes statements about the future, such statements are forward-looking and are subject to a number of risks and uncertainties that could cause actual results to differ materially from the statements made. These factors include the challenges of volatility in end market conditions and the cyclical nature of the data storage, semiconductor, HB-LED/wireless and scientific research markets, risks associated with integrating acquired businesses and the acceptance of new products by individual customers and by the marketplace and other factors discussed in the Business Description and Management’s Discussion and Analysis sections of Veeco’s Annual Report on Form 10-K for the year ended December 31, 2005, subsequent Quarterly Reports on Form 10-Q and current reports on Form 8-K. Veeco does not undertake any obligation to update any forward-looking statements to reflect future events or circumstances after the date of such statements. In addition, this presentation may review non-GAAP financial measures. For GAAP reconciliation, please refer to the reconciliation section in this presentation as well as Veeco’s financial press releases and 10K and 10Q filings available on www.veeco.com |
APPENDIX |
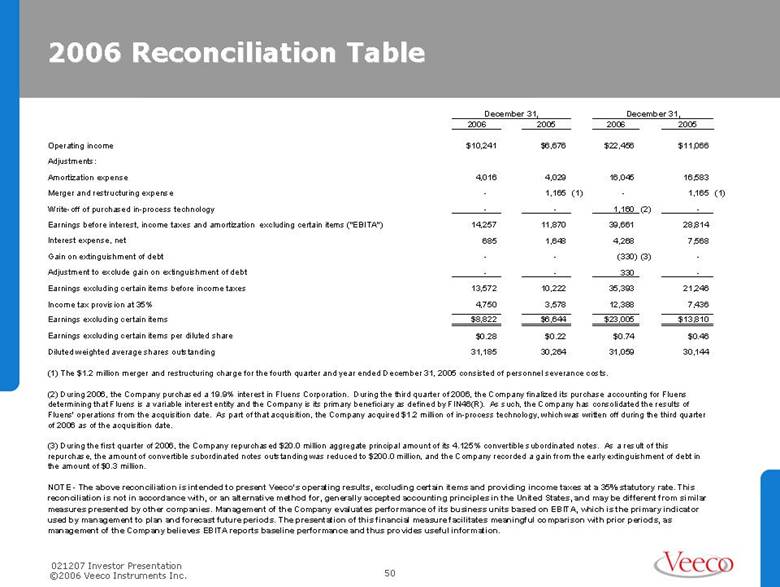
2006 Reconciliation Table 2006 2005 2006 2005 Operating income $10,241 $6,676 $22,456 $11,066 Adjustments: Amortization expense 4,016 4,029 16,045 16,583 Merger and restructuring expense - 1,165 (1) - 1,165 (1) Write-off of purchased in-process technology - - 1,160 (2) - Earnings before interest, income taxes and amortization excluding certain items ("EBITA") 14,257 11,870 39,661 28,814 Interest expense, net 685 1,648 4,268 7,568 Gain on extinguishment of debt - - (330) (3) - Adjustment to exclude gain on extinguishment of debt - - 330 - Earnings excluding certain items before income taxes 13,572 10,222 35,393 21,246 Income tax provision at 35% 4,750 3,578 12,388 7,436 Earnings excluding certain items $8,822 $6,644 $23,005 $13,810 Earnings excluding certain items per diluted share $0.28 $0.22 $0.74 $0.46 Diluted weighted average shares outstanding 31,185 30,264 31,059 30,144 NOTE - The above reconciliation is intended to present Veeco's operating results, excluding certain items and providing income taxes at a 35% statutory rate. This reconciliation is not in accordance with, or an alternative method for, generally accepted accounting principles in the United States, and may be different from similar measures presented by other companies. Management of the Company evaluates performance of its business units based on EBITA, which is the primary indicator used by management to plan and forecast future periods. The presentation of this financial measure facilitates meaningful comparison with prior periods, as management of the Company believes EBITA reports baseline performance and thus provides useful information. December 31, (1) The $1.2 million merger and restructuring charge for the fourth quarter and year ended December 31, 2005 consisted of personnel severance costs. (2) During 2006, the Company purchased a 19.9% interest in Fluens Corporation. During the third quarter of 2006, the Company finalized its purchase accounting for Fluens determining that Fluens is a variable interest entity and the Company is its primary beneficiary as defined by FIN46(R). As such, the Company has consolidated the results of Fluens' operations from the acquisition date. As part of that acquisition, the Company acquired $1.2 million of in-process technology, which was written off during the third quarter of 2006 as of the acquisition date. (3) During the first quarter of 2006, the Company repurchased $20.0 million aggregate principal amount of its 4.125% convertible subordinated notes. As a result of this repurchase, the amount of convertible subordinated notes outstanding was reduced to $200.0 million, and the Company recorded a gain from the early extinguishment of debt in the amount of $0.3 million. December 31, |
Q107 Guidance Reconciliation Table High End Low End 4,000 4,000 Amortization expense 6,300 2,500 Earnings before interest, income taxes and amortization, excluding certain items (“EBITA”) 1,300 1,300 Interest expense, net 5,000 1,200 Earnings excluding certain items before income taxes 1,750 420 Income tax provision at 35% $3,250 $780 Earnings excluding certain items $0.10 $0.02 Earnings excluding certain items per diluted share 32,250 32,250 Diluted weighted average shares outstanding (1) The forecasted income tax expenses for the three months ending March 31, 2007 high end and low end guidance is $1.0 million. NOTE: The above reconciliation is intended to present Veeco’s operating results, excluding certain items and providing income taxes at a 35% statutory rate. This reconciliation is not in accordance with, or an alternative method for, generally accepted accounting principles in the United States, and may be different from similar measures presented by other companies. Management of the Company evaluates performance of its business units based on EBITA, which is the primary indicator used to plan and forecast future periods. The presentation of this financial measure facilitates meaningful comparison with prior periods, as management of the Company believes EBITA reports baseline performance and thus provides useful information. $10,300 $6,500 Operating income Guidance for three months ended March 31, 2007 (in thousands) |