Free signup for more
- Track your favorite companies
- Receive email alerts for new filings
- Personalized dashboard of news and more
- Access all data and search results
Filing tables
Filing exhibits
Related financial report
VECO similar filings
- 16 Jun 08 Departure of Directors or Principal Officers
- 22 May 08 Veeco Extends Thin Film Solar Equipment Product Line With Acquisition of Mill Lane Engineering
- 28 Apr 08 Veeco Announces First Quarter 2008 Financial Results
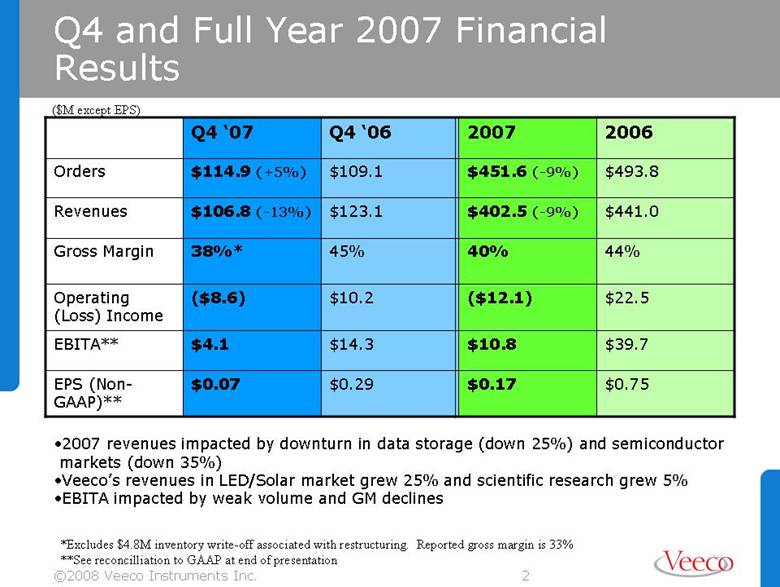
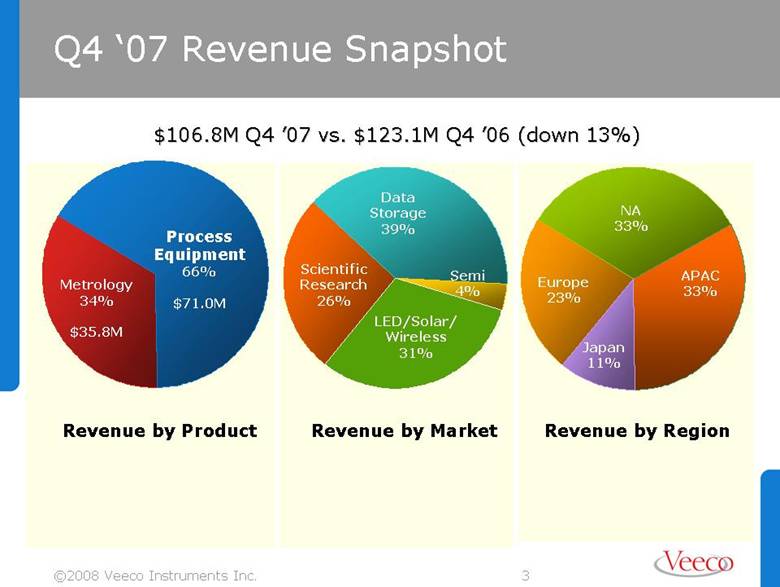
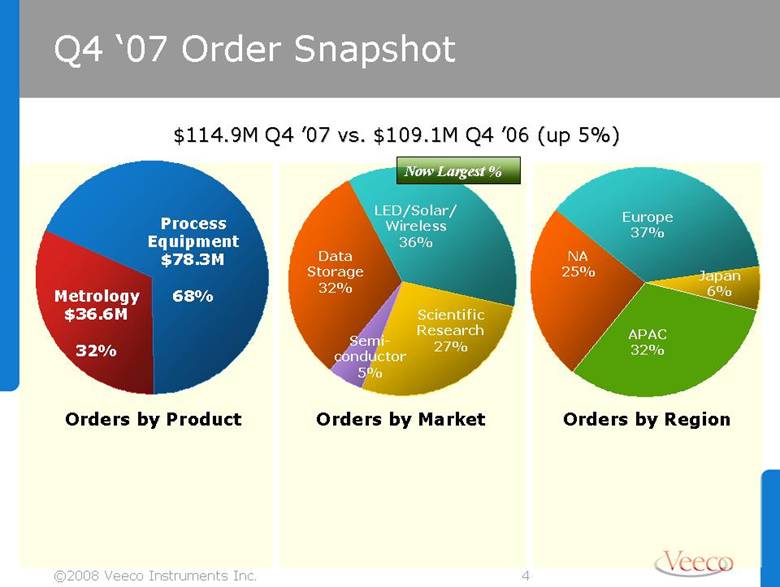
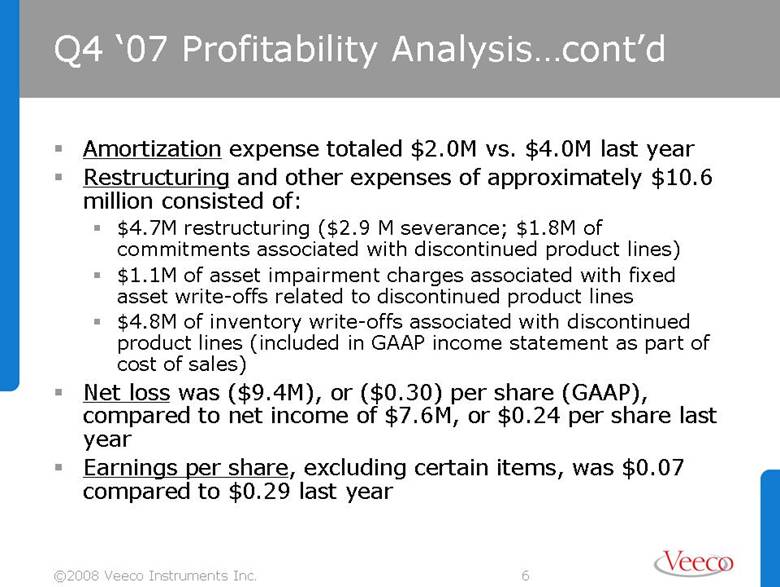
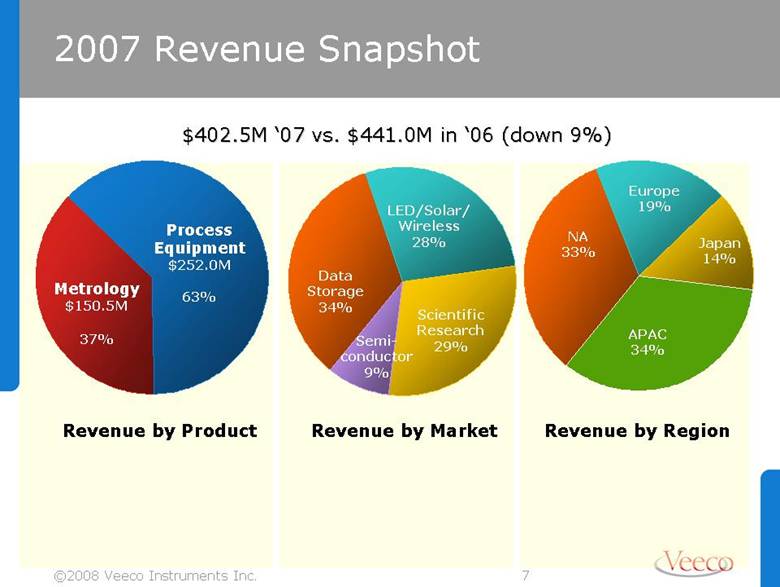
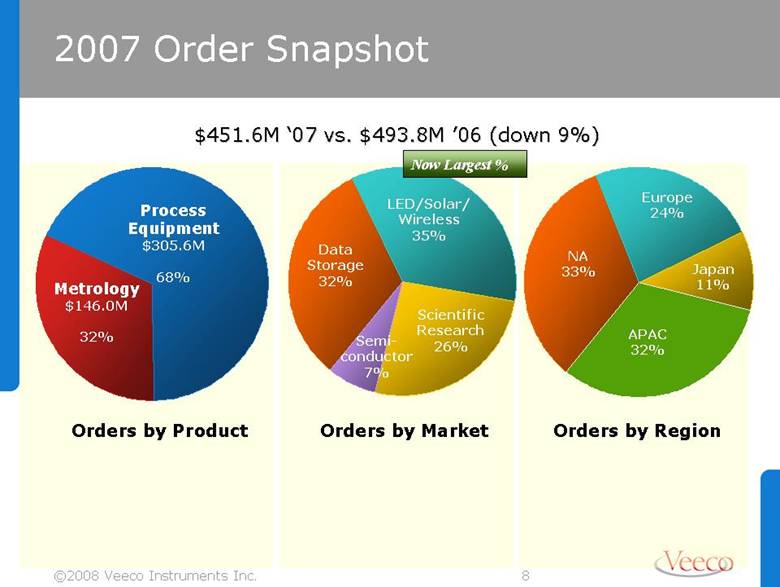
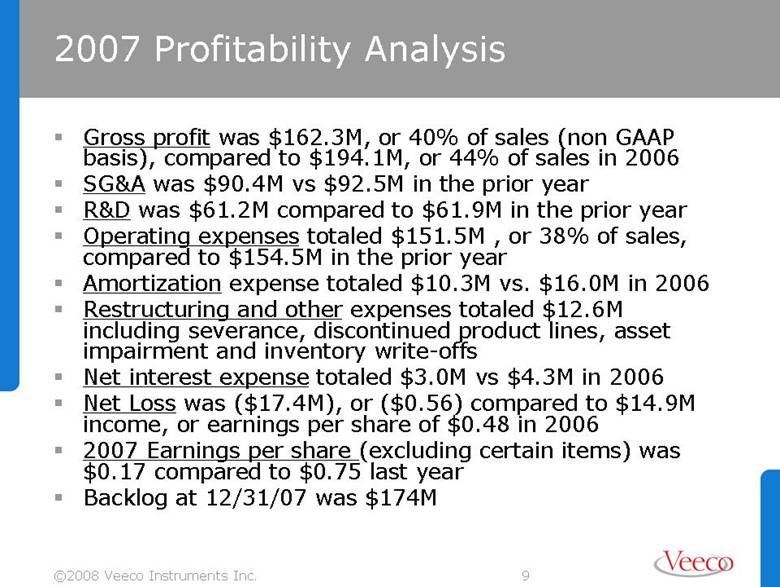
- 11 Feb 08 Veeco Announces Fourth Quarter and 2007 Financial Results
- 31 Jan 08 Other Events
- 27 Nov 07 Veeco Patent Litigation Against Asylum Research Set for Trial
- 5 Nov 07 Veeco Investor Presentation November 2007
Filing view
External links