Exhibit 99.2
Q1 ’08 Financial Data April 28, 2008 |
©2008 Veeco Instruments Inc 042808 Investor Slides 2 $30 $39 $40 $24 $42 $36 First Quarter Segment Results LED & Solar Process Equipment Data Storage Process Equipment Metrology LED & Solar Process Equipment Data Storage Process Equipment Metrology (41%) (24%) (35%) (36%) (37%) (27%) Q1 08 Revenues ($M) $102 Million Q1 08 Bookings ($M) $109 Million |
©2008 Veeco Instruments Inc 042808 Investor Slides 3 Q1 2008 Financials ($M except EPS) * Excludes $4.8M inventory write-off associated with restructuring. Reported gross margin is 33% ** See reconciliation to GAAP at end of presentation Q4 ’07 $114.9 $106.8 38%* ($8.6) $4.1 $0.07 Q1 ’07 $105.9 $99.2 44% $1.7 $5.6 $0.10 Q1 ’08 $109.3 $102.3 42% $0.2 $5.3 $0.09 Orders Revenues Gross Margin Operating Income (Loss) EBITA** EPS (Non-GAAP)** • In-line revenues and better than expected earnings due to restructuring and cost-containment • Better than anticipated Gross Margins, up 380 basis points sequentially |
©2008 Veeco Instruments Inc 042808 Investor Slides 4 Q1 Segment Data: Y/Y and Sequential Highlights 4.1 5.6 5.3 EBITA 37.9% 44.1% 41.7% Gross Margin 114.9 105.9 109.3 Bookings 106.8 99.2 102.3 Revenues Total (2.4) (2.6) (3.6) Unallocated Corporate (1.5) 4.0 1.8 EBITA 39.3% 49.4% 46.6% Gross Margin 36.6 37.2 30.0 Bookings 35.8 41.1 36.1 Revenues Metrology 2.8 2.4 (1.5) EBITA 34.9% 41.6% 35.3% Gross Margin 35.8 32.3 40.6 Bookings 37.3 35.7 24.1 Revenues Data Storage Process Equipment 5.2 1.8 8.6 EBITA 39.8% 38.2% 41.0% Gross Margin 42.5 36.4 38.7 Bookings 33.7 22.4 42.1 Revenues LED/Solar Process Equipment Q4 2007 Q1 2007 Q1 2008 ($ millions) |
©2008 Veeco Instruments Inc 042808 Investor Slides 5 2008 “Recovery Year” Goal is revenue growth at a minimum of 10% to $440M Operating spending forecasted to decline as a percentage of sales (38% in ’07 to 36-37% ’08) Continued focus on gross margin improvements: – Better than anticipated GMs in Q1 (41.7% vs. guidance of 39%)... anticipate continued GM improvements in 2H ‘08s – Driving margin improvement independent of volume • Better pricing • Global supply chain initiatives • Outsourcing Cost containment focus so that spending does not get ahead of revenue growth . . . continued improvements in expense structure |
©2008 Veeco Instruments Inc 042808 Investor Slides 6 Veeco’s 2008 Growth Outlook ~$440M ~10% $402M TOTAL $157-160M ~5-7% $150M Metrology $137-143M ~0-5% $136M Data Storage Process Equipment $140-145M ~20-25% $116M LED & Solar Process Equipment 2008 Revenue Range 2008 Revenue Growth Range* 2007 Revenue * Based upon end market industry forecasts (Strategy Analytics, IDC) and Veeco Estimates |
©2008 Veeco Instruments Inc 042808 Investor Slides 7 Q2 ’08 Guidance Q2 ‘08 Revenues $102-$110 million Q2 ‘08 Earnings ($0.02)-$0.07 per share GAAP Non-GAAP EPS $0.05 - $0.11 excluding amortization of $2.0 million, using a 35% tax rate Q2 ‘08 Orders $110-$118 million |
©2008 Veeco Instruments Inc 042808 Investor Slides 8 Gross Margin Improvement Model >5% 11 - 14% 3-5% 5.1% 2.7% 3.8% EBITA (%) 36-37% 32 - 34% 36-38% 36.5% 37.6% 34.1% Operating Expenses 42% 45-46% 41% 41.7% 40% 37.9% TOTAL 52% 46% 46.6% 44.1% 39.3% Metrology 43% 39% 39.0% 38.1% 37.2% Process Equipment Gross Margin > $440M $125-130M $102-$110M $102.3M $402M $106.8M Revenue 2008 Target Peak Quarter Q2’08 F Q1’08 2007 Full Year Q4 2007 Anticipate higher Q2 spending levels due to raises, additional hiring in LED & Solar PE |
©2008 Veeco Instruments Inc 042808 Investor Slides 9 Veeco Balance Sheet December 31, 2007 March 31, 2008 $273.7 $276.9 Shareholder’s Equity 146.6 146.4 Long-Term Debt (including current portion) 529.3 532.0 Total Assets 66.1 65.7 Fixed Assets 174.5 181.2 Working Capital $117.1 $114.4 Cash and Investments (in millions) |
©2008 Veeco Instruments Inc 042808 Investor Slides 10 Safe Harbor Statement To the extent that this presentation discusses expectations or otherwise make statements about the future, such statements are forward-looking and are subject to a number of risks and uncertainties that could cause actual results to differ materially from the statements made. These factors include the risk factors discussed in the Business Description and Management's Discussion and Analysis sections of Veeco's Annual Report on Form 10-K for the year ended December 31, 2007 and subsequent Quarterly Reports on Form 10-Q and current reports on Form 8-K. Veeco does not undertake any obligation to update any forward-looking statements to reflect future events or circumstances after the date of such statements. In addition, this presentation includes non-GAAP financial measures. For GAAP reconciliation, please refer to the reconciliation section in this presentation as well as Veeco’s financial press releases and 10-K and 10-Q filings available on www.veeco.com. |
©2008 Veeco Instruments Inc 042808 Investor Slides 11 Back-Up and Reconciliation Slides |
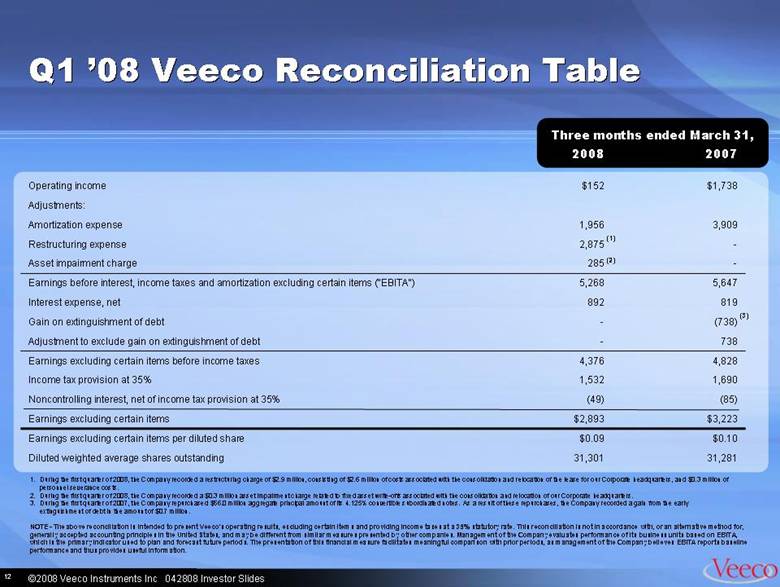
©2008 Veeco Instruments Inc 042808 Investor Slides 12 Q1 ’08 Veeco Reconciliation Table 31,281 31,301 Diluted weighted average shares outstanding $0.10 $0.09 Earnings excluding certain items per diluted share $3,223 $2,893 Earnings excluding certain items (85) (49) Noncontrolling interest, net of income tax provision at 35% 1,690 1,532 Income tax provision at 35% 4,828 4,376 Earnings excluding certain items before income taxes 738 - Adjustment to exclude gain on extinguishment of debt (738) - Gain on extinguishment of debt 819 892 Interest expense, net 5,647 5,268 Earnings before interest, income taxes and amortization excluding certain items ("EBITA") - 285 Asset impairment charge - 2,875 Restructuring expense 3,909 1,956 Amortization expense Adjustments: $1,738 $152 Operating income 2007 2008 (1) (2) (3) Three months ended March 31, NOTE - The above reconciliation is intended to present Veeco's operating results, excluding certain items and providing income taxes at a 35% statutory rate. This reconciliation is not in accordance with, or an alternative method for, generally accepted accounting principles in the United States, and may be different from similar measures presented by other companies. Management of the Company evaluates performance of its business units based on EBITA, which is the primary indicator used to plan and forecast future periods. The presentation of this financial measure facilitates meaningful comparison with prior periods, as management of the Company believes EBITA reports baseline performance and thus provides useful information. 1. During the first quarter of 2008, the Company recorded a restructuring charge of $2.9 million, consisting of $2.6 million of costs associated with the consolidation and relocation of the lease for our Corporate headquarters, and $0.3 million of personnel severance costs. 2. During the first quarter of 2008, the Company recorded a $0.3 million asset impairment charge related to fixed asset write-offs associated with the consolidation and relocation of our Corporate headquarters. 3. During the first quarter of 2007, the Company repurchased $56.0 million aggregate principal amount of its 4.125% convertible subordinated notes. As a result of these repurchases, the Company recorded a gain from the early extinguishment of debt in the amount of $0.7 million. |
©2008 Veeco Instruments Inc 042808 Investor Slides 13 Q1 2008 Segment Reconciliation March 31, March 31, 2008 2007 LED & Solar Process Equipment Bookings 38.7 $ 36.4 $ Revenues 42.1 22.4 Operating income (loss) 8.1 (0.5) Amortization expense 0.5 2.3 EBITA 8.6 1.8 Data Storage Process Equipment Bookings 40.6 32.3 Revenues 24.1 35.7 Operating (loss) income (2.6) 1.4 Amortization expense 1.0 1.0 Restructuring expense 0.1 - EBITA (1.5) 2.4 Metrology Bookings 30.0 37.2 Revenues 36.1 41.1 Operating income 1.2 3.6 Amortization expense 0.4 0.4 Restructuring expense 0.2 - 1.8 4.0 Unallocated Corporate Operating loss (6.6) (2.8) Amortization expense 0.1 0.2 Restructuring expense 2.6 - Asset impairment charge 0.3 - EBITA (3.6) (2.6) Total Bookings 109.3 105.9 Revenues 102.3 99.2 Operating income 0.1 1.7 Amortization expense 2.0 3.9 Restructuring expense 2.9 - Asset impairment charge 0.3 - EBITA 5.3 $ 5.6 $ ** Refer to footnotes on reconciliation of operating income to earnings excluding certain items Three months ended Segment Revenues, Bookings, and Reconciliation of Operating Income (Loss) to EBITA (In millions, unaudited) |
©2008 Veeco Instruments Inc 042808 Investor Slides 14 Q2 ‘08 Guidance Reconciliation Table LOW HIGH Operating income $1,000 $4,000 Amortization expense 2,000 2,000 Earnings before interest, income taxes and amortization excluding certain items ("EBITA") 3,000 6,000 Interest expense, net 800 800 Earnings excluding certain items before income taxes 2,200 5,200 Income tax expense at 35% 770 1,820 Noncontrolling interest, net of income tax provision at 35% (65) (65) Earnings excluding certain items $1,495 $3,445 Earnings excluding certain items per diluted share $0.05 $0.11 Diluted weighted average shares outstanding 31,600 31,600 Veeco Instruments Inc. and Subsidiaries Reconciliation of operating (loss) income to earnings excluding certain items (In thousands, except per share data) (Unaudited) Guidance for the Three months ended June 30, 2008 Note: The forecasted income tax expenses for the three months ending June 30, 2008 is $1.0 million for both high end and low end guidance. NOTE: The above reconciliation is intended to present Veeco’s operating results, excluding certain items and providing income taxes at a 35% statutory rate. This reconciliation is not in accordance with, or an alternative method for, generally accepted accounting principles in the United States, and may be different from similar measures presented by other companies. Management of the Company evaluates performance of its business units based on EBITA, which is the primary indicator used to plan and forecast future periods. The presentation of this financial measure facilitates meaningful comparison with prior periods, as management of the Company believes EBITA reports baseline performance and thus provides useful information. |
©2008 Veeco Instruments Inc 042808 Investor Slides 15 2007 Segment Data March 31, June 30, September 30, December 31, 2007 2007 2007 2007 LED & Solar Process Equipment Bookings 36.4 $ 36.4 $ 48.7 $ 42.5 $ Revenues 22.4 28.0 31.8 33.7 Operating (loss) income (0.5) 2.8 2.7 4.7 Amortization expense 2.3 1.0 0.5 0.5 EBITA 1.8 3.8 3.2 5.2 Data Storage Process Equipment Bookings 32.3 41.3 32.2 35.8 Revenues 35.7 32.1 31.1 37.3 Operating income (loss) 1.4 0.6 (2.2) (6.4) Amortization expense 1.0 1.0 1.0 1.0 Restructuring expense - - 0.2 2.3 Asset impairment charge - - - 1.1 Inventory write-off - - - 4.8 EBITA 2.4 1.6 (1.0) 2.8 Metrology Bookings 37.2 34.8 37.4 36.6 Revenues 41.1 38.7 34.8 35.8 Operating income (loss) 3.6 (0.6) (0.8) (2.4) Amortization expense 0.4 0.3 0.4 0.3 Restructuring expense - 0.6 0.6 EBITA 4.0 0.3 (0.4) (1.5) Unallocated Corporate Operating loss (2.8) (3.9) (3.9) (4.4) Amortization expense 0.2 0.1 0.1 0.2 Restructuring expense - 0.8 0.3 1.8 EBITA (2.6) (3.0) (3.5) (2.4) Total Bookings 105.9 112.5 118.3 114.9 Revenues 99.2 98.8 97.7 106.8 Operating income (loss) 1.7 (1.1) (4.2) (8.5) Amortization expense 3.9 2.4 2.0 2.0 Restructuring expense - 1.5 0.5 4.7 Asset impairment charge - - - 1.1 Inventory write-off - - - 4.8 EBITA 5.6 $ 2.8 $ (1.7) $ 4.1 $ Three months ended Segment Revenues, Bookings, and Reconciliation of Operating Income (Loss) to EBITA (In millions, unaudited) |