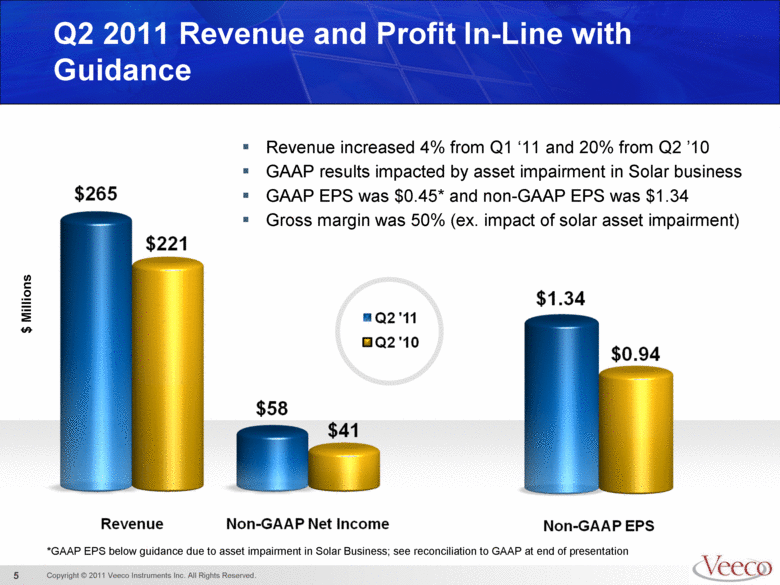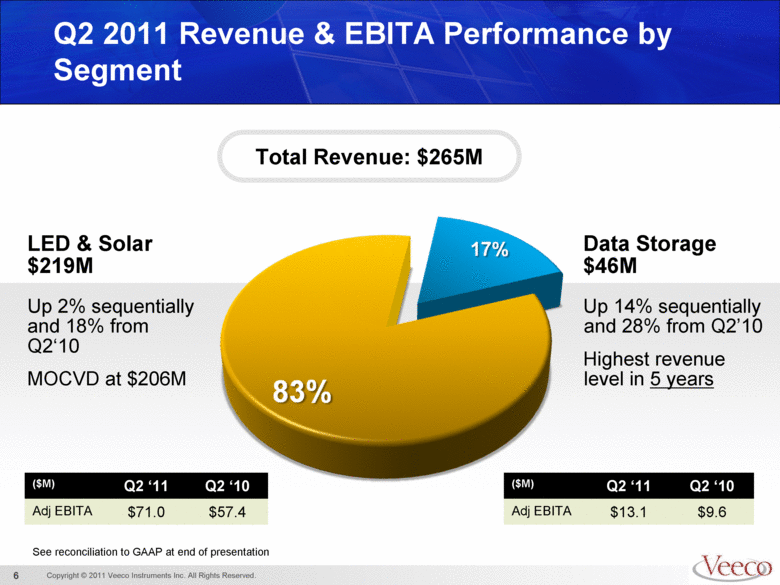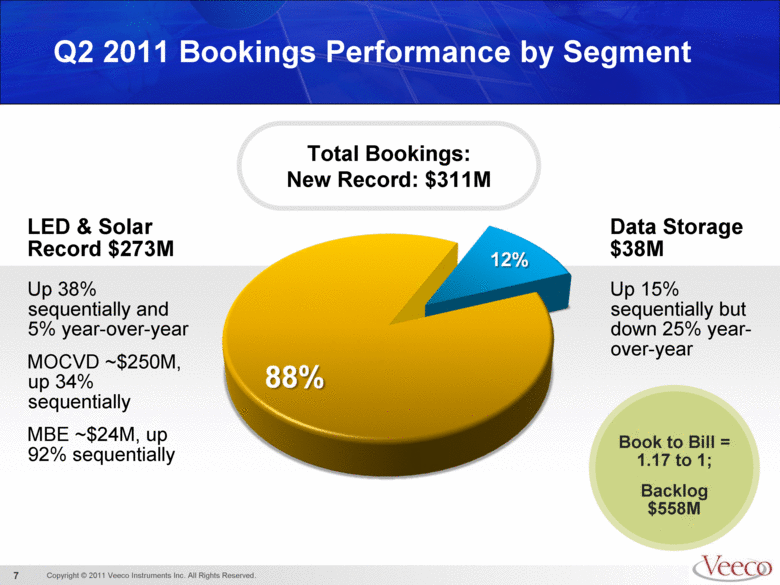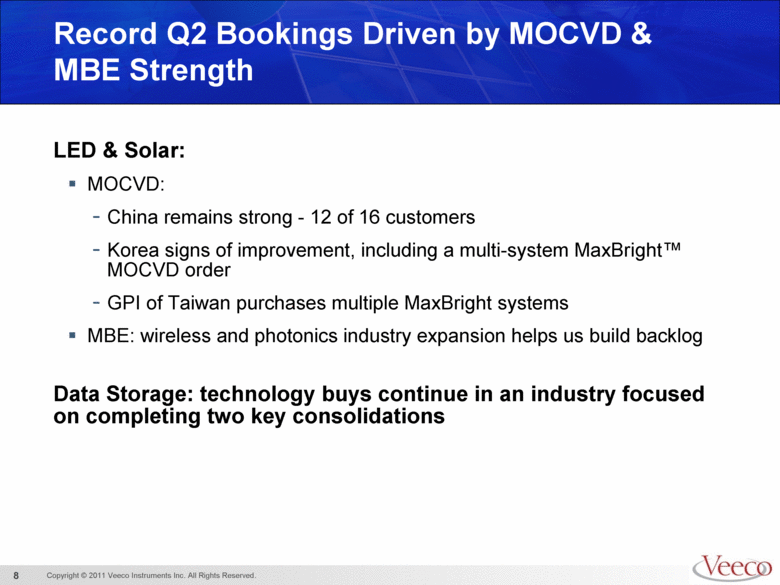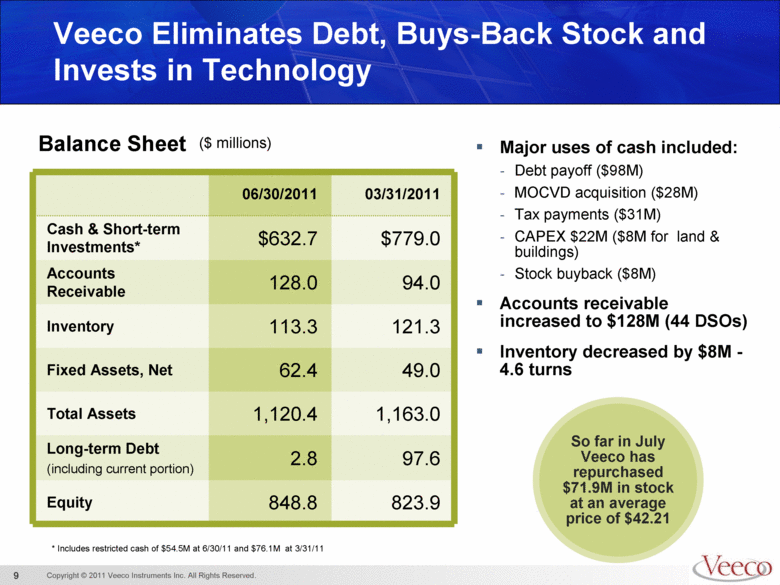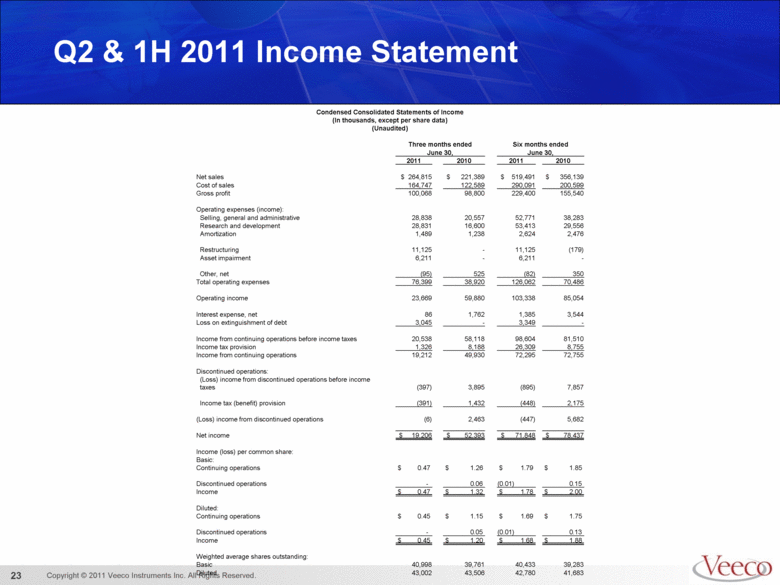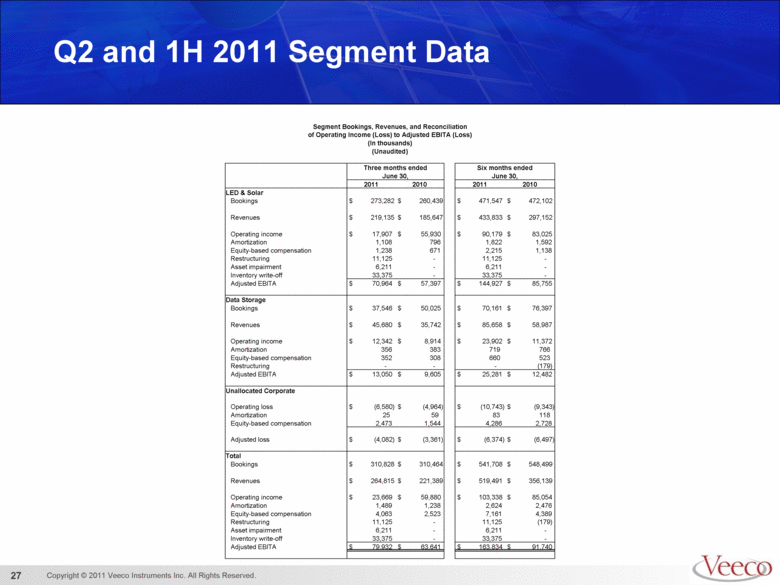
| Q2 and 1H 2011 Segment Data Segment Bookings, Revenues, and Reconciliation of Operating Income (Loss) to Adjusted EBITA (Loss) (In thousands) (Unaudited) Three months ended Six months ended June 30, June 30, 2011 2010 2011 2010 LED & Solar Bookings $ 273,282 $ 260,439 $ 471,547 $ 472,102 Revenues $ 219,135 $ 185,647 $ 433,833 $ 297,152 Operating income $ 17,907 $ 55,930 $ 90,179 $ 83,025 Amortization 1,108 796 1,822 1,592 Equity-based compensation 1,238 671 2,215 1,138 Restructuring 11,125 - 11,125 - Asset impairment 6,211 - 6,211 - Inventory write-off 33,375 - 33,375 - Adjusted EBITA $ 70,964 $ 57,397 $ 144,927 $ 85,755 Data Storage Bookings $ 37,546 $ 50,025 $ 70,161 $ 76,397 Revenues $ 45,680 $ 35,742 $ 85,658 $ 58,987 Operating income $ 12,342 $ 8,914 $ 23,902 $ 11,372 Amortization 356 383 719 766 Equity-based compensation 352 308 660 523 Restructuring - - - (179) Adjusted EBITA $ 13,050 $ 9,605 $ 25,281 $ 12,482 Unallocated Corporate Operating loss $ (6,580) $ (4,964) $ (10,743) $ (9,343) Amortization 25 59 83 118 Equity-based compensation 2,473 1,544 4,286 2,728 Adjusted loss $ (4,082) $ (3,361) $ (6,374) $ (6,497) Total Bookings $ 310,828 $ 310,464 $ 541,708 $ 548,499 Revenues $ 264,815 $ 221,389 $ 519,491 $ 356,139 Operating income $ 23,669 $ 59,880 $ 103,338 $ 85,054 Amortization 1,489 1,238 2,624 2,476 Equity-based compensation 4,063 2,523 7,161 4,389 Restructuring 11,125 - 11,125 (179) Asset impairment 6,211 - 6,211 - Inventory write-off 33,375 - 33,375 - Adjusted EBITA $ 79,932 $ 63,641 $ 163,834 $ 91,740 |


