Exhibit 99.2
Q2 2014 Conference Call July 30, 2014 |
Safe Harbor To the extent that this presentation discusses expectations or otherwise makes statements about the future, such statements are forward-looking and are subject to a number of risks and uncertainties that could cause actual results to differ materially from the statements made. These items include the risk factors discussed in the Business Description and Management's Discussion and Analysis sections of Veeco's Annual Report on Form 10-K for the year ended December 31, 2013 and subsequent Quarterly Reports on Form 10-Q and current reports on Form 8-K. Veeco does not undertake any obligation to update any forward-looking statements to reflect future events or circumstances after the date of such statements. |
John Peeler Chairman & CEO Introduction |
Second Quarter 2014 Highlights Q2 Orders $104M Cash and Short Term Investments $485M Q2 Revenue up 5% sequentially to $95M Third sequential quarter with a positive book-to-bill ratio Generated cash in a challenging quarter Improvement in MOCVD & MBE drive revenue growth |
Strong MOCVD Order Trend ($M) 1H 2014 = $157M 1H 14 Up Nearly 80% from 1H 13 1H 2013 = $88M |
Sam Maheshwari, CFO Financial Highlights |
P&L Highlights *Excludes amortization and restructuring. **Q1 2014 GAAP results include $29M gain resulting from reversal of Synos acquisition related contingency accruals See financial tables for further details. Synos Purchase 10/1/13 |
Revenue Highlights – Q2 2014 Total Revenue: $95M LED & Solar ~$77M MOCVD $67M; up 5% sequentially MBE $10M ($M) Q2 14 Q1 14 Adj EBITA ($1.6M) $2.1M ($M) Q2 14 Q1 14 Adj EBITA ($0.3M) ($0.6M) Data Storage ~$18M Data Storage down 10% sequentially |
Order Highlights – Q2 2014 Total Bookings: $104M LED & Solar ~$81M MOCVD at $75M; down 10% sequentially MBE $6M; up slightly on a sequential basis Data Storage ~$23M Improves 52% sequentially after extremely weak Q1 2014 |
Balance Sheet Highlights Cash improves $2M Accounts receivable increased by $7M Inventory reduced by $4M Synos Purchase 10/1/13 |
Cost Reduction Initiatives To Drive Lower Breakeven Other Facility Consolidations & Streamlining Consolidate Data Storage Business into One Site General Expense Reduction Initiatives 2 1 3 Total annual OPEX savings $16M OPEX declines in 2H 2014 2015 OPEX to decline ~10% from 2014 levels Fund growth in LED & OLED Display and return to profitability |
Q3 2014 Guidance Q3 2014 Orders Higher than Q2 Revenue $92M-100M Gross Margins 31.5-33.5% OPEX* $41M-42M Adjusted EBITA ($7M)-($3M) Adjusted EBITDA ($4M)-$0M GAAP EPS ($0.43)-($0.34) Non-GAAP EPS** ($0.15)-($0.07) *Excludes amortization ** Non-GAAP EPS excludes $2.6M restructuring charge Orders Expected to Grow in 2H 2014 Compared with 1H 2014 |
Business Update and Outlook |
UHD-TV uses 2X more LEDs; larger chip size; brighter specs Increased share of >50” screen size shipments boosts LED demand High utilization and chip performance requirements (brighter chips) helped LED manufacturers to improve their bottom line in 1H 2014 Source: NPD Displaysearch, Digitimes CAGR 168% UHD-TV UNITS(M) |
LED Lighting Demand Accelerating Source: IHS Research LED Lamp Shipments (in M units) Nearly 40% CAGR LED Lighting Market Value up 25% to $5B in 2014 |
Early Innings of Big Secular LED Lighting Trend Some Underutilized Equipment Still Coming On-line LED Customer Consolidation Customers Remain Cautious Install Base Yield Improvements Maxing Out Tier 1 Operating Close to Maximum Capacity Starting to Invest LED Adoption Accelerating Incandescent Phase-Outs Occurring Globally Better LED Customer Profitability LED Demand Strong for TV and Lighting |
1 FAST-ALD Technology to Drive Growth in 2015 and Beyond Focused on winning for OLED Flex Display Encapsulation 3 OLED Mobile $200-400M TAM Engaging Potential New Customers 2 OLED TV and Lighting >$200M TAM 3 Market Validation Activity on Track for New Applications Semiconductor & Other >$200M TAM |
Update on our Top Priorities Transition to Profitable Growth in 2015 Develop and launch game changing new products Next-gen MOCVD and new ALD to drive growth Targeting GMs >40% Streamlining initiatives to improve profitability Improve customers’ CoO and our gross margins Drive process improvement initiatives and lower expenses |
Q&A Session |
Financial Tables and Reconciliation |
Income Statement Veeco Instruments Inc. and Subsidiaries Consolidated Statements of Operations (In thousands, except per share data) (Unaudited) For the three months ended For the six months ended June 30, June 30, 2014 2013 2014 2013 Net sales $ 95,122 $ 97,435 $ 185,963 $ 159,216 Cost of sales 64,449 62,795 121,513 102,024 Gross profit 30,673 34,640 64,450 57,192 Operating expenses: Selling, general and administrative 21,891 19,779 43,558 39,427 Research and development 21,011 20,870 40,779 41,607 Amortization 2,899 855 5,802 1,711 Restructuring 801 - 1,193 531 Total operating expenses 46,602 41,504 91,332 83,276 Other operating, net (158) (52) (370) 352 Changes in contingent consideration - - (29,368) - Operating income (loss) (15,771) (6,812) 2,856 (26,436) Interest income (expense), net 72 236 236 428 Income (loss) before income taxes (15,699) (6,576) 3,092 (26,008) Income tax provision (benefit) (488) (2,495) (857) (11,856) Net income (loss) $ (15,211) $ (4,081) $ 3,949 $ (14,152) Income (loss) per common share: Basic: Income (loss) $ (0.39) $ (0.11) $ 0.10 $ (0.37) Diluted: Income (loss) $ (0.39) $ (0.11) $ 0.10 $ (0.37) Weighted average shares outstanding: Basic 39,379 38,764 39,275 38,740 Diluted 39,379 38,764 40,061 38,740 |
Balance Sheet Veeco Instruments Inc. and Subsidiaries Condensed Consolidated Balance Sheets (In thousands) June 30, December 31, 2014 2013 (Unaudited) ASSETS Current assets: Cash and cash equivalents $ 232,332 $ 210,799 Short-term investments 252,165 281,538 Restricted cash 518 2,738 Accounts receivable, net 58,323 23,823 Inventories 48,364 59,726 Prepaid expenses and other current assets 32,488 23,303 Deferred income taxes 9,403 11,716 Total current assets 633,593 613,643 Property, plant and equipment at cost, net 83,141 89,139 Goodwill 91,521 91,348 Deferred income taxes 397 397 Intangible assets, net 108,914 114,716 Other assets 39,506 38,726 Total assets $ 957,072 $ 947,969 LIABILITIES AND EQUITY Current liabilities: Accounts payable $ 27,777 $ 35,755 Accrued expenses and other current liabilities 35,360 51,084 Customer deposits and deferred revenue 57,580 34,754 Income taxes payable 6,796 6,149 Deferred income taxes 159 159 Current portion of long-term debt 302 290 Total current liabilities 127,974 128,191 Deferred income taxes 23,057 28,052 Long-term debt 1,694 1,847 Other liabilities 2,912 9,649 Total liabilities 155,637 167,739 Equity 801,435 780,230 Total liabilities and equity $ 957,072 $ 947,969 |
Reconciliation Veeco Instruments Inc. and Subsidiaries Reconciliation of GAAP to non-GAAP results (In thousands, except per share data) (Unaudited) For the three months ended For the six months ended June 30, June 30, 2014 2013 2014 2013 Adjusted EBITA ** Operating income (loss) $ (15,771) $ (6,812) $ 2,856 $ (26,436) Non-GAAP adjustments: Amortization 2,899 855 5,802 1,711 Equity-based compensation 5,091 3,713 9,813 6,292 Restructuring 801 - 1,193 531 Changes in contingent consideration - - (29,368) - Earnings before interest, income taxes and amortization excluding certain items ("Adjusted EBITA") $ (6,980) $ (2,244) $ (9,704) $ (17,902) Non-GAAP Net Income (Loss) Net income (loss) (GAAP basis) $ (15,211) $ (4,081) $ 3,949 $ (14,152) Non-GAAP adjustments: Amortization 2,899 855 5,802 1,711 Equity-based compensation 5,091 3,713 9,813 6,292 Restructuring 801 - 1,193 531 Changes in contingent consideration - - (29,368) - Income tax effect of non-GAAP adjustments 312 (1,741) 119 (3,113) (1) Non-GAAP net income (loss) $ (6,108) $ (1,254) $ (8,492) $ (8,731) Non-GAAP earnings (loss) per diluted share excluding certain items ("Non-GAAP EPS") $ (0.16) $ (0.03) $ (0.22) $ (0.23) Diluted weighted average shares outstanding 39,379 38,764 39,275 38,740 ** Starting in the third quarter 2014 the Company will be using adjusted EBITDA to evaluate the performance of our business units, and therefore will be reporting non-GAAP measures as adjusted EBITDA. (1) The Company utilized the with and without method to determine the income tax effect of non-GAAP adjustments. NOTE - This reconciliation is not in accordance with, or an alternative method for, generally accepted accounting principles in the United States ("GAAP"), and may be different from similar measures presented by other companies. Management of the Company evaluates performance of its business units based on adjusted EBITA, which is the primary indicator used to plan and forecast future periods. The presentation of this financial measure facilitates meaningful comparison with prior periods, as management of the Company believes adjusted EBITA reports baseline performance and thus provides useful information. |
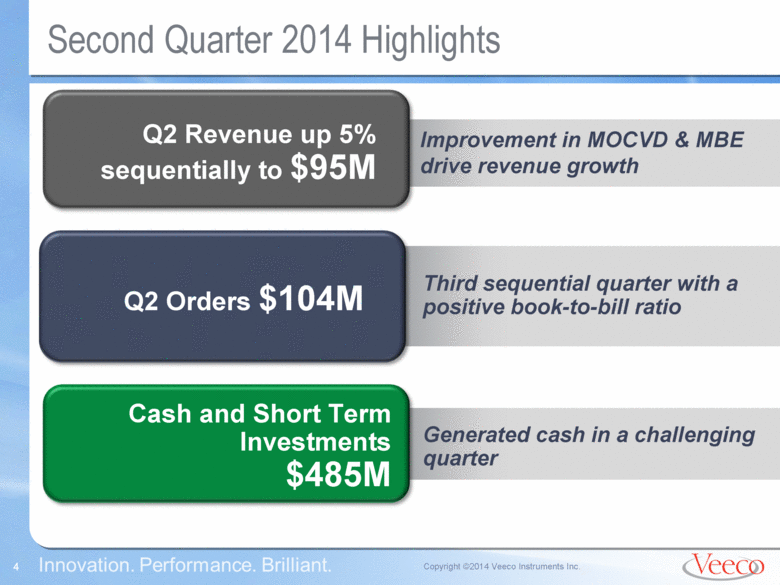
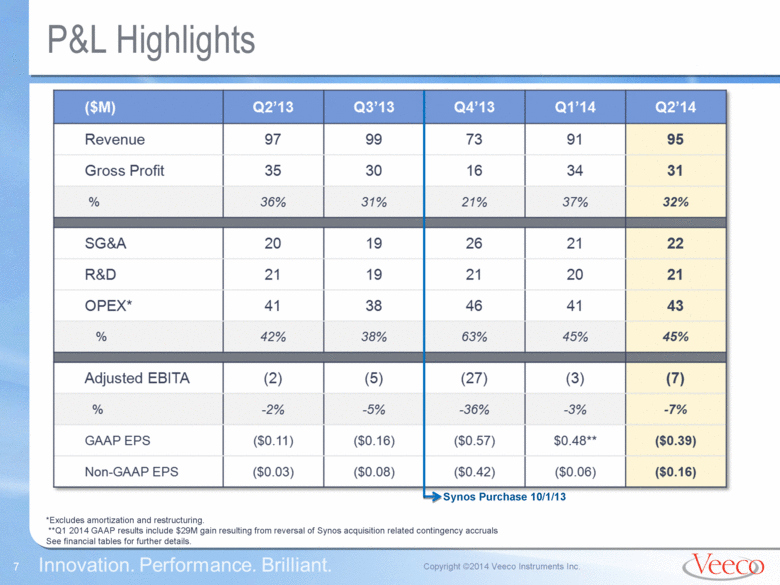
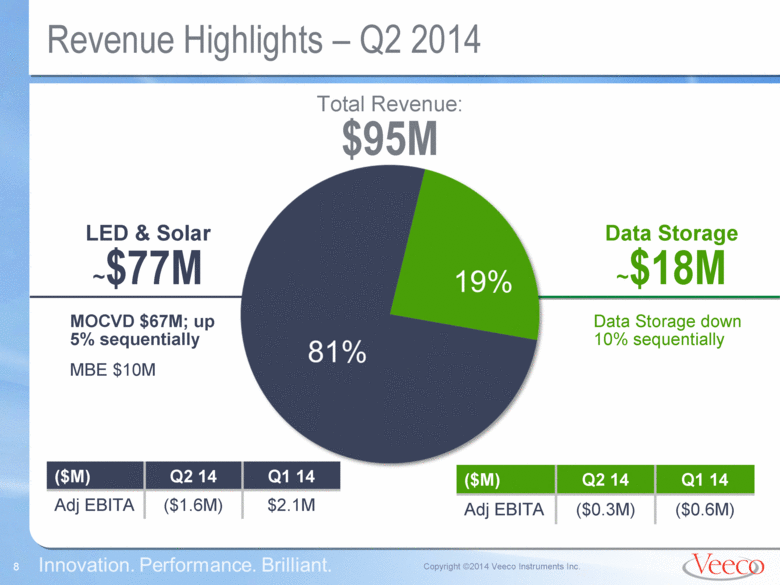
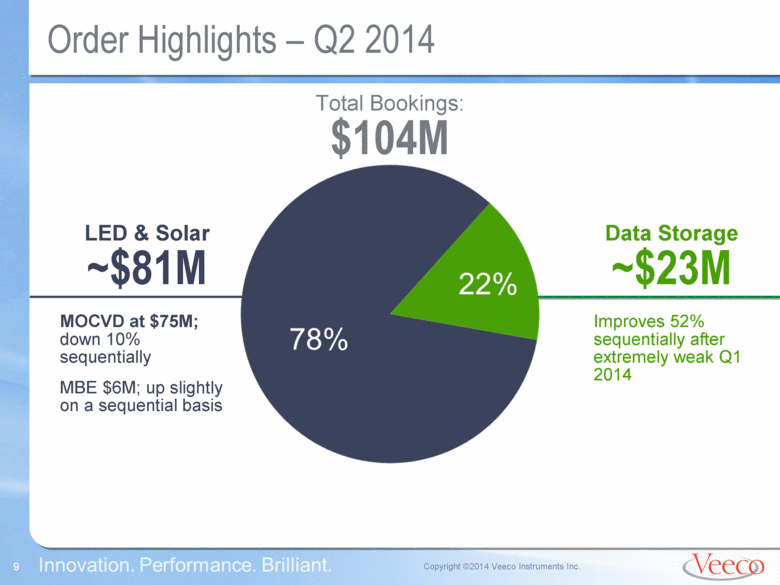
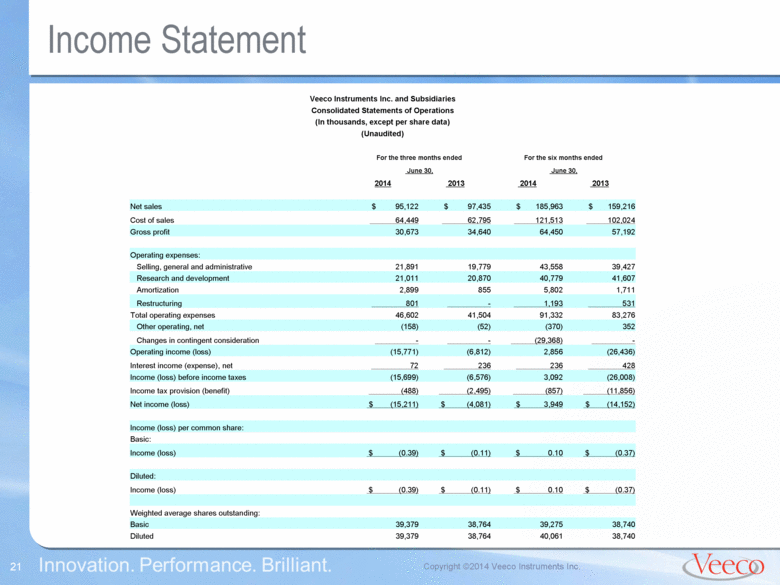
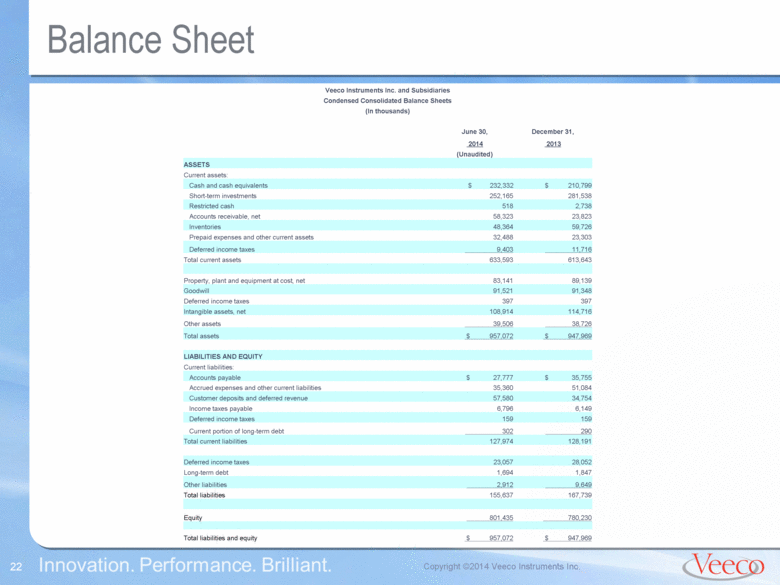
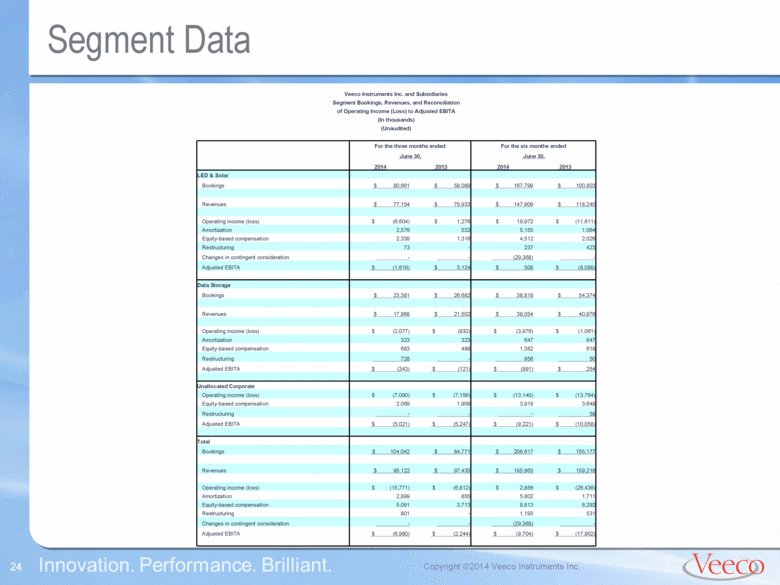
Segment Data Veeco Instruments Inc. and Subsidiaries Segment Bookings, Revenues, and Reconciliation of Operating Income (Loss) to Adjusted EBITA (In thousands) (Unaudited) For the three months ended For the six months ended June 30, June 30, 2014 2013 2014 2013 LED & Solar Bookings $ 80,661 $ 58,089 $ 167,799 $ 100,803 Revenues $ 77,154 $ 75,933 $ 147,909 $ 118,240 Operating income (loss) $ (6,604) $ 1,276 $ 19,972 $ (11,611) Amortization 2,576 532 5,155 1,064 Equity-based compensation 2,339 1,316 4,512 2,026 Restructuring 73 - 237 423 Changes in contingent consideration - - (29,368) - Adjusted EBITA $ (1,616) $ 3,124 $ 508 $ (8,098) Data Storage Bookings $ 23,381 $ 26,682 $ 38,818 $ 54,374 Revenues $ 17,968 $ 21,502 $ 38,054 $ 40,976 Operating income (loss) $ (2,077) $ (932) $ (3,976) $ (1,061) Amortization 323 323 647 647 Equity-based compensation 683 488 1,382 618 Restructuring 728 - 956 50 Adjusted EBITA $ (343) $ (121) $ (991) $ 254 Unallocated Corporate Operating income (loss) $ (7,090) $ (7,156) $ (13,140) $ (13,764) Equity-based compensation 2,069 1,909 3,919 3,648 Restructuring - - - 58 Adjusted EBITA $ (5,021) $ (5,247) $ (9,221) $ (10,058) Total Bookings $ 104,042 $ 84,771 $ 206,617 $ 155,177 Revenues $ 95,122 $ 97,435 $ 185,963 $ 159,216 Operating income (loss) $ (15,771) $ (6,812) $ 2,856 $ (26,436) Amortization 2,899 855 5,802 1,711 Equity-based compensation 5,091 3,713 9,813 6,292 Restructuring 801 - 1,193 531 Changes in contingent consideration - - (29,368) - Adjusted EBITA $ (6,980) $ (2,244) $ (9,704) $ (17,902) |
Guidance Veeco Instruments Inc. and Subsidiaries Reconciliation of GAAP to non-GAAP results (In thousands, except per share data) (Unaudited) Guidance for the three months ending September 30, 2014 LOW HIGH Adjusted EBITDA ** Operating income $ (17,596) $ (14,046) Adjustments: Amortization 2,929 2,929 Equity-based compensation 5,118 5,118 Restructuring 2,634 2,634 Earnings before interest, income taxes and amortization excluding certain items ("Adjusted EBITA") (6,915) (3,365) Depreciation 3,187 3,187 Earnings before interest, income taxes and amortization excluding certain items ("Adjusted EBITDA") $ (3,728) $ (178) Non-GAAP Net Income Net income (loss) (GAAP basis) $ (16,870) $ (13,445) Non-GAAP adjustments: Amortization 2,929 2,929 Equity-based compensation 5,118 5,118 Restructuring 2,634 2,634 Income tax effect of non-GAAP adjustments 110 (143) (1) Non-GAAP net income (loss) $ (6,079) $ (2,907) Non-GAAP earnings per diluted share excluding certain items ("Non-GAAP EPS") $ (0.15) $ (0.07) Diluted weighted average shares outstanding 39,462 39,462 ** Starting in the third quarter 2014 the Company will be using adjusted EBITDA to evaluate the performance of our business units, and therefore will be reporting non-GAAP measures as adjusted EBITDA. (1) The Company utilizes the with and without method to determine the income tax effect of non-GAAP adjustments. NOTE - This reconciliation is not in accordance with, or an alternative method for, generally accepted accounting principles in the United States ("GAAP"), and may be different from similar measures presented by other companies. Management of the Company evaluates performance of its business units based on adjusted EBITDA, which is the primary indicator used to plan and forecast future periods. The presentation of this financial measure facilitates meaningful comparison with prior periods, as management of the Company believes adjusted EBITDA reports baseline performance and thus provides useful information. |
Historical Reconciliation – EBITA to EBITDA Veeco moves to Adjusted EBITDA model for Non-GAAP measures. Three Months Ended March 31, June 30, September 30, December 31, 2012 2012 2012 2012 Adjusted EBITA (As reported) $ 25,354 $ 20,319 $ 14,219 $ 1,230 Depreciation 2,500 2,934 2,870 2,980 Adjusted EBITDA (As revised) $ 27,854 $ 23,253 $ 17,089 $ 4,210 Three Months Ended March 31, June 30, September 30, December 31, 2013 2013 2013 2013 Adjusted EBITA (As reported) $ (15,658) $ (2,244) $ (5,079) $ (26,640) Depreciation 3,071 3,203 3,240 3,384 Adjusted EBITDA (As revised) $ (12,587) $ 959 $ (1,839) $ (23,256) Three Months Ended March 31, June 30, 2014 2014 Adjusted EBITA (As reported) $ (2,724) $ (6,980) Depreciation 2,868 2,930 Adjusted EBITDA (As revised) $ 144 $ (4,050) |