UNITED STATES
SECURITIES AND EXCHANGE COMMISSION
Washington, D.C. 20549
FORM N-CSR
CERTIFIED SHAREHOLDER REPORT OF REGISTERED
MANAGEMENT INVESTMENT COMPANIES
Investment Company Act file number: 811-08039
Third Avenue Trust
(Exact name of registrant as specified in charter)
622 Third Avenue, 32nd Floor, New York, NY | 10017 | |
| (Address of principal executive offices) | (Zip code) | |
| W. James Hall III, General Counsel, 622 Third Avenue, New York, NY | 10017 | |
| (Name and address of agent for service) |
Registrant’s telephone number, including area code: 800-443-1021
Date of fiscal year end: October 31, 2017
Date of reporting period: October 31, 2017
The following N-CSR relates only to the series (the “Funds”) of Third Avenue Trust (the “Trust”) listed below and does not relate to any series of the Trust with a different fiscal year and, therefore, different N-CSR reporting requirements. A separate N-CSR will be filed for any series with a different fiscal year end, as appropriate.
Third Avenue Value Fund
Third Avenue Small-Cap Value Fund
Third Avenue Real Estate Value Fund
Third Avenue International Value Fund
Form N-CSR is to be used by management investment companies to file reports with the Commission not later than 10 days after the transmission to stockholders of any report that is required to be transmitted to stockholders under Rule 30e-1 under the Investment Company Act of 1940 (17 CFR 270.30e-1). The Commission may use the information provided on Form N-CSR in its regulatory, disclosure review, inspection, and policymaking roles.
A registrant is required to disclose the information specified by Form N-CSR, and the Commission will make this information public. A registrant is not required to respond to the collection of information contained in Form N-CSR unless the Form displays a currently valid Office of Management and Budget (“OMB”) control number. Please direct comments concerning the accuracy of the information collection burden estimate and any suggestions for reducing the burden to Secretary, Securities and Exchange Commission, 100 F Street, NE, Washington, DC 20549-0609. The OMB has reviewed this collection of information under the clearance requirements of 44 U.S.C. § 3507.
| Item 1. | Reports to Stockholders. |
The Funds’ annual report transmitted to shareholders pursuant to Rule 30e-1 under the Investment Company Act of 1940, as amended (the “1940 Act”), is as follows:

Third Avenue Value Fund
Third Avenue Small-Cap Value Fund
Third Avenue Real Estate Value Fund
Third Avenue International Value Fund
ANNUAL REPORT
OCTOBER 31, 2017
To read the latest calendar quarter Portfolio Manager Commentary, please visit
www.thirdave.com
THIRD AVENUE FUNDS
Privacy Policy
Third Avenue Funds (the “Funds”) respect your right to privacy. We also know that you expect us to conduct and process your business in an accurate and efficient manner. To do so, we must collect and maintain certain personal information about you. This is the information we collect from you on applications or other forms and from the transactions you make with us, our affiliates, or third parties. We do not disclose any information about you or any of our former customers to anyone, except to our affiliates (which may include the Funds’ affiliated money management entities) and service providers, or as otherwise permitted by law. To protect your personal information, we permit access only to authorized employees. Be assured that we maintain physical, electronic and procedural safeguards that comply with federal standards to guard your personal information.
Proxy Voting Policies and Procedures
The Funds have delegated the voting of proxies relating to their voting securities to the Funds’ investment adviser pursuant to the adviser’s proxy voting guidelines. A description of these proxy voting guidelines and procedures, as well as information relating to how a Fund voted proxies relating to portfolio securities during the most recent 12-month period ended June 30, is available by August 31 each year (i) without charge, upon request, by calling (800) 443- 1021, (ii) at the website of the Securities and Exchange Commission (the “SEC”) at http://www.sec.gov, and (iii) on the Funds’ website www.thirdave.com.
Schedule of Portfolio Holdings—Form N-Q
The Funds file their complete schedule of portfolio holdings with the SEC for the first and third quarters of each fiscal year on Form N-Q. The Funds’ Form N-Q is available on the SEC’s website at http://www.sec.gov, and may be reviewed and copied at the SEC’s Public Reference Room in Washington, DC. Information on the operation of the Public Reference Room may be obtained by calling 1-800-SEC-0330.
Third Avenue Trust
Third Avenue Value Fund
Portfolio Management Discussion
October 31, 2017 (Unaudited)
| Average Annual Returns for the periods ended October 31, 2017 | ||||||||||||||||||||
One Year ended 10/31/17 | Three Year | Five Year | Ten Year | Since Inception | ||||||||||||||||
| Third Avenue Value Fund Investor Class† | 18.05 | % | 4.90 | % | 8.45 | % | N/A | 6.43 | % | |||||||||||
Third Avenue Value Fund Institutional Class^ | 18.38 | % | 5.18 | % | 8.73 | % | 1.89 | % | N/A | |||||||||||
| MSCI World Index‡ | 23.46 | % | 8.75 | % | 12.19 | % | 4.69 | % | 10.19 | % | ||||||||||
| S&P 500 Index‡ | 23.63 | % | 10.77 | % | 15.18 | % | 7.51 | % | 13.64 | % | ||||||||||
| † | Investor Class commenced investment operations on December 31, 2009. |
| ^ | Institutional Class commenced investment operations on November 1, 1990. |
| ‡ | The date used to calculate the Since Inception performance for the index is the inception date of the Investor Class. |
On September 19, 2017, Third Avenue Management LLC (“the Adviser”) announced that Matthew Fine and Michael Fineman have assumed portfolio management responsibilities for the Third Avenue Value Fund (the “Fund”). Matt and Mike, being Marty acolytes and experienced practitioners of the Third Avenue approach, intend to carry-on the key pillars of the investment philosophy as Co-Portfolio Managers. It is expected that the companies represented in the Fund will be those that, in our view, maintain a strong financial position, trade at a discount to readily ascertainable net asset value, provide comprehensive financial disclosures, and will provide the potential to compound our estimate of the underlying net asset value by double-digit rates over a three-to-five year period. It is our view that shareholders want a genuinely differentiated investment approach, as an alternative to passive allocations, that is supported by nearly a half century of experience across many global markets. We will continue to focus on contrarian deep-value investing, special situations investments and other opportunities arising from complexity, fear and misunderstanding. Our approach is long-term by nature and strives to limit the probability of permanent loss of capital. The intended outcome is to produce superior performance over longer periods of time, though not consistently in all periods of time, and we expect that the Fund will exhibit lower levels of correlation to indices than the average fund in its peer group, potentially offering diversification benefits for many shareholders’ broader portfolios.
1
Third Avenue Trust
Third Avenue Value Fund
Portfolio Management Discussion (continued)
October 31, 2017 (Unaudited)
For the fiscal year ended October 31, 2017, the Fund generated positive 18.05% and 18.38% returns for the Investor and Institutional share classes, respectively, underperforming the MSCI World Index which returned 23.46% over the same period. Key positive drivers of return came from several holdings within the US home building industry. Housing availability remains materially below normalized levels and is one of the biggest factors associated with our investments in timber and home developer Weyerhaeuser Co., as well as window manufacturer Cavco Industries, Inc. Both of these names were among our top performers for the fiscal year. Other positive contributors for the quarter came from several names within the financial sector, including Comerica, Inc., PNC Financial Services Group, Inc., and the Bank of New York Mellon Corp. Looking forward, potential further industry deregulation, stronger US economic activity and modestly higher interest rates may continue to benefit the sector.
The top two detractors in the Fund during the fiscal year were Brookdale Senior Living, Inc. and integrated real estate company Tejon Ranch Co. The team sold Brookdale at the end of the fiscal year, along with the elimination of Ralph Lauren Corp. and Kingfisher PLC, which were retail-related names. We continue to maintain conviction in Tejon Ranch which supports an extensive 270,000-acre ranch and agribusiness in California. We believe in the concept of purchasing securities that possess hard assets underpinning our investments for a variety of reasons. Hard asset values can be durable, with estimable and lasting value, thereby providing considerable downside protection in times of turmoil as compared to earnings-driven valuations. Further, many hard asset businesses can be extremely difficult to replicate or may be comprised of inherently finite assets, limiting competitive threats while simultaneously providing other benefits such as inflation-protection or tax attributes.
Looking forward, we believe the current low levels of offshore oil and gas investment to be patently unsustainable and indeed the industry has recently begun to show signs of stabilization, albeit at low levels. As such, we have incrementally increased our energy weighting by adding two new names, EOG Resources, Inc. and Tidewater, Inc., and we funded the purchases with the sale of Apache Corp.
We are confident that our firm’s investment approach is capable of producing excellent and differentiated returns over time, and we continue to believe that prospects for a high active share strategy like ours are as bright today as they have been in the past. Our process has an enhanced relevance in the current market environment characterized by an increased concentration of dollars invested in passively managed strategies – most which are heavily weighted towards richly-valued securities.
THE INFORMATION IN THE PORTFOLIO MANAGEMENT DISCUSSION REPRESENTS A FACTUAL OVERVIEW OF THE FUND’S PERFORMANCE AND IS NOT INTENDED TO BE A FORECAST OF FUTURE EVENTS, A GUARANTEE OF FUTURE RESULTS NOR INVESTMENT ADVICE. VIEWS EXPRESSED ARE THOSE OF THE INVESTMENT TEAM AND MAY DIFFER FROM THOSE OF OTHER INVESTMENT TEAMS OR THE FIRM AS A WHOLE. ALSO, PLEASE NOTE THAT ANY DISCUSSION OF THE PORTFOLIO’S HOLDINGS, THE FUND’S PERFORMANCE, AND THE INVESTMENT TEAM’S VIEWS ARE AS OF OCTOBER 31, 2017, AND ARE SUBJECT TO CHANGE.
2
Third Avenue Trust
Third Avenue Value Fund
Portfolio Management Discussion (continued)
October 31, 2017 (Unaudited)
The Fund’s performance may be influenced by a foreign country’s political, social and economic situation. Other risks include currency fluctuations, less liquidity, lack of efficient trading markets, and different auditing and legal standards. These risks may result in more volatility for the Fund. These and other risks are described more fully in the Fund’s prospectus.
Third Avenue Value Fund is offered by prospectus only. The prospectus contains more complete information on advisory fees, distribution charges, and other expenses and should be read carefully before investing or sending money. Past performance is no guarantee of future results. Investment return and principal value will fluctuate so that an investor’s shares, when redeemed, may be worth more or less than original cost. The Fund’s returns should be viewed in light of its investment objectives, policies and strategies and the periods selected. Foreside Fund Services, LLC, Distributor.
If you should have any questions, or for updated information (including performance data current to the most recent month-end) or a copy of our prospectus, please call 1-800-443-1021 or go to our web site at www.thirdave.com. Current performance may be lower or higher than performance quoted.
The MSCI World Index is a free float-adjusted market capitalization weighted index that is designed to measure the equity market performance of 23 of the world’s most developed markets. The S&P 500 Index is a widely recognized benchmark of U.S. stock market performance that is dominated by the stocks of large U.S. companies. The MSCI World Index and the S&P 500 Index are not securities that can be purchased or sold, and their total returns are reflective of unmanaged portfolios. The returns include reinvestment of all distributions.
3
Third Avenue Trust
Third Avenue Value Fund - Investor Class
Comparison of a $10,000 Investment
Comparison of a $10,000 Investment
(Unaudited)
Performance Illustration
COMPARISON OF CHANGE IN VALUE OF A $10,000 INVESTMENT IN THIRD AVENUE
VALUE FUND – INVESTOR CLASS (TVFVX),
THE MSCI WORLD INDEX AND THE STANDARD & POOR’S 500 INDEX (S&P 500 INDEX)
FROM INCEPTION OF THE FUND (12/31/09) THROUGH OCTOBER 31, 2017
Average Annual Total Return
1 Year | 3 Years | 5 Years | Since Inception (12/31/09) | |||||||||
18.05 | % | 4.90 | % | 8.45 | % | 6.43 | % | |||||

| * | Assumes reinvestment of all distributions. |
| † | Includes the use of derivatives. |
Past performance does not indicate future results. Performance may reflect fee waivers, expense offset arrangement and/or recovery. Total return would have been lower if the Adviser had not waived certain expenses. Conversely, total return would have been higher if the Adviser had not recovered previously waived expenses. Also, the returns shown in the graph and table do not reflect the deduction of taxes that a shareholder would pay on fund distributions or the redemption of fund shares.
4
Third Avenue Trust
Third Avenue Value Fund - Institutional Class
Comparison of a $100,000 Investment
(Unaudited)
Performance Illustration
COMPARISON OF CHANGE IN VALUE OF A $100,000 INVESTMENT IN THIRD AVENUE VALUE FUND – INSTITUTIONAL CLASS (TAVFX),
THE MSCI WORLD INDEX AND THE STANDARD & POOR’S 500 INDEX (S&P 500 INDEX)
FOR THE TEN YEARS ENDED OCTOBER 31, 2017
Average Annual Total Return
| 1 Year | 3 Years | 5 Years | 10 Years | |||||||||||
| 18.38 | % | 5.18 | % | 8.73 | % | 1.89 | % | |||||||

| * | Assumes reinvestment of all distributions. |
| † | Includes the use of derivatives. |
Past performance does not indicate future results. Performance may reflect fee waivers, expense offset arrangement and/or recovery. Total return would have been lower if the Adviser had not waived certain expenses. Conversely, total return would have been higher if the Adviser had not recovered previously waived expenses. Also, the returns shown in the graph and table do not reflect the deduction of taxes that a shareholder would pay on fund distributions or the redemption of fund shares.
5
Third Avenue Trust
Third Avenue Value Fund
Industry Diversification
(Unaudited)
The summary of the Fund’s investments as of October 31, 2017 is as follows:

6
Third Avenue Trust
Third Avenue Value Fund
Portfolio of Investments
at October 31, 2017
Principal Amount($) | Security† | Value (Note 1) | |||||
| Corporate Notes - 0.61% | |||||||
| Consumer Products - 0.61% | |||||||
| 11,361,970 | Home Products International, Inc., 2nd Lien, 6.000%, due 12/20/22 (a)(b)(c)(d). | $ | 7,013,744 | ||||
| Total Corporate Notes | |||||||
| (Cost $25,025,995) | 7,013,744 | ||||||
| Shares | |||||||
| Common Stocks - 84.46% | |||||||
| Asset Management - 10.84% | |||||||
| 1,327,913 | Bank of New York Mellon Corp. (The) | 68,321,124 | |||||
| 1,329,056 | Brookfield Asset Management, Inc., Class A (Canada) | 55,740,609 | |||||
| 124,061,733 | |||||||
| Automotive - 2.38% | |||||||
| 441,593 | Toyota Industries Corp. (Japan) | 27,180,720 | |||||
| Banks - 11.01% | |||||||
| 726,649 | Comerica, Inc. | 57,092,812 | |||||
| 744,098 | KeyCorp | 13,579,788 | |||||
| 404,300 | PNC Financial Services Group, Inc. (The) | 55,304,197 | |||||
| 125,976,797 | |||||||
| Computers-Integrated Systems - 2.20% | |||||||
| 372,839 | Cerner Corp. (e) | 25,174,089 | |||||
| Consumer Products - 1.75% | |||||||
| 526,368 | Home Products International, Inc. (a)(b)(c)(d)(e) | 1 | |||||
| 501,930 | Masco Corp. | 19,986,853 | |||||
| 19,986,854 | |||||||
| Diversified Holding Companies - 11.81% | |||||||
| 3,711,500 | CK Hutchison Holdings, Ltd. (Cayman Islands) | 47,142,423 | |||||
| 878,725 | Investor AB, Class B (Sweden) | 43,537,877 | |||||
| 276,068 | Pargesa Holding S.A. (Switzerland) | 23,118,396 | |||||
| 3,052,000 | Wheelock & Co., Ltd. (Hong Kong) | 21,261,600 | |||||
| 135,060,296 | |||||||
| Electronic Components - 1.59% | |||||||
| 265,007 | Anixter International, Inc. (e) | 18,205,981 | |||||
| Forest Products & Paper - 7.30% | |||||||
| 709,100 | Interfor Corp. (Canada) (e) | 11,542,594 | |||||
The accompanying notes are an integral part of the financial statements.
7
Third Avenue Trust
Third Avenue Value Fund
Portfolio of Investments (continued)
at October 31, 2017
| Shares | Security† | Value (Note 1) | |||||
| Common Stocks (continued) | |||||||
| Forest Products & Paper (continued) | |||||||
| 2,004,410 | Weyerhaeuser Co., REIT | $ | 71,978,362 | ||||
| 83,520,956 | |||||||
| Industrial Machinery & Equipment - 3.59% | |||||||
| 992,129 | Johnson Controls International PLC (Ireland) | 41,064,219 | |||||
| Insurance & Reinsurance - 5.23% | |||||||
| 63,673 | Alleghany Corp. (e) | 36,052,926 | |||||
| 26,727 | White Mountains Insurance Group, Ltd. (Bermuda) | 23,764,312 | |||||
| 59,817,238 | |||||||
| Manufactured Housing - 3.45% | |||||||
| 251,573 | Cavco Industries, Inc. (e) | 39,471,804 | |||||
| Media & Entertainment - 1.54% | |||||||
| 314,100 | CBS Corp., Class B, Non-Voting Shares | 17,627,292 | |||||
| Medical Devices - 1.13% | |||||||
| 175,400 | LivaNova PLC (United Kingdom) (e) | 12,962,060 | |||||
| Metal Service Center - 2.19% | |||||||
| 326,286 | Reliance Steel & Aluminum Co. | 25,071,816 | |||||
| Metals & Mining - 0.93% | |||||||
| 408,422 | Warrior Met Coal, Inc. | 10,627,140 | |||||
| Oil & Gas Production & Services - 9.07% | |||||||
| 555,006 | Devon Energy Corp. | 20,479,721 | |||||
| 193,173 | EOG Resources, Inc. | 19,292,188 | |||||
| 584,173 | Tidewater, Inc. (e). | 15,918,714 | |||||
| 863,132 | Total S.A. (France) . | 48,109,351 | |||||
| 103,799,974 | |||||||
| Pharmaceuticals - 2.70% | |||||||
| 176,500 | Amgen, Inc. | 30,926,330 | |||||
| U.S. Homebuilder - 2.87% | |||||||
| 589,518 | Lennar Corp., Class A | 32,818,467 | |||||
| U.S. Real Estate Operating Companies - 2.24% | |||||||
| 1,359,121 | Tejon Ranch Co. (a)(e) | 25,619,431 | |||||
| Utilities - 0.64% | |||||||
| 456,807 | Covanta Holding Corp. | 7,354,593 | |||||
| Total Common Stocks | |||||||
| (Cost $704,569,012) | 966,327,790 | ||||||
The accompanying notes are an integral part of the financial statements.
8
Third Avenue Trust
Third Avenue Value Fund
Portfolio of Investments (continued)
at October 31, 2017
| Shares | Security† | Value (Note 1) | |||||
| Preferred Stocks - 0.00%* | |||||||
| Consumer Products - 0.00%* | |||||||
| 14,316,215 | Home Products International, Inc., Convertible, 8.000% | ||||||
| Cash or Payment-in-kind (a)(b)(c)(d)(f) | $ | 1 | |||||
| Total Preferred Stocks | |||||||
| (Cost $0) | 1 | ||||||
Principal Amount($) | |||||||
| Short-Term Investments - 10.05% | |||||||
| U.S. Government Obligations - 10.05% | |||||||
| 115,000,000 | U.S. Treasury Bills, 0.965% - 0.966%, due 11/2/17-11/16/17(g) | 114,972,636 | |||||
| Total Short-Term Investments | |||||||
| (Cost $114,972,636) | 114,972,636 | ||||||
| Total Investment Portfolio - 95.12% | |||||||
| (Cost $844,567,643) | 1,088,314,171 | ||||||
| Other Assets less Liabilities - 4.88% | 55,854,021 | ||||||
| NET ASSETS - 100.00%. | $ | 1,144,168,192 | |||||
The accompanying notes are an integral part of the financial statements.
9
Third Avenue Trust
Third Avenue Value Fund
Portfolio of Investments (continued)
at October 31, 2017
Notes:
| (a) | Affiliated issuer - as defined in the Investment Company Act of 1940 (ownership by the Fund of 5% or more of the outstanding voting securities of these issuers). |
| (b) | Fair-valued security. |
| (c) | Security subject to restrictions on resale. |
Shares/ Principal Amount($) | Issuer | Acquisiton Date | Cost | Market Value Per Unit | |||||||||
| 526,368 | Home Products International, Inc. | 5/30/07 | $ | 54,667,470 | $ | 0.00 | 1 | ||||||
| $ | 11,361,970 | Home Products International, Inc., 2nd Lien, 6.000%, due 12/20/22 | 3/16/07 - 10/2/17 | 25,678,185 | 61.73 | ||||||||
| 14,316,215 | Home Products International, Inc., Convertible Preferred Stock, 8.000%Cash or Payment-in-kind | 3/16/07 - 10/2/17 | — | 0.00 | 1 | ||||||||
At October 31, 2017, these restricted securities had a total market value of $7,013,746 or 0.61% of net assets.
1)Amount less than $0.01.
| (d) | Security is valued using significant unobservable inputs and is classified as Level 3 in the fair value hierarchy. |
| (e) | Non-income producing security. |
| (f) | Payment-in-kind security. Income may be paid as additional securities or cash at the discretion of the issuer. |
| (g) | Annualized yield at date of purchase. |
| † | U.S. issuer unless otherwise noted. |
| * | Amount represents less than 0.01% of net assets. REIT: Real Estate Investment Trust. |
Country Concentration
% of Net Assets | ||||
| United States** | 64.05 | % | ||
| Canada | 5.88 | |||
| France | 4.20 | |||
| Cayman Islands | 4.12 | |||
| Sweden | 3.81 | |||
| Ireland | 3.59 | |||
| Japan | 2.38 | |||
| Bermuda | 2.08 | |||
| Switzerland | 2.02 | |||
| Hong Kong | 1.86 | |||
| United Kingdom | 1.13 | |||
| Total | 95.12 | % | ||
| ** | Includes cash equivalents, classified as Short-Term Investments on the Portfolio of Investments |
The accompanying notes are an integral part of the financial statements.
10
Third Avenue Trust
Third Avenue Small-Cap Value Fund
Portfolio Management Discussion
October 31, 2017 (Unaudited)
Average Annual Returns for the periods ended October 31, 2017 | ||||||||||||||||||||
One Year Ended 10/31/17 | Three Year | Five Year | Ten Year | Since Inception | ||||||||||||||||
| Third Avenue Small-Cap Value Fund | ||||||||||||||||||||
| Investor Class† | 22.22 | % | 8.71 | % | 12.41 | % | N/A | 10.67 | % | |||||||||||
| Third Avenue Small-Cap Value Fund | ||||||||||||||||||||
| Institutional Class^ | 22.59 | % | 8.98 | % | 12.68 | % | 5.74 | % | N/A | |||||||||||
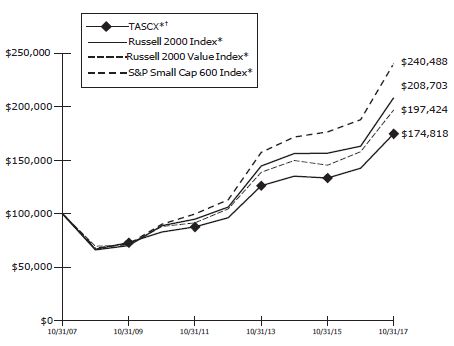
| Russell 2000 Index‡ | 27.85 | % | 10.12 | % | 14.49 | % | 7.63 | % | 13.37 | % | ||||||||||
| Russell 2000 Value Index‡ | 24.81 | % | 9.67 | % | 13.58 | % | 7.04 | % | 12.48 | % | ||||||||||
| S&P Small Cap 600 Index‡ | 27.92 | % | 11.85 | % | 16.29 | % | 9.17 | % | 15.18 | % | ||||||||||
| † | Investor Class commenced investment operations on December 31, 2009. |
| ^ | Institutional Class commenced investment operations on April 1, 1997. |
| ‡ | The date used to calculate the Since Inception performance for the index is the inception date of the Investor Class. |
The Third Avenue Small-Cap Value Fund (the “Fund”) generated positive absolute returns of 22.22% and 22.59% for the Investor and Institutional share classes over the last fiscal year, respectively. The Fund’s benchmark, the Russell 2000 Value Index, returned 24.81% over the same period.
The top performers in the Fund during the fiscal year were Insight Enterprises, Inc., Visteon Corp., and Korn/Ferry International. Visteon’s principal activity is to design, engineer and manufacture vehicle cockpit electronics and connected car solutions. The company’s strong product portfolio in cockpit electronics is an area of robust growth and interest for auto suppliers. The combination of existential threats from electric cars and an extended recovery in auto sales has created excessive pessimism in this segment. In our view, it’s overdone. The average age of vehicles continues to rise and the projections for electric car share gains appear excessive to us. The disruption, uncertainty and pessimism surrounding the industry is creating opportunities. We are particularly interested in auto suppliers. The suppliers benefit from the rising age of cars on the road and have a broader range of investing outcomes. This contrasts from original equipment manufacturers (OEMs) or retailers where the opportunity set is more binary. Our investments within the auto sector are well-capitalized companies that have the capacity to compound our capital through cycles.
Positions that detracted from performance over the fiscal year were Carrizo Oil & Gas, Inc., World Fuel Services Corp., and Synaptics Inc., Carrizo Oil and Gas, Inc. is a multi-basin exploration and production company with operations in Eagle Ford Shale and the Delaware Basin. World Fuel Services is a leading provider of aviation and marine services, including fuel supply, weather reports and flight plans to a variety of customers such as the US military. Synaptics develops sensors that enable people to interact with various electronic devices.
11
Third Avenue Trust
Third Avenue Small-Cap Value Fund
Portfolio Management Discussion (continued)
October 31, 2017 (Unaudited)
The Fund sold out of seven names during the year. Dispositions included CIRCOR International, Inc., G-III Apparel Group, Ltd., DSW, Inc., Vail Resorts, Inc., ANI Pharmaceuticals, Inc., VCA, Inc., and Brookdale Senior Living, Inc.
We remain excited about the potential for our portfolio, especially about the outlook for our top holdings.
THE INFORMATION IN THE PORTFOLIO MANAGEMENT DISCUSSION REPRESENTS A FACTUAL OVERVIEW OF THE FUND’S PERFORMANCE AND IS NOT INTENDED TO BE A FORECAST OF FUTURE EVENTS, A GUARANTEE OF FUTURE RESULTS NOR INVESTMENT ADVICE. VIEWS EXPRESSED ARE THOSE OF THE INVESTMENT TEAM AND MAY DIFFER FROM THOSE OF OTHER INVESTMENT TEAMS OR THE FIRM AS A WHOLE. ALSO, PLEASE NOTE THAT ANY DISCUSSION OF THE PORTFOLIO’S HOLDINGS, THE FUND’S PERFORMANCE, AND THE INVESTMENT TEAM’S VIEWS ARE AS OF OCTOBER 31, 2017, AND ARE SUBJECT TO CHANGE.
Small-cap companies carry additional risks because their share prices may be more volatile, and their securities may be less liquid than larger, more established companies. Such investments may increase the risk of greater price fluctuations. These and other risks are described more fully in the Fund’s prospectus.
Third Avenue Small-Cap Value Fund is offered by prospectus only. The prospectus contains more complete information on advisory fees, distribution charges, and other expenses and should be read carefully before investing or sending money. Past performance is no guarantee of future results. Investment return and principal value will fluctuate so that an investor’s shares, when redeemed, may be worth more or less than original cost. The Fund’s returns should be viewed in light of its investment objectives, policies and strategies and the periods selected. Foreside Fund Services, LLC, Distributor.
If you should have any questions, or for updated information (including performance data current to the most recent month-end) or a copy of our prospectus, please call 1-800-443-1021 or go to our web site at www.thirdave.com. Current performance may be lower or higher than performance quoted.
The Russell 2000 Index measures the performance of small companies. The Russell 2000 Value Index measures the performance of those Russell 2000 companies with lower price-to-book ratios and lower forecasted growth values. The S&P Small Cap 600 Index is a small cap index that covers approximately 3% of the U.S. equities market and consists of companies that meet specific inclusion criteria to ensure that they are investable and financially viable. The Russell 2000 Index, the Russell 2000 Value Index, and the S&P Small Cap 600 Index are not securities that can be purchased or sold, and their total returns are reflective of unmanaged portfolios. The returns include reinvestment of all distributions.
12
Third Avenue Trust
Third Avenue Small-Cap Value Fund - Investor Class
Comparison of a $10,000 Investment
(Unaudited)
Performance Illustration
COMPARISON OF CHANGE IN VALUE OF A $10,000 INVESTMENT IN THIRD AVENUE
SMALL-CAP VALUE FUND – INVESTOR
CLASS (TVSVX), THE RUSSELL 2000 INDEX, THE RUSSELL 2000 VALUE INDEX AND
THE S&P SMALL CAP 600 INDEX
FROM INCEPTION OF THE FUND (12/31/09) THROUGH OCTOBER 31, 2017
| Average Annual Total Return | ||||||||||||||
| 1 Year | 3 Years | 5 Years | Since Inception (12/31/09) | |||||||||||
| 22.22 | % | 8.71 | % | 12.41 | % | 10.67 | % | |||||||

| * | Assumes reinvestment of all distributions. |
| † | Includes the use of derivatives. |
Past performance does not indicate future results. Performance may reflect fee waivers, expense offset arrangement and/or recovery. Total return would have been lower if the Adviser had not waived certain expenses. Conversely, total return would have been higher if the Adviser had not recovered previously waived expenses. Also, the returns shown in the graph and table do not reflect the deduction of taxes that a shareholder would pay on fund distributions or the redemption of fund shares.
13
Third Avenue Trust
Third Avenue Small-Cap Value Fund - Institutional Class
Comparison of a $100,000 Investment
(Unaudited)
Performance Illustration
COMPARISON OF CHANGE IN VALUE OF A $100,000 INVESTMENT IN THIRD
AVENUE SMALL-CAP VALUE FUND – INSTITUTIONAL
CLASS (TASCX), THE RUSSELL 2000 INDEX, THE RUSSELL 2000 VALUE INDEX AND
THE S&P SMALL CAP 600 INDEX
FOR THE TEN YEARS ENDED OCTOBER 31, 2017
Average Annual Total Return
| 1 Year | 3 Years | 5 Years | 10 Years | |||||||||||
| 22.59 | % | 8.98 | % | 12.68 | % | 5.74 | % | |||||||
| * | Assumes reinvestment of all distributions. |
| † | Includes the use of derivatives. |
Past performance does not indicate future results. Performance may reflect fee waivers, expense offset arrangement and/or recovery. Total return would have been lower if the Adviser had not waived certain expenses. Conversely, total return would have been higher if the Adviser had not recovered previously waived expenses. Also, the returns shown in the graph and table do not reflect the deduction of taxes that a shareholder would pay on fund distributions or the redemption of fund shares.
14
Third Avenue Trust
Third Avenue Small-Cap Value Fund
Industry Diversification
(Unaudited)
The summary of the Fund’s investments as of October 31, 2017 is as follows:

15
Third Avenue Trust
Third Avenue Small-Cap Value Fund
Portfolio of Investments
at October 31, 2017
| Shares | Security† | Value (Note 1) | |||||
| Common Stocks - 88.87% | |||||||
| Asset Management - 0.77% | |||||||
| 59,332 | Legg Mason, Inc. | $ | 2,265,296 | ||||
| Auto Parts and Services - 4.63% | |||||||
| 43,600 | Dorman Products, Inc. (a) | 3,013,196 | |||||
| 268,100 | Horizon Global Corp. (a) . | 4,351,263 | |||||
| 46,947 | Standard Motor Products, Inc. | 2,050,175 | |||||
| 34,064 | Visteon Corp. (a) | 4,293,427 | |||||
| 13,708,061 | |||||||
| Bank & Thrifts - 12.76% | |||||||
| 102,906 | Commerce Bancshares, Inc. | 5,985,013 | |||||
| 60,800 | Cullen/Frost Bankers, Inc. | 5,988,800 | |||||
| 93,046 | Prosperity Bancshares, Inc. | 6,120,566 | |||||
| 198,385 | Southside Bancshares, Inc. | 7,024,813 | |||||
| 81,391 | UMB Financial Corp. | 5,984,680 | |||||
| 189,675 | Valley National Bancorp | 2,181,262 | |||||
| 111,300 | WesBanco, Inc. | 4,496,520 | |||||
| 37,781,654 | |||||||
| Building Products - 1.59% | |||||||
| 214,700 | Quanex Building Products Corp. | 4,712,665 | |||||
| Business Services - 7.49% | |||||||
| 125,500 | Korn/Ferry International | 5,249,665 | |||||
| 166,523 | SP Plus Corp. (a). | 6,452,766 | |||||
| 120,700 | TriNet Group, Inc. (a).. | 4,190,704 | |||||
| 108,235 | Viad Corp. | 6,283,042 | |||||
| 22,176,177 | |||||||
| Computers-Integrated Systems - 1.84% | |||||||
| 192,244 | NetScout Systems, Inc. (a). | 5,459,730 | |||||
| Conglomerates - 1.39% | |||||||
| 937 | Seaboard Corp. | 4,122,912 | |||||
| Consulting and Information Technology Services - 8.07% | |||||||
| 136,292 | FTI Consulting, Inc. (a) . | 5,826,483 | |||||
| 162,066 | Genpact, Ltd. (Bermuda) | 4,934,910 | |||||
| 144,822 | ICF International, Inc. (a) . | 7,776,941 | |||||
| 229,006 | Syntel, Inc. (a) | 5,349,580 | |||||
| 23,887,914 | |||||||
The accompanying notes are an integral part of the financial statements.
16
Third Avenue Trust
Third Avenue Small-Cap Value Fund
Portfolio of Investments (continued)
at October 31, 2017
| Shares | Security† | Value (Note 1) | |||||
| Common Stocks (continued) | |||||||
| Electronic Components - 3.60% | |||||||
| 58,456 | Anixter International, Inc. (a) | $ | 4,015,927 | ||||
| 147,700 | Insight Enterprises, Inc. (a). | 6,653,885 | |||||
| 10,669,812 | |||||||
| Energy Exploration & Production - 2.42% | |||||||
| 177,853 | Carrizo Oil & Gas, Inc. (a). | 3,146,220 | |||||
| 79,000 | PDC Energy, Inc. (a) | 4,023,470 | |||||
| 7,169,690 | |||||||
| Food Distributors - 1.05% | |||||||
| 91,661 | Core-Mark Holding Co, Inc. | 3,121,974 | |||||
| Forest Products & Paper - 1.47% | |||||||
| 267,005 | Interfor Corp. (Canada) (a) | 4,346,256 | |||||
| General Building Contractors-Residential - 1.96% | |||||||
| 270,800 | BMC Stock Holdings, Inc. (a) | 5,808,660 | |||||
| Healthcare - 2.13% | |||||||
| 143,642 | AMN Healthcare Services, Inc. (a) . | 6,305,884 | |||||
| Home Building - 2.46% | |||||||
| 410,900 | TRI Pointe Group, Inc. (a) . | 7,268,821 | |||||
| Industrial Capital Equipment Manufacturers - 1.49% | |||||||
| 67,600 | Barnes Group, Inc. | 4,400,084 | |||||
| Industrial Equipment - 1.66% | |||||||
| 46,706 | Alamo Group, Inc. | 4,927,483 | |||||
| Industrial Services - 17.93% | |||||||
| 89,857 | ABM Industries, Inc. | 3,771,298 | |||||
| 169,475 | Comfort Systems USA, Inc. | 7,507,743 | |||||
| 132,204 | Cubic Corp. | 7,211,728 | |||||
| 82,107 | EMCOR Group, Inc. | 6,610,435 | |||||
| 241,920 | Interface, Inc. | 5,515,776 | |||||
| 60,262 | Multi-Color Corp. | 4,983,667 | |||||
| 197,900 | MYR Group, Inc. (a) . | 6,311,031 | |||||
| 131,444 | Tetra Tech, Inc. | 6,473,617 | |||||
| 29,910 | UniFirst Corp. | 4,710,825 | |||||
| 53,096,120 | |||||||
| Metals Manufacturing - 2.10% | |||||||
| 62,678 | Kaiser Aluminum Corp. | 6,216,404 | |||||
The accompanying notes are an integral part of the financial statements.
17
Third Avenue Trust
Third Avenue Small-Cap Value Fund
Portfolio of Investments (continued)
at October 31, 2017
| Shares | Security† | Value (Note 1) | |||||
| Common Stocks (continued) | |||||||
| Oil & Gas Production & Services - 1.15% | |||||||
| 124,482 | Tidewater, Inc. (a) | $ | 3,392,135 | ||||
| Optical Components - 1.60% | |||||||
201,400 | Finisar Corp. (a) .. | 4,740,956 | |||||
| Pharmaceutical Intermediate - 0.92% | |||||||
63,085 | Cambrex Corp. (a) . | 2,728,426 | |||||
| Securities Trading/Processing Services - 1.25% | |||||||
62,900 | DST Systems, Inc.. | 3,687,198 | |||||
| Software and Services - 2.21% | |||||||
67,198 | CSG Systems International, Inc.. | 2,845,163 | |||||
| 87,555 | Progress Software Corp. . | 3,706,203 | |||||
| 6,551,366 | |||||||
| Steel Producers - 1.57% | |||||||
130,443 | Haynes International, Inc. | 4,654,206 | |||||
| Technology Hardware & Equipment - 1.21% | |||||||
96,807 | Synaptics, Inc. (a) | 3,593,476 | |||||
| U.S. Real Estate Operating Companies - 2.15% | |||||||
119,727 | Alico, Inc. | 3,939,018 | |||||
| 124,753 | Kennedy-Wilson Holdings, Inc. | 2,426,446 | |||||
| Total Common Stocks | 6,365,464 | ||||||
| (Cost $179,043,849). | 263,158,824 | ||||||
Principal Amount($) | |||||||
Short-Term Investments - 5.06% | |||||||
| U.S. Government Obligations - 5.06% | |||||||
| 15,000,000 | U.S. Treasury Bills, 0.981%, due 11/2/17 (b) . | 14,999,592 | |||||
| Total Short-Term Investments | |||||||
| (Cost $14,999,592) | 14,999,592 | ||||||
| Total Investment Portfolio - 93.93% | |||||||
| (Cost $194,043,441). | 278,158,416 | ||||||
| Other Assets less Liabilities - 6.07% | 17,964,874 | ||||||
| NET ASSETS - 100.00%. | $ | 296,123,290 | |||||
The accompanying notes are an integral part of the financial statements.
18
Third Avenue Trust
Third Avenue Small-Cap Value Fund
Portfolio of Investments (continued)
at October 31, 2017
Notes:
| (a) | Non-income producing security. |
| (b) | Annualized yield at date of purchase. |
† U.S. issuer unless otherwise noted.
Country Concentration
% of Net Assets | ||||
| United States* | 90.80 | % | ||
| Bermuda | 1.66 | |||
| Canada | 1.47 | |||
| Total | 93.93 | % | ||
| * | Includes cash equivalents, classified as Short-Term Investments on the Portfolio of Investments |
The accompanying notes are an integral part of the financial statements.
19
Third Avenue Trust
Third Avenue Real Estate Value Fund
Portfolio Management Discussion
October 31, 2017 (Unaudited)
Average Annual Returns for the periods ended October 31, 2017 | ||||||||||||||||||||
One Year ended 10/31/17 | Three Year | Five Year | Ten Year | Since Inception | ||||||||||||||||
| Third Avenue Real Estate Value Fund | ||||||||||||||||||||
| Investor Class† | 18.13 | % | 6.03 | % | 9.77 | % | N/A | 10.24 | % | |||||||||||
| Third Avenue Real Estate Value Fund | ||||||||||||||||||||
| Institutional Class^ | 18.41 | % | 6.29 | % | 10.03 | % | 4.15 | % | N/A | |||||||||||
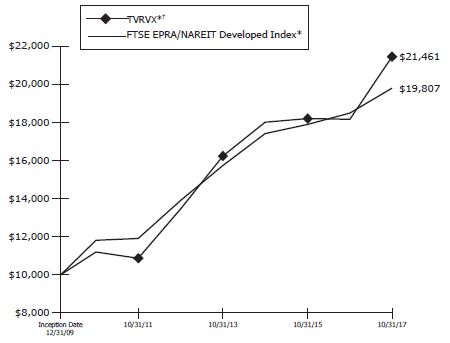
| FTSE EPRA/NAREIT Developed Index‡ | 7.13 | % | 4.38 | % | 7.32 | % | 2.28 | % | 9.12 | % | ||||||||||
| † | Investor Class commenced investment operations on December 31, 2009. |
| ^ | Institutional Class commenced investment operations on September 17, 1998. |
| ‡ | The date used to calculate the Since Inception performance for the index is the inception date of the Investor Class. |
The Third Avenue Real Estate Value Fund (the “Fund”) generated returns of +18.13% and +18.41% during the fiscal year ended October 31, 2017, for the Investor and Institutional share classes, respectively. As a result, the Fund outperformed its benchmark, the FTSE EPRA/NAREIT Developed Index, which returned +7.13% over the same time frame.
Top contributors during the 2017 fiscal year were the common stocks of Global Logistics Properties, Ltd. (“Global Logistics”) and Lennar Corp (“Lennar”). Global Logistics owns and controls leading industrial real estate platforms in China and Japan, where fundamentals have been favorable given the structural rise in demand for distribution space and the secular tailwinds of e-commerce over recent years. In mid-July, Global Logistics announced that it had agreed to sell the company to a consortium of Asian-based buyers for $3.38 per share, or a 25% premium to prevailing market prices, allowing the Fund to exit above our estimate of the company’s net asset value. Lennar is a well-capitalized and well-managed U.S. homebuilder that focuses on some of the most desirable markets on the West Coast, in Texas, and throughout the Southeast. During the year, the company benefited from a continued recovery in the U.S. residential markets, in particular an increase in the purchase of newly constructed single family homes. Lennar remains a top holding in the Fund.
The largest detractor to performance during the year was Five Point Holdings, LLC (“Five Point”). Five Point is a real estate operating company that is the largest developer of mixed-use communities in coastal California. With planning in place to build more than 40,000 residential homes and 20 million square feet or commercial space in some of the most supply constrained markets in North America, Fund management is not aware of another publicly traded property company with what we believe is such a substantial opportunity for long-term value creation. Five Point is also a top holding in the Fund.
20
Third Avenue Trust
Third Avenue Real Estate Value Fund
Portfolio Management Discussion (continued)
October 31, 2017 (Unaudited)
At the end of the year, the Fund’s invested capital remains concentrated in the pockets of the real estate universe that we believe offer tremendous value, including the U.S. residential markets, property companies involved with long-term wealth creation, and certain special situations.
THE INFORMATION IN THE PORTFOLIO MANAGEMENT DISCUSSION REPRESENTS A FACTUAL OVERVIEW OF THE FUND’S PERFORMANCE AND IS NOT INTENDED TO BE A FORECAST OF FUTURE EVENTS, A GUARANTEE OF FUTURE RESULTS NOR INVESTMENT ADVICE. VIEWS EXPRESSED ARE THOSE OF THE INVESTMENT TEAM AND MAY DIFFER FROM THOSE OF OTHER INVESTMENT TEAMS OR THE FIRM AS A WHOLE. ALSO, PLEASE NOTE THAT ANY DISCUSSION OF THE PORTFOLIO’S HOLDINGS, THE FUND’S PERFORMANCE, AND THE INVESTMENT TEAM’S VIEWS ARE AS OF OCTOBER 31, 2017, AND ARE SUBJECT TO CHANGE.
Real estate investments may be subject to special risks, including risks related to general and local economic conditions, and changes in real estate values that may have negative effects on issuers related to the real estate industry. The Fund’s investments in small and medium capitalization stocks may experience more volatility than larger capitalization stocks. These and other risks are described more fully in the Fund’s prospectus.
Third Avenue Real Estate Value Fund is offered by prospectus only. The prospectus contains more complete information on advisory fees, distribution charges, and other expenses and should be read carefully before investing or sending money. Past performance is no guarantee of future results. Investment return and principal value will fluctuate so that an investor’s shares, when redeemed, may be worth more or less than original cost. The Fund’s returns should be viewed in light of its investment objectives, policies and strategies and the periods selected. Foreside Fund Services, LLC, Distributor.
If you should have any questions, or for updated information (including performance data current to the most recent month-end) or a copy of our prospectus, please call 1-800-443-1021 or go to our web site at www.thirdave.com. Current performance may be lower or higher than performance quoted.
The FTSE EPRA/NAREIT Developed Index is designed to reflect the stock performance of companies engaged in specific aspects of the North American, European and Asian Real Estate markets. The FTSE EPRA/NAREIT Developed Index is not a security that can be purchased or sold, and its total returns are reflective of unmanaged portfolios. The returns include reinvestment of all distributions.
21
Third Avenue Trust
Third Avenue Real Estate Value Fund - Investor Class
Comparison of a $10,000 Investment
(Unaudited)
Performance Illustration
COMPARISON OF CHANGE IN VALUE OF A $10,000 INVESTMENT IN THIRD AVENUE
REAL ESTATE FUND – INVESTOR CLASS (TVRVX)
AND THE FTSE EPRA/NAREIT DEVELOPED INDEX
FROM INCEPTION OF THE FUND (12/31/09) THROUGH OCTOBER 31, 2017
Average Annual Total Return
| 1 Year | 3 Years | 5 Years | Since Inception (12/31/09) | |||||||||||
| 18.13 | % | 6.03 | % | 9.77 | % | 10.24 | % | |||||||
| * | Assumes reinvestment of all distributions. |
| † | Includes the use of derivatives. |
22
Third Avenue Trust
Third Avenue Real Estate Value Fund - Institutional Class
Comparison of a $100,000 Investment
(Unaudited)
Performance Illustration
COMPARISON OF CHANGE IN VALUE OF A $100,000 INVESTMENT IN THIRD
AVENUE REAL ESTATE VALUE FUND – INSTITUTIONAL
CLASS (TAREX) AND THE FTSE EPRA/NAREIT DEVELOPED INDEX
FOR THE TEN YEARS ENDED OCTOBER 31, 2017
Average Annual Total Return
| 1 Year | 3 Years | 5 Years | 10 Years | |||||||||||
| 18.41 | % | 6.29 | % | 10.03 | % | 4.15 | % | |||||||

| * | Assumes reinvestment of all distributions. |
| † | Includes the use of derivatives. |
Past performance does not indicate future results. Performance may reflect fee waivers, expense offset arrangement and/or recovery. Total return would have been lower if the Adviser had not waived certain expenses. Conversely, total return would have been higher if the Adviser had not recovered previously waived expenses. Also, the returns shown in the graph and table do not reflect the deduction of taxes that a shareholder would pay on fund distributions or the redemption of fund shares.
23
Third Avenue Trust
Third Avenue Real Estate Value Fund
Industry Diversification
(Unaudited)
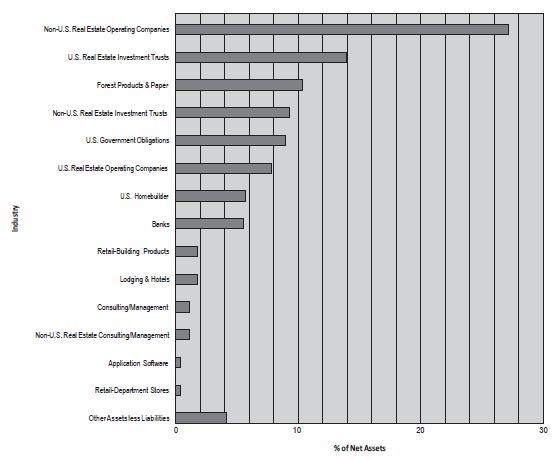
The summary of the Fund’s investments as of October 31, 2017 is as follows:
24
Third Avenue Trust
Third Avenue Real Estate Value Fund
Portfolio of Investments
at October 31, 2017
Principal Amount‡ | Security† | Value (Note 1) | |||||
| Term Loans - 0.41% | |||||||
| Non-U.S. Real Estate Operating Companies - 0.00%** | |||||||
36,277 EUR | Concrete Investment II, L.P. S.A.R.L., Term Loan, Tranche A2, 2.000% Cash or Payment-in-kind Interest, due 10/31/18 (Luxembourg)(a)(b)(c)(d) | $ | 42,258 | ||||
| Retail-Department Stores - 0.41% | |||||||
| 10,000,000 | Neiman Marcus Group Ltd. LLC, 1st Lien Term Loan, (USD 3 Month LIBOR + 3.250%) 4.488% due 10/25/20 (c) | 7,920,000 | |||||
| Total Term Loans | |||||||
| (Cost $8,395,965) | 7,962,258 | ||||||
| Shares | |||||||
| Common Stocks & Warrants - 86.42% | |||||||
| Application Software - 0.44% | |||||||
| 189,529 | Black Knight, Inc.(e) | 8,595,157 | |||||
| Banks - 5.57% | |||||||
1,186,849 | PNC Financial Services Group, Inc., Warrants, expire 12/31/18(e) . . . | 84,064,515 | |||||
| 520,400 | Zions Bancorporation | 24,177,784 | |||||
| 108,242,299 | |||||||
| Consulting/Management - 1.19% | |||||||
618,100 | FNF Group | 23,129,302 | |||||
| Forest Products & Paper - 10.37% | |||||||
3,131,100 | Rayonier, Inc., REIT | 93,870,378 | |||||
| 3,003,910 | Weyerhaeuser Co., REIT | 107,870,408 | |||||
| 201,740,786 | |||||||
| Lodging & Hotels - 1.81% | |||||||
4,384,514 | Millennium & Copthorne Hotels PLC (United Kingdom) . | 35,230,778 | |||||
| Non-U.S. Real Estate Consulting/Management - 1.17% | |||||||
1,840,432 | Savills PLC (United Kingdom) | 22,805,879 | |||||
| Non-U.S. Real Estate Investment Trusts - 9.33% | |||||||
4,889,153 | Hammerson PLC (United Kingdom) . | 34,034,363 | |||||
| 6,580,499 | Land Securities Group PLC (United Kingdom) | 84,518,051 | |||||
| 8,723,614 | Segro PLC (United Kingdom) . | 62,976,445 | |||||
| 181,528,859 | |||||||
| Non-U.S. Real Estate Operating Companies - 27.14% | |||||||
2,077,489 | Brookfield Asset Management, Inc., Class A (Canada) . | 87,129,889 | |||||
| 5,804,950 | City Developments, Ltd. (Singapore). | 55,128,883 | |||||
The accompanying notes are an integral part of the financial statements.
25
Third Avenue Trust
Third Avenue Real Estate Value Fund
Portfolio of Investments (continued)
at October 31, 2017
| Shares | Security† | Value (Note 1) | |||||
| Common Stocks & Warrants (continued) | |||||||
| Non-U.S. Real Estate Operating Companies (continued) | |||||||
| 13,433,000 | CK Asset Holdings, Ltd. (Cayman Islands) | $ | 110,551,391 | ||||
| 13,603,077 | Henderson Land Development Co., Ltd. (Hong Kong) | 88,772,321 | |||||
| 2,418,000 | Sun Hung Kai Properties, Ltd. (Hong Kong) | 39,557,025 | |||||
| 12,727,903 | Westfield Corp., REIT (Australia) | 75,861,668 | |||||
| 10,203,500 | Wheelock & Co., Ltd. (Hong Kong) | 71,082,156 | |||||
| 528,083,333 | |||||||
| Retail-Building Products - 1.82% | |||||||
| 442,930 | Lowe’s Cos., Inc. | 35,412,254 | |||||
| U.S. Homebuilder - 5.74% | |||||||
| 2,004,761 | Lennar Corp., Class A | 111,605,045 | |||||
| U.S. Real Estate Investment Trusts - 13.99% | |||||||
| 1,667,531 | First Industrial Realty Trust, Inc. | 51,493,357 | |||||
| 4,132,617 | Forest City Realty Trust, Inc., Class A | 101,786,357 | |||||
| 297,747 | JBG SMITH Properties(e) | 9,292,684 | |||||
| 1,005,700 | Kimco Realty Corp. | 18,263,512 | |||||
| 790,662 | Macerich Co. (The) | 43,170,145 | |||||
| 643,594 | Vornado Realty Trust | 48,179,447 | |||||
| 272,185,502 | |||||||
| U.S. Real Estate Operating Companies - 7.85% | |||||||
| 1,712,857 | Five Point Holdings, LLC, Class A(e) | 22,010,212 | |||||
| 4,557,222 | Five Point Holdings, LLC, Class A (a)(d)(e)(f) | 57,490,575 | |||||
| 982,100 | Kennedy-Wilson Holdings, Inc. | 19,101,845 | |||||
| 1,129,952 | Tejon Ranch Co.(e) | 21,299,595 | |||||
| 4,556,286 | Trinity Place Holdings, Inc.(e)(f)(g) | 32,805,252 | |||||
| 152,707,479 | |||||||
| Total Common Stocks & Warrants | |||||||
| (Cost $1,082,334,535) | 1,681,266,673 | ||||||
Notional Amount($) | |||||||
| Purchased Options - 0.00%** | |||||||
| Total Purchased Options | |||||||
| (Cost $427,500) | 26,250 | ||||||
The accompanying notes are an integral part of the financial statements.
26
Third Avenue Trust
Third Avenue Real Estate Value Fund
Portfolio of Investments (continued)
at October 31, 2017
Principal Amount($) | Security† | Value (Note 1) | |||||
| Short-Term Investments - 8.99% | |||||||
| U.S. Government Obligations - 8.99% | |||||||
| 175,000,000 | U.S. Treasury Bills, 0.955% - 0.965%, due 11/2/17-11/9/17(h) | $ | 174,976,775 | ||||
| Total Short-Term Investments | |||||||
| (Cost $174,976,775) | 174,976,775 | ||||||
| Total Investment Portfolio - 95.82% | |||||||
| (Cost $1,266,134,775) | 1,864,231,956 | ||||||
| Other Assets less Liabilities - 4.18% | 81,361,430 | ||||||
| NET ASSETS - 100.00% | $ | 1,945,593,386 | |||||
Notes:
| (a) | Fair-valued security. |
| (b) | Payment-in-kind security. Income may be paid as additional securities or cash at the discretion of the issuer. |
| (c) | Variable rate security. The rate disclosed is in effect as of October 31, 2017. |
| (d) | Security is valued using significant unobservable inputs and is classified as Level 3 in the fair value hierarchy. |
| (e) | Non-income producing security. |
| (f) | Security subject to restrictions on resale. |
| Shares | Issuer | Acquisiton Date | Cost | Market Value Per Unit | |||||||||
| 4,557,222 | Five Point Holdings, LLC, Class A | 5/9/08 - 4/3/13 | $ | 75,516,188 | $ | 12.62 | |||||||
| 4,556,286 | Trinity Place Holdings, Inc. | 10/2/13 - 3/31/17 | 21,123,824 | 7.20 | |||||||||
At October 31, 2017, these restricted securities had a total market value of $90,295,827 or 4.64% of net assets.
| (g) | Affiliated issuer - as defined in the Investment Company Act of 1940 (ownership by the Fund of 5% or more of the outstanding voting securities of these issuers). |
| (h) | Annualized yield at date of purchase. |
‡ Denominated in U.S. Dollars unless otherwise noted.
† U.S. issuer unless otherwise noted.
** Amount represents less than 0.01% of net assets.
EUR: Euro.
LIBOR: London Interbank Offered Rate.
REIT: Real Estate Investment Trust.
The accompanying notes are an integral part of the financial statements.
27
Third Avenue Trust
Third Avenue Real Estate Value Fund
Portfolio of Investments (continued)
at October 31, 2017
Country Concentration | % of Net Assets | |||
| United States* | 56.36 | % | ||
| United Kingdom | 12.31 | |||
| Hong Kong | 10.25 | |||
| Cayman Islands | 5.68 | |||
| Canada | 4.48 | |||
| Australia | 3.90 | |||
| Singapore | 2.84 | |||
| Luxembourg** | 0.00 | |||
| Total | 95.82 | % | ||
| * | Includes cash equivalents, classified as Short-Term Investments on the Portfolio of Investments |
| ** | Amount represents less than 0.01% of net assets. |
| Purchased options | |||||||||||||||
| Description | Counterparty | Notional Amount | Exercise Price | Expiration Date | Value | ||||||||||
| U.S. Currency, Call | JPMorgan Chase Bank, N.A. | $ | 300,000,000 | 8.18HKD | 08/15/18 | $ | 26,250 | ||||||||
| HKD: Hong Kong Dollar | |||||||||||||||
The accompanying notes are an integral part of the financial statements.
28
Third Avenue Trust
Third Avenue International Value Fund
Portfolio Management Discussion
October 31, 2017 (Unaudited)
Average Annual Returns for the periods ended October 31, 2017 | ||||||||||||||||||||
One Year ended 10/31/17 | Three Year | Five Year | Ten Year | Since Inception | ||||||||||||||||
| Third Avenue International Value Fund | ||||||||||||||||||||
| Investor Class† | 26.34 | % | 6.63 | % | 6.09 | % | N/A | 4.79 | % | |||||||||||
| Third Avenue International Value Fund | ||||||||||||||||||||
| Institutional Class^ | 26.67 | % | 6.90 | % | 6.36 | % | 1.25 | % | N/A | |||||||||||
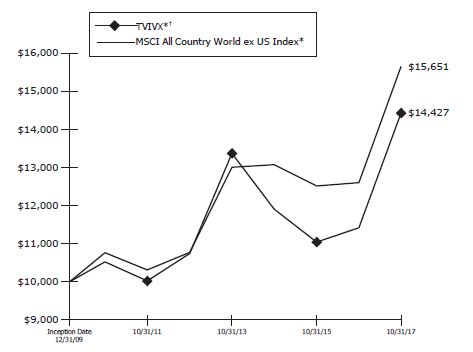
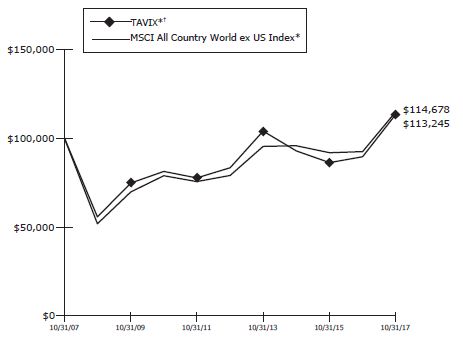
| MSCI All Country World ex US Index‡ | 24.20 | % | 6.20 | % | 7.77 | % | 1.38 | % | 5.89 | % | ||||||||||
| † | Investor Class commenced investment operations on December 31, 2009. |
| ^ | Institutional Class commenced investment operations on December 31, 2001. |
| ‡ | The date used to calculate the Since Inception performance for the index is the inception date of the Investor Class. |
For the fiscal year period ending October 31, 2017, the Third Avenue International Value Fund (the “Fund”) returned 26.34% and 26.67% for the Investor and Institutional share classes, respectively. The Fund outperformed its benchmark, the MSCI All Country World ex US Index, which returned 24.20% over the same period.
The three largest contributors in the Fund during the fiscal year were Capstone Mining Corp., Arcos Dorados Holdings, Inc. and Lundin Mining Corp. Capstone Mining, is a small-cap Vancouver-based producer with all of its operations in the Americas, taking on an unusually low level of political/jurisdictional risk for a mining company. Even absent further increases in copper prices over time, which we believe are more likely to occur than not, we are very excited about the return prospects presented by Capstone’s operating performance under current conditions.
Detractors to performance during the fiscal year include Petroleum Geo-Services ASA (PGS), Rubicon, Ltd., and Prosegur Compania de Seguridad SA. PGS is a Norwegian offshore seismic company. The offshore seismic industry is a niche within the oil service industry. PGS has a balance sheet that is far superior to that of its peers offering a relative competitive strength. While performance detracted during the fiscal year, we maintain our positive long-term view of the company.
The Fund strategy employs a high conviction investment approach, with a strong commitment to finding unique sources of value. As a result, the Fund’s portfolio is highly concentrated and heavily populated by names that are not found in broad based indices, as evidenced by its high active share relative to the MSCI All Country World ex US Index.
29
Third Avenue Trust
Third Avenue International Value Fund
Portfolio Management Discussion (continued)
October 31, 2017 (Unaudited)
THE INFORMATION IN THE PORTFOLIO MANAGEMENT DISCUSSION REPRESENTS A FACTUAL OVERVIEW OF THE FUND’S PERFORMANCE AND IS NOT INTENDED TO BE A FORECAST OF FUTURE EVENTS, A GUARANTEE OF FUTURE RESULTS NOR INVESTMENT ADVICE. VIEWS EXPRESSED ARE THOSE OF THE INVESTMENT TEAM AND MAY DIFFER FROM THOSE OF OTHER INVESTMENT TEAMS OR THE FIRM AS A WHOLE. ALSO, PLEASE NOTE THAT ANY DISCUSSION OF THE PORTFOLIO’S HOLDINGS, THE FUND’S PERFORMANCE, AND THE INVESTMENT TEAM’S VIEWS ARE AS OF OCTOBER 31, 2017, AND ARE SUBJECT TO CHANGE.
The Fund’s performance may be influenced by a foreign country’s political, social and economic situation. Other risks include currency fluctuations, less liquidity, lack of efficient trading markets, and different auditing and legal standards. These risks may result in more volatility for the Fund. These and other risks are described more fully in the Fund’s prospectus.
Third Avenue International Value Fund is offered by prospectus only. The prospectus contains more complete information on advisory fees, distribution charges, and other expenses and should be read carefully before investing or sending money. Past performance is no guarantee of future results. Investment return and principal value will fluctuate so that an investor’s shares, when redeemed, may be worth more or less than original cost. The Fund’s returns should be viewed in light of its investment objectives, policies and strategies and the periods selected. Foreside Fund Services, LLC, Distributor.
If you should have any questions, or for updated information (including performance data current to the most recent month-end) or a copy of our prospectus, please call 1-800-443-1021 or go to our web site at www.thirdave.com. Current performance may be lower or higher than performance quoted.
The MSCI All Country World ex US Index is an unmanaged index of common stocks and includes securities representative of the market structure of over 50 developed and emerging market countries (other than the United States) in North America, Europe, Latin America and the Asian Pacific Region. This index is not a security that can be purchased or sold, and its total returns are reflective of unmanaged portfolios. The returns include reinvestment of all distributions.
30
Third Avenue Trust
Third Avenue International Value Fund - Investor Class
Comparison of a $10,000 Investment
(Unaudited)
Performance Illustration
COMPARISON OF CHANGE IN VALUE OF A $10,000 INVESTMENT IN THIRD AVENUE
INTERNATIONAL VALUE FUND – INVESTOR
CLASS (TVIVX) AND THE MSCI ALL COUNTRY WORLD EX US INDEX
FROM INCEPTION OF THE FUND (12/31/09) THROUGH OCTOBER 31, 2017
Average Annual Total Return
| 1 Year | 3 Years | 5 Years | Since Inception (12/31/09) | |||||||||||
| 26.34 | % | 6.63 | % | 6.09 | % | 4.79 | % | |||||||
| * | Assumes reinvestment of all distributions. |
| † | Includes the use of derivatives. |
Past performance does not indicate future results. Performance may reflect fee waivers, expense offset arrangement and/or recovery. Total return would have been lower if the Adviser had not waived certain expenses. Conversely, total return would have been higher if the Adviser had not recovered previously waived expenses. Also, the returns shown in the graph and table do not reflect the deduction of taxes that a shareholder would pay on fund distributions or the redemption of fund shares.
31
Third Avenue Trust
Third Avenue International Value Fund - Institutional Class
Comparison of a $100,000 Investment
(Unaudited)
Performance Illustration
COMPARISON OF CHANGE IN VALUE OF A $100,000 INVESTMENT IN THIRD
AVENUE INTERNATIONAL VALUE FUND – INSTITUTIONAL
CLASS (TAVIX) AND THE MSCI ALL COUNTRY WORLD EX US INDEX
FOR THE TEN YEARS ENDED OCTOBER 31, 2017
Average Annual Total Return
| 1 Year | 3 Years | 5 Years | 10 Years | |||||||||||
| 26.67 | % | 6.90 | % | 6.36 | % | 1.25 | % | |||||||
| * | Assumes reinvestment of all distributions. |
| † | Includes the use of derivatives. |
Past performance does not indicate future results. Performance may reflect fee waivers, expense offset arrangement and/or recovery. Total return would have been lower if the Adviser had not waived certain expenses. Conversely, total return would have been higher if the Adviser had not recovered previously waived expenses. Also, the returns shown in the graph and table do not reflect the deduction of taxes that a shareholder would pay on fund distributions or the redemption of fund shares.
32
Third Avenue Trust
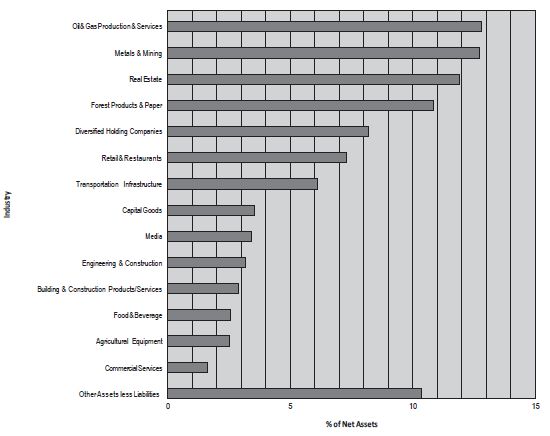
Third Avenue International Value Fund
Industry Diversification
(Unaudited)
The summary of the Fund’s investments as of October 31, 2017 is as follows:
33
Third Avenue Trust
Third Avenue International Value Fund
Portfolio of Investments
at October 31, 2017
Principal Amount($) | Security† | Value (Note 1) | |||||
| Corporate Bonds - 1.98% | |||||||
| Oil & Gas Production & Services - 1.98% | |||||||
| 2,900,000 | Petroleum Geo-Services ASA, 7.375%, due 12/15/20 (Norway) (a) | $ | 2,639,000 | ||||
| Total Corporate Bonds | |||||||
| (Cost $2,777,814) | 2,639,000 | ||||||
| Shares | |||||||
| Common Stocks - 87.65% | |||||||
| Agricultural Equipment - 2.53% | |||||||
| 265,100 | CNH Industrial N.V. (Netherlands) | 3,366,770 | |||||
| Building & Construction Products/Services-2.91% | |||||||
| 815,499 | Grupo Cementos de Chihuahua S.A.B de C.V. (Mexico) | 3,871,672 | |||||
| Capital Goods - 3.53% | |||||||
| 71,810 | Nexans S.A. (France) | 4,699,780 | |||||
| Commercial Services-1.62% | |||||||
| 757,176 | IWG PLC (Jersey) | 2,166,325 | |||||
| Diversified Holding Companies - 8.22% | |||||||
| 277,184 | CK Hutchison Holdings, Ltd. (Cayman Islands) | 3,520,713 | |||||
| 563,000 | Cosan Ltd., Class A (Bermuda) | 4,892,470 | |||||
| 100,233 | Leucadia National Corp. | 2,535,895 | |||||
| 10,949,078 | |||||||
| Engineering & Construction - 3.16% | |||||||
| 28,833 | Cie d’Entreprises CFE (Belgium) | 4,216,223 | |||||
| Food & Beverage - 2.55% | |||||||
| 991,239 | C&C Group PLC (Ireland) | 3,401,582 | |||||
| Forest Products & Paper - 10.85% | |||||||
| 375,709 | Interfor Corp. (Canada) (b) | 6,115,719 | |||||
| 41,699,325 | Rubicon, Ltd. (New Zealand) (b)(c) | 5,421,611 | |||||
| 81,243 | Weyerhaeuser Co., REIT | 2,917,436 | |||||
| 14,454,766 | |||||||
| Media - 3.42% | |||||||
| 183,492 | Vivendi S.A. (France) | 4,556,435 | |||||
| Metals & Mining - 12.73% | |||||||
| 147,705 | Antofagasta PLC (United Kingdom) | 1,871,949 | |||||
| 8,471,012 | Capstone Mining Corp. (Canada) (b) | 9,652,265 | |||||
| 550,800 | Lundin Mining Corp. (Canada) | 4,201,126 | |||||
The accompanying notes are an integral part of the financial statements.
34
Third Avenue Trust
Third Avenue International Value Fund
Portfolio of Investments (continued)
at October 31, 2017
| Shares | Security† | Value (Note 1) | |||||
| Common Stocks (continued) | |||||||
| Metals & Mining (continued) | |||||||
| 47,588 | Warrior Met Coal, Inc. | $ | 1,238,240 | ||||
| 16,963,580 | |||||||
| Oil & Gas Production & Services - 10.83% | |||||||
| 490,429 | John Wood Group PLC (United Kingdom) | 4,637,386 | |||||
| 2,312,378 | Petroleum Geo-Services ASA (Norway) (b) | 3,803,720 | |||||
| 126,396 | Tidewater, Inc. (b) | 3,444,291 | |||||
| 13,899,800 | Vard Holdings, Ltd. (Singapore) (b) | 2,549,299 | |||||
| 14,434,696 | |||||||
| Real Estate - 11.89% | |||||||
| 942,828 | Atrium European Real Estate, Ltd. (Jersey) | 4,414,976 | |||||
| 535,098 | CK Asset Holdings, Ltd. (Cayman Islands) | 4,403,769 | |||||
| 493,460 | Henderson Land Development Co., Ltd. (Hong Kong) | 3,220,271 | |||||
| 2,217,078 | Hibernia REIT, PLC (Ireland) | 3,809,279 | |||||
| 15,848,295 | |||||||
| Retail & Restaurants - 7.29% | |||||||
| 971,150 | Arcos Dorados Holdings, Inc., Class A (British Virgin Islands) (b) | 9,711,500 | |||||
| Transportation Infrastructure - 6.12% | |||||||
| 277,760 | easyJet PLC (United Kingdom) | 4,939,904 | |||||
| 3,002,645 | Santos Brasil Participacoes S.A. (Brazil) (b) | 3,212,563 | |||||
| 8,152,467 | |||||||
| Total Common Stocks | |||||||
| (Cost $120,281,508) | 116,793,169 | ||||||
| Total Investment Portfolio - 89.63% | |||||||
| (Cost $123,059,322) | 119,432,169 | ||||||
| Other Assets less Liabilities - 10.37% | 13,815,322 | ||||||
| NET ASSETS - 100.00% | $ | 133,247,491 | |||||
Notes:
| (a) | Security is exempt from registration pursuant to Rule 144A under the Securities Act of 1933. This security may be resold in transactions that are exempt from registration, normally to qualified institutional buyers. |
| (b) | Non-income producing security. |
| (c) | Affiliated issuer - as defined in the Investment Company Act of 1940 (ownership by the Fund of 5% or more of the outstanding voting securities of these issuers). |
| † | U.S. issuer unless otherwise noted. |
| REIT: | Real Estate Investment Trust. |
The accompanying notes are an integral part of the financial statements.
35
Third Avenue Trust
Third Avenue International Value Fund
Portfolio of Investments (continued)
at October 31, 2017
Country Concentration
% of Net Assets | ||||
| Canada | 14.98 | % | ||
| United Kingdom | 8.59 | |||
| United States | 7.61 | |||
| British Virgin Islands | 7.29 | |||
| France | 6.95 | |||
| Cayman Islands | 5.95 | |||
| Ireland | 5.41 | |||
| Jersey | 4.94 | |||
| Norway | 4.83 | |||
| New Zealand | 4.07 | |||
| Bermuda | 3.67 | |||
| Belgium | 3.16 | |||
| Mexico | 2.91 | |||
| Netherlands | 2.53 | |||
| Hong Kong | 2.42 | |||
| Brazil | 2.41 | |||
| Singapore | 1.91 | |||
| Total | 89.63 | % | ||
The accompanying notes are an integral part of the financial statements.
36
Third Avenue Trust
Statement of Assets and Liabilities
at October 31, 2017
| Value Fund | Small-Cap Value Fund | Real Estate Value Fund | International Value Fund | |||||||||||||
| Assets: | ||||||||||||||||
| Investments at value (Notes 1 and 4): | ||||||||||||||||
| Unaffiliated issuers† | $ | 1,055,680,994 | $ | 278,158,416 | $ | 1,831,400,454 | $ | 114,010,558 | ||||||||
Affiliated issuers‡ | 32,633,177 | — | 32,805,252 | 5,421,611 | ||||||||||||
| Cash | 59,411,892 | 17,216,743 | 91,822,810 | 12,960,194 | ||||||||||||
| Dividends and interest receivable | 1,523,743 | 395,000 | 700,643 | 1,748,496 | ||||||||||||
| Receivable for securities sold | — | 1,222,387 | — | 12,982 | ||||||||||||
| Receivable for fund shares sold | 33,742 | 1,494 | 933,450 | 20,722 | ||||||||||||
| Foreign currency at value^ | — | — | 293 | — | ||||||||||||
| Purchased foreign currency options* | — | — | 26,250 | — | ||||||||||||
| Other assets | 97,854 | 37,382 | 159,322 | 38,222 | ||||||||||||
| Total assets | 1,149,381,402 | 297,031,422 | 1,957,848,474 | 134,212,785 | ||||||||||||
| Liabilities: | ||||||||||||||||
| Payable for securities purchased | 3,129,786 | 346,478 | 8,077,273 | 635,082 | ||||||||||||
| Payable for fund shares redeemed | 423,624 | 228,849 | 2,201,607 | 108,321 | ||||||||||||
| Payable to Adviser (Note 3) | 900,639 | 212,743 | 1,518,171 | 116,569 | ||||||||||||
| Payable for shareholder servicing fees (Note 3) | 79,332 | 24,519 | 176,731 | 12,794 | ||||||||||||
| Distribution fees payable (Note 5) | 2,828 | 1,049 | 54,428 | 1,710 | ||||||||||||
| Payables to Trustees and officers | 12,592 | 3,082 | 19,791 | 1,199 | ||||||||||||
| Accrued expenses | 221,469 | 91,412 | 207,087 | 82,369 | ||||||||||||
| Taxes Payable | 442,940 | — | — | 7,250 | ||||||||||||
| Total liabilities | 5,213,210 | 908,132 | 12,255,088 | 965,294 | ||||||||||||
| Net assets | $ | 1,144,168,192 | $ | 296,123,290 | $ | 1,945,593,386 | $ | 133,247,491 | ||||||||
The accompanying notes are an integral part of the financial statements.
37
Third Avenue Trust
Statement of Assets and Liabilities
at October 31, 2017
| Value Fund | Small-Cap Value Fund | Real Estate Value Fund | International Value Fund | |||||||||||||
| Summary of net assets: | ||||||||||||||||
| Capital stock, $0.001 par value, | $ | 832,188,314 | $ | 178,100,203 | $ | 1,235,306,640 | $ | 153,560,537 | ||||||||
| Accumulated undistributed net investment income/(distributions in excess of net investment income) | 16,681,735 | — | 19,096,005 | (2,855,693 | ) | |||||||||||
| Accumulated net realized gain/(loss) on investments, options, forward foreign currency contracts and foreign currency transactions .... | 51,563,906 | 33,941,310 | 93,115,910 | (13,656,970 | ) | |||||||||||
| Net unrealized appreciation/(depreciation) on investments, options, forward foreign currency contracts, and translation of foreign currency denominated assets and liabilities | 243,734,237 | 84,081,777 | 598,074,831 | (3,800,383 | ) | |||||||||||
| Net assets applicable to capital shares outstanding | $ | 1,144,168,192 | $ | 296,123,290 | $ | 1,945,593,386 | $ | 133,247,491 | ||||||||
| Investor Class | ||||||||||||||||
| Net assets | $ | 12,680,101 | $ | 4,954,517 | $ | 255,382,836 | $ | 7,688,192 | ||||||||
| Outstanding shares of beneficial interest, unlimited number of shares authorized | 226,675 | 212,679 | 7,435,467 | 407,829 | ||||||||||||
| Net asset value, offering and redemption price per share± | $ | 55.94 | $ | 23.30 | $ | 34.35 | $ | 18.85 | ||||||||
| Institutional Class | ||||||||||||||||
| Net assets | $ | 1,131,488,091 | $ | 291,168,773 | $ | 1,690,210,550 | $ | 125,559,299 | ||||||||
| Outstanding shares of beneficial interest, unlimited number of shares authorized | $ | 20,188,847 | $ | 12,366,284 | $ | 48,870,238 | $ | 6,657,002 | ||||||||
| Net asset value, offering and redemption price per share±. | $ | 56.05 | $ | 23.55 | $ | 34.59 | $ | 18.86 | ||||||||
| † | Cost of unaffiliated issuers | $ | 745,840,005 | $ | 194,043,441 | $ | 1,244,583,451 | $ | 107,234,088 | |||||||||
| ‡ | Cost of affiliated issuers | $ | 98,727,638 | $ | — | $ | 21,123,824 | $ | 15,825,234 | |||||||||
| ^ | Cost of foreign currency | $ | — | $ | — | $ | 296 | $ | — | |||||||||
| * | Cost of purchased foreign currency options | $ | — | $ | — | $ | 427,500 | $ | — | |||||||||
| ± | Redemption price is gross of redemption fees (Note 6) |
The accompanying notes are an integral part of the financial statements.
38
Third Avenue Trust
Statement of Operations
For the Year Ended October 31, 2017
| Value Fund | Small-Cap Value Fund | Real Estate Value Fund | International Value Fund | |||||||||||||
| Investment Income: | ||||||||||||||||
| Dividends - unaffiliated issuers* | $ | 14,929,987 | $ | 1,793,580 | $ | 34,467,768 | $ | 2,180,964 | ||||||||
| Interest - unaffiliated issuers | 265,580 | 10,600 | 838,439 | 310,915 | ||||||||||||
| Interest - affiliated issuers (Notes 1 and 4) | 1,883 | — | — | — | ||||||||||||
| Interest - payment-in-kind unaffiliated issuers (Note 1) | — | — | 108,347 | — | ||||||||||||
| Interest - payment-in-kind affiliated issuers (Notes 1 and 4) | 821,843 | — | — | — | ||||||||||||
| Other income | 38,061 | — | 69,594 | — | ||||||||||||
| Total investment income | 16,057,354 | 1,804,180 | 35,484,148 | 2,491,879 | ||||||||||||
| Expenses: | ||||||||||||||||
| Investment advisory fees (Note 3) | 10,584,554 | 2,737,530 | 16,641,034 | 1,757,134 | ||||||||||||
| Shareholder servicing fees (Note 3) | 1,145,001 | 317,999 | 2,005,998 | 171,000 | ||||||||||||
| Auditing and tax fees | 168,068 | 86,792 | 107,573 | 87,292 | ||||||||||||
| Transfer agent fees | 491,601 | 219,599 | 301,500 | 173,700 | ||||||||||||
| Reports to shareholders | 75,000 | 24,000 | 115,000 | 15,499 | ||||||||||||
| Accounting fees | 132,121 | 58,595 | 186,355 | 72,098 | ||||||||||||
| Administration fees (Note 3) | 64,684 | 16,729 | 101,696 | 7,731 | ||||||||||||
| Custodian fees | 63,780 | 10,203 | 191,332 | 28,422 | ||||||||||||
| Trustees’ and officers’ fees and expenses | 273,600 | 72,909 | 411,100 | 31,452 | ||||||||||||
| Insurance | 78,625 | 20,711 | 126,619 | 6,267 | ||||||||||||
| Legal fees | 154,998 | 38,998 | 245,003 | 20,000 | ||||||||||||
| Distribution fees (Note 5) | 35,025 | 12,579 | 610,753 | 40,049 | ||||||||||||
| Registration and filing fees | 37,371 | 36,541 | 57,250 | 36,350 | ||||||||||||
| Miscellaneous. | 49,200 | 13,560 | 102,101 | 11,301 | ||||||||||||
| Total expenses | 13,353,628 | 3,666,745 | 21,203,314 | 2,458,295 | ||||||||||||
| Less: Fees waived (Note 3) | — | (151,026 | ) | — | (445,535 | ) | ||||||||||
| Expenses reduced by custodian fee expense offset arrangement (Note 3) | (22,579 | ) | (5,185 | ) | (39,831 | ) | (4,721 | ) | ||||||||
| Net expenses | 13,331,049 | 3,510,534 | 21,163,483 | 2,008,039 | ||||||||||||
| Net investment income/(loss) | 2,726,305 | (1,706,354 | ) | 14,320,665 | 483,840 |
| Realized and unrealized gain/(loss) on investments, options, forward foreign currency contracts, and foreign currency transactions: | ||||||||||||||||
| Net realized gain/(loss) on investments – unaffiliated issuers | 55,793,177 | 37,907,489 | 110,233,643 | 2,070,040 | ||||||||||||
| Net realized gain/(loss) on investments – affiliated issuers (Notes 1 and 4) | 767,150 | — | — | (2,888,518 | ) | |||||||||||
| Net realized gain on written equity options | 152,020 | — | — | — | ||||||||||||
| Net realized loss on purchased options | — | — | (1,258,000 | ) | (493,750 | ) | ||||||||||
| Net realized gain on forward foreign currency contracts | — | — | 585,025 | — | ||||||||||||
| Net realized gain/(loss) on foreign currency transactions | 111,593 | 3,154 | 15,073 | (254,019 | ) | |||||||||||
| Net change in unrealized appreciation/(depreciation) on investments - unaffiliated issuers | 154,523,349 | 25,642,284 | 192,231,971 | 32,364,728 | ||||||||||||
| Net change in unrealized appreciation/(depreciation) on investments - affiliated issuers (Notes 1 and 4) | (15,308,765 | ) | — | (10,452,461 | ) | 1,409,675 | ||||||||||
| Net change in unrealized appreciation on purchased options | — | — | 671,718 | — | ||||||||||||
The accompanying notes are an integral part of the financial statements.
39
Third Avenue Trust
Statement of Operations
For the Year Ended October 31, 2017
| Value Fund | Small-Cap Value Fund | Real Estate Value Fund | International Value Fund | |||||||||||||
| Net change in unrealized appreciation on forward foreign currency contracts | $ | — | $ | — | $ | 611,020 | $ | — | ||||||||
| Net change in unrealized appreciation/(depreciation) on translation of other assets and liabilities denominated in foreign currency | 43,333 | 23,924 | 91,130 | 128,216 | ||||||||||||
| Net gain on investments, options, forward foreign currency contracts, and foreign currency transactions | 196,081,857 | 63,576,851 | 292,729,119 | 32,336,372 | ||||||||||||
| Net increase in net assets resulting from operations | $ | 198,808,162 | $ | 61,870,497 | $ | 307,049,784 | $ | 32,820,212 | ||||||||
* Net of foreign withholding taxes of | $ | 1,201,515 | $ | — | $ | 977,565 | $ | 139,894 | ||||||||
The accompanying notes are an integral part of the financial statements.
40
Third Avenue Trust
Statement of Changes in Net Assets
| Value Fund | Small-Cap Value Fund | |||||||||||||||
For the Year Ended October 31, 2017 | For the Year Ended October 31, 2016 | For the Year Ended October 31, 2017 | For the Year Ended October 31, 2016 | |||||||||||||
| Operations: | ||||||||||||||||
| Net investment income/(loss) | $ | 2,726,305 | $ | 14,841,542 | $ | (1,706,354 | ) | $ | 2,026,567 | |||||||
| Net realized gain | 56,823,940 | 48,409,222 | 37,910,643 | 27,350,988 | ||||||||||||
| Net change in unrealized appreciation/(depreciation) | 139,257,917 | (64,061,867 | ) | 25,666,208 | (13,777,526 | ) | ||||||||||
| Net increase/(decrease) in net assets resulting from operations | 198,808,162 | (811,103 | ) | 61,870,497 | 15,600,029 | |||||||||||
| Dividends and Distributions to Shareholders from: | ||||||||||||||||
| Net investment income: | ||||||||||||||||
| Investor Class | (80,506 | ) | (309,798 | ) | (14,608 | ) | — | |||||||||
| Institutional Class | (9,820,946 | ) | (22,539,852 | ) | (1,692,492 | ) | — | |||||||||
| Net realized gains: | ||||||||||||||||
| Investor Class | (992,772 | ) | (1,659,569 | ) | (418,302 | ) | (1,115,615 | |||||||||
| Institutional Class | (81,010,259 | ) | (96,040,894 | ) | (24,923,360 | ) | (46,384,578 | |||||||||
| Decrease in net assets from dividends and distributions | (91,904,483 | ) | (120,550,113 | ) | (27,048,762 | ) | (47,500,193 | |||||||||
| Capital Share Transactions: | ||||||||||||||||
| Proceeds from sale of shares | 22,590,057 | 17,208,028 | 6,636,283 | 6,657,754 | ||||||||||||
| Net asset value of shares issued in reinvestment of dividends and distributions | 88,658,512 | 116,333,170 | 26,461,605 | 46,419,821 | ||||||||||||
| Redemption fees | 5,237 | 8,925 | 1,921 | 1,725 | ||||||||||||
| Cost of shares redeemed | (230,652,894 | ) | (541,257,635 | ) | (69,109,275 | ) | (121,688,598 | ) | ||||||||
| Net decrease in net assets resulting from capital share transactions | (119,399,088 | ) | (407,707,512 | ) | (36,009,466 | ) | (68,609,298 | ) | ||||||||
| Net decrease in net assets | (12,495,409 | ) | (529,068,728 | ) | (1,187,731 | ) | (100,509,462 | ) | ||||||||
| Net assets at beginning of period | 1,156,663,601 | 1,685,732,329 | 297,311,021 | 397,820,483 | ||||||||||||
| Net assets at end of period* | $ | 1,144,168,192 | $ | 1,156,663,601 | $ | 296,123,290 | $ | 297,311,021 | ||||||||
| * Including accumulated undistributed net investment income/ (distributions in excess of net investment income) of | $ | 16,681,735 | 22,343,547 | $ | — | $ | (127,569 | ) | ||||||||
The accompanying notes are an integral part of the financial statements.
41
Third Avenue Trust
Statement of Changes in Net Assets
| Real Estate Value Fund | International Value Fund | |||||||||||||||
For the Year Ended October 31, 2017 | For the Year Ended October 31, 2016 | For the Year Ended October 31, 2017 | For the Year Ended October 31, 2016 | |||||||||||||
| Operations: | ||||||||||||||||
| Net investment income | $ | 14,320,665 | $ | 12,003,062 | $ | 483,840 | $ | 1,555,021 | ||||||||
| Net realized gain/(loss) | 109,575,741 | 39,372,450 | (1,566,247 | ) | (6,318,910 | ) | ||||||||||
| Net change in unrealized appreciation/(depreciation) | 183,153,378 | (138,256,671 | ) | 33,902,619 | 4,112,816 | |||||||||||
| Net increase/(decrease) in net assets resulting from operations | 307,049,784 | (86,881,159 | ) | 32,820,212 | (651,073 | ) | ||||||||||
| Dividends and Distributions to Shareholders from: | ||||||||||||||||
| Net investment income: | ||||||||||||||||
| Investor Class | (1,265,619 | ) | (1,877,632 | ) | (247,203 | ) | — | |||||||||
| Institutional Class | (12,800,132 | ) | (19,925,485 | ) | (5,486,413 | ) | (331,431 | ) | ||||||||
| Net realized gains: | ||||||||||||||||
| Investor Class | (2,200,063 | ) | (19,638,175 | ) | — | (76,680 | ) | |||||||||
| Institutional Class | (14,239,140 | ) | (132,429,662 | ) | — | (2,282,943 | ) | |||||||||
| Decrease in net assets from dividends and distributions | (30,504,954 | ) | (173,870,954 | ) | (5,733,616 | ) | (2,691,054 | ) | ||||||||
| Capital Share Transactions: | ||||||||||||||||
| Proceeds from sale of shares | 292,867,062 | 304,661,847 | 35,672,170 | 4,242,388 | ||||||||||||
| Net asset value of shares issued in reinvestment of dividends and distributions | 28,821,858 | 164,892,407 | 5,571,376 | 2,618,813 | ||||||||||||
| Redemption fees | 28,310 | 105,529 | 19,815 | 4,198 | ||||||||||||
| Cost of shares redeemed | (493,057,650 | ) | (1,833,310,328 | ) | (63,728,525 | ) | (76,397,119 | ) | ||||||||
| Net decrease in net assets resulting from capital share transactions | (171,340,420 | ) | (1,363,650,545 | ) | (22,465,164 | ) | (69,531,720 | ) | ||||||||
| Net increase/(decrease) in net assets | 105,204,410 | (1,624,402,658 | ) | 4,621,432 | (72,873,847 | ) | ||||||||||
| Net assets at beginning of period | 1,840,388,976 | 3,464,791,634 | 128,626,059 | 201,499,906 | ||||||||||||
| Net assets at end of period* | $ | 1,945,593,386 | $ | 1,840,388,976 | $ | 133,247,491 | $ | 128,626,059 | ||||||||
| * Including accumulated undistributed net investment income/ (distributions in excess of net investment income) of | $ | 19,096,005 | $ | 7,843,367 | $ | (2,855,693 | ) | $ | (2,119,875 | ) | ||||||
The accompanying notes are an integral part of the financial statements.
42
Third Avenue Trust
Financial Highlights
Selected data (for a share outstanding throughout each period) and ratios are as follows:
| Third Avenue Value Fund | ||||||||||||||||||||
| Years Ended October 31, | ||||||||||||||||||||
| 2017 | 2016 | 2015 | 2014 | 2013 | ||||||||||||||||
| Investor Class: | ||||||||||||||||||||
| Net asset value, beginning of period | $ | 51.12 | $ | 54.22 | $ | 59.54 | $ | 57.73 | $ | 48.47 | ||||||||||
| Income/(loss) from investment operations: | ||||||||||||||||||||
Net investment income/(loss)@ | (0.01 | ) | 0.41 | ‡ | 0.29 | 1.39 | ± | 0.61 | ** | |||||||||||
Net gain/(loss) on investment transactions (both realized and unrealized)1 | 8.83 | 0.38 | (2.46 | ) | 2.22 | 9.89 | ||||||||||||||
| Total from investment operations | 8.82 | 0.79 | (2.17 | ) | 3.61 | 10.50 | ||||||||||||||
| Less dividends and distributions to shareholders: | ||||||||||||||||||||
| Dividends from net investment income | (0.30 | ) | (0.61 | ) | (2.09 | ) | (1.80 | ) | (1.24 | ) | ||||||||||
| Distributions from net realized gain | (3.70 | ) | (3.28 | ) | (1.06 | ) | — | — | ||||||||||||
| Total dividends and distributions | (4.00 | ) | (3.89 | ) | (3.15 | ) | (1.80 | ) | (1.24 | ) | ||||||||||
| Net asset value, end of period | $ | 55.94 | $ | 51.12 | $ | 54.22 | $ | 59.54 | $ | 57.73 | ||||||||||
Total return2 | ||||||||||||||||||||
| Ratios/Supplemental Data: | 18.05 | % | 1.74 | % | (3.90 | %) | 6.45 | % | 22.07 | % | ||||||||||
| Net assets, end of period (in thousands) | $ | 12,680 | $ | 14,415 | $ | 28,963 | $ | 33,936 | $ | 36,811 | ||||||||||
| Ratio of expenses to average net assets | ||||||||||||||||||||
| Before fee waivers/expense offset arrangement/recovery | 1.38 | % | 1.40 | % | 1.34 | % | 1.33 | % | 1.35 | % | ||||||||||
After fee waivers/expense offset arrangement/recovery3 | 1.38 | % | 1.39 | % | 1.34 | % | 1.32 | % | 1.35 | %† | ||||||||||
| Ratio of net investment income/(loss) to average net assets | (0.02 | %) | 0.83 | %‡ | 0.52 | % | 2.36% | ± | 1.15 | %** | ||||||||||
| Portfolio turnover rate | 18 | % | 17 | % | 24 | % | 31 | % | 21 | % | ||||||||||
| 1 | Includes redemption fees of less than $0.01 per share. |
| 2 | Performance figures may reflect fee waivers, expense offset arrangement and/or recovery of previously waived fees. Past performance is no guarantee of future results. Total return would have been lower if the Adviser had not waived certain expenses. Conversely, total return would have been higher if the Adviser had not recovered previously waived expenses. Total return is calculated assuming an initial investment made at the net asset value at the beginning of the period, reinvestment of all dividends and distributions at net asset value during the period and redemption on the last day of the period and is not annualized. |
| 3 | As a result of an expense limitation, the ratio of expenses (exclusive of taxes, interest, brokerage commissions, acquired fund fees and expenses, and extraordinary items) to average net assets will not exceed 1.40%. |
| @ | Calculated based on the average number of shares outstanding during the period. |
| ‡ | Investment income per share reflects a special dividend received during the period which amounted to $0.19 per share. Excluding the special dividend, the ratio of net investment income to average net assets would have been 0.43%. |
| ± | Investment income per share reflects special dividends received during the period which amounted to $0.41 per share. Excluding the special dividends, the ratio of net investment income to average net assets would have been 1.67%. |
| ** | Investment income per share reflects a special dividend received during the period which amounted to $0.44 per share. Excluding the special dividend, the ratio of net investment income to average net assets would have been 0.33%. |
| † | The Adviser recovered a portion of its previously waived fees. |
The accompanying notes are an integral part of the financial statements.
43
Third Avenue Trust
Financial Highlights
Selected data (for a share outstanding throughout each period) and ratios are as follows:
| Third Avenue Value Fund | ||||||||||||||||||||
| Years Ended October 31, | ||||||||||||||||||||
| 2017 | 2016 | 2015 | 2014 | 2013 | ||||||||||||||||
| Institutional Class: | ||||||||||||||||||||
| Net asset value, beginning of period | $ | 51.22 | $ | 54.35 | $ | 59.69 | $ | 57.86 | $ | 48.53 | ||||||||||
| Income/(loss) from investment operations: | ||||||||||||||||||||
Net investment income@ | 0.13 | 0.57 | ‡ | 0.43 | 1.53 | ± | 0.77 | ** | ||||||||||||
Net gain/(loss) on investment transactions (both realized and unrealized)1 | 8.85 | 0.35 | (2.46 | ) | 2.23 | 9.87 | ||||||||||||||
| Total from investment operations | 8.98 | 0.92 | (2.03 | ) | 3.76 | 10.64 | ||||||||||||||
| Less dividends and distributions to shareholders: | ||||||||||||||||||||
| Dividends from net investment income | (0.45 | ) | (0.77 | ) | (2.25 | ) | (1.93 | ) | (1.31 | ) | ||||||||||
| Distributions from net realized gain | (3.70 | ) | (3.28 | ) | (1.06 | ) | — | — | ||||||||||||
| Total dividends and distributions | (4.15 | ) | (4.05 | ) | (3.31 | ) | (1.93 | ) | (1.31 | ) | ||||||||||
| Net asset value, end of period | $ | 56.05 | $ | 51.22 | $ | 54.35 | $ | 59.69 | $ | 57.86 | ||||||||||
Total return2 | 18.38 | % | 2.00 | % | (3.64 | %) | 6.70 | % | 22.40 | % | ||||||||||
| Ratios/Supplemental Data: | ||||||||||||||||||||
| Net assets, end of period (in thousands) | $ | 1,131,488 | $ | 1,142,249 | $ | 1,656,769 | $ | 2,131,554 | $ | 2,594,637 | ||||||||||
| Ratio of expenses to average net assets | ||||||||||||||||||||
| Before fee waivers/expense offset arrangement/recovery | 1.13 | % | 1.15 | % | 1.09 | % | 1.08 | % | 1.10 | % | ||||||||||
After fee waivers/expense offset arrangement/recovery3 | 1.13 | % | 1.14 | % | 1.09 | % | 1.07 | % | 1.10 | %† | ||||||||||
| Ratio of net investment income to average net assets | 0.23 | % | 1.16 | %‡ | 0.76 | % | 2.61 | %± | 1.45 | %** | ||||||||||
| Portfolio turnover rate | 18 | % | 17 | % | 24 | % | 31 | % | 21 | % | ||||||||||
| 1 | Includes redemption fees of less than $0.01 per share. |
| 2 | Performance figures may reflect fee waivers, expense offset arrangement and/or recovery of previously waived fees. Past performance is no guarantee of future results. Total return would have been lower if the Adviser had not waived certain expenses. Conversely, total return would have been higher if the Adviser had not recovered previously waived expenses. Total return is calculated assuming an initial investment made at the net asset value at the beginning of the period, reinvestment of all dividends and distributions at net asset value during the period and redemption on the last day of the period and is not annualized. |
| 3 | As a result of an expense limitation, the ratio of expenses (exclusive of taxes, interest, brokerage commissions, acquired fund fees and expenses, and extraordinary items) to average net assets will not exceed 1.15%. |
| @ | Calculated based on the average number of shares outstanding during the period. |
| ‡ | Investment income per share reflects a special dividend received during the period which amounted to $0.19 per share. Excluding the special dividend, the ratio of net investment income to average net assets would have been 0.76%. |
| ± | Investment income per share reflects special dividends received during the period which amounted to $0.41 per share. Excluding the special dividends, the ratio of net investment income to average net assets would have been 1.92%. |
| ** | Investment income per share reflects a special dividend received during the period which amounted to $0.44 per share. Excluding the special dividend, the ratio of net investment income to average net assets would have been 0.63%. |
| † | The Adviser recovered a portion of its previously waived fees. |
The accompanying notes are an integral part of the financial statements.
44
Third Avenue Trust
Financial Highlights
Selected data (for a share outstanding throughout each period) and ratios are as follows:
| Third Avenue Small‐Cap Value Fund | ||||||||||||||||||||
| Years Ended October 31, | ||||||||||||||||||||
| 2017 | 2016 | 2015 | 2014 | 2013 | ||||||||||||||||
| Investor Class: | ||||||||||||||||||||
| Net asset value, beginning of period | $ | 20.77 | $ | 22.28 | $ | 28.18 | $ | 28.10 | $ | 22.13 | ||||||||||
| Income/(loss) from investment operations: | ||||||||||||||||||||
Net investment income/(loss)@ | (0.18 | ) | 0.08 | ‡ | (0.10 | ) | (0.11 | ) | 0.06 | * | ||||||||||
Net gain/(loss) on investment transactions (both realized and unrealized)1 | 4.63 | 1.17 | (0.19 | ) | 1.96 | 6.57 | ||||||||||||||
| Total from investment operations | 4.45 | 1.25 | (0.29 | ) | 1.85 | 6.63 | ||||||||||||||
| Less dividends and distributions to shareholders: | ||||||||||||||||||||
| Dividends from net investment income | (0.06 | ) | — | — | — | (0.16 | ) | |||||||||||||
| Distributions from net realized gain | (1.86 | ) | (2.76 | ) | (5.61 | ) | (1.77 | ) | (0.50 | ) | ||||||||||
| Total dividends and distributions | (1.92 | ) | (2.76 | ) | (5.61 | ) | (1.77 | ) | (0.66 | ) | ||||||||||
| Net asset value, end of period | $ | 23.30 | $ | 20.77 | $ | 22.28 | $ | 28.18 | $ | 28.10 | ||||||||||
Total return2 | 22.22 | % | 6.71 | % | (1.49 | %) | 6.85 | % | 30.74 | % | ||||||||||
| Ratios/Supplemental Data: | ||||||||||||||||||||
| Net assets, end of period (in thousands) | $ | 4,955 | $ | 5,145 | $ | 9,379 | $ | 9,898 | $ | 11,995 | ||||||||||
| Ratio of expenses to average net assets | ||||||||||||||||||||
| Before fee waivers/expense offset arrangement/recovery | 1.45 | % | 1.45 | % | 1.39 | % | 1.35 | % | 1.37 | % | ||||||||||
After fee waivers/expense offset arrangement/recovery3 | 1.40 | %# | 1.40 | %# | 1.39 | % | 1.35 | % | 1.37 | % | ||||||||||
| Ratio of net investment income/(loss) to average net assets | (0.81 | %) | 0.39 | %‡ | (0.42 | %) | (0.41 | %) | 0.25 | %* | ||||||||||
| Portfolio turnover rate | 32 | % | 20 | % | 29 | % | 40 | % | 39 | % | ||||||||||
| 1 | Includes redemption fees of less than $0.01 per share. |
| 2 | Performance figures may reflect fee waivers, expense offset arrangement and/or recovery of previously waived fees. Past performance is no guarantee of future results. Total return would have been lower if the Adviser had not waived certain expenses. Conversely, total return would have been higher if the Adviser had not recovered previously waived expenses. Total return is calculated assuming an initial investment made at the net asset value at the beginning of the period, reinvestment of all dividends and distributions at net asset value during the period and redemption on the last day of the period and is not annualized. |
| 3 | As a result of an expense limitation, the ratio of expenses (exclusive of taxes, interest, brokerage commissions, acquired fund fees and expenses, and extraordinary items) to average net assets will not exceed 1.40%. |
| @ | Calculated based on the average number of shares outstanding during the period. |
| ‡ | Investment income per share reflects special dividends received during the period which amounted to $0.11 per share. Excluding the special dividends, the ratio of net investment income/(loss) to average net assets would have been (0.17%). |
| * | Investment income per share reflects special dividends received during the period which amounted to $0.11 per share. Excluding the special dividends, the ratio of net investment income/(loss) to average net assets would have been (0.18%). |
| # | The Adviser waived a portion of its fees. |
The accompanying notes are an integral part of the financial statements.
45
Third Avenue Trust
Financial Highlights
Selected data (for a share outstanding throughout each period) and ratios are as follows:
| Third Avenue Small-Cap Value Fund | ||||||||||||||||||||
| Years Ended October 31, | ||||||||||||||||||||
| 2017 | 2016 | 2015 | 2014 | 2013 | ||||||||||||||||
| Institutional Class: | ||||||||||||||||||||
| Net asset value, beginning of period | $ | 20.97 | $ | 22.42 | $ | 28.27 | $ | 28.16 | $ | 22.18 | ||||||||||
| Income/(loss) from investment operations: | ||||||||||||||||||||
Net investment income/(loss)@ | (0.12 | ) | 0.13 | † | (0.04 | ) | (0.05 | ) | 0.15 | ‡ | ||||||||||
Net gain/(loss) on investment transactions (both realized and unrealized)1 | 4.69 | 1.18 | (0.20 | ) | 1.97 | 6.54 | ||||||||||||||
| Total from investment operations | 4.57 | 1.31 | (0.24 | ) | 1.92 | 6.69 | ||||||||||||||
| Less dividends and distributions to shareholders: | ||||||||||||||||||||
| Dividends from net investment income | (0.13 | ) | — | — | (0.04 | ) | (0.21 | ) | ||||||||||||
| Distributions from net realized gain | (1.86 | ) | (2.76 | ) | (5.61 | ) | (1.77 | ) | (0.50 | ) | ||||||||||
| Total dividends and distributions | (1.99 | ) | (2.76 | ) | (5.61 | ) | (1.81 | ) | (0.71 | ) | ||||||||||
| Net asset value, end of period | $ | 23.55 | $ | 20.97 | $ | 22.42 | $ | 28.27 | $ | 28.16 | ||||||||||
Total return2 | 22.59 | % | 6.95 | % | (1.27 | %) | 7.09 | % | 31.05 | % | ||||||||||
| Ratios/Supplemental Data: | $ | 291,169 | $ | 292,166 | $ | 388,441 | $ | 510,053 | $ | 667,712 | ||||||||||
| Net assets, end of period (in thousands) | ||||||||||||||||||||
| Ratio of expenses to average net assets | ||||||||||||||||||||
| Before fee waivers/expense offset arrangement/recovery | 1.20 | % | 1.21 | % | 1.14 | % | 1.10 | % | 1.12 | % | ||||||||||
After fee waivers/expense offset arrangement/recovery3 | 1.15 | %# | 1.15 | %# | 1.14 | % | 1.10 | % | 1.12 | % | ||||||||||
| Ratio of net investment income/(loss) to average net assets | (0.56 | %) | 0.65 | %† | (0.16 | %) | (0.17 | %) | 0.62% | ‡ | ||||||||||
| Portfolio turnover rate | 32 | % | 20 | % | 29 | % | 40 | % | 39 | % | ||||||||||
| 1 | Includes redemption fees of less than $0.01 per share. |
| 2 | Performance figures may reflect fee waivers, expense offset arrangement and/or recovery of previously waived fees. Past performance is no guarantee of future results. Total return would have been lower if the Adviser had not waived certain expenses. Conversely, total return would have been higher if the Adviser had not recovered previously waived expenses. Total return is calculated assuming an initial investment made at the net asset value at the beginning of the period, reinvestment of all dividends and distributions at net asset value during the period and redemption on the last day of the period and is not annualized. |
| 3 | As a result of an expense limitation, the ratio of expenses (exclusive of taxes, interest, brokerage commissions, acquired fund fees and expenses, and extraordinary items) to average net assets will not exceed 1.15%. |
| @ | Calculated based on the average number of shares outstanding during the period. |
| † | Investment income per share reflects special dividends received during the period which amounted to $0.11 per share. Excluding the special dividends, the ratio of net investment income to average net assets would have been 0.09%. |
| ‡ | Investment income per share reflects special dividends received during the period which amounted to $0.11 per share. Excluding the special dividends, the ratio of net investment income/(loss) to average net assets would have been 0.19%. |
| # | The Adviser waived a portion of its fees. |
The accompanying notes are an integral part of the financial statements.
46
Third Avenue Trust
Financial Highlights
Selected data (for a share outstanding throughout each period) and ratios are as follows:
| Third Avenue Real Estate Value Fund | ||||||||||||||||||||
| Years Ended October 31, | ||||||||||||||||||||
| 2017 | 2016 | 2015 | 2014 | 2013 | ||||||||||||||||
| Investor Class: | ||||||||||||||||||||
| Net asset value, beginning of period | $ | 29.51 | $ | 31.14 | $ | 31.84 | $ | 29.40 | $ | 26.53 | ||||||||||
| Income/(loss) from investment operations: | ||||||||||||||||||||
Net investment income/(loss)@ | 0.18 | * | 0.08 | ‡ | (0.04 | ) | 0.50 | ± | 0.10 | |||||||||||
Net gain/(loss) on investment transactions (both realized and unrealized)1 | 5.10 | (0.18 | ) | 0.41 | 2.60 | 4.99 | ||||||||||||||
| Total from investment operations | 5.28 | (0.10 | ) | 0.37 | 3.10 | 5.09 | ||||||||||||||
| Less dividends and distributions to shareholders: | ||||||||||||||||||||
| Dividends from net investment income | (0.16 | ) | (0.13 | ) | (0.44 | ) | (0.26 | ) | (0.84 | ) | ||||||||||
| Distributions from net realized gain | (0.28 | ) | (1.40 | ) | (0.63 | ) | (0.40 | ) | (1.38 | ) | ||||||||||
| Total dividends and distributions | (0.44 | ) | (1.53 | ) | (1.07 | ) | (0.66 | ) | (2.22 | ) | ||||||||||
| Net asset value, end of period | $ | 34.35 | $ | 29.51 | $ | 31.14 | $ | 31.84 | $ | 29.40 | ||||||||||
Total return2 | 18.13 | % | (0.21 | %) | 1.12 | % | 10.84 | % | 20.61 | % | ||||||||||
| Ratios/Supplemental Data: | ||||||||||||||||||||
| Net assets, end of period (in thousands) | $ | 255,383 | $ | 243,502 | $ | 438,506 | $ | 367,834 | $ | 145,169 | ||||||||||
| Ratio of expenses to average net assets | ||||||||||||||||||||
| Before fee waivers/expense offset arrangement/recovery | 1.36 | % | 1.38 | % | 1.35 | % | 1.34 | % | 1.34 | % | ||||||||||
After fee waivers/expense offset arrangement/recovery3 | 1.36 | % | 1.38 | % | 1.35 | % | 1.33 | % | 1.33 | % | ||||||||||
| Ratio of net investment income/(loss) to average net assets | 0.56% | * | 0.28% | ‡ | (0.11 | %) | 1.63 | %± | 0.36 | % | ||||||||||
| Portfolio turnover rate | 7 | % | 20 | % | 17 | % | 14 | % | 13 | % | ||||||||||
| 1 | Includes redemption fees of less than $0.01 per share. |
| 2 | Performance figures may reflect fee waivers, expense offset arrangement and/or recovery of previously waived fees. Past performance is no guarantee of future results. Total return would have been lower if the Adviser had not waived certain expenses. Conversely, total return would have been higher if the Adviser had not recovered previously waived expenses. Total return is calculated assuming an initial investment made at the net asset value at the beginning of the period, reinvestment of all dividends and distributions at net asset value during the period and redemption on the last day of the period and is not annualized. |
| 3 | As a result of an expense limitation, the ratio of expenses (exclusive of taxes, interest, brokerage commissions, acquired fund fees and expenses, and extraordinary items) to average net assets will not exceed 1.40%. |
| @ | Calculated based on the average number of shares outstanding during the period. |
| * | Investment income per share reflects a special dividend received during the period which amounted to $0.10 per share. Excluding the special dividend, the ratio of net investment income/(loss) to average net assets would have been 0.25%. |
| ‡ | Investment income per share reflects a special dividend received during the period which amounted to $0.09 per share. Excluding the special dividend, the ratio of net investment income/(loss) to average net assets would have been (0.04%). |
| ± | Investment income per share reflects a special dividend received during the period which amounted to $0.06 per share. Excluding the special dividend, the ratio of net investment income to average net assets would have been 1.43%. |
The accompanying notes are an integral part of the financial statements.
47
Third Avenue Trust
Financial Highlights
Selected data (for a share outstanding throughout each period) and ratios are as follows:
| Third Avenue Real Estate Value Fund | ||||||||||||||||||||
| Years Ended October 31, | ||||||||||||||||||||
| 2017 | 2016 | 2015 | 2014 | 2013 | ||||||||||||||||
| Institutional Class: | ||||||||||||||||||||
| Net asset value, beginning of period | $ | 29.73 | $ | 31.36 | $ | 32.05 | $ | 29.56 | $ | 26.66 | ||||||||||
| Income/(loss) from investment operations: | ||||||||||||||||||||
Net investment income@ | 0.26 | * | 0.16 | ‡ | 0.04 | 0.56 | ± | 0.18 | ||||||||||||
Net gain/(loss) on investment transactions (both realized and unrealized)1 | 5.13 | (0.18 | ) | 0.41 | 2.63 | 4.99 | ||||||||||||||
| Total from investment operations | 5.39 | (0.02 | ) | 0.45 | 3.19 | 5.17 | ||||||||||||||
| Less dividends and distributions to shareholders: | ||||||||||||||||||||
| Dividends from net investment income | (0.25 | ) | (0.21 | ) | (0.51 | ) | (0.30 | ) | (0.89 | ) | ||||||||||
| Distributions from net realized gain | (0.28 | ) | (1.40 | ) | (0.63 | ) | (0.40 | ) | (1.38 | ) | ||||||||||
| Total dividends and distributions | (0.53 | ) | (1.61 | ) | (1.14 | ) | (0.70 | ) | (2.27 | ) | ||||||||||
| Net asset value, end of period | $ | 34.59 | $ | 29.73 | $ | 31.36 | $ | 32.05 | $ | 29.56 | ||||||||||
Total return2 | 18.41 | % | 0.05 | % | 1.37 | % | 11.11 | % | 20.87 | % | ||||||||||
| Ratios/Supplemental Data: | ||||||||||||||||||||
| Net assets, end of period (in thousands) | $ | 1,690,211 | $ | 1,596,887 | $ | 3,026,286 | $ | 2,866,849 | $ | 2,010,557 | ||||||||||
| Ratio of expenses to average net assets | ||||||||||||||||||||
| Before fee waivers/expense offset arrangement/recovery | 1.11 | % | 1.13 | % | 1.10 | % | 1.09 | % | 1.09 | % | ||||||||||
After fee waivers/expense offset arrangement/recovery3 | 1.11 | % | 1.13 | % | 1.10 | % | 1.08 | % | 1.08 | % | ||||||||||
| Ratio of net investment income to average net assets | 0.81 | %* | 0.56 | %‡ | 0.13 | % | 1.82 | %± | 0.65 | % | ||||||||||
| Portfolio turnover rate | 7 | % | 20 | % | 17 | % | 14 | % | 13 | % | ||||||||||
| 1 | Includes redemption fees of less than $0.01 per share. |
| 2 | Performance figures may reflect fee waivers, expense offset arrangement and/or recovery of previously waived fees. Past performance is no guarantee of future results. Total return would have been lower if the Adviser had not waived certain expenses. Conversely, total return would have been higher if the Adviser had not recovered previously waived expenses. Total return is calculated assuming an initial investment made at the net asset value at the beginning of the period, reinvestment of all dividends and distributions at net asset value during the period and redemption on the last day of the period and is not annualized. |
| 3 | As a result of an expense limitation, the ratio of expenses (exclusive of taxes, interest, brokerage commissions, acquired fund fees and expenses, and extraordinary items) to average net assets will not exceed 1.15%. |
| @ | Calculated based on the average number of shares outstanding during the period. |
| * | Investment income per share reflects a special dividend received during the period which amounted to $0.10 per share. Excluding the special dividend, the ratio of net investment income to average net assets would have been 0.50%. |
| ‡ | Investment income per share reflects a special dividend received during the period which amounted to $0.09 per share. Excluding the special dividend, the ratio of net investment income to average net assets would have been 0.24%. |
| ± | Investment income per share reflects a special dividend received during the period which amounted to $0.06 per share. Excluding the special dividend, the ratio of net investment income to average net assets would have been 1.62%. |
The accompanying notes are an integral part of the financial statements.
48
Third Avenue Trust
Financial Highlights
Selected data (for a share outstanding throughout each period) and ratios are as follows:
| Third Avenue International Value Fund | ||||||||||||||||||||
| Years Ended October 31, | ||||||||||||||||||||
| 2017 | 2016 | 2015 | 2014 | 2013 | ||||||||||||||||
| Investor Class: | ||||||||||||||||||||
| Net asset value, beginning of period | $ | 15.59 | $ | 15.29 | $ | 17.58 | $ | 19.96 | $ | 16.14 | ||||||||||
| Income/(loss) from investment operations: | ||||||||||||||||||||
Net investment income/(loss)@ | (0.24 | ) | 0.13 | 0.08 | 0.39 | ± | 0.25 | * | ||||||||||||
Net gain/(loss) on investment transactions (both realized and unrealized)1 | 4.21 | 0.37 | (1.26 | ) | (2.55 | ) | 3.68 | |||||||||||||
| Total from investment operations | 3.97 | 0.50 | (1.18 | ) | (2.16 | ) | 3.93 | |||||||||||||
| Less dividends and distributions to shareholders: | ||||||||||||||||||||
| Dividends from net investment income | (0.71 | ) | — | (1.11 | ) | (0.22 | ) | (0.11 | ) | |||||||||||
| Distributions from net realized gain | — | (0.20 | ) | — | — | — | ||||||||||||||
| Total dividends and distributions | (0.71 | ) | (0.20 | ) | (1.11 | ) | (0.22 | ) | (0.11 | ) | ||||||||||
| Net asset value, end of period | $ | 18.85 | $ | 15.59 | $ | 15.29 | $ | 17.58 | $ | 19.96 | ||||||||||
Total return2 | 26.34 | % | 3.44 | % | (7.24 | %) | (10.96 | %) | 24.49 | % | ||||||||||
| Ratios/Supplemental Data: | ||||||||||||||||||||
| Net assets, end of period (in thousands) | $ | 7,688 | $ | 4,465 | $ | 5,977 | $ | 12,266 | $ | 35,013 | ||||||||||
| Ratio of expenses to average net assets | ||||||||||||||||||||
| Before fee waivers and expense offset arrangement | 1.96 | % | 2.04 | % | 1.86 | % | 1.71 | % | 1.69 | % | ||||||||||
After fee waivers and expense offset arrangement3,# | 1.65 | % | 1.65 | % | 1.65 | % | 1.65 | % | 1.65 | % | ||||||||||
| Ratio of net investment income/(loss) to average net assets | (1.41 | %) | 0.90 | % | 0.50 | % | 1.99 | %± | 1.37 | %* | ||||||||||
| Portfolio turnover rate | 37 | % | 15 | % | 25 | % | 22 | % | 11 | % | ||||||||||
| 1 | Includes redemption fees of less than $0.01 per share. |
| 2 | Performance figures may reflect fee waivers and/or expense offset arrangement. Past performance is no guarantee of future results. In the absence of fee waivers and/or expense offset arrangement, the total return would have been lower. Total return is calculated assuming an initial investment made at the net asset value at the beginning of the period, reinvestment of all dividends and distributions at net asset value during the period and redemption on the last day of the period and is not annualized. |
| 3 | As a result of an expense limitation, the ratio of expenses (exclusive of taxes, interest, brokerage commissions, acquired fund fees and expenses, and extraordinary items) to average net assets will not exceed 1.65%. |
| @ | Calculated based on the average number of shares outstanding during the period. |
| ± | Investment income per share reflects special dividends received during the period which amounted to $0.12 per share. Excluding the special dividends, the ratio of net investment income to average net assets would have been 1.39%. |
| * | Investment income per share reflects a special dividend received during the period which amounted to $0.15 per share. Excluding the special dividend, the ratio of net investment income to average net assets would have been 0.53%. |
| # | The Adviser waived a portion of its fees. |
The accompanying notes are an integral part of the financial statements.
49
Third Avenue Trust
Financial Highlights
Selected data (for a share outstanding throughout each period) and ratios are as follows:
| Third Avenue International Value Fund | ||||||||||||||||||||
| Years Ended October 31, | ||||||||||||||||||||
| 2017 | 2016 | 2015 | 2014 | 2013 | ||||||||||||||||
| Institutional Class: | ||||||||||||||||||||
| Net asset value, beginning of period | $ | 15.59 | $ | 15.29 | $ | 17.63 | $ | 20.00 | $ | 16.16 | ||||||||||
| Income/(loss) from investment operations: | ||||||||||||||||||||
Net investment income@ | 0.10 | 0.16 | 0.13 | 0.43 | ± | 0.25 | ** | |||||||||||||
Net gain/(loss) on investment transactions (both realized and unrealized)1 | 3.91 | 0.37 | (1.27 | ) | (2.54 | ) | 3.74 | |||||||||||||
| Total from investment operations | 4.01 | 0.53 | (1.14 | ) | (2.11 | ) | 3.99 | |||||||||||||
| Less dividends and distributions to shareholders: | ||||||||||||||||||||
| Dividends from net investment income | (0.74 | ) | (0.03 | ) | (1.20 | ) | (0.26 | ) | (0.15 | ) | ||||||||||
| Distributions from net realized gain | — | (0.20 | ) | — | — | — | ||||||||||||||
| Total dividends and distributions | (0.74 | ) | (0.23 | ) | (1.20 | ) | (0.26 | ) | (0.15 | ) | ||||||||||
| Net asset value, end of period | $ | 18.86 | $ | 15.59 | $ | 15.29 | $ | 17.63 | $ | 20.00 | ||||||||||
Total return2 | 26.67 | % | 3.66 | % | (6.97 | %) | (10.79 | %) | 24.89 | % | ||||||||||
| Ratios/Supplemental Data: | ||||||||||||||||||||
| Net assets, end of period (in thousands) | $ | 125,559 | $ | 124,161 | $ | 195,523 | $ | 339,498 | $ | 1,223,107 | ||||||||||
| Ratio of expenses to average net assets | ||||||||||||||||||||
| Before fee waivers and expense offset arrangement | 1.72 | % | 1.79 | % | 1.61 | % | 1.46 | % | 1.44 | % | ||||||||||
After fee waivers and expense offset arrangement3, # | 1.40 | % | 1.40 | % | 1.40 | % | 1.40 | % | 1.40 | % | ||||||||||
| Ratio of net investment income to average net assets | 0.57 | % | 1.14 | % | 0.82 | % | 2.19 | %± | 1.40 | %** | ||||||||||
| Portfolio turnover rate | 37 | % | 15 | % | 25 | % | 22 | % | 11 | % | ||||||||||
| 1 | Includes redemption fees of less than $0.01 per share. |
| 2 | Performance figures may reflect fee waivers and/or expense offset arrangement. Past performance is no guarantee of future results. In the absence of fee waivers and/or expense offset arrangement, the total return would have been lower. Total return is calculated assuming an initial investment made at the net asset value at the beginning of the period, reinvestment of all dividends and distributions at net asset value during the period and redemption on the last day of the period and is not annualized. |
| 3 | As a result of an expense limitation, the ratio of expenses (exclusive of taxes, interest, brokerage commissions, acquired fund fees and expenses, and extraordinary items) to average net assets will not exceed 1.40%. |
| @ | Calculated based on the average number of shares outstanding during the period. |
| ± | Investment income per share reflects special dividends received during the period which amounted to $0.12 per share. Excluding the special dividends, the ratio of net investment income to average net assets would have been 1.59%. |
| ** | Investment income per share reflects a special dividend received during the period which amounted to $0.15 per share. Excluding the special dividend, the ratio of net investment income to average net assets would have been 0.56%. |
| # | The Adviser waived a portion of its fees. |
The accompanying notes are an integral part of the financial statements.
50
Third Avenue Trust
Notes to Financial Statements (continued)
Notes to Financial Statements (continued)
Notes to Financial Statements (continued)
Notes to Financial Statements (continued)
Notes to Financial Statements (continued)
Notes to Financial Statements (continued)
Notes to Financial Statements (continued)
Notes to Financial Statements (continued)
Notes to Financial Statements (continued)
Notes to Financial Statements
October 31, 2017
| 1. | SUMMARY OF ORGANIZATION AND SIGNIFICANT ACCOUNTING POLICIES |
Organization:
Third Avenue Trust (the “Trust”) is an open-end, management investment company organized as a Delaware business trust pursuant to a Trust Instrument dated October 31, 1996. The Trust currently consists of the following diversified (within the meaning of Section 5(b)(2) of the Investment Company Act), separate investment series: Third Avenue Value Fund, Third Avenue Small-Cap Value Fund, Third Avenue Real Estate Value Fund, and Third Avenue International Value Fund (each a “Fund” and, collectively, the “Funds”). The Trust also contains the Third Avenue Focused Credit Fund, a separate non-diversified investment series of the Trust, whose financial statements are presented separately. Third Avenue Management LLC (the “Adviser”) provides investment advisory services to each of the Funds in the Trust. The Funds seek to achieve their investment objectives by adhering to a strict value discipline when selecting securities and other instruments. Each Fund has a distinct investment approach.
Third Avenue Value Fund seeks to achieve its long-term capital appreciation objective mainly by acquiring common stocks of well-financed companies (meaning companies with high quality assets and conservative levels of liabilities) at a discount to what the Adviser believes is their intrinsic value. The Fund may invest in companies of any market capitalization. The Fund may also acquire senior securities, such as convertible securities, preferred stocks and debt instruments (including high-yield and distressed securities that may be in default and may have any or no credit rating), that the Adviser believes are undervalued. The Fund invests in both domestic and foreign securities.
Third Avenue Small-Cap Value Fund seeks to achieve its long-term capital appreciation objective mainly by acquiring equity securities, including common stocks and convertible securities, of well-financed (meaning companies with high quality assets and conservative levels of liabilities) small companies at a discount to what the Adviser believes is their intrinsic value. Under normal circumstances, the Fund expects to invest at least 80% of its net assets (plus the amount of any borrowing for investment purposes) in securities of companies that are considered small. The Fund considers a “small company” to be one whose market capitalization is within the range of capitalizations during the most recent 12-month period (as measured each calendar quarter end) of companies in the Russell 2000 Index, the S&P Small Cap 600 Index or the Dow Jones Wilshire U.S. Small-Cap Index at the time of investment (based on month-end data). The Fund may also acquire senior securities, such as preferred stocks and debt instruments (including high-yield and distressed securities that may be in default and may have any or no credit rating), that the Adviser believes are undervalued. The Fund invests in both domestic and foreign securities.
51
Third Avenue Trust
Notes to Financial Statements (continued)
October 31, 2017
Third Avenue Real Estate Value Fund seeks to achieve its long-term capital appreciation objective primarily by investing in equity securities, including common stocks and convertible securities, of well-financed (meaning companies with high quality assets and conservative levels of liabilities) real estate and real estate-related companies, or in companies which own significant real estate assets or derive a significant portion of gross revenues or net profits from real estate-related companies at the time of investment (“real estate companies”). The Fund seeks to acquire these securities at a discount to what the Adviser believes is their intrinsic value. Under normal circumstances, at least 80% of the Fund’s net assets (plus the amount of any borrowing for investment purposes) will be invested in securities of real estate and real estate-related companies. The Fund may invest in companies of any market capitalization. The Fund may also acquire senior securities, such as preferred stocks and debt instruments (including high-yield, distressed and mortgage-backed securities that may be in default and may have any or no credit rating) of real estate companies or loans secured by real estate or real estate-related companies that the Adviser believes have above-average yield potential. The Fund invests in both domestic and foreign securities.
Third Avenue International Value Fund seeks to achieve its long-term capital appreciation objective primarily by acquiring equity securities, including common stocks and convertible securities, of well-financed companies (meaning companies with high quality assets and conservative levels of liabilities) located outside of the United States. While the Fund may invest in companies located anywhere in the world, it currently expects that most of its assets will be invested in the more developed countries and, under normal circumstances, at least 80% of its net assets (plus the amount of any borrowing for investment purposes) will be invested in securities of issuers located outside of the United States at the time of investment. The Fund may also acquire senior securities, such as preferred stocks and debt instruments (including high-yield and distressed securities that may be in default and may have any or no credit rating), that the Adviser believes are undervalued.
Because of the Funds’ disciplined and deliberate investing approach, there may be times when a Fund will have a significant cash position. A substantial cash position can adversely impact Fund performance in certain market conditions, and may make it more difficult for a Fund to achieve its investment objective.
Accounting policies:
The policies described below are followed consistently by the Funds in the preparation of their financial statements in conformity with accounting principles generally accepted in the United States of America (“U.S. GAAP”). The Trust is an investment company and, accordingly, follows the investment company accounting and reporting guidance of the Financial Accounting Standards Board Accounting Standards Codification (“FASB ASC”) Topic 946-Investment Companies, which is part of U.S. GAAP.
52
Third Avenue Trust
Notes to Financial Statements (continued)
October 31, 2017
The preparation of financial statements in accordance with U.S. GAAP requires management to make estimates and assumptions that affect the reported amounts and disclosures. Actual results could differ from those estimates.
Security valuation:
Generally, the Funds’ investments are valued at market value. Securities traded on a principal stock exchange, including The NASDAQ Stock Market, Inc. (“NASDAQ”), are valued at the last quoted sales price, the NASDAQ official closing price, or, in the absence of closing sales prices on that day, securities are valued at the mean between the closing bid and asked price. In accordance with procedures approved by the Trust’s Board of Trustees (the “Board”), the Funds have retained a third party provider that applies a statistical model to provide fair value pricing for foreign equity securities with principal markets that are no longer open when a Fund calculates its net asset value (“NAV”). Debt instruments with maturities greater than 60 days, including floating rate loan securities, are valued on the basis of prices obtained from a pricing service approved by the Board or otherwise pursuant to policies and procedures approved by the Board. Investments in derivative instruments are valued independently by service providers or by broker quotes based on pricing models. Short-term cash investments are valued at cost, plus accrued interest, which approximates market value. Short-term debt securities with 60 days or less to maturity may be valued at amortized cost.
The Adviser has established a Valuation Committee (the “Committee”) which is responsible for overseeing the pricing and valuation of all securities held in the Funds. The Committee operates under pricing and valuation policies and procedures established by the Adviser and approved by the Board, including pricing policies which set forth the mechanisms and processes to be employed on a daily basis to implement these policies and procedures. In particular, the pricing policies describe how to determine market quotations for securities and other instruments. The Committee’s responsibilities include: 1) fair value determinations (and oversight of third parties used in valuation determinations), and 2) regular monitoring of the Adviser’s pricing and valuation policies and procedures and modification or enhancement of these policies and procedures (or recommendation of the modification of these policies and procedures) as the Committee believes appropriate.
53
Third Avenue Trust
Notes to Financial Statements (continued)
October 31, 2017
Securities for which market quotations are not readily available are valued at “fair value”, as determined in good faith by the Committee as authorized by the Board, under policies and procedures approved by the Board. At October 31, 2017, such securities had a total fair value of $7,013,746, or 0.61% of net assets of Third Avenue Value Fund, and $57,532,833, or 2.96% of net assets of Third Avenue Real Estate Value Fund. There were no fair valued securities for Third Avenue Small-Cap Value Fund and Third Avenue International Value Fund at October 31, 2017. Among the factors that may be considered by the Committee in determining fair value are: prior trades in the security in question, trades in similar securities of the same or other issuers, the type of security, trading in marketable securities of the same issuer, the financial condition of the issuer, comparable multiples of similar issuers, the operating results of the issuer and liquidation value of the issuer. See Fair Value Measurements below for additional detail on fair value measurements for financial reporting purposes. The fair values determined in accordance with these policies and procedures may differ significantly from the amounts which would be realized upon disposition of the securities.
Fair value measurements:
In accordance with FASB ASC 820-10, Fair Value Measurements and Disclosures, the Funds disclose the fair value of their investments in a hierarchy that prioritizes the inputs to valuation techniques used to measure the fair value. Fair value is defined as the price that a Fund would receive upon selling an investment in an orderly transaction to an independent buyer in the principal or most advantageous market for the investment under current market conditions. The hierarchy gives the highest priority to valuations based upon unadjusted quoted prices in active markets for identical assets or liabilities (Level 1 measurement) and the lowest priority to valuations based upon unobservable inputs that are significant to the valuation (Level 3 measurements). The three levels of the fair value hierarchy are as follows:
• Level 1 – Inputs that reflect unadjusted quoted prices in active markets for identical assets or liabilities that the Funds have the ability to access at the measurement date;
• Level 2 – Inputs other than quoted prices that are observable for the asset or liability either directly or indirectly, including inputs in markets that are not considered to be active;
• Level 3 – Significant unobservable inputs (including the Funds’ own assumptions in determining the fair value of investments)
A financial instrument’s level within the fair value hierarchy is based on the lowest level of any input both individually and in aggregate that is significant to the fair value measurement. However, the determination of what constitutes “observable” requires significant judgment by the Funds. The Funds consider observable data to be market data which is readily available, regularly distributed or updated, reliable and verifiable, not proprietary, and provided by independent sources that are actively involved in the relevant market. The inputs or methodology used for valuing investments are not necessarily an indication of the risk associated with investing in those investments.
The Funds use valuation techniques to measure fair value that are consistent with the market approach and/or income approach, depending on the type of security and the particular circumstance. The market approach uses prices and other relevant information generated by market transactions involving identical or comparable securities. The income approach uses valuation techniques to discount estimated future cash flows to present value.
54
Third Avenue Trust
Notes to Financial Statements (continued)
October 31, 2017
The following are certain inputs and techniques that the Funds generally use to evaluate how to classify each major category of assets and liabilities for Level 2 and Level 3, in accordance with U.S. GAAP.
Equity Securities (Common Stocks and Warrants)—Equity securities traded in inactive markets and certain foreign equity securities are valued using inputs which include broker- dealer quotes, recently executed transactions adjusted for changes in the benchmark index, or evaluated prices received from independent pricing services or brokers that take into account the integrity of the market sector and issuer, the individual characteristics of the security, and information received from broker-dealers and other market sources pertaining to the issuer or security. To the extent that these inputs are observable, the values of equity securities are categorized as Level 2. To the extent that these inputs are unobservable, the values are categorized as Level 3.
U.S. Government Obligations—U.S. Government obligations are valued by independent pricing services based on pricing models that evaluate the mean between the most recently quoted bid and ask prices. The models also take into consideration data received from active market makers and broker-dealers, yield curves, and the spread over comparable U.S. Government issues. The spreads change daily in response to market conditions and are generally obtained from the new issue market and broker dealer sources. To the extent that these inputs are observable, the values of U.S. Government obligations are categorized as Level 2. To the extent that these inputs are unobservable, the values are categorized as Level 3.
Corporate Bonds and Notes—Corporate bonds and notes are generally comprised of two main categories: investment grade bonds and high yield bonds. Investment grade bonds are valued by independent pricing services or brokers using various inputs and techniques, which include broker-dealer quotations, live trading levels, recently executed transactions in securities of the issuer or comparable issuers, and option adjusted spread models that include base curve and spread curve inputs. Adjustments to individual bonds can be applied to recognize trading differences compared to other bonds issued by the same issuer. High yield bonds are valued by independent pricing services or brokers based primarily on broker-dealer quotations from relevant market makers and recently executed transactions in securities of the issuer or comparable issuers. The broker-dealer quotations received are supported by credit analysis of the issuer that takes into consideration credit quality assessments, daily trading activity, and the activity of the underlying equities, listed bonds and sector specific trends. To the extent that these inputs are observable, the values of corporate bonds and notes are categorized as Level 2. To the extent that these inputs are unobservable, the values are categorized as Level 3.
55
Third Avenue Trust
Notes to Financial Statements (continued)
October 31, 2017
Term Loans—Term loans are valued by independent pricing services based on the average of evaluated quoted prices received from multiple dealers or valued relative to other benchmark securities when broker-dealer quotes are unavailable. Inputs may include quoted prices for similar investments in active markets, interest rates, coupon rates, yield curves, option adjusted spreads, default rates, credit spreads and other unique security features in order to estimate the relevant cash flows which are then discounted to calculate fair values. To the extent that these inputs are observable, the values of term loans are categorized as Level 2. To the extent that these inputs are unobservable, the values are categorized as Level 3.
Options (Purchased)—Options are valued by independent pricing services or by brokers based on pricing models that take into account, among other factors, foreign exchange rate, time until expiration, and volatility of the underlying foreign currency security. To the extent that these inputs are observable, the values of options are categorized as Level 2. To the extent that these inputs are unobservable, the values are categorized as Level 3.
The following is a Summary by Level of Inputs used to value the Funds’ investments as of October 31, 2017:
Third Avenue Value Fund | Third Avenue Small-Cap Value Fund | Third Avenue Real Estate Value Fund | Third Avenue International Value Fund | |||||||||||||
| Level 1: Quoted Prices† | ||||||||||||||||
| Investments in Securities: | ||||||||||||||||
| Common Stocks & Warrants: | ||||||||||||||||
| Consumer Products | $ | 19,986,853 | $ | — | $ | — | $ | — | ||||||||
| Diversified Holding Companies | — | — | — | 7,428,365 | ||||||||||||
| Metals & Mining | 10,627,140 | — | — | 15,091,631 | ||||||||||||
| Non-U.S. Real Estate Operating Companies | — | — | 87,129,889 | — | ||||||||||||
| Oil & Gas Production & Services | 55,690,623 | 3,392,135 | — | 5,993,590 | ||||||||||||
| Real Estate | — | — | — | 8,224,255 | ||||||||||||
| Transportation Infrastructure | — | — | — | 3,212,563 | ||||||||||||
| U.S. Real Estate Operating Companies | 25,619,431 | 6,365,464 | 95,216,904 | — | ||||||||||||
56
Third Avenue Trust
Notes to Financial Statements (continued)
October 31, 2017
Summary by level of inputs (continued)
Third Avenue Value Fund | Third Avenue Small-Cap Value Fund | Third Avenue Real Estate Value Fund | Third Avenue International Value Fund | |||||||||||||
| Other** | $ | 644,053,375 | $ | 253,401,225 | $ | 818,947,002 | $ | 34,806,290 | ||||||||
| Total for Level 1 Securities | 755,977,422 | 263,158,824 | 1,001,293,795 | 74,756,694 | ||||||||||||
| Level 2: Other Significant Observable Inputs† Investments in Securities: | ||||||||||||||||
| Common Stocks: | ||||||||||||||||
| Automotive | 27,180,720 | — | — | — | ||||||||||||
| Capital Goods | — | — | — | 4,699,780 | ||||||||||||
| Commercial Services | — | — | — | 2,166,325 | ||||||||||||
| Diversified Holding Companies | 135,060,296 | — | — | 3,520,713 | ||||||||||||
| Engineering & Construction | — | — | — | 4,216,223 | ||||||||||||
| Media | — | — | — | 4,556,435 | ||||||||||||
| Metals & Mining | — | — | — | 1,871,949 | ||||||||||||
| Non-U.S. Real Estate Investment Trusts | — | — | 181,528,859 | — | ||||||||||||
| Non-U.S. Real Estate Operating Companies | — | — | 440,953,444 | — | ||||||||||||
| Oil & Gas Production & Services | 48,109,351 | — | — | 8,441,106 | ||||||||||||
| Real Estate | — | — | — | 7,624,040 | ||||||||||||
| Transportation Infrastructure | — | — | — | 4,939,904 | ||||||||||||
| Corporate Bonds | — | — | — | 2,639,000 | ||||||||||||
| Term Loans | — | — | 7,920,000 | — | ||||||||||||
| Purchased Options: | ||||||||||||||||
| Foreign Currency Call Options | — | — | 26,250 | — | ||||||||||||
| Short-Term Investments: | ||||||||||||||||
| U.S. Government Obligations | 114,972,636 | 14,999,592 | 174,976,775 | — | ||||||||||||
| Total for Level 2 Securities | 325,323,003 | 14,999,592 | 805,405,328 | 44,675,475 |
| Level 3: Significant Unobservable Inputs Investments in Securities: | ||||||||||||||||
| Common Stocks: | ||||||||||||||||
| Consumer Products | 1 | — | — | — | ||||||||||||
| U.S. Real Estate Operating Companies | — | — | 57,490,575 | — | ||||||||||||
| Preferred Stocks: | ||||||||||||||||
| Consumer Products | 1 | — | — | — | ||||||||||||
| Corporate Notes | 7,013,744 | — | — | — | ||||||||||||
| Term Loans | — | — | 42,258 | — | ||||||||||||
| Total for Level 3 Securities | 7,013,746 | — | 57,532,833 | — | ||||||||||||
| Total Value of Investments | $ | 1,088,314,171 | $ | 278,158,416 | $ | 1,864,231,956 | $ | 119,432,169 |
| † | The value of securities that were transferred from Level 1 to Level 2 for Third Avenue Value Fund, Third Avenue Real Estate Value Fund and Third Avenue International Value Fund was $182,738,239, $598,358,850 and $31,106,671, respectively. The transfer was due to certain securities trading primarily outside the U.S. whose values were adjusted following the close of the local trading market at period end. |
| ** | Please refer to the Portfolios of Investments for industry specifics of the portfolio holdings. |
57
Third Avenue Trust
Notes to Financial Statements (continued)
October 31, 2017
Transfers from Level 1 to Level 2, or from Level 2 to Level 1, are recorded utilizing values as of the beginning of the period.
The following is a reconciliation of Level 3 investments for which significant unobservable inputs were used to determine fair value:
Third Avenue Value Fund
Common Stocks | Preferred Stocks | Corporate Bonds & Notes | Limited Partnerships | Total | ||||||||||||||||
| Balance as of 10/31/16 (fair value) | ||||||||||||||||||||
| Consumer Products | $ | — | * | $ | — | $ | 17,402,785 | $ | — | $ | 17,402,785 | |||||||||
| Insurance & Reinsurance | — | — | — | 12,217 | 12,217 | |||||||||||||||
| Purchases | ||||||||||||||||||||
| Consumer Products | — | — | ‡ | 25,025,995 | ‡ | — | 25,025,995 | |||||||||||||
| Payment-in-kind | ||||||||||||||||||||
| Consumer Products | — | — | 821,843 | — | 821,843 | |||||||||||||||
| Sales | ||||||||||||||||||||
| Consumer Products | — | — | (25,025,995 | )‡ | — | (25,025,995 | ) | |||||||||||||
| Insurance & Reinsurance | — | — | — | (12,111 | ) | (12,111 | ) | |||||||||||||
| Net change in unrealized gain/(loss) | ||||||||||||||||||||
| Consumer Products | 1 | 1 | (11,210,884 | ) | — | (11,210,882 | ) | |||||||||||||
| Insurance & Reinsurance | — | — | — | (12,217 | ) | (12,217 | ) | |||||||||||||
| Net realized gain/(loss) | ||||||||||||||||||||
| Insurance & Reinsurance | — | — | — | 12,111 | 12,111 | |||||||||||||||
| Balance as of 10/31/17 (fair value) | ||||||||||||||||||||
| Consumer Products | 1 | 1 | 7,013,744 | — | 7,013,746 | |||||||||||||||
| Insurance & Reinsurance | — | — | — | — | — | |||||||||||||||
| Total | $ | 1 | $ | 1 | $ | 7,013,744 | $ | — | $ | 7,013,746 | ||||||||||
| Net change in unrealized gain/(loss) related to securities still held as of October 31, 2017: | $ | 1 | $ | 1 | $ | (11,210,884 | ) | $ | — | $ | (11,210,882 | ) | ||||||||
* Investments fair valued at zero.
‡ Exchange of investments.
58
Third Avenue Trust
Notes to Financial Statements (continued)
October 31, 2017
Third Avenue Real Estate Value Fund
Common Stocks | Preferred Stocks | Term Loans | Total | |||||||||||||
| Balance as of 10/31/16 (fair value) | ||||||||||||||||
| Non-U.S. Real Estate Operating Companies | $ | — | $ | 36,079,757 | $ | 3,497,959 | $ | 39,577,716 | ||||||||
| U.S. Real Estate Operating Companies | 93,753,455 | ** | — | — | 93,753,455 | |||||||||||
| Payment-in-kind | ||||||||||||||||
| Non-U.S. Real Estate Operating Companies | — | — | 108,347 | 108,347 | ||||||||||||
| Sales | ||||||||||||||||
| Non-U.S. Real Estate Operating Companies | — | (31,802,983 | ) | (3,446,063 | ) | (35,249,046 | ) | |||||||||
| Net change in unrealized gain/(loss) | ||||||||||||||||
| Non-U.S. Real Estate Operating Companies | — | 5,863,814 | 702,584 | 6,566,398 | ||||||||||||
| U.S Real Estate Operating Companies | (36,262,880 | ) | — | — | (36,262,880 | ) | ||||||||||
| Net realized gain/(loss) | ||||||||||||||||
| Non-U.S. Real Estate Operating Companies | — | (10,140,588 | ) | (820,569 | ) | (10,961,157 | ) | |||||||||
| Balance as of 10/31/17 (fair value) | ||||||||||||||||
| Non-U.S. Real Estate Operating Companies | — | — | 42,258 | 42,258 | ||||||||||||
| U.S. Real Estate Operating Companies | 57,490,575 | — | — | 57,490,575 | ||||||||||||
| Total | $ | 57,490,575 | $ | — | $ | 42,258 | $ | 57,532,833 | ||||||||
| Net change in unrealized gain/(loss) related to securities still held as of October 31, 2017: | $ | (36,262,880 | ) | $ | — | $ | 2,422 | $ | (36,260,458 | ) | ||||||
** Investment categorized as common stocks due to corporate action.
59
Third Avenue Trust
Notes to Financial Statements (continued)
October 31, 2017
Quantitative Information about Level 3 Fair Value Measurements
(amounts in thousands)
| Third Avenue Value Fund | Fair Value at 10/31/17 | Valuation Technique(s) | Unobservable Input(s) | Multiple | ||||||
| Corporate Notes | $ | 7,014 | Market Comparable Companies | Enterprise Multiple | 5.0 | x | ||||
| Other (a) | — | * | ||||||||
| $ | 7,014 | |||||||||
| Third Avenue Real Estate Value Fund | Fair Value at 10/31/17 | Valuation Technique(s) | Unobservable Input(s) | Percentage Discount on Restricted Shares | ||||||
| Common Stocks | $ | 57,491 | Option Pricing Model (b) | Share volatility | 1.83 | % | ||||
| Other (a) | 42 | |||||||||
| $ | 57,533 | |||||||||
| (a) | Includes securities less than 0.50% of net assets of the Fund. |
| (b) | Represents amounts used when the reporting entity has determined that market participants would take into account premiums and discounts, as applicable, when pricing the investments. |
| * | Amount less than $1,000. |
The significant unobservable inputs used in the fair value measurement of the Funds’ investments are listed above. Generally, a change in the assumptions used in any input in isolation may be accompanied by a change in another input. Significant changes in any of the unobservable inputs may significantly impact the fair value measurement. The impact is based on the relationship between each unobservable input and the fair value measurement. Significant increases (decreases) in enterprise multiples may increase (decrease) the fair value measurement.
Security transactions and investment income:
Security transactions for financial statement purposes are accounted for on a trade date basis. Dividend income is recorded on the ex-dividend date or, for certain foreign dividends, as soon as the Funds become aware of the dividends. Interest income is determined on the basis of coupon interest accrued using the effective interest method which adjusts for amortization of premiums and accretion of discounts. Dividend income on the Statement of Operations is shown net of any foreign taxes withheld on income from foreign securities. Payments received from certain investments held by the Funds may be comprised of dividends, capital gains and return of capital. The Funds originally estimate the expected classification of such payments. These amounts may subsequently be reclassified upon receipt of information from the issuer. Realized gains and losses from securities transactions are recorded on an identified cost basis.
60
Third Avenue Trust
Notes to Financial Statements (continued)
October 31, 2017
Foreign currency translation and foreign investments:
The books and records of the Funds are maintained in U.S. dollars. Foreign currency amounts are translated into U.S. dollars as follows:
| • | Investments and assets and liabilities denominated in foreign currencies: At the prevailing rates of exchange on the valuation date. |
| • | Investment transactions and investment income: At the prevailing rates of exchange on the date of such transactions. |
The net assets of the Funds are presented at market values using the foreign exchange rates at the close of the period. The Funds do not generally isolate that portion of the results of operations arising as a result of changes in the foreign exchange rates from the fluctuations arising from changes in the market prices of the investments held.
Similarly, the Funds do not isolate the effect of changes in foreign exchange rates from the fluctuations arising from changes in the market prices of investments sold during the period. Accordingly, realized and unrealized foreign currency gains/(losses) are included in the reported net realized gain/(loss) and unrealized appreciation/(depreciation) on investments transactions and balances.
Net realized gains/(losses) on foreign currency transactions represent net foreign exchange gains/(losses) from disposition of foreign currencies, currency gains or losses realized between the trade and settlement dates on securities transactions, and the difference between the amount of investment income and foreign withholding taxes recorded on the Funds’ books and the U.S. dollar equivalent amounts actually received or paid. Net unrealized currency gains/(losses) from valuing foreign currency denominated assets and liabilities at period end exchange rates are reflected as a component of net unrealized appreciation/(depreciation) on the Statement of Assets and Liabilities. The change in net unrealized currency gains/(losses) for the period is reflected on the Statement of Operations.
Pursuant to U.S. federal income tax regulations, gains and losses from certain foreign currency transactions and the foreign currency portion of gains and losses realized on sales and maturities of foreign denominated debt securities are generally treated as ordinary income.
61
Third Avenue Trust
Notes to Financial Statements (continued)
October 31, 2017
Payment-in-kind securities (“PIKs”):
The Funds may invest in PIKs. PIKs may make a payment at each interest payment date in either cash or additional securities. Those additional securities usually have the same terms, including maturity dates and interest rates, and associated risks as the original securities. The daily market quotations of the original securities may include the accrued interest (referred to as a “dirty” price) and require a pro-rata adjustment from the unrealized appreciation or depreciation on investments to income receivable on the Statement of Assets and Liabilities.
For the year ended October 31, 2017, the total in-kind payments with respect to PIK securities that were received by the Third Avenue Value Fund in the amounts of $821,843 or 5.12% of total investment income are shown as a separate line item on the Statement of Operations.
Term loans:
The Funds typically invest in loans which are structured and administered by a third party entity (the “Agent”) that acts on behalf of a group of lenders that make or hold interests in the loan. These securities generally pay interest at rates which are periodically pre-determined by reference to a base lending rate plus a premium. These base lending rates are generally either the lending rate offered by one or more major European banks, such as the London Interbank Offered Rate (LIBOR), or the prime rate offered by one or more major United States banks, or the certificate of deposit rate.
These securities are ordinarily contractually obligated to receive approval from the Agent bank and/or borrower prior to disposition. Remaining maturities of term loans may be less than the stated maturities shown as a result of contractual or optional payments by the borrower. Such prepayments cannot be predicted with certainty. The interest rate disclosed reflects the rate in effect on October 31, 2017.
Forward foreign currency contracts:
The Funds may be exposed to foreign currency risks associated with portfolio investments and therefore may use forward foreign currency contracts to hedge or manage these exposures. The Funds also may buy forward foreign currency contracts to gain exposure to currencies. Forward foreign currency contracts are valued at the forward rate and are marked-to-market daily. The change in market value is included in unrealized appreciation/(depreciation) on forward foreign currency contracts. When the contract is closed, the Funds record a realized gain or loss equal to the difference between the value of the contract at the time it was opened and the value at the time it was closed.
62
Third Avenue Trust
Notes to Financial Statements (continued)
October 31, 2017
The use of forward foreign currency contracts does not eliminate fluctuations in the underlying prices of the Funds’ portfolio securities, but it does establish a rate of exchange that can be achieved in the future. Although forward foreign currency contracts limit the risk of loss due to a decline in the value of the hedged currency, they also limit any potential gain that might result should the value of the currency increase. In addition, the Funds could be exposed to risks if the counterparties to the contracts are unable to meet the terms of their contracts.
During the year ended October 31, 2017, Third Avenue Real Estate Value Fund used forward foreign currency contracts for hedging foreign currency risks. As of October 31, 2017, the Third Avenue Real Estate Value Fund no longer held any forward foreign currency contracts.
Option contracts:
The Funds may purchase and sell (“write”) put and call options on various instruments including investments, indices, and foreign currencies to manage and hedge exchange rate risks within their portfolios and also to gain long or short exposure to the underlying instruments.
An option contract gives the buyer the right, but not the obligation, to buy (call) or sell (put) an underlying item at a fixed exercise price on a certain date or during a specified period. The cost of the underlying instruments acquired through the exercise of a call option is increased by the premiums paid. The proceeds from the underlying instruments sold through the exercise of a purchased put option are decreased by the premiums paid. Investments in over-the-counter option contracts require the Funds to fair value or mark-to market the options on a daily basis, which reflects the change in the market value of the contracts at the close of each day’s trading. The cost of purchased options that expire unexercised are treated by the Funds, on expiration date, as realized losses on investments or foreign currency transactions.
When the Funds write an option, an amount equal to the premium received by the Funds is recorded as a liability and is subsequently adjusted to the current fair value of the option written. Premiums received from writing options that expire unexercised are treated by the Funds, on the expiration date, as realized gains on written options or foreign currency. The difference between the premium and the amount paid on effecting a closing purchase transaction, including brokerage commissions, is also treated as a realized gain, or, if the premium is less than the amount paid for the closing purchase transaction, as a realized loss. If a call option is exercised, the premium is added to the proceeds from the sale of the underlying security or currency in determining whether the Funds have a realized gain or loss. If a put option is exercised, the premium reduces the cost basis of the security or currency purchased by the Funds. In purchasing and writing options, the Funds bear the market risk of an unfavorable change in the price of the underlying security or the risk that the Funds may not be able to enter into a closing transaction due to an illiquid market. Exercise of a written option could result in the Funds purchasing a security or currency at a price different from the current market value. The Funds may execute transactions in both listed and over-the-counter options. Listed options involve minimal counterparty risk since listed options are guaranteed against default by the exchange on which they trade. When purchasing over-the-counter options, the Funds bear the risk of economic loss from counterparty default, equal to the market value of the option.
63
Third Avenue Trust
Notes to Financial Statements (continued)
October 31, 2017
During the year ended October 31, 2017, Third Avenue Real Estate Value Fund used purchased options on foreign currency for hedging purposes and/or to protect against losses in foreign currencies. Third Avenue International Value Fund used purchased options on exchange - traded funds to gain long exposure to the underlying instruments. As of October 31, 2017, the Third Avenue International Value Fund no longer held any purchased options on exchange - traded funds.
During the year ended October 31, 2017, Third Avenue Value Fund used written put options on equities to enhance the yield of the Fund. As of October 31, 2017, the Third Avenue Value Fund no longer held any written options on equities.
Summary of derivatives information:
The following tables present the value of derivatives held as of October 31, 2017, by their primary underlying risk exposure and respective location on the Statements of Assets and Liabilities:
Third Avenue Real Estate Value Fund
Derivative Contract | Statement of Assets and Liabilities Location | Options | |||
| Assets: | |||||
| Foreign currency contracts | Purchased foreign currency options | $ | 26,250 | ||
The following tables present the effect of derivatives on the Statement of Operations during the year ended October 31, 2017, by primary risk exposure:
Third Avenue Value Fund
Amount of Realized Gain/(Loss) on Derivatives Recognized in Income | ||||
Derivative Contract | Written Options | |||
| Equity contracts | $ | 152,020(a | ) | |
Third Avenue Real Estate Value Fund
| Amount of Realized Gain/(Loss) on Derivatives Recognized in Income | ||||||||||||
Derivative Contract | Forward Foreign Currency Contracts | Purchased Options | Total | |||||||||
| Foreign currency contracts | $ | 585,025(d | ) | $ | (1,258,000) | (e) | $ | (672,975 | ) | |||
64
Third Avenue Trust
Notes to Financial Statements (continued)
October 31, 2017
Amount of Change in Unrealized Appreciation/(Depreciation) on Derivatives Recognized in Income | ||||||||||||
Derivative Contract | Forward Foreign Currency Contracts | Purchased Options | Total | |||||||||
| Foreign currency contracts | $ | 611,020(c | ) | $ | 671,718(b | ) | $ | 1,282,738 | ||||
Third Avenue International Value Fund
Amount of Realized Gain/(Loss) on Derivatives Recognized in Income | ||||
Derivative Contract | Purchased Options | |||
| Equity contracts | $ | (493,750)(e) | ||
| (a) | Included in “Net realized gain on written equity options”. |
| (b) | Included in “Net change in unrealized appreciation/(depreciation) on purchased options”. |
| (c) | Included in “Net change in unrealized appreciation on forward foreign currency contracts”. |
| (d) | Included in “Net realized gain on forward foreign currency contracts”. |
| (e) | Included in “Net realized loss on purchased options”. |
Derivatives volume:
The tables below disclose the volume of the Funds’ forward foreign currency contracts and options activities during the year ended October 31, 2017 (amounts denominated in U.S. Dollars unless otherwise noted, except number of contracts). Please refer to the tables in the Summary of derivatives information for derivative-related gains and losses associated with volume activity (measured at each month-end).
65
Third Avenue Trust
Notes to Financial Statements (continued)
October 31, 2017
Third Avenue Value Fund | Third Avenue Real Estate Value Fund | Third Avenue International Value Fund | ||||||||||
| OTC Equity Options: | ||||||||||||
Average Number of Contracts - Purchased Option | — | — | 1,538 | |||||||||
Average Notional - Purchased Option | $ | — | $ | — | $ | 9,711,154 | ||||||
Average Number of Contracts - Written Option | 35 | — | — | |||||||||
Average Notional - Written Option | $ | 239,908 | $ | — | $ | — | ||||||
| Foreign Currency Options: | ||||||||||||
Average Notional - Purchased Option | $ | — | $ | 315,384,615 | $ | — | ||||||
Ending Notional Balance - Purchased Option | $ | — | $ | 300,000,000 | $ | — | ||||||
| Forward Foreign Currency Contracts: | ||||||||||||
Average Notional - Long Foreign Currency | $ | — | $ | 631,307 | $ | — | ||||||
Average Notional - Short Foreign Currency | $ | — | $ | 49,867,569 | $ | — | ||||||
Floating rate obligations:
The Funds may invest in debt securities with interest payments or maturity values that are not fixed, but float in conjunction with an underlying index or price. These securities may be backed by corporate issuers. The indices and prices upon which such securities can be based include interest rates and currency rates. Floating rate securities pay interest according to a coupon which is reset periodically.
66
Third Avenue Trust
Notes to Financial Statements (continued)
October 31, 2017
Dividends and distributions to shareholders:
The amount of dividends and distributions paid to shareholders from net investment income and net realized capital gains on disposition of securities, respectively, is determined in accordance with U.S. federal income tax law and regulations which may differ from U.S. GAAP. Such dividends and distributions are recorded on the ex-dividend date. The majority of dividends and capital gains distributions from a Fund may be automatically reinvested into additional shares of that Fund, based upon the discretion of the Fund’s shareholders.
Income tax information:
The Funds have complied and intend to continue to comply with the requirements of the Internal Revenue Code applicable to regulated investment companies, and each Fund intends to distribute all of its taxable net investment income and net realized capital gains, if any, to its shareholders. Therefore, no provision for U.S. federal income taxes is included on the accompanying financial statements.
Income, including capital gains, from investments in foreign securities received by the Funds may be subject to income, withholding or other taxes imposed by foreign countries.
Management has analyzed the tax positions taken on the Funds’ U.S. federal income tax returns for all open tax years (generally the current and prior three tax years), and has concluded that no provision for U.S. federal income tax is required in the Funds’ financial statements. This conclusion may be subject to future review and adjustment at a later date based upon factors including, but not limited to, on-going analyses of and changes to tax laws, regulations and interpretations thereof. The Funds are subject to possible examination by the relevant taxing authorities for tax years for which the applicable statutes of limitations have not expired.
Expense allocation:
Expenses attributable to a specific Fund are charged to that Fund. Expenses attributable to the Trust are generally allocated using the ratio of each series’ average net assets relative to the total average net assets of the Trust. Certain expenses are shared with the Third Avenue Variable Series Trust, an affiliated fund. Such costs are allocated using the ratio of the series’ average net assets relative to the total average net assets of each series of the Trust and Third Avenue Variable Series Trust.
Share class accounting:
Investment income, common expenses and realized/unrealized gains/(losses) are allocated to the two classes of shares of each Fund on the basis of daily net assets of each class. Fees relating to a specific class are charged directly to that share class.
67
Third Avenue Trust
Notes to Financial Statements (continued)
October 31, 2017
Trustees’ and officers’ fees:
The Trust does not pay any fees to its officers for their services as such, except for the Chief Compliance Officer and the Associate Director of Compliance, to whom the Trust paid $323,311 including $36,462 from Third Avenue Focused Credit Fund, for the year ended October 31, 2017. The Trust does pay, together with Third Avenue Variable Series Trust, Trustees who are not “interested persons” (as defined in the Investment Company Act of 1940) of the Trust (“Independent Trustee”) a fee of $5,000 for each meeting of the Board that each Independent Trustee attends, in addition to reimbursing all Independent Trustees for travel and incidental expenses incurred by them in connection with their attendance at meetings. If a special meeting is required, Trustees will each receive $2,500. Prior to January 1, 2017, the Trust, together with Third Avenue Variable Series Trust, also paid each Independent Trustee an annual retainer of $65,000 (the lead Independent Trustee received an additional retainer of $12,000). Effective January 1, 2017, the annual retainer was reduced to $55,000 and the additional retainer for the Chairman was set at $20,000. The Trustees on the Audit Committee each receive $2,000 for each audit committee meeting, and the audit committee chairman receives an annual retainer of $6,000. Effective March 2016, one of the Trustees began acting in an Advisory Trustee capacity. Prior to January 1, 2017, the Advisory Trustee received an annual retainer of $32,500 and a fee of $2,500 for each Board meeting the Trustee attends. Effective January 1, 2017, the annual retainer was reduced to $27,500.
68
Third Avenue Trust
Notes to Financial Statements (continued)
October 31, 2017
| 2. | INVESTMENTS |
Purchases and sales/conversions:
The aggregate cost of purchases and aggregate proceeds from sales and conversions of investments, excluding short-term investments, from unaffiliated and affiliated issuers (as defined in the Investment Company Act of 1940 as ownership by a Fund of 5% or more of the outstanding voting securities of these issuers) for the year ended October 31, 2017 were as follows:
Purchases | Sales | |||||||
| Third Avenue Value Fund | ||||||||
| Affiliated | $ | 4,077,364 | $ | 2,332,718 | ||||
| Unaffiliated | 187,485,042 | 510,710,339 | ||||||
| Third Avenue Small-Cap Value Fund | ||||||||
| Unaffiliated | 92,128,894 | 176,378,672 | ||||||
| Third Avenue Real Estate Value Fund | ||||||||
| Affiliated | 2,625,000 | — | ||||||
| Unaffiliated | 117,080,026 | 469,376,080 | ||||||
| Third Avenue International Value Fund | ||||||||
| Affiliated | — | 842,443 | ||||||
| Unaffiliated | 45,336,975 | 70,060,717 | ||||||
| 3. | INVESTMENT ADVISORY SERVICES, ADMINISTRATION AND SERVICE FEE AGREEMENTS AND EXPENSE OFFSET ARRANGEMENT |
Each Fund has an Investment Advisory Agreement with the Adviser for investment advice and certain management functions. The terms of the Investment Advisory Agreements provide the annual advisory fees based on the total average daily net assets for the Funds which are indicated as below. These fees are calculated daily and paid monthly.
Fund | Annual Management Fee | |||
| Third Avenue Value Fund | 0.90 | % | ||
| Third Avenue Small-Cap Value Fund | 0.90 | % | ||
| Third Avenue Real Estate Value Fund | 0.90 | % | ||
| Third Avenue International Value Fund | 1.25 | % | ||
Additionally, the Adviser pays certain expenses on behalf of the Funds which are partially reimbursed by the Funds, including service fees due to third parties, the compensation expense for the Funds’ Chief Compliance Officer and Associate Director of Compliance and other miscellaneous expenses.
69
Third Avenue Trust
Notes to Financial Statements (continued)
October 31, 2017
The following were amounts payable to the Adviser at October 31, 2017:
| Value Fund | Small-Cap Value Fund | Real Estate Value Fund | International Value Fund | |||||||||||||
| Advisory fees | $ | 888,935 | $ | 209,936 | $ | 1,492,748 | $ | 115,269 | ||||||||
| Administration fees | 5,418 | 1,385 | 9,097 | 635 | ||||||||||||
| Reimbursement for legal fees | — | — | 6,558 | — | ||||||||||||
| Reimbursement for shareholder servicing fees | 2,875 | 547 | 4,127 | 264 | ||||||||||||
| Reimbursement for Trustees’ and officers’ fees | 3,411 | 875 | 5,641 | 401 | ||||||||||||
| Total | $ | 900,639 | $ | 212,743 | $ | 1,518,171 | $ | 116,569 | ||||||||
Until March 1, 2018 (subject to renewal), whenever each Fund’s normal operating expenses, including the investment advisory fee and most other operating expenses, but excluding taxes, interest, brokerage commissions, acquired fund fees and expenses, and extraordinary items, exceeds the expense limitation based on each Fund’s average daily net assets, the Adviser has agreed to waive a portion of its advisory fees and/or reimburse each Fund in an amount equal to that excess. The expense limitations for each Fund are disclosed in its corresponding Financial Highlights. Below are the corresponding contingent liabilities to the Adviser in effect as of October 31, 2017:
Expenses Waived through Fiscal Periods ending | |||||||||||||
October 31, 2015 | October 31, 2016 | October 31, 2017 | |||||||||||
| Subject to Repayment until October 31, | |||||||||||||
Fund | Expiration Date | 2018 | 2019 | 2020 | |||||||||
| Third Avenue | |||||||||||||
| Small-Cap Value Fund | 2/28/2018 | $ | — | $ | 171,158 | $ | 151,026 | ||||||
| Third Avenue | |||||||||||||
| International Value Fund | 2/28/2018 | 547,840 | 538,118 | 445,535 | |||||||||
The waived fees and reimbursed expenses may be paid to the Adviser during the following three-year period after the end of the fiscal year in which an expense is waived or reimbursed by the Adviser, to the extent that the payment of such fees and expenses would not cause a Fund to exceed the expense limitations.
70
Third Avenue Trust
Notes to Financial Statements (continued)
October 31, 2017
The Trust has entered into an Administration Agreement with the Adviser pursuant to which the Adviser, as administrator, is responsible for providing various administrative services to the Trust. The Adviser has in turn entered into a Sub-Administration Agreement with BNY Mellon Investment Servicing (U.S.) Inc. (“BNY Mellon”) pursuant to which BNY Mellon provides certain of these administrative services on behalf of the Adviser. Each Fund pays the Adviser a fee calculated at an annual rate of 0.0055% of the average daily net assets of each respective Fund for such services. The Adviser pays BNY Mellon an annual sub-administration fee for sub-administration services provided to the Trust equal to $204,165 including $20,940 related to Third Avenue Focused Credit Fund.
Both the Trust and the Adviser have entered into agreements with financial intermediaries to provide recordkeeping, processing, shareholder communications and other services to customers of the intermediaries investing in the Funds and have agreed to compensate the intermediaries for providing those services. Certain of those services would be provided by the Funds if the shares of each customer were registered directly with the Funds’ transfer agent. Accordingly, the Funds have agreed to reimburse a portion of the intermediary fees paid by the Adviser pursuant to provisions adopted by the Board. Each Fund pays a portion of the intermediary fees attributable to shares of the Fund not exceeding the estimated expense the Fund would have paid its transfer agent had each customer’s shares been registered directly with the transfer agent instead of held through the intermediary accounts. The Adviser pays the remainder of the fees. The fees incurred by the Funds are reflected as shareholder servicing fees in the Statements of Operations. For the year ended October 31, 2017, such fees amounted to $1,145,001 for Third Avenue Value Fund, $317,999 for Third Avenue Small-Cap Value Fund, $2,005,998 for Third Avenue Real Estate Value Fund, and $171,000 for Third Avenue International Value Fund.
The Funds have an expense offset arrangement in connection with their custodian contract. Credits realized as a result of uninvested cash balances are used to reduce a portion of the Funds’ custodian expenses. The following amounts are the reduction of expenses due to this arrangement for the year ended October 31, 2017. These amounts are reflected as “Expenses reduced by custodian fee expense offset arrangement” in the Statements of Operations.
| Fund | Custody Credit | |||
| Third Avenue Value Fund | $ | 22,579 | ||
| Third Avenue Small-Cap Value Fund | 5,185 | |||
| Third Avenue Real Estate Value Fund | 39,831 | |||
| Third Avenue International Value Fund | 4,721 | |||
| 4. | RELATED PARTY TRANSACTIONS |
Investment in affiliates:
A summary of the Funds’ transactions in securities of affiliated issuers for the year ended October 31, 2017 is set forth below:
71
Investment in affiliates (continued)
Third Avenue Value Fund
Name of Issuer: | Shares/ Principal Amount Held at Oct. 31, 2016 | Gross Purchases and Additions | Gross Sales and Reductions | Shares/ Principal Amount Held at Oct. 31, 2017 | Value at Oct. 31, 2017 | Investment Income Nov. 1, 2016- Oct. 31, 2017 | Net Realized Gain/(Loss) | Net Change in Unrealized Appreciation (Depreciation) | ||||||||||||||||||||||||
| Home Products International, Inc. | 526,368 | — | — | 526,368 | $ | 1 | $ | — | $ | — | $ | 1 | ||||||||||||||||||||
| Home Products International, Inc., 2nd Lien, Convertible, 6.000% Payment-in-kind Interest, due 12/20/17 | 24,204,152 | 1,474,033 | 1 | 25,678,185 | 3 | — | — | 821,843 | 1 | — | 6,801,367 | |||||||||||||||||||||
| Home Products International, Inc., Preferred Stock, Convertible, 8.000% Cash or Payment in kind | — | 14,316,215 | 2 | — | 14,316,215 | 1 | — | — | 1 | |||||||||||||||||||||||
| Home Products International, Inc., 2nd Lien, 6.000%, due 12/20/22 | — | 11,361,970 | 2 | — | 11,361,970 | 7,013,744 | 1,883 | — | (18,012,251 | ) | ||||||||||||||||||||||
| Tejon Ranch Co. | 1,217,794 | 226,520 | 2 | 85,193 | 1,359,121 | 25,619,431 | — | 767,150 | (4,097,883 | ) | ||||||||||||||||||||||
| Total Affiliates | $ | 32,633,177 | $ | 823,726 | $ | 767,150 | $ | (15,308,765 | ) | |||||||||||||||||||||||
| 1 | PIK interest. |
| 2 | Amount increase due to corporate action. |
| 3 | Amount decrease due to corporate action. |
72
Investment in affiliates (continued)
Third Avenue Real Estate Value Fund
Name of Issuer: | Shares Held at Oct. 31, 2016 | Gross Purchases and Additions | Gross Sales and Reductions | Shares Held at Oct. 31, 2017 | Value at Oct. 31, 2017 | Investment Income Nov. 1, 2016- Oct. 31, 2017 | Net Realized Gain/(Loss) | Net Change in Unrealized Appreciation (Depreciation) | ||||||||||||||||||||||||
| Five Point Holdings, LLC, Class A* | 28,847,217 | — | 24,289,995 | 2 | 4,557,222 | $ | 57,490,575 | $ | — | $ | — | $ | — | |||||||||||||||||||
| Tenon, Ltd.* | 3,653,991 | — | 3,653,991 | 2 | — | — | — | — | — | |||||||||||||||||||||||
| Trinity Place Holdings, Inc. | 4,206,286 | 350,000 | 1 | — | 4,556,286 | 32,805,252 | — | — | $ | (10,452,461 | ) | |||||||||||||||||||||
| Total Affiliates | $ | 90,295,827 | $ | — | $ | — | $ | (10,452,461 | ) | |||||||||||||||||||||||
| * | As of October 31, 2017, no longer an affiliate. |
| 1 | Share increase due to corporate action. |
| 2 | Share decrease includes corporate action. |
73
Investment in affiliates (continued)
Third Avenue International Value Fund
Name of Issuer: | Shares Held at Oct. 31, 2016 | Gross Purchases and Additions | Gross Sales and Reductions | Shares Held atOct. 31, 2017 | Value at Oct. 31, 2017 | Investment Income Nov. 1, 2016- Oct. 31, 2017 | Net Realized Gain/(Loss) | Net Change in Unrealized Appreciation (Depreciation) | ||||||||||||||||||||||||
| Rubicon, Ltd. | 47,077,150 | — | 5,377,825 | 41,699,325 | $ | 5,421,611 | $ | — | $ | (2,888,518 | ) | $ | 1,409,675 | |||||||||||||||||||
| Tenon, Ltd.* | 4,277,651 | — | 4,277,651 | 1 | — | — | — | — | — | |||||||||||||||||||||||
| Total Affiliates | $ | 5,421,611 | $ | — | $ | (2,888,518 | ) | $ | 1,409,675 | |||||||||||||||||||||||
| * | As of October 31, 2017, no longer an affiliate. |
| 1 | Share decrease includes corporate action. |
74
Third Avenue Trust
Notes to Financial Statements (continued)
October 31, 2017
Certain employees of the Adviser serve as members of the board of directors of companies in which the Funds have investments. As a result of such service, for the year ended October 31, 2017, the Funds received the following board member fees from these companies that board members employed by the Adviser agreed to have paid directly to the benefit of the Funds. These fees are included in “Other Income” on the accompanying Statements of Operations.
Fund | Fees | |||
| Third Avenue Value Fund | $ | 38,061 | ||
| Third Avenue Real Estate Value Fund | 69,594 | |||
| 5. | DISTRIBUTION EXPENSES |
The Board has adopted a distribution plan (the “Plan”) pursuant to Rule 12b-1 under the Investment Company Act. The Plan provides that, as compensation for distribution and related services provided to Third Avenue Value Fund Investor Class (“TVFVX”), Third Avenue Small-Cap Value Fund Investor Class (“TVSVX”), Third Avenue Real Estate Value Fund Investor Class (“TVRVX”), and Third Avenue International Value Fund Investor Class (“TVIVX”), each Fund’s Investor Class accrues a fee calculated at the annual rate of 0.25% of average daily net assets of the class. Such fees may be paid to institutions that provide distribution services. The amount of fees paid during any period may be more or less than the cost of distribution and other services provided. Financial Industry Regulatory Authority rules impose a ceiling on the cumulative distribution fees paid. The Plan complies with those rules.
For the year ended October 31, 2017, distribution expenses were as follows:
| Fund | Fees | |||
| Third Avenue Value Fund | $ | 35,025 | ||
| Third Avenue Small-Cap Value Fund | 12,579 | |||
| Third Avenue Real Estate Value Fund | 610,753 | |||
| Third Avenue International Value Fund | 40,049 | |||
75
Third Avenue Trust
Notes to Financial Statements (continued)
October 31, 2017
| 6. | CAPITAL SHARE TRANSACTIONS |
Each Fund is authorized to issue an unlimited number of shares of each class of beneficial interest with $0.001 par value.
Transactions in capital stock of each class were as follows:
Third Avenue Value Fund
For the Year Ended October 31, 2017 | For the Year Ended October 31, 2016 | |||||||||||||||
| Investor Class | Investor Class | |||||||||||||||
| Shares | Amount | Shares | Amount | |||||||||||||
| Shares sold | 24,105 | $ | 1,285,800 | 33,327 | $ | 1,650,130 | ||||||||||
| Shares issued upon reinvestment of dividends and distributions | 20,789 | 1,055,644 | 39,489 | 1,943,257 | ||||||||||||
| Shares redeemed* | (100,220 | ) | (5,374,364 | ) | (324,983 | ) | (15,414,722 | ) | ||||||||
| Net decrease | (55,326 | ) | $ | (3,032,920 | ) | (252,167 | ) | $ | (11,821,335 | ) | ||||||
For the Year Ended October 31, 2017 | For the Year Ended October 31, 2016 | |||||||||||||||
| Institutional Class | Institutional Class | |||||||||||||||
| Shares | Amount | Shares | Amount | |||||||||||||
| Shares sold | 397,711 | $ | 21,304,257 | 320,705 | $ | 15,557,898 | ||||||||||
| Shares issued upon reinvestment of dividends and distributions | 1,725,485 | 87,602,868 | 2,324,998 | 114,389,913 | ||||||||||||
| Shares redeemed* | (4,233,547 | ) | (225,273,293 | ) | (10,829,026 | ) | (525,833,988 | ) | ||||||||
| Net decrease | (2,110,351 | ) | $ | (116,366,168 | ) | (8,183,323 | ) | $ | (395,886,177 | ) | ||||||
76
Third Avenue Trust
Notes to Financial Statements (continued)
October 31, 2017
Third Avenue Small-Cap Value Fund
For the Year Ended October 31, 2017 | For the Year Ended October 31, 2016 | |||||||||||||||
| Investor Class | Investor Class | |||||||||||||||
| Shares | Amount | Shares | Amount | |||||||||||||
| Shares sold | 34,661 | $ | 760,125 | 26,055 | $ | 521,081 | ||||||||||
| Shares issued upon reinvestment of dividends and distributions | 20,023 | 430,279 | 58,070 | 1,106,819 | ||||||||||||
| Shares redeemed* | (89,790 | ) | (1,969,457 | ) | (257,343 | ) | (4,821,200 | ) | ||||||||
| Net decrease | (35,106 | ) | $ | (779,053 | ) | (173,218 | ) | $ | (3,193,300 | ) | ||||||
For the Year Ended October 31, 2017 | For the Year Ended October 31, 2016 | |||||||||||||||
| Institutional Class | Institutional Class | |||||||||||||||
| Shares | Amount | Shares | Amount | |||||||||||||
| Shares sold | 264,897 | $ | 5,876,158 | 315,774 | $ | 6,136,673 | ||||||||||
| Shares issued upon reinvestment of dividends and distributions | 1,200,707 | 26,031,326 | 2,358,829 | 45,313,002 | ||||||||||||
| Shares redeemed* | (3,028,631 | ) | (67,137,897 | ) | (6,067,099 | ) | (116,865,673 | ) | ||||||||
| Net decrease | (1,563,027 | ) | $ | (35,230,413 | ) | (3,392,496 | ) | $ | (65,415,998 | ) | ||||||
Third Avenue Real Estate Value Fund
For the Year Ended October 31, 2017 | For the Year Ended October 31, 2016 | |||||||||||||||
| Investor Class | Investor Class | |||||||||||||||
| Shares | Amount | Shares | Amount | |||||||||||||
| Shares sold | 1,508,595 | $ | 48,704,952 | 2,334,996 | $ | 66,856,635 | ||||||||||
| Shares issued upon reinvestment of dividends and distributions | 114,545 | 3,447,813 | 738,578 | 21,352,283 | ||||||||||||
| Shares redeemed* | (2,439,557 | ) | (76,845,275 | ) | (8,903,248 | ) | (251,954,820 | ) | ||||||||
| Net decrease | (816,417 | ) | $ | (24,692,510 | ) | (5,829,674 | ) | $ | (163,745,902 | ) | ||||||
77
Third Avenue Trust
Notes to Financial Statements (continued)
October 31, 2017
For the Year Ended October 31, 2017 | For the Year Ended October 31, 2016 | |||||||||||||||
| Institutional Class | Institutional Class | |||||||||||||||
| Shares | Amount | Shares | Amount | |||||||||||||
| Shares sold | 7,496,990 | $ | 244,162,110 | 8,221,550 | $ | 237,805,212 | ||||||||||
| Shares issued upon reinvestment of dividends and distributions | 839,089 | 25,374,045 | 4,941,140 | 143,540,124 | ||||||||||||
| Shares redeemed* | (13,186,277 | ) | (416,184,065 | ) | (55,937,866 | ) | (1,581,249,979 | ) | ||||||||
| Net decrease | (4,850,198 | ) | $ | (146,647,910 | ) | (42,775,176 | ) | $ | (1,199,904,643 | ) | ||||||
Third Avenue International Value Fund
For the Year Ended October 31, 2017 | For the Year Ended October 31, 2016 | |||||||||||||||
| Investor Class | Investor Class | |||||||||||||||
| Shares | Amount | Shares | Amount | |||||||||||||
| Shares sold | 1,701,054 | $ | 27,392,515 | 29,295 | $ | 412,928 | ||||||||||
| Shares issued upon reinvestment of dividends and distributions | 15,204 | 238,546 | 5,394 | 75,354 | ||||||||||||
| Shares redeemed* | (1,594,823 | ) | (27,531,631 | ) | (139,142 | ) | (1,918,945 | ) | ||||||||
| Net increase/(decrease) | 121,435 | $ | 99,430 | (104,453 | ) | $ | (1,430,663 | ) | ||||||||
For the Year Ended October 31, 2017 | For the Year Ended October 31, 2016 | |||||||||||||||
| Institutional Class | Institutional Class | |||||||||||||||
| Shares | Amount | Shares | Amount | |||||||||||||
| Shares sold | 493,552 | $ | 8,279,655 | 291,318 | $ | 3,829,460 | ||||||||||
| Shares issued upon reinvestment of dividends and distributions | 340,538 | 5,332,830 | 182,457 | 2,543,459 | ||||||||||||
| Shares redeemed* | (2,139,573 | ) | (36,177,079 | ) | (5,300,685 | ) | (74,473,976 | ) | ||||||||
| Net decrease | (1,305,483 | ) | $ | (22,564,594 | ) | (4,826,910 | ) | $ | (68,101,057 | ) | ||||||
| * | Redemption fees are netted with redemption amounts. |
78
Third Avenue Trust
October 31, 2017
Third Avenue Value Fund, Third Avenue Small-Cap Value Fund, Third Avenue Real Estate Value Fund, and Third Avenue International Value Fund charge a redemption fee of 1%, 1%, 1%, and 2%, respectively, for shares redeemed or exchanged for shares of another series of the Trust within 60 days of the purchase date.
| 7. | COMMITMENTS AND CONTINGENCIES |
In the normal course of business, the Funds enter into contracts that contain a variety of representations and warranties and which provide general indemnifications. The Funds’ maximum exposure under these arrangements is unknown, as this would involve future claims that may be made against the Funds that have not yet occurred.
In 2016, the Adviser became party to various derivatives and securities class action lawsuits which have been settled during 2017. The settlement has not affected the Adviser’s ability to fully perform its investment advisory and other services to the Trust.
| 8. | RISKS RELATING TO CERTAIN INVESTMENTS |
Foreign securities and emerging markets risk:
Foreign securities from a particular country or region may be subject to currency fluctuations and controls, or adverse political, social, economic or other developments that are unique to that particular country or region. Therefore, the prices of foreign securities in particular countries or regions may, at times, move in a different direction from those of U.S. securities. From time to time, foreign capital markets may exhibit more volatility than those in the U.S., and the securities markets of emerging market countries can be extremely volatile. Emerging market countries can generally have economic structures that are less diverse and mature, and political systems that are less stable, than those of developed countries, and, as a result, the securities markets of emerging market countries can be more volatile than more developed markets may be.
High yield and distressed risk:
The Funds’ investments in high-yield debt securities (commonly known as “junk bonds”) and distressed securities may expose the Funds to greater risks than if the Funds only owned higher-grade securities. The value of high-yield, lower quality securities is affected by the creditworthiness of the issuers of the securities and by general economic and specific industry conditions. The prices of high yield securities can fall in response to negative news about the issuer or its industry, or the economy in general to a greater extent than those of higher rated securities. Issuers of high-yield securities are not as strong financially as those with higher credit ratings, so the securities are usually considered speculative investments. These issuers are more vulnerable to financial setbacks and recession than are more creditworthy issuers, which may impair their ability to make interest and principal payments. The Funds may also invest in distressed securities, which the Adviser considers to be issued by companies that are, or might be, involved in reorganizations or financial restructurings, either out of court or in bankruptcy. The Funds’ investments in distressed securities typically may involve the purchase of high-yield bonds, bank debt or other indebtedness of such companies.
79
Third Avenue Trust
October 31, 2017
Debt securities risk:
The market value of a debt security may decline due to general market conditions that are not specifically related to a particular company, such as real or perceived adverse economic conditions, changes in the outlook for corporate earnings, changes in interest or currency rates or adverse investor sentiment generally. The debt securities market can be susceptible to increases in volatility and decreases in liquidity. Increases in volatility and decreases in liquidity may be caused by a rise in interest rates (or the expectation of a rise in interest rates), which are at or near historic lows in the United States and in other countries. During periods of reduced market liquidity, a Fund may not be able to readily sell debt securities at prices at or near their perceived value. If a Fund needed to sell large blocks of debt securities to meet shareholder redemption requests or to raise cash, those sales could further reduce the prices of such securities.
Prices of bonds and other debt securities tend to move inversely with changes in interest rates. Typically, a rise in rates will adversely affect debt securities and, accordingly, will cause the value of a Fund’s investments in these securities to decline. When interest rates fall, the values of already-issued securities generally rise, although investments in new securities may be at lower yields. The prices of high-yield debt securities (“junk bonds”), unlike investment grade securities, may fluctuate unpredictably and not necessarily inversely with changes in interest rates.
The rates on floating debt instruments adjust periodically with changes in market interest rates. Although these instruments are generally less sensitive to interest rate changes than fixed rate instruments, the value of floating rate loans and other floating rate securities may decline if their interest rates do not rise as quickly, or as much, as general interest rates. An unexpected increase in Fund redemption requests, including requests from shareholders who may own a significant percentage of a Fund’s shares, which may be triggered by market turmoil or an increase in interest rates, could cause the Fund to sell its holdings at a loss or at undesirable prices and adversely affect the Fund’s share price and increase the Fund’s liquidity risk, Fund expenses and/or taxable distributions. Economic and other developments can adversely affect debt securities markets.
80
Third Avenue Trust
October 31, 2017
Market risk:
Prices of securities have historically fluctuated. The market value of a security may decline due to general market conditions that are not related to the particular company, such as real or perceived adverse economic conditions, changes in the outlook for corporate earnings, changes in interest or currency rates or adverse investor sentiment generally. A security’s market value also may decline because of factors that affect the particular company, such as management performance, financial leverage, and reduced demand for the company’s products or services, or factors that affect the company’s industry, such as labor shortages or increased production costs and competitive conditions within an industry. The value of the Funds will similarly fluctuate and you could lose money.
Liquidity risk:
Liquidity risk exists when particular investments are difficult to sell. The Funds may not be able to sell these investments at the best prices or at the value the Funds place on them. In such a market, the value of such investments and a Fund’s share price may fall dramatically, even during periods of declining interest rates. Investments that are illiquid or that trade in lower volumes may be more difficult to value. The market for high-yield debt securities (“junk bonds”) may be less liquid and therefore these securities may be harder to value or sell at an acceptable price, especially during times of market volatility or decline. Investments in foreign securities tend to have greater exposure to liquidity risk than U.S. securities. Liquidity can decline unpredictably in response to overall economic conditions or credit tightening. Investments in private debt instruments, restricted securities, and securities having substantial market and/or credit risk may involve greater liquidity risk.
Counterparty risk:
The Funds are exposed to counterparty risk, or the risk that an institution or other entity with which the Funds have unsettled or open transactions will default. The potential loss to the Funds could exceed the value of the financial assets recorded in the Funds’ financial statements. Financial assets, which potentially expose the Funds to counterparty risk, consist principally of cash due from counterparties and investments. The Adviser seeks to minimize the Funds’ counterparty risk by performing reviews of each counterparty and by minimizing concentration of counterparty risk by undertaking transactions with multiple customers and counterparties on recognized and reputable exchanges. Delivery of securities sold is only made once the Funds have received payment. Payment is made on a purchase once the securities have been delivered by the counterparty. The trade will fail if either party fails to meet its obligation.
At October 31, 2017, the Funds had counterparty concentration of credit risk primarily with JP Morgan Chase Bank, N.A.
81
Third Avenue Trust
October 31, 2017
The Funds are party to International Swaps and Derivatives Association, Inc. Master Agreements (“ISDA Master Agreements”) with select counterparties that govern transactions, over-the-counter derivatives and foreign exchange contracts entered into by the Funds and those counterparties. The ISDA Master Agreements contain provisions for general obligations, representations, agreements, collateral and events of default or termination. Events of termination include conditions that may entitle counterparties to elect to terminate early and cause settlement of all outstanding transactions under the applicable ISDA Master Agreement. Any election to terminate early could be material to the financial statements of the Funds.
The considerations and factors surrounding the settlement of certain purchases and sales made on a delayed-delivery basis are governed by Master Securities Forward Transaction Agreements (“Master Forward Agreements”) between the Funds and select counterparties. The Master Forward Agreements maintain provisions for, among other things, initiation and confirmation, payment and transfer, events of default, termination, and maintenance of collateral.
The counterparty risk associated with certain contracts may be reduced by master netting arrangements to the extent that if an event of default occurs, all amounts with the counterparty are terminated and settled on a net basis. The Funds’ overall exposure to counterparty risk with respect to transactions subject to master netting arrangements can change substantially within a short period, as it is affected by each transaction subject to the arrangement.
Collateral requirements:
For derivatives traded under an ISDA Master Agreement and/or Master Forward Agreement, the collateral requirements are typically calculated by netting the mark-to-market amount for each transaction under such agreement and comparing that amount to the value of any collateral currently pledged by the Fund and the counterparty.
Cash collateral that has been pledged to cover obligations of a Fund and cash collateral received from the counterparty, if any, is reported separately on the Statement of Assets and Liabilities as cash pledged as collateral and cash received as collateral, respectively. Non-cash collateral pledged by a Fund, if any, is noted in the Portfolio of Investments. Generally, the amount of collateral due from or to a party has to exceed a minimum transfer amount threshold (e.g. $500,000) before a transfer is required, which is determined at the close of business of a Fund and any additional required collateral is delivered to/pledged by a Fund on the next business day. Typically, a Fund and its counterparties are not permitted to sell, re-pledge or use the collateral they receive. To the extent amounts due to a Fund from its counterparties are not fully collateralized, contractually or otherwise, a Fund bears the risk of loss from counterparty non-performance. The Funds attempt to mitigate counterparty risk by entering into agreements only with counterparties that it believes have the financial resources to honor their obligations and by monitoring the financial stability of those counterparties.
82
Third Avenue Trust
Notes to Financial Statements (continued)
October 31, 2017
For financial reporting purposes, the Funds do not offset derivative assets and derivative liabilities that are subject to netting arrangements in the Statement of Assets and Liabilities.
Third Avenue Real Estate Value Fund
At October 31, 2017, the Fund’s derivative assets and liabilities (by type) on a gross basis are as follows:
| Assets | Liabilities | |||||||
| Derivative Financial Instruments: | ||||||||
| Options | $ | 26,250 | $ | — | ||||
| Total derivative assets and liabilties in the Statement of Assets and Liabilities | 26,250 | — | ||||||
| Derivatives not subject to a master netting agreement or similar agreement (“MNA”) | — | — | ||||||
| Total derivative assets and liabilities subject to a MNA | $ | 26,250 $ | — | |||||
The following tables present the Fund’s derivative assets by counterparty net of amounts available for offset under a MNA and net of the related collateral received by the Fund as of October 31, 2017:
| Counterparty | Amount of Assets Subject to a MNA by Counterparty | Derivatives Available for Offset1 | Non-cash Collateral Received2 | Cash Collateral Received2 | Net Amount of Derivative Assets3 | |||||||||||||||
| JP Morgan Chase Bank N.A. | $ | 26,250 | $ | — | $ | — | $ | — | $ | 26,250 | ||||||||||
| 1 | The amount of derviatives for offset is limited to the amount of assets and/or liabilites that are subject to a MNA. |
| 2 | Excess of collateral received from the individual counterparty may not be shown for financial reporting purposes. |
| 3 | Net amount represents the net amount receivable from the counterparty in the event of default. |
Loans and other direct debt instruments:
The Funds may invest in loans and other direct debt instruments issued by corporate borrowers. These loans represent amounts owed to lenders or lending syndicates (loans and loan participations) or to other parties. Direct debt instruments may involve a risk of loss in case of default or insolvency of the borrower and may offer less legal protection to the Fund in the event of fraud or misrepresentation. In addition, loan participations involve a risk of insolvency of the lending bank or other financial intermediary. The markets in loans are not regulated by federal securities laws or the SEC.
83
Third Avenue Trust
October 31, 2017
Cash concentration:
The Funds’ cash balances are held at a major regional U.S. bank. The Funds’ cash balances, which typically exceed Federal Deposit Insurance Corporation insurance coverage, subject the Funds to a concentration of credit risk. The Funds regularly monitor the credit ratings of this financial institution in order to mitigate the credit risk that exists with the balances in excess of insured amounts.
Off-balance sheet risk:
The Funds enter into derivatives which may represent off-balance sheet risk. Off-balance sheet risk exists when the maximum potential loss on a particular investment is greater than the value of such investment as reflected in the Statement of Assets and Liabilities.
Focused investing:
The Funds hold relatively concentrated portfolios that may contain fewer securities or industries than the portfolios of other mutual funds. Holding a relatively concentrated portfolio may increase the risk that the value of a Fund could decrease because of the poor performance of one or a few investments. Concentrated positions may be difficult to liquidate.
| 9. | FEDERAL INCOME TAXES |
The amount of dividends and distributions paid by the Funds from net investment income and net realized capital gains are determined in accordance with U.S. federal income tax law and regulations which may differ from U.S. GAAP. Such dividends and distributions are recorded by the Funds on the ex-dividend date. In order to present accumulated undistributed net investment income (loss), accumulated net realized gain (loss) on investments and foreign currency transactions and capital stock on the Statement of Assets and Liabilities that more closely represent their tax character, certain adjustments have been made. “Book/tax” differences are either temporary or permanent in nature. To the extent these differences are permanent in nature, such amounts are reclassified within the capital accounts based on their tax-basis treatment. Temporary differences do not require reclassification. Permanent differences are primarily due to reclassification of certain transactions involving foreign securities and currencies, investments in passive foreign investment companies, real estate investment trusts (“REITs”) and partnerships, the difference in the treatment of amortization of discount on certain debt instruments, certain derivative instruments and other book to tax adjustments. Net investment income (loss), net realized capital gain (loss) on investments and foreign currency transactions and net assets were not affected by these changes. For the year ended October 31, 2017, the adjustments were as follows:
84
Third Avenue Trust
Notes to Financial Statements (continued)
October 31, 2017
Increase/(Decrease) to Capital Stock | Increase/(Decrease) to Accumulated Net Investment Income (Loss) | Increase/(Decrease) to Undistributed Net Realized Gain (Loss) | ||||||||||
| Third Avenue Value Fund | $ | — | $ | 1,513,335 | $ | (1,513,335 | ) | |||||
| Third Avenue Small-Cap Value Fund | — | 3,541,023 | (3,541,023 | ) | ||||||||
| Third Avenue Real Estate Value Fund | — | 10,997,724 | (10,997,724 | ) | ||||||||
| Third Avenue International Value Fund | — | 4,513,958 | (4,513,958 | ) | ||||||||
The tax character of dividends and distributions paid during the year ended October 31, 2017 was as follows:
Ordinary Income | Net Capital Gains | Total | ||||||||||
| Third Avenue Value Fund(a) | $ | 18,872,167 | $ | 73,032,316 | $ | 91,904,483 | ||||||
| Third Avenue Small-Cap Value Fund(a) | 720,981 | 26,327,781 | 27,048,762 | |||||||||
| Third Avenue Real Estate Value Fund | 4,960,396 | 25,544,558 | 30,504,954 | |||||||||
| Third Avenue International Value Fund | 5,733,616 | — | 5,733,616 | |||||||||
The tax character of dividends and distributions paid during the fiscal year ended October 31, 2016 was as follows:
Ordinary Income | Net Capital Gains | Total | ||||||||||
| Third Avenue Value Fund | $ | 20,160,573 | $ | 100,389,540 | $ | 120,550,113 | ||||||
| Third Avenue Small-Cap Value Fund(a) | 800,048 | 46,700,145 | 47,500,193 | |||||||||
| Third Avenue Real Estate Value Fund(a) | 23,653,654 | 150,217,300 | 173,870,954 | |||||||||
| Third Avenue International Value Fund | 243,534 | 2,447,520 | 2,691,054 | |||||||||
At October 31, 2017 , the accumulated undistributed earnings on a tax basis were:
85
Third Avenue Trust
Notes to Financial Statements (continued)
October 31, 2017
Undistributed Ordinary Income | Net Capital Gains | |||||||
| Third Avenue Value Fund(a) | $ | 28,571,262 | $ | 51,132,387 | ||||
| Third Avenue Small-Cap Value Fund | — | 34,656,982 | ||||||
| Third Avenue Real Estate Value Fund | 21,798,955 | 95,239,248 | ||||||
| Third Avenue International Value Fund | 194,748 | — | ||||||
This differs from the amount shown on the Statement of Assets and Liabilities primarily due to cumulative timing differences.
(a) Includes short-term capital gains, which are taxed as ordinary income.
As of October 31, 2017, Third Avenue International Value Fund has a capital loss carryforward which should be available to offset certain capital gains generated in future years as follows:
Capital Losses incurred in a post-enactment year | Short-Term | Long-Term | Total | |||||||||
| Year ended October 31, 2016 | $ | — | $ | 6,463,286 | $ | 6,463,286 | ||||||
| Year ended October 31, 2017 | — | 5,591,393 | 5,591,393 | |||||||||
| Total | $ | — | $ | 12,054,679 | $ | 12,054,679 | ||||||
The Regulated Investment Company Modernization Act of 2010 generally allows capital losses incurred in a taxable year beginning after December 22, 2010 (“post-enactment”) to be carried forward for an unlimited period to the extent not utilized. Post-enactment capital loss carryforwards will retain their character as either short-term or long-term capital losses.
The U.S. federal income tax basis of the Funds’ investments and the total unrealized appreciation/(depreciation) as of October 31, 2017 were as follows:
86
Third Avenue Trust
Notes to Financial Statements (continued)
October 31, 2017
Tax Basis of Investments | Appreciation | (Depreciation) | Total Unrealized Appreciation/ (Depreciation) | Other Cost Basis Adjustments | Total Net Unrealized Appreciation/ (Depreciation) | |||||||||||||||||||
| Value Fund | $ | 856,025,653 | $ | 296,187,847 | $ | (63,899,329 | ) | $ | 232,288,518 | $ | (12,291 | ) | $ | 232,276,227 | ||||||||||
| Small-Cap Value Fund | $ | 194,759,111 | $ | 85,743,557 | $ | (2,344,252 | ) | $ | 83,399,305 | $ | (33,198 | ) | $ | 83,366,107 | ||||||||||
| Real Estate Value Fund | $ | 1,270,961,065 | $ | 654,136,834 | $ | (60,865,943 | ) | $ | 593,270,891 | $ | (22,349 | ) | $ | 593,248,542 | ||||||||||
| International Value Fund | $ | 127,712,060 | $ | 27,260,074 | $ | (35,539,965 | ) | $ | (8,279,891 | ) | $ | (173,229 | ) | $ | (8,453,120 | ) | ||||||||
The difference between book and tax basis total unrealized appreciation/(depreciation) is primarily attributable to deferred losses on wash sales, mark-to-market treatment of investments in certain passive foreign investment companies, investments in REITs and partnerships, differences in the treatment of amortization of discount on certain debt instruments, and other timing differences. Other cost basis adjustments are primarily attributable to unrealized appreciation/(depreciation) on receivables and payables on foreign currency, written options and other book to tax differences.
| 10. | SUBSEQUENT EVENTS |
Management has evaluated the impact of all subsequent events on the Funds through the date the financial statements were issued, and has determined that there were no events, except those listed below, that would require additional disclosure in the Funds’ financial statements.
Third Avenue has received Board approval and intends to seek shareholder approval to merge the Third Avenue International Value Fund into the Third Avenue Value Fund.
On December 20, 2017, the Funds made the following per share distribution to shareholders of record on December 19, 2017. This information would not be used in completing your income tax returns as it may not represent final tax information.
87
Third Avenue Trust
Notes to Financial Statements (continued)
October 31, 2017
Ordinary Income | Short-Term Capital Gains | Long-Term Capital Gains | Total Distributions | |||||||||||||
| Third Avenue Value Fund Investor Class | $ | 1.4504 | $ | 0.0528 | $ | 2.5621 | $ | 4.0653 | ||||||||
| Third Avenue Value Fund Institutional Class | 1.6134 | 0.0528 | 2.5621 | 4.2283 | ||||||||||||
| Third Avenue Small-Cap Value Fund Investor Class | — | — | 2.8310 | 2.8310 | ||||||||||||
Third Avenue Small-Cap Value Fund Institutional Class | — | — | 2.8310 | 2.8310 | ||||||||||||
| Third Avenue Real Estate Value Fund Investor Class | 0.2742 | 0.0527 | 1.7225 | 2.0494 | ||||||||||||
| Third Avenue Real Estate Value Fund Institutional Class | 0.3628 | 0.0527 | 1.7225 | 2.1380 | ||||||||||||
| Third Avenue International Value Fund Investor Class | 0.0203 | — | — | 0.0203 | ||||||||||||
| Third Avenue International Value Fund Institutional Class | 0.1568 | — | — | 0.1568 | ||||||||||||
88
Third Avenue Trust
Report of Independent Registered Public Accounting Firm
To the Board of Trustees of the Third Avenue Trust and Shareholders of Third Avenue Value Fund, Third Avenue Small-Cap Value Fund, Third Avenue Real Estate Value Fund, and Third Avenue International Value Fund
In our opinion, the accompanying statements of assets and liabilities, including the portfolios of investments, and the related statements of operations and of changes in net assets and the financial highlights present fairly, in all material respects, the financial positions of Third Avenue Value Fund, Third Avenue Small-Cap Value Fund, Third Avenue Real Estate Value Fund and Third Avenue International Value Fund (hereafter referred to as the “Funds”) as of October 31, 2017, the results of each of their operations for the year then ended, the changes in each of their net assets for each of the two years in the period then ended and the financial highlights for each of the five years in the period then ended, in conformity with accounting principles generally accepted in the United States of America. These financial statements and financial highlights (hereafter referred to as “financial statements”) are the responsibility of the Funds’ management. Our responsibility is to express an opinion on these financial statements based on our audits. We conducted our audits of these financial statements in accordance with the standards of the Public Company Accounting Oversight Board (United States). Those standards require that we plan and perform the audit to obtain reasonable assurance about whether the financial statements are free of material misstatement. An audit includes examining, on a test basis, evidence supporting the amounts and disclosures in the financial statements, assessing the accounting principles used and significant estimates made by management, and evaluating the overall financial statement presentation. We believe that our audits, which included confirmation of securities as of October 31, 2017 by correspondence with the custodian, issuers and transfer agents, provide a reasonable basis for our opinion.
/s/PricewaterhouseCoopers LLP
New York, New York
December 22, 2017
89
Third Avenue Trust
Annual Renewal of Investment Advisory Agreements
October 31, 2017 (Unaudited)
At a meeting of the Board of Trustees of the Trust (the “Board”) held on June 13 and 14, 2017, the Trustees, all of whom are not “interested persons” (as the term is defined in the Investment Company Act) of the Trust (the “Independent Trustees”), approved the renewal of each Fund’s Investment Advisory Agreement (collectively, the “Agreements”). Prior to voting on the Agreements, the Independent Trustees met separately with their independent legal counsel for a discussion of the Adviser’s presentation and materials referred to below.
In advance of the meeting, the Trustees, through their independent legal counsel, requested extensive materials, and the Adviser provided them, to assist the Board in considering the renewal of the Agreements. The Trustees also constituted an ad hoc committee to work with representatives of the Adviser to evaluate the adequacy and extent of the information to be provided for their consideration. This committee communicated frequently with the Adviser’s representatives and independent legal counsel. The committee and independent legal counsel to the Independent Trustees also met with representatives of Affiliated Managers Group (“AMG”), the majority owner of the Adviser. At its meeting held on June 13 and 14, 2017, the Board discussed the materials with the Adviser and AMG. During their consideration, the Independent Trustees requested and received additional information about the effect on the Adviser’s revenue projections of the trend in net asset outflows from the Funds and of recent and anticipated personnel changes. In considering the Agreements, the Trustees did not identify any single overriding factor and instead considered all factors collectively. As a part of their decision-making process, the Trustees considered information derived from their service on the Trust’s Board and their familiarity with the Adviser and its investment process. Among other things, they noted that the Adviser has managed each Fund since its inception, and expressed their belief that a long-term relationship with a capable, conscientious adviser is in the best interest of the Funds. The following is a summary of the discussions and conclusions regarding the material factors that formed the basis for the Board’s approval.
Factors Considered
| A. | Financial Condition of the Adviser; Advisory Fees; Profitability |
The Trustees received a presentation from representatives of the Adviser, including a report prepared by Morningstar, Inc. (“Morningstar”), and reviewed, among other things:
| 1. | the financial condition of the Adviser to determine that the Adviser is solvent and currently is sufficiently well-capitalized to perform its ongoing responsibilities to the Funds, recognizing the need for continued scrutiny, at least in the short-term, on the ongoing potential for a continued decrease in assets under management and recent and anticipated personnel changes; |
90
Third Avenue Trust
Annual Renewal of Investment Advisory Agreements (continued)
October 31, 2017 (Unaudited)
| 2. | the information sources and methodology used in the selection of funds included in the comparison universe and the competitive fund group used in comparative analyses of each Fund’s advisory fees and expense ratios and in analyzing the Fund’s performance, noting the enhancements in such process made by Morningstar; |
| 3. | each Fund’s advisory fee and total expenses as compared to those of the comparison universe and competitive fund group, focusing, in part, on the total expense ratio of each Fund and the funds in its respective comparison universe and competitive fund group; |
| 4. | performance analyses of each Fund and funds in its comparison universe and competitive fund group; |
| 5. | a comparison of fees paid to the Adviser versus fees paid by similar funds advised by the Adviser, as well as any similar separate advisory accounts; |
| 6. | information presented in respect of economies of scale, noting that all of the Funds had suffered significant redemptions since late 2015; that the Adviser has agreed to waive its fees and/or reimburse expenses to maintain an expense limitation for each Fund; and the resources that the Adviser continues to dedicate to its business even while Fund assets generally have declined in recent years; |
| 7. | the profitability to the Adviser resulting from each Agreement (including the fall-out benefits noted below), reviewing the dollar amount of expenses allocated and revenue received by the Adviser and the method used to determine such expenses and corresponding profit; and |
| 8. | fallout benefits, including (i) fees for providing administrative services and (ii) research services received by the Adviser in connection with executing Fund Portfolio transactions. |
| B. | Description of Personnel and Services Provided by the Adviser |
The Trustees reviewed with representatives of the Adviser, and considered:
| 1. | the nature, extent and quality of services rendered to the Funds, including by the Adviser’s investment, senior management and operational personnel (and efforts being made to retain key staff during a period of net redemptions, as well as enhancements to the Adviser’s risk management capabilities), and the oversight of day-to-day operations of the Funds provided by the Adviser; |
| 2. | the Adviser’s research and portfolio management capabilities, particularly the intensive research undertaken in connection with the Adviser’s deep value philosophy; |
| 3. | the value added over time through the Adviser’s active management style that includes participation in corporate restructurings and other activist investments; and |
91
Third Avenue Trust
Annual Renewal of Investment Advisory Agreements (continued)
October 31, 2017 (Unaudited)
| 4. | the Adviser’s experience operating funds registered under the 1940 Act and its dedication to providing high quality services to the Funds in the long term. |
| C. | Investment Performance of the Funds and Adviser |
| 1. | The Trustees reviewed total return information for each Fund versus the comparison universe and competitive funds group for various periods. The Trustees also reviewed information pertaining to the Funds’ risk adjusted performance and risk measures. |
Conclusions
The Trustees concluded that the nature, extent and quality of the services provided by the Adviser currently are adequate and appropriate. The Trustees considered and evaluated each Fund’s performance over various time periods in light of market conditions, the Adviser’s investing style and circumstances particular to that Fund. While the Trustees expressed concern about the long-term performance for certain Funds, they understood the relevant circumstances and noted the Funds’ performance generally had improved recently. They also considered the advisory fee and expense ratio of each Fund and evaluated the comparisons to those of funds in the comparable universe and competitive fund group and the performance analysis, as discussed in the Adviser’s presentation.
The Trustees discussed the Adviser’s profitability, and it was noted that, among other things, the profitability percentage for each Fund was below the maximum profitability levels found in relevant court cases upholding board approval of particular advisory agreements. The Trustees also considered the advisory fees charged for similar funds advised by the Adviser in the past, as well as any separate advisory accounts, and reviewed the nature of the services provided and differences, from the Adviser’s perspective, in managing the Funds as compared to advisory services provided to other advised funds and any separate accounts. As in the past, the Trustees recognized that differences in fees paid were consistent with the differences in services provided by the Adviser.
The Trustees considered whether material economies of scale are present and, if present, are shared with the Funds and considered each Fund’s fee structure, and the resources that the Adviser dedicates to its investment advisory process to the benefit of the Funds. The Trustees concluded that, because of declining overall assets in each Fund, material economies of scale were not present to be shared with the Funds.
The Trustees concluded, in light of considerations noted above, to approve the Agreements, upon the understanding that the Adviser would provide to the Board, by July 31, 2017, information about its current and projected financial condition and governance structure, in form and substance satisfactory to the Board in the exercise of its business judgment. On July 25, 2017, the Adviser satisfied this requirement.
92
Third Avenue Trust
Management of the Trust
(Unaudited)
Information pertaining to the Trustees and officers of the Trust is set forth below. The fund complex includes five portfolios in the Third Avenue Trust and one portfolio in the Third Avenue Variable Series Trust. The Statement of Additional Information (SAI) includes additional information about the Trustees and is available upon request, without charge, by calling (800) 443-1021.
Chairman Emeritus
Name, Date of Birth & Address | Term of Office and Length of Time Served* | Position(s) Held With Registrant | Principal Occupation(s) During Past 5 Years | Other Directorships Held by Trustee | ||||
Martin J. Whitman** DOB: September 1924 622 Third Avenue New York, NY 10017 | Trustee from 7/99 to 12/16 and Chairman Emeritus (12/16 to Present) | Chairman Emeritus | Chairman (3/90 to 12/16) (5 funds) of Third Avenue Trust; Chairman (7/99 to 12/16) of Third Avenue Variable Series Trust; CEO, President and Director (10/74 to 12/16) of Martin J. Whitman & Co., Inc. (formerly M.J. Whitman & Co., Inc.) (private investment company); Chartered Financial Analyst; Founder of Third Avenue Holdings Delaware LLC. | N/A |
93
Third Avenue Trust
Management of the Trust (continued)
(Unaudited)
Independent Trustees
Correspondence intended for any Independent Trustee may be sent to: Third Avenue Management LLC, 622 Third Avenue, 32nd Floor, New York, NY 10017.
Name & Date of Birth | Term of Office and Length of Time Served* | Position(s) Held With Registrant | Principal Occupation(s) During Past 5 Years | Other Directorships Held by Trustee | ||||
William E. Chapman, II DOB: September 1941 | Trustee since 8/02 | Trustee | President and Owner (1998 to Present) of Longboat Retirement Planning Solutions (consulting firm). | Trustee, The AMG Funds (1999 to 2016) (66 portfolios); Director of Harding, Loevner Funds, Inc. (2008 to 2017) (9 portfolios); Trustee (5/02 to 6/13) of Bowdoin College; Director, The Mutual Fund Directors Forum (2010 to Present); Director, Sarasota Memorial Healthcare Foundation (2011 to Present) and Trustee of Third Avenue Variable Series Trust (8/02 to Present). | ||||
Lucinda Franks DOB: July 1946 | Trustee since 2/98 | Trustee | Journalist and author (1969 to Present). | Trustee of Third Avenue Variable Series Trust (7/99 to Present). | ||||
Edward J. Kaier DOB: September 1945 | Trustee since 8/02 | Trustee | Partner (7/07 to Present) at Teeters Harvey Marrone & Kaier LLP (law firm). | Trustee, The AMG Funds (1999 to Present) (66 portfolios); and Trustee of Third Avenue Variable Series Trust (8/02 to Present). |
94
Third Avenue Trust
Management of the Trust (continued)
(Unaudited)
Independent Trustees
Name & Date of Birth | Term of Office and Length of Time Served* | Position(s) Held With Registrant | Principal Occupation(s) During Past 5 Years | Other Directorships Held by Trustee | ||||
Eric Rakowski DOB: June 1958 | Trustee since 8/02 | Trustee | Professor (1990 to Present) at University of California at Berkeley School of Law. | Trustee, The AMG Funds (1999 to Present) (66 portfolios); Director of Harding, Loevner Funds, Inc. (2008 to Present) (9 portfolios); Trustee, AMG Pantheon Fund (2014 to Present) and Trustee of Third Avenue Variable Series Trust (8/02 to Present). | ||||
Patrick Reinkemeyer DOB: March 1965 | Trustee since 1/15 | Trustee | President, SilverPepper LLC (2011 to Present); Executive Officer, Morningstar Inc.; President, Morningstar Associates LLC. (1996 to 2010). | Trustee of Third Avenue Variable Series Trust (1/15 to Present). | ||||
Martin Shubik DOB: March 1926 | Advisory Trustee since 3/16*** | Advisory Trustee | Seymour H. Knox Professor of Mathematical Institutional Economics, Yale University; Emeritus (2007 to Present). | Trustee or Director of Third Avenue Variable Series Trust or its predecessor (7/99 to 3/16). | ||||
Charles C. Walden DOB: July 1944 | Trustee since 5/96; Lead Independent Trustee (2007 to 12/16); Chairman (12/16 to Present). | Trustee**** | President and Owner (2006 to Present) of Sound Capital Associates, LLC (consulting firm); Chartered Financial Analyst. | Director, Special Opportunities Fund, Inc. (2009 to Present) and Trustee or Director of Third Avenue Variable Series Trust or its predecessor (7/99 to Present). |
| * | Each Trustee serves until his or her successor is duly elected and qualified. |
| ** | Effective December 12, 2016, Martin Whitman resigned as Chairman and Trustee and is now Chairman Emeritus. |
95
Third Avenue Trust
Management of the Trust (continued)
(Unaudited)
| *** | Mr. Shubik was a Trustee of the Trust from July 1999 untill March 2016 and now acts in an Advisory Trustee capacity. |
| **** | At a Board meeting held on December 15, 2016, Mr. Walden was appointed Chairman of the Board. |
Principal Trust Officers
Name, Date of Birth & Address | Position(s) Held With Registrant | Principal Occupation(s) During Past 5 Years | Other Directorships Held by Officer | |||
Michael A. Buono DOB: May 1967 622 Third Avenue New York, NY 10017 | Treasurer and CFO | Treasurer and Chief Financial Officer (CFO) (7/17 to Present) (5 funds) of Third Avenue Trust; Treasurer and CFO (7/17 to Present) of Third Avenue Variable Series Trust; Controller (5/06 to 6/17) (5 funds) of Third Avenue Trust, Third Avenue Variable Series Trust, Third Avenue Management LLC and M.J. Whitman LLC and subsidiaries. | N/A | |||
W. James Hall III DOB: July 1964 622 Third Avenue New York, NY 10017 | President, General Counsel and Secretary | General Counsel and Secretary (6/00 to Present) (5 funds) and President (12/15 to Present) (5 funds) of Third Avenue Trust; General Counsel and Secretary (9/00 to Present) and President (12/15 to Present) of Third Avenue Variable Series Trust; General Counsel and Secretary (9/00 to Present) of EQSF Advisers, Inc., and its succesor, Third Avenue Management LLC; General Counsel and Secretary (6/00 to Present) of Third Avenue Holdings Delaware, LLC; General Counsel and Secretary (5/00 to Present) of M.J. Whitman, Inc. and its succesor M.J. Whitman LLC; General Counsel and Secretary of certain other funds advised by Third Avenue Management LLC (7/02 to Present). | N/A | |||
Joseph J. Reardon DOB: April 1960 622 Third Avenue New York, NY 10017 | Chief Compliance Officer | Chief Compliance Officer (4/05 to Present) (5 funds) of Third Avenue Trust, Third Avenue Variable Series Trust and Third Avenue Management LLC. | N/A |
96
Third Avenue Trust
Schedule of Shareholder Expenses
(Unaudited)
As a shareholder of a Fund, you incur two types of costs: (1) transaction costs, such as redemption fees; and (2) ongoing costs, including management fees, shareholder servicing fees, distribution fees (if applicable) and other Fund expenses. This example is intended to help you understand your ongoing costs (in dollars) of investing in the Funds and to compare these costs with the ongoing costs of investing in other mutual funds.
The example is based on an investment of $1,000 invested at the beginning of the period, May 1, 2017 and held for the six month period ended October 31, 2017.
Actual Expenses
For each Class of each Fund in the table below, the first line provides information about actual account values and actual expenses. You may use the information in this line, together with the amount you invested, to estimate the expenses that you paid over the period. Simply divide your account value by $1,000 (for example, an $8,600 account value divided by $1,000 = 8.6), then multiply the result by the number in the first line under the heading entitled “Expenses Paid During the Period” to estimate the expenses you paid on your account during this period.
Hypothetical Example for Comparison Purposes
The second line of each Class in the table below provides information about hypothetical account values and hypothetical expenses based on the Class’ actual expense ratio and an assumed rate of return of 5% per year before expenses, which is not the Class’ actual return. The hypothetical account values and expenses may not be used to estimate the actual ending account balance or expenses you paid for the period. You may use this information to compare the ongoing costs of investing in the Class of the Fund and other funds. To do so, compare this 5% hypothetical example with the 5% hypothetical examples that appear in the shareholder reports of the other funds.
Please note that the expenses shown in the table are meant to highlight your ongoing costs only and do not reflect any transactional costs, such as redemption fees. Therefore, the second line of each Class in the table is useful in comparing ongoing costs only, and will not help you determine the relative total costs of owning different funds. In addition, if these transactional costs were included, your costs would have been higher. The example also assumes all dividends and distributions have been reinvested.
97
Third Avenue Trust
Schedule of Shareholder Expenses (continued)
(Unaudited)
Beginning Account Value May 1, 2017 | Ending Account Value October 31, 2017 | Expenses Paid During the Period May 1, 2017 to October 31, 2017* | Annualized Expense Ratio | |||||||||||||
| Third Avenue Value Fund | ||||||||||||||||
| Investor Class | ||||||||||||||||
| Actual | $ | 1,000 | $ | 1,046.40 | $ | 7.12 | 1.38 | % | ||||||||
| Hypothetical | $ | 1,000 | $ | 1,018.25 | $ | 7.02 | 1.38 | % | ||||||||
| Institutional Class | ||||||||||||||||
| Actual | $ | 1,000 | $ | 1,047.70 | $ | 5.78 | 1.12 | % | ||||||||
| Hypothetical | $ | 1,000 | $ | 1,019.56 | $ | 5.70 | 1.12 | % | ||||||||
| Third Avenue Small-Cap Value Fund | ||||||||||||||||
| Investor Class | ||||||||||||||||
| Actual | $ | 1,000 | $ | 1,055.30 | $ | 7.25 | 1.40 | % | ||||||||
| Hypothetical | $ | 1,000 | $ | 1,018.15 | $ | 7.12 | 1.40 | % | ||||||||
| Institutional Class | ||||||||||||||||
| Actual | $ | 1,000 | $ | 1,056.50 | $ | 5.96 | 1.15 | % | ||||||||
| Hypothetical | $ | 1,000 | $ | 1,019.41 | $ | 5.85 | 1.15 | % | ||||||||
| Third Avenue Real Estate Value Fund | ||||||||||||||||
| Investor Class | ||||||||||||||||
| Actual | $ | 1,000 | $ | 1,048.80 | $ | 6.92 | 1.34 | % | ||||||||
| Hypothetical | $ | 1,000 | $ | 1,018.45 | $ | 6.82 | 1.34 | % | ||||||||
| Institutional Class | ||||||||||||||||
| Actual | $ | 1,000 | $ | 1,050.10 | $ | 5.63 | 1.09 | % | ||||||||
| Hypothetical | $ | 1,000 | $ | 1,019.71 | $ | 5.55 | 1.09 | % | ||||||||
| Third Avenue International Value Fund | ||||||||||||||||
| Investor Class | ||||||||||||||||
| Actual | $ | 1,000 | $ | 1,105.60 | $ | 8.76 | 1.65 | % | ||||||||
| Hypothetical | $ | 1,000 | $ | 1,016.89 | $ | 8.39 | 1.65 | % | ||||||||
| Institutional Class | ||||||||||||||||
| Actual | $ | 1,000 | $ | 1,106.80 | $ | 7.43 | 1.40 | % | ||||||||
| Hypothetical | $ | 1,000 | $ | 1,018.15 | $ | 7.12 | 1.40 | % | ||||||||
| * | Expenses (net of fee waivers and expense offset arrangement) are equal to the Class’ annualized expense ratio, multiplied by the average account value over the period, multiplied by the number of days in the most recent fiscal half-year (184) divided by 365. |
98
Third Avenue Trust
Federal Tax Status of Dividends and Distributions
(Unaudited)
The following information represents the tax status of dividends and distributions paid by the Funds during the fiscal year ended October 31, 2017. This information is presented to meet regulatory requirements, and no current action on your part is required. The information reported below will differ from the actual amounts taxable to shareholders for the calendar year ending December 31, 2017.
Information necessary to complete your income tax returns for the calendar year ending December 31, 2017 will be issued by the Funds in the early part of 2018.
The Funds are required to make certain designations including to designate the portion of any distributions made to shareholders during their fiscal year beginning on November 1, 2016 and ending on October 31, 2017 that were from capital gains. Depending upon your instructions, distributions from the Funds were either paid to you in cash or reinvested into your account.
The following is the breakdown of dividends and distributions paid by each Fund during fiscal year ended October 31, 2017:
Third Avenue Value Fund | Third Avenue Small-Cap Value Fund | |||||||||||||||
Institutional Class | Investor Class | Institutional Class | Investor Class | |||||||||||||
| Ordinary Income | $ | 0.3809 | $ | 0.2324 | $ | 0.0613 | $ | — | ||||||||
| Short-Term | ||||||||||||||||
| Capital Gains Distributions (treated as ordinary income) | 0.4723 | 0.4723 | — | — | ||||||||||||
| Long-Term | ||||||||||||||||
| Capital Gains Distributions | 3.2948 | 3.2948 | 1.9233 | 1.9233 | ||||||||||||
| Total | ||||||||||||||||
| Dividends and Distributions | $ | 4.1480 | $ | 3.9995 | $ | 1.9846 | $ | 1.9233 | ||||||||
99
Third Avenue Trust
Federal Tax Status of Dividends and Distributions (continued)
(Unaudited)
Third Avenue Real Estate Value Fund | Third Avenue International Value Fund | |||||||||||||||
Institutional Class | Investor Class | Institutional Class | Investor Class | |||||||||||||
| Ordinary Income | $ | 0.0977 | $ | 0.0061 | $ | 0.7370 | $ | 0.7050 | ||||||||
| Short-Term | ||||||||||||||||
| Capital Gains Distributions (treated as ordinary income) | — | — | — | — | ||||||||||||
| Long-Term | ||||||||||||||||
| Capital Gains Distributions | 0.4397 | 0.4397 | — | — | ||||||||||||
| Total | ||||||||||||||||
| Dividends and Distributions | $ | 0.5374 | $ | 0.4458 | $ | 0.7370 | $ | 0.7050 | ||||||||
With respect to ordinary dividends paid by the Funds during their fiscal year ended October 31, 2017, the Funds designate the maximum allowable amounts under section 854 of the Internal Revenue Code. Such designated amounts shall not be less than the following with respect to ordinary dividends:
Qualified Dividend Income for Individuals | Dividends Received Deduction for Corporations | |||||||
| Third Avenue Value Fund | $ | 18,716,487 | 69.94 | % | ||||
| Third Avenue Small-Cap Value Fund | 632,757 | 76.97 | % | |||||
| Third Avenue Real Estate Value Fund | 4,960,396 | 65.65 | % | |||||
| Third Avenue International Value Fund | 5,805,937 | 0.68 | % | |||||
The following Fund intends to elect to pass through to shareholders the income taxes paid to foreign countries which may be eligible for the foreign tax credit in accordance with Section 853 of the Internal Revenue Code. Gross foreign source income and foreign tax expense for the year ended October 31, 2017 are as follows:
Gross Foreign Source Income | Foreign Tax Pass Through | |||||||
| Third Avenue International Value Fund | $ | 7,377,495 | $ | 139,894 | ||||
100
BOARD OF TRUSTEES
William E. Chapman, II
Lucinda Franks
Edward J. Kaier
Eric Rakowski
Patrick Reinkemeyer
Charles C. Walden — Chairman
Martin Shubik — Advisory Trustee
Martin J. Whitman — Chairman Emeritus
OFFICERS
W. James Hall III — President, General Counsel, Secretary
Michael A. Buono — Chief Financial Officer, Treasurer
Joseph J. Reardon — Chief Compliance Officer
TRANSFER AGENT
BNY Mellon Investment Servicing (U.S.) Inc.
P.O. Box 9802
Providence, RI 02940-8002
610-239-4600
800-443-1021 (toll-free)
INVESTMENT ADVISER
Third Avenue Management LLC
622 Third Avenue
New York, NY 10017
INDEPENDENT REGISTERED PUBLIC ACCOUNTING FIRM
PricewaterhouseCoopers LLP
300 Madison Avenue
New York, NY 10017
CUSTODIAN
JPMorgan Chase Bank, N.A.
383 Madison Avenue, 4th Floor
New York, NY 10179
 | Third Avenue offers multiple investment solutions with unique exposures and return profiles. Our core strategies are currently available through ’40Act mutual funds and customized accounts. If you would like further information, please contact a Relationship Manager at: |
www.thirdave.com  /third-ave-management /third-ave-management | 622 Third Avenue New York, NY 10017 |  212.906.1160 212.906.1160 clientservice@thirdave.com clientservice@thirdave.com |
 |  |
| Item 2. | Code of Ethics. |
At October 31, 2017, the Trust had a code of ethics (the “Code of Ethics”) that applies to its principal executive officer and principal financial officer. This Code of Ethics is attached as Exhibit (a) (1) hereto.
| Item 3. | Audit Committee Financial Expert. |
The Trust’s Board of Trustees has determined that Messrs. William Chapman and Charles Walden, members of the Audit Committee of the Board, are “audit committee financial experts” (“ACFE”) as defined by the Securities and Exchange Commission (“SEC”) and has designated Mr. Chapman as the Committee’s ACFE. Each of Messrs. Chapman and Walden are “independent” as defined by the SEC for purposes of ACFE determinations. Under applicable securities laws, a person who is determined to be an ACFE will not be deemed an “expert” for any purpose, including without limitation for the purposes of Section 11 of the Securities Act of 1933, as a result of being designated or identified as an ACFE. The designation or identification of a person as an ACFE does not impose on such person any duties, obligations, or liabilities that are greater than the duties, obligations, and liabilities imposed on such person as a member of the Audit Committee and Board of Trustees in the absence of such designation or identification.
| Item 4. | Principal Accountant Fees and Services. |
(a) Audit Fees. The aggregate fees billed for each of the last two fiscal years for professional services rendered by the Trust’s principal accountant for the audit of the Funds’ annual financial statements or services that are normally provided by the accountant in connection with statutory and regulatory filings or engagements for those fiscal years were $257,000, including out of pocket expenses of approximately $5,000, for the fiscal year ended October 31, 2017 and $242,000, including out of pocket expenses of approximately $4,000, for the fiscal year ended October 31, 2016.
(b) Audit-Related Fees. There were no fees billed in each of the last two fiscal years for assurance and related services by the Trust’s principal accountant that are reasonably related to the performance of the audit of the Funds’ financial statements and are not reported above in Item 4(a). There were no audit-related services provided to the Funds’ investment adviser or any entity controlling, controlled by, or under common control with the Funds’ investment adviser that provides ongoing services to the Trust (“Service Affiliates”) during each of the last two years that were required to be pre-approved by the Trust’s Audit Committee.
(c) Tax Fees. The aggregate fees billed to the Funds in each of the last two fiscal years for professional services rendered by the Trust’s principal accountant for tax compliance, tax advice and tax planning were $173,000 for the fiscal year ended October 31, 2017 and $266,000 for the fiscal year ended October 31, 2016. These services related to the preparation of tax returns and the review of tax-related issues. There were no tax services provided to Service Affiliates during each of the last two fiscal years that were required to be pre-approved by the Trust’s Audit Committee.
(d) All Other Fees. There were no fees billed to the Funds in each of the last two fiscal years for products and services provided by the Trust’s principal accountant, other than the services reported above in Items 4(a) through (c). There were no other services provided to Service Affiliates during each of the last two fiscal years that were required to be pre-approved by the Trust’s Audit Committee.
(e) Audit Committee Pre-Approval Policies and Procedures.
(i) The Audit Committee pre-approves the Trust’s accountant’s engagement for audit and non-audit services to the Trust and certain non-audit services to the Service Affiliates on a case-by-case basis. Pre-approval considerations include whether the proposed services are compatible with maintaining the accountant’s independence.
(ii) There were no services provided to the Trust or Service Affiliates during the last two fiscal years for which the pre-approval requirement was waived pursuant to paragraph (c)(7)(i)(C) of Rule 2-01 of Regulation S-X.
(f) Not Applicable.
(g) The aggregate non-audit fees billed by the Trust’s accountant for services rendered to the Funds and Service Affiliates for each of the last two fiscal years were $173,000 for the fiscal year ended October 31, 2017 and $266,000 for the fiscal year ended October 31, 2016.
(h) The Audit Committee has considered whether the provision of non-audit services to the Service Affiliates that were not pre-approved pursuant to paragraph (c)(7)(ii) of Rule 2-01 of Regulation S-X is compatible with maintaining the independence of the Trust’s accountant.
| Item 5. | Audit Committee of Listed Registrants. |
Not applicable.
| Item 6. | Schedule of Investments. |
Not applicable.
| Item 7. | Disclosure of Proxy Voting Policies and Procedures for Closed-End Management Investment Companies. |
Not applicable.
| Item 8. | Portfolio Managers of Closed-End Management Investment Companies. |
Not applicable.
| Item 9. | Purchase of Equity Securities by Closed-End Management Investment Company and Affiliated Purchasers. |
Not applicable.
| Item 10. | Submission of Matters to a Vote of Security Holders. |
Not applicable.
| Item 11. | Controls and Procedures. |
(a) The Trust’s principal executive officer and principal financial officer have evaluated the Trust’s disclosure controls and procedures within 90 days of this filing and have concluded that the Trust’s disclosure controls and procedures are reasonably designed to ensure that information required to be disclosed by the Trust in this Form N-CSR is recorded, processed, summarized, and reported within the required time periods and that information required to be disclosed by the Trust in the report that it files or submits on Form N-CSR is accumulated and communicated to the Trust’s management, including its principal executive and principal financial officers, as appropriate to allow timely decisions regarding required disclosure.
(b) The Trust’s principal executive officer and principal financial officer are aware of no changes in the Trust’s internal control over financial reporting that occurred during the second fiscal quarter of the period covered by this report that have materially affected, or are reasonably likely to materially affect, the Trust’s internal control over financial reporting.
| Item 12. | Exhibits. |
| (a)(1) | Code of Ethics |
| (a)(2) | Certifications pursuant to Rule 30a-2(a) under the 1940 Act. |
| (a)(3) | Not applicable |
| (b) | Certifications pursuant to Rule 30a-2(b) under the 1940 Act. |
SIGNATURES
Pursuant to the requirements of the Securities Exchange Act of 1934 and the 1940 Act, the registrant has duly caused this report to be signed on its behalf by the undersigned, thereunto duly authorized.
(Registrant) Third Avenue Trust
| By: | /s/ W. James Hall |
| Name: | W. James Hall |
| Title: | Principal Executive Officer |
| Date: | December 22, 2017 |
Pursuant to the requirements of the Securities Exchange Act of 1934 and the 1940 Act, this report has been signed by the following persons on behalf of the registrant and in the capacities and on the dates indicated.
| By: | /s/ W. James Hall |
| Name: | W. James Hall |
| Title: | Principal Executive Officer |
| Date: | December 22, 2017 |
| By: | /s/ Michael A. Buono |
| Name: | Michael A. Buono |
| Title: | Principal Financial Officer |
| Date: | December 22, 2017 |