QuickLinks -- Click here to rapidly navigate through this document
UNITED STATES
SECURITIES AND EXCHANGE COMMISSION
Washington, D.C. 20549
FORM 10-Q
| (Mark One) | |
ý |
Quarterly report pursuant to Section 13 or 15(d) of the Securities Exchange Act of 1934 |
For the quarterly period ended September 30, 2005 or |
o |
Transition report pursuant to Section 13 or 15(d) of the Securities Exchange Act of 1934 |
For the transition period from to to . |
Commission File Number: 001-13251
SLM CORPORATION
(Exact name of registrant as specified in its charter)
Delaware
(State or other jurisdiction of
incorporation or organization) | | 52-2013874
(I.R.S. Employer
Identification No.) |
12061 Bluemont Way, Reston, Virginia
(Address of principal executive offices) |
|
20190
(Zip Code) |
(703) 810-3000
(Registrant's telephone number, including area code)
Indicate by check mark whether the registrant: (1) has filed all reports required to be filed by Section 13 or 15(d) of the Securities Exchange Act of 1934 during the preceding 12 months (or for such shorter period that the registrant was required to file such reports), and (2) has been subject to such filing requirements for the past 90 days. Yes ý No o
Indicate by check mark whether the registrant is an accelerated filer (as defined in Rule 12b-2 of the Act). Yes ý No o
Indicate by check mark whether the registrant is a shell company (as defined in Rule 12b-2 of the Exchange Act). Yes o No ý
Indicate the number of shares outstanding of each of the issuer's classes of common stock, as of the latest practicable date:
Class
| | Outstanding at October 31, 2005
|
|---|
| Common Stock, $.20 par value | | 417,313,366 shares |
GLOSSARY
Listed below are definitions of key terms that are used throughout this document.
Consolidation Loans—Under both the FFELP and FDLP, borrowers with eligible student loans may consolidate them into one note with one lender and convert the variable interest rates on the loans being consolidated into a fixed rate for the life of the loan. The new note is considered a Consolidation Loan. Typically a borrower can consolidate their student loans only once unless the borrower has another eligible loan to consolidate with the existing Consolidation Loan. FFELP Consolidation Loan borrowers can reconsolidate their FFELP Consolidation Loan into a FDLP Consolidation Loan. The borrower rate on a Consolidation Loan is fixed for the term of the loan and is set by the weighted-average interest rate of the loans being consolidated, rounded up to the nearest 1/8th of a percent, not to exceed 8.25 percent. In low interest rate environments, Consolidation Loans provide an attractive refinancing opportunity to certain borrowers because they allow borrowers to consolidate variable rate loans into a long-term fixed rate loan. Holders of Consolidation Loans are eligible to earn interest under the Special Allowance Payment ("SAP") formula (see definition below).
Consolidation Loan Rebate Fee—All holders of Consolidation Loans are required to pay to the U.S. Department of Education ("ED") an annual 105 basis point Consolidation Loan Rebate Fee on all outstanding principal and accrued interest balances of Consolidation Loans purchased or originated after October 1, 1993, except for loans for which consolidation applications were received between October 1, 1998 and January 31, 1999, where the Consolidation Loan Rebate Fee is 62 basis points.
Constant Prepayment Rate ("CPR")—A variable in life of loan estimates that measures the rate at which loans in the portfolio pay before their stated maturity. The CPR is directly correlated to the average life of the portfolio. CPR equals the percentage of loans that prepay annually as a percentage of the beginning of period balance.
Direct Loans—Student loans originated directly by ED under the William D. Ford Federal Direct Student Loan Program ("FDLP").
ED—The U.S. Department of Education.
Embedded Fixed Rate/Variable Rate Floor Income—Embedded Floor Income is Floor Income (see definition below) that is earned on off-balance sheet student loans that are in securitization trusts sponsored by us. At the time of the securitization, the option value of Embedded Fixed Rate Floor Income is included in the initial valuation of the Residual Interest (see definition below) and the gain or loss on sale of the student loans. Embedded Floor Income is also included in the quarterly fair value adjustments of the Residual Interest.
Exceptional Performer ("EP") Designation—The EP designation is determined by ED in recognition of a servicer meeting certain performance standards set by ED in servicing FFELP (see definition below) loans. Upon receiving the EP designation, the EP servicer receives 100 percent reimbursement on default claims on federally guaranteed student loans for all loans serviced for a period of at least 270 days before the date of default and will no longer be subject to the two percent Risk Sharing (see definition below) on these loans. The EP servicer is entitled to receive this benefit as long as it remains in compliance with the required servicing standards, which are assessed on an annual and quarterly basis through compliance audits and other criteria. The annual assessment is in part based upon subjective factors which alone may form the basis for an ED determination to withdraw the designation. If the designation is withdrawn, the two percent Risk Sharing may be applied retroactively to the date of the occurrence that resulted in noncompliance.
FDLP—The William D. Ford Federal Direct Student Loan Program.
FFELP—The Federal Family Education Loan Program, formerly the Guaranteed Student Loan Program.
1
FFELP Stafford and Other Student Loans—Education loans to students or parents of students that are guaranteed or reinsured under the FFELP. The loans are primarily Stafford loans and also PLUS and HEAL loans.
Fixed Rate Floor Income—We refer to Floor Income (see definition below) associated with student loans whose borrower rate is fixed to term (primarily Consolidation Loans) as Fixed Rate Floor Income.
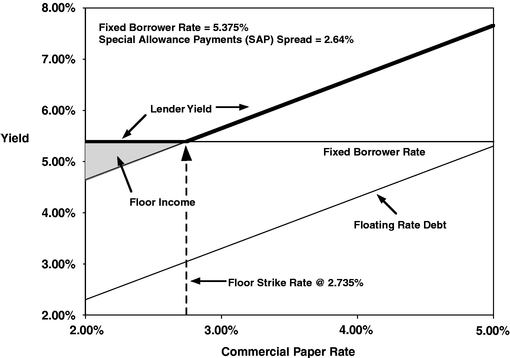
Floor Income—Our portfolio of FFELP student loans earns interest at the higher of a floating rate based on the Special Allowance Payment or SAP formula (see definition below) set by ED and the borrower rate, which is fixed over a period of time. We generally finance our student loan portfolio with floating rate debt over all interest rate levels. In low and/or declining interest rate environments, when the fixed borrower rate is higher than the rate produced by the SAP formula, our student loans earn at a fixed rate while the interest on our floating rate debt continues to decline. In these interest rate environments, we earn additional spread income that we refer to as Floor Income. Depending on the type of the student loan and when it was originated, the borrower rate is either fixed to term or is reset to a market rate each July 1. As a result, for loans where the borrower rate is fixed to term, we may earn Floor Income for an extended period of time, and for those loans where the borrower interest rate is reset annually on July 1, we may earn Floor Income to the next reset date.
The following example shows the mechanics of Floor Income for a typical fixed rate Consolidation Loan originated after July 1, 2004 (with a commercial paper-based SAP spread of 2.64 percent):
| Fixed Borrower Rate: | | 5.375 | % |
| SAP Spread over Commercial Paper Rate: | | (2.640 | )% |
| | |
| |
| Floor Strike Rate(1) | | 2.735 | % |
| | |
| |
- (1)
- The interest rate at which the underlying index (Treasury bill or commercial paper) plus the fixed SAP spread equals the fixed borrower rate. Floor Income is earned anytime the interest rate of the underlying index declines below this rate.
Based on this example, if the quarterly average commercial paper rate is over 2.735 percent, the holder of the student loan will earn at a floating rate based on the SAP formula, which in this example is a fixed spread to commercial paper of 2.64 percent. On the other hand, if the quarterly average commercial paper rate is below 2.735 percent, the SAP formula will produce a rate below the fixed borrower rate of 5.375 percent and the loan holder earns at the borrower rate of 5.375 percent. The difference between the fixed borrower rate and the lender's expected yield based on the SAP formula is referred to as Floor Income. Our student loan assets are generally funded with floating rate debt, so when student loans are earning at the fixed borrower rate, decreases in interest rates may increase Floor Income.
2
Graphic Depiction of Floor Income:
Floor Income Contracts—We enter into contracts with counterparties under which, in exchange for an upfront fee representing the present value of the Floor Income that we expect to earn on a notional amount of underlying student loans being hedged, we will pay the counterparties the Floor Income earned on that notional amount over the life of the Floor Income Contract. Specifically, we agree to pay the counterparty the difference, if positive, between the fixed borrower rate less the SAP (see definition below) spread and the average of the applicable interest rate index on that notional amount, regardless of the actual balance of underlying student loans, over the life of the contract. The contracts generally do not extend over the life of the underlying student loans. This contract effectively locks in the amount of Floor Income we will earn over the period of the contract. Floor Income Contracts are not considered effective hedges under Statement of Financial Accounting Standards ("SFAS") No. 133, "Accounting for Derivative Instruments and Hedging Activities," and each quarter we must record the change in fair value of these contracts through income.
GSE—The Student Loan Marketing Association was a federally chartered government-sponsored enterprise and wholly owned subsidiary of SLM Corporation that was dissolved under the terms of the Privatization Act (see definition below) on December 29, 2004.
HEA—The Higher Education Act of 1965, as amended.
Managed Basis—We generally analyze the performance of our student loan portfolio on a Managed Basis, under which we view both on-balance sheet student loans and off-balance sheet student loans owned by the securitization trusts as a single portfolio, and the related on-balance sheet financings are combined with off-balance sheet debt. When the term Managed is capitalized in this document, it is referring to Managed Basis.
Offset Fee—We were required to pay to ED an annual 30 basis point Offset Fee on the outstanding balance of Stafford and PLUS student loans purchased and held by the GSE after August 10, 1993. The fee did not apply to student loans sold to securitized trusts or to loans held outside of the GSE. This fee no longer applies, as the GSE was dissolved under the terms of the Privatization Act on December 29, 2004.
3
Preferred Channel Originations—Preferred Channel Originations are comprised of: 1) student loans that are originated by lenders with forward purchase commitment agreements with Sallie Mae and are committed for sale to Sallie Mae, such that we either own them from inception or acquire them soon after origination, and 2) loans that are originated by internally marketed Sallie Mae brands.
Preferred Lender List—To streamline the student loan process, most higher education institutions select a small number of lenders to recommend to their students and parents. This recommended list is referred to as the Preferred Lender List.
Private Education Loans (formerly referred to as "Private Credit Student Loans")—Education loans to students or parents of students that are not guaranteed or reinsured under the FFELP or any other federal student loan program. Private Education Loans include loans for traditional higher education, undergraduate and graduate degrees, and for alternative education, such as career training, private kindergarten through secondary education schools and tutorial schools. Traditional higher education loans have repayment terms similar to FFELP loans, whereby repayments begin after the borrower leaves school. Repayment for alternative education or career training loans begins immediately.
Privatization Act—The Student Loan Marketing Association Reorganization Act of 1996.
Residual Interest—When we securitize student loans, we retain the right to receive cash flows from the student loans sold to trusts we sponsor in excess of amounts needed to pay servicing, derivative costs (if any), other fees, and the principal and interest on the bonds backed by the student loans. The Residual Interest (which may also include reserve and other cash accounts), is the present value of these future expected cash flows, which includes the present value of Embedded Fixed Rate Floor Income described above. We value the Residual Interest at the time of sale of the student loans to the trust and at the end of each subsequent quarter.
Retained Interest—The Retained Interest includes the Residual Interest (defined above) and servicing rights (as the Company retains the servicing responsibilities).
Risk Sharing—When a FFELP loan defaults, the federal government guarantees 98 percent of the principal balance plus accrued interest and the holder of the loan generally must absorb the two percent not guaranteed as a Risk Sharing loss on the loan. FFELP student loans acquired after October 1, 1993 are subject to Risk Sharing on loan default claim payments unless the default results from the borrower's death, disability or bankruptcy. FFELP loans serviced by a servicer that has EP designation from ED are not subject to Risk Sharing.
Special Allowance Payment ("SAP")—FFELP student loans generally earn interest at the greater of the borrower rate or a floating rate determined by reference to the average of the applicable floating rates (91-day Treasury bill rate or commercial paper) in a calendar quarter, plus a fixed spread that is dependent upon when the loan was originated and the loan's repayment status. If the resulting floating rate exceeds the borrower rate, ED pays the difference directly to us. This payment is referred to as the Special Allowance Payment or SAP and the formula used to determine the floating rate is the SAP formula. We refer to the fixed spread to the underlying index as the SAP spread.
Title IV Programs and Title IV Loans—Student loan programs created under Title IV of the HEA, including the FFELP and the FDLP, and student loans originated under those programs, respectively.
Wind-Down—The dissolution of the GSE under the terms of the Privatization Act (see definition above).
Variable Rate Floor Income—For FFELP Stafford student loans whose borrower interest rate resets annually on July 1, we may earn Floor Income or Embedded Floor Income (see definitions above) based on a calculation of the difference between the borrower rate and the then current interest rate. We refer to this as Variable Rate Floor Income because Floor Income is earned only through the next reset date.
4
SLM CORPORATION
FORM 10-Q
INDEX
September 30, 2005
| Part I. Financial Information | | |
| Item 1. | | Financial Statements | | 6 |
| Item 2. | | Management's Discussion and Analysis of Financial Condition and Results of Operations | | 37 |
| Item 3. | | Quantitative and Qualitative Disclosures about Market Risk | | 89 |
| Item 4. | | Controls and Procedures | | 91 |
| Part II. Other Information | | |
| Item 1. | | Legal Proceedings | | 92 |
| Item 2. | | Changes in Securities, Use of Proceeds and Issuer Purchases of Equity Securities | | 92 |
| Item 3. | | Defaults Upon Senior Securities | | 93 |
| Item 4. | | Submission of Matters to a Vote of Security Holders | | 93 |
| Item 5. | | Other Information | | 93 |
| Item 6. | | Exhibits | | 93 |
Signatures |
|
94 |
5
PART I. FINANCIAL INFORMATION
Item 1. Financial Statements
SLM CORPORATION
CONSOLIDATED BALANCE SHEETS
(Dollars and shares in thousands, except per share amounts)
| | September 30,
2005
| | December 31,
2004
|
|---|
| | (Unaudited)
| |
|
|---|
| Assets | | | | | | |
| FFELP Stafford and Other Student Loans | | $ | 22,353,605 | | $ | 18,965,634 |
| Consolidation Loans (net of allowance for losses of $5,627 and $7,778, respectively) | | | 51,193,725 | | | 41,595,805 |
| Private Education Loans (net of allowance for losses of $193,332 and $171,886, respectively) | | | 8,078,650 | | | 5,419,611 |
| Other loans (net of allowance for losses of $13,563 and $11,148, respectively) | | | 1,094,464 | | | 1,047,745 |
| Investments | | | | | | |
| | Available-for-sale | | | 1,971,297 | | | 3,274,123 |
| | Other | | | 242,417 | | | 304,700 |
| | |
| |
|
| Total investments | | | 2,213,714 | | | 3,578,823 |
| Cash and cash equivalents | | | 1,559,300 | | | 3,395,487 |
| Restricted cash and investments | | | 2,706,925 | | | 2,211,643 |
| Retained Interest in off-balance sheet securitized loans | | | 2,330,390 | | | 2,316,388 |
| Goodwill and acquired intangible assets, net | | | 1,063,916 | | | 1,066,142 |
| Other assets | | | 3,725,670 | | | 4,496,248 |
| | |
| |
|
| Total assets | | $ | 96,320,359 | | $ | 84,093,526 |
| | |
| |
|
| Liabilities | | | | | | |
| Short-term borrowings | | $ | 4,652,334 | | $ | 2,207,095 |
| Long-term borrowings | | | 84,499,739 | | | 75,914,573 |
| Other liabilities | | | 3,330,763 | | | 2,797,921 |
| | |
| |
|
| Total liabilities | | | 92,482,836 | | | 80,919,589 |
| | |
| |
|
Commitments and contingencies |
|
|
|
|
|
|
Minority interest in subsidiaries |
|
|
13,725 |
|
|
71,633 |
Stockholders' equity |
|
|
|
|
|
|
| Preferred stock, par value $.20 per share, 20,000 shares authorized; Series A: 3,300 and 3,300 shares issued, respectively, at stated value of $50 per share; Series B: 4,000 and 0 shares issued, respectively at stated value of $100 per share | | | 565,000 | | | 165,000 |
| Common stock, par value $.20 per share, 1,125,000 shares authorized: 488,525 and 483,266 shares issued, respectively | | | 97,705 | | | 96,654 |
| Additional paid-in capital | | | 2,107,961 | | | 1,905,460 |
| Accumulated other comprehensive income (net of tax of $219,567 and $237,285, respectively) | | | 407,768 | | | 440,672 |
| Retained earnings | | | 3,195,034 | | | 2,521,740 |
| | |
| |
|
| Stockholders' equity before treasury stock | | | 6,373,468 | | | 5,129,526 |
| Common stock held in treasury at cost: 69,927 and 59,634 shares, respectively | | | 2,549,670 | | | 2,027,222 |
| | |
| |
|
| Total stockholders' equity | | | 3,823,798 | | | 3,102,304 |
| | |
| |
|
| Total liabilities and stockholders' equity | | $ | 96,320,359 | | $ | 84,093,526 |
| | |
| |
|
See accompanying notes to consolidated financial statements.
6
SLM CORPORATION
CONSOLIDATED STATEMENTS OF INCOME
(Dollars and shares in thousands, except per share amounts)
| | Three months ended
September 30,
| | Nine months ended
September 30,
| |
|---|
| | 2005
| | 2004
| | 2005
| | 2004
| |
|---|
| | (Unaudited)
| | (Unaudited)
| | (Unaudited)
| | (Unaudited)
| |
|---|
| Interest income: | | | | | | | | | | | | | |
| | FFELP Stafford and Other Student Loans | | $ | 270,444 | | $ | 188,624 | | $ | 699,687 | | $ | 550,122 | |
| | Consolidation Loans | | | 676,820 | | | 332,982 | | | 1,739,670 | | | 932,617 | |
| | Private Education Loans | | | 173,467 | | | 83,303 | | | 429,892 | | | 236,505 | |
| | Other loans | | | 21,614 | | | 18,212 | | | 61,813 | | | 54,714 | |
| | Cash and investments | | | 70,541 | | | 61,774 | | | 186,835 | | | 157,765 | |
| | |
| |
| |
| |
| |
| Total interest income | | | 1,212,886 | | | 684,895 | | | 3,117,897 | | | 1,931,723 | |
Interest expense: |
|
|
|
|
|
|
|
|
|
|
|
|
|
| | Short-term debt | | | 47,409 | | | 35,085 | | | 125,627 | | | 179,142 | |
| | Long-term debt | | | 780,713 | | | 336,867 | | | 1,930,958 | | | 785,316 | |
| | |
| |
| |
| |
| |
| Total interest expense | | | 828,122 | | | 371,952 | | | 2,056,585 | | | 964,458 | |
| | |
| |
| |
| |
| |
| Net interest income | | | 384,764 | | | 312,943 | | | 1,061,312 | | | 967,265 | |
| Less: provisions for losses | | | 12,217 | | | 10,930 | | | 137,688 | | | 79,092 | |
| | |
| |
| |
| |
| |
| Net interest income after provisions for losses | | | 372,547 | | | 302,013 | | | 923,624 | | | 888,173 | |
| | |
| |
| |
| |
| |
Other income: |
|
|
|
|
|
|
|
|
|
|
|
|
|
| | Gains on student loan securitizations | | | — | | | 63,590 | | | 311,895 | | | 375,384 | |
| | Servicing and securitization revenue | | | (16,194 | ) | | 158,639 | | | 276,698 | | | 419,334 | |
| | Losses on investments, net | | | (43,030 | ) | | (32,887 | ) | | (56,976 | ) | | (37,244 | ) |
| | Gains (losses) on derivative and hedging activities, net | | | 316,469 | | | 73,000 | | | 176,278 | | | 342,404 | |
| | Guarantor servicing fees | | | 35,696 | | | 33,192 | | | 93,922 | | | 91,412 | |
| | Debt management fees | | | 92,727 | | | 73,631 | | | 261,068 | | | 223,672 | |
| | Collections revenue | | | 41,772 | | | 5,164 | | | 118,536 | | | 5,164 | |
| | Other | | | 74,174 | | | 91,134 | | | 206,187 | | | 222,561 | |
| | |
| |
| |
| |
| |
| Total other income | | | 501,614 | | | 465,463 | | | 1,387,608 | | | 1,642,687 | |
Operating expenses: |
|
|
|
|
|
|
|
|
|
|
|
|
|
| | Salaries and benefits | | | 162,897 | | | 113,386 | | | 461,165 | | | 353,138 | |
| | Loss on GSE debt extinguishment and defeasance | | | — | | | 102,990 | | | — | | | 102,990 | |
| | Other | | | 129,064 | | | 97,386 | | | 380,500 | | | 272,562 | |
| | |
| |
| |
| |
| |
| Total operating expenses | | | 291,961 | | | 313,762 | | | 841,665 | | | 728,690 | |
| | |
| |
| |
| |
| |
| Income before income taxes and minority interest in net earnings of subsidiaries | | | 582,200 | | | 453,714 | | | 1,469,567 | | | 1,802,170 | |
| Income taxes | | | 149,821 | | | 97,136 | | | 512,860 | | | 539,201 | |
| | |
| |
| |
| |
| |
| Income before minority interest in net earnings of subsidiaries | | | 432,379 | | | 356,578 | | | 956,707 | | | 1,262,969 | |
| Minority interest in net earnings of subsidiaries | | | 1,029 | | | — | | | 5,458 | | | — | |
| | |
| |
| |
| |
| |
Net income |
|
|
431,350 |
|
|
356,578 |
|
|
951,249 |
|
|
1,262,969 |
|
| Preferred stock dividends | | | 7,288 | | | 2,875 | | | 14,071 | | | 8,625 | |
| | |
| |
| |
| |
| |
| Net income attributable to common stock | | $ | 424,062 | | $ | 353,703 | | $ | 937,178 | | $ | 1,254,344 | |
| | |
| |
| |
| |
| |
| Basic earnings per common share | | $ | 1.02 | | $ | .81 | | $ | 2.24 | | $ | 2.85 | |
| | |
| |
| |
| |
| |
| Average common shares outstanding | | | 417,235 | | | 435,764 | | | 419,205 | | | 439,430 | |
| | |
| |
| |
| |
| |
| Diluted earnings per common share | | $ | .95 | | $ | .76 | | $ | 2.10 | | $ | 2.65 | |
| | |
| |
| |
| |
| |
| Average common and common equivalent shares outstanding | | | 458,798 | | | 474,455 | | | 461,222 | | | 478,323 | |
| | |
| |
| |
| |
| |
| Dividends per common share | | $ | .22 | | $ | .19 | | $ | .63 | | $ | .55 | |
| | |
| |
| |
| |
| |
See accompanying notes to consolidated financial statements.
7
SLM CORPORATION
CONSOLIDATED STATEMENTS OF CHANGES IN STOCKHOLDERS' EQUITY
(Dollars in thousands, except share and per share amounts)
(Unaudited)
| |
| | Common Stock Shares
| |
| |
| |
| | Accumulated
Other
Comprehensive
Income (Loss)
| |
| |
| |
| |
|---|
| | Preferred
Stock
Shares
| | Preferred
Stock
| | Common
Stock
| | Additional
Paid-In
Capital
| | Retained
Earnings
| | Treasury
Stock
| | Total
Stockholders'
Equity
| |
|---|
| | Issued
| | Treasury
| | Outstanding
| |
|---|
| Balance at June 30, 2004 | | 3,300,000 | | 478,722,527 | | (39,760,083 | ) | 438,962,444 | | $ | 165,000 | | $ | 95,745 | | $ | 1,747,284 | | $ | 355,955 | | $ | 1,683,563 | | $ | (1,126,881 | ) | $ | 2,920,666 | |
| Comprehensive income: | | | | | | | | | | | | | | | | | | | | | | | | | | | | | | |
| | Net income | | | | | | | | | | | | | | | | | | | | | | | 356,578 | | | | | | 356,578 | |
| | Other comprehensive income, net of tax: | | | | | | | | | | | | | | | | | | | | | | | | | | | | | | |
| | | Change in unrealized gains (losses) on investments, net of tax | | | | | | | | | | | | | | | | | | | | 97,774 | | | | | | | | | 97,774 | |
| | | Change in unrealized gains (losses) on derivatives, net of tax | | | | | | | | | | | | | | | | | | | | 33,215 | | | | | | | | | 33,215 | |
| | | | | | | | | | | | | | | | | | | | | | | | | | | | |
| |
| Comprehensive income | | | | | | | | | | | | | | | | | | | | | | | | | | | | | 487,567 | |
| Dividends: | | | | | | | | | | | | | | | | | | | | | | | | | | | | | | |
| | Common stock ($.19 per share) | | | | | | | | | | | | | | | | | | | | | | | (83,547 | ) | | | | | (83,547 | ) |
| | Preferred stock, series A ($.87 per share) | | | | | | | | | | | | | | | | | | | | | | | (2,875 | ) | | | | | (2,875 | ) |
| Issuance of common shares | | | | 1,746,074 | | 4,950 | | 1,751,024 | | | | | | 349 | | | 51,908 | | | | | | | | | 205 | | | 52,462 | |
| Tax benefit related to employee stock option and purchase plans | | | | | | | | | | | | | | | | | 5,937 | | | | | | | | | | | | 5,937 | |
| Repurchase of common shares: | | | | | | | | | | | | | | | | | | | | | | | | | | | | | | |
| | Equity forwards: | | | | | | | | | | | | | | | | | | | | | | | | | | | | | | |
| | | Exercise cost, cash | | | | | | (4,740,000 | ) | (4,740,000 | ) | | | | | | | | | | | | | | | | | (193,195 | ) | | (193,195 | ) |
| | | Exercise cost, net settlement | | | | | | (6,661,561 | ) | (6,661,561 | ) | | | | | | | | | | | | | | | | | (289,512 | ) | | (289,512 | ) |
| | | Gain on settlement | | | | | | — | | — | | | | | | | | | | | | | | | | | | 6,225 | | | 6,225 | |
| | Benefit plans | | | | | | (98,360 | ) | (98,360 | ) | | | | | | | | | | | | | | | | | (3,751 | ) | | (3,751 | ) |
| | |
| |
| |
| |
| |
| |
| |
| |
| |
| |
| |
| |
| Balance at September 30, 2004 | | 3,300,000 | | 480,468,601 | | (51,255,054 | ) | 429,213,547 | | $ | 165,000 | | $ | 96,094 | | $ | 1,805,129 | | $ | 486,944 | | $ | 1,953,719 | | $ | (1,606,909 | ) | $ | 2,899,977 | |
| | |
| |
| |
| |
| |
| |
| |
| |
| |
| |
| |
| |
| Balance at June 30, 2005 | | 7,300,000 | | 486,706,143 | | (66,531,905 | ) | 420,174,238 | | $ | 565,000 | | $ | 97,341 | | $ | 2,035,676 | | $ | 473,121 | | $ | 2,862,730 | | $ | (2,382,130 | ) | $ | 3,651,738 | |
| Comprehensive income: | | | | | | | | | | | | | | | | | | | | | | | | | | | | | | |
| | Net income | | | | | | | | | | | | | | | | | | | | | | | 431,350 | | | | | | 431,350 | |
| | Other comprehensive income, net of tax: | | | | | | | | | | | | | | | | | | | | | | | | | | | | | | |
| | | Change in unrealized gains (losses) on investments, net of tax | | | | | | | | | | | | | | | | | | | | (68,680 | ) | | | | | | | | (68,680 | ) |
| | | Change in unrealized gains (losses) on derivatives, net of tax | | | | | | | | | | | | | | | | | | | | 3,327 | | | | | | | | | 3,327 | |
| | | | | | | | | | | | | | | | | | | | | | | | | | | | |
| |
| Comprehensive income | | | | | | | | | | | | | | | | | | | | | | | | | | | | | 365,997 | |
| Dividends: | | | | | | | | | | | | | | | | | | | | | | | | | | | | | | |
| | Common stock ($.22 per share) | | | | | | | | | | | | | | | | | | | | | | | (91,758 | ) | | | | | (91,758 | ) |
| | Preferred stock, series A ($.87 per share) | | | | | | | | | | | | | | | | | | | | | | | (2,886 | ) | | | | | (2,886 | ) |
| | Preferred stock, series B ($1.12 per share) | | | | | | | | | | | | | | | | | | | | | | | (4,244 | ) | | | | | (4,244 | ) |
| Issuance of common shares | | | | 1,818,734 | | 8,409 | | 1,827,143 | | | | | | 364 | | | 58,205 | | | | | | | | | 487 | | | 59,056 | |
| Preferred stock issuance costs and related amortization | | | | | | | | | | | | | | | | | 68 | | | | | | (158 | ) | | | | | (90 | ) |
| Tax benefit related to employee stock option and purchase plans | | | | | | | | | | | | | | | | | 14,012 | | | | | | | | | | | | 14,012 | |
| Repurchase of common shares: | | | | | | | | | | | | | | | | | | | | | | | | | | | | | | |
| | Equity forwards: | | | | | | | | | | | | | | | | | | | | | | | | | | | | | | |
| | | Exercise cost, cash | | | | | | (2,936,023 | ) | (2,936,023 | ) | | | | | | | | | | | | | | | | | (148,181 | ) | | (148,181 | ) |
| | | Gain on settlement | | | | | | — | | — | | | | | | | | | | | | | | | | | | 2,554 | | | 2,554 | |
| | Benefit plans | | | | | | (467,626 | ) | (467,626 | ) | | | | | | | | | | | | | | | | | (22,400 | ) | | (22,400 | ) |
| | |
| |
| |
| |
| |
| |
| |
| |
| |
| |
| |
| |
| Balance at September 30, 2005 | | 7,300,000 | | 488,524,877 | | (69,927,145 | ) | 418,597,732 | | $ | 565,000 | | $ | 97,705 | | $ | 2,107,961 | | $ | 407,768 | | $ | 3,195,034 | | $ | (2,549,670 | ) | $ | 3,823,798 | |
| | |
| |
| |
| |
| |
| |
| |
| |
| |
| |
| |
| |
See accompanying notes to consolidated financial statements.
8
| |
| | Common Stock Shares
| |
| |
| |
| | Accumulated
Other
Comprehensive
Income (Loss)
| |
| |
| |
| |
|---|
| | Preferred
Stock
Shares
| | Preferred
Stock
| | Common
Stock
| | Additional
Paid-In
Capital
| | Retained
Earnings
| | Treasury
Stock
| | Total
Stockholders'
Equity
| |
|---|
| | Issued
| | Treasury
| | Outstanding
| |
|---|
| Balance at December 31, 2003 | | 3,300,000 | | 472,642,996 | | (24,964,753 | ) | 447,678,243 | | $ | 165,000 | | $ | 94,529 | | $ | 1,553,240 | | $ | 425,621 | | $ | 941,284 | | $ | (549,628 | ) | $ | 2,630,046 | |
| Comprehensive income: | | | | | | | | | | | | | | | | | | | | | | | | | | | | | | |
| | Net income | | | | | | | | | | | | | | | | | | | | | | | 1,262,969 | | | | | | 1,262,969 | |
| | Other comprehensive income, net of tax: | | | | | | | | | | | | | | | | | | | | | | | | | | | | | | |
| | | Change in unrealized gains (losses) on investments, net of tax | | | | | | | | | | | | | | | | | | | | 25,781 | | | | | | | | | 25,781 | |
| | | Change in unrealized gains (losses) on derivatives, net of tax | | | | | | | | | | | | | | | | | | | | 35,900 | | | | | | | | | 35,900 | |
| | | Minority pension liability adjustment | | | | | | | | | | | | | | | | | | | | (358 | ) | | | | | | | | (358 | ) |
| | | | | | | | | | | | | | | | | | | | | | | | | | | | |
| |
| Comprehensive income | | | | | | | | | | | | | | | | | | | | | | | | | | | | | 1,324,292 | |
| Dividends: | | | | | | | | | | | | | | | | | | | | | | | | | | | | | | |
| | Common stock ($.55 per share) | | | | | | | | | | | | | | | | | | | | | | | (241,909 | ) | | | | | (241,909 | ) |
| | Preferred stock, series A ($2.61 per share) | | | | | | | | | | | | | | | | | | | | | | | (8,625 | ) | | | | | (8,625 | ) |
| Issuance of common shares | | | | 7,825,605 | | 58,078 | | 7,883,683 | | | | | | 1,565 | | | 215,399 | | | | | | | | | 2,252 | | | 219,216 | |
| Tax benefit related to employee stock option and purchase plans | | | | | | | | | | | | | | | | | 36,490 | | | | | | | | | | | | 36,490 | |
| Repurchase of common shares: | | | | | | | | | | | | | | | | | | | | | | | | | | | | | | |
| | Open market repurchases | | | | | | (563,500 | ) | (563,500 | ) | | | | | | | | | | | | | | | | | (21,554 | ) | | (21,554 | ) |
| | Equity forwards: | | | | | | | | | | | | | | | | | | | | | | | | | | | | | | |
| | | Exercise cost, cash | | | | | | (18,150,460 | ) | (18,150,460 | ) | | | | | | | | | | | | | | | | | (643,317 | ) | | (643,317 | ) |
| | | Exercise cost, net settlement | | | | | | (6,661,561 | ) | (6,661,561 | ) | | | | | | | | | | | | | | | | | (289,512 | ) | | (289,512 | ) |
| | | Gain on settlement | | | | | | — | | — | | | | | | | | | | | | | | | | | | (66,425 | ) | | (66,425 | ) |
| | Benefit plans | | | | | | (972,858 | ) | (972,858 | ) | | | | | | | | | | | | | | | | | (38,725 | ) | | (38,725 | ) |
| | |
| |
| |
| |
| |
| |
| |
| |
| |
| |
| |
| |
| Balance at September 30, 2004 | | 3,300,000 | | 480,468,601 | | (51,255,054 | ) | 429,213,547 | | $ | 165,000 | | $ | 96,094 | | $ | 1,805,129 | | $ | 486,944 | | $ | 1,953,719 | | $ | (1,606,909 | ) | $ | 2,899,977 | |
| | |
| |
| |
| |
| |
| |
| |
| |
| |
| |
| |
| |
| Balance at December 31, 2004 | | 3,300,000 | | 483,266,408 | | (59,634,019 | ) | 423,632,389 | | $ | 165,000 | | $ | 96,654 | | $ | 1,905,460 | | $ | 440,672 | | $ | 2,521,740 | | $ | (2,027,222 | ) | $ | 3,102,304 | |
| Comprehensive income: | | | | | | | | | | | | | | | | | | | | | | | | | | | | | | |
| | Net income | | | | | | | | | | | | | | | | | | | | | | | 951,249 | | | | | | 951,249 | |
| | Other comprehensive income, net of tax: | | | | | | | | | | | | | | | | | | | | | | | | | | | | | | |
| | | Change in unrealized gains (losses) on investments, net of tax | | | | | | | | | | | | | | | | | | | | (37,936 | ) | | | | | | | | (37,936 | ) |
| | | Change in unrealized gains (losses) on derivatives, net of tax | | | | | | | | | | | | | | | | | | | | 5,032 | | | | | | | | | 5,032 | |
| | | | | | | | | | | | | | | | | | | | | | | | | | | | |
| |
| Comprehensive income | | | | | | | | | | | | | | | | | | | | | | | | | | | | | 918,345 | |
| Dividends: | | | | | | | | | | | | | | | | | | | | | | | | | | | | | | |
| | Common stock ($.63 per share) | | | | | | | | | | | | | | | | | | | | | | | (263,884 | ) | | | | | (263,884 | ) |
| | Preferred stock, series A ($2.61 per share) | | | | | | | | | | | | | | | | | | | | | | | (8,636 | ) | | | | | (8,636 | ) |
| | Preferred stock, series B ($1.12 per share) | | | | | | | | | | | | | | | | | | | | | | | (5,239 | ) | | | | | (5,239 | ) |
| Issuance of common shares | | | | 5,258,469 | | 73,406 | | 5,331,875 | | | | | | 1,051 | | | 169,065 | | | | | | | | | 3,762 | | | 173,878 | |
| Issuance of preferred shares | | 4,000,000 | | | | | | | | | 400,000 | | | | | | | | | | | | | | | | | | 400,000 | |
| Preferred stock issuance costs and related amortization | | | | | | | | | | | | | | | | | (2,894 | ) | | | | | (196 | ) | | | | | (3,090 | ) |
| Tax benefit related to employee stock option and purchase plans | | | | | | | | | | | | | | | | | 36,330 | | | | | | | | | | | | 36,330 | |
| Repurchase of common shares: | | | | | | | | | | | | | | | | | | | | | | | | | | | | | | |
| | Equity forwards: | | | | | | | | | | | | | | | | | | | | | | | | | | | | | | |
| | | Exercise cost, cash | | | | | | (9,405,676 | ) | (9,405,676 | ) | | | | | | | | | | | | | | | | | (468,267 | ) | | (468,267 | ) |
| | | Gain on settlement | | | | | | — | | — | | | | | | | | | | | | | | | | | | (11,276 | ) | | (11,276 | ) |
| | Benefit plans | | | | | | (960,856 | ) | (960,856 | ) | | | | | | | | | | | | | | | | | (46,667 | ) | | (46,667 | ) |
| | |
| |
| |
| |
| |
| |
| |
| |
| |
| |
| |
| |
| Balance at September 30, 2005 | | 7,300,000 | | 488,524,877 | | (69,927,145 | ) | 418,597,732 | | $ | 565,000 | | $ | 97,705 | | $ | 2,107,961 | | $ | 407,768 | | $ | 3,195,034 | | $ | (2,549,670 | ) | $ | 3,823,798 | |
| | |
| |
| |
| |
| |
| |
| |
| |
| |
| |
| |
| |
See accompanying notes to consolidated financial statements.
9
SLM CORPORATION
CONSOLIDATED STATEMENTS OF CASH FLOWS
(Dollars in thousands)
| | Nine months ended
September 30,
| |
|---|
| | 2005
| | 2004
| |
|---|
| | (Unaudited)
| | (Unaudited)
| |
|---|
| Operating activities | | | | | | | |
| Net income | | $ | 951,249 | | $ | 1,262,969 | |
| Adjustments to reconcile net income to net cash used in operating activities: | | | | | | | |
| | Gains on student loan securitizations | | | (311,895 | ) | | (375,384 | ) |
| | Losses on investments, net | | | 56,976 | | | 37,244 | |
| | Loss on GSE debt extinguishment and defeasance | | | — | | | 102,990 | |
| | Unrealized (gains)/losses on derivative and hedging activities, excluding equity forwards | | | (420,878 | ) | | (558,387 | ) |
| | Unrealized (gains)/losses on derivative and hedging activities — equity forwards | | | (64,519 | ) | | (335,271 | ) |
| | Provisions for losses | | | 137,688 | | | 79,092 | |
| | Minority interest, net | | | (6,714 | ) | | — | |
| | Mortgage loans originated | | | (1,335,468 | ) | | (1,072,098 | ) |
| | Proceeds from sales of mortgage loans | | | 1,239,425 | | | 904,412 | |
| | Increase in restricted cash | | | (279,814 | ) | | (669,030 | ) |
| | Increase in accrued interest receivable | | | (469,714 | ) | | (347,405 | ) |
| | Increase in accrued interest payable | | | 82,764 | | | 69,093 | |
| | Decrease in Retained Interest in off-balance sheet securitized loans, net | | | 194,231 | | | 67,905 | |
| | Decrease in other assets, goodwill and acquired intangible assets, net | | | 153,860 | | | 216,268 | |
| | Increase (decrease) in other liabilities | | | 594,256 | | | (252,873 | ) |
| | |
| |
| |
| Total adjustments | | | (429,802 | ) | | (2,133,444 | ) |
| | |
| |
| |
| Net cash provided by (used in) operating activities | | | 521,447 | | | (870,475 | ) |
| | |
| |
| |
| Investing activities | | | | | | | |
| | Student loans acquired | | | (23,108,450 | ) | | (17,605,626 | ) |
| | Loans purchased from securitized trusts (primarily through loan consolidations) | | | (7,459,199 | ) | | (3,968,953 | ) |
| | Reduction of student loans: | | | | | | | |
| | | Installment payments | | | 4,909,516 | | | 3,844,999 | |
| | | Claims and resales | | | 768,328 | | | 571,774 | |
| | | Proceeds from securitization of student loans treated as sales | | | 9,045,932 | | | 12,475,726 | |
| | | Proceeds from sales of student loans | | | 166,471 | | | 470,711 | |
| | Other loans made | | | (346,473 | ) | | (391,058 | ) |
| | Other loans repaid | | | 393,838 | | | 534,946 | |
| | Purchases of available-for-sale securities | | | (50,629,556 | ) | | (192,762,310 | ) |
| | Proceeds from sales of available-for-sale securities | | | 983,469 | | | — | |
| | Proceeds from maturities of available-for-sale securities | | | 50,764,290 | | | 193,993,403 | |
| | Purchases of held-to-maturity and other securities | | | (713,852 | ) | | (216,814 | ) |
| | Proceeds from sales and maturities of held-to-maturity securities and other securities | | | 685,132 | | | 233,683 | |
| | Return of investment from Retained Interest | | | 161,183 | | | 372,833 | |
| | Purchase of subsidiaries, net of cash acquired | | | (178,844 | ) | | (148,436 | ) |
| | |
| |
| |
| | Net cash used in investing activities | | | (14,558,215 | ) | | (2,595,122 | ) |
| | |
| |
| |
| Financing activities | | | | | | | |
| | Short-term borrowings issued | | | 56,745,936 | | | 290,798,033 | |
| | Short-term borrowings repaid | | | (56,834,645 | ) | | (296,886,713 | ) |
| | Long-term borrowings issued | | | 8,286,865 | | | 12,051,790 | |
| | Long-term borrowings repaid | | | (4,957,066 | ) | | (13,746,106 | ) |
| | Borrowings collateralized by loans in trust issued | | | 9,808,399 | | | 17,648,875 | |
| | Borrowings collateralized by loans in trust — activity | | | (627,003 | ) | | (1,382,643 | ) |
| | GSE debt extinguishment | | | — | | | (1,852,665 | ) |
| | Common stock issued | | | 173,878 | | | 219,216 | |
| | Common stock repurchased | | | (514,934 | ) | | (703,596 | ) |
| | Common stock dividends paid | | | (263,884 | ) | | (241,909 | ) |
| | Preferred stock issued | | | 396,910 | | | — | |
| | Preferred stock dividends accrued and paid | | | (13,875 | ) | | (8,625 | ) |
| | |
| |
| |
| | Net cash provided by financing activities | | | 12,200,581 | | | 5,895,657 | |
| | |
| |
| |
| | Net (decrease) increase in cash and cash equivalents | | | (1,836,187 | ) | | 2,430,060 | |
| | Cash and cash equivalents at beginning of period | | | 3,395,487 | | | 1,847,585 | |
| | |
| |
| |
| | Cash and cash equivalents at end of period | | $ | 1,559,300 | | $ | 4,277,645 | |
| | |
| |
| |
| Cash disbursements made for: | | | | | | | |
| | Interest | | $ | 1,701,632 | | $ | 787,628 | |
| | |
| |
| |
| | Income taxes | | $ | 234,962 | | $ | 546,843 | |
| | |
| |
| |
See accompanying notes to consolidated financial statements.
10
SLM CORPORTION
NOTES TO CONSOLIDATED FINANCIAL STATEMENTS
(Information at September 30, 2005 and for the three and nine months ended
September 30, 2005 and 2004 is unaudited)
(Dollars and shares in thousands, except per share amounts, unless otherwise noted)
1. Significant Accounting Policies
Basis of Presentation
The accompanying unaudited, consolidated financial statements of SLM Corporation (the "Company") have been prepared in accordance with generally accepted accounting principles in the United States of America ("GAAP") for interim financial information. Accordingly, they do not include all of the information and footnotes required by GAAP for complete consolidated financial statements. In the opinion of management, all adjustments considered necessary for a fair statement of the results for the interim periods have been included. The preparation of financial statements in conformity with GAAP requires management to make estimates and assumptions that affect the amounts reported in the consolidated financial statements and accompanying notes. Actual results could differ from those estimates. Operating results for the three and nine months ended September 30, 2005 are not necessarily indicative of the results for the year ending December 31, 2005. These unaudited financial statements should be read in conjunction with the audited financial statements and related notes included in the Company's 2004 Annual Report on Form 10-K.
Reclassifications
Certain reclassifications have been made to the balances as of and for the three and nine months ended September 30, 2004 to be consistent with classifications adopted for 2005.
Recently Issued Accounting Pronouncements
In May 2005, the Financial Accounting Standards Board (the "FASB") issued Statement of Financial Accounting Standards ("SFAS") No. 154, "Accounting Changes and Error Corrections," which is a replacement of Accounting Principles Board ("APB") Opinion No. 20, "Accounting Changes," and SFAS No. 3, "Reporting Accounting Changes in Interim Financial Statements." This statement changes the requirements for the accounting for and reporting of a change in accounting principle. This statement applies to all voluntary changes in accounting principle and applies to changes required by an accounting pronouncement in the unusual instance that the pronouncement does not include specific transition provisions. This statement requires retrospective application to prior periods' financial statements of changes in accounting principle, unless it is impracticable to determine either the period-specific effects or the cumulative effect of the change. When it is impracticable to determine the period-specific effects of an accounting change on one or more individual prior periods presented, this statement requires that the new accounting principle be applied to the balances of assets and liabilities as of the beginning of the earliest period for which retrospective application is practicable and that a corresponding adjustment be made to the opening balance of retained earnings for that period rather than being reported in an income statement. This statement is effective for accounting changes made in fiscal years beginning after December 15, 2005. The Company will adopt SFAS No. 154 on January 1, 2006. The Company expects that the adoption of SFAS No. 154 will not have a material impact on the Company's financial statements.
11
On December 16, 2004, the FASB issued SFAS No. 123(R), "Share-Based Payment," which is a revision of SFAS No. 123, "Accounting for Stock-Based Compensation." Generally, the approach in SFAS No. 123(R) is similar to the approach described in SFAS No. 123. However, SFAS No. 123(R) requires all share-based payments to employees, including grants of employee stock options, to be recognized in the income statement based on their fair values. Pro forma disclosure is no longer an alternative. The new standard will be effective for public entities (excluding small business issuers) for the fiscal year beginning after June 15, 2005. SFAS No. 123(R) allows for two transition alternatives for public companies: (a) modified-prospective transition or (b) modified-retrospective transition. Management is still evaluating both methods, but has tentatively decided to apply the modified-retrospective transition alternative for all periods presented and will recognize compensation cost in the amounts previously reported in the pro forma footnote disclosure under the provisions of SFAS No. 123. Had the Company adopted SFAS No. 123(R) for the first nine months of 2005, its diluted earnings per share would have been $.06 lower, and going forward, the adoption of SFAS No. 123(R) should have a similar effect on diluted earnings per share. The Company plans to adopt SFAS No. 123(R) on January 1, 2006.
In December 2004, the Company adopted Emerging Issues Task Force ("EITF") Issue No. 04-8, "The Effect of Contingently Convertible Debt on Diluted Earnings per Share," which addresses the timing of the inclusion of the dilutive effect of contingently convertible debt instruments ("Co-Cos") in diluted earnings per share ("diluted EPS"). Co-Cos are generally convertible into the common shares of the issuer after the common stock share price exceeds a predetermined threshold for a specified time period, generally referred to as the market price trigger. EITF No. 04-8 requires the shares underlying the Co-Cos be included in diluted EPS computations regardless of whether the market price trigger or the conversion price has been met, using the "if-converted" accounting method. EITF No. 04-8 was effective for reporting periods ending after December 15, 2004 with retroactive restatement to all required reporting periods. As a result, the diluted EPS amounts have been retroactively restated for all prior periods presented to give effect to the application of EITF No. 04-8 as it relates to the Company's $2 billion Co-Cos issued in May 2003. The effect of the adoption of EITF No. 04-8 was to decrease diluted EPS, by $.04 and $.04 per share for the three months ended September 30, 2005 and 2004, respectively, and by $.08 and $.15 per share for the nine months ended September 30, 2005 and 2004, respectively. See Note 5, "Common Stock," for a more detailed calculation of the negative impact of the Co-Cos on diluted EPS.
Stock-Based Compensation
The Company has elected to continue to follow the intrinsic value method of accounting as prescribed by APB Opinion No. 25, "Accounting for Stock Issued to Employees," to account for employee stock options (see "Recently Issued Accounting Pronouncements—Share Based Payment" above). Under APB No. 25, the Company does not recognize compensation expense on fixed award plans unless the exercise price of its employee stock options is less than the market price of the
12
underlying stock on the date of grant. The Company grants all of its options at the fair market value of the underlying stock on the date of grant. Consequently, the Company has not recorded such expense in the periods presented.
The fair values for the options granted in the three and nine months ended September 30, 2005 and 2004 were estimated at the date of grant using a Black-Scholes option pricing model, with the following weighted average assumptions:
| | Three months ended
September 30,
| | Nine months ended
September 30,
|
|---|
| | 2005
| | 2004
| | 2005
| | 2004
|
|---|
| Risk free interest rate | | 3.98% | | 2.97% | | 3.63% | | 2.58% |
| Expected volatility | | 22.13% | | 17.92% | | 21.66% | | 16.18% |
| Expected dividend rate | | 1.72% | | 1.71% | | 1.52% | | 1.68% |
| Expected life of the option | | 3 years | | 3 years | | 3 years | | 3 years |
The following table summarizes pro forma disclosures for the three and nine months ended September 30, 2005 and 2004, as if the Company had accounted for employee and Board of Directors stock options granted subsequent to December 31, 1994 under the fair market value method as set forth in SFAS No. 123. The option value is amortized over an assumed vesting period of between one and three years depending on option type or to the actual date of vesting, whichever comes first.
| | Three months ended
September 30,
| | Nine months ended
September 30,
| |
|---|
| | 2005
| | 2004
| | 2005
| | 2004
| |
|---|
| Net income attributable to common stock | | $ | 424,062 | | $ | 353,703 | | $ | 937,178 | | $ | 1,254,344 | |
| Less: Total stock-based employee compensation expense determined under fair value based method for all awards, net of related tax effects | | | (9,081 | ) | | (9,381 | ) | | (29,670 | ) | | (32,460 | ) |
| | |
| |
| |
| |
| |
| Pro forma net income attributable to common stock | | $ | 414,981 | | $ | 344,322 | | $ | 907,508 | | $ | 1,221,884 | |
| | |
| |
| |
| |
| |
| Basic earnings per common share | | $ | 1.02 | | $ | .81 | | $ | 2.24 | | $ | 2.85 | |
| | |
| |
| |
| |
| |
| Pro forma basic earnings per common share | | $ | .99 | | $ | .79 | | $ | 2.16 | | $ | 2.78 | |
| | |
| |
| |
| |
| |
| Diluted earnings per common share | | $ | .95 | | $ | .76 | | $ | 2.10 | | $ | 2.65 | |
| | |
| |
| |
| |
| |
| Pro forma diluted earnings per common share | | $ | .93 | | $ | .74 | | $ | 2.04 | | $ | 2.59 | |
| | |
| |
| |
| |
| |
2. Allowance for Student Loan Losses
The provisions for student loan losses represent the periodic expense of maintaining an allowance sufficient to absorb losses, net of recoveries, inherent in the student loan portfolios. The evaluation of the provisions for student loan losses is inherently subjective as it requires material estimates that may
13
be susceptible to significant changes. The Company believes that the allowance for student loan losses is adequate to cover probable losses in the student loan portfolios.
Third Quarter of 2005 Change in Recovery Methodology
The Company continues to gain experience in analyzing its Private Education Loan portfolios and as a result, it has developed additional data to better estimate the amount of recoveries on defaulted loans. During the third quarter of 2005, the Company changed its methodology for estimating the amount of charged-off student loans that will ultimately be recovered, which resulted in a $49 million reduction in the Company's allowance in the third quarter of 2005 to recognize the effect of this change.
Second Quarter of 2005 Change in Accounting Estimate
In the second quarter of 2005, the Company changed its estimate of the allowance for loan losses and the estimate of uncollectible accrued interest for its loan portfolio using a migration analysis of delinquent and current accounts. A migration analysis is a technique used to estimate the likelihood that a loan receivable may progress through the various delinquency stages and ultimately charge-off.
This is a widely used reserving methodology in the consumer finance industry. Previously, the Company calculated the allowance for Private Education Loan losses by estimating the probable losses in the portfolio based primarily on loan characteristics and where pools of loans were in their life with less emphasis on current delinquency status of the loan. Also, in the Company's prior methodology for calculating the allowance, some loss rates were based on proxies and extrapolations of FFELP loan loss data.
The Company also used a migration analysis to revise its estimates surrounding its non-accrual policy for interest income. Under the new methodology, the Company estimates the amount of uncollectible accrued interest on Private Education Loans and writes it off against current period interest income. Under its prior methodology, Private Education Loans continued to accrue interest, including in periods of forbearance, until they were charged off, at which time, the loans were placed on non-accrual status and all accrued interest was reversed against income in the month of charge-off.
This change in reserving methodology has been accounted for as a change in estimate in accordance with the FASB's APB Opinion No. 20, "Accounting Changes." The cumulative effect of this change to the second quarter of 2005 was to increase the value of the allowance by $40 million and to reduce student loan interest income for the estimate of uncollectible accrued interest receivable by $14 million. On the income statement, adjustments to the allowance are recorded through the provision for losses whereas adjustments to accrued interest are recorded in interest income.
14
The following table summarizes changes in the allowance for student loan losses for both the Private Education Loan and federally insured student loan portfolios for the three and nine months ended September 30, 2005 and 2004.
| | Three months ended
September 30,
| | Nine months ended
September 30,
| |
|---|
| | 2005
| | 2004
| | 2005
| | 2004
| |
|---|
| Balance at beginning of period | | $ | 233,518 | | $ | 197,159 | | $ | 179,664 | | $ | 211,709 | |
| Additions: | | | | | | | | | | | | | |
| | Provisions for student loan losses | | | 8,908 | | | 39,921 | | | 127,425 | | | 103,995 | |
| | Recoveries | | | 5,157 | | | 3,729 | | | 14,670 | | | 9,891 | |
| Deductions: | | | | | | | | | | | | | |
| | Reductions for student loan sales and securitizations | | | — | | | (4,056 | ) | | (5,886 | ) | | (35,887 | ) |
| | Charge-offs | | | (48,624 | ) | | (33,661 | ) | | (116,914 | ) | | (86,265 | ) |
| | Reduction in federal Risk Sharing allowance/provision for EP designation | | | — | | | (31,595 | ) | | — | | | (31,595 | ) |
| Other | | | — | | | 541 | | | — | | | 190 | |
| | |
| |
| |
| |
| |
| Balance at end of period | | $ | 198,959 | | $ | 172,038 | | $ | 198,959 | | $ | 172,038 | |
| | |
| |
| |
| |
| |
In addition to the provisions for student loan losses, provisions for losses on other Company loans totaled $3 million for both the three months ended September 30, 2005 and 2004, respectively, and $10 million and $7 million for the nine months ended September 30, 2005 and 2004, respectively.
15
The following table summarizes changes in the allowance for student loan losses for Private Education Loans for the three and nine months ended September 30, 2005 and 2004.
| | Three months ended
September 30,
| | Nine months ended
September 30,
| |
|---|
(Dollars in millions)
| |
|---|
| | 2005
| | 2004
| | 2005
| | 2004
| |
|---|
| Allowance at beginning of period | | $ | 228 | | $ | 155 | | $ | 172 | | $ | 166 | |
| | Provision for Private Education Loan losses | | | 56 | | | 40 | | | 135 | | | 100 | |
| | Change in estimate | | | — | | | — | | | 40 | | | — | |
| | Change in recovery methodology | | | (49 | ) | | — | | | (49 | ) | | — | |
| | |
| |
| |
| |
| |
| | Total provision | | | 7 | | | 40 | | | 126 | | | 100 | |
| |
Charge-offs |
|
|
(47 |
) |
|
(32 |
) |
|
(113 |
) |
|
(81 |
) |
| | Recoveries | | | 5 | | | 4 | | | 14 | | | 10 | |
| | |
| |
| |
| |
| |
| | Net charge-offs | | | (42 | ) | | (28 | ) | | (99 | ) | | (71 | ) |
| | |
| |
| |
| |
| |
| Balance before securitization of Private Education Loans | | | 193 | | | 167 | | | 199 | | | 195 | |
| Reduction for securitization of Private Education Loans | | | — | | | — | | | (6 | ) | | (28 | ) |
| | |
| |
| |
| |
| |
| Allowance at end of period | | $ | 193 | | $ | 167 | | $ | 193 | | $ | 167 | |
| | |
| |
| |
| |
| |
| Net charge-offs as a percentage of average total loans (annualized) | | | 5.35 | % | | 4.71 | % | | 4.37 | % | | 3.86 | % |
| Allowance as a percentage of the ending total loan balance | | | 2.34 | % | | 3.38 | % | | 2.34 | % | | 3.38 | % |
| Allowance as a percentage of ending loans in repayment | | | 6.00 | % | | 6.93 | % | | 6.00 | % | | 6.93 | % |
| Allowance coverage of net charge-offs (annualized) | | | 1.15 | | | 1.51 | | | 1.46 | | | 1.74 | |
| Average total loans | | $ | 7,193 | | $ | 4,401 | | $ | 6,615 | | $ | 4,640 | |
| Ending total loans | | $ | 8,272 | | $ | 4,939 | | $ | 8,272 | | $ | 4,939 | |
| Average loans in repayment | | $ | 3,150 | | $ | 2,352 | | $ | 3,031 | | $ | 2,480 | |
| Ending loans in repayment | | $ | 3,220 | | $ | 2,408 | | $ | 3,220 | | $ | 2,408 | |
16
Delinquencies
The table below presents the Company's Private Education Loan delinquency trends as of September 30, 2005 and 2004. Delinquencies have the potential to adversely impact earnings through increased servicing and collection costs in the event the delinquent accounts charge off.
| | September 30,
| |
|---|
| | 2005
| | 2004
| |
|---|
(Dollars in millions)
| |
|---|
| | Balance
| | %
| | Balance
| | %
| |
|---|
| Loans in-school/grace/deferment(1) | | $ | 5,042 | | | | $ | 2,522 | | | |
| Loans in forbearance(2) | | | 311 | | | | | 179 | | | |
| Loans in repayment and percentage of each status: | | | | | | | | | | | |
| | Loans current | | | 2,873 | | 89.2 | % | | 2,122 | | 88.1 | % |
| | Loans delinquent 31-60 days(3) | | | 145 | | 4.5 | | | 97 | | 4.0 | |
| | Loans delinquent 61-90 days | | | 75 | | 2.3 | | | 65 | | 2.7 | |
| | Loans delinquent greater than 90 days | | | 127 | | 4.0 | | | 124 | | 5.2 | |
| | |
| |
| |
| |
| |
| | Total Private Education Loans in repayment | | | 3,220 | | 100.0 | % | | 2,408 | | 100.0 | % |
| | |
| |
| |
| |
| |
| Total Private Education Loans, gross | | | 8,573 | | | | | 5,109 | | | |
| Private Education Loan unamortized discount | | | (301 | ) | | | | (170 | ) | | |
| | |
| | | |
| | | |
| Total Private Education Loans | | | 8,272 | | | | | 4,939 | | | |
| Private Education Loan allowance for losses | | | (193 | ) | | | | (167 | ) | | |
| | |
| | | |
| | | |
| Private Education Loans, net | | $ | 8,079 | | | | $ | 4,772 | | | |
| | |
| | | |
| | | |
| Percentage of Private Education Loans in repayment | | | 37.6 | % | | | | 47.1 | % | | |
| | |
| | | |
| | | |
| Delinquencies as a percentage of Private Education Loans in repayment | | | 10.8 | % | | | | 11.9 | % | | |
| | |
| | | |
| | | |
- (1)
- Loans for borrowers who still may be attending school or engaging in other permitted educational activities and are not yet required to make payments on their loans, e.g., residency periods for medical students or a grace period for bar exam preparation.
- (2)
- Loans for borrowers who have requested extension of grace period during employment transition or who have temporarily ceased making full payments due to hardship or other factors, consistent with the established loan program servicing policies and procedures.
- (3)
- The period of delinquency is based on the number of days scheduled payments are contractually past due.
17
3. Goodwill and Acquired Intangible Assets
Intangible assets include the following:
| |
| | As of September 30, 2005
|
|---|
(Dollars in millions)
| |
|
|---|
| | Average
Amortization
Period
| | Gross
| | Accumulated
Amortization
| | Net
|
|---|
| Intangible assets subject to amortization: | | | | | | | | | | | |
| | Customer, services, and lending relationships | | 12 years | | $ | 234 | | $ | (68 | ) | $ | 166 |
| | Tax exempt bond funding(1) | | 10 years | | | 67 | | | (21 | ) | | 46 |
| | Software and technology | | 7 years | | | 80 | | | (47 | ) | | 33 |
| | Non-compete agreements | | 2 years | | | 9 | | | (8 | ) | | 1 |
| | | | |
| |
| |
|
| | Total | | | | | 390 | | | (144 | ) | | 246 |
| | | | |
| |
| |
|
| Intangible assets not subject to amortization: | | | | | | | | | | | |
| | Trade name and trademark | | Indefinite | | | 72 | | | — | | | 72 |
| | | | |
| |
| |
|
| Total acquired intangible assets | | | | $ | 462 | | $ | (144 | ) | $ | 318 |
| | | | |
| |
| |
|
| |
| |
As of December 31, 2004
|
|---|
(Dollars in millions)
| |
|
|---|
| | Average
Amortization
Period
| | Gross
| | Accumulated
Amortization
| | Net
|
|---|
| Intangible assets subject to amortization: | | | | | | | | | | | |
| | Customer, services, and lending relationships | | 12 years | | $ | 239 | | $ | (48 | ) | $ | 191 |
| | Tax exempt bond funding(1) | | 10 years | | | 64 | | | (6 | ) | | 58 |
| | Software and technology | | 7 years | | | 80 | | | (39 | ) | | 41 |
| | Non-compete agreements | | 2 years | | | 9 | | | (7 | ) | | 2 |
| | | | |
| |
| |
|
| | Total | | | | | 392 | | | (100 | ) | | 292 |
| | | | |
| |
| |
|
| Intangible assets not subject to amortization: | | | | | | | | | | | |
| | Trade name and trademark | | Indefinite | | | 71 | | | — | | | 71 |
| | | | |
| |
| |
|
| Total acquired intangible assets | | | | $ | 463 | | $ | (100 | ) | $ | 363 |
| | | | |
| |
| |
|
- (1)
- In connection with the Company's 2004 acquisition of Southwest Student Services Corporation, the Company acquired certain tax exempt bonds that enable the Company to earn a 9.5 percent Special Allowance Payment ("SAP") rate on student loans funded by those bonds in indentured trusts. If a student loan is removed from the trust such that it is no longer funded by the bonds, it ceases earning the 9.5 percent SAP. A different student loan can be substituted in the trust and begin earning the 9.5 percent SAP. This feature remains as long as the bonds are outstanding.
The Company recorded amortization of $16 million and $8 million for the three months ended September 30, 2005 and 2004, respectively, and $44 million and $22 million for the nine months ended September 30, 2005 and 2004, respectively.
18
A summary of changes in the Company's goodwill by reportable segment (see Note 9, "Segment Reporting") is as follows:
| | December 31,
2004
| | Acquisitions/
Adjustments
| | September 30,
2005
|
|---|
(Dollars in millions)
| |
| |
| |
|
|---|
| Lending | | $ | 440 | | $ | (35 | ) | $ | 405 |
| Debt Management Operations | | | 206 | | | 78 | | | 284 |
| Corporate and Other | | | 57 | | | — | | | 57 |
| | |
| |
| |
|
| Total | | $ | 703 | | $ | 43 | | $ | 746 |
| | |
| |
| |
|
In the third quarter of 2005, the Company closed on the second step in a two step purchase of the secondary market and related businesses of Education Assistance Foundation ("EAF") and its affiliate, Student Loan Finance Association ("SLFA") and its subsidiaries, which were initially acquired on December 13, 2004. The initial purchase price for the second closing transaction was approximately $61 million, which resulted in an excess purchase price over the fair value of net assets acquired, or goodwill, of approximately $6 million.
On August 31, 2005, the Company acquired 100 percent of GRP Financial Services ("GRP"), a debt management company that acquires and manages portfolios of sub-performing and non-performing mortgage loans, substantially all of which are secured by one-to-four family residential real estate, for an initial purchase price of approximately $137 million including cash consideration and certain acquisition costs.
Acquisitions are accounted for under the purchase method of accounting as defined in SFAS No. 141, "Business Combinations." The Company allocates the purchase price to the fair value of the acquired tangible assets, liabilities and identifiable intangible assets as of the acquisition date as determined by an independent appraiser. Goodwill associated with the Company's acquisitions is reviewed for impairment in accordance with SFAS No. 142, "Goodwill and Other Intangible Assets," addressed further in Note 2, "Significant Accounting Policies," within the Company's 2004 Annual Report on Form 10-K.
4. Student Loan Securitization
Securitization Activity
The Company securitizes its student loan assets and for transactions qualifying as sales retains a Residual Interest and servicing rights (as the Company retains the servicing responsibilities), all of which are referred to as the Company's Retained Interest in off-balance sheet securitized loans. The Residual Interest is the right to receive cash flows from the student loans and reserve accounts in excess of the amounts needed to pay servicing, derivative costs (if any), other fees, and the principal and interest on the bonds backed by the student loans. The investors of the securitization trusts have no recourse to the Company's other assets should there be a failure of the student loans to pay when due.
19
The following table summarizes the Company's securitization activity for the three and nine months ended September 30, 2005 and 2004. Those securitizations listed as sales are off-balance sheet transactions and those listed as financings remain on-balance sheet.
| | Three months ended September 30,
| |
|---|
| | 2005
| | 2004
| |
|---|
| | No. of
Transactions
| | Amount
Securitized
| | Pre-Tax
Gain
| | Gain %
| | No. of
Transactions
| | Amount
Securitized
| | Pre-Tax
Gain
| | Gain %
| |
|---|
| FFELP Stafford and Other Student Loans | | — | | $ | — | | $ | — | | — | % | 2 | | $ | 4,500 | | $ | 64 | | 1.4 | % |
| Consolidation Loans | | — | | | — | | | — | | — | | — | | | — | | | — | | — | |
| Private Education Loans | | — | | | — | | | — | | — | | — | | | — | | | — | | — | |
| | |
| |
| |
| |
| |
| |
| |
| |
| |
| Total securitizations—sales | | — | | | — | | $ | — | | — | % | 2 | | | 4,500 | | $ | 64 | | 1.4 | % |
| | | | | | | |
| |
| | | | | | |
| |
| |
| Asset-backed commercial paper | | — | | | — | | | | | | | — | | | — | | | | | | |
| Consolidation Loans(1) | | 3 | | | 7,276 | | | | | | | 1 | | | 2,210 | | | | | | |
| | |
| |
| | | | | | |
| |
| | | | | | |
| Total securitizations—financings | | 3 | | | 7,276 | | | | | | | 1 | | | 2,210 | | | | | | |
| | |
| |
| | | | | | |
| |
| | | | | | |
| Total securitizations | | 3 | | $ | 7,276 | | | | | | | 3 | | $ | 6,710 | | | | | | |
| | |
| |
| | | | | | |
| |
| | | | | | |
| |
Nine months ended September 30,
| |
|---|
| | 2005
| | 2004
| |
|---|
| | No. of
Transactions
| | Amount
Securitized
| | Pre-Tax
Gain
| | Gain %
| | No. of
Transactions
| | Amount
Securitized
| | Pre-Tax
Gain
| | Gain %
| |
|---|
| FFELP Stafford and Other Student Loans | | 2 | | $ | 3,530 | | $ | 50 | | 1.4 | % | 4 | | $ | 10,002 | | $ | 134 | | 1.3 | % |
| Consolidation Loans | | 2 | | | 4,011 | | | 31 | | .8 | | — | | | — | | | — | | — | |
| Private Education Loans | | 1 | | | 1,505 | | | 231 | | 15.3 | | 2 | | | 2,535 | | | 241 | | 9.5 | |
| | |
| |
| |
| |
| |
| |
| |
| |
| |
| Total securitizations—sales | | 5 | | | 9,046 | | $ | 312 | | 3.4 | % | 6 | | | 12,537 | | $ | 375 | | 3.0 | % |
| | | | | | | |
| |
| | | | | | |
| |
| |
| Asset-backed commercial paper | | — | | | — | | | | | | | 1 | | | 4,186 | | | | | | |
| Consolidation Loans(1) | | 4 | | | 9,502 | | | | | | | 5 | | | 13,224 | | | | | | |
| | |
| |
| | | | | | |
| |
| | | | | | |
| Total securitizations—financings | | 4 | | | 9,502 | | | | | | | 6 | | | 17,410 | | | | | | |
| | |
| |
| | | | | | |
| |
| | | | | | |
| Total securitizations | | 9 | | $ | 18,548 | | | | | | | 12 | | $ | 29,947 | | | | | | |
| | |
| |
| | | | | | |
| |
| | | | | | |
- (1)
- In certain Consolidation Loan securitization structures, the Company holds certain rights that can affect the remarketing of certain bonds such that these securitizations did not qualify as qualifying special purpose entities ("QSPEs"). Accordingly, they are accounted for on-balance sheet as variable interest entities ("VIEs").
The increase in the gain as a percentage of the amount securitized for the 2005 Private Education Loan securitization versus the prior year's transaction is primarily impacted by higher earnings spreads on the mix of loans securitized, improved funding spreads, and a decrease in the Constant Prepayment Rate ("CPR") assumption used in the calculation of the gain on sale.
20
The table below presents the key assumptions used in estimating the fair value of Residual Interests at the date of securitization resulting from the student loan securitization sale transactions completed during the three and nine months ended September 30, 2005 and 2004.
| | Three months ended September 30,
|
|---|
| | 2005
| | 2004
|
|---|
| | FFELP
Stafford(1)
| | Consolidation(1)
| | Private
Education(1)
| | FFELP
Stafford
| | Consolidation(1)
| | Private
Education(1)
|
|---|
| Prepayment speed | | — | | — | | — | | ** | | — | | — |
| Weighted-average life | | — | | — | | — | | 4.1 | yrs. | — | | — |
| Expected credit losses (% of principal securitized) | | — | | — | | — | | .06 | % | — | | — |
| Residual cash flows discounted at (weighted average) | | — | | — | | — | | 12 | % | — | | — |
| |
Nine months ended September 30,
| |
|---|
| | 2005
| | 2004
| |
|---|
| | FFELP
Stafford
| | Consolidation
| | Private
Education
| | FFELP
Stafford
| | Consolidation(1)
| | Private
Education
| |
|---|
| Prepayment speed | | * | | 6 | % | 3 | % | ** | | — | | 6 | % |
| Weighted-average life | | 4.0 | yrs. | 7.9 | yrs. | 9.0 | yrs. | 4.2 | yrs. | — | | 7.2 | yrs. |
| Expected credit losses (% of principal securitized) | | — | | — | % | 4.38 | % | .12 | % | — | | 4.72 | % |
| Residual cash flows discounted at (weighted average) | | 12 | % | 10.1 | % | 12.4 | % | 12 | % | — | | 12 | % |
- (1)
- No securitizations in the period, or such securitizations did not qualify for sale treatment.
- *
- 20 percent for 2005, 15 percent for 2006 and 6 percent thereafter.
- **
- As a result of updated assumptions, securitizations through August 2004 used a CPR of 20 percent for 2004, 15 percent for 2005 and 6 percent thereafter. Securitizations in September 2004 used a CPR of 20 percent for 2004 through 2005, 15 percent for 2006 and 6 percent thereafter.
21
Retained Interest
The following table summarizes the fair value of the Company's Retained Interests along with the underlying off-balance sheet student loans that relate to those securitizations in transactions that were treated as sales.
| | As of September 30, 2005
| | As of December 31, 2004
|
|---|
| | Retained
Interest
Fair Value
| | Underlying
Securitized
Loan Balance
| | Retained Interest
Fair Value
| | Underlying
Securitized
Loan Balance
|
|---|
(Dollars in millions)
| |
| |
| |
| |
|
|---|
| FFELP Stafford and Other Student Loans | | $ | 782 | | $ | 20,435 | | $ | 1,037 | | $ | 27,444 |
| Consolidation Loans(1) | | | 597 | | | 10,677 | | | 585 | | | 7,393 |
| Private Education Loans | | | 951 | | | 7,529 | | | 694 | | | 6,309 |
| | |
| |
| |
| |
|
| | Total(2) | | $ | 2,330 | | $ | 38,641 | | $ | 2,316 | | $ | 41,146 |
| | |
| |
| |
| |
|
- (1)
- Includes $265 million and $399 million related to the fair value of the Embedded Floor Income as of September 30, 2005 and December 31, 2004, respectively. The decrease in the fair value of the Embedded Floor Income is due to rising interest rates during the period.
- (2)
- Unrealized gains (pre-tax) included in accumulated other comprehensive income related to the Retained Interests totaled $429 million and $445 million as of September 30, 2005 and December 31, 2004, respectively.
The Company recorded $195 million and $61 million of impairment related to the Retained Interests for the nine months ended September 30, 2005 and 2004, respectively. These impairment charges were primarily the result of continued record levels of consolidation activity as well as the Company increasing its expected future CPR assumptions used to value the Residual Interest. FFELP Stafford loans prepaid faster than projected due to the record amount of Consolidation Loan applications received in the second quarter of 2005 that were processed through the Company's securitizations in the third quarter of 2005. This surge in Consolidation Loan activity in 2005 was due to FFELP Stafford borrowers locking in lower interest rates by consolidating their loans prior to the July 1 interest rate reset for FFELP Stafford loans. The level and timing of Consolidation Loan activity is highly volatile, and in response the Company continues to revise its estimate of the effects of Consolidation Loan activity on the Company's Retained Interests. The Company updated its FFELP Stafford CPR assumptions in the third quarter of 2005 as follows:
Year
| | As of
September 30,
2005
| | As of
December 31,
2004
|
|---|
| 2005 | | 30% | | 20% |
| 2006 | | 20% | | 15% |
| 2007 | | 15% | | 6% |
| Thereafter | | 10% | | 6% |
22
In 2004, the Company's Retained Interests were also impaired by the effect of higher market interest rates on the Embedded Floor Income. The impairments are recorded as a reduction in securitization revenue. The level and timing of Consolidation Loan activity remains highly volatile which may result in an additional impairment recorded in future periods if Consolidation Loan activity remains higher than projected.
In addition to student loans in off-balance sheet trusts, the Company had $38.9 billion and $31.5 billion of securitized student loans outstanding (face amount) as of September 30, 2005 and December 31, 2004, respectively, in on-balance sheet securitization trusts.
5. Common Stock
The following table summarizes the Company's common share repurchases, issuances and equity forward activity for the three and nine months ended September 30, 2005 and 2004.
| | Three months ended
September 30,
| | Nine months ended
September 30,
|
|---|
| | 2005
| | 2004
| | 2005
| | 2004
|
|---|
(Shares in millions)
| |
| |
| |
| |
|
|---|
| Common shares repurchased: | | | | | | | | | | | | |
| | Open market | | | — | | | — | | | — | | | .5 |
| | Equity forwards | | | 2.9 | | | 11.4 | | | 9.4 | | | 24.8 |
| | Benefit plans(1) | | | .5 | | | .1 | | | 1.0 | | | 1.0 |
| | |
| |
| |
| |
|
| | Total shares repurchased | | | 3.4 | | | 11.5 | | | 10.4 | | | 26.3 |
| | |
| |
| |
| |
|
| | Average purchase price per share | | $ | 50.12 | | $ | 38.91 | | $ | 49.67 | | $ | 36.21 |
| | |
| |
| |
| |
|
| Common shares issued | | | 1.8 | | | 1.8 | | | 5.3 | | | 7.9 |
| | |
| |
| |
| |
|
| Equity forward contracts: | | | | | | | | | | | | |
| | Outstanding at beginning of period | | | 51.7 | | | 47.2 | | | 42.8 | | | 43.5 |
| | New contracts | | | 1.4 | | | 12.3 | | | 16.8 | | | 29.4 |
| | Exercises | | | (2.9) | | | (11.4) | | | (9.4) | | | (24.8) |
| | |
| |
| |
| |
|
| | Outstanding at end of period | | | 50.2 | | | 48.1 | | | 50.2 | | | 48.1 |
| | |
| |
| |
| |
|
| Authority remaining at end of period to repurchase or enter into equity forwards(2) | | | 19.0 | | | 8.4 | | | 19.0 | | | 8.4 |
| | |
| |
| |
| |
|
- (1)
- Includes shares withheld from stock option exercises and vesting of performance stock to satisfy minimum statutory tax withholding obligations and shares tendered by employees to satisfy option exercise costs.
- (2)
- In October 2004, the Board authorized an additional 30 million shares for repurchase.
23
As of September 30, 2005, the expiration dates and purchase prices for outstanding equity forward contracts were as follows:
Year of maturity
| | Outstanding
contracts
| | Range of
purchase prices
| | Average
purchase price
|
|---|
| | (Shares in millions)
| |
| |
|
|---|
| 2007 | | 9.5 | | $50.47 | | $ | 50.47 |
| 2008 | | 7.9 | | 50.47 | | | 50.47 |
| 2009 | | 16.0 | | 50.47 | | | 50.47 |
| 2010 | | 16.8 | | 47.09 – 51.22 | | | 48.76 |
| | |
| | | |
|
| | | 50.2 | | | | $ | 49.90 |
| | |
| | | |
|
The closing price of the Company's common stock on September 30, 2005 was $53.64.
Earnings per Share
Basic earnings per common share ("basic EPS") is calculated using the weighted average number of shares of common stock outstanding during each period. Diluted earnings per common share ("diluted EPS") reflect the potential dilutive effect of (i) additional common shares that are issuable upon exercise of outstanding stock options, deferred compensation, restricted stock units, and the outstanding commitment to issue shares under the Employee Stock Purchase Plan ("ESPP"), determined by the treasury stock method, (ii) the assumed conversion of convertible debentures, determined by the "if-converted" method, and (iii) equity forwards, determined by the reverse treasury stock method. Equity forwards are dilutive to EPS when the Company's average stock price is lower than the equity forward's strike price.
At September 30, 2005, the Company had $2 billion contingently convertible debentures ("Co-Cos") outstanding that are convertible, under certain conditions, into shares of SLM common stock at an initial conversion price of $65.98. The investors generally can only convert the debentures if the Company's common stock has appreciated for a prescribed period to 130 percent of the conversion price, which would amount to $85.77, or the Company calls the debentures. Per EITF No. 04-8, diluted EPS for all periods presented includes the potential dilutive effect of the Company's outstanding Co-Cos for the three and nine months ended September 30, 2005 and 2004. (See Note 1, "Significant Accounting Policies—Recently Issued Accounting Pronouncements.")
24
A reconciliation of the numerators and denominators of the basic and diluted EPS calculations is as follows for the three and nine months ended September 30, 2005 and 2004:
| | Three months ended
September 30,
| | Nine months ended
September 30,
| |
|---|
| | 2005
| | 2004
| | 2005
| | 2004
| |
|---|
| Numerator: | | | | | | | | | | | | | |
| Net income attributable to common stock | | $ | 424,062 | | $ | 353,703 | | $ | 937,178 | | $ | 1,254,344 | |
| Adjusted for debt expense of Co-Cos, net of taxes | | | 11,971 | | | 5,622 | | | 30,887 | | | 14,280 | |
| | |
| |
| |
| |
| |
| Net income attributable to common stock, adjusted | | $ | 436,033 | | $ | 359,325 | | $ | 968,065 | | $ | 1,268,624 | |
| | |
| |
| |
| |
| |
| Denominator: | | | | | | | | | | | | | |
| Weighted-average shares used to compute basic EPS | | | 417,235 | | | 435,764 | | | 419,205 | | | 439,430 | |
| Effect of dilutive securities: | | | | | | | | | | | | | |
| | Dilutive effect of stock options, deferred compensation, restricted stock units, ESPP, and equity forwards | | | 11,251 | | | 8,379 | | | 11,705 | | | 8,581 | |
| | Dilutive effect of Co-Cos | | | 30,312 | | | 30,312 | | | 30,312 | | | 30,312 | |
| | |
| |
| |
| |
| |
| Dilutive potential common shares | | | 41,563 | | | 38,691 | | | 42,017 | | | 38,893 | |
| | |
| |
| |
| |
| |
| Weighted-average shares used to compute diluted EPS | | | 458,798 | | | 474,455 | | | 461,222 | | | 478,323 | |
| | |
| |
| |
| |
| |
| Net earnings per share: | | | | | | | | | | | | | |
| Basic EPS | | $ | 1.02 | | $ | .81 | | $ | 2.24 | | $ | 2.85 | |
| | Dilutive effect of stock options, deferred compensation, restricted stock units, ESPP, and equity forwards | | | (.03 | ) | | (.01 | ) | | (.06 | ) | | (.05 | ) |
| | Dilutive effect of Co-Cos | | | (.04 | ) | | (.04 | ) | | (.08 | ) | | (.15 | ) |
| | |
| |
| |
| |
| |
| Diluted EPS | | $ | .95 | | $ | .76 | | $ | 2.10 | | $ | 2.65 | |
| | |
| |
| |
| |
| |
- (1)
- For the three months ended September 30, 2005 and 2004, securities of approximately 50 million shares and 4 million shares, respectively, and for the nine months ended September 30, 2005 and 2004, securities of approximately 19 million shares and 4 million shares, respectively, were outstanding but not included in the computation of diluted earnings per share because their inclusion would be antidilutive.
6. Derivative Financial Instruments
Summary of Derivative Financial Statement Impact
The following tables summarize the fair values and notional amounts or number of contracts of all derivative instruments at September 30, 2005 and December 31, 2004 and their impact on other comprehensive income and earnings for the three and nine months ended September 30, 2005 and 2004. At September 30, 2005 and December 31, 2004, $572 million and $524 million (fair value),
25
respectively, of available-for-sale investment securities and $135 million and $222 million, respectively, of cash were pledged as collateral against these derivative instruments.
| | Cash Flow
| | Fair Value
| | Trading
| | Total
| |
|---|
Fair Values
(Dollars in millions)
| | September 30,
2005
| | December 31,
2004
| | September 30,
2005
| | December 31,
2004
| | September 30,
2005
| | December 31,
2004
| | September 30,
2005
| | December 31,
2004
| |
|---|
| Interest rate swaps | | $ | — | | $ | 25 | | $ | (263 | ) | $ | (176 | ) | $ | (40 | ) | $ | (84 | ) | $ | (303 | ) | $ | (235 | ) |
| Floor/Cap contracts | | | — | | | — | | | — | | | — | | | (472 | ) | | (625 | ) | | (472 | ) | | (625 | ) |
| Futures | | | — | | | — | | | — | | | — | | | (1 | ) | | (2 | ) | | (1 | ) | | (2 | ) |
| Equity forwards | | | — | | | — | | | — | | | — | | | 232 | | | 139 | | | 232 | | | 139 | |
| Cross currency interest rate swaps | | | — | | | — | | | 313 | | | 1,839 | | | — | | | — | | | 313 | | | 1,839 | |
| | |
| |
| |
| |
| |
| |
| |
| |
| |
| Total | | $ | — | | $ | 25 | | $ | 50 | | $ | 1,663 | | $ | (281 | ) | $ | (572 | ) | $ | (231 | ) | $ | 1,116 | |
| | |
| |
| |
| |
| |
| |
| |
| |
| |
|
|
|
|
|
|
|
|
|
|
|
|
|
|
|
|
|
|
|
|
|
|
|
|
|
|
Notional Values
(Dollars in billions)
| |
| |
| |
| |
| |
| |
| |
| |
| |
|---|
| Interest rate swaps | | $ | 2.2 | | $ | 5.8 | | $ | 14.5 | | $ | 13.4 | | $ | 128.9 | | $ | 85.9 | | $ | 145.6 | | $ | 105.1 | |
| Floor/Cap contracts | | | — | | | — | | | — | | | — | | | 43.2 | | | 41.7 | | | 43.2 | | | 41.7 | |
| Futures | | | .2 | | | 1.0 | | | — | | | — | | | .6 | | | 6.5 | | | .8 | | | 7.5 | |
| Cross currency interest rate swaps | | | — | | | — | | | 16.2 | | | 13.7 | | | — | | | — | | | 16.2 | | | 13.7 | |
| Other(1) | | | — | | | — | | | — | | | — | | | 2.0 | | | 2.0 | | | 2.0 | | | 2.0 | |
| | |
| |
| |
| |
| |
| |
| |
| |
| |
| Total | | $ | 2.4 | | $ | 6.8 | | $ | 30.7 | | $ | 27.1 | | $ | 174.7 | | $ | 136.1 | | $ | 207.8 | | $ | 170.0 | |
| | |
| |
| |
| |
| |
| |
| |
| |
| |
|
|
|
|
|
|
|
|
|
|
|
|
|
|
|
|
|
|
|
|
|
|
|
|
|
|
Contracts
(Shares in millions)
| |
| |
| |
| |
| |
| |
| |
| |
| |
|---|
| Equity forwards | | | — | | | — | | | — | | | — | | | 50.2 | | | 42.8 | | | 50.2 | | | 42.8 | |
| | |
| |
| |
| |
| |
| |
| |
| |
| |
- (1)
- "Other" consists of an embedded derivative bifurcated from the convertible debenture issuance that relates primarily to certain contingent interest and conversion features of the debt. The embedded derivative has had a de minimis fair value since inception.
26
| | Three months ended September 30,
| |
|---|
| | Cash Flow
| | Fair Value
| | Trading
| | Total
| |
|---|
(Dollars in millions)
| |
|---|
| | 2005
| | 2004
| | 2005
| | 2004
| | 2005
| | 2004
| | 2005
| | 2004
| |
|---|
| Changes to accumulated other comprehensive income, net of tax | | | | | | | | | | | | | | | | | | | | | | | | | |
| Hedge ineffectiveness reclassified to earnings | | $ | — | | $ | 5 | | $ | — | | $ | — | | $ | — | | $ | — | | $ | — | | $ | 5 | |
| Change in fair value to cash flow hedges | | | (2 | ) | | 17 | | | — | | | — | | | — | | | — | | | (2 | ) | | 17 | |
| Amortization of effective hedges and transition adjustment(1) | | | 5 | | | 11 | | | — | | | — | | | — | | | — | | | 5 | | | 11 | |
| | |
| |
| |
| |
| |
| |
| |
| |
| |
| Change in accumulated other comprehensive income, net | | $ | 3 | | $ | 33 | | $ | — | | $ | — | | $ | — | | $ | — | | $ | 3 | | $ | 33 | |
| | |
| |
| |
| |
| |
| |
| |
| |
| |
| Earnings Summary | | | | | | | | | | | | | | | | | | | | | | | | | |
| Amortization of closed futures contracts' gains/losses in interest expense(2) | | $ | (9 | ) | $ | (15 | ) | $ | — | | $ | — | | $ | — | | $ | — | | $ | (9 | ) | $ | (15 | ) |
| Recognition of futures losses related to tendered debt | | | — | | | (8 | ) | | — | | | — | | | — | | | — | | | — | | | (8 | ) |
| Gains (losses) on derivative and hedging activities—Realized(3) | | | — | | | — | | | — | | | — | | | (93 | ) | | (154 | ) | | (93 | ) | | (154 | ) |
| Gains (losses) on derivative and hedging activities—Unrealized | | | — | | | — | | | 8 | (4) | | (1 | )(4) | | 401 | | | 228 | | | 409 | | | 227 | |
| | |
| |
| |
| |
| |
| |
| |
| |
| |
| Total earnings impact | | $ | (9 | ) | $ | (23 | ) | $ | 8 | | $ | (1 | ) | $ | 308 | | $ | 74 | | $ | 307 | | $ | 50 | |
| | |
| |
| |
| |
| |
| |
| |
| |
| |
| |
Nine months ended September 30,
| |
|---|
| | Cash Flow
| | Fair Value
| | Trading
| | Total
| |
|---|
(Dollars in millions)
| |
|---|
| | 2005
| | 2004
| | 2005
| | 2004
| | 2005
| | 2004
| | 2005
| | 2004
| |
|---|
| Changes to accumulated other comprehensive income, net of tax | | | | | | | | | | | | | | | | | | | | | | | | | |
| Hedge ineffectiveness reclassified to earnings | | $ | — | | $ | 8 | | $ | — | | $ | — | | $ | — | | $ | — | | $ | — | | $ | 8 | |
| Change in fair value to cash flow hedges | | | (15 | ) | | 10 | | | — | | | — | | | — | | | — | | | (15 | ) | | 10 | |
| Amortization of effective hedges and transition adjustment(1) | | | 20 | | | 18 | | | — | | | — | | | — | | | — | | | 20 | | | 18 | |
| | |
| |
| |
| |
| |
| |
| |
| |
| |
| Change in accumulated other comprehensive income, net | | $ | 5 | | $ | 36 | | $ | — | | $ | — | | $ | — | | $ | — | | $ | 5 | | $ | 36 | |
| | |
| |
| |
| |
| |
| |
| |
| |
| |
| Earnings Summary | | | | | | | | | | | | | | | | | | | | | | | | | |
| Amortization of closed futures contracts' gains/losses in interest expense(2) | | $ | (32 | ) | $ | (26 | ) | $ | — | | $ | — | | $ | — | | $ | — | | $ | (32 | ) | $ | (26 | ) |
| Recognition of futures losses related to tendered debt | | | — | | | (8 | ) | | — | | | — | | | — | | | — | | | — | | | (8 | ) |
| Losses on derivative and hedging activities—Realized(3) | | | — | | | (4 | ) | | — | | | — | | | (309 | ) | | (547 | ) | | (309 | ) | | (551 | ) |
| Gains (losses) on derivative and hedging activities—Unrealized | | | — | | | — | | | (4 | )(4) | | (4 | )(4) | | 489 | | | 897 | | | 485 | | | 893 | |
| | |
| |
| |
| |
| |
| |
| |
| |
| |
| Total earnings impact | | $ | (32 | ) | $ | (38 | ) | $ | (4 | ) | $ | (4 | ) | $ | 180 | | $ | 350 | | $ | 144 | | $ | 308 | |
| | |
| |
| |
| |
| |
| |
| |
| |
| |
- (1)
- The Company expects to amortize $16 million of after-tax net losses from accumulated other comprehensive income to earnings during the next 12 months related to closed futures contracts that were hedging the forecasted issuance of debt instruments that are outstanding as of September 30, 2005.
- (2)
- For futures contracts that qualify as SFAS No. 133 hedges where the hedged transaction occurs.
- (3)
- Includes net settlement income/expense related to trading derivatives and realized gains and losses related to derivative dispositions.
- (4)
- The change in the fair value of cash flow and fair value hedges represents amounts related to ineffectiveness.
27
7. Pension Plans
Effective July 1, 2004, the Company's qualified and supplemental pension plans (the "Pension Plans") were frozen with respect to new entrants and participants with less than five years of service. Accordingly, at July 1, 2004, the Company recorded a net curtailment gain of $4.5 million. No further benefits will accrue with respect to such participants under the Pension Plans, other than interest accruals on cash balance accounts. These participants were fully vested as of June 30, 2004.
For those participants continuing to accrue benefits under the Pension Plans, benefits are credited using a cash balance formula. Under the formula, each participant has an account, for record keeping purposes only, to which credits are allocated each payroll period based on a percentage of the participant's compensation for the current pay period. The applicable percentage is determined by the participant's number of years of service with the Company. If an individual participated in the Company's prior pension plan as of September 30, 1999 and met certain age and service criteria, the participant ("grandfathered participant") will receive the greater of the benefits calculated under the prior plan, which uses a final average pay plan method, or the current plan under the cash balance formula.
Components of Net Periodic Pension Cost
Net periodic pension cost included the following components:
| | Three months ended
September 30,
| | Nine months ended
September 30,
| |
|---|
| | 2005
| | 2004
| | 2005
| | 2004
| |
|---|
| Service cost—benefits earned during the period | | $ | 2,474 | | $ | 2,287 | | $ | 7,420 | | $ | 8,574 | |
| Interest cost on project benefit obligations | | | 2,805 | | | 2,797 | | | 8,417 | | | 8,426 | |
| Expected return on plan assets | | | (4,109 | ) | | (3,994 | ) | | (12,326 | ) | | (11,679 | ) |
| Net amortization and deferral | | | (30 | ) | | (309 | ) | | (89 | ) | | (1,067 | ) |
| | |
| |
| |
| |
| |
| Net periodic pension cost | | | 1,140 | | | 781 | | | 3,422 | | | 4,254 | |
| Curtailment gain | | | — | | | (4,506 | ) | | — | | | (4,506 | ) |
| | |
| |
| |
| |
| |
| Total net periodic pension cost (benefit) | | $ | 1,140 | | $ | (3,725 | ) | $ | 3,422 | | $ | (252 | ) |
| | |
| |
| |
| |
| |
Employer Contributions
The Company previously disclosed in its financial statements for the year ended December 31, 2004 that it did not expect to contribute to its qualified pension plan (the "Qualified Plan") in 2005. As of September 30, 2005, the Company had made no contributions to its Qualified Plan.
8. Contingencies
The Company was named as a defendant in a putative class action lawsuit brought by three Wisconsin residents on December 20, 2001 in the Superior Court for the District of Columbia. The plaintiffs sought to represent a nationwide class action on behalf of all borrowers who allegedly paid
28
"undisclosed improper and excessive" late fees over the past three years. The plaintiffs sought damages of one thousand five hundred dollars per violation plus punitive damages and claimed that the class consisted of two million borrowers. In addition, the plaintiffs alleged that the Company charged excessive interest by capitalizing interest quarterly in violation of the promissory note. On February 27, 2003, the Superior Court granted the Company's motion to dismiss the complaint in its entirety. On March 4, 2004, the District of Columbia Court of Appeals affirmed the Superior Court's decision granting the Company's motion to dismiss the complaint, but granted plaintiffs leave to re-plead the first count, which alleged violations of the D.C. Consumer Protection Procedures Act. On September 15, 2004, the plaintiffs filed an amended class action complaint. On December 27, 2004, the Superior Court granted the Company's motion to dismiss the plaintiffs' amended compliant. Plaintiffs have appealed the Superior Court's December 27, 2004 dismissal order to the District of Columbia Court of Appeals. All appellate briefing has been completed. The Company believes that it will prevail on the merits of this case if it becomes necessary to further litigate this matter.
The Company is also subject to various claims, lawsuits and other actions that arise in the normal course of business. Most of these matters are claims by borrowers disputing the manner in which their loans have been processed or the accuracy of the Company's reports to credit bureaus. In addition, the collections subsidiaries in the Company's debt management operation group are named in individual plaintiff or class action lawsuits in which the plaintiffs allege that the Company has violated the Fair Debt Collection Practices Act or state law in the process of collecting their account. Management believes that these claims, lawsuits and other actions will not have a material adverse effect on its business, financial condition or results of operations.
9. Segment Reporting
The Company has two primary operating segments as defined in SFAS No. 131, "Disclosures about Segments of an Enterprise and Related Information"—the Lending and Debt Management Operations ("DMO") segments. The Lending and DMO operating segments meet the quantitative thresholds for reportable segments identified in SFAS No. 131. Accordingly, the results of operations of the Company's Lending and DMO segments are presented below. The Company has smaller operating segments including the Guarantor Servicing and Student Loan Servicing operating segments as well as certain other products and services provided to colleges and universities which do not meet the quantitative thresholds identified in SFAS No. 131. Therefore, the results of operations for these operating segments and the revenues and expenses associated with these other products and services are combined with corporate overhead and other corporate activities within the Corporate and Other reporting segment.
The management reporting process measures the performance of the Company's operating segments based on the management structure of the Company as well as the methodology used by management to evaluate performance and allocate resources. Management, including the Company's chief operating decision maker, evaluates the performance of the Company's operating segments based on their profitability. As discussed further below, management measures the profitability of the Company's operating segments based on "core earnings." Accordingly, information regarding the Company's reportable segments is provided based on "core earnings." The Company's "core earnings"
29
are not defined terms within GAAP and may not be comparable to similarly titled measures reported by other companies. "Core earnings" reflect only current period adjustments to GAAP as described below. Unlike financial accounting, there is no comprehensive, authoritative guidance for management reporting. The management reporting process measures the performance of the operating segments based on the management structure of the Company and is not necessarily comparable with similar information for any other financial institution. The Company's operating segments are defined by the products and services they offer or the types of customers they serve, and they reflect the manner in which financial information is currently evaluated by management. Intersegment revenues and expenses are netted within the appropriate financial statement line items consistent with the income statement presentation provided to management. Changes in management structure or allocation methodologies and procedures may result in changes in reported segment financial information.
The Company's principal operations are located in the United States, and its results of operations and long-lived assets in geographic regions outside of the United States are not significant. In the Lending segment, no individual customer accounted for more than ten percent of its total revenue during the three months and nine months ended September 30, 2005 and 2004. United Student Aid Funds, Inc. ("USA Funds") is the Company's largest customer in both the DMO and Corporate and Other segments. During the three months ending September 30, 2005 and 2004, it accounted for 42 percent and 45 percent, respectively, of the aggregate revenues generated by the Company's DMO and Corporate and Other segments. During the nine months ending September 30, 2005 and 2004, USA Funds accounted for 38 percent and 47 percent, respectively, of the aggregate revenues generated by the Company's DMO and Corporate and Other segments. No other customers accounted for more than ten percent of total revenues in those segments for the years mentioned.
Lending
In the Company's Lending business segment, the Company originates and acquires both federally guaranteed student loans, which are administered by ED, and Private Education Loans, which are not federally guaranteed. Private Education Loans are primarily used by borrowers to supplement FFELP loans to meet the rising cost of education. The Company manages student loans for over 8 million borrowers totaling $120.6 billion at September 30, 2005, of which $105.2 billion or 87 percent are federally insured. In addition to education lending, the Company also originates mortgage and consumer loans with the intent of selling the majority of such loans. During the three and nine months ended September 30, 2005, the Company originated $602 million and $1.5 billion, respectively, in mortgage and consumer loans and its mortgage and consumer loan portfolio totaled $603 million at September 30, 2005, of which $259 million pertained to mortgages in the held for sale portfolio.
DMO
The Company provides a wide range of accounts receivable and collections services through six operating units that comprise its DMO operating segment. These services include defaulted student loan portfolio management services, contingency collections services for student loans and other asset classes, student loan default aversion services, and accounts receivable management and investment in purchased portfolios of receivables that have been charged off by their original creditors. The
30
Company's DMO operating segment primarily serves the student loan marketplace through a broad array of default management services on a contingency fee or other pay for performance basis to ten FFELP guarantors and for campus based programs.
In addition to collecting on its own purchased receivables, the DMO operating segment purchases charged-off debt. The DMO operating segment provides receivable management and collection services for large federal agencies, credit card clients and other holders of consumer debt.
Corporate and Other
The Company's Corporate and Other business segment includes the aggregate activity of its smaller operating segments including its Guarantor Servicing and Loan Servicing business segments, other products and services as well as corporate overhead.
Financial Highlights
The tables below include the condensed operating results for each of the Company's reportable segments. Management, including the "chief operating decision maker," evaluates the Company on certain non-GAAP performance measures that the Company refers to as "core earnings" for each business segment. While "core earnings" are not a substitute for reported results under GAAP, the Company relies on "core earnings" in operating each business segment because it believes these measures provide additional information regarding the operational and performance indicators that are most closely assessed by management.
"Core earnings" are the primary financial performance measures used by management to develop the Company's financial plans, track results, and establish corporate performance targets and incentive compensation. Management believes this information provides additional insight into the financial performance of the core business activities of its operating segments. Accordingly, the tables presented below reflect "core earnings" operating measures reviewed and utilized by management to manage the business. Reconciliation of the segment totals to the Company's consolidated operating results in accordance with GAAP are also included in the tables below.
31
Segment Results and Reconciliations to GAAP
| | Three months ended September 30, 2005
|
|---|
(Dollars in millions)
| | Lending
| | DMO
| | Corporate
and Other
| | Segment
Totals
| | Adjustments
| | Total
GAAP
|
|---|
| Interest income: | | | | | | | | | | | | | | | | | | |
| | FFELP Stafford and Other Student Loans | | $ | 586 | | $ | — | | $ | — | | $ | 586 | | $ | (316 | ) | $ | 270 |
| | Consolidation Loans | | | 833 | | | — | | | — | | | 833 | | | (156 | ) | | 677 |
| | Private Education Loans | | | 312 | | | — | | | — | | | 312 | | | (138 | ) | | 174 |
| | Other loans | | | 22 | | | — | | | — | | | 22 | | | — | | | 22 |
| | Cash and investments | | | 113 | | | — | | | — | | | 113 | | | (43 | ) | | 70 |
| | |
| |
| |
| |
| |
| |
|
| Total interest income | | | 1,866 | | | — | | | — | | | 1,866 | | | (653 | ) | | 1,213 |
| Total interest expense | | | 1,306 | | | — | | | — | | | 1,306 | | | (477 | ) | | 829 |
| | |
| |
| |
| |
| |
| |
|
| Net interest income | | | 560 | | | — | | | — | | | 560 | | | (176 | ) | | 384 |
| Less: provisions for losses | | | — | | | — | | | — | | | — | | | 12 | | | 12 |
| | |
| |
| |
| |
| |
| |
|
| Net interest income after provisions for losses | | | 560 | | | — | | | — | | | 560 | | | (188 | ) | | 372 |
| Fee income | | | — | | | 93 | | | 36 | | | 129 | | | — | | | 129 |
| Collections revenue | | | — | | | 42 | | | — | | | 42 | | | — | | | 42 |
| Other income | | | — | | | — | | | 36 | | | 36 | | | 295 | | | 331 |
| Operating expenses | | | 117 | | | 72 | | | 82 | | | 271 | | | 21 | | | 292 |
| Income tax expense (benefit)(1) | | | 164 | | | 23 | | | (4 | ) | | 183 | | | (33 | ) | | 150 |
| Minority interest in net earnings of subsidiaries | | | — | | | 1 | | | — | | | 1 | | | — | | | 1 |
| | |
| |
| |
| |
| |
| |
|
| Net income (loss) | | $ | 279 | | $ | 39 | | $ | (6 | ) | $ | 312 | | $ | 119 | | $ | 431 |
| | |
| |
| |
| |
| |
| |
|
- (1)
- Income taxes are based on a percentage of net income before tax for the individual reportable segment.
32
| |
Three months ended September 30, 2004
|
|---|
| | Lending
| | DMO
| | Corporate
and Other
| | Segment Totals
| | Adjustments
| | Total
GAAP
|
|---|
| Interest income: | | | | | | | | | | | | | | | | | | |
| | FFELP Stafford and Other Student Loans | | $ | 458 | | $ | — | | $ | — | | $ | 458 | | $ | (269 | ) | $ | 189 |
| | Consolidation Loans | | | 368 | | | — | | | — | | | 368 | | | (35 | ) | | 333 |
| | Private Education Loans | | | 165 | | | — | | | — | | | 165 | | | (82 | ) | | 83 |
| | Other loans | | | 18 | | | — | | | — | | | 18 | | | — | | | 18 |
| | Cash and investments | | | 73 | | | — | | | — | | | 73 | | | (11 | ) | | 62 |
| | |
| |
| |
| |
| |
| |
|
| Total interest income | | | 1,082 | | | — | | | — | | | 1,082 | | | (397 | ) | | 685 |
| Total interest expense | | | 616 | | | — | | | — | | | 616 | | | (244 | ) | | 372 |
| | |
| |
| |
| |
| |
| |
|
| Net interest income | | $ | 466 | | $ | — | | $ | — | | $ | 466 | | $ | (153 | ) | $ | 313 |
| Less: provisions for losses | | | (7 | ) | | — | | | — | | | (7 | ) | | 18 | | | 11 |
| | |
| |
| |
| |
| |
| |
|
| Net interest income after provisions for losses | | | 473 | | | — | | | — | | | 473 | | | (171 | ) | | 302 |
| Fee income | | | — | | | 74 | | | 33 | | | 107 | | | — | | | 107 |
| Collections revenue | | | — | | | 5 | | | — | | | 5 | | | — | | | 5 |
| Other income | | | 17 | | | — | | | 46 | | | 63 | | | 291 | | | 354 |
| Loss on GSE debt extinguishment and defeasance | | | 103 | | | — | | | — | | | 103 | | | — | | | 103 |
| Operating expenses | | | 98 | | | 35 | | | 70 | | | 203 | | | 8 | | | 211 |
| Income tax expense (benefit)(1) | | | 104 | | | 16 | | | 3 | | | 123 | | | (26 | ) | | 97 |
| | |
| |
| |
| |
| |
| |
|
| Net income | | $ | 185 | | $ | 28 | | $ | 6 | | $ | 219 | | $ | 138 | | $ | 357 |
| | |
| |
| |
| |
| |
| |
|
- (1)
- Income taxes are based on a percentage of net income before tax for the individual reportable segment.
33
| | Nine months ended September 30, 2005
|
|---|
| | Lending
| | DMO
| | Corporate
and Other
| | Segment
Totals
| | Adjustments
| | Total
GAAP
|
|---|
| Interest income: | | | | | | | | | | | | | | | | | | |
| | FFELP Stafford and Other Student Loans | | $ | 1,678 | | $ | — | | $ | — | | $ | 1,678 | | $ | (978 | ) | $ | 700 |
| | Consolidation Loans | | | 2,080 | | | — | | | — | | | 2,080 | | | (341 | ) | | 1,739 |
| | Private Education Loans | | | 787 | | | — | | | — | | | 787 | | | (357 | ) | | 430 |
| | Other loans | | | 62 | | | — | | | — | | | 62 | | | — | | | 62 |
| | Cash and investments | | | 271 | | | — | | | — | | | 271 | | | (84 | ) | | 187 |
| | |
| |
| |
| |
| |
| |
|
| Total interest income | | | 4,878 | | | — | | | — | | | 4,878 | | | (1,760 | ) | | 3,118 |
| Total interest expense | | | 3,309 | | | — | | | — | | | 3,309 | | | (1,252 | ) | | 2,057 |
| | |
| |
| |
| |
| |
| |
|
| Net interest income | | | 1,569 | | | — | | | — | | | 1,569 | | | (508 | ) | | 1,061 |
| Less: provisions for loan losses | | | 69 | | | — | | | — | | | 69 | | | 69 | | | 138 |
| | |
| |
| |
| |
| |
| |
|
| Net interest income after provisions for losses | | | 1,500 | | | — | | | — | | | 1,500 | | | (577 | ) | | 923 |
| Fee income | | | — | | | 261 | | | 94 | | | 355 | | | — | | | 355 |
| Collections revenue | | | — | | | 119 | | | — | | | 119 | | | — | | | 119 |
| Other income | | | 72 | | | — | | | 97 | | | 169 | | | 745 | | | 914 |
| Operating expenses | | | 357 | | | 201 | | | 233 | | | 791 | | | 51 | | | 842 |
| Income tax expense (benefit)(1) | | | 449 | | | 67 | | | (16 | ) | | 500 | | | 13 | | | 513 |
| Minority interest in net earnings of subsidiaries | | | 2 | | | 3 | | | — | | | 5 | | | — | | | 5 |
| | |
| |
| |
| |
| |
| |
|
| Net income (loss) | | $ | 764 | | $ | 109 | | $ | (26 | ) | $ | 847 | | $ | 104 | | $ | 951 |
| | |
| |
| |
| |
| |
| |
|
- (1)
- Income taxes are based on a percentage of net income before tax for the individual reportable segment.
34
| |
Nine months ended September 30, 2004
|
|---|
| | Lending
| | DMO
| | Corporate
and Other
| | Segment
Totals
| | Adjustments
| | Total
GAAP
|
|---|
| Interest income: | | | | | | | | | | | | | | | | | | |
| | FFELP Stafford and Other Student Loans | | $ | 1,239 | | $ | — | | $ | — | | $ | 1,239 | | $ | (689 | ) | $ | 550 |
| | Consolidation Loans | | | 984 | | | — | | | — | | | 984 | | | (51 | ) | | 933 |
| | Private Education Loans | | | 426 | | | — | | | — | | | 426 | | | (190 | ) | | 236 |
| | Other loans | | | 55 | | | — | | | — | | | 55 | | | — | | | 55 |
| | Cash and investments | | | 176 | | | — | | | — | | | 176 | | | (18 | ) | | 158 |
| | |
| |
| |
| |
| |
| |
|
| Total interest income | | | 2,880 | | | — | | | — | | | 2,880 | | | (948 | ) | | 1,932 |
| Total interest expense | | | 1,536 | | | — | | | — | | | 1,536 | | | (571 | ) | | 965 |
| | |
| |
| |
| |
| |
| |
|
| Net interest income | | | 1,344 | | | — | | | — | | | 1,344 | | | (377 | ) | | 967 |
| Less: provisions for loan losses | | | 78 | | | — | | | — | | | 78 | | | 1 | | | 79 |
| | |
| |
| |
| |
| |
| |
|
| Net interest income after provisions for losses | | | 1,266 | | | — | | | — | | | 1,266 | | | (378 | ) | | 888 |
| Fee income | | | — | | | 224 | | | 91 | | | 315 | | | — | | | 315 |
| Collections revenue | | | — | | | 5 | | | — | | | 5 | | | — | | | 5 |
| Other income | | | 94 | | | — | | | 100 | | | 194 | | | 1,129 | | | 1,323 |
| Loss on GSE debt extinguishment and defeasance | | | 103 | | | — | | | — | | | 103 | | | — | | | 103 |
| Operating expenses | | | 298 | | | 99 | | | 207 | | | 604 | | | 22 | | | 626 |
| Income tax expense (benefit)(1) | | | 345 | | | 47 | | | (6 | ) | | 386 | | | 153 | | | 539 |
| | |
| |
| |
| |
| |
| |
|
| Net income (loss) | | $ | 614 | | $ | 83 | | $ | (10 | ) | $ | 687 | | $ | 576 | | $ | 1,263 |
| | |
| |
| |
| |
| |
| |
|
- (1)
- Income taxes are based on a percentage of net income before tax for the individual reportable segment.
35
The adjustments required to reconcile from the Company's segment totals to its GAAP results of operations relate to differing treatments for securitization transactions, derivatives, Floor Income related to the Company's student loans, and certain other items that management does not consider in evaluating the Company's operating results. The following table reflects aggregate adjustments associated with these areas for the three and nine months ended September 30, 2005 and 2004.
| | Three months ended
September 30,
| | Nine months ended
September 30,
| |
|---|
| | 2005
| | 2004
| | 2005
| | 2004
| |
|---|
| Segment reporting adjustments to GAAP: | | | | | | | | | | | | | |
| | Net impact of securitization accounting(1) | | $ | (253 | ) | $ | (74 | ) | $ | (178 | ) | $ | (19 | ) |
| | Net impact of derivative accounting(2) | | | 409 | | | 230 | | | 488 | | | 891 | |
| | Net impact of Floor Income(3) | | | (54 | ) | | (36 | ) | | (148 | ) | | (122 | ) |
| | Amortization of acquired intangibles(4) | | | (16 | ) | | (8 | ) | | (45 | ) | | (21 | ) |
| | Net tax effect(5) | | | 33 | | | 26 | | | (13 | ) | | (153 | ) |
| | |
| |
| |
| |
| |
| Total segment reporting adjustments to GAAP | | $ | 119 | | $ | 138 | | $ | 104 | | $ | 576 | |
| | |
| |
| |
| |
| |
- (1)
- Securitization: Under GAAP, certain securitization transactions in the Company's Lending segment are accounted for as sales of assets. Under the "core earnings" for the Lending segment, the Company presents all securitization transactions on a Managed Basis as long-term non-recourse financings. The upfront "gains" on sale from securitization transactions as well as ongoing "servicing and securitization revenue" presented in accordance with GAAP are excluded from the "core earnings" and replaced by the interest income, provision for loan losses, and interest expense as they are earned or incurred on the securitization loans. The Company also excludes transactions with its off-balance sheet trusts which would be considered intercompany on a Managed Basis.
- (2)
- Derivative accounting: "Core earnings" exclude periodic unrealized gains and losses arising primarily in the Company's Lending business segment, and to a lesser degree in the Company's Corporate and Other business segment, that are caused primarily by the one-sided mark-to-market derivative valuations prescribed by SFAS No. 133 on derivatives that do not qualify for "hedge treatment" under GAAP. Under "core earnings," the Company recognizes the economic effect of these hedges, which generally results in any cash paid or received being recognized ratably as an expense or revenue over the hedged item's life. The Company also excludes the gain or loss on equity forward contracts that are required to be accounted for in accordance with SFAS No. 133 as derivatives and are marked-to-market through earnings.
- (3)
- Floor Income: The timing and amount (if any) of Floor Income earned in the Company's Lending segment is uncertain and in excess of expected spreads and, therefore, the Company excludes such income from its "core earnings" measures when it is not economically hedged. The Company employs derivatives, primarily Floor Income Contracts and futures, to economically hedge Floor Income. As discussed above in "Derivative Accounting," these derivatives do not qualify as effective accounting hedges and therefore under GAAP are marked-to-market through the "gains (losses) on derivative and hedging activities, net" line on the income statement with no offsetting gain or loss recorded for the economically hedged items. For "core earnings" under the Lending segment, the Company reverses the fair value adjustments on the Floor Income Contracts and futures economically hedging Floor Income and include the amortization of net premiums received (net of Eurodollar futures contracts' realized gains or losses) in income.
- (4)
- Other items: The Company excludes amortization of acquired intangibles.
- (5)
- Such tax effect is based upon the Company's "core earnings" effective tax rate for the year. The net tax effect results primarily from the exclusion of the permanent income tax impact of the equity forward contracts.
36
Item 2. Management's Discussion and Analysis of Financial Condition and Results of Operations
MANAGEMENT'S DISCUSSION AND ANALYSIS OF
FINANCIAL CONDITION AND RESULTS OF OPERATIONS
Three and nine months ended September 30, 2005 and 2004
(Dollars in millions, except per share amounts, unless otherwise stated)
FORWARD-LOOKING AND CAUTIONARY STATEMENTS
Some of the statements contained in this quarterly report discuss future expectations and business strategies or include other "forward-looking" information. Those statements are subject to known and unknown risks, uncertainties and other factors that could cause the actual results to differ materially from those contemplated by the statements. The forward-looking information is based on various factors and was derived using numerous assumptions. We undertake no obligation to publicly update or revise any forward-looking statements.
OVERVIEW
We are the largest source of funding, delivery and servicing support for education loans in the United States. Our primary business is to originate, acquire and hold both federally guaranteed student loans and Private Education Loans, which are not federally guaranteed. The primary source of our earnings is from net interest income earned on those student loans as well as gains on the sales of them in securitization transactions. We also earn fees for pre-default and post-default receivables management services on student loans, such that we are engaged in every phase of the student loan life cycle—from originating and servicing student loans to default prevention and ultimately the collection on defaulted student loans. We also provide a wide range of other financial services, processing capabilities and information technology to meet the needs of educational institutions, lenders, students and their families, and guarantee agencies. SLM Corporation, more commonly known as Sallie Mae, is a holding company that operates through a number of subsidiaries and references in this report to the "Company" refer to SLM Corporation and its subsidiaries.
We have used both internal growth and strategic acquisitions to attain our leadership position in the education finance marketplace. Our sales force, which delivers our products on campuses across the country, is the largest in the student loan industry. The core of our marketing strategy is to promote our on-campus brands, which generate student loan originations through our Preferred Channel. Loans generated through our Preferred Channel are more profitable than loans acquired through other acquisition channels because we own them earlier in the student loan's life and generally incur lower costs to acquire such loans. We have built brand leadership among the Sallie Mae name, the brands of our subsidiaries and those of our lender partners. These sales and marketing efforts are supported by the largest and most diversified servicing capabilities in the industry, providing an unmatched array of servicing capability to financial aid offices.
In recent years we have diversified our business through the acquisition of several companies that provide default management and loan collections services, all of which are combined in our Debt Management Operations ("DMO") business segment. Initially these acquisitions were concentrated in the student loan industry, but through our acquisitions of Arrow Financial Services ("AFS") in September 2004 and GRP Financial Services ("GRP") in August 2005, we expanded our capabilities to include a full range of accounts receivable management services to a number of different industries. The DMO business segment has been expanding rapidly such that revenue grew 71 percent and 66 percent in the three and the nine months ended September 30, 2005, respectively, compared to the same periods in 2004, and we now employ over 3,000 people in this segment.
37
In December 2004, we completed the Wind-Down of the GSE through the defeasance of all remaining GSE debt obligations and dissolution of the GSE's federal charter. The liquidity provided to the Company by the GSE has been replaced primarily by securitizations. In addition to securitizations, we have also increased and diversified our investor base over the last three years to enable us to access a number of additional sources of liquidity including an asset-backed commercial paper program, unsecured revolving credit facilities, and other unsecured corporate debt and equity security issuances.
We manage our business through two primary operating segments: the Lending operating segment and the DMO operating segment. Accordingly, the results of operations of the Company's Lending and DMO segments are presented separately below under "BUSINESS SEGMENTS." These operating segments are considered reportable segments under the Financial Accounting Standards Board's ("FASB") Statement of Financial Accounting Standards ("SFAS") No. 131, "Disclosures about Segments of an Enterprise and Related Information," based on quantitative thresholds applied to the Company's financial statements.
SELECTED FINANCIAL DATA
Condensed Statements of Income
| | Three months ended
September 30,
| | Increase
(decrease)
| | Nine months ended
September 30,
| | Increase
(decrease)
| |
|---|
| | 2005
| | 2004
| | $
| | %
| | 2005
| | 2004
| | $
| | %
| |
|---|
| Net interest income | | $ | 384 | | $ | 313 | | $ | 71 | | 23 | % | $ | 1,061 | | $ | 967 | | $ | 94 | | 10 | % |
| Less: provisions for losses | | | 12 | | | 11 | | | 1 | | 9 | | | 138 | | | 79 | | | 59 | | 75 | |
| | |
| |
| |
| |
| |
| |
| |
| |
| |
| Net interest income after provisions for losses | | | 372 | | | 302 | | | 70 | | 23 | | | 923 | | | 888 | | | 35 | | 4 | |
| Gains on student loan securitizations | | | — | | | 64 | | | (64 | ) | (100 | ) | | 312 | | | 375 | | | (63 | ) | (17 | ) |
| Servicing and securitization revenue | | | (16 | ) | | 159 | | | (175 | ) | (110 | ) | | 277 | | | 419 | | | (142 | ) | (34 | ) |
| Losses on securities, net | | | (43 | ) | | (33 | ) | | (10 | ) | (30 | ) | | (57 | ) | | (37 | ) | | (20 | ) | (54 | ) |
| Gains (losses) on derivative and hedging activities, net | | | 316 | | | 73 | | | 243 | | 333 | | | 176 | | | 342 | | | (166 | ) | (49 | ) |
| Guarantor servicing fees | | | 36 | | | 33 | | | 3 | | 9 | | | 94 | | | 92 | | | 2 | | 2 | |
| Debt management fees | | | 93 | | | 74 | | | 19 | | 26 | | | 261 | | | 224 | | | 37 | | 17 | |
| Collections revenue | | | 42 | | | 5 | | | 37 | | 740 | | | 119 | | | 5 | | | 114 | | 2280 | |
| Other income | | | 74 | | | 91 | | | (17 | ) | (19 | ) | | 206 | | | 223 | | | (17 | ) | (8 | ) |
| Operating expenses | | | 292 | | | 211 | | | 81 | | 38 | | | 842 | | | 626 | | | 216 | | 35 | |
| Loss on GSE debt extinguishment | | | — | | | 103 | | | (103 | ) | (100 | ) | | — | | | 103 | | | (103 | ) | (100 | ) |
| Income taxes | | | 150 | | | 97 | | | 53 | | 55 | | | 513 | | | 539 | | | (26 | ) | (5 | ) |
| Minority interest in net earnings of subsidiaries | | | 1 | | | — | | | 1 | | 100 | | | 5 | | | — | | | 5 | | 100 | |
| | |
| |
| |
| |
| |
| |
| |
| |
| |
| Net income | | | 431 | | | 357 | | | 74 | | 21 | | | 951 | | | 1,263 | | | (312 | ) | (25 | ) |
| Preferred stock dividends | | | 7 | | | 3 | | | 4 | | 133 | | | 14 | | | 9 | | | 5 | | 56 | |
| | |
| |
| |
| |
| |
| |
| |
| |
| |
| Net income attributable to common stock | | $ | 424 | | $ | 354 | | $ | 70 | | 20 | % | $ | 937 | | $ | 1,254 | | $ | (317 | ) | (25 | )% |
| | |
| |
| |
| |
| |
| |
| |
| |
| |
| Basic earnings per common share | | $ | 1.02 | | $ | .81 | | $ | .21 | | 26 | % | $ | 2.24 | | $ | 2.85 | | $ | (.61 | ) | (21 | )% |
| | |
| |
| |
| |
| |
| |
| |
| |
| |
| Diluted earnings per common share | | $ | .95 | | $ | .76 | | $ | .19 | | 25 | % | $ | 2.10 | | $ | 2.65 | | $ | (.55 | ) | (21 | )% |
| | |
| |
| |
| |
| |
| |
| |
| |
| |
| Dividends per common share | | $ | .22 | | $ | .19 | | $ | .03 | | 16 | % | $ | .63 | | $ | .55 | | $ | .08 | | 15 | % |
| | |
| |
| |
| |
| |
| |
| |
| |
| |
38
Condensed Balance Sheets
| |
| |
| | Increase
(decrease)
| |
|---|
| | September 30,
2005
| | December 31,
2004
| |
|---|
| | $
| | %
| |
|---|
| Assets | | | | | | | | | | | | |
| FFELP Stafford and Other Student Loans | | $ | 22,354 | | $ | 18,965 | | $ | 3,389 | | 18 | % |
| Consolidation Loans, net | | | 51,193 | | | 41,596 | | | 9,597 | | 23 | |
| Private Education Loans, net | | | 8,079 | | | 5,420 | | | 2,659 | | 49 | |
| Other loans, net | | | 1,094 | | | 1,048 | | | 46 | | 4 | |
| Cash and investments | | | 3,773 | | | 6,974 | | | (3,201 | ) | (46 | ) |
| Restricted cash and investments | | | 2,707 | | | 2,212 | | | 495 | | 22 | |
| Retained Interest in off-balance sheet securitized loans | | | 2,330 | | | 2,316 | | | 14 | | 1 | |
| Goodwill and acquired intangible assets, net | | | 1,064 | | | 1,066 | | | (2 | ) | — | |
| Other assets | | | 3,726 | | | 4,497 | | | (771 | ) | (17 | ) |
| | |
| |
| |
| |
| |
| Total assets | | $ | 96,320 | | $ | 84,094 | | $ | 12,226 | | 15 | % |
| | |
| |
| |
| |
| |
| Liabilities and Stockholders' Equity | | | | | | | | | | | | |
| Short-term borrowings | | $ | 4,652 | | $ | 2,207 | | $ | 2,445 | | 111 | % |
| Long-term borrowings | | | 84,500 | | | 75,915 | | | 8,585 | | 11 | |
| Other liabilities | | | 3,331 | | | 2,798 | | | 533 | | 19 | |
| | |
| |
| |
| |
| |
| Total liabilities | | | 92,483 | | | 80,920 | | | 11,563 | | 14 | |
| | |
| |
| |
| |
| |
| Minority interest in subsidiaries | | | 14 | | | 72 | | | (58 | ) | (81 | ) |
| Stockholders' equity before treasury stock | | | 6,373 | | | 5,129 | | | 1,244 | | 24 | |
| Common stock held in treasury at cost | | | 2,550 | | | 2,027 | | | 523 | | 26 | |
| | |
| |
| |
| |
| |
| Total stockholders' equity | | | 3,823 | | | 3,102 | | | 721 | | 23 | |
| | |
| |
| |
| |
| |
| Total liabilities and stockholders' equity | | $ | 96,320 | | $ | 84,094 | | $ | 12,226 | | 15 | % |
| | |
| |
| |
| |
| |
39
RESULTS OF OPERATIONS
CONSOLIDATED EARNINGS SUMMARY
Three Months Ended September 30, 2005 Compared to Three Months Ended September 30, 2004
For the three months ended September 30, 2005, net income of $431 million ($.95 diluted earnings per share) was a 21 percent increase over net income of $357 million for the three months ended September 30, 2004. On a pre-tax basis, third quarter of 2005 income of $582 million was a 28 percent increase over $454 million earned in the third quarter of 2004. The smaller percentage increase in year-over-year, after-tax net income versus pre-tax net income is due to the increase in the effective tax rate from 21 percent in the third quarter of 2004 to 26 percent in the third quarter of 2005. Fluctuations in the effective tax rate are driven by the permanent impact of the exclusion of the unrealized gains and losses on equity forward contracts for tax purposes. In the third quarter of 2005 an unrealized gain of $163 million on our outstanding equity forward contracts was excluded from taxable income versus an unrealized gain of $198 million in the third quarter of 2004.
The increase in pre-tax income in the third quarter of 2005 versus the third quarter of 2004 is due to a number of factors, the largest of which is a $243 million increase in the gain on derivative and hedging activities. Quarter-to-quarter income statement fluctuations in derivative and hedging activities are primarily driven by the effect of changes in interest rates on open derivative positions that do not qualify for hedge accounting treatment. The year-over-year increase in the gain on derivatives was primarily caused by higher forward interest rates reducing the mark-to-market value of our outstanding Floor Income Contracts at September 30, 2005, resulting in an unrealized gain of $257 million versus an unrealized loss of $58 million in the same period of 2004. Our Floor Income Contracts are liabilities so decreases in the value results in unrealized gains.
Third quarter income also benefited from the higher average balance of student loans on-balance sheet that increased net interest income by $148 million, partially offset by lower earning spreads on our student loans. The quarter also benefited from a change in methodology for estimating the amount of charged-off student loans that will ultimately be recovered, which resulted in a $49 million reduction in our provisions for loan losses.
In the third quarter of 2005, we incurred impairment losses on our Retained Interest in off-balance sheet securitized loans of $171 million versus $12 million in the year-ago quarter. The third quarter Retained Interest impairments were primarily the result of FFELP Stafford loans prepaying faster than projected due to the record amount of Consolidation Loan applications that were processed in the third quarter of 2005. There were no off-balance sheet securitization transactions in the third quarter of 2005 and therefore, there were no securitization gains versus gains of $64 million in the third quarter of 2004.
Net income for the three months ended September 30, 2004 was negatively impacted by a $103 million pre-tax loss related to the repurchase and defeasance of $3.0 billion of GSE debt in connection with the GSE Wind-Down in fiscal year 2004, of which $1.7 billion was repurchased in the third quarter of 2004.
The year-over-year increase in fee income and collections revenue of $56 million is primarily due to collections revenue from AFS, acquired in September 2004. Positive impacts to pre-tax income were offset by the year-over-year increase in operating expenses of $81 million, primarily attributable to the expenses associated with three subsidiaries acquired in September 2004 and the fourth quarter of 2004: AFS, Southwest Student Services Corporation ("Southwest") and Student Loan Finance Association ("SLFA").
During the third quarter of 2005, we acquired $8.4 billion in student loans, including $2.3 billion in Private Education Loans. In the third quarter of 2004, we acquired $6.1 billion in student loans, of
40
which $1.2 billion were Private Education Loans. In the third quarter of 2005, we originated $7.2 billion of student loans through our Preferred Channel, an increase of 23 percent over the $5.9 billion originated in the third quarter of 2004.
Nine Months Ended September 30, 2005 Compared to Nine Months Ended September 30, 2004
For the nine months ended September 30, 2005, our net income of $951 million ($2.10 diluted earnings per share) decreased 25 percent from net income of $1.3 billion ($2.65 diluted earnings per share) in 2004. Pre-tax income for the nine months ended September 30, 2005 decreased by 18 percent to $1.5 billion from $1.8 billion in the first nine months of 2004. The larger percentage decrease in year-over-year, after-tax net income versus pre-tax net income from 2004 to 2005 is primarily due to the increase in the effective tax rate from 30 percent in the first nine months of 2004 to 35 percent in the first nine months of 2005, caused by the exclusion of unrealized gains and losses on equity forward contracts from pre-tax income for tax purposes, as discussed above. In the first nine months of 2005, when calculating tax expense, we excluded unrealized gains on our outstanding equity forward contracts of $65 million versus unrealized gains of $335 million in the first nine months of 2004.
The decrease in pre-tax income is primarily due to lower gains on derivative and hedging activities of $166 million, caused primarily by market value changes in open derivative positions that do not receive hedge accounting treatment. In the first nine months of 2004, we recorded a gain on derivative and hedging activities of $342 million versus a gain on derivative and hedging activities of $176 million for the same period in 2005.
Results for the first nine months of 2005 were negatively affected by impairment losses on our Retained Interest in off-balance sheet securitized loans of $195 million versus $61 million for the first nine months of 2004. This was primarily due to the third quarter of 2005 impairment of $171 million discussed above.
The year-over-year increase in fee income and collections revenue of $153 million is primarily due to collections revenue from AFS, acquired in the third quarter of 2004. Positive impacts to pre-tax income were offset by the year-over-year increase in operating expenses of $216 million, primarily attributable to the expenses associated with three subsidiaries acquired in the second half of 2004: AFS, Southwest and SLFA.
Net income for the nine months ended September 30, 2004 was also negatively impacted by a $103 million pre-tax loss related to the repurchase and defeasance of $3.0 billion of GSE debt in connection with the GSE Wind-Down in fiscal year 2004, of which $1.7 billion was repurchased in the third quarter of 2004.
Our Managed student loan portfolio grew by $22.3 billion, from $98.3 billion at September 30, 2004 to $120.6 billion at September 30, 2005. This growth was fueled by the acquisition of $23.7 billion of student loans in the first nine months of 2005, a 31 percent increase over the $18.1 billion acquired in the first nine months of 2004. In the first nine months of 2005, we originated $16.8 billion of student loans through our Preferred Channel, an increase of 20 percent over the $14.0 billion originated in the first nine months of 2004.
NET INTEREST INCOME
Net interest income, including interest income and interest expense, is derived primarily from our portfolio of student loans that remain on-balance sheet and to a lesser extent from other loans, cash and investments. The "Taxable Equivalent Net Interest Income" analysis below is designed to facilitate a comparison of non-taxable asset yields to taxable yields on a similar basis. Additional information regarding the return on our student loan portfolio is set forth under "Student Loans—Student Loan
41
Spread Analysis." Information regarding the provisions for losses is included in Note 3 to the consolidated financial statements, "Allowance for Student Loan Losses."
Taxable Equivalent Net Interest Income
The amounts in the following table are adjusted for the impact of certain tax-exempt and tax-advantaged investments based on the marginal federal corporate tax rate of 35 percent.
| | Three months ended
September 30,
| | Increase
(decrease)
| | Nine months ended
September 30,
| | Increase
(decrease)
| |
|---|
| | 2005
| | 2004
| | $
| | %
| | 2005
| | 2004
| | $
| | %
| |
|---|
| Interest income | | | | | | | | | | | | | | | | | | | | | | | |
| | Student loans | | $ | 1,121 | | $ | 605 | | $ | 516 | | 85 | % | $ | 2,869 | | $ | 1,719 | | $ | 1,150 | | 67 | % |
| | Other loans | | | 22 | | | 18 | | | 4 | | 22 | | | 62 | | | 55 | | | 7 | | 13 | |
| | Investments | | | 70 | | | 62 | | | 8 | | 13 | | | 187 | | | 158 | | | 29 | | 18 | |
| | Taxable equivalent adjustment | | | 1 | | | 1 | | | — | | — | | | 3 | | | 5 | | | (2 | ) | (40 | ) |
| | |
| |
| |
| |
| |
| |
| |
| |
| |
| | Total taxable equivalent interest income | | | 1,214 | | | 686 | | | 528 | | 77 | | | 3,121 | | | 1,937 | | | 1,184 | | 61 | |
| Interest expense | | | 829 | | | 372 | | | 457 | | 123 | | | 2,057 | | | 964 | | | 1,093 | | 113 | |
| | |
| |
| |
| |
| |
| |
| |
| |
| |
| Taxable equivalent net interest income | | $ | 385 | | $ | 314 | | $ | 71 | | 23 | % | $ | 1,064 | | $ | 973 | | $ | 91 | | 9 | % |
| | |
| |
| |
| |
| |
| |
| |
| |
| |
Average Balance Sheets
The following table reflects the rates earned on interest earning assets and paid on interest bearing liabilities for the three and nine months ended September 30, 2005 and 2004. This table reflects the net interest margin for the entire Company on a consolidated basis.
| | Three months ended September 30,
| |
|---|
| | 2005
| | 2004
| |
|---|
| | Balance
| | Rate
| | Balance
| | Rate
| |
|---|
| Average Assets | | | | | | | | | | | |
| FFELP Stafford and Other Student Loans | | $ | 21,574 | | 4.97 | % | $ | 18,079 | | 4.15 | % |
| Consolidation Loans | | | 48,774 | | 5.51 | | | 32,042 | | 4.13 | |
| Private Education Loans | | | 7,193 | | 9.57 | | | 4,401 | | 7.53 | |
| Other loans | | | 1,036 | | 8.40 | | | 943 | | 7.98 | |
| Cash and investments | | | 6,621 | | 4.26 | | | 12,238 | | 2.02 | |
| | |
| |
| |
| |
| |
| Total interest earning assets | | | 85,198 | | 5.65 | % | | 67,703 | | 4.03 | % |
| | | | | |
| | | | |
| |
| Non-interest earning assets | | | 6,898 | | | | | 6,409 | | | |
| | |
| | | |
| | | |
| | Total assets | | $ | 92,096 | | | | $ | 74,112 | | | |
| | |
| | | |
| | | |
| Average Liabilities and Stockholders' Equity | | | | | | | | | | | |
| Short-term borrowings | | $ | 4,765 | | 3.95 | % | $ | 5,813 | | 2.40 | % |
| Long-term borrowings | | | 80,125 | | 3.87 | | | 62,428 | | 2.15 | |
| | |
| |
| |
| |
| |
| Total interest bearing liabilities | | | 84,890 | | 3.87 | % | | 68,241 | | 2.17 | % |
| | | | | |
| | | | |
| |
| Non-interest bearing liabilities | | | 3,596 | | | | | 3,080 | | | |
| Stockholders' equity | | | 3,610 | | | | | 2,791 | | | |
| | |
| | | |
| | | |
| | Total liabilities and stockholders' equity | | $ | 92,096 | | | | $ | 74,112 | | | |
| | |
| | | |
| | | |
| Net interest margin | | | | | 1.80 | % | | | | 1.84 | % |
| | | | | |
| | | | |
| |
42
| |
Nine months ended September 30,
| |
|---|
| | 2005
| | 2004
| |
|---|
| | Balance
| | Rate
| | Balance
| | Rate
| |
|---|
| Average Assets | | | | | | | | | | | |
| FFELP Stafford and Other Student Loans | | $ | 20,268 | | 4.62 | % | $ | 19,876 | | 3.70 | % |
| Consolidation Loans | | | 45,081 | | 5.16 | | | 29,557 | | 4.21 | |
| Private Education Loans | | | 6,615 | | 8.69 | | | 4,640 | | 6.81 | |
| Other loans | | | 1,061 | | 7.96 | | | 996 | | 7.69 | |
| Cash and investments | | | 6,523 | | 3.86 | | | 11,333 | | 1.89 | |
| | |
| |
| |
| |
| |
| Total interest earning assets | | | 79,548 | | 5.25 | % | | 66,402 | | 3.90 | % |
| | | | | |
| | | | |
| |
| Non-interest earning assets | | | 6,639 | | | | | 6,479 | | | |
| | |
| | | |
| | | |
| | Total assets | | $ | 86,187 | | | | $ | 72,881 | | | |
| | |
| | | |
| | | |
| Average Liabilities and Stockholders' Equity | | | | | | | | | | | |
| Short-term borrowings | | $ | 4,515 | | 3.72 | % | $ | 12,935 | | 1.85 | % |
| Long-term borrowings | | | 75,044 | | 3.44 | | | 53,992 | | 1.94 | |
| | |
| |
| |
| |
| |
| Total interest bearing liabilities | | | 79,559 | | 3.46 | % | | 66,927 | | 1.92 | % |
| | | | | |
| | | | |
| |
| Non-interest bearing liabilities | | | 3,378 | | | | | 3,235 | | | |
| Stockholders' equity | | | 3,250 | | | | | 2,719 | | | |
| | |
| | | |
| | | |
| Total liabilities and stockholders' equity | | $ | 86,187 | | | | $ | 72,881 | | | |
| | |
| | | |
| | | |
| | Net interest margin | | | | | 1.79 | % | | | | 1.96 | % |
| | | | | |
| | | | |
| |
Rate/Volume Analysis
The following rate/volume analysis illustrates the relative contribution of changes in interest rates and asset volumes.
| |
| | Increase
(decrease)
attributable to
change in
|
|---|
| | Taxable
equivalent
increase
(decrease)
|
|---|
| | Rate
| | Volume
|
|---|
| Three months ended September 30, 2005 vs. three months ended September 30, 2004 | | | | | | | | | |
| Taxable equivalent interest income | | $ | 528 | | $ | 289 | | $ | 239 |
| Interest expense | | | 457 | | | 366 | | | 91 |
| | |
| |
| |
|
| Taxable equivalent net interest income | | $ | 71 | | $ | (77 | ) | $ | 148 |
| | |
| |
| |
|
| |
| |
Increase
(decrease)
attributable to
change in
|
|---|
| | Taxable
equivalent
increase
(decrease)
|
|---|
| | Rate
| | Volume
|
|---|
| Nine months ended September 30, 2005 vs. nine months ended September 30, 2004 | | | | | | | | | |
| Taxable equivalent interest income | | $ | 1,184 | | $ | 649 | | $ | 535 |
| Interest expense | | | 1,093 | | | 904 | | | 189 |
| | |
| |
| |
|
| Taxable equivalent net interest income | | $ | 91 | | $ | (255 | ) | $ | 346 |
| | |
| |
| |
|
43
The decrease in the net interest margin versus the year-ago quarter is primarily due to fluctuations in the student loan spread as discussed under "Student Loans—Student Loan Spread Analysis." In addition to student loan spread related items, the net interest margin in the year-ago quarter was negatively impacted by the higher average balances of lower yielding short-term investments which were being built up during 2004 as additional liquidity in anticipation of the GSE Wind-Down.
Student Loans
For both federally insured and Private Education Loans, we account for premiums paid, discounts received and certain origination costs incurred on the origination and acquisition of student loans in accordance with SFAS No. 91, "Accounting for Nonrefundable Fees and Costs Associated with Originating or Acquiring Loans and Initial Direct Costs of Leases." The unamortized portion of the premiums and discounts is included in the carrying value of the student loans on the consolidated balance sheet. We recognize income on our student loan portfolio based on the expected yield of the student loan after giving effect to the amortization of purchase premiums and the accretion of student loan discounts, as well as interest rate reductions and rebates expected to be earned through borrower benefit programs.
Student Loan Spread Analysis
The following table analyzes the reported earnings from student loans both on-balance sheet and those off-balance sheet in securitization trusts. For student loans off-balance sheet, we will continue to earn securitization and servicing fee revenues over the life of the securitized loan portfolios. The off-balance sheet information is discussed in more detail in "LIQUIDITY AND CAPITAL RESOURCES—Securitization Activities—Servicing and Securitization Revenue" where we analyze the on-going servicing revenue and Residual Interest earned on the securitized portfolios of student loans. For an analysis of our student loan spread for the entire portfolio of Managed student loans on a similar basis to the on-balance sheet analysis, see "LENDING BUSINESS SEGMENT—Student Loan Spread Analysis—Managed Basis."
| | Three months ended
September 30,
| | Nine months ended
September 30,
| |
|---|
| | 2005
| | 2004
| | 2005
| | 2004
| |
|---|
| On-Balance Sheet | | | | | | | | | | | | | |
| Student loan yield, before Floor Income | | | 6.39 | % | | 4.58 | % | | 5.94 | % | | 4.34 | % |
| Floor Income | | | .20 | | | .67 | | | .30 | | | .80 | |
| Consolidation Loan Rebate Fees | | | (.65 | ) | | (.60 | ) | | (.65 | ) | | (.56 | ) |
| Offset Fees | | | — | | | (.01 | ) | | — | | | (.04 | ) |
| Borrower benefits | | | (.04 | ) | | (.12 | ) | | (.11 | ) | | (.16 | ) |
| Premium and discount amortization | | | (.16 | ) | | (.11 | ) | | (.15 | ) | | (.13 | ) |
| | |
| |
| |
| |
| |
| Student loan net yield | | | 5.74 | | | 4.41 | | | 5.33 | | | 4.25 | |
| Student loan cost of funds | | | (3.85 | ) | | (2.15 | ) | | (3.43 | ) | | (1.84 | ) |
| | |
| |
| |
| |
| |
| Student loan spread | | | 1.89 | % | | 2.26 | % | | 1.90 | % | | 2.41 | % |
| | |
| |
| |
| |
| |
| Off-Balance Sheet | | | | | | | | | | | | | |
| Servicing and securitization revenue, before Floor Income | | | (.23 | )% | | 1.31 | % | | .82 | % | | 1.16 | % |
| Floor Income, net of Floor Income previously recognized in gain on sale calculation | | | .07 | | | .18 | | | .06 | | | .25 | |
| | |
| |
| |
| |
| |
| Servicing and securitization revenue | | | (.16 | )% | | 1.49 | % | | .88 | % | | 1.41 | % |
| | |
| |
| |
| |
| |
| Average Balances | | | | | | | | | | | | | |
| On-balance sheet student loans | | $ | 77,541 | | $ | 54,522 | | $ | 71,964 | | $ | 54,073 | |
| Off-balance sheet student loans | | | 40,742 | | | 42,230 | | | 42,137 | | | 39,787 | |
| | |
| |
| |
| |
| |
| Managed student loans | | $ | 118,283 | | $ | 96,752 | | $ | 114,101 | | $ | 93,860 | |
| | |
| |
| |
| |
| |
44
Discussion of Student Loan Spread—Effects of Floor Income and Derivative Accounting
The primary driver of fluctuations in our on-balance sheet student loan spread is the level of gross Floor Income (Floor Income earned before payments on Floor Income Contracts) earned in the period. For the three months ended September 30, 2005 and September 30, 2004, we earned gross Floor Income of $40 million (20 basis points), and $92 million (67 basis points), respectively. The reduction in gross Floor Income is primarily due to the increase in short-term interest rates. We believe that we have economically hedged most of the Floor Income through the sale of Floor Income Contracts, under which we receive an upfront fee and agree to pay the counterparty the Floor Income earned on a notional amount of student loans. These contracts do not qualify for hedge accounting treatment and as a result the payments on the Floor Income Contracts are included on the income statement with "gains (losses) on derivative and hedging activities, net" rather than in student loan interest income. Payments on Floor Income Contracts associated with on-balance sheet student loans for the three months ended September 30, 2005 and September 30, 2004 totaled $38 million (19 basis points) and $86 million (63 basis points), respectively.
In addition to Floor Income Contracts, we also extensively use basis swaps to manage our basis risk associated with interest rate sensitive assets and liabilities. These swaps generally do not qualify as accounting hedges and are likewise required to be accounted for in the "gains (losses) on derivative and hedging activities, net" line on the income statement. As a result, they are not considered in the calculation of the cost of funds in the above table.
Discussion of Student Loan Spread—Effects of Significant Events in the Quarter
In the third quarter of 2005, we revised our method for estimating the qualification for borrower benefits and updated our estimates to account for programmatic changes as well as the effect of continued high levels of consolidations. These updates resulted in a reduction of $16 million or 8 basis points in our borrower benefits reserve in the third quarter.
Discussion of Student Loan Spread—Other Fluctuations
The student loan spread, exclusive of items discussed above, increased in the third quarter 2005 when compared to the year-ago quarter. The increase was due primarily to the increase in the higher yielding Private Education Loans as a percentage of the on-balance sheet portfolio outweighing the negative effect of the increase in lower yielding Consolidation Loans as a percentage of the on-balance sheet portfolio.
For the nine months ended September 30, 2005 versus the year-ago period, the student loan spread was relatively unchanged after considering the effects of Floor Income and significant events discussed above.
45
On-Balance Sheet Floor Income
For on-balance sheet student loans, gross Floor Income is included in student loan income. The following table summarizes the components of Floor Income from on-balance sheet student loans, net of payments under Floor Income Contracts, for the three and nine months ended September 30, 2005 and 2004.
| | Three months ended
| |
|---|
| | September 30, 2005
| | September 30, 2004
| |
|---|
| | Fixed
borrower
Rate
| | Variable
borrower
rate
| | Total
| | Fixed
borrower
Rate
| | Variable
borrower
rate
| | Total
| |
|---|
| Floor Income: | | | | | | | | | | | | | | | | | | | |
| Gross Floor Income | | $ | 40 | | $ | — | | $ | 40 | | $ | 92 | | $ | — | | $ | 92 | |
| Payments on Floor Income Contracts | | | (38 | ) | | — | | | (38 | ) | | (86 | ) | | — | | | (86 | ) |
| | |
| |
| |
| |
| |
| |
| |
| Net Floor Income | | $ | 2 | | $ | — | | $ | 2 | | $ | 6 | | $ | — | | $ | 6 | |
| | |
| |
| |
| |
| |
| |
| |
| Net Floor Income in basis points | | | 1 | | | — | | | 1 | | | 4 | | | — | | | 4 | |
| | |
| |
| |
| |
| |
| |
| |
| |
Nine months ended
| |
|---|
| | September 30, 2005
| | September 30, 2004
| |
|---|
| | Fixed
borrower
Rate
| | Variable
borrower
rate
| | Total
| | Fixed
borrower
Rate
| | Variable
borrower
rate
| | Total
| |
|---|
| Floor Income: | | | | | | | | | | | | | | | | | | | |
| Gross Floor Income | | $ | 162 | | $ | — | | $ | 162 | | $ | 323 | | $ | 2 | | $ | 325 | |
| Payments on Floor Income Contracts | | | (150 | ) | | — | | | (150 | ) | | (296 | ) | | — | | | (296 | ) |
| | |
| |
| |
| |
| |
| |
| |
| Net Floor Income | | $ | 12 | | $ | — | | $ | 12 | | $ | 27 | | $ | 2 | | $ | 29 | |
| | |
| |
| |
| |
| |
| |
| |
| Net Floor Income in basis points | | | 2 | | | — | | | 2 | | | 7 | | | — | | | 7 | |
| | |
| |
| |
| |
| |
| |
| |
The decrease in Floor Income for the periods presented for 2005 versus the periods presented for 2004 is due to an increase in short-term interest rates.
As discussed in more detail under "LIQUIDITY AND CAPITAL RESOURCES—Securitization Activities," when we securitize a portfolio of student loans, we estimate the future Fixed Rate Embedded Floor Income earned on off-balance sheet student loans using a discounted cash flow option pricing model and recognize the fair value of such cash flows in the initial gain on sale and subsequent valuations of the Residual Interest. Variable Rate Embedded Floor Income is recognized as earned in servicing and securitization revenue.
46
Student Loan Floor Income Contracts
The following table analyzes the ability of the FFELP student loans in our Managed student loan portfolio to earn Floor Income after September 30, 2005 and 2004.
| | September 30, 2005
| | September 30, 2004
| |
|---|
(Dollars in billions)
| | Fixed
borrower
Rate
| | Variable
borrower
rate
| | Total
| | Fixed
borrower
Rate
| | Variable
borrower
rate
| | Total
| |
|---|
| Student loans eligible to earn Floor Income: | | | | | | | | | | | | | | | | | | | |
| | On-balance sheet student loans | | $ | 49.6 | | $ | 17.9 | | $ | 67.5 | | $ | 32.7 | | $ | 12.0 | | $ | 44.7 | |
| | Off-balance sheet student loans | | | 10.6 | | | 18.7 | | | 29.3 | | | 7.5 | | | 26.8 | | | 34.3 | |
| | |
| |
| |
| |
| |
| |
| |
| Managed student loans eligible to earn Floor Income | | | 60.2 | | | 36.6 | | | 96.8 | | | 40.2 | | | 38.8 | | | 79.0 | |
| Less: Economically hedged Floor Income contracts | | | (26.0 | ) | | — | | | (26.0 | ) | | (16.4 | ) | | — | | | (16.4 | ) |
| | |
| |
| |
| |
| |
| |
| |
| Net Managed student loans eligible to earn Floor Income | | $ | 34.2 | | $ | 36.6 | | $ | 70.8 | | $ | 23.8 | | $ | 38.8 | | $ | 62.6 | |
| | |
| |
| |
| |
| |
| |
| |
| Net Managed student loans earning Floor Income | | $ | .9 | | $ | — | | $ | .9 | | $ | 12.7 | | $ | .5 | | $ | 13.2 | |
| | |
| |
| |
| |
| |
| |
| |
The following table presents a projection of the average Managed balance of Consolidation Loans whose Fixed Rate Floor Income has already been economically hedged through Floor Income Contracts for the period October 1, 2005 to March 31, 2010. These loans are both on and off-balance sheet and the related hedges do not qualify under SFAS No. 133 accounting as effective hedges.
(Dollars in billions)
| | 2005
| | 2006
| | 2007
| | 2008
| | 2009
| | 2010
|
|---|
| Managed Basis: | | | | | | | | | | | | | | | | | | |
| Average balance of economically hedged Consolidation Loans | | $ | 26 | | $ | 25 | | $ | 16 | | $ | 15 | | $ | 10 | | $ | 2 |
| | |
| |
| |
| |
| |
| |
|
FEDERAL AND STATE TAXES
The Company is subject to federal and state income taxes. Our effective tax rate for the three and nine months ended September 30, 2005 was 26 percent and 35 percent, respectively, versus 21 percent and 30 percent, respectively, for the three and nine months ended September 30, 2004. The effective tax rate reflects the permanent impact of the exclusion of the gains or losses on equity forward contracts recognized under SFAS No. 150, "Accounting for Certain Financial Instruments with Characteristics of both Liabilities and Equity."
BUSINESS SEGMENTS
We manage our business through two primary operating segments: the Lending operating segment and the DMO operating segment. Accordingly, the results of operations of the Company's Lending and DMO segments are presented below. These operating segments are considered reportable segments under SFAS No. 131, "Disclosures about Segments of an Enterprise and Related Information," based on quantitative thresholds applied to the Company's financial statements. In addition, we provide other complementary products and services, including guarantor and student loan servicing, through smaller operating segments that do not meet such thresholds and are aggregated in the Corporate and Other operating segment for financial reporting purposes.
The management reporting process measures the performance of the Company's operating segments based on the management structure of the Company as well as the methodology used by management to evaluate performance and allocate resources. Management, including the Company's chief operating decision maker, evaluates the performance of the Company's operating segments based on their profitability. As discussed further below, management measures the profitability of the
47
Company's operating segments based on "core earnings." Accordingly, information regarding the Company's reportable segments is provided based on "core earnings." Our "core earnings" are not defined terms within generally accepted accounting principles in the United States of America ("GAAP") and may not be comparable to similarly titled measures reported by other companies. "Core earnings" reflect only current period adjustments to GAAP as described below. Unlike financial accounting, there is no comprehensive, authoritative guidance for management reporting. The management reporting process measures the performance of the operating segments based on the management structure of the Company and is not necessarily comparable with similar information for any other financial institution. The Company's operating segments are defined by the products and services they offer or the types of customers they serve, and they reflect the manner in which financial information is currently evaluated by management. Intersegment revenues and expenses are netted within the appropriate financial statement line items consistent with the income statement presentation provided to management. Changes in management structure or allocation methodologies and procedures may result in changes in reported segment financial information.
"Core earnings" are the primary financial performance measures used by management to develop the Company's financial plans, track results, and establish corporate performance targets and incentive compensation. While "core earnings" are not a substitute for reported results under GAAP, the Company relies on "core earnings" in operating its business because "core earnings" permit management to make meaningful period-to-period comparisons of the operational and performance indicators that are most closely assessed by management. Management believes this information provides additional insight into the financial performance of the core business activities of its operating segments. Accordingly, the tables presented below reflect "core earnings" reviewed and utilized by management to manage the business for each of the Company's reportable segments.
| | Three months ended September 30, 2005
| |
|---|
| | Lending
| | DMO
| | Corporate
and Other
| |
|---|
| Interest income: | | | | | | | | | | |
| | FFELP Stafford and Other Student Loans | | $ | 586 | | $ | — | | $ | — | |
| | Consolidation Loans | | | 833 | | | — | | | — | |
| | Private Education Loans | | | 312 | | | — | | | — | |
| | Other loans | | | 22 | | | — | | | — | |
| | Cash and investments | | | 113 | | | — | | | — | |
| | |
| |
| |
| |
| Total interest income | | | 1,866 | | | — | | | — | |
| Total interest expense | | | 1,306 | | | — | | | — | |
| | |
| |
| |
| |
| Net interest income | | | 560 | | | — | | | — | |
| Less: provisions for losses | | | — | | | — | | | — | |
| | |
| |
| |
| |
| Net interest income after provisions for losses | | | 560 | | | — | | | — | |
| Fee income | | | — | | | 93 | | | 36 | |
| Collections revenue | | | — | | | 42 | | | — | |
| Other income | | | — | | | — | | | 36 | |
| Operating expenses | | | 117 | | | 72 | | | 82 | |
| Income tax expense (benefit)(1) | | | 164 | | | 23 | | | (4 | ) |
| Minority interest in net earnings of subsidiaries | | | — | | | 1 | | | — | |
| | |
| |
| |
| |
| Net income (loss) | | $ | 279 | | $ | 39 | | $ | (6 | ) |
| | |
| |
| |
| |
- (1)
- Income taxes are based on a percentage of net income before tax for the individual reportable segment.
48
| | Three months ended September 30, 2004
|
|---|
| | Lending
| | DMO
| | Corporate
and Other
|
|---|
| Interest income: | | | | | | | | | |
| | FFELP Stafford and Other Student Loans | | $ | 458 | | $ | — | | $ | — |
| | Consolidation Loans | | | 368 | | | — | | | — |
| | Private Education Loans | | | 165 | | | — | | | — |
| | Other loans | | | 18 | | | — | | | — |
| | Cash and investments | | | 73 | | | — | | | — |
| | |
| |
| |
|
| Total interest income | | | 1,082 | | | — | | | — |
| Total interest expense | | | 616 | | | — | | | — |
| | |
| |
| |
|
| Net interest income | | | 466 | | | — | | | — |
| Less: provisions for losses | | | (7 | ) | | — | | | — |
| | |
| |
| |
|
| Net interest income after provisions for losses | | | 473 | | | — | | | — |
| Fee income | | | — | | | 74 | | | 33 |
| Collections revenue | | | — | | | 5 | | | — |
| Other income | | | 17 | | | — | | | 46 |
| Loss on GSE debt extinguishment and defeasance | | | 103 | | | — | | | — |
| Operating expenses | | | 98 | | | 35 | | | 70 |
| Income tax expense(1) | | | 104 | | | 16 | | | 3 |
| | |
| |
| |
|
| Net income | | $ | 185 | | $ | 28 | | $ | 6 |
| | |
| |
| |
|
| |
Nine months ended September 30, 2005
| |
|---|
| | Lending
| | DMO
| | Corporate
and Other
| |
|---|
| Interest income: | | | | | | | | | | |
| | FFELP Stafford and Other Student Loans | | $ | 1,678 | | $ | — | | $ | — | |
| | Consolidation Loans | | | 2,080 | | | — | | | — | |
| | Private Education Loans | | | 787 | | | — | | | — | |
| | Other loans | | | 62 | | | — | | | — | |
| | Cash and investments | | | 271 | | | — | | | — | |
| | |
| |
| |
| |
| Total interest income | | | 4,878 | | | — | | | — | |
| Total interest expense | | | 3,309 | | | — | | | — | |
| | |
| |
| |
| |
| Net interest income | | | 1,569 | | | — | | | — | |
| Less: provisions for loan losses | | | 69 | | | — | | | — | |
| | |
| |
| |
| |
| Net interest income after provisions for losses | | | 1,500 | | | — | | | — | |
| Fee income | | | — | | | 261 | | | 94 | |
| Collections revenue | | | — | | | 119 | | | — | |
| Other income | | | 72 | | | — | | | 97 | |
| Operating expenses | | | 357 | | | 201 | | | 233 | |
| Income tax expense (benefit)(1) | | | 449 | | | 67 | | | (16 | ) |
| Minority interest in net earnings of subsidiaries | | | 2 | | | 3 | | | — | |
| | |
| |
| |
| |
| Net income (loss) | | $ | 764 | | $ | 109 | | $ | (26 | ) |
| | |
| |
| |
| |
- (1)
- Income taxes are based on a percentage of net income before tax for the individual reportable segment.
49
| | Nine months ended September 30, 2004
| |
|---|
| | Lending
| | DMO
| | Corporate
and Other
| |
|---|
| Interest income: | | | | | | | | | | |
| | FFELP Stafford and Other Student Loans | | $ | 1,239 | | $ | — | | $ | — | |
| | Consolidation Loans | | | 984 | | | — | | | — | |
| | Private Education Loans | | | 426 | | | — | | | — | |
| | Other loans | | | 55 | | | — | | | — | |
| | Cash and investments | | | 176 | | | — | | | — | |
| | |
| |
| |
| |
| Total interest income | | | 2,880 | | | — | | | — | |
| Total interest expense | | | 1,536 | | | — | | | — | |
| | |
| |
| |
| |
| Net interest income | | | 1,344 | | | — | | | — | |
| Less: provisions for loan losses | | | 78 | | | — | | | — | |
| | |
| |
| |
| |
| Net interest income after provisions for losses | | | 1,266 | | | — | | | — | |
| Fee income | | | — | | | 224 | | | 91 | |
| Collections revenue | | | — | | | 5 | | | — | |
| Other income | | | 94 | | | — | | | 100 | |
| Loss on GSE debt extinguishment and defeasance | | | 103 | | | — | | | — | |
| Operating expenses | | | 298 | | | 99 | | | 207 | |
| Income tax expense (benefit)(1) | | | 345 | | | 47 | | | (6 | ) |
| | |
| |
| |
| |
| Net income (loss) | | $ | 614 | | $ | 83 | | $ | (10 | ) |
| | |
| |
| |
| |
- (1)
- Income taxes are based on a percentage of net income before tax for the individual reportable segment.
Alternative Performance Measures
In accordance with the Rules and Regulations of the Securities and Exchange Commission ("SEC"), we prepare financial statements in accordance with GAAP. In addition to evaluating the Company's GAAP-based financial information, management evaluates the Company's business segments under certain non-GAAP performance measures that we refer to as "core earnings" for each business segment and we refer to this information in our presentations with credit rating agencies and lenders. While "core earnings" are not a substitute for reported results under GAAP, we rely on "core earnings" in operating each business segment because we believe these measures provide additional information regarding the operational and performance indicators that are most closely assessed by management.
Our "core earnings" are the primary financial performance measures used by management to evaluate performance and to allocate resources. Accordingly, financial information is reported to management on a "core earnings" basis by reportable segment, as these are the measures used regularly by our chief operating decision maker. Our "core earnings" are used in developing our financial plans and tracking results, and also in establishing corporate performance targets and determining incentive compensation. Management believes this information provides additional insight into the financial performance of the Company's core business activities. Our "core earnings" are not defined terms within GAAP and may not be comparable to similarly titled measures reported by other companies. "Core earnings" reflect only current period adjustments to GAAP as described below. Accordingly, the Company's "core earnings" presentation does not represent another comprehensive basis of accounting. A more detailed discussion of the differences between GAAP and "core earnings" follows.
50
Limitations on "Core Earnings"
While GAAP provides a uniform, comprehensive basis of accounting, for the reasons described above, management believes that "core earnings" are an important additional tool for providing a more complete understanding of the Company's results of operations. Nevertheless, "core earnings" are subject to certain general and specific limitations that investors should carefully consider. For example, as stated above, unlike financial accounting, there is no comprehensive, authoritative guidance for management reporting. Our "core earnings" are not defined terms within GAAP and may not be comparable to similarly titled measures reported by other companies. Unlike GAAP, the Company's "core earnings" presentation does not represent a comprehensive basis of accounting. Investors, therefore, may not compare our Company's performance with that of other financial services companies based upon "core earnings." "Core earnings" results are only meant to supplement GAAP results by providing additional information regarding the operational and performance indicators that are most closely used by management, the Company's board of directors, rating agencies and lenders to assess performance.
Other limitations arise from the specific adjustments that management makes to GAAP results to derive "core earnings" results. For example, in reversing the unrealized gains and losses that result from SFAS No. 133, "Accounting for Derivative Instruments and Hedging Activities," on derivatives that do not qualify for hedge treatment accounting, as well as on derivatives that do qualify but are in part ineffective because they are not perfect hedges, we focus on the long-term economic effectiveness of those instruments relative to the underlying hedged item and isolate the effects of interest rate volatility, changing credit spreads and changes in our stock price on the fair value of such instruments during the period. Under GAAP, the effects of these factors on the fair value of the derivative instruments (but not on the underlying hedged item) tend to show more volatility in the short term. While our presentation of our results on a Managed Basis provides important information regarding the performance of our Managed portfolio, a limitation on this presentation is that we are presenting the ongoing spread income on loans that have been sold to a trust managed by us. While we believe that our Managed Basis presentation presents the economic substance of our Managed loan portfolio, it understates earnings volatility from securitization gains. Our "core earnings" results exclude certain Floor Income, which is real cash income, from our reported results and therefore may in certain periods understate earnings. Management's financial planning and valuation of operating results, however, does not take into account Floor Income because of its inherent uncertainty, except when it is economically hedged through Floor Income Contracts.
51
Pre-tax differences between "Core Earnings" and GAAP by Business Segment
| | Three months ended September 30,
| |
|---|
| | 2005
| | 2004
| |
|---|
| | Lending
| | DMO
| | Corporate
and Other
| | Lending
| | DMO
| | Corporate
and Other
| |
|---|
| "Core earnings" adjustments to GAAP: | | | | | | | | | | | | | | | | | | | |
| | Net impact of securitization accounting | | $ | (253 | ) | $ | — | | $ | — | | $ | (74 | ) | $ | — | | $ | — | |
| | Net impact of derivative accounting | | | 246 | | | — | | | 163 | | | 32 | | | — | | | 198 | |
| | Net impact of Floor Income | | | (54 | ) | | — | | | — | | | (36 | ) | | — | | | — | |
| | Amortization of acquired intangibles | | | (12 | ) | | (3 | ) | | (1 | ) | | (5 | ) | | (2 | ) | | (1 | ) |
| | |
| |
| |
| |
| |
| |
| |
| Total "core earnings" adjustments to GAAP | | $ | (73 | ) | $ | (3 | ) | $ | 162 | | $ | (83 | ) | $ | (2 | ) | $ | 197 | |
| | |
| |
| |
| |
| |
| |
| |
| |
Nine months ended September 30,
| |
|---|
| | 2005
| | 2004
| |
|---|
| | Lending
| | DMO
| | Corporate
and Other
| | Lending
| | DMO
| | Corporate
and Other
| |
|---|
| "Core earnings" adjustments to GAAP: | | | | | | | | | | | | | | | | | | | |
| | Net impact of securitization accounting | | $ | (178 | ) | $ | — | | $ | — | | $ | (19 | ) | $ | — | | $ | — | |
| | Net impact of derivative accounting | | | 423 | | | — | | | 65 | | | 556 | | | — | | | 335 | |
| | Net impact of Floor Income | | | (148 | ) | | — | | | — | | | (122 | ) | | — | | | — | |
| | Amortization of acquired intangibles | | | (33 | ) | | (4 | ) | | (8 | ) | | (13 | ) | | (5 | ) | | (3 | ) |
| | |
| |
| |
| |
| |
| |
| |
| Total "core earnings" adjustments to GAAP | | $ | 64 | | $ | (4 | ) | $ | 57 | | $ | 402 | | $ | (5 | ) | $ | 332 | |
| | |
| |
| |
| |
| |
| |
| |
Pre-tax differences between "Core Earnings" and GAAP
- 1)
- Securitization: Under GAAP, certain securitization transactions in our Lending segment are accounted for as sales of assets. Under "core earnings," we present all securitization transactions on a Managed Basis as long-term non-recourse financings. The upfront "gains" on sale from securitization transactions as well as ongoing "servicing and securitization revenue" presented in accordance with GAAP are excluded from "core earnings" and replaced by the interest income, provision for loan losses, and interest expense as they are earned or incurred on the securitization loans. We also exclude transactions with our off-balance sheet trusts which would be considered intercompany on a Managed Basis.
- The following table summarizes the securitization adjustments in our Lending business segment for the three and nine months ended September 30, 2005 and 2004.
| | Three months ended
September 30,
| | Nine months ended
September 30,
| |
|---|
| | 2005
| | 2004
| | 2005
| | 2004
| |
|---|
| "Core earnings" securitization adjustments: | | | | | | | | | | | | | |
| Net interest income on securitized loans, after provisions for losses | | $ | (225 | ) | $ | (292 | ) | $ | (740 | ) | $ | (803 | ) |
| Gains on student loan securitizations | | | — | | | 64 | | | 312 | | | 375 | |
| Servicing and securitization revenue | | | (16 | ) | | 159 | | | 277 | | | 419 | |
| Intercompany transactions with off-balance sheet trusts | | | (12 | ) | | (5 | ) | | (27 | ) | | (10 | ) |
| | |
| |
| |
| |
| |
| Total "core earnings" securitization adjustments | | $ | (253 | ) | $ | (74 | ) | $ | (178 | ) | $ | (19 | ) |
| | |
| |
| |
| |
| |
52
- 2)
- Derivative Accounting: "Core earnings" exclude periodic unrealized gains and losses arising primarily in our Lending business segment, and to a lesser degree in our Corporate and Other business segment, that are caused primarily by the one-sided mark-to-market derivative valuations prescribed by SFAS No. 133 on derivatives that do not qualify for "hedge treatment" under GAAP. Under "core earnings," we recognize the economic effect of these hedges, which generally results in any cash paid or received being recognized ratably as an expense or revenue over the hedged item's life. We also exclude the gain or loss on equity forward contracts that are required to be accounted for in accordance with SFAS No. 133 as derivatives and are marked-to-market through earnings.
- SFAS No. 133 requires that changes in the fair value of derivative instruments be recognized currently in earnings unless specific hedge accounting criteria, as specified by SFAS No. 133, are met. We believe that all of our derivatives are effective economic hedges, and as such, are a critical element of our risk management strategy. However, some of our derivatives, primarily Floor Income Contracts, certain Eurodollar futures contracts and certain basis swaps and equity forward contracts (discussed in detail below), do not qualify for "hedge treatment" as defined by SFAS No. 133, and the stand-alone derivative must be marked-to-market in the income statement with no consideration for the corresponding change in fair value of the hedged item. "Gains (losses) on derivatives and hedging activities, net" are primarily caused by interest rate volatility, changing credit spreads and changes in our stock price during the period and the volume and term of derivatives not receiving hedge treatment.
- Our Floor Income Contracts are written options which must meet more stringent requirements than other hedging relationships to achieve hedge effectiveness under SFAS No. 133. Specifically, our Floor Income Contracts do not qualify for hedge accounting treatment because the paydown of principal of the student loans underlying the Floor Income embedded in those student loans does not exactly match the change in the notional amount of our written Floor Income Contracts. Under SFAS No. 133, the upfront payment is deemed a liability and changes in fair value are recorded through income throughout the life of the contract. The change in the value of Floor Income Contracts is primarily caused by changing interest rates that cause the amount of Floor Income earned on the underlying student loans and paid to the counterparties to vary. This is economically offset by the change in value of the student loan portfolio, including our Retained Interests, earning Floor Income but that offsetting change in value is not recognized under SFAS No. 133. We believe the Floor Income Contracts are economic hedges because they effectively fix the amount of Floor Income earned over the contract period, thus eliminating the timing and uncertainty that changes in interest rates can have on Floor Income for that period. Prior to SFAS No. 133, we accounted for Floor Income Contracts as hedges and amortized the upfront cash compensation ratably over the lives of the contracts.
- Basis swaps are used to convert floating rate debt from one interest rate index to another to better match the interest rate characteristics of the assets financed by that debt. We primarily use basis swaps to change the index of our fixed rate and LIBOR-based debt to better match the cash flows of our student loan assets that are primarily indexed to a commercial paper, Prime or Treasury bill index. SFAS No. 133 requires that when using basis swaps, the change in the cash flows of the hedge effectively offset both the change in the cash flows of the asset and the change in the cash flows of the liability. Our basis swaps hedge variable interest rate risk, however they do not meet this effectiveness test because our FFELP student loans can earn at either a variable or a fixed interest rate depending on market interest rates. We also have basis swaps that do not meet the SFAS No. 133 effectiveness test that economically hedge off-balance sheet instruments. As a result, under GAAP these swaps are recorded at fair value with changes in fair value reflected in the income statement.
53
- Generally, a decrease in current interest rates and the respective forward interest rate curves results in an unrealized loss related to our written Floor Income Contracts which is offset by an increase in the value of the economically hedged student loans. This increase is not recognized in income. We will experience unrealized gains/losses related to our basis swaps, if the two underlying indices (and related forward curve) do not move in parallel.
- Under SFAS No. 150, equity forward contracts that allow a net settlement option either in cash or the Company's stock are required to be accounted for in accordance with SFAS No. 133 as derivatives. As a result, we account for our equity forward contracts as derivatives in accordance with SFAS No. 133 and mark them to market through earnings. They do not qualify as effective SFAS No. 133 hedges as a requirement to achieve hedge accounting is the hedged item must impact net income, and the settlement of these contracts through the purchase of our own stock does not impact net income.
- The table below quantifies the adjustments for derivative accounting under SFAS No. 133 on our net income for the three and nine months ended September 30, 2005 and 2004 when compared with the accounting principles employed in all years prior to the SFAS No. 133 implementation.
| | Three months ended
September 30,
| | Nine months ended
September 30,
| |
|---|
| | 2005
| | 2004
| | 2005
| | 2004
| |
|---|
| "Core earnings" derivative adjustments: | | | | | | | | | | | | | |
| Gains (losses) on derivative and hedging activities, net included in other income(1) | | $ | 316 | | $ | 73 | | $ | 176 | | $ | 342 | |
| Less: Realized losses on derivative and hedging activities, net(1) | | | 93 | | | 154 | | | 309 | | | 551 | |
| | |
| |
| |
| |
| |
| Unrealized gains (losses) on derivative and hedging activities, net(1) | | | 409 | | | 227 | | | 485 | | | 893 | |
| Other pre-SFAS No. 133 accounting adjustments | | | — | | | 3 | | | 3 | | | (2 | ) |
| | |
| |
| |
| |
| |
| Total net impact of SFAS No. 133 derivative accounting | | $ | 409 | | $ | 230 | | $ | 488 | | $ | 891 | |
| | |
| |
| |
| |
| |
- (1)
- See "Reclassification of Realized Gains (Losses) on Derivative and Hedging Activities" below for a detailed breakdown of the components of both the realized and unrealized losses on derivative and hedging activities.
54
- SFAS No. 133 requires net settlement income/expense on derivatives and realized gains/losses related to derivative dispositions (collectively referred to as "realized gains (losses) on derivative and hedging activities") that do not qualify as hedges under SFAS No. 133 to be recorded in a separate income statement line item below net interest income. The table below summarizes the realized losses on derivative and hedging activities, and where they are reclassified to on a "core earnings" basis for the three and nine months ended September 30, 2005 and 2004.
| | Three months ended
September 30,
| | Nine months ended
September 30,
| |
|---|
| | 2005
| | 2004
| | 2005
| | 2004
| |
|---|
| Reclassification of realized losses on derivative and hedging activities: | | | | | | | | | | | | | |
| Net settlement expense on Floor Income Contracts reclassified to net interest income | | $ | (57 | ) | $ | (131 | ) | $ | (222 | ) | $ | (451 | ) |
| Net settlement expense on interest rate swaps reclassified to net interest income | | | (36 | ) | | (27 | ) | | (82 | ) | | (49 | ) |
| Net realized losses on closed Eurodollar futures contracts and terminated derivative contracts reclassified to other income | | | — | | | 4 | | | (5 | ) | | (51 | ) |
| | |
| |
| |
| |
| |
| Total reclassifications of realized losses on derivative and hedging activities | | | (93 | ) | | (154 | ) | | (309 | ) | | (551 | ) |
| Add: Unrealized gains (losses) on derivative and hedging activities, net(1) | | | 409 | | | 227 | | | 485 | | | 893 | |
| | |
| |
| |
| |
| |
| Gains (losses) on derivative and hedging activities, net | | $ | 316 | | $ | 73 | | $ | 176 | | $ | 342 | |
| | |
| |
| |
| |
| |
- (1)
- "Unrealized gains (losses) on derivative and hedging activities, net" is comprised of the following unrealized mark-to-market gains/ (losses):
| | Three months
ended
September 30,
| | Nine months
ended
September 30,
|
|---|
| | 2005
| | 2004
| | 2005
| | 2004
|
|---|
| Floor Income Contracts | | $ | 257 | | $ | (58 | ) | $ | 379 | | $ | 502 |
| Equity forward contracts | | | 163 | | | 198 | | | 65 | | | 335 |
| Basis swaps | | | (19 | ) | | 102 | | | 48 | | | 44 |
| Other | | | 8 | | | (15 | ) | | (7 | ) | | 12 |
| | |
| |
| |
| |
|
| Total unrealized gains (losses) on derivative and hedging activities, net | | $ | 409 | | $ | 227 | | $ | 485 | | $ | 893 |
| | |
| |
| |
| |
|
- 3)
- Floor Income: The timing and amount (if any) of Floor Income earned in our Lending segment is uncertain and in excess of expected spreads and, therefore, we exclude such income from "core earnings" when it is not economically hedged. We employ derivatives, primarily Floor Income Contracts and futures, to economically hedge Floor Income. As discussed above in "Derivative Accounting," these derivatives do not qualify as effective accounting hedges and therefore under GAAP are marked-to-market through the "gains (losses) on derivative and hedging activities, net" line on the income statement with no offsetting gain or loss recorded for the economically hedged items. For "core earnings," we reverse the fair value adjustments on the Floor Income Contracts and futures economically hedging Floor Income and include the amortization of net premiums received (net of Eurodollar futures contracts' realized gains or losses) in income.
55
- The following table summarizes the Floor Income adjustments in our Lending business segment for the three and nine months ended September 30, 2005 and 2004.
| | Three months ended
September 30,
| | Nine months ended
September 30,
| |
|---|
| | 2005
| | 2004
| | 2005
| | 2004
| |
|---|
| "Core earnings" Floor Income adjustments: | | | | | | | | | | | | | |
| Floor Income earned on Managed loans, net of payments on Floor Income Contracts | | $ | 2 | | $ | 18 | | $ | 19 | | $ | 69 | |
| Amortization of net premiums on Floor Income Contracts and futures in net interest income | | | (56 | ) | | (54 | ) | | (167 | ) | | (141 | ) |
| Net losses related to closed Eurodollar futures contracts economically hedging Floor Income | | | — | | | — | | | — | | | (50 | ) |
| | |
| |
| |
| |
| |
| Total "core earnings" Floor Income adjustments | | $ | (54 | ) | $ | (36 | ) | $ | (148 | ) | $ | (122 | ) |
| | |
| |
| |
| |
| |
- 4)
- Other Items: We exclude amortization of acquired intangibles. The 2005 increase in the amortization of acquired intangibles is driven by the acquisition of definite life intangible assets in connection with our acquisitions of AFS, Southwest, and SLFA.
LENDING BUSINESS SEGMENT
In our Lending business segment, we originate and acquire federally guaranteed student loans, which are administered by the U.S. Department of Education ("ED"), and Private Education Loans, which are not federally guaranteed. The majority of our Private Education Loans is made in conjunction with a FFELP Stafford loan and as a result is marketed through the same marketing channels as FFELP Stafford Loans. While FFELP student loans and Private Education Loans have different overall risk profiles due to the federal guarantee of the FFELP student loans, they share many of the same characteristics such as similar repayment terms, the same marketing channel and sales force, and are originated and serviced on the same servicing platform. In addition, Private Education Loans made to sudents attending Title IV schools to cover the cost of attendence are not dischargeable in bankruptcy unless the borrower can meet the very difficult burden of proving undue hardship. Finally, where possible, the borrower receives a single bill for both the federally guaranteed and privately underwritten loans.
56
The following table summarizes the "core earnings" results of operations for our Lending business segment.
| |
| |
| | %
Increase
(Decrease)
| |
| |
| | %
Increase
(Decrease)
| |
|---|
| | Three months
ended
September 30,
| | Nine months
ended
September 30,
| |
|---|
| | 2005 vs.
2004
| | 2005 vs.
2004
| |
|---|
| | 2005
| | 2004
| | 2005
| | 2004
| |
|---|
| Managed Basis interest income: | | | | | | | | | | | | | | | | | |
| | Managed FFELP and Other Student Loans | | $ | 586 | | $ | 458 | | 28 | % | $ | 1,678 | | $ | 1,239 | | 35 | % |
| | Managed Consolidation loans | | | 833 | | | 368 | | 126 | | | 2,080 | | | 984 | | 111 | |
| | Managed Private Education Loans | | | 312 | | | 165 | | 89 | | | 787 | | | 426 | | 85 | |
| | Other loans | | | 22 | | | 18 | | 22 | | | 62 | | | 55 | | 13 | |
| | Cash and investments | | | 113 | | | 73 | | 55 | | | 271 | | | 176 | | 54 | |
| | |
| |
| |
| |
| |
| |
| |
| Total Managed interest income | | | 1,866 | | | 1,082 | | 72 | | | 4,878 | | | 2,880 | | 69 | |
| Total Managed interest expense | | | 1,306 | | | 616 | | 112 | | | 3,309 | | | 1,536 | | 115 | |
| | |
| |
| |
| |
| |
| |
| |
| Net Managed interest income | | | 560 | | | 466 | | 20 | | | 1,569 | | | 1,344 | | 17 | |
| Less: provisions for losses | | | — | | | (7 | ) | (100 | ) | | 69 | | | 78 | | (12 | ) |
| | |
| |
| |
| |
| |
| |
| |
| Net interest income after provisions for losses | | | 560 | | | 473 | | 18 | | | 1,500 | | | 1,266 | | 18 | |
| Other income | | | — | | | 17 | | (100 | ) | | 72 | | | 94 | | (23 | ) |
| Loss on GSE debt extinguishment and defeasance | | | — | | | 103 | | (100 | ) | | — | | | 103 | | (100 | ) |
| Operating expenses | | | 117 | | | 98 | | 19 | | | 357 | | | 298 | | 20 | |
| | |
| |
| |
| |
| |
| |
| |
| Income before income taxes and minority interest in net earnings of subsidiaries | | | 443 | | | 289 | | 53 | | | 1,215 | | | 959 | | 27 | |
| Income taxes | | | 164 | | | 104 | | 58 | | | 449 | | | 345 | | 30 | |
| | |
| |
| |
| |
| |
| |
| |
| Income before minority interest in net earnings of subsidiaries | | | 279 | | | 185 | | 51 | | | 766 | | | 614 | | 25 | |
| Minority interest in net earnings of subsidiaries | | | — | | | — | | — | | | 2 | | | — | | 100 | |
| | |
| |
| |
| |
| |
| |
| |
| Net income | | $ | 279 | | $ | 185 | | 51 | % | $ | 764 | | $ | 614 | | 24 | % |
| | |
| |
| |
| |
| |
| |
| |
57
Summary of our Managed Student Loan Portfolio
The following tables summarize the components of our Managed student loan portfolio and show the changing composition of our portfolio.
Ending Balances (net of allowance for loan losses):
| | September 30, 2005
| |
|---|
| | FFELP
Stafford and
Other(1)
| | Consolidation
Loans
| | Total
FFELP
| | Private
Education
Loans
| | Total
| |
|---|
| On-balance sheet | | $ | 22,354 | | $ | 51,193 | | $ | 73,547 | | $ | 8,079 | | $ | 81,626 | |
| Off-balance sheet | | | 20,728 | | | 10,968 | | | 31,696 | | | 7,312 | | | 39,008 | |
| | |
| |
| |
| |
| |
| |
| Total Managed | | $ | 43,082 | | $ | 62,161 | | $ | 105,243 | | $ | 15,391 | | $ | 120,634 | |
| | |
| |
| |
| |
| |
| |
| % of on-balance sheet Federal | | | 30 | % | | 70 | % | | 100 | % | | | | | | |
| % of Managed Federal | | | 41 | % | | 59 | % | | 100 | % | | | | | | |
| % of Total | | | 36 | % | | 52 | % | | 87 | % | | 13 | % | | 100 | % |
| |
December 31, 2004
| |
|---|
| | FFELP
Stafford and
Other(1)
| | Consolidation
Loans
| | Total
FFELP
| | Private
Education
Loans
| | Total
| |
|---|
| On-balance sheet | | $ | 18,965 | | $ | 41,596 | | $ | 60,561 | | $ | 5,420 | | $ | 65,981 | |
| Off-balance sheet | | | 27,825 | | | 7,570 | | | 35,395 | | | 6,062 | | | 41,457 | |
| | |
| |
| |
| |
| |
| |
| Total Managed | | $ | 46,790 | | $ | 49,166 | | $ | 95,956 | | $ | 11,482 | | $ | 107,438 | |
| | |
| |
| |
| |
| |
| |
| % of on-balance sheet Federal | | | 31 | % | | 69 | % | | 100 | % | | | | | | |
| % of Managed Federal | | | 49 | % | | 51 | % | | 100 | % | | | | | | |
| % of Total | | | 44 | % | | 45 | % | | 89 | % | | 11 | % | | 100 | % |
- (1)
- Other includes PLUS, SLS and HEAL loans.
58
Average Balances:
| |
Three months ended September 30, 2005
| |
|---|
| | FFELP
Stafford and
Other(1)
| | Consolidation
Loans
| | Total
FFELP
| | Private
Education
Loans
| | Total
| |
|---|
| On-balance sheet | | $ | 21,574 | | $ | 48,774 | | $ | 70,348 | | $ | 7,193 | | $ | 77,541 | |
| Off-balance sheet | | | 22,250 | | | 11,094 | | | 33,344 | | | 7,398 | | | 40,742 | |
| | |
| |
| |
| |
| |
| |
| Total Managed | | $ | 43,824 | | $ | 59,868 | | $ | 103,692 | | $ | 14,591 | | $ | 118,283 | |
| | |
| |
| |
| |
| |
| |
| % of on-balance sheet Federal | | | 31 | % | | 69 | % | | 100 | % | | | | | | |
| % of Managed Federal | | | 42 | % | | 58 | % | | 100 | % | | | | | | |
| % of Total | | | 37 | % | | 51 | % | | 88 | % | | 12 | % | | 100 | % |
| |
Three months ended September 30, 2004
| |
|---|
| | FFELP
Stafford and
Other(1)
| | Consolidation
Loans
| | Total
FFELP
| | Private
Education
Loans
| | Total
| |
|---|
| On-balance sheet | | $ | 18,079 | | $ | 32,042 | | $ | 50,121 | | $ | 4,401 | | $ | 54,522 | |
| Off-balance sheet | | | 28,417 | | | 7,575 | | | 35,992 | | | 6,238 | | | 42,230 | |
| | |
| |
| |
| |
| |
| |
| Total Managed | | $ | 46,496 | | $ | 39,617 | | $ | 86,113 | | $ | 10,639 | | $ | 96,752 | |
| | |
| |
| |
| |
| |
| |
| % of on-balance sheet Federal | | | 36 | % | | 64 | % | | 100 | % | | | | | | |
| % of Managed Federal | | | 54 | % | | 46 | % | | 100 | % | | | | | | |
| % of Total | | | 48 | % | | 41 | % | | 89 | % | | 11 | % | | 100 | % |
| |
Nine months ended September 30, 2005
| |
|---|
| | FFELP
Stafford and
Other(1)
| | Consolidation
Loans
| | Total
FFELP
| | Private
Education
Loans
| | Total
| |
|---|
| On-balance sheet | | $ | 20,268 | | $ | 45,081 | | $ | 65,349 | | $ | 6,615 | | $ | 71,964 | |
| Off-balance sheet | | | 25,783 | | | 9,481 | | | 35,264 | | | 6,873 | | | 42,137 | |
| | |
| |
| |
| |
| |
| |
| Total Managed | | $ | 46,051 | | $ | 54,562 | | $ | 100,613 | | $ | 13,488 | | $ | 114,101 | |
| | |
| |
| |
| |
| |
| |
| % of on-balance sheet Federal | | | 31 | % | | 69 | % | | 100 | % | | | | | | |
| % of Managed Federal | | | 46 | % | | 54 | % | | 100 | % | | | | | | |
| % of Total | | | 40 | % | | 48 | % | | 88 | % | | 12 | % | | 100 | % |
| |
Nine months ended September 30, 2004
| |
|---|
| | FFELP
Stafford and
Other(1)
| | Consolidation
Loans
| | Total
FFELP
| | Private
Education
Loans
| | Total
| |
|---|
| On-balance sheet | | $ | 19,876 | | $ | 29,557 | | $ | 49,433 | | $ | 4,640 | | $ | 54,073 | |
| Off-balance sheet | | | 26,786 | | | 7,741 | | | 34,527 | | | 5,260 | | | 39,787 | |
| | |
| |
| |
| |
| |
| |
| Total Managed | | $ | 46,662 | | $ | 37,298 | | $ | 83,960 | | $ | 9,900 | | $ | 93,860 | |
| | |
| |
| |
| |
| |
| |
| % of on-balance sheet Federal | | | 40 | % | | 60 | % | | 100 | % | | | | | | |
| % of Managed Federal | | | 55 | % | | 45 | % | | 100 | % | | | | | | |
| % of Total | | | 49 | % | | 40 | % | | 89 | % | | 11 | % | | 100 | % |
- (1)
- Other includes PLUS, SLS and HEAL loans.
59
Student Loan Spread Analysis—Managed Basis
The following table analyzes the earnings from our portfolio of Managed student loans on a "core earnings" basis (see "Pre-tax differences between 'Core Earnings' and GAAP"). This analysis includes both on-balance sheet and off-balance sheet loans in securitization trusts and derivatives economically hedging these line items and excludes unhedged Floor Income while including the amortization of upfront payments on Floor Income Contracts.
| | Three months ended
September 30,
| | Nine months ended
September 30,
| |
|---|
| | 2005
| | 2004
| | 2005
| | 2004
| |
|---|
| Managed Basis student loan yield | | | 6.55 | % | | 4.67 | % | | 6.04 | % | | 4.39 | % |
| Consolidation Loan Rebate Fees | | | (.52 | ) | | (.42 | ) | | (.49 | ) | | (.41 | ) |
| Offset Fees | | | — | | | — | | | — | | | (.02 | ) |
| Borrower benefits | | | (.04 | ) | | (.02 | ) | | (.06 | ) | | (.07 | ) |
| Premium and discount amortization | | | (.18 | ) | | (.15 | ) | | (.17 | ) | | (.12 | ) |
| | |
| |
| |
| |
| |
| Managed Basis student loan net yield | | | 5.81 | | | 4.08 | | | 5.32 | | | 3.77 | |
| Managed Basis student loan cost of funds | | | (4.00 | ) | | (2.16 | ) | | (3.54 | ) | | (1.85 | ) |
| | |
| |
| |
| |
| |
| Managed Basis student loan spread | | | 1.81 | % | | 1.92 | % | | 1.78 | % | | 1.92 | % |
| | |
| |
| |
| |
| |
| Average Balances | | | | | | | | | | | | | |
| On-balance sheet student loans | | $ | 77,541 | | $ | 54,522 | | $ | 71,964 | | $ | 54,073 | |
| Off-balance sheet student loans | | | 40,742 | | | 42,230 | | | 42,137 | | | 39,787 | |
| | |
| |
| |
| |
| |
| Managed student loans | | $ | 118,283 | | $ | 96,752 | | $ | 114,101 | | $ | 93,860 | |
| | |
| |
| |
| |
| |
Discussion of Managed Basis Student Loan Spread—Effects of Significant Events in the Quarter
In the third quarter of 2005, we updated our estimates for the qualification for borrower benefits to account for programmatic changes as well as the effect of continued high levels of Consolidations. These updates resulted in a reduction of $21 million or 7 basis points in our borrower benefits reserve in the third quarter.
The increase to premium and discount amortization in the third quarter was impacted by the surge in Consolidation Loan activity in the second quarter as we wrote-off the balance of unamortized premiums associated with loans that consolidate with third parties as a current period expense in accordance with SFAS No. 91 (as discussed under "Net Interest Income—Student Loans").
Discussion of Managed Basis Student Loan Spread—Other Fluctuations
The decrease in the Managed student loan spread versus the year-ago quarter is primarily due to the increase in the average balance of Consolidation Loans as a percentage of the Managed portfolio. Consolidation Loans have lower spreads than other FFELP loans due primarily to the 105 basis point Consolidation Loan Rebate Fee. These negative effects are partially offset by the higher SAP spread earned on Consolidation Loans and lower student loan premium amortization due to their extended term. When compared to the year-ago quarter, the third quarter of 2005 spread was also negatively impacted by higher premium amortization, primarily caused by the purchase price allocation for student loans acquired in acquisitions, and by lower amortization of the upfront fee received on Floor Income Contracts.
The third quarter 2005 Managed student loan spread benefited from the increase in the average balance of Managed Private Education Loans as a percentage of the average Managed student loan portfolio from 11 percent in the third quarter 2004 to 12 percent in the third quarter 2005. Private Education Loans are subject to credit risk and therefore earn higher spreads, which averaged
60
4.75 percent in the third quarter of 2005 for the Managed Private Education Loan portfolio versus a spread of 1.31 percent in the third quarter of 2005 for the Managed guaranteed student loan portfolio, excluding the impact from the update to our estimates for the qualification for borrower benefits.
Private Education Loans
All Private Education Loans are initially acquired on-balance sheet. When we securitize Private Education Loans, we reduce the on-balance sheet allowance for amounts previously provided for in the allowance and then provide for these loans in the Managed presentation only as they are no longer owned by the Company.
When Private Education Loans in securitized trusts become 180 days delinquent, we typically exercise our contingent call option to repurchase these loans at par value out of the trust and record a loss for the difference in the par value paid and the fair market value of the loan at the time of purchase. If these loans reach the 212th day of delinquency, a charge-off for the remaining balance of the loan is triggered. On a Managed Basis, the losses recorded under GAAP at the time of repurchase of delinquent Private Education Loans are considered charge-offs when the delinquent Private Education Loans reach the 212-day charge-off date. These charge-offs are shown in the off-balance sheet section in the table below.
The off-balance sheet allowance as a percentage of ending loans in repayment is lower than the on-balance sheet percentage because of the different mix of loans on-balance sheet and off-balance sheet. Certain loan types with higher expected default rates, such as career training and other programs with lower FICO scores, have not yet been securitized.
Allowance for Private Education Loan Losses
Third Quarter of 2005 Change in Recovery Methodology
We continue to gain experience in analyzing our Private Education Loan portfolios and as a result, we have developed additional data to better estimate the amount of recoveries on defaulted loans. During the third quarter of 2005, we changed our methodology for estimating the amount of charged-off student loans that will ultimately be recovered, which resulted in a $49 million decrease in the value of the allowance through the provision for loan losses. On a Managed Basis, we decreased the allowance for loan losses by $65 million to recognize the effect of this change.
Second Quarter of 2005 Change in Accounting Estimate
In the second quarter of 2005, we changed our estimate of the allowance for loan losses and the estimate of uncollectible accrued interest for our Managed loan portfolio using a migration analysis of delinquent and current accounts. A migration analysis is a technique used to estimate the likelihood that a loan receivable may progress through the various delinquency stages and ultimately charge-off.
This is a widely used reserving methodology in the consumer finance industry. Previously, we calculated the allowance for Private Education Loan losses by estimating the probable losses in the portfolio based primarily on loan characteristics and where pools of loans were in their life with less emphasis on current delinquency status of the loan. Also, in our prior methodology for calculating the allowance, some loss rates were based on proxies and extrapolations of FFELP loan loss data.
We also used a migration analysis to revise our estimates surrounding our non-accrual policy for interest income. Under the new methodology, we estimate the amount of uncollectible accrued interest on Private Education Loans and write it off against current period interest income. Under our prior methodology, Private Education Loans continued to accrue interest, including in periods of forbearance, until they were charged off, at which time, the loans were placed on non-accrual status and all accrued interest was reversed against income in the month of charge-off.
61
This change in reserving methodology has been accounted for as a change in estimate in accordance with the FASB's Accounting Principles Board ("APB") Opinion No. 20, "Accounting Changes." The cumulative effect of this change to the second quarter of 2005 was to increase the value of the allowance by $40 million and to reduce student loan interest income for the estimate of uncollectible accrued interest receivable by $14 million. On the income statement, adjustments to the allowance are recorded through the provision for loan losses whereas adjustments to accrued interest are recorded in interest income. On a Managed Basis, we decreased the allowance for loan losses by $20 million and reduced student loan interest income by $16 million for uncollectible accrued interest.
The difference in the impact of the change in estimate on the allowance for loan losses between our on-balance sheet and our Managed results is due to the difference in the mix of Private Education Loans on-and off- balance sheet. Certain loan types with higher expected default rates, such as career training and other loan programs with lower FICO scores, have not yet been securitized and as such the on-balance sheet portfolio contains loans with higher delinquency rates. Because the required allowance under the new methodology is more directly tied to the current status of the portfolio, the on-balance sheet portfolio reserve requirements increased while the off-balance sheet portfolio reserve requirements decreased with the net effect being a decrease in the Managed Basis allowance.
Activity in the Allowance for Private Education Loan Losses
The provision for student loan losses represents the periodic expense of maintaining an allowance sufficient to absorb losses, net of recoveries, inherent in the portfolio of Private Education Loans.
The following table summarizes changes in the allowance for Private Education Loan losses for the three and nine months ended September 30, 2005 and 2004.
| | Activity in Allowance for Private Education Loan Losses
| |
|---|
| | On-Balance Sheet
| | Off-Balance Sheet
| | Managed Basis
| |
|---|
| | Three months ended
| | Three months ended
| | Three months ended
| |
|---|
| | September 30,
2005
| | September 30,
2004
| | September 30,
2005
| | September 30,
2004
| | September 30,
2005
| | September 30,
2004
| |
|---|
| Allowance at beginning of period | | $ | 228 | | $ | 155 | | $ | 91 | | $ | 133 | | $ | 319 | | $ | 288 | |
| | Provision for Private Education Loan losses | | | 56 | | | 40 | | | 4 | | | 12 | | | 60 | | | 52 | |
| | Change in recovery methodology | | | (49 | ) | | — | | | (16 | ) | | — | | | (65 | ) | | — | |
| | |
| |
| |
| |
| |
| |
| |
| | Total provision | | | 7 | | | 40 | | | (12 | ) | | 12 | | | (5 | ) | | 52 | |
| |
Charge-offs |
|
|
(47 |
) |
|
(32 |
) |
|
— |
|
|
(1 |
) |
|
(47 |
) |
|
(33 |
) |
| | Recoveries | | | 5 | | | 4 | | | — | | | — | | | 5 | | | 4 | |
| | |
| |
| |
| |
| |
| |
| |
| | Net charge-offs | | | (42 | ) | | (28 | ) | | — | | | (1 | ) | | (42 | ) | | (29 | ) |
| | |
| |
| |
| |
| |
| |
| |
| Balance before securitization of Private Education Loans | | | 193 | | | 167 | | | 79 | | | 144 | | | 272 | | | 311 | |
| Reduction for securitization of Private Education Loans | | | — | | | — | | | — | | | — | | | — | | | — | |
| | |
| |
| |
| |
| |
| |
| |
| Allowance at end of period | | $ | 193 | | $ | 167 | | $ | 79 | | $ | 144 | | $ | 272 | | $ | 311 | |
| | |
| |
| |
| |
| |
| |
| |
| Net charge-offs as a percentage of average loans in repayment (annualized) | | | 5.35 | % | | 4.71 | % | | — | % | | .11 | % | | 2.42 | % | | 2.29 | % |
| Allowance as a percentage of the ending total loan balance | | | 2.34 | % | | 3.38 | % | | 1.07 | % | | 2.32 | % | | 1.74 | % | | 2.79 | % |
| Allowance as a percentage of ending loans in repayment | | | 6.00 | % | | 6.93 | % | | 2.13 | % | | 5.52 | % | | 3.93 | % | | 6.20 | % |
| Average coverage of net charge-offs (annualized) | | | 1.15 | | | 1.51 | | | — | | | 49.88 | | | 1.62 | | | 2.73 | |
| Average total loans | | $ | 7,193 | | $ | 4,401 | | $ | 7,398 | | $ | 6,238 | | $ | 14,591 | | $ | 10,639 | |
| Ending total loans | | $ | 8,272 | | $ | 4,939 | | $ | 7,391 | | $ | 6,220 | | $ | 15,663 | | $ | 11,159 | |
| Average loans in repayment | | $ | 3,150 | | $ | 2,352 | | $ | 3,814 | | $ | 2,621 | | $ | 6,964 | | $ | 4,973 | |
| Ending loans in repayment | | $ | 3,220 | | $ | 2,408 | | $ | 3,705 | | $ | 2,610 | | $ | 6,925 | | $ | 5,018 | |
62
| | Activity in Allowance for Private Education Loan Losses
| |
|---|
| | On-Balance Sheet
| | Off-Balance Sheet
| | Managed Basis
| |
|---|
| | Nine months ended
| | Nine months ended
| | Nine months ended
| |
|---|
| | September 30,
2005
| | September 30,
2004
| | September 30,
2005
| | September 30,
2004
| | September 30,
2005
| | September 30,
2004
| |
|---|
| Allowance at beginning of period | | $ | 172 | | $ | 166 | | $ | 143 | | $ | 93 | | $ | 315 | | $ | 259 | |
| | Provision for Private Education Loan losses | | | 135 | | | 100 | | | 9 | | | 27 | | | 144 | | | 127 | |
| | Change in estimate | | | 40 | | | — | | | (60 | ) | | — | | | (20 | ) | | — | |
| | Change in recovery methodology | | | (49 | ) | | — | | | (16 | ) | | — | | | (65 | ) | | — | |
| | |
| |
| |
| |
| |
| |
| |
| | Total provision | | | 126 | | | 100 | | | (67 | ) | | 27 | | | 59 | | | 127 | |
| |
Charge-offs |
|
|
(113 |
) |
|
(81 |
) |
|
(3 |
) |
|
(4 |
) |
|
(116 |
) |
|
(85 |
) |
| | Recoveries | | | 14 | | | 10 | | | — | | | — | | | 14 | | | 10 | |
| | |
| |
| |
| |
| |
| |
| |
| | Net charge-offs | | | (99 | ) | | (71 | ) | | (3 | ) | | (4 | ) | | (102 | ) | | (75 | ) |
| | |
| |
| |
| |
| |
| |
| |
| Balance before securitization of Private Education Loans | | | 199 | | | 195 | | | 73 | | | 116 | | | 272 | | | 311 | |
| Reduction for securitization of Private Education Loans | | | (6 | ) | | (28 | ) | | 6 | | | 28 | | | — | | | — | |
| | |
| |
| |
| |
| |
| |
| |
| Allowance at end of period | | $ | 193 | | $ | 167 | | $ | 79 | | $ | 144 | | $ | 272 | | $ | 311 | |
| | |
| |
| |
| |
| |
| |
| |
| Net charge-offs as a percentage of average loans in repayment (annualized) | | | 4.37 | % | | 3.86 | % | | .09 | % | | .19 | % | | 2.07 | % | | 2.12 | % |
| Allowance as a percentage of the ending total loan balance | | | 2.34 | % | | 3.38 | % | | 1.07 | % | | 2.32 | % | | 1.74 | % | | 2.79 | % |
| Allowance as a percentage of ending loans in repayment | | | 6.00 | % | | 6.93 | % | | 2.13 | % | | 5.52 | % | | 3.93 | % | | 6.20 | % |
| Average coverage of net charge-offs (annualized) | | | 1.46 | | | 1.74 | | | 24.00 | | | 33.53 | | | 2.01 | | | 3.11 | |
| Average total loans | | $ | 6,615 | | $ | 4,640 | | $ | 6,873 | | $ | 5,260 | | $ | 13,488 | | $ | 9,900 | |
| Ending total loans | | $ | 8,272 | | $ | 4,939 | | $ | 7,391 | | $ | 6,220 | | $ | 15,663 | | $ | 11,159 | |
| Average loans in repayment | | $ | 3,031 | | $ | 2,480 | | $ | 3,529 | | $ | 2,239 | | $ | 6,560 | | $ | 4,719 | |
| Ending loans in repayment | | $ | 3,220 | | $ | 2,408 | | $ | 3,705 | | $ | 2,610 | | $ | 6,925 | | $ | 5,018 | |
The increase in charge-offs over the year-ago quarter is primarily due to the 38 percent growth in the portfolio in repayment on a Managed Basis.
The year-over-year allowance on a Managed Basis increased by $46 million, exclusive of the changes in estimate and methodology, due to the growth in the repayment portfolio. Also, under the new allowance methodology adopted in the second quarter of 2005, we provide for losses over a shorter period of time versus the prior methodology. Consequently, the year-over-year growth rate in the provision is less than the growth rate in the portfolio.
The reduction in the allowance for loan losses as a percentage of loans in repayment is due to the second quarter change in estimate and to the third quarter improvement in our estimate of recoveries of previously defaulted loans discussed above. The decrease is also due to the shorter time period for which we calculate our allowance under the migration analysis adopted in the second quarter.
63
Delinquencies
The table below presents our Private Education Loan delinquency trends as of September 30, 2005 and 2004. Delinquencies have the potential to adversely impact earnings through increased servicing and collection costs in the event the delinquent accounts charge off.
| | On-Balance Sheet Private Education
Loan Delinquencies
| |
|---|
| | September 30, 2005
| | September 30, 2004
| |
|---|
| | Balance
| | %
| | Balance
| | %
| |
|---|
| Loans in-school/grace/deferment(1) | | $ | 5,042 | | | | $ | 2,522 | | | |
| Loans in forbearance(2) | | | 311 | | | | | 179 | | | |
| Loans in repayment and percentage of each status: | | | | | | | | | | | |
| | Loans current | | | 2,873 | | 89.2 | % | | 2,122 | | 88.1 | % |
| | Loans delinquent 31-60 days(3) | | | 145 | | 4.5 | | | 97 | | 4.0 | |
| | Loans delinquent 61-90 days | | | 75 | | 2.3 | | | 65 | | 2.7 | |
| | Loans delinquent greater than 90 days | | | 127 | | 4.0 | | | 124 | | 5.2 | |
| | |
| |
| |
| |
| |
| | Total Private Education Loans in repayment | | | 3,220 | | 100.0 | % | | 2,408 | | 100.0 | % |
| | |
| |
| |
| |
| |
| Total Private Education Loans, gross | | | 8,573 | | | | | 5,109 | | | |
| Private Education Loan unamortized discount | | | (301 | ) | | | | (170 | ) | | |
| | |
| | | |
| | | |
| Total Private Education Loans | | | 8,272 | | | | | 4,939 | | | |
| Private Education Loan allowance for losses | | | (193 | ) | | | | (167 | ) | | |
| | |
| | | |
| | | |
| Private Education Loans, net | | $ | 8,079 | | | | $ | 4,772 | | | |
| | |
| | | |
| | | |
| Percentage of Private Education Loans in repayment | | | 37.6 | % | | | | 47.1 | % | | |
| | |
| | | |
| | | |
| Delinquencies as a percentage of Private Education Loans in repayment | | | 10.8 | % | | | | 11.9 | % | | |
| | |
| | | |
| | | |
| |
Off-Balance Sheet Private Education
Loan Delinquencies
| |
|---|
| | September 30, 2005
| | September 30, 2004
| |
|---|
| | Balance
| | %
| | Balance
| | %
| |
|---|
| Loans in-school/grace/deferment(1) | | $ | 3,272 | | | | $ | 3,251 | | | |
| Loans in forbearance(2) | | | 552 | | | | | 455 | | | |
| Loans in repayment and percentage of each status: | | | | | | | | | | | |
| | Loans current | | | 3,514 | | 94.9 | % | | 2,456 | | 94.1 | % |
| | Loans delinquent 31-60 days(3) | | | 94 | | 2.5 | | | 67 | | 2.6 | |
| | Loans delinquent 61-90 days | | | 38 | | 1.0 | | | 42 | | 1.6 | |
| | Loans delinquent greater than 90 days | | | 59 | | 1.6 | | | 45 | | 1.7 | |
| | |
| |
| |
| |
| |
| | Total Private Education Loans in repayment | | | 3,705 | | 100.0 | % | | 2,610 | | 100.0 | % |
| | |
| |
| |
| |
| |
| Total Private Education Loans, gross | | | 7,529 | | | | | 6,316 | | | |
| Private Education Loan unamortized discount | | | (138 | ) | | | | (96 | ) | | |
| | |
| | | |
| | | |
| Total Private Education Loans | | | 7,391 | | | | | 6,220 | | | |
| Private Education Loan allowance for losses | | | (79 | ) | | | | (144 | ) | | |
| | |
| | | |
| | | |
| Private Education Loans, net | | $ | 7,312 | | | | $ | 6,076 | | | |
| | |
| | | |
| | | |
| Percentage of Private Education Loans in repayment | | | 49.2 | % | | | | 41.3 | % | | |
| | |
| | | |
| | | |
| Delinquencies as a percentage of Private Education Loans in repayment | | | 5.1 | % | | | | 5.9 | % | | |
| | |
| | | |
| | | |
64
| | Managed Private Education
Loan Delinquencies
| |
|---|
| | September 30, 2005
| | September 30, 2004
| |
|---|
| | Balance
| | %
| | Balance
| | %
| |
|---|
| Loans in-school/grace/deferment(1) | | $ | 8,314 | | | | $ | 5,773 | | | |
| Loans in forbearance(2) | | | 863 | | | | | 634 | | | |
| Loans in repayment and percentage of each status: | | | | | | | | | | | |
| | Loans current | | | 6,387 | | 92.2 | % | | 4,578 | | 91.2 | % |
| | Loans delinquent 31-60 days(3) | | | 239 | | 3.5 | | | 164 | | 3.3 | |
| | Loans delinquent 61-90 days | | | 113 | | 1.6 | | | 107 | | 2.1 | |
| | Loans delinquent greater than 90 days | | | 186 | | 2.7 | | | 169 | | 3.4 | |
| | |
| |
| |
| |
| |
| | Total Private Education Loans in repayment | | | 6,925 | | 100.0 | % | | 5,018 | | 100.0 | % |
| | |
| |
| |
| |
| |
| Total Private Education Loans, gross | | | 16,102 | | | | | 11,425 | | | |
| Private Education Loan unamortized discount | | | (439 | ) | | | | (266 | ) | | |
| | |
| | | |
| | | |
| Total Private Education Loans | | | 15,663 | | | | | 11,159 | | | |
| Private Education Loan allowance for losses | | | (272 | ) | | | | (311 | ) | | |
| | |
| | | |
| | | |
| Private Education Loans, net | | $ | 15,391 | | | | $ | 10,848 | | | |
| | |
| | | |
| | | |
| Percentage of Private Education Loans in repayment | | | 43.0 | % | | | | 43.9 | % | | |
| | |
| | | |
| | | |
| Delinquencies as a percentage of Private Education Loans in repayment | | | 7.8 | % | | | | 8.8 | % | | |
| | |
| | | |
| | | |
- (1)
- Loans for borrowers who still may be attending school or engaging in other permitted educational activities and are not yet required to make payments on the loans, e.g., residency periods for medical students or a grace period for bar exam preparation.
- (2)
- Loans for borrowers who have requested extension of grace period during employment transition or who have temporarily ceased making full payments due to hardship or other factors, consistent with the established loan program servicing policies and procedures.
- (3)
- The period of delinquency is based on the number of days scheduled payments are contractually past due.
Forbearance—Managed Basis Private Education Loans
Private Education Loans are made to parent and student borrowers by our lender partners in accordance with our underwriting policies. These loans generally supplement federally guaranteed student loans, which are subject to federal lending caps. Private Education Loans are not guaranteed or insured against any loss of principal or interest. Traditional student borrowers use the proceeds of these loans to obtain higher education, which increases the likelihood of obtaining employment at higher income levels than would be available without the additional education. As a result, the borrowers' repayment capability generally improves between the time the loan is made and the time the borrower becomes established in the post-education work force. We generally allow the loan repayment period on traditional Private Education Loans, except those generated by our SLM Financial subsidiary, to begin six to nine months after the student leaves school. This provides the borrower time to obtain a job to service his or her debt. For borrowers that need more time or experience other hardships, we permit additional delays in payment or partial payments (both referred to as forbearances) when we believe additional time will improve the borrower's ability to repay the loan. Our policy does not grant any reduction in the repayment obligation (principal or interest) but does allow the borrower to stop or reduce monthly payments for an agreed period of time. In addition, Private Education Loans made to students attending Title IV schools to cover the cost of attendance are not dischargeable in bankruptcy unless the borrower can meet the very difficult burden of proving undue hardship.
65
Forbearance is used most heavily immediately after the loan enters repayment. As indicated in the tables below showing the composition and status of the Managed Private Education Loan portfolio by number of months aged from the first date of repayment, the percentage of loans in forbearance decreases the longer the loans have been in repayment. At September 30, 2005, loans in forbearance as a percentage of loans in repayment and forbearance are 13.8 percent for loans that have been in repayment 1 to 24 months. The percentage drops to 5.8 percent for loans that have been in repayment more than 48 months. Approximately 73 percent of the Company's loans in forbearance have been in repayment less than 24 months. These borrowers are essentially extending their grace period as they transition to the workforce. Forbearance continues to be a positive collection tool for the Private Education Loans as we believe it can provide the borrower with sufficient time to obtain employment and income to support his or her obligation. We consider the potential impact of forbearance in the determination of the loan loss reserves. The increase in forbearance was partially due to approximately $100 million in forbearance granted to borrowers affected by Hurricane Katrina.
The tables below show the composition and status of the Managed Private Education Loan portfolio by number of months aged from the first date of repayment.
| | Months since entering repayment
| |
|---|
| | 1 to 24
months
| | 25 to 48
months
| | More than
48 months
| | After
September 30,
2005(1)
| | Total
| |
|---|
| September 30, 2005 | | | | | | | | | | | | | | | | |
| Loans in-school/grace/deferment | | $ | — | | $ | — | | $ | — | | $ | 8,314 | | $ | 8,314 | |
| Loans in forbearance | | | 630 | | | 150 | | | 83 | | | — | | | 863 | |
| Loans in repayment—current | | | 3,635 | | | 1,485 | | | 1,267 | | | — | | | 6,387 | |
| Loans in repayment—delinquent 31-60 days | | | 131 | | | 62 | | | 46 | | | — | | | 239 | |
| Loans in repayment—delinquent 61-90 days | | | 72 | | | 26 | | | 15 | | | — | | | 113 | |
Loans in repayment—delinquent greater than
90 days | | | 100 | | | 58 | | | 28 | | | — | | | 186 | |
| | |
| |
| |
| |
| |
| |
| Total | | $ | 4,568 | | $ | 1,781 | | $ | 1,439 | | $ | 8,314 | | | 16,102 | |
| | |
| |
| |
| |
| | | | |
| Unamortized discount | | | | | | | | | | | | | | | (439 | ) |
| Allowance for loan losses | | | | | | | | | | | | | | | (272 | ) |
| | | | | | | | | | | | | | |
| |
| Total Managed Private Education Loans, net | | | | | | | | | | | | | | $ | 15,391 | |
| | | | | | | | | | | | | | |
| |
| Loans in forbearance as a percentage of loans in repayment and forbearance | | | 13.8 | % | | 8.4 | % | | 5.8 | % | | — | % | | 11.1 | % |
| | |
| |
| |
| |
| |
| |
66
| |
Months since entering repayment
| |
|---|
| | 1 to 24
months
| | 25 to 48
months
| | More than
48 months
| | After
September 30,
2004(1)
| | Total
| |
|---|
| September 30, 2004 | | | | | | | | | | | | | | | | |
| Loans in-school/grace/deferment | | $ | — | | $ | — | | $ | — | | $ | 5,773 | | $ | 5,773 | |
| Loans in forbearance | | | 472 | | | 107 | | | 55 | | | — | | | 634 | |
| Loans in repayment—current | | | 2,400 | | | 1,177 | | | 1,001 | | | — | | | 4,578 | |
| Loans in repayment—delinquent 31-60 days | | | 84 | | | 44 | | | 36 | | | — | | | 164 | |
| Loans in repayment—delinquent 61-90 days | | | 57 | | | 30 | | | 20 | | | — | | | 107 | |
Loans in repayment—delinquent greater than
90 days | | | 70 | | | 59 | | | 40 | | | — | | | 169 | |
| | |
| |
| |
| |
| |
| |
| Total | | $ | 3,083 | | $ | 1,417 | | $ | 1,152 | | $ | 5,773 | | | 11,425 | |
| | |
| |
| |
| |
| | | | |
| Unamortized discount | | | | | | | | | | | | | | | (266 | ) |
| Allowance for loan losses | | | | | | | | | | | | | | | (311 | ) |
| | | | | | | | | | | | | | |
| |
| Total Managed Private Education Loans, net | | | | | | | | | | | | | | $ | 10,848 | |
| | | | | | | | | | | | | | |
| |
| Loans in forbearance as a percentage of loans in repayment and forbearance | | | 15.3 | % | | 7.6 | % | | 4.8 | % | | — | % | | 11.2 | % |
| | |
| |
| |
| |
| |
| |
- (1)
- Includes all loans in-school/grace/deferment.
Additionally, as indicated in the table below which categorizes the balance of Managed Private Education Loans in forbearance by the cumulative number of months the borrower has used forbearance as of the dates indicated, 7 percent of borrowers currently in forbearance have deferred their loan repayment more than 24 months.
| | September 30, 2005
| | September 30, 2004
| |
|---|
| | Forbearance
Balance
| | % of
Total
| | Forbearance
Balance
| | % of
Total
| |
|---|
| Cumulative number of months borrower has used forbearance | | | | | | | | | | | |
| 1 to 12 months | | $ | 646 | | 75 | % | $ | 429 | | 68 | % |
| 13 to 24 months | | | 154 | | 18 | | | 154 | | 24 | |
| 25 to 36 months | | | 40 | | 4 | | | 32 | | 5 | |
| More than 36 months | | | 23 | | 3 | | | 19 | | 3 | |
| | |
| |
| |
| |
| |
| Total | | $ | 863 | | 100 | % | $ | 634 | | 100 | % |
| | |
| |
| |
| |
| |
On a Managed Basis, loans in forbearance status decreased slightly from 11.2 percent of loans in repayment and forbearance status at September 30, 2004 to 11.1 percent of loans in repayment and forbearance status at September 30, 2005. The decrease in the percentage of loans in forbearance status from the prior year is primarily due to a more specific evaluations of the borrower's need and ability to benefit from a forbearance that were instituted in the fourth quarter of 2004. Included in the "1 to 12 month" forbearance balance as of September 30, 2005 in the above table is approximately $100 million in forbearance granted to borrowers affected by Hurricane Katrina.
67
Other Income, Net
The following table summarizes the components of other income, net, for our Lending business segment for the three and nine months ended September 30, 2005 and 2004.
| | Three months
ended
September 30,
| | Nine months
ended
September 30,
| |
|---|
| | 2005
| | 2004
| | 2005
| | 2004
| |
|---|
| Late fees | | $ | 23 | | $ | 22 | | $ | 67 | | $ | 72 | |
| Gains on sales of mortgages and other loan fees | | | 6 | | | 5 | | | 14 | | | 15 | |
| Losses on investments, net | | | (35 | ) | | (27 | ) | | (32 | ) | | (24 | ) |
| Other | | | 6 | | | 17 | | | 23 | | | 31 | |
| | |
| |
| |
| |
| |
| Total other income, net | | $ | — | | $ | 17 | | $ | 72 | | $ | 94 | |
| | |
| |
| |
| |
| |
The increase in losses on investments is primarily due to the $39 million leveraged lease impairment reserve recorded in the third quarter of 2005, which primarily reflects the impairment of an aircraft leased to Northwest Airlines, which declared bankruptcy in September 2005. In the year-ago quarter we recorded a $27 million leveraged lease impairment reserve in recognition of the deteriorating financial condition of Delta Airlines. Delta also declared bankruptcy in September 2005.
At September 30, 2005, our remaining investments in leveraged and direct financing leases, net of impairments, totaled $122 million and are the general obligations of American Airlines and Federal Express Corporation. Based on an analysis of the potential losses on certain leveraged leases plus the increase in incremental tax obligations related to the forgiveness of debt obligations and/or the taxable gain on the sale of the aircraft, our remaining after-tax accounting exposure from our investment in American Airlines is $56 million at September 30, 2005.
Student Loan Acquisitions
In the nine months ended September 30, 2005, 72 percent of our Managed student loan acquisitions were originated through our Preferred Channel. The following tables summarize the components of our student loan acquisition activity for the three and nine months ended September 30, 2005 and 2004.
| | Three months ended
September 30, 2005
| |
|---|
| | FFELP
| | Private
| | Total
| |
|---|
| Preferred Channel | | $ | 3,455 | | $ | 2,238 | | $ | 5,693 | |
| Other commitment clients | | | 148 | | | — | | | 148 | |
| Spot purchases | | | 669 | | | — | | | 669 | |
| Consolidations from third parties | | | 1,306 | | | — | | | 1,306 | |
| Acquisitions from off-balance sheet securitized trusts, primarily consolidations | | | 3,207 | | | — | | | 3,207 | |
| Acquisition of Idaho Transfer Corporation | | | 43 | | | — | | | 43 | |
| Capitalized interest, premiums and discounts | | | 340 | | | (20 | ) | | 320 | |
| | |
| |
| |
| |
| Total on-balance sheet student loan acquisitions | | | 9,168 | | | 2,218 | | | 11,386 | |
| Consolidations to SLM Corporation from off-balance sheet securitized trusts | | | (3,207 | ) | | — | | | (3,207 | ) |
| Capitalized interest and other—off-balance sheet securitized trusts | | | 131 | | | 42 | | | 173 | |
| | |
| |
| |
| |
| Total Managed student loan acquisitions | | $ | 6,092 | | $ | 2,260 | | $ | 8,352 | |
| | |
| |
| |
| |
68
| |
Three months ended
September 30, 2004
| |
|---|
| | FFELP
| | Private
| | Total
| |
|---|
| Preferred Channel | | $ | 3,137 | | $ | 1,138 | | $ | 4,275 | |
| Other commitment clients | | | 87 | | | 45 | | | 132 | |
| Spot purchases | | | 325 | | | — | | | 325 | |
| Consolidations from third parties | | | 978 | | | — | | | 978 | |
| Acquisitions from off-balance sheet securitized trusts, primarily consolidations | | | 2,484 | | | — | | | 2,484 | |
| Capitalized interest, premiums and discounts | | | 265 | | | 14 | | | 279 | |
| | |
| |
| |
| |
| Total on-balance sheet student loan acquisitions | | | 7,276 | | | 1,197 | | | 8,473 | |
| Consolidations to SLM Corporation from off-balance sheet securitized trusts | | | (2,484 | ) | | — | | | (2,484 | ) |
| Capitalized interest and other—off-balance sheet securitized trusts | | | 112 | | | 28 | | | 140 | |
| | |
| |
| |
| |
| Total Managed student loan acquisitions | | $ | 4,904 | | $ | 1,225 | | $ | 6,129 | |
| | |
| |
| |
| |
| |
Nine months ended
September 30, 2005
| |
|---|
| | FFELP
| | Private
| | Total
| |
|---|
| Preferred Channel | | $ | 12,229 | | $ | 4,801 | | $ | 17,030 | |
| Other commitment clients | | | 395 | | | — | | | 395 | |
| Spot purchases | | | 1,568 | | | — | | | 1,568 | |
| Consolidations from third parties | | | 3,145 | | | — | | | 3,145 | |
| Acquisitions from off-balance sheet securitized trusts, primarily consolidations | | | 7,455 | | | — | | | 7,455 | |
| Acquisition of Idaho Transfer Corporation | | | 43 | | | — | | | 43 | |
| Capitalized interest, premiums and discounts | | | 1,011 | | | (36 | ) | | 975 | |
| | |
| |
| |
| |
| Total on-balance sheet student loan acquisitions | | | 25,846 | | | 4,765 | | | 30,611 | |
| Consolidations to SLM Corporation from off-balance sheet securitized trusts | | | (7,455 | ) | | — | | | (7,455 | ) |
| Capitalized interest and other—off-balance sheet securitized trusts | | | 386 | | | 145 | | | 531 | |
| | |
| |
| |
| |
| Total Managed student loan acquisitions | | $ | 18,777 | | $ | 4,910 | | $ | 23,687 | |
| | |
| |
| |
| |
| |
Nine months ended
September 30, 2004
| |
|---|
| | FFELP
| | Private
| | Total
| |
|---|
| Preferred Channel | | $ | 10,624 | | $ | 3,173 | | $ | 13,797 | |
| Other commitment clients | | | 266 | | | 45 | | | 311 | |
| Spot purchases | | | 1,080 | | | 1 | | | 1,081 | |
| Consolidations from third parties | | | 1,627 | | | — | | | 1,627 | |
| Acquisitions from off-balance sheet securitized trusts, primarily consolidations | | | 3,970 | | | — | | | 3,970 | |
| Capitalized interest, premiums and discounts | | | 795 | | | (5 | ) | | 790 | |
| | |
| |
| |
| |
| Total on-balance sheet student loan acquisitions | | | 18,362 | | | 3,214 | | | 21,576 | |
| Consolidations to SLM Corporation from off-balance sheet securitized trusts | | | (3,970 | ) | | — | | | (3,970 | ) |
| Capitalized interest and other—off-balance sheet securitized trusts | | | 396 | | | 95 | | | 491 | |
| | |
| |
| |
| |
| Total Managed student loan acquisitions | | $ | 14,788 | | $ | 3,309 | | $ | 18,097 | |
| | |
| |
| |
| |
69
For the three months ended September 30, 2005, net new student loan acquisitions resulting from consolidation activity was effectively neutral to the portfolio. For the nine months ended September 30, 2005, consolidation activity resulted in $514 million of net new student loan acquisitions. For the three and nine months ended September 30, 2004, consolidation activity resulted in $382 million and $128 million, respectively, of net new student loan acquisitions.
As shown on the above table, off-balance sheet FFELP Stafford loans that consolidate with us become an on-balance sheet interest earning asset. This activity results in impairments of our Retained Interests in securitizations, but this is offset by an increase in on-balance sheet interest earning assets, for which we do not record an offsetting gain.
The following table includes on-balance sheet asset information for our Lending business segment.
| | September 30,
2005
| | December 31,
2004
|
|---|
| FFELP Stafford and Other Student Loans | | $ | 22,354 | | $ | 18,958 |
| Consolidation Loans, net | | | 51,194 | | | 41,603 |
| Private Education Loans, net | | | 8,079 | | | 5,420 |
| Other loans, net | | | 1,094 | | | 1,048 |
| Investments(1) | | | 6,014 | | | 8,914 |
| Retained Interest in off-balance sheet securitized loans | | | 2,330 | | | 2,315 |
| Other(2) | | | 3,919 | | | 4,792 |
| | |
| |
|
| Total assets | | $ | 94,984 | | $ | 83,050 |
| | |
| |
|
- (1)
- Investments include cash and cash equivalents, investments, restricted cash and investments, leveraged leases, and municipal bonds.
- (2)
- Other assets include accrued interest receivable, goodwill and acquired intangible assets and other non-interest earning assets.
Consolidation Loan Activity
The following tables present the effect of Consolidation Loan activity on our Managed FFELP portfolio.
| | Three months ended
| |
|---|
| | September 30, 2005
| | September 30, 2004
| |
|---|
| | FFELP
Stafford and
Other(1)
| | Consolidation
Loans
| | Total
FFELP
| | FFELP
Stafford and
Other(1)
| | Consolidation
Loans
| | Total
FFELP
| |
|---|
| Beginning Managed balance | | $ | 47,126 | | $ | 55,875 | | $ | 103,001 | | $ | 48,223 | | $ | 36,792 | | $ | 85,015 | |
| Acquisitions | | | 3,993 | | | 793 | | | 4,786 | | | 3,664 | | | 262 | | | 3,926 | |
| Incremental Consolidations from third parties | | | — | | | 1,306 | | | 1,306 | | | — | | | 978 | | | 978 | |
| Internal Consolidations(2) | | | (5,250 | ) | | 5,250 | | | — | | | (3,410 | ) | | 3,410 | | | — | |
| Consolidations to third parties | | | (979 | ) | | (320 | ) | | (1,299 | ) | | (497 | ) | | (96 | ) | | (593 | ) |
| Repayments/claims/resales/other | | | (1,808 | ) | | (743 | ) | | (2,551 | ) | | (1,367 | ) | | (468 | ) | | (1,835 | ) |
| | |
| |
| |
| |
| |
| |
| |
| Ending Managed balance | | $ | 43,082 | | $ | 62,161 | | $ | 105,243 | | $ | 46,613 | | $ | 40,878 | | $ | 87,491 | |
| | |
| |
| |
| |
| |
| |
| |
- (1)
- Other includes PLUS, SLS and HEAL loans.
- (2)
- Included in Internal Consolidations for the three months ended September 30, 2005 and 2004 were $3.2 billion and $2.5 billion respectively, of FFELP student loans in securitization trusts that were consolidated back on balance sheet.
70
| | Nine months ended
| |
|---|
| | September 30, 2005
| | September 30, 2004
| |
|---|
| | FFELP
Stafford and
Other(3)
| | Consolidation
Loans
| | Total
FFELP
| | FFELP
Stafford and
Other(1)
| | Consolidation
Loans
| | Total
FFELP
| |
|---|
| Beginning Managed balance | | $ | 46,791 | | $ | 49,165 | | $ | 95,956 | | $ | 45,554 | | $ | 34,930 | | $ | 80,484 | |
| Acquisitions | | | 14,188 | | | 1,444 | | | 15,632 | | | 12,454 | | | 707 | | | 13,161 | |
| Incremental Consolidations from third parties | | | — | | | 3,145 | | | 3,145 | | | — | | | 1,627 | | | 1,627 | |
| Internal Consolidations(4) | | | (11,090 | ) | | 11,090 | | | — | | | (5,219 | ) | | 5,219 | | | — | |
| Consolidations to third parties | | | (1,952 | ) | | (660 | ) | | (2,612 | ) | | (1,263 | ) | | (227 | ) | | (1,490 | ) |
| Repayments/claims/resales/other | | | (4,855 | ) | | (2,023 | ) | | (6,878 | ) | | (4,913 | ) | | (1,378 | ) | | (6,291 | ) |
| | |
| |
| |
| |
| |
| |
| |
| Ending Managed balance | | $ | 43,082 | | $ | 62,161 | | $ | 105,243 | | $ | 46,613 | | $ | 40,878 | | $ | 87,491 | |
| | |
| |
| |
| |
| |
| |
| |
- (3)
- Other includes PLUS, SLS and HEAL loans.
- (4)
- Included in Internal Consolidations for the nine months ended September 30, 2005 and 2004 were $7.2 billion and $3.8 billion, respectively, of FFELP student loans in securitization trusts that were consolidated back on balance sheet.
Preferred Channel Originations
We originated $7.2 billion and $16.8 billion in student loan volume through our Preferred Channel in the three and nine months ended September 30, 2005, respectively, versus $5.9 billion and $14.0 billion in the three and nine months ended September 30, 2004, respectively.
In the third quarter of 2005, we grew our Preferred Channel Originations by 80 percent versus the year-ago quarter. For the nine months ended September 30, 2005, our internally marketed brands constitute 41 percent of our Preferred Channel Originations, up from 32 percent in the year-ago period. The pipeline of loans that we currently service and are committed to purchase was $6.2 billion and $6.4 billion at September 30, 2005 and 2004, respectively. The following tables further break down our Preferred Channel Originations by type of loan and source.
| | Three months ended
September 30,
| | Nine months ended
September 30,
|
|---|
| | 2005
| | 2004
| | 2005
| | 2004
|
|---|
| Preferred Channel Originations—Type of Loan | | | | | | | | | | | | |
| Stafford | | $ | 3,966 | | $ | 3,655 | | $ | 9,879 | | $ | 8,914 |
| PLUS | | | 863 | | | 794 | | | 2,046 | | | 1,794 |
| | |
| |
| |
| |
|
| Total FFELP | | | 4,829 | | | 4,449 | | | 11,925 | | | 10,708 |
| Private | | | 2,399 | | | 1,412 | | | 4,839 | | | 3,310 |
| | |
| |
| |
| |
|
| Total | | $ | 7,228 | | $ | 5,861 | | $ | 16,764 | | $ | 14,018 |
| | |
| |
| |
| |
|
Preferred Channel Originations—Source |
|
|
|
|
|
|
|
|
|
|
|
|
| Internally marketed brands | | $ | 3,430 | | $ | 1,883 | | $ | 6,869 | | $ | 4,453 |
| Lender partners | | | 3,798 | | | 3,978 | | | 9,895 | | | 9,565 |
| | |
| |
| |
| |
|
| Total | | $ | 7,228 | | $ | 5,861 | | $ | 16,764 | | $ | 14,018 |
| | |
| |
| |
| |
|
71
The following table summarizes the activity in our Managed portfolio of student loans for the three and nine months ended September 30, 2005 and 2004.
| | Three months ended
September 30,
| | Nine months ended
September 30,
| |
|---|
| | 2005
| | 2004
| | 2005
| | 2004
| |
|---|
| Beginning balance | | $ | 116,500 | | $ | 94,901 | | $ | 107,438 | | $ | 88,789 | |
| Acquisitions, including capitalized interest | | | 8,352 | | | 6,129 | | | 23,687 | | | 18,097 | |
| Repayments, claims and other | | | (2,715 | ) | | (2,063 | ) | | (7,574 | ) | | (6,486 | ) |
| Charge-offs to reserves and securitization trusts | | | (49 | ) | | (31 | ) | | (119 | ) | | (91 | ) |
| Loans sales | | | (149 | ) | | (1 | ) | | (167 | ) | | (471 | ) |
| Loans consolidated from SLM Corporation | | | (1,305 | ) | | (596 | ) | | (2,631 | ) | | (1,499 | ) |
| | |
| |
| |
| |
| |
| Ending balance | | $ | 120,634 | | $ | 98,339 | | $ | 120,634 | | $ | 98,339 | |
| | |
| |
| |
| |
| |
DEBT MANAGEMENT OPERATIONS ("DMO") BUSINESS SEGMENT
The following table includes the "core earnings" results of operations for our DMO business segment.
| | Three months
ended
September 30,
| | % Increase
(Decrease)
| | Nine months
ended
September 30,
| | % Increase
(Decrease)
| |
|---|
| | 2005
| | 2004
| | 2005 vs.
2004
| | 2005
| | 2004
| | 2005 vs.
2004
| |
|---|
| Fee income | | $ | 93 | | $ | 74 | | 26 | % | $ | 261 | | $ | 224 | | 17 | % |
| Collections revenue | | | 42 | | | 5 | | 740 | | | 119 | | | 5 | | 2,280 | |
| | |
| |
| |
| |
| |
| |
| |
| Total fee and other income | | | 135 | | | 79 | | 71 | | | 380 | | | 229 | | 66 | |
| Operating expenses | | | 72 | | | 35 | | 106 | | | 201 | | | 99 | | 103 | |
| | |
| |
| |
| |
| |
| |
| |
| Income before income taxes and minority interest in net earnings of subsidiaries | | | 63 | | | 44 | | 43 | | | 179 | | | 130 | | 38 | |
| Income tax expense | | | 23 | | | 16 | | 44 | | | 67 | | | 47 | | 43 | |
| | |
| |
| |
| |
| |
| |
| |
| Income before minority interest in net earnings of subsidiaries | | | 40 | | | 28 | | 43 | | | 112 | | | 83 | | 35 | |
| Minority interest in net earnings of subsidiaries | | | 1 | | | — | | 100 | | | 3 | | | — | | 100 | |
| | |
| |
| |
| |
| |
| |
| |
| Net income | | $ | 39 | | $ | 28 | | 39 | % | $ | 109 | | $ | 83 | | 31 | % |
| | |
| |
| |
| |
| |
| |
| |
72
DMO Revenue by Product
| | Three months ended
September 30,
| | Nine months ended
September 30,
| |
|---|
| | 2005
| | 2004
| | 2005
| | 2004
| |
|---|
| Purchase paper | | $ | 42 | | $ | 5(2) | | $ | 119 | | $ | 5(2) | |
| Contingency: | | | | | | | | | | | | | |
| | Contingency—Student loans | | | 66 | | | 68 | | | 195 | | | 194 | |
| | Contingency—Other | | | 9 | | | 4 | | | 28 | | | 10 | |
| | |
| |
| |
| |
| |
| Total contingency | | | 75 | | | 72 | | | 223 | | | 204 | |
| Other | | | 18 | | | 2 | | | 38 | | | 20 | |
| | |
| |
| |
| |
| |
| Total | | $ | 135 | | $ | 79 | | $ | 380 | | $ | 229 | |
| | |
| |
| |
| |
| |
| USA Funds(1) business | | $ | 47 | | $ | 45 | | $ | 136 | | $ | 147 | |
| | |
| |
| |
| |
| |
| % of total DMO | | | 35 | % | | 58 | % | | 36 | % | | 64 | % |
| | |
| |
| |
| |
| |
- (1)
- United Student Aid Funds, Inc. ("USA Funds")
- (2)
- Includes revenue attributed to AFS for the period from September 16 to September 30.
Fee Income and Collections Revenue
On August 31, 2005, we acquired 100 percent of GRP Financial Services ("GRP"), a debt management company that acquires and manages portfolios of sub-performing and non-performing mortgage loans, substantially all of which are secured by one-to-four family residential real estate.
DMO revenue for the three months ended September 30, 2005 increased by $56 million or 71 percent over the year-ago period, of which $39 million was generated by the purchase paper business of AFS, acquired in September 2004. DMO revenue increased by $151 million or 66 percent for the nine months ended September 30, 2005 over the year-ago period, of which $111 million was generated by the purchase paper business of AFS. Contingency fee income increased by $3 million, or 4 percent, to $75 million for the third quarter of 2005 versus the year-ago period. The growth in contingency fee revenues was primarily driven by the contingency business of AFS.
Purchase Paper—Non-Mortgage
| | Three months ended
September 30,
| | Nine months ended
September 30,
| |
|---|
| | 2005
| | 2004(1)
| | 2005
| | 2004(1)
| |
|---|
| Face value of purchases | | $ | 330 | | $ | 77 | | $ | 1,746 | | $ | 77 | |
| Purchase price | | | 25 | | | 4 | | | 90 | | | 4 | |
| % of face value purchased | | | 7.5 | % | | 5.1 | % | | 5.2 | % | | 5.1 | % |
Gross Cash Collections ("GCC") |
|
$ |
61 |
|
$ |
8 |
|
$ |
179 |
|
$ |
8 |
|
| Purchase paper revenue | | | 39 | | | 5 | | | 116 | | | 5 | |
| % of GCC | | | 65 | % | | 63 | % | | 65 | % | | 63 | % |
Carrying value of purchases |
|
$ |
81 |
|
$ |
55 |
|
$ |
81 |
|
$ |
55 |
|
- (1)
- Includes revenue for AFS for the period from September 16 to September 30.
73
The amount of face value purchased in any quarter is a function of a combination of factors including the average age of the portfolio, the type of receivable, and competition in the marketplace. As a result, the percentage of principal purchased will vary from quarter to quarter.
Purchase Paper—Mortgage/Properties
| | Three months ended
September 30,
| | Nine months ended
September 30,
| |
|---|
| | 2005(1)
| | 2004
| | 2005(1)
| | 2004
| |
|---|
| Face value of purchases | | $ | 34 | | $ | — | | $ | 34 | | $ | — | |
| Purchase paper revenue | | | 3 | | | — | | | 3 | | | — | |
| Collateral value of purchases | | | 42 | | | — | | | 42 | | | — | |
Purchase price |
|
|
32 |
|
|
— |
|
|
32 |
|
|
— |
|
| % of collateral value | | | 76 | % | | — | % | | 76 | % | | — | % |
Carrying value of purchases |
|
$ |
238 |
|
$ |
— |
|
$ |
238 |
|
$ |
— |
|
- (1)
- Includes results for GRP since the acquisition, which closed on August 31, 2005.
The purchase price for sub-performing and non-performing mortgage loans is generally determined as a percentage of the collateral.
Contingency Inventory
The following table presents the outstanding inventory of defaulted loans that are currently being serviced through our DMO business.
| | September 30,
2005
| | December 31,
2004
|
|---|
| Contingency: | | | | | | |
| | Contingency—Student loans | | $ | 6,985 | | $ | 6,869 |
| | Contingency—Other | | | 2,106 | | | 1,756 |
| | |
| |
|
| Total | | $ | 9,091 | | $ | 8,625 |
| | |
| |
|
Operating Expenses
Operating expenses for our DMO business segment increased by $37 million, or 106 percent, to $72 million for the three months ended September 30, 2005 versus the year-ago quarter, primarily due to the inclusion of AFS's expenses for a full quarter and GRP's expenses since the acquisition which closed August 31, 2005. AFS was acquired in mid-September 2004.
At September 30, 2005 and December 31, 2004, the DMO business segment had total assets of $786 million and $519 million, respectively.
CORPORATE AND OTHER BUSINESS SEGMENT
At September 30, 2005 and December 31, 2004, the Corporate and Other business segment had total assets of $550 million and $524 million, respectively.
74
The following table includes "core earnings" results of operations for our Corporate and Other business segment.
| | Three months ended
September 30,
| | % Increase
(Decrease)
| | Nine months ended
September 30,
| | % Increase
(Decrease)
| |
|---|
| | 2005
| | 2004
| | 2005 vs.
2004
| | 2005
| | 2004
| | 2005 vs.
2004
| |
|---|
| Fee income | | $ | 36 | | $ | 33 | | 9 | % | $ | 94 | | $ | 91 | | 3 | % |
| Collections revenue | | | 36 | | | 46 | | (22 | ) | | 97 | | | 100 | | (3 | ) |
| | |
| |
| |
| |
| |
| |
| |
| Total fee and other income | | | 72 | | | 79 | | (9 | ) | | 191 | | | 191 | | — | |
| Operating expenses | | | 82 | | | 70 | | 17 | | | 233 | | | 207 | | 13 | |
| | |
| |
| |
| |
| |
| |
| |
| Income (loss) before income taxes | | | (10 | ) | | 9 | | (211 | ) | | (42 | ) | | (16 | ) | (163 | ) |
| Income tax expense (benefit) | | | (4 | ) | | 3 | | (233 | ) | | (16 | ) | | (6 | ) | (167 | ) |
| | |
| |
| |
| |
| |
| |
| |
| Net income (loss) | | $ | (6 | ) | $ | 6 | | (200 | )% | $ | (26 | ) | $ | (10 | ) | (160 | )% |
| | |
| |
| |
| |
| |
| |
| |
Fee and Other Income
The following table summarizes the components of fee and other income for our Corporate and Other business segment for the three and nine months ended September 30, 2005 and 2004.
| | Three months ended
September 30,
| | Nine months ended
September 30,
|
|---|
| | 2005
| | 2004
| | 2005
| | 2004
|
|---|
| Guarantor servicing fees | | $ | 36 | | $ | 33 | | $ | 94 | | $ | 91 |
| Loan servicing fees | | | 11 | | | 14 | | | 36 | | | 38 |
| Other income | | | 25 | | | 32 | | | 61 | | | 62 |
| | |
| |
| |
| |
|
| Total fee and other income | | $ | 72 | | $ | 79 | | $ | 191 | | $ | 191 |
| | |
| |
| |
| |
|
USA Funds, the nation's largest guarantee agency, accounted for 79 percent and 81 percent, respectively, of guarantor servicing fees for the three months ended September 30, 2005 and 2004, and 82 percent and 85 percent, respectively, of guarantor servicing fees for the nine months ended September 30, 2005 and 2004. Overall, USA Funds accounted for 38 percent of consolidated fee and other income for the nine months ended September 30, 2005.
Operating Expenses
Operating expenses for our Corporate and Other business segment include costs incurred to service loans for unrelated third parties and to perform guarantor servicing on behalf of guarantee agencies, and general and administrative expenses associated with these businesses. Operating expenses also include unallocated corporate overhead expenses which include centralized headquarters functions such as executive management, accounting and finance, human resources and marketing. Our corporate overhead also includes a portion of information technology expenses related to these functions. The increase in operating expenses over the prior quarter (which includes a $14 million net settlement in the CLC lawsuit) and the year-ago quarter can primarily be attributed to expenses associated with three new subsidiaries acquired in September 2004 and the fourth quarter of 2004.
75
LIQUIDITY AND CAPITAL RESOURCES
As fee based businesses, our DMO and Corporate and Other business segments are not capital intensive businesses and as such require less debt and equity capital to meet their business plans. Therefore, the following liquidity and capital resource discussion is concentrated on our Lending business segment.
We depend on the debt capital markets to support our business plan. We have developed deep and diverse funding sources to ensure continued access to funding now that the GSE has been dissolved. Our main source of funding is student loan securitizations where we securitized $18.5 billion in student loans in nine transactions in the nine months ended September 30, 2005, versus $29.9 billion in twelve transactions in the year-ago period. The 2005 securitization volume is more indicative of future funding needs from securitization, as the first nine months of 2004 reflects additional funding to refinance outstanding GSE debt obligations in addition to ongoing financing needs of the business. Securitizations now comprise 67 percent of our financing, versus 69 percent at September 30, 2004. Our securitizations backed by FFELP loans are unique securities in the asset-backed class as they are backed by student loans with an explicit guarantee on 100 percent of principal and interest. This guarantee is subject to servicing compliance.
Our other sources of liquidity include our $5 billion asset-backed commercial paper program (which had $5.0 billion and $3.6 billion outstanding at September 30, 2005 and December 31, 2004, respectively) and our $5 billion of unsecured revolving credit facilities (on which we have never drawn), as well as unsecured corporate debt and equity security issuances.
The following tables present the ending balances of our Managed borrowings at September 30, 2005 and 2004 and average balances and average interest rates of our Managed borrowings for the three and nine months ended September 30, 2005 and 2004. The average interest rates include derivatives that are economically hedging the underlying debt, but do not qualify for hedge accounting treatment under SFAS No. 133. (See "BUSINESS SEGMENTS—Pre-tax differences Between 'Core Earnings' and GAAP—Reclassification of Realized Gains (Losses) on Derivative and Hedging Activities.")
| | As of September 30,
|
|---|
| | 2005
| | 2004
|
|---|
| | Ending Balance
| | Ending Balance
|
|---|
| | Short
Term
| | Long
Term
| | Total
Managed
Basis
| | Short
Term
| | Long
Term
| | Total
Managed
Basis
|
|---|
| GSE borrowings (unsecured) | | $ | — | | $ | — | | $ | — | | $ | 1,491 | | $ | 568 | | $ | 2,059 |
| SLM Corp borrowings (unsecured) | | | 4,227 | | | 35,965 | | | 40,192 | | | 2,662 | | | 28,506 | | | 31,168 |
| Indentured trusts (on-balance sheet) | | | 425 | | | 3,455 | | | 3,880 | | | 248 | | | 803 | | | 1,051 |
| Securitizations (on-balance sheet) | | | — | | | 44,951 | | | 44,951 | | | — | | | 30,764 | | | 30,764 |
| Securitizations (off-balance sheet) | | | — | | | 43,372 | | | 43,372 | | | — | | | 47,265 | | | 47,265 |
| | |
| |
| |
| |
| |
| |
|
| Total | | $ | 4,652 | | $ | 127,743 | | $ | 132,395 | | $ | 4,401 | | $ | 107,906 | | $ | 112,307 |
| | |
| |
| |
| |
| |
| |
|
| |
Three months ended September 30,
| |
Nine months ended September 30,
| |
|---|
| | 2005
| | 2004
| | 2005
| | 2004
| |
|---|
| | Average
Balance
| | Average
Rate
| | Average
Balance
| | Average
Rate
| | Average
Balance
| | Average
Rate
| | Average
Balance
| | Average
Rate
| |
|---|
| GSE borrowings (unsecured) | | $ | — | | — | % | $ | 4,513 | | 2.91 | % | $ | — | | — | % | $ | 12,824 | | 2.16 | % |
| SLM Corp borrowings (unsecured) | | | 39,302 | | 4.13 | | | 30,663 | | 2.46 | | | 36,746 | | 3.72 | | | 27,056 | | 2.06 | |
| Indentured trusts (on-balance sheet) | | | 4,250 | | 3.47 | | | 1,030 | | 2.52 | | | 5,186 | | 3.17 | | | 1,081 | | 2.48 | |
| Securitizations (on-balance sheet) | | | 41,338 | | 3.90 | | | 32,036 | | 1.81 | | | 37,627 | | 3.43 | | | 25,966 | | 1.58 | |
| Securitizations (off-balance sheet) | | | 45,278 | | 3.97 | | | 45,164 | | 2.13 | | | 45,372 | | 3.52 | | | 41,731 | | 1.86 | |
| | |
| |
| |
| |
| |
| |
| |
| |
| |
| Total | | $ | 130,168 | | 3.98 | % | $ | 113,406 | | 2.16 | % | $ | 124,931 | | 3.54 | % | $ | 108,658 | | 1.89 | % |
| | |
| |
| |
| |
| |
| |
| |
| |
| |
76
Unsecured On-Balance Sheet Financing Activities
The following table presents the senior unsecured credit ratings on our debt from major rating agencies.
| | S&P
| | Moody's
| | Fitch
|
|---|
| Short-term unsecured debt | | A-1 | | P-1 | | F1+ |
| Long-term unsecured debt | | A | | A2 | | A+ |
The table below presents our unsecured on-balance sheet term funding by funding source for the three and nine months ended September 30, 2005 and 2004.
| | Debt issued for the
three months ended
September 30,
| | Debt issued for the
nine months ended
September 30,
| | Outstanding at
September 30,
|
|---|
| | 2005
| | 2004
| | 2005
| | 2004
| | 2005
| | 2004
|
|---|
| Convertible debentures | | $ | — | | $ | — | | $ | — | | $ | — | | $ | 1,991 | | $ | 1,987 |
| Retail notes | | | 81 | | | 412 | | | 661 | | | 1,270 | | | 3,491 | | | 2,346 |
| Foreign currency denominated(1) | | | 1,151 | | | 188 | | | 2,150 | | | 4,011 | | | 6,933 | | | 4,611 |
| Extendible notes | | | 499 | | | — | | | 999 | | | 249 | | | 5,246 | | | 1,998 |
| Global notes (Institutional) | | | 3,281 | | | 1,148 | | | 4,465 | | | 5,885 | | | 20,726 | | | 16,719 |
| Medium-term notes (Institutional) | | | — | | | — | | | — | | | — | | | 1,803 | | | 3,233 |
| | |
| |
| |
| |
| |
| |
|
| Total | | $ | 5,012 | | $ | 1,748 | | $ | 8,275 | | $ | 11,415 | | $ | 40,190 | | $ | 30,894 |
| | |
| |
| |
| |
| |
| |
|
- (1)
- All foreign currency denominated notes are swapped back to U.S. dollars.
In addition to the term issuances reflected in the table above, the Company also uses its commercial paper program for short-term liquidity purposes. The average balance of commercial paper outstanding during the three months ended September 30, 2005 and 2004 was $503 million and $272 million, respectively, and for the nine months ended September 30, 2005 and 2004 was $440 million and $106 million, respectively. The maximum daily amount outstanding for the three and nine months ended September 30, 2005 and 2004 was $2.8 billion and $274 million, respectively.
Contingently Convertible Debentures
At September 30, 2005, we have approximately $2 billion Contingently Convertible Debentures ("Co-Cos") outstanding. The Co-Cos are convertible, under certain conditions, into shares of SLM common stock at an initial conversion price of $65.98. The investors generally can only convert the debentures if the Company's common stock has appreciated for a prescribed period to 130 percent of the conversion price, which would amount to $85.77, or if we call the debentures.
In December 2004, the Company adopted Emerging Issues Task Force ("EITF") Issue No. 04-8, "The Effect of Contingently Convertible Debt on Diluted Earnings per Share," which requires the shares underlying the Co-Cos to be included in diluted earnings per share ("diluted EPS") computations regardless of whether the market price trigger or the conversion price has been met, using the "if-converted" accounting method, while the after-tax interest expense of the Co-Cos is added back to earnings. Diluted EPS amounts disclosed prior to December 2004 have been retroactively restated to give effect to the application of EITF No. 04-8 as it relates to the Company's $2 billion in Co-Cos issued in May 2003.
77
The following table provides the historical effect of our Co-Cos on our common stock equivalents ("CSEs") and after-tax interest expense in connection with the retroactive implementation of EITF No. 04-8 for the 2005 and 2004 quarters:
| |
| |
| | Three months ended
|
|---|
| | Three months
ended
September 30,
2005
| |
|
|---|
(in thousands)
| | Year ended
December 31,
2004
| | December 31,
2004
| | September 30,
2004
| | June 30,
2004
| | March 31,
2004
|
|---|
| CSE impact of Co-Cos (shares) | | | 30,312 | | | 30,312 | | | 30,312 | | | 30,312 | | | 30,312 | | | 30,312 |
| Co-Cos after-tax interest expense | | $ | 11,971 | | $ | 21,405 | | $ | 7,125 | | $ | 5,622 | | $ | 4,364 | | $ | 4,294 |
The table below outlines the effect of the Co-Cos on the numerators and denominators for the diluted EPS calculations for the three and nine months ended September 30, 2005 and 2004. The net effect of the Co-Cos on diluted EPS will vary with the period to period changes in net income of the Company.
| | Three months ended
September 30,
| | Nine months ended
September 30,
| |
|---|
| | 2005
| | 2004
| | 2005
| | 2004
| |
|---|
| Numerator: | | | | | | | | | | | | | |
| Net income attributable to common stock | | $ | 424,062 | | $ | 353,703 | | $ | 937,178 | | $ | 1,254,344 | |
| Adjusted for debt expense of Co-Cos, net of taxes | | | 11,971 | | | 5,622 | | | 30,887 | | | 14,280 | |
| | |
| |
| |
| |
| |
| Net income attributable to common stock, adjusted | | $ | 436,033 | | $ | 359,325 | | $ | 968,065 | | $ | 1,268,624 | |
| | |
| |
| |
| |
| |
Denominator: |
|
|
|
|
|
|
|
|
|
|
|
|
|
| Weighted-average shares used to compute basic EPS | | | 417,235 | | | 435,764 | | | 419,205 | | | 439,430 | |
| Effect of dilutive securities: | | | | | | | | | | | | | |
| | Dilutive effect of stock options, deferred compensation, restricted stock units, ESPP, and equity forwards | | | 11,251 | | | 8,379 | | | 11,705 | | | 8,581 | |
| | Dilutive effect of Co-Cos | | | 30,312 | | | 30,312 | | | 30,312 | | | 30,312 | |
| | |
| |
| |
| |
| |
| Dilutive potential common shares | | | 41,563 | | | 38,691 | | | 42,017 | | | 38,893 | |
| | |
| |
| |
| |
| |
| Weighted-average shares used to compute diluted EPS | | | 458,798 | | | 474,455 | | | 461,222 | | | 478,323 | |
| | |
| |
| |
| |
| |
Net earnings per share: |
|
|
|
|
|
|
|
|
|
|
|
|
|
| Basic EPS | | $ | 1.02 | | $ | .81 | | $ | 2.24 | | $ | 2.85 | |
| | Dilutive effect of stock options, deferred compensation, restricted stock units, ESPP, and equity forwards | | | (.03 | ) | | (.01 | ) | | (.06 | ) | | (.05 | ) |
| | Dilutive effect of Co-Cos | | | (.04 | ) | | (.04 | ) | | (.08 | ) | | (.15 | ) |
| | |
| |
| |
| |
| |
| Diluted EPS | | $ | .95 | | $ | .76 | | $ | 2.10 | | $ | 2.65 | |
| | |
| |
| |
| |
| |
- (1)
- For the three months ended September 30, 2005 and 2004, securities of approximately 50 million shares and 4 million shares, respectively, and for the nine months ended September 30, 2005 and 2004, securities of approximately 19 million shares and 4 million shares, respectively, were outstanding but not included in the computation of diluted earnings per share because their inclusion would be antidilutive.
78
Securitization Activities
Securitization Program
The following table summarizes our securitization activity for the three and nine months ended September 30, 2005 and 2004. Those securitizations listed as sales are off-balance sheet transactions and those listed as financings remain on-balance sheet.
| | Three months ended September 30,
| |
|---|
| | 2005
| | 2004
| |
|---|
| | No. of
Transactions
| | Amount
Securitized
| | Pre-Tax
Gain
| | Gain %
| | No. of
Transactions
| | Amount
Securitized
| | Pre-Tax
Gain
| | Gain %
| |
|---|
| FFELP Stafford and Other Student Loans | | — | | $ | — | | $ | — | | — | % | 2 | | $ | 4,500 | | $ | 64 | | 1.4 | % |
| Consolidation Loans | | — | | | — | | | — | | — | | — | | | — | | | — | | — | |
| Private Education Loans | | — | | | — | | | — | | — | | — | | | — | | | — | | — | |
| | |
| |
| |
| |
| |
| |
| |
| |
| |
| Total securitizations—sales | | — | | | — | | $ | — | | — | % | 2 | | | 4,500 | | $ | 64 | | 1.4 | % |
| | | | | | | |
| |
| | | | | | |
| |
| |
| Asset-backed commercial paper | | — | | | — | | | | | | | — | | | — | | | | | | |
| Consolidation Loans | | 3 | | | 7,276 | | | | | | | 1 | | | 2,210 | | | | | | |
| | |
| |
| | | | | | |
| |
| | | | | | |
| Total securitizations—financings | | 3 | | | 7,276 | | | | | | | 1 | | | 2,210 | | | | | | |
| | |
| |
| | | | | | |
| |
| | | | | | |
| Total securitizations | | 3 | | $ | 7,276 | | | | | | | 3 | | $ | 6,710 | | | | | | |
| | |
| |
| | | | | | |
| |
| | | | | | |
| | Nine months ended September 30,
| |
|---|
| | 2005
| | 2004
| |
|---|
| | No. of
Transactions
| | Amount
Securitized
| | Pre-Tax
Gain
| | Gain %
| | No. of
Transactions
| | Amount
Securitized
| | Pre-Tax
Gain
| | Gain %
| |
|---|
| FFELP Stafford and Other Student Loans | | 2 | | $ | 3,530 | | $ | 50 | | 1.4 | % | 4 | | $ | 10,002 | | $ | 134 | | 1.3 | % |
| Consolidation Loans | | 2 | | | 4,011 | | | 31 | | .8 | | — | | | — | | | — | | — | |
| Private Education Loans | | 1 | | | 1,505 | | | 231 | | 15.3 | | 2 | | | 2,535 | | | 241 | | 9.5 | |
| | |
| |
| |
| |
| |
| |
| |
| |
| |
| Total securitizations—sales | | 5 | | | 9,046 | | $ | 312 | | 3.4 | % | 6 | | | 12,537 | | $ | 375 | | 3.0 | % |
| | | | | | | |
| |
| | | | | | |
| |
| |
| Asset-backed commercial paper | | — | | | — | | | | | | | 1 | | | 4,186 | | | | | | |
| Consolidation Loans | | 4 | | | 9,502 | | | | | | | 5 | | | 13,224 | | | | | | |
| | |
| |
| | | | | | |
| |
| | | | | | |
| Total securitizations—financings | | 4 | | | 9,502 | | | | | | | 6 | | | 17,410 | | | | | | |
| | |
| |
| | | | | | |
| |
| | | | | | |
| Total securitizations | | 9 | | $ | 18,548 | | | | | | | 12 | | $ | 29,947 | | | | | | |
| | |
| |
| | | | | | |
| |
| | | | | | |
The increase in the gain as a percentage of the amount securitized for the 2005 Private Education Loan securitization versus the prior year's transactions is primarily impacted by higher earnings spreads on the mix of loans securitized, improved funding spreads, and a decrease in the Constant Prepayment Rate ("CPR") assumption used in the calculation of the 2005 gains on sale.
79
Liquidity Risk
With the dissolution of the GSE, our long-term funding, credit spread and liquidity exposure to the corporate and asset-backed capital markets has increased significantly. A major disruption in the fixed income capital markets that limits our ability to raise funds or significantly increases the cost of those funds could have a material impact on our ability to acquire student loans, or on our results of operations. Going forward, securitizations will continue to be the primary source of long-term financing. Our securitizations are structured such that we do not provide any material level of financial, credit or liquidity support to any of the trusts. Our exposure is limited to the recovery of the Retained Interest asset on the balance sheet for off-balance sheet securitizations. While all of our Retained Interests are subject to some prepayment risk, Retained Interests from our FFELP Stafford securitizations have significant prepayment risk primarily arising from borrowers opting to consolidate their Stafford loans. When consolidation activity is higher than projected, the increase in prepayment could materially impair the value of our Retained Interest.
Retained Interest in Off-Balance Sheet Securitized Loans
The following table summarizes the fair value of our Retained Interests along with the underlying student loans that relate to those securitizations that were treated as sales.
| | As of September 30, 2005
| | As of December 31, 2004
|
|---|
| | Retained
Interest
Fair
Value
| | Underlying
Securitized
Loan
Balance
| | Retained
Interest
Fair
Value
| | Underlying
Securitized
Loan
Balance
|
|---|
| FFELP Stafford and Other Student Loans | | $ | 782 | | $ | 20,435 | | $ | 1,037 | | $ | 27,444 |
| Consolidation Loans(1) | | | 597 | | | 10,677 | | | 585 | | | 7,393 |
| Private Education Loans | | | 951 | | | 7,529 | | | 694 | | | 6,309 |
| | |
| |
| |
| |
|
| Total(2) | | $ | 2,330 | | $ | 38,641 | | $ | 2,316 | | $ | 41,146 |
| | |
| |
| |
| |
|
- (1)
- Includes $265 million and $399 million related to the fair value of the Embedded Floor Income as of September 30, 2005 and December 31, 2004, respectively. The decrease in the fair value of Embedded Floor Income is due to rising interest rates during the period.
- (2)
- Unrealized gains (pre-tax) included in accumulated other comprehensive income related to the Retained Interests totaled $429 million and $445 million as of September 30, 2005 and December 31, 2004, respectively.
Servicing and Securitization Revenue
Servicing and securitization revenue, the ongoing revenue from securitized loan pools accounted for off-balance sheet as QSPEs, includes the interest earned on the Residual Interest asset and the revenue we receive for servicing the loans in the securitization trusts. Interest income recognized on the Residual Interest is based on our anticipated yield determined by estimating future cash flows each quarter.
80
The following table summarizes the components of servicing and securitization revenue for the three and nine months ended September 30, 2005 and 2004.
| | Three months ended
September 30,
| | Nine months ended
September 30,
| |
|---|
| | 2005
| | 2004
| | 2005
| | 2004
| |
|---|
| Servicing revenue | | $ | 79 | | $ | 86 | | $ | 250 | | $ | 239 | |
| Securitization revenue, before Embedded Floor Income and impairment | | | 68 | | | 66 | | | 203 | | | 168 | |
| | |
| |
| |
| |
| |
| Servicing and securitization revenue, before Embedded Floor Income and impairment | | | 147 | | | 152 | | | 453 | | | 407 | |
| Embedded Floor Income | | | 19 | | | 56 | | | 69 | | | 200 | |
| Less: Floor Income previously recognized in gain calculation | | | (11 | ) | | (37 | ) | | (50 | ) | | (127 | ) |
| | |
| |
| |
| |
| |
| Net Embedded Floor Income | | | 8 | | | 19 | | | 19 | | | 73 | |
| | |
| |
| |
| |
| |
| Servicing and securitization revenue, before impairment | | | 155 | | | 171 | | | 472 | | | 480 | |
| Retained Interest impairment | | | (171 | ) | | (12 | ) | | (195 | ) | | (61 | ) |
| | |
| |
| |
| |
| |
| Total servicing and securitization revenue | | $ | (16 | ) | $ | 159 | | $ | 277 | | $ | 419 | |
| | |
| |
| |
| |
| |
| Average off-balance sheet student loans | | $ | 40,742 | | $ | 42,230 | | $ | 42,137 | | $ | 39,787 | |
| | |
| |
| |
| |
| |
| Average balance of Retained Interest | | $ | 2,530 | | $ | 2,397 | | $ | 2,476 | | $ | 2,435 | |
| | |
| |
| |
| |
| |
| Servicing and securitization revenue as a percentage of the average balance of off-balance sheet student loans (annualized) | | | (.16 | )% | | 1.49 | % | | .88 | % | | 1.41 | % |
| | |
| |
| |
| |
| |
Servicing and securitization revenue is primarily driven by the average balance of off-balance sheet student loans and the amount of and the difference in the timing of Embedded Floor Income recognition on off-balance sheet student loans. Servicing and securitization revenue can also be negatively impacted by impairments of the value of our Retained Interest, caused primarily by the effect of higher than expected Consolidation Loan activity on FFELP Stafford student loan securitizations and the effect of market interest rates on the Embedded Floor Income included in the Retained Interest. When FFELP Stafford loans in a securitization trust consolidate, they are a prepayment to the trust resulting in a shorter average life. We use a CPR assumption to estimate the effect of trust prepayments from loan consolidation and other factors on the life of the trust. When consolidation activity is higher than forecasted, the Residual Interest asset can be impaired and the yield used to recognize subsequent income from the trust is negatively impacted. The majority of the consolidations bring the loans back on-balance sheet so we retain the value of the asset on-balance sheet versus in the trust.
For the three months ended September 30, 2005 and 2004, we recorded impairments to the Retained Interests of $171 million and $12 million, respectively. For the nine months ended September 30, 2005 and 2004, we recorded impairments to the Retained Interests of $195 million and $61 million, respectively. These impairment charges were primarily the result of continued record levels of consolidation activity and an increase in future CPR assumptions used to value the Residual Interest, which reflects our view that there will be continued strong demand for Consolidation Loans. In the third quarter of 2005, FFELP Stafford loans prepaid faster than projected due to the record amount of Consolidation Loan applications received in the second quarter of 2005 that were processed through our securitizations in the third quarter of 2005. This surge in Consolidation Loan activity was due to FFELP Stafford borrowers locking in lower interest rates by consolidating their loans prior to the July 1 interest rate reset for FFELP Stafford loans. The level and timing of Consolidation Loan activity is highly volatile, and in response we will continue to review and, if necessary, revise our
81
estimates of the effects of Consolidation Loan activity on our Retained Interests. We updated our FFELP Stafford CPR assumptions in the third quarter of 2005 as follows:
Year
| | As of
September 30,
2005
| | As of
December 31,
2004
| |
|---|
| 2005 | | 30 | % | 20 | % |
| 2006 | | 20 | % | 15 | % |
| 2007 | | 15 | % | 6 | % |
| Thereafter | | 10 | % | 6 | % |
In 2004, our Retained Interests were also impaired by the effect of higher market interest rates on the Embedded Floor Income. The impairments are recorded as a reduction in securitization revenue. The level and timing of Consolidation Loan activity remains highly volatile which may result in an additional impairment recorded in future periods if Consolidation Loan activity remains higher than projected.
Interest Rate Risk Management
Asset and Liability Funding Gap
The tables below present our assets and liabilities (funding) arranged by underlying indices as of September 30, 2005. The difference between the asset and the funding is the funding gap, which represents our exposure to interest rate risk in the form of basis risk and repricing risk, which is the risk that the different indices may reset at different frequencies or may not move in the same direction or at the same magnitude. In the following GAAP presentation, the funding gap only includes derivatives that qualify as effective SFAS No. 133 hedges (those derivatives which are reflected in net interest margin, as opposed to in the gains (losses) on derivative and hedging activities).
Index
| | Frequency of
Variable Resets
| | Assets
| | Funding(1)
| | Funding
Gap
| |
|---|
(Dollars in billions)
| |
| |
| |
| |
| |
|---|
| 3 month commercial paper | | daily | | $ | 59.4 | | $ | — | | $ | 59.4 | |
| 3 month Treasury bill | | weekly | | | 9.7 | | | .3 | | | 9.4 | |
| Prime | | annual | | | 1.0 | | | — | | | 1.0 | |
| Prime | | quarterly | | | 1.4 | | | — | | | 1.4 | |
| Prime | | monthly | | | 5.7 | | | — | | | 5.7 | |
| PLUS Index | | annual | | | 2.8 | | | — | | | 2.8 | |
| 3-month LIBOR | | daily | | | — | | | — | | | — | |
| 3-month LIBOR | | quarterly | | | 1.6 | | | 72.9 | | | (71.3 | ) |
| 1-month LIBOR | | monthly | | | — | | | 2.5 | | | (2.5 | ) |
| CMT/CPI index | | monthly/quarterly | | | — | | | 1.9 | | | (1.9 | ) |
| Non discreet reset(2) | | monthly | | | — | | | 8.2 | | | (8.2 | ) |
| Non discreet reset(3) | | daily/weekly | | | 4.2 | | | — | | | 4.2 | |
| Fixed Rate(4) | | | | | 10.5 | | | 10.5 | | | — | |
| | | | |
| |
| |
| |
| Total | | | | $ | 96.3 | | $ | 96.3 | | $ | — | |
| | | | |
| |
| |
| |
- (1)
- Includes all derivatives that qualify as hedges under SFAS No. 133.
- (2)
- Consists of asset-backed commercial paper and auction rate securities, which are discount note type instruments that generally roll over monthly.
- (3)
- Includes restricted and non-restricted cash equivalents and other overnight type instruments including commercial paper program.
- (4)
- Includes receivables/payables, other assets (including retained interest), other liabilities and stockholders' equity (excluding Series B Preferred Stock).
82
The funding gaps in the above table are primarily interest rate mismatches in short term indices between our assets and liabilities. We address this issue primarily through the use of basis swaps that convert quarterly 3-month LIBOR to other indices that are more correlated to our asset indices. These basis swaps generally do not qualify as effective hedges under SFAS No. 133 and as a result are not included in our interest margin and are therefore excluded from the GAAP presentation.
In addition to the GAAP basis, management analyzes interest rate risk on a Managed Basis, which consists of both on-balance sheet and off-balance sheet assets and liabilities and includes all derivatives that are economically hedging our debt whether they qualify as effective hedges under SFAS No. 133 or not. Accordingly, we are also presenting the asset and liability funding gap on a Managed basis in the table that follows the GAAP presentation.
Index
| | Frequency of
Variable Resets
| | Assets
| | Funding(5)
| | Funding
Gap
| |
|---|
(Dollars in billions)
| |
| |
| |
| |
| |
|---|
| 3 month commercial paper | | daily | | $ | 79.3 | | $ | 16.4 | | $ | 62.9 | |
| 3 month Treasury bill | | weekly | | | 20.1 | | | 19.4 | | | .7 | |
| Prime | | annual | | | 1.0 | | | — | | | 1.0 | |
| Prime | | quarterly | | | 7.3 | | | 5.5 | | | 1.8 | |
| Prime | | monthly | | | 6.4 | | | 1.2 | | | 5.2 | |
| PLUS Index | | annual | | | 4.5 | | | 4.6 | | | (.1 | ) |
| 3-month LIBOR | | daily | | | — | | | 65.8 | | | (65.8 | ) |
| 3-month LIBOR | | quarterly | | | 1.5 | | | 5.2 | | | (3.7 | ) |
| 1-month LIBOR | | monthly | | | .1 | | | 2.5 | | | (2.4 | ) |
| Non discreet reset(6) | | monthly | | | — | | | 8.5 | | | (8.5 | ) |
| Non discreet reset(7) | | daily/weekly | | | 9.0 | | | — | | | 9.0 | |
| Fixed Rate(8) | | | | | 9.3 | | | 9.4 | | | (.1 | ) |
| | | | |
| |
| |
| |
| Total | | | | $ | 138.5 | | $ | 138.5 | | $ | — | |
| | | | |
| |
| |
| |
- (5)
- Includes all derivatives that management considers economic hedges of interest rate risk and reflects how we internally manage our interest rate exposure.
- (6)
- Consists of asset-backed commercial paper and auction rate securities, which are discount note type instruments that generally roll over monthly.
- (7)
- Includes restricted and non-restricted cash equivalents and other overnight type instruments.
- (8)
- Includes receivables/payables, other assets, other liabilities and stockholders' equity (excluding Series B Preferred Stock).
To the extent possible we generally fund our assets with debt (in combination with derivatives) that has the same underlying index (index type and index reset frequency). When it is more economical, we also fund our assets with debt that has a different index and/or reset frequency than the asset, but only in instances where we believe there is a high degree of correlation between the interest rate movement of the two indices. For example, we use daily reset 3-month LIBOR to fund a large portion of our daily reset 3-month commercial paper indexed assets. In addition, we use quarterly reset 3-month LIBOR to fund a portion of our quarterly reset Prime rate indexed Private Education Loans. We also use our monthly non discreet reset funding (see note 6 in the above table) to primarily fund Treasury bill and commercial paper indexed student loans. In using different index types and different index reset frequencies to fund our assets, we are exposed to interest rate risk in the form of basis risk and repricing risk, which is the risk that the different indices that may reset at different frequencies will not move in the same direction or at the same magnitude. We believe that this risk is low as all of these
83
indices are short-term with rate movements that are highly correlated over a long period of time. We use interest rate swaps and other derivatives to achieve our risk management objectives.
When compared with the GAAP presentation the Managed Basis presentation includes all of our off-balance sheet assets and funding, and also includes basis swaps that primarily convert quarterly 3-month LIBOR to other indices that are more correlated to our asset indices.
Interest Rate Gap Analysis
In the table below, the Company's variable rate assets and liabilities are categorized by reset date of the underlying index. Fixed rate assets and liabilities are categorized based on their maturity dates. An interest rate gap is the difference between volumes of assets and volumes of liabilities maturing or repricing during specific future time intervals. The following gap analysis reflects rate-sensitive positions at September 30, 2005 and is not necessarily reflective of positions that existed throughout the period.
| | Interest Rate Sensitivity Period
| |
|---|
| | 3 months
or less
| | 3 months
to
6 months
| | 6 months
to
1 year
| | 1 to 2
years
| | 2 to 5
years
| | Over
5 years
| |
|---|
| Assets | | | | | | | | | | | | | | | | | | | |
| Student loans | | $ | 78,105 | | $ | 108 | | $ | 3,336 | | $ | 10 | | $ | 64 | | $ | 3 | |
| Other loans | | | 205 | | | 43 | | | 84 | | | 14 | | | 13 | | | 735 | |
| Cash and investments, including restricted | | | 4,374 | | | 125 | | | 180 | | | 160 | | | 1,130 | | | 511 | |
| Other assets | | | 1,865 | | | 110 | | | 221 | | | 281 | | | 564 | | | 4,079 | |
| | |
| |
| |
| |
| |
| |
| |
| Total assets | | | 84,549 | | | 386 | | | 3,821 | | | 465 | | | 1,771 | | | 5,328 | |
| | |
| |
| |
| |
| |
| |
| |
| Liabilities and Stockholders' Equity | | | | | | | | | | | | | | | | | | | |
| Short-term borrowings | | | 4,132 | | | — | | | 520 | | | — | | | — | | | — | |
| Long-term borrowings | | | 60,453 | | | 25 | | | — | | | 1,488 | | | 10,469 | | | 12,064 | |
| Other liabilities | | | 486 | | | — | | | — | | | — | | | — | | | 2,845 | |
| Minority interest in subsidiaries | | | — | | | — | | | — | | | — | | | — | | | 14 | |
| Stockholders' equity | | | — | | | — | | | — | | | — | | | — | | | 3,824 | |
| | |
| |
| |
| |
| |
| |
| |
| Total liabilities and stockholders' equity | | | 65,071 | | | 25 | | | 520 | | | 1,488 | | | 10,469 | | | 18,747 | |
| | |
| |
| |
| |
| |
| |
| |
| Period gap before adjustments | | | 19,478 | | | 361 | | | 3,301 | | | (1,023 | ) | | (8,698 | ) | | (13,419 | ) |
Adjustments for Derivatives and
Other Financial Instruments |
|
|
|
|
|
|
|
|
|
|
|
|
|
|
|
|
|
|
|
| Interest rate swaps | | | (17,588 | ) | | 2,050 | | | (5,195 | ) | | 99 | | | 8,675 | | | 11,959 | |
| Impact of securitized student loans | | | (1,954 | ) | | — | | | 1,954 | | | — | | | — | | | — | |
| | |
| |
| |
| |
| |
| |
| |
| Total derivatives and other financial instruments | | | (19,542 | ) | | 2,050 | | | (3,241 | ) | | 99 | | | 8,675 | | | 11,959 | |
| | |
| |
| |
| |
| |
| |
| |
| Period gap | | $ | (64 | ) | $ | 2,411 | | $ | 60 | | $ | (924 | ) | $ | (23 | ) | $ | (1,460 | ) |
| | |
| |
| |
| |
| |
| |
| |
| Cumulative gap | | $ | (64 | ) | $ | 2,347 | | $ | 2,407 | | $ | 1,483 | | $ | 1,460 | | $ | — | |
| | |
| |
| |
| |
| |
| |
| |
| Ratio of interest-sensitive assets to interest-sensitive liabilities | | | 128.0 | % | | 1,104.0 | % | | 692.3 | % | | 12.4 | % | | 11.5 | % | | 10.3 | % |
| | |
| |
| |
| |
| |
| |
| |
| Ratio of cumulative gap to total assets | | | (.1 | )% | | 2.4 | % | | 2.5 | % | | 1.5 | % | | 1.5 | % | | — | % |
| | |
| |
| |
| |
| |
| |
| |
84
Weighted Average Life
The following table reflects the weighted average life for our Managed earning assets and liabilities at September 30, 2005.
(Averages in years)
| | On-Balance
Sheet
| | Off-Balance
Sheet
| | Managed
|
|---|
| Earning assets | | | | | | |
| Student loans | | 9.3 | | 4.7 | | 8.9 |
| Other loans | | 7.6 | | — | | 7.6 |
| Cash and investments | | 1.5 | | .1 | | .8 |
| | |
| |
| |
|
| Total earning assets | | 8.7 | | 4.1 | | 8.2 |
| | |
| |
| |
|
Borrowings |
|
|
|
|
|
|
| Short-term borrowings | | .5 | | — | | .5 |
| Long-term borrowings | | 7.1 | | 4.7 | | 6.3 |
| | |
| |
| |
|
| Total borrowings | | 6.7 | | 4.7 | | 6.1 |
| | |
| |
| |
|
The longer average life for student loans on-balance sheet versus off-balance sheet is due to the higher percentage of Consolidation Loans on-balance sheet plus the higher percentage of loans in-school.
Long-term debt issuances likely to be called have been categorized according to their call dates rather than their maturity dates. Long-term debt issuances which are putable by the investor are categorized according to their put dates rather than their maturity dates.
85
COMMON STOCK
The following table summarizes our common share repurchases, issuances and equity forward activity for the three and nine months ended September 30, 2005 and 2004.
| | Three months ended
September 30,
| | Nine months ended
September 30,
| |
|---|
(Shares in millions)
| |
|---|
| | 2005
| | 2004
| | 2005
| | 2004
| |
|---|
| Common shares repurchased: | | | | | | | | | | | | | |
| | Open market | | | — | | | — | | | — | | | .5 | |
| | Equity forwards | | | 2.9 | | | 11.4 | | | 9.4 | | | 24.8 | |
| | Benefit plans(1) | | | .5 | | | .1 | | | 1.0 | | | 1.0 | |
| | |
| |
| |
| |
| |
| | Total shares repurchased | | | 3.4 | | | 11.5 | | | 10.4 | | | 26.3 | |
| | |
| |
| |
| |
| |
| | Average purchase price per share | | $ | 50.12 | | $ | 38.91 | | $ | 49.67 | | $ | 36.21 | |
| | |
| |
| |
| |
| |
| Common shares issued | | | 1.8 | | | 1.8 | | | 5.3 | | | 7.9 | |
| | |
| |
| |
| |
| |
| Equity forward contracts: | | | | | | | | | | | | | |
| | Outstanding at beginning of period | | | 51.7 | | | 47.2 | | | 42.8 | | | 43.5 | |
| | New contracts | | | 1.4 | | | 12.3 | | | 16.8 | | | 29.4 | |
| | Exercises | | | (2.9 | ) | | (11.4 | ) | | (9.4 | ) | | (24.8 | ) |
| | |
| |
| |
| |
| |
| | Outstanding at end of period | | | 50.2 | | | 48.1 | | | 50.2 | | | 48.1 | |
| | |
| |
| |
| |
| |
| Authority remaining at end of period to repurchase or enter into equity forwards(2) | | | 19.0 | | | 8.4 | | | 19.0 | | | 8.4 | |
| | |
| |
| |
| |
| |
- (1)
- Includes shares withheld from stock option exercises and vesting of performance stock to satisfy minimum statutory tax withholding obligations and shares tendered by employees to satisfy option exercise costs.
- (2)
- In October 2004, the Board authorized an additional 30 million shares for repurchase.
As of September 30, 2005, the expiration dates and purchase prices for outstanding equity forward contracts were as follows:
Year of maturity
| | Outstanding
contracts
| | Range of
purchase prices
| | Average
purchase price
|
|---|
| | (Shares in millions)
| |
| |
|
|---|
| 2007 | | 9.5 | | $50.47 | | $ | 50.47 |
| 2008 | | 7.9 | | 50.47 | | | 50.47 |
| 2009 | | 16.0 | | 50.47 | | | 50.47 |
| 2010 | | 16.8 | | 47.09 – 51.22 | | | 48.76 |
| | |
| | | |
|
| | | 50.2 | | | | $ | 49.90 |
| | |
| | | |
|
The closing price of the Company's common stock on September 30, 2005 was $53.64.
86
RECENT DEVELOPMENTS
Higher Education Act Reauthorization
The relevant committees of the House and Senate have each passed bills to reauthorize the Higher Education Act ("HEA"). We anticipate that each of these bills will eventually be moved to the floor of each body for approval, with a House/Senate conference then negotiating the terms of the final law. Depending on whether the current budget reconciliation process stands, final passage of HEA reauthorization could take place as part of budget reconciliation, or as a stand-alone bill.
The House Education and the Workforce Committee originally reported its HEA reauthorization bill, H.R. 609, in July. We provided a summary of that bill's major provisions in our Quarterly Report on Form 10-Q for the second quarter of 2005. The July mark-up took place in the context of a reconciliation budget instruction to the Committee of $12.6 billion in savings for all areas in its jurisdiction, which was part of an overall entitlement savings goal of $35 billion. However, as part of an effort to achieve additional spending cuts, the House Education and Workforce Committee met on October 26, 2005, and reported legislation to achieve total savings of $20 billion, of which $14.5 billion comes from the student loan programs. In addition to the savings from H.R. 609, the House budget legislation includes the following provisions:
- •
- Increase in lender origination fee from 0.5 percent to 1 percent.
- •
- Charge a borrower origination fee of 1 percent on all Consolidation Loans. This provision replaced the 0.5 percent fee on fixed rate Consolidation Loans in H.R. 609.
- •
- Reduce retention on "regular" collections from 23 percent to 20 percent. This would apply primarily to cash collections versus the rehabilitations and consolidations which have already been addressed in earlier versions of the bill.
- •
- Eliminate mandatory spending for direct loan administrative costs. This provision would shift existing spending from the "mandatory" to the "discretionary" budget category.
The House budget legislation, known as "reconciliation," is likely to be considered by the full House during the week of November 7th.
On November 3, 2005, the Senate passed its version of the omnibus budget reconciliation bill, which included HEA reauthorization. The Senate HEA provisions share some provisions with the House bill, but also differed in a number of important ways. The major provisions of the Senate bill affecting Sallie Mae are as follows:
- •
- Key provisions similar to House bill: the Senate bill's provisions on loan limit increases, lender rebate of floor income, Guaranty agency compensation for collections, fix to PLUS/SAP gap, and repeal of the single holder are all similar to the House bill's approach.
- •
- Borrower Interest Rates and Consolidation: Borrower interest rates would shift from the current variable rate structure to fixed rates. New Stafford loans would be fixed at 6.8 percent, PLUS at 8.5 percent; consolidation is fixed at the average of the underlying rates. The basic lender SAP rate would remain unchanged. This contrasts with the House bill, which would maintain a variable rate structure on Stafford and PLUS loans.
- •
- Origination Fees: Mandates a one percent FFELP Guaranty Fee, similar to House bill. Reduces the three percent FFELP lender Origination Fee to two percent in 2007 and completely eliminates the origination fees in 2011. Gives the Direct Loan Program authority to discount its Origination Fees. Increases lender origination fee on Consolidation Loans to one percent.
87
- •
- Risk Sharing and Exceptional Performer. Changes government insurance on new loans to 97 percent from current 98 percent; ends the Exceptional Performer program, which has provided Sallie Mae and other qualifying servicers 100 percent insurance.
- •
- 9.5% SAP: makes permanent the existing ban on "transferring" and "refunding" practices that have been used to grow and extend the life of 9.5 percent SAP portfolios. Does not end "recycling" as the House bill does.
- •
- Need-based grant aid: Creates two major new needs-based grant programs ($8.0 billion expense over 5 years).
- •
- PLUS expansion: Expands PLUS (at fixed 8.5 percent rate) to graduate and professional students.
- •
- School-As-Lender: Allows no new schools to participate (if not participating August 31, 2005); places new restrictions on existing participants, including holding loans to grace.
88
Item 3. Quantitative and Qualitative Disclosures about Market Risk
Interest Rate Sensitivity Analysis
The effect of short-term movements in interest rates on our results of operations and financial position has been limited through our interest rate risk management. The following tables summarize the effect on earnings for the three and nine months ended September 30, 2005 and 2004 and the effect on fair values at September 30, 2005 and December 31, 2004, based upon a sensitivity analysis performed by management assuming a hypothetical increase in market interest rates of 100 basis points and 300 basis points while funding spreads remain constant.
| | Three months ended September 30,
| |
|---|
| | 2005
| | 2004
| |
|---|
| | Interest Rates:
| | Interest Rates:
| |
|---|
| | Change from
increase of
100 basis
points
| | Change from
increase of
300 basis
points
| | Change from
increase of
100 basis
points
| | Change from
increase of
300 basis
points
| |
|---|
(Dollars in millions, except per share amounts)
| |
|---|
| | $
| | %
| | $
| | %
| | $
| | %
| | $
| | %
| |
|---|
| Effect on Earnings | | | | | | | | | | | | | | | | | | | | | |
| Increase/(decrease) in pre-tax net income before gains (losses) on derivative and hedging activities(1) | | $ | 2 | | 1 | % | $ | (8 | ) | (5 | )% | $ | 14 | | 6 | % | $ | 44 | | 19 | % |
| Unrealized gains (losses) on derivative and hedging activities | | | 243 | | 60 | | | 437 | | 107 | | | 268 | | 118 | | | 576 | | 254 | |
| | |
| |
| |
| |
| |
| |
| |
| |
| |
| Increase in net income before taxes | | $ | 245 | | 42 | % | $ | 429 | | 74 | % | $ | 282 | | 62 | % | $ | 620 | | 137 | % |
| | |
| |
| |
| |
| |
| |
| |
| |
| |
| Increase in diluted earnings per common share | | $ | .35 | | 37 | % | $ | .62 | | 65 | % | $ | .387 | | 51 | % | $ | .857 | | 113 | % |
| | |
| |
| |
| |
| |
| |
| |
| |
| |
| | Nine months ended September 30,
| |
|---|
| | 2005
| | 2004
| |
|---|
| | Interest Rates:
| | Interest Rates:
| |
|---|
| | Change from
increase of
100 basis
points
| | Change from
increase of
300 basis
points
| | Change from
increase of
100 basis
points
| | Change from
increase of
300 basis
points
| |
|---|
(Dollars in millions, except per share amounts)
| |
|---|
| | $
| | %
| | $
| | %
| | $
| | %
| | $
| | %
| |
|---|
| Effect on Earnings | | | | | | | | | | | | | | | | | | | | | |
| Increase/(decrease) in pre-tax net income before gains (losses) on derivative and hedging activities(1) | | $ | 16 | | 2 | % | $ | 24 | | 2 | % | $ | 23 | | 3 | % | $ | 111 | | 12 | % |
| Unrealized gains (losses) on derivative and hedging activities | | | 243 | | 50 | | | 437 | | 90 | | | 268 | | 30 | | | 576 | | 65 | |
| | |
| |
| |
| |
| |
| |
| |
| |
| |
| Increase in net income before taxes | | $ | 259 | | 18 | % | $ | 461 | | 31 | % | $ | 291 | | 16 | % | $ | 687 | | 38 | % |
| | |
| |
| |
| |
| |
| |
| |
| |
| |
| Increase in diluted earnings per common share | | $ | .38 | | 18 | % | $ | .70 | | 33 | % | $ | .409 | | 15 | % | $ | .979 | | 37 | % |
| | |
| |
| |
| |
| |
| |
| |
| |
| |
- (1)
- "Increase/(decrease) in pre-tax net income before "gains (losses) on derivative and hedging activities" includes stress of Series B Preferred Stock.
89
| | At September 30, 2005
| |
|---|
| |
| | Interest Rates:
| |
|---|
| |
| | Change from
increase of
100 basis points
| | Change from
increase of
300 basis points
| |
|---|
(Dollars in millions)
| | Fair
Value
| |
|---|
| | $
| | %
| | $
| | %
| |
|---|
| Effect on Fair Values | | | | | | | | | | | | | | |
| Assets | | | | | | | | | | | | | | |
| | Student loans | | $ | 84,665 | | $ | (260 | ) | — | % | $ | (472 | ) | (1 | )% |
| | Other earning assets | | | 7,614 | | | (62 | ) | (1 | ) | | (179 | ) | (2 | ) |
| | Other assets | | | 7,120 | | | (422 | ) | (6 | ) | | (600 | ) | (8 | ) |
| | |
| |
| |
| |
| |
| |
| | Total assets | | $ | 99,399 | | $ | (744 | ) | (1 | )% | $ | (1,251 | ) | (1 | )% |
| | |
| |
| |
| |
| |
| |
Liabilities |
|
|
|
|
|
|
|
|
|
|
|
|
|
|
| | Interest bearing liabilities | | $ | 89,384 | | $ | (1,451 | ) | (2 | )% | $ | (3,635 | ) | (4 | )% |
| | Other liabilities | | | 3,331 | | | 816 | | 25 | | | 2,558 | | 77 | |
| | |
| |
| |
| |
| |
| |
| | Total liabilities | | $ | 92,715 | | $ | (635 | ) | (1 | )% | $ | (1,077 | ) | (1 | )% |
| | |
| |
| |
| |
| |
| |
| |
At December 31, 2004
| |
|---|
| |
| | Interest Rates:
| |
|---|
| |
| | Change from
increase of
100 basis points
| | Change from
increase of
300 basis points
| |
|---|
(Dollars in millions)
| | Fair
Value
| |
|---|
| | $
| | %
| | $
| | %
| |
|---|
| Effect on Fair Values | | | | | | | | | | | | | | |
| Assets | | | | | | | | | | | | | | |
| | Student loans | | $ | 67,431 | | $ | (315 | ) | — | % | $ | (636 | ) | (1 | )% |
| | Other earning assets | | | 10,285 | | | (120 | ) | (1 | ) | | (333 | ) | (3 | ) |
| | Other assets | | | 7,878 | | | (652 | ) | (8 | ) | | (1,154 | ) | (15 | ) |
| | |
| |
| |
| |
| |
| |
| | Total assets | | $ | 85,594 | | $ | (1,087 | ) | (1 | )% | $ | (2,123 | ) | (2 | )% |
| | |
| |
| |
| |
| |
| |
Liabilities |
|
|
|
|
|
|
|
|
|
|
|
|
|
|
| | Interest bearing liabilities | | $ | 78,295 | | $ | (1,202 | ) | (2 | )% | $ | (3,356 | ) | (4 | )% |
| | Other liabilities | | | 2,798 | | | 276 | | 10 | | | 1,503 | | 54 | |
| | |
| |
| |
| |
| |
| |
| | Total liabilities | | $ | 81,093 | | $ | (926 | ) | (1 | )% | $ | (1,853 | ) | (2 | )% |
| | |
| |
| |
| |
| |
| |
A primary objective in our funding is to minimize our sensitivity to changing interest rates by generally funding our floating rate student loan portfolio with floating rate debt. However, as discussed under "NET INTEREST INCOME—Student Loans—On-Balance Sheet Floor Income," in the current low interest rate environment, we can have a fixed versus floating mismatch in funding if the student loan earns at the fixed borrower rate and the funding remains floating.
During the three and nine months ended September 30, 2005 and 2004, certain FFELP student loans were earning Floor Income and we locked in a portion of that Floor Income through the use of futures and Floor Income Contracts. The result of these hedging transactions was to convert a portion of the fixed rate nature of student loans to variable rate, and to fix the relative spread between the student loan asset rate and the variable rate liability.
In the above table, under the scenario where interest rates increase 100 and 300 basis points, the change in pre-tax net income before the unrealized gains (losses) on derivative and hedging activities is primarily due to the impact of (i) our off-balance sheet hedged Consolidation Loan securitizations and
90
the related Embedded Floor Income recognized as part of the gain on sale, which results in no change in the Embedded Floor Income as a result of the increase in rates but does result in a decrease in payments on the written Floor contracts (ii) our unhedged on-balance sheet loans not currently having significant Floor Income due to the recent increase in interest rates, which results in these loans being more variable rate in nature and (iii) a portion of our fixed rate assets being funded with variable debt. The first two items together will generally cause income to increase when interest rates increase from a low interest rate environment, whereas, the third item will offset this increase. In the 300 basis point scenario for the three months ended September 30, 2005 the first two items had little impact allowing the third item to cause a net decrease in income.
Item 4. Controls and Procedures
Disclosure Controls and Procedures
Our management, with the participation of our President and Chief Executive Officer and Executive Vice President, Finance, Accounting and Risk Management, evaluated the effectiveness of our disclosure controls and procedures (as defined in Rules 13a-15(e) and 15d-15(e) under the Securities Exchange Act of 1934, as amended (the "Exchange Act")) as of September 30, 2005. Based on this evaluation, our President and Chief Executive Officer and Executive Vice President, Finance, Accounting and Risk Management, concluded that, as of September 30, 2005, our disclosure controls and procedures were effective to ensure that information required to be disclosed by us in the reports that we file or submit under the Exchange Act is (a) recorded, processed, summarized and reported within the time periods specified in the SEC's rules and forms and (b) accumulated and communicated to our management, including our President and Chief Executive Officer and Executive Vice President, Finance, Accounting and Risk Management, as appropriate to allow timely decisions regarding required disclosure.
Changes in Internal Control Over Financial Reporting
No change in our internal control over financial reporting (as defined in Rules 13a-15(f) and 15d-15(f) under the Securities Exchange Act of 1934, as amended) occurred during the fiscal quarter ended September 30, 2005 that has materially affected, or is reasonably likely to materially affect, our internal control over financial reporting.
91
PART II. OTHER INFORMATION
Item 1. Legal Proceedings
The Company was named as a defendant in a putative class action lawsuit brought by three Wisconsin residents on December 20, 2001 in the Superior Court for the District of Columbia. The plaintiffs sought to represent a nationwide class action on behalf of all borrowers who allegedly paid "undisclosed improper and excessive" late fees over the past three years. The plaintiffs sought damages of one thousand five hundred dollars per violation plus punitive damages and claimed that the class consisted of two million borrowers. In addition, the plaintiffs alleged that the Company charged excessive interest by capitalizing interest quarterly in violation of the promissory note. On February 27, 2003, the Superior Court granted the Company's motion to dismiss the complaint in its entirety. On March 4, 2004, the District of Columbia Court of Appeals affirmed the Superior Court's decision granting our motion to dismiss the complaint, but granted plaintiffs leave to re-plead the first count, which alleged violations of the D.C. Consumer Protection Procedures Act. On September 15, 2004, the plaintiffs filed an amended class action complaint. On December 27, 2004, the Superior Court granted the Company's motion to dismiss the plaintiffs' amended compliant. Plaintiffs have appealed the Superior Court's December 27, 2004 dismissal order to the District of Columbia Court of Appeals. All appellate briefing has been completed. The Company believes that it will prevail on the merits of this case if it becomes necessary to further litigate this matter.
We are also subject to various claims, lawsuits and other actions that arise in the normal course of business. Most of these matters are claims by borrowers disputing the manner in which their loans have been processed or the accuracy of our reports to credit bureaus. In addition, the collections subsidiaries in our debt management operation group are named in individual plaintiff or class action lawsuits in which the plaintiffs allege that we have violated the Fair Debt Collection Practices Act or state law in the process of collecting their account. Management believes that these claims, lawsuits and other actions will not have a material adverse effect on its business, financial condition or results of operations.
Item 2. Changes in Securities, Use of Proceeds and Issuer Purchases of Equity Securities
The following table summarizes the Company's common share repurchases during the third quarter of 2005 pursuant to the stock repurchase program first authorized in September 1997 by the Board of Directors. Since the inception of the program, which has no expiration date, the Board of Directors has authorized the purchase of up to 307.5 million shares as of September 30, 2005.
(Common shares in millions)
| | Total Number
of Shares
Purchased(1)
| | Average Price
Paid per
Share
| | Total Number of
Shares Purchased
as Part of Publicly
Announced Plans
or Programs
| | Maximum Number
of Shares that May
Yet Be Purchased
Under the Plans
or Programs(2)
|
|---|
| Period: | | | | | | | | | |
| July 1 – July 31, 2005 | | 3.0 | | $ | 50.48 | | 3.0 | | 20.5 |
| August 1 – August 31, 2005 | | .3 | | | 46.86 | | .3 | | 19.0 |
| September 1 – September 30, 2005 | | .1 | | | 49.94 | | .1 | | 19.0 |
| | |
| |
| |
| | |
| Total third quarter | | 3.4 | | $ | 50.12 | | 3.4 | | |
| | |
| |
| |
| | |
- (1)
- The total number of shares purchased includes: i) shares purchased under the stock repurchase program discussed above, and ii) shares purchased in connection with the exercise of stock options and vesting of performance stock to satisfy minimum statutory tax withholding obligations and shares tendered by employees to satisfy option exercise costs (which combined totaled .5 million shares for the third quarter of 2005).
- (2)
- Reduced by outstanding equity forward contracts.
92
Item 3. Defaults Upon Senior Securities
Nothing to report.
Item 4. Submission of Matters to a Vote of Security Holders
Nothing to report.
Item 5. Other Information
Nothing to report.
Item 6. Exhibits
The following exhibits are furnished or filed, as applicable:
| 10.23 | | Employment Agreement between Registrant and Thomas J. Fitzpatrick, President and Chief Executive Officer, effective as of June 1, 2005 |
| 31.1 | | Certification Pursuant to Section 302 of the Sarbanes-Oxley Act of 2002 |
| 31.2 | | Certification Pursuant to Section 302 of the Sarbanes-Oxley Act of 2002 |
| 32.1 | | Certification Pursuant to 18 U.S.C. Section 1350, as Adopted Pursuant to Section 906 of the Sarbanes-Oxley Act of 2002 |
| 32.2 | | Certification Pursuant to 18 U.S.C. Section 1350, as Adopted Pursuant to Section 906 of the Sarbanes-Oxley Act of 2002 |
93
SIGNATURES
Pursuant to the requirements of the Securities Exchange Act of 1934, as amended, the Registrant has duly caused this report to be signed on its behalf by the undersigned hereunto duly authorized.
|
|
SLM CORPORATION
(Registrant) |
|
|
By: |
/s/ C. E. ANDREWS
C. E. Andrews
Executive Vice President, Finance,
Accounting and Risk Management
(Principal Accounting Officer and
Duly Authorized Officer) |
Date: November 8, 2005
94
QuickLinks
SLM CORPORATION FORM 10-Q INDEX September 30, 2005PART I. FINANCIAL INFORMATIONSLM CORPORATION CONSOLIDATED BALANCE SHEETS (Dollars and shares in thousands, except per share amounts)SLM CORPORATION CONSOLIDATED STATEMENTS OF INCOME (Dollars and shares in thousands, except per share amounts)SLM CORPORATION CONSOLIDATED STATEMENTS OF CHANGES IN STOCKHOLDERS' EQUITY (Dollars in thousands, except share and per share amounts) (Unaudited)SLM CORPORATION CONSOLIDATED STATEMENTS OF CASH FLOWS (Dollars in thousands)SLM CORPORTION NOTES TO CONSOLIDATED FINANCIAL STATEMENTS (Information at September 30, 2005 and for the three and nine months ended September 30, 2005 and 2004 is unaudited) (Dollars and shares in thousands, except per share amounts, unless otherwise noted)MANAGEMENT'S DISCUSSION AND ANALYSIS OF FINANCIAL CONDITION AND RESULTS OF OPERATIONS Three and nine months ended September 30, 2005 and 2004 (Dollars in millions, except per share amounts, unless otherwise stated)PART II. OTHER INFORMATIONSIGNATURES