UNITED STATES
SECURITIES AND EXCHANGE COMMISSION
Washington, D.C. 20549
Form 10-K
(Mark One)
☑ ANNUAL REPORT PURSUANT TO SECTION 13 OR 15(d) OF THE SECURITIES EXCHANGE
ACT OF 1934
For the fiscal year ended December 31, 2024
or
☐ TRANSITION REPORT PURSUANT TO SECTION 13 or 15(d) OF THE SECURITIES EXCHANGE
ACT OF 1934
For the transition period from to
Commission file number 001-13251
SLM Corporation
(Exact Name of Registrant as Specified in Its Charter)
| | | | | | | | | | | |
| Delaware | | 52-2013874 |
(State or other jurisdiction of
incorporation or organization) | | (I.R.S. Employer
Identification No.) |
| | | |
| 300 Continental Drive | Newark, | Delaware | 19713 |
| (Address of principal executive offices) | | (Zip Code) |
(302) 451-0200
(Registrant’s Telephone Number, Including Area Code)
(Former name, former address and former fiscal year, if changed since last report)
Securities registered pursuant to Section 12(b) of the Act: | | | | | | | | |
| Title of each class | Trading Symbol(s) | Name of each exchange on which registered |
| Common stock, par value $.20 per share | SLM | The NASDAQ Global Select Market |
| Floating Rate Non-Cumulative Preferred Stock, Series B, par value $.20 per share | SLMBP | The NASDAQ Global Select Market |
Securities registered pursuant to Section 12(g) of the Act: None
Indicate by check mark if the registrant is a well-known seasoned issuer, as defined in Rule 405 of the Securities Act. Yes ☑ No ☐
Indicate by check mark if the registrant is not required to file reports pursuant to Section 13 or 15(d) of the Act. Yes ☐ No ☑
Indicate by check mark whether the registrant: (1) has filed all reports required to be filed by Section 13 or 15(d) of the Securities Exchange Act of 1934 during the preceding 12 months (or for such shorter period that the registrant was required to file such reports), and (2) has been subject to such filing requirements for the past 90 days. Yes ☑ No ☐
Indicate by check mark whether the registrant has submitted electronically every Interactive Data File required to be submitted pursuant to Rule 405 of Regulation S-T during the preceding 12 months (or for such shorter period that the registrant was required to submit such files). Yes ☑ No ☐
Indicate by check mark whether the registrant is a large accelerated filer, an accelerated filer, a non-accelerated filer, a smaller reporting company, or an emerging growth company. See the definitions of “large accelerated filer,” “accelerated filer,” “smaller reporting company,” and “emerging growth company” in Rule 12b-2 of the Exchange Act. (Check one):
| | | | | | | | | | | | | | | | | |
| Large accelerated filer | ☑ | | | Accelerated filer | ☐ |
| Non-accelerated filer | ☐ | (Do not check if a smaller reporting company) | Smaller reporting company | ☐ |
| Emerging growth company | ☐ | | | | |
If an emerging growth company, indicate by check mark if the registrant has elected not to use the extended transition period for complying with any new or revised financial accounting standards provided pursuant to Section 13(a) of the Exchange Act. ☐
Indicate by check mark whether the registrant has filed a report on and attestation to its management’s assessment of the effectiveness of its internal control over financial reporting under Section 404(b) of the Sarbanes-Oxley Act (15 U.S.C. 7262(b)) by the registered public accounting firm that prepared or issued its audit report. ☑
If securities are registered pursuant to Section 12(b) of the Act, indicate by check mark whether the financial statements of the registrant included in the filing reflect the correction of an error to previously issued financial statements. ☐
Indicate by check mark whether any of those error corrections are restatements that required a recovery analysis of incentive-based compensation received by any of the registrant's executive officers during the relevant recovery period pursuant to §240.10D-1(b). ☐
Indicate by check mark whether the registrant is a shell company (as defined in Rule 12b-2 of the Exchange Act). Yes ☐ No ☑
The aggregate market value of voting common stock held by non-affiliates of the Registrant as of June 28, 2024 was $4.5 billion (based on closing sale price of $20.79 per share as reported for the NASDAQ Global Select Market).
As of January 31, 2025, there were 210,423,462 shares of common stock outstanding.
DOCUMENTS INCORPORATED BY REFERENCE
Portions of the definitive proxy statement on Schedule 14A relating to the Registrant’s 2025 Annual Meeting of Stockholders are incorporated by reference into Parts II and III of this Annual Report on Form 10-K.
Auditor Name: KPMG LLP Auditor Location: McLean, Virginia Auditor Firm ID: 185
SLM CORPORATION
TABLE OF CONTENTS
| | | | | | | | |
| | Page Number |
| | |
| | |
| | |
| PART I. | | |
| Item 1. | | |
| Item 1A. | | |
| Item 1B. | | |
| Item 1C. | | |
| Item 2. | | |
| Item 3. | | |
| Item 4. | | |
| PART II. | | |
| Item 5. | | |
| Item 6. | | |
| Item 7. | | |
| | |
| | |
| | |
| | |
| | |
| Risk Management | |
| Item 7A. | | |
| Item 8. | | |
| Item 9. | | |
| Item 9A. | | |
| Item 9B. | | |
| PART III. | | |
| Item 10. | | |
| Item 11. | | |
| Item 12. | | |
| Item 13. | | |
| Item 14. | | |
| PART IV. | | |
| Item 15. | | |
FORWARD-LOOKING AND CAUTIONARY STATEMENTS
References in this Annual Report on Form 10-K to “we,” “us,” “our,” “Sallie Mae,” “SLM,” and the “Company” refer to SLM Corporation and its subsidiaries, except as otherwise indicated or unless the context otherwise requires.
This Annual Report on Form 10-K contains “forward-looking statements” and information based on management’s current expectations as of the date of this report. Statements that are not historical facts, including statements about the Company’s beliefs, opinions, or expectations and statements that assume or are dependent upon future events, are forward-looking statements. These include, but are not limited to: strategies; goals and assumptions of the Company; the Company’s expectation and ability to execute loan sales and share repurchases; the Company’s expectation and ability to pay a quarterly cash dividend on our common stock in the future, subject to the approval of our Board of Directors; the Company’s 2025 guidance; the Company’s three-year horizon outlook; the impact of acquisitions the Company has made or may make in the future; the Company’s projections regarding originations, net charge-offs, non-interest expenses, earnings, balance sheet position, and other metrics; any estimates related to accounting standard changes; and any estimates related to the impact of credit administration practices changes, including the results of simulations or other behavioral observations.
Forward-looking statements are subject to risks, uncertainties, assumptions, and other factors, many of which are difficult to predict and generally beyond the control of the Company, which may cause actual results to be materially different from those reflected in such forward-looking statements. There can be no assurance that future developments affecting the Company will be the same as those anticipated by management. The Company cautions readers that a number of important factors could cause actual results to differ materially from those expressed in, or implied or projected by, such forward-looking statements. These factors include, among others, the risks and uncertainties set forth in Item 1A. “Risk Factors” and elsewhere in this Annual Report on Form 10-K and subsequent filings with the Securities and Exchange Commission (“SEC”); increases in financing costs; limits on liquidity; increases in costs associated with compliance with laws and regulations; failure to comply with consumer protection, banking, and other laws or regulations; changes in laws, regulations, and supervisory expectations, especially in light of the goals of the new Trump administration; our ability to timely develop new products and services and the acceptance of those products and services by potential and existing customers; changes in accounting standards and the impact of related changes in significant accounting estimates, including any regarding the measurement of our allowance for credit losses and the related provision expense; any adverse outcomes in any significant litigation to which the Company is a party; credit risk associated with the Company’s exposure to third parties, including counterparties to the Company’s derivative transactions; the effectiveness of our risk management framework and quantitative models; and changes in the terms of education loans and the educational credit marketplace (including changes resulting from new laws and the implementation of existing laws). We could also be affected by, among other things: changes in our funding costs and availability; reductions to our credit ratings; cybersecurity incidents, cyberattacks, and other failures or breaches of our operating systems or infrastructure, including those of third-party vendors; tariffs; the societal, business, and legislative/regulatory impact of pandemics, other public heath crises, and/or natural disasters; damage to our reputation; risks associated with restructuring initiatives, including failures to successfully implement cost-cutting programs and the adverse effects of such initiatives on our business; changes in the demand for educational financing or in financing preferences of lenders, educational institutions, students, and their families; changes in law and regulations with respect to the student lending business and financial institutions generally; changes in banking rules and regulations, including increased capital requirements; increased competition from banks and other consumer lenders; the creditworthiness of our customers, or any change related thereto; changes in the general interest rate environment, including the rate relationships among relevant money-market instruments and those of our earning assets versus our funding arrangements; rates of prepayments on the loans owned by us; changes in general economic conditions and our ability to successfully effectuate any acquisitions; and other strategic initiatives. The preparation of our consolidated financial statements also requires management to make certain estimates and assumptions, including estimates and assumptions about future events. These estimates or assumptions may prove to be incorrect.
2024 Form 10-K — SLM CORPORATION 2
All forward-looking statements contained in this Annual Report on Form 10-K are expressly qualified in their entirety by the factors, risks, and uncertainties set forth in the foregoing cautionary statements, and are made only as of the date of this report. We do not undertake any obligation to update or revise any forward-looking statements to conform to actual results or changes in our expectations, nor to reflect events or circumstances that occur after the date on which such statements were made. In light of these risks, uncertainties, and assumptions, you should not put undue reliance on any forward-looking statements discussed.
2024 Form 10-K — SLM CORPORATION 3
AVAILABLE INFORMATION
Our website address is www.salliemae.com. Copies of our Annual Reports on Form 10-K, Quarterly Reports on Form 10-Q, and Current Reports on Form 8-K, as well as any amendments to those reports, and our Proxy Statements and any significant investor presentations, are available free of charge through our website as soon as reasonably practicable after they are electronically filed with, or furnished to, the SEC. The SEC maintains a website at www.sec.gov that contains all such filed or furnished reports and other information. In addition, copies of our Board Governance Guidelines, Code of Business Conduct (which includes the code of ethics applicable to our Principal Executive Officer, Principal Financial Officer, and Principal Accounting Officer) and the governing charters for each committee of our Board of Directors are available free of charge on our website, as well as in print to any stockholder upon request. We intend to disclose any amendments to or waivers of our Code of Business Conduct (to the extent applicable to our Principal Executive Officer, Principal Financial Officer, or Principal Accounting Officer) by posting such information on our website. Information contained or referenced on our website is not incorporated by reference into and does not form a part of this Annual Report on Form 10-K.
2024 Form 10-K — SLM CORPORATION 4
PART I.
Item 1. Business
Our Company Mission
SLM Corporation, more commonly known as Sallie Mae, is the premier financial brand in higher education. As an education solutions company, our mission is to power confidence as students begin their unique journeys. We support students and families navigating to, through, and immediately after higher education. We simplify the college planning process and advance higher education access and completion by providing free tools, resources, scholarships, and responsible financing options.
We believe education, in all forms, is the foundation for success, an equalizer of opportunities, and a proven pathway to economic mobility. Higher education increases lifetime wages and enables economic mobility. For example, data from the U.S. Bureau of Labor and Statistics confirms those with bachelor’s degrees earn 66 percent more than those with a high school diploma.1 Those with advanced degrees earn an even greater percentage than those with a high school diploma.1 This effect is multigenerational, as children of parents who are college educated are more likely to earn a bachelor’s degree than students whose parents did not go to college. Most would agree our society prospers and becomes more economically inclusive when each of its members is provided access to post-secondary education.2 Education represents a transformative investment in one’s future that yields our country’s next nurses, teachers, engineers, business leaders, and more.
Our History
While the Sallie Mae name has existed for more than 50 years, the company that operates as Sallie Mae today, SLM Corporation, was formed in late 2013 and includes its wholly-owned subsidiary, Sallie Mae Bank, an industrial bank established in 2005 (the “Bank”). On April 30, 2014, we legally separated (the “Spin-Off”) from another public company that is now named Navient Corporation (“Navient”), which is in the education loan management, consolidation loan, and business processing businesses. Navient retained all assets and liabilities generated prior to the Spin-Off other than those explicitly retained by us pursuant to the Separation and Distribution Agreement executed in connection with the Spin-Off (the “Separation and Distribution Agreement”). We are a consumer banking business and did not retain any assets or liabilities generated prior to the Spin-Off other than those explicitly retained by us pursuant to the Separation and Distribution Agreement. We sometimes refer to the company that existed prior to the Spin-Off as “pre-Spin-Off SLM.”
Our principal executive offices are located at 300 Continental Drive, Newark, Delaware 19713. Additionally, we have offices in New Castle, Delaware; Salt Lake City, Utah; Indianapolis, Indiana; Newton, Massachusetts; and Sterling, Virginia. Our telephone number is (302) 451-0200.
______________________
1 “Education pays, 2023,” Career Outlook, U.S. Bureau of Labor Statistics, August 2024.
2 https://research.collegeboard.org/trends/education-pays. The information contained on, or accessible through, the foregoing website does not constitute a part of, and is not incorporated by reference in, this Annual Report on Form 10-K.
2024 Form 10-K — SLM CORPORATION 5
Our Business
Our business is focused and aligned to strategic imperatives that set the foundation for our continued success. Our focus remains on maximizing the profitability and growth of our core private student loan business, while harnessing and optimizing the power of our brand and attractive client base. In addition, we continue to seek to better inform the external narrative about student lending and Sallie Mae. We also strive to maintain a rigorous and predictable capital allocation and return program to create shareholder value. We are focused on driving a mission-led culture that continues to make Sallie Mae a great place to work. We also continue to strengthen our risk and compliance functions, enhance and build upon our risk management framework, and assess and monitor enterprise-wide risk.
Private Education Loans
Our primary business is to originate and service high-quality Private Education Loans. “Private Education Loans” are education loans for students or their families that are not made, insured, or guaranteed by any state or federal government. We also offer a range of deposit products insured by the Federal Deposit Insurance Corporation (the “FDIC”). We serve more families than any other private student loan lender. We originated approximately $7.0 billion of Private Education Loans in 2024, an increase of 10 percent from the year ended December 31, 2023. As of December 31, 2024, we had $20.9 billion of Private Education Loans held for investment, net, outstanding.
Our Private Education Loans serve primarily to bridge the gap between the cost of higher education and the amount funded through family income and savings, scholarships and grants, and federal financial aid. We also extend Private Education Loans as an alternative to similar federal education loan products where we believe our rates are competitive.
Private student lending is cyclical in nature. We typically experience peak volume of originations and commitments in the third quarter of our fiscal year, corresponding to the required timing of disbursements prior to the start of the fall semester at most higher education institutions. There is generally also a “mini-peak” in volume of originations and commitments in the first quarter of our fiscal year, corresponding to the required timing of disbursements prior to the start of the spring semester at most higher education institutions.
Our primary Private Education Loan product is the Smart Option Student Loan, which emphasizes in-school payment features that can produce shorter terms and reduce customers’ total finance charges. Customers elect one of three Smart Option repayment types at the time of loan origination. The first two, interest only and fixed payment options, require monthly payments while the student is in school and during the grace period thereafter, and accounted for more than half of the Private Education Loans the Bank originated during 2024. The third repayment option is the more traditional deferred Private Education Loan product where customers are not required to make payments while the student is in school and during the grace period after separation from school. The grace period for a Smart Option Student Loan generally runs for six months after the borrower separates from school, and can run for up to 36 months for a small subset of graduate loans. Lower interest rates on the interest only and fixed payment options encourage customers to elect those options, which help reduce total loan cost compared with the traditional deferred option loan. Making payments while in school helps customers become accustomed to making on-time regular loan payments. We offer both variable-rate and fixed-rate loans.
We also offer six loan products for specific graduate programs of study. These include the Sallie Mae Law School Loan, the Sallie Mae MBA Loan, the Sallie Mae Graduate School Loan for Health Professions, the Sallie Mae Medical School Loan, the Sallie Mae Dental School Loan, and the Sallie Mae Graduate School Loan. These products were designed to address the specific needs of graduate students, such as longer grace periods for medical students. We also offer two non-cost of attendance loans to support bar study preparation, as well as residency and relocation expenses for medical and dental school students.
We regularly review and update the terms of our Private Education Loan products. As a holder of Private Education Loans, we bear the full credit risk of the customers. We manage this risk by underwriting and pricing based on customized credit scoring criteria and the addition of qualified cosigners. For Private Education Loans originated during the year ended December 31, 2024, our average FICO scores (representing the higher credit scores of the cosigners or borrowers) at the time of original approval were 752, and approximately 90 percent of
2024 Form 10-K — SLM CORPORATION 6
those loans were cosigned. In addition, for all loans other than Bar Study loans and Residency and Relocation loans, we require school certification of both the need for, and the amount of, every Private Education Loan we originate (to prevent unnecessary borrowing beyond a school’s cost of attendance), and we disburse the loan proceeds directly to the higher education institutions to ensure loan proceeds are applied directly to the student’s education expenses.
The core of our marketing strategy is to promote our products on campuses through financial aid offices as well as through online and direct marketing to students and families. Our on-campus efforts with more than 2,000 higher education institutions are actively managed by our relationship management team, the largest in the industry, which has become a trusted resource for financial aid offices.
Our loans are high credit quality and the overwhelming majority of our customers manage their payments with great success. Private Education Loans in repayment include loans on which customers are making interest only or fixed payments, as well as loans that have entered full principal and interest repayment status after any applicable grace period. At December 31, 2024, 3.7 percent of Private Education Loans (held for investment) in repayment were 30 days or more delinquent, and Private Education Loans (held for investment) in forbearance were 2.5 percent of loans in repayment and forbearance. In 2024, Private Education Loan net charge-offs as a percentage of average loans in repayment were 2.19 percent.
Sallie Mae Bank
The Bank, which is regulated by the Utah Department of Financial Institutions (the “UDFI”), the FDIC, and the Consumer Financial Protection Bureau (the “CFPB”), offers traditional savings products, such as high-yield savings accounts, money market accounts, and certificates of deposit (“CDs”), and originates Private Education Loans. At December 31, 2024, the Bank had total assets of $30.0 billion, including $20.9 billion of Private Education Loans (held for investment), net, and total deposits of $21.5 billion. Previously, the Bank also owned a portfolio of loans insured or guaranteed under the previously existing Federal Family Education Loan Program (“FFELP Loans”). In the fourth quarter of 2024, the Bank sold its remaining portfolio of FFELP Loans to an unaffiliated third party. As of December 31, 2024, the Bank held no FFELP Loans.
Our ability to obtain deposit funding and offer competitive interest rates on deposits will be necessary to sustain our Private Education Loan originations and achieve other business goals. Our ability to obtain such funding is dependent, in part, on the capital levels of the Bank and its compliance with other applicable regulatory requirements. During 2024, we maintained our diversified funding base by raising $2.2 billion in term funding collateralized by pools of Private Education Loans in the long-term asset-backed securities (“ABS”) market. This brought our total ABS funding outstanding at December 31, 2024 to $5.4 billion, or 26 percent of our total Private Education Loans held for investment portfolio. We plan to continue to use ABS funding, market conditions permitting. This helps us better match-fund our assets and avoids excessive reliance on deposit funding.
See Item 1. “Business — Supervision and Regulation — Regulation of Sallie Mae Bank” for additional details about the Bank.
2024 Form 10-K — SLM CORPORATION 7
Our Lending Philosophy
Sallie Mae is committed to responsible lending and encourages responsible borrowing by advising students and families to follow this three-step approach to paying for higher education:
Start with money you won’t have to pay back. Supplement savings and income by maximizing scholarships, grants, and work-study.
Explore federal student loans. Explore federal student loan options by completing the Free Application for Federal Student Aid.
Consider a responsible private student loan. Fill the gap between available resources and any remaining costs of higher education.
The best interests of our customers are front-and-center and integral to our responsible lending philosophy. We reward financial responsibility, emphasize building good credit, and provide flexible repayment terms to help customers manage and eliminate debt. We also embed customer protections in our products. To ensure applicants borrow only what they need to cover their school’s cost of attendance, we actively engage with schools and require school certification before we disburse a Private Education Loan (except for Bar Study loans and Residency and Relocation loans). To help applicants understand their loan and its terms, we provide multiple, customized disclosures explaining the applicant’s interest rate, whether the interest rate is fixed or variable, and the loan’s total cost under the available repayment options. Our Private Education Loans generally feature (i) no origination fees and no prepayment penalties, (ii) an interest rate reduction for those who enroll in and make monthly payments through auto debit, (iii) free access to quarterly FICO credit scores to help customers monitor their credit health, (iv) a choice of repayment options, (v) a choice of either a variable or fixed interest rate, and (vi) loan forgiveness in the case of death or permanent disability of the student borrower.
Our Approach to Assisting Students and Families Borrowing and Repaying Private Education Loans
Approximately half of our Private Education Loan customers elect an in-school repayment option. By making in-school payments, customers learn to establish good repayment patterns, reduce their total loan cost, and graduate with less debt. We send monthly communications to customers while they are in school, even if they have no monthly payments scheduled, to keep them informed and encourage them to reduce the amount they will owe when they leave school.
Our experience has taught us the successful transition from school to full principal and interest repayment status involves making and carrying out a financial plan. As customers approach the principal and interest repayment period on their loans, Sallie Mae engages with them and communicates what to expect during the transition. In addition, SallieMae.com provides educational content for customers on how to organize loans, set up a monthly budget, and understand repayment obligations. Examples are provided to help explain how payments are applied and allocated, and how the accrued interest on alternative repayment programs could affect the cost of customers’ loans.
Some customers transitioning from school to the work force may require more time before they are financially capable of making full payments of principal and interest. Sallie Mae created a Graduated Repayment Period program (“GRP”) to assist borrowers with additional payment flexibility, allowing eligible customers to make interest-only payments instead of full principal and interest payments for a period of 12 months if they elect within a specified time frame to participate in GRP. Generally, the 12-month interest-only payments under GRP begin upon expiration of a borrower’s grace period or election of GRP, whichever is later.
After graduation, a student borrower may apply for the cosigner to be released from the loan. This option is available after 12 principal and interest payments are made and the student borrower demonstrates an ability to assume sole responsibility for repayment of the loan. In the event of a cosigner’s death, the student borrower automatically continues as the sole individual on the loan with the same terms.
If a customer’s account becomes delinquent, our collection teams work with the customer and/or the cosigner to understand their ability to make ongoing payments. If the customer is in financial hardship, we work with the customer and/or cosigner and identify potential alternative arrangements designed to reduce monthly payment
2024 Form 10-K — SLM CORPORATION 8
obligations. These can include extended grace periods, short-term hardship forbearances, temporary interest rate reductions, and, in some cases, permanent interest rate reductions. We offer rate and term modifications to customers experiencing more severe hardship. These arrangements are intended to address the customer’s individual circumstances and ability to make payments. When we grant forbearance or modify a loan, we counsel customers on the effect the forbearance or modification will have on their loan balance. See Item 7. “Management’s Discussion and Analysis of Financial Condition and Results of Operations — Financial Condition — Allowance for Credit Losses — Use of Forbearance and Modifications as a Private Education Loan Collection Tool” for additional information about our credit administration practices.
Customer Service
We perform the origination, servicing, and collections activities for all of our Private Education Loans with dedicated representatives assisting customers with various needs. We expect the Bank or affiliates of the Bank to retain servicing of all Private Education Loans the Bank originates, regardless of whether the loans are held, sold, or securitized.
Over the past few years, we have implemented several improvements in our ability to interact with our loan customers, including:
•an integrated platform with customer-centric capabilities that allows self-service and empowers our servicing and collections agents, thus streamlining our processes and providing efficiencies;
•an online chat function for application support and customer service related inquiries;
•a mobile application accessible through smart phones; and
•expansion of customer surveys to gain feedback on areas for improvement within our originations, servicing, and collections functions.
Customer Success
We continue to adapt our business to best serve the needs of families who see us as a trusted advisor and partner. We are strongly invested in our customers’ success. Of our total loan portfolio, approximately 96 percent of loans in repayment are in good standing, and, on average, fewer than 3 percent of loans default annually.
In 2022, we acquired the assets of Epic Research Education Services, LLC, which did business as Nitro College (“Nitro”). Nitro provided resources that helped students and families evaluate how to responsibly pay for college and manage their financial responsibilities after graduation.
The acquisition of Nitro enhanced future strategic growth opportunities and expanded our digital marketing capabilities, reduced the cost to acquire customer accounts, and accelerated our progress to become a broader education solutions provider helping students to, through, and immediately after higher education. In 2024, we completed the transition of the related Nitro branding to the Sallie and Sallie Mae brands and platforms.
In 2023, we completed the acquisition of several key assets of Scholly, Inc. (“Scholly”), which was engaged in the business of operating as a scholarship publishing and servicing platform, comprised of websites and mobile application search products that offered custom recommendations for post-secondary scholarships for students, their families, and others as well as related services for scholarship providers. The addition of Scholly assets supports our mission of providing students with the confidence needed to successfully navigate the higher education journey.
2024 Form 10-K — SLM CORPORATION 9
Key Drivers of Private Education Loan Market Growth
The size of the Private Education Loan market is based primarily on three factors: college enrollment levels, the costs of attending college, and the availability of funds from the federal government to pay for a college education. The amounts students and their families can contribute toward college costs and the availability of scholarships and institutional grants are also important. If the cost of education increases at a pace exceeding the sum of family income, savings, federal lending, and scholarships, more students and families can be expected to rely on Private Education Loans. If enrollment levels or college costs decline, or the availability of federal education loans, grants, or subsidies and scholarships significantly increases, Private Education Loan demand could decrease.
We focus primarily on students attending public and private not-for-profit four-year degree granting institutions. We lend to some students attending two-year and for-profit schools. Due to the lower cost of two-year programs, federal grant and loan programs are typically sufficient for the funding needs of these students. Approximately 18 percent or $1.31 billion of our 2024 Private Education Loan originations were for students attending for-profit schools. The for-profit schools where we continue to do business are primarily focused on career training and health care fields. We expect students who attend and complete programs at for-profit schools to support the same repayment performance as students who attend and graduate from public and private not-for-profit four-year degree granting institutions.
Our competitors1 in the Private Education Loan market include large banks such as Citizens Financial Group, Inc. and PNC Bank, as well as a number of specialty finance companies such as Sofi Technologies, Inc. and College Ave, and members of the Education Finance Council. We compete based on our products, originations capability, price, and customer service.
Enrollment
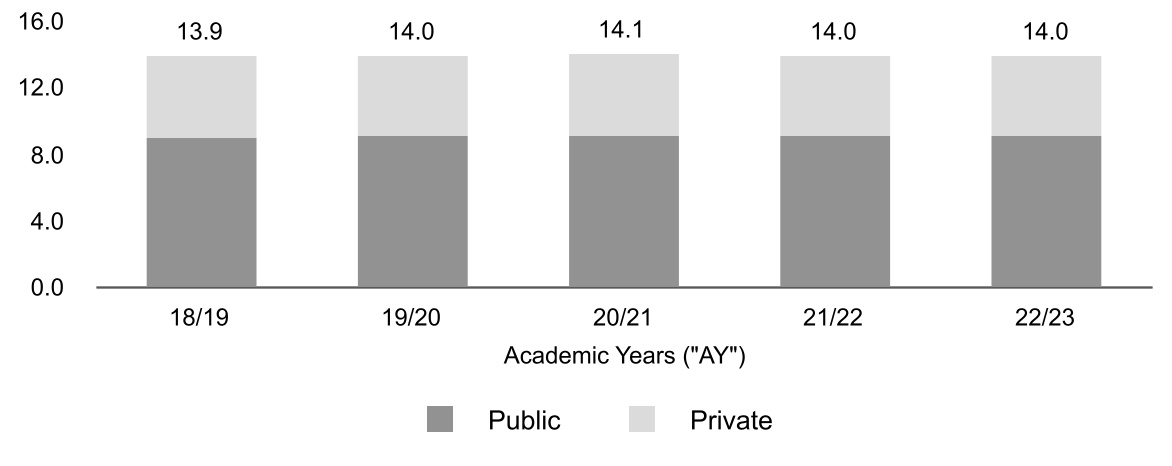
We expect enrollment to remain relatively flat over the next several years.
Enrollment at Four-Year Degree Granting Institutions2
(in millions)
•According to the U.S. Department of Education’s projections, the enrollment in four-year degree granting institutions is projected to remain relatively flat through 2031.2
______________________
1Source: Enterval Analytics LLC 2024 Q3 Private Student Loan Report, November 2024.
2Source: U.S. Department of Education, National Center for Education Statistics, Enrollment in Degree-Granting Institutions Projection Model, through 2031. These are the most recent sources available to us for this information. 2022/2023 is an estimate.
2024 Form 10-K — SLM CORPORATION 10
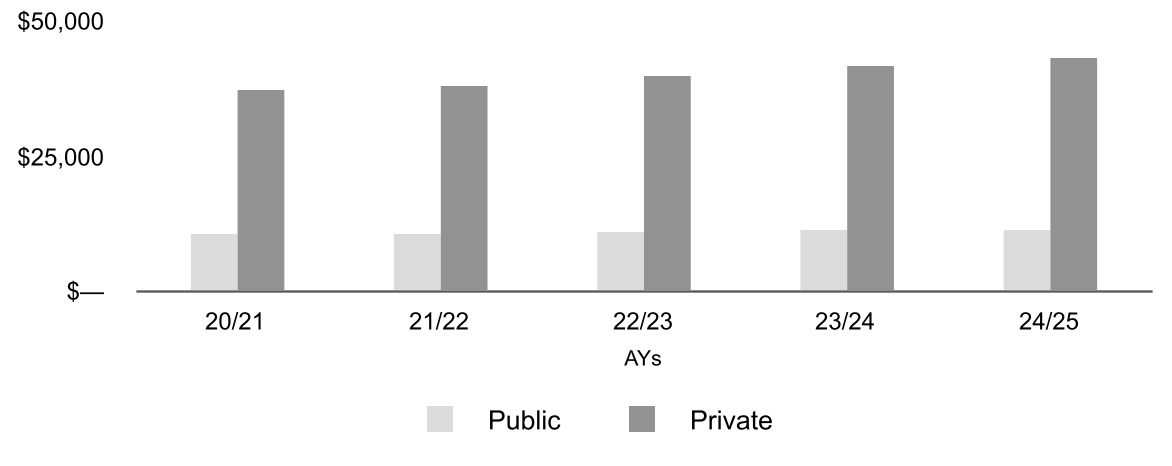
Tuition Rates
•Average published tuition and fees (exclusive of room and board) at four-year public and private not-for-profit institutions increased at compound annual growth rates of 2.4 percent and 3.9 percent, respectively, from AYs 2020-2021 through 2024-2025. Average published tuition and fees at public and private four-year not-for-profit institutions grew 2.9 percent and 4.5 percent, respectively, between AYs 2022-2023 and 2023-2024 and 2.7 percent and 3.9 percent, respectively, between AYs 2023-2024 and 2024-2025.3
Published Tuition and Fees3
(Dollars in actuals)
3 Source: The College Board-Trends in College Pricing 2024. © 2024 The College Board. The College Board restates its data annually, which may cause previously reported results to vary.
2024 Form 10-K — SLM CORPORATION 11
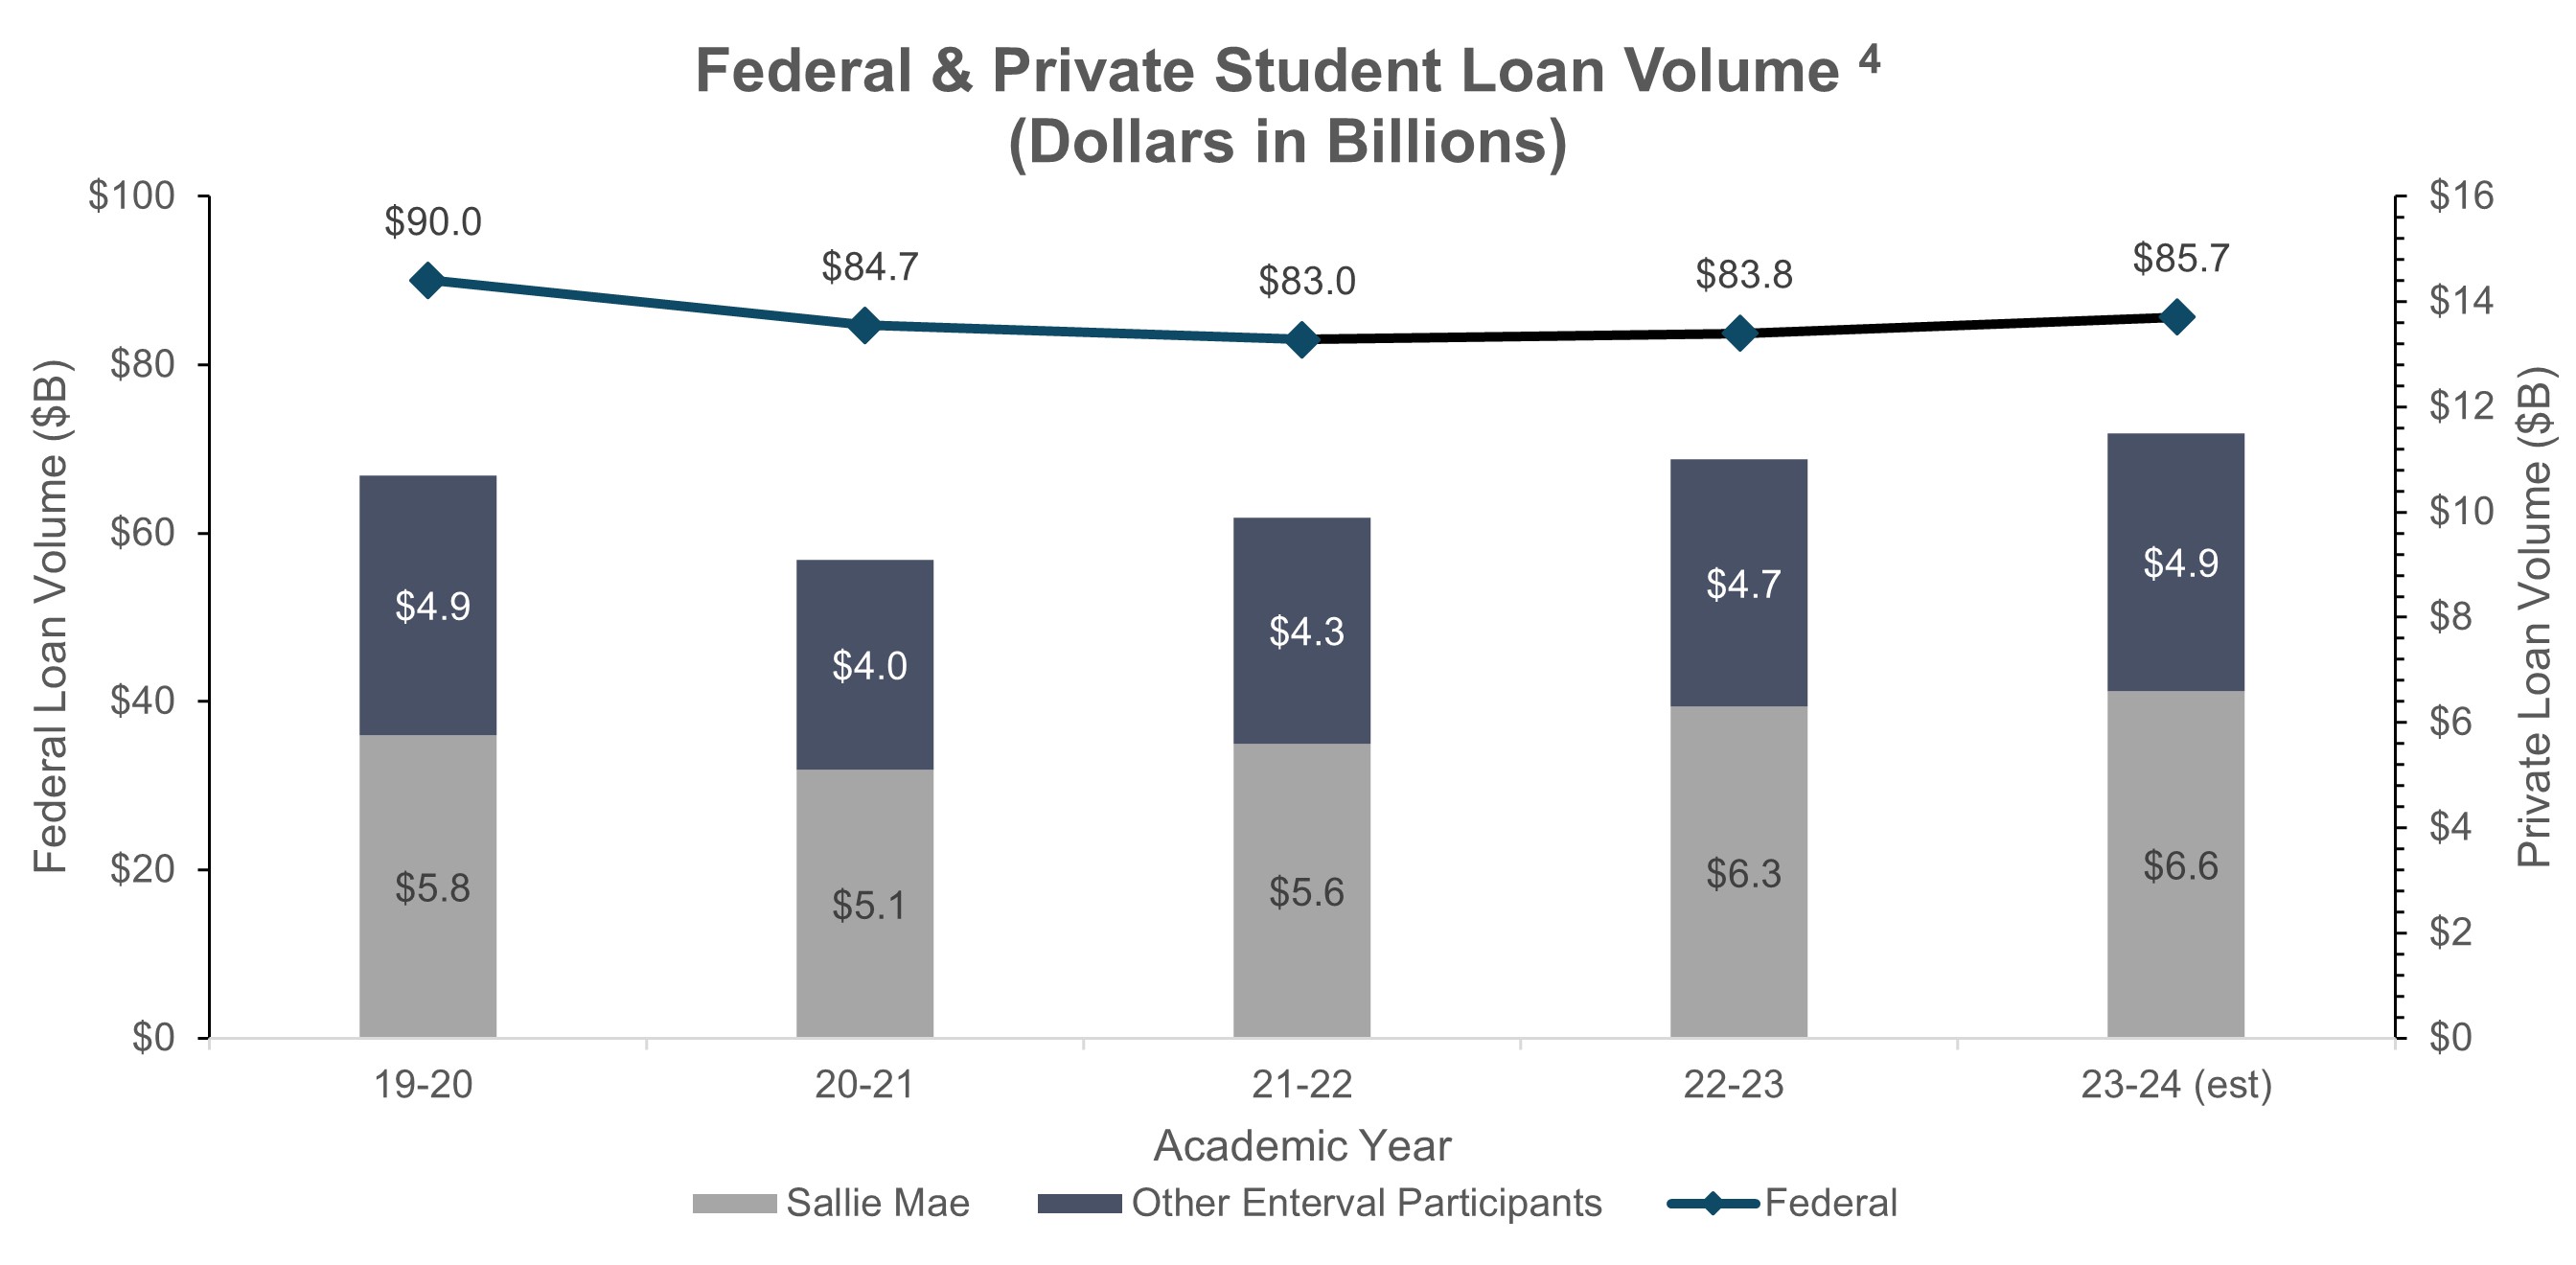
Sources of Funding
Private Education Loan originations were an estimated $11.5 billion in AY 2023-2024, an increase of $0.5 billion from AY 2022-2023.4
_______
4 Source: The College Board-Trends in Student Aid 2024© The College Board. Enterval LLC. Funding sources in current dollars and include federal and private student loan data. Other sources for the size of the Private Education Loan market exist and may cite the size of the market differently. The College Board restates its data annually, which may cause previously reported results to vary. We rely on publicly available sources for market estimates, because we believe it provides a more appropriate basis for comparison of the performance of our business.
2024 Form 10-K — SLM CORPORATION 12
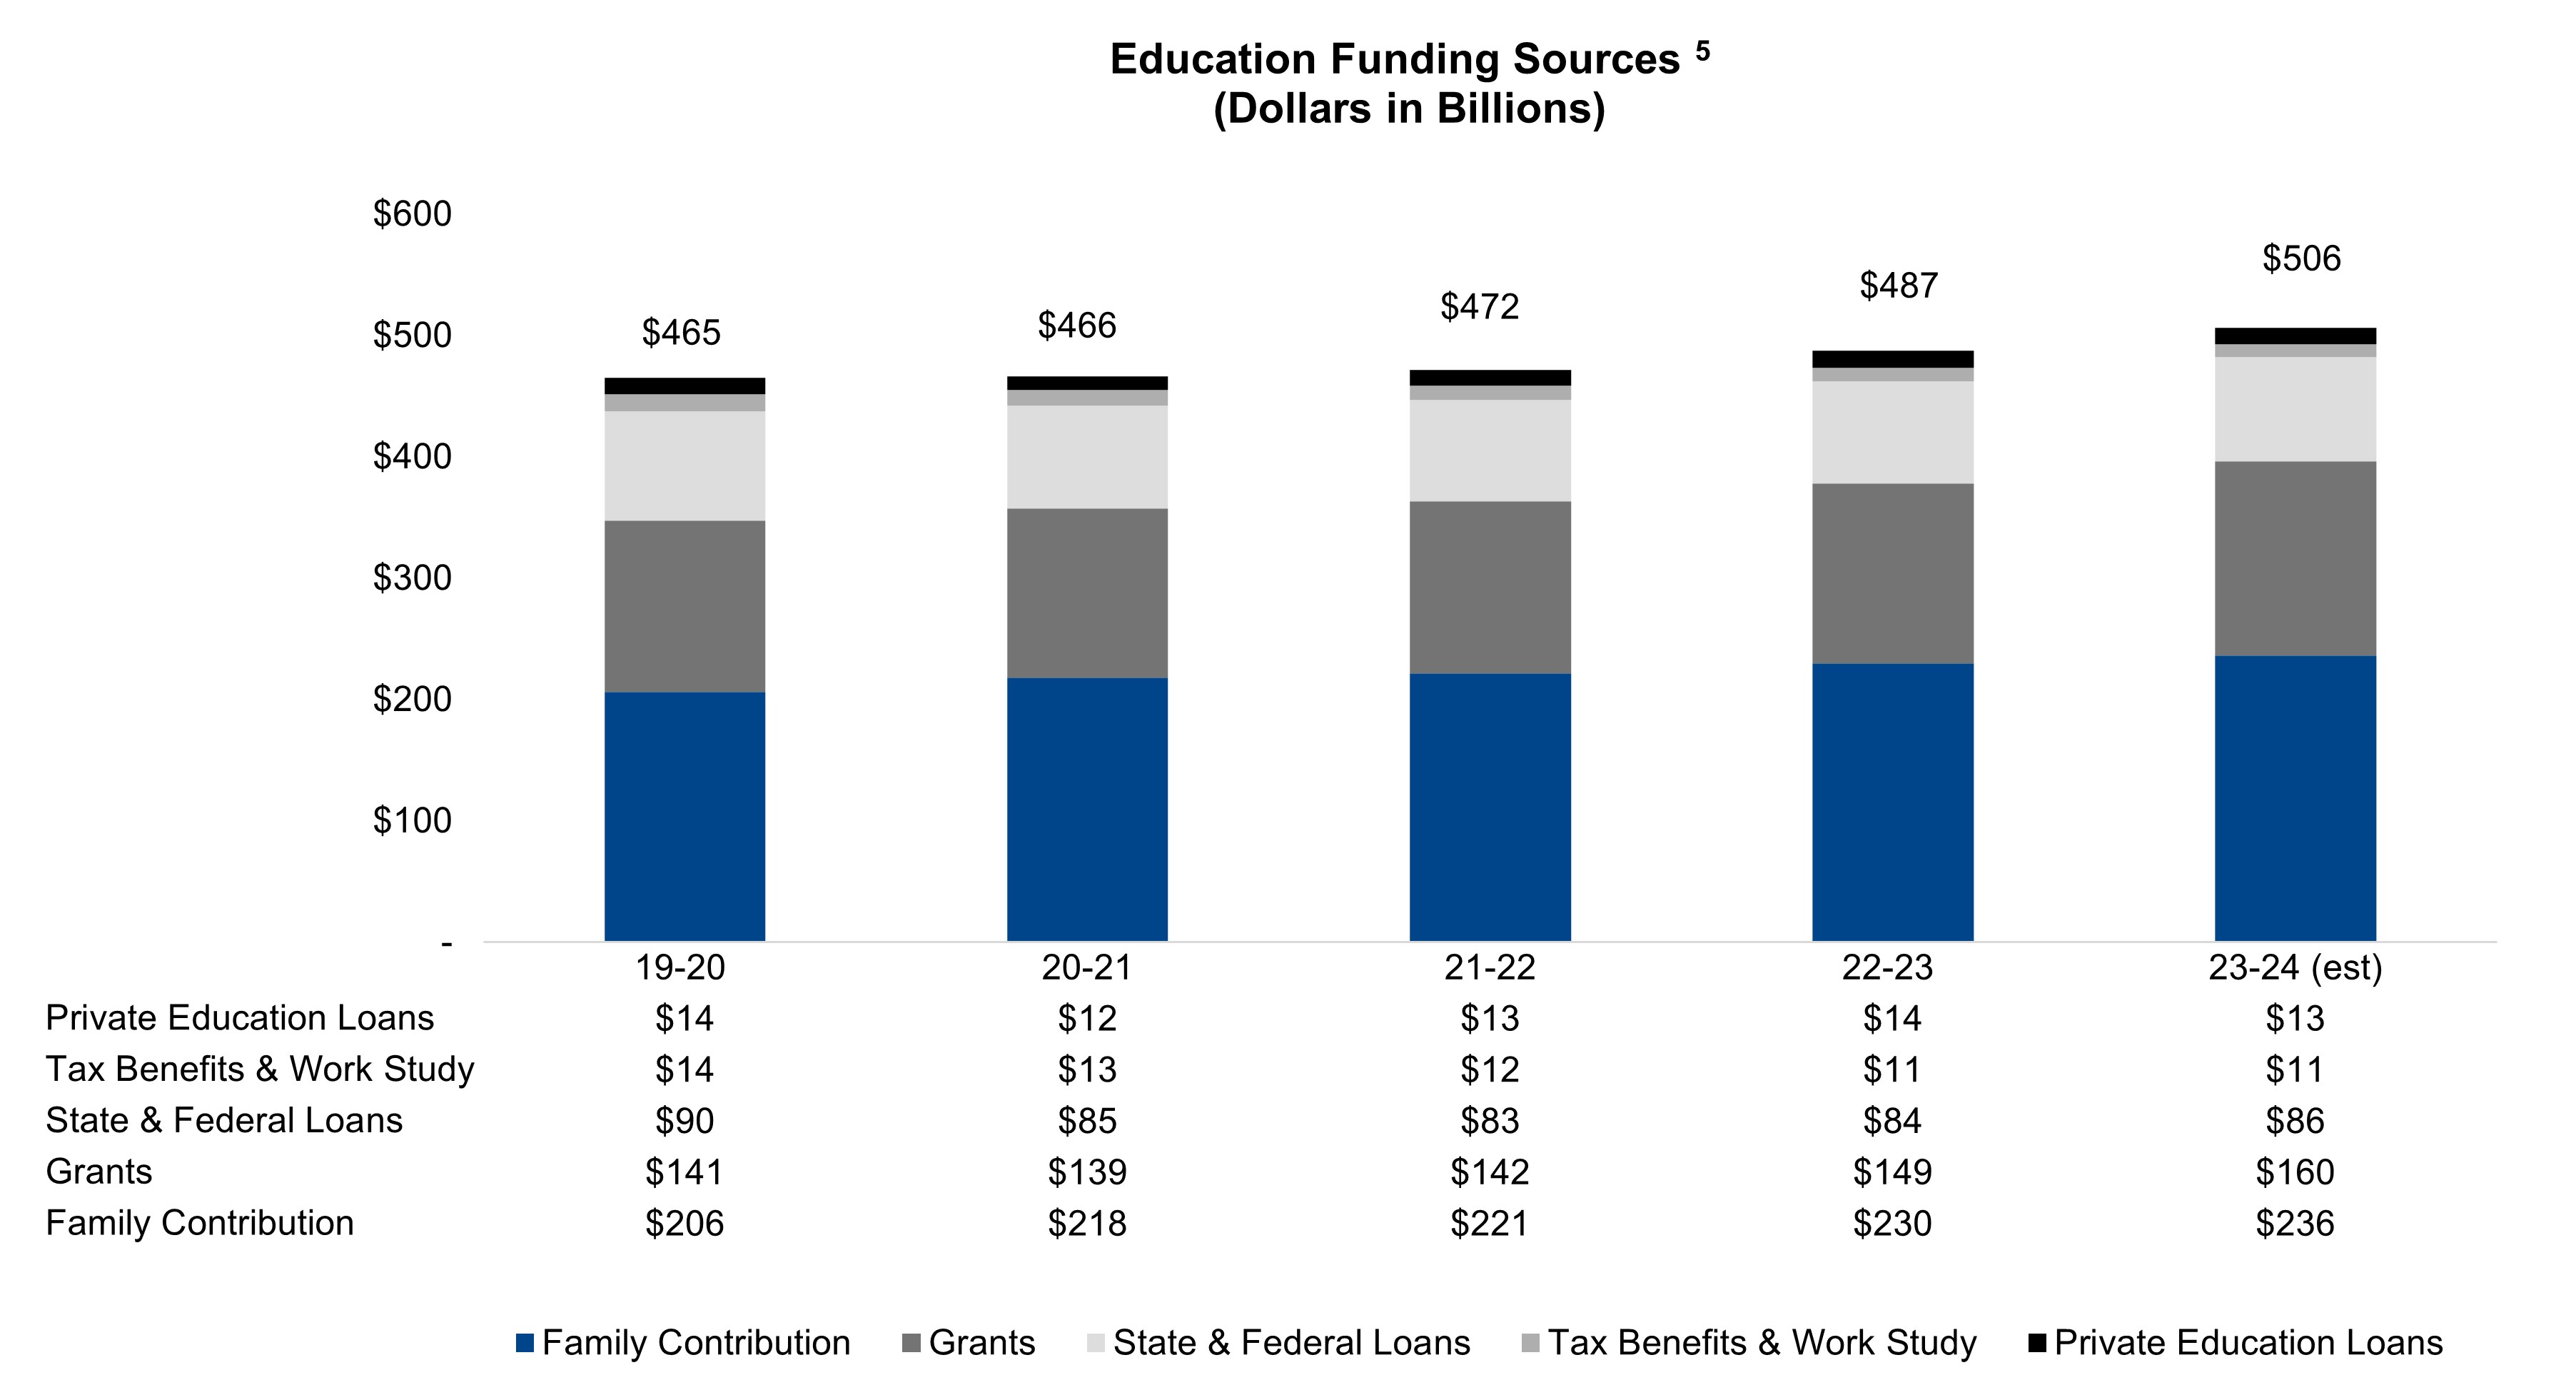
•We estimate total spending on higher education was $506 billion in AY 2023-2024, up from $465 billion in AY 2019-2020. Private Education Loan originations decreased $1 billion from the year-ago period to an estimated $13 billion in AY 2023-2024, and represent just 2.6 percent of total spending on higher education.5
•Over the AYs 2019-2024 period, increases in total spending have been absorbed primarily through increased family contributions. If household finances continue to improve, we would expect this trend to continue.
_________________________ | | |
5 Source: Total post-secondary education spending is estimated by Sallie Mae determining the full-time equivalents for both graduates and undergraduates and multiplying by the estimated total per person cost of attendance for each school type. In doing so, we utilize information from the U.S. Department of Education, National Center for Education Statistics, Digest of Education Statistics to 2031 (NCES 2024, January 2024), The Integrated Postsecondary Education Data System (IPEDS), College Board -Trends in College Pricing and Student Aid 2024. © 2024 The College Board and Company analysis. Other sources for these data points also exist publicly and may vary from our computed estimates. NCES, IPEDS, and College Board restate their data annually, which may cause previous reports to vary. We have also recalculated figures in our Company analysis to standardize all costs of attendance to dollars not adjusted for inflation. This has a minimal impact on historically-stated numbers. |
2024 Form 10-K — SLM CORPORATION 13
Supervision and Regulation
Overview
We are subject to extensive regulation, examination, and supervision by various federal, state, and local authorities. The more significant aspects of the laws and regulations that apply to us and our subsidiaries are described below. These descriptions are qualified in their entirety by reference to the full text of the applicable statutes, legislation, regulations, and policies, as they may be amended, and as interpreted and applied, by federal, state, and local agencies.
The Dodd-Frank Wall Street Reform and Consumer Protection Act of 2010 (the “Dodd-Frank Act”) was adopted to reform and strengthen regulation and supervision of the U.S. financial services industry. It contains comprehensive provisions to govern the practices and oversight of financial institutions and other participants in the financial markets. It mandates significant regulations, additional requirements, and oversight on almost every aspect of the U.S. financial services industry, including increased capital and liquidity requirements, limits on leverage, and enhanced supervisory authority. It requires the issuance of many regulations, which will take effect over several years.
Additionally, states are taking an increased interest in directly regulating the conduct and practices of student loan lenders and servicers. Some states have enacted legislation creating specialized offices within state government to oversee the student loan origination and servicing industry operating within those states, as well as to set minimum standards governing the practices of student loan lenders and servicers. This represents a significant change from the past in which states generally did not issue laws and regulations tailored specifically to the student loan origination and servicing industry.
Consumer Protection Laws and Regulations
A number of our products and services, including our origination, servicing, first-party collection, deposit taking, and education solutions activities, subject us to federal and state consumer protection, privacy, and related laws and regulations. Some of the more significant laws and regulations applicable to our business include:
•various state and federal laws governing unfair, deceptive, or abusive acts or practices;
•various state laws and regulations imposing specific, mandated standards and requirements on the conduct and practices of student loan lenders and servicers;
•the federal Truth-In-Lending Act and Regulation Z, which govern disclosures of credit terms to consumer borrowers;
•the Fair Credit Reporting Act and Regulation V, which govern the use and provision of information to consumer reporting agencies;
•the Equal Credit Opportunity Act and Regulation B, which prohibit creditor practices that discriminate on the basis of race, religion, and other prohibited factors in extending credit;
•the Servicemembers Civil Relief Act, which applies to all debts incurred prior to commencement of active military service (including education loans) and limits the amount of interest, including fees, that may be charged;
•the Truth in Savings Act and Regulation DD, which mandate certain disclosures related to consumer deposit accounts;
•the Expedited Funds Availability Act, Check Clearing for the 21st Century Act and Regulation CC issued by the Board of Governors of the Federal Reserve System, which relate to the availability of deposit funds to consumers;
•the Right to Financial Privacy Act, which imposes a duty to maintain the confidentiality of consumer financial records and prescribes procedures for complying with federal government requests for and subpoenas of financial records;
•the Electronic Funds Transfer Act and Regulation E, which govern automated transfers of funds and consumers’ rights related thereto;
•the Telephone Consumer Protection Act, which governs communication methods that may be used to contact customers;
2024 Form 10-K — SLM CORPORATION 14
•the Gramm-Leach-Bliley Act, which governs the ability of financial institutions to disclose nonpublic information about consumers to non-affiliated third parties; and
•the California Consumer Privacy Act and California Privacy Rights Act, which govern transparency and disclosure obligations regarding personal information of residents of the State of California.
Consumer Financial Protection Bureau
The CFPB has broad authority to promulgate regulations under federal consumer financial protection laws and to directly or indirectly enforce those laws, including providing regulatory oversight of the private education loan industry, and to examine financial institutions for compliance. It is authorized to collect fines and order consumer restitution in the event of violations, engage in consumer financial education, track consumer complaints, request data, and promote the availability of financial services to underserved consumers and communities. It has authority to prevent unfair, deceptive, or abusive acts and practices by issuing regulations or by using its enforcement authority without first issuing regulations. Under the Biden Administration, the CFPB was active in its supervision, examination, and enforcement of financial services companies, notably bringing enforcement actions, imposing fines, and mandating large refunds to customers of several large banking institutions. The enforcement and regulatory posture of the CFPB under the Trump Administration is unclear. The CFPB is the Bank’s primary consumer compliance supervisor with compliance examination authority and primary consumer protection enforcement authority. The UDFI and FDIC remain the prudential regulatory authorities with respect to the Bank’s financial strength.
The private education loan Ombudsman within the CFPB is authorized to receive and attempt to informally resolve inquiries about private education loans. The private education loan Ombudsman is required by law to report to Congress annually on the trends and issues identified through this process. The CFPB continues to take an active interest in the student loan industry, undertaking a number of initiatives related to the private education loan market and student loan servicing. The CFPB and the U.S. Department of Education share complaint information from borrowers and meet quarterly to discuss, among other things, the nature of complaints received and available information about the resolution of complaints.
Regulation of Sallie Mae Bank
The Bank was chartered in 2005 and is a Utah industrial bank regulated by the FDIC, the UDFI, and the CFPB. We are not a bank holding company under the Bank Holding Company Act and therefore are not subject to the federal regulations applicable to bank holding companies. However, we and our non-bank subsidiaries are subject to regulation and oversight as institution-affiliated parties. The following discussion sets forth some of the elements of the bank regulatory framework applicable to us, the Bank, and our other non-bank subsidiaries.
General
The Bank is currently subject to prudential regulation and examination by the FDIC and the UDFI, and consumer compliance regulation and examination by the CFPB. Numerous other federal and state laws and regulations govern almost all aspects of the operations of the Bank and, to some degree, our operations and those of our non-bank subsidiaries as institution-affiliated parties.
Actions by Federal and State Regulators
Under federal and state laws and regulations pertaining to the safety and soundness of insured depository institutions, the UDFI and the FDIC have the authority to compel or restrict certain actions of the Bank if it is determined to lack sufficient capital or other resources, or is otherwise operating in a manner deemed to be inconsistent with safe and sound banking practices. Under this authority, the Bank’s regulators can require it to enter into informal or formal supervisory agreements, including board resolutions, memoranda of understanding, written agreements, and consent or cease and desist orders, pursuant to which the Bank would be required to take identified corrective actions to address cited concerns and refrain from taking certain actions.
2024 Form 10-K — SLM CORPORATION 15
Enforcement Powers of Regulators
As “institution-affiliated parties” of the Bank, we, our non-bank subsidiaries, and our management, employees, agents, independent contractors, and consultants are subject to potential civil and criminal penalties for violations of law, regulations, or written orders of a government agency. Violations can include failure to timely file required reports, filing false or misleading information, or submitting inaccurate reports. Civil penalties may be as high as $1,000,000 per day for such violations, and criminal penalties for some financial institution crimes may include imprisonment for 20 years. Regulators have flexibility to commence enforcement actions against institutions and institution-affiliated parties, and the FDIC has the authority to terminate deposit insurance. When issued by a banking agency, cease and desist and similar orders may, among other things, require affirmative action to correct any harm resulting from a violation or practice, including by compelling restitution, reimbursement, indemnifications, or guarantees against loss. A financial institution may also be ordered to restrict its growth, dispose of certain assets, rescind agreements or contracts, or take other actions determined to be appropriate by the ordering agency. The federal banking regulators also may remove a director or officer from an insured depository institution (or bar them from the industry) if a violation is willful or reckless.
Standards for Safety and Soundness
The Federal Deposit Insurance Act requires the federal banking regulatory agencies such as the FDIC to prescribe, by regulation or guidance, operational and managerial standards for all insured depository institutions, such as the Bank, relating to internal controls, information systems and audit systems, loan documentation, credit underwriting, interest rate risk exposure, and asset quality. The agencies also must prescribe standards for earnings and stock valuation, as well as standards for compensation, fees, and benefits. The federal banking regulators have implemented these required standards through regulations and interagency guidance designed to identify and address problems at insured depository institutions before capital becomes impaired. Under the regulations, if a regulator determines a bank fails to meet any prescribed standards, the regulator may require the bank to submit an acceptable plan to achieve compliance, consistent with deadlines for the submission and review of such safety and soundness compliance plans.
Dividends and Share Repurchase Programs
The Bank is chartered under the laws of the State of Utah and its deposits are insured by the FDIC. The Bank’s ability to pay dividends is subject to the laws of Utah and the regulations of the FDIC. Generally, under Utah’s industrial bank laws and regulations as well as FDIC regulations, the Bank may pay dividends from its net profits without regulatory approval if, following the payment of the dividend, the Bank’s capital and surplus would not be impaired. The Company relies on dividends from the Bank, as necessary, to enable the Company to pay any declared dividends and other payments and consummate share repurchases, as described herein.
The Company pays quarterly cash dividends on its outstanding Floating-Rate Non-Cumulative Preferred Stock, Series B (the “Series B Preferred Stock”) when, as, and if declared by its Board of Directors, in the Board’s discretion. In January 2019, the Company initiated a new policy to pay a regular, quarterly cash dividend on its common stock as well, beginning in the first quarter of 2019, and its Board of Directors approved a common stock share repurchase program.
Common stock dividend declarations are subject to determination by, and the discretion of, the Company’s Board of Directors. The Company may change its common stock dividend policy at any time.
We expect that the Bank will pay dividends to the Company as may be necessary to enable the Company to pay any declared dividends on its Series B Preferred Stock and common stock and to consummate any common share repurchases by the Company under the Company’s share repurchase programs. The Bank declared $570 million, $550 million, and $700 million in dividends for the years ended December 31, 2024, 2023, and 2022, respectively, with the proceeds primarily used to fund share repurchase programs and stock dividends.
Our Board of Directors has authorized share repurchase programs during prior years, the most recent of which occurred in January 2024 (for a program of up to $650 million of common stock). Under the share repurchase programs, purchases take place as and when we determine in open market or private transactions made based upon the market price of our common stock, the nature of other investment opportunities or growth projects, our cash flows from operations, and general economic conditions. The share repurchase programs do not require us to acquire any specific number of shares, and may be modified, suspended, extended, or terminated by us at any
2024 Form 10-K — SLM CORPORATION 16
time. We repurchased 11.6 million and 22.3 million shares during the years ended December 31, 2024 and 2023, respectively. As of December 31, 2024, we had $402 million of capacity remaining under the 2024 Share Repurchase Program (as hereinafter defined). See Notes to the Consolidated Financial Statements, Note 12, “Stockholders’ Equity” in this Form 10-K for additional information.
Regulatory Capital Requirements
The Bank is subject to various regulatory capital requirements administered by the federal and state banking authorities. Failure to meet minimum capital requirements can initiate certain mandatory and possibly additional discretionary actions by regulators that, if undertaken, could have a direct material adverse effect on our business, results of operations, and financial condition.
For more information on how the Bank manages its capital position, see Item 7. “Management’s Discussion and Analysis of Financial Condition and Results of Operations – Regulatory Capital – Capital Management.”
Stress Testing Requirements
The Bank is not currently subject to stress testing requirements under the Dodd-Frank Act. However, under regulatory guidance, the Bank still conducts annual capital stress tests, the results of which it presents to its prudential regulators - the FDIC and the UDFI - for their review. The Bank also conducts quarterly liquidity stress tests to evaluate the adequacy of its liquidity sources under various stress scenarios and provides the results to its Board of Directors. These results are submitted to the Bank’s prudential regulators at their request.
Deposit Insurance and Assessments
Deposits at the Bank are insured up to the applicable legal limits by the FDIC-administered Deposit Insurance Fund (the “DIF”), which is funded primarily by quarterly assessments on insured banks. An insured bank’s assessment is calculated by multiplying its assessment rate by its assessment base. A bank’s assessment base and assessment rate are determined each quarter.
The Bank’s insurance assessment base currently is its average consolidated total assets minus its average tangible equity during the assessment period. The Bank’s assessment rate is determined by the FDIC using a number of factors, including the results of supervisory evaluations, the Bank’s capital ratios and its financial condition, as well as the risk posed by the Bank to the DIF. Assessment rates for insured banks also are subject to adjustment depending on a number of factors, including significant holdings of brokered deposits in certain instances and the issuance or holding of certain types of debt.
Deposits
With respect to brokered deposits, an insured depository institution must be well capitalized under the prompt corrective action framework in order to accept, renew, or roll over such deposits without FDIC clearance. An adequately capitalized insured depository institution must obtain a waiver from the FDIC to accept, renew, or roll over brokered deposits. Undercapitalized insured depository institutions generally may not accept, renew, or roll over brokered deposits. For more information on the Bank’s deposits, see Item 7. “Management’s Discussion and Analysis of Financial Condition and Results of Operations — Key Financial Measures — Funding Sources.”
Regulatory Examinations
The Bank currently undergoes regular on-site examinations by the Bank’s regulators, who examine for adherence to a range of legal and regulatory compliance responsibilities. A regulator conducting an examination has unfettered access to the books and records of the examined institution. The results of the examination are confidential. The cost of examinations may be assessed against the examined institution as the agency deems necessary or appropriate.
Source of Strength
Under the Dodd-Frank Act, we are required to serve as a source of financial strength to the Bank and to commit resources to support the Bank in circumstances when we might not do so absent the statutory requirement. Any loan by us to the Bank would be subordinate in right of payment to depositors and to certain other indebtedness of the Bank.
2024 Form 10-K — SLM CORPORATION 17
Community Reinvestment Act
The Community Reinvestment Act (the “CRA”) requires the FDIC to evaluate the record of the Bank in meeting the credit needs of its local community, including low- and moderate-income neighborhoods, consistent with the safe and sound operation of the institution. These evaluations are considered in evaluating mergers, acquisitions, and applications to open a branch or facility. Failure to adequately meet these criteria could result in additional requirements and limitations on the Bank. The Bank has received a CRA rating of Outstanding.
Data Privacy and Data Security Laws and Regulations
The federal banking regulators, as required by the Gramm-Leach-Bliley Act (“GLBA”), have adopted regulations that limit the ability of banks and other financial institutions to disclose nonpublic information about consumers to unaffiliated third parties. Financial institutions are required to disclose to consumers their policies for collecting and protecting confidential customer information. Customers generally may prevent financial institutions from sharing nonpublic personal information with unaffiliated third parties, with some exceptions. Financial institutions generally may not disclose certain consumer or account information to any unaffiliated third party for use in telemarketing, direct mail marketing, or other marketing. The privacy regulations also restrict information sharing among affiliates for marketing purposes and govern the use and provision of information to consumer reporting agencies. Federal and state banking agencies have adopted regulations for maintaining the security and confidentiality of consumer information, and the Bank is subject to such regulations, as well as certain federal and state laws or regulations for notifying consumers in the event of a security breach. In addition, we must comply with increasingly complex and rigorous data privacy and data security laws and regulations enacted or adopted to protect business and personal information. These laws and regulations impose additional obligations on companies regarding the handling of personal information and provide certain individual privacy rights to persons whose personal information is stored and shared. Any failure to comply with these laws and regulations could subject us to legal and reputational risk. For example, we are subject the rules and regulations promulgated under the authority of the Federal Trade Commission, which regulates unfair or deceptive acts or practices (including with respect to data privacy and data security). At the state level, California passed the California Consumer Privacy Act (the “CCPA”), which became effective on January 1, 2020, and the California Privacy Rights Act (the “CPRA”), which expands upon the CCPA and brought additional compliance obligations with respect to certain processing of personal information of California residents once it came into effect in most material respects on January 1, 2023. The CCPA and CCRA apply to for-profit businesses that conduct business in California and meet certain revenue or data collection thresholds. The CCPA and CCRA contain several exemptions, including an exemption applicable to information that is collected, processed, sold, or disclosed pursuant to the GLBA. However, the definition of personal information is expanded under the California statutes to apply to certain data beyond the scope of the GLBA exemption. Additionally, numerous other states have enacted or are in the process of enacting state-level data privacy and data security laws and regulations relating to the collection, storage, handling, use, disclosure, transfer, security, and other processing of personal information. Misuse of or failure to secure certain personal information could result in violation of data privacy or data security laws and regulations, proceedings against the Company by governmental entities or others, damage to our reputation and credibility, and could negatively affect our business, financial condition, and results of operations. If other states in the U.S. adopt similar laws or if a comprehensive federal data privacy or data security law is enacted, or if regulators whose authority we are subject to adopt additional or amend existing data privacy or data security regulations, we may expend considerable additional resources to meet these requirements and the overall risk to the Company could incrementally increase depending upon the reach and application of any such laws or regulations.
State Regulation of Student Loan Lenders and Servicers
In certain states, laws regulating the conduct of student loan lenders and servicers may apply to and impact the origination and servicing practices of the Bank. While these state laws vary in content, they generally include components relating to licensure and oversight by state authorities and the creation of specialized student loan ombudsman offices to oversee the student loan industry operating within these states. These laws may also include requirements pertaining to payment processing, customer communications, the handling of customer inquiries and complaints, information concerning loan repayment options, access to borrower account records, the processing of disability applications and borrower requests to remove cosigners from loans, and debt collection, among other
2024 Form 10-K — SLM CORPORATION 18
requirements. Notably, these laws often include provisions for enforcement of alleged violations by state regulators as well as private litigation by aggrieved consumers.
Other Sources of Regulation
Many other aspects of our businesses are subject to federal and state regulation and administrative oversight. Some of the most significant of these are described below.
Oversight of Derivatives
Title VII of the Dodd-Frank Act requires certain standardized derivatives, including most interest rate swaps, to be submitted for clearing to central intermediaries to reduce counterparty risk. Two of the central intermediaries we use are the Chicago Mercantile Exchange (the “CME”) and the London Clearing House (the “LCH”). All variation margin payments on derivatives cleared through the CME and LCH are required to be accounted for as legal settlement. As of December 31, 2024, $850 million notional of our derivative contracts were cleared on the CME and $71 million were cleared on the LCH. The derivative contracts cleared through the CME and LCH represent 92.3 percent and 7.7 percent, respectively, of our total notional derivative contracts of $921 million at December 31, 2024. Our exposure on these derivative contracts is limited to the value of the derivative contracts in a gain position less any collateral held and plus any collateral posted. When there is a net negative exposure, we consider our exposure to the counterparty to be zero.
Credit Risk Retention
The Dodd-Frank risk retention rules generally require sponsors of ABS, such as Sallie Mae, to retain an economic interest in an ABS transaction that represents at least five percent of the credit risk of the assets being securitized. We early adopted the Dodd-Frank risk retention rules beginning with our 2016-A securitization transaction completed in May 2016. For our 2016-A transaction and subsequent securitizations that are treated as on-balance sheet, we comply with the Dodd-Frank risk retention rules by retaining (for a requisite period of time) an “eligible horizontal residual interest” comprised of residual certificates representing at least five percent of the fair value of all ABS interests issued in the securitization transaction, determined as of the date of transfer. For any securitizations that are treated as off-balance sheet, including any loan sale transactions structured as securitizations, we comply with the Dodd-Frank risk retention rules by retaining (for a requisite period) an “eligible vertical interest” comprised of a five percent interest in each class of ABS interests issued in any such transaction; for future off-balance securitizations, we may also comply with the Dodd-Frank risk retention rules by retaining (for a requisite period) a single interest entitling the holder to five percent of any amounts payable by the trustee in respect of each interest issued by the issuing trust.
Anti-Money Laundering, the USA PATRIOT Act, and U.S. Economic Sanctions
The USA PATRIOT Act of 2001 (the “USA Patriot Act”), which amended the Bank Secrecy Act, substantially broadened the scope of United States anti-money laundering laws and regulations by imposing significant new compliance and due diligence obligations, creating new crimes and penalties, and expanding the extra-territorial jurisdiction of the United States. The U.S. Treasury Department has issued a number of regulations that apply various requirements of the USA Patriot Act to financial institutions such as the Bank. These regulations impose obligations on financial institutions to maintain appropriate internal policies, procedures, and controls to detect, prevent, and report money laundering and terrorist financing and to verify the identity of their customers. In addition, U.S. law generally prohibits or substantially restricts U.S. persons from doing business with countries and territories that are the subject of comprehensive territorial sanctions designated by the U.S. Department of the Treasury’s Office of Foreign Assets Control (“OFAC”) or with persons that are the subject of sanctions administered by OFAC or other agencies. We maintain policies and procedures designed to ensure compliance with relevant U.S. laws and regulations applicable to U.S. persons, including the Bank Secrecy Act, as amended, and its implementing regulations and U.S. economic sanctions.
Volcker Rule
The “Volcker Rule” provisions of the Dodd-Frank Act are implemented by rules issued by the U.S. banking agencies, the SEC, and the U.S. Commodity Futures Trading Commission that prohibit insured depository institutions and their affiliates from engaging in proprietary trading and from investing in, sponsoring, or having certain financial relationships with, certain private funds. These prohibitions are subject to a number of important exclusions and exemptions that, for example, permit insured depository institutions and their affiliates to trade for risk-mitigating hedging and liquidity management, subject to certain conditions and restrictions. The Volcker Rule
2024 Form 10-K — SLM CORPORATION 19
does not have a meaningful effect on our current operations or those of our subsidiaries, as we do not materially engage in the businesses prohibited by the Volcker Rule.
Human Capital Resources and Talent Development
We believe in a mission-led culture that inspires commitment and drives performance. Our human capital strategy is focused on the attraction, development, empowerment, recognition, and rewarding of team members as they bring our mission to life.
As of December 31, 2024, we had approximately 1,710 team members, all located in the United States. We believe an engaged workforce leads to a more innovative, productive, and profitable company. For this reason, we measure employee engagement through culture surveys. These culture surveys provide insights we use to create an environment in which team members thrive and bring their full selves to work.
We strive to create a culture of belonging — an environment that encourages and reinforces mutual trust, makes it safe to express thoughts, ideas and concerns, and connects and embraces all backgrounds and perspectives to power and fuel our mission. We are focused on providing a total compensation package that enables us to attract, motivate, and retain the best possible talent to help drive our business forward. We believe in paying competitive market wages, and our benefits package includes Company contributions to the 401(k), educational assistance to our team members and their dependents, flexible work arrangements, and other comprehensive health and welfare programs.
We have made significant investments in learning and talent development, and provide team members with the tools and resources necessary to support their success and drive performance of the Company.
Our team members are involved in the communities in which they live and work through the Sallie Mae Employee Volunteer Program and the Sallie Mae Employee Matching Gift Program. In 2024, our team members donated approximately 4,700 hours through our community engagement programs. We also provide matching gifts for team members to support their interests and needs and those of their communities.
2024 Form 10-K — SLM CORPORATION 20
Item 1A. Risk Factors
SUMMARY OF RISK FACTORS
Below is a summary of the principal factors that make an investment in our securities risky. This summary does not address all of the risks that we face. Additional discussion of the risks summarized in this risk factor summary, and other risks that we face, can be found below and should be carefully considered, together with other information in this Form 10-K and our other filings with the SEC, before making an investment decision regarding our securities.
•Our product offerings are primarily concentrated in loan products for higher education and deposit products for online depositors. Such concentrations and the competitive environment for those products subject us to risks that could adversely affect our financial position.
•Consumer access to alternative means of financing the costs of education and other factors may reduce demand for, or adversely affect our ability to retain, Private Education Loans, which could have a material adverse effect on us.
•Consolidation or refinancing of existing Private Education Loans could have a material adverse effect on our business, financial condition, results of operations, and/or cash flows.
•Defaults on our loans could adversely affect our business, financial condition, results of operations, and/or cash flows.
•Our allowance for credit losses may not be adequate to cover actual losses in all possible scenarios, and we may be required to materially increase our allowance, which may adversely affect our capital, financial condition, and/or results of operations.
•We are subject to the creditworthiness of third parties other than borrowers and exposure to those third parties could adversely affect our business, financial condition, results of operations, and/or cash flows.
•The levels of or changes in interest rates could adversely affect our results of operations, financial condition, regulatory capital, and/or liquidity.
•The interest rate and maturity characteristics of our earning assets do not fully match the interest rate and maturity characteristics of our funding arrangements, which may negatively impact the level of our net interest income.
•We are subject to repayment and prepayment risks, which can increase uncertainty and adversely affect our business, financial condition, results of operations, and/or cash flows.
•Our use of derivatives to manage interest rate sensitivity exposes us to credit and market risk that could have a material adverse effect on our earnings.
•The trailing effects of the discontinuance of LIBOR could adversely affect our business and financial results.
•Our ability to achieve our business goals will be heavily reliant on our ability to obtain deposits, obtain funding through asset-backed securitizations, and sell loans at attractive prices to help fund share repurchase programs and other activities. An inability to effectively manage our liquidity could have a material adverse effect on us.
•In structuring and facilitating securitizations or sales of Private Education Loans, administering securitization trusts, or servicing loans we have securitized or sold, we may incur liabilities to transaction parties. If those liabilities are significant, they could adversely affect our business and financial condition.
•Adverse developments, and/or a continuation of recent turmoil, in the financial services industry could adversely affect our financial condition and results of operations.
•The Bank is subject to various regulatory capital requirements, and failure to meet minimum capital requirements can initiate certain mandatory and possibly additional discretionary actions by regulators that, if undertaken, could have a material adverse effect on us.
2024 Form 10-K — SLM CORPORATION 21
•Unfavorable results from the periodic stress scenarios we model under regulatory guidance may adversely affect our business and result in regulatory action that could adversely affect us.
•Changes in accounting standards, or incorrect estimates and assumptions by management in connection with the preparation of our consolidated financial statements, could adversely affect us.
•We operate in a highly regulated environment and the laws and regulations that govern our operations, or changes in these laws and regulations, or our failure to comply with them, may adversely affect us.
•Failure to comply with consumer protection, privacy, data protection, or cybersecurity laws and requirements could subject us to civil and criminal penalties or litigation, including class actions, and have a material adverse effect on our business.
•Our framework for managing risks, including model risk and data governance risk, may not be effective in mitigating our risk of loss in all possible scenarios and, if the framework is ineffective, could have a material adverse effect on us.
•Proposals of federal and state governments, or of various political officials or candidates, affecting the student loan industry in particular, subject us to political risk and could have a material adverse impact on us.
•We are subject to reputational and other risks, which could damage our brand and have a material adverse impact on us.
•Failure or significant interruption of our operating systems or infrastructure or the inability to adapt to changes could disrupt our business, cause significant losses, result in regulatory action or litigation, or damage our reputation.
•We could lose market share if we are not able to keep pace with rapid changes in technology.
•We depend on secure information technology and a breach of those systems or those of third-party vendors could materially adversely affect us and lead to significant financial, legal, and reputational exposure.
•We depend significantly on third parties for a wide array of our operations and customer services and key components of our information technology infrastructure, and a breach of security or service levels, or violation of law by one of these third parties, could disrupt our business.
•We may face risks from our operations related to litigation or regulatory or supervisory actions that could result in significant legal expenses and settlement or damage awards.
•Our internal controls over financial reporting and disclosure controls, as well as other internal controls, may be ineffective, which could have a material adverse effect on our financial condition and/or results of operations.
•Our business operations and those of our third-party vendors may be adversely impacted by unpredictable catastrophic events.
•New lines of business and our ability to successfully make acquisitions are subject to significant risks.
•We may have exposure to risks related to the Spin-Off, indemnification claims, and/or Navient’s creditworthiness.
•The holders of our preferred stock have rights that are senior to those of our common stockholders.
•We may be limited in our ability to receive dividends from the Bank, pay dividends on and repurchase our common stock, and make payments on our corporate debt.
•Our business could be negatively affected if we are unable to attract, retain, and motivate skilled employees.
2024 Form 10-K — SLM CORPORATION 22
RISK FACTORS
We face many risks and uncertainties, any one or more of which could have a material adverse effect on our business, financial condition (including capital and liquidity), results of operations, cash flows, and/or stock price. We describe certain of these risk and uncertainties in this section, although we may be adversely affected by other risks or uncertainties that (i) are presently not known to us, (ii) we have failed to identify or appreciate, or (iii) we currently consider immaterial. These Risk Factors, together with other information in this Form 10-K and our other filings with the SEC, should be carefully considered before making an investment decision regarding our securities.
CONCENTRATION RISK
Our product offerings are primarily concentrated in loan products for higher education and deposit products for online depositors. Such concentrations and the competitive environment for those products subject us to risks that could adversely affect our financial position.
At December 31, 2024, approximately 74 percent of our total assets, and 88 percent of our total assets excluding cash and cash equivalents, were comprised of Private Education Loans. This concentration poses the risk that any disruption, dislocation, significant adverse legislative or regulatory change, or other negative event or trend in the Private Education Loan market, the overall education loan market, or the overall economic environment, including an inflationary and rising or high interest rate environment or a recession in the U.S., could disproportionately and adversely affect our business, financial condition, and results of operations. We face competition in the Private Education Loan market from a variety of players. We compete with banks and other consumer lending institutions, many of whom have strong consumer brand name recognition, greater financial resources, and greater diversification in their mix of assets, which can enable them to be more competitive in their products and offerings, particularly in uncertain or challenging economic times. We also compete with financial technology (“FinTech”) companies and digital asset service providers, many of whom have lower return hurdles than more traditional consumer lending institutions. The emergence, adoption, and evolution of new technologies and advances in robotic process automation and artificial intelligence could significantly affect the competition for financial services. The use of marketplace lending sites is also growing in popularity in the student loan sector. These market channels may erode our more traditional lending channels and increase our cost to originate Private Education Loans. Moreover, we expect that our competition will increase as various lending institutions and other competitors enter or re-enter the Private Education Loan market. We compete based on our brand products, origination capability, and customer service. To the extent our competitors compete more aggressively or effectively, we could lose market share to them and/or our existing loans could be subject to consolidation or refinancing risk.
In addition to competition from private industry players, the federal government, through the Federal Direct Student Loan Program and other higher education lending programs, poses significant competition to our Private Education Loan products. The availability and terms of loans the government originates or guarantees affect the demand for Private Education Loans because students and their families often rely on Private Education Loans to bridge the gap between available funds, including family savings, scholarships, grants, and federal and state loans, and the costs of post-secondary education. The federal government currently places both annual and aggregate limits on the amount of federal loans any student can receive and determines the criteria for student eligibility. Parents and graduate students may obtain additional federal education loans through other programs, such as the Parent Plus and Graduate Plus programs, without any aggregate limits other than the difference between the cost of education and the amount of other financial aid received by a student. These federal education lending programs are generally adjusted in connection with funding authorizations from the U.S. Congress for programs under the Higher Education Act of 1965 (the “HEA”). The HEA’s reauthorization is currently pending in the U.S. Congress. Reauthorization, as well as measures to provide relief for borrowers of student loans in general, could provide a legislative vehicle for changes to student loan programs. Possible components that could impact the Private Education Loan market and our business include changes to federal education loan limits and/or payment requirements, or private loan refinancing programs. Other components of any legislation also could have a negative impact on our business and financial condition. See “— POLITICAL/REPUTATIONAL RISK” in this Item 1A.
We also face substantial competition for our online deposit products. We expect to compete based primarily on a combination of reputation, rate, and availability of information about our deposit products. Our competitors, many of whom have greater financial resources or lower costs than we do, may be more effective in attracting new deposits and retaining existing deposits such as by offering more competitive rates, dedicating more resources for advertising, or engaging in more effective forms of marketing. For instance, our new depositor acquisition marketing is partly dependent on search engines, as well as bank deposit information aggregators, to direct a significant
2024 Form 10-K — SLM CORPORATION 23
amount of traffic to our website via organic ranking and paid search advertising. Our bank competitors’ paid search activities, such as pay per click marketing, may result in their sites receiving higher search results than ours, thus leading to significant increases in the cost of such depositor acquisition for us. In addition, changes to search engines and deposit information aggregators’ methodologies and business practices could result in a decline in our new deposit growth or existing customer retention. Increased competition for deposits could cause our cost of funds to increase, which could negatively impact our loan pricing and net interest margin. See also “—LIQUIDITY RISK” in this Item 1A.
Consumer access to alternative means of financing the costs of education and other factors may reduce demand for, or adversely affect our ability to retain, Private Education Loans, which could have a material adverse effect on our business, financial condition, results of operations, and/or cash flows.
The demand for Private Education Loans could weaken if families and student borrowers use other vehicles to bridge the gap between available funds and costs of post-secondary education. These vehicles include, among others:
•Home equity loans or other borrowings available to families to finance their education costs;
•Pre-paid tuition plans, which allow students to pay tuition at today’s rates to cover tuition costs in the future;
•Section 529 plans, which include both pre-paid tuition plans and college savings plans that allow a family to save funds on a tax-advantaged basis;
•Education IRAs, now known as Coverdell Education Savings Accounts, under which a holder can make annual contributions for education savings;
•Government education loan programs; and
•Direct loans from colleges and universities, as well as income sharing agreements offered by schools and facilitated by private companies.
In addition, our ability to grow Private Education Loan originations and retain assets at our planned levels could be negatively affected if:
•demographic trends in the United States result in a decrease in college-age individuals;
•demand for higher education decreases (which can occur, among other times, during periods of strong employment in the United States and/or when fewer employers require college degrees for their employees);
•the cost of attendance of higher education decreases;
•consumers increase their targeted savings for higher education;
•prepayment rates on our Private Education Loans increase or accelerate due to greater market liquidity, availability of alternative means of financing, improved household incomes, increasing consumer confidence, and/or various other factors;
•macroeconomic factors (including, without limitation, high unemployment) cause loan applicants or borrowers to be unable to meet our credit standards or repay credit obligations;
•there is broader public resistance to increasing higher education costs; or
•proposals for new federal and state education spending described below in “—POLITICAL/REPUTATIONAL RISK” gain broader appeal or momentum.
Consolidation or refinancing of existing Private Education Loans could have a material adverse effect on our business, financial condition, results of operations, and/or cash flows.
We believe the design of our Private Education Loan products, with emphasis on rigorous underwriting, credit-worthy cosigners and variable or fixed interest rates, creates sustainable, competitive loan products. However, increasing amounts of private education consolidation loans at interest rates below those of our existing portfolio - whether from private sources (including FinTech companies) or otherwise - can contribute to an increase in the prepayment rates of our existing Private Education Loans and, if prolonged and continuous, could have a material adverse effect on our business, financial condition, results of operations, and/or cash flows. Increases in consolidation loans may result from competition, as there has been, and there may be continue to be, an increase in the number of lenders offering consolidation or refinancing products.
2024 Form 10-K — SLM CORPORATION 24
CREDIT RISK
Defaults on our loans could adversely affect our business, financial condition, results of operations, and/or cash flows.
We bear the full credit exposure on our Private Education Loans, which are unsecured loans. If those loans were to default at rates much higher than anticipated or at speeds faster than anticipated, our business, financial condition, results of operations, and/or cash flows could be adversely affected. Delinquencies are an important indicator of the potential future credit performance of our loan portfolio. Many factors can have an impact on borrower delinquencies, including, without limitation, economic conditions (including inflationary, rising or high interest rate, and recessionary environments), changes in interest rates, personal circumstances and hardships, risk characteristics such as school type, loan status, loan seasoning, underwriting criteria, presence of a cosigner, changes made in credit administration practices from time to time, changes in loan underwriting criteria made from time to time, legislative, regulatory and operational changes, servicing and collections staffing challenges, other operational challenges we may encounter, the cessation by the federal government of any payment suspension programs it may implement from time to time for borrowers of federal student loans (including the suspension program initiated during the COVID-19 pandemic), the invalidation or failure of efforts to forgive or lessen the burden of federal student loan indebtedness for certain borrowers, and unforeseen events or trends.
Rising unemployment rates and the failure of our in-school borrowers to graduate are two of the most significant macroeconomic factors that could increase loan delinquencies, defaults, and loan modifications, or otherwise negatively affect performance of our existing education loan portfolio, as such factors may cause borrowers and cosigners to experience trouble repaying credit obligations or meeting our credit standards. The impact of these factors may be heightened in rising or high interest rate environments when interest rates rise causing payments on variable-rate loans to increase. See Item 7. “Management’s Discussion and Analysis of Financial Condition and Results of Operations — Financial Condition — Allowance for Credit Losses — Use of Forbearance and Modifications as a Private Education Loan Collection Tool” for a discussion of how items such as changes in credit administration practices can impact the timing and level of delinquencies and defaults on our loans. As part of our underwriting process, we rely heavily upon information supplied by applicants and third parties. If any of this information is intentionally or negligently misrepresented, or is inaccurate, and is not detected by us before completing the transaction, or changes after we collect the information, we may experience increased credit risk. Higher credit-related losses and weaker credit quality negatively affect our business, financial condition, and results of operations and limit funding options, which could also adversely impact our liquidity position. Our Private Education Loan (held for investment) delinquencies (loans greater than 30 days past due), as a percentage of Private Education Loans (held for investment) in repayment, were 3.68% at December 31, 2024.
Our allowance for credit losses may not be adequate to cover actual losses in all possible scenarios, and we may be required to materially increase our allowance, which may adversely affect our capital, financial condition, and/or results of operations.
We are required to measure our allowance for credit losses based on our estimate of all current expected credit losses over the remaining contractual term of our assets. The current expected credit loss (“CECL”) standard resulted in a significant change in how we recognize credit losses and has had a material impact on our financial condition, results of operations, and capital levels. The evaluation of our allowance for credit losses is inherently subjective, as it requires material estimates that may be subject to significant changes. The measurement of expected credit losses is based on historical information, current conditions, and reasonable and supportable forecasts to estimate the expected loss over the life of the loan. Our models take into account historical loss experience in various economic conditions to estimate expected future losses based upon future economic forecasts over a period of time (“reasonable and supportable period”), at which point we immediately revert our forecasted economic factors to long-term historical loss conditions. Defaults can be higher than anticipated due to a variety of factors, and our models may not accurately estimate future loan loss performance. The models used in calculating our CECL estimates include forecasts of future economic conditions, the weighting of economic forecasts, prepayment speeds, and recovery rates. If these forecasts prove to be inaccurate, or our models were not designed properly, our allowance for credit losses may not be sufficient to cover future losses, which could negatively impact our financial condition, results of operations, and capital levels. In addition, the amount of losses recorded under CECL is very sensitive to the inputs described above. As such, changes to these inputs could significantly change the amount of allowance necessary, which could have a negative impact on our financial results and capital levels. Additionally, regulatory agencies may periodically review our allowance for credit losses, including our methodology and models used in calculating the allowance, and could insist on an increase in the
2024 Form 10-K — SLM CORPORATION 25
allowance or recognition of additional charge-offs based on judgments different than those used by our management. If these differences in judgment are significant, our allowance could increase significantly and result in sizable decreases in our net income and capital. See Item 7. “Management’s Discussion and Analysis of Financial Condition and Results of Operations — Critical Accounting Policies and Estimates — Allowance for Credit Losses” for further details regarding our allowance for credit losses.
We are subject to the creditworthiness of third parties other than borrowers and exposure to those third parties could adversely affect our business, financial condition, results of operations, and/or cash flows.
We are also subject to the creditworthiness of third parties, including various lending, securitization, investment, and derivative counterparties. Our overall counterparty exposure is more fully discussed in Part II, Item 7. “Management’s Discussion and Analysis of Financial Condition and Results of Operations — Liquidity and Capital Resources — Counterparty Exposure.” If our counterparties are unable to perform their obligations, or the ability of our counterparties to perform their obligations becomes impaired or less certain, the obligations of our counterparties to us or our investments in any counterparties or their securities could become impaired, which could have a material adverse impact on our business, financial condition, results of operations, and/or cash flows.
INTEREST RATE RISK
The levels of or changes in interest rates could adversely affect our results of operations, financial condition, regulatory capital, and/or liquidity.
We are highly dependent on net interest income, which is the difference between interest income on earning assets (such as loans and investments) and interest expense on deposits and borrowings. Net interest income is significantly affected by market rates of interest, which in turn are influenced by monetary and fiscal policies of governmental agencies, general economic conditions, conditions in the capital markets, the political and regulatory environments, business and consumer sentiment, competitive pressures, and expectations about the future. We may be adversely affected by policies or events that have the effect of flattening or inverting the yield curve (that is, the difference between long-term and short-term interest rates), compressing interest rates on our earnings assets closer to interest rates on our deposits and borrowings, increasing the volatility of market rates of interest, or changing the spreads among different interest rate indices. Changes in interest rate levels also can lead to other adverse impacts, such as reducing the demand for or increasing the prepayment speeds of our Private Education Loans, increasing the delinquencies or defaults of our borrowers or other counterparties, reducing the value of our assets, or increasing our liabilities. Many of these adverse impacts can occur in an inflationary and/or rising interest rate environment. These adverse impacts may materially adversely affect our operations, our regulatory capital and liquidity position, the credit performance of our Private Education Loans and other assets, the number of borrowers seeking payment relief, our results of operations and financial condition, and/or our cash flows. The level of and changes in market rates of interest and, as a result, these risks and uncertainties, are beyond our control.
The interest rate and maturity characteristics of our earning assets do not fully match the interest rate and maturity characteristics of our funding arrangements, which may negatively impact the level of our net interest income.
Net interest income is the primary source of cash flow generated by our loan portfolio. Interest earned on our Private Education Loans is either fixed-rate or indexed to a short-term variable rate, and these loans are originated with relatively long repayment periods. ABS funding closely mirrors the expected maturities of our education loans and provides a combination of fixed and variable-rate funding. Deposits are issued with both fixed and variable rates, and the average term is typically shorter than the expected term of our loan portfolio.
The different interest rate and maturity characteristics of our loan portfolio and the liabilities funding the portfolio result in fluctuations in our net interest income. In certain interest rate environments, this mismatch may reduce our net interest margin (the interest yield earned on our portfolio less the rate paid on our interest-bearing liabilities) and net interest income. While we actively monitor and manage mismatches in the interest rate and maturity characteristics of our assets and liabilities, using derivative transactions where necessary to avoid excessive levels of repricing and refunding risk, it is not possible to hedge all of our exposure to such risks. While the assets, liabilities, and related hedging derivative contract re-pricing indices are typically highly correlated, there can be no assurance that the historically high correlation will not be disrupted by capital market dislocations or other factors outside our control. In these circumstances, our earnings could be materially adversely affected.
2024 Form 10-K — SLM CORPORATION 26
We are subject to repayment and prepayment risks, which can increase uncertainty as we manage our interest rate risk and can adversely affect our business, financial condition, results of operations, and/or cash flows.
We are subject to risks associated with changes in repayment and prepayment rates on Private Education Loans, which can increase uncertainty as we manage our interest rate risk. Consolidations and refinancings contribute to increased prepayment rates. In addition, increases in employment levels, wages, family income, alternative sources of financing, and government support for student loan borrowers or the forgiveness for certain borrowers of federal student loan indebtedness, may also contribute to higher-than-expected prepayment rates, which can adversely affect our interest rate and repricing risk and our financial condition and results of operations.
Our use of derivatives to manage interest rate sensitivity exposes us to credit and market risk that could have a material adverse effect on our earnings.
We maintain an overall interest rate strategy that uses derivatives to reduce the economic effect of interest rate changes. Developing an effective hedging strategy for dealing with movements in interest rates is complex, and no strategy can completely avoid the risks associated with these fluctuations. For example, our Private Education Loan portfolio remains subject to prepayment risk that could cause it to be under- or over-hedged, which could result in material losses. In addition, some of our interest rate risk management activities expose us to mark-to-market losses if interest rates move in a materially different way than was expected when we entered into the related derivative contracts.
Our use of derivatives also exposes us to market risk and credit risk. Market risk is the chance of financial loss resulting from changes in interest rates and market liquidity. Some of the interest rate swaps we use to economically hedge interest rate risk between our assets and liabilities do not qualify for hedge accounting treatment. Therefore, the change in fair value, called the “mark-to-market,” of the swaps that do not qualify as accounting hedges is included in our statement of income. A decline in the fair value of those derivatives could have a material adverse effect on our reported earnings. See also “— CREDIT RISK — We are subject to the creditworthiness of third parties other than borrowers and exposure to those third parties could adversely affect our business, financial condition, results of operations, and/or cash flows” in this Item 1A.
The trailing effects of the discontinuance of LIBOR could adversely affect our business and financial results.
In 2017, the Alternative Reference Rates Committee, a group of market participants that includes both banks and a number of non-banks, identified the Secured Overnight Financing Rate (“SOFR”), which is a rate based on overnight U.S. Treasury repurchase agreement transactions, as its recommended alternative to USD LIBOR (which was being phased out by regulatory authorities).
Between 2020 and 2023, we transitioned our assets, liabilities, and off-balance sheet items to SOFR (plus the applicable spread adjustment). In some instances, we relied on safe harbors provided by federal legislation to transition obligations from LIBOR to SOFR because the obligations did not have fallback provisions for alternative reference rates. Although we relied on those safe harbors in certain instances, the safe harbors were untested. We could still be exposed to risks associated with disputes and litigation with customers, counterparties, and other market participants in connection with implementing replacement rates for LIBOR.
LIQUIDITY RISK
Our ability to achieve our business goals will be heavily reliant on our ability to obtain deposits, obtain funding through asset-backed securitizations, and sell loans at attractive prices to help fund share repurchase programs and other activities. An inability to effectively manage our liquidity could negatively impact our ability to fund our business obligations and opportunities, which could lead to regulatory scrutiny and could have a material adverse effect on our business, financial condition, results of operations, and/or cash flows.
We must effectively manage the liquidity risk inherent in our business. We require liquidity to meet cash requirements for such things as day-to-day operating expenses, funding of our Private Education Loan originations, deposit withdrawals and maturities, payment of any declared dividends on our preferred stock and common stock, payment of our debt service, and payment for any shares of common stock or preferred stock acquired under any stock repurchase program or otherwise. Our primary sources of liquidity and funding are customer deposits,
2024 Form 10-K — SLM CORPORATION 27
payments received on Private Education Loans that we hold, and proceeds from loan sales and securitization transactions. We may maintain too much liquidity, which can be costly, or we may be too illiquid, which could result in financial distress during times of economic stress or capital market disruptions.
We fund Private Education Loan originations through asset-backed securitizations and deposits raised by the Bank, including term and liquid brokered and retail deposits, as well as Educational 529 and Health Savings Account deposits, and with proceeds received from loan sales. Assets funded through deposits result in refinancing risk because the average term of the deposits is shorter than the expected term of the Private Education Loan assets we originate. The significant competition for deposits from other banking organizations that are also seeking stable deposits to support their funding needs may affect deposit renewal rates, costs, or availability. At December 31, 2024, our brokered deposits totaled $9.5 billion, which represented 45 percent of our total deposits. Brokered deposits may be more price sensitive than other types of deposits and may become less available if alternative investments offer higher returns. In addition, our ability to maintain existing balances of all deposit types or obtain additional deposits of any type may be affected by factors, including those beyond our control, such as a rising stock market, more attractive returns on alternative investments, perceptions about our existing and future financial strength, quality of deposit servicing or online banking generally, changes in monetary or fiscal policies that influence deposit or other rates, general economic conditions, including high unemployment and decreased savings rates, and adverse developments in the financial services industry generally. See also “—LIQUIDITY RISK — Adverse developments, and/or a continuation of recent turmoil, in the financial services industry could adversely affect our financial condition and results of operations” in this Item 1A. Also, our ability to maintain our current level of deposits or grow our deposit base could be affected by regulatory restrictions, including the possible imposition by our regulators of prior approval requirements or restrictions on our offered rates, brokered deposit growth, or other areas.
Our success also depends on our ability to structure Private Education Loan securitizations or execute other secured funding transactions. Several factors may have a material adverse effect on both our ability to obtain such funding and the time it takes us to structure and execute these transactions, including the following:
•Persistent and prolonged disruption or volatility in the capital markets (which could occur as a result of, among other things, general economic conditions, a government debt default, or a government shutdown) or in the education loan ABS sector specifically;
•Degradation of the credit quality or performance of the Private Education Loans we sell or finance through securitization trusts, or adverse rating agency assumptions, rating actions, or conclusions with respect to those trusts or the education loan-backed securitization trusts sponsored by other issuers;
•A material breach of our obligations to purchasers of our Private Education Loans, including securitization trusts;
•The timing, pricing, and size of education loan asset-backed securitizations other parties issue, or the adverse performance of, or other problems with, such securitizations;
•Challenges to the enforceability of Private Education Loans based on violations of, or changes to, federal or state consumer protection or licensing laws and related regulations, or imposition of penalties or liabilities on assignees of Private Education Loans for violation of such laws and regulations; and
•Our inability to structure and gain market acceptance for new product features or services to meet new demands of ABS investors, rating agencies, or credit facility providers.
If we require funding beyond that which we may be able to obtain through deposits and proceeds from ABS transactions at attractive prices, we may need to raise additional liquidity through other forms of secured and unsecured debt financing, which, in turn, could increase our funding costs and reduce our net interest margin. Future downgrades to our credit ratings, or to the credit ratings of our subsidiaries or to the securities issued in our securitization transactions, also could result in higher funding costs and reduce our net interest margin.
Our ability to sell loans at attractive prices, as well as the timing and volume of any sales, will be subject to market conditions and competitive purchasers, and there can be no guarantee that we will be able to effectuate planned or unplanned loan sales at the prices, times, or volumes we desire, or at all. If we are unable to effectuate loan sales at the prices, times, and volumes we desire, we may not be able to fund share repurchase programs that are authorized from time to time, originate Private Education Loans in the volumes we desire, meet other obligations, or achieve other business goals.
2024 Form 10-K — SLM CORPORATION 28
If our business objectives require capital above and beyond what we generate through retained earnings, we may need to raise capital for our business by issuing additional equity to investors. Several factors, some of which may be beyond our control, may have a material adverse effect on our ability to raise funding at any given time through any of the channels described above in this Risk Factor in the amounts, at the rates, or within the timeframes we desire or need. If this occurs, our business, results of operations, financial position, and/or cash flows could be materially and adversely affected.
We conduct quarterly liquidity stress tests to evaluate the adequacy of our liquidity sources under several stress scenarios, including a severely adverse macroeconomic scenario. The results of these scenarios may lead management to determine, or our regulators to demand, that higher levels of capital be maintained at significant incremental expense to the Bank.
In structuring and facilitating securitizations or sales of Private Education Loans, administering securitization trusts, or servicing loans we have securitized or sold, we may incur liabilities to transaction parties. If those liabilities are significant, they could adversely affect our business, financial condition, results of operations, and/or cash flows.
Under applicable state and federal securities laws, if investors incur losses as a result of purchasing ABS issued in connection with our securitization transactions, we could be deemed responsible and could be liable to investors for damages. We could also be liable to investors or other parties for certain updated performance information that we may provide subsequent to the original issuances. If we fail to cause the securitization trusts or other transaction parties to disclose adequately all material information regarding an investment in any securities, if we or the trusts make statements that are misleading in any material respect in information delivered to investors in any securities, if we breach any representations or warranties made in connection with securitization of the loans, or if we breach any other duties as the administrator or servicer of the securitization trusts, it is possible we could be sued and ultimately held liable to an investor or other transaction party. In transactions involving the sale of loans in non-securitized form where we remain the servicer of the loans, it is possible we could be subject to claims and ultimately held liable to the purchaser of the loans or another transaction party for breaches of representations or warranties or breaches of servicing covenants. If any of those liabilities are significant, they could adversely affect our business, financial condition, results of operations, and/or cash flows.
Adverse developments, and/or a continuation of recent turmoil, in the financial services industry could adversely affect our financial condition and results of operations.
In the past couple of years, several financial services institutions failed or required outside liquidity support. The impact of these failures led to risk of additional stress to the financial services industry generally as a result of increased lack of confidence in the financial sector. Significant, unanticipated deposit withdrawals due to market distress or otherwise or our inability to access other sources of liquidity, whether due to capital markets dislocations or otherwise, could result in constraints on our liquidity and adversely affect our business, financial condition, and results of operations.
The financial system is highly interrelated, and we have exposure to, and routinely execute transactions with, a variety of financial institutions. If any of these financial institutions or participants were to become or be perceived as unstable, or enter conservatorship, receivership, or bankruptcy, the consequences could have an adverse effect on our business, financial condition, and results of operations.
2024 Form 10-K — SLM CORPORATION 29
CAPITAL RISK
The Bank is subject to various regulatory capital requirements administered by the FDIC and the UDFI. Failure to meet minimum capital requirements can initiate certain mandatory and possibly additional discretionary actions by regulators that, if undertaken, could have a material adverse effect on our business, results of operations, and/or financial condition.
Under the FDIC’s regulations implementing the Basel III capital framework (“U.S. Basel III”) and the regulatory framework for prompt corrective action, the Bank must meet specific capital standards that involve quantitative measures of its assets, liabilities, and certain off-balance sheet items as calculated under regulatory accounting practices. The Bank’s capital adequacy and its classification under the prompt corrective action framework are also subject to qualitative judgments by the regulators about components of capital, risk weightings, and other factors.
If the Bank fails to satisfy regulatory risk-based or leverage capital requirements, it would be subject to serious regulatory consequences, including restrictions on the ability to make dividend payments or share repurchases, that could prevent us from successfully executing our business plan and may have a material adverse effect on our business, results of operations, financial position, and/or cash flows. See Item 7. “Management’s Discussion and Analysis of Financial Condition and Results of Operations - Regulatory Capital.”
Unfavorable results from the periodic stress scenarios we model under regulatory guidance may adversely affect our business and result in regulatory action that could adversely affect our cost of capital and liquidity position.
Pursuant to regulatory guidance, the Bank conducts annual capital stress tests, modeling a systemic stress scenario. In addition, the Bank may model company-specific stress scenarios from time to time. In 2024, the Bank conducted its annual capital stress tests and the results of these tests were presented to and reviewed by the Bank’s senior management, the Bank’s Board of Directors, and the Board’s Financial Risk Committee. In addition, the Bank made the results of the stress tests (its current business forecast) available to its prudential regulators - the FDIC and the UDFI. Generally, the stress test results include certain measures that evaluate the Bank’s ability to absorb losses in severely adverse economic and financial conditions. On the basis of a stress analysis, senior management may elect to adjust its business plans or capital targets to reduce risks identified by the analysis. Our regulators may also require the Bank to raise additional capital or take other actions, or may impose restrictions on our business, based on the results of the stress tests. We may not be able to raise additional capital if required to do so or may not be able to do so on terms that are advantageous to us. Any such capital raises, if required, may also be dilutive to our existing stockholders. Our regulators may also update their supervisory expectations applicable to the Bank’s stress tests, which could change how the Bank conducts stress tests or how senior management uses the results of the stress tests to inform business plans and capital targets.
Changes in accounting standards, or incorrect estimates and assumptions by management in connection with the preparation of our consolidated financial statements, could adversely affect our capital levels, results of operations, and/or financial condition.
We are subject to the requirements of entities that set and interpret the accounting standards governing the preparation of our financial statements and other financial reports. These entities, which include the Financial Accounting Standards Board (the “FASB”), the SEC, and banking regulators, may add new requirements or change their interpretations of how those standards should be applied. Changes in our accounting policies or in accounting standards could materially affect how we report our financial condition and/or results of operations. As a result of changes to financial accounting or reporting standards, whether promulgated or required by the FASB or other regulators, we could be required to change certain of the assumptions or estimates we have previously used in preparing our financial statements, which could negatively impact how we record and report our financial condition, results of operations, and capital levels.
The preparation of our consolidated financial statements requires us to make critical accounting estimates and assumptions that affect the reported amounts of assets, liabilities, income, and expenses during the reporting periods. Incorrect estimates and assumptions by us in connection with the preparation of our consolidated financial statements could adversely affect the reported amounts of assets, liabilities, income, and expenses. If we make incorrect assumptions or estimates, we may under- or overstate reported financial results, which could materially and adversely affect our business, financial condition, results of operations, and/or capital levels. For additional information on the key areas for which assumptions and estimates are used in preparing our financial statements,
2024 Form 10-K — SLM CORPORATION 30
see Item 7. “Management’s Discussion and Analysis of Financial Condition and Results of Operations — Critical Accounting Policies and Estimates” and Notes to Consolidated Financial Statements, Note 2, “Significant Accounting Policies.”
REGULATORY RISK
We operate in a highly regulated environment and the laws and regulations that govern our operations, or changes in these laws and regulations, or our failure to comply with them, may adversely affect us.
We are subject to extensive regulation and supervision that govern almost all aspects of our operations. Intended to protect clients, depositors, the DIF, and the overall financial system, these laws, regulations, and supervisory actions may, among other matters:
•increase minimum capital requirements;
•reclassify the types of assets we hold for regulatory capital purposes, including for risk-weightings;
•limit the rates of growth of our business;
•impose limitations on the business activities in which we can engage;
•limit the dividends or distributions the Bank can pay to us;
•limit share repurchases;
•restrict the payment of discretionary bonuses to executive officers;
•restrict the ability of institutions to guarantee our debt;
•limit proprietary trading and investments in certain private funds;
•impose certain specific accounting requirements on us that may be more restrictive;
•result in changes from time to time in our practices, policies, procedures, and personnel in various areas of our business (including, without limitation, practices and policies regarding the dischargeability of certain Private Education Loans in the event of a borrower’s bankruptcy);
•enhance restrictions regarding money laundering and the financing of terrorism;
•enhance requirements related to risk management and corporate governance; and
•result in greater or earlier charges to earnings or reductions in our capital.
Compliance with laws and regulations can be difficult and costly, and changes to laws and regulations, as well as increased intensity in supervision, often impose additional costs and could result in additional charge-offs. In recent years, there has been an increase in the scope of the laws and regulations and the intensity of the supervision to which we are subject, as well as an increase in regulatory enforcement and fines across the banking and financial services sector. The scope of regulation and the intensity of supervision may become higher in the future, which could increase our costs and levels of charge-offs, require increased management attention, and adversely impact our results of operations.
In connection with their continuous supervision and examinations of us, the FDIC, the UDFI, the CFPB, or other regulatory agencies may require changes in our business or operations. Such a requirement may be judicially enforceable or impractical for us to contest, and we could become subject to formal or informal enforcement and other supervisory actions, including memoranda of understanding, written agreements, cease-and-desist orders, and prompt-corrective-action or safety-and-soundness directives. Supervisory actions could entail significant restrictions on our existing business, our ability to develop new business, our flexibility in conducting operations, and our ability to pay dividends or utilize capital. Enforcement and other supervisory actions also can result in the imposition of civil monetary penalties or injunctions, related litigation by private plaintiffs, damage to our reputation, and a loss of customer or investor confidence. We could be required as well to dispose of specified assets and liabilities or to increase our level of charge-offs within a prescribed period of time. As a result, any enforcement or other supervisory action could have an adverse effect on our business, financial condition, results of operations, and prospects. Restrictions or limitations on our operations, or other directives, imposed by our regulators may be confidential and thus, in some instances, we may not be permitted to publicly disclose the actions.
In addition, changes in the regulatory and supervisory environments could adversely affect us in substantial and unpredictable ways, including by limiting the types of financial services and products we may offer, enhancing
2024 Form 10-K — SLM CORPORATION 31
the ability of others to offer more competitive financial services and products, restricting our ability to make acquisitions or pursue other profitable opportunities, and negatively impacting our financial condition and results of operations. Changes in the prevailing interpretations of federal or state laws, or the passage of new federal or state laws, and related regulations could also invalidate or call into question the legality of certain of our services and business practices. The impact of the Trump Administration’s policies is unclear.
Our failure to comply with the laws, regulations, and supervisory actions to which we are subject, even if the failure is inadvertent or reflects a difference in interpretation, could subject us to fines, other penalties, and restrictions on our business activities, any of which could adversely affect our business, financial condition, cash flows, results of operations, capital base, and/or the price of our securities.
Failure to comply with consumer protection, privacy, data protection, or cybersecurity laws and requirements could subject us to civil and criminal penalties or litigation, including class actions, and have a material adverse effect on our business.
We are subject to a broad range of federal and state consumer protection laws applicable to our lending and retail banking activities, including laws governing fair lending, unfair, deceptive and abusive acts and practices, service member protections, interest rates and loan fees, disclosures of loan terms, marketing, servicing, and collections.
The CFPB is the Bank’s primary consumer compliance supervisor, with exclusive authority to conduct examinations for the purposes of assessing compliance with the requirements of federal consumer financial laws and with primary consumer compliance enforcement authority. CFPB jurisdiction, regulation, and supervision could increase our costs and limit our ability to pursue business opportunities. Complaints received by the CFPB regarding us could lead to additional scrutiny of us and increase our costs. Consent orders, decrees, or settlements entered into with governmental agencies may also increase our compliance costs or restrict certain of our activities.
The CFPB and the FDIC issued guidance to supervised banks with respect to increased responsibilities to supervise the activities of service providers to ensure compliance with federal consumer protection laws. The issuance of regulatory guidance and the enforcement of the enhanced vendor management standards via examination and investigation of us or any third party with whom we do business may increase our costs, require increased management attention, and adversely impact our operations. In the event we should fail to meet the heightened standards for management of service providers, we could be subject to supervisory orders to cease and desist, civil monetary penalties, or other actions due to claimed noncompliance, which could have an adverse effect on our business, financial condition, operating results, and/or cash flows.
We are also subject to a dynamically changing landscape of privacy, data protection, and cybersecurity laws, regulations, and requirements. Various federal and state regulators, including governmental agencies, have adopted, or are considering adopting, laws and regulations regarding the use and disclosure of personal information and data privacy and security. This patchwork of legislation and regulation may lead to conflicts or differing views of privacy rights. As an example, certain state laws regarding personal information may be broader in scope or more stringent than federal laws or the laws of other states regarding personal information. See Item 1. “Business — Supervision and Regulation — Regulation of Sallie Mae Bank — Data Privacy and Data Security Laws and Regulations” for additional information.
Further, we make public statements about our use, collection, disclosure, and other processing of personal information through our privacy policies, information provided on our website, and press statements. Although we endeavor to comply with our public statements and documentation, we may at times fail to do so or be alleged to have failed to do so. The publication of our privacy policies and other statements that provide assurances about privacy, data protection, and data security can subject us to potential regulatory or legal action if they are found to be deceptive, unfair, or misrepresentative of our actual practices.
Violations of federal or state consumer protection, privacy, data protection, or cybersecurity laws or related regulations may expose us to litigation, administrative fines, penalties, and restitution. Compliance with laws and regulations can be difficult and costly, and changes to laws and regulations, as well as increased intensity in compliance and supervision activities, often impose additional compliance costs and may constrain the marketing and origination of Private Education Loans or other products, adversely affect the collection of balances due on the loan assets held by us or by securitization trusts, adversely affect the execution of strategic initiatives, or otherwise adversely affect our business.
2024 Form 10-K — SLM CORPORATION 32
From time to time, we and our third-party service providers may use artificial intelligence, machine learning, data analytics, and similar tools to collect, aggregate, and analyze data in connection with our business. The impacts of, and regulatory framework for, such technology are continually evolving and remain uncertain and could affect our operations and the way in which we and our third-party service providers use such technology. Additionally, we could incur significant costs to comply with such evolving framework, which could adversely affect our business, financial condition, and results of operations.
Our framework for managing risks, including model risk and data governance risk, may not be effective in mitigating our risk of loss in all possible scenarios and, if the framework is ineffective, could have a material adverse effect on us and our business.
Our risk management framework seeks to mitigate risk and appropriately balance risk and return. We continue to evolve our risk management framework to consider changes in business and regulatory expectations and to refine established processes and procedures intended to identify, measure, monitor, test, control, report, escalate, and mitigate the types of risk to which we are subject. We seek to monitor and control our risk exposure through a framework of policies, procedures, limits, and reporting requirements.
We also rely on quantitative models to measure and manage risks and estimate certain financial values. Models may be used in such processes as product pricing, extending credit, measuring interest rate and other market risk, estimating losses, calculating and assessing capital levels, estimating the value of financial instruments and balance sheet items, and various other processes. If the models that we use to measure and/or mitigate these risks and values are poorly designed, based upon incorrect or incomplete information, poorly implemented, or are otherwise inadequate, or our governance surrounding the management of data we use in our models and other aspects of our business is poorly designed or implemented, or otherwise is inadequate, our business decisions may be adversely affected, we may provide inaccurate information to the public or regulators, and/or we may incur increased losses.
In addition, there may be existing or developing risks that we have not appropriately anticipated, identified, or mitigated. If our risk management framework does not effectively identify or mitigate our risks, we could suffer unexpected losses and our business, financial condition, and/or results of operations could be materially adversely affected. An ineffective risk-management framework or function also could give rise to enforcement and other supervisory actions, damage our reputation, and result in litigation.
POLITICAL/REPUTATIONAL RISK
Proposals of federal and state governments, or of various political officials or candidates, affecting the student loan industry in particular, subject us to political risk and could have a material adverse impact on our business, results of operations, financial condition, and/or cash flows.
We operate in an environment of heightened political and regulatory scrutiny of education loan lending, servicing, and originations. The rising cost of higher education, questions regarding the quality of education provided, and the increasing amount of student loan debt outstanding in the United States have sustained this heightened and ongoing scrutiny. This environment could lead to further proposals by federal and state legislators and regulators, and/or political officials or candidates, and to the enactment of laws, regulations, and/or executive orders applicable to, or limiting, our business. Further, the regulatory environment at the state level has shifted such that some states recently have enacted new legislation specifically restricting the conduct and practices of student loan servicers. The enactment of any proposed legislation or policies like those described above, even if they do not apply specifically to Private Education Loans, could have a material adverse impact on our business, results of operations, financial condition, and/or cash flows. In addition, the continued ongoing publicity regarding these various proposals, even if they are not enacted, could negatively impact the market price of our common stock.
2024 Form 10-K — SLM CORPORATION 33
We are subject to reputational and other risks, which could damage our brand and have a material adverse impact on our business, results of operations, financial condition, and/or cash flows.
Our brand is very important to us and our business. Our reputation as an originator, servicer, seller, and securitizer of high-quality Private Education Loans and as a depository for online deposits is very dependent upon how our customers, our regulators, legislators, the education community, our employees, and the broader market perceive our business practices, financial heath, and integrity. In addition, the business practices, financial health, and integrity of the overall student loan market, other loan markets, or the market for online deposits, as applicable, could impact our reputation. Negative publicity, including as a result of our culture, actual or alleged conduct by us, our employees, or our vendors, or public opinion of the broader student loan industry or other relevant industries generally, could damage our reputation and business and adversely impact the price of our common stock or other securities.
Other matters that can impact our reputation, including, but not limited to, community impact and workforce issues, and our overall governance environment, may expose us to negative publicity based on the identity and activities of those with whom we do business and the public’s view of our approach and performance, and that of our business partners, regarding these matters. Such negative publicity could damage our relationships and reputation with our existing and prospective customers and third parties with whom we do business, have an adverse effect on our ability to attract and retain customers and employees, and have a negative impact on the demand for and market price of our securities. Stakeholders’ expectations are diverse and rapidly changing, and we may not be able to align our practices with such evolving expectations within the timeframes expected by stakeholders or without incurring significant costs.
Any negative publicity, including individual posts via social media, could “go viral”, causing potentially significant harm to our brand and reputation, and our business, whether or not factually accurate.
Additionally, as described above, proposals of political candidates, administrations, or legislators that may affect the financial industry, or the student loan industry, in particular, could impact our reputation and/or business and adversely impact the price of our common stock.
Any internal, market, or other developments, including those relating to our competitors or our business, that result in a negative impact on our brand or reputation or the reputation of the student loan industry or other relevant industries could have an adverse effect on our ability to originate, service, sell, securitize, and retain Private Education Loans, as applicable, result in greater regulatory, legislative, and media scrutiny, increase our risk of litigation and regulatory sanctions or other actions, and have a material adverse effect on our financial condition and/or results of operations.
OPERATIONAL RISKS
Failure or significant interruption of our operating systems or infrastructure or the inability to adapt to changes could disrupt our business, cause significant losses, result in regulatory action or litigation, or damage our reputation.
Our business is dependent on our ability to process and monitor large numbers of transactions in compliance with legal and regulatory standards and our product specifications. As processing demands change and our loan portfolio grows in both volume and differing terms and conditions, developing and maintaining our operating systems and infrastructure become increasingly challenging. There is no assurance we can adequately or efficiently develop, maintain, or acquire access to such systems and infrastructure.
Our loan originations and deposits and the servicing, financial, accounting, data processing, communications, or other operating systems, processes, and facilities that support them may fail to operate properly, become disabled as a result of events beyond our control, or be unable to be rapidly configured to timely address regulatory changes or other business requirements, in each case potentially adversely affecting our ability to process these transactions adequately. Any such failure could adversely affect our ability to service our customers, result in financial loss or liability to our customers and investors, disrupt our business, result in regulatory action or litigation, or cause reputational damage. Despite the plans we have in place from time to time, our ability to operate may be adversely affected by a disruption in the infrastructure that supports our businesses. Notwithstanding our efforts to maintain business continuity, a disruptive event impacting our processing locations, a failure to adequately anticipate the level of staffing or effort needed to efficiently and effectively communicate with and service our
2024 Form 10-K — SLM CORPORATION 34
customers or to service and collect on our loans, or another similar operational event could adversely affect our business, financial condition, results of operations, and/or cash flows.
Our business processes are becoming increasingly dependent upon technological advancement, and we could lose market share if we are not able to keep pace with rapid changes in technology.
Our future success depends, in part, on our ability to underwrite and approve loans, process loan applications and payments, and provide other customer services, in a safe, automated manner with high-quality service standards. The volume of loan originations we are able to process is reliant on the systems and processes we have implemented and developed. These systems and processes are becoming increasingly dependent upon technological advancement, such as the ability to process loans and payments over the internet or mobile applications, accept electronic signatures, and provide initial decisions instantly. Our future success also depends, in part, on our ability to develop and implement technology solutions that keep pace with continuing changes in technology, industry standards, and client preferences, including FinTech developments. We may not be successful in anticipating or responding to these developments in a timely manner. We have made, and need to continue to make, investments in our technology platform to provide competitive products and services and to reduce the number of manual processes we employ. We may be required to expend significant funds to develop or acquire new technologies. If competitors introduce products, services, and systems that are better than ours or that are more cost-effective or that gain greater market acceptance, we could lose market share. Any one of these circumstances could have a material adverse effect on our business reputation and ability to obtain and retain clients and, therefore, could materially adversely affect our business, financial condition, and/or results of operations.
We depend on secure information technology and a breach of those systems or those of third-party vendors could result in significant losses, unauthorized disclosure of confidential customer information, and reputational damage, which could materially adversely affect our business, financial condition, and/or results of operations and could lead to significant financial, legal, and reputational exposure.
Our operations rely on the secure collection, processing, storage, and transmission of personal, confidential, and other information in a significant number of customer transactions on a continuous basis through our computer systems and networks and those of our third-party service providers. Information security risks for financial institutions and third-party service providers have increased in recent years and continue to evolve in part because of the proliferation of new technologies, the use of the internet and telecommunications technologies to conduct financial transactions, and the increased sophistication and activities of organized crime, hackers, terrorists, activists, and other external parties, including foreign state-sponsored actors. These parties also may fraudulently induce employees, customers, and others who use our or our service providers’ systems or have access to our or our customers’ data, to gain access to our and our customers’ data or our assets.
We and our service providers face constant threats to our systems and data and continuously experience cyberattacks and other security incidents. While we continue to evolve our security controls to improve our ability to prevent, detect, and respond to the continually changing threats, we may be required to expend significant additional resources in the future to enhance our security controls in response to new or more sophisticated threats, as well as new regulations related to cybersecurity. Additionally, while we and our third-party service providers commit resources to the design, implementation, maintenance, security, and monitoring of our networks and systems, there is no guarantee that our security controls, or those of our third-party service providers, will protect against all threats.
Despite the measures we and our third-party service providers implement to protect our systems and our or our customers’ data, we may not be able to anticipate, prevent, or detect cyberattacks, particularly because the techniques used by attackers change frequently or are not recognized until launched, and because cyberattacks can originate from a wide variety of sources, including third parties who are or may be involved in organized crime or linked to terrorist organizations or hostile foreign governments. Such third parties may seek to gain unauthorized access to our systems either directly or using equipment or security passwords belonging to employees, customers, third-party service providers, or other users of our systems or those of our third-party service providers. Or, they may seek to disrupt or disable our or our service providers’ services through attacks such as denial-of-service and ransomware attacks. In addition, we or our service providers may be unable to identify, or may be significantly delayed in identifying, cyberattacks and incidents due to the increasing use of techniques and tools that are designed to circumvent controls, to avoid detection, and to remove or obfuscate forensic artifacts. As a result, our computer systems, software, and networks, as well as those of third-party vendors we utilize, may be vulnerable to unauthorized access, computer viruses, malware attacks, and other events that could have a security impact
2024 Form 10-K — SLM CORPORATION 35
beyond our control. We also routinely transmit and receive personal, confidential, and proprietary information, some through third parties, which may be vulnerable to interception, misuse, or mishandling. This risk may be heightened by our hybrid work environment, which may lead to unanticipated issues arising from handling personal, confidential, and other information from a work-from-home environment.
If one or more of such events occur, personal, confidential, and other information processed by, stored in, or transmitted through, our computer systems and networks, or those of third-party vendors, could be compromised or could cause interruptions or malfunctions in our or our customers’ or service providers’ operations that could result in significant losses, loss of business by us and loss of confidence in us, customer dissatisfaction, significant litigation, regulatory exposures, and harm to our reputation and brand. In addition, we may be required to expend significant resources to modify our protective measures, to investigate the circumstances surrounding the event, and implement mitigation and remediation measures. We also may be subject to fines, penalties, litigation (including securities fraud class action lawsuits) and regulatory investigation costs and settlements and other financial losses. If one or more of such events occur, our business, financial condition, and/or results of operations could be significantly and adversely affected.
While we seek to mitigate cyber and related risks associated with outsourcing to third-party service providers, including through our vendor management processes, both operational and technological cyber risks remain, and certain risks are beyond our security and control systems. Cyberattacks targeted at our service providers or in other areas of our business chain may result in unauthorized interception, misuse, mishandling, access, acquisition, loss, or destruction of our or our customers’ data, or may affect the availability of our services, and impose costs and other liabilities that significantly and adversely affect us in the ways discussed above.
While we maintain insurance coverage that may apply to various cybersecurity risks and liabilities, there is no guarantee that any or all costs or losses incurred would be partially or fully covered.
We depend significantly on third parties for a wide array of our operations and customer services and key components of our information technology infrastructure, and a breach of security or service levels, or violation of law by one of these third parties, could disrupt our business or provide our competitors with an opportunity to enhance their position at our expense.
We depend significantly on third parties for a wide array of our operations and customer services and key components of our information technology and security infrastructures. Third-party vendors are significantly involved in aspects of our servicing for Private Education Loans, Bank deposit-taking activities, payroll software and systems development, data center and operations, including the timely and secure transmission of information across our data communication network, and for “cloud” computing services and other telecommunications, email, processing, storage, remittance, and technology-related services in connection with our business. If a service provider fails to provide the services we require or expect, or fails to meet applicable regulatory or contractual requirements, such as service levels, protection of our customers’ personal and confidential information, or compliance with applicable laws, that failure could negatively impact our business by adversely affecting our ability to process customers’ transactions in a timely and accurate manner, otherwise hampering our ability to serve our customers and investors, or subjecting us to litigation and regulatory risk for matters as diverse as poor vendor oversight, improper release or protection of personal information, or release of incorrect information. Such a failure could adversely affect the perception of the reliability of our networks and services, and the quality of our brand, and could materially adversely affect our business, financial condition, and/or results of operations.
We may face risks from our operations related to litigation or regulatory or supervisory actions that could result in significant legal expenses and settlement or damage awards.
From time to time, in the ordinary course of our business, we face litigation alleging violations of consumer protection, securities, employment, and other laws. Defending against such litigation, or regulatory or supervisory actions, may require significant attention and resources of management and, regardless of the outcome, such actions could result in significant expenses. If we are a party to material litigation or regulatory or supervisory actions and if the defenses we assert are ultimately unsuccessful, or if we are unable to achieve a favorable outcome, we could be liable for large damages, penalties, or other costs or charge-offs and that could have a material adverse effect on our business, results of operations, and/or financial condition.
2024 Form 10-K — SLM CORPORATION 36
Our internal controls over financial reporting and disclosure controls, as well as other internal controls, may be ineffective, which could have a material adverse effect on our financial condition and/or results of operations.
Our management is responsible for maintaining, regularly assessing, and, as necessary, making changes to our internal controls over financial reporting and our disclosure controls. Nevertheless, our internal controls over financial reporting and our disclosure controls can provide only reasonable assurances regarding the reliability of our financial reporting and the preparation of our financial statements for external purposes in accordance with generally accepted accounting principles in the United States (“GAAP”) and may not prevent or detect misstatements. Any failure or circumvention of our internal controls over financial reporting or our disclosure controls, failure to comply with rules and regulations related to such controls, or failure to make sound and appropriate application of the criteria established in the framework set forth in Internal Control-Integrated Framework (2013) issued by the Committee of Sponsoring Organizations of the Treadway Commission could have a material adverse effect on our financial condition and/or results of operations.
Other internal controls, including fraud detection and controls, and corporate governance procedures also are based on the assumption that they can provide only reasonable, not absolute, assurances the objectives of the controls and procedures are met. Any failure or circumvention of controls and procedures, including as a result of human error, malfeasance of employees or third parties, or other misconduct by employees or third parties, can result in legal risk and reputational harm and have a material adverse effect on our business, financial condition, and/or results of operations.
Our business operations and those of our third-party vendors may be adversely impacted by political events, terrorism, cyberattacks, public health issues (including pandemics), natural disasters, severe weather, climate change, infrastructure failure or outages, labor disputes, business interruptions, and other unpredictable catastrophic events.
Our business operations and those of our third-party vendors are subject to interruption by, among other things, geopolitical events, terrorism, cyberattacks, public health issues (including pandemics), natural disasters, severe weather, climate change, infrastructure failure or outages, labor disputes, and other unpredictable catastrophic events, which could make it difficult or impossible for us to deliver a satisfactory experience to our customers or could decrease demand for our products and services.
Any of the unpredictable catastrophic events discussed above could affect the stability of our deposit base, impair the ability of our borrowers and cosigners to repay their outstanding loans, cause significant property damage, and result in loss of revenue and/or cause us to incur additional expenses. The occurrence of any such event could have a material adverse impact on our business, financial condition, results of operations, and/or cash flows.
New lines of business or new products and services may subject us to additional risks. Additionally, our ability to successfully make acquisitions is subject to significant risks, including the risk that governmental authorities may not provide any requisite approvals, the risk that integrating acquisitions may be more difficult, costly, or time consuming than expected, and the risk that the value of acquisitions may be less than anticipated.
From time to time, we may implement or acquire new lines of business or offer new products and services, or enter into new business arrangements with third-party service providers, alternative payment providers, or other industry participants. We may face compliance and regulatory risks in each of those cases. We also may from time to time seek to acquire other financial services companies or businesses that complement our business strategy. These acquisitions may be subject to regulatory approval in some instances, and no assurance can be provided that we will be able to obtain that approval in a timely manner or at all or that approval may not be subject to burdensome conditions. Even if we are able to obtain any required regulatory approval, the failure of other closing conditions to be satisfied or waived could delay the completion of an acquisition for a significant period of time or prevent it from occurring altogether. Any failure or delay in closing an acquisition could adversely affect our reputation, business, and performance.
Acquisitions and/or implementation of new lines of business, products, or services involve numerous risks and uncertainties, including inaccurate financial and operational assumptions, incomplete or failed due diligence, lower-than-expected performance, higher-than-expected costs, difficulties related to integration, diversion of
2024 Form 10-K — SLM CORPORATION 37
management’s attention from other business activities, adverse market or other reactions, changes in relationships with customers or counterparties, the potential loss of key personnel, and the possibility of litigation and other disputes. An acquisition also could be dilutive to our existing stockholders if we were to issue common stock to fully or partially pay or fund the purchase price. Moreover, we may not be successful in identifying appropriate acquisition candidates, integrating acquired businesses or companies, or realizing expected value from acquisitions or new lines of business, products, or services. Significant competition exists for valuable acquisition targets, and we may not be able to acquire other businesses or companies on attractive terms. No assurance can be given that we will pursue future acquisitions, and our ability to grow and successfully compete may be impaired if we choose not to pursue or are unable to successfully make acquisitions or implement new lines of business, products, or services.
RISKS RELATED TO SPIN-OFF
We may have exposure to risks related to the Spin-Off, indemnification claims, and/or Navient’s creditworthiness.
In connection with the Spin-Off, we entered into a Separation and Distribution Agreement with Navient (the “Separation and Distribution Agreement”). We also entered into various other ancillary agreements with Navient, including a tax sharing agreement, to effect the Spin-Off and provide a framework for our relationship with Navient thereafter. Pursuant to the terms of the Separation and Distribution Agreement, and as contemplated by the structure of the Spin-Off, Navient is legally responsible for, and obligated to indemnify the Bank against, all claims, actions, damages, losses, or expenses that may arise from the conduct of all activities of pre-Spin-Off SLM occurring prior to the Spin-Off, except for certain liabilities specifically assumed by the Bank in the agreement as to which the Bank would be obligated to indemnify Navient.
The Bank and Navient entered into the above-referenced tax sharing agreement to govern the respective rights, responsibilities, and obligations of the parties after the Spin-Off relating to taxes, including with respect to the payment of taxes, the preparation and filing of tax returns, and the conduct of tax contests. Under this agreement, each party is generally liable for taxes attributable to its business. The agreement also addresses the allocation of tax liabilities that are incurred as a result of the Spin-Off and related transactions. While the statutes of limitation on the tax periods covered by the tax sharing agreement have largely run, any trailing tax liabilities associated with past periods could impact our business, financial condition, and/or results of operations.
The Separation and Distribution Agreement and tax sharing agreement provide specific processes and procedures pursuant to which claims for indemnification may be submitted. Any financial liability or litigation costs resulting from an indemnification claim made against or by Navient could have a material adverse impact on our business, financial condition, and/or results of operations. Additionally, if Navient is unable or unwilling to pay claims that we make against it, our financial condition, results of operations, and/or cash flows could be materially and adversely affected over time.
GENERAL RISKS
The holders of our preferred stock have rights that are senior to those of our common stockholders.
At December 31, 2024, we had issued and outstanding 2.5 million shares of our Series B Preferred Stock. Our Series B Preferred Stock is senior to our shares of common stock in right of payment of dividends and other distributions. Generally, we must be current on dividends payable to holders of our Series B Preferred Stock before any dividends can be paid on our common stock. We also must comply with certain provisions that are protective of the Series B Preferred Stock in order to effectuate any repurchases under our common stock share repurchase program. In the event of our bankruptcy, dissolution, or liquidation, the holders of our Series B Preferred Stock must be satisfied before any distributions can be made to our common stockholders.
2024 Form 10-K — SLM CORPORATION 38
We may be limited in our ability to receive dividends from the Bank, pay dividends on and repurchase our common stock, and make payments on our corporate debt.
The declaration and payment of future common stock dividends, as well as the amount thereof, are subject to determination by, and the discretion of, our Board of Directors. In addition, we may change our policy regarding the payment of dividends and reduce or eliminate our common stock dividend in the future, which could adversely affect the market price of our common stock.
Our share repurchase programs permit us to repurchase from time to time shares of our common stock up to an aggregate repurchase price not to exceed the authorized limits described in this Form 10-K. We may not be able to sell loans at prices, in volumes, or on a schedule, that will provide us with sufficient funds to effect share repurchases under our share repurchase programs. Additionally, we may pause or discontinue our share repurchase programs for other reasons, such as legal or regulatory considerations, or because we decide to allocate available funds for other corporate priorities. The timing and volume of any repurchases will be subject to market conditions, and there can be no guarantee that we will repurchase up to the limit of any program or at all, which could adversely affect the market price of our common stock.
We are dependent on funds obtained from the Bank to fund corporate debt payments, dividend payments, and any share repurchases. Regulatory and other legal restrictions may limit our ability to transfer funds freely, either to or from our subsidiaries. In particular, the Bank is subject to laws and regulations that authorize regulatory bodies to block or reduce the flow of funds to us, or that prohibit such transfers altogether in certain circumstances. These laws, regulations, and rules may hinder our ability to access funds that we may need to make payments in respect of our stock or to satisfy our other responsibilities. The FDIC has the authority to prohibit or limit the payment of dividends by the Bank and SLM Corporation.
Our business could be negatively affected if we are unable to attract, retain, and motivate skilled employees.
Our success depends, in large part, on our ability to retain key senior leaders and to attract and retain skilled employees and subject matter experts. We depend on our senior leaders and skilled employees and subject matter experts to oversee initiatives across the enterprise and execute on our business plans in an efficient and effective manner. Competition for such senior leaders and employees, and the cost associated with attracting and retaining them, is high. Recent scrutiny of compensation in the financial services industry has introduced additional challenges in this area. Our ability to attract and retain qualified employees also is affected by perceptions of our culture and management, our profile in the regions where we have offices, and the professional opportunities we offer. We rely upon our senior leaders not only for business success, but also to lead with integrity. To the extent our senior leaders behave in a manner that does not comport with our values, the consequences to our brand and reputation could be severe and could adversely affect our financial condition and results of operations. If we are unable to attract, develop, and retain talented senior leadership and employees, or to implement appropriate succession plans for our senior leadership and subject matter experts, our business could be negatively affected.
Item 1B. Unresolved Staff Comments
None.
2024 Form 10-K — SLM CORPORATION 39
Item 1C. Cybersecurity
Cybersecurity Risk Management and Strategy
We have developed and implemented a cybersecurity risk management program intended to protect the confidentiality, integrity, and availability of our critical systems and information. Our cybersecurity risk management program includes a cybersecurity incident response standard.
We use the Cyber Risk Institute Profile (which is based on the National Institute of Standards and Technology Cybersecurity Framework), the Federal Financial Institutions Examination Council Information Technology Examination Handbook, and the Payment Card Industry Data Security Standards as guides to help us identify, assess, and manage cybersecurity risks relevant to our business and develop and implement our cybersecurity risk management program. This does not imply that we meet any particular technical standards, specifications, or requirements.
Our cybersecurity risk management program is integrated with our overall enterprise risk management program, and shares common methodologies, reporting channels, and governance processes that apply across the enterprise risk management program to other legal, compliance, strategic, operational, and financial risk areas.
Our cybersecurity risk management program includes the following key elements:
•risk assessments designed to help identify material cybersecurity risks to our critical systems, information, services, and our broader enterprise information technology (“IT”) environment;
•a team comprised of IT security, IT infrastructure, and IT compliance personnel principally responsible for directing (i) our cybersecurity risk assessment processes, (ii) our security processes, and (iii) our response to cybersecurity incidents;
•the use of external cybersecurity service providers, where appropriate, to assess, test, or otherwise assist with aspects of our security processes;
•cybersecurity awareness training of employees with access to our IT systems;
•a cybersecurity incident response standard and Crisis Management Policy that guide our response to cybersecurity incidents; and
•a third-party risk identification and management process for service providers.
We face certain ongoing risks from cybersecurity threats that, if realized, are reasonably likely to materially affect us, including our operations, business strategy, results of operations, and/or financial condition. See Item 1A. “Risk Factors – OPERATIONAL RISKS – We depend on secure information technology and a breach of those systems or those of third-party vendors could result in significant losses, unauthorized disclosure of confidential customer information, and reputational damage, which could materially adversely affect our business, financial condition, and/or results of operations and could lead to significant financial, legal, and reputational exposure” in this Form 10-K.
Cybersecurity Governance
Our Board of Directors considers cybersecurity risk as critical to the enterprise and delegates the cybersecurity risk oversight function to the Operational and Compliance Risk Committee of the Board. The Operational and Compliance Risk Committee of our Board of Directors oversees management’s design, implementation, and enforcement of our cybersecurity risk management program.
Our Chief Security Officer (“CSO”) reports to our Chief Operational Officer and President of the Bank and leads the Company’s overall cybersecurity function. Our CSO provides periodic updates on our cybersecurity risk management program to the management-level Operational and Compliance Risk Committee (“OCRC”) and Executive Committee (“EC”). The Operational and Compliance Risk Committee of our Board of Directors also receives periodic reports from our CSO on our cybersecurity risks, including briefings on our cyber risk management program and cybersecurity incidents.
Our CSO supervises efforts to prevent, detect, mitigate, and remediate cybersecurity risks and incidents through various means, which include: briefings from internal security personnel; threat intelligence and other
2024 Form 10-K — SLM CORPORATION 40
information obtained from governmental, public, or private sources, including external cybersecurity service providers; and alerts and reports produced by security tools deployed in the IT environment.
Our CSO is responsible for assessing and managing our material risks from cybersecurity threats, has primary responsibility for leading our overall cybersecurity risk management program, and supervises both our internal cybersecurity personnel and our external cybersecurity service providers. Our CSO has significant executive experience in managing and leading IT and cybersecurity teams in both government and the private sector and has received industry recognition in the cybersecurity area. Our CSO holds cybersecurity certifications from leading cybersecurity training and research institutes, is a Fellow at the National Security Institute, and is a member of the Board of Directors of the Financial Services Information Sharing and Analysis Center.
Item 2. Properties
The following table lists the principal facility owned by us as of December 31, 2024:
| | | | | | | | | | | | | | |
| Location | | Function | | Approximate
Square Feet |
| Newark, DE | | Headquarters | | 160,000 |
The following table lists the principal facilities leased by us as of December 31, 2024:
| | | | | | | | | | | | | | |
| Location | | Function | | Approximate
Square Feet |
| Indianapolis, IN | | Administrative Offices | | 115,000 |
| New Castle, DE | | Loan Servicing Center | | 125,000 |
| Sterling, VA | | Administrative Offices | | 27,000 |
| Newton, MA | | Administrative Offices | | 14,000 |
| Salt Lake City, UT | | Sallie Mae Bank | | 17,000 |
Our headquarters is currently located in owned space, unencumbered by a mortgage, at 300 Continental Drive, Newark, Delaware, 19713.
2024 Form 10-K — SLM CORPORATION 41
Item 3. Legal Proceedings
The information required by this Item is set forth in the “Commitments, Contingencies, and Guarantees” discussion in Note 18 of the accompanying Notes to the Consolidated Financial Statements in this Annual Report on Form 10-K, which discussion is included in Item 8 of this Report, and is incorporated herein by reference in response to this Item.
Item 4. Mine Safety Disclosures
N/A
PART II.
Item 5. Market for Registrant’s Common Equity, Related Stockholder Matters, and Issuer Purchases of Equity Securities
Our common stock is listed and trades on the NASDAQ Global Select Market (“Nasdaq”) under the symbol SLM. As of January 31, 2025, there were 210,423,462 shares of our common stock outstanding and approximately 239 holders of record.
We paid quarterly cash dividends on our common stock of $0.11 per share for the first, second, and third quarters of 2024, respectively, and $0.13 per share for the fourth quarter of 2024. We paid quarterly cash dividends on our common stock of $0.11 per share for each quarter of 2023 and 2022. Common stock dividend declarations are subject to determination by, and the discretion of, our Board of Directors. We may change our common stock dividend policy at any time. See Item 1A. “Risk Factors — GENERAL RISKS” for possible limitations on the payments of our dividends.
The information contained in the definitive proxy statement on Schedule 14A for our 2025 annual meeting of shareholders (the “2025 Proxy Statement”), including information appearing in the section titled “Equity Plan Compensation Information”, is incorporated herein by reference.
Issuer Purchases of Equity Securities
The following table provides information relating to our purchase of shares of our common stock in the three months ended December 31, 2024.
| | | | | | | | | | | | | | | | | | | | | | | | | | |
(Dollars in thousands,
except per share data) | | Total Number of Shares Purchased(1) | | Average Price Paid per Share | | Total Number of Shares Purchased as Part of Publicly Announced Plans or Programs(2)(3) | | Approximate Dollar Value of Shares That May Yet Be Purchased Under Publicly Announced Plans or Programs at December 31, 2024(2) |
| Period: | | | | | | | | |
| October 1 - October 31, 2024 | | 1,582,502 | | | $ | 22.90 | | | 1,569,378 | | | $412,000 |
| November 1 - November 30, 2024 | | 433,180 | | | $ | 23.58 | | | 431,330 | | | $402,000 |
| December 1 - December 31, 2024 | | 8,590 | | | $ | 27.13 | | | — | | | $402,000 |
| Total fourth-quarter 2024 | | 2,024,272 | | | $ | 23.07 | | | 2,000,708 | | | |
(1) The total number of shares purchased includes: (i) shares purchased under the stock repurchase programs discussed herein, and (ii) 23,564 shares of our common stock tendered to us to satisfy the exercise price in connection with cashless exercises of stock options, and tax withholding obligations in connection with exercises of stock options and vesting of restricted stock, restricted stock units, and performance stock units.
(2) As of December 31, 2024, we had $402 million of capacity remaining under the 2024 Share Repurchase Program. The 2024 Share Repurchase Program was announced on January 24, 2024, with an effective date of January 26, 2024, and expires on February 6, 2026. See Notes to Consolidated Financial Statements, Note 12, “Stockholders’ Equity” in this Form 10-K for further discussion.
(3) In the fourth quarter of 2024, we repurchased 2.0 million common shares under our 10b5-1 trading plans. See Notes to Consolidated Financial Statements, Note 12, “Stockholders’ Equity” in this Form 10-K for further discussion.
2024 Form 10-K — SLM CORPORATION 42
The closing price of our common stock on Nasdaq on December 31, 2024 was $27.58.
In January 2020, we announced a share repurchase program of up to $600 million of common stock. This program expired in January 2022. In January 2021, we announced an additional share repurchase program of up to $1.25 billion of common stock (the “2021 Share Repurchase Program”) that expired in January 2023. In October 2021, our Board of Directors approved a $250 million increase in the amount of common stock that could be repurchased under the 2021 Share Repurchase Program, resulting in a total authorization of $1.5 billion of common stock. In January 2022, we announced a share repurchase program of up to $1.25 billion of common stock that expired in January 2024.
In January 2024, we announced a new share repurchase program of up to $650 million of common stock (the “2024 Share Repurchase Program”). The program expires in February 2026. We had $402 million of capacity remaining under the 2024 Share Repurchase Program as of December 31, 2024.
Under the above share repurchase programs, repurchases could occur from time to time and through a variety of methods, including open market repurchases, repurchases effected through Rule 10b5-1 trading plans, negotiated block purchases, accelerated share repurchase programs, tender offers, or other similar transactions. The timing and volume of any repurchases are subject to market conditions, and there can be no guarantee that the Company will repurchase up to the limit of the 2024 Share Repurchase Program.
Stock Performance
The following graph compares the five-year cumulative total returns of SLM Corporation, the S&P Supercomposite Consumer Finance Sub-Industry Index, and the S&P 400 Regional Bank Sub-Industry Index.
This graph assumes $100 was invested in the stock or the relevant index on December 31, 2019, and also assumes the reinvestment of dividends through December 31, 2024.
Five-Year Cumulative Total Stockholder Return
| | | | | | | | | | | | | | | | | | | | |
| Company/Index | 12/31/19 | 12/31/20 | 12/31/21 | 12/31/22 | 12/31/23 | 12/31/24 |
| SLM Corporation | $100.0 | | $140.9 | | $226.1 | | $195.7 | | $232.2 | | $342.0 | |
| S&P Supercomposite Consumer Finance Sub-Industry Index | 100.0 | | 100.8 | | 137.7 | | 110.9 | | 142.5 | | 215.2 | |
| S&P 400 Regional Bank Sub-Industry Index | 100.0 | | 91.4 | | 129.5 | | 124.1 | | 123.0 | | 143.9 | |
Source: FactSet data and analytics
2024 Form 10-K — SLM CORPORATION 43
Item 6. [Reserved]
2024 Form 10-K — SLM CORPORATION 44
Item 7. Management’s Discussion and Analysis of Financial Condition and Results of Operations
The following discussion and analysis should be read in conjunction with our consolidated financial statements and related notes included elsewhere in this Annual Report on Form 10-K. This discussion and analysis also contains forward-looking statements and should be read in conjunction with the disclosures and information contained in “Forward-Looking and Cautionary Statements” and Part I, Item 1A. “Risk Factors” in this Annual Report on Form 10-K.
Through this discussion and analysis, we intend to provide the reader with some narrative context for how our management views our consolidated financial statements, additional context within which to assess our operating results, and information on the quality and variability of our earnings, liquidity, and cash flows.
Overview
The following discussion and analysis presents a review of our business and operations as of and for the year ended December 31, 2024.
Strategic Imperatives
To focus our business and increase shareholder value, we continue to advance our strategic imperatives. Our primary focus remains on maximizing the profitability and growth of our core private student loan business, while harnessing and optimizing the power of our brand and attractive client base. In addition, we continue to seek to better inform the external narrative about student lending and Sallie Mae, and strive to maintain a rigorous and predictable capital allocation and return program to create shareholder value. We are focused on driving a mission-led culture that continues to make Sallie Mae a great place to work, while we continue to strengthen our risk and compliance functions, enhance and build upon our risk management framework, and assess and monitor enterprise-wide risk.
Key Financial Measures
Set forth below are brief summaries of our key financial measures. Our operating results are primarily driven by net interest income from our Private Education Loan portfolio, gains and losses on loan sales, provision expense for credit losses, and operating expenses. The growth of our business and the strength of our financial condition are primarily driven by our ability to achieve our annual Private Education Loan origination goals while sustaining credit quality and maintaining cost-efficient funding sources to support our originations.
Net Interest Income and Net Interest Margin
Most of our earnings are generated from the interest income earned on assets in our education loan portfolios, net of the interest expense we pay on the funding for those loans. We report these earnings as net interest income. The majority of our interest income comes from our Private Education Loan portfolio.
We also often refer to the net interest margin, which is the net interest yield earned on our interest-earning assets less the rate paid on our related interest-bearing liabilities. As interest rates change, changes in the cost of our interest-bearing liabilities tend to lag slightly compared to changes in the yields on our interest-earning assets, which could impact our net interest margin in any given period.
Loan Sales and Secured Financings
We may sell loans to third parties through whole loan sales, securitizations, or other similar transactions. We typically retain servicing of loans subsequent to their sale and earn revenue for this servicing at prevailing market rates for such services. Selling loans removes the loan assets from our balance sheet and helps us manage our asset growth, capital, and liquidity needs. Alternatively, we may use loans as collateral in connection with the creation of asset-backed securitizations or secured funding facilities structured as financings. These types of transactions may provide us long-term financing, but they do not remove loan assets from our balance sheet, nor do they generate gains on sales of loans, net. Consequently, our operating results may be significantly affected by whether we choose to sell loans and recognize current gains on sale or continue to hold or finance loans, thereby retaining some or all the net interest income from those loans. In 2024, we recognized $255 million in gains from the sale of approximately $3.69 billion of our Private Education Loans, including $3.42 billion of principal and $274 million in capitalized interest, to unaffiliated third parties.
2024 Form 10-K — SLM CORPORATION 45
For additional information regarding these transactions, see Notes to Consolidated Financial Statements, Note 5, “Loans Held for Investment” and Note 10, “Borrowings - Unconsolidated Funding Vehicles” in this Form 10-K.
During the third quarter of 2024, we transferred our remaining FFELP Loan portfolio to loans held for sale and subsequently sold the FFELP Loan portfolio to an unaffiliated third party in the fourth quarter of 2024. We wrote down the FFELP Loan portfolio to its estimated fair value through an adjustment to the allowance for credit losses of $8 million in 2024. For additional information, see Notes to Consolidated Financial Statements, Note 5, “Loans Held for Investment.”
Allowance for Credit Losses
Management estimates and maintains an allowance for credit losses for the lifetime expected credit losses on loans in our portfolios, as well as for future loan commitments, at the reporting date. See “ — Critical Accounting Policies and Estimates — Allowance for Credit Losses” in this Item 7. Allowances for credit losses are an important indicator of management’s perspective on the future performance of a loan portfolio. Each quarter, management makes an adjustment to the allowance for credit losses to reflect its most up-to-date estimate of future losses by recording a charge against quarterly revenues known as provision expense. As they occur, actual loan charge-offs and recoveries are then charged or credited, respectively, against the allowance for credit losses rather than against earnings.
The allowance for credit losses and provision expense rise in periods of high loan origination, when future charge-offs are expected to increase, and fall when future charge-offs are expected to decline. We bear the full credit exposure on our Private Education Loans. Losses on our Private Education Loans are affected by risk characteristics such as loan status (in-school, grace, forbearance, repayment, and delinquency), loan seasoning (number of months in active repayment), underwriting criteria (e.g., credit scores), presence of a cosigner, servicing and collections practices, and the current economic environment. See Item 1A “Risk Factors — CREDIT RISK — Defaults on our loans could adversely affect our business, financial condition, results of operations, and/or cash flows” for additional information. Losses typically emerge once a borrower separates from school and enters full principal and interest repayment after the borrower’s grace period (six months, typically) ends. As a larger proportion of our Private Education Loan portfolio enters full principal and interest repayment in the coming years, we would expect the dollar amount of charge-offs to increase.
Prior to the sale of our remaining FFELP Loan portfolio in the fourth quarter of 2024, our allowance for credit losses for FFELP Loans and related periodic provision expense was small because we generally bore a maximum of three percent loss exposure due to the federal guarantee on such loans. We maintained an allowance for credit losses for our FFELP Loans at a level sufficient to cover lifetime expected credit losses.
Charge-Offs and Delinquencies
Delinquencies are another important indicator of potential future credit performance. Private Education Loans are charged off at the end of the month in which they reach 120 days delinquent or otherwise when the loans are classified as a loss by us or our regulator. Charge-off data provides relevant information with respect to the actual performance of a loan portfolio over time. Management focuses on delinquencies as well as the progression of loans from early to late stage delinquency as a key metric in estimating the allowance for credit losses and tailoring its future collections strategies. We sell a segment of defaulted loans immediately after charge-off, and use in-house collectors and third-party collectors to collect on retained defaulted loans.
Operating Expenses
The cost of operating our business directly affects our profitability. We strive to manage growth in our business in a prudent fashion by focusing on investments to improve efficiency. We monitor and report internally various metrics, including cost to acquire and cost to service our loans (which include both owned and serviced loans), among others. The cost to acquire is affected by such variables as technology, personnel, and marketing costs. Servicing expenses primarily include compensation and benefit expenses related to our collections, customer support, and payment processing employees, and technology costs and other expenses associated with facilitating and servicing borrowers. Costs to service can vary period to period based upon seasonality and borrower payment status. The cost to service a delinquent borrower is significantly higher than the cost to service a current or in-school borrower.
Private Education Loan Originations
Private Education Loans are the principal asset on our balance sheet, and the amount of new Private Education Loan originations we generate each year is a key indicator of the trajectory of our business, including our future earnings and asset growth.
2024 Form 10-K — SLM CORPORATION 46
Funding Sources
Though we rely primarily on deposits and loan securitizations to fund our loan originations, we also have access to a multi-lender secured borrowing facility (the “Secured Borrowing Facility”) and, from time to time, we access the debt capital markets through unsecured bond issuances. For additional information, see “—Borrowings — Long-term Borrowings” below in this Item 7.
Deposits
We utilize brokered, retail, and other core deposits to meet funding needs and enhance our liquidity position. These deposits can be term or liquid deposits. Our term brokered deposits have original terms from three months to ten years. Retail deposits are sourced through a direct banking platform and serve as an important source of diversified funding. Brokered deposits are sourced through a network of brokers and provide a stable source of funding. In addition, we accept certain deposits considered non-brokered that are held in large accounts structured to allow FDIC insurance to flow through to underlying individual depositors. We further diversify our funding sources with deposits from Educational 529 savings plans and Health Savings plans.
Loan Securitizations
Term ABS financing provides long-term funding for our Private Education Loan portfolio at attractive interest rates and at terms that effectively match the average life of the assets. Loans associated with these transactions will remain on our balance sheet if we retain the residual interest in the related trusts.
2024 Form 10-K — SLM CORPORATION 47
Results of Operations
We present the results of operations below on a consolidated basis in accordance with GAAP.
GAAP Consolidated Statements of Income
| | | | | | | | | | | | | | | | | | | | | | | | | | | | | | | | | | | | | | | | | | | | |
Years ended December 31,
(dollars in millions, except per share amounts) | | | | | | | | Increase (Decrease) |
| | | 2024 vs. 2023 | | 2023 vs. 2022 |
| 2024 | | 2023 | | 2022 | | $ | | % | | $ | | % |
| Interest income: | | | | | | | | | | | | | | |
| Loans | | $ | 2,314 | | | $ | 2,327 | | | $ | 1,915 | | | $ | (13) | | | (1) | % | | $ | 412 | | | 22 | % |
| Investments | | 61 | | | 51 | | | 35 | | | 10 | | | 20 | | | 16 | | | 46 | |
| Cash and cash equivalents | | 243 | | | 214 | | | 82 | | | 29 | | | 14 | | | 132 | | | 161 | |
| Total interest income | | 2,619 | | | 2,592 | | | 2,032 | | | 26 | | | 1 | | | 560 | | | 28 | |
| Total interest expense | | 1,138 | | | 1,030 | | | 543 | | | 108 | | | 10 | | | 487 | | | 90 | |
| Net interest income | | 1,481 | | | 1,562 | | | 1,489 | | | (82) | | | (5) | | | 73 | | | 5 | |
| Less: provisions for credit losses | | 409 | | | 345 | | | 633 | | | 64 | | | 19 | | | (288) | | | (45) | |
| Net interest income after provisions for credit losses | | 1,072 | | | 1,217 | | | 855 | | | (145) | | | (12) | | | 362 | | | 42 | |
| Non-interest income: | | | | | | | | | | | | | | |
| Gains on sales of loans, net | | 255 | | | 160 | | | 328 | | | 95 | | | 59 | | | (168) | | | (51) | |
| Gains (losses) on securities, net | | — | | | 3 | | | (60) | | | (3) | | | (100) | | | 63 | | | 105 | |
| | | | | | | | | | | | | | |
| Other income | | 113 | | | 84 | | | 67 | | | 29 | | | 35 | | | 17 | | | 25 | |
| Total non-interest income | | 368 | | | 247 | | | 335 | | | 121 | | | 49 | | | (88) | | | (26) | |
| Non-interest expenses: | | | | | | | | | | | | | | |
| Total operating expenses | | 637 | | | 619 | | | 551 | | | 18 | | | 3 | | | 68 | | | 12 | |
| Acquired intangible assets impairment and amortization expense | | 5 | | | 66 | | | 8 | | | (61) | | | (92) | | | 58 | | | 725 | |
| | | | | | | | | | | | | | |
| Total non-interest expenses | | 642 | | | 685 | | | 559 | | | (43) | | | (6) | | | 126 | | | 23 | |
| Income before income tax expense | | 798 | | | 778 | | | 631 | | | 20 | | | 3 | | | 147 | | | 23 | |
| Income tax expense | | 190 | | | 197 | | | 162 | | | (7) | | | (4) | | | 35 | | | 22 | |
| Net income | | 608 | | | 581 | | | 469 | | | 27 | | | 5 | | | 112 | | | 24 | |
| Preferred stock dividends | | 18 | | | 18 | | | 9 | | | — | | | — | | | 9 | | | 100 | |
| Net income attributable to SLM Corporation common stock | | $ | 590 | | | $ | 564 | | | $ | 460 | | | $ | 26 | | | 5 | % | | $ | 104 | | | 23 | % |
| Basic earnings per common share | | $ | 2.73 | | | $ | 2.44 | | | $ | 1.78 | | | $ | 0.29 | | | 12 | % | | $ | 0.66 | | | 37 | % |
| Diluted earnings per common share | | $ | 2.68 | | | $ | 2.41 | | | $ | 1.76 | | | $ | 0.27 | | | 11 | % | | $ | 0.65 | | | 37 | % |
| Declared dividends per common share | | $ | 0.46 | | | $ | 0.44 | | | $ | 0.44 | | | $ | 0.02 | | | 5 | % | | $ | — | | | — | % |
Note: Due to rounding, amounts in this table may not sum to totals.
2024 Form 10-K — SLM CORPORATION 48
GAAP Consolidated Earnings Summary
Year Ended December 31, 2024 Compared with Year Ended December 31, 2023
For the year ended December 31, 2024, net income was $608 million, or $2.68 diluted earnings per common share, compared with net income of $581 million, or $2.41 diluted earnings per common share, for the year ended December 31, 2023. The year-over-year increase was primarily attributable to an increase in gains on sales of loans, net and other income and a decrease in total non-interest expense, which were offset by a decrease in total net interest income and an increase in provisions for credit losses.
The primary contributors to the drivers of change in net income for the current year period compared with the year-ago period are as follows:
•Net interest income in 2024 decreased by $82 million compared with the year-ago period primarily due to a 31-basis point decrease in our net interest margin and an $79 million decrease in average Private Education Loans and FFELP Loans outstanding. Our net interest margin decreased in the current period from the year-ago period primarily because our cost of funds increased more than the yields on our interest-earning assets. As interest rates change, changes in the cost of our interest-bearing liabilities tend to lag compared to changes in the yields on our interest-earning assets. In a rising interest rate environment, as we experienced in 2022 and the first part of 2023, our variable-rate interest earning assets repriced faster than our cost of funds. As such, we saw an expansion in our net interest margin throughout most of 2023. As interest rates stabilized in the latter half of 2023 and into the first half of 2024, our cost of funds increased faster than our interest-earning assets yields and reduced our net interest margin.
•Provision for credit losses in 2024 was $409 million, compared with $345 million in the year-ago period. During 2024, the increase in the provision for credit losses was primarily affected by new loan commitments, net of expired commitments, and changes in recovery rates. These drivers were offset by $236 million in negative provisions resulting from the approximately $3.69 billion Private Education Loan sales during 2024, an improved economic outlook, and changes in management overlays. In the year-ago period, the provision for credit losses was primarily affected by new loan commitments, net of expired commitments, slower prepayment rates, management overlays, and changes in economic outlook, which were partially offset by $205 million in negative provisions recorded as a result of the approximately $3.15 billion in Private Education Loan sales during 2023 and an increase in recovery rates (as the result of a 2023 change in our defaulted loan recovery process).
•Gains on sales of loans, net, were $255 million in 2024, compared with $160 million in the year-ago period. The increase in gains on sales of loans was primarily the result of selling approximately $3.69 billion of Private Education Loans in 2024, compared with the sale of approximately $3.15 billion of Private Education Loans in the year-ago period. Additionally, we received lower sales premiums in 2023 as compared to 2024 due to movement in market interest rates in 2023. We also sold our Credit Card loan portfolio in May 2023 and recorded a $4 million loss on the sale in 2023.
•Gains (losses) on securities, net, were less than $1 million in gains in 2024, compared with $3 million in gains in the year-ago period. The decrease from the year-ago period was due to the change in mark-to-fair value of our trading investments.
•Other income was $113 million in 2024, compared with $84 million in the year-ago period. The increase in other income compared with the year-ago period was primarily the result of a $21 million increase in third-party servicing fees from the year-ago period. The increase in third-party servicing fees was primarily due to an additional approximately $3.7 billion of sold loans that we continue to service on behalf of the owners of the loans. There was also a $3 million increase in early withdrawal penalty fee income in 2024 compared with the year-ago period, which was related to a health savings account provider that redeemed its deposits early and paid an early withdrawal penalty in the first quarter of 2024.
•For the year ended December 31, 2024, total operating expenses were $637 million, compared with $619 million in the year-ago period. The increase in total operating expenses was primarily driven by higher personnel costs, increased marketing costs, and higher FDIC assessment fees.
•In 2024, we recorded $5 million in impairment and amortization of acquired intangible assets, compared with $66 million in the year-ago period. The decrease is a result of the impairment write-down of the Nitro trade name intangible asset taken in the fourth quarter of 2023. For additional information, see Notes to Consolidated Financial Statements, Note 8, “Goodwill and Acquired Intangible Assets” in this Form 10-K.
2024 Form 10-K — SLM CORPORATION 49
•Income tax expense for the year ended December 31, 2024 was $190 million, compared with $197 million in the year-ago period. The effective tax rate decreased in 2024 to 23.8 percent from 25.3 percent in the year-ago period. The decrease in the effective rate for 2024 was primarily attributable to a decrease in state income taxes.
Year Ended December 31, 2023 Compared with Year Ended December 31, 2022
For the year ended December 31, 2023, net income was $581 million, or $2.41 diluted earnings per common share, compared with net income of $469 million, or $1.76 diluted earnings per common share, for the year ended December 31, 2022. The year-over-year increase was primarily attributable to less provisions for credit losses and an increase in total net interest income and other income, which were offset by decreases in gains on sales of loans, net, and higher operating expenses.
The primary contributors to each of the identified drivers of change in net income for 2023 compared with 2022 are as follows:
•Net interest income in 2023 increased by $73 million compared with 2022 primarily due to a $375 million increase in average Private Education Loans and FFELP Loans outstanding and a 19-basis point increase in our net interest margin. Our net interest margin increased in 2023 from 2022 because of the dramatic increase in interest rates in 2023. When interest rates rise, the yield on our interest-earning assets typically increases faster than our cost of funds. As such, as rates increased in 2023, we saw our net interest margin increase.
•Provision for credit losses in 2023 was $345 million, compared with $633 million in 2022. During 2023, the provision for credit losses was primarily affected by new loan commitments, net of expired commitments, slower prepayment rates, management overlays, and changes in economic outlook, which were partially offset by $205 million in negative provisions recorded as a result of the approximately $3.15 billion in Private Education Loan sales during 2023 and an increase in recovery rates (as the result of a change in our defaulted loan recovery process). In 2022, the provision for credit losses was primarily affected by new loan commitments made during the period, slower than expected prepayment rates, and additional management overlays, which were partially offset by negative provisions recorded related to approximately $3.34 billion in Private Education Loans sold in 2022 and the adoption of a new loss model that included a reduction in the long-term estimate of losses after the reasonable and supportable period. Management overlays increased in 2022 due to several factors, including additional provisions for our expectation of higher future loan losses related to the previously announced credit administration practices changes we implemented in 2021, “gap year” loans, a shortage and lack of tenured collections staff, and other operational challenges we experienced in 2022.
•Gains on sales of loans, net, were $160 million in 2023, compared with $328 million in 2022. The decrease in gains on sales of loans was primarily the result of selling approximately $3.15 billion of Private Education Loans in 2023, compared with the sale of approximately $3.34 billion of Private Education Loans in 2022, and lower sales premiums received in 2023 compared to 2022, which were attributable to higher interest rates in 2023. We also sold our Credit Card loan portfolio in May 2023 and recorded a $4 million loss on the sale in 2023.
•Gains (losses) on securities, net, were $3 million in gains in 2023, compared with a net loss of $60 million in 2022. The gains on securities, net, in 2023 were related to the changes in mark-to-fair value of our trading investments. During 2022, we determined that an investment in non-marketable equity securities was impaired. As such, we wrote down the value by $60 million in 2022 based upon an estimate of the value of these securities.
•Other income was $84 million in 2023, compared with $67 million in 2022. The increase in other income compared with 2022 was primarily the result of a $13 million increase in third-party servicing fees from 2022 and a $2 million increase in Private Education Loan late fees compared with 2022.
•For the year ended December 31, 2023, total operating expenses were $619 million, compared with $551 million in 2022. The increase in total operating expenses was primarily driven by higher personnel costs, initiative spending, and higher FDIC assessment fees, which were partially offset by lower Credit Card portfolio expenses as a result of the sale of the portfolio.
•In 2023, we recorded $66 million in impairment and amortization of acquired intangible assets, compared with $8 million in 2022. During the fourth quarter of 2023, we recorded an impairment of $56 million as a result of a write-down of the value of the Nitro trade name and trademarks intangible assets. This write-down occurred because we planned to discontinue the use of the Nitro trade name and trademarks in 2024 and transition the related branding to the Sallie and Sallie Mae brands and platforms. In 2023, we recorded $10 million in amortization expense of acquired intangible assets, compared to $8 million in 2022. The increase in amortization expense was related to our acquisition of several key assets of Scholly in the third quarter of 2023. For additional
2024 Form 10-K — SLM CORPORATION 50
information, see Notes to Consolidated Financial Statements, Note 8, “Goodwill and Acquired Intangible Assets” in this Form 10-K.
•Income tax expense for the year ended December 31, 2023 was $197 million, compared with $162 million in 2022. The effective tax rate decreased in 2023 to 25.3 percent from 25.6 percent in 2022. The decrease in the effective rate for 2023 was primarily attributable to an increase in tax credits utilized in the year.
2024 Form 10-K — SLM CORPORATION 51
,
Financial Condition
Average Balance Sheets - GAAP
The following table reflects the rates earned on interest-earning assets and paid on interest-bearing liabilities and reflects our net interest margin on a consolidated basis.
| | | | | | | | | | | | | | | | | | | | | | | | | | | | | | | | | | | | | | |
Years Ended December 31,
(dollars in thousands) | | 2024 | | 2023 | | 2022 |
| Balance | | Rate | | Balance | | Rate | | Balance | | Rate |
| Average Assets | | | | | | | | | | | | |
| Private Education Loans | | $ | 21,121,545 | | | 10.81 | % | | $ | 21,039,701 | | | 10.86 | % | | $ | 20,576,737 | | | 9.14 | % |
| FFELP Loans | | 413,338 | | | 7.45 | | | 574,218 | | | 7.19 | | | 662,194 | | | 4.62 | |
| Credit Cards | | — | | | — | | | 11,096 | | | 14.02 | | | 28,547 | | | 5.10 | |
| Taxable securities | | 2,316,848 | | | 2.65 | | | 2,543,586 | | | 2.00 | | | 2,509,215 | | | 1.41 | |
| Cash and other short-term investments | | 4,700,066 | | | 5.19 | | | 4,215,164 | | | 5.09 | | | 4,284,442 | | | 1.93 | |
| Total interest-earning assets | | 28,551,797 | | | 9.17 | % | | 28,383,765 | | | 9.13 | % | | 28,061,135 | | | 7.24 | % |
| | | | | | | | | | | | | |
| Non-interest-earning assets | | 505,245 | | | | | 301,749 | | | | | 605,447 | | | |
| | | | | | | | | | | | | |
| Total assets | | $ | 29,057,042 | | | | | $ | 28,685,514 | | | | | $ | 28,666,582 | | | |
| | | | | | | | | | | | | |
| Average Liabilities and Equity | | | | | | | | | | | | |
| Brokered deposits | | $ | 10,009,221 | | | 3.89 | % | | $ | 9,803,802 | | | 3.29 | % | | $ | 9,871,787 | | | 1.95 | % |
| Retail and other deposits | | 11,142,798 | | | 4.65 | | | 11,605,215 | | | 4.40 | | | 11,109,675 | | | 1.65 | |
Other interest-bearing liabilities(1) | | 5,616,445 | | | 4.09 | | | 5,366,365 | | | 3.66 | | | 5,517,489 | | | 3.03 | |
| Total interest-bearing liabilities | | 26,768,464 | | | 4.25 | % | | 26,775,382 | | | 3.85 | % | | 26,498,951 | | | 2.05 | % |
| | | | | | | | | | | | | |
| Non-interest-bearing liabilities | | 149,594 | | | | | 83,895 | | | | | 107,611 | | | |
| Equity | | 2,138,984 | | | | | 1,826,237 | | | | | 2,060,020 | | | |
| Total liabilities and equity | | $ | 29,057,042 | | | | | $ | 28,685,514 | | | | | $ | 28,666,582 | | | |
| | | | | | | | | | | | | |
| Net interest margin | | | | 5.19 | % | | | | 5.50 | % | | | | 5.31 | % |
(1) Includes the average balance of our unsecured borrowings, as well as secured borrowings and amortization expense of transaction costs related to our term asset-backed securitizations and our Secured Borrowing Facility.
2024 Form 10-K — SLM CORPORATION 52
Rate/Volume Analysis - GAAP
The following rate/volume analysis shows the relative contribution of changes in interest rates and asset volumes.
| | | | | | | | | | | | | | | | | | | | |
Years Ended December 31,
(dollars in thousands) | | Increase
(Decrease) | | Change Due To(1) |
| Rate | | Volume |
| 2024 vs. 2023 | | | | | | |
| Interest income | | $ | 26,743 | | | $ | 11,358 | | | $ | 15,385 | |
| Interest expense | | 108,174 | | | 108,440 | | | (266) | |
| Net interest income (loss) | | $ | (81,431) | | | $ | (90,630) | | | $ | 9,199 | |
| | | | | | | |
| 2023 vs. 2022 | | | | | | |
| Interest income | | $ | 560,723 | | | $ | 537,107 | | | $ | 23,616 | |
| Interest expense | | 487,291 | | | 481,570 | | | 5,721 | |
| Net interest income | | $ | 73,432 | | | $ | 56,165 | | | $ | 17,267 | |
(1) Changes in income and expense due to both rate and volume have been allocated in proportion to the relationship of the absolute dollar amounts of the change in each. The changes in income and expense are calculated independently for each line in the table. The totals for the rate and volume columns are not the sum of the individual lines.
Summary of Our Loans Held for Investment Portfolio
Ending Loans Held for Investment Balances, net
| | | | | | | | |
As of December 31, 2024
(dollars in thousands) | | Total Loans
Held for
Investment (Private Education Loans) |
| Total loan portfolio: | | |
In-school(1) | | $ | 4,397,127 | |
Repayment and other(2) | | 17,837,881 | |
| Total, gross | | 22,235,008 | |
| Deferred origination costs and unamortized premium/(discount) | | 103,070 | |
| Allowance for loan losses | | (1,435,920) | |
| Total loans held for investment portfolio, net | | $ | 20,902,158 | |
| | | |
| % of total | | 100 | % |
(1) Loans for customers still attending school and who are not yet required to make payments on the loans.
(2) Includes loans in deferment or forbearance. Loans in repayment include loans on which borrowers are making interest only or fixed payments, as well as loans that have entered full principal and interest repayment status after any applicable grace period (but, for purposes of the table, do not include those loans while they are in forbearance).
2024 Form 10-K — SLM CORPORATION 53
| | | | | | | | | | | | | | | | | | | | |
As of December 31, 2023
(dollars in thousands) | | Private Education Loans | | FFELP
Loans | | Total Loans
Held for
Investment |
| Total loan portfolio: | | | | | | |
In-school(1) | | $ | 3,997,092 | | | $ | 57 | | | $ | 3,997,149 | |
Repayment and other(2) | | 17,028,752 | | | 537,344 | | | 17,566,096 | |
| Total, gross | | 21,025,844 | | | 537,401 | | | 21,563,245 | |
| Deferred origination costs and unamortized premium/(discount) | | 81,554 | | | 1,330 | | | 82,884 | |
| Allowance for loan losses | | (1,335,105) | | | (4,667) | | | (1,339,772) | |
| Total loans held for investment portfolio, net | | $ | 19,772,293 | | | $ | 534,064 | | | $ | 20,306,357 | |
| | | | | | | |
| % of total | | 97 | % | | 3 | % | | 100 | % |
(1) Loans for customers still attending school and who are not yet required to make payments on the loans.
(2) Includes loans in deferment or forbearance. Loans in repayment include loans on which borrowers are making interest only or fixed payments, as well as loans that have entered full principal and interest repayment status after any applicable grace period (but, for purposes of the table, do not include those loans while they are in forbearance).
| | | | | | | | | | | | | | | | | | | | |
As of December 31, 2022
(dollars in thousands) | | Private Education Loans | | FFELP
Loans | | Total Loans
Held for
Investment |
| Total loan portfolio: | | | | | | |
In-school(1) | | $ | 3,659,323 | | | $ | 57 | | | $ | 3,659,380 | |
Repayment and other(2) | | 16,644,365 | | | 608,993 | | | 17,253,358 | |
| Total, gross | | 20,303,688 | | | 609,050 | | | 20,912,738 | |
| Deferred origination costs and unamortized premium/(discount) | | 69,656 | | | 1,549 | | | 71,205 | |
| Allowance for loan losses | | (1,353,631) | | | (3,444) | | | (1,357,075) | |
| Total loans held for investment portfolio, net | | $ | 19,019,713 | | | $ | 607,155 | | | $ | 19,626,868 | |
| | | | | | | |
| % of total | | 97 | % | | 3 | % | | 100 | % |
(1) Loans for customers still attending school and who are not yet required to make payments on the loans.
(2) Includes loans in deferment or forbearance. Loans in repayment include loans on which borrowers are making interest only or fixed payments, as well as loans that have entered full principal and interest repayment status after any applicable grace period (but, for purposes of the table, do not include those loans while they are in forbearance).
2024 Form 10-K — SLM CORPORATION 54
| | | | | | | | | | | | | | | | | | | | | | | | | | | | |
As of December 31, 2021
(dollars in thousands) | | Private Education Loans | | FFELP
Loans | | | | Credit
Cards | | Total Loans Held for Investment |
| Total loan portfolio: | | | | | | | | | | |
In-school(1) | | $ | 3,544,030 | | | $ | 82 | | | | | $ | — | | | $ | 3,544,112 | |
Repayment and other(2) | | 17,172,833 | | | 695,134 | | | | | 25,014 | | | 17,892,981 | |
| Total, gross | | 20,716,863 | | | 695,216 | | | | | 25,014 | | | 21,437,093 | |
| Deferred origination costs and unamortized premium/(discount) | | 67,488 | | | 1,815 | | | | | 222 | | | 69,525 | |
| Allowance for loan losses | | (1,158,977) | | | (4,077) | | | | | (2,281) | | | (1,165,335) | |
| Total loans held for investment portfolio, net | | $ | 19,625,374 | | | $ | 692,954 | | | | | $ | 22,955 | | | $ | 20,341,283 | |
| | | | | | | | | | | |
| % of total | | 97 | % | | 3 | % | | | | — | % | | 100 | % |
(1) Loans for customers still attending school and who are not yet required to make payments on the loans.
(2) Includes loans in deferment or forbearance. Loans in repayment include loans on which borrowers are making interest only or fixed payments, as well as loans that have entered full principal and interest repayment status after any applicable grace period (but, for purposes of the table, do not include those loans while they are in forbearance).
| | | | | | | | | | | | | | | | | | | | | | | | | | | | |
As of December 31, 2020
(dollars in thousands) | | Private Education Loans | | FFELP
Loans | | | | Credit
Cards | | Total Loans Held for Investment |
| Total loan portfolio: | | | | | | | | | | |
In-school(1) | | $ | 3,582,394 | | | $ | 81 | | | | | $ | — | | | $ | 3,582,475 | |
Repayment and other(2)(3) | | 16,146,943 | | | 737,512 | | | | | 12,238 | | | 16,896,693 | |
| Total, gross | | 19,729,337 | | | 737,593 | | | | | 12,238 | | | 20,479,168 | |
| Deferred origination costs and unamortized premium/(discount) | | 63,475 | | | 1,993 | | | | | 230 | | | 65,698 | |
| Allowance for loan losses | | (1,355,844) | | | (4,378) | | | | | (1,501) | | | (1,361,723) | |
| Total loans held for investment portfolio, net | | $ | 18,436,968 | | | $ | 735,208 | | | | | $ | 10,967 | | | $ | 19,183,143 | |
| | | | | | | | | | | |
| % of total | | 96 | % | | 4 | % | | | | — | % | | 100 | % |
(1) Loans for customers still attending school and who are not yet required to make payments on the loans. At December 31, 2020, the loans in the “in-school” category include $254 million of Private Education Loans whose borrowers did not return to school in the fall of 2020 because of the COVID-19 pandemic, or other reasons, and who received an extension of time from us to re-enroll before beginning their grace period and, therefore, were then not required to make any payments.
(2) At December 31, 2020, the loans in the “grace, repayment and other” category include (a) $147 million of Private Education Loans whose borrowers were in a grace or deferred status and who did not return to school in the fall of 2020, who received an extension of time from us to re-enroll before beginning their grace period and, therefore, were not then required to make any payments, and (b) $639 million of Private Education Loans whose borrowers were in a forbearance or repayment status and who did not return to school in the fall of 2020 and who then received an extension of time from us to re-enroll before beginning their grace period.
(3) Includes loans in deferment or forbearance. Loans in repayment include loans on which borrowers are making interest only or fixed payments, as well as loans that have entered full principal and interest repayment status after any applicable grace period (but, for purposes of the table, do not include those loans while they are in forbearance).
2024 Form 10-K — SLM CORPORATION 55
Average Loans Held for Investment Balances (net of unamortized premium/discount)
| | | | | | | | | | | | | | | | | | | | | | | | | | | | | | | | | | | | | | |
| Years Ended December 31, (dollars in thousands) | | 2024 | | 2023 | | 2022 |
| Private Education Loans | | $ | 21,121,545 | | | 98 | % | | $ | 21,039,701 | | | 97 | % | | $ | 20,576,737 | | | 97 | % |
| FFELP Loans | | 413,338 | | | 2 | | | 574,218 | | | 3 | | | 662,194 | | | 3 | |
| Total portfolio | | $ | 21,534,883 | | | 100 | % | | $ | 21,613,919 | | | 100 | % | | $ | 21,238,931 | | | 100 | % |
.
Loans Held for Investment, Net — Activity
| | | | | | | | | | | | | | | | | | | | |
Year Ended December 31, 2024
(dollars in thousands) | | Private
Education
Loans | | FFELP
Loans | | Total Loans
Held for Investment, net |
| Beginning balance | | $ | 19,772,293 | | | $ | 534,064 | | | $ | 20,306,357 | |
| Acquisitions and originations: | | | | | | |
| Fixed-rate | | 6,629,205 | | | — | | | 6,629,205 | |
| Variable-rate | | 435,025 | | | — | | | 435,025 | |
| Total acquisitions and originations | | 7,064,230 | | | — | | | 7,064,230 | |
| Capitalized interest and deferred origination cost premium amortization | | 602,825 | | | 16,796 | | | 619,621 | |
| Sales | | (3,430,920) | | | — | | | (3,430,920) | |
| | | | | | |
| Loan consolidations to third parties | | (806,908) | | | (45,467) | | | (852,375) | |
| Allowance | | (100,815) | | | 4,667 | | | (96,148) | |
| Transfer to loans held-for-sale | | — | | | (466,168) | | | (466,168) | |
| Repayments and other | | (2,198,547) | | | (43,892) | | | (2,242,439) | |
| Ending balance | | $ | 20,902,158 | | | $ | — | | | $ | 20,902,158 | |
| | | | | | | | | | | | | | | | | | | | |
Year Ended December 31, 2023
(dollars in thousands) | | Private
Education
Loans | | FFELP
Loans | | Total Loans
Held for Investment, net |
| Beginning balance | | $ | 19,019,713 | | | $ | 607,155 | | | $ | 19,626,868 | |
| Acquisitions and originations: | | | | | | |
| Fixed-rate | | 5,760,434 | | | — | | | 5,760,434 | |
| Variable-rate | | 665,987 | | | — | | | 665,987 | |
| Total acquisitions and originations | | 6,426,421 | | | — | | | 6,426,421 | |
| Capitalized interest and deferred origination cost premium amortization | | 597,480 | | | 22,584 | | | 620,064 | |
| Sales | | (2,938,616) | | | — | | | (2,938,616) | |
| | | | | | |
| Loan consolidations to third parties | | (975,889) | | | (32,855) | | | (1,008,744) | |
| Allowance | | 18,526 | | | (1,223) | | | 17,303 | |
| | | | | | |
| Repayments and other | | (2,375,342) | | | (61,597) | | | (2,436,939) | |
| Ending balance | | $ | 19,772,293 | | | $ | 534,064 | | | $ | 20,306,357 | |
2024 Form 10-K — SLM CORPORATION 56
| | | | | | | | | | | | | | | | | | | | | | | | | | |
Year Ended December 31, 2022
(dollars in thousands) | | Private
Education
Loans | | FFELP
Loans | | Credit
Cards | | Total Loans
Held for
Investment, net |
| Beginning balance | | $ | 19,625,374 | | | $ | 692,954 | | | $ | 22,955 | | | $ | 20,341,283 | |
| Acquisitions and originations: | | | | | | | | |
| Fixed-rate | | 4,189,269 | | | — | | | — | | | 4,189,269 | |
| Variable-rate | | 1,809,301 | | | — | | | 82,819 | | | 1,892,120 | |
| Total acquisitions and originations | | 5,998,570 | | | — | | | 82,819 | | | 6,081,389 | |
| Capitalized interest and deferred origination cost premium amortization | | 550,474 | | | 24,642 | | | (195) | | | 574,921 | |
| Sales | | (3,136,302) | | | — | | | — | | | (3,136,302) | |
| | | | | | | | |
| Loan consolidations to third parties | | (1,384,950) | | | (61,529) | | | — | | | (1,446,479) | |
| Allowance | | (194,654) | | | 633 | | | 2,281 | | | (191,740) | |
| Transfer to loans held-for-sale | | — | | | — | | | (28,905) | | | (28,905) | |
| Repayments and other | | (2,438,799) | | | (49,545) | | | (78,955) | | | (2,567,299) | |
| Ending balance | | $ | 19,019,713 | | | $ | 607,155 | | | $ | — | | | $ | 19,626,868 | |
“Loan consolidations to third parties” and “Repayments and other” are both significantly affected by the volume of loans in our held for investment portfolio in full principal and interest repayment status. The amount of loans in full principal and interest repayment status in our Private Education Loans held for investment portfolio at December 31, 2024 increased by 3.7 percent compared with December 31, 2023, and now totals 42 percent of our Private Education Loans held for investment portfolio at December 31, 2024. The balance of loans held for investment in full principal and interest repayment status was affected in 2024 and 2023 by loan sales.
“Loan consolidations to third parties” for the year ended December 31, 2024 total 9.1 percent of our Private Education Loans held for investment portfolio in full principal and interest repayment status at December 31, 2024, or 3.9 percent of our total Private Education Loans held for investment portfolio at December 31, 2024, compared with the year-ago period of 11.5 percent of our Private Education Loan held for investment portfolio in full principal and interest repayment status, or 4.9 percent of our total Private Education Loans held for investment portfolio, respectively. While interest rates began to decrease towards the end of 2024, increased interest rates for most of the year led to a decrease in consolidations compared to 2023. Historical experience has shown that loan consolidation activity is heightened in the period when the loan initially enters full principal and interest repayment status and then subsides over time.
The “Repayments and other” category includes all scheduled repayments, as well as voluntary prepayments, made on loans in repayment (including loans in full principal and interest repayment status) and also includes charge-offs. Consequently, this category can be significantly affected by the volume of loans in repayment.
2024 Form 10-K — SLM CORPORATION 57
Private Education Loan Originations
The following table summarizes our Private Education Loan originations. Originations represent loans that were funded or acquired during the period presented.
| | | | | | | | | | | | | | | | | | | | | | | | | | | | | | | | | | | | | | |
Years Ended December 31,
(dollars in thousands) | | 2024 | | % | | 2023 | | % | | 2022 | | % |
Smart Option - interest only(1) | | $ | 1,272,414 | | | 18 | % | | $ | 1,166,442 | | | 18 | % | | $ | 1,146,365 | | | 19 | % |
Smart Option - fixed pay(1) | | 2,331,055 | | | 33 | | | 2,121,112 | | | 33 | | | 1,950,048 | | | 33 | |
Smart Option - deferred(1) | | 2,786,821 | | | 40 | | | 2,584,545 | | | 41 | | | 2,330,719 | | | 39 | |
| | | | | | | | | | | | |
Graduate Loan(2) | | 623,033 | | | 9 | | | 511,193 | | | 8 | | | 516,877 | | | 8 | |
Parent Loan(3) | | — | | | — | | | 38 | | | — | | | 30,515 | | | 1 | |
| Total Private Education Loan originations | | $ | 7,013,323 | | | 100 | % | | $ | 6,383,330 | | | 100 | % | | $ | 5,974,524 | | | 100 | % |
| | | | | | | | | | | | |
| Percentage of loans with a cosigner | | 90.0 | % | | | | 87.5 | % | | | | 86.0 | % | | |
Average FICO at approval(4) | | 752 | | | | | 748 | | | | | 747 | | | |
(1) Interest only, fixed pay and deferred describe the payment option while in school or in grace period. See Item 1. “Business - Our Business - Private Education Loans” for a further discussion.
(2) For the year ended December 31, 2024, the Graduate Loan originations include $32.2 million of Smart Option Loans where the student was in a graduate status. For the year ended December 31, 2023, the Graduate Loan originations include $29.4 million of Smart Option Loans where the student was in a graduate status. For the year ended December 31, 2022, the Graduate Loan originations include $1.8 million of Parent Loans and $29.1 million of Smart Option Loans where the student was in a graduate status.
(3) In December 2021, we discontinued offering our Parent Loan product. Applications for those loans received before the offering termination date were processed, and final disbursements under those loans occurred in February 2023.
(4) Represents the higher credit score of the cosigner or the borrower.
Private Education Loan Maturities
The following table summarizes the remaining maturities of our Private Education Loan portfolio.
| | | | | | | | | | | | | | | | | | | | | | | | | | | | | | | | |
As of December 31, 2024
(dollars in thousands) | | One year or less | | After one year to five years | | After five years to 15 years | | After 15 years | | Total |
| Fixed-rate | | $ | 7,782 | | | $ | 313,875 | | | $ | 8,191,111 | | | $ | 8,580,614 | | | $ | 17,093,382 | |
| Variable-rate | | 20,054 | | | 506,104 | | | 3,349,420 | | | 1,266,048 | | | 5,141,626 | |
| Total Private Education Loans, gross | | $ | 27,836 | | | $ | 819,979 | | | $ | 11,540,531 | | | $ | 9,846,662 | | | $ | 22,235,008 | |
2024 Form 10-K — SLM CORPORATION 58
Allowance for Credit Losses
Allowance for Loan Losses Activity
| | | | | | | | | | | | | | | | | | | | | | | | | | | | | | | | | | | | | | | | |
Years Ended December 31,
(dollars in thousands) | | 2024 | | 2023 |
| Private
Education
Loans | | FFELP
Loans | | | | Total
Portfolio | | Private
Education
Loans | | FFELP
Loans | | Total
Portfolio |
| Beginning balance | | $ | 1,335,105 | | | $ | 4,667 | | | | | $ | 1,339,772 | | | $ | 1,353,631 | | | $ | 3,444 | | | $ | 1,357,075 | |
Transfer from unfunded commitment liability(1) | | 311,787 | | | — | | | | | 311,787 | | | 320,237 | | | — | | | 320,237 | |
| Less: | | | | | | | | | | | | | | |
| Charge-offs | | (376,840) | | | (380) | | | | | (377,220) | | | (420,095) | | | (1,001) | | | (421,096) | |
Write-downs arising from transfer of loans to held for sale(2) | | — | | | (8,297) | | | | | (8,297) | | | — | | | — | | | — | |
| Plus: | | | | | | | | | | | | | | |
| Recoveries | | 44,756 | | | — | | | | | 44,756 | | | 46,368 | | | — | | | 46,368 | |
| Provisions for loan losses: | | | | | | | | | | | | | | |
| Provision, current period | | 357,067 | | | 4,010 | | | | | 361,077 | | | 240,347 | | | 2,224 | | | 242,571 | |
| Loan sale reduction to provision | | (235,955) | | | — | | | | | (235,955) | | | (205,383) | | | — | | | (205,383) | |
| | | | | | | | | | | | | | |
Total provisions for loan losses(3) | | 121,112 | | | 4,010 | | | | | 125,122 | | | 34,964 | | | 2,224 | | | 37,188 | |
| Ending balance | | $ | 1,435,920 | | | $ | — | | | | | $ | 1,435,920 | | | $ | 1,335,105 | | | $ | 4,667 | | | $ | 1,339,772 | |
| | | | | | | | | | | | | | | | | | | | | | | | | | | | | | | | | | | | | | | | | | | | | | | | | | | | | | | | | | | | | | | |
| | | 2022 | | 2021 | | | | | | | | | | | |
| Years Ended December 31, (dollars in thousands) | | Private
Education
Loans | | FFELP
Loans | | | | Credit Cards | | Total
Portfolio | | Private
Education
Loans | | FFELP
Loans | | Credit Cards | | Total
Portfolio | | | | | | | | | | | |
| Beginning balance | | $ | 1,158,977 | | | $ | 4,077 | | | | | $ | 2,281 | | | $ | 1,165,335 | | | $ | 1,355,844 | | | $ | 4,378 | | | $ | 1,501 | | | $ | 1,361,723 | | | | | | | | | | | | |
Transfer from unfunded commitment liability(1) | | 344,310 | | | — | | | | | — | | | 344,310 | | | 301,655 | | | — | | | — | | | 301,655 | | | | | | | | | | | | |
| Less: | | | | | | | | | | | | | | | | | | | | | | | | | | | | | |
| Charge-offs | | (427,416) | | | (613) | | | | | (3,215) | | | (431,244) | | | (229,591) | | | (321) | | | (356) | | | (230,268) | | | | | | | | | | | | |
| | | | | | | | | | | | | | | | | | | | | | | | | | | | | |
| Plus: | | | | | | | | | | | | | | | | | | | | | | | | | | | | | |
| Recoveries | | 41,737 | | | — | | | | | 5 | | | 41,742 | | | 29,494 | | | — | | | 12 | | | 29,506 | | | | | | | | | | | | |
| Provisions for loan losses: | | | | | | | | | | | | | | | | | | | | | | | | | | | | | |
| Provision, current period | | 410,254 | | | (20) | | | | | 3,301 | | | 413,535 | | | (233,852) | | | 20 | | | 1,124 | | | (232,708) | | | | | | | | | | | | |
| Loan sale reduction to provision | | (174,231) | | | — | | | | | — | | | (174,231) | | | (66,460) | | | — | | | — | | | (66,460) | | | | | | | | | | | | |
| Loans transferred (to) from held-for-sale | | — | | | — | | | | | (2,372) | | | (2,372) | | | 1,887 | | | — | | | — | | | 1,887 | | | | | | | | | | | | |
Total provisions for loan losses(3) | | 236,023 | | | (20) | | | | | 929 | | | 236,932 | | | (298,425) | | | 20 | | | 1,124 | | | (297,281) | | | | | | | | | | | | |
| Ending balance | | $ | 1,353,631 | | | $ | 3,444 | | | | | $ | — | | | $ | 1,357,075 | | | $ | 1,158,977 | | | $ | 4,077 | | | $ | 2,281 | | | $ | 1,165,335 | | | | | | | | | | | | |
| | | | | | | | | | | | | | | | | | | | | | | | | | | | | |
| | | | | | | | | | | | | | | | | | | | | | | | | | | | | |
| | | | | | | | | | | | | | | | | | | | | | | | | | | | | |
| | | | | | | | | | | | | | | | | | | | | | | | | | | | | |
| | | | | | | | | | | | | | | | | | | | | | | | | | | | | |
| | | | | | | | | | | | | | | | | | | | | | | | | | | | | |
| | | | | | | | | | | | | | | | | | | | | | | | | | | | | |
| | | | | | | | | | | | | | | | | | | | | | | | | | | | | |
| | | | | | | | | | | | | | | | | | | | | | | | | | | | | |
| | | | | | | | | | | | | | | | | | | | | | | | | | | | | |
| | | | | | | | | | | | | | | | | | | | | | | | | | | | | |
| | | | | | | | | | | | | | | | | | | | | | | | | | | | | |
| | | | | | | | | | | | | | | | | | | | | | | | | | | | | |
| | | | | | | | | | | | | | | | | | | | | | | | | | | | | |
| | | | | | | | | | | | | | | | | | | | | | | | | | | | | |
(1) See Notes to Consolidated Financial Statements, Note 6, “Allowance for Credit Losses and Unfunded Loan Commitments,” in this Form 10-K for a summary of the activity in the allowance for and balance of unfunded loan commitments, respectively.
(2) Represents fair value adjustments on loans transferred to held for sale.
(3) See “—Financial Condition — Allowance for Credit Losses — Provision for Credit Losses” in this Item 7 for a reconciliation of the provisions for credit losses reported in the consolidated statements of income.
2024 Form 10-K — SLM CORPORATION 59
| | | | | | | | | | | | | | | | | | | | | | | | | | | | | | | | |
| | 2020 |
Year Ended December 31,
(dollars in thousands) | | Private
Education
Loans | | FFELP
Loans | | Personal Loans | | Credit
Cards | | Total
Portfolio |
| Beginning balance | | $ | 374,300 | | | $ | 1,633 | | | $ | 65,877 | | | $ | 102 | | | $ | 441,912 | |
| Day 1 adjustment for adoption of CECL | | 1,060,830 | | | 2,852 | | | 79,183 | | | 188 | | | 1,143,053 | |
| Balance at January 1 | | 1,435,130 | | | 4,485 | | | 145,060 | | | 290 | | | 1,584,965 | |
| | | | | | | | | | |
Transfer from unfunded commitment liability(1) | | 320,808 | | | — | | | — | | | — | | | 320,808 | |
| Less: | | | | | | | | | | |
| Charge-offs | | (205,326) | | | (519) | | | (39,079) | | | (119) | | | (245,043) | |
Loan sales(2) | | — | | | — | | | (108,534) | | | — | | | (108,534) | |
| Plus: | | | | | | | | | | |
| Recoveries | | 24,021 | | | — | | | 4,984 | | | 2 | | | 29,007 | |
| Provisions for loan losses: | | | | | | | | | | |
| Provision, current period | | 148,673 | | | 412 | | | 40,485 | | | 1,328 | | | 190,898 | |
| Loan sale reduction to provision | | (161,793) | | | — | | | (42,916) | | | — | | | (204,709) | |
| Loans transferred (to) from held-for-sale | | (205,669) | | | — | | | — | | | — | | | (205,669) | |
Total provisions for loan losses(3) | | (218,789) | | | 412 | | | (2,431) | | | 1,328 | | | (219,480) | |
| Ending balance | | $ | 1,355,844 | | | $ | 4,378 | | | $ | — | | | $ | 1,501 | | | $ | 1,361,723 | |
(1) See Notes to Consolidated Financial Statements, Note 6, “Allowance for Credit Losses and Unfunded Loan Commitments,” in this Form 10-K for a summary of the activity in the allowance for and balance of unfunded loan commitments, respectively.
(2) Represents fair value adjustments on loans sold.
(3) See “—Financial Condition — Allowance for Credit Losses — Provision for Credit Losses” in this Item 7 for a reconciliation of the provisions for credit losses reported in the consolidated statements of income.
Provision for Credit Losses
Below is a reconciliation of the provisions for credit losses reported in the consolidated statements of income.
| | | | | | | | | | | | | | | | | | | | | | | | | | | | | | | | |
Consolidated Statements of Income
Provisions for Credit Losses Reconciliation | | | | | | | | | | |
Years Ended December 31,
(dollars in thousands) | | 2024 | | 2023 | | 2022 | | 2021 | | 2020 |
| Private Education Loan provisions for credit losses: | | | | | | | | | | |
| Provisions for loan losses | | $ | 121,112 | | | $ | 34,964 | | | $ | 236,023 | | | $ | (298,425) | | | $ | (218,789) | |
| Provisions for unfunded loan commitments | | 283,393 | | | 308,275 | | | 396,521 | | | 264,324 | | | 312,613 | |
| Total Private Education Loan provisions for credit losses | | 404,505 | | | 343,239 | | | 632,544 | | | (34,101) | | | 93,824 | |
| Other impacts to the provisions for credit losses: | | | | | | | | | | |
| Personal Loans | | — | | | — | | | — | | | — | | | (2,431) | |
| FFELP Loans | | 4,010 | | | 2,224 | | | (20) | | | 20 | | | 412 | |
| Credit Cards | | — | | | — | | | 929 | | | 1,124 | | | 1,328 | |
| Total | | 4,010 | | | 2,224 | | | 909 | | | 1,144 | | | (691) | |
| Provisions for credit losses reported in consolidated statements of income | | 408,515 | | | 345,463 | | | 633,453 | | | (32,957) | | | 93,133 | |
2024 Form 10-K — SLM CORPORATION 60
Private Education Loan Allowance for Credit Losses
In establishing the allowance for Private Education Loan losses as of December 31, 2024, we considered several factors with respect to our Private Education Loan held for investment portfolio, in particular, credit quality and delinquency, forbearance, and charge-off trends.
Private Education Loans held for investment in full principal and interest repayment status were 42 percent of our total Private Education Loans held for investment portfolio at December 31, 2024, compared with 43 percent at December 31, 2023.
For a more detailed discussion of our policy for determining the collectability of Private Education Loans and maintaining our allowance for Private Education Loans, see “— Critical Accounting Policies and Estimates — Allowance for Credit Losses” in this Item 7 and Notes to Consolidated Financial Statements, Note 5, “Loans Held for Investment — Certain Collection Tools — Private Education Loans” in this Form 10-K.
2024 Form 10-K — SLM CORPORATION 61
The table below presents our Private Education Loans held for investment portfolio delinquency trends. Loans in repayment include loans making interest only or fixed payments, as well as loans that have entered full principal and interest repayment status after any applicable grace period (but, for purposes of the following table, do not include those loans while they are in forbearance).
| | | | | | | | | | | | | | | | | | | | | | | | | | | | | | | | | | | | | | |
| Private Education Loans Held for Investment | | 2024 | | 2023 | | 2022 |
| As of December 31, (dollars in thousands) | | Balance | | % | | Balance | | % | | Balance | | % |
Loans in-school/grace/deferment(1) | | $ | 5,722,827 | | | | | $ | 5,291,991 | | | | | $ | 4,895,053 | | | |
Loans in forbearance(2) | | 405,430 | | | | | 324,039 | | | | | 279,085 | | | |
| Loans in repayment and percentage of each status: | | | | | | | | | | | | |
| Loans current | | 15,513,333 | | | 96.3 | % | | 14,809,271 | | | 96.1 | % | | 14,559,347 | | | 96.2 | % |
Loans delinquent 30-59 days(3) | | 310,748 | | | 1.9 | | | 298,751 | | | 1.9 | | | 287,308 | | | 1.9 | |
Loans delinquent 60-89 days(3) | | 140,735 | | | 0.9 | | | 151,017 | | | 1.0 | | | 147,505 | | | 1.0 | |
Loans 90 days or greater past due(3) | | 141,935 | | | 0.9 | | | 150,775 | | | 1.0 | | | 135,390 | | | 0.9 | |
| Total Private Education Loans in repayment | | 16,106,751 | | | 100.0 | % | | 15,409,814 | | | 100.0 | % | | 15,129,550 | | | 100.0 | % |
| Total Private Education Loans, gross | | 22,235,008 | | | | | 21,025,844 | | | | | 20,303,688 | | | |
| Private Education Loans deferred origination costs and unamortized premium/(discount) | | 103,070 | | | | | 81,554 | | | | | 69,656 | | | |
| Total Private Education Loans | | 22,338,078 | | | | | 21,107,398 | | | | | 20,373,344 | | | |
| Private Education Loans allowance for losses | | (1,435,920) | | | | | (1,335,105) | | | | | (1,353,631) | | | |
| Private Education Loans, net | | $ | 20,902,158 | | | | | $ | 19,772,293 | | | | | $ | 19,019,713 | | | |
| Percentage of loans in repayment | | | | 72.4 | % | | | | 73.3 | % | | | | 74.5 | % |
| Delinquencies as a percentage of loans in repayment | | | | 3.7 | % | | | | 3.9 | % | | | | 3.8 | % |
| Percentage of loans in forbearance: | | | | | | | | | | | | |
Percentage of loans in an extended grace period(4) | | | | 1.6 | % | | | | 1.1 | % | | | | 0.7 | % |
Percentage of loans in hardship and other forbearances(5) | | | | 0.9 | % | | | | 1.0 | % | | | | 1.1 | % |
(1)Deferment includes customers who have returned to school or are engaged in other permitted educational activities and are not yet required to make payments on the loans (e.g., residency periods for medical students or a grace period for bar exam preparation).
(2)Loans for customers who have requested extension of grace period generally during employment transition or who have temporarily ceased making full payments due to hardship or other factors, consistent with established loan program servicing policies and procedures.
(3)The period of delinquency is based on the number of days scheduled payments are contractually past due.
(4)We calculate the percentage of loans in an extended grace period as the ratio of (a) Private Education Loans in forbearance in an extended grace period numerator to (b) Private Education Loans in repayment and forbearance denominator. An extended grace period aligns with The Office of the Comptroller of the Currency definition of an additional, consecutive, one-time period during which no payment is required for up to six months after the initial grace period. We typically grant this extended grace period to customers who may be having difficulty finding employment before the full principal and interest repayment period starts or once it has begun. Loans in forbearance in an extended grace period were approximately $253 million, $168 million, and $114 million at December 31, 2024, 2023, and 2022, respectively. See “—Financial Condition — Allowance for Credit Losses — Use of Forbearance and Modifications as a Private Education Loan Collection Tool” in this Item 7 for additional details.
(5)We calculate the percentage of loans in hardship and other forbearances as the ratio of (a) Private Education Loans in hardship and other forbearances (excluding loans in an extended grace period) numerator to (b) Private Education Loans in repayment and forbearance denominator. If the customer is in financial hardship, we work with the customer and/or cosigner and identify any available alternative arrangements designed to reduce monthly payment obligations, which may include a short-term hardship forbearance. Loans in hardship and other forbearances (excluding loans in an extended grace period) were approximately $152 million, $156 million, and $165 million at December 31, 2024, 2023, and 2022, respectively. See “—Financial Condition — Allowance for Credit Losses — Use of Forbearance and Modifications as a Private Education Loan Collection Tool” in this Item 7 for additional details.
Delinquencies as a percentage of Private Education Loans (held for investment) in repayment decreased to 3.7 percent at December 31, 2024 from 3.9 percent at December 31, 2023. The decrease in the delinquency metric in 2024 compared with 2023 was primarily attributable to the new loan modification programs. See “—Financial Condition — Allowance for Credit Losses — Use of Forbearance and Modifications as a Private Education Loan Collection Tool” in this
2024 Form 10-K — SLM CORPORATION 62
Item 7 for additional details. The percentage of loans in an extended grace forbearance increased to 1.6 percent at December 31, 2024 from 1.1 percent at December 31, 2023. The increase was primarily due to borrowers being eligible to receive up to six months of extended grace forbearance in one increment instead of multiple instances of two-month increments, coupled with our continued efforts to better match our available program offerings to the financial needs of our borrowers. The percentage of loans in hardship and other forbearances remained relatively consistent at 0.9 percent and 1.0 percent, respectively, at December 31, 2024 and December 31, 2023.
The increase in delinquencies at December 31, 2023, compared with 2022, was primarily attributable to loan modification programs initiated in the fourth quarter of 2023 that required borrowers to remain in their respective delinquency buckets until three consecutive payments were made under the modified loan terms before being brought current (if re-age eligible). The increase in the percentage of loans in an extended grace period at December 31, 2023 compared with 2022 was primarily due to borrowers being eligible to receive up to six months of extended grace forbearance in one increment instead of multiple instances of two-month increments, beginning in September 2023. The percentage of loans in hardship and other forbearances remained relatively consistent at 1.0 percent and 1.1 percent, respectively at December 31, 2023 and December 31, 2022.
2024 Form 10-K — SLM CORPORATION 63
The following table summarizes changes in the allowance for Private Education Loan (held for investment) losses and the allowance for unfunded loan commitments.
| | | | | | | | | | | | | | | | | | | | | | | | | | | | | | | | |
Years Ended December 31,
(dollars in thousands) | | 2024 | | 2023 | | 2022 | | 2021 | | 2020 |
| Allowance for loan losses, beginning balance | | $ | 1,335,105 | | | $ | 1,353,631 | | | $ | 1,158,977 | | | $ | 1,355,844 | | | $ | 374,300 | |
| Day 1 adjustment for adoption of CECL | | — | | | — | | | — | | | — | | | 1,060,830 | |
| Balance at January 1 | | 1,335,105 | | | 1,353,631 | | | 1,158,977 | | | 1,355,844 | | | 1,435,130 | |
Transfer from allowance for unfunded loan commitments(1) | | 311,787 | | | 320,237 | | | 344,310 | | | 301,655 | | | 320,808 | |
| Provisions: | | | | | | | | | | |
| Provision for current period | | 357,067 | | | 240,347 | | | 410,254 | | | (233,852) | | | 148,673 | |
| Loan sale reduction to provision | | (235,955) | | | (205,383) | | | (174,231) | | | (66,460) | | | (161,793) | |
| Loans transferred (to) from held-for-sale | | — | | | — | | | — | | | 1,887 | | | (205,669) | |
Total provisions(2) | | 121,112 | | | 34,964 | | | 236,023 | | | (298,425) | | | (218,789) | |
| Net charge-offs: | | | | | | | | | | |
| Charge-offs | | (376,840) | | | (420,095) | | | (427,416) | | | (229,591) | | | (205,326) | |
| Recoveries | | 44,756 | | | 46,368 | | | 41,737 | | | 29,494 | | | 24,021 | |
| Net charge-offs | | (332,084) | | | (373,727) | | | (385,679) | | | (200,097) | | | (181,305) | |
| Allowance for loan losses, ending balance | | 1,435,920 | | | 1,335,105 | | | 1,353,631 | | | 1,158,977 | | | 1,355,844 | |
Allowance for unfunded loan commitments, beginning balance (1) | | 112,962 | | | 124,924 | | | 72,713 | | | 110,044 | | | 2,481 | |
| Day 1 adjustment for adoption of CECL | | — | | | — | | | — | | | — | | | 115,758 | |
| Balance at January 1 | | 112,962 | | | 124,924 | | | 72,713 | | | 110,044 | | | 118,239 | |
Provision(2)(3) | | 283,393 | | | 308,275 | | | 396,521 | | | 264,324 | | | 312,613 | |
| Transfer to allowance for loan losses | | (311,787) | | | (320,237) | | | (344,310) | | | (301,655) | | | (320,808) | |
Allowance for unfunded loan commitments, ending balance(1) | | 84,568 | | | 112,962 | | | 124,924 | | | 72,713 | | | 110,044 | |
| Total allowance for credit losses, ending balance | | $ | 1,520,488 | | | $ | 1,448,067 | | | $ | 1,478,555 | | | $ | 1,231,690 | | | $ | 1,465,888 | |
| | | | | | | | | | |
| Total allowance for credit losses as a percentage of the ending total loan balance, plus unfunded loan commitments and total accrued interest receivable | | 5.83 | % | | 5.89 | % | | 6.30 | % | | 5.20 | % | | 6.49 | % |
| | | | | | | | | | |
| Allowance for loan losses coverage of net charge-offs | | 4.32 | | | 3.57 | | | 3.51 | | | 5.79 | | | 7.48 | |
Net charge-offs as a percentage of average loans in repayment(4) | | 2.19 | % | | 2.44 | % | | 2.55 | % | | 1.33 | % | | 1.17 | % |
Delinquencies as a percentage of ending loans in repayment(4) | | 3.68 | % | | 3.90 | % | | 3.77 | % | | 3.26 | % | | 2.84 | % |
Loans in forbearance as a percentage of ending loans in repayment and forbearance(4) | | 2.46 | % | | 2.06 | % | | 1.81 | % | | 1.91 | % | | 4.32 | % |
| Ending total loans, gross | | $ | 22,235,008 | | | $ | 21,025,844 | | | $ | 20,303,688 | | | $ | 20,716,863 | | | $ | 19,729,337 | |
Average loans in repayment(4) | | $ | 15,139,184 | | | $ | 15,310,934 | | | $ | 15,103,123 | | | $ | 15,019,869 | | | $ | 15,518,851 | |
Ending loans in repayment(4) | | $ | 16,106,751 | | | $ | 15,409,814 | | | $ | 15,129,550 | | | $ | 15,511,212 | | | $ | 14,304,821 | |
| Unfunded loan commitments | | $ | 2,311,660 | | | $ | 2,221,077 | | | $ | 1,995,808 | | | $ | 1,776,976 | | | $ | 1,673,018 | |
| Total accrued interest receivable | | $ | 1,549,415 | | | $ | 1,354,565 | | | $ | 1,177,562 | | | $ | 1,187,123 | | | $ | 1,168,895 | |
| | | | | | | | | | |
| | | | | | | | | | |
(1) When a new loan commitment is made, we record an allowance to cover lifetime expected credit losses on the unfunded commitments, which is recorded in “Other Liabilities” on the consolidated balance sheet. See Notes to Consolidated Financial Statements, Note 6, “Allowance for Credit Losses and Unfunded Loan Commitments” in this Form 10-K for a summary of the activity in the allowance for and balance of unfunded loan commitments.
(2) See “—Financial Condition — Allowance for Credit Losses — Provision for Credit Losses” in this Item 7 for a reconciliation of the provisions for credit losses reported in the consolidated statements of income.
(3) Includes incremental provision for new commitments and changes to provision for existing commitments.
(4) Loans in repayment include loans on which borrowers are making interest only or fixed payments, as well as loans that have entered full principal and interest repayment status after any applicable grace period (but, for purposes of the table, do not include those loans while they are in forbearance).
As part of concluding on the adequacy of the allowance for credit losses, we review key allowance and loan metrics. The most significant of the metrics considered are the allowance coverage of net charge-offs ratio; the allowance as a percentage of ending total loans plus unfunded loan commitments and total accrued interest receivable; and delinquency and forbearance percentages.
2024 Form 10-K — SLM CORPORATION 64
Charge-offs decreased in the year ended December 31, 2024 compared with the year-ago period primarily due to the new loan modification programs implemented throughout the full year 2024. Charge-offs decreased in the year ended December 31, 2023 compared with the year ended December 31, 2022 because of a combination of factors, including improved staffing levels and the impact of the new loan modification programs begun in the fourth quarter of 2023. In the fourth quarter of 2022, we charged off $13 million of delinquent loans that had received certain grants of forbearance under previous credit administration practices (which have been discontinued) and which were classified as a loss and charged off prior to their reaching 120 days delinquent.
Use of Forbearance and Modifications as a Private Education Loan Collection Tool
Over the course of the last few years, we have made significant changes to our credit administration practices, enhancing our loss mitigation programs through both our forbearance and loan modification offerings. We adjust the terms of loans for certain borrowers when we believe such changes will help our borrowers manage their student loan obligations and achieve better student outcomes, and increase the collectability of the loans. These changes generally take the form of a temporary forbearance of payments, a temporary or permanent interest rate reduction, a temporary or permanent interest rate reduction with a permanent extension of the loan term, and/or a short-term extended repayment or interest-only alternative.
Forbearance allows a borrower to not make scheduled payments for a specified period of time. Our forbearance policies and practices vary depending upon whether a borrower is current or delinquent at the time forbearance is requested, generally with stricter requirements for delinquent borrowers. Using forbearance extends the original term of the loan by the term of forbearance taken. Forbearance does not grant any reduction in the total principal or interest repayment obligation. While a loan is in forbearance status, interest continues to accrue and is capitalized (added to principal) at the end of the forbearance. Interest will not capitalize at the end of certain types of forbearance, such as disaster forbearance, however.
During the first six months following a borrower’s grace period, the borrower may be eligible for extended grace forbearance, which provides temporary payment relief to give the borrower additional time to be in a position to make regular principal and interest payments.
Hardship forbearance may be granted in order to provide temporary payment relief to borrowers who are either current in their payments but demonstrate a need for relief, or who are delinquent in their payments but demonstrate an ability and willingness to repay their obligation. In these circumstances, a borrower’s loan is placed into a forbearance status in limited monthly increments and is reflected in the forbearance status at month-end during this time. At the end of the forbearance period, for borrowers who were current when they entered forbearance, or those who were delinquent but met specific payment requirements curing their delinquency, the borrower will enter repayment status as current. In all instances, the borrowers are expected to begin making scheduled monthly payments at the end of their forbearance periods. This strategy is aimed at assisting borrowers while mitigating the risks of delinquency and default as well as encouraging resolution of delinquent loans.
Disaster forbearance is used to assist borrowers affected by material events, typically federally-declared disasters, including hurricanes, wildfires, floods, and pandemics. We typically grant disaster forbearance to affected borrowers in increments of up to three months at a time, but the disaster forbearance granted generally does not apply toward the 12-month forbearance limit described below.
Currently, we generally grant forbearance in increments of one to two months at a time, for up to 12 months over the life of the loan, although extended grace forbearance is typically granted in one six-month increment and disaster forbearance and certain other limited instances do not apply toward the 12-month limit. We also currently require 12 months of positive payment performance by a borrower (meaning the borrower must make payment in a cumulative amount equivalent to 12 monthly required payments under the loan) between successive grants of forbearance and between forbearance grants and certain other repayment alternatives. This required period of positive payment performance does not apply, however, to extended grace forbearances and is not required for a borrower to receive a contractual interest rate reduction. In addition, we currently limit the participation of delinquent borrowers in certain short-term extended or interest-only repayment alternatives to once in 12 months and twice in five years. We also now count the number of months a borrower receives a short-term extended repayment alternative toward the 12-month forbearance limit described above.
For borrowers experiencing more severe hardship, following evaluation of their ability and willingness to repay, we currently use modification programs tailored to the financial condition of the individual borrower. Pursuant to our modification programs, we may reduce the contractual interest rate on a loan to a rate between 2 percent and 8 percent
2024 Form 10-K — SLM CORPORATION 65
for a temporary period of two to four years, and in some instances may also permanently extend the final maturity of the loan. For borrowers experiencing the most severe financial conditions, we may permanently reduce the contractual interest rate on a loan to 2 percent for the remaining life of the loan and also permanently extend the final maturity of the loan. Following modification, borrowers who are delinquent but meet specific payment requirements curing their delinquency will be brought current. We currently limit the granting of a permanent extension of the final maturity date of a loan to once over the life of the loan, and the number of interest rate reductions to twice over the life of the loan.
We continually monitor our credit administration practices and may modify them further from time to time based upon performance, industry conventions, and/or regulatory feedback.
Delinquency Trends by Active Repayment Status
The tables below show the composition and status of the Private Education Loan portfolio held for investment aged by number of months in active repayment status (months for which a scheduled monthly payment was due). Active repayment status includes loans on which borrowers are making interest only or fixed payments, as well as loans that have entered full principal and interest repayment status after any applicable grace period. Our experience shows that the percentage of loans in forbearance status generally decreases the longer the loans have been in active repayment status. At December 31, 2024, for Private Education Loans (held for investment) that have been in active repayment status for fewer than 25 months, loans in forbearance status as a percentage of loans in repayment and forbearance were 1.9 percent. Approximately 77 percent of our Private Education Loans (held for investment) in forbearance status have been in active repayment status fewer than 25 months.
| | | | | | | | | | | | | | | | | | | | | | | | | | | | | | | | | | | | | | | | | | | | |
As of December 31, 2024
(dollars in millions) | | Private Education Loans Held for Investment
Aged by Number of Months in Active Repayment Status | | Not Yet in
Repayment | | Total |
| 0 to 12 | | 13 to 24 | | 25 to 36 | | 37 to 48 | | More than 48 | |
| Loans in-school/grace/deferment | | $ | — | | | $ | — | | | $ | — | | | $ | — | | | $ | — | | | $ | 5,723 | | | $ | 5,723 | |
| Loans in forbearance | | 247 | | | 66 | | | 37 | | | 23 | | | 32 | | | — | | | 405 | |
| Loans in repayment - current | | 4,497 | | | 3,585 | | | 2,230 | | | 1,518 | | | 3,683 | | | — | | | 15,513 | |
| Loans in repayment - delinquent 30-59 days | | 78 | | | 58 | | | 49 | | | 36 | | | 90 | | | — | | | 311 | |
| Loans in repayment - delinquent 60-89 days | | 38 | | | 25 | | | 22 | | | 17 | | | 39 | | | — | | | 141 | |
| Loans in repayment - 90 days or greater past due | | 39 | | | 23 | | | 20 | | | 16 | | | 44 | | | — | | | 142 | |
| Total | | $ | 4,899 | | | $ | 3,757 | | | $ | 2,358 | | | $ | 1,610 | | | $ | 3,888 | | | $ | 5,723 | | | 22,235 | |
| Deferred origination costs and unamortized premium/(discount) | | | | | | | | | | | | | | 103 | |
| Allowance for loan losses | | | | | | | | | | | | | | (1,436) | |
| Total Private Education Loans, net | | | | | | | | | | | | | | $ | 20,902 | |
| | | | | | | | | | | | | | | |
| Loans in forbearance as a percentage of total Private Education Loans in repayment and forbearance | | 1.50 | % | | 0.40 | % | | 0.23 | % | | 0.14 | % | | 0.19 | % | | — | % | | 2.46 | % |
2024 Form 10-K — SLM CORPORATION 66
| | | | | | | | | | | | | | | | | | | | | | | | | | | | | | | | | | | | | | | | | | | | |
As of December 31, 2023
(dollars in millions) | | Private Education Loans Held for Investment
Aged by Number of Months in Active Repayment Status | | Not Yet in
Repayment | | Total |
| 0 to 12 | | 13 to 24 | | 25 to 36 | | 37 to 48 | | More than 48 | |
| Loans in-school/grace/deferment | | $ | — | | | $ | — | | | $ | — | | | $ | — | | | $ | — | | | $ | 5,292 | | | $ | 5,292 | |
| Loans in forbearance | | 190 | | | 55 | | | 31 | | | 20 | | | 28 | | | — | | | 324 | |
| Loans in repayment - current | | 4,129 | | | 3,529 | | | 2,183 | | | 1,472 | | | 3,496 | | | — | | | 14,809 | |
| Loans in repayment - delinquent 30-59 days | | 81 | | | 56 | | | 45 | | | 33 | | | 84 | | | — | | | 299 | |
| Loans in repayment - delinquent 60-89 days | | 40 | | | 29 | | | 24 | | | 17 | | | 41 | | | — | | | 151 | |
| Loans in repayment - 90 days or greater past due | | 42 | | | 28 | | | 23 | | | 16 | | | 42 | | | — | | | 151 | |
| Total | | $ | 4,482 | | | $ | 3,697 | | | $ | 2,306 | | | $ | 1,558 | | | $ | 3,691 | | | $ | 5,292 | | | 21,026 | |
| Deferred origination costs and unamortized premium/(discount) | | | | | | | | | | | | | | 81 | |
| Allowance for loan losses | | | | | | | | | | | | | | (1,335) | |
| Total Private Education Loans, net | | | | | | | | | | | | | | $ | 19,772 | |
| | | | | | | | | | | | | | | |
| Loans in forbearance as a percentage of total Private Education Loans in repayment and forbearance | | 1.21 | % | | 0.35 | % | | 0.19 | % | | 0.13 | % | | 0.18 | % | | — | % | | 2.06 | % |
| | | | | | | | | | | | | | | | | | | | | | | | | | | | | | | | | | | | | | | | | | | | |
As of December 31, 2022
(dollars in millions) | | Private Education Loans Held for Investment
Aged by Number of Months in Active Repayment Status | | Not Yet in
Repayment | | Total |
| 0 to 12 | | 13 to 24 | | 25 to 36 | | 37 to 48 | | More than 48 | |
| Loans in-school/grace/deferment | | $ | — | | | $ | — | | | $ | — | | | $ | — | | | $ | — | | | $ | 4,895 | | | $ | 4,895 | |
| Loans in forbearance | | 165 | | | 43 | | | 26 | | | 19 | | | 26 | | | — | | | 279 | |
| Loans in repayment - current | | 4,131 | | | 3,393 | | | 2,129 | | | 1,603 | | | 3,303 | | | — | | | 14,559 | |
| Loans in repayment - delinquent 30-59 days | | 80 | | | 58 | | | 44 | | | 31 | | | 74 | | | — | | | 287 | |
| Loans in repayment - delinquent 60-89 days | | 43 | | | 30 | | | 20 | | | 17 | | | 38 | | | — | | | 148 | |
| Loans in repayment - 90 days or greater past due | | 41 | | | 27 | | | 20 | | | 14 | | | 34 | | | — | | | 136 | |
| Total | | $ | 4,460 | | | $ | 3,551 | | | $ | 2,239 | | | $ | 1,684 | | | $ | 3,475 | | | $ | 4,895 | | | 20,304 | |
| Deferred origination costs and unamortized premium/(discount) | | | | | | | | | | | | | | 70 | |
| Allowance for loan losses | | | | | | | | | | | | | | (1,354) | |
| Total Private Education Loans, net | | | | | | | | | | | | | | $ | 19,020 | |
| | | | | | | | | | | | | | | |
| Loans in forbearance as a percentage of total Private Education Loans in repayment and forbearance | | 1.07 | % | | 0.28 | % | | 0.17 | % | | 0.12 | % | | 0.17 | % | | — | % | | 1.81 | % |
2024 Form 10-K — SLM CORPORATION 67
Private Education Loans Held for Investment Types
The following table provides information regarding the loans in repayment balance and total loan balance by Private Education Loan held for investment product type for the years ended December 31, 2024 and 2023.
| | | | | | | | | | | | | | | | | | | | | | | | | | | | | | | | |
| As of December 31, 2024 (dollars in thousands) | | | | | | Smart Option | | | | Graduate
Loan | | Other(1) | | Total |
$ in repayment(2) | | | | | | $ | 14,273,952 | | | | | $ | 1,466,915 | | | $ | 365,884 | | | $ | 16,106,751 | |
| $ in total | | | | | | $ | 19,710,266 | | | | | $ | 2,067,468 | | | $ | 457,274 | | | $ | 22,235,008 | |
| | | | | | | | | | | | | | | | | | | | | | | | | | | | | | | | |
| As of December 31, 2023 (dollars in thousands) | | | | | | Smart Option | | | | Graduate
Loan | | Other(1) | | Total |
$ in repayment(2) | | | | | | $ | 13,747,153 | | | | | $ | 1,243,129 | | | $ | 419,532 | | | $ | 15,409,814 | |
| $ in total | | | | | | $ | 18,764,200 | | | | | $ | 1,750,814 | | | $ | 510,830 | | | $ | 21,025,844 | |
(1) Other includes our Parent Loan and Career training loan products. In December 2021, we discontinued offering our Parent Loan product. Applications for those loans received before the offering termination date continued to be processed, and final disbursements under those loans occurred in February 2023. In May 2022, we discontinued offering our Career Training loan product. Applications for those loans received before the offering termination date continued to be processed, and final disbursements under those loans occurred in September 2023.
(2) Loans in repayment include loans on which borrowers are making interest only or fixed payments, as well as loans that have entered full principal and interest repayment status after any applicable grace period (but, for purposes of the table, do not include those loans while they are in forbearance).
Accrued Interest Receivable
The following table provides information regarding accrued interest receivable on our Private Education Loans. The table also discloses the amount of accrued interest on loans 90 days or greater past due as compared to our allowance for uncollectible interest. The majority of the total accrued interest receivable represents accrued interest on deferred loans where no payments are due while the borrower is in school and fixed-pay loans where the borrower makes a $25 monthly payment that is smaller than the interest accruing on that loan in that month. The accrued interest on these loans will be capitalized to the balance of the loans when the borrower exits the grace period after separation from school. The allowance for credit losses considers both the collectibility of principal and accrued interest. The allowance for uncollectible interest estimates the additional uncollectible interest that is not captured in the allowance for credit losses.
| | | | | | | | | | | | | | | | | | | | |
| | Private Education Loans |
| | | Accrued Interest Receivable |
| (Dollars in thousands) | | Total Interest Receivable | | 90 Days or Greater
Past Due | | Allowance for Uncollectible Interest(1) |
| December 31, 2024 | | $ | 1,549,415 | | | $ | 6,420 | | | $ | 12,366 | |
| December 31, 2023 | | $ | 1,354,565 | | | $ | 8,373 | | | $ | 9,897 | |
| December 31, 2022 | | $ | 1,177,562 | | | $ | 6,609 | | | $ | 8,121 | |
| December 31, 2021 | | $ | 1,187,123 | | | $ | 3,635 | | | $ | 4,937 | |
| December 31, 2020 | | $ | 1,168,895 | | | $ | 4,354 | | | $ | 4,467 | |
(1) The allowance for uncollectible interest at December 31, 2024, 2023, 2022, 2021, and 2020 represents the expected losses related to the portion of accrued interest receivable on those loans that are in repayment (at December 31, 2024, 2023, 2022, 2021, and 2020, relates to $164 million, $151 million, $240 million, $240 million, and $196 million, respectively, of accrued interest receivable) that is/was not expected to be capitalized. The accrued interest receivable that is/was expected to be capitalized ($1.4 billion, $1.2 billion, $937 million, $947 million, and $973 million, respectively, at December 31, 2024, 2023, 2022, 2021, and 2020) is/was reserved for in the allowance for credit losses.
2024 Form 10-K — SLM CORPORATION 68
Liquidity and Capital Resources
Funding and Liquidity Risk Management
Our primary liquidity needs include our ongoing ability to fund our businesses throughout market cycles, including during periods of financial stress, our ongoing ability to fund originations of Private Education Loans, and our ability to meet any outflows of our Bank deposits. To achieve these objectives, we analyze and monitor our liquidity needs, and maintain excess liquidity and access to diverse funding sources, such as deposits at the Bank, issuance of secured debt primarily through asset-backed securitizations, other financing facilities, and loan sales.
At December 31, 2024 and December 31, 2023, our sources of liquidity included liquid investments with unrealized losses of $105.8 million and $128.9 million, respectively. It is our policy to manage operations so liquidity needs are fully satisfied through normal operations to avoid unplanned loan or liquid investment sales under all but the most dire emergency conditions. Our liquidity management is governed by policies approved by our Board of Directors. Oversight of these policies is performed in the Asset and Liability Committee, a management-level committee. These policies take into account the volatility of cash flow forecasts, expected asset and liability maturities, anticipated loan demand, and a variety of other factors to establish minimum liquidity guidelines.
Key risks associated with our liquidity relate to our ability to access the capital markets and the markets for bank deposits at reasonable rates. This ability may be affected by our performance, competitive pressures, the macroeconomic environment, and the impact they have on the availability of funding sources in the marketplace. We target maintaining sufficient on-balance sheet and contingent sources of liquidity to enable us to meet all contractual and contingent obligations under various stress scenarios, including severe macroeconomic stresses as well as specific stresses that test the resiliency of our balance sheet. We hold a significant liquidity buffer of cash and securities, which we expect to maintain through 2025. Due to the seasonal nature of our business, our liquidity levels will likely vary from quarter to quarter.
Sources of Liquidity and Available Capacity
Ending Balances
| | | | | | | | | | | | | | | | | | | | |
As of December 31,
(dollars in thousands) | | 2024 | | 2023 | | 2022 |
| Sources of primary liquidity: | | | | | | |
| Unrestricted cash and liquid investments: | | | | | | |
| Holding Company and other non-bank subsidiaries | | $ | 3,745 | | | $ | 3,224 | | | $ | — | |
Sallie Mae Bank(1) | | 4,696,621 | | | 4,146,614 | | | 4,617,533 | |
| Available-for-sale investments | | 1,361,431 | | | 1,988,295 | | | 2,012,901 | |
| Total unrestricted cash and liquid investments | | $ | 6,061,797 | | | $ | 6,138,133 | | | $ | 6,630,434 | |
(1) This amount will be used primarily to originate Private Education Loans at the Bank.
Average Balances
| | | | | | | | | | | | | | | | | | | | |
Years Ended December 31,
(dollars in thousands) | | 2024 | | 2023 | | 2022 |
| Sources of primary liquidity: | | | | | | |
| Unrestricted cash and liquid investments: | | | | | | |
| Holding Company and other non-bank subsidiaries | | $ | 8,698 | | | $ | 6,827 | | | $ | 7,954 | |
Sallie Mae Bank(1) | | 4,504,167 | | | 4,014,444 | | | 4,080,312 | |
| Available-for-sale investments | | 1,647,113 | | | 1,975,754 | | | 2,230,118 | |
| Total unrestricted cash and liquid investments | | $ | 6,159,978 | | | $ | 5,997,025 | | | $ | 6,318,384 | |
(1) This amount will be used primarily to originate Private Education Loans at the Bank.
2024 Form 10-K — SLM CORPORATION 69
Deposits
The following table summarizes total deposits.
| | | | | | | | | | | | | | | |
As of December 31,
(dollars in thousands) | | 2024 | | | 2023 |
| Deposits - interest-bearing | | $ | 21,066,752 | | | | $ | 21,651,657 | |
| Deposits - non-interest-bearing | | 1,816 | | | | 1,531 | |
| Total deposits | | $ | 21,068,568 | | | | $ | 21,653,188 | |
Our total deposits of $21.1 billion were comprised of $9.5 billion in brokered deposits and $11.6 billion in retail and other deposits at December 31, 2024, compared with total deposits of $21.7 billion, which were comprised of $10.3 billion in brokered deposits and $11.4 billion in retail and other deposits, at December 31, 2023.
Interest-bearing deposits as of December 31, 2024 and 2023 consisted of retail and brokered non-maturity savings deposits, retail and brokered non-maturity money market deposit accounts (“MMDAs”), and retail and brokered CDs. Interest-bearing deposits also include deposits from Educational 529 and Health Savings plans that diversify our funding sources and that we consider to be core. These and other large omnibus accounts, aggregating the deposits of many individual depositors, represented $7.0 billion of our deposit total as of December 31, 2024, compared with $7.6 billion at December 31, 2023. The omnibus accounts are structured in such a way that entitles the individual depositor pass-through deposit insurance (subject to FDIC rules and limitations), and the majority of these deposits have contractual minimum balances and maturity terms.
Some of our deposit products are serviced by third-party providers. Placement fees associated with the brokered CDs are amortized into interest expense using the effective interest rate method. We recognized placement fee expense of $11 million, $12 million, and $13 million in the years ended December 31, 2024, 2023, and 2022, respectively. Fees paid to third-party brokers related to brokered CDs were $8 million, $8 million, and $13 million during the years ended December 31, 2024, 2023, and 2022, respectively.
Interest-bearing deposits at December 31, 2024 and 2023 are summarized as follows:
| | | | | | | | | | | | | | | | | | | | | | | | | | | | | |
| | 2024 | | 2023 | |
As of December 31,
(dollars in thousands) | | Amount | | Year-End Weighted Average Stated Rate(1) | | Amount | | Year-End Weighted Average Stated Rate(1) | |
| | | | | | | | | |
| Money market | | $ | 9,582,290 | | | 4.27 | % | | $ | 10,258,292 | | | 4.85 | % | |
| Savings | | 944,034 | | | 4.02 | | | 945,000 | | | 4.35 | | |
| Certificates of deposit | | 10,540,428 | | | 4.20 | | | 10,448,365 | | | 3.69 | | |
| Deposits - interest-bearing | | $ | 21,066,752 | | | | | $ | 21,651,657 | | | | |
(1) Includes the effect of interest rate swaps in effective hedge relationships.
As of December 31, 2024 and 2023, there were $567 million and $478 million, respectively, of deposits exceeding FDIC insurance limits. Accrued interest on deposits was $92 million and $91 million at December 31, 2024 and 2023, respectively.
2024 Form 10-K — SLM CORPORATION 70
Counterparty Exposure
Counterparty exposure related to financial instruments arises from the risk that a lending, investment, or derivative counterparty will not be able to meet its obligations to us.
Excess cash is generally invested with the Federal Reserve Bank of San Francisco (the “FRB”) on an overnight basis or in the FRB’s Term Deposit Facility, minimizing counterparty exposure on cash balances.
Our investment portfolio is primarily comprised of a small portfolio of mortgage-backed securities issued by government agencies and government-sponsored enterprises that are purchased to meet CRA targets. Additionally, our investing activity is governed by Board-approved limits on the amount that is allowed to be invested with any one issuer based on the credit rating of the issuer, further minimizing our counterparty exposure. Counterparty credit risk is considered when valuing investments and considering impairment.
Related to derivative transactions, protection against counterparty risk is generally provided by International Swaps and Derivatives Association, Inc. Credit Support Annexes (“CSAs”), or clearinghouses for over-the-counter derivatives. CSAs require a counterparty to post collateral if a potential default would expose the other party to a loss. All derivative contracts entered into by the Bank are covered under CSAs or clearinghouse agreements and require collateral to be exchanged based on the net fair value of derivatives with each counterparty. Our exposure to the counterparty is limited to the value of the derivative contracts in a gain position, less any collateral held by us and plus collateral posted with the counterparty.
Title VII of the Dodd-Frank Act requires all standardized derivatives, including most interest rate swaps, to be submitted for clearing to central counterparties to reduce counterparty risk. Two of the central counterparties we use are the CME and the LCH. All variation margin payments on derivatives cleared through the CME and LCH are accounted for as legal settlement. As of December 31, 2024, $850 million notional of our derivative contracts were cleared on the CME and $71 million were cleared on the LCH. The derivative contracts cleared through the CME and LCH represent 92.3 percent and 7.7 percent, respectively, of our total notional derivative contracts of $921 million at December 31, 2024.
For derivatives cleared through the CME and LCH, the net gain (loss) position includes the variation margin amounts as settlement of the derivative and not collateral against the fair value of the derivative. The amount of variation margin included as settlement as of December 31, 2024 was $(22) million and $(1) million for the CME and LCH, respectively. Changes in fair value for derivatives not designated as hedging instruments are presented as realized gains (losses).
Our exposure to the counterparty is limited to the value of the derivative contracts in a gain position less any collateral held and plus any collateral posted. When there is a net negative exposure, we consider our exposure to the counterparty to be zero. At December 31, 2024 and 2023, we had a net positive exposure (derivative gain/loss positions to us, less collateral held by us and plus collateral posted with counterparties) related to derivatives of $5 million and $9 million, respectively.
We have liquidity exposure related to collateral movements between us and our derivative counterparties. Movements in the value of the derivatives, which are primarily affected by changes in interest rates, may require us to return cash collateral held or may require us to access primary liquidity to post collateral to counterparties.
The table below highlights exposure related to our derivative counterparties as of December 31, 2024.
| | | | | | | | |
As of December 31, 2024
(dollars in thousands) | | SLM Corporation
and Sallie Mae Bank
Contracts |
| Total exposure, net of collateral | | $ | 4,839 | |
| Exposure to counterparties with credit ratings, net of collateral | | $ | 4,839 | |
| Percent of exposure to counterparties with credit ratings below S&P AA- or Moody’s Aa3 | | — | % |
| Percent of exposure to counterparties with credit ratings below S&P A- or Moody’s A3 | | — | % |
2024 Form 10-K — SLM CORPORATION 71
Regulatory Capital
The Bank is subject to various regulatory capital requirements administered by federal and state banking authorities. Failure to meet minimum capital requirements can initiate certain mandatory and possibly additional discretionary actions by regulators that, if undertaken, could have a direct material adverse effect on our business, results of operations, and financial position. Under U.S. Basel III and the regulatory framework for prompt corrective action, the Bank must meet specific capital standards that involve quantitative measures of its assets, liabilities, and certain off-balance sheet items as calculated under regulatory accounting practices. The Bank’s capital amounts and its classification under the prompt corrective action framework are also subject to qualitative judgments by the regulators about components of capital, risk weightings, and other factors.
Capital Management
The Bank intends to maintain at all times regulatory capital levels that meet both the minimum levels required under U.S. Basel III (including applicable buffers) and the levels necessary to be considered “well capitalized” under the FDIC’s prompt corrective action framework, in order to support asset growth and operating needs, address unexpected credit risks, and protect the interests of depositors and the DIF administered by the FDIC. The Bank’s Capital Policy requires management to monitor these capital standards and the Bank’s compliance with them. The Board of Directors and management periodically evaluate the quality of assets, the stability of earnings, and the adequacy of the allowance for credit losses for the Bank. The Company is a source of strength for the Bank and will provide additional capital if necessary.
We believe that current and projected capital levels are appropriate for 2025. As of December 31, 2024, the Bank’s risk-based and leverage capital ratios exceed the required minimum ratios and the applicable buffers under the fully phased-in U.S. Basel III standards as well as the “well capitalized” standards under the prompt corrective action framework.
Under U.S. Basel III, the Bank is required to maintain the following minimum regulatory capital ratios: a Common Equity Tier 1 risk-based capital ratio of 4.5 percent, a Tier 1 risk-based capital ratio of 6.0 percent, a Total risk-based capital ratio of 8.0 percent, and a Tier 1 leverage ratio of 4.0 percent. In addition, the Bank is subject to a Common Equity Tier 1 capital conservation buffer of greater than 2.5 percent. Failure to maintain the buffer will result in restrictions on the Bank’s ability to make capital distributions, including the payment of dividends, and to pay discretionary bonuses to executive officers. Including the buffer, the Bank is required to maintain the following capital ratios under U.S. Basel III in order to avoid such restrictions: a Common Equity Tier 1 risk-based capital ratio of greater than 7.0 percent, a Tier 1 risk-based capital ratio of greater than 8.5 percent, and a Total risk-based capital ratio of greater than 10.5 percent.
To qualify as “well capitalized” under the prompt corrective action framework for insured depository institutions, the Bank must maintain a Common Equity Tier 1 risk-based capital ratio of at least 6.5 percent, a Tier 1 risk-based capital ratio of at least 8.0 percent, a Total risk-based capital ratio of at least 10.0 percent, and a Tier 1 leverage ratio of at least 5.0 percent.
In July 2023, the federal banking agencies proposed a rule to implement significant changes to the U.S. Basel Ill regulatory capital requirements. The proposed changes to the regulatory capital requirements generally would amend or introduce approaches and methodologies that would apply to banking organizations with total consolidated assets of $100 billion or more or to banking organizations with significant trading activity. The proposed rule therefore would not affect the Bank's capital requirements or the calculation of its capital ratios.
Under regulations issued by the FDIC and other federal banking agencies, banking organizations that adopted CECL during the 2020 calendar year, including the Bank, could elect to delay for two years, and then phase in over the following three years, the effects on regulatory capital of CECL relative to the incurred loss methodology. The Bank elected to use this option. Therefore, the regulatory capital impact of the Bank’s transition adjustments recorded on January 1, 2020 from the adoption of CECL, and 25 percent of the ongoing impact of CECL on the Bank’s allowance for credit losses, retained earnings, and average total consolidated assets, each as reported for regulatory capital purposes (collectively, the “adjusted transition amounts”), were deferred for the two-year period ending January 1, 2022. On each of January 1, 2022, 2023, and 2024, 25 percent of the adjusted transition amounts was phased in for regulatory capital purposes. On January 1, 2025, the remaining 25 percent of the adjusted transition amounts was phased in for regulatory capital purposes, with the phased-in amounts included in regulatory capital at the beginning of the year. The Bank’s January 1, 2020 CECL transition amounts increased our allowance for credit losses by $1.1 billion, increased the liability representing our off-balance sheet exposure for unfunded commitments by $116 million, and increased our deferred tax asset by $306 million, resulting in a cumulative effect adjustment that reduced retained earnings by $953 million. This
2024 Form 10-K — SLM CORPORATION 72
transition adjustment was inclusive of qualitative adjustments incorporated into our CECL allowance as necessary, to address any limitations in the models used.
At December 31, 2024, the adjusted transition amounts that were deferred and are being phased in for regulatory capital purposes are as follows:
| | | | | | | | | | | | | | | | | | | | | | | | | | | | | | | | |
| | Adjusted
Transition Amounts | | Phase-In
Amounts for the Year Ended | | Phase-In
Amounts for the Year Ended | | Phase-In
Amounts for the Year Ended | | Remaining Adjusted Transition Amounts to be Phased-In |
| (Dollars in thousands) | | December 31, 2021 | | December 31, 2022 | | December 31, 2023 | | December 31, 2024 | | December 31, 2024 |
| | | | | | | | | | |
| Retained earnings | | $ | 836,351 | | | $ | (209,088) | | | $ | (209,088) | | | $ | (209,088) | | | $ | 209,087 | |
| Allowance for credit losses | | 1,038,145 | | | (259,536) | | | (259,536) | | | (259,536) | | | 259,537 | |
| Liability for unfunded commitments | | 104,377 | | | (26,094) | | | (26,094) | | | (26,095) | | | 26,094 | |
| Deferred tax asset | | 306,171 | | | (76,542) | | | (76,542) | | | (76,543) | | | 76,544 | |
The Bank’s required and actual regulatory capital amounts and ratios, including applicable capital conservation buffers, under U.S. Basel III are shown in the following table. The following capital amounts and ratios are based upon the Bank’s average assets and risk-weighted assets, as indicated. The Bank has elected to exclude accumulated other comprehensive income related to both available-for-sale investments and swap valuations from Common Equity Tier 1 Capital. At December 31, 2024 and December 31, 2023, the unrealized loss on available-for-sale investments included in other comprehensive income totaled $83 million and $115 million, net of tax of $27 million and $37 million, respectively. The capital ratios would remain above the well capitalized thresholds, including applicable capital conservation buffers, if the unrealized loss became fully recognized into capital.
| | | | | | | | | | | | | | | | | | | | | | | |
| | | Actual | | U.S. Basel III Minimum Requirements Plus Buffer(1)(2) |
| (Dollars in thousands) | | Amount | Ratio | | Amount | | Ratio |
As of December 31, 2024(3): | | | | | | | |
| Common Equity Tier 1 Capital (to Risk-Weighted Assets) | | $ | 2,957,067 | | 11.3 | % | | $ | 1,827,318 | | > | 7.0 | % |
| Tier 1 Capital (to Risk-Weighted Assets) | | $ | 2,957,067 | | 11.3 | % | | $ | 2,218,886 | | > | 8.5 | % |
| Total Capital (to Risk-Weighted Assets) | | $ | 3,294,663 | | 12.6 | % | | $ | 2,740,976 | | > | 10.5 | % |
| Tier 1 Capital (to Average Assets) | | $ | 2,957,067 | | 9.7 | % | | $ | 1,213,505 | | > | 4.0 | % |
| | | | | | | |
As of December 31, 2023(3): | | | | | | | |
| Common Equity Tier 1 Capital (to Risk-Weighted Assets) | | $ | 3,019,973 | | 12.3 | % | | $ | 1,719,621 | | > | 7.0 | % |
| Tier 1 Capital (to Risk-Weighted Assets) | | $ | 3,019,973 | | 12.3 | % | | $ | 2,088,111 | | > | 8.5 | % |
| Total Capital (to Risk-Weighted Assets) | | $ | 3,334,140 | | 13.6 | % | | $ | 2,579,432 | | > | 10.5 | % |
| Tier 1 Capital (to Average Assets) | | $ | 3,019,973 | | 10.2 | % | | $ | 1,184,213 | | > | 4.0 | % |
(1) Reflects the U.S. Basel III minimum required ratio plus the applicable capital conservation buffer.
(2) The Bank’s regulatory capital ratios also exceeded all applicable standards for the Bank to qualify as “well capitalized” under the prompt corrective action framework.
(3) For December 31, 2024 and 2023, the actual amounts and the actual ratios include the respective adjusted transition amounts discussed above that were phased in at the beginning of 2024 and 2023.
2024 Form 10-K — SLM CORPORATION 73
Dividends
The Bank is chartered under the laws of the State of Utah and its deposits are insured by the FDIC. The Bank’s ability to pay dividends is subject to the laws of Utah and the regulations of the FDIC. Generally, under Utah’s industrial bank laws and regulations as well as FDIC regulations, the Bank may pay dividends from its net profits without regulatory approval if, following the payment of the dividend, the Bank’s capital and surplus would not be impaired. The Company relies on dividends from the Bank, as necessary, to enable the Company to pay any declared dividends and other payments and consummate share repurchases, as described herein. The Bank declared $570 million, $550 million, and $700 million in dividends to the Company for the years ended December 31, 2024, 2023, and 2022, respectively, with the proceeds primarily used to fund share repurchase programs and stock dividends. We expect that the Bank will pay dividends to the Company as may be necessary to enable the Company to pay any declared dividends on its Series B Preferred Stock and common stock and to consummate any common share repurchases by the Company under the share repurchase programs. See Item 1A. “Risk Factors — GENERAL RISKS” for possible limitations on the payments of our dividends.
Borrowings
Outstanding borrowings consist of unsecured debt and secured borrowings issued through our term ABS program and our Secured Borrowing Facility. The issuing entities for those secured borrowings are variable interest entities and are consolidated for accounting purposes. The following table summarizes our secured borrowings at December 31, 2024 and 2023. For additional information, see Notes to Consolidated Financial Statements, Note 10, “Borrowings” in this Form 10-K.
| | | | | | | | | | | | | | | | | | | | | | | | | | | | | | | | | | | | | | |
| | 2024 | | 2023 |
As of December 31,
(dollars in thousands) | | Short-Term | | Long-Term | | Total | | Short-Term | | Long-Term | | Total |
| Unsecured borrowings: | | | | | | | | | | | | |
| Unsecured debt (fixed-rate) | | $ | — | | | $ | 995,420 | | | $ | 995,420 | | | $ | — | | | $ | 992,200 | | | $ | 992,200 | |
| Total unsecured borrowings | | — | | | 995,420 | | | 995,420 | | | — | | | 992,200 | | | 992,200 | |
| | | | | | | | | | | | |
| Secured borrowings: | | | | | | | | | | | | |
| Private Education Loan term securitizations: | | | | | | | | | | | | |
| Fixed-rate | | — | | | 4,617,743 | | | 4,617,743 | | | — | | | 3,585,254 | | | 3,585,254 | |
| Variable-rate | | — | | | 827,182 | | | 827,182 | | | — | | | 650,058 | | | 650,058 | |
| Total Private Education Loan term securitizations | | — | | | 5,444,925 | | | 5,444,925 | | | — | | | 4,235,312 | | | 4,235,312 | |
| Secured Borrowing Facility | | — | | | — | | | — | | | — | | | — | | | — | |
| Total secured borrowings | | — | | | 5,444,925 | | | 5,444,925 | | | — | | | 4,235,312 | | | 4,235,312 | |
| Total | | $ | — | | | $ | 6,440,345 | | | $ | 6,440,345 | | | $ | — | | | $ | 5,227,512 | | | $ | 5,227,512 | |
Short-term Borrowings
Secured Financings
On June 14, 2024, we amended our $2 billion maximum financing Secured Borrowing Facility to extend the maturity. We hold 100 percent of the residual interest in the Secured Borrowing Facility trust. The amendment extended the revolving period, during which we may borrow, repay, and reborrow funds, until June 13, 2025. The scheduled amortization period, during which amounts outstanding under the Secured Borrowing Facility must be repaid, ends on June 13, 2026 (or earlier, if certain material adverse events occur). The one-year revolving period plus the one-year amortization period results in a contractual maturity that is two years from the date of inception or renewal; however, we classify advances under our Secured Borrowing Facility as short-term borrowings because it is our intention to repay those advances within one year. For the years ended December 31, 2024 and 2023, there were no outstanding short-term borrowings under the Secured Borrowing Facility. For additional information, see Notes to Consolidated Financial Statements, Note 10, “Borrowings” in this Form 10-K.
2024 Form 10-K — SLM CORPORATION 74
Long-term Borrowings
Unsecured Financing Transactions
On October 29, 2020, we issued at par $500 million of 4.20 percent unsecured Senior Notes due October 29, 2025. This unsecured borrowing remained classified as long-term as of December 31, 2024 in accordance with our ability and intent to refinance the debt on a long-term basis. At December 31, 2024, the outstanding balance was $499 million. On February 18, 2025, we redeemed these Senior Notes. See Notes to Consolidated Financial Statements, Note 23, “Subsequent Events” in this Form 10-K for additional information.
On November 1, 2021, we issued $500 million of 3.125 percent unsecured Senior Notes due November 2, 2026, at a price of 99.43 percent. At December 31, 2024, the outstanding balance was $496 million.
On January 31, 2025, we issued $500 million of 6.50 percent unsecured Senior Notes due January 31, 2030. For additional information, see Notes to Consolidated Financial Statements, Note 23, “Subsequent Events” in this Form 10-K.
Secured Financing Transactions
The following summarizes those Private Education Loan Trust term ABS issued in 2023 and 2024 in which we retained 100 percent of the residual class certificates.
| | | | | | | | | | | | | | | | | | | | | | | | | | | | | | | | | | | | | | | | |
| SMB Private Education Loan Trust | | Date Closed | | Loans Transferred to the Trust(1) | | Notes Issued | | Gross
Proceeds | | Weighted Average Cost of Funds(2) | | Weighted Average Life
(in years) of Class A and Class B Notes | | |
| (Dollars in thousands) | | | | | | | | | | | | | | |
| | | | | | | | | | | | | | |
| | | | | | | | | | | | | | |
| | | | | | | | | | | | | | |
| | | | | | | | | | | | |
| | | | | | | | | | | | | | |
| | | | | | | | | | | | | | |
| | | | | | | | | | | | | | |
| | | | | | | | | | | | | | |
| | | | | | | | | | | | | | |
| | | | | | | | | | | | | | |
| | | | | | | | | | | | |
| | | | | | | | | | | | | | |
| | | | | | | | | | | | | | |
| | | | | | | | | | | | | | |
| | | | | | | | | | | | | | |
| | | | | | | | | | | | |
| | | | | | | | | | | | | | |
| 2023-A ABS Transaction | | March 15, 2023 | | $ | 644,573 | | | $ | 579,000 | | | $ | 571,910 | | | SOFR plus 1.53% | | 5.06 | | |
| 2023-C ABS Transaction | | August 16, 2023 | | 647,934 | | | 568,000 | | | 567,881 | | | SOFR plus 1.69% | | 4.93 | | |
| Total 2023 | | | | $ | 1,292,507 | | | $ | 1,147,000 | | | $ | 1,139,791 | | | | | | | |
| | | | | | | | | | | | | | |
| 2024-C ABS Transaction | | May 15, 2024 | | $ | 733,644 | | | $ | 668,000 | | | $ | 667,888 | | | SOFR plus 1.19% | | 5.36 | | |
| 2024-E ABS Transaction | | August 14, 2024 | | 944,645 | | | 868,000 | | | 867,743 | | | SOFR plus 1.42% | | 5.17 | | |
| 2024-F ABS Transaction | | November 6, 2024 | | 732,445 | | | 680,000 | | | 679,981 | | | SOFR plus 1.08% | | 5.09 | | |
| Total 2024 | | | | $ | 2,410,734 | | | $ | 2,216,000 | | | $ | 2,215,612 | | | | | | | |
(1)The transfer of such loans did not qualify for sale treatment and thus remain on our consolidated balance sheet. At December 31, 2024, the following Private Education Loan amounts remain encumbered related to these transactions:
| | | | | | | | | | | | | | | | | | | | |
| SMB Private Education Loan Trust | | Loan Principal | | Capitalized
Interest | | Total Loans |
| (Dollars in thousands) | | | | | | |
| 2023-A ABS Transaction | | $ | 484,551 | | | $ | 32,856 | | | $ | 517,407 | |
| 2023-C ABS Transaction | | 516,507 | | | 35,287 | | | 551,794 | |
| Total 2023 | | $ | 1,001,058 | | | $ | 68,143 | | | $ | 1,069,201 | |
| | | | | | |
| 2024-C ABS Transaction | | $ | 646,550 | | | 52,968 | | | $ | 699,518 | |
| 2024-E ABS Transaction | | 841,355 | | | 69,238 | | | 910,593 | |
| 2024-F ABS Transaction | | 662,361 | | | 55,131 | | | 717,492 | |
| Total 2024 | | $ | 2,150,266 | | | 177,337 | | | $ | 2,327,603 | |
(2)Represents SOFR equivalent cost of funds for variable and fixed-rate bonds, excluding issuance costs.
2024 Form 10-K — SLM CORPORATION 75
Pre-2023 Transactions
Prior to 2023, we executed a total of $10.38 billion in ABS transactions that were accounted for as secured financings. At December 31, 2024, $3.74 billion of our Private Education Loans, including $3.63 billion of principal and $107 million in capitalized interest, were encumbered as a result of these transactions.
Other Borrowing Sources
We maintain discretionary uncommitted Federal Funds lines of credit with various correspondent banks, which totaled $125 million at December 31, 2024. The interest rate we are charged on these lines of credit is priced at Fed Funds plus a spread at the time of borrowing, and is payable daily. We did not utilize these lines of credit in the years ended December 31, 2024 and 2023.
We established an account at the FRB to meet eligibility requirements for access to the Primary Credit borrowing facility at the FRB’s Discount Window (the “Window”). The Primary Credit borrowing facility is a lending program available to depository institutions that are in generally sound financial condition. All borrowings at the Window must be fully collateralized. We can pledge asset-backed and mortgage-backed securities, as well as Private Education Loans, to the FRB as collateral for borrowings at the Window. Generally, collateral value is assigned based on the estimated fair value of the pledged assets. At December 31, 2024 and December 31, 2023, the value of our pledged collateral at the FRB was $2.2 billion and $1.6 billion, respectively. The interest rate charged to us is the discount rate set by the FRB. We did not utilize this facility in the years ended December 31, 2024 and 2023.
Contractual Loan Commitments
When we approve a Private Education Loan at the beginning of an academic year, that approval may cover the borrowing for the entire academic year. As such, we do not always disburse the full amount of the loan at the time of such approval, but instead have a commitment to fund a portion of the loan at a later date (usually at the start of the second semester or subsequent trimesters). We estimate expected credit losses over the contractual period in which we are exposed to credit risk via a contractual obligation to extend credit, unless that obligation is unconditionally cancellable by us. At December 31, 2024, we had $2.3 billion of outstanding contractual loan commitments which we expect to fund during the remainder of the 2024/2025 academic year. At December 31, 2024, we had an $85 million reserve recorded in “Other Liabilities” to cover lifetime expected credit losses on the unfunded commitments.
Contractual Cash Obligations
In addition to our contractual loan commitments, we have certain other contractual cash obligations and commitments. These include contractual principal obligations associated with long-term Bank deposits, secured borrowings, unsecured debt, and lease obligations. Our material contractual cash obligations relate to Bank deposits. At December 31, 2024, we had $7.8 billion of principal obligations related to Bank deposits due in the next year, and $7.7 billion due thereafter. At December 31, 2024, our contractual cash obligations due in the next year for secured borrowings, unsecured debt, and lease obligations were $824 million, $500 million, and $7 million, respectively, and our contractual cash obligations due thereafter for our secured borrowings, unsecured debt, and lease obligations were $4.6 billion, $500 million, and $27 million, respectively.
Common Stock
Our shareholders have authorized the issuance of 1.125 billion shares of common stock (par value of $0.20). At December 31, 2024, 210 million shares were issued and outstanding and 33 million shares were unissued but encumbered for outstanding stock options, restricted stock, restricted stock units, performance stock units, and dividend equivalent units for employee compensation and remaining authority for stock-based compensation plans. See Notes to Consolidated Financial Statements, Note 12, “Stockholders’ Equity” in this Form 10-K for additional details.
2024 Form 10-K — SLM CORPORATION 76
Critical Accounting Policies and Estimates
Management’s Discussion and Analysis of Financial Condition and Results of Operations addresses our consolidated financial statements, which have been prepared in accordance with GAAP. Notes to Consolidated Financial Statements, Note 2, “Significant Accounting Policies” in this Form 10-K includes a summary of the significant accounting policies and methods used in the preparation of our consolidated financial statements. The preparation of these financial statements requires management to make estimates and assumptions that affect the reported amounts of assets and liabilities and the reported amounts of income and expenses during the reporting periods. Actual results may differ from these estimates under varying assumptions or conditions. On a quarterly basis, management evaluates its estimates, particularly those that include the most difficult, subjective, or complex judgments and are often about matters that are inherently uncertain. The most significant judgments, estimates, and assumptions relate to the following critical accounting policies that are discussed in more detail below.
Allowance for Credit Losses
Allowance for Credit Losses
We maintain an allowance for credit losses for the lifetime expected credit losses on loans in our portfolios, as well as for future loan commitments, at the reporting date.
In determining the lifetime expected credit losses on our Private Education Loan portfolio loan segments, we use a discounted cash flow method. This method requires us to project future principal and interest cash flows on our loans in those portfolios.
To estimate the future expected cash flows, we use statistical loan-level models that consider life of loan expectations for defaults, prepayments, recoveries, and any other qualitative adjustments deemed necessary, to determine the adequacy of the allowance at each balance sheet date. These cash flows are discounted at the loan’s effective interest rate to calculate the present value of those cash flows. Management adjusts the effective interest rate used to discount expected cash flows to incorporate expected prepayments. The difference between the present value of those cash flows and the amortized cost basis of the underlying loans is the allowance for credit losses. Entities that measure credit losses based on the present value of expected future cash flows are permitted to report the entire change in present value as credit loss expense, but may alternatively report the change in present value due to the passage of time as interest income. We have elected to report the entire change in present value as credit loss expense.
We estimate future default rates used in our current expected credit losses at a loan level using historical loss experience, current borrower characteristics, current conditions, and economic factors forecasted over a reasonable and supportable period. At the end of the reasonable and supportable forecast period, we immediately revert our forecasted economic factors to long-term historical averages. We estimate future prepayment speeds used in our current expected credit losses at a loan level using historical prepayment experience, current borrower characteristics, current conditions, and economic factors forecasted over a reasonable and supportable period.
The reasonable and supportable forecast period is meant to represent the period in which we believe we can estimate the impact of forecasted economic factors in our expected losses. We use a two-year reasonable and supportable forecast period, although this period is subject to change as our view evolves on our ability to reasonably forecast economic conditions to estimate future losses.
In estimating future default rates and prepayment speeds in our current expected credit losses, we use a combination of expected economic scenarios coupled with our historical experience and adjust for any qualitative factors (as described below). We also develop an adverse and favorable economic scenario. At each reporting date, we determine the appropriate weighting of these alternate scenarios based upon the current economic conditions and our view of the risks of alternate outcomes. This weighting of expectations is used in calculating our current expected credit losses recorded each period.
We obtain forecasts for these inputs from Moody’s Analytics. Moody’s Analytics provides a range of forecasts for each of these inputs with various likelihoods of occurrence. We determine which forecasts we will include in our estimation of allowance for credit losses and the associated weightings for each of these inputs. At December 31, 2024, December 31, 2023, and December 31, 2022, we used the Baseline (50th percentile likelihood of occurring)/S1 (stronger near-term growth scenario - 10 percent likelihood of occurring)/S3 (unfavorable (or downside) scenario - 10 percent likelihood of occurring) scenarios and weighted them 40 percent, 30 percent, and 30 percent, respectively. Management reviews both the scenarios and their respective weightings each quarter in determining the allowance for credit losses.
In estimating recoveries, we use both estimates of what we expect to receive from the sale of defaulted loans as well as historical borrower payment behavior to estimate the timing and amount of future recoveries on charged-off loans.
2024 Form 10-K — SLM CORPORATION 77
In addition to the above modeling approach, we also take certain other qualitative factors into consideration when calculating the allowance for credit losses, which could result in management overlays (increases or decreases to the allowance for credit losses). These management overlays can encompass a broad array of factors not captured by model inputs, including, but not limited to, changes in lending policies and procedures, including changes in underwriting standards, changes in servicing policies and collection administration practices, including the loan modification program changes implemented in the fourth quarter of 2023, state law changes that could impact servicing and collection practices, charge-offs, recoveries not already included in the analysis, the effect of other external factors such as legal and regulatory requirements on the level of estimated current expected credit losses, the performance of the model over time versus actual losses, and any other operational or regulatory changes that could affect our estimate of future losses.
The evaluation of the allowance for credit losses is inherently subjective, as it requires material estimates that may be susceptible to significant changes. If actual future performance in delinquency, charge-offs, and recoveries is significantly different than estimated, or management assumptions or practices were to change, this could materially affect the estimate of the allowance for credit losses, the timing of when losses are recognized, and the related provision for credit losses in our consolidated statements of income.
When calculating our allowance for credit losses and liability for unfunded commitments, we incorporate several inputs that are subject to change period to period. These include, but are not limited to, CECL model inputs and any overlays deemed necessary by management. The most impactful CECL model inputs include:
•Economic forecasts;
•Weighting of economic forecasts; and
•Recovery rates.
Of the model inputs outlined above, economic forecasts, weighting of economic forecasts, and recovery rates are subject to estimation uncertainty, and changes in these inputs could have a material impact to our allowance for credit losses and the related provision for credit losses.
In the fourth quarter of 2022, we changed our loss model to include forecasts of college graduate unemployment, retail sales, and median family income in determining the adequacy of the allowance for credit losses. Prior to this change, we included forecasts of college graduate unemployment and the Consumer Price Index in our loss forecasting models.
In 2023, we experienced slower prepayment rates due to the rising interest rate environment. Historically, when rates rise, loan prepayments decline due to a reduction in consolidation activity of our borrowers to third party lenders, and when rates decline, loan prepayments rise due to an increase in consolidation activity of our borrowers to third party lenders. During 2023, our estimates of future prepayment speeds reflected the then current interest rate environment and future expectations of increased prepayment speeds in line with market expectations of a decline in interest rates based on the scenarios produced by Moody's Analytics described above. Slower prepayment speeds increase the allowance for credit losses because the loss rates applied in the future periods are applied to higher loan balances.
In the second quarter of 2024, we implemented a loan-level future default rate model that includes current portfolio characteristics and forecasts of real gross domestic product and college graduate unemployment. In the second quarter of 2024, we also implemented a future prepayment speeds model to include forecasts of real gross domestic product, retail sales, SOFR, and the U.S. 10-year treasury rate. These models reduce the reliance on certain qualitative overlays compared to the previous default rate and prepayment speeds models. Prior to these changes, our default rate and prepayment speeds models used forecasts of college graduate unemployment, retail sales, home price index, and median family income. Both the future default rate model and the future prepayment speeds model are used in determining the adequacy of the allowance for credit losses. The combined impact upon implementation of these model enhancements and the changes in the related qualitative overlays did not have a material impact on the overall level of our allowance for credit losses.
2024 Form 10-K — SLM CORPORATION 78
To demonstrate the sensitivity of the allowance for credit losses for our Private Education Loan portfolio to a more pessimistic forecast of expected economic outcomes, we considered what our allowance for credit losses would be if we applied a 100 percent probability weighting to the S3 unfavorable (or downside/90th percentile) scenario (with a concurrent 0 percent weighting for both the Baseline and S1 stronger near-term growth scenarios) under the range of scenarios noted above. Excluding consideration of qualitative adjustments, this sensitivity analysis would result in a hypothetical increase in our allowance for credit losses as of December 31, 2024 of $177 million or 11.6 percent. In addition, we also considered a 100 percent probability weighting to the S4 unfavorable (or downside/96th percentile) scenario (with a concomitant 0 percent weighting for both the Baseline and S1 stronger near-term growth scenarios) under the range of scenarios noted above. Excluding consideration of qualitative adjustments, this sensitivity analysis would result in a hypothetical increase in our allowance for credit losses as of December 31, 2024 of $274 million or 18.0 percent. These scenarios do not reflect our current expectations as of December 31, 2024, nor do they capture other qualitative adjustments or all the potential unknown variables that could arise in the forecast periods, but they provide an approximation of possible outcomes under hypothetical pessimistic conditions. The estimated impacts were calculated for the two-year reasonable and supportable periods, but were not calculated for the remaining periods since long-term assumptions used to calculate the allowance for the remaining periods are based on longer term averages and only change when we determine there is a fundamental change that will affect the long-term rate.
Below we describe in further detail our policies and procedures for the allowance for credit losses as they relate to our Private Education Loan portfolio. During the fourth quarter of 2024, we sold our remaining FFELP Loan portfolio to an unaffiliated third party. During the third quarter of 2022, we reclassified our Credit Card loan portfolio to loans held-for-sale and subsequently sold the Credit Card portfolio to a third party in May 2023.
Allowance for Private Education Loan Losses
In addition to the key assumptions/estimates described above, some estimates are unique to our Private Education Loan portfolio. Estimates are made on our Private Education Loans regarding when each borrower will separate from school. The cash flow timing of when a borrower will begin making full principal and interest payments is dependent upon when the student either graduates or leaves school. These dates can change based upon many factors. We receive information regarding projected graduation dates from a third-party clearinghouse. The separation from school date is updated quarterly based on updated information received from the clearinghouse.
Additionally, when we have a contractual obligation to fund a loan or a portion of a loan at a later date, we make an estimate regarding the percentage of this obligation that will be funded. This estimate is based on historical experience. For unfunded commitments, we recognize the related life of loan allowance as a liability. Once the loan is funded, that liability transfers to the allowance for Private Education Loan losses.
2024 Form 10-K — SLM CORPORATION 79
Key Credit Quality Indicators - Private Education Loans
We determine the collectability of our Private Education Loan portfolio by evaluating certain risk characteristics. We consider credit score at original approval and periodically refreshed/updated credit scores through the loan’s term, existence of a cosigner, loan status, and loan seasoning as the key credit quality indicators because they have the most significant effect on the determination of the adequacy of our allowance for credit losses. Credit scores are an indicator of the creditworthiness of borrowers, and the higher the credit scores the more likely it is the borrowers will be able to make all of their contractual payments. Loan status affects the credit risk because a past due loan is more likely to result in a credit loss than a current loan. Additionally, loans in the deferred payment status have different credit risk profiles compared with those in current pay status. Loan seasoning affects credit risk because a loan with a history of making payments generally has a lower incidence of default than a loan with a history of making infrequent or no payments. The existence of a cosigner lowers the likelihood of default as well. We monitor and update these credit quality indicators in the analysis of the adequacy of our allowance for credit losses on a quarterly basis.
In the second quarter of 2023, we changed how we collect on defaulted loans. Previously, we used a mix of in-house collectors and sales to third parties. We continue to sell a segment of defaulted loans immediately after charge-off but no longer sell retained defaulted loans (that have been subject to internal collection attempts for six months) to third parties and instead continue our collection efforts using in-house collectors and third-party collectors. This improved our estimate of recovery rates for the year ended December 31, 2023. When we estimate the timing and amount of future recoveries on charged-off loans, we no longer include expectations of future sales on retained defaulted loans. We continue to monitor how we collect on defaulted loans and may modify the approach from time to time based on performance, industry conventions, and/or regulatory feedback.
For December 31, 2022, we used both an estimate of recovery rates from in-house collections as well as expectations of future sales of defaulted loans to estimate the timing and amount of future recoveries on charged-off loans.
Private Education Loans generally do not require borrowers to begin principal and interest repayment until at least six months after the borrowers have graduated or otherwise separated from school. Consequently, the loss estimates for these loans are generally low while the borrower is in school and then increase upon the end of the grace period after separation from school. At December 31, 2024 and 2023, 26 percent and 25 percent, respectively, of the principal balance of the Private Education Loan portfolio was related to borrowers who were then in an in-school (fully deferred), grace, or other deferment status and not required to make payments.
Our collection policies for Private Education Loans allow for periods of nonpayment (forbearance) for certain borrowers requesting an extended grace period upon leaving school or experiencing temporary difficulty meeting payment obligations.
As part of concluding on the adequacy of the allowance for credit losses for Private Education Loans, we review key allowance and loan metrics. The most relevant of the metrics considered are the allowance coverage of net charge-offs ratio; the allowance as a percentage of ending total loans plus unfunded loan commitments and total accrued interest receivable; and delinquency and forbearance percentages.
We consider a Private Education Loan to be delinquent if the borrower has not made a required payment prior to the 31st day after such payment was contractually due.
Off-Balance Sheet Exposure for Contractual Loan Commitments
When we approve a Private Education Loan at the beginning of an academic year, that approval may cover the borrowing for the entire academic year. As such, we do not always disburse the full amount of the loan at the time of such approval, but instead have a commitment to fund a portion of the loan at a later date (usually the start of the second semester or subsequent trimesters). We estimate expected credit losses over the contractual period in which we are exposed to credit risk via a contractual obligation to extend credit, unless that obligation is unconditionally cancellable by us. The discounted cash flow approach described above includes expected future contractual disbursements. The portion of the allowance for credit losses related to future disbursements is shown as a liability on the face of the balance sheet, and related provision for credit losses is reflected on the income statement.
2024 Form 10-K — SLM CORPORATION 80
Uncollectible Interest
The majority of the total accrued interest receivable on our Private Education Loan portfolio represents accrued interest on deferred loans where no payments are due while the borrower is in school and on fixed-pay loans where the borrower makes a $25 monthly payment that is smaller than the interest accrued on the loan in that month. The accrued interest on these loans will be capitalized and increase the unpaid principal balance of the loans when the borrower exits the grace period after separation from school. The discounted cash flow approach and the allowance for credit losses described above consider both the collectability of principal and accrued interest. The allowance for uncollectible interest estimates the additional uncollectible interest that is not captured in the allowance for credit losses. The allowance for uncollectible interest uses historical experience to estimate the uncollectible interest on loans for which payment in full of principal or interest is not expected. This amount is recorded as a reduction of interest income. Accrued interest receivable is separately disclosed on the face of the balance sheet.
Allowance for FFELP Loan Losses
During the third quarter of 2024, we transferred our FFELP Loan portfolio to loans held for sale as we planned to sell our FFELP Loan portfolio. At that time, we wrote down this loan portfolio to its estimated fair value through an adjustment to the allowance for credit losses of $8 million. We subsequently sold the FFELP Loan portfolio to a third party in the fourth quarter of 2024.
FFELP Loans are insured as to their principal and accrued interest in the event of default, subject to a risk-sharing level based on the date of loan disbursement. These insurance obligations are supported by contractual rights against the United States. For loans disbursed on or after July 1, 2006, owners receive 97 percent reimbursement on all qualifying claims. For loans disbursed after October 1, 1993, and before July 1, 2006, owners receive 98 percent reimbursement on all qualifying claims. For loans disbursed prior to October 1, 1993, owners receive 100 percent reimbursement. Because owners bear a maximum of three percent loss exposure due to this federal guarantee, our allowance for credit losses for FFELP Loans and related periodic provision expense were relatively small.
For the years ended December 31, 2023 and 2022, we used the gross loss approach when estimating the allowance for credit losses for the unguaranteed portion of our FFELP Loans. We maintained an allowance for credit losses for our FFELP Loans at a level sufficient to cover lifetime expected credit losses. The allowance for FFELP Loan losses used historical experience of customer default behavior. We applied the default rate projections, net of applicable risk sharing, to our FFELP Loans for the relevant period to perform our quantitative calculation. Once the quantitative calculation was performed, we reviewed the adequacy of the allowance for credit losses and determined if qualitative adjustments needed to be considered.
2024 Form 10-K — SLM CORPORATION 81
Risk Management
Our Approach
Risk is inherent in our business activities and the specialized lending industry we serve. The ability of management to identify, manage, and remediate risk in a timely manner is critical to our continued success. Our risk management framework is designed to assess, manage, and report these risks and escalate as appropriate to the Board of Directors or its designee.
Risk Oversight
Our Board of Directors oversees our overall strategic direction, including our risk management capability and effectiveness. The Board of Directors has oversight of key policies as well as the risk management framework developed and administered by the management team. We also have a process that is designed to escalate meaningful departures from our risk appetite statements to the Board. The Board of Directors oversees the continued development of the risk management framework.
The Governance Framework
Our overall objective is to ensure all significant risks inherent in our business can be identified and appropriately mitigated. To this end, we have adopted the “three lines of defense” approach to governance. Specifically, the business units form the “first line of defense” and are the “owners” of risks in their business activities. As the risk owner, the first line of defense is accountable for the day-to-day execution of risk and control policies and procedures (including activities performed by third-party contractors). The “second line of defense” is our Risk Management function, which is independent from the first line of defense. The second line of defense conducts oversight and effective challenge of the risk-taking activities within the first line of defense. Finally, the Internal Audit function comprises the “third line of defense.” The Internal Audit function provides opinions to the Board of Directors on the effectiveness of the first and second lines of defense, as reflected in audit reports.
Risk Management Policy and Risk Appetite Standard
The Risk Management Policy and Risk Appetite Standard are designed to establish a stable risk and control environment across the enterprise. The policy, which is approved by the Board of Directors, outlines the framework used to ensure that risk and control issues across the enterprise are identified, assessed, measured, monitored, and reported. The Risk Management Policy, the Risk Appetite Standard, and the related policies and procedures constitute the core of the risk management program.
Sallie Mae leverages risk appetite to outline the level of risk we are willing to accept within each risk category, as described below, in pursuit of our business objectives. Compliance with our risk appetite is monitored using a set of risk metrics, with defined thresholds and limits, for each risk category. The management-level Enterprise Risk Committee provides oversight of the risk appetite standard with escalation to the Board of Directors, as appropriate.
Board of Directors Committee Structure
We have a Board of Directors committee structure as outlined below that facilitates oversight, effective challenge, and escalation of risk and control issues.
•Financial Risk Committee. The Financial Risk Committee assists the Board of Directors in fulfilling its risk management oversight responsibilities with regard to the Company’s major financial risks, including credit risk, market risk, and liquidity risk. The Financial Risk Committee, along with the Operational and Compliance Risk Committee, provides oversight of the development, maintenance, and monitoring of the Company’s risk management framework, risk governance structure, and risk appetite statements, metrics, and associated limits and thresholds, and the promotion of our risk management culture. The Financial Risk Committee receives periodic updates on compliance with the framework from the Chief Risk Officer.
•Operational and Compliance Risk Committee. The Operational and Compliance Risk Committee assists the Board of Directors in fulfilling its oversight responsibilities relating to the major non-financial risks, including compliance risks, operational risks, information and cyber security risk, and model risk. The Operational and Compliance Risk Committee, along with the Financial Risk Committee, provides oversight of the development, maintenance, and monitoring of our risk management framework, risk governance structure, and risk appetite statements, metrics, and associated limits and thresholds, and the promotion of our risk
2024 Form 10-K — SLM CORPORATION 82
management culture. The Operational and Compliance Risk Committee receives periodic updates on compliance with the framework from the Chief Risk Officer.
•Audit Committee. The Audit Committee is responsible for oversight of the quality and integrity of our financial statements, accounting and reporting processes, the performance of the Internal Audit function, and the qualifications, hiring, performance, and independence of our independent registered public accounting firm.
•Nominations and Governance Committee. The Nominations and Governance Committee recommends to the Board of Directors appropriate standards of corporate governance, and assists the Board of Directors in fulfilling its obligations with regard to oversight of the operations of the Board of Directors, the qualifications and independence of directors, nominations to the Board of Directors, and compliance with the corporate governance standards.
•Compensation Committee. The Compensation Committee assists the Board of Directors in fulfilling its oversight responsibilities related to the compensation and benefits of our Chief Executive Officer (“CEO”) and the non-employee members of the Board of Directors, our incentive compensation and benefits practices for employees of all levels, and management’s succession planning. Additionally, the Compensation Committee provides oversight of human capital management.
•Preferred Stock Committee. The Preferred Stock Committee monitors and evaluates proposed actions that may impact the rights of holders of our preferred stock.
Management-Level Committee Structure
Executive Committee. The EC is authorized by the Board of Directors to assist the CEO in the general supervision of the business of the Company. Specifically, the EC will (i) provide to the CEO advice and counsel, subject matter expertise, and recommendations as requested, and (ii) through its subcommittees, facilitate the evaluation and decision-making on routine cross-functional matters, and assist management in the fulfillment of management’s duties related to specific risks. The EC has established the following sub-committees to assist in fulfilling its duties.
•Enterprise Risk Committee (“ERC”). The ERC provides independent oversight and monitoring of the risk and control environment. The ERC is jointly accountable to the Financial Risk Committee and the Operational and Compliance Risk Committee of the Board of Directors and provides for escalation accordingly.
•Credit Committee. The Credit Committee is responsible for credit and counterparty risk, product pricing, and credit and collections operations.
•Operational and Compliance Risk Committee. The OCRC is the oversight body for the identification, assessment, remediation, measurement, and reporting of operational and compliance risks.
•Asset and Liability Committee (“ALCO”). ALCO is responsible for the strategy, processes, and authorities with which the Bank’s interest rate risk, liquidity, and capital adequacy are managed.
•Policy Management Committee (“PMC”) The PMC is responsible for the effective and efficient administration of the Company’s policies, standards, and procedures.
Each of these sub-committees is comprised of subject matter experts from the senior management team and is accountable to the EC. Moreover, these sub-committees may be supported by steering or working groups, as appropriate.
Disclosure Committee. Our Disclosure Committee assists our CEO and Chief Financial Officer in their review of periodic SEC reporting documents, earnings releases, investor materials, and related disclosure policies and procedures.
Internal Audit
Internal Audit provides independent assurance to the Audit Committee of the Board of Directors as to the adequacy and effectiveness of our risk management, control, and governance processes. Internal Audit also assists management by providing objective assurance, credible challenge, and consulting services around matters involving risk management. Internal Audit regularly performs selected reviews of our risk management and compliance functions to assess the effectiveness of the overall risk management framework, identifies areas that may require increased focus and resources, and reports significant control issues and recommendations to executive management and the Audit Committee of the Board of Directors. Annually, Internal Audit performs an
2024 Form 10-K — SLM CORPORATION 83
independent risk assessment to evaluate the risk of all significant components of the Company and uses the results to develop an annual, risk-based Internal Audit plan to provide the assurance services noted above.
Risk Categories
Risk categories are a foundational element of the risk management framework; they are widely used in risk
identification and provide the basis for risk aggregation and reporting. The Company has identified six major risk categories:
Strategic Risk. Strategic risk is the risk of: adverse impacts to enterprise value, current or anticipated earnings, capital, or franchise value arising from the Company’s competitive and market position and evolving forces in the industry that can affect that position; lack of responsiveness to these conditions; strategic decisions to change the Company’s scale, market position, or operating model; or failure to appropriately consider implementation risks inherent in the Company’s strategy.
The overall development of the Company’s strategic plan includes extensive engagement with the Board of Directors. Similarly, the Board of Directors provides oversight and effective challenge on performance relative to the strategic plan.
Credit Risk. Credit risk is the risk of adverse impacts to earnings, capital, or reputation resulting from obligors’ failure, or the increased probability thereof, to meet the terms of a lending, issuer, or counterparty agreement. Credit risk is found in all activities where success depends on counterparty, issuer, or borrower performance.
The credit risk related to Private Education Loans is managed within a credit risk infrastructure that includes: (i) a well-defined underwriting, asset quality, and collection policy framework; (ii) an ongoing monitoring and review process of portfolio composition and trends; (iii) assignment and management of credit authorities and responsibilities; and (iv) establishment of an allowance for credit losses that covers estimated future losses based upon an analysis of portfolio metrics and economic factors.
Credit risk related to derivative contracts is managed by reviewing counterparties for credit strength on an ongoing basis and through our credit policies, which place limits on the amount of exposure we may take with any one counterparty and require collateral to secure the position. The credit and counterparty risk associated with derivatives is measured based on the replacement cost should the counterparty with contracts in a gain position to us fail to perform under the terms of the contract.
Credit risk exposure is managed primarily through the Credit Committee, and regular reporting on credit programs and credit metrics is provided to the Financial Risk Committee of the Board of Directors.
Market Risk. Market risk is the risk of adverse impacts to earnings, capital, or reputation resulting from fluctuations in market conditions such as changes in interest rates, foreign exchange rates, commodity prices, equity prices, and other financial market factors. We are exposed to various types of market risk, in particular the risk of loss resulting from interest rate risk, basis risk, and other risks that arise through the management of our investment, debt, and loan portfolios. Market risk exposures are managed primarily through ALCO. These activities are closely tied to those related to the management of our funding and liquidity risks. The Financial Risk Committee of our Board of Directors periodically reviews and approves the investment and asset and liability management policies and contingency funding plan developed and administered by ALCO. The Chief Financial Officer provides reports to the Financial Risk Committee of the Board of Directors on market risk management.
Liquidity Risk. Liquidity risk is the risk of adverse impacts to earnings, capital, reputation, or survival resulting from not being able to meet the Company’s financial obligations when they become due, whether due to a lack of available funding or the inability to liquidate assets in a timely and cost-effective manner.
Our primary liquidity needs include our ongoing ability to: meet our funding needs through market cycles, including periods of financial stress; manage the relative maturities of assets and liabilities on our balance sheet; fund disbursements of Private Education Loans and other loans; and service our indebtedness and bank deposits. Ultimately, our liquidity risk relates to our ability to access the capital markets at reasonable rates and to maintain deposits and other funding sources through the Bank, as well as our maintenance of a reserve of cash and unencumbered highly liquid investment securities that may be readily converted to cash if needed.
Our liquidity risk activities are centralized within our Corporate Finance department, which is responsible for developing and executing our funding strategy. We analyze and monitor our liquidity risk, maintain excess liquidity, and access diverse funding sources depending on current market conditions. Liquidity risks are overseen and recommendations approved primarily through ALCO. The Financial Risk Committee of our Board of Directors is
2024 Form 10-K — SLM CORPORATION 84
responsible for periodically reviewing the liquidity positions and contingency funding plan developed and administered by ALCO.
Operational Risk. Operational risk is the risk of adverse impacts to earnings, capital, or reputation resulting from inadequate or failed internal processes, people, and systems, or from external events. Operational risk is pervasive in that it exists in all business lines, functional units, legal entities, and geographic locations.
Operational risk exposures are managed through a combination of first line of defense and control activities and second line of defense oversight. The OCRC is the management committee responsible for operational risk, and it supports the EC in its oversight duties. The OCRC is responsible for escalation to the EC, as appropriate. Additionally, our key risk indicators include operational risk metrics, thresholds, and limits and are included in the periodic reporting to the Operational and Compliance Risk Committee of the Board of Directors.
Cybersecurity risk is one of our significant operational risks. We provide more detailed information on our cybersecurity risk management, strategy, and governance in Part I, Item 1C. of this Form 10-K.
Compliance Risk. Compliance risk is the risk of adverse impacts to earnings, capital, or reputation resulting from violations of, or non-conformance with, the Code of Business Conduct and with laws, rules, regulations, and self regulatory organizations’ standards.
Primary ownership and responsibility for compliance risk is placed with the first line of defense to identify and manage. Our Compliance function supports these activities by providing extensive training, monitoring, and testing of the processes, policies, and procedures utilized by the first line of defense, maintaining relevant legal and regulatory requirements, and working in close coordination with our Legal department. Compliance risk metrics and regular reporting on compliance programs are provided to the Operational and Compliance Risk Committee of the Board of Directors.
2024 Form 10-K — SLM CORPORATION 85
Item 7A. Quantitative and Qualitative Disclosures about Market Risk
Interest Rate Sensitivity Analysis
Our interest rate risk management program seeks to manage and control interest rate risk, thereby reducing our exposure to fluctuations in interest rates and achieving consistent and acceptable levels of profit in any rate environment and sustainable growth in net interest income over the long term. We evaluate and monitor interest rate risk through two primary methods:
•Earnings at Risk (“EAR”), which measures the impact of hypothetical changes in interest rates on net interest income; and
•Economic Value of Equity (“EVE”), which measures the sensitivity or change in the economic value of equity to changes in interest rates.
A number of potential interest rate scenarios are simulated using our asset liability management system. The Bank is the primary source of interest rate risk within the Company. At present, a significant portion of the Bank’s earning assets and a large balance of deposits are indexed to 30-day average SOFR. Therefore, 30-day average SOFR is considered a core rate in our interest rate risk analysis. The 30-day average SOFR and other rates are shocked in parallel for shock scenarios unless otherwise indicated. Rates are adjusted up or down via a set of scenarios that includes both rate shocks and ramps. Rate shocks represent an immediate and sustained change in key rates, with the resulting changes in other indices correlated accordingly. Interest rate ramps represent a linear increase in those key rates over the course of 12 months, with the resulting changes in other indices correlated accordingly.
The following table summarizes the potential effect on earnings over the next 24 months and the potential effect on market values of balance sheet assets and liabilities at December 31, 2024 and 2023, based upon a sensitivity analysis performed by management assuming hypothetical increases in market interest rates of 100 and 300 basis points and a decrease of 100 and 300 basis points while credit and funding spreads remain constant. EAR analysis assumes a static balance sheet, with maturities of each product replaced with assumed issuance of new products of the same type. The EVE sensitivity is applied only to financial assets and liabilities, including hedging instruments, that existed at the balance sheet date, and does not reflect any impact of loan sales, new assets, liabilities, commitments, or hedging instruments that may arise in the future.
The EAR results for December 31, 2024 indicate a market risk profile of low sensitivity to rate changes, based on static balance sheet assumptions over the next two years. The higher mix of fixed-rate versus variable-rate loan disbursements continues, which results in our liabilities repricing more quickly than our assets over time. Planned loan sales, which are not included in the static EVE modeling, significantly reduce our EVE exposure. Management is evaluating this trend to determine if, and when, further actions are necessary to manage EVE sensitivity.
| | | | | | | | | | | | | | | | | | | | | | | | | | | | | | | | | | | | | | | | | | | | | | | | | | | | | | | | | | | | | | | | | | | | | | | | | | |
| As of December 31, | | 2024 | | 2023 |
| +300 Basis
Points | | +100 Basis
Points | | -100 Basis
Points | | -300 Basis Points | | +300 Basis
Points | | +100 Basis
Points | | -100 Basis
Points | | -300 Basis Points |
| | | | | | | | | | | | | | | | | | | | | | | | |
| EAR - Shock | | -8.1 | % | | -2.5 | % | | +2.0 | % | | +5.9 | % | | -2.9 | % | | -0.9 | % | | +0.7 | % | | +1.9 | % |
| EAR - Ramp | | -4.5 | % | | -1.4 | % | | +1.2 | % | | +3.4 | % | | -1.9 | % | | -0.6 | % | | +0.4 | % | | +1.3 | % |
| EVE | | -24.2 | % | | -7.9 | % | | +7.0 | % | | +20.9 | % | | -26.0 | % | | -8.9 | % | | +8.8 | % | | +25.9 | % |
In the preceding tables, the interest rate sensitivity analysis reflects the balance sheet mix of fully variable SOFR and Prime-based loans, and fully variable funding, including brokered CDs that have been converted to SOFR through derivative transactions. The analysis assumes that retail MMDAs and retail savings balances, while relatively sensitive to interest rate changes, will not correlate 100 percent to the full interest rate shocks or ramps.
Although we believe that these measurements provide an estimate of our interest rate sensitivity, they do not account for potential changes in credit quality, balance sheet mix, and size of our balance sheet. They also do not
2024 Form 10-K — SLM CORPORATION 86
account for other business developments that could affect net income, or for management actions that could affect net income or could be taken to change our risk profile. Accordingly, we can give no assurance that actual results would not differ materially from the estimated outcomes of our simulations. Further, such simulations do not represent our current view of expected future interest rate movements.
Asset and Liability Funding Gap
The table below presents our assets and liabilities (funding) arranged by underlying indices as of December 31, 2024. In the following GAAP presentation, the funding gap only includes derivatives that qualify as effective hedges (those derivatives which are reflected in net interest income, as opposed to those reflected in the “gains (losses) on derivatives and hedging activities, net” line on the consolidated statements of income). The difference between the asset and the funding is the funding gap for the specified index. This represents at a high level our exposure to interest rate risk in the form of basis risk and repricing risk, which is the risk that the different indices may reset at different frequencies or may not move in the same direction or at the same magnitude. (Note that all fixed-rate assets and liabilities are aggregated into one line item, which does not capture the differences in time due to maturity.)
| | | | | | | | | | | | | | | | | | | | | | | | | | |
As of December 31, 2024 (dollars in millions) Index | | Frequency of
Variable
Resets | | Assets | | Funding (1) | | Funding
Gap |
| Fed Funds Effective Rate | | daily/weekly/monthly | | $ | — | | | $ | 547.9 | | | $ | (547.9) | |
| SOFR Rate | | daily/weekly/monthly | | 5,323.2 | | | 4,816.6 | | | 506.6 | |
| 3-month SOFR | | quarterly | | — | | | 251.1 | | | (251.1) | |
| 3-month Treasury bill | | weekly | | — | | | — | | | — | |
| Prime | | monthly | | 0.3 | | | — | | | 0.3 | |
Non-Discrete reset(2) | | daily/weekly | | 4,927.5 | | | 3,606.4 | | | 1,321.1 | |
Fixed-Rate(3) | | | | 19,821.1 | | | 20,850.1 | | | (1,029.0) | |
| Total | | | | $ | 30,072.1 | | | $ | 30,072.1 | | | $ | — | |
(1) Funding (by index) includes all derivatives that qualify as effective hedges.
(2) Assets include restricted and unrestricted cash equivalents and other overnight type instruments. Funding includes liquid retail deposits and the obligation to return cash collateral held related to derivatives exposures.
(3) Assets include receivables and other assets (including premiums and reserves). Funding includes unswapped time deposits, liquid MMDAs swapped to fixed-rates, and stockholders’ equity.
The “Funding Gap” in the above table shows primarily mismatches in the Fed Funds Effective Rate, SOFR rate, 3-month SOFR, Non-Discrete Reset, and Fixed-Rate categories. Changes in the Fed Funds Effective Rate, the Non-Discrete Reset, and the daily, weekly, and monthly SOFR, and 3-month SOFR categories are generally quite highly correlated, and should offset each other effectively. The funding in the fixed-rate bucket includes $1.9 billion and $0.4 billion of non-interest-bearing liabilities. We consider the overall repricing risk to be low.
We use interest rate swaps and other derivatives to achieve our risk management objectives. Our asset liability management strategy is to match assets with debt (in combination with derivatives) that have the same underlying index and reset frequency or have interest rate characteristics that we believe are highly correlated. The use of funding with index types and reset frequencies that are different from our assets exposes us to interest rate risk in the form of basis and repricing risk. This could result in our cost of funds not moving in the same direction or with the same magnitude as the yield on our assets. While we believe this risk is low, as all of these indices are short-term with rate movements that are highly correlated over a long period of time, market disruptions (which have occurred in recent years) can lead to a temporary divergence between indices, resulting in a negative impact to our earnings.
2024 Form 10-K — SLM CORPORATION 87
Weighted Average Life
The following table reflects the weighted average lives of our earning assets and liabilities at December 31, 2024.
| | | | | | | | |
As of December 31, 2024
(averages in years) | | Weighted Average Life |
| Earning assets | | |
| Education loans | | 5.57 | |
| Cash and investments | | 1.28 | |
| Total earning assets | | 4.55 | |
| | | |
| Deposits | | |
| Short-term deposits | | 0.60 | |
| Long-term deposits | | 2.47 | |
| Total deposits | | 0.90 | |
| | |
| Borrowings | | |
| | |
| Long-term borrowings | | 3.60 | |
| Total borrowings | | 3.60 | |
2024 Form 10-K — SLM CORPORATION 88
Item 8. Financial Statements and Supplementary Data
Reference is made to the financial statements listed under the heading “(a) 1.A. Financial Statements” of Part IV, Item 15 hereof, which financial statements are incorporated by reference in response to this Item 8.
Item 9. Changes in and Disagreements with Accountants on Accounting and Financial Disclosure
Nothing to report.
Item 9A. Controls and Procedures
Disclosure Controls and Procedures
Our management, with the participation of our principal executive officer and principal financial officer, evaluated the effectiveness of our disclosure controls and procedures (as defined in Rules 13a-15(e) and 15d-15(e) under the Securities Exchange Act of 1934, as amended (the “Exchange Act”)) as of December 31, 2024. Based on this evaluation, our principal executive officer and principal financial officer concluded that, as of December 31, 2024, our disclosure controls and procedures were effective to ensure that information required to be disclosed by us in the reports that we file or submit under the Exchange Act is (i) recorded, processed, summarized, and reported within the time periods specified in the SEC’s rules and forms and (ii) accumulated and communicated to our management, including our principal executive officer and principal financial officer as appropriate, to allow timely decisions regarding required disclosure.
Management’s Report on Internal Control over Financial Reporting
Our management is responsible for establishing and maintaining adequate internal control over financial reporting (as defined in Rule 13a-15(f) under the Exchange Act). Under the supervision and with the participation of our management, including our principal executive officer and principal financial officer, we assessed the effectiveness of our internal control over financial reporting as of December 31, 2024. In making this assessment, our management used the criteria established in Internal Control — Integrated Framework (2013) issued by the Committee of Sponsoring Organizations of the Treadway Commission. Based on our assessment and those criteria, management concluded that, as of December 31, 2024, our internal control over financial reporting is effective.
KPMG, LLP, which is the independent registered public accounting firm that audited the financial statements included in this Form 10-K, has issued an audit report on the Company’s internal control over financial reporting, which can be found under the heading “Report of Independent Registered Public Accounting Firm” in Part IV, Item 15 of this Form 10-K.
Because of its inherent limitations, internal control over financial reporting may not prevent or detect misstatements. Also, projections of any evaluation of effectiveness to future periods are subject to the risk that controls may become inadequate because of changes in conditions, or that the degree of compliance with the policies or procedures may deteriorate.
Changes in Internal Control over Financial Reporting
There have been no changes in our internal control over financial reporting (as defined in Rules 13a-15(f) and 15d-15(f) under the Exchange Act) during the fiscal quarter ended December 31, 2024 that have materially affected, or are reasonably likely to materially affect, our internal control over financial reporting.
Item 9B. Other Information
Insider Trading Arrangements
In the fourth quarter of 2024, no director or officer (as defined in Rule 16a-1(f) promulgated under the Securities Exchange Act of 1934, as amended) of the Company adopted or terminated a “Rule 10b5-1 trading arrangement” or “non-Rule 10b5-1 trading arrangement” for the purchase or sale of securities of the Company, each within the meaning of Item 408 of Regulation S-K.
2024 Form 10-K — SLM CORPORATION 89
PART III.
Item 10. Directors, Executive Officers and Corporate Governance
The information contained in the 2025 Proxy Statement, including information appearing in the sections titled “Proposal 1 — Election of Directors,” “Executive Officers,” “Compensation Discussion and Analysis — Other Arrangements, Policies and Practices Related to Executive Compensation Programs — Section 16(a) Beneficial Ownership Reporting Compliance,” and “Corporate Governance”, is incorporated herein by reference.
Item 11. Executive Compensation
The information contained in the 2025 Proxy Statement, including information appearing in the sections titled “Executive Compensation” and “Director Compensation”, is incorporated herein by reference.
Item 12. Security Ownership of Certain Beneficial Owners and Management and Related Stockholder Matters
The information contained in the 2025 Proxy Statement, including information appearing in the sections titled “Equity Compensation Plan Information,” “Ownership of Common Stock by 5 Percent or More Holders,” and “Ownership of Common Stock by Directors and Executive Officers”, is incorporated herein by reference.
Item 13. Certain Relationships and Related Transactions, and Director Independence
The information contained in the 2025 Proxy Statement, including information appearing under “Corporate Governance — Related Party Transactions” and “Corporate Governance — Director Independence”, is incorporated herein by reference.
Item 14. Principal Accounting Fees and Services
The information contained in the 2025 Proxy Statement, including information appearing under “Independent Registered Public Accounting Firm”, is incorporated herein by reference.
2024 Form 10-K — SLM CORPORATION 90
PART IV.
Item 15. Exhibits, Financial Statement Schedules
(a) 1. Financial Statements
A. The following consolidated financial statements of SLM Corporation and the Report of the Independent Registered Public Accounting Firm thereon are included in Part II, Item 8 above:
2. Financial Statement Schedules
All schedules are omitted because they are not applicable or the required information is shown in the consolidated financial statements or notes thereto.
3. Exhibits
The exhibits listed in the accompanying index to exhibits are filed or incorporated by reference as part of this Annual Report on Form 10-K.
We will furnish at cost a copy of any exhibit filed with or incorporated by reference into this Annual Report on Form 10-K. Oral or written requests for copies of any exhibits should be directed to the Corporate Secretary.
2024 Form 10-K — SLM CORPORATION 91
(b) Exhibits
| | | | | |
| 2.1 | |
| |
| 3.1 | |
| |
| 3.2 | |
| |
| 4.1 | |
| |
| 4.2 | |
| |
| 4.3 | |
| |
| 4.4 | |
| |
| 4.5 | |
| |
| 4.6 | |
| |
| 4.7 | |
| |
| 4.8 | |
| |
| 4.9 | |
| |
| 4.10 | |
| |
| |
| |
| |
| |
| |
| 10.1† | |
| |
| 10.2† | |
| |
| 10.3† | |
| |
| 10.4† | |
| |
| 10.5† | |
| |
| 10.6† | |
| |
| 10.7† | |
| |
| 10.8† | |
| |
2024 Form 10-K — SLM CORPORATION 92
| | | | | |
| 10.9† | |
| |
| 10.10† | |
| |
| |
| 10.11† | |
| |
| 10.12† | |
| |
| |
| |
| |
| |
| |
| 10.13† | |
| |
| |
| |
| |
| |
| |
| |
| |
| |
| |
| |
| |
| |
| |
| |
| |
| |
| |
| |
| |
| |
| |
| |
| 10.14† | |
| |
| |
| |
| |
| |
| |
| |
| 10.15† | |
| |
| 10.16† | |
| |
| 10.17† | |
| |
| 10.18 | |
| |
| 10.19 | |
| |
| |
| |
| |
| |
| |
| |
| |
| |
| |
| |
| |
| |
| |
| |
| |
| |
| |
| |
| 10.20† | |
| |
| 10.21† | |
| |
| 10.22† | |
| |
| 10.23† | |
| |
| 10.24† | |
| |
| 10.25† | |
| |
| 10.26 | |
| |
| |
| |
| 10.27† | |
| |
| 10.28† | |
| |
| 10.29† | |
| |
| 10.30† | |
| |
| 10.31† | |
| |
| 10.32† | |
2024 Form 10-K — SLM CORPORATION 93
| | | | | |
| |
| 10.33† | |
| |
| 10.34† | |
| |
| 10.35† | |
| |
| 10.36† | |
| |
| 10.37† | |
| |
| 10.38† | |
| |
| 10.39† | |
| |
| 10.40† | |
| |
| 10.41† | |
| |
| 10.42† | |
| |
| 10.43† | |
| |
| 10.44† | |
| |
| 10.45† | |
| |
| 10.46† | |
| |
| 10.47† | |
| |
| 10.48† | |
| |
| 10.49† | |
| |
| 10.50† | |
| |
| 10.51† | |
| |
| 19.1* | |
| |
| 21.1* | |
| |
| 23.1* | |
| |
| 31.1* | |
| |
| 31.2* | |
| |
| 32.1* | |
| |
2024 Form 10-K — SLM CORPORATION 94
| | | | | |
| 32.2* | |
| |
| 97.1* | |
| |
| 101.INS | XBRL Instance Document - the instance document does not appear in the Interactive Data File because its XBRL tags are embedded within the Inline XBRL document. |
| |
| 101.SCH | XBRL Taxonomy Extension Schema Document. |
| |
| 101.CAL | XBRL Taxonomy Extension Calculation Linkbase Document. |
| |
| 101.DEF | XBRL Taxonomy Extension Definition Linkbase Document. |
| |
| 101.LAB | XBRL Taxonomy Extension Label Linkbase Document. |
| |
| 101.PRE | XBRL Taxonomy Extension Presentation Linkbase Document. |
| |
| 104 | Cover Page Interactive Data File (formatted as Inline XBRL and contained in Exhibit 101). |
† Management Contract or Compensatory Plan or Arrangement
* Filed herewith
2024 Form 10-K — SLM CORPORATION 95
SIGNATURES
Pursuant to the requirements of Section 13 or 15(d) of the Securities Exchange Act of 1934, as amended, the Registrant has duly caused this report to be signed on its behalf by the undersigned hereunto duly authorized.
Dated: February 20, 2025
| | | | | |
| SLM CORPORATION |
| |
| By: | /S/ JONATHAN W. WITTER |
| | Jonathan W. Witter Chief Executive Officer and Director |
Pursuant to the requirement of the Securities Exchange Act of 1934, as amended, this report has been signed below by the following persons on behalf of the Registrant and in the capacities and on the dates indicated.
| | | | | | | | |
| /S/ JONATHAN W. WITTER | | |
| Jonathan W. Witter | Chief Executive Officer and Director
(Principal Executive Officer) | February 20, 2025 |
| | |
| /S/ PETER M. GRAHAM | | |
| Peter M. Graham | Executive Vice President, Chief Financial Officer and Treasurer
(Principal Financial and Accounting Officer) | February 20, 2025 |
| | |
| /S/ MARY CARTER WARREN FRANKE | | |
| Mary Carter Warren Franke | Chair of the Board of Directors | February 20, 2025 |
| | |
| /S/ JANAKI AKELLA | | |
| Janaki Akella | Director | February 20, 2025 |
| | |
| /S/ R. SCOTT BLACKLEY | | |
| R. Scott Blackley | Director | February 20, 2025 |
| | |
| /S/ HENRY F. GREIG | | |
| Henry F. Greig | Director | February 20, 2025 |
| | |
| /S/ MARK L. LAVELLE | | |
| Mark L. Lavelle | Director | February 20, 2025 |
| | |
| /S/ CHRISTOPHER T. LEECH | | |
| Christopher T. Leech | Director | February 20, 2025 |
| | |
| /S/ TED MANVITZ | | |
| Ted Manvitz | Director | February 20, 2025 |
| | |
| /S/ JIM MATHESON | | |
| Jim Matheson | Director | February 20, 2025 |
| | |
2024 Form 10-K — SLM CORPORATION 96
| | | | | | | | |
| /S/ VIVIAN C. SCHNECK-LAST | | |
| Vivian C. Schneck-Last | Director | February 20, 2025 |
| | |
| /S/ ROBERT S. STRONG | | |
| Robert S. Strong | Director | February 20, 2025 |
| | |
| /S/ KIRSTEN O. WOLBERG | | |
| Kirsten O. Wolberg | Director | February 20, 2025 |
2024 Form 10-K — SLM CORPORATION 97
CONSOLIDATED FINANCIAL STATEMENTS
INDEX
2024 Form 10-K — SLM CORPORATION F-1
Report of Independent Registered Public Accounting Firm
To the Stockholders and Board of Directors
SLM Corporation:
Opinion on the Consolidated Financial Statements
We have audited the accompanying consolidated balance sheets of SLM Corporation and subsidiaries (the Company) as of December 31, 2024 and 2023, the related consolidated statements of income, comprehensive income, changes in equity, and cash flows for each of the years in the three-year period ended December 31, 2024, and the related notes (collectively, the consolidated financial statements). In our opinion, the consolidated financial statements present fairly, in all material respects, the financial position of the Company as of December 31, 2024 and 2023, and the results of its operations and its cash flows for each of the years in the three-year period ended December 31, 2024, in conformity with U.S. generally accepted accounting principles.
We also have audited, in accordance with the standards of the Public Company Accounting Oversight Board (United States) (PCAOB), the Company’s internal control over financial reporting as of December 31, 2024, based on criteria established in Internal Control – Integrated Framework (2013) issued by the Committee of Sponsoring Organizations of the Treadway Commission, and our report dated February 20, 2025 expressed an unqualified opinion on the effectiveness of the Company’s internal control over financial reporting.
Basis for Opinion
These consolidated financial statements are the responsibility of the Company’s management. Our responsibility is to express an opinion on these consolidated financial statements based on our audits. We are a public accounting firm registered with the PCAOB and are required to be independent with respect to the Company in accordance with the U.S. federal securities laws and the applicable rules and regulations of the Securities and Exchange Commission and the PCAOB.
We conducted our audits in accordance with the standards of the PCAOB. Those standards require that we plan and perform the audit to obtain reasonable assurance about whether the consolidated financial statements are free of material misstatement, whether due to error or fraud. Our audits included performing procedures to assess the risks of material misstatement of the consolidated financial statements, whether due to error or fraud, and performing procedures that respond to those risks. Such procedures included examining, on a test basis, evidence regarding the amounts and disclosures in the consolidated financial statements. Our audits also included evaluating the accounting principles used and significant estimates made by management, as well as evaluating the overall presentation of the consolidated financial statements. We believe that our audits provide a reasonable basis for our opinion.
Critical Audit Matter
The critical audit matter communicated below is a matter arising from the current period audit of the consolidated financial statements that was communicated or required to be communicated to the audit committee and that: (1) relates to accounts or disclosures that are material to the consolidated financial statements and (2) involved our especially challenging, subjective, or complex judgments. The communication of a critical audit matter does not alter in any way our opinion on the consolidated financial statements, taken as a whole, and we are not, by communicating the critical audit matter below, providing a separate opinion on the critical audit matter or on the accounts or disclosures to which it relates.
Assessment of the Allowance for Credit Losses related to Private Education Loans Evaluated on a Collective Basis
As discussed in Notes 2 and 6 to the consolidated financial statements, the Company’s total allowance for credit losses on private education loans evaluated on a collective basis (the Collective ACL) was $1,436 million as of December 31, 2024. For all loans carried at amortized cost, upon loan origination, the Company
F-2 SLM CORPORATION — 2024 Form 10-K
is required to measure the allowance for credit losses based on the estimate of all current expected credit losses over the remaining contractual term of the loans. In determining the lifetime expected credit losses on the private education loan portfolio, the Company applies a discounted cash flow method that requires the Company to project future principal and interest cash flows on loans in the private education loan portfolio. To estimate the future expected cash flows, the Company uses statistical loan-level models that consider life of loan expectations for defaults, prepayments, recoveries, and any other qualitative adjustments deemed necessary to determine the adequacy of the allowance for credit losses. These cash flows are discounted at the loan’s effective interest rate to calculate the present value of the cash flows. The difference between the present value of those cash flows and the amortized cost basis of the underlying loans is the allowance for credit losses. Future default rates and future prepayment speeds are estimated at a loan level using historical experience, current borrower characteristics, current conditions, and economic factors forecasted over a reasonable and supportable period. At the end of the reasonable and supportable forecast period, the Company immediately reverts forecasted economic factors to long-term historical averages. In estimating future default rates and prepayment speeds, the Company uses a combination of expected economic scenarios coupled with historical experience. The Company also develops an adverse and favorable economic scenario. These scenarios are weighted based upon the current economic conditions and the Company’s view of the risks of alternate outcomes. In estimating recoveries, the Company uses both estimates of what would be received from the sale of defaulted loans as well as historical borrower payment behavior to estimate the timing and amount of future recoveries of charged-off loans. The Company also takes certain qualitative factors into consideration when calculating the Collective ACL, which could result in management overlays.
We identified the assessment of the Collective ACL as a critical audit matter. A high degree of audit effort, including specialized skills and knowledge, and subjective and complex auditor judgment was involved in the assessment due to significant measurement uncertainty. Specifically, the assessment of the Collective ACL methodology encompassed the evaluation of the conceptual soundness and performance of the statistical loan-level models, including their significant assumptions. Such significant assumptions included (1) forecasted economic factors and (2) default and prepayment rates derived from statistical loan-level models. The assessment also encompassed the conceptual soundness of the methods and significant assumptions used to determine certain individual management overlays. In addition, auditor judgment was required to evaluate the sufficiency of audit evidence obtained.
The following are the primary procedures we performed to address the critical audit matter. We evaluated the design and tested the operating effectiveness of certain internal controls related to the Company’s measurement of the Collective ACL estimate, including controls over the:
•Collective ACL methodology
•development of the statistical loan-level models used to estimate future defaults and prepayment speeds
•performance monitoring of the statistical loan-level models
•determination and measurement of the significant assumptions used in the models
•development of certain individual management overlay methods and assumptions
•analysis of the Collective ACL results, trends, and ratios.
We evaluated the Company’s process to develop the Collective ACL estimate by testing certain sources of data, factors, and assumptions that the Company used, and considered the relevance and reliability of such data, factors, and assumptions. In addition, we involved credit risk professionals with specialized skills and knowledge, who assisted in:
•evaluating the Company’s Collective ACL methodology for compliance with U.S. generally accepted accounting principles
2024 Form 10-K — SLM CORPORATION F-3
•evaluating judgments made by the Company relative to the development and performance testing of the statistical loan-level models by comparing them to the relevant Company-specific metrics and trends
•assessing the conceptual soundness and performance testing of the statistical loan-level models by inspecting the model documentation to determine whether the models are suitable for their intended use
•evaluating the selection of the forecasted economic factors used to adjust future default rates and future prepayment speeds over the reasonable and supportable forecast period by comparing them to the Company’s business environment and relevant industry practices
•evaluating the conceptual soundness of the methods and assumptions used to develop certain individual management overlays and their impact on the Collective ACL compared with relevant credit risk factors and consistency with credit trends and identified limitations of the underlying statistical loan-level models.
We also assessed the sufficiency of the audit evidence obtained related to the Collective ACL by evaluating the cumulative results of the audit procedures and potential bias in the accounting estimates.
/s/ KPMG LLP
We have served as the Company’s auditor since 2013.
McLean, Virginia
February 20, 2025
F-4 SLM CORPORATION — 2024 Form 10-K
Report of Independent Registered Public Accounting Firm
To the Stockholders and Board of Directors
SLM Corporation:
Opinion on Internal Control Over Financial Reporting
We have audited SLM Corporation and subsidiaries' (the Company) internal control over financial reporting as of December 31, 2024, based on criteria established in Internal Control – Integrated Framework (2013) issued by the Committee of Sponsoring Organizations of the Treadway Commission. In our opinion, the Company maintained, in all material respects, effective internal control over financial reporting as of December 31, 2024, based on criteria established in Internal Control – Integrated Framework (2013) issued by the Committee of Sponsoring Organizations of the Treadway Commission.
We also have audited, in accordance with the standards of the Public Company Accounting Oversight Board (United States) (PCAOB), the consolidated balance sheets of the Company as of December 31, 2024 and 2023, the related consolidated statements of income, comprehensive income, changes in equity, and cash flows for each of the years in the three-year period ended December 31, 2024, and the related notes (collectively, the consolidated financial statements), and our report dated February 20, 2025 expressed an unqualified opinion on those consolidated financial statements.
Basis for Opinion
The Company’s management is responsible for maintaining effective internal control over financial reporting and for its assessment of the effectiveness of internal control over financial reporting, included in the accompanying Management's Report on Internal Control over Financial Reporting. Our responsibility is to express an opinion on the Company’s internal control over financial reporting based on our audit. We are a public accounting firm registered with the PCAOB and are required to be independent with respect to the Company in accordance with the U.S. federal securities laws and the applicable rules and regulations of the Securities and Exchange Commission and the PCAOB.
We conducted our audit in accordance with the standards of the PCAOB. Those standards require that we plan and perform the audit to obtain reasonable assurance about whether effective internal control over financial reporting was maintained in all material respects. Our audit of internal control over financial reporting included obtaining an understanding of internal control over financial reporting, assessing the risk that a material weakness exists, and testing and evaluating the design and operating effectiveness of internal control based on the assessed risk. Our audit also included performing such other procedures as we considered necessary in the circumstances. We believe that our audit provides a reasonable basis for our opinion.
Definition and Limitations of Internal Control Over Financial Reporting
A company’s internal control over financial reporting is a process designed to provide reasonable assurance regarding the reliability of financial reporting and the preparation of financial statements for external purposes in accordance with generally accepted accounting principles. A company’s internal control over financial reporting includes those policies and procedures that (1) pertain to the maintenance of records that, in reasonable detail, accurately and fairly reflect the transactions and dispositions of the assets of the company; (2) provide reasonable assurance that transactions are recorded as necessary to permit preparation of financial statements in accordance with generally accepted accounting principles, and that receipts and expenditures of the company are being made only in accordance with authorizations of management and directors of the company; and (3) provide reasonable assurance regarding prevention or timely detection of
2024 Form 10-K — SLM CORPORATION F-5
unauthorized acquisition, use, or disposition of the company’s assets that could have a material effect on the financial statements.
Because of its inherent limitations, internal control over financial reporting may not prevent or detect misstatements. Also, projections of any evaluation of effectiveness to future periods are subject to the risk that controls may become inadequate because of changes in conditions, or that the degree of compliance with the policies or procedures may deteriorate.
/s/ KPMG LLP
McLean, Virginia
February 20, 2025
F-6 SLM CORPORATION — 2024 Form 10-K
| | | | | | | | | | | | | | |
| CONSOLIDATED BALANCE SHEETS | | | | |
As of December 31,
(dollars in thousands, except share and per share amounts) | | 2024 | | 2023 |
| Assets | | | | |
| Cash and cash equivalents | | $ | 4,700,366 | | | $ | 4,149,838 | |
| Investments: | | | | |
| Trading investments at fair value (cost of $41,715 and $43,412, respectively) | | 53,262 | | | 54,481 | |
| Available-for-sale investments at fair value (cost of $2,042,473 and $2,563,984, respectively) | | 1,933,226 | | | 2,411,622 | |
| Other investments | | 112,377 | | | 91,567 | |
| Total investments | | 2,098,865 | | | 2,557,670 | |
| Loans held for investment (net of allowance for losses of $1,435,920 and $1,339,772, respectively) | | 20,902,158 | | | 20,306,357 | |
| | | | |
| Restricted cash | | 173,894 | | | 149,669 | |
| Other interest-earning assets | | 4,880 | | | 9,229 | |
| Accrued interest receivable | | 1,546,590 | | | 1,379,904 | |
| Premises and equipment, net | | 119,354 | | | 129,501 | |
| Goodwill and acquired intangible assets, net | | 63,532 | | | 68,711 | |
| Income taxes receivable, net | | 425,625 | | | 366,247 | |
| | | | |
| Other assets | | 36,846 | | | 52,342 | |
| Total assets | | $ | 30,072,110 | | | $ | 29,169,468 | |
| | | | |
| Liabilities | | | | |
| Deposits | | $ | 21,068,568 | | | $ | 21,653,188 | |
| | | | |
| Long-term borrowings | | 6,440,345 | | | 5,227,512 | |
| | | | |
| | | | |
| Other liabilities | | 403,277 | | | 407,971 | |
| Total liabilities | | 27,912,190 | | | 27,288,671 | |
| Commitments and contingencies | | | | |
| Equity | | | | |
| Preferred stock, par value $0.20 per share, 20 million shares authorized: | | | | |
| Series B: 2.5 million and 2.5 million shares issued, respectively, at stated value of $100 per share | | 251,070 | | | 251,070 | |
| Common stock, par value $0.20 per share, 1.125 billion shares authorized: 440.6 million and 438.2 million shares issued, respectively | | 88,121 | | | 87,647 | |
| Additional paid-in capital | | 1,193,753 | | | 1,148,689 | |
| Accumulated other comprehensive loss (net of tax benefit of $(21,209) and $(24,176), respectively) | | (65,861) | | | (75,104) | |
| Retained earnings | | 4,114,446 | | | 3,624,859 | |
| Total SLM Corporation stockholders’ equity before treasury stock | | 5,581,529 | | | 5,037,161 | |
| Less: Common stock held in treasury at cost: 230.2 million and 217.9 million shares, respectively | | (3,421,609) | | | (3,156,364) | |
| Total equity | | 2,159,920 | | | 1,880,797 | |
| Total liabilities and equity | | $ | 30,072,110 | | | $ | 29,169,468 | |
See accompanying notes to consolidated financial statements.
2024 Form 10-K — SLM CORPORATION F-7
| | | | | | | | | | | | | | | | | | | | |
| CONSOLIDATED STATEMENTS OF INCOME | | | | | | |
Years ended December 31,
(dollars in thousands, except per share amounts) | | 2024 | | 2023 | | 2022 |
| Interest income: | | | | | | |
| Loans | | $ | 2,314,417 | | | $ | 2,327,743 | | | $ | 1,914,554 | |
| Investments | | 61,412 | | | 50,810 | | | 35,304 | |
| Cash and cash equivalents | | 243,217 | | | 213,750 | | | 81,722 | |
| Total interest income | | 2,619,046 | | | 2,592,303 | | | 2,031,580 | |
| Interest expense: | | | | | | |
| Deposits | | 881,456 | | | 808,065 | | | 368,914 | |
| Interest expense on short-term borrowings | | 13,815 | | | 13,501 | | | 11,956 | |
| Interest expense on long-term borrowings | | 242,993 | | | 208,524 | | | 161,929 | |
| | | | | | |
| Total interest expense | | 1,138,264 | | | 1,030,090 | | | 542,799 | |
| Net interest income | | 1,480,782 | | | 1,562,213 | | | 1,488,781 | |
| Less: provisions for credit losses | | 408,515 | | | 345,463 | | | 633,453 | |
| Net interest income after provisions for credit losses | | 1,072,267 | | | 1,216,750 | | | 855,328 | |
| Non-interest income: | | | | | | |
| Gains on sales of loans, net | | 254,928 | | | 160,290 | | | 327,750 | |
| Gains (losses) on securities, net | | 467 | | | 2,678 | | | (60,267) | |
| Losses on derivatives and hedging activities, net | | — | | | — | | | (5) | |
| Other income | | 112,873 | | | 84,148 | | | 67,160 | |
| Total non-interest income | | 368,268 | | | 247,116 | | | 334,638 | |
| Non-interest expenses: | | | | | | |
| Operating expenses: | | | | | | |
| Compensation and benefits | | 349,387 | | | 326,554 | | | 270,354 | |
| FDIC assessment fees | | 51,606 | | | 45,766 | | | 20,939 | |
| Other operating expenses | | 235,577 | | | 246,886 | | | 260,169 | |
| Total operating expenses | | 636,570 | | | 619,206 | | | 551,462 | |
| Acquired intangible assets impairment and amortization expense | | 5,329 | | | 66,364 | | | 7,779 | |
| | | | | | |
| Total non-interest expenses | | 641,899 | | | 685,570 | | | 559,241 | |
| Income before income tax expense | | 798,636 | | | 778,296 | | | 630,725 | |
| Income tax expense | | 190,311 | | | 196,905 | | | 161,711 | |
| Net income | | 608,325 | | | 581,391 | | | 469,014 | |
| Preferred stock dividends | | 18,296 | | | 17,705 | | | 9,029 | |
| Net income attributable to SLM Corporation common stock | | $ | 590,029 | | | $ | 563,686 | | | $ | 459,985 | |
| Basic earnings per common share | | $ | 2.73 | | | $ | 2.44 | | | $ | 1.78 | |
| Average common shares outstanding | | 216,220 | | | 231,411 | | | 258,439 | |
| Diluted earnings per common share | | $ | 2.68 | | | $ | 2.41 | | | $ | 1.76 | |
| Average common and common equivalent shares outstanding | | 219,934 | | | 234,063 | | | 261,503 | |
| Declared dividends per common share | | $ | 0.46 | | | $ | 0.44 | | | $ | 0.44 | |
See accompanying notes to consolidated financial statements.
F-8 SLM CORPORATION — 2024 Form 10-K
| | | | | | | | | | | | | | | | | | | | |
| CONSOLIDATED STATEMENTS OF COMPREHENSIVE INCOME | | | | |
Years ended December 31,
(dollars in thousands) | | 2024 | | 2023 | | 2022 |
| Net income | | $ | 608,325 | | | $ | 581,391 | | | $ | 469,014 | |
| Other comprehensive income: | | | | | | |
| Unrealized gains (losses) on investments | | 42,604 | | | 59,205 | | | (194,157) | |
| Unrealized gains (losses) on cash flow hedges | | (30,394) | | | (34,457) | | | 93,731 | |
| Total unrealized gains (losses) | | 12,210 | | | 24,748 | | | (100,426) | |
| Income tax (expense) benefit | | (2,967) | | | (5,982) | | | 24,453 | |
| Other comprehensive income (loss), net of tax (expense) benefit | | 9,243 | | | 18,766 | | | (75,973) | |
| Total comprehensive income | | $ | 617,568 | | | $ | 600,157 | | | $ | 393,041 | |
See accompanying notes to consolidated financial statements.
2024 Form 10-K — SLM CORPORATION F-9
| | | | | | | | | | | | | | | | | | | | | | | | | | | | | | | | | | | | | | | | | | | | | | | | | | | | | | | | | | | | | | | | | | | | |
| CONSOLIDATED STATEMENTS OF CHANGES IN EQUITY | | | | | | | | | | | | | | | | |
| | | | Common Stock Shares | | | | | | | | | | | | | | |
| (In thousands, except share and per share amounts) | | Preferred Stock Shares | | Issued | | Treasury | | Outstanding | | Preferred Stock | | Common Stock | | Additional Paid-In Capital | | Accumulated
Other
Comprehensive
Income (Loss) | | Retained Earnings | | Treasury Stock | | Total Equity |
| Balance at December 31, 2021 | | 2,510,696 | | | 432,013,372 | | | (153,056,639) | | | 278,956,733 | | | $ | 251,070 | | | $ | 86,403 | | | $ | 1,074,384 | | | $ | (17,897) | | | $ | 2,817,134 | | | $ | (2,061,383) | | | $ | 2,149,711 | |
| Net income | | — | | | — | | | — | | | — | | | — | | | — | | | — | | | — | | | 469,014 | | | — | | | 469,014 | |
| Other comprehensive loss, net of tax | | — | | | — | | | — | | | — | | | — | | | — | | | — | | | (75,973) | | | — | | | — | | | (75,973) | |
| Total comprehensive income | | — | | | — | | | — | | | — | | | — | | | — | | | — | | | — | | | — | | | — | | | 393,041 | |
| Cash dividends declared: | | | | | | | | | | | | | | | | | | | | | | |
| Common stock ($0.44 per share) | | — | | | — | | | — | | | — | | | — | | | — | | | — | | | — | | | (112,961) | | | — | | | (112,961) | |
| Preferred Stock, Series B ($3.60 per share) | | — | | | — | | | — | | | — | | | — | | | — | | | — | | | — | | | (9,029) | | | — | | | (9,029) | |
| | | | | | | | | | | | | | | | | | | | | | |
| | | | | | | | | | | | | | | | | | | | | | |
| Issuance of common shares | | — | | | 3,107,768 | | | | | 3,107,768 | | | — | | | 622 | | | 618 | | | — | | | (807) | | | — | | | 433 | |
| Stock-based compensation expense | | — | | | — | | | — | | | — | | | — | | | — | | | 34,070 | | | — | | | 289 | | | — | | | 34,359 | |
| | | | | | | | | | | | | | | | | | | | | | |
| Common stock repurchased | | — | | | — | | | (40,253,548) | | | (40,253,548) | | | — | | | — | | | — | | | — | | | — | | | (707,742) | | | (707,742) | |
| Shares repurchased related to employee stock-based compensation plans | | — | | | — | | | (1,135,509) | | | (1,135,509) | | | — | | | — | | | — | | | — | | | — | | | (20,842) | | | (20,842) | |
| Balance at December 31, 2022 | | 2,510,696 | | | 435,121,140 | | | (194,445,696) | | | 240,675,444 | | | $ | 251,070 | | | $ | 87,025 | | | $ | 1,109,072 | | | $ | (93,870) | | | $ | 3,163,640 | | | $ | (2,789,967) | | | $ | 1,726,970 | |
See accompanying notes to consolidated financial statements.
F-10 SLM CORPORATION — 2024 Form 10-K
| | | | | | | | | | | | | | | | | | | | | | | | | | | | | | | | | | | | | | | | | | | | | | | | | | | | | | | | | | | | | | | | | | | | |
| CONSOLIDATED STATEMENTS OF CHANGES IN EQUITY | | | | | | | | | | | | | | |
| | | | Common Stock Shares | | | | | | | | | | | | | | |
| (In thousands, except share and per share amounts) | | Preferred Stock Shares | | Issued | | Treasury | | Outstanding | | Preferred Stock | | Common Stock | | Additional Paid-In Capital | | Accumulated
Other
Comprehensive
Income (Loss) | | Retained Earnings | | Treasury Stock | | Total Equity |
| Balance at December 31, 2022 | | 2,510,696 | | | 435,121,140 | | | (194,445,696) | | | 240,675,444 | | | $ | 251,070 | | | $ | 87,025 | | | $ | 1,109,072 | | | $ | (93,870) | | | $ | 3,163,640 | | | $ | (2,789,967) | | | $ | 1,726,970 | |
| Net income | | — | | | — | | | — | | | — | | | — | | | — | | | — | | | — | | | 581,391 | | | — | | | 581,391 | |
| Other comprehensive income, net of tax | | — | | | — | | | — | | | — | | | — | | | — | | | — | | | 18,766 | | | — | | | — | | | 18,766 | |
| Total comprehensive income | | — | | | — | | | — | | | — | | | — | | | — | | | — | | | — | | | — | | | — | | | 600,157 | |
| Cash dividends declared: | | | | | | | | | | | | | | | | | | | | | | |
| Common stock (0.44 per share) | | — | | | — | | | — | | | — | | | — | | | — | | | — | | | — | | | (101,233) | | | — | | | (101,233) | |
| Preferred Stock, Series B ($7.05 per share) | | — | | | — | | | — | | | — | | | — | | | — | | | — | | | — | | | (17,705) | | | — | | | (17,705) | |
| | | | | | | | | | | | | | | | | | | | | | |
| Issuance of common shares | | — | | | 3,109,276 | | | | | 3,109,276 | | | — | | | 622 | | | 3,237 | | | — | | | (1,234) | | | — | | | 2,625 | |
| Stock-based compensation expense | | — | | | — | | | — | | | — | | | — | | | — | | | 36,380 | | | — | | | — | | | — | | | 36,380 | |
| Common stock repurchased | | — | | | — | | | (22,341,595) | | | (22,341,595) | | | — | | | — | | | — | | | — | | | — | | | (349,397) | | | (349,397) | |
| Shares repurchased related to employee stock-based compensation plans | | — | | | — | | | (1,099,241) | | | (1,099,241) | | | — | | | — | | | — | | | — | | | — | | | (17,000) | | | (17,000) | |
| Balance at December 31, 2023 | | 2,510,696 | | | 438,230,416 | | | (217,886,532) | | | 220,343,884 | | | $ | 251,070 | | | $ | 87,647 | | | $ | 1,148,689 | | | $ | (75,104) | | | $ | 3,624,859 | | | $ | (3,156,364) | | | $ | 1,880,797 | |
See accompanying notes to consolidated financial statements.
2024 Form 10-K — SLM CORPORATION F-11
| | | | | | | | | | | | | | | | | | | | | | | | | | | | | | | | | | | | | | | | | | | | | | | | | | | | | | | | | | | | | | | | | | | | |
| CONSOLIDATED STATEMENTS OF CHANGES IN EQUITY | | | | | | | | | | | | | | |
| | | | Common Stock Shares | | | | | | | | | | | | | | |
| (In thousands, except share and per share amounts) | | Preferred Stock Shares | | Issued | | Treasury | | Outstanding | | Preferred Stock | | Common Stock | | Additional Paid-In Capital | | Accumulated
Other
Comprehensive
Income (Loss) | | Retained Earnings | | Treasury Stock | | Total Equity |
| Balance at December 31, 2023 | | 2,510,696 | | | 438,230,416 | | | (217,886,532) | | | 220,343,884 | | | $ | 251,070 | | | $ | 87,647 | | | $ | 1,148,689 | | | $ | (75,104) | | | $ | 3,624,859 | | | $ | (3,156,364) | | | $ | 1,880,797 | |
| Net income | | — | | | — | | | — | | | — | | | — | | | — | | | — | | | — | | | 608,325 | | | — | | | 608,325 | |
| Other comprehensive income, net of tax | | — | | | — | | | — | | | — | | | — | | | — | | | — | | | 9,243 | | | — | | | — | | | 9,243 | |
| Total comprehensive income | | — | | | — | | | — | | | — | | | — | | | — | | | — | | | — | | | — | | | — | | | 617,568 | |
| Cash dividends declared: | | | | | | | | | | | | | | | | | | | | | | |
| Common stock ($0.46 per share) | | — | | | — | | | — | | | — | | | — | | | — | | | — | | | — | | | (99,172) | | | — | | | (99,172) | |
| Preferred Stock, Series B ($7.29 per share) | | — | | | — | | | — | | | — | | | — | | | — | | | — | | | — | | | (18,296) | | | — | | | (18,296) | |
| | | | | | | | | | | | | | | | | | | | | | |
| | | | | | | | | | | | | | | | | | | | | | |
| Issuance of common shares | | — | | | 2,374,379 | | | | | 2,374,379 | | | — | | | 474 | | | 5,068 | | | — | | | (1,270) | | | — | | | 4,272 | |
| Stock-based compensation expense | | — | | | — | | | — | | | — | | | — | | | — | | | 39,996 | | | — | | | — | | | — | | | 39,996 | |
| Common stock repurchased | | — | | | — | | | (11,586,103) | | | (11,586,103) | | | — | | | — | | | — | | | — | | | — | | | (250,108) | | | (250,108) | |
| Shares repurchased related to employee stock-based compensation plans | | — | | | — | | | (749,866) | | | (749,866) | | | — | | | — | | | — | | | — | | | — | | | (15,137) | | | (15,137) | |
| Balance at December 31, 2024 | | 2,510,696 | | | 440,604,795 | | | (230,222,501) | | | 210,382,294 | | | $ | 251,070 | | | $ | 88,121 | | | $ | 1,193,753 | | | $ | (65,861) | | | $ | 4,114,446 | | | $ | (3,421,609) | | | $ | 2,159,920 | |
See accompanying notes to consolidated financial statements.
F-12 SLM CORPORATION — 2024 Form 10-K
| | | | | | | | | | | | | | | | | | | | |
| CONSOLIDATED STATEMENTS OF CASH FLOWS | | | | | | |
Years Ended December 31,
(dollars in thousands) | | 2024 | | 2023 | | 2022 |
| Operating activities | | | | | | |
| Net income | | $ | 608,325 | | | $ | 581,391 | | | $ | 469,014 | |
| Adjustments to reconcile net income to net cash provided by (used in) operating activities: | | | | | | |
| Provisions for credit losses | | 408,515 | | | 345,463 | | | 633,453 | |
| Deferred tax provision (benefit) | | (34,327) | | | (23,224) | | | (93,670) | |
| Amortization of brokered deposit placement fee | | 10,529 | | | 11,681 | | | 12,904 | |
| Amortization of Secured Borrowing Facility upfront fee | | 2,359 | | | 2,869 | | | 2,634 | |
| Amortization of deferred loan origination costs and loan premium/(discounts), net | | 12,883 | | | 12,583 | | | 14,804 | |
| Net amortization of discount on investments | | (1,772) | | | (2,726) | | | 103 | |
| Reduction of tax indemnification receivable | | — | | | 2,816 | | | 5,231 | |
| Depreciation of premises and equipment | | 17,652 | | | 17,811 | | | 17,331 | |
| Acquired intangible assets impairment and amortization expense | | 5,329 | | | 66,364 | | | 7,779 | |
| Stock-based compensation expense | | 39,996 | | | 36,380 | | | 34,461 | |
| Unrealized (gains) losses on derivative and hedging activities, net | | 65 | | | (341) | | | 269 | |
| Gains on sale of loans, net | | (254,928) | | | (160,290) | | | (327,750) | |
| (Gains) losses on securities, net | | (467) | | | (2,678) | | | 60,267 | |
| Acquisition transaction costs, net | | — | | | 952 | | | 2,603 | |
| | | | | | |
| Other adjustments to net income, net | | 12,563 | | | 16,212 | | | 14,213 | |
| Changes in operating assets and liabilities: | | | | | | |
| Increase in accrued interest receivable | | (1,110,434) | | | (1,054,071) | | | (819,958) | |
| Increase in trading investments | | — | | | — | | | (5,117) | |
| Increase in non-marketable securities | | (11,336) | | | (1,256) | | | (2,050) | |
| (Increase) decrease in other interest-earning assets | | 4,349 | | | 1,933 | | | (1,507) | |
| | | | | | |
| Increase in other assets | | (6,531) | | | (38,902) | | | (23,472) | |
| Increase (decrease) in income tax payable, net | | (20,408) | | | 36,723 | | | (15,063) | |
| Increase (decrease) in accrued interest payable | | 3,423 | | | 33,480 | | | 24,986 | |
| | | | | | |
| Increase (decrease) in other liabilities | | (15,180) | | | (27,807) | | | (6,473) | |
| Total adjustments | | (937,720) | | | (726,028) | | | (464,022) | |
| Total net cash (used in) provided by operating activities | | (329,395) | | | (144,637) | | | 4,992 | |
| Investing activities | | | | | | |
| Loans acquired and originated | | (7,064,230) | | | (6,452,199) | | | (6,081,389) | |
| Net proceeds from sales of loans held for investment and loans held for sale | | 4,246,602 | | | 3,198,502 | | | 3,459,527 | |
| Proceeds from FFELP Loan claim payments | | 27,579 | | | 50,145 | | | 33,197 | |
| Net decrease in loans held for investment and loans held for sale (other than loans acquired and originated, and loan sales) | | 2,725,473 | | | 3,046,064 | | | 3,586,825 | |
| Purchases of available-for-sale securities | | (91,881) | | | (105,970) | | | (753,129) | |
| Proceeds from sales and maturities of available-for-sale securities | | 832,450 | | | 265,652 | | | 960,015 | |
| Purchase of subsidiary, net of cash acquired | | — | | | (14,654) | | | (127,654) | |
| | | | | | |
| Total net cash provided by (used in) investing activities | | 675,993 | | | (12,460) | | | 1,077,392 | |
| Financing activities | | | | | | |
| Brokered deposit placement fee | | (7,975) | | | (7,841) | | | (11,170) | |
| Net increase in certificates of deposit | | 88,444 | | | 953,412 | | | 130,109 | |
| Net increase (decrease) in other deposits | | (687,108) | | | (770,485) | | | 570,147 | |
| Issuance costs for collateralized borrowings | | — | | | (15) | | | (40) | |
| Borrowings collateralized by loans in securitization trusts - issued | | 2,206,704 | | | 1,135,036 | | | 572,640 | |
| Borrowings collateralized by loans in securitization trusts - repaid | | (1,004,117) | | | (1,154,269) | | | (1,278,183) | |
| | | | | | |
| | | | | | |
| Fees paid on Secured Borrowing Facility | | (2,357) | | | (2,868) | | | (2,833) | |
| Issuance costs for unsecured debt offering | | — | | | — | | | (375) | |
| | | | | | |
| | | | | | |
| Preferred stock dividends paid | | (18,296) | | | (17,705) | | | (9,029) | |
| | | | | | |
2024 Form 10-K — SLM CORPORATION F-13
| | | | | | | | | | | | | | | | | | | | |
| Common stock dividends paid | | (99,172) | | | (101,233) | | | (112,961) | |
| Common stock repurchased | | (247,968) | | | (350,264) | | | (713,197) | |
| Net cash provided by (used in) financing activities | | 228,155 | | | (316,232) | | | (854,892) | |
| Net increase (decrease) in cash, cash equivalents and restricted cash | | 574,753 | | | (473,329) | | | 227,492 | |
| Cash, cash equivalents and restricted cash at beginning of year | | 4,299,507 | | | 4,772,836 | | | 4,545,344 | |
| Cash, cash equivalents and restricted cash at end of year | | $ | 4,874,260 | | | $ | 4,299,507 | | | $ | 4,772,836 | |
| Cash disbursements made for: | | | | | | |
| Interest | | $ | 1,109,084 | | | $ | 963,260 | | | $ | 482,974 | |
| Income taxes paid | | $ | 243,341 | | | $ | 191,690 | | | $ | 272,940 | |
| Income taxes refunded | | $ | (1,395) | | | $ | (8,201) | | | $ | (2,043) | |
| Reconciliation of the Consolidated Statements of Cash Flows to the Consolidated Balance Sheets: | | | | | | |
| Cash and cash equivalents | | $ | 4,700,366 | | | $ | 4,149,838 | | | $ | 4,616,117 | |
| Restricted cash | | 173,894 | | | 149,669 | | | 156,719 | |
| Total cash, cash equivalents and restricted cash | | $ | 4,874,260 | | | $ | 4,299,507 | | | $ | 4,772,836 | |
| Supplemental non-cash operating and investing activities: | | | | | | |
| Accrued interest capitalized during the period | | $ | 632,504 | | | $ | 632,649 | | | $ | 589,725 | |
| Trading investments received in consideration for loans sold | | $ | 5,218 | | | $ | 5,327 | | | $ | 16,477 | |
| Available-for-sale investments received in consideration for loans sold | | $ | 210,371 | | | $ | 162,256 | | | $ | 222,663 | |
See accompanying notes to consolidated financial statements.
F-14 SLM CORPORATION — 2024 Form 10-K
1.Organization and Business
SLM Corporation (“Sallie Mae,” “SLM,” the “Company,” “we,” “our,” or “us”) is a holding company that operates through a number of subsidiaries and is the premier financial brand for higher education.
While the Sallie Mae name has existed for more than 50 years, the company that operates as Sallie Mae today, SLM Corporation, was formed in late 2013 and includes its wholly-owned subsidiary, Sallie Mae Bank, an industrial bank established in 2005 (the “Bank”). On April 30, 2014, we legally separated (the “Spin-Off”) from another public company that is now named Navient Corporation (“Navient”), which is in the education loan management, consolidation loan, and business processing businesses. We are a consumer banking business and did not retain any assets or liabilities generated prior to the Spin-Off other than those explicitly retained by us pursuant to the documents executed in connection with the Spin-Off. We sometimes refer to the company that existed prior to the Spin-Off as “pre-Spin-Off SLM.”
Our primary business is to originate and service loans we make to students and their families to finance the cost of their education. We use “Private Education Loans” to mean education loans to students or their families that are not made, insured, or guaranteed by any state or federal government. Private Education Loans do not include loans insured or guaranteed under the previously existing Federal Family Education Loan Program (“FFELP Loans”). The core of our marketing strategy is to generate Private Education Loan originations by promoting our products on campuses through the financial aid offices as well as through online and direct marketing to students and their families. The Bank is regulated by the Utah Department of Financial Institutions (the “UDFI”), the Federal Deposit Insurance Corporation (the “FDIC”), and the Consumer Financial Protection Bureau (the “CFPB”).
2. Significant Accounting Policies
Use of Estimates and Assumptions
The financial reporting and accounting policies of SLM Corporation conform to generally accepted accounting principles in the United States of America (“GAAP”). The preparation of financial statements in conformity with GAAP requires management to make estimates and assumptions that affect the reported amounts of assets and liabilities and disclosure of contingent assets and liabilities at the date of the financial statements and the reported amounts of revenues and expenses during the reporting period. Actual results could differ from those estimates. Key accounting policies that include significant judgments and estimates include the valuation of allowance for credit losses.
Consolidation
The consolidated financial statements include the accounts of SLM Corporation and its majority-owned and controlled subsidiaries after eliminating the effects of intercompany accounts and transactions.
We consolidate any variable interest entity (“VIE”) where we have determined we are the primary beneficiary. The primary beneficiary is the entity which has both: (i) the power to direct the activities of the VIE that most significantly impact the VIE’s economic performance; and (ii) the obligation to absorb losses or receive benefits of the entity that could potentially be significant to the VIE.
Cash and Cash Equivalents
Cash and cash equivalents include cash held in the Federal Reserve Bank of San Francisco (the “FRB”) and commercial bank accounts, and other short-term liquid instruments with original maturities of three months or less. Fees associated with investing cash and cash equivalents are amortized into interest income using the effective interest rate method.
Trading Investments
We periodically sell Private Education Loans through securitization transactions where we are required to retain a five percent vertical risk retention interest (i.e., five percent of each class issued in the securitizations). We classify those vertical risk retention interests related to the transactions as available-for-sale investments, except for the interest in the residual classes, which we classify as trading investments recorded at fair value with changes recorded through earnings.
2024 Form 10-K — SLM CORPORATION F-15
| | | | | |
| 2. | Significant Accounting Policies (Continued) |
Available-for-Sale Investments
Our available-for-sale investments consist of mortgage-backed securities, Utah Housing Corporation bonds, U.S. government-sponsored enterprises and Treasury securities, and the vertical risk retention interests described above (other than residual classes). We record our investment purchases and sales on a trade date basis. The amortized cost of debt securities is adjusted for amortization of premiums and accretion of discounts, which are amortized using the effective interest rate method.
Our investments are classified as available-for-sale and reported at fair value. Unrealized gains or losses on available-for-sale investments are recorded in equity and reported as a component of other comprehensive income (loss), net of applicable income taxes.
We assess unrealized losses on available-for-sale debt securities that we have the ability and intent to hold for a period of time sufficient to recover the amortized cost of the security, for the purpose of determining credit impairment. If any credit impairment exists, an allowance for losses is established for the amount of the unrealized loss that is determined to be credit-related.
Other Investments
We hold investments in non-marketable securities and account for these investments at cost, less impairment, plus or minus observable price changes of identical or similar securities of the same issuer.
We also invest in affordable housing projects that qualify for the low income housing tax credit (“LIHTC”), which is designed to promote private development of low income housing. These investments generate a return mostly through realization of federal tax credits.
Loans Held for Investment
Loans, consisting of Private Education Loans, that we have the ability and intent to hold for the foreseeable future, are classified as held for investment, and are carried at amortized cost. Amortized cost includes the unamortized premiums, discounts, and capitalized origination costs and fees, all of which are amortized to interest income as discussed under “— Loan Interest Income.” Loans that are held for investment are reported net of an allowance for credit losses. During the third quarter of 2024, we transferred our FFELP Loan portfolio from loans held for investment to loans held for sale as we planned to sell the portfolio. During the fourth quarter of 2024, we sold our FFELP Loan portfolio to a third party. This transaction qualified for sale treatment and removed the balance of the loans from our balance sheet on the settlement date.
Loans Held for Sale
Any loans we have not classified as held for investment are classified as held for sale and are carried at the lower of cost or fair value. Loans are classified as held for sale when we have the intent and ability to sell such loans. Loans that are held for sale do not have the associated premium, discount, and capitalized origination costs and fees amortized into interest income. When a decision has been made to sell loans not previously classified as held for sale, such loans are transferred into the held for sale classification and carried at the lower of amortized cost basis (which excludes any allowance for credit losses) or fair value. At the time of the transfer to the held for sale classification, any amount by which the amortized cost basis exceeds fair value is accounted for as a valuation allowance. In addition, once a loan is classified as held for sale, we reverse any allowance for loan loss applicable to that loan.
As market conditions permit, we may sell or securitize loans as a source of financing for other loans. Due to varying structuring terms, certain transactions may qualify for sale treatment while others do not qualify for sale treatment and are recorded as financings. All of our education loans are initially categorized as held for investment. It is only when we have selected the loans to sell or securitize and the transaction qualifies as a sale that we transfer the loans into the held for sale classification and carry them at the lower of cost or fair value. If we anticipate recognizing a gain related to the impending securitization or sale, then the fair value of the loans is higher than their respective cost basis and no valuation allowance is recorded.
Restricted Cash
Restricted cash primarily includes amounts held in student loan securitization trusts and other secured borrowings. This cash must be used to make payments related to trust obligations. Amounts on deposit in these accounts are primarily the result of timing differences between when principal and interest is collected on the trust assets and when principal and interest is paid on trust liabilities.
F-16 SLM CORPORATION — 2024 Form 10-K
| | | | | |
| 2. | Significant Accounting Policies (Continued) |
Allowance for Credit Losses
We maintain an allowance for credit losses for the lifetime expected credit losses on loans in our portfolios, as well as for future loan commitments, at the reporting date.
In determining the lifetime expected credit losses on our Private Education Loan portfolio loan segments, we use a discounted cash flow method. This method requires us to project future principal and interest cash flows on our loans in those portfolios.
To estimate the future expected cash flows, we use statistical loan-level models that consider life of loan expectations for defaults, prepayments, recoveries, and any other qualitative adjustments deemed necessary, to determine the adequacy of the allowance at each balance sheet date. These cash flows are discounted at the loan’s effective interest rate to calculate the present value of those cash flows. Management adjusts the effective interest rate used to discount expected cash flows to incorporate expected prepayments. The difference between the present value of those cash flows and the amortized cost basis of the underlying loans is the allowance for credit losses. Entities that measure credit losses based on the present value of expected future cash flows are permitted to report the entire change in present value as credit loss expense, but may alternatively report the change in present value due to the passage of time as interest income. We have elected to report the entire change in present value as credit loss expense.
We estimate future default rates used in our current expected credit losses at a loan level using historical loss experience, current borrower characteristics, current conditions, and economic factors forecasted over a reasonable and supportable period. At the end of the reasonable and supportable forecast period, we immediately revert our forecasted economic factors to long-term historical averages. We estimate future prepayment speeds used in our current expected credit losses at a loan level using historical prepayment experience, current borrower characteristics, current conditions, and economic factors forecasted over a reasonable and supportable period.
The reasonable and supportable forecast period is meant to represent the period in which we believe we can estimate the impact of forecasted economic factors in our expected losses. We use a two-year reasonable and supportable forecast period, although this period is subject to change as our view evolves on our ability to reasonably forecast economic conditions to estimate future losses.
In estimating future default rates and prepayment speeds in our current expected credit losses, we use a combination of expected economic scenarios coupled with our historical experience and adjust for any qualitative factors (as described below). We also develop an adverse and favorable economic scenario. At each reporting date, we determine the appropriate weighting of these alternate scenarios based upon the current economic conditions and our view of the risks of alternate outcomes. This weighting of expectations is used in calculating our current expected credit losses recorded each period.
We obtain forecasts for our loss model inputs from Moody’s Analytics. Moody’s Analytics provides a range of forecasts for each of these inputs with various likelihoods of occurrence. We determine which forecasts we will include in our estimation of allowance for credit losses and the associated weightings for each of these inputs. At December 31, 2024, December 31, 2023, and December 31, 2022, we used the Baseline (50th percentile likelihood of occurring)/S1 (stronger near-term growth scenario - 10 percent likelihood of occurring)/S3 (unfavorable (or downside) scenario - 10 percent likelihood of occurring) scenarios and weighted them 40 percent, 30 percent, and 30 percent, respectively. Management reviews both the scenarios and their respective weightings each quarter in determining the allowance for credit losses.
In estimating recoveries, we use both estimates of what we expect to receive from the sale of defaulted loans as well as historical borrower payment behavior to estimate the timing and amount of future recoveries on charged-off loans.
In addition to the above modeling approach, we also take certain qualitative factors into consideration when calculating the allowance for credit losses, which could result in management overlays (increases or decreases to the allowance for credit losses). These management overlays can encompass a broad array of factors not captured by model inputs, including, but not limited to, changes in lending policies and procedures, including changes in underwriting standards, changes in servicing policies and collection administration practices, including the loan modification program changes implemented in the fourth quarter of 2023, state law changes that could impact servicing and collection practices, charge-offs, recoveries not already included in the analysis, the effect of other external factors such as legal and regulatory requirements on the level of estimated current expected credit losses, the performance of the model over time versus actual losses, and any other operational or regulatory changes that could affect our estimate of future losses.
The evaluation of the allowance for credit losses is inherently subjective, as it requires material estimates that may be susceptible to significant changes. If actual future performance in delinquency, charge-offs, and recoveries is significantly different than estimated, or management assumptions or practices were to change, this could materially affect
2024 Form 10-K — SLM CORPORATION F-17
| | | | | |
| 2. | Significant Accounting Policies (Continued) |
the estimate of the allowance for credit losses, the timing of when losses are recognized, and the related provision for credit losses in our consolidated statements of income.
When calculating our allowance for credit losses and liability for unfunded commitments, we incorporate several inputs that are subject to change period to period. These include, but are not limited to, CECL model inputs and any overlays deemed necessary by management. The most impactful CECL model inputs include:
•Economic forecasts;
•Weighting of economic forecasts; and
•Recovery rates.
Of the model inputs outlined above, economic forecasts, weighting of economic forecasts, and recovery rates are subject to estimation uncertainty, and changes in these inputs could have a material impact to our allowance for credit losses and the related provision for credit losses.
In the fourth quarter of 2022, we changed our loss model to include forecasts of college graduate unemployment, retail sales, and median family income in determining the adequacy of the allowance for credit losses. Prior to this change, we included forecasts of college graduate unemployment and the Consumer Price Index in our loss forecasting models.
In 2023, we experienced slower prepayment rates due to the rising interest rate environment. Historically, when rates rise, loan prepayments decline due to a reduction in consolidation activity of our borrowers to third party lenders, and when rates decline, loan prepayments rise due to an increase in consolidation activity of our borrowers to third party lenders. During 2023, our estimates of future prepayment speeds reflected the then current interest rate environment and future expectations of increased prepayment speeds in line with market expectations of a decline in interest rates based on the scenarios produced by Moody's Analytics described above. Slower prepayment speeds increase the allowance for credit losses because the loss rates applied in the future periods are applied to higher loan balances. In the second quarter of 2024, we implemented a loan-level future default rate model that includes current portfolio characteristics and forecasts of real gross domestic product and college graduate unemployment.
In the second quarter of 2024, we also implemented a future prepayment speeds model to include forecasts of real gross domestic product, retail sales, the Secured Overnight Financing Rate (“SOFR”), and the U.S. 10-year treasury rate. These models reduce the reliance on certain qualitative overlays compared to the previous default rate and prepayment speeds models. Prior to these changes, our default rate and prepayment speeds models used forecasts of college graduate unemployment, retail sales, home price index, and median family income. Both the future default rate model and the future prepayment speeds model are used in determining the adequacy of the allowance for credit losses. The combined impact upon implementation of these model enhancements and the changes in the related qualitative overlays did not have a material impact on the overall level of our allowance for credit losses.
Below we describe in further detail our policies and procedures for the allowance for credit losses as they relate to our Private Education Loan portfolio. During the third quarter of 2024, we reclassified our FFELP Loan portfolio to loans held for sale and subsequently sold the FFELP Loan portfolio to a third party during the fourth quarter of 2024. During the third quarter of 2022, we reclassified our Credit Card loan portfolio to loans held for sale and subsequently sold the Credit Card portfolio to a third party in May 2023.
Allowance for Private Education Loan Losses
In addition to the key assumptions/estimates described above, some estimates are unique to our Private Education Loan portfolio. Estimates are made on our Private Education Loans regarding when each borrower will separate from school. The cash flow timing of when a borrower will begin making full principal and interest payments is dependent upon when the student either graduates or leaves school. These dates can change based upon many factors. We receive information regarding projected graduation dates from a third-party clearinghouse. The separation from school date is updated quarterly based on updated information received from the clearinghouse.
Additionally, when we have a contractual obligation to fund a loan or a portion of a loan at a later date, we make an estimate regarding the percentage of this obligation that will be funded. This estimate is based on historical experience. For unfunded commitments, we recognize the related life of loan allowance as a liability. Once the loan is funded, that liability transfers to the allowance for Private Education Loan losses.
F-18 SLM CORPORATION — 2024 Form 10-K
| | | | | |
| 2. | Significant Accounting Policies (Continued) |
Key Credit Quality Indicators - Private Education Loans
We determine the collectability of our Private Education Loan portfolio by evaluating certain risk characteristics. We consider credit score at original approval and periodically refreshed/updated credit scores through the loan’s term, existence of a cosigner, loan status, and loan seasoning as the key credit quality indicators because they have the most significant effect on the determination of the adequacy of our allowance for credit losses. Credit scores are an indicator of the creditworthiness of borrowers, and the higher the credit scores the more likely it is the borrowers will be able to make all of their contractual payments. Loan status affects the credit risk because a past due loan is more likely to result in a credit loss than a current loan. Additionally, loans in the deferred payment status have different credit risk profiles compared with those in current pay status. Loan seasoning affects credit risk because a loan with a history of making payments generally has a lower incidence of default than a loan with a history of making infrequent or no payments. The existence of a cosigner lowers the likelihood of default as well. We monitor and update these credit quality indicators in the analysis of the adequacy of our allowance for credit losses on a quarterly basis.
In the second quarter of 2023, we changed how we collect on defaulted loans. Previously, we used a mix of in-house collectors and sales to third parties. We continue to sell a segment of defaulted loans immediately after charge-off but no longer sell retained defaulted loans (that have been subject to internal collection attempts for six months) to third parties and instead continue our collection efforts using in-house collectors and third-party collectors. This improved our estimate of recovery rates for the year ended December 31, 2023. When we estimate the timing and amount of future recoveries on charged-off loans, we no longer include expectations of future sales on retained defaulted loans. We continue to monitor how we collect on defaulted loans and may modify the approach from time to time based on performance, industry conventions, and/or regulatory feedback.
For December 31, 2022, we used both an estimate of recovery rates from in-house collections as well as expectations of future sales of defaulted loans to estimate the timing and amount of future recoveries on charged-off loans.
Private Education Loans generally do not require borrowers to begin principal and interest repayment until at least six months after the borrowers have graduated or otherwise separated from school. Consequently, the loss estimates for these loans are generally low while the borrower is in school and then increase upon the end of the grace period after separation from school. At December 31, 2024 and 2023, 26 percent and 25 percent, respectively, of the principal balance of the Private Education Loan portfolio was related to borrowers who were then in an in-school (fully deferred), grace, or other deferment status and not required to make payments.
Our collection policies for Private Education Loans allow for periods of nonpayment (forbearance) for certain borrowers requesting an extended grace period upon leaving school or experiencing temporary difficulty meeting payment obligations.
As part of concluding on the adequacy of the allowance for credit losses for Private Education Loans, we review key allowance and loan metrics. The most relevant of the metrics considered are the allowance coverage of net charge-offs ratio; the allowance as a percentage of ending total loans plus unfunded loan commitments and total accrued interest receivable; and delinquency and forbearance percentages.
We consider a Private Education Loan to be delinquent if the borrower has not made a required payment prior to the 31st day after such payment was contractually due.
Off-Balance Sheet Exposure for Contractual Loan Commitments
When we approve a Private Education Loan at the beginning of an academic year, that approval may cover the borrowing for the entire academic year. As such, we do not always disburse the full amount of the loan at the time of such approval, but instead have a commitment to fund a portion of the loan at a later date (usually the start of the second semester or subsequent trimesters). We estimate expected credit losses over the contractual period in which we are exposed to credit risk via a contractual obligation to extend credit, unless that obligation is unconditionally cancellable by us. The discounted cash flow approach described above includes expected future contractual disbursements. The portion of the allowance for credit losses related to future disbursements is shown as a liability on the face of the balance sheet, and related provision for credit losses is reflected on the income statement.
2024 Form 10-K — SLM CORPORATION F-19
| | | | | |
| 2. | Significant Accounting Policies (Continued) |
Uncollectible Interest
The majority of the total accrued interest receivable on our Private Education Loan portfolio represents accrued interest on deferred loans where no payments are due while the borrower is in school and on fixed-pay loans where the borrower makes a $25 monthly payment that is smaller than the interest accrued on the loan in that month. The accrued interest on these loans will be capitalized and increase the unpaid principal balance of the loans when the borrower exits the grace period after separation from school. The discounted cash flow approach and the allowance for credit losses described above consider both the collectability of principal and accrued interest. The allowance for uncollectible interest estimates the additional uncollectible interest that is not captured in the allowance for credit losses. The allowance for uncollectible interest uses historical experience to estimate the uncollectible interest on loans for which payment in full of principal or interest is not expected. This amount is recorded as a reduction of interest income. Accrued interest receivable is separately disclosed on the face of the balance sheet.
Allowance for Credit Card Loans
At September 30, 2022, we transferred our Credit Card portfolio to loans held for sale as we planned to sell our Credit Card portfolio. At that time, we reversed $2.4 million through the provisions for credit losses for the allowance related to these loans. We subsequently sold the Credit Card portfolio to a third party in May 2023.
Allowance for FFELP Loan Losses
During the third quarter of 2024, we transferred our FFELP Loan portfolio to loans held for sale as we planned to sell our FFELP Loan portfolio. At that time, we wrote down this loan portfolio to its estimated fair value through an adjustment to the allowance for credit losses of $8 million. We subsequently sold the FFELP Loan portfolio to a third party in the fourth quarter of 2024.
FFELP Loans are insured as to their principal and accrued interest in the event of default, subject to a risk-sharing level based on the date of loan disbursement. These insurance obligations are supported by contractual rights against the United States. For loans disbursed on or after July 1, 2006, owners receive 97 percent reimbursement on all qualifying claims. For loans disbursed after October 1, 1993, and before July 1, 2006, owners receive 98 percent reimbursement on all qualifying claims. For loans disbursed prior to October 1, 1993, owners receive 100 percent reimbursement. Because owners bear a maximum of three percent loss exposure due to this federal guarantee, our allowance for credit losses for FFELP Loans and related periodic provision expense were relatively small.
For the years ended December 31, 2023 and 2022, we used the gross loss approach when estimating the allowance for credit losses for the unguaranteed portion of our FFELP Loans. We maintained an allowance for credit losses for our FFELP Loans at a level sufficient to cover lifetime expected credit losses. The allowance for FFELP Loan losses used historical experience of customer default behavior. We applied the default rate projections, net of applicable risk sharing, to our FFELP Loans for the respective period to perform our quantitative calculation. Once the quantitative calculation was performed, we reviewed the adequacy of the allowance for credit losses and determined if qualitative adjustments needed to be considered.
Business Combinations
On March 4, 2022, we completed the acquisition of the assets primarily used or held for use of Epic Research Education Services, LLC, which did business as Nitro College (“Nitro”). Nitro provided resources that helped students and families evaluate how to responsibly pay for college and manage their financial responsibilities after graduation. The addition of Nitro supports our mission of providing students with the confidence needed to successfully navigate the higher education journey. The acquisition of the Nitro assets, including its employees and intellectual property, expanded our digital marketing capabilities, reduced the cost to acquire customer accounts, and accelerated our progress to become a broader education solutions provider for students before, during, and immediately after college. In 2024, we completed the transition of the related Nitro branding to the Sallie and Sallie Mae brands and platforms.
On July 21, 2023, we completed the acquisition of several key assets of Scholly, Inc. (“Scholly”). Scholly was engaged in the business of operating as a scholarship publishing and servicing platform, comprised of websites and mobile application search products that offered custom recommendations for post-secondary scholarships for students, their families, and others as well as related services for scholarship providers. The addition of Scholly assets supports our mission of providing students with the confidence needed to successfully navigate the higher education journey.
These acquisitions were accounted for as business combinations using the acquisition method of accounting in accordance with the Accounting Standard Codification 805, “Business Combinations,” of the Financial Accounting Standards Board (“FASB”), whereby as of the respective acquisition date, the acquired tangible assets and liabilities were recorded at their estimated fair values. The identifiable intangible assets were recorded at fair values as determined by an independent appraiser. The final purchase price allocation for Nitro resulted in an excess purchase price over fair value of
F-20 SLM CORPORATION — 2024 Form 10-K
| | | | | |
| 2. | Significant Accounting Policies (Continued) |
net assets acquired, or goodwill, of $51 million. The final purchase price allocation for Scholly resulted in an excess purchase price over fair value of net assets acquired, or goodwill, of $5 million.
The results of operations of Nitro and Scholly have been included in our consolidated financial statements since the respective acquisition dates. We have not disclosed the pro forma impact of these acquisitions to the results of operations for the years ended December 31, 2023 and 2022, as the pro forma impacts were deemed immaterial. Transaction costs associated with the Nitro acquisition were approximately $3 million and were expensed as incurred within “Other operating expenses” in the consolidated statements of income for the year ended December 31, 2022. Transaction costs associated with the Scholly acquisition were approximately $1 million and were expensed as incurred within “Other operating expenses” in the consolidated statements of income for the year ended December 31, 2023.
Identifiable intangible assets at the acquisition date of Nitro included definite life intangible assets with an aggregate fair value of approximately $75 million, including trade name and trademarks, customer relationships, and developed technology. In the fourth quarter of 2023, we impaired our Nitro trade name and trademarks intangible asset. See Note 8, “Goodwill and Acquired Intangible Assets” in this Form 10-K for additional details.
Identifiable intangible assets at the acquisition date of Scholly included definite life intangible assets with an aggregate fair value of approximately $11 million, including trade name and trademarks, developed technology, customer relationships, and partner relationships.
See “—Goodwill and Acquired Intangible Assets” in this Note 2 and Note 8, “Goodwill and Acquired Intangible Assets” in this Form 10-K for additional details.
Goodwill and Acquired Intangible Assets
Acquisitions are accounted for under the acquisition method of accounting, which results in the Company allocating the purchase price to the fair value of the acquired assets, liabilities, and non-controlling interests, if any, with the remaining purchase price allocated to goodwill.
Goodwill is not amortized but is tested periodically for impairment. We test goodwill for impairment annually in the fourth quarter of the year, or more frequently if we believe that indicators of impairment exist. We complete a goodwill impairment analysis, which may be a qualitative or a quantitative analysis depending on the facts and circumstances associated with the reporting unit. In conjunction with a qualitative impairment analysis, we assess relevant qualitative factors to determine whether it is “more-likely-than-not” that the fair value of a reporting unit is less than its carrying amount. The “more-likely-than-not” threshold is defined as having a likelihood of more than 50 percent. If, based on first assessing impairment utilizing a qualitative approach, we determine it is “more-likely-than not” that the fair value of the reporting unit is less than its carrying amount, we will also complete a quantitative impairment analysis. In conjunction with a quantitative impairment analysis, we compare the fair value of the reporting unit to the reporting unit’s carrying value, including goodwill. If the carrying value of the reporting unit exceeds the fair value, goodwill is impaired in an amount equal to the amount by which the carrying value exceeds the fair value of the reporting unit, but not to exceed the goodwill amount attributed to the reporting unit.
Acquired intangible assets include trade names and trademarks, customer relationships, developed technology, and partner relationships. Our acquired intangible assets have finite lives and are amortized over their estimated useful lives in proportion to their estimated economic benefit. We review our long-lived assets for impairment whenever events or changes in circumstances indicate that the carrying amount of such assets may not be recoverable.
See Note 8, “Goodwill and Acquired Intangible Assets” in this Form 10-K for additional details.
Deposits
Our retail deposit accounts are principally certificates of deposit (“CDs”), money market deposit accounts (“MMDAs”), and high-yield savings (“HYS”) accounts. CDs are accounts that have a stipulated maturity and interest rate. Retail CDs may be withdrawn early, but a penalty is assessed. MMDA and HYS accounts are both interest and non-interest-bearing accounts that have no maturity or expiration date. For retail MMDA and HYS accounts, the depositor may be required to give written notice of any intended withdrawal not less than seven days before the withdrawal is made.
The Bank also includes brokered CDs in its funding base. Early withdrawal of brokered CDs is generally prohibited (except in the case of death or legal incapacity). Other deposit accounts include large interest-bearing omnibus accounts deposited in the Bank by commercial entities having custodial responsibilities for many underlying accounts. These omnibus accounts may be structured with or without fixed maturities, and may have fixed or variable interest rates.
2024 Form 10-K — SLM CORPORATION F-21
| | | | | |
| 2. | Significant Accounting Policies (Continued) |
Fair Value Measurement
We use estimates of fair value in applying various accounting standards for our financial statements. Fair value measurements are used in one of four ways:
•In the consolidated balance sheet with changes in fair value recorded in the consolidated statement of income;
•In the consolidated balance sheet with changes in fair value recorded in the accumulated other comprehensive income section of the consolidated statement of changes in equity;
•In the consolidated balance sheet for instruments carried at lower of cost or fair value with impairment charges recorded in the consolidated statement of income; and
•In the notes to the consolidated financial statements.
Fair value is defined as the price to sell an asset or transfer a liability in an orderly transaction between willing and able market participants. In general, our policy in estimating fair value is to first look at observable market prices for identical assets and liabilities in active markets, where available. When these are not available, other inputs are used to model fair value such as prices of similar instruments, yield curves, volatilities, prepayment speeds, default rates, and credit spreads (including for our liabilities), relying first on observable data from active markets. Depending on current market conditions, additional adjustments to fair value may be based on factors such as liquidity, credit, and bid/offer spreads. Transaction costs are not included in the determination of fair value. When possible, we seek to validate the model’s output to market transactions. Depending on the availability of observable inputs and prices, different valuation models could produce materially different fair value estimates. The values presented may not represent future fair values and may not be realizable.
We categorize our fair value estimates based on a hierarchical framework associated with three levels of price transparency utilized in measuring financial instruments at fair value. Classification is based on the lowest level of input that is significant to the fair value of the instrument. The three levels are as follows:
•Level 1 — Quoted prices (unadjusted) in active markets for identical assets or liabilities that we have the ability to access at the measurement date. The types of financial instruments included in level 1 are highly liquid instruments with quoted prices.
•Level 2 — Inputs from active markets, other than quoted prices for identical instruments, are used to determine fair value. Significant inputs are directly observable from active markets for substantially the full term of the asset or liability being valued.
•Level 3 — Pricing inputs significant to the valuation are unobservable. Inputs are developed based on the best information available. However, significant judgment is required by us in developing the inputs.
Loan Interest Income
For all loans, including impaired loans (regardless of the delinquency status of the impaired loans), classified as held for investment, we recognize interest income as earned, adjusted for the amortization of deferred direct origination and acquisition costs. Deferred fees or costs are required to be recognized as yield adjustments over the life of the related loans and are recognized by the interest method. The objective of the interest method is to arrive at periodic interest income (including recognition of fees and costs) at a constant effective yield on the net investment in the receivable (i.e., the principal amount of the receivable adjusted by unamortized fees or costs, purchase premium or discount, and any hedging activity—these unamortized costs will collectively be referred to as “basis adjustments”). The difference between the periodic interest income so determined and the interest income determined by applying the stated interest rate to the outstanding principal amount of the receivable is the amount of periodic amortization of deferred direct origination and acquisition costs.
For the amortization of the basis adjustments, we determine the constant effective yield necessary to apply the interest method based upon the contractual terms of the loan contract, with no consideration given to expected prepayments.
For fixed-rate loans, when a prepayment occurs the unamortized balance of the basis adjustments is adjusted so that future amortization (based upon the contractual terms of the loan) will result in a constant effective yield equal to the original effective interest rate. Prepayments do not result in a change in the effective interest rate of the loan. We determine the contractual payments on a pool basis; as such, when a prepayment occurs, future contractual payments will be determined assuming the pool will make smaller payments through the original term of the contract. The adjustment to the unamortized basis adjustment balance is recorded in interest income.
For variable-rate loans, the effective interest rate at the time of origination is the loan’s effective interest rate assuming all future contractual payments. The effective interest rate remains the same for that loan until the loan rate
F-22 SLM CORPORATION — 2024 Form 10-K
| | | | | |
| 2. | Significant Accounting Policies (Continued) |
changes. If there is no prepayment and no change in the stated interest rate, the periodic amortization of the basis adjustments is equal to the difference between the effective interest rate multiplied by the book basis and the contractual interest due. We determine the contractual payments on a pool basis; as such, when a prepayment occurs, future contractual payments will be determined assuming the pool will make smaller payments through the original term of the contract. The adjustment to the unamortized basis adjustment balance is recorded in interest income.
When the interest rate on a variable-rate loan changes, the effective interest rate is recalculated using the same methodology described in the previous paragraph; however, the future contractual payments are changed to reflect the new interest rate. There is no forecasting of future expected changes in interest rates. The accounting basis used to determine the effective interest rate of the cash flows is equal to the balances of the unpaid principal balance and unamortized basis adjustments at the time of the rate change.
We also paid the U.S. Department of Education (the “DOE”) an annual 105 basis point Consolidation Loan Rebate Fee on FFELP consolidation loans, which was netted against loan interest income. Additionally, interest earned on education loans reflects potential non-payment adjustments in accordance with our uncollectible interest recognition policy. We do not amortize any adjustments to the basis of loans when they are classified as held for sale.
For loans not currently in full principal and interest repayment status or interest-only repayment status, we recognize the allowance for the portion of uncollectible interest representing amounts to be capitalized after separation from school and the expiration of the grace period to the provisions for credit losses and classify this allowance as part of our allowance for credit losses.
The allowance for the portion of uncollectible interest on loans making full interest payments estimates the additional uncollectible interest that is not captured in the allowance for credit losses and will continue to be recorded as a reduction of interest income. As we maintain an allowance for uncollectible interest on loans making full interest payments and an allowance for credit losses for the interest on loans where all, or a portion of the interest, will be capitalized in the future, we do not place loans in nonaccrual status prior to charge-off. However, if it is determined that an individual loan or pool of loans is high risk, they may be placed on nonaccrual status, which entails stopping the accrual of interest on those loans until such time that the borrower(s) have made a sufficient number of payments (typically six months) to return to accrual status. At December 31, 2024, we had an immaterial amount of loans in nonaccrual status. At December 31, 2023, we also had an immaterial amount of loans in nonaccrual status.
We recognize certain fee income (primarily late fees) on all loans when earned according to the contractual provisions of the promissory notes, as well as our expectation of collectability. Fee income is recorded when earned in “other non-interest income” in the accompanying consolidated statements of income.
Interest Expense
Interest expense is based upon contractual interest rates and other fees, adjusted for the amortization of issuance costs, premiums, and discounts. We incur interest expense on interest-bearing deposits comprised of non-maturity savings deposits, brokered and retail CDs, brokered and retail MMDAs, as well as unsecured and secured financings. Our Private Education Loan multi-lender secured borrowing facility (the “Secured Borrowing Facility”) also incurs an unused facility fee on the amount of unfunded commitments. Interest expense is recognized when amounts are contractually due and is adjusted for net payments/receipts related to qualifying interest rate swap agreements designated as hedges of interest-bearing liabilities. Interest expense also includes the amortization of deferred gains and losses on closed qualifying hedge transactions. Amortization of debt issuance costs, premiums, discounts, and terminated hedge-basis adjustments are recognized using the effective interest rate method. Refer to Note 9, “Deposits,” and Note 10, “Borrowings” in this Form 10-K for further details of our interest-bearing liabilities.
Gains on Sale of Loans, Net
We may participate and sell loans to third parties and affiliates. These sales may occur through whole loan sales or securitization transactions that qualify for sale treatment. If a transfer of loans qualifies as a sale, we derecognize the loan and recognize a gain or loss as the difference between the carry basis of the loan sold and liabilities retained and the compensation received. We recognize the results of a transfer of loans based upon the settlement date of the transaction. These loans were initially recorded as held for investment and were transferred to held for sale immediately prior to sale or securitization.
Other Income
Included in other income are late fees on both Private Education Loans and FFELP Loans, which we recognize when the cash has been received, income for servicing private student loans for third parties, and changes to our tax indemnification receivable from Navient. Other income also included fees related to our Credit Card program. At
2024 Form 10-K — SLM CORPORATION F-23
| | | | | |
| 2. | Significant Accounting Policies (Continued) |
September 30, 2022, we transferred our Credit Card portfolio to loans held for sale and subsequently sold the Credit Card portfolio to a third party in May 2023.
Securitization Accounting
Our securitization transactions use a two-step structure with a special purpose entity VIE that legally isolates the transferred assets from us in the event of bankruptcy or receivership. Transactions receiving sale treatment are also structured to ensure that the holders of the beneficial interests issued are not constrained from pledging or exchanging their interests, and that we do not maintain effective control over the transferred assets. If these criteria are not met, the transaction does not meet the criteria for sale treatment and is accounted for as an on-balance sheet secured borrowing. If a securitization qualifies as a sale, we assess whether Sallie Mae is the primary beneficiary of the securitization trust and thus required to consolidate the trust. We are considered the primary beneficiary if we have both: (i) the power to direct the activities of the VIE that most significantly impact the VIE’s economic performance; and (ii) the obligation to absorb losses or receive benefits of the entity that could potentially be significant to the VIE. As there is not a bright-line test for determining significance, the assessment of who has the power to significantly direct the activities of the VIE, and who has the obligation to absorb losses or receive benefits material to the VIE, can be qualitative and judgmental in nature. If we are determined to be the primary beneficiary, then no gain or loss is recognized on the transaction.
Irrespective of whether a securitization receives sale or on-balance sheet treatment, our continuing involvement with our securitization trusts is generally limited to:
•Owning the equity certificates of certain trusts;
•The servicing of the student loan assets within the securitization trusts, on both a pre- and post-default basis;
•Our acting as administrator for the securitization transactions we sponsored;
•Our responsibilities relative to representation and warranty violations; and
•The option to exercise the clean-up call and purchase the student loans from the trust when the pool balance is 10 percent or less of the original pool balance.
In 2024 and 2023, we executed several secured financing transactions. Based upon our relationships with these securitizations, we believe the consolidation assessment is straightforward. We consolidated our secured financing transactions because either we did not meet the accounting criterion for sales treatment or we determined we were the primary beneficiary of the VIE because we retained (i) the residual interest in the securitization and therefore had the obligation to absorb losses or receive benefits of the entity that could potentially be significant to the VIE, as well as (ii) the power to direct the activities of the VIE in our role as servicer.
The investors in our securitization trusts have no recourse to our other assets should there be a failure of the trust to pay when due. Generally, the only recourse the securitization trusts have to us is in the event we breach a seller representation or warranty or our duties as master servicer and servicer, in which event we are obligated to repurchase the related loans from the trust. We may also be responsible for indemnities in other instances for such things as willful misfeasance or bad faith.
In 2024 and 2023, we also closed several loan sales and securitization transactions that were not consolidated on our balance sheet due to the transaction having met the criteria for sales treatment and Sallie Mae not being the primary beneficiary. In these transactions, we removed loans from our consolidated balance sheet and recognized any assets retained and liabilities assumed at fair value, and recorded a gain or loss on the transferred loans. Our continuing involvement in these securitization transactions mainly consists of acting as the primary servicer and holding certain retained interests. We provide additional information regarding these types of activities in Note 10, “Borrowings — Unconsolidated Funding Vehicles” in this Form 10-K.
Derivative Accounting
We account for our derivatives, consisting of interest rate swaps, at fair value on the consolidated balance sheets as either an asset or liability. Derivative positions are recorded as net positions by counterparty based on master netting arrangements (see Note 11, “Derivative Financial Instruments” in this Form 10-K), exclusive of accrued interest and cash collateral held or pledged. The Dodd-Frank Wall Street Reform and Consumer Protection Act of 2010 (the “Dodd-Frank Act”) requires all standardized derivatives, including most interest rate swaps, to be submitted for clearing to central counterparties to reduce counterparty risk. Two of the central counterparties we use are the Chicago Mercantile Exchange (the “CME”) and the London Clearing House (the “LCH”). All variation margin payments on derivatives cleared through the CME and LCH are accounted for as legal settlement. As of December 31, 2024, $850 million notional of our derivative contracts were cleared on the CME and $71 million were cleared on the LCH. The derivative contracts cleared
F-24 SLM CORPORATION — 2024 Form 10-K
| | | | | |
| 2. | Significant Accounting Policies (Continued) |
through the CME and LCH represent 92.3 percent and 7.7 percent, respectively, of our total notional derivative contracts of $921 million at December 31, 2024.
For derivatives cleared through the CME and LCH, the net gain (loss) position includes the variation margin amounts as settlement of the derivative and not collateral against the fair value of the derivative. The amount of variation margin included as settlement as of December 31, 2024 was $(22) million and $(1) million for the CME and LCH, respectively. Changes in fair value for derivatives not designated as hedging instruments are presented as realized gains (losses).
We determine the fair value for our derivative contracts primarily using pricing models that consider current market conditions and the contractual terms of the derivative contracts. These pricing models consider interest rates, time value, forward interest rate curves, and volatility factors. Inputs are generally from active financial markets.
The accounting for derivative instruments requires that every derivative instrument, including certain derivative instruments embedded in other contracts, be recorded on the balance sheet as either an asset or liability measured at fair value. Our derivative instruments are classified and accounted for by us as either fair value hedges or cash flow hedges.
Each derivative is designated to a specific (or pool of) liability(ies) on the consolidated balance sheets, and is designated as either a “fair value” hedge or a “cash flow” hedge. Fair value hedges are designed to hedge our exposure to the changes in fair value of a fixed-rate liability. For effective fair value hedges, both the hedge and the hedged item (for the risk being hedged) are recorded at fair value with any difference reflecting ineffectiveness recorded immediately in the consolidated statements of income. Cash flow hedges are designed to hedge our exposure to variability in cash flows related to variable-rate deposits. The assessment of the hedge’s effectiveness is performed at inception and on an ongoing basis, using regression testing. For hedges of a pool of liabilities, tests are performed to demonstrate the similarity of individual instruments of the pool. When it is determined that a derivative is not currently an effective hedge, ineffectiveness is recognized for the full change in fair value of the derivative with no offsetting amount from the hedged item since the last time it was effective. If it is also determined the hedge will not be effective in the future, we discontinue the hedge accounting prospectively and begin amortization of any basis adjustments that exist related to the hedged item.
On March 12, 2020, FASB issued ASU No. 2020-04, “Reference Rate Reform (“Topic 848”): Facilitation of the Effects of Reference Rate Reform on Financial Reporting.” On January 7, 2021, the FASB issued ASU No. 2021-01, “Reference Rate Reform (“Topic 848”): Scope” that clarified the scope of Topic 848. Topic 848 contains temporary optional expedients and exceptions for applying GAAP to contract modifications, hedging relationships, and other transactions affected by reference rate reform.
Our derivative portfolio is made up of interest rate swaps that are centrally cleared through either the CME or the LCH. On October 16, 2020, both the CME and the LCH changed the price alignment interest and discount rate applied when valuing these transactions to SOFR. The ISDA 2020 LIBOR Fallbacks Protocol (the “ISDA Fallback Protocol”) was made available for adherence on October 23, 2020, with an effective date of January 25, 2021. Once adhered to by both counterparties in a bilateral relationship and the effective date is reached, the ISDA Fallback Protocol represents a change to the contractual terms of derivatives governed by each respective ISDA agreement between the Company and a derivative counterparty. We have elected the option provided in Topic 848 to not reassess previous accounting determinations as well as the option to not dedesignate a hedging relationship due to a current or future change in a critical or contractual term related to reference rate reform, including changes in the discount rate.
As our liabilities began to use alternatives to LIBOR before LIBOR was no longer published, for cash flow hedges of forecasted LIBOR based payments, we elected the expedient offered in Topic 848 to disregard the potential change in the designated hedged interest rate risk that may occur because of reference rate reform when we assess whether the hedged forecasted transactions are probable, in accordance with the requirements of “Derivatives and Hedging” Topic 815. We have also elected the expedient provided by Topic 848 to assume the reference rate would not be replaced for the remainder of the hedging relationship when assessing hedge effectiveness.
Stock-Based Compensation
We recognize stock-based compensation cost in our consolidated statements of income using the fair value method. Under this method, we determine the fair value of the stock-based compensation at the time of the grant and recognize the resulting compensation expense over the shorter of the vesting period of the stock-based grant or the employee’s retirement eligible date. We do not apply a forfeiture rate to our stock-based compensation expense, but rather record forfeitures when they occur. We record all excess tax benefits/deficiencies related to the settlement of employee stock-based compensation to the income tax expense line item on our consolidated statements of income.
2024 Form 10-K — SLM CORPORATION F-25
| | | | | |
| 2. | Significant Accounting Policies (Continued) |
Income Taxes
We account for income taxes under the asset and liability approach, which requires the recognition of deferred tax liabilities and assets for the expected future tax consequences of temporary differences between the carrying amounts and tax basis of our assets and liabilities. To the extent tax laws change, deferred tax assets and liabilities are adjusted in the period that the tax change is enacted.
“Income tax expense (benefit)” includes (i) deferred tax expense (benefit), which represents the net change in the deferred tax asset or liability balance during the year when applicable, and (ii) current tax expense (benefit), which represents the amount of tax currently payable to or receivable from a tax authority plus amounts accrued for unrecognized tax benefits. Income tax expense (benefit) excludes the tax effects related to adjustments recorded in equity.
An uncertain tax position is recognized only if it is more likely than not to be sustained upon examination based on the technical merits of the position. The amount of tax benefit recognized in the consolidated financial statements is the largest amount of benefit that is more than 50 percent likely of being sustained upon ultimate settlement of the uncertain tax position. We recognize interest and penalties related to unrecognized tax benefits in income tax expense (benefit).
Recently Adopted Accounting Pronouncements
In November 2023, the FASB issued ASU No. 2023-07, Segment Reporting (Topic 280): Improvements to Reportable Segment Disclosures. The ASU improves reportable segment disclosure requirements and requires enhanced disclosures about significant segment expenses. We adopted this amendment as of December 31, 2024, on a retrospective basis. See Note 22, “Segment Reporting” in this Form 10-K for additional details on the impact of adoption of the ASU.
Recently Issued Accounting Pronouncements
In December 2023, the FASB issued ASU No. 2023-09, Income Taxes (Topic 740): Improvements to Income Tax Disclosures. The ASU requires entities to disclose specific categories in the effective tax rate reconciliation and provide additional information for reconciling items where the effect of those reconciling items is equal to or greater than 5 percent of the amount computed by multiplying pretax income/loss by the applicable statutory income tax rate. Additionally, entities are required to disclose the year-to-date amount of income taxes paid (net of refunds received) disaggregated by jurisdiction. The standard is effective for fiscal years beginning after December 15, 2024. We do not expect the impact of this ASU to be material to our consolidated financial statements.
In November 2024, the FASB issued ASU No. 2024-03, Income Statement-Reporting Comprehensive Income-Expense Disaggregation Disclosure (Subtopic 220-40): Disaggregation of Income Statement Expenses. The ASU is intended to provide more detailed information about specified categories of expenses (purchases of inventory, employee compensation, depreciation and amortization) included in certain expense captions presented on the consolidated statements of income. The guidance in this standard is effective for fiscal years beginning after December 15, 2026, and interim periods within fiscal years beginning after December 15, 2027, with early adoption permitted. We are currently evaluating the impact of the ASU on our consolidated financial statements.
3. Cash and Cash Equivalents
As of December 31, 2024, cash and cash equivalents include cash due from the FRB of $4.6 billion and cash due from depository institutions of $57 million. As of December 31, 2023, cash and cash equivalents include cash due from the FRB of $4.1 billion and cash due from depository institutions of $41 million. As of December 31, 2024 and 2023, we had no outstanding cash equivalents.
The FRB Term Deposit Facility program is used to facilitate the conduct of monetary policy by providing a tool that may be used to manage the aggregate quantity of reserve balances held by depository institutions. Under this program, the FRB accepts deposits for a stated maturity at a rate of interest determined via auction. The funds are removed from the accounts of participating institutions for the life of the term deposit. We did not participate in these auctions in 2024 or 2023, resulting in no interest reported. As of December 31, 2024 and 2023, no funds were on deposit with the FRB under this program.
F-26 SLM CORPORATION — 2024 Form 10-K
4. Investments
Trading Investments
We periodically sell Private Education Loans through securitization transactions where we are required to retain a five percent vertical risk retention interest (i.e., five percent of each class issued in the securitizations). We classify those vertical risk retention interests related to the transactions as available-for-sale investments, except for the interest in the residual classes, which we classify as trading investments recorded at fair value with changes recorded through earnings.
At December 31, 2022, we had a $5 million investment in a convertible debt security classified as a trading investment. In March 2023, this security, and the related accrued interest, was converted into equity securities classified as investments in non-marketable securities.
At December 31, 2024 and 2023, we had $53 million and $54 million, respectively, classified as trading investments.
Available-for-Sale Investments
The amortized cost and fair value of securities available for sale are as follows:
| | | | | | | | | | | | | | | | | | | | | | | | | | | | | | | | |
As of December 31, 2024
(dollars in thousands) | | Amortized Cost | | Allowance for credit losses(1) | | Gross Unrealized Gains | | Gross Unrealized Losses | | Estimated Fair Value |
| Available for sale: | | | | | | | | | | |
| Mortgage-backed securities | | $ | 516,358 | | | $ | — | | | $ | 205 | | | $ | (73,235) | | | $ | 443,328 | |
| Utah Housing Corporation bonds | | 2,849 | | | — | | | — | | | (490) | | | 2,359 | |
| U.S. government-sponsored enterprises and Treasuries | | 948,009 | | | — | | | — | | | (32,265) | | | 915,744 | |
| Other securities | | 575,257 | | | — | | | 8,633 | | | (12,095) | | | 571,795 | |
| Total | | $ | 2,042,473 | | | $ | — | | | $ | 8,838 | | | $ | (118,085) | | | $ | 1,933,226 | |
| | | | | | | | | | |
As of December 31, 2023
(dollars in thousands) | | Amortized Cost | | Allowance for credit losses(1) | | Gross Unrealized Gains | | Gross Unrealized Losses | | Estimated Fair Value |
| Available for sale: | | | | | | | | | | |
| Mortgage-backed securities | | $ | 468,204 | | | $ | — | | | $ | 703 | | | $ | (62,480) | | | $ | 406,427 | |
| Utah Housing Corporation bonds | | 3,408 | | | — | | | — | | | (279) | | | 3,129 | |
| U.S. government-sponsored enterprises and Treasuries | | 1,645,609 | | | — | | | — | | | (66,870) | | | 1,578,739 | |
| Other securities | | 446,763 | | | — | | | 603 | | | (24,039) | | | 423,327 | |
| Total | | $ | 2,563,984 | | | $ | — | | | $ | 1,306 | | | $ | (153,668) | | | $ | 2,411,622 | |
(1) Represents the amount of impairment that has resulted from credit-related factors and that was recognized in the consolidated balance sheets (as a credit loss expense on available-for-sale securities). The amount excludes unrealized losses related to non-credit factors.
F-27 SLM CORPORATION — 2022 Form 10-K
| | | | | | | | |
| 4. | Investments (Continued) | |
The following table summarizes the amount of gross unrealized losses for our available-for-sale securities and the estimated fair value for securities having gross unrealized loss positions, categorized by length of time the securities have been in an unrealized loss position:
| | | | | | | | | | | | | | | | | | | | | | | | | | | | | | | | | | | | | | |
| | Less than 12 months | | 12 months or more | | Total |
As of December 31,
(dollars in thousands) | | Gross Unrealized Losses | | Estimated Fair Value | | Gross Unrealized Losses | | Estimated Fair Value | | Gross Unrealized Losses | | Estimated Fair Value |
| 2024: | | | | | | | | | | | | |
| Mortgage-backed securities | | $ | (2,723) | | | $ | 137,585 | | | $ | (70,512) | | | $ | 290,257 | | | $ | (73,235) | | | $ | 427,842 | |
| Utah Housing Corporation bonds | | — | | | — | | | (490) | | | 2,359 | | | (490) | | | 2,359 | |
| U.S. government-sponsored enterprises and Treasuries | | — | | | — | | | (32,265) | | | 915,744 | | | (32,265) | | | 915,744 | |
| Other securities | | (74) | | | 11,579 | | | (12,021) | | | 182,215 | | | (12,095) | | | 193,794 | |
| Total | | $ | (2,797) | | | $ | 149,164 | | | $ | (115,288) | | | $ | 1,390,575 | | | $ | (118,085) | | | $ | 1,539,739 | |
| | | | | | | | | | | | |
| 2023: | | | | | | | | | | | | |
| Mortgage-backed securities | | $ | (531) | | | $ | 51,391 | | | $ | (61,949) | | | $ | 300,318 | | | $ | (62,480) | | | $ | 351,709 | |
| Utah Housing Corporation bonds | | — | | | — | | | (279) | | | 3,129 | | | (279) | | | 3,129 | |
| U.S. government-sponsored enterprises and Treasuries | | — | | | — | | | (66,870) | | | 1,578,739 | | | (66,870) | | | 1,578,739 | |
| Other securities | | (2,221) | | | 90,725 | | | (21,818) | | | 241,253 | | | (24,039) | | | 331,978 | |
| Total | | $ | (2,752) | | | $ | 142,116 | | | $ | (150,916) | | | $ | 2,123,439 | | | $ | (153,668) | | | $ | 2,265,555 | |
At December 31, 2024 and 2023, 236 of 278 and 213 of 248, respectively, of our available-for-sale securities were in an unrealized loss position.
Impairment
For available-for-sale securities in an unrealized loss position, we first assess whether we intend to sell, or it is more likely than not that we will be required to sell, the security before recovery of its amortized cost basis. If either of these criteria are met, the security’s amortized cost basis is written down to fair value through net income. For securities in an unrealized loss position that do not meet these criteria, we evaluate whether the decline in fair value has resulted from credit loss or other factors. In making this assessment, we consider the extent to which fair value is less than amortized cost, any changes to the rating of the security by a rating agency, adverse conditions specifically related to the security, as well as any guarantees (e.g., guarantees by the U.S. Government) that may be applicable to the security. If this assessment indicates a credit loss exists, the credit-related portion of the loss is recorded as an allowance for losses on the security.
Our investment portfolio contains mortgage-backed securities issued by Ginnie Mae, Fannie Mae, and Freddie Mac, as well as Utah Housing Corporation bonds. We own these securities to meet our requirements under the Community Reinvestment Act (“CRA”). We also invest in other U.S. government-sponsored enterprise securities issued by the Federal Home Loan Banks, Freddie Mac, and the Federal Farm Credit Bank. Our mortgage-backed securities that were issued under Ginnie Mae programs carry a full faith and credit guarantee from the U.S. Government. The remaining mortgage-backed securities in a net loss position carry a principal and interest guarantee by Fannie Mae or Freddie Mac, respectively. Our Treasury and other U.S. government-sponsored enterprise bonds are rated Aaa by Moody’s Investors Service or AA+ by Standard and Poor’s. We have the intent and ability to hold these bonds for a period of time sufficient for the market price to recover to at least the adjusted amortized cost of the security. Based on this qualitative analysis, we have determined that no credit impairment exists.
We periodically sell Private Education Loans through securitization transactions where we are required to retain a five percent vertical risk retention interest. We classify the non-residual vertical risk retention interests as available-for-sale investments. We have the intent and ability to hold each of these bonds for a period of time sufficient for the market price to recover to at least the adjusted amortized cost of the security. We expect to receive all contractual cash flows related to these investments and do not consider a credit impairment to exist.
F-28 SLM CORPORATION — 2024 Form 10-K
| | | | | | | | |
| 4. | Investments (Continued) | |
As of December 31, 2024, the amortized cost and fair value of securities, by contractual maturities, are summarized below. Contractual maturities versus actual maturities may differ due to the effect of prepayments.
| | | | | | | | | | | |
As of December 31, 2024 Year of Maturity (dollars in thousands) | Amortized Cost | | Estimated Fair Value |
| 2025 | $ | 299,816 | | | $ | 298,648 | |
| 2026 | 549,175 | | | 520,793 | |
| 2027 | 99,018 | | | 96,303 | |
| 2038 | 66 | | | 66 | |
| 2039 | 551 | | | 531 | |
| 2042 | 2,112 | | | 1,793 | |
| 2043 | 3,761 | | | 3,299 | |
| 2044 | 4,085 | | | 3,651 | |
| 2045 | 4,518 | | | 3,919 | |
| 2046 | 6,953 | | | 5,965 | |
| 2047 | 6,704 | | | 5,781 | |
| 2048 | 1,702 | | | 1,481 | |
| 2049 | 14,838 | | | 12,842 | |
| 2050 | 101,145 | | | 78,475 | |
| 2051 | 144,694 | | | 111,058 | |
| 2052 | 58,268 | | | 50,497 | |
| 2053 | 297,695 | | | 294,197 | |
| 2054 | 142,209 | | | 135,800 | |
| 2055 | 71,611 | | | 70,409 | |
| 2056 | 194,173 | | | 197,363 | |
| 2058 | 39,379 | | | 40,355 | |
| Total | $ | 2,042,473 | | | $ | 1,933,226 | |
Some of the mortgage-backed securities and a portion of the government securities have been pledged to the FRB as collateral against any advances and accrued interest under the Primary Credit lending program sponsored by the FRB. We had $610 million and $612 million par value of securities pledged to this borrowing facility at December 31, 2024 and 2023, respectively, as discussed further in Note 10, “Borrowings” in this Form 10-K.
Other Investments
Investments in Non-Marketable Securities
We hold investments in non-marketable securities and account for these investments at cost, less impairment, plus or minus observable price changes of identical or similar securities of the same issuer. Changes in market value are recorded through earnings. Because these are non-marketable securities, we use observable price changes of identical or similar securities of the same issuer, or when observable prices are not available, use market data of similar entities, in determining any changes in the value of the securities. In the third quarter of 2024, we funded a new investment in non-marketable securities of an issuer whose securities we have not previously purchased. In March 2023, our $5 million investment in a convertible debt security, classified as a trading investment, and the related accrued interest were converted into equity securities and were reclassified to investments in non-marketable securities. In the fourth quarter of 2022, we determined that our investment in an issuer whose equity securities we purchased in the past was impaired. As such, we wrote down the value based upon an estimate of the value of these securities and recorded a loss of $60 million in “gains (losses) on securities, net” in the consolidated statements of income in 2022. At December 31, 2024 and December 31, 2023, our total investment in non-marketable securities was $24 million and $14 million, respectively.
2024 Form 10-K — SLM CORPORATION F-29
| | | | | | | | |
| 4. | Investments (Continued) | |
Low Income Housing Tax Credit Investments
We invest in affordable housing projects that qualify for the LIHTC, which is designed to promote private development of low-income housing. These investments generate a return mostly through realization of federal tax credits and tax benefits from net operating losses on the underlying properties. We recognized $13 million, $11 million, and $9 million of tax credits and other tax benefits associated with investments in affordable housing projects within income tax expense for the years ended December 31, 2024, 2023, and 2022, respectively. The amount of amortization of such investments reported in income tax expense was $10 million, $9 million, and $7 million for the years ended December 31, 2024, 2023, and 2022, respectively. Total carrying value of the LIHTC investments was $82 million at December 31, 2024 and $72 million at December 31, 2023. We are periodically required to provide additional financial support during the investment period. Our liability for these unfunded commitments was $30 million at December 31, 2024 and $30 million at December 31, 2023.
5. Loans Held for Investment
Loans held for investment consist solely of Private Education Loans as of December 31, 2024. During the third quarter of 2024, we transferred our remaining FFELP Loan portfolio to loans held for sale and subsequently sold the FFELP Loan portfolio to an unaffiliated third party during the fourth quarter of 2024. We wrote down the FFELP Loan portfolio to its estimated fair value through an adjustment to the allowance for credit losses of $8 million in 2024.
We use “Credit Cards” to refer to the suite of Credit Card loans that we previously held. At September 30, 2022, we transferred our Credit Card portfolio to loans held for sale and subsequently sold the Credit Card portfolio to a third party in May 2023. We recorded a loss of $4 million on the sale of the Credit Card portfolio in 2023.
Our Private Education Loans are made largely to bridge the gap between the cost of higher education and the amount funded through financial aid, government loans, and customers’ resources. Private Education Loans bear the full credit risk of the customer. We manage this risk through risk-performance underwriting strategies and qualified cosigners. Private Education Loans may be fixed-rate or may carry a variable interest rate indexed to SOFR, the Secured Overnight Financing Rate. As of December 31, 2024 and December 31, 2023, 23 percent and 33 percent, respectively, of all our Private Education Loans were indexed to SOFR. We provide incentives for customers to include a cosigner on the loan, and the vast majority of Private Education Loans in our portfolio are cosigned. We also encourage customers to make payments while in school.
The following table summarizes our Private Education Loan sales to unaffiliated third parties for the periods presented.
| | | | | | | | | | | | | | | | | | | | |
Years Ended December 31,
(dollars in millions) | | 2024 | | 2023 | | 2022 |
| Loan principal | | $ | 3,418 | | | $ | 2,927 | | | $ | 3,126 | |
| Capitalized interest | | 274 | | | 226 | | | 217 | |
| Total Private Education Loans sold | | $ | 3,692 | | | $ | 3,153 | | | $ | 3,343 | |
| | | | | | |
| Gain on sale of loans, net | | $ | 255 | | | $ | 164 | | | $ | 328 | |
There were VIEs created in the execution of certain of these loan sales; however, based on our consolidation analysis, we are not the primary beneficiary of these VIEs. These transactions qualified for sale treatment and removed the balance of the loans from our balance sheet on the respective settlement dates. We remained the servicer of these loans pursuant to applicable servicing agreements executed in connection with the sales. For additional information, see Note 10, “Borrowings — Unconsolidated Funding Vehicles” in this Form 10-K.
F-30 SLM CORPORATION — 2024 Form 10-K
| | | | | | | | |
| 5. | Loans Held for Investment (Continued) | |
Loans held for investment are summarized as follows:
| | | | | | | | | | | | | | |
As of December 31,
(dollars in thousands) | | 2024 | | 2023 |
| Private Education Loans: | | | | |
| Fixed-rate | | $ | 17,093,382 | | | $ | 13,985,791 | |
| Variable-rate | | 5,141,626 | | | 7,040,053 | |
| Total Private Education Loans, gross | | 22,235,008 | | | 21,025,844 | |
| Deferred origination costs and unamortized premium/ (discount) | | 103,070 | | | 81,554 | |
| Allowance for loan losses | | (1,435,920) | | | (1,335,105) | |
| Total Private Education Loans, net | | 20,902,158 | | | 19,772,293 | |
| | | | |
FFELP Loans(1) | | — | | | 537,401 | |
| Deferred origination costs and unamortized premium/ (discount) | | — | | | 1,330 | |
| Allowance for loan losses | | — | | | (4,667) | |
| Total FFELP Loans, net | | — | | | 534,064 | |
| Loans held for investment, net | | $ | 20,902,158 | | | $ | 20,306,357 | |
(1) FFELP Loans were transferred to loans held for sale during the third quarter of 2024 and subsequently sold to a third party during the fourth quarter of 2024.
The estimated weighted average life of education loans in our portfolio was approximately 5.6 years and 5.0 years at December 31, 2024 and 2023, respectively.
The average balance (net of unamortized premium/(discount)) and the respective weighted average interest rates of loans in our portfolio are summarized as follows:
| | | | | | | | | | | | | | | | | | | | | | | | | | | | | | | | | | | | | | |
| | 2024 | | 2023 | | 2022 |
| Years Ended December 31, (dollars in thousands) | | Average Balance | | Weighted Average Interest Rate | | Average Balance | | Weighted Average Interest Rate | | Average Balance | | Weighted Average Interest Rate |
| Private Education Loans | | $ | 21,121,545 | | | 10.81 | % | | $ | 21,039,701 | | | 10.86 | % | | $ | 20,576,737 | | | 9.14 | % |
| FFELP Loans | | 413,338 | | | 7.45 | | | 574,218 | | | 7.19 | | | 662,194 | | | 4.62 | |
| Total portfolio | | $ | 21,534,883 | | | | | $ | 21,613,919 | | | | | $ | 21,238,931 | | | |
Certain Collection Tools — Private Education Loans
Over the course of the last few years, we have made significant changes to our credit administration practices, enhancing our loss mitigation programs through both our forbearance and loan modification offerings. We adjust the terms of loans for certain borrowers when we believe such changes will help our borrowers manage their student loan obligations and achieve better student outcomes, and increase the collectability of the loans. These changes generally take the form of a temporary forbearance of payments, a temporary or permanent interest rate reduction, a temporary or permanent interest rate reduction with a permanent extension of the loan term, and/or a short-term extended repayment or interest-only alternative.
Forbearance allows a borrower to not make scheduled payments for a specified period of time. Our forbearance policies and practices vary depending upon whether a borrower is current or delinquent at the time forbearance is requested, generally with stricter requirements for delinquent borrowers. Using forbearance extends the original term of the loan by the term of forbearance taken. Forbearance does not grant any reduction in the total principal or interest repayment obligation. While a loan is in forbearance status, interest continues to accrue and is capitalized (added to principal) at the end of the forbearance. Interest will not capitalize at the end of certain types of forbearance, such as disaster forbearance, however.
2024 Form 10-K — SLM CORPORATION F-31
| | | | | | | | |
| 5. | Loans Held for Investment (Continued) | |
During the first six months following a borrower’s grace period, the borrower may be eligible for extended grace forbearance, which provides temporary payment relief to give the borrower additional time to be in a position to make regular principal and interest payments.
Hardship forbearance may be granted in order to provide temporary payment relief to borrowers who are either current in their payments but demonstrate a need for relief, or who are delinquent in their payments but demonstrate an ability and willingness to repay their obligation. In these circumstances, a borrower’s loan is placed into a forbearance status in limited monthly increments and is reflected in the forbearance status at month-end during this time. At the end of the forbearance period, for borrowers who were current when they entered forbearance, or those who were delinquent but met specific payment requirements curing their delinquency, the borrower will enter repayment status as current. In all instances, the borrowers are expected to begin making scheduled monthly payments at the end of their forbearance periods. This strategy is aimed at assisting borrowers while mitigating the risks of delinquency and default as well as encouraging resolution of delinquent loans.
Disaster forbearance is used to assist borrowers affected by material events, typically federally-declared disasters, including hurricanes, wildfires, floods, and pandemics. We typically grant disaster forbearance to affected borrowers in increments of up to three months at a time, but the disaster forbearance granted generally does not apply toward the 12-month forbearance limit described below.
Currently, we generally grant forbearance in increments of one to two months at a time, for up to 12 months over the life of the loan, although extended grace forbearance is typically granted in one six-month increment and disaster forbearance and certain other limited instances do not apply toward the 12-month limit. We also currently require 12 months of positive payment performance by a borrower (meaning the borrower must make payment in a cumulative amount equivalent to 12 monthly required payments under the loan) between successive grants of forbearance and between forbearance grants and certain other repayment alternatives. This required period of positive payment performance does not apply, however, to extended grace forbearances and is not required for a borrower to receive a contractual interest rate reduction. In addition, we currently limit the participation of delinquent borrowers in certain short-term extended or interest-only repayment alternatives to once in 12 months and twice in five years. We also now count the number of months a borrower receives a short-term extended repayment alternative toward the 12-month forbearance limit described above.
For borrowers experiencing more severe hardship, following evaluation of their ability and willingness to repay, we currently use modification programs tailored to the financial condition of the individual borrower. Pursuant to our modification programs, we may reduce the contractual interest rate on a loan to a rate between 2 percent and 8 percent for a temporary period of two to four years, and in some instances may also permanently extend the final maturity of the loan. For borrowers experiencing the most severe financial conditions, we may permanently reduce the contractual interest rate on a loan to 2 percent for the remaining life of the loan and also permanently extend the final maturity of the loan. Following modification, borrowers who are delinquent but meet specific payment requirements curing their delinquency will be brought current. We currently limit the granting of a permanent extension of the final maturity date of a loan to once over the life of the loan, and the number of interest rate reductions to twice over the life of the loan.
We continually monitor our credit administration practices and may modify them further from time to time based upon performance, industry conventions, and/or regulatory feedback.
The period of delinquency for loans is based on the number of days scheduled payments are contractually past due. As of December 31, 2024 and 2023, we had $142 million and $151 million, respectively, of Private Education Loans held for investment that were more than 90 days delinquent and continue to accrue interest. As of December 31, 2023, $45 million of FFELP Loans held for investment were more than 90 days delinquent that continued to accrue interest. We sold the FFELP Loan portfolio to an unaffiliated third party during the fourth quarter of 2024. At December 31, 2024 and December 31, 2023, we had an immaterial amount of loans in nonaccrual status.
Borrower-in-Custody Arrangements
We maintain Borrower-in-Custody arrangements with the FRB. Under these arrangements, we can pledge FFELP Loans or Private Education Loans to the FRB to secure any advances and accrued interest generated under the Primary Credit program at the FRB. As of December 31, 2024 and 2023, we had $2.3 billion and $1.4 billion, respectively, of Private Education Loans pledged to this borrowing facility, as discussed further in Note 10, “Borrowings” in this Form 10-K. We did not have any FFELP Loans pledged at December 31, 2024 or 2023.
F-32 SLM CORPORATION — 2024 Form 10-K
| | | | | | | | |
| 5. | Loans Held for Investment (Continued) | |
Loans Held for Investment by Region
At December 31, 2024 and 2023, 43.8 percent and 43.5 percent, respectively, of total education loans were concentrated in the following states:
| | | | | | | | | | | | | | |
| As of December 31, | | 2024 | | 2023 |
| California | | 10.2 | % | | 10.1 | % |
| New York | | 9.0 | | | 9.0 | |
| Pennsylvania | | 7.1 | | | 7.2 | |
| Texas | | 6.6 | | | 6.3 | |
| New Jersey | | 5.6 | | | 5.6 | |
| Florida | | 5.3 | | | 5.3 | |
| | 43.8 | % | | 43.5 | % |
No other state had a concentration of total education loans in excess of 5 percent of the aggregate outstanding education loans held for investment.
6. Allowance for Credit Losses and Unfunded Loan Commitments
Our provision for credit losses represents the periodic expense of maintaining an allowance sufficient to absorb lifetime expected credit losses in the held for investment loan portfolios. The evaluation of the allowance for credit losses is inherently subjective, as it requires material estimates that may be susceptible to significant changes. We believe the allowance for credit losses is appropriate to cover lifetime expected losses incurred in the loan portfolios.
When a new loan commitment is made, we record the CECL allowance as a liability for unfunded loan commitments by recording a provision for credit losses. The allowance is recorded in “Other Liabilities” on the consolidated balance sheet. When the loan is funded, we transfer that liability to the allowance for loan losses.
The majority of the total accrued interest receivable on our Private Education Loan portfolio represents accrued interest on deferred loans where no payments are due while the borrower is in school and on fixed-pay loans where the borrower makes a $25 monthly payment that is smaller than the interest accrued on the loan in that month. The allowance for credit losses considers the collectability of both principal and accrued interest. The allowance for uncollectible interest estimates the additional uncollectible interest that is not captured in the allowance for credit losses. See “— Accrued Interest Receivable” in this Note 6 for further discussion.
For the years ended December 31, 2024, 2023, and 2022, the allowance for loan losses, ending total loans, and accrued interest balances were all collectively evaluated for impairment, none of the balances were individually evaluated for impairment.
See Note 2, “Significant Accounting Policies — Allowance for Credit Losses” for a more detailed discussion on our allowance for credit losses accounting policies.
2024 Form 10-K — SLM CORPORATION F-33
| | | | | | | | |
| 6. | Allowance for Credit Losses and Unfunded Loan Commitments (Continued) | |
Allowance for Credit Losses Metrics
The following tables provide a summary of the activity in the allowance for loan losses and the allowance for unfunded loan commitments during the years ended December 31, 2024, 2023, and 2022.
| | | | | | | | | | | | | | | | | | | | | | |
Year Ended December 31, 2024
(dollars in thousands) | | FFELP
Loans | | Private Education
Loans | | | | Total |
| Allowance for loan losses, beginning balance | | $ | 4,667 | | | $ | 1,335,105 | | | | | $ | 1,339,772 | |
| Transfer from allowance for unfunded loan commitments | | — | | | 311,787 | | | | | 311,787 | |
| Provisions: | | | | | | | | |
| Provision for current period | | 4,010 | | | 357,067 | | | | | 361,077 | |
| Loan sale reduction to provision | | — | | | (235,955) | | | | | (235,955) | |
| | | | | | | | |
Total provisions(1) | | 4,010 | | | 121,112 | | | | | 125,122 | |
| Net charge-offs: | | | | | | | | |
| Charge-offs | | (380) | | | (376,840) | | | | | (377,220) | |
| Recoveries | | — | | | 44,756 | | | | | 44,756 | |
| Net charge-offs | | (380) | | | (332,084) | | | | | (332,464) | |
Write-downs arising from transfer of loans to held for sale(2) | | (8,297) | | | — | | | | | (8,297) | |
| Allowance for loan losses, ending balance | | — | | | 1,435,920 | | | | | 1,435,920 | |
Allowance for unfunded loan commitments, beginning balance(3) | | — | | | 112,962 | | | | | 112,962 | |
Provision(1)(4) | | — | | | 283,393 | | | | | 283,393 | |
| Transfer to allowance for loan losses | | — | | | (311,787) | | | | | (311,787) | |
Allowance for unfunded loan commitments, ending balance(3) | | — | | | 84,568 | | | | | 84,568 | |
| Total allowance for credit losses, ending balance | | $ | — | | | $ | 1,520,488 | | | | | $ | 1,520,488 | |
| | | | | | | | |
Net charge-offs as a percentage of average loans in repayment(5) | | — | % | | 2.19 | % | | | | |
| Allowance for loan losses coverage of net charge-offs | | — | | | 4.32 | | | | | |
| Total allowance for credit losses as a percentage of the ending total loan balance, plus unfunded loan commitments and total accrued interest receivable | | — | % | | 5.83 | % | | | | |
| | | | | | | | |
| Ending total loans, gross | | $ | — | | | $ | 22,235,008 | | | | | |
Average loans in repayment(5) | | $ | — | | | $ | 15,139,184 | | | | | |
Ending loans in repayment(5) | | $ | — | | | $ | 16,106,751 | | | | | |
| Unfunded loan commitments | | $ | — | | | $ | 2,311,660 | | | | | |
| Total accrued interest receivable | | $ | — | | | $ | 1,549,415 | | | | | |
| | | | | | | | |
| | | | | | | | |
(1) See “— Provisions for Credit Losses” below in this Note 6 for a reconciliation of the provisions for credit losses reported in the consolidated statements of income.
(2) Represents fair value adjustments on loans transferred to held for sale.
(3) When a new loan commitment is made, we record an allowance to cover lifetime expected credit losses on the unfunded commitments, which is recorded in “Other Liabilities” on the consolidated balance sheet. See “— Unfunded Loan Commitments” in this Note 6 for further discussion.
(4) Includes incremental provision for new commitments and changes to provision for existing commitments.
(5) Loans in repayment include loans on which borrowers are making interest only or fixed payments, as well as loans that have entered full principal and interest repayment status after any applicable grace period (but, for purposes of the table, do not include those loans while they are in forbearance).
F-34 SLM CORPORATION — 2024 Form 10-K
| | | | | | | | |
| 6. | Allowance for Credit Losses and Unfunded Loan Commitments (Continued) | |
| | | | | | | | | | | | | | | | | | | | | | |
Year Ended December 31, 2023
(dollars in thousands) | | FFELP
Loans | | Private Education
Loans | | | | Total |
| Allowance for loan losses, beginning balance | | $ | 3,444 | | | $ | 1,353,631 | | | | | $ | 1,357,075 | |
| Transfer from allowance for unfunded loan commitments | | — | | | 320,237 | | | | | 320,237 | |
| Provisions: | | | | | | | | |
| Provision for current period | | 2,224 | | | 240,347 | | | | | 242,571 | |
| Loan sale reduction to provision | | — | | | (205,383) | | | | | (205,383) | |
| | | | | | | | |
Total provisions(1) | | 2,224 | | | 34,964 | | | | | 37,188 | |
| Net charge-offs: | | | | | | | | |
| Charge-offs | | (1,001) | | | (420,095) | | | | | (421,096) | |
| Recoveries | | — | | | 46,368 | | | | | 46,368 | |
| Net charge-offs | | (1,001) | | | (373,727) | | | | | (374,728) | |
| | | | | | | | |
| Allowance for loan losses, ending balance | | 4,667 | | | 1,335,105 | | | | | 1,339,772 | |
Allowance for unfunded loan commitments, beginning balance(2) | | — | | | 124,924 | | | | | 124,924 | |
Provision(1)(3) | | — | | | 308,275 | | | | | 308,275 | |
| Transfer to allowance for loan losses | | — | | | (320,237) | | | | | (320,237) | |
Allowance for unfunded loan commitments, ending balance(2) | | — | | | 112,962 | | | | | 112,962 | |
| Total allowance for credit losses, ending balance | | $ | 4,667 | | | $ | 1,448,067 | | | | | $ | 1,452,734 | |
| | | | | | | | |
Net charge-offs as a percentage of average loans in repayment(4) | | 0.23 | % | | 2.44 | % | | | | |
| Allowance for loan losses coverage of net charge-offs | | 4.66 | | | 3.57 | | | | | |
| Total allowance for credit losses as a percentage of the ending total loan balance, plus unfunded loan commitments and total accrued interest receivable | | 0.87 | % | | 5.89 | % | | | | |
| | | | | | | | |
| Ending total loans, gross | | $ | 537,401 | | | $ | 21,025,844 | | | | | |
Average loans in repayment(4) | | $ | 433,225 | | | $ | 15,310,934 | | | | | |
Ending loans in repayment(4) | | $ | 406,568 | | | $ | 15,409,814 | | | | | |
| Unfunded loan commitments | | $ | — | | | $ | 2,221,077 | | | | | |
| Total accrued interest receivable | | $ | — | | | $ | 1,354,565 | | | | | |
| | | | | | | | |
| | | | | | | | |
(1) See “— Provisions for Credit Losses” below in this Note 6 for a reconciliation of the provisions for credit losses reported in the consolidated statements of income.
(2) When a new loan commitment is made, we record an allowance to cover lifetime expected credit losses on the unfunded commitments, which is recorded in “Other Liabilities” on the consolidated balance sheet. See “— Unfunded Loan Commitments” in this Note 6 for further discussion.
(3) Includes incremental provision for new commitments and changes to provision for existing commitments.
(4) Loans in repayment include loans on which borrowers are making interest only or fixed payments, as well as loans that have entered full principal and interest repayment status after any applicable grace period (but, for purposes of the table, do not include those loans while they are in forbearance).
2024 Form 10-K — SLM CORPORATION F-35
| | | | | | | | |
| 6. | Allowance for Credit Losses and Unfunded Loan Commitments (Continued) | |
| | | | | | | | | | | | | | | | | | | | | | | | | | |
Year Ended December 31, 2022
(dollars in thousands) | | FFELP
Loans | | Private Education
Loans | | Credit
Cards | | Total |
| Allowance for loan losses, beginning balance | | $ | 4,077 | | | $ | 1,158,977 | | | $ | 2,281 | | | $ | 1,165,335 | |
| Transfer from allowance for unfunded loan commitments | | — | | | 344,310 | | | — | | | 344,310 | |
| Provisions: | | | | | | | | |
| Provision for current period | | (20) | | | 410,254 | | | 3,301 | | | 413,535 | |
| Loan sale reduction to provision | | — | | | (174,231) | | | — | | | (174,231) | |
| Loans transferred to held-for-sale | | — | | | — | | | (2,372) | | | (2,372) | |
Total provisions(1) | | (20) | | | 236,023 | | | 929 | | | 236,932 | |
| Net charge-offs: | | | | | | | | |
| Charge-offs | | (613) | | | (427,416) | | | (3,215) | | | (431,244) | |
| Recoveries | | — | | | 41,737 | | | 5 | | | 41,742 | |
| Net charge-offs | | (613) | | | (385,679) | | | (3,210) | | | (389,502) | |
| | | | | | | | |
| Allowance for loan losses, ending balance | | 3,444 | | | 1,353,631 | | | — | | | 1,357,075 | |
Allowance for unfunded loan commitments, beginning balance(2) | | — | | | 72,713 | | | — | | | 72,713 | |
Provision(1)(3) | | — | | | 396,521 | | | — | | | 396,521 | |
| Transfer to allowance for loan losses | | — | | | (344,310) | | | — | | | (344,310) | |
Allowance for unfunded loan commitments, ending balance(2) | | — | | | 124,924 | | | — | | | 124,924 | |
| Total allowance for credit losses, ending balance | | $ | 3,444 | | | $ | 1,478,555 | | | $ | — | | | $ | 1,481,999 | |
| | | | | | | | |
Net charge-offs as a percentage of average loans in repayment(4) | | 0.12 | % | | 2.55 | % | | — | % | | |
| Allowance for loan losses coverage of net charge-offs | | 5.62 | | | 3.51 | | | — | | | |
| Total allowance for credit losses as a percentage of the ending total loan balance, plus unfunded loan commitments and total accrued interest receivable | | 0.57 | % | | 6.30 | % | | — | % | | |
| | | | | | | | |
| Ending total loans, gross | | $ | 609,050 | | | $ | 20,303,688 | | | $ | — | | | |
Average loans in repayment(4) | | $ | 517,139 | | | $ | 15,103,123 | | | $ | — | | | |
Ending loans in repayment(4) | | $ | 453,915 | | | $ | 15,129,550 | | | $ | — | | | |
| Unfunded loan commitments | | $ | — | | | $ | 1,995,808 | | | $ | — | | | |
| Total accrued interest receivable | | $ | — | | | $ | 1,177,562 | | | $ | — | | | |
| | | | | | | | |
| | | | | | | | |
(1) See “— Provisions for Credit Losses” below in this Note 6 for a reconciliation of the provisions for credit losses reported in the consolidated statements of income.
(2) When a new loan commitment is made, we record an allowance to cover lifetime expected credit losses on the unfunded commitments, which is recorded in “Other Liabilities” on the consolidated balance sheet. See “— Unfunded Loan Commitments” in this Note 6 for further discussion.(
(3) Includes incremental provision for new commitments and changes to provision for existing commitments.
(4) Loans in repayment include loans on which borrowers are making interest only or fixed payments, as well as loans that have entered full principal and interest repayment status after any applicable grace period (but, for purposes of the table, do not include those loans while they are in forbearance).
F-36 SLM CORPORATION — 2024 Form 10-K
| | | | | | | | |
| 6. | Allowance for Credit Losses and Unfunded Loan Commitments (Continued) | |
Provisions for Credit Losses
Below is a reconciliation of the provisions for credit losses reported in the consolidated statements of income.
| | | | | | | | | | | | | | | | | | | | |
Consolidated Statements of Income
Provisions for Credit Losses Reconciliation | | |
| | | | | | |
| Years Ended December 31, | | | | | | |
| (dollars in thousands) | | 2024 | | 2023 | | 2022 |
| Private Education Loan provisions for credit losses: | | | | | | |
| Provisions for loan losses | | $ | 121,112 | | | $ | 34,964 | | | $ | 236,023 | |
| Provisions for unfunded loan commitments | | 283,393 | | | 308,275 | | | 396,521 | |
| Total Private Education Loan provisions for credit losses | | 404,505 | | | 343,239 | | | 632,544 | |
| Other impacts to the provisions for credit losses: | | | | | | |
| FFELP Loans | | 4,010 | | | 2,224 | | | (20) | |
| Credit Cards | | — | | | — | | | 929 | |
| Total | | 4,010 | | | 2,224 | | | 909 | |
| Provisions for credit losses reported in consolidated statements of income | | $ | 408,515 | | | $ | 345,463 | | | $ | 633,453 | |
The provision for credit losses for the year ended December 31, 2024 was $409 million, compared with $345 million in the year-ago period. During 2024, the provision for credit losses was primarily affected by new loan commitments, net of expired commitments, and changes in recovery rates, which were partially offset by $236 million in negative provisions recorded as a result of the approximately $3.69 billion in Private Education Loan sales during 2024, an improved economic outlook, and changes in management overlays.
In 2023, the provision for credit losses was primarily affected by new loan commitments, net of expired commitments, slower prepayment rates, management overlays, and changes in economic outlook, which were partially offset by $205 million in negative provisions recorded as a result of the approximately $3.15 billion in Private Education Loan sales during 2023 and an increase in recovery rates (as the result of a change in our defaulted loan recovery process).
During 2022, the provision for credit losses was primarily affected by new loan commitments made during the period, slower than expected prepayment rates, and additional management overlays, which were partially offset by negative provisions recorded related to approximately $3.34 billion in Private Education Loans sold in 2022 and the adoption of a new loss model that included a reduction in the long-term estimate of losses after the reasonable and supportable period. Management overlays increased in 2022 due to several factors, including additional provisions arising from our expectation of higher future losses related to the previously announced credit administration practices changes we implemented in 2021, “gap year” loans, a shortage and lack of tenured collections staff, and other operational challenges we experienced in 2022. “Gap year” loans refer to loans to borrowers who took a “gap year” during the COVID-19 pandemic and entered full principal and interest repayment status starting in late 2021 and early 2022. Losses on those “gap year” loans were higher than expected and contributed to the higher provision expense recorded in 2022 to cover the higher-than-expected losses.
Private Education Loans Allowance for Credit Losses - Forecast Assumptions
See Note 2, “Significant Accounting Policies — Allowance for Credit Losses” for a more detailed discussion on the forecast assumptions used in calculating the allowance for credit losses.
Loan Modifications to Borrowers Experiencing Financial Difficulty
The allowance for credit losses incorporates an estimate of lifetime expected credit losses and is recorded on each asset upon asset origination or acquisition. The starting point for the estimate of the allowance for credit losses is historical information, which includes losses from modifications of receivables whose borrowers are experiencing financial difficulty. We use a discounted cash flow model to determine the allowance for credit losses. An assessment of whether a borrower is experiencing financial difficulty is made on the date of a modification.
The effect of most modifications of loans made to borrowers who are experiencing financial difficulty is already included in the allowance for credit losses because of the measurement methodologies used to estimate the allowance. The forecast of expected future cash flows is updated as the loan modifications occur.
2024 Form 10-K — SLM CORPORATION F-37
| | | | | | | | |
| 6. | Allowance for Credit Losses and Unfunded Loan Commitments (Continued) | |
Within the Private Education Loan portfolio, we deem loans greater than 90 days past due as nonperforming. FFELP Loans are at least 97 percent guaranteed as to their principal and accrued interest by the federal government in the event of default and, therefore, we did not deem FFELP Loans as nonperforming from a credit risk perspective at any point in their life cycle prior to claim payment and continued to accrue interest on those loans through the date of claim.
For additional information, see Note 2, “Significant Accounting Policies —Allowance for Credit Losses” in this Form 10-K.
Under our current forbearance practices, temporary forbearance of payments is generally granted in one-to-two month increments, for up to 12 months over the life of the loan, with 12 months of positive payment performance by a borrower required between grants (meaning the borrower must make payment in a cumulative amount equivalent to 12 monthly required payments under the loan). During the first six months following a borrower’s grace period, the borrower may be eligible for extended grace forbearance in one six-month increment (which would also count towards the 12-month forbearance cap). See Note 5, “Loans Held for Investment — Certain Collection Tools - Private Education Loans” in this Form 10-K. In the first quarter of 2022, we adopted ASU No. 2022-02. Under this ASU, if the debt has been previously restructured, an entity must consider the cumulative effect of past restructurings made within the 12-month period before the current restructuring when determining whether a delay in payment resulting from the current restructuring is insignificant. Due to our current forbearance practices, including the limitations on forbearances offered to borrowers, we do not believe the granting of forbearances will exceed the significance threshold and, therefore, we do not consider the forbearances as loan modifications.
We offer certain administrative forbearances (e.g., death and disability, bankruptcy, military service, disaster forbearance, and in school assistance) that are required by law (such as by the Servicemembers Civil Relief Act), are considered separate from our active loss mitigation programs, or do not exceed the significance threshold and therefore are not considered to be loan modifications requiring disclosure under ASU No. 2022-02. In addition, we may offer on a limited basis term extensions or rate reductions or a combination of both to borrowers to reduce consolidation activities. For purposes of this disclosure, we do not consider them modifications of loans to borrowers experiencing financial difficulty and they therefore are not included in the tables below.
For additional information on our forbearance and modification programs, see Note 5, “Loans Held for Investment —Certain Collection Tools — Private Education Loans” in this Form 10-K.
As part of the additional modification programs that were launched in the fourth quarter of 2023, we also offered for a short period of time a permanent term extension with no interest rate reduction program. This program ended in the fourth quarter of 2023. The amortized cost of this program totaled $7.3 million as of December 31, 2024, representing 0.03 percent of the total Private Education Loan portfolio. This program added a weighted average of 6.7 years to the life of loans in the program. As of December 31, 2024, $6.0 million of these loans were in a current or deferred status, $0.6 million of these loans were 30-59 days past due, $0.4 million of these loans were 60-89 days past due, and $0.3 million of these loans were 90 days or greater past due. As of December 31, 2024, the defaulted amount and amortized cost basis of loans that received a permanent term extension and no interest rate reduction and defaulted during the year ended December 31, 2024 and were modified for borrowers experiencing financial difficulty during the twelve months prior to default were $2.5 million and $2.0 million, respectively. Additionally, loans that received a permanent term extension with no interest rate reduction in the fourth quarter of 2023 that were both modified and subsequently charged-off during the twelve months ended December 31, 2024 are not included in the amortized cost basis and had an amortized cost basis of $0.6 million.
F-38 SLM CORPORATION — 2024 Form 10-K
| | | | | | | | |
| 6. | Allowance for Credit Losses and Unfunded Loan Commitments (Continued) | |
The following tables show the amortized cost basis at the end of the respective reporting periods of the loans to borrowers experiencing financial difficulty that were modified during the period, disaggregated by class of financing receivable and type of modification. When we approve a Private Education Loan at the beginning of an academic year, we do not always disburse the full amount of the loan at the time of approval, but instead have a commitment to fund a portion of the loan at a later date (usually at the start of the second semester or subsequent trimesters). We consider borrowers to be in financial difficulty after they have exited school and have difficulty making their scheduled principal and interest payments. The increase in loan modifications during the year ended December 31, 2024 compared to the year-ago period is primarily due to additional modification programs implemented in the fourth quarter of 2023 and subsequent refinements to those programs.
| | | | | | | | | | | | | | | | | | | | | | | | | | |
| | Loan Modifications Made to Borrowers Experiencing Financial Difficulty |
Year Ended December 31, 2024
(dollars in thousands) | | Interest Rate Reduction | | Combination - Interest Rate Reduction and Term Extension |
| Loan Type: | | Amortized Cost Basis | | % of Total Class of Financing Receivable | | Amortized Cost Basis | | % of Total Class of Financing Receivable |
| Private Education Loans | | $ | 31,966 | | | 0.13 | % | | $ | 1,003,089 | | | 4.20 | % |
| Total | | $ | 31,966 | | | 0.13 | % | | $ | 1,003,089 | | | 4.20 | % |
| | | | | | | | | | | | | | | | | | | | | | | | | | |
| | Loan Modifications Made to Borrowers Experiencing Financial Difficulty |
Year Ended December 31, 2023
(dollars in thousands) | | Interest Rate Reduction | | Combination - Interest Rate Reduction and Term Extension |
| Loan Type: | | Amortized Cost Basis | | % of Total Class of Financing Receivable | | Amortized Cost Basis | | % of Total Class of Financing Receivable |
| Private Education Loans | | $ | 48,637 | | | 0.22 | % | | $ | 331,889 | | | 1.48 | % |
| Total | | $ | 48,637 | | | 0.22 | % | | $ | 331,889 | | | 1.48 | % |
| | | | | | | | |
| | | | | |
| | | | | | |
| | | | | | | | |
| | | | | | | | |
| | | | | | | | |
The following tables describe the financial effect of the modifications made to loans whose borrowers are experiencing financial difficulty:
| | | | | | | | | | | | | | | | | | | | |
| Year Ended December 31, 2024 |
| Interest Rate Reduction | | Combination - Interest Rate
Reduction and Term Extension |
| | | | | | |
| Loan Type | | Financial Effect | | Loan Type | | Financial Effect |
| Private Education Loans | | Reduced average contractual rate from 13.22% to 3.79% | | Private Education Loans | | Added a weighted average 9.23 years to the life of loans
Reduced average contractual rate from 12.71% to 3.66% |
2024 Form 10-K — SLM CORPORATION F-39
| | | | | | | | |
| 6. | Allowance for Credit Losses and Unfunded Loan Commitments (Continued) | |
| | | | | | | | | | | | | | | | | | | | |
| Year Ended December 31, 2023 |
| Interest Rate Reduction | | Combination - Interest Rate
Reduction and Term Extension |
| | | | | | |
| Loan Type | | Financial Effect | | Loan Type | | Financial Effect |
| Private Education Loans | | Reduced average contractual rate from 13.37% to 4.00% | | Private Education Loans | | Added a weighted average 10.20 years to the life of loans
Reduced average contractual rate from 12.92% to 4.00% |
| | | | | | |
| | | | | | |
Private Education Loans are charged off at the end of the month in which they reach 120 days delinquent or otherwise when the loans are classified as a loss by us or our regulator. Therefore, the amortized cost basis of the loan is reduced by the uncollectible amount and the allowance for credit losses is adjusted by the same amount. See Note 2, “Significant Accounting Policies — Allowance for Credit Losses — Allowance for Private Education Loan Losses” and “Significant Accounting Policies — Allowance for Credit Losses — Allowance for FFELP Loan Losses” in this Form 10-K for a more detailed discussion.
For the periods presented, the following table presents the defaulted amount and period-end amortized cost basis, by modification category, of loans that defaulted during the period and were modified for borrowers experiencing financial difficulty during the 12 months preceding default. Solely for the purpose of the below table, starting in the quarter ended December 31, 2024, we changed our definition of payment default to be two missed consecutive post-modification payment obligations. As such, as reflected for the year ended December 31, 2024 below, defaulted amount represents the principal amount of modified loans at the time the borrower missed two consecutive post-modification payment obligations during the period. Previously, as reflected for the year ended December 31, 2023 in the table below, defaulted amount represented the principal amount of modified loans at the time they became 60 days or more past due in the relevant period. Loans that were both modified and subsequently charged-off during the twelve months ended December 31, 2024 are not included in the period-end amortized cost basis and had an amortized cost basis of $40.4 million at the time of charge-off. The increase in loan modifications during the year ended December 31, 2024 compared to the year-ago period is primarily due to the additional modification programs implemented in the fourth quarter of 2023 and subsequent refinements to those programs. The following two tables do not include loans that received a permanent term extension with no interest rate reduction during the fourth quarter of 2023, which are described earlier in this Note 6.
| | | | | | | | | | | | | | | | | | | | | | | | | | |
|
| | Year Ended December 31, 2024 | | Year Ended December 31, 2023 |
| (Dollars in thousands) | | Defaulted Amount | | Period-end Amortized Cost Basis | | Defaulted Amount | | Period-end Amortized Cost Basis |
| Loan Type: | | | | | | | | |
| Private Education Loans | | | | | | | | |
| Interest Rate Reduction | | $ | 6,460 | | | $ | 4,621 | | | $ | 4,521 | | | $ | 4,174 | |
| Combination - Interest Rate Reduction and Term Extension | | 143,300 | | | 114,307 | | | 26,341 | | | 24,798 | |
| Total | | $ | 149,760 | | | $ | 118,928 | | | $ | 30,862 | | | $ | 28,972 | |
| | | | | | | | |
| | | | | | |
| | | | | | | |
| | | | | | | | |
| | | | | | | | |
| | | | | | | | |
F-40 SLM CORPORATION — 2024 Form 10-K
| | | | | | | | |
| 6. | Allowance for Credit Losses and Unfunded Loan Commitments (Continued) | |
We closely monitor performance of the loans to borrowers experiencing financial difficulty that are modified to understand the effectiveness of the modification efforts. The following table depicts the performance of loans that have been modified during the respective reporting periods (the twelve months ended December 31, 2024 and 2023, respectively).
| | | | | | | | | | | | | | | | | | | | |
| | Twelve Months Ended
December 31, 2024 | | Twelve Months Ended
December 31, 2023 |
| (Dollars in thousands) | | Balance | % | | Balance | % |
Payment Status (Amortized Cost Basis)(1): | | | | | | |
Loan modifications in deferment(2) | | $ | 33,645 | | | | $ | 6,843 | | |
| Loan modifications in repayment: | | | | | | |
Loans current(3)(4) | | 826,007 | | 83 | % | | 334,967 | | 90 | % |
Loans delinquent 30-59 days(3)(4) | | 77,446 | | 8 | % | | 17,205 | | 4 | % |
Loans delinquent 60-89 days(3)(4) | | 43,484 | | 4 | % | | 7,689 | | 2 | % |
Loans 90 days or greater past due(3)(4) | | 54,473 | | 5 | % | | 13,822 | | 4 | % |
| Total loan modifications in repayment | | 1,001,410 | | 100 | % | | 373,683 | | 100 | % |
| Total Private Education Loan modifications | | $ | 1,035,055 | | | | $ | 380,526 | | |
(1)Loans that were both modified and subsequently charged-off during the twelve months ended December 31, 2024 and 2023 are excluded from the table and had an amortized cost basis of $40.4 million and $8.4 million, respectively. Additionally, loans that received a permanent term extension with no interest rate reduction during the fourth quarter of 2023 are excluded from the table.
(2)Deferment includes customers who have returned to school or are engaged in other permitted educational activities and are not yet required to make full principal and interest payments on the loans (e.g., residency periods for medical students or a grace period for bar exam preparation). Deferment also includes loans that have entered a forbearance after the loan modification was granted.
(3)Represents loans in repayment, which include loans that have entered full principal and interest repayment status after any applicable grace period (but, for purposes of the table, do not include those loans while they are in forbearance).
(4)The period of delinquency is based on the number of days scheduled payments are contractually past due.
2024 Form 10-K — SLM CORPORATION F-41
| | | | | | | | |
| 6. | Allowance for Credit Losses and Unfunded Loan Commitments (Continued) | |
Private Education Loans Held for Investment - Key Credit Quality Indicators
For Private Education Loans, the key credit quality indicators are FICO scores, the existence of a cosigner, the loan status, and loan seasoning. The FICO scores are assessed at original approval and periodically refreshed/updated through the loan’s term. The following tables highlight the gross principal balance of our Private Education Loan portfolio (held for investment), by year of origination approval/first disbursement, stratified by key credit quality indicators.
| | | | | | | | | | | | | | | | | | | | | | | | | | | | | | | | | | | | | | | | | | | | | | | | | | |
As of December 31, 2024
(dollars in thousands) | | Private Education Loans Held for Investment - Credit Quality Indicators | | |
| Year of Origination Approval | | 2024(1) | | 2023(1) | | 2022(1) | | 2021(1) | | 2020(1) | | 2019 and Prior(1) | | Total(1) | | % of Balance |
| | | | | | | | | | | | | | | | |
| Cosigners: | | | | | | | | | | | | | | | | |
| With cosigner | | $ | 4,519,952 | | | $ | 4,707,685 | | | $ | 2,741,871 | | | $ | 1,759,261 | | | $ | 1,151,751 | | | $ | 4,642,019 | | | $ | 19,522,539 | | | 88 | % |
| Without cosigner | | 504,640 | | | 613,825 | | | 443,376 | | | 310,175 | | | 222,245 | | | 618,208 | | | 2,712,469 | | | 12 | |
| Total | | $ | 5,024,592 | | | $ | 5,321,510 | | | $ | 3,185,247 | | | $ | 2,069,436 | | | $ | 1,373,996 | | | $ | 5,260,227 | | | $ | 22,235,008 | | | 100 | % |
| | | | | | | | | | | | | | | | |
FICO at Origination Approval(2): | | | | | | | | | | | | | | | | |
| Less than 670 | | $ | 293,025 | | | $ | 394,962 | | | $ | 261,589 | | | $ | 155,661 | | | $ | 94,355 | | | $ | 475,186 | | | $ | 1,674,778 | | | 8 | % |
| 670-699 | | 615,617 | | | 753,548 | | | 449,214 | | | 285,181 | | | 197,205 | | | 898,535 | | | 3,199,300 | | | 14 | |
| 700-749 | | 1,525,547 | | | 1,641,641 | | | 998,834 | | | 660,373 | | | 451,695 | | | 1,782,121 | | | 7,060,211 | | | 32 | |
| Greater than or equal to 750 | | 2,590,403 | | | 2,531,359 | | | 1,475,610 | | | 968,221 | | | 630,741 | | | 2,104,385 | | | 10,300,719 | | | 46 | |
| Total | | $ | 5,024,592 | | | $ | 5,321,510 | | | $ | 3,185,247 | | | $ | 2,069,436 | | | $ | 1,373,996 | | | $ | 5,260,227 | | | $ | 22,235,008 | | | 100 | % |
| | | | | | | | | | | | | | | | |
FICO Refreshed(2)(3): | | | | | | | | | | | | | | | | |
| Less than 670 | | $ | 453,705 | | | $ | 666,049 | | | $ | 467,562 | | | $ | 301,367 | | | $ | 194,124 | | | $ | 831,053 | | | $ | 2,913,860 | | | 13 | % |
| 670-699 | | 633,749 | | | 710,546 | | | 409,808 | | | 248,325 | | | 138,730 | | | 578,639 | | | 2,719,797 | | | 12 | |
| 700-749 | | 1,485,771 | | | 1,512,643 | | | 879,450 | | | 563,941 | | | 362,715 | | | 1,398,737 | | | 6,203,257 | | | 28 | |
| Greater than or equal to 750 | | 2,451,367 | | | 2,432,272 | | | 1,428,427 | | | 955,803 | | | 678,427 | | | 2,451,798 | | | 10,398,094 | | | 47 | |
| Total | | $ | 5,024,592 | | | $ | 5,321,510 | | | $ | 3,185,247 | | | $ | 2,069,436 | | | $ | 1,373,996 | | | $ | 5,260,227 | | | $ | 22,235,008 | | | 100 | % |
| | | | | | | | | | | | | | | | |
Seasoning(4): | | | | | | | | | | | | | | | | |
| 1-12 payments | | $ | 2,860,113 | | | $ | 774,471 | | | $ | 499,812 | | | $ | 280,154 | | | $ | 159,762 | | | $ | 324,506 | | | $ | 4,898,818 | | | 22 | % |
| 13-24 payments | | — | | | 2,729,334 | | | 372,496 | | | 191,989 | | | 122,938 | | | 340,556 | | | 3,757,313 | | | 17 | |
| 25-36 payments | | — | | | — | | | 1,564,157 | | | 254,068 | | | 110,952 | | | 429,127 | | | 2,358,304 | | | 11 | |
| 37-48 payments | | — | | | — | | | — | | | 987,977 | | | 170,051 | | | 451,494 | | | 1,609,522 | | | 7 | |
| More than 48 payments | | — | | | — | | | — | | | — | | | 625,916 | | | 3,262,308 | | | 3,888,224 | | | 17 | |
| Not yet in repayment | | 2,164,479 | | | 1,817,705 | | | 748,782 | | | 355,248 | | | 184,377 | | | 452,236 | | | 5,722,827 | | | 26 | |
| Total | | $ | 5,024,592 | | | $ | 5,321,510 | | | $ | 3,185,247 | | | $ | 2,069,436 | | | $ | 1,373,996 | | | $ | 5,260,227 | | | $ | 22,235,008 | | | 100 | % |
| | | | | | | | | | | | | | | | |
2024 Current period(5) gross charge-offs | | $ | (1,826) | | | $ | (29,094) | | | $ | (68,454) | | | $ | (53,697) | | | $ | (37,318) | | | $ | (186,451) | | | $ | (376,840) | | | |
2024 Current period(5) recoveries | | 117 | | | 2,191 | | | 6,487 | | | 5,771 | | | 3,840 | | | 26,350 | | | 44,756 | | | |
2024 Current period(5) net charge-offs | | $ | (1,709) | | | $ | (26,903) | | | $ | (61,967) | | | $ | (47,926) | | | $ | (33,478) | | | $ | (160,101) | | | $ | (332,084) | | | |
| | | | | | | | | | | | | | | | |
| Total accrued interest by origination approval vintage | | $ | 195,291 | | | $ | 484,531 | | | $ | 325,962 | | | $ | 197,504 | | | $ | 106,565 | | | $ | 239,562 | | | $ | 1,549,415 | | | |
(1)Balance represents gross Private Education Loans held for investment. (2)Represents the higher credit score of the cosigner or the borrower. (3)Represents the FICO score updated as of the fourth-quarter 2024. (4)Number of months in active repayment (whether interest only payment, fixed payment, or full principal and interest payment status) for which a scheduled payment was due. (5)Current period refers to period from January 1, 2024 through December 31, 2024. |
|
|
F-42 SLM CORPORATION — 2024 Form 10-K
| | | | | | | | |
| 6. | Allowance for Credit Losses and Unfunded Loan Commitments (Continued) | |
| | | | | | | | | | | | | | | | | | | | | | | | | | | | | | | | | | | | | | | | | | | | | | | | | | |
As of December 31, 2023
(dollars in thousands) | | Private Education Loans Held for Investment - Credit Quality Indicators | | |
| Year of Origination Approval | | 2023(1) | | 2022(1) | | 2021(1) | | 2020(1) | | 2019(1) | | 2018 and Prior(1) | | Total(1) | | % of Balance |
| | | | | | | | | | | | | | | | |
| Cosigners: | | | | | | | | | | | | | | | | |
| With cosigner | | $ | 3,903,676 | | | $ | 4,428,163 | | | $ | 2,516,380 | | | $ | 1,535,308 | | | $ | 1,378,699 | | | $ | 4,529,768 | | | $ | 18,291,994 | | | 87 | % |
| Without cosigner | | 586,443 | | | 660,576 | | | 421,042 | | | 283,781 | | | 253,601 | | | 528,407 | | | 2,733,850 | | | 13 | |
| Total | | $ | 4,490,119 | | | $ | 5,088,739 | | | $ | 2,937,422 | | | $ | 1,819,089 | | | $ | 1,632,300 | | | $ | 5,058,175 | | | $ | 21,025,844 | | | 100 | % |
| | | | | | | | | | | | | | | | |
FICO at Origination Approval(2): | | | | | | | | | | | | | | | | |
| Less than 670 | | $ | 328,199 | | | $ | 395,526 | | | $ | 208,696 | | | $ | 118,935 | | | $ | 137,494 | | | $ | 451,613 | | | $ | 1,640,463 | | | 8 | % |
| 670-699 | | 635,642 | | | 704,642 | | | 400,744 | | | 254,762 | | | 257,840 | | | 868,777 | | | 3,122,407 | | | 15 | |
| 700-749 | | 1,383,779 | | | 1,586,783 | | | 934,033 | | | 590,401 | | | 545,333 | | | 1,709,299 | | | 6,749,628 | | | 32 | |
| Greater than or equal to 750 | | 2,142,499 | | | 2,401,788 | | | 1,393,949 | | | 854,991 | | | 691,633 | | | 2,028,486 | | | 9,513,346 | | | 45 | |
| Total | | $ | 4,490,119 | | | $ | 5,088,739 | | | $ | 2,937,422 | | | $ | 1,819,089 | | | $ | 1,632,300 | | | $ | 5,058,175 | | | $ | 21,025,844 | | | 100 | % |
| | | | | | | | | | | | | | | | |
FICO Refreshed(2)(3): | | | | | | | | | | | | | | | | |
| Less than 670 | | $ | 495,451 | | | $ | 638,381 | | | $ | 379,738 | | | $ | 217,956 | | | $ | 214,665 | | | $ | 791,875 | | | $ | 2,738,066 | | | 13 | % |
| 670-699 | | 616,684 | | | 672,777 | | | 365,674 | | | 193,462 | | | 176,963 | | | 564,245 | | | 2,589,805 | | | 12 | |
| 700-749 | | 1,347,094 | | | 1,477,310 | | | 836,747 | | | 498,414 | | | 445,244 | | | 1,361,073 | | | 5,965,882 | | | 28 | |
| Greater than or equal to 750 | | 2,030,890 | | | 2,300,271 | | | 1,355,263 | | | 909,257 | | | 795,428 | | | 2,340,982 | | | 9,732,091 | | | 47 | |
| Total | | $ | 4,490,119 | | | $ | 5,088,739 | | | $ | 2,937,422 | | | $ | 1,819,089 | | | $ | 1,632,300 | | | $ | 5,058,175 | | | $ | 21,025,844 | | | 100 | % |
| | | | | | | | | | | | | | | | |
Seasoning(4): | | | | | | | | | | | | | | | | |
| 1-12 payments | | $ | 2,514,079 | | | $ | 740,450 | | | $ | 440,293 | | | $ | 245,631 | | | $ | 208,941 | | | $ | 332,608 | | | $ | 4,482,002 | | | 21 | % |
| 13-24 payments | | — | | | 2,675,956 | | | 303,045 | | | 167,532 | | | 165,577 | | | 384,760 | | | 3,696,870 | | | 18 | |
| 25-36 payments | | — | | | — | | | 1,524,834 | | | 195,091 | | | 129,571 | | | 456,448 | | | 2,305,944 | | | 11 | |
| 37-48 payments | | — | | | — | | | — | | | 902,938 | | | 208,521 | | | 446,350 | | | 1,557,809 | | | 7 | |
| More than 48 payments | | — | | | — | | | — | | | 116 | | | 706,097 | | | 2,985,015 | | | 3,691,228 | | | 18 | |
| Not yet in repayment | | 1,976,040 | | | 1,672,333 | | | 669,250 | | | 307,781 | | | 213,593 | | | 452,994 | | | 5,291,991 | | | 25 | |
| Total | | $ | 4,490,119 | | | $ | 5,088,739 | | | $ | 2,937,422 | | | $ | 1,819,089 | | | $ | 1,632,300 | | | $ | 5,058,175 | | | $ | 21,025,844 | | | 100 | % |
| | | | | | | | | | | | | | | | |
2023 Current period(5) gross charge-offs | | $ | (1,812) | | | $ | (31,032) | | | $ | (70,331) | | | $ | (49,624) | | | $ | (50,585) | | | $ | (216,711) | | | $ | (420,095) | | | |
2023 Current period(5) recoveries | | 172 | | | 2,342 | | | 6,496 | | | 4,923 | | | 5,260 | | | 27,175 | | | 46,368 | | | |
2023 Current period(5) net charge-offs | | $ | (1,640) | | | $ | (28,690) | | | $ | (63,835) | | | $ | (44,701) | | | $ | (45,325) | | | $ | (189,536) | | | $ | (373,727) | | | |
| | | | | | | | | | | | | | | | |
| Total accrued interest by origination approval vintage | | $ | 177,959 | | | $ | 408,800 | | | $ | 269,978 | | | $ | 152,094 | | | $ | 116,618 | | | $ | 229,116 | | | $ | 1,354,565 | | | |
(1)Balance represents gross Private Education Loans held for investment. (2)Represents the higher credit score of the cosigner or the borrower. (3)Represents the FICO score updated as of the fourth-quarter 2023. (4)Number of months in active repayment (whether interest only payment, fixed payment, or full principal and interest payment status) for which a scheduled payment was due. (5)Current period refers to period from January 1, 2023 through December 31, 2023. |
2024 Form 10-K — SLM CORPORATION F-43
| | | | | | | | |
| 6. | Allowance for Credit Losses and Unfunded Loan Commitments (Continued) | |
Delinquencies - Private Education Loans Held for Investment
The following tables provide information regarding the loan status of our Private Education Loans held for investment, by year of origination approval/first disbursement. Loans in repayment include loans on which borrowers are making interest only or fixed payments, as well as loans that have entered full principal and interest repayment status after any applicable grace period (but, for purposes of the following tables, do not include those loans while they are in forbearance).
| | | | | | | | | | | | | | | | | | | | | | | | | | | | | | | | | | | | | | | | | | | | |
| | Private Education Loans Held for Investment - Delinquencies by Origination Approval Vintage |
As of December 31, 2024
(dollars in thousands) | | 2024 | | 2023 | | 2022 | | 2021 | | 2020 | | 2019 and Prior | | Total |
| | | | | | | | | | | | | | |
Loans in-school/grace/deferment(1) | | $ | 2,164,479 | | | $ | 1,817,705 | | | $ | 748,782 | | | $ | 355,248 | | | $ | 184,377 | | | $ | 452,236 | | | $ | 5,722,827 | |
| | | | | | | | | | | | | | |
| | | | | | | | | | | | | | |
| | | | | | | | | | | | | | |
| | | | | | | | | | | | | | |
| | | | | | | | | | | | | | |
Loans in forbearance(2) | | 19,984 | | | 124,728 | | | 87,961 | | | 52,686 | | | 31,575 | | | 88,496 | | | 405,430 | |
| Loans in repayment: | | | | | | | | | | | | | | |
| Loans current | | 2,820,940 | | | 3,312,916 | | | 2,259,455 | | | 1,590,812 | | | 1,107,189 | | | 4,422,021 | | | 15,513,333 | |
Loans delinquent 30-59 days(3) | | 13,533 | | | 36,441 | | | 45,543 | | | 35,245 | | | 27,302 | | | 152,684 | | | 310,748 | |
Loans delinquent 60-89 days(3) | | 3,973 | | | 15,239 | | | 23,359 | | | 18,365 | | | 10,921 | | | 68,878 | | | 140,735 | |
Loans 90 days or greater past due(3) | | 1,683 | | | 14,481 | | | 20,147 | | | 17,080 | | | 12,632 | | | 75,912 | | | 141,935 | |
| Total Private Education Loans in repayment | | 2,840,129 | | | 3,379,077 | | | 2,348,504 | | | 1,661,502 | | | 1,158,044 | | | 4,719,495 | | | 16,106,751 | |
| Total Private Education Loans, gross | | 5,024,592 | | | 5,321,510 | | | 3,185,247 | | | 2,069,436 | | | 1,373,996 | | | 5,260,227 | | | 22,235,008 | |
| Private Education Loans deferred origination costs and unamortized premium/(discount) | | 47,659 | | | 25,599 | | | 10,788 | | | 6,142 | | | 4,057 | | | 8,825 | | | 103,070 | |
| Total Private Education Loans | | 5,072,251 | | | 5,347,109 | | | 3,196,035 | | | 2,075,578 | | | 1,378,053 | | | 5,269,052 | | | 22,338,078 | |
| Private Education Loans allowance for losses | | (258,235) | | | (326,207) | | | (234,532) | | | (150,324) | | | (90,600) | | | (376,022) | | | (1,435,920) | |
| Private Education Loans, net | | $ | 4,814,016 | | | $ | 5,020,902 | | | $ | 2,961,503 | | | $ | 1,925,254 | | | $ | 1,287,453 | | | $ | 4,893,030 | | | $ | 20,902,158 | |
| | | | | | | | | | | | | | |
| Percentage of Private Education Loans in repayment | | 56.5 | % | | 63.5 | % | | 73.7 | % | | 80.3 | % | | 84.3 | % | | 89.7 | % | | 72.4 | % |
| Delinquent Private Education Loans in repayment as a percentage of Private Education Loans in repayment | | 0.7 | % | | 2.0 | % | | 3.8 | % | | 4.3 | % | | 4.4 | % | | 6.3 | % | | 3.7 | % |
| | | | | | | | | | | | | | |
| Loans in forbearance as a percentage of loans in repayment and forbearance | | 0.7 | % | | 3.6 | % | | 3.6 | % | | 3.1 | % | | 2.7 | % | | 1.8 | % | | 2.5 | % |
(1)Deferment includes customers who have returned to school or are engaged in other permitted educational activities and are not yet required to make payments on the loans (e.g., residency periods for medical students or a grace period for bar exam preparation).
(2)Loans for customers who have requested extension of grace period generally during employment transition or who have temporarily ceased making full payments due to hardship or other factors, consistent with established loan program servicing policies and procedures.
(3)The period of delinquency is based on the number of days scheduled payments are contractually past due.
F-44 SLM CORPORATION — 2024 Form 10-K
| | | | | | | | |
| 6. | Allowance for Credit Losses and Unfunded Loan Commitments (Continued) | |
| | | | | | | | | | | | | | | | | | | | | | | | | | | | | | | | | | | | | | | | | | | | |
| | Private Education Loans Held for Investment - Delinquencies by Origination Approval Vintage |
As of December 31, 2023
(dollars in thousands) | | 2023 | | 2022 | | 2021 | | 2020 | | 2019 | | 2018 and Prior | | Total |
| | | | | | | | | | | | | | |
Loans in-school/grace/deferment(1) | | $ | 1,976,040 | | | $ | 1,672,333 | | | $ | 669,250 | | | $ | 307,781 | | | $ | 213,593 | | | $ | 452,994 | | | $ | 5,291,991 | |
| | | | | | | | | | | | | | |
| | | | | | | | | | | | | | |
| | | | | | | | | | | | | | |
| | | | | | | | | | | | | | |
| | | | | | | | | | | | | | |
Loans in forbearance(2) | | 19,265 | | | 93,079 | | | 58,438 | | | 35,450 | | | 31,818 | | | 85,989 | | | 324,039 | |
| Loans in repayment: | | | | | | | | | | | | | | |
| Loans current | | 2,469,817 | | | 3,254,534 | | | 2,131,040 | | | 1,416,069 | | | 1,323,825 | | | 4,213,986 | | | 14,809,271 | |
Loans delinquent 30-59 days(3) | | 17,599 | | | 34,627 | | | 37,147 | | | 28,020 | | | 31,432 | | | 149,926 | | | 298,751 | |
Loans delinquent 60-89 days(3) | | 5,720 | | | 17,227 | | | 20,077 | | | 16,614 | | | 15,482 | | | 75,897 | | | 151,017 | |
Loans 90 days or greater past due(3) | | 1,678 | | | 16,939 | | | 21,470 | | | 15,155 | | | 16,150 | | | 79,383 | | | 150,775 | |
| Total Private Education Loans in repayment | | 2,494,814 | | | 3,323,327 | | | 2,209,734 | | | 1,475,858 | | | 1,386,889 | | | 4,519,192 | | | 15,409,814 | |
| Total Private Education Loans, gross | | 4,490,119 | | | 5,088,739 | | | 2,937,422 | | | 1,819,089 | | | 1,632,300 | | | 5,058,175 | | | 21,025,844 | |
| Private Education Loans deferred origination costs and unamortized premium/(discount) | | 35,616 | | | 18,556 | | | 9,465 | | | 5,809 | | | 3,556 | | | 8,552 | | | 81,554 | |
| Total Private Education Loans | | 4,525,735 | | | 5,107,295 | | | 2,946,887 | | | 1,824,898 | | | 1,635,856 | | | 5,066,727 | | | 21,107,398 | |
| Private Education Loans allowance for losses | | (269,642) | | | (335,090) | | | (194,104) | | | (118,755) | | | (100,111) | | | (317,403) | | | (1,335,105) | |
| Private Education Loans, net | | $ | 4,256,093 | | | $ | 4,772,205 | | | $ | 2,752,783 | | | $ | 1,706,143 | | | $ | 1,535,745 | | | $ | 4,749,324 | | | $ | 19,772,293 | |
| | | | | | | | | | | | | | |
| Percentage of Private Education Loans in repayment | | 55.6 | % | | 65.3 | % | | 75.2 | % | | 81.1 | % | | 85.0 | % | | 89.3 | % | | 73.3 | % |
| Delinquent Private Education Loans in repayment as a percentage of Private Education Loans in repayment | | 1.0 | % | | 2.1 | % | | 3.6 | % | | 4.1 | % | | 4.5 | % | | 6.8 | % | | 3.9 | % |
| | | | | | | | | | | | | | |
| Loans in forbearance as a percentage of loans in repayment and forbearance | | 0.8 | % | | 2.7 | % | | 2.6 | % | | 2.3 | % | | 2.2 | % | | 1.9 | % | | 2.1 | % |
(1)Deferment includes customers who have returned to school or are engaged in other permitted educational activities and are not yet required to make payments on the loans (e.g., residency periods for medical students or a grace period for bar exam preparation).
(2)Loans for customers who have requested extension of grace period generally during employment transition or who have temporarily ceased making full payments due to hardship or other factors, consistent with established loan program servicing policies and procedures.
(3)The period of delinquency is based on the number of days scheduled payments are contractually past due.
2024 Form 10-K — SLM CORPORATION F-45
| | | | | | | | |
| 6. | Allowance for Credit Losses and Unfunded Loan Commitments (Continued) | |
| | | | | | | | | | | | | | | | | | | | | | | | | | | | | | | | | | | | | | | | | | | | |
| | Private Education Loans Held for Investment - Delinquencies by Origination Approval Vintage |
As of December 31, 2022
(dollars in thousands) | | 2022 | | 2021 | | 2020 | | 2019 | | 2018 | | 2017 and Prior | | Total |
| | | | | | | | | | | | | | |
Loans in-school/grace/deferment(1) | | $ | 1,827,649 | | | $ | 1,433,322 | | | $ | 578,253 | | | $ | 380,639 | | | $ | 219,280 | | | $ | 455,910 | | | $ | 4,895,053 | |
| | | | | | | | | | | | | | |
| | | | | | | | | | | | | | |
| | | | | | | | | | | | | | |
| | | | | | | | | | | | | | |
| | | | | | | | | | | | | | |
Loans in forbearance(2) | | 16,046 | | | 64,360 | | | 38,613 | | | 37,802 | | | 30,583 | | | 91,681 | | | 279,085 | |
| Loans in repayment: | | | | | | | | | | | | | | |
| Loans current | | 2,411,441 | | | 2,991,839 | | | 1,907,574 | | | 1,683,986 | | | 1,301,809 | | | 4,262,698 | | | 14,559,347 | |
Loans delinquent 30-59 days(3) | | 14,164 | | | 30,740 | | | 30,877 | | | 35,213 | | | 31,366 | | | 144,948 | | | 287,308 | |
Loans delinquent 60-89 days(3) | | 5,523 | | | 15,056 | | | 14,433 | | | 18,201 | | | 16,697 | | | 77,595 | | | 147,505 | |
Loans 90 days or greater past due(3) | | 1,710 | | | 11,842 | | | 14,872 | | | 16,819 | | | 16,107 | | | 74,040 | | | 135,390 | |
| Total Private Education Loans in repayment | | 2,432,838 | | | 3,049,477 | | | 1,967,756 | | | 1,754,219 | | | 1,365,979 | | | 4,559,281 | | | 15,129,550 | |
| Total Private Education Loans, gross | | 4,276,533 | | | 4,547,159 | | | 2,584,622 | | | 2,172,660 | | | 1,615,842 | | | 5,106,872 | | | 20,303,688 | |
| Private Education Loans deferred origination costs and unamortized premium/(discount) | | 26,714 | | | 15,933 | | | 9,062 | | | 5,496 | | | 3,575 | | | 8,876 | | | 69,656 | |
| Total Private Education Loans | | 4,303,247 | | | 4,563,092 | | | 2,593,684 | | | 2,178,156 | | | 1,619,417 | | | 5,115,748 | | | 20,373,344 | |
| Private Education Loans allowance for losses | | (304,943) | | | (323,506) | | | (181,915) | | | (141,424) | | | (101,023) | | | (300,820) | | | (1,353,631) | |
| Private Education Loans, net | | $ | 3,998,304 | | | $ | 4,239,586 | | | $ | 2,411,769 | | | $ | 2,036,732 | | | $ | 1,518,394 | | | $ | 4,814,928 | | | $ | 19,019,713 | |
| | | | | | | | | | | | | | |
| Percentage of Private Education Loans in repayment | | 56.9 | % | | 67.1 | % | | 76.1 | % | | 80.7 | % | | 84.5 | % | | 89.3 | % | | 74.5 | % |
| Delinquent Private Education Loans in repayment as a percentage of Private Education Loans in repayment | | 0.9 | % | | 1.9 | % | | 3.1 | % | | 4.0 | % | | 4.7 | % | | 6.5 | % | | 3.8 | % |
| | | | | | | | | | | | | | |
| Loans in forbearance as a percentage of loans in repayment and forbearance | | 0.7 | % | | 2.1 | % | | 1.9 | % | | 2.1 | % | | 2.2 | % | | 2.0 | % | | 1.8 | % |
(1)Deferment includes customers who have returned to school or are engaged in other permitted educational activities and are not yet required to make payments on the loans (e.g., residency periods for medical students or a grace period for bar exam preparation).
(2)Loans for customers who have requested extension of grace period generally during employment transition or who have temporarily ceased making full payments due to hardship or other factors, consistent with established loan program servicing policies and procedures.
(3)The period of delinquency is based on the number of days scheduled payments are contractually past due.
F-46 SLM CORPORATION — 2024 Form 10-K
| | | | | | | | |
| 6. | Allowance for Credit Losses and Unfunded Loan Commitments (Continued) | |
Accrued Interest Receivable
The following table provides information regarding accrued interest receivable on our Private Education Loans. The table also discloses the amount of accrued interest on loans 90 days or greater past due as compared to our allowance for uncollectible interest. The majority of the total accrued interest receivable represents accrued interest on deferred loans where no payments are due while the borrower is in school and fixed-pay loans where the borrower makes a $25 monthly payment that is smaller than the interest accruing on the loan in that month. The accrued interest on these loans will be capitalized to the balance of the loans when the borrower exits the grace period after separation from school. The allowance for credit losses considers the collectibility of both principal and accrued interest. The allowance for uncollectible interest estimates the additional uncollectible interest that is not captured in the allowance for credit losses. See Note 2, “Significant Accounting Policies — Allowance for Credit Losses — Uncollectible Interest” in this Form 10-K for additional information.
| | | | | | | | | | | | | | | | | | | | |
| | | Private Education Loans |
| | Accrued Interest Receivable |
| (Dollars in thousands) | | Total Interest
Receivable | | 90 Days or Greater
Past Due | | Allowance for Uncollectible Interest(1) |
| | | | | | |
| December 31, 2024 | | $ | 1,549,415 | | | $ | 6,420 | | | $ | 12,366 | |
| December 31, 2023 | | $ | 1,354,565 | | | $ | 8,373 | | | $ | 9,897 | |
(1) At December 31, 2024 and 2023, $164 million and $151 million, respectively, of accrued interest receivable was not expected to be capitalized and $1.4 billion and $1.2 billion of accrued interest receivable was expected to be capitalized.
Unfunded Loan Commitments
When we approve a Private Education Loan at the beginning of an academic year, that approval may cover the borrowing for the entire academic year. As such, we do not always disburse the full amount of the loan at the time of such approval, but instead have a commitment to fund a portion of the loan at a later date (usually at the start of the second semester or subsequent trimesters). We estimate expected credit losses over the contractual period in which we are exposed to credit risk via a contractual obligation to extend credit, unless that obligation is unconditionally cancellable by us. See Note 2, “Significant Accounting Policies — Allowance for Credit Losses — Off-Balance Sheet Exposure for Contractual Loan Commitments” in this Form 10-K for additional information.
At December 31, 2024, we had $2.3 billion of outstanding contractual loan commitments that we expect to fund during the remainder of the 2024/2025 academic year. The tables below summarize the activity in the allowance recorded to cover lifetime expected credit losses on the unfunded commitments, which is recorded in “Other Liabilities” on the consolidated balance sheets, as well as the activity in the unfunded commitments balance.
| | | | | | | | | | | | | | | | | | | | | | | | | | | | | | | | | | | | |
| Years Ended December 31, (dollars in thousands) | 2024 | | 2023 | | 2022 | |
| Allowance | | Unfunded Commitments | | Allowance | | Unfunded Commitments | | Allowance | | Unfunded Commitments | |
| | | | | | | | | | | | |
| Beginning Balance | $ | 112,962 | | | $ | 2,221,077 | | | $ | 124,924 | | | $ | 1,995,808 | | | $ | 72,713 | | | $ | 1,776,976 | | |
Provision/New commitments - net(1) | 283,393 | | | 7,103,832 | | | 308,275 | | | 6,602,803 | | | 396,521 | | | 6,180,805 | | |
Transfer - funded loans(2) | (311,787) | | | (7,013,249) | | | (320,237) | | | (6,377,534) | | | (344,310) | | | (5,961,973) | | |
| Ending Balance | $ | 84,568 | | | $ | 2,311,660 | | | $ | 112,962 | | | $ | 2,221,077 | | | $ | 124,924 | | | $ | 1,995,808 | | |
(1) Net of expirations of commitments unused. Also includes incremental provision for new commitments and changes to provision for existing commitments.
(2) When a loan commitment is funded, its related liability for credit losses (which originally was recorded as a provision for unfunded commitments) is transferred to the allowance for credit losses.
The unfunded commitments disclosed above represent the total amount of outstanding unfunded commitments at each period end. However, historically not all of these commitments are funded prior to the expiration of the commitments.
2024 Form 10-K — SLM CORPORATION F-47
| | | | | | | | |
| 6. | Allowance for Credit Losses and Unfunded Loan Commitments (Continued) | |
We estimate the amount of commitments expected to be funded in calculating the reserve for unfunded commitments. The amount we expect to fund and use in our calculation of the reserve for unfunded commitments will change period to period based upon the loan characteristics of the underlying commitments.
7. Premises and Equipment, net
The following is a summary of our premises and equipment.
| | | | | | | | | | | | | | |
As of December 31,
(dollars in thousands) | | 2024 | | 2023 |
| Land and land improvements | | $ | 12,356 | | | $ | 12,356 | |
| Buildings and leasehold improvements | | 124,568 | | | 122,301 | |
| Furniture, fixtures, and equipment | | 35,519 | | | 34,068 | |
| Software | | 115,132 | | | 106,422 | |
| Premises and equipment, gross | | 287,575 | | | 275,147 | |
| Accumulated depreciation | | (168,221) | | | (145,646) | |
| Premises and equipment, net | | $ | 119,354 | | | $ | 129,501 | |
Depreciation expense for premises and equipment was $18 million, $18 million, and $17 million for the years ended December 31, 2024, 2023, and 2022, respectively.
8. Goodwill and Acquired Intangible Assets
Goodwill
We recorded as goodwill the excess of the purchase price over the estimated fair values of identifiable assets and liabilities acquired as part of the Nitro acquisition in the first quarter of 2022 and the Scholly acquisition in the third quarter of 2023. At December 31, 2024, we had $56 million in total goodwill. See Note 2, “Significant Accounting Policies — Business Combinations” in this Form 10-K for additional details on our acquisitions of Nitro and Scholly.
Goodwill is not amortized but is tested periodically for impairment. We test goodwill for impairment annually in the fourth quarter of the year, or more frequently if we believe that indicators of impairment exist. As a part of the 2024 annual impairment testing, we conducted a quantitative impairment test of goodwill associated with our education services business. We utilized the income approach to estimate the fair value of the reporting unit. The income approach measures the value of the reporting unit’s future economic benefit determined by its discounted cash flows derived from our reporting unit’s internal forecast. Based on the quantitative analysis, we determined that the fair value of the reporting unit exceeded its carrying value. Thus, no impairment charges were recorded during the year ended December 31, 2024.
Acquired Intangible Assets
Our intangible assets include acquired trade name and trademarks, customer relationships, developed technology, and partner relationships. We review our long-lived assets for impairment whenever events or changes in circumstances indicate that the carrying amount of such assets may not be recoverable.
In the fourth quarter of 2023, we determined that it was more likely than not that the Nitro trade name and trademark assets would not be used as originally intended due to changes in business strategy and, therefore, no longer held value. As a result, the Company performed an impairment review and wrote down the Nitro trade name and trademark to zero, which resulted in the recognition of a non-cash pre-tax impairment loss of $56 million. That impairment loss was recorded to acquired intangible assets impairment and amortization expense.
In the fourth quarter of 2024, we determined that it was more likely than not that the Scholly partner relationships asset no longer held value. As a result, the Company performed an impairment review and wrote down the Scholly partner relationships asset to zero, which resulted in the recognition of a non-cash pre-tax impairment loss of less than $1 million. That impairment loss was recorded to acquired intangible assets impairment and amortization expense.
F-48 SLM CORPORATION — 2024 Form 10-K
| | | | | | | | |
| 8. | Goodwill and Acquired Intangibles Assets (Continued) | |
Acquired intangible assets include the following:
| | | | | | | | | | | | | | | | | | | | | | | | | | | | | | | | | | | | | | | | | | | | |
As of December 31,
(dollars in thousands) | | | | 2024 | | 2023 |
| Useful Life (in years)(1) | | Cost Basis | | Accumulated Amortization | | Net | | Cost Basis | | Accumulated Amortization | | Net |
Trade name and trademarks(2)(3) | | 4.0 | | $ | 6,040 | | | $ | (2,139) | | | $ | 3,901 | | | $ | 6,040 | | | $ | (629) | | | $ | 5,411 | |
Customer relationships(2) | | 4.6 | | 8,920 | | | (6,465) | | | 2,455 | | | 8,920 | | | (4,013) | | | 4,907 | |
Developed technology(2) | | 3.5 | | 2,590 | | | (1,661) | | | 929 | | | 2,590 | | | (908) | | | 1,682 | |
Partner relationships(4) | | — | | — | | | — | | | — | | | 730 | | | (122) | | | 608 | |
| Sallie.com domain | | 4.0 | | 150 | | | (6) | | | 144 | | | — | | | — | | | — | |
| Total acquired intangible assets | | | | $ | 17,700 | | | $ | (10,271) | | | $ | 7,429 | | | $ | 18,280 | | | $ | (5,672) | | | $ | 12,608 | |
(1) The weighted average useful life of acquired intangible assets related to the Nitro acquisition is 4.6 years and the weighted average useful life of the acquired intangible assets related to the Scholly acquisition is 4.0 years.
(2) Trade name and trademarks, customer relationships, and developed technology at December 31, 2024 include $4 million, $1 million, and $1 million, respectively, related to the Scholly acquisition.
(3) In 2023, we fully impaired the Nitro trade name and trademarks asset for $56 million.
(4) In 2024, we fully impaired the Scholly partner relationships asset for less than $1 million.
We recorded amortization of acquired intangible assets totaling approximately $5 million and $10 million in the years ended December 31, 2024 and 2023, respectively. We will continue to amortize our intangible assets with definite useful lives over their remaining estimated useful lives. We estimate amortization expense associated with these intangible assets will be approximately $4 million, $3 million, and $1 million in 2025, 2026, and 2027.
2024 Form 10-K — SLM CORPORATION F-49
9. Deposits
The following table summarizes total deposits at December 31, 2024 and 2023.
| | | | | | | | | | | | | | | |
As of December 31,
(dollars in thousands) | | 2024 | | | 2023 |
| Deposits - interest-bearing | | $ | 21,066,752 | | | | $ | 21,651,657 | |
| Deposits - non-interest-bearing | | 1,816 | | | | 1,531 | |
| Total deposits | | $ | 21,068,568 | | | | $ | 21,653,188 | |
Our total deposits of $21.1 billion were comprised of $9.5 billion in brokered deposits and $11.6 billion in retail and other deposits at December 31, 2024, compared with total deposits of $21.7 billion, which were comprised of $10.3 billion in brokered deposits and $11.4 billion in retail and other deposits, at December 31, 2023.
Interest-bearing deposits as of December 31, 2024 and 2023 consisted of retail and brokered non-maturity savings deposits, retail and brokered non-maturity MMDAs, and retail and brokered CDs. Interest-bearing deposits also include deposits from Educational 529 and Health Savings plans that diversify our funding sources and that we consider to be core. These and other large omnibus accounts, aggregating the deposits of many individual depositors, represented $7.0 billion of our deposit total as of December 31, 2024, compared with $7.6 billion at December 31, 2023. The omnibus accounts are structured in such a way that entitles the individual depositor pass-through deposit insurance (subject to FDIC rules and limitations), and the majority of these deposits have contractual minimum balances and maturity terms.
Some of our deposit products are serviced by third-party providers. Placement fees associated with the brokered CDs are amortized into interest expense using the effective interest rate method. We recognized placement fee expense of $11 million, $12 million, and $13 million in the years ended December 31, 2024, 2023, and 2022, respectively. Fees paid to third-party brokers related to brokered CDs were $8 million, $8 million, and $13 million during the years ended December 31, 2024, 2023, and 2022, respectively.
Interest bearing deposits at December 31, 2024 and 2023 are summarized as follows:
| | | | | | | | | | | | | | | | | | | | | | | | | | |
| | | 2024 | | 2023 |
As of December 31,
(dollars in thousands) | | Amount | | Year-End Weighted Average Stated Rate(1) | | Amount | | Year-End Weighted Average Stated Rate(1) |
| | | | | | | | |
| Money market | | $ | 9,582,290 | | | 4.27 | % | | $ | 10,258,292 | | | 4.85 | % |
| Savings | | 944,034 | | | 4.02 | | | 945,000 | | | 4.35 | |
| Certificates of deposit | | 10,540,428 | | | 4.20 | | | 10,448,365 | | | 3.69 | |
| Deposits - interest-bearing | | $ | 21,066,752 | | | | | $ | 21,651,657 | | | |
(1) Includes the effect of interest rate swaps in effective hedge relationships.
Certificates of deposit remaining maturities are summarized as follows:
| | | | | | | | | | | | | | |
As of December 31,
(dollars in thousands) | | 2024 | | 2023 |
| One year or less | | $ | 6,569,872 | | | $ | 3,937,766 | |
| After one year to two years | | 2,074,849 | | | 4,112,902 | |
| After two years to three years | | 986,262 | | | 1,881,371 | |
| After three years to four years | | 189,421 | | | 327,295 | |
| After four years to five years | | 720,005 | | | 188,802 | |
| After five years | | 19 | | | 229 | |
| Total | | $ | 10,540,428 | | | $ | 10,448,365 | |
F-50 SLM CORPORATION — 2022 Form 10-K
As of December 31, 2024 and 2023, there were $567 million and $478 million, respectively, of deposits exceeding FDIC insurance limits. Accrued interest on deposits was $92 million and $91 million at December 31, 2024 and 2023, respectively.
10. Borrowings
Outstanding borrowings consist of unsecured debt and secured borrowings issued through our term asset-backed securities (“ABS”) program and our Secured Borrowing Facility. The issuing entities for those secured borrowings are VIEs and are consolidated for accounting purposes. The following table summarizes our secured borrowings at December 31, 2024 and 2023.
| | | | | | | | | | | | | | | | | | | | | | | | | | | | | | | | | | | | | | |
As of December 31,
(dollars in thousands) | | 2024 | | 2023 |
| Short-Term | | Long-Term | | Total | | Short-Term | | Long-Term | | Total |
| Unsecured borrowings: | | | | | | | | | | | | |
| Unsecured debt (fixed-rate) | | $ | — | | | $ | 995,420 | | | $ | 995,420 | | | $ | — | | | $ | 992,200 | | | $ | 992,200 | |
| Total unsecured borrowings | | — | | | 995,420 | | | 995,420 | | | — | | | 992,200 | | | 992,200 | |
| | | | | | | | | | | | |
| Secured borrowings: | | | | | | | | | | | | |
| Private Education Loan term securitizations: | | | | | | | | | | | | |
| Fixed-rate | | — | | | 4,617,743 | | | 4,617,743 | | | — | | | 3,585,254 | | | 3,585,254 | |
| Variable-rate | | — | | | 827,182 | | | 827,182 | | | — | | | 650,058 | | | 650,058 | |
| Total Private Education Loan term securitizations | | — | | | 5,444,925 | | | 5,444,925 | | | — | | | 4,235,312 | | | 4,235,312 | |
| Secured Borrowing Facility | | — | | | — | | | — | | | — | | | — | | | — | |
| Total secured borrowings | | — | | | 5,444,925 | | | 5,444,925 | | | — | | | 4,235,312 | | | 4,235,312 | |
| Total | | $ | — | | | $ | 6,440,345 | | | $ | 6,440,345 | | | $ | — | | | $ | 5,227,512 | | | $ | 5,227,512 | |
Short-term Borrowings
Secured Financings
On June 14, 2024, we amended our $2 billion maximum Secured Borrowing Facility to extend the maturity. We hold 100 percent of the residual interest in the Secured Borrowing Facility trust. The amendment extended the revolving period, during which we may borrow, repay, and reborrow funds, until June 13, 2025. The scheduled amortization period, during which amounts outstanding under the Secured Borrowing Facility must be repaid, ends on June 13, 2026 (or earlier, if certain material adverse events occur). The one-year revolving period plus the one-year amortization period results in a contractual maturity that is two years from the date of inception or renewal; however, we classify advances under our Secured Borrowing Facility as short-term borrowings because it is our intention to repay those advances within one year. For the years ended December 31, 2024 and December 31, 2023, there were no outstanding short-term borrowings under the Secured Borrowing Facility.
With the Secured Borrowing Facility, we incur financing costs on the unused borrowing capacity and on any outstanding advances. The non-use fee is based upon the Facility’s maximum borrowing limit of $2 billion, for both 2024 and 2023, and is applied to the unfunded balance. The Facility non-use fee was 55 basis points in both 2024 and 2023.
2024 Form 10-K — SLM CORPORATION F-51
| | | | | |
| 10. | Borrowings (Continued) |
Long-term Borrowings
The following table summarizes the outstanding long-term borrowings, the weighted average interest rates at the end of the period and the related average balance during the period. Rates reflect stated interest of borrowings and related discounts and premiums. The long-term borrowings amortize over time and mature serially from 2025 to 2056.
| | | | | | | | | | | | | | | | | | | | | | | | | | | | | | | | | | | | | | |
| | December 31, 2024 | | Year Ended
December 31, 2024 | | December 31, 2023 | | Year Ended
December 31, 2023 |
| (Dollars in thousands) | | Ending Balance | | Weighted Average
Interest Rate | | Average Balance | | Ending Balance | | Weighted Average
Interest Rate | | Average Balance |
| Long-term borrowings: | | | | | | | | | | | | |
| Floating-rate borrowings | | $ | 827,182 | | | 5.71 | % | | $ | 724,761 | | | $ | 650,058 | | | 6.51 | % | | $ | 715,409 | |
| Fixed-rate borrowings | | 5,613,163 | | | 4.09 | | | 4,864,359 | | | 4,577,454 | | | 3.52 | | | 4,605,806 | |
| Total long-term borrowings | | $ | 6,440,345 | | | 4.30 | % | | $ | 5,589,120 | | | $ | 5,227,512 | | | 3.89 | % | | $ | 5,321,215 | |
As of December 31, 2024, the maturities of our brokered CDs and borrowings are summarized below.
| | | | | | | | | | | | | | | | | | | | | | | | | | | | | | | |
As of December 31, 2024
(dollars in thousands) | Brokered CDs | | Unsecured
Debt | | Secured Borrowings(1) | | Total | | | | | | | | |
| | | | | | | | | | | | | | | |
| 2025 | $ | 2,763,401 | | | $ | 498,897 | | | $ | 823,843 | | | $ | 4,086,141 | | | | | | | | | |
| 2026 | 1,824,607 | | | 496,523 | | | 840,927 | | | 3,162,057 | | | | | | | | | |
| 2027 | 783,061 | | | — | | | 823,320 | | | 1,606,381 | | | | | | | | | |
| 2028 | 146,282 | | | — | | | 642,798 | | | 789,080 | | | | | | | | | |
| 2029 | 683,748 | | | — | | | 568,779 | | | 1,252,527 | | | | | | | | | |
| 2030 and after | — | | | — | | | 1,764,900 | | | 1,764,900 | | | | | | | | | |
| 6,201,099 | | | 995,420 | | | 5,464,567 | | | 12,661,086 | | | | | | | | | |
| Hedge accounting adjustments | (241) | | | — | | | — | | | (241) | | | | | | | | | |
| Total | $ | 6,200,858 | | | $ | 995,420 | | | $ | 5,464,567 | | | $ | 12,660,845 | | | | | | | | | |
(1) We view our secured borrowings as long-term based on the contractual maturity dates ranging from 2032 to 2056. However, the actual maturity of our secured borrowings depends on the prepayment speeds of the underlying collateralized loans. To disclose how we expect this debt to pay down over time, the maturities for our secured borrowings are based on the projected bond principal paydowns using the current estimated loan prepayment speeds.
Unsecured Financing Transactions
On October 29, 2020, we issued $500 million of 4.20 percent unsecured Senior Notes due October 29, 2025. At December 31, 2024, the outstanding balance was $499 million. This unsecured borrowing remained classified as long-term as of December 31, 2024 in accordance with our ability and intent to refinance the debt on a long-term basis. On February 18, 2025, we redeemed these Senior Notes with proceeds from $500 million of 6.50 percent unsecured Senior Notes issued on January 31, 2025 and due January 31, 2030. See Note 23, “Subsequent Events” in this Form 10-K for additional information.
On November 1, 2021, we issued $500 million of 3.125 percent unsecured Senior Notes due November 2, 2026, at a price of 99.43 percent. At December 31, 2024, the outstanding balance was $496 million.
F-52 SLM CORPORATION — 2024 Form 10-K
| | | | | |
| 10. | Borrowings (Continued) |
Secured Financing Transactions
The following summarizes our term funding collateralized by pools of Private Education Loans in the long-term ABS market issued in 2023 and 2024 in which we retained 100 percent of the residual class certificates.
| | | | | | | | | | | | | | | | | | | | | | | | | | | | | | | | | | | | | | | | |
| SMB Private Education Loan Trust | | Date Closed | | Loans Transferred to the Trust(1) | | Notes
Issued | | Gross
Proceeds | | Weighted Average Cost of Funds(2) | | Weighted Average Life of Class A and Class B Notes
(in years) | | |
| (Dollars in thousands) | | | | | | | | | | | | | | |
| | | | | | | | | | | | | | |
| | | | | | | | | | | | | | |
| | | | | | | | | | | | | | |
| | | | | | | | | | | | |
| | | | | | | | | | | | | | |
| | | | | | | | | | | | | | |
| | | | | | | | | | | | | | |
| | | | | | | | | | | | | | |
| | | | | | | | | | | | | | |
| | | | | | | | | | | | | | |
| | | | | | | | | | | | |
| | | | | | | | | | | | | | |
| | | | | | | | | | | | | | |
| | | | | | | | | | | | | | |
| | | | | | | | | | | | | | |
| | | | | | | | | | | | |
| | | | | | | | | | | | | | |
| 2023-A ABS Transaction | | March 15, 2023 | | $ | 644,573 | | | $ | 579,000 | | | $ | 571,910 | | | SOFR plus 1.53% | | 5.06 | | |
| 2023-C ABS Transaction | | August 16, 2023 | | 647,934 | | | 568,000 | | | 567,881 | | | SOFR plus 1.69% | | 4.93 | | |
| Total 2023 | | | | $ | 1,292,507 | | | $ | 1,147,000 | | | $ | 1,139,791 | | | | | | | |
| | | | | | | | | | | | | | |
| 2024-C ABS Transaction | | May 15, 2024 | | $ | 733,644 | | | $ | 668,000 | | | $ | 667,888 | | | SOFR plus 1.19% | | 5.36 | | |
| 2024-E ABS Transaction | | August 14, 2024 | | 944,645 | | | 868,000 | | | 867,743 | | | SOFR plus 1.42% | | 5.17 | | |
| 2024-F ABS Transaction | | November 6, 2024 | | 732,445 | | | 680,000 | | | 679,981 | | | SOFR plus 1.08% | | 5.09 | | |
| Total 2024 | | | | $ | 2,410,734 | | | $ | 2,216,000 | | | $ | 2,215,612 | | | | | | | |
(1)The transfer of such loans did not qualify for sale treatment and thus remain on our consolidated balance sheet. At December 31, 2024, the following Private Education Loan amounts remain encumbered related to these transactions:
| | | | | | | | | | | | | | | | | | | | |
| SMB Private Education Loan Trust | | Loan Principal | | Capitalized
Interest | | Total Loans |
| (Dollars in thousands) | | | | | | |
| 2023-A ABS Transaction | | $ | 484,551 | | | $ | 32,856 | | | $ | 517,407 | |
| 2023-C ABS Transaction | | 516,507 | | | 35,287 | | | 551,794 | |
| Total 2023 | | $ | 1,001,058 | | | $ | 68,143 | | | $ | 1,069,201 | |
| | | | | | |
| 2024-C ABS Transaction | | $ | 646,550 | | | $ | 52,968 | | | $ | 699,518 | |
| 2024-E ABS Transaction | | 841,355 | | | 69,238 | | | 910,593 | |
| 2024-F ABS Transaction | | 662,361 | | | 55,131 | | | 717,492 | |
| Total 2024 | | $ | 2,150,266 | | | $ | 177,337 | | | $ | 2,327,603 | |
(2)Represents SOFR equivalent cost of funds for variable and fixed-rate bonds, excluding issuance costs.
Pre-2023 Transactions
Prior to 2023, we executed a total of $10.38 billion in ABS transactions that were accounted for as secured financings. At December 31, 2024, $3.74 billion of our Private Education Loans, including $3.63 billion of principal and $107 million in capitalized interest, were encumbered as a result of these transactions.
2024 Form 10-K — SLM CORPORATION F-53
| | | | | |
| 10. | Borrowings (Continued) |
Consolidated Funding Vehicles
We consolidate our financing entities that are VIEs as a result of our being the entities’ primary beneficiary. As a result, these financing VIEs are accounted for as secured borrowings.
| | | | | | | | | | | | | | | | | | | | | | | | | | | | | | | | | | | | | | | | | | | | |
As of December 31, 2024
(dollars in thousands) | | |
| Debt Outstanding | | Carrying Amount of Net Assets Securing Debt Outstanding |
| Short-Term | | Long-Term | | Total | | Loans | | Restricted Cash | | Other Assets, Net(1) | | Total |
| Secured borrowings: | | | | | | | | | | | | | | |
| Private Education Loan term securitizations | | $ | — | | | $ | 5,444,925 | | | $ | 5,444,925 | | | $ | 6,786,390 | | | $ | 173,892 | | | $ | 418,705 | | | $ | 7,378,987 | |
| Secured Borrowing Facility | | — | | | — | | | — | | | — | | | — | | | 98 | | | 98 | |
| Total | | $ | — | | | $ | 5,444,925 | | | $ | 5,444,925 | | | $ | 6,786,390 | | | $ | 173,892 | | | $ | 418,803 | | | $ | 7,379,085 | |
| | | | | | | | | | | | | | | | | | | | | | | | | | | | | | | | | | | | | | | | | | | | |
As of December 31, 2023
(dollars in thousands) | | |
| Debt Outstanding | | Carrying Amount of Net Assets Securing Debt Outstanding |
| Short-Term | | Long-Term | | Total | | Loans | | Restricted Cash | | Other Assets, Net(1) | | Total |
| Secured borrowings: | | | | | | | | | | | | | | |
| Private Education Loan term securitizations | | $ | — | | | $ | 4,235,312 | | | $ | 4,235,312 | | | $ | 5,539,964 | | | $ | 149,412 | | | $ | 303,653 | | | $ | 5,993,029 | |
| Secured Borrowing Facility | | — | | | — | | | — | | | — | | | — | | | 100 | | | 100 | |
| Total | | $ | — | | | $ | 4,235,312 | | | $ | 4,235,312 | | | $ | 5,539,964 | | | $ | 149,412 | | | $ | 303,753 | | | $ | 5,993,129 | |
(1) Other assets, net primarily represents accrued interest receivable and payable.
F-54 SLM CORPORATION — 2024 Form 10-K
| | | | | |
| 10. | Borrowings (Continued) |
Unconsolidated Funding Vehicles
Private Education Loan Securitizations
Unconsolidated VIEs include variable interests that we hold in certain securitization trusts created by the sale of our Private Education Loans to unaffiliated third parties. We remained the servicer of these loans pursuant to applicable servicing agreements executed in connection with the sales, and we are also the administrator of these trusts. Additionally, we own five percent of the securities issued by the trusts to meet risk retention requirements. We were not required to consolidate these entities because the fees we receive as the servicer/administrator are commensurate with our responsibility, so the fees are not considered a variable interest. Additionally, the five percent vertical interest we maintain does not absorb more than an insignificant amount of the VIE’s expected losses, nor do we receive more than an insignificant amount of the VIE’s expected residual returns. We classified those vertical risk retention interests related to the securitization transactions listed below as available-for-sale investments, except for the interest in the residual class, which we classified as trading investments recorded at fair value with changes recorded through earnings. The following summarizes our Private Education Loan ABS transactions closed in 2023 and 2024 where the respective VIEs were not consolidated.
| | | | | | | | | | | | | | | | | |
| SMB Private Education Loan Trust | Date Closed | Loans Transferred to the Trust by Third-Party Seller | Date Third-Party Seller Previously Purchased Loans from the Bank | Additional Loans the Bank Transferred to the Trust(1) | Gain on Sale for Additional Loans Transferred by Bank |
| (Dollars in thousands) | | | | | |
2023-B ABS transaction(2) | May 24, 2023 | $ | 1,988,277 | | May 3, 2023 | $ | 104,743 | | $ | 5,391 | |
2023-D ABS transaction(2) | November 7, 2023 | 995,184 | | October 13, 2023 | 52,572 | | 1,570 | |
2024-A ABS transaction(2) | March 13, 2024 | 1,988,248 | | February 1, 2024 | 104,748 | | 6,685 | |
2024-R1 ABS transaction(3) | April 9, 2024 | 68,896 | | n/a | — | | — | |
2024-B ABS transaction(2) | April 11, 2024 | 191,445 | | March 6, 2020 and November 17, 2021 | 10,132 | | 35 | |
2024-D ABS transaction(2) | June 28, 2024 | 1,494,953 | | May 23, 2024 | 78,782 | | $ | 6,051 | |
(1)The transfer of such additional loans qualified for sale treatment and removed these loans from our balance sheet on the settlement date of the transaction.
(2)Sallie Mae Bank sponsored the transaction and is the servicer and administrator.
(3)An unaffiliated third party sold to the Trust approximately $69 million of Private Education Loan residual flows from our 2020-PTA and 2020-PTB transactions through a re-securitization. Sallie Mae Bank sponsored the 2024-R1 transaction and is the administrator of the Trust.
The table below provides a summary of our exposure related to our unconsolidated VIEs.
| | | | | | | | | | | | | | | | | | | | | | | | | | | | | | | | | | | | | | |
| | 2024 | | 2023 |
As of December 31,
(dollars in thousands) | | Debt Interests(1) | | Equity Interests(2) | | Total Exposure | | Debt Interests(1) | | Equity Interests(2) | | Total Exposure |
| Private Education Loan term securitizations | | $ | 571,795 | | | $ | 53,262 | | | $ | 625,057 | | | $ | 423,327 | | | $ | 54,481 | | | $ | 477,808 | |
(1) Vertical risk retention interest classified as available-for-sale investment.
(2) Vertical risk retention interest classified as trading investment.
Other Borrowing Sources
We maintain discretionary uncommitted Federal Funds lines of credit with various correspondent banks, which totaled $125 million at December 31, 2023. The interest rate we are charged on these lines of credit is priced at Fed Funds plus a spread at the time of borrowing, and is payable daily. We did not utilize these lines of credit in the years ended December 31, 2024 and 2023.
2024 Form 10-K — SLM CORPORATION F-55
| | | | | |
| 10. | Borrowings (Continued) |
We established an account at the FRB to meet eligibility requirements for access to the Primary Credit borrowing facility at the FRB’s Discount Window (the “Window”). The Primary Credit borrowing facility is a lending program available to depository institutions that are in generally sound financial condition. All borrowings at the Window must be fully collateralized. We can pledge asset-backed and mortgage-backed securities, as well as Private Education Loans, to the FRB as collateral for borrowings at the Window. Generally, collateral value is assigned based on the estimated fair value of the pledged assets. At December 31, 2024 and December 31, 2023, the value of our pledged collateral at the FRB totaled $2.2 billion and $1.6 billion, respectively. The interest rate charged to us is the discount rate set by the FRB. We did not utilize this facility in the years ended December 31, 2024 and 2023.
11. Derivative Financial Instruments
Risk Management Strategy
We maintain an overall interest rate risk management strategy that incorporates the use of derivative instruments to reduce the economic effect of interest rate changes. Our goal is to manage interest rate sensitivity by modifying the repricing frequency and underlying index characteristics of certain balance sheet assets or liabilities so any adverse impacts related to movements in interest rates are managed within low to moderate limits. As a result of interest rate fluctuations, hedged balance sheet positions will appreciate or depreciate in market value or create variability in cash flows. Income or loss on the derivative instruments linked to the hedged item will generally offset the effect of this unrealized appreciation or depreciation or volatility in cash flows for the period the item is being hedged. We view this strategy as a prudent management of interest rate risk.
Although we use derivatives to reduce the risk of interest rate changes, the use of derivatives does expose us to both market and credit risk. Market risk is the chance of financial loss resulting from changes in interest rates and market liquidity. Credit risk is the risk that a counterparty will not perform its obligations under a contract and it is limited to the loss of the fair value gain in a derivative that the counterparty owes us less collateral held and plus collateral posted. When the fair value of a derivative contract less collateral held and plus collateral posted is negative, we owe the counterparty and, therefore, we have no credit risk exposure to the counterparty; however, the counterparty has exposure to us. We minimize the credit risk in derivative instruments by entering into transactions with reputable counterparties that are reviewed regularly by our Credit Department. We also maintain a policy of requiring that all derivative contracts be governed by an International Swaps and Derivatives Association, Inc. Master Agreement. Depending on the nature of the derivative transaction, bilateral collateral arrangements are required as well. When we have more than one outstanding derivative transaction with the counterparty, and there exists legally enforceable netting provisions with the counterparty (i.e., a legal right to offset receivable and payable derivative contracts), the “net” mark-to-market exposure, less collateral held and plus collateral posted, represents exposure with the counterparty. We refer to this as the “net position.” When there is a net negative exposure, we consider our exposure to the counterparty and the net position to be zero.
Title VII of the Dodd-Frank Act requires all standardized derivatives, including most interest rate swaps, to be submitted for clearing to central counterparties to reduce counterparty risk. Two of the central counterparties we use are the CME and the LCH. All variation margin payments on derivatives cleared through the CME and LCH are accounted for as legal settlement. As of December 31, 2024, $850 million notional of our derivative contracts were cleared on the CME and $71 million were cleared on the LCH. The derivative contracts cleared through the CME and LCH represent 92.3 percent and 7.7 percent, respectively, of our total notional derivative contracts of $921 million at December 31, 2024.
For derivatives cleared through the CME and LCH, the net gain (loss) position includes the variation margin amounts as settlement of the derivative and not collateral against the fair value of the derivative. The amount of variation margin included as settlement as of December 31, 2024 was $(22) million and $(1) million for the CME and LCH, respectively. Changes in fair value for derivatives not designated as hedging instruments are presented as realized gains (losses).
Our exposure to the counterparty is limited to the value of the derivative contracts in a gain position less any collateral held and plus any collateral posted. When there is a net negative exposure, we consider our exposure to the counterparty to be zero. At December 31, 2024 and 2023, we had a net positive exposure (derivative gain/loss positions to us, less collateral held by us and plus collateral posted with counterparties) related to derivatives of $5 million and $9 million, respectively.
Accounting for Derivative Instruments
The accounting for derivative instruments requires that every derivative instrument, including certain derivative instruments embedded in other contracts, be recorded on the balance sheet as either an asset or liability measured at fair value. Our derivative instruments are classified and accounted for by us as either fair value hedges or cash flow hedges.
F-56 SLM CORPORATION — 2024 Form 10-K
| | | | | | | | |
| 11. | Derivative Financial Instruments (Continued) | |
Fair Value Hedges
We generally use fair value hedges to offset the exposure to changes in fair value of a recognized fixed-rate liability. We enter into interest rate swaps to economically convert fixed-rate liabilities into variable-rate liabilities. For fair value hedges, we generally consider all components of the derivative’s gain and/or loss when assessing hedge effectiveness and generally hedge changes in fair values due to interest rates. For fair value hedges, the entire change in the fair value of the hedging instrument included in the assessment of hedge effectiveness is recorded in the same line item in the consolidated statements of income that is used to present the earnings effect of the hedged component of the hedged item.
Cash Flow Hedges
We use cash flow hedges to hedge the exposure to variability in cash flows of floating-rate liabilities. This strategy is used primarily to minimize the exposure to volatility in cash flows from future changes in interest rates. In assessing hedge effectiveness, generally all components of each derivative’s gains or losses are included in the assessment. We hedge exposure to changes in cash flows due to changes in interest rates or total changes in cash flow. For cash flow hedges, the entire change in the fair value of the hedging instrument included in the assessment of hedge effectiveness is recorded in other comprehensive income (loss). Those amounts are subsequently reclassified to earnings, in the same line item in the consolidated statements of income as impacted by the hedged item, when the hedged item affects earnings.
Summary of Derivative Financial Statement Impact
The following tables summarize the fair values and notional amounts of all derivative instruments at December 31, 2024 and 2023, and their impact on earnings and other comprehensive income for the years ended December 31, 2024, 2023, and 2022.
Impact of Derivatives on the Consolidated Balance Sheets
| | | | | | | | | | | | | | | | | | | | | | | | | | | | | | | | | | | | | | | | | | | | | | | | | | | | | | | | |
| | | | Cash Flow Hedges | | Fair Value Hedges | | Trading | | Total |
As of December 31,
(dollars in thousands) | | 2024 | | 2023 | | 2024 | | 2023 | | 2024 | | 2023 | | 2024 | | 2023 |
Fair Values(1) | | Hedged Risk Exposure | | | | | | | | | | | | | | | | |
| | | | | | | | | | | | | | | | | | |
Derivative Assets:(2) | | | | | | | | | | | | | | | | | | |
| Interest rate swaps | | Interest rate | | $ | — | | | $ | — | | | $ | — | | | $ | — | | | $ | — | | | $ | — | | | $ | — | | | $ | — | |
| | | | | | | | | | | | | | | | | | |
Derivative Liabilities:(2) | | | | | | | | | | | | | | | | | | |
| Interest rate swaps | | Interest rate | | (19) | | | (339) | | | (21) | | | (31) | | | — | | | — | | | (40) | | | (370) | |
| Total net derivatives | | | | $ | (19) | | | $ | (339) | | | $ | (21) | | | $ | (31) | | | $ | — | | | $ | — | | | $ | (40) | | | $ | (370) | |
(1)Fair values reported include variation margin as legal settlement of the derivative contract. Assets and liabilities are presented without consideration of master netting agreements. Derivatives are carried on the balance sheet based on net position by counterparty under master netting agreements and classified in other assets or other liabilities depending on whether in a net positive or negative position.
(2)The following table reconciles gross positions with the impact of master netting agreements to the balance sheet classification:
| | | | | | | | | | | | | | | | | | | | | | | | | | |
As of December 31,
(dollars in thousands) | | Other Assets | | Other Liabilities |
| 2024 | | 2023 | | 2024 | | 2023 |
Gross position(1) | | $ | — | | | $ | — | | | $ | (40) | | | $ | (370) | |
| Impact of master netting agreement | | — | | | — | | | — | | | — | |
| Derivative values with impact of master netting agreements (as carried on balance sheet) | | — | | | — | | | (40) | | | (370) | |
Cash collateral pledged(2) | | 4,879 | | | 9,228 | | | — | | | — | |
| Net position | | $ | 4,879 | | | $ | 9,228 | | | $ | (40) | | | $ | (370) | |
__________
(1) Gross position amounts include accrued interest and variation margin as legal settlement of the derivative contract.
(2) Cash collateral pledged excludes amounts that represent legal settlement of the derivative contracts.
2024 Form 10-K — SLM CORPORATION F-57
| | | | | | | | |
| 11. | Derivative Financial Instruments (Continued) | |
| | | | | | | | | | | | | | | | | | | | | | | | | | | | | | | | | | | | | | | | | | | | | | | | | | |
| Notional Values |
| | Cash Flow | | Fair Value | | Trading | | Total |
As of December 31,
(dollars in thousands) | | 2024 | | 2023 | | 2024 | | 2023 | | 2024 | | 2023 | | 2024 | | 2023 |
| | | | | | | | | | | | | | | | |
| | | | | | | | | | | | | | | | |
| Interest rate swaps | | $ | 639,097 | | | $ | 1,203,783 | | | $ | 281,520 | | | $ | 702,309 | | | $ | — | | | $ | — | | | $ | 920,617 | | | $ | 1,906,092 | |
| | | | | | | | | | | | | | | | |
| Net total notional | | $ | 639,097 | | | $ | 1,203,783 | | | $ | 281,520 | | | $ | 702,309 | | | $ | — | | | $ | — | | | $ | 920,617 | | | $ | 1,906,092 | |
| | | | | | | | | | | | | | | | |
| | | | | | | | | | | | | | | | |
| | | | | | | | | | | | | | | | |
| | | | | | | | | | | | | | | | |
| | | | | | | | | | | | | | | | |
| | | | | | | | | | | | | | | | |
As of December 31, 2024 and 2023, the following amounts were recorded on the consolidated balance sheet related to cumulative basis adjustments for fair value hedges:
| | | | | | | | | | | | | | | | | | | | | | | | | | |
As of December 31,
(dollars in thousands)
Line Item in the Balance Sheet in Which the Hedged Item is Included: | | Carrying Amount of the Hedged Assets/(Liabilities) | | Cumulative Amount of Fair Value Hedging Adjustment Included in the Carrying Amount of the Hedged Assets/(Liabilities) |
| 2024 | | 2023 | | 2024 | | 2023 |
| | | | | | | | |
| Deposits | | $ | (279,908) | | | $ | (689,137) | | | $ | 1,420 | | | $ | 12,910 | |
Impact of Derivatives on the Consolidated Statements of Income
| | | | | | | | | | | | | | | | | | | | |
Years Ended December 31,
(dollars in thousands) | | 2024 | | 2023 | | 2022 |
| | | | | | |
| Fair Value Hedges | | | | | | |
| Interest rate swaps: |
| Interest recognized on derivatives | | $ | (15,278) | | | $ | (26,054) | | | $ | 16,308 | |
| Hedged items recorded in interest expense | | (11,490) | | | (18,350) | | | 82,043 | |
| Derivatives recorded in interest expense | | 11,554 | | | 18,487 | | | (82,063) | |
| Total | | $ | (15,214) | | | $ | (25,917) | | | $ | 16,288 | |
| | | | | | |
| Cash Flow Hedges | | | | | | |
| Interest rate swaps: | | | | | | |
| Amount of gain (loss) reclassified from accumulated other comprehensive income into interest expense | | $ | 41,221 | | | $ | 47,810 | | | $ | 3,658 | |
| Total | | $ | 41,221 | | | $ | 47,810 | | | $ | 3,658 | |
| | | | | | |
| Trading | | | | | | |
| Interest rate swaps: | | | | | | |
| Change in fair value of future interest payments recorded in earnings | | $ | — | | | $ | — | | | $ | (248) | |
| Total | | — | | | — | | | (248) | |
| Total | | $ | 26,007 | | | $ | 21,893 | | | $ | 19,698 | |
F-58 SLM CORPORATION — 2024 Form 10-K
| | | | | | | | |
| 11. | Derivative Financial Instruments (Continued) | |
Impact of Derivatives on the Statements of Changes in Stockholders’ Equity
| | | | | | | | | | | | | | | | | | | | |
Years Ended December 31,
(dollars in thousands) | | 2024 | | 2023 | | 2022 |
| Amount of gain (loss) recognized in other comprehensive income (loss) | | $ | 10,827 | | | $ | 13,353 | | | $ | 97,389 | |
| Less: Amount of gain (loss) reclassified in interest expense | | 41,221 | | | 47,810 | | | 3,658 | |
| Total change in other comprehensive income (loss) for unrealized gains (losses) on derivatives, before income tax (expense) benefit | | $ | (30,394) | | | $ | (34,457) | | | $ | 93,731 | |
Amounts reported in accumulated other comprehensive income related to derivatives will be reclassified to interest expense as interest payments are made on our variable-rate deposits. During the next twelve months, we estimate $21 million will be reclassified as a decrease to interest expense.
Cash Collateral
As of December 31, 2024, cash collateral held and pledged excludes amounts that represent legal settlement of the derivative contracts held with the CME and LCH. There was no cash collateral held by us related to derivative exposure between us and our derivatives counterparties at December 31, 2024 and 2023, respectively. Collateral held is recorded in “Other Liabilities” on the consolidated balance sheets. Cash collateral pledged by us related to derivative exposure between us and our derivatives counterparties was $5 million and $9 million at December 31, 2024 and 2023, respectively. Collateral pledged is recorded in “Other interest-earning assets” on the consolidated balance sheets.
12. Stockholders’ Equity
Preferred Stock
At December 31, 2024, we had 2.5 million shares of Floating-Rate Non-Cumulative Preferred Stock, Series B (the “Series B Preferred Stock”) outstanding. The Series B Preferred Stock does not have a maturity date, but can be redeemed at our option. Redemption would include any accrued and unpaid dividends for the then current quarterly dividend period, up to the redemption date. The shares have no preemptive or conversion rights and are not exchangeable for any of our other securities or property. Dividends are not mandatory and are paid quarterly, when, as, and if declared by the Board of Directors. Holders of Series B Preferred Stock were entitled to receive quarterly dividends based on 3-month LIBOR plus 170 basis points per annum in arrears, until the transition to SOFR in the third quarter of 2023. The first dividends on our Series B Preferred Stock that were based on a SOFR rate were declared dividends paid on December 15, 2023, which were based on the adjusted 3-month CME Term SOFR plus 170 basis points per annum in arrears, where the adjusted 3-month CME Term SOFR includes the LIBOR Benchmark Replacement Adjustment of 26.161 basis points. Upon liquidation or dissolution of the Company, holders of the Series B Preferred Stock are entitled to receive $100 per share, plus an amount equal to accrued and unpaid dividends for the then current quarterly dividend period, pro rata, and before any distribution of assets is made to holders of our common stock.
Common Stock
Our shareholders have authorized the issuance of 1.125 billion shares of common stock (par value of $0.20). At December 31, 2024, 210 million shares were issued and outstanding and 33 million shares were unissued but encumbered for outstanding stock options, restricted stock, restricted stock units, performance stock units, and dividend equivalent units for employee compensation and remaining authority for stock-based compensation plans.
Common Stock Dividends
In the year ended December 31, 2024, we paid a total common stock dividend of $0.46 per common share. In both the years ended December 31, 2023 and 2022, we paid a total common stock dividend of $0.44 per common share. Common stock dividend declarations are subject to determination by, and the discretion of, our Board of Directors. We may change our common stock dividend policy at any time.
We are dependent on funds obtained from the Bank to fund dividend payments. Regulatory and other legal restrictions may limit our ability to transfer funds freely, either to or from our subsidiaries. In particular, the Bank is subject to laws and regulations that authorize regulatory bodies to block or reduce the flow of funds to us, or that prohibit such transfers altogether in certain circumstances. These laws, regulations, and rules may hinder our ability to access funds that we may need to make payments in respect of our stock or to satisfy our other responsibilities. The FDIC has the authority to prohibit or limit the payment of dividends by the Bank and SLM Corporation.
2024 Form 10-K — SLM CORPORATION F-59
| | | | | | | | |
| 12. | Stockholders’ Equity (Continued) | |
Share Repurchases
In January 2020, we announced a share repurchase program of up to $600 million of common stock. This program expired in January 2022. In January 2021, we announced an additional share repurchase program of up to $1.25 billion of common stock (the “2021 Share Repurchase Program”) that expired in January 2023. In October 2021, our Board of Directors approved a $250 million increase in the amount of common stock that could be repurchased under the 2021 Share Repurchase Program, resulting in a total authorization of $1.5 billion of common stock. In January 2022, we announced a share repurchase program of up to $1.25 billion of common stock that expired in January 2024.
In January 2024, we announced a new share repurchase program of up to $650 million of common stock (the “2024 Share Repurchase Program”). The program expires in February 2026. We had $402 million of capacity remaining under the 2024 Share Repurchase Program at December 31, 2024.
Under the above share repurchase programs, repurchases could occur from time to time and through a variety of methods, including open market repurchases, repurchases effected through Rule 10b5-1 trading plans, negotiated block purchases, accelerated share repurchase programs, tender offers, or other similar transactions. The timing and volume of any repurchases are subject to market conditions, and there can be no guarantee that the Company will repurchase up to the limit of the 2024 Share Repurchase Program.
Share Repurchases under our Rule 10b5-1 Trading Plans
During the years ended December 31, 2024, 2023, and 2022, we repurchased 12 million, 22 million, and 40 million shares, respectively, of our common stock at a total cost of $250 million, $349 million, and $708 million, respectively, under Rule 10b5-1 trading plans authorized under our share repurchase programs.
The following table summarizes our common share repurchases and issuances associated with these programs.
| | | | | | | | | | | | | | | | | | | | |
Years Ended December 31,
(shares and per share amounts in actuals) | | 2024 | | 2023 | | 2022 |
Common stock repurchased under repurchase programs(1) | | 11,586,103 | | | 22,341,595 | | | 40,253,548 | |
Average purchase price per share(2) | | $ | 21.59 | | | $ | 15.64 | | | $ | 17.58 | |
Shares repurchased related to employee stock-based compensation plans(3) | | 749,866 | | | 1,099,241 | | | 1,135,509 | |
| Average purchase price per share | | $ | 20.19 | | | $ | 15.46 | | | $ | 18.36 | |
Common shares issued(4) | | 2,374,379 | | | 3,109,276 | | | 3,107,768 | |
(1) Common shares purchased under our share repurchase programs. There was $402 million of capacity remaining under the 2024 Share Repurchase Program at December 31, 2024.
(2) Average purchase price per share includes purchase commission costs and excise taxes.
(3) Comprised of shares withheld from stock option exercises and the vesting of restricted stock, restricted stock units, performance stock units, and dividend equivalent units for employees’ tax withholding obligations and shares tendered by employees to satisfy option exercise costs.
(4) Common shares issued under our various compensation and benefit plans.
The closing price of our common stock on the NASDAQ Global Select Market on December 31, 2024 was $27.58.
F-60 SLM CORPORATION — 2024 Form 10-K
13. Earnings per Common Share
Basic earnings per common share (“EPS”) are calculated using the weighted average number of shares of common stock outstanding during each period. A reconciliation of the numerators and denominators of the basic and diluted EPS calculations follows.
| | | | | | | | | | | | | | | | | | | | |
| Years ended December 31, (dollars in thousands, except per share data) | | 2024 | | 2023 | | 2022 |
| Numerator: | | | | | | |
| Net income | | $ | 608,325 | | | $ | 581,391 | | | $ | 469,014 | |
| Preferred stock dividends | | 18,296 | | | 17,705 | | | 9,029 | |
| Net income attributable to SLM Corporation common stock | | $ | 590,029 | | | $ | 563,686 | | | $ | 459,985 | |
| Denominator: | | | | | | |
| Weighted average shares used to compute basic EPS | | 216,220 | | | 231,411 | | | 258,439 | |
| Effect of dilutive securities: | | | | | | |
Dilutive effect of stock options, restricted stock, restricted stock units, performance stock units, and Employee Stock Purchase Plan (“ESPP”) (1)(2) | | 3,714 | | | 2,652 | | | 3,064 | |
| Weighted average shares used to compute diluted EPS | | 219,934 | | | 234,063 | | | 261,503 | |
| | | | | | |
| Basic earnings per common share | | $ | 2.73 | | | $ | 2.44 | | | $ | 1.78 | |
| | | | | | |
| Diluted earnings per common share | | $ | 2.68 | | | $ | 2.41 | | | $ | 1.76 | |
(1) Includes the potential dilutive effect of additional common shares that are issuable upon exercise of outstanding stock options, restricted stock, restricted stock units, performance stock units, and the outstanding commitment to issue shares under the ESPP, determined by the treasury stock method.
(2) For the years ended December 31, 2024, 2023, and 2022, securities covering approximately less than 1 million shares, 1 million shares, and 1 million shares, respectively, were outstanding but not included in the computation of diluted earnings per share because they were anti-dilutive.
2024 Form 10-K — SLM CORPORATION F-61
14. Stock-Based Compensation Plans and Arrangements
Plan Summaries
As of December 31, 2024, we had one active stock-based compensation plan that provides for grants of equity awards to our employees and non-employee directors.
The SLM Corporation 2021 Omnibus Incentive Plan was approved by shareholders on June 8, 2021, and at December 31, 2024, 14 million shares were authorized to be issued from this plan.
We also maintain an Employee Stock Purchase Plan (the “ESPP”). The number of shares authorized under the plan at December 31, 2024 was 14 million shares.
Shares issued under these stock-based compensation plans may be either shares reacquired by us or shares that are authorized but unissued.
Stock-Based Compensation
The total stock-based compensation cost recognized in the consolidated statements of income for the years ended December 31, 2024, 2023, and 2022 was $40 million, $36 million, and $34 million, respectively. As of December 31, 2024, there was $23 million of total unrecognized compensation expense related to unvested restricted stock awards, restricted stock units, performance stock units, and ESPP awards, which is expected to be recognized over a weighted average period of 1.5 years. We amortize compensation expense on a straight-line basis over the related vesting periods of each tranche of each award.
Stock Options
There were 86,536 time-vested options granted in the year ended December 31, 2022. The options were granted to team members of an acquisition that took place in the first half of the year in 2022. The exercise price of the options is equal to 100 percent of the fair market value of a share of our common stock as of the grant date. The options will vest 100 percent on the third anniversary of the respective grant date and expire ten years after the respective grant date. The fair value of each stock option grant was estimated on the date of grant using a Black-Scholes option pricing model. The expected volatility of our common stock at the date of grant is estimated based on a historic volatility rate and the expected option life is calculated based on historical stock option experience as the best estimate of future exercise patterns. The dividend yield assumption is based on historical and anticipated dividend payouts. The risk-free interest rate assumption is based on observed interest rates consistent with the expected life of each stock option grant.
There were no stock options granted in the years ended December 31, 2023 and 2024.
F-62 SLM CORPORATION — 2024 Form 10-K
| | | | | | | | |
| 14. | Stock-Based Compensation Plans and Arrangements (Continued) | |
The following table summarizes stock option activity for the year ended December 31, 2024.
| | | | | | | | | | | | | | | | | | | | | | | |
| (Dollars in thousands, shares and per share amounts in actuals) | Number of
Options | | Weighted
Average
Exercise
Price per
Share | | Weighted
Average
Remaining
Contractual
Term | | Aggregate Intrinsic Value(1) |
| Outstanding at December 31, 2023 | 1,066,197 | | | $ | 17.59 | | | | | |
| Granted | — | | | — | | | | | |
Exercised(2)(3) | (65,668) | | | 17.65 | | | | | |
| Canceled | — | | | — | | | | | |
Outstanding at December 31, 2024(4) | 1,000,529 | | | $ | 17.59 | | | 6.2 years | | $ | 9,997 | |
| Exercisable at December 31, 2024 | 933,223 | | | $ | 17.65 | | | 6.1 years | | $ | 9,267 | |
(1)The aggregate intrinsic value represents the total intrinsic value (the aggregate difference between our closing stock price on December 31, 2024 and the exercise price of in-the-money options) that would have been received by the option holders if all in-the-money options had been exercised on December 31, 2024.
(2)The total intrinsic value of the options exercised was $0.3 million for the year ended December 31, 2024. No options were exercised in the years ended December 31, 2023 and 2022.
(3)Cash of $1 million was received from option exercises for the year ended December 31, 2024. The actual tax benefit realized for the tax deductions from option exercises totaled less than $1 million for the year ended December 31, 2024.
(4)For net-settled options, gross number is reflected.
Restricted Stock
Restricted stock awards generally vest over one year. Outstanding restricted stock is entitled to dividend equivalent units that vest subject to the same vesting requirements or lapse of transfer restrictions, as applicable, as the underlying restricted stock award. The fair value of restricted stock awards is based on our stock price at the grant date.
The following table summarizes restricted stock activity for the year ended December 31, 2024.
| | | | | | | | | | | |
| (Shares and per share amounts in actuals) | Number of
Shares | | Weighted
Average Grant
Date
Fair Value |
| Non-vested at December 31, 2023 | 83,479 | | | $ | 16.47 | |
| Granted | 77,759 | | | 20.51 | |
Vested(1) | (83,479) | | | 16.47 | |
| Canceled | (7,069) | | | 20.51 | |
Non-vested at December 31, 2024(2) | 70,690 | | | $ | 20.51 | |
(1)The total fair value of shares that vested during the years ended December 31, 2024, 2023, and 2022 was $1 million, $1 million, and $1 million, respectively.
(2)As of December 31, 2024, there was $0.7 million of unrecognized compensation cost related to restricted stock, which is expected to be recognized over a weighted average period of 0.5 years.
2024 Form 10-K — SLM CORPORATION F-63
| | | | | | | | |
| 14. | Stock-Based Compensation Plans and Arrangements (Continued) | |
Restricted Stock Units and Performance Stock Units
Restricted stock units (“RSUs”) and performance stock units (“PSUs”) are equity awards granted to employees that entitle the holder to shares of our common stock when the award vests. RSUs may be time-vested over three years or vested at grant but subject to transfer restrictions, while PSUs vest based on corporate performance targets at the end of a three-year period.
Outstanding RSUs and PSUs are entitled to dividend equivalent units that vest subject to the same vesting requirements or lapse of transfer restrictions, as applicable, as the underlying award. The fair value of RSUs is based on our stock price at the grant date. The fair value of each PSU grant was estimated on the date of grant using the Monte Carlo simulation-pricing model.
The following table summarizes RSU and PSU activity for the year ended December 31, 2024.
| | | | | | | | | | | |
| (Shares and per share amounts in actuals) | Number of
RSUs/
PSUs | | Weighted
Average Grant
Date
Fair Value |
| Outstanding at December 31, 2023 | 4,346,994 | | | $ | 16.39 | |
| Granted | 2,061,763 | | | 20.22 | |
Vested and converted to common stock(1) | (1,932,557) | | | 16.39 | |
| Canceled | (38,019) | | | 18.25 | |
Outstanding at December 31, 2024(2) | 4,438,181 | | | $ | 18.16 | |
(1)The total fair value of RSUs/PSUs that vested and converted to common stock during the years ended December 31, 2024, 2023, and 2022 was $32 million, $35 million, and $34 million, respectively.
(2)As of December 31, 2024, there was $22 million of unrecognized compensation cost related to RSUs/PSUs, which is expected to be recognized over a weighted average period of 1.5 years.
Employee Stock Purchase Plan
Employees may purchase shares of our common stock at the end of a 12-month offering period at a price equal to the share price at the beginning of the 12-month period, less 15 percent, up to a maximum purchase price of $7,500 (whole dollars). The purchase price for each offering is determined at the beginning of the offering period on August 1.
The fair values of the stock purchase rights of the ESPP offerings were calculated using a Black-Scholes option pricing model with the following weighted average assumptions:
| | | | | | | | | | | | | | | | | |
| Years ended December 31, (per share amounts in actuals) | 2024 | | 2023 | | 2022 |
| Risk-free interest rate | 4.56 | % | | 5.31 | % | | 3.02 | % |
| Expected volatility | 27 | % | | 38 | % | | 39 | % |
| Expected dividend rate | 1.99 | % | | 2.73 | % | | 2.78 | % |
| Expected life of the option | 1 year | | 1 year | | 1 year |
| Weighted average fair value of stock purchase rights | $ | 5.07 | | | $ | 4.14 | | | $ | 4.17 | |
The expected volatility is based on implied volatility from publicly-traded options on our stock at the grant date and historical volatility of our stock consistent with the expected life. The risk-free interest rate is based on the zero-coupon U.S. Treasury STRIPS rate at the grant date consistent with the expected life.
The fair values were amortized to compensation cost on a straight-line basis over a one-year vesting period. As of December 31, 2024, there was less than $1 million of unrecognized compensation cost related to the ESPP, which is expected to be recognized by July 2025.
F-64 SLM CORPORATION — 2024 Form 10-K
| | | | | | | | |
| 14. | Stock-Based Compensation Plans and Arrangements (Continued) | |
During the years ended December 31, 2023 and 2024, plan participants purchased approximately 195,000 shares and 227,000 shares, respectively, of our common stock. No shares were purchased for the year ended December 31, 2022, as our stock price on July 31, 2022 was less than the offering price for the ESPP plan.
15. Fair Value Measurements
We use estimates of fair value in applying various accounting standards for the consolidated financial statements.
We categorize our fair value estimates based on a hierarchical framework associated with three levels of price transparency utilized in measuring financial instruments at fair value. For additional information regarding our policies for determining fair value and the hierarchical framework, see Note 2, “Significant Accounting Policies — Fair Value Measurement” in this Form 10-K.
The following table summarizes the valuation of our financial instruments that are marked-to-fair value on a recurring basis.
| | | | | | | | | | | | | | | | | | | | | | | | | | | | | | | | | | | | | | | | | | | | | | | | | | |
| | | Fair Value Measurements on a Recurring Basis |
| | | 2024 | | 2023 |
As of December 31,
(dollars in thousands) | | Level 1 | | Level 2 | | Level 3 | | Total | | Level 1 | | Level 2 | | Level 3 | | Total |
| Assets: | | | | | | | | | | | | | | | | |
| | | | | | | | | | | | | | | | |
| Trading investments | | $ | — | | | $ | — | | | $ | 53,262 | | | $ | 53,262 | | | $ | — | | | $ | — | | | $ | 54,481 | | | $ | 54,481 | |
| Available-for-sale investments | | — | | | 1,930,537 | | | 2,689 | | | 1,933,226 | | | — | | | 2,411,622 | | | — | | | 2,411,622 | |
| Derivative instruments | | — | | | — | | | — | | | — | | | — | | | — | | | — | | | — | |
| Total | | $ | — | | | $ | 1,930,537 | | | $ | 55,951 | | | $ | 1,986,488 | | | $ | — | | | $ | 2,411,622 | | | $ | 54,481 | | | $ | 2,466,103 | |
| | | | | | | | | | | | | | | | |
| Liabilities: | | | | | | | | | | | | | | | | |
| Derivative instruments | | $ | — | | | $ | (40) | | | $ | — | | | $ | (40) | | | $ | — | | | $ | (370) | | | $ | — | | | $ | (370) | |
| Total | | $ | — | | | $ | (40) | | | $ | — | | | $ | (40) | | | $ | — | | | $ | (370) | | | $ | — | | | $ | (370) | |
2024 Form 10-K — SLM CORPORATION F-65
| | | | | | | | |
| 15. | Fair Value Measurements (Continued) | |
The following table summarizes the change in balance sheet carrying value associated with level 3 financial instruments carried at fair value on a recurring basis.
| | | | | | | | | | | | | | | | | | | | | | | | | | | | | | | | | | | | | | |
| | 2024 | | 2023 |
| | Investments | | Investments |
Years ended December 31,
(dollars in thousands) | | Available For Sale -
Debt Securities | | Trading - Residual Interests | | Total | | Available For Sale -
Debt Securities | | Trading - Residual Interests | | Total |
| Balance, beginning of period | | $ | — | | | $ | 54,481 | | | $ | 54,481 | | | $ | — | | | $ | 50,786 | | | $ | 50,786 | |
| Total gains/(losses): | | | | | | | | | | | | |
Included in earnings (or changes in net assets)(1) | | 20 | | | 478 | | | 498 | | | — | | | 2,721 | | | 2,721 | |
| Included in other comprehensive income | | 80 | | | — | | | 80 | | | — | | | — | | | — | |
| Settlements | | 2,589 | | | (1,697) | | | 892 | | | — | | | 974 | | | 974 | |
| Transfers into level 3 | | — | | | — | | | — | | | — | | | — | | | — | |
| Transfers out of level 3 | | — | | | — | | | — | | | — | | | — | | | — | |
| Balance, end of period | | $ | 2,689 | | | $ | 53,262 | | | $ | 55,951 | | | $ | — | | | $ | 54,481 | | | $ | 54,481 | |
| | | | | | | | | | | | |
| Change in unrealized gains (losses) for the period included in other comprehensive income for assets held at the end of the reporting period | | $ | 80 | | | $ | — | | | $ | 80 | | | $ | — | | | $ | — | | | $ | — | |
Change in unrealized gains (losses) for the period included in earnings (or changes in net assets) for assets held at the end of the reporting period(2) | | $ | — | | | $ | 478 | | | $ | 478 | | | $ | — | | | $ | 2,721 | | | $ | 2,721 | |
(1) Included in earnings (or changes in net assets) is comprised of the amounts recorded in the specified line item in the consolidated statements of income:
| | | | | | | | | | | | | | |
Years Ended December 31,
(dollars in thousands) | | |
| 2024 | | 2023 |
| Interest Income - Investments | | $ | 20 | | | $ | — | |
| Gains (losses) on securities, net | | 478 | | | 2,721 | |
| Total | | $ | 498 | | | $ | 2,721 | |
(2) Recorded in "gains (losses) on securities, net" in the consolidated statements of income.
The following table presents the significant unobservable inputs used in the recurring valuations of the level 3 financial instruments detailed above.
| | | | | | | | | | | | | | | | | | | | | | | | | | |
As of December 31, 2024
(dollars in thousands) | | Fair Value | | Valuation Technique | | Unobservable Input | | Range (Average) |
| Debt Securities | | $ | 2,689 | | | Discounted cash flow | | Constant Prepayment Rate | | 6.9%-11.0% (8.3%) |
| | | | | | Probability of default | | 4.0%-17.0% (11.5%) |
| Residual Interests | | 53,262 | | | Discounted cash flow | | Constant Prepayment Rate | | 6.9%-11.0% (8.3%) |
| | | | | | Probability of default | | 4.0%-17.0% (11.5%) |
| Total | | $ | 55,951 | | | | | | | |
The significant inputs detailed in the above table would be expected to have the following impacts to the valuations:
•A decrease in CPR would result in a longer weighted average life of the trust, resulting in a decrease to the valuation due to the delay in residual cash flows with the increased term. The opposite is true for an increase in the CPR.
•A decrease in the probability of defaults means increased principal receipts, resulting in an increase to the valuation due to the increase in residual cash flow.
F-66 SLM CORPORATION — 2024 Form 10-K
| | | | | | | | |
| 15. | Fair Value Measurements (Continued) | |
•Conversely, an increase in the probability of defaults means decreased principal receipts, resulting in a decrease to the valuation due to the decrease in residual cash flow.
The following table summarizes the fair values of our financial assets and liabilities, including derivative financial instruments.
| | | | | | | | | | | | | | | | | | | | | | | | | | | | | | | | | | | | | | |
As of December 31,
(dollars in thousands) | | 2024 | | 2023 |
| Fair
Value | | Carrying
Value | | Difference | | Fair
Value | | Carrying
Value | | Difference |
| Earning assets: | | | | | | | | | | | | |
| Loans held for investment, net: | | | | | | | | | | | | |
| Private Education Loans | | $ | 24,110,381 | | | $ | 20,902,158 | | | $ | 3,208,223 | | | $ | 22,229,045 | | | $ | 19,772,293 | | | $ | 2,456,752 | |
| FFELP Loans | | — | | | — | | | — | | | 542,775 | | | 534,064 | | | 8,711 | |
| | | | | | | | | | | | |
| | | | | | | | | | | | |
| Cash and cash equivalents | | 4,700,366 | | | 4,700,366 | | | — | | | 4,149,838 | | | 4,149,838 | | | — | |
| Trading investments | | 53,262 | | | 53,262 | | | — | | | 54,481 | | | 54,481 | | | — | |
| Available-for-sale investments | | 1,933,226 | | | 1,933,226 | | | — | | | 2,411,622 | | | 2,411,622 | | | — | |
| Accrued interest receivable | | 1,663,474 | | | 1,546,590 | | | 116,884 | | | 1,448,766 | | | 1,379,904 | | | 68,862 | |
| | | | | | | | | | | | |
| Derivative instruments | | — | | | — | | | — | | | — | | | — | | | — | |
| Total earning assets | | $ | 32,460,709 | | | $ | 29,135,602 | | | $ | 3,325,107 | | | $ | 30,836,527 | | | $ | 28,302,202 | | | $ | 2,534,325 | |
| Interest-bearing liabilities: | | | | | | | | | | | | |
| Money-market and savings accounts | | $ | 10,503,731 | | | $ | 10,526,324 | | | $ | 22,593 | | | $ | 11,134,883 | | | $ | 11,203,292 | | | $ | 68,409 | |
| Certificates of deposit | | 10,593,666 | | | 10,540,428 | | | (53,238) | | | 10,380,684 | | | 10,448,365 | | | 67,681 | |
| | | | | | | | | | | | |
| Long-term borrowings | | 6,323,384 | | | 6,440,345 | | | 116,961 | | | 4,873,690 | | | 5,227,512 | | | 353,822 | |
| Accrued interest payable | | 108,488 | | | 108,488 | | | — | | | 105,066 | | | 105,066 | | | — | |
| Derivative instruments | | 40 | | | 40 | | | — | | | 370 | | | 370 | | | — | |
| Total interest-bearing liabilities | | $ | 27,529,309 | | | $ | 27,615,625 | | | $ | 86,316 | | | $ | 26,494,693 | | | $ | 26,984,605 | | | $ | 489,912 | |
| | | | | | | | | | | | |
| Excess of net asset fair value over carrying value | | | | | | $ | 3,411,423 | | | | | | | $ | 3,024,237 | |
The methods and assumptions used to estimate the fair value of each class of financial instruments are as follows:
Cash and Cash Equivalents
Cash and cash equivalents are carried at cost. Carrying value approximated fair value for disclosure purposes. These are level 1 valuations.
Investments
Trading
Investments classified as trading are carried at fair value in the consolidated financial statements. Investments in residual class interests are valued using observable inputs in the cash flow modeling where available, but many significant inputs are unobservable. Residual interests are not exchange traded nor do they have quoted market prices, as they are unique and do not actively trade. As such, these are level 3 valuations.
Available-for-Sale
Investments classified as available-for-sale are carried at fair value in the consolidated financial statements. Investments in mortgage-backed securities, U.S. government-sponsored enterprises and Treasury securities, and Utah Housing Corporation bonds are valued using observable market prices of similar assets. As such, these are level 2 valuations. The fair value of most of our non-residual vertical risk retention investments is estimated using pricing indications obtained from the investment bankers who participate in the asset-backed securities market. As such, these
2024 Form 10-K — SLM CORPORATION F-67
| | | | | | | | |
| 15. | Fair Value Measurements (Continued) | |
are level 2 valuations. Where we are unable to obtain pricing indications for our non-residual vertical risk retention investments, we classify them as level 3 valuations.
Loans Held For Investment and Accrued Interest Receivable
Private Education Loans
For Private Education Loans, fair value was determined by using observable quoted prices for similar assets in our most recent market transactions. Adjustments were then made to account for the value of loans in our portfolio that have materially different characteristics than those included in the most recent market transaction. These are considered level 2 valuations. A portion of the fair value that has been modeled is attributable to accrued interest receivable that has not yet been capitalized, and has been allocated to the accrued interest receivable line item. The remaining accrued interest receivable that will not be capitalized into the principal balance of the loan is carried at cost.
FFELP Loans
During the third quarter of 2024, we transferred our FFELP Loan portfolio to loans held for sale as we planned to sell our FFELP Loan portfolio. At that time, we wrote down this loan portfolio to its estimated fair value through an adjustment to the allowance for credit losses of $8 million. We subsequently sold the FFELP Loan portfolio to a third party during the fourth quarter of 2024.
For FFELP Loans, the fair value was determined by modeling expected loan level cash flows using stated terms of the assets and internally developed assumptions to determine aggregate portfolio yield, net present value, and average life. The significant assumptions used to determine fair value are prepayment speeds, default rates, cost of funds, and required return on equity. Significant inputs into the model are not observable. However, we do calibrate the model based on market transactions when appropriate. As such, these are level 3 valuations.
Money Market and Savings Accounts
Some of our MMDAs are fixed-rate deposits that are subject to minimum balances for a specified period of time. The fair values of these deposits are estimated using discounted cash flows based on rates currently offered for deposits of similar maturities. These are level 2 valuations. The fair values of our remaining money market and savings accounts equal the amounts payable on demand at the balance sheet date and are reported at their carrying value. These are level 1 valuations.
Certificates of Deposit
The fair values of CDs are estimated using discounted cash flows based on rates currently offered for deposits of similar remaining maturities. These are level 2 valuations.
Accrued Interest Payable
Accrued interest payable is carried at cost. The carrying value approximates fair value due to its short-term nature. This is a level 1 valuation.
Borrowings
Borrowings are accounted for at cost in the consolidated financial statements. The carrying value of short-term borrowings approximated fair value for disclosure purposes, due to the short-term nature of those borrowings. This is a level 1 valuation. The fair value of long-term secured borrowings is estimated using pricing indications obtained from the investment bankers who participate in the asset-backed securities market. The fair value of our long-term unsecured borrowings is sourced from a third-party pricing service.These are level 2 valuations.
Derivatives
All derivatives are accounted for at fair value in the consolidated financial statements. The fair value of derivative financial instruments was determined by a standard derivative pricing and option model using the stated terms of the contracts and observable market inputs. It is our policy to compare the derivative fair values to those received from our counterparties in order to evaluate the model’s outputs.
When determining the fair value of derivatives, we take into account counterparty credit risk for positions where we are exposed to the counterparty on a net basis by assessing exposure net of collateral held. When the counterparty has exposure to us under derivative contracts with the Company, we fully collateralize the exposure (subject to certain thresholds).
F-68 SLM CORPORATION — 2024 Form 10-K
| | | | | | | | |
| 15. | Fair Value Measurements (Continued) | |
Interest rate swaps are valued using a standard derivative cash flow model with a SOFR swap yield curve, which is an observable input from an active market. These derivatives are level 2 fair value estimates in the hierarchy.
The carrying value of borrowings designated as the hedged item in a fair value hedge is adjusted for changes in fair value due to changes in the benchmark interest rate (SOFR). These valuations are determined through standard pricing models using the stated terms of the borrowings and observable yield curves.
16. Regulatory Capital
The Bank is subject to various regulatory capital requirements administered by the FDIC and the UDFI. Failure to meet minimum capital requirements can initiate certain mandatory and possibly additional discretionary actions by regulators that, if undertaken, could have a direct material adverse effect on our business, results of operations, and financial position. Under the FDIC’s regulations implementing the Basel III capital framework (“U.S. Basel III”) and the regulatory framework for prompt corrective action, the Bank must meet specific capital standards that involve quantitative measures of its assets, liabilities, and certain off-balance sheet items as calculated under regulatory accounting practices. The Bank’s capital amounts and its classification under the prompt corrective action framework are also subject to qualitative judgments by the regulators about components of capital, risk weightings, and other factors.
The Bank is subject to the following minimum capital ratios under U.S. Basel III: a Common Equity Tier 1 risk-based capital ratio of 4.5 percent, a Tier 1 risk-based capital ratio of 6.0 percent, a Total risk-based capital ratio of 8.0 percent, and a Tier 1 leverage ratio of 4.0 percent. In addition, the Bank is subject to a Common Equity Tier 1 capital conservation buffer of greater than 2.5 percent. Failure to maintain the buffer will result in restrictions on the Bank’s ability to make capital distributions, including the payment of dividends, and to pay discretionary bonuses to executive officers. Including the buffer, the Bank is required to maintain the following capital ratios under U.S. Basel III in order to avoid such restrictions: a Common Equity Tier 1 risk-based capital ratio of greater than 7.0 percent, a Tier 1 risk-based capital ratio of greater than 8.5 percent, and a Total risk-based capital ratio of greater than 10.5 percent.
To qualify as “well capitalized” under the prompt corrective action framework for insured depository institutions, the Bank must maintain a Common Equity Tier 1 risk-based capital ratio of at least 6.5 percent, a Tier 1 risk-based capital ratio of at least 8.0 percent, a Total risk-based capital ratio of at least 10.0 percent, and a Tier 1 leverage ratio of at least 5.0 percent.
In July 2023, the federal banking agencies proposed a rule to implement significant changes to the U.S. Basel III regulatory capital requirements. The proposed changes to the regulatory capital requirements generally would amend or introduce approaches and methodologies that would apply to banking organizations with total consolidated assets of $100 billion or more or to banking organizations with significant trading activity. The proposed rule therefore would not affect the Bank’s capital requirements or the calculation of its capital ratios.
Under regulations issued by the FDIC and other federal banking agencies, banking organizations that adopted CECL during the 2020 calendar year, including the Bank, could elect to delay for two years, and then phase in over the following three years, the effects on regulatory capital of CECL relative to the incurred loss methodology. The Bank elected to use this option. Therefore, the regulatory capital impact of the Bank’s transition adjustments recorded on January 1, 2020 from the adoption of CECL, and 25 percent of the ongoing impact of CECL on the Bank’s allowance for credit losses, retained earnings, and average total consolidated assets, each as reported for regulatory capital purposes (collectively, the “adjusted transition amounts”), were deferred for the two-year period ending January 1, 2022. On each of January 1 of 2022, 2023 and 2024, 25 percent of the adjusted transition amounts was phased in for regulatory capital purposes. On January 1, 2025, the remaining 25 percent of the adjusted transition amounts was phased in for regulatory capital purposes, with the phased-in amounts included in regulatory capital at the beginning of the year. The Bank’s January 1, 2020 CECL transition amounts increased our allowance for credit losses by $1.1 billion, increased the liability representing our off-balance sheet exposure for unfunded commitments by $116 million, and increased our deferred tax asset by $306 million, resulting in a cumulative effect adjustment that reduced retained earnings by $953 million. This transition adjustment was inclusive of qualitative adjustments incorporated into our CECL allowance as necessary, to address any limitations in the models used.
2024 Form 10-K — SLM CORPORATION F-69
| | | | | | | | |
| 16. | Regulatory Capital (Continued) | |
At December 31, 2024, the adjusted transition amounts that were deferred and are being phased in for regulatory capital purposes are as follows:
| | | | | | | | | | | | | | | | | | | | | | | | | | | | | | | | |
| | Adjusted Transition Amounts | | Phase-In
Amounts for the Year Ended | | Phase-In
Amounts for the Year Ended | | Phase-In
Amounts for the Year Ended | | Remaining Adjusted Transition Amounts to be Phased-In |
| (Dollars in thousands) | | December 31, 2021 | | December 31, 2022 | | December 31, 2023 | | December 31, 2024 | | December 31, 2024 |
| | | | | | | | | | |
| Retained earnings | | $ | 836,351 | | | $ | (209,088) | | | $ | (209,088) | | | $ | (209,088) | | | $ | 209,087 | |
| Allowance for credit losses | | 1,038,145 | | | (259,536) | | | (259,536) | | | (259,536) | | | 259,537 | |
| Liability for unfunded commitments | | 104,377 | | | (26,094) | | | (26,094) | | | (26,095) | | | 26,094 | |
| Deferred tax asset | | 306,171 | | | (76,542) | | | (76,542) | | | (76,543) | | | 76,544 | |
The Bank’s required and actual regulatory capital amounts and ratios, including applicable capital conservation buffers, under U.S. Basel III are shown in the following table. The following capital amounts and ratios are based upon the Bank’s average assets and risk-weighted assets, as indicated. The Bank has elected to exclude accumulated other comprehensive income related to both available-for-sale investments and swap valuations from Common Equity Tier 1 Capital. At December 31, 2024 and December 31, 2023, the unrealized loss on available-for-sale investments included in other comprehensive income totaled $83 million and $115 million, net of tax of $27 million and $37 million, respectively. The capital ratios would remain above the well capitalized thresholds, including applicable capital conservation buffers, if the unrealized loss became fully recognized into capital.
| | | | | | | | | | | | | | | | | | | | | | | |
| (Dollars in thousands) | | Actual | | U.S. Basel III Minimum Requirements Plus Buffer(1)(2) |
| | Amount | Ratio | | Amount | | Ratio |
As of December 31, 2024(3): | | | | | | | |
| Common Equity Tier 1 Capital (to Risk-Weighted Assets) | | $ | 2,957,067 | | 11.3 | % | | $ | 1,827,318 | | > | 7.0 | % |
| Tier 1 Capital (to Risk-Weighted Assets) | | $ | 2,957,067 | | 11.3 | % | | $ | 2,218,886 | | > | 8.5 | % |
| Total Capital (to Risk-Weighted Assets) | | $ | 3,294,663 | | 12.6 | % | | $ | 2,740,976 | | > | 10.5 | % |
| Tier 1 Capital (to Average Assets) | | $ | 2,957,067 | | 9.7 | % | | $ | 1,213,505 | | > | 4.0 | % |
| | | | | | | |
As of December 31, 2023(3): | | | | | | | |
| Common Equity Tier 1 Capital (to Risk-Weighted Assets) | | $ | 3,019,973 | | 12.3 | % | | $ | 1,719,621 | | > | 7.0 | % |
| Tier 1 Capital (to Risk-Weighted Assets) | | $ | 3,019,973 | | 12.3 | % | | $ | 2,088,111 | | > | 8.5 | % |
| Total Capital (to Risk-Weighted Assets) | | $ | 3,334,140 | | 13.6 | % | | $ | 2,579,432 | | > | 10.5 | % |
| Tier 1 Capital (to Average Assets) | | $ | 3,019,973 | | 10.2 | % | | $ | 1,184,213 | | > | 4.0 | % |
(1)Reflects the U.S. Basel III minimum required ratio plus the applicable capital conservation buffer.
(2)The Bank’s regulatory capital ratios also exceeded all applicable standards for the Bank to qualify as “well capitalized” under the prompt corrective action framework.
(3)For both December 31, 2024 and 2023, the actual amounts and the actual ratios include the respective adjusted transition amounts discussed above that were phased in at the beginning of 2024 and 2023.
Bank Dividends
The Bank is chartered under the laws of the State of Utah and its deposits are insured by the FDIC. The Bank’s ability to pay dividends is subject to the laws of Utah and the regulations of the FDIC. Generally, under Utah’s industrial bank laws and regulations as well as FDIC regulations, the Bank may pay dividends from its net profits without regulatory approval if, following the payment of the dividend, the Bank’s capital and surplus would not be impaired. The Company
F-70 SLM CORPORATION — 2024 Form 10-K
| | | | | | | | |
| 16. | Regulatory Capital (Continued) | |
relies on dividends from the Bank, as necessary, to enable the Company to pay any declared dividends and other payments and consummate share repurchases, as described herein. The Bank declared $570 million, $550 million, and $700 million in dividends to the Company for the years ended December 31, 2024, 2023, and 2022, respectively, with the proceeds primarily used to fund share repurchase programs and stock dividends. In the future, we expect that the Bank will pay dividends to the Company as may be necessary to enable the Company to pay any declared dividends on its Series B Preferred Stock and common stock and to consummate any common share repurchases by the Company under its repurchase programs.
17. Defined Contribution Plans
We participate in a defined contribution plan which is intended to qualify under section 401(k) of the Internal Revenue Code. The Sallie Mae 401(k) Savings Plan covers substantially all employees. After six months of service, we match 100 percent of the first five percent of contributions for eligible employees. For the years ended December 31, 2024, 2023, and 2022, we contributed $10 million, $8 million, and $7 million, respectively, to this plan.
18. Commitments, Contingencies, and Guarantees
Commitments
When we approve a Private Education Loan at the beginning of an academic year, that approval may cover the borrowing for the entire academic year. As such, we do not always disburse the full amount of the loan at the time of such approval, but instead have a commitment to fund a portion of the loan at a later date (usually at the start of the second semester or subsequent trimesters). We estimate expected credit losses over the contractual period that we are exposed to credit risk via a contractual obligation to extend credit, unless that obligation is unconditionally cancellable by us. At December 31, 2024, we had $2.3 billion of outstanding contractual loan commitments which we expect to fund during the remainder of the 2024/2025 academic year. At December 31, 2024, we had an $85 million reserve recorded in “Other Liabilities” to cover lifetime expected credit losses on the unfunded commitments. See Note 2,“Significant Accounting Policies — Allowance for Credit Losses — Off-Balance Sheet Exposure for Contractual Loan Commitments” and Note 6, “Allowance for Credit Losses and Unfunded Loan Commitments — Unfunded Loan Commitments” in this Form 10-K for additional information.
Contingencies
In the ordinary course of business, we and our subsidiaries are routinely defendants in or parties to pending and threatened legal actions and proceedings, including actions brought on behalf of various classes of claimants. These actions and proceedings may be based on alleged violations of consumer protection, securities, employment, and other laws. In certain of these actions and proceedings, claims for substantial monetary damage may be asserted against us and our subsidiaries.
It is common for the Company, our subsidiaries, and affiliates to receive information and document requests and investigative demands from state attorneys general, legislative committees, and administrative agencies. These requests may be for informational or regulatory purposes and may relate to our business practices, the industries in which we operate, or other companies with whom we conduct business. Our practice has been and continues to be to cooperate with these bodies and be responsive to any such requests.
We are required to establish reserves for litigation and regulatory matters where those matters present loss contingencies that are both probable and estimable. When loss contingencies are not both probable and estimable, we do not establish reserves.
2024 Form 10-K — SLM CORPORATION F-71
19. Income Taxes
Reconciliations of the statutory U.S. federal income tax rates to our effective tax rate for continuing operations follow:
| | | | | | | | | | | | | | | | | | | | |
| Years ended December 31, | | 2024 | | 2023 | | 2022 |
| Statutory rate | | 21.0 | % | | 21.0 | % | | 21.0 | % |
| | | | | | |
| State tax, net of federal benefit | | 2.3 | | | 3.8 | | | 4.1 | |
| Business credits | | (2.0) | | | (1.3) | | | (1.5) | |
| | | | | | |
| | | | | | |
| | | | | | |
| | | | | | |
| | | | | | |
| Other, net | | 2.5 | | | 1.8 | | | 2.0 | |
| Effective tax rate | | 23.8 | % | | 25.3 | % | | 25.6 | % |
The effective tax rate varies from the statutory U.S. federal rate of 21 percent primarily due to business tax credits and the impact of state taxes, net of federal benefit, for the years ended December 31, 2024, 2023, and 2022.
Income tax expense consists of:
| | | | | | | | | | | | | | | | | | | | |
As of December 31,
(dollars in thousands) | | 2024 | | 2023 | | 2022 |
| Current provision (benefit): | | | | | | |
| Federal | | $ | 181,132 | | | $ | 175,977 | | | $ | 205,954 | |
| State | | 43,506 | | | 44,152 | | | 49,427 | |
| | | | | | |
| Total current provision (benefit) | | 224,638 | | | 220,129 | | | 255,381 | |
| Deferred provision (benefit): | | | | | | |
| Federal | | (19,032) | | | (20,687) | | | (75,978) | |
| State | | (15,295) | | | (2,537) | | | (17,692) | |
| | | | | | |
| Total deferred provision (benefit) | | (34,327) | | | (23,224) | | | (93,670) | |
| Provision for income tax expense | | $ | 190,311 | | | $ | 196,905 | | | $ | 161,711 | |
F-72 SLM CORPORATION — 2024 Form 10-K
| | | | | | | | |
| 19. | Income Taxes (Continued) | |
The tax effect of temporary differences that give rise to deferred tax assets and liabilities is summarized below.
| | | | | | | | | | | | | | |
As of December 31,
(dollars in thousands) | | 2024 | | 2023 |
| Deferred tax assets: | | | | |
| Loan reserves | | $ | 376,029 | | | $ | 354,412 | |
| Net unrealized losses | | 21,209 | | | 24,176 | |
| Accrued expenses not currently deductible | | 19,841 | | | 16,297 | |
| Unrecorded tax benefits | | 12,008 | | | 11,568 | |
| Research and development costs | | 38,119 | | | 26,519 | |
| Stock-based compensation plans | | 12,885 | | | 10,847 | |
| | | | |
| Acquired intangible assets | | 16,394 | | | 14,536 | |
| Operating loss carryovers | | — | | | 26 | |
| | | | |
| | | | |
| | | | |
| | | | |
| Other | | 1,785 | | | 1,426 | |
| Total deferred tax assets | | 498,270 | | | 459,807 | |
| Deferred tax liabilities: | | | | |
| Student loan premiums and discounts, net | | 22,873 | | | 15,908 | |
| Fixed assets | | 7,708 | | | 8,533 | |
| Federal deferred for state receivable | | 1,908 | | | 1,171 | |
| | | | |
| | | | |
| | | | |
| | | | |
| Other | | 402 | | | 614 | |
| Total deferred tax liabilities | | 32,891 | | | 26,226 | |
| Net deferred tax assets | | $ | 465,379 | | | $ | 433,581 | |
Included in operating loss carryovers are state net operating losses of $234 million and $223 million as of December 31, 2024 and 2023, respectively. The Company has recorded a valuation allowance against these net operating losses of $234 million and $223 million, respectively. Also included in operating loss carryovers is a capital loss of $23 million and $18 million as of December 31, 2024 and 2023, respectively. The Company has recorded a full valuation allowance against this capital loss. The valuation allowance is primarily attributable to deferred tax assets for state net operating losses and capital losses that management believes are more likely than not to expire prior to being realized. Included in net unrealized losses is a valuation allowance of $5 million and $4 million, respectively.
The ultimate realization of the deferred tax assets is dependent upon the generation of future taxable income of the appropriate character (i.e., capital or ordinary) during the period in which the temporary differences become deductible. Management considers, among other things, the scheduled reversals of deferred tax liabilities and the history of positive taxable income in evaluating the realizability of the deferred tax assets. Management believes that it is more likely than not that the results of future operations will generate sufficient taxable income to realize our deferred tax assets (other than state net operating loss, net unrealized losses and capital loss carryovers as outlined above).
As of December 31, 2024, the state net operating loss carryforwards will begin to expire in 2029 and the capital losses will begin to expire in 2025.
2024 Form 10-K — SLM CORPORATION F-73
| | | | | | | | |
| 19. | Income Taxes (Continued) | |
Accounting for Uncertainty in Income Taxes
The following table summarizes changes in unrecognized tax benefits:
| | | | | | | | | | | | | | | | | | | | |
As of December 31,
(dollars in thousands) | | 2024 | | 2023 | | 2022 |
| Unrecognized tax benefits at beginning of year | | $ | 68,123 | | | $ | 79,366 | | | $ | 75,328 | |
| Increases resulting from tax positions taken during a prior period | | 1,232 | | | 1,204 | | | 6,049 | |
| Decreases resulting from tax positions taken during a prior period | | (1,890) | | | (250) | | | (1,327) | |
| Increases resulting from tax positions taken during the current period | | 3,218 | | | 2,711 | | | 11,032 | |
| Decreases related to settlements with taxing authorities | | (18,349) | | | (10,089) | | | (4,666) | |
| | | | | | |
| Reductions related to the lapse of statute of limitations | | (3,927) | | | (4,819) | | | (7,050) | |
| Unrecognized tax benefits at end of year | | $ | 48,407 | | | $ | 68,123 | | | $ | 79,366 | |
As of December 31, 2024, the gross unrecognized tax benefits are $48 million. Included in the $48 million are $39 million of unrecognized tax benefits that, if recognized, would favorably impact the effective tax rate.
Tax-related interest and penalty expense is reported as a component of income tax expense. As of December 31, 2024, 2023, and 2022, the total amount of income tax-related accrued interest and penalties, net of related benefit, recognized in the consolidated balance sheets was $11 million, $8 million, and $8 million, respectively.
For the years ended December 31, 2024, 2023, and 2022, the total amount of income tax-related accrued interest, net of related tax benefit, recognized in the consolidated statements of income was $3 million, $2 million, and $(2) million, respectively.
The Company or one of its subsidiaries files income tax returns at the U.S. federal level and in most U.S. states. U.S. federal income tax returns filed for years 2020 and prior are no longer subject to examination. Various combinations of subsidiaries, tax years, and jurisdictions remain open for review, subject to statute of limitations periods (typically three to four prior years). We do not expect the resolution of open audits to have a material impact on our unrecognized tax benefits.
It is reasonably possible that the uncertain tax position reserve may decrease by as much as $11 million during the next 12 months due to the expiration of statutes of limitations. The reduction in the uncertain tax position reserve would be reflected as a tax benefit.
F-74 SLM CORPORATION — 2024 Form 10-K
20. Concentrations of Risk
Our business is primarily focused on helping students and their families save, plan, and pay for college. We primarily originate, service, and/or collect loans made to students and their families to finance the cost of their education. We provide funding, delivery, and servicing support for education loans in the United States through our Private Education Loan program. Because of this concentration in one industry, we are exposed to a number of risks, including, but not limited to, credit, legislative/political/reputational, operational, regulatory, liquidity, capital, and interest rate risks associated with the student loan industry.
Concentration Risk in the Revenues Associated with Private Education Loans
We compete in the Private Education Loan market with banks and other consumer lending institutions, some with strong consumer brand name recognition and greater financial resources. We compete based on our products, origination capability, and customer service. To the extent our competitors compete aggressively or more effectively, we could lose market share to them or subject our existing loans to refinancing risk. Our product offerings may not prove to be profitable and may result in higher-than-expected losses.
We are a leading provider of saving- and paying-for-college products and programs. This concentration gives us a competitive advantage in the marketplace. This concentration also creates risks in our business, particularly in light of our concentration as a Private Education Loan lender. If population demographics result in a decrease in college-age individuals, if demand for higher education decreases, if the cost of attendance of higher education decreases, if consumers increase their targeted savings for higher education, if public resistance to higher education costs strengthens, if certain proposals for new federal and state spending on education gain broader appeal or momentum, or if the demand for higher education loans decreases, our consumer lending business could be negatively affected. In addition, the federal government, through the Federal Direct Student Loan Program (the “DSLP”), poses significant competition to our private credit loan products. If loan limits under the DSLP increase, DSLP loans could be more widely available to students and their families and DSLP loans could increase, resulting in further decreases in the size of the Private Education Loan market and demand for our Private Education Loan products. Also, competition from banks and other consumer lenders, many of whom may have a greater level of diversification in their mix of assets or may have lower return hurdles, could lead to decreases in demand for our Private Education Loan products.
Concentration Risk Associated with Deposit Products
Our ability to achieve our business goals, including funding our Private Education Loans, is heavily reliant on our ability to obtain deposits. We expect to compete for deposits based primarily on a combination of reputation, rate, and availability of information about our deposit products. Our competitors, many of whom have greater financial resources or lower costs than we do, may be more effective in attracting new deposits and retaining existing deposits such as by offering more competitive rates, dedicating more resources for advertising, or engaging in more effective forms of marketing.
At December 31, 2024, our brokered deposits represented 45 percent of our total deposits. Brokered deposits may be more price sensitive than other types of deposits and may become less available if alternative investments offer higher returns. In addition, our ability to maintain existing balances of all deposit types or obtain additional deposits of any type may be affected by factors, including those beyond our control, such as a rising stock market, more attractive returns on alternative investments, perceptions about our existing and future financial strength, quality of deposit servicing or online banking generally, changes in monetary or fiscal policies that influence deposit or other rates, general economic conditions, including high unemployment and decreased savings rates, and adverse developments in the financial services industry generally. Also, our ability to maintain our current level of deposits or grow our deposit base could be affected by regulatory restrictions, including the possible imposition by our regulators of prior approval requirements or restrictions on our offered rates, brokered deposit growth, or other areas.
2024 Form 10-K — SLM CORPORATION F-75
21. Parent Only Statements
The following parent company-only financial information should be read in conjunction with the other notes to the consolidated financial statements. The accounting policies for the parent company-only financial statements are the same as those used in the presentation of the consolidated financial statements, except that the parent company-only financial statements account for the parent company’s investments in its subsidiaries under the equity method.
| | | | | | | | | | | | | | |
| Parent Only Condensed Balance Sheets | | | | |
| At December 31, (dollars in thousands, except share and per share amounts) | | 2024 | | 2023 |
| Assets | | | | |
| Cash and cash equivalents | | $ | 391,481 | | | $ | 237,857 | |
| Total investments in subsidiaries (primarily Sallie Mae Bank) | | 2,773,211 | | | 2,628,838 | |
| | | | |
| | | | |
| Due from subsidiaries, net | | 43,556 | | | 63,679 | |
| Other assets | | 2,165 | | | 2,270 | |
| Total assets | | $ | 3,210,413 | | | $ | 2,932,644 | |
| | | | |
| Liabilities and Equity | | | | |
| Liabilities | | | | |
| | | | |
| Long-term borrowings | | $ | 995,420 | | | $ | 992,200 | |
| Income taxes payable, net | | 22,440 | | | 26,701 | |
| | | | |
| Other liabilities | | 32,633 | | | 32,946 | |
| Total liabilities | | 1,050,493 | | | 1,051,847 | |
| | | | |
| Equity | | | | |
| Preferred stock, par value $0.20 per share, 20 million shares authorized: | | | | |
| Series B: 2.5 million and 2.5 million shares issued, respectively, at stated value of $100 per share | | 251,070 | | | 251,070 | |
| Common stock, par value $0.20 per share, 1.125 billion shares authorized: 440.6 million and 438.2 million shares issued, respectively | | 88,121 | | | 87,647 | |
| Additional paid-in capital | | 1,193,753 | | | 1,148,689 | |
| Accumulated other comprehensive loss (net of tax benefit of $(21,209) and $(24,176), respectively) | | (65,861) | | | (75,104) | |
| Retained earnings | | 4,114,446 | | | 3,624,859 | |
| Total SLM Corporation stockholders’ equity before treasury stock | | 5,581,529 | | | 5,037,161 | |
| Less: Common stock held in treasury at cost: 230.2 million and 217.9 million shares, respectively | | (3,421,609) | | | (3,156,364) | |
| Total equity | | 2,159,920 | | | 1,880,797 | |
| Total liabilities and equity | | $ | 3,210,413 | | | $ | 2,932,644 | |
F-76 SLM CORPORATION — 2024 Form 10-K
| | | | | | | | |
| 21. | Parent Only Statements (Continued) | |
| | | | | | | | | | | | | | | | | | | | |
| Parent Only Condensed Statements of Income | | | | | | |
| Years ended December 31, (dollars in thousands) | | 2024 | | 2023 | | 2022 |
| Interest income | | $ | 11,660 | | | $ | 9,334 | | | $ | 4,084 | |
| Interest expense | | 39,855 | | | 39,850 | | | 39,860 | |
| Net interest loss | | (28,195) | | | (30,516) | | | (35,776) | |
| | | | | | |
| Non-interest income (loss) | | 114 | | | (2,701) | | | (5,117) | |
| Non-interest expenses | | 62,696 | | | 61,958 | | | 55,466 | |
| Loss before income tax benefit and equity in net income from subsidiaries | | (90,777) | | | (95,175) | | | (96,359) | |
| Income tax benefit | | (7,117) | | | (6,942) | | | (10,351) | |
| Equity in net income from subsidiaries (primarily Sallie Mae Bank) | | 691,985 | | | 669,624 | | | 555,022 | |
| Net income | | 608,325 | | | 581,391 | | | 469,014 | |
| Preferred stock dividends | | 18,296 | | | 17,705 | | | 9,029 | |
| Net income attributable to SLM Corporation common stock | | $ | 590,029 | | | $ | 563,686 | | | $ | 459,985 | |
2024 Form 10-K — SLM CORPORATION F-77
| | | | | | | | |
| 21. | Parent Only Statements (Continued) | |
| | | | | | | | | | | | | | | | | | | | |
| Parent Only Condensed Statement of Cash Flows | | | | | | |
| Years ended December 31, (dollars in thousands) | | 2024 | | 2023 | | 2022 |
| | | | | | |
| Cash flows from operating activities: | | | | | | |
| Net income | | $ | 608,325 | | | $ | 581,391 | | | $ | 469,014 | |
| Adjustments to reconcile net income to net cash provided by operating activities: | | | | | | |
| Undistributed earnings of subsidiaries | | (691,985) | | | (669,624) | | | (555,022) | |
| Dividends received from Sallie Mae Bank | | 569,500 | | | 550,000 | | | 699,500 | |
| Reduction of tax indemnification receivable | | — | | | 2,816 | | | 5,231 | |
| Amortization of unsecured debt upfront fees | | 2,647 | | | 2,643 | | | 2,651 | |
| Amortization of discount on unsecured borrowings | | 573 | | | 571 | | | 571 | |
| | | | | | |
| Acquisition related costs | | — | | | 952 | | | 2,603 | |
| | | | | | |
| (Increase) decrease in investment in subsidiaries, net | | 27,350 | | | 35,654 | | | (9,179) | |
| | | | | | |
| Decrease in due from subsidiaries, net | | 20,123 | | | 36,864 | | | 5,124 | |
| Increase in other assets | | (14,265) | | | (13,422) | | | (20,533) | |
| Increase (decrease) in income taxes payable, net | | (4,261) | | | 490 | | | (8,713) | |
| Decrease in payable due to entity that is a subsidiary of Navient | | — | | | — | | | (101) | |
| Increase (decrease) in other liabilities | | 1,053 | | | (3,442) | | | (1,836) | |
| Total adjustments | | (89,265) | | | (56,498) | | | 120,296 | |
| Net cash provided by operating activities | | 519,060 | | | 524,893 | | | 589,310 | |
| | | | | | |
| Cash flows from investing activities: | | | | | | |
| Purchase of subsidiary, net of cash acquired | | — | | | (14,654) | | | (127,654) | |
| | | | | | |
| Net cash used in investing activities | | — | | | (14,654) | | | (127,654) | |
| | | | | | |
| Cash flows from financing activities: | | | | | | |
| Issuance costs for unsecured debt offering | | — | | | — | | | (375) | |
| | | | | | |
| | | | | | |
| | | | | | |
| Common stock dividends paid | | (99,172) | | | (101,233) | | | (112,961) | |
| Preferred stock dividends paid | | (18,296) | | | (17,705) | | | (9,029) | |
| Common stock repurchased | | (247,968) | | | (350,264) | | | (713,197) | |
| Net cash used in financing activities | | (365,436) | | | (469,202) | | | (835,562) | |
| Net increase (decrease) in cash and cash equivalents | | 153,624 | | | 41,037 | | | (373,906) | |
| Cash and cash equivalents at beginning of year | | 237,857 | | | 196,820 | | | 570,726 | |
| Cash and cash equivalents at end of year | | $ | 391,481 | | | $ | 237,857 | | | $ | 196,820 | |
F-78 SLM CORPORATION — 2024 Form 10-K
22. Segment Reporting
The Company is managed as a single line of business with a single reportable segment originating and servicing high-quality Private Education Loans and providing other education-related services to customers. Our consolidated financial results are regularly reviewed by the Company’s Chief Executive Officer (the “CEO”) to allocate resources and evaluate financial performance.
The CEO evaluates the performance of the Company and decides how to allocate resources based on net income and total consolidated assets. The CEO uses net income to assess financial performance and to decide whether to re-invest profits into the Company or to return capital to shareholders in the form of dividends or the repurchase of common stock. Net income is also used to compare budget versus actual results, and the budget versus actual analysis is part of the segment financial performance review.
The following table illustrates the significant expense categories and amounts regularly provided to the CEO.
| | | | | | | | | | | | | | | | | | | | |
Years Ended December 31,
(dollars in thousands) | | 2024 | | 2023 | | 2022 |
| Non-interest expenses: | | | | | | |
| Compensation and benefits | | $ | 349,387 | | | $ | 326,554 | | | $ | 270,354 | |
| Professional fees | | 129,472 | | | 145,062 | | | 164,226 | |
| Technology expenses | | 57,431 | | | 54,942 | | | 48,561 | |
| FDIC assessment fees | | 51,606 | | | 45,766 | | | 20,939 | |
| Other operating expenses | | 48,674 | | | 46,882 | | | 47,382 | |
| Total operating expenses | | 636,570 | | | 619,206 | | | 551,462 | |
| Acquired intangible assets impairment and amortization expense | | 5,329 | | | 66,364 | | | 7,779 | |
| Total non-interest expenses | | $ | 641,899 | | | $ | 685,570 | | | $ | 559,241 | |
2024 Form 10-K — SLM CORPORATION F-79
23. Subsequent Events
Unsecured Debt
On January 31, 2025, we issued $500 million of 6.50 percent unsecured Senior Notes due January 31, 2030.
On February 18, 2025, we redeemed $500 million of the 4.20 percent unsecured Senior Notes due October 29, 2025. The Senior Notes were redeemed at 100 percent of their principal amount, plus the accrued and unpaid interest thereon through the redemption date. As a result of the redemption, we will recognize a loss of approximately $1 million on the transaction in the first-quarter 2025 consolidated statements of income.
2025 Loan Sales
On February 6, 2025, we sold approximately $2.0 billion of our Private Education Loans, including $1.8 billion in principal, $163 million in capitalized interest and $10 million in accrued interest, to an unaffiliated third party. The gain on sale of loans sold expressed as a percentage was in the high single-digits and will be recognized in the first-quarter 2025 consolidated statements of income. The transaction qualified for sale treatment and removed the balance of the loans from our balance sheet on the settlement date. We will continue to service these loans pursuant to the terms of the applicable transaction documents.
F-80 SLM CORPORATION — 2024 Form 10-K