Searchable text section of graphics shown above
[LOGO]
[GRAPHIC]
MAXIMUS QUARTERLY EARNINGS CALL
David N. Walker
Chief Financial Officer and Treasurer
2nd Quarter Fiscal 2006
May 4, 2006
Q2 FY06 Financial Highlights
• Revenue was $179.8 million
• An increase of 17% year-over-year
• Driven principally by Operations Segment
• Net income totaled $8.9 million or $0.41 per diluted share
• Compares to $8.5 million or $0.39 a share in the same quarter last year, after adjusting for FAS 123R
• Q2 EPS impacted by $0.02 for legal and settlement costs
• Net cash provided by operating activities totaled $11.4 million with free cash flow of $6.5 million
• Cash, cash equivalents, and marketable securities remained healthy at $175.1 million as of March 31, 2006
2
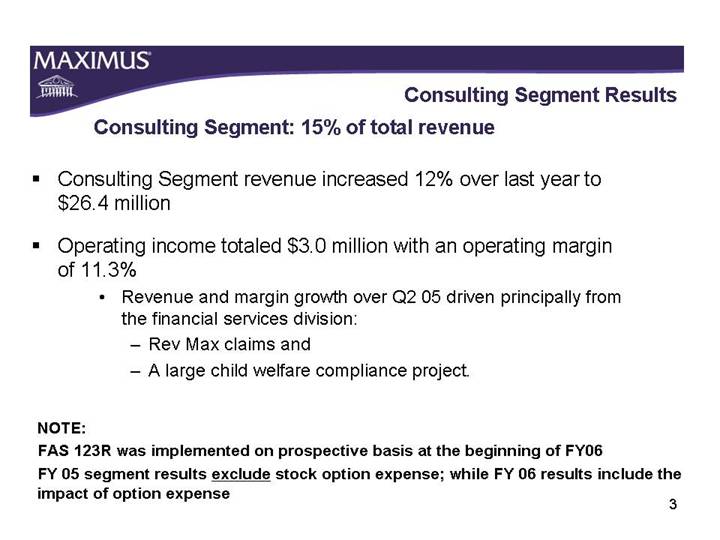
Consulting Segment Results
Consulting Segment: 15% of total revenue
• Consulting Segment revenue increased 12% over last year to $26.4 million
• Operating income totaled $3.0 million with an operating margin of 11.3%
• Revenue and margin growth over Q2 05 driven principally from the financial services division:
• Rev Max claims and
• A large child welfare compliance project.
NOTE:
FAS 123R was implemented on prospective basis at the beginning of FY06
FY 05 segment results exclude stock option expense; while FY 06 results include the impact of option expense
3
Systems Segment Results
Systems Segment: 18% of total revenue
• Systems Segment revenue $32.2 million which is comparable to last year
• Operating income just under $300,000
• Decline of $1.7 million compared to Q2 05
• Operating income decline largely the result of additional resources needed to fulfill contractual obligations on a large system implementation
• Follow-on phase to contract should return the Division to profitability in the second half of FY 06
4
Operations Segment Results
Operations Segment: 67% of total revenue
• Operations Segment grew 24% over Q2 05, revenue of $121.2 million
• Growth driven principally by:
• British Columbia health operations contract; launched in Q3 05
• $4.1 million hardware delivery on voter contract
• New work across the segment
• Operating income totaled $10.5 million with an 8.7% operating margin
• Operating margin declined compared to Q2 05 due to losses in B.C. and a $2.3 million loss in Texas
• Operating margin expansion over Q1 05 was driven by reduced losses and improvements on the B.C. project
• Expect B.C. project to turn the corner in FY07
• Current view - project will begin sustained profitable operations FY 07
5
Total Company - Expenses and Operating Margin
• Operating margin for Q2 was 7.6%
• Excluding legal and settlement; operating margin was 8%
• Year-over-year SG&A and operating margins were impacted in FY06 by FAS 123 (R), as FY 05 does not include option expense
• Total stock option expense in the Q2 06 of $1.3 million or $0.04 per diluted share
• If we expense options in Q2 05, option expense would have been $1.6 million or $0.05 per diluted share
6
Balance Sheet
| | Q205 | | Q305 | | YE &
Q405 | | Q106 | | Q206 | |
Billed A/R | | $ | 115.5 | | $ | 128.2 | | $ | 124.5 | | $ | 123.6 | | $ | 139.6 | |
Unbilled A/R | | $ | 48.1 | | $ | 44.7 | | $ | 43.7 | | $ | 47.2 | | $ | 46.2 | |
Total A/R | | $ | 163.6 | | $ | 172.9 | | $ | 168.3 | | $ | 170.8 | | $ | 185.8 | |
• A/R for Q2 totaled $185.8 million
• DSOs totaled 97 days
NOTE: The 97 days includes $5.4 million in long term A/R; classified within other assets on balance sheet
7
Cash Balance, Stock Repurchase, and
Cash Flow from Operations
| | Q205 | | Q305 | | Q405 | | FY 06 | | Q106 | | Q206 | |
Cash from Ops | | $ | 27.1 | | $ | 11.9 | | $ | 25.0 | | $ | 74.1 | | $ | 5.1 | | $ | 11.4 | |
FCF | | $ | 22.5 | | $ | 6.0 | | $ | 15.9 | | $ | 49.8 | | $ | (0.5 | ) | $ | 6.5 | |
• Cash from operations totaled $11.4 million with free cash flow of $6.5 million
• Cash, cash equivalents, and marketable securities of $175.1 million at March 31, 2006
• The company purchased 138,700 shares of common stock during Q2, with $24.4 million available under ongoing stock repurchase program
8
[LOGO]
[GRAPHIC]
MAXIMUS QUARTERLY EARNINGS CALL
Richard A. Montoni
President and Chief Executive Officer
2nd Quarter Fiscal 2006
May 4, 2006
Management Transition
• MAXIMUS remains strong and stable
• Above all a team-oriented company
• Overwhelming support received from large customers
• Change will not adversely impact project and field operations
• Morale is high and employee base is energized
10
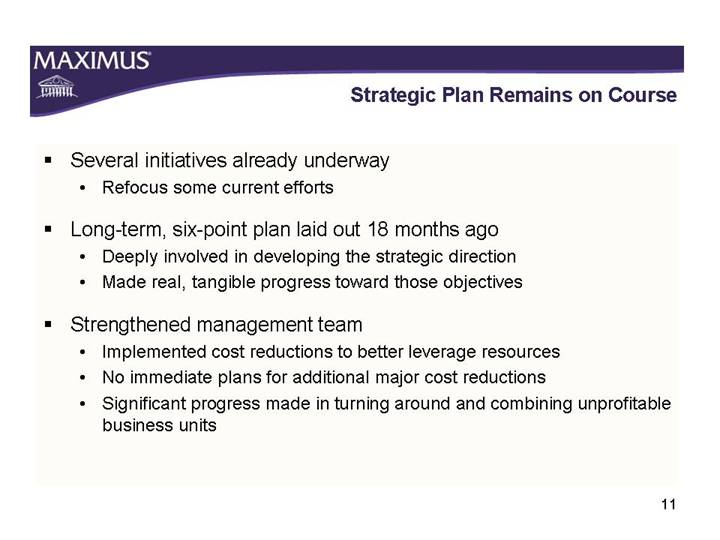
Strategic Plan Remains on Course
• Several initiatives already underway
• Refocus some current efforts
• Long-term, six-point plan laid out 18 months ago
• Deeply involved in developing the strategic direction
• Made real, tangible progress toward those objectives
• Strengthened management team
• Implemented cost reductions to better leverage resources
• No immediate plans for additional major cost reductions
• Significant progress made in turning around and combining unprofitable business units
11
New Approach to Business
• Committed to being the premier government services provider
• Quality can and will be improved
• Execute on current contracts and manage the risk in start-up implementations such as BC and TX
• Redirect the organization on winning more profitable business and increasing overall margin
• Not strictly emphasizing a volume-driven approach
• More selective in determining the opportunities
• Committed to margin expansion in current contracts and new business wins
• Critical component - how operations going forward are managed
12
MAXIMUS Leadership
• Recruit industry-leading talent that hit the ground running
• Taken ownership of long-term objectives
• More can be accomplished by further empowering the team
• Decision-making process and accountability must be driven downward
• Segment leaders will have necessary resources and decision-making latitude to increase efficiency and accelerate growth
• Need to be a more flexible, nimble organization
• Managers to take on more day-to-day decision making
13
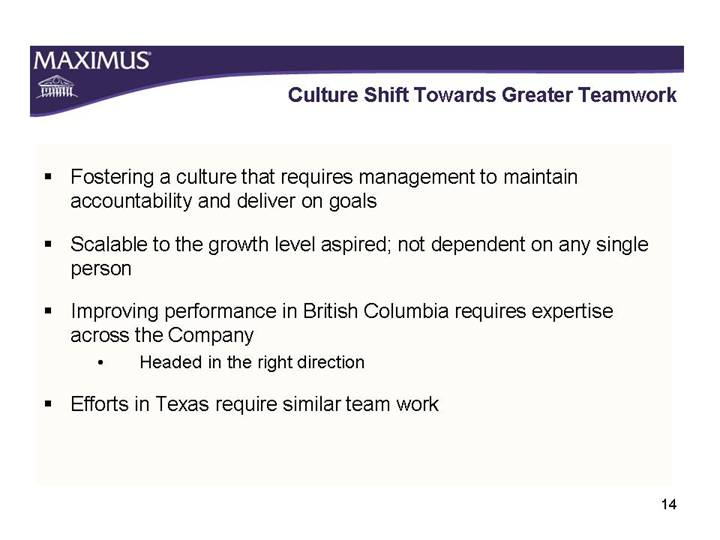
Culture Shift Towards Greater Teamwork
• Fostering a culture that requires management to maintain accountability and deliver on goals
• Scalable to the growth level aspired; not dependent on any single person
• Improving performance in British Columbia requires expertise across the Company
• Headed in the right direction
• Efforts in Texas require similar team work
14
British Columbia
• Significant progress made in turning around performance
• Service levels among the best on record for the Ministry
• Ministry quarterly report noted:
• Maintaining a record low document inventory level
• Processed public documents within required levels
• Answered phones from the public, within three minute call window
• Answered calls from doctors and pharmacists, within one-minute call window
• Aligning staffing levels and managing service delivery closer to economic model
15
Texas Integrated Eligibility Project
• Texas Health and Human Services Commission delayed integrated eligibility roll out
• Delay is a result of needed technical and operational improvements
• Systems development and interfacing
• Start-up readiness
• Financial implications not known today but dependent on finalization and agreement to revise scope and responsibilities
• Finalize and quantify in the next 30 days
16
Uses of Cash
• M&A activity: smaller, tuck-in acquisitions
• Divest certain businesses
• Facilitate margin improvement
• Business lines that no longer aligned with strategic objectives
• Reinvest in the business to upgrade technological capabilities
• More effectively scale service offerings
• Improve ability to roll knowledge from one project to the next
• Continue to pay a quarterly cash dividend of $0.10 per share
• Maintain an active share repurchase program
17
Re-bids
• 17 jobs up for re-bid in FY 06
• Have won or received extensions on 13
• Total value of $172 million
• To date, won $114 million
• FY 06 re-bid contract value totaled close to $32 million
• Secured $29 million, to date
• Largest re-bid decision expected end of FY 06
18
Options
• 14 option exercises outstanding
• Total contract value of $81 million
• Won six with a contract value of $48 million
• FY 06 impact totals $20 million and we’ve secured $17 million
• Eight remaining options
• Three totaling $21 million; awarded late 2006 with no impact to FY06
19
Summary Awards & Pipeline
| | Q2 FY05 | | Q2 FY06 | |
Signed | | $ | 628 | | $ | 292 | |
Awarded but Not Signed | | 452 | | 135 | |
Pipeline | | | | | |
Proposals Submitted | | 190 | | 494 | |
Proposals in Preparation | | 310 | | 144 | |
Major Opportunities Tracking | | 558 | | 682 | |
Total Pipeline | | $ | 1,058 | | $ | 1,321 | |
All dollar values in millions
20
Guidance
• Expect revenue in the range of $710-$725
• Revising full year EPS estimates
• $1.87 still achievable; reducing to more conservative levels
• Estimate diluted earning per share in the range of $1.80 - $1.87
• Revised forecast with several items in mind
• Texas
• Continued improvement in British Columbia
• License revenue and contingency-based work uncertainties
• Several accretive events can get us to $1.87
• Revised guidance is prudent and conservative
21
Conclusion
• Focused on key priorities
• Preserve MAXIMUS heritage but make meaningful changes
• Cultural shifts
• Better leverage talent
• More directed, focused, and accountable
• Empower leadership
• Re-evaluating uses of cash
• Optimizing current business
• Project and risk management
• Pricing
• Approach to business development
22


