325 John H. McConnell Boulevard, Suite 200, Columbus, Ohio 43215
James F. Laird, Jr., 325 John H. McConnell Boulevard, Suite 200, Columbus, Ohio 43215
Form N-CSR is to be used by management investment companies to file reports with the Commission not later than 10 days after the transmission to stockholders of any report that is required to be transmitted to stockholders under Rule 30e-1 under the Investment Company Act of 1940 (17 CFR 270.30e-1). The Commission may use the information provided on Form N-CSR in its regulatory, disclosure review, inspection and policymaking roles.
Item 1. Reports to Stockholders.
Table of Contents
| Letter to Shareholders | 1 |
| | |
| Mission Statement, Pledge, and Fundamental Principles | 4 |
| | |
| Financial Statements | |
| | |
| Schedules of Investments | 7 |
| | |
| Tabular Presentation of Schedule of Investments | 19 |
| | |
| Statements of Assets & Liabilities | 21 |
| | |
| Statements of Operations | 23 |
| | |
| Statements of Changes in Net Assets | 24 |
| | |
| Schedule of Capital Share Transactions | 26 |
| | |
| Financial Highlights | 28 |
| | |
| Notes to Financial Statements | 35 |
| | |
| Other Items | 42 |
| | |
| Schedule of Shareholder Expenses | 44 |
| | |
| Management of the Trust | 45 |
| | |
| Notice of Privacy Policy | 46 |
CAUTIONARY STATEMENT
At Diamond Hill, we pledge that, “we will communicate with our clients about our investment performance in a manner that will allow them to properly assess whether we are deserving of their trust.” Our views and opinions regarding the investment prospects of our portfolio holdings and Funds are “forward looking statements” which may or may not be accurate over the long term. While we believe we have a reasonable basis for our opinions, actual results may differ materially from those we anticipate. Information provided in this report should not be considered a recommendation to purchase or sell any particular security.
You can identify forward looking statements by words like “believe,” “expect,” “anticipate,” or similar expressions when discussing prospects for particular portfolio holdings and/or one of the Funds. We cannot assure future results. You should not place undue reliance on forward-looking statements, which speak only as of the date of this report. We disclaim any obligation to update or alter any forward-looking statements, whether as a result of new information, future events, or otherwise. This material is not authorized for distribution to prospective investors unless preceded or accompanied by a Prospectus. Please read the Prospectus carefully for a discussion of fees, expenses, and risks. Current performance may be lower or higher than that quoted herein. You may obtain a current copy of the Prospectus or more current performance information by calling 1-888-226-5595 or at Diamond Hill’s website (www.diamond-hill.com).
Letter to Shareholders
Dear fellow shareholder:
We are pleased to provide this 2009 mid-year update for the Diamond Hill Funds. Our focus remains on seeking out investment opportunities where the price-to-intrinsic value relationship provides an opportunity to earn an attractive rate of return while also providing a margin of safety.
Fund Performance and Markets
Following a dismal 2008, U.S. equity markets posted positive returns for the first six months of 2009 with the Russell 1000 and Russell 2000 Indices increasing 4.32% and 2.64%, respectively. The year began with a brief rally in January, as investors reacted positively to new policy initiatives and support for the ailing financial sector. However, the markets soon reflected pessimism that the policy changes would be insufficient and recognition that financial sector risk remained high. In addition, corporate earnings reports were not only worse than expected, but also the quality was low and guidance for 2009 earnings fell dramatically.
Initially driven by positive comments from financial giants Bank of America and JP Morgan Chase and from short covering, the market staged a second more significant rally in early March that continued into the second quarter of 2009. In general, the second quarter was a period of healing for financial markets around the globe. A transition from risk aversion to risk taking is a necessary precondition to a market recovery, and we had been monitoring the credit markets closely for signs that this shift was underway. The credit markets began to recover with the equity markets in early March and the progress continued unabated through the end of the second quarter. For the first half of the year, the Merrill Lynch US High Yield Master II Index returned 29.37% and the Merrill Lynch US Corporate Master Index returned 9.23%. As is typical, the market improvement began in anticipation of tangible signs of economic recovery, or at the very least, in the anticipation that the worst might be over. Following the recent rally, corporate profits will need to match forecasts to justify market valuations, and investors may continue to be wary of any signs of renewed crisis.
We were very pleased with the absolute and relative performance of our funds for periods ended June 30, 2009. Although the Diamond Hill Large Cap Fund lagged the Russell 1000 Index very slightly in the first six months of 2009, it remains solidly ahead of the Russell 1000 for longer time periods. All other Funds exceeded their respective benchmarks. We remain focused on long-term performance and committed to our investment philosophy, which is rooted in the belief that market price and intrinsic value tend to converge over a reasonable period of time.
Market Returns - 1970s and Today
As I have stated many times, I was very fortunate to get started in this business in 1982. The bull market, which began in August of that year and lasted until 2000, helped make it a wonderful period to be an equity investor. At the beginning of my career, I remember being surprised by the dismal equity returns of the previous periods. Equities were virtually flat for the 14 years ending in July of 1982, which is a very long period of time for so little progress to be made in the equity markets. This had several implications, but primarily an indifferent investor class and attractive valuations. Today’s investors seem more discouraged than indifferent, but I look back on that period for clues as to the opportunities available in the market today. On the surface, it might appear discouraging. If we are entering an extended period of flat market returns, equity opportunities would appear limited. However, the analogy I would like to draw is with the narrower time period of 1974-1982. While the 14 year period ending in 1982 was awful, the returns from the lows of 1974-75 were attractive. If March 2009 turns out to be the market low of this cycle, similar opportunities may be available today. If we were to apply the 1970s analogy, simple math indicates that investment opportunities could return to historical norms. To provide an example, let’s assume a 16 year period of a flat S&P 500. That sounds like an awful return but remember valuations were a lot higher in 2000. So if we assume the market does return to the peak levels of 2000 by the end of 2016, then the market appreciation from June 30, 2009 would be approximately 7% annually. Add in the dividend yield, and we would have a very normal return for the next 7 ½ years, in that scenario.
| |
| Diamond Hill Funds Semi-Annual Report June 30, 2009 | Page 1 |
Of course, simply doing the calculation does not mean that the market will return to those levels or that the 1970s analogy is even valid. However, in my opinion, if you examine the levels of earnings and valuations in the market today, normal rates of growth off normalized earnings could get you close to the level of earnings in the market in 2006-2007. If you put a normal multiple on those earnings, you could justify the market valuations we first reached in 2000. My estimates may be off by a year or two, but I believe the opportunity remains approximately the same. The way I see it, normal, but not outstanding, investment opportunities appear to be available in the equity markets.
Consumer Debt
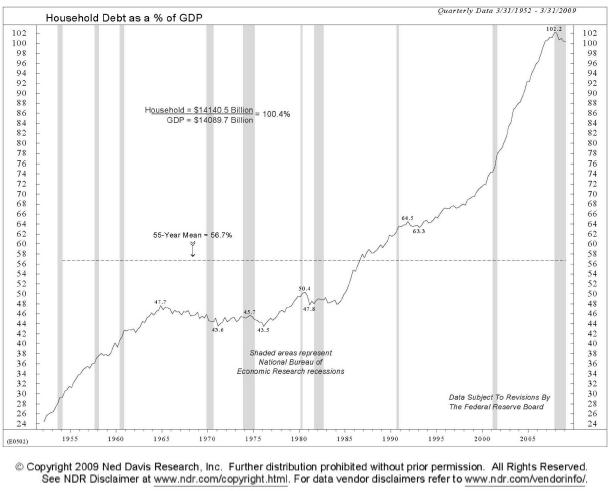
Within the equity markets, we remain concerned regarding the health of the American consumer and the effect the consumer will have on the economic recovery. This is an area of the U.S. economy that is facing serious secular issues. The past 25 years have been marked by occasional recessions and recoveries, driven by consumer spending. This consumer spending was driven, in large part, by increased borrowing against higher asset prices. Those assets are no longer appreciating, but the debt remains. Levels of consumer debt seem unsustainable, which is why I believe the market may be too optimistic regarding a U.S. recovery dependent on consumer spending. Below is a chart showing the rise in consumer debt relative to GDP. The increase in the last 30 years is amazing.
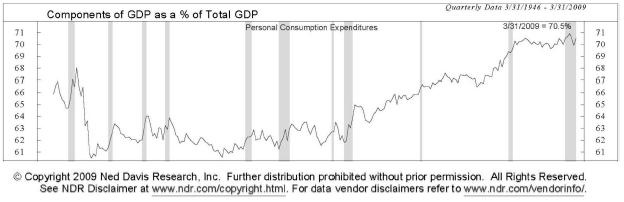
The next chart shows the growth of personal consumption expenditures as a percent of GDP. Note the steady rise over this period. Through much of the 1980s and early 1990s, this could be explained by the normal spending pattern of baby boomers, as they approached middle age. However, now the population is aging, and consumption should shrink from these high levels. While such a correction is normal, it will make it difficult for American consumers to drive future GDP growth.
| |
| Page 2 | Diamond Hill Funds Semi-Annual Report June 30, 2009 |
This letter is intended to provide an historic framework for our current environment, as well as a sober assessment of the opportunities. Market opportunities will be different in this environment, as the challenges facing the U.S. consumer are daunting. In my opinion, the good news is that valuations have adjusted, so going forward equity investors should have the opportunity for more normal returns for the next several years. As you would expect, that assessment is reflected in our portfolios.
Charles S. Bath, CFA
Managing Director - Investments
The views expressed are those of the portfolio manager as of June 30, 2009, are subject to change, and may differ from the views of other portfolio managers or the firm as a whole. These opinions are not intended to be a forecast of future events, a guarantee of future results, or investment advice. All data referenced are from sources deemed to be reliable but cannot be guaranteed. Securities and sectors referenced should not be construed as a solicitation or recommendation or be used as the sole basis for any investment decision.
The Russell 1000 Index measures the performance of the large-cap segment of the U.S. equity universe. It is a subset of the Russell 3000® Index and includes approximately 1,000 of the largest securities based on a combination of their market cap and current index membership. The Russell 1000 represents approximately 90% of the U.S. market.
The Russell 2000 Index measures the performance of the small-cap segment of the U.S. equity universe. The Russell 2000 Index is a subset of the Russell 3000® Index representing approximately 8% of the total market capitalization of that index. It includes approximately 2,000 of the smallest securities based on a combination of their market cap and current index membership.
Investors should consider the investment objectives, risks, and charges and expenses of the Diamond Hill Funds carefully before investing. This and other information about the Funds is in the prospectus, which can be obtained at www.diamond-hill.com or by calling 888-226-5595. Read the prospectus carefully before you invest. Diamond Hill Capital Management, Inc., a registered investment adviser, serves as Investment Adviser to the Diamond Hill Funds and is paid a fee for its services. The Diamond Hill Funds are distributed by BHIL Distributors, Inc. (Member FINRA), an affiliated company. Like all mutual funds, Diamond Hill Funds are not FDIC insured, may lose value, and have no bank guarantee.
| |
| Diamond Hill Funds Semi-Annual Report June 30, 2009 | Page 3 |
Mission Statement, Pledge
and Fundamental Principles
| Mission | The mission of Diamond Hill is to serve our clients through a disciplined intrinsic value-based approach to investing, while maintaining a long-term perspective, and aligning our interests with those of our clients. |
| | To successfully pursue our mission, we are: |
| | |
| | COMMITTED to the Graham-Buffett investment philosophy, with goals (over 5-year rolling periods) to outperform benchmarks and our peers, and achieve absolute returns sufficient for risk of asset class. DRIVEN by our conviction to create lasting value for clients and shareholders. MOTIVATED through ownership of Diamond Hill funds and company stock. |
| | |
Investment Philosophy | At Diamond Hill, the investment philosophy, which is rooted in the teachings of Benjamin Graham and the methods of Warren Buffett, drives the investment process — not the opposite. |
| | |
| | Most simply, we invest in a company when its market price is at a discount to our appraisal of the intrinsic value of the business (or at a premium for short positions). There are four guiding principles to our investment philosophy: |
| | ♦ | Treat every investment as a partial ownership interest in that company |
| | ♦ | Always invest with a margin of safety to ensure the protection of capital as well as return on capital |
| | ♦ | Possess a long-term investment temperament |
| | | |
| | ♦ | Recognize that market price and intrinsic value tend to converge over a reasonable period of time |
“Investment is most intelligent when it is most businesslike.”
| Pledge | Consistent with our mission & investment philosophy, we pledge the following to all of our clients: |
| | Our investment discipline is to assess the economics of the underlying business, its management, and the price that must be paid to own a piece of it. We seek to concentrate our investments in businesses that are available at prices below intrinsic value (above intrinsic value for short positions) and are managed or controlled by trustworthy and capable people. Benjamin Graham pioneered this discipline during the 1930s and many others have practiced it with great success ever since, most notably Warren Buffett. |
| | We will communicate with our clients about our investment performance in a manner that will allow them to properly assess whether we are deserving of their trust. |
| | Our investment team will be comprised of people with integrity, sound experience and education, in combination with a strong work ethic and independence of thought. Especially important is that each possesses the highest level of character, business ethics and professionalism. |
| |
| Page 4 | Diamond Hill Funds Semi-Annual Report June 30, 2009 |
| | Our employees will enjoy a working environment that supports professional and personal growth, thereby enhancing employee satisfaction, the productivity of the firm and the experience of our clients. |
| | “Invest With Us” means we will invest the capital you entrust to us with the same care that we invest our own capital. To this end, Diamond Hill employees and affiliates are significant investors in the same portfolios in which our clients invest and are collectively the largest shareholders in the Diamond Hill Funds. In addition, all Diamond Hill employees are subject to a Code of Ethics, which states that all personal investments must be made in a Diamond Hill fund, unless approved by our Chief Compliance Officer. |
| | |
Our fundamental investment principles | Valuation |
| | Every share of stock has an intrinsic value that is independent of its current stock market price. |
| | At any point in time, the stock market price may be either significantly higher or lower than intrinsic value. |
| | Over short periods of time, as evidenced by extreme stock market volatility, the stock market price is heavily influenced by the emotions of market participants, which are far more difficult to predict than intrinsic value. While stock market prices may experience extreme fluctuations on a particular day, we believe intrinsic value is far less volatile. |
| | Over sufficiently long periods of time, five years and longer, the stock market price tends to converge with intrinsic value. |
| | Calculating Intrinsic Value Estimate |
| | We believe that we can determine a reasonable approximation of that intrinsic value in some cases. |
| | That value can be determined if we have a reasonable basis for projecting the future cash flows of a business and use an appropriate discount rate. |
| | In estimating intrinsic value, we use an interdisciplinary approach. Not only do we perform financial modeling including discounted cash flow, private market value, and leveraged buyout analyses, we draw from other areas we believe are relevant to our investment decision-making. These include economics, statistics and probability theory, politics, psychology, and consumer behavior. |
| | In short, we do not want to exclude from our thinking anything that can help us forecast future cash flows, our most important as well as most difficult job. |
| | The Diamond Hill investment process continually compares market price to our estimate of intrinsic value, which is updated over time as new information arises. |
| | We only invest in a business when the stock market price is lower than our conservative assessment of per share intrinsic value (or higher than our assessment of per share intrinsic value for short positions). |
| | We concentrate our investments in businesses whose per share intrinsic value is likely to grow. |
| | To achieve this, we assess the underlying economics of the businesses in which we invest and the industries and markets in which they participate. We seek to invest in businesses that possess a competitive advantage and significant growth prospects as well as outstanding managers and employees. |
| |
| Diamond Hill Funds Semi-Annual Report June 30, 2009 | Page 5 |
| | Every business in which we invest is “handicapped” by its price. While we would prefer to own only great businesses with superior managers, there are very few businesses that satisfy those criteria and additionally are available at attractive prices. As a result, we may invest in less attractive businesses at more than attractive prices. Depending on the price that we pay, our returns from less than ideal businesses may be even better than our returns from ideal businesses. |
| | We intend to achieve our return from both the closing of the gap between our purchase price and intrinsic value and the growth in per share intrinsic value. For short positions, a growing intrinsic value may shorten the holding period. |
| | We do not define risk by price volatility. We define risk as the possibility that we are unable to obtain the return of the capital that we invest as well as a reasonable return on that capital when you need the capital for other purposes. If your time horizon is less than five years, then you should not invest that capital in the stock market. |
| | |
Our fundamental strategic income principles | Our Yield Our primary goal is to generate a yield greater than the current rate of inflation without bearing undue credit or interest rate risk. However, we cannot guarantee any specific yield. |
| | A flexible approach allows us to invest in both investment grade and non-investment grade corporate bonds as well as in preferred securities, real estate investment trusts, master limited partnerships, and closed end funds. |
| | We can also invest in securities issued by the U.S. government and its agencies when conditions warrant. |
| | We balance our income objective with a focus on total return. Over the next five years, our objective is to earn equity-like returns in the income markets with lower year-to-year volatility and more importantly, a much lower risk of permanent loss of capital. |
“You simply have to behave according to what is rational than
according to what is fashionable.”
— WARREN BUFFETT
| |
| Page 6 | Diamond Hill Funds Semi-Annual Report June 30, 2009 |
Diamond Hill Small Cap Fund
Schedule of Investments
June 30, 2009 (Unaudited)
| | | | | | | |
| | | | | | Market | |
| | | Shares | | | Value | |
| Preferred Stock — 1.1% | | | | | | |
| Financial — 1.1% | | | | | | |
| Mid-America Apartment | | | | | | |
Communities, Inc. - REIT◊ | | | 125,069 | | | $ | 4,591,283 | |
| | | | | | | | | |
| Common Stocks — 79.7% | | | | | | | | |
| Consumer Discretionary — 10.3% | | | | | | | | |
Aaron Rents, Inc. ◊ | | | 58,980 | | | | 1,758,784 | |
| Black & Decker Corp., The | | | 132,295 | | | | 3,791,575 | |
| Brink's Home Security Holdings, Inc.* | | | 114,340 | | | | 3,236,965 | |
Callaway Golf Co. ◊ | | | 631,916 | | | | 3,203,814 | |
Charming Shoppes, Inc.* ◊ | | | 691,690 | | | | 2,573,087 | |
Hanesbrands, Inc.* ◊ | | | 355,100 | | | | 5,330,051 | |
| JAKKS Pacific, Inc.* | | | 231,212 | | | | 2,966,450 | |
K-Swiss, Inc. ◊ | | | 457,100 | | | | 3,885,350 | |
Priceline.com, Inc.* ◊ | | | 19,205 | | | | 2,142,318 | |
Steiner Leisure Ltd.* ◊ | | | 495,310 | | | | 15,121,814 | |
| | | | | | | | 44,010,208 | |
| | | | | | | | | |
| Consumer Staples — 7.3% | | | | | | | | |
Chattem, Inc.* ◊ | | | 132,710 | | | | 9,037,551 | |
| Del Monte Foods Co. | | | 590,160 | | | | 5,535,701 | |
Flowers Foods, Inc. ◊ | | | 303,350 | | | | 6,625,164 | |
| Lance, Inc. | | | 155,682 | | | | 3,600,925 | |
Ruddick Corp. ◊ | | | 275,945 | | | | 6,465,391 | |
| | | | | | | | 31,264,732 | |
| | | | | | | | | |
| Energy — 13.2% | | | | | | | | |
Berry Petroleum Co. ◊ | | | 179,460 | | | | 3,336,161 | |
Cimarex Energy Co. ◊ | | | 404,530 | | | | 11,464,380 | |
| Encore Acquisition Co.* | | | 415,108 | | | | 12,806,081 | |
Helmerich & Payne, Inc. ◊ | | | 175,695 | | | | 5,423,705 | |
| Hornbeck Offshore Services, Inc.* | | | 271,525 | | | | 5,807,920 | |
| Lufkin Industries, Inc. | | | 112,750 | | | | 4,741,138 | |
| Southwestern Energy Co.* | | | 178,230 | | | | 6,924,236 | |
Whiting Petroleum Corp.* ◊ | | | 170,055 | | | | 5,979,134 | |
| | | | | | | | 56,482,755 | |
| | | | | | | | | |
| Financial — 16.7% | | | | | | | | |
Alleghany Corp.* ◊ | | | 8,571 | | | | 2,322,741 | |
| Assurant, Inc. | | | 399,980 | | | | 9,635,517 | |
Assured Guaranty Ltd. ◊ | | | 841,492 | | | | 10,417,670 | |
City National Corp. ◊ | | | 158,685 | | | | 5,844,369 | |
First State Bancorp*◊ | | | 617,950 | | | | 1,192,644 | |
| Hanover Insurance Group | | | 178,565 | | | | 6,805,112 | |
Huntington Bancshares, Inc. ◊ | | | 1,305,798 | | | | 5,458,236 | |
LaSalle Hotel Properties - REIT◊ | | | 214,720 | | | | 2,649,645 | |
Leucadia National Corp.* ◊ | | | 286,645 | | | | 6,045,343 | |
Old Republic International Corp. ◊ | | | 671,690 | | | | 6,616,147 | |
| Redwood Trust, Inc. | | | 246,720 | | | | 3,641,587 | |
Taylor Capital Group, Inc◊ | | | 111,249 | | | | 762,056 | |
| United Fire & Casualty Co. | | | 156,509 | | | | 2,684,129 | |
| XL Capital, Class A | | | 672,025 | | | | 7,701,407 | |
| | | | | | | | 71,776,603 | |
| | | | | | | | | |
| Health Care — 8.3% | | | | | | | | |
| Analogic Corp. | | | 84,069 | | | | 3,106,350 | |
| InVentiv Health, Inc.* | | | 383,780 | | | | 5,192,543 | |
| LifePoint Hospitals, Inc.* | | | 275,325 | | | | 7,227,281 | |
| Res-Care, Inc.* | | | 500,695 | | | | 7,159,939 | |
STERIS Corp. ◊ | | | 184,640 | | | | 4,815,411 | |
| Waters Corp.* | | | 152,120 | | | | 7,829,616 | |
| | | | | | | | 35,331,140 | |
| | | | | | | | | |
| Industrial — 11.5% | | | | | | | | |
AirTran Holdings, Inc.* ◊ | | | 1,036,405 | | | | 6,415,347 | |
Apogee Enterprises, Inc. ◊ | | | 499,250 | | | | 6,140,775 | |
BE Aerospace, Inc.* ◊ | | | 563,240 | | | | 8,088,126 | |
| Brink's Co., The | | | 182,175 | | | | 5,288,540 | |
| Hub Group, Inc. - Class A* | | | 261,430 | | | | 5,395,915 | |
Kaydon Corp. ◊ | | | 161,270 | | | | 5,250,951 | |
Toro Co., The◊ | | | 313,670 | | | | 9,378,734 | |
Trinity Industries, Inc. ◊ | | | 246,170 | | | | 3,352,835 | |
| | | | | | | | 49,311,223 | |
| | | | | | | | | |
| Information Technology — 7.6% | | | | | | | | |
Alliance Data Systems Corp.* ◊ | | | 178,685 | | | | 7,360,035 | |
| CSG Systems International, Inc.* | | | 399,322 | | | | 5,287,023 | |
| KLA-Tencor Corp. | | | 262,130 | | | | 6,618,783 | |
Orbitz Worldwide, Inc.* ◊ | | | 739,940 | | | | 1,405,886 | |
| Verigy Ltd.* | | | 987,055 | | | | 12,012,459 | |
| | | | | | | | 32,684,186 | |
| | | | | | | | | |
| Utilities — 4.8% | | | | | | | | |
Cleco Corp. ◊ | | | 318,925 | | | | 7,150,299 | |
| UGI Corp. | | | 243,200 | | | | 6,199,168 | |
WGL Holdings, Inc. ◊ | | | 228,319 | | | | 7,310,774 | |
| | | | | | | | 20,660,241 | |
| | | | | | | | | |
| Total Common Stocks | | | | | | $ | 341,521,088 | |
| |
| Diamond Hill Funds Semi-Annual Report June 30, 2009 | Page 7 |
Diamond Hill Small Cap Fund
Schedule of Investments (Continued)
June 30, 2009 (Unaudited)
| | | | | | | | Market | |
| | | | Shares | | | | Value | |
| Registered Investment Companies — 37.5% | | | | | | | | |
| JPMorgan Prime Money | | | | | | | | |
Market Fund†† | | | 81,112,935 | | | $ | 81,112,935 | |
| JPMorgan U.S. Government | | | | | | | | |
| Money Market Fund | | | 79,314,831 | | | | 79,314,831 | |
| Total Registered | | | | | | | | |
| Investment Companies | | | | | | $ | 160,427,766 | |
| | | | | | | | | |
| Total Investment Securities — 118.3% | | | | | | | | |
| (Cost $545,619,101)** | | | | | | $ | 506,540,137 | |
| | | | | | | | | |
| Liabilities In Excess | | | | | | | | |
| Of Other Assets — (18.3)% | | | | | | | (78,389,208 | ) |
| | | | | | | | | |
| Net Assets — 100.0% | | | | | | $ | 428,150,929 | |
| * | Non-income producing security. |
| ** | Represents cost for financial reporting purposes. |
| ◊ | All or a portion of the security is on loan. The total market value of the securities on loan, as of June 30, 2009, was $73,195,869. |
| †† | A portion of this security represents collateral for securities loaned. The total value of the collateral, as of June 30, 2009, was $75,811,300. |
REIT – Real Estate Investment Trust
See accompanying Notes to Financial Statements.
Diamond Hill Small-Mid Cap Fund
Schedule of Investments
June 30, 2009 (Unaudited)
| | | | | | Market | |
| | | Shares | | | Value | |
| Common Stocks — 86.6% | | | | | | |
| Consumer Discretionary — 9.3% | | | | | | |
| Black & Decker Corp., The | | | 13,882 | | | $ | 397,858 | |
| Brink's Home Security Holdings, Inc.* | | | 9,345 | | | | 264,557 | |
Callaway Golf Co. ◊ | | | 73,080 | | | | 370,516 | |
Charming Shoppes, Inc.* ◊ | | | 74,760 | | | | 278,107 | |
| Hanesbrands, Inc.* | | | 11,845 | | | | 177,793 | |
Harley - Davidson, Inc. ◊ | | | 9,080 | | | | 147,187 | |
K-Swiss, Inc. ◊ | | | 33,945 | | | | 288,533 | |
Steiner Leisure Ltd.* ◊ | | | 20,975 | | | | 640,366 | |
| | | | | | | | 2,564,917 | |
| | | | | | | | | |
| Consumer Staples — 9.8% | | | | | | | | |
Chattem, Inc.* ◊ | | | 9,955 | | | | 677,936 | |
| ConAgra Foods, Inc. | | | 39,840 | | | | 759,350 | |
| Del Monte Foods Co. | | | 57,105 | | | | 535,645 | |
Flowers Foods, Inc. ◊ | | | 23,980 | | | | 523,723 | |
| Lance, Inc. | | | 9,345 | | | | 216,150 | |
| | | | | | | | 2,712,804 | |
| | | | | | | | | |
| Energy — 15.4% | | | | | | | | |
Berry Petroleum Co. ◊ | | | 6,570 | | | | 122,136 | |
Cimarex Energy Co. ◊ | | | 29,740 | | | | 842,831 | |
| Encore Acquisition Co.* | | | 27,170 | | | | 838,195 | |
| Helmerich & Payne, Inc. | | | 11,950 | | | | 368,897 | |
Hornbeck Offshore Services, Inc.* ◊ | | | 11,010 | | | | 235,504 | |
| Noble Energy, Inc. | | | 18,150 | | | | 1,070,305 | |
| Southwestern Energy Co.* | | | 15,885 | | | | 617,132 | |
| Whiting Petroleum Corp.* | | | 4,410 | | | | 155,056 | |
| | | | | | | | 4,250,056 | |
| | | | | | | | | |
| Financial — 17.0% | | | | | | | | |
| Allstate Corp. | | | 16,595 | | | | 404,918 | |
| Assurant, Inc. | | | 25,565 | | | | 615,860 | |
Assured Guaranty Ltd. ◊ | | | 36,675 | | | | 454,037 | |
| City National Corp. | | | 6,640 | | | | 244,551 | |
Fifth Third Bancorp◊ | | | 38,590 | | | | 273,989 | |
| Hanover Insurance Group, Inc. | | | 11,745 | | | | 447,602 | |
| Huntington Bancshares, Inc. | | | 89,884 | | | | 375,715 | |
| Marsh & McLennan Co's., Inc. | | | 19,365 | | | | 389,817 | |
Old Republic International Corp. ◊ | | | 35,170 | | | | 346,425 | |
| Prudential Financial, Inc. | | | 4,290 | | | | 159,674 | |
| SunTrust Banks, Inc. | | | 28,155 | | | | 463,149 | |
United Fire & Casualty Co. ◊ | | | 9,024 | | | | 154,762 | |
| XL Capital Ltd. - Class A | | | 30,861 | | | | 353,667 | |
| | | | | | | | 4,684,166 | |
| |
| Page 8 | Diamond Hill Funds Semi-Annual Report June 30, 2009 |
Diamond Hill Small-Mid Cap Fund
Schedule of Investments (Continued)
June 30, 2009 (Unaudited)
| | | | | | Market | |
| | | Shares | | | Value | |
| Health Care — 4.6% | | | | | | |
| Analogic Corp. | | | 5,302 | | | $ | 195,909 | |
| LifePoint Hospitals, Inc.* | | | 12,865 | | | | 337,706 | |
Steris Corp. ◊ | | | 12,105 | | | | 315,698 | |
| Waters Corp.* | | | 8,120 | | | | 417,937 | |
| | | | | | | | 1,267,250 | |
| | | | | | | | | |
| Industrial — 15.6% | | | | | | | | |
AirTran Holdings, Inc.* ◊ | | | 54,605 | | | | 338,005 | |
| Avery Dennison Corp. | | | 11,310 | | | | 290,441 | |
BE Aerospace, Inc.* ◊ | | | 24,350 | | | | 349,666 | |
| Brink's Co., The | | | 10,135 | | | | 294,219 | |
| Dover Corp. | | | 28,040 | | | | 927,843 | |
| Fluor Corp. | | | 8,890 | | | | 455,968 | |
| Hub Group, Inc. - Class A* | | | 21,310 | | | | 439,838 | |
Southwest Airlines Co. ◊ | | | 47,250 | | | | 317,993 | |
Toro Co., The◊ | | | 17,795 | | | | 532,071 | |
Trinity Industries, Inc. ◊ | | | 25,840 | | | | 351,941 | |
| | | | | | | | 4,297,985 | |
| | | | | | | | | |
| Information Technology — 8.0% | | | | | | | | |
Alliance Data Systems Corp.* ◊ | | | 13,355 | | | | 550,092 | |
| KLA-Tencor Corp. | | | 24,010 | | | | 606,253 | |
Orbitz Worldwide, Inc.* ◊ | | | 56,880 | | | | 108,072 | |
| Paychex, Inc. | | | 7,515 | | | | 189,378 | |
| Verigy Ltd.* | | | 62,680 | | | | 762,816 | |
| | | | | | | | 2,216,611 | |
| | | | | | | | | |
| Utilities — 6.9% | | | | | | | | |
| Cleco Corp. | | | 16,315 | | | | 365,782 | |
| Energen Corp. | | | 17,760 | | | | 708,624 | |
| UGI Corp. | | | 18,305 | | | | 466,594 | |
| WGL Holdings, Inc. | | | 11,525 | | | | 369,031 | |
| | | | | | | | 1,910,031 | |
| | | | | | | | | |
| Total Common Stocks | | | | | | $ | 23,903,820 | |
| | | | | | | | | |
| Registered Investment Companies — 31.6% | | | | | | | | |
| JPMorgan Prime Money | | | | | | | | |
Market Fund†† | | | 7,466,154 | | | $ | 7,466,154 | |
| JPMorgan U.S. Government | | | | | | | | |
| Money Market Fund | | | 1,275,779 | | | | 1,275,779 | |
| Total Registered | | | | | | | | |
| Investment Companies | | | | | | $ | 8,741,933 | |
| | | | | | | | | |
| Total Investment Securities — 118.2% | | | | | | | | |
| (Cost $33,270,271)** | | | | | | $ | 32,645,753 | |
| | | | | | | | | |
| Liabilities In Excess | | | | | | | | |
| Of Other Assets — (18.2)% | | | | | | | (5,022,981 | ) |
| | | | | | | | | |
| Net Assets — 100.0% | | | | | | $ | 27,622,772 | |
| * | Non-income producing security. |
| ** | Represents cost for financial reporting purposes. |
| ◊ | All or a portion of the security is on loan. The total market value of the securities on loan, as of June 30, 2009, was $4,412,453. |
| †† | A portion of this security represents collateral for securities loaned. The total value of the collateral, as of June 30, 2009, was $4,565,353. |
See accompanying Notes to Financial Statements.
| |
| Diamond Hill Funds Semi-Annual Report June 30, 2009 | Page 9 |
Diamond Hill Large Cap FundSchedule of Investments
June 30, 2009 (Unaudited)
| | | | | | Market | |
| | | Shares | | | Value | |
| Common Stocks — 90.9% | | | | | | |
| Consumer Discretionary — 3.4% | | | | | | |
Black & Decker Corp., The◊ | | | 96,576 | | | $ | 2,767,868 | |
Hanesbrands, Inc.* ◊ | | | 205,113 | | | | 3,078,746 | |
| McDonald’s Corp. | | | 169,780 | | | | 9,760,652 | |
| | | | | | | | 15,607,266 | |
| | | | | | | | | |
| Consumer Staples — 12.6% | | | | | | | | |
ConAgra Foods, Inc. ◊ | | | 479,440 | | | | 9,138,126 | |
General Mills, Inc. ◊ | | | 175,770 | | | | 9,846,635 | |
| Kimberly-Clark Corp. | | | 160,585 | | | | 8,419,472 | |
| PepsiCo, Inc. | | | 178,730 | | | | 9,823,001 | |
Procter & Gamble Co., The◊ | | | 268,950 | | | | 13,743,346 | |
Sysco Corp. ◊ | | | 340,180 | | | | 7,647,246 | |
| | | | | | | | 58,617,826 | |
| | | | | | | | | |
| Energy — 20.4% | | | | | | | | |
Anadarko Petroleum Corp. ◊ | | | 420,450 | | | | 19,084,226 | |
| Apache Corp. | | | 295,070 | | | | 21,289,301 | |
| Devon Energy Corp. | | | 317,340 | | | | 17,295,030 | |
Occidental Petroleum Corp. ◊ | | | 275,427 | | | | 18,125,851 | |
Southwestern Energy Co.* ◊ | | | 107,505 | | | | 4,176,569 | |
| Transocean, Ltd.* | | | 48,990 | | | | 3,639,467 | |
| XTO Energy, Inc. | | | 305,497 | | | | 11,651,656 | |
| | | | | | | | 95,262,100 | |
| | | | | | | | | |
| Financial — 10.1% | | | | | | | | |
| Allstate Corp. | | | 81,145 | | | | 1,979,938 | |
American Express Co. ◊ | | | 275,980 | | | | 6,413,775 | |
Bank of New York Mellon Corp. ◊ | | | 184,861 | | | | 5,418,276 | |
| Marsh & McLennan Co's., Inc. | | | 322,665 | | | | 6,495,246 | |
SunTrust Banks, Inc. ◊ | | | 466,270 | | | | 7,670,142 | |
Travelers Companies, Inc., The◊ | | | 229,415 | | | | 9,415,191 | |
| U.S. Bancorp | | | 195,010 | | | | 3,494,579 | |
Wells Fargo & Co. ◊ | | | 247,875 | | | | 6,013,448 | |
| | | | | | | | 46,900,595 | |
| | | | | | | | | |
| Health Care — 18.4% | | | | | | | | |
Abbott Laboratories◊ | | | 317,275 | | | | 14,924,616 | |
| Baxter International, Inc. | | | 146,990 | | | | 7,784,590 | |
| Cardinal Health, Inc. | | | 249,370 | | | | 7,618,254 | |
Johnson & Johnson◊ | | | 190,350 | | | | 10,811,880 | |
Medtronic, Inc. ◊ | | | 509,987 | | | | 17,793,446 | |
Pfizer, Inc. ◊ | | | 564,160 | | | | 8,462,400 | |
| Schering-Plough Corp. | | | 344,140 | | | | 8,644,797 | |
UnitedHealth Group, Inc. ◊ | | | 388,690 | | | | 9,709,476 | |
| | | | | | | | 85,749,459 | |
| | | | | | | | | |
| Industrial — 12.4% | | | | | | | | |
Avery Dennison Corp. ◊ | | | 191,960 | | | | 4,929,533 | |
Dover Corp. ◊ | | | 272,765 | | | | 9,025,794 | |
Fluor Corp. ◊ | | | 106,550 | | | | 5,464,950 | |
Illinois Tool Works, Inc. ◊ | | | 250,745 | | | | 9,362,818 | |
Parker Hannifin Corp. ◊ | | | 220,345 | | | | 9,466,021 | |
| Southwest Airlines Co. | | | 750,370 | | | | 5,049,990 | |
United Technologies Corp. ◊ | | | 279,770 | | | | 14,536,849 | |
| | | | | | | | 57,835,955 | |
| | | | | | | | | |
| Information Technology — 11.1% | | | | | | | | |
Alliance Data Systems Corp.* ◊ | | | 148,545 | | | | 6,118,569 | |
| Cisco Systems* | | | 490,675 | | | | 9,146,182 | |
Dell, Inc.* ◊ | | | 543,900 | | | | 7,467,747 | |
KLA-Tencor Corp. ◊ | | | 303,040 | | | | 7,651,760 | |
Microsoft Corp. ◊ | | | 534,945 | | | | 12,715,642 | |
Texas Instruments, Inc. ◊ | | | 408,850 | | | | 8,708,505 | |
| | | | | | | | 51,808,405 | |
| | | | | | | | | |
| Utilities — 2.5% | | | | | | | | |
| Dominion Resources, Inc. | | | 344,260 | | | | 11,505,169 | |
| | | | | | | | | |
| Total Common Stocks | | | | | | $ | 423,286,775 | |
| Registered Investment Companies — 35.6% | | | | | | | | |
| JPMorgan Prime Money | | | | | | | | |
Market Fund†† | | | 123,537,669 | | | $ | 123,537,669 | |
| JPMorgan U.S. Government | | | | | | | | |
| Money Market Fund | | | 42,069,971 | | | | 42,069,971 | |
| Total Registered | | | | | | | | |
| Investment Companies | | | | | | $ | 165,607,640 | |
| | | | | | | | | |
| Total Investment Securities — 126.5% | | | | | | | | |
| (Cost $636,369,242)** | | | | | | $ | 588,894,415 | |
| | | | | | | | | |
| Liabilities In Excess | | | | | | | | |
| Of Other Assets — (26.5)% | | | | | | | (123,328,339 | ) |
| | | | | | | | | |
| Net Assets — 100.0% | | | | | | $ | 465,566,076 | |
| * | Non-income producing security. |
| ** | Represents cost for financial reporting purposes. |
| ◊ | All or a portion of the security is on loan. The total market value of the securities on loan, as of June 30, 2009, was $119,634,757. |
| †† | The entire security represents collateral for securities loaned as of June 30, 2009. |
See accompanying Notes to Financial Statements.
| |
| Page 10 | Diamond Hill Funds Semi-Annual Report June 30, 2009 |
Diamond Hill Large Cap FundSchedule of Investments (Continued)
June 30, 2009 (Unaudited)
| | | | | | | | Market | |
| | | | Shares | | | | Value | |
| Total Investment Securities — 126.5% | | | | | | | | |
| (Cost $636,369,242)** | | | | | | $ | 588,894,415 | |
| | | | | | | | | |
| Liabilities In Excess | | | | | | | | |
| Of Other Assets — (26.5)% | | | | | | | (123,328,339 | ) |
| | | | | | | | | |
| Net Assets — 100.0% | | | | | | $ | 465,566,076 | |
| * | Non-income producing security. |
| ** | Represents cost for financial reporting purposes. |
| ◊ | All or a portion of the security is on loan. The total market value of the securities on loan, as of June 30, 2009, was $119,634,757. |
| †† | The entire security represents collateral for securities loaned as of June 30, 2009. |
See accompanying Notes to Financial Statements.
Diamond Hill Select Fund
Schedule of Investments
June 30, 2009 (Unaudited)
| | | | | | Market | |
| | | Shares | | | Value | |
| Common Stocks — 89.4% | | | | | | |
| Consumer Discretionary — 3.8% | | | | | | |
Hanesbrands, Inc.* ◊ | | | 18,161 | | | $ | 272,597 | |
| McDonald’s Corp. | | | 6,155 | | | | 353,851 | |
| | | | | | | | 626,448 | |
| | | | | | | | | |
| Consumer Staples — 13.1% | | | | | | | | |
| ConAgra Foods, Inc. | | | 28,643 | | | | 545,935 | |
| General Mills, Inc. | | | 6,250 | | | | 350,125 | |
| PepsiCo, Inc. | | | 5,090 | | | | 279,746 | |
| Procter & Gamble Co., The | | | 9,765 | | | | 498,992 | |
| Sysco Corp. | | | 21,235 | | | | 477,363 | |
| | | | | | | | 2,152,161 | |
| | | | | | | | | |
| Energy — 15.2% | | | | | | | | |
| Anadarko Petroleum Corp. | | | 10,210 | | | | 463,432 | |
| Apache Corp. | | | 8,185 | | | | 590,548 | |
Cimarex Energy Co. ◊ | | | 5,725 | | | | 162,247 | |
| Devon Energy Corp. | | | 11,035 | | | | 601,407 | |
| Occidental Petroleum Corp. | | | 7,915 | | | | 520,886 | |
| Southwestern Energy Co.* | | | 4,115 | | | | 159,868 | |
| | | | | | | | 2,498,388 | |
| | | | | | | | | |
| Financial — 9.8% | | | | | | | | |
| American Express Co. | | | 9,645 | | | | 224,150 | |
| SunTrust Banks, Inc. | | | 17,650 | | | | 290,343 | |
| Travelers Companies, Inc., The | | | 11,105 | | | | 455,749 | |
| U.S. Bancorp | | | 16,550 | | | | 296,576 | |
| Wells Fargo & Co. | | | 14,040 | | | | 340,610 | |
| | | | | | | | 1,607,428 | |
| | | | | | | | | |
| Health Care — 20.0% | | | | | | | | |
| Abbott Laboratories | | | 11,230 | | | | 528,259 | |
| Baxter International, Inc. | | | 7,235 | | | | 383,166 | |
| Cardinal Health, Inc. | | | 13,800 | | | | 421,590 | |
| Johnson & Johnson | | | 6,120 | | | | 347,616 | |
| Medtronic, Inc. | | | 14,806 | | | | 516,581 | |
| Pfizer, Inc. | | | 23,545 | | | | 353,175 | |
| Schering-Plough Corp. | | | 14,360 | | | | 360,723 | |
| UnitedHealth Group, Inc. | | | 14,682 | | | | 366,756 | |
| | | | | | | | 3,277,866 | |
| |
| Diamond Hill Funds Semi-Annual Report June 30, 2009 | Page 11 |
Diamond Hill Select Fund
Schedule of Investments (Continued)
June 30, 2009 (Unaudited)
| | | | | | Market | |
| | | Shares | | | Value | |
| Industrial — 13.4% | | | | | | |
AirTran Holdings, Inc.* ◊ | | | 10,600 | | | $ | 65,614 | |
Dover Corp. ◊ | | | 15,430 | | | | 510,579 | |
| Illinois Tool Works, Inc. | | | 15,073 | | | | 562,826 | |
Parker Hannifin Corp. ◊ | | | 5,550 | | | | 238,428 | |
Trinity Industries, Inc. ◊ | | | 10,795 | | | | 147,028 | |
| United Technologies Corp. | | | 13,055 | | | | 678,337 | |
| | | | | | | | 2,202,812 | |
| | | | | | | | | |
| Information Technology — 11.4% | | | | | | | | |
Alliance Data Systems Corp.* ◊ | | | 6,040 | | | | 248,788 | |
| Cisco Systems* | | | 22,190 | | | | 413,622 | |
| KLA-Tencor Corp. | | | 12,340 | | | | 311,585 | |
| Microsoft Corp. | | | 25,985 | | | | 617,663 | |
| Verigy Ltd.* | | | 22,955 | | | | 279,362 | |
| | | | | | | | 1,871,020 | |
| | | | | | | | | |
| Utilities — 2.7% | | | | | | | | |
| Dominion Resources, Inc. | | | 13,100 | | | | 437,802 | |
| | | | | | | | | |
| Total Common Stocks | | | | | | $ | 14,673,925 | |
| Registered Investment Companies — 17.3% | | | | | | | | |
| JPMorgan Prime Money | | | | | | | | |
Market Fund†† | | | 1,097,946 | | | $ | 1,097,946 | |
| JPMorgan U.S. Government | | | | | | | | |
| Money Market Fund | | | 1,733,984 | | | | 1,733,984 | |
| Total Registered | | | | | | | | |
| Investment Companies | | | | | | $ | 2,831,930 | |
| | | | | | | | | |
| Total Investment Securities — 106.7% | | | | | | | | |
| (Cost $17,252,502)** | | | | | | $ | 17,505,855 | |
| | | | | | | | | |
| Liabilities In Excess | | | | | | | | |
| Of Other Assets — (6.7)% | | | | | | | (1,105,860 | ) |
| | | | | | | | | |
| Net Assets — 100.0% | | | | | | $ | 16,399,995 | |
| * | Non-income producing security. |
| ** | Represents cost for financial reporting purposes. |
| ◊ | All or a portion of the security is on loan. The total market value of the securities on loan, as of June 30, 2009, was $1,059,187. |
| †† | The entire security represents collateral for securities loaned as of June 30, 2009. |
See accompanying Notes to Financial Statements.
Diamond Hill Long-Short Fund
Schedule of Investments
June 30, 2009 (Unaudited)
| | | | | | Market | |
| | | Shares | | | Value | |
| Common Stocks — 86.0% | | | | | | |
| Consumer Discretionary — 4.2% | | | | | | |
Acco Brands Corp.* נ | | | 862,449 | | | $ | 2,432,106 | |
Black & Decker Corp., Theנ | | | 523,045 | | | | 14,990,470 | |
Hanesbrands, Inc.* נ | | | 1,029,786 | | | | 15,457,088 | |
McDonald’s Corp. † | | | 688,369 | | | | 39,574,334 | |
| | | | | | | | 72,453,998 | |
| | | | | | | | | |
| Consumer Staples — 11.3% | | | | | | | | |
ConAgra Foods, Inc. † | | | 1,978,570 | | | | 37,711,544 | |
General Mills, Inc. † | | | 712,656 | | | | 39,922,989 | |
PepsiCo, Inc. ◊ | | | 738,140 | | | | 40,568,174 | |
| Procter & Gamble Co., The | | | 1,003,195 | | | | 51,263,266 | |
Sysco Corp. † | | | 1,183,457 | | | | 26,604,113 | |
| | | | | | | | 196,070,086 | |
| | | | | | | | | |
| Energy — 18.9% | | | | | | | | |
Anadarko Petroleum Corp. † | | | 1,367,135 | | | | 62,054,258 | |
Apache Corp. † | | | 918,431 | | | | 66,264,796 | |
Cimarex Energy Co. ◊ | | | 589,480 | | | | 16,705,863 | |
Devon Energy Corp. נ | | | 968,315 | | | | 52,773,168 | |
Occidental Petroleum Corp. † | | | 1,156,785 | | | | 76,128,020 | |
| Transocean, Ltd.* | | | 203,766 | | | | 15,137,776 | |
XTO Energy, Inc. † | | | 956,857 | | | | 36,494,526 | |
| | | | | | | | 325,558,407 | |
| | | | | | | | | |
| Financial — 8.0% | | | | | | | | |
| American Express Co. | | | 1,058,050 | | | | 24,589,082 | |
SunTrust Banks, Inc. ◊ | | | 1,787,655 | | | | 29,406,925 | |
Travelers Companies, Inc., The◊ | | | 855,830 | | | | 35,123,263 | |
U.S. Bancorpנ | | | 817,137 | | | | 14,643,095 | |
Wells Fargo & Co. ◊ | | | 762,760 | | | | 18,504,558 | |
| XL Capital, Class A | | | 1,362,892 | | | | 15,618,742 | |
| | | | | | | | 137,885,665 | |
| | | | | | | | | |
| Health Care — 18.0% | | | | | | | | |
Abbott Laboratories† | | | 1,183,475 | | | | 55,670,664 | |
| Baxter International, Inc. | | | 572,255 | | | | 30,306,625 | |
Cardinal Health, Inc. † | | | 835,510 | | | | 25,524,831 | |
Johnson & Johnsonנ | | | 612,185 | | | | 34,772,108 | |
Medtronic, Inc. † | | | 1,590,052 | | | | 55,476,914 | |
| Pfizer, Inc. | | | 2,249,135 | | | | 33,737,025 | |
Schering-Plough Corp. † | | | 1,366,025 | | | | 34,314,548 | |
UnitedHealth Group, Inc. † | | | 1,632,145 | | | | 40,770,982 | |
| | | | | | | | 310,573,697 | |
| |
| Page 12 | Diamond Hill Funds Semi-Annual Report June 30, 2009 |
Diamond Hill Long-Short Fund
Schedule of Investments (Continued)
June 30, 2009 (Unaudited)
| | | | | | Market | |
| | | Shares | | | Value | |
| Industrial — 12.2% | | | | | | | | |
AirTran Holdings, Inc.* † | | | 531,471 | | | | 3,289,805 | |
Avery Dennison Corp. ◊ | | | 732,754 | | | | 18,817,123 | |
Dover Corp. † | | | 1,056,055 | | | | 34,944,860 | |
Fluor Corp. נ | | | 420,275 | | | | 21,555,905 | |
Illinois Tool Works, Inc. † | | | 895,960 | | | | 33,455,146 | |
Parker Hannifin Corp. ◊ | | | 717,775 | | | | 30,835,614 | |
Trinity Industries, Inc. נ | | | 862,194 | | | | 11,743,082 | |
United Technologies Corp. † | | | 1,085,615 | | | | 56,408,556 | |
| | | | | | | | 211,050,091 | |
| | | | | | | | | |
| Information Technology — 10.8% | | | | | | | | |
Alliance Data Systems Corp.* ◊ | | | 549,585 | | | | 22,637,406 | |
| Cisco Systems, Inc.* | | | 1,895,325 | | | | 35,328,858 | |
| Dell, Inc.* | | | 2,092,290 | | | | 28,727,142 | |
KLA-Tencor Corp. ◊ | | | 1,209,845 | | | | 30,548,586 | |
Microsoft Corp. נ | | | 1,843,935 | | | | 43,830,335 | |
Texas Instruments, Inc. ◊ | | | 1,230,730 | | | | 26,214,549 | |
| | | | | | | | 187,286,876 | |
| | | | | | | | | |
| Utilities — 2.6% | | | | | | | | |
Dominion Resources, Inc. ◊ | | | 1,353,830 | | | | 45,244,999 | |
| | | | | | | | | |
| Total Common Stocks | | | | | | $ | 1,486,123,819 | |
| | | | | | | | | |
| Registered Investment Companies — 22.6% | | | | | | | | |
| JPMorgan 100% U.S. Treasury | | | | | | | | |
| Securities Money Market Fund | | | 89,460,300 | | | $ | 89,460,300 | |
| JPMorgan Prime Money | | | | | | | | |
Market Fund†† | | | 139,782,977 | | | | 139,782,977 | |
| JPMorgan U.S. Government | | | | | | | | |
| Money Market Fund | | | 161,448,536 | | | | 161,448,536 | |
| Total Registered | | | | | | | | |
| Investment Companies | | | | | | $ | 390,691,813 | |
| | | | | | | | | |
| Total Investment Securities — 108.6% | | | | | | | | |
| (Cost $2,026,356,751)** | | | | | | $ | 1,876,815,632 | |
| | | | | | | | | |
| Segregated Cash | | | | | | | | |
| With Brokers — 36.0% | | | | | | | 622,583,231 | |
| | | | | | | | | |
| Securities Sold Short—(36.2)% | | | | | | | | |
| (Proceeds $644,711,506) | | | | | | | (625,234,072 | ) |
| | | | | | | | | |
| Liabilities In Excess | | | | | | | | |
| Of Other Assets — (8.4)% | | | | | | | (145,585,607 | ) |
| | | | | | | | | |
| Net Assets — 100.0% | | | | | | $ | 1,728,579,184 | |
| * | Non-income producing security. |
| ** | Represents cost for financial reporting purposes. |
| ◊ | All or a portion of the security is on loan. The total market value of the securities on loan, as of June 30, 2009 was $135,820,774. |
| † | Security position is either entirely or partially held in a segregated account as collateral for securities sold short aggregating a total market value of $646,658,299. |
| †† | The entire security represents collateral for securities loaned as of June 30, 2009. |
See accompanying Notes to Financial Statements.
| |
| Diamond Hill Funds Semi-Annual Report June 30, 2009 | Page 13 |
Diamond Hill Long-Short Fund
Schedule of Securities Sold Short
June 30, 2009 (Unaudited)
| | | | | | Market | |
| | | Shares | | | Value | |
| Common Stocks — 87.8% | | | | | | |
| Consumer Discretionary — 40.3% | | | | | | |
| Amazon.com, Inc.* | | | 162,070 | | | $ | 13,558,776 | |
| Career Education Corp.* | | | 1,753,620 | | | | 43,647,602 | |
| CarMax, Inc.* | | | 527,598 | | | | 7,755,691 | |
| Chipotle Mexican Grill, Inc.* | | | 84,240 | | | | 6,739,200 | |
| Corinthian Colleges, Inc.* | | | 627,705 | | | | 10,627,046 | |
| Gap, Inc., The | | | 444,035 | | | | 7,282,174 | |
| Gymboree Corp., The* | | | 484,185 | | | | 17,178,884 | |
| J.C. Penny Company, Inc. | | | 243,990 | | | | 7,004,953 | |
| Macy's, Inc. | | | 617,210 | | | | 7,258,390 | |
| Marvel Entertainment, Inc.* | | | 833,650 | | | | 29,669,603 | |
| MGM MIRAGE* | | | 2,800,810 | | | | 17,897,176 | |
| NetFlix, Inc.* | | | 143,265 | | | | 5,922,574 | |
| Nordstrom, Inc. | | | 330,275 | | | | 6,569,169 | |
| Regal Entertainment Group | | | 1,544,276 | | | | 20,523,428 | |
| Royal Caribbean Cruises, Ltd. | | | 1,179,190 | | | | 15,966,233 | |
| Sally Beauty Holdings, Inc.* | | | 1,521,610 | | | | 9,677,440 | |
| Tractor Supply Co.* | | | 598,128 | | | | 24,714,649 | |
| | | | | | | | 251,992,988 | |
| | | | | | | | | |
| Consumer Staples — 12.9% | | | | | | | | |
| BJ's Wholesale Club, Inc.* | | | 220,587 | | | | 7,109,519 | |
| Colgate-Palmolive Co. | | | 395,646 | | | | 27,987,998 | |
| Dean Foods Co.* | | | 923,048 | | | | 17,713,292 | |
| Kraft Foods, Inc. | | | 1,088,860 | | | | 27,591,712 | |
| | | | | | | | 80,402,521 | |
| | | | | | | | | |
| Financial — 1.3% | | | | | | | | |
| Prosperity Bancshares, Inc. | | | 287,385 | | | | 8,572,694 | |
| | | | | | | | | |
| Health Care — 17.0% | | | | | | | | |
| Covance* | | | 342,575 | | | | 16,854,690 | |
| Laboratory Corp. of | | | | | | | | |
| America Holdings* | | | 598,488 | | | | 40,571,502 | |
| Omnicare, Inc. | | | 1,258,521 | | | | 32,419,501 | |
| Quest Diagnostics, Inc. | | | 289,850 | | | | 16,356,235 | |
| | | | | | | | 106,201,928 | |
| | | | | | | | | |
| Industrial — 4.1% | | | | | | | | |
| Boeing Co., The | | | 417,160 | | | | 17,729,300 | |
| Old Dominion Freight Line, Inc.* | | | 233,115 | | | | 7,825,671 | |
| | | | | | | | 25,554,971 | |
| | | | | | | | | |
| Information Technology — 2.5% | | | | | | | | |
| Akamai Technologies, Inc.* | | | 627,195 | | | $ | 12,029,600 | |
| Salesforce.com, Inc.* | | | 94,930 | | | | 3,623,477 | |
| | | | | | | | 15,653,077 | |
| | | | | | | | | |
| Materials — 7.5% | | | | | | | | |
| Dow Chemical Co. | | | 2,904,235 | | | | 46,874,353 | |
| | | | | | | | | |
| | | | | | | | | |
| Utilities — 2.2% | | | | | | | | |
| Sprint Nextel Corp.* | | | 2,798,055 | | | | 13,458,645 | |
| | | | | | | | | |
| Total Common Stocks Sold Short | | | | | | $ | 548,711,177 | |
| | | | | | | | | |
| Exchange Traded Funds — 12.2% | | | | | | | | |
| iShares Russell 2000 Index Fund | | | 793,250 | | | | 40,424,020 | |
| SPDR S&P Retail ETF | | | 1,296,655 | | | | 36,098,875 | |
| | | | | | | | | |
| | | | | | | | | |
| Total Exchange Traded | | | | | | | | |
| Funds Sold Short | | | | | | $ | 76,522,895 | |
| | | | | | | | | |
| Total Securities Sold Short | | | | | | | | |
| (Proceeds $644,711,506) | | | | | | $ | 625,234,072 | |
| * | Non-dividend expense producing security. |
See accompanying Notes to Financial Statements.
| | |
| Page 14 | Diamond Hill Funds Semi-Annual Report June 30, 2009 |
Diamond Hill Financial Long-Short Fund
Schedule of Investments
June 30, 2009 (Unaudited)
| | | | | | Market | |
| | | Shares | | | Value | |
| Preferred Stocks — 16.1% | | | | | | |
| Financial — 12.4% | | | | | | |
| Citizens Funding Trust I, 7.50% | | | 6,340 | | | $ | 69,740 | |
Countrywide Capital V, 7.00%† | | | 19,550 | | | | 333,523 | |
Huntington Bancshares, 8.50%◊ | | | 423 | | | | 317,250 | |
National City Capital Trust IV, 8.00%◊ | | | 15,310 | | | | 339,882 | |
| Regions Financing Trust III, 8.88% | | | 2,411 | | | | 47,931 | |
| | | | | | | | 1,108,326 | |
| | | | | | | | | |
| Real Estate Investment Trust — 3.7% | | | | | | | | |
| iStar Financial, Inc., Series F | | | 1,359 | | | | 9,662 | |
| LaSalle Hotel Properties, Series B | | | 203 | | | | 3,999 | |
| LaSalle Hotel Properties, Series E | | | 1,557 | | | | 27,345 | |
| Mid-America Apartment | | | | | | | | |
Communities, Inc.† | | | 2,926 | | | | 107,413 | |
| Wachovia Preferred Funding | | | 10,375 | | | | 187,373 | |
| | | | | | | | 335,792 | |
| | | | | | | | | |
| Total Preferred Stocks | | | | | | $ | 1,444,118 | |
| | | | | | | | | |
| Common Stocks — 75.5% | | | | | | | | |
| Finance - Banks & Thrifts — 37.2% | | | | | | | | |
Bank of New York Mellon Corp. † | | | 9,429 | | | | 276,364 | |
City National Corp. † | | | 3,295 | | | | 121,355 | |
Comerica, Inc. † | | | 4,440 | | | | 93,906 | |
| Fifth Third Bancorp | | | 19,185 | | | | 136,214 | |
First State Bancorp† | | | 13,280 | | | | 25,630 | |
Huntington Bancshares, Inc. נ | | | 29,825 | | | | 124,669 | |
| JPMorgan Chase & Co. | | | 16,765 | | | | 571,853 | |
PNC Financial Services Group, Inc. † | | | 6,935 | | | | 269,147 | |
| Prudential Financial, Inc. | | | 5,975 | | | | 222,390 | |
| South Financial Group, Inc., The | | | 77,100 | | | | 91,749 | |
| SunTrust Banks, Inc. | | | 23,740 | | | | 390,523 | |
Synovus Financial Corp. † | | | 10,922 | | | | 32,657 | |
Taylor Capital Group, Incנ | | | 1,220 | | | | 8,357 | |
U.S. Bancorp† | | | 21,125 | | | | 378,560 | |
Wells Fargo & Co. † | | | 23,960 | | | | 581,269 | |
| | | | | | | | 3,324,643 | |
| | | | | | | | | |
| Finance - Broker Dealer — 4.2% | | | | | | | | |
Affiliated Managers Group, Inc.* ◊ | | | 2,930 | | | $ | 170,497 | |
Morgan Stanley† | | | 3,935 | | | | 112,187 | |
| State Street Corp. | | | 2,040 | | | | 96,288 | |
| | | | | | | | 378,972 | |
| | | | | | | | | |
| Financial - Diversified — 3.8% | | | | | | | | |
| Leucadia National Corp.* | | | 3,155 | | | | 66,539 | |
| Marsh & McLennan Co's., Inc. | | | 9,875 | | | | 198,784 | |
Paychex, Inc. ◊ | | | 3,145 | | | | 79,254 | |
| | | | | | | | 344,577 | |
| | | | | | | | | |
| Financial Specialties — 4.8% | | | | | | | | |
| American Express Co. | | | 12,060 | | | | 280,274 | |
Discover Financial Services† | | | 15,000 | | | | 154,050 | |
| | | | | | | | 434,324 | |
| | | | | | | | | |
| Insurance — 23.0% | | | | | | | | |
Allstate Corp. † | | | 12,500 | | | | 305,000 | |
Assurant, Inc. † | | | 12,135 | | | | 292,332 | |
Assured Guaranty Ltd. ◊ | | | 24,580 | | | | 304,300 | |
Hanover Insurance Group, Inc. נ | | | 5,375 | | | | 204,841 | |
| Hartford Financial | | | | | | | | |
Services Group, Inc., The◊ | | | 4,600 | | | | 54,602 | |
Old Republic International Corp. ◊ | | | 23,650 | | | | 232,953 | |
| Travelers Companies, Inc., The | | | 9,195 | | | | 377,363 | |
United Fire & Casualty Co. † | | | 3,987 | | | | 68,377 | |
| XL Capital Ltd. - Class A | | | 19,028 | | | | 218,061 | |
| | | | | | | | 2,057,829 | |
| | | | | | | | | |
| Real Estate Investment Trust — 2.5% | | | | | | | | |
Redwood Trust, Inc. ◊ | | | 15,070 | | | | 222,433 | |
| | | | | | | | | |
| | | | | | | | | |
| Total Common Stocks | | | | | | $ | 6,762,778 | |
| | | | | | | | | |
| Registered Investment Companies — 22.3% | | | | | | | | |
| JPMorgan Prime Money | | | | | | | | |
Market Fund†† | | | 1,757,257 | | | $ | 1,757,257 | |
| JPMorgan U.S. Government | | | | | | | | |
| Money Market Fund | | | 239,845 | | | | 239,845 | |
| Total Registered | | | | | | | | |
| Investment Companies | | | | | | $ | 1,997,102 | |
| |
| Diamond Hill Funds Semi-Annual Report June 30, 2009 | Page 15 |
Diamond Hill Financial Long-Short Fund
Schedule of Investments
June 30, 2009 (Unaudited)
| | | | | | | | Market | |
| | | | Par Value | | | | Value | |
| Corporate Bonds — 2.2% | | | | | | | | |
| Financial — 2.2% | | | | | | | | |
| First Horizon National, | | | | | | | | |
| 4.50%, 5/15/13 | | | 250,000 | | | $ | 199,313 | |
| | | | | | | | | |
| Total Investment Securities — 116.1% | | | | | | | | |
| (Cost $10,403,836)** | | | | | | $ | 10,403,311 | |
| | | | | | | | | |
| Segregated Cash With Brokers — 7.2% | | | | | | | 647,746 | |
| | | | | | | | | |
| Securities Sold Short—(7.9)% | | | | | | | | |
| (Proceeds $844,076) | | | | | | | (708,278 | ) |
| | | | | | | | | |
| Liabilities In Excess | | | | | | | | |
| Of Other Assets — (15.4)% | | | | | | | (1,378,036 | ) |
| | | | | | | | | |
| Net Assets — 100.0% | | | | | | $ | 8,964,743 | |
| * | Non-income producing security. |
| ** | Represents cost for financial reporting purposes. |
| ◊ | All or a portion of the security is on loan. The total market value of the securities on loan, as of June 30, 2009, was $1,325,184. |
| † | Security position is either entirely or partially held in a segregated account as collateral for securities sold short aggregating a total market value of $2,610,568. |
| †† | A portion of this security represents collateral for securities loaned. The total value of the collateral, as of June 30, 2009, was $1,356,515. |
See accompanying Notes to Financial Statements.
Diamond Hill Financial Long-Short Fund
Schedule of Securities Sold Short
June 30, 2009 (Unaudited)
| | | | | | Market | |
| | | Shares | | | Value | |
| Common Stocks — 100.0% | | | | | | |
| Finance - Banks & Thrifts — 90.3% | | | | | | |
| First Financial Bankshares, Inc. | | | 2,825 | | | $ | 142,267 | |
| Glacier Bancorp, Inc. | | | 7,875 | | | | 116,314 | |
| Home Bancshares, Inc. | | | 6,410 | | | | 122,046 | |
| Peoples Bancorp, Inc. | | | 5,130 | | | | 87,466 | |
| Prosperity Bancshares, Inc. | | | 2,745 | | | | 81,884 | |
| WesBanco, Inc. | | | 6,150 | | | | 89,421 | |
| | | | | | | | 639,398 | |
| | | | | | | | | |
| Finance - Broker Dealer — 9.7% | | | | | | | | |
| KBW, Inc.* | | | 2,395 | | | | 68,880 | |
| | | | | | | | | |
| | | | | | | | | |
| Total Securities Sold Short | | | | | | | | |
| (Proceeds $844,076) | | | | | | $ | 708,278 | |
| * | Non-dividend expense producing security |
See accompanying Notes to Financial Statements.
| |
| Page 16 | Diamond Hill Funds Semi-Annual Report June 30, 2009 |
Diamond Hill Strategic Income Fund
Schedule of Investments
June 30, 2009 (Unaudited)
| | | Shares/ | | | Market | |
| | | Par Value | | | Value | |
| Common Stocks — 0.3% | | | | | | |
| Real Estate Investment Trust — 0.3% | | | | | | |
iStar Financial, Inc. ◊ | | | 94,500 | | | $ | 268,380 | |
| | | | | | | | | |
| Collateralized Debt Obligations — 0.5% | | | | | | | | |
Alesco Preferred Funding III† | | | 724,100 | | | | 83,800 | |
Alesco Preferred Funding IV† | | | 337 | | | | 4,014 | |
Alesco Preferred Funding V† | | | 80 | | | | 1,002 | |
Alesco Preferred Funding VI† | | | 621,631 | | | | 114,100 | |
| Alesco Preferred Funding VI | | | | | | | | |
Series E† | | | 336,608 | | | | 61,475 | |
Fort Sheridan, Ltd.† | | | 489,231 | | | | 95,292 | |
Taberna Preferred Funding, Ltd. † | | | 1,008,118 | | | | 176,351 | |
| Total Collateralized | | | | | | | | |
| Debt Obligations | | | | | | $ | 536,034 | |
| | | | | | | | | |
| Preferred Stocks — 8.5% | | | | | | | | |
| Countrywide Capital V, 7.00% | | | 114,600 | | | | 1,955,076 | |
| Eagle Hospitality Properties | | | | | | | | |
| Trust, Inc., 8.25%, Series A - REIT | | | 21,007 | | | | 3,151 | |
| Innkeepers USA Trust | | | 93,250 | | | | 46,625 | |
| iStar Financial, 7.80%, Series F | | | 138,500 | | | | 984,735 | |
National City Capital IV, 8.00%◊ | | | 70,300 | | | | 1,560,660 | |
| Wachovia Preferred Funding - REIT | | | 153,815 | | | | 2,777,899 | |
| XL Capital Ltd., 10.75% | | | 88,000 | | | | 1,716,000 | |
| Total Preferred Stocks | | | | | | $ | 9,044,146 | |
| Registered Investment Companies — 4.6% | | | | | | | | |
| JPMorgan Prime Money | | | | | | | | |
Market Fund†† | | | 3,261,549 | | | | 3,261,549 | |
| JPMorgan U.S. Government | | | | | | | | |
| Money Market Fund | | | 1,636,053 | | | | 1,636,053 | |
| Total Registered | | | | | | | | |
| Investment Companies | | | | | | $ | 4,897,602 | |
| | | | | | Market | |
| | | Par Value | | | Value | |
| Corporate Bonds — 86.5% | | | | | | |
| Consumer Discretionary — 11.4% | | | | | | |
| Expedia, Inc., 8.50%, 7/1/16^ | | $ | 4,500,000 | | | $ | 4,320,000 | |
Fortune Brands, 4.875%, 12/1/13◊ | | | 3,475,000 | | | | 3,382,979 | |
| Hansebrands, Inc., | | | | | | | | |
4.59%, 12/15/14∆ | | | 3,505,000 | | | | 2,821,525 | |
| Historic Time Warner, Inc., | | | | | | | | |
| 8.05%, 1/15/16 | | | 1,600,000 | | | | 1,609,494 | |
| | | | | | | | 12,133,998 | |
| | | | | | | | | |
| Energy — 10.1% | | | | | | | | |
| Centerpoint Energy, Inc., | | | | | | | | |
| 5.95%, 2/1/17 | | | 2,525,000 | | | | 2,206,360 | |
| Cimarex Energy, 7.125%, 5/1/17 | | | 1,650,000 | | | | 1,452,000 | |
| Energy Transfer Partners, | | | | | | | | |
| 5.95%, 2/1/15 | | | 1,700,000 | | | | 1,712,786 | |
| Enterprise Products | | | | | | | | |
| Operation, 9.75%, 1/31/14 | | | 1,450,000 | | | | 1,666,788 | |
| Kaneb Pipeline, 7.75%, 2/15/12 | | | 1,700,000 | | | | 1,694,781 | |
| Pacific Energy Partners, | | | | | | | | |
| 7.125%, 6/15/14 | | | 2,000,000 | | | | 2,047,872 | |
| | | | | | | | 10,780,587 | |
| | | | | | | | | |
| Finance — 41.2% | | | | | | | | |
| American Express, | | | | | | | | |
| 7.00%, 3/19/18 | | | 2,000,000 | | | | 1,942,076 | |
| AmSouth Bank NA, | | | | | | | | |
| 5.20%, 4/1/15 | | | 2,000,000 | | | | 1,604,994 | |
| CNA Financial Corp., | | | | | | | | |
| 6.50%, 8/15/16 | | | 1,465,000 | | | | 1,187,117 | |
| Fifth Third Bank, 4.75%, 2/1/15 | | | 2,473,000 | | | | 2,088,624 | |
| First Horizon National | | | | | | | | |
| Corp., 4.50%, 05/15/13 | | | 1,400,000 | | | | 1,116,149 | |
| First Tennessee Bank, | | | | | | | | |
| 4.63%, 5/15/13 | | | 1,795,000 | | | | 1,447,628 | |
| First Tennessee Bank, | | | | | | | | |
| 5.05%, 1/15/15 | | | 1,150,000 | | | | 890,611 | |
| First Tennessee Bank, | | | | | | | | |
| 5.65%, 4/1/16 | | | 400,000 | | | | 299,734 | |
| Goldman Sachs Group, Inc., | | | | | | | | |
6.60%, 1/15/12◊ | | | 1,300,000 | | | | 1,384,143 | |
| Hartford Financial Services | | | | | | | | |
| Group, 6.30%, 3/15/18 | | | 4,900,000 | | | | 3,984,549 | |
| |
| Diamond Hill Funds Semi-Annual Report June 30, 2009 | Page 17 |
Diamond Hill Strategic Income Fund
Schedule of Investments (Continued)
June 30, 2009 (Unaudited)
| | | | | | Market | |
| | | Par Value | | | Value | |
| | | | | | | |
| Finance — 41.2% continued | | | | | | |
| Huntington National Bank, | | | | | | |
| 6.60%, 6/15/18 | | | 4,525,000 | | | $ | 3,262,398 | |
Key Bank, 5.80%, 7/1/14◊ | | | 2,000,000 | | | | 1,855,896 | |
| Key Bank, 7.413%, 5/6/15 | | | 1,125,000 | | | | 1,008,471 | |
| Marsh & McLennan Co.'s, Inc., | | | | | | | | |
5.75%, 9/15/15◊ | | | 3,000,000 | | | | 2,858,187 | |
| National City Bank of | | | | | | | | |
| Kentucky, 6.30%, 2/15/11 | | | 3,267,000 | | | | 3,306,246 | |
| National City Bank, | | | | | | | | |
| 6.20%, 12/15/11 | | | 773,000 | | | | 794,413 | |
| Nuveen Investments, Inc., | | | | | | | | |
| 10.50%, 11/15/15^ | | | 3,000,000 | | | | 2,070,000 | |
| OneBeacon U.S. Holdings, | | | | | | | | |
| 5.88%, 5/15/13 | | | 2,800,000 | | | | 2,637,566 | |
| Prudential Financial, Inc., | | | | | | | | |
| 5.10%, 9/20/14 | | | 2,720,000 | | | | 2,569,913 | |
| Prudential Financial, Inc., | | | | | | | | |
| 6.10%, 6/15/17 | | | 2,000,000 | | | | 1,902,700 | |
| Transatlantic Holdings, | | | | | | | | |
| 5.75%, 12/14/15 | | | 3,800,000 | | | | 3,139,849 | |
| Wachovia Corp., 5.75%, 6/15/17 | | | 1,635,000 | | | | 1,613,024 | |
| Wilmington Trust Corp., | | | | | | | | |
| 8.50%, 4/2/18 | | | 1,000,000 | | | | 942,960 | |
| | | | | | | | 43,907,248 | |
| | | | | | | | | |
| Industrial — 23.8% | | | | | | | | |
BE Aerospace, Inc., 8.50%, 7/1/18◊ | | | 3,300,000 | | | | 3,110,250 | |
| Fisher Scientific | | | | | | | | |
| International, Inc., 6.75%, 8/15/14 | | | 3,350,000 | | | | 3,442,882 | |
| Freeport McMoRan Copper | | | | | | | | |
| & Gold, Inc., 8.25%, 4/1/15 | | | 5,050,000 | | | | 5,100,500 | |
| KLA Instruments Corp., | | | | | | | | |
| 6.90%, 5/1/18 | | | 4,425,000 | | | | 3,978,402 | |
| Martin Marietta Materials, | | | | | | | | |
| 6.60%, 4/15/18 | | | 2,500,000 | | | | 2,376,840 | |
| National Semiconductor, | | | | | | | | |
| 6.60%, 6/15/17 | | | 4,475,000 | | | | 3,913,974 | |
| Trinity Industries, Inc., | | | | | | | | |
| 6.50%, 3/15/14 | | | 3,870,000 | | | | 3,366,900 | |
| | | | | | | | 25,289,748 | |
| | | | | | | | | |
| Utilities — 0.0% | | | | | | | | |
| International Telephone, | | | | | | | | |
| 7.50%, 7/1/11 | | | 40,000 | | | $ | 40,094 | |
| Total Corporate Bonds | | | | | | $ | 92,151,675 | |
| | | | | | | | | |
| Total Investment Securities — 100.4% | | | | | | | | |
| (Cost $116,197,547)** | | | | | | $ | 106,897,837 | |
| | | | | | | | | |
| Liabilities In Excess | | | | | | | | |
| Of Other Assets — (0.4)% | | | | | | | (473,058 | ) |
| | | | | | | | | |
| Net Assets — 100.0% | | | | | | $ | 106,424,779 | |
| ** | Represents cost for financial reporting purposes. |
| ◊ | All or a portion of the security is on loan. The total market value of the securities on loan, as of June 30, 2009, was $2,743,971. |
| ∆ | Variable notes earn interest at a coupon rate which fluctuates at specified intervals, usually daily, monthly or semi-annually. The rates shown in the Schedule of Investments are the coupon rates in effect at June 30, 2009. |
| † | Restricted and illiquid securities valued at fair value and not registered under the Securities Act of 1933: |
| | Acquisition Date | | Current Cost | | | Value | | | Value as a % of Net Assets |
| Alesco Preferred Funding III | March-05 | | $ | 724,100 | | | $ | 83,800 | | | | 0.1 | % |
| Alesco Preferred Funding IV | May-04 | | | 337,338 | | | | 4,014 | | | | 0.0 | % |
| Alesco Preferred Funding V | October-04 | | | 80,180 | | | | 1,002 | | | | 0.0 | % |
| Alesco Preferred Funding VI | December-04 | | | 621,631 | | | | 114,100 | | | | 0.1 | % |
| Alesco Preferred Funding VI Series E | March-05 | | | 336,608 | | | | 61,475 | | | | 0.0 | % |
| Fort Sheridan, LTD | March-05 | | | 489,065 | | | | 95,292 | | | | 0.1 | % |
| Taberna Preferred Funding, LTD | March-05 | | | 1,010,811 | | | | 176,351 | | | | 0.2 | % |
| | | | $ | 3,599,733 | | | $ | 536,034 | | | | 0.5 | % |
| †† | The entire security represents collateral for securities loaned as of June 30, 2009. |
| ^ | Restricted securities not registered under the Securities Act of 1933. Acquisition date and current cost: Nuveen Investments, Inc., 10.50%, 11/15/15 – 1/08, $2,915,000 and Expedia, Inc., 8.50%, 7/1/16, $2,814,375. At June 30, 2009, these securities had a market value of $2,070,000 and $4,320,000, respectively, representing 1.9% and 4.1% of net assets, respectively. |
REIT – Real Estate Investment Trust
See accompanying Notes to Financial Statements.
| |
| Page 18 | Diamond Hill Funds Semi-Annual Report June 30, 2009 |
Diamond Hill Funds
Tabular Presentation of Schedule of Investments
June 30, 2009 (Unaudited)
The illustrations below provide each Fund's sector allocation. We hope it will be useful to shareholders as it summarizes key information about each Fund's investments.
| Small Cap Fund | | | |
| | | % of | |
| Sector Allocation | | Net Assets | |
| Common Stock: | | | |
| Consumer Discretionary | | | 10 | % |
| Consumer Staples | | | 7 | % |
| Energy | | | 13 | % |
| Financial | | | 17 | % |
| Health Care | | | 8 | % |
| Industrial | | | 12 | % |
| Information Technology | | | 8 | % |
| Utilities | | | 5 | % |
| Preferred Stock | | | 1 | % |
| Cash and Cash Equivalents | | | 19 | % |
| | | | 100 | % |
| Small-Mid Cap Fund | | | |
| | | % of | |
| Sector Allocation | | Net Assets | |
| Consumer Discretionary | | | 9 | % |
| Consumer Staples | | | 10 | % |
| Energy | | | 15 | % |
| Financial | | | 17 | % |
| Health Care | | | 5 | % |
| Industrial | | | 16 | % |
| Information Technology | | | 8 | % |
| Utilities | | | 7 | % |
| Cash and Cash Equivalents | | | 13 | % |
| | | | 100 | % |
| Large Cap Fund | | | |
| | | % of | |
| Sector Allocation | | Net Assets | |
| Consumer Discretionary | | | 3 | % |
| Consumer Staples | | | 13 | % |
| Energy | | | 20 | % |
| Financial | | | 10 | % |
| Health Care | | | 18 | % |
| Industrial | | | 12 | % |
| Information Technology | | | 11 | % |
| Utilities | | | 3 | % |
| Cash and Cash Equivalents | | | 10 | % |
| | | | 100 | % |
| Select Fund | | | |
| | | % of | |
| Sector Allocation | | Net Assets | |
| Consumer Discretionary | | | 4 | % |
| Consumer Staples | | | 13 | % |
| Energy | | | 15 | % |
| Financial | | | 10 | % |
| Health Care | | | 20 | % |
| Industrial | | | 13 | % |
| Information Technology | | | 11 | % |
| Utilities | | | 3 | % |
| Cash and Cash Equivalents | | | 11 | % |
| | | | 100 | % |
| Long-Short Fund | | | | | | |
| | | % of Long | | | % of Net | |
| Sector Allocation | | Portfolio | | | Assets | |
| Long Portfolio | | | | | | |
| Consumer Discretionary | | | 4 | % | | | 4 | % |
| Consumer Staples | | | 11 | % | | | 11 | % |
| Energy | | | 17 | % | | | 19 | % |
| Financial | | | 7 | % | | | 8 | % |
| Health Care | | | 17 | % | | | 18 | % |
| Industrial | | | 11 | % | | | 12 | % |
| Information Technology | | | 10 | % | | | 11 | % |
| Utilities | | | 2 | % | | | 3 | % |
| Cash & Cash Equivalents | | | 21 | % | | | 14 | % |
| | | | 100 | % | | | | |
| | | | | | | | | |
| | | % of Short | | | % of Net | |
| Sector Allocation | | Portfolio | | | Assets | |
| Short Portfolio | | | | | | | | |
| Consumer Discretionary | | | 40 | % | | | -15 | % |
| Consumer Staples | | | 13 | % | | | -5 | % |
| Finance | | | 1 | % | | | 0 | % |
| Health Care | | | 17 | % | | | -6 | % |
| Industrial | | | 4 | % | | | -1 | % |
| Information Technology | | | 3 | % | | | -1 | % |
| Materials | | | 8 | % | | | -3 | % |
| Utilities | | | 2 | % | | | -1 | % |
| Exchange Traded Funds | | | 12 | % | | | -4 | % |
| | | | 100 | % | | | | |
| Other | | | | | | | | |
| Segregated Cash with Brokers | | | | | | | 36 | % |
| | | | | | | | 100 | % |
| |
| Diamond Hill Funds Semi-Annual Report June 30, 2009 | Page 19 |
Diamond Hill Funds
Tabular Presentation of Schedule of Investments (Continued)
June 30, 2009 (Unaudited)
| Financial Long-Short Fund | | | | | | |
| | | | | | | |
| | | % of Long | | | % of Net | |
| Sector Allocation | | Portfolio | | | Assets | |
| Long Portfolio | | | | | | |
| Common Stocks: | | | | | | |
| Finance - Banks & Thrifts | | | 32 | % | | | 37 | % |
| Finance - Broker Dealer | | | 4 | % | | | 4 | % |
| Finance - Diversified | | | 3 | % | | | 4 | % |
| Finance - Specialties | | | 4 | % | | | 5 | % |
| Insurance | | | 20 | % | | | 23 | % |
| REIT | | | 2 | % | | | 3 | % |
| Cash & Cash Equivalents | | | 19 | % | | | 7 | % |
| Preferred Stocks: | | | | | | | | |
| Finance | | | 11 | % | | | 12 | % |
| Real Estate Investment Trust | | | 3 | % | | | 4 | % |
| Corporate Bonds | | | 2 | % | | | 2 | % |
| | | | 100 | % | | | | |
| | | | | | | | | |
| | | % of Short | | | % of Net | |
| Sector Allocation | | Portfolio | | | Assets | |
| Short Portfolio | | | | | | | | |
| Commons Stocks: | | | | | | | | |
| Finance - Banks & Thrifts | | | 90 | % | | | -7 | % |
| Finance - Broker Dealer | | | 10 | % | | | -1 | % |
| | | | 100 | % | | | | |
| Other | | | | | | | | |
| Segregated Cash with Brokers | | | | | | | 7 | % |
| | | | | | | | 100 | % |
| | | | | | | | | |
| Strategic Income Fund | | | |
| | | | |
| | % of | |
| Sector Allocation | | Net Assets | |
| REIT Common Stock | | | 0 | % |
| Trust Preferred Stock | | | 9 | % |
| Collateralized Debt Obligations | | | 1 | % |
| Corporate Bonds - Maturing > 2 Years | | | 83 | % |
| Corporate Bonds - Maturing or | | | | |
| Likely to Be Called < 2 Years | | | 3 | % |
| Cash and Cash Equivalents | | | 4 | % |
| | | | 100 | % |
| |
| Page 20 | Diamond Hill Funds Semi-Annual Report June 30, 2009 |
Diamond Hill Funds
Statements of Assets & Liabilities
June 30, 2009 (Unaudited)
| | | | | | Small-Mid | | | | | | | |
| | | Small Cap | | | Cap | | | Large Cap | | | Select | |
| | | Fund | | | Fund | | | Fund | | | Fund | |
| Assets | | | | | | | | | | | | |
| Investment securities, at cost | | $ | 545,619,101 | | | $ | 33,270,271 | | | $ | 636,369,242 | | | $ | 17,252,502 | |
| Investment securities, at market value - including $73,195,869; $4,412,453; $119,634,757; and $1,059,187 of securities loaned for the Small Cap Fund, the Small-Mid Cap Fund, the Large Cap Fund and the Select Fund, respectively. | | $ | 506,540,137 | | | $ | 32,645,753 | | | $ | 588,894,415 | | | $ | 17,505,855 | |
| Receivable for fund shares issued | | | 678,227 | | | | 11,004 | | | | 726,698 | | | | - | |
| Receivable for dividends and interest | | | 303,340 | | | | 18,151 | | | | 566,292 | | | | 19,074 | |
| Total Assets | | | 507,521,704 | | | | 32,674,908 | | | | 590,187,405 | | | | 17,524,929 | |
| | | | | | | | | | | | | | | | | |
| Liabilities | | | | | | | | | | | | | | | | |
| Return of collateral for securities on loan | | | 75,811,300 | | | | 4,565,353 | | | | 123,537,669 | | | | 1,097,946 | |
| Payable for securities purchased | | | 2,165,060 | | | | - | | | | - | | | | - | |
| Payable for fund shares redeemed | | | 753,197 | | | | 452,808 | | | | 541,970 | | | | 5,000 | |
| Payable to Investment Adviser | | | 285,053 | | | | 17,604 | | | | 232,045 | | | | 9,492 | |
| Payable to Administrator | | | 104,238 | | | | 4,791 | | | | 97,743 | | | | 3,017 | |
| Accrued distribution and service fees | | | 251,927 | | | | 11,580 | | | | 211,902 | | | | 9,479 | |
| Total Liabilities | | | 79,370,775 | | | | 5,052,136 | | | | 124,621,329 | | | | 1,124,934 | |
| | | | | | | | | | | | | | | | | |
| Net Assets | | $ | 428,150,929 | | | $ | 27,622,772 | | | $ | 465,566,076 | | | $ | 16,399,995 | |
| | | | | | | | | | | | | | | | | |
| Components of Net Assets | | | | | | | | | | | | | | | | |
| Paid-in capital | | $ | 517,615,102 | | | $ | 34,325,733 | | | $ | 605,656,920 | | | $ | 20,305,801 | |
| Accumulated net investment income | | | 89,605 | | | | 67,015 | | | | 2,562,531 | | | | 79,080 | |
| Accumulated net realized losses | | | | | | | | | | | | | | | | |
| from investment transactions | | | (50,474,814 | ) | | | (6,145,458 | ) | | | (95,178,548 | ) | | | (4,238,239 | ) |
| Net unrealized appreciation (depreciation) | | | | | | | | | | | | | | | | |
| on investments | | | (39,078,964 | ) | | | (624,518 | ) | | | (47,474,827 | ) | | | 253,353 | |
| Net Assets | | $ | 428,150,929 | | | $ | 27,622,772 | | | $ | 465,566,076 | | | $ | 16,399,995 | |
| | | | | | | | | | | | | | | | | |
| Pricing of Class A Shares | | | | | | | | | | | | | | | | |
| Net assets attributable to Class A shares | | $ | 345,867,213 | | | $ | 7,228,016 | | | $ | 269,536,497 | | | $ | 4,508,624 | |
| Shares of beneficial interest outstanding | | | | | | | | | | | | | | | | |
| (unlimited number of shares authorized, no par value) | | | 19,993,367 | | | | 901,013 | | | | 24,806,788 | | | | 631,237 | |
| Net asset value and redemption price per share | | $ | 17.30 | | | $ | 8.02 | | | $ | 10.87 | | | $ | 7.14 | |
| Maximum offering price per share | | $ | 18.21 | | | $ | 8.44 | | | $ | 11.44 | | | $ | 7.52 | |
| | | | | | | | | | | | | | | | | �� |
| Pricing of Class C Shares | | | | | | | | | | | | | | | | |
| Net assets attributable to Class C shares | | $ | 18,017,567 | | | $ | 2,979,558 | | | $ | 20,765,707 | | | $ | 2,842,143 | |
| Shares of beneficial interest outstanding | | | | | | | | | | | | | | | | |
| (unlimited number of shares authorized, no par value) | | | 1,099,132 | | | | 378,201 | | | | 1,970,159 | | | | 399,982 | |
| Net asset value, offering price and | | | | | | | | | | | | | | | | |
redemption price per share (A) | | $ | 16.39 | | | $ | 7.88 | | | $ | 10.54 | | | $ | 7.11 | |
| | | | | | | | | | | | | | | | | |
| Pricing of Class I Shares | | | | | | | | | | | | | | | | |
| Net assets attributable to Class I shares | | $ | 64,266,149 | | | $ | 17,415,198 | | | $ | 175,263,872 | | | $ | 9,049,228 | |
| Shares of beneficial interest outstanding | | | | | | | | | | | | | | | | |
| (unlimited number of shares authorized, no par value) | | | 3,703,879 | | | | 2,168,887 | | | | 16,069,948 | | | | 1,270,030 | |
| Net asset value, offering price and | | | | | | | | | | | | | | | | |
| redemption price per share | | $ | 17.35 | | | $ | 8.03 | | | $ | 10.91 | | | $ | 7.13 | |
(A) Redemption price per share varies based upon holding period.
See accompanying Notes to Financial Statements.
| |
| Diamond Hill Funds Semi-Annual Report June 30, 2009 | Page 21 |
Diamond Hill Funds
Statements of Assets & Liabilities
June 30, 2009 (Unaudited)
| | | | | | | | | Strategic | |
| | | Long-Short | | | Long-Short | | | Income | |
| | | Fund | | | Fund | | | Fund | |
| Assets | | | | | | | | | |
| Investment securities, at cost | | $ | 2,026,356,751 | | | $ | 10,403,836 | | | $ | 116,197,547 | |
| Investment securities, at market value - including $135,820,774, | | | | | | | | | | | | |
| $1,325,184 and $2,743,971 of securities loaned for the | | | | | | | | | | | | |
| Long-Short Fund, the Financial Long-Short Fund and the | | | | | | | | | | | | |
| Strategic Income Fund, respectively | | $ | 1,876,815,632 | | | $ | 10,403,311 | | | $ | 106,897,837 | |
| Cash | | | 152,907 | | | | - | | | | - | |
| Deposits with brokers for securities sold short | | | 622,583,231 | | | | 647,746 | | | | - | |
| Receivable for securities sold | | | 443,110 | | | | 68,415 | | | | 1,135,224 | |
| Receivable for fund shares issued | | | 4,320,347 | | | | 24,710 | | | | 3,522,923 | |
| Receivable for dividends and interest | | | 1,686,691 | | | | 21,741 | | | | 1,592,358 | |
| Total Assets | | | 2,506,001,918 | | | | 11,165,923 | | | | 113,148,342 | |
| | | | | | | | | | | | | |
| Liabilities | | | | | | | | | | | | |
| Return of collateral for securities on loan | | | 139,782,977 | | | | 1,356,515 | | | | 3,261,549 | |
| Securities sold short, at value (proceeds $644,711,506 for the | | | | | | | | | | | | |
| Long-Short Fund and $844,076 for the Financial Long-Short Fund) | | | 625,234,072 | | | | 708,278 | | | | - | |
| Dividends payable | | | - | | | | - | | | | 308 | |
| Payable for securities purchased | | | - | | | | 89,548 | | | | 3,176,625 | |
| Payable for dividends on securities sold short | | | 896,241 | | | | 3,389 | | | | - | |
| Payable for fund shares redeemed | | | 8,588,212 | | | | 27,053 | | | | 173,128 | |
| Payable to Investment Adviser | | | 1,333,967 | | | | 7,682 | | | | 41,438 | |
| Payable to Administrator | | | 371,346 | | | | 1,075 | | | | 15,409 | |
| Accrued distribution and service fees | | | 1,215,919 | | | | 7,640 | | | | 55,106 | |
| Total Liabilities | | | 777,422,734 | | | | 2,201,180 | | | | 6,723,563 | |
| | | | | | | | | | | | | |
| Net Assets | | $ | 1,728,579,184 | | | $ | 8,964,743 | | | $ | 106,424,779 | |
| | | | | | | | | | | | | |
| Components of Net Assets | | | | | | | | | | | | |
| Paid-in capital | | $ | 2,370,931,030 | | | $ | 25,194,458 | | | $ | 142,340,859 | |
| Accumulated net investment income | | | 1,991,502 | | | | 103,841 | | | | 1,855,015 | |
| Accumulated net realized losses | | | | | | | | | | | | |
| from investment transactions | | | (514,279,663 | ) | | | (16,468,829 | ) | | | (28,471,385 | ) |
| Net unrealized appreciation (depreciation) | | | | | | | | | | | | |
| on investments | | | (130,063,685 | ) | | | 135,273 | | | | (9,299,710 | ) |
| Net Assets | | $ | 1,728,579,184 | | | $ | 8,964,743 | | | $ | 106,424,779 | |
| | | | | | | | | | | | | |
| Pricing of Class A Shares | | | | | | | | | | | | |
| Net assets attributable to Class A shares | | $ | 889,947,436 | | | $ | 7,055,465 | | | $ | 33,943,640 | |
| Shares of beneficial interest outstanding | | | | | | | | | | | | |
| (unlimited number of shares authorized, no par value) | | | 62,558,649 | | | | 828,083 | | | | 3,730,133 | |
| Net asset value and redemption price per share | | $ | 14.23 | | | $ | 8.52 | | | $ | 9.10 | |
| Maximum offering price per share | | $ | 14.98 | | | $ | 8.97 | | | $ | 9.43 | |
| | | | | | | | | | | | | |
| Pricing of Class C Shares | | | | | | | | | | | | |
| Net assets attributable to Class C shares | | $ | 251,267,756 | | | $ | 1,396,127 | | | $ | 15,815,966 | |
| Shares of beneficial interest outstanding | | | | | | | | | | | | |
| (unlimited number of shares authorized, no par value) | | | 18,465,785 | | | | 171,696 | | | | 1,738,812 | |
| Net asset value, offering price and | | | | | | | | | | | | |
redemption price per share (A) | | $ | 13.61 | | | $ | 8.13 | | | $ | 9.10 | |
| | | | | | | | | | | | | |
| Pricing of Class I Shares | | | | | | | | | | | | |
| Net assets attributable to Class I shares | | $ | 587,363,992 | | | $ | 513,151 | | | $ | 56,665,173 | |
| Shares of beneficial interest outstanding | | | | | | | | | | | | |
| (unlimited number of shares authorized, no par value) | | | 41,094,655 | | | | 60,449 | | | | 6,238,654 | |
| Net asset value, offering price and | | | | | | | | | | | | |
| redemption price per share | | $ | 14.29 | | | $ | 8.49 | | | $ | 9.08 | |
(A) Redemption price per share varies based upon holding period.
See accompanying Notes to Financial Statements.
| |
| Page 22 | Diamond Hill Funds Semi-Annual Report June 30, 2009 |
Diamond Hill Funds
Statements of Operations
For the six months ended June 30, 2009 (Unaudited)
| | | | | | Small-Mid | | | | | | | |
| | | Small Cap | | | Cap | | | Large Cap | | | Select | |
| | | Fund | | | Fund | | | Fund | | | Fund | |
| Investment Income | | | | | | | | | | | | |
| Dividends | | $ | 2,184,408 | | | $ | 183,759 | | | $ | 4,628,695 | | | $ | 161,854 | |
| Securities lending income | | | 308,972 | | | | 21,769 | | | | 117,437 | | | | 4,718 | |
| Total Investment Income | | | 2,493,380 | | | | 205,528 | | | | 4,746,132 | | | | 166,572 | |
| | | | | | | | | | | | | | | | | |
| Expenses | | | | | | | | | | | | | | | | |
| Investment advisory fees | | | 1,463,044 | | | | 91,966 | | | | 1,234,077 | | | | 50,761 | |
| Administration fees | | | 547,930 | | | | 28,988 | | | | 552,177 | | | | 17,793 | |
| Distribution fees - Class A | | | 380,469 | | | | 8,402 | | | | 302,360 | | | | 4,657 | |
| Distribution and service fees - Class C | | | 78,101 | | | | 13,167 | | | | 94,987 | | | | 14,281 | |
| Net Expenses | | | 2,469,544 | | | | 142,523 | | | | 2,183,601 | | | | 87,492 | |
| | | | | | | | | | | | | | | | | |
| Net Investment Income | | | 23,836 | | | | 63,005 | | | | 2,562,531 | | | | 79,080 | |
| | | | | | | | | | | | | | | | | |
| Realized and Unrealized Gains (Losses) on Investments | | | | | | | | | | | | | | | | |
| Net realized losses from security transactions | | | (42,854,082 | ) | | | (2,485,722 | ) | | | (51,301,228 | ) | | | (2,126,277 | ) |
| Net change in unrealized appreciation/depreciation on investments | | | 61,862,604 | | | | 5,125,146 | | | | 64,933,312 | | | | 2,781,448 | |
| Net Realized and Unrealized Gains on Investments | | | 19,008,522 | | | | 2,639,424 | | | | 13,632,084 | | | | 655,171 | |
| | | | | | | | | | | | | | | | | |
| Net Change in Net Assets from Operations | | $ | 19,032,358 | | | $ | 2,702,429 | | | $ | 16,194,615 | | | $ | 734,251 | |
| | | | | | | | | | | | | | | | | |
| | | | | | | | | | |
| | | | | | | | | Strategic | |
| | | Long-Short | | | Long-Short | | | Income | |
| | | Fund | | | Fund | | | Fund | |
| Investment Income | | | | | | | | | |
| Dividends | | $ | 17,818,213 | | | $ | 161,656 | | | $ | 720,787 | |
| Interest | | | - | | | | 4,361 | | | | 3,686,880 | |
| Securities lending income | | | 284,754 | | | | 2,076 | | | | 22,123 | |
| Total Investment Income | | | 18,102,967 | | | | 168,093 | | | | 4,429,790 | |
| | | | | | | | | | | | | |
| Expenses | | | | | | | | | | | | |
| Investment advisory fees | | | 8,137,268 | | | | 40,225 | | | | 234,209 | |
| Administration fees | | | 2,456,873 | | | | 12,379 | | | | 115,083 | |
| Distribution fees - Class A | | | 1,201,413 | | | | 7,868 | | | | 35,922 | |
| Distribution and service fees - Class C | | | 1,256,155 | | | | 6,254 | | | | 72,428 | |
| Dividend expense on securities sold short | | | 3,079,227 | | | | 7,155 | | | | - | |
| Net Expenses | | | 16,130,936 | | | | 73,881 | | | | 457,642 | |
| | | | | | | | | | | | | |
| Net Investment Income | | | 1,972,031 | | | | 94,212 | | | | 3,972,148 | |
| | | | | | | | | | | | | |
| Realized and Unrealized Gains (Losses) on Investments | | | | | | | | | | | | |
| Net realized losses from security transactions | | | (405,917,373 | ) | | | (5,166,226 | ) | | | (5,146,609 | ) |
| Net realized gains on closed short positions | | | 28,830,710 | | | | 364,694 | | | | - | |
| Net change in unrealized appreciation/depreciation on investments | | | 401,361,218 | | | | 4,614,866 | | | | 14,091,885 | |
| Net Realized and Unrealized Gains (Losses) on Investments | | | 24,274,555 | | | | (186,666 | ) | | | 8,945,276 | |
| | | | | | | | | | | | | |
| Net Change in Net Assets from Operations | | $ | 26,246,586 | | | $ | (92,454 | ) | | $ | 12,917,424 | |
See accompanying Notes to Financial Statements.
| |
| Diamond Hill Funds Semi-Annual Report June 30, 2009 | Page 23 |
Diamond Hill Funds
Statements of Changes in Net Assets
| | | Small Cap Fund | | | Small-Mid Cap Fund | | | Large Cap Fund | | | Select Fund | |
| | | For the | | | For the | | | For the | | | For the | | | For the | | | For the | | | For the | | | For the | |
| | | Six Months | | | Year | | | Six Months | | | Year | | | Six Months | | | Year | | | Six Months | | | Year | |
| | | Ended | | | Ended | | | Ended | | | Ended | | | Ended | | | Ended | | | Ended | | | Ended | |
| | | June 30, 2009 | | | December 31, | | | June 30, 2009 | | | December 31, | | | June 30, 2009 | | | December 31, | | | June 30, 2009 | | | December 31, | |
| | | (Unaudited) | | | 2008 | | | (Unaudited) | | | 2008 | | | (Unaudited) | | | 2008 | | | (Unaudited) | | | 2008 | |
| From Operations | | | | | | | | | | | | | | | | | | | | | | | | |
| Net investment income | | $ | 23,836 | | | $ | 2,763,134 | | | $ | 63,005 | | | $ | 365,117 | | | $ | 2,562,531 | | | $ | 6,013,969 | | | $ | 79,080 | | | $ | 166,536 | |
| Net realized losses from | | | | | | | | | | | | | | | | | | | | | | | | | | | | | | | | |
| security transactions | | | (42,854,082 | ) | | | (2,308,521 | ) | | | (2,485,722 | ) | | | (3,617,835 | ) | | | (51,301,228 | ) | | | (43,718,442 | ) | | | (2,126,277 | ) | | | (2,536,054 | ) |
| Net change in unrealized | | | | | | | | | | | | | | | | | | | | | | | | | | | | | | | | |
| appreciation/depreciation | | | | | | | | | | | | | | | | | | | | | | | | | | | | | | | | |
| on investments | | | 61,862,604 | | | | (108,806,446 | ) | | | 5,125,146 | | | | (5,338,310 | ) | | | 64,933,312 | | | | (150,696,635 | ) | | | 2,781,448 | | | | (3,770,060 | ) |
| Net Change in Net | | | | | | | | | | | | | | | | | | | | | | | | | | | | | | | | |
| Assets from Operations | | | 19,032,358 | | | | (108,351,833 | ) | | | 2,702,429 | | | | (8,591,028 | ) | | | 16,194,615 | | | | (188,401,108 | ) | | | 734,251 | | | | (6,139,578 | ) |
| | | | | | | | | | | | | | | | | | | | | | | | | | | | | | | | | |
| Distributions to Shareholders | | | | | | | | | | | | | | | | | | | | | | | | | | | | | | | | |
| From net investment income: | | | | | | | | | | | | | | | | | | | | | | | | | | | | | | | | |
| Class A | | | - | | | | (2,153,299 | ) | | | - | | | | (90,512 | ) | | | - | | | | (3,435,709 | ) | | | - | | | | (44,841 | ) |
| Class C | | | - | | | | - | | | | - | | | | (28,964 | ) | | | - | | | | (120,551 | ) | | | - | | | | - | |
| Class I | | | - | | | | (472,675 | ) | | | - | | | | (242,573 | ) | | | - | | | | (2,471,299 | ) | | | - | | | | (125,373 | ) |
| From net realized gains on investments: | | | | | | | | | | | | | | | | | | | | | | | | | | | | | | | | |
| Class A | | | - | | | | (470,895 | ) | | | - | | | | - | | | | - | | | | (2,287,749 | ) | | | - | | | | (160,947 | ) |
| Class C | | | - | | | | (28,872 | ) | | | - | | | | - | | | | - | | | | (193,041 | ) | | | - | | | | (109,395 | ) |
| Class I | | | - | | | | (62,512 | ) | | | - | | | | - | | | | - | | | | (1,298,518 | ) | | | - | | | | (297,972 | ) |
| Decrease in Net Assets | | | | | | | | | | | | | | | | | | | | | | | | | | | | | | | | |
| from Distributions | | | | | | | | | | | | | | | | | | | | | | | | | | | | | | | | |
| to Shareholders | | | - | | | | (3,188,253 | ) | | | - | | | | (362,049 | ) | | | - | | | | (9,806,867 | ) | | | - | | | | (738,528 | ) |
| | | | | | | | | | | | | | | | | | | | | | | | | | | | | | | | | |
| From Capital Transactions | | | | | | | | | | | | | | | | | | | | | | | | | | | | | | | | |
| Class A | | | | | | | | | | | | | | | | | | | | | | | | | | | | | | | | |
| Proceeds from shares sold | | | 95,366,401 | | | | 199,222,977 | | | | 483,262 | | | | 2,310,251 | | | | 56,953,892 | | | | 179,263,026 | | | | 732,658 | | | | 2,395,729 | |
| Reinvested distributions | | | - | | | | 2,222,464 | | | | - | | | | 85,434 | | | | - | | | | 5,511,832 | | | | - | | | | 187,573 | |
| Payments for shares redeemed | | | (74,593,710 | ) | | | (116,445,848 | ) | | | (1,411,939 | ) | | | (2,328,114 | ) | | | (50,798,830 | ) | | | (113,001,942 | ) | | | (411,367 | ) | | | (3,389,294 | ) |
| Net Increase (Decrease) in | | | | | | | | | | | | | | | | | | | | | | | | | | | | | | | | |
| Net Assets from Class A | | | | | | | | | | | | | | | | | | | | | | | | | | | | | | | | |
| Share Transactions | | | 20,772,691 | | | | 84,999,593 | | | | (928,677 | ) | | | 67,571 | | | | 6,155,062 | | | | 71,772,916 | | | | 321,291 | | | | (805,992 | ) |
| | | | | | | | | | | | | | | | | | | | | | | | | | | | | | | | | |
| Class C | | | | | | | | | | | | | | | | | | | | | | | | | | | | | | | | |
| Proceeds from shares sold | | | 2,195,829 | | | | 5,572,858 | | | | 175,014 | | | | 2,009,995 | | | | 2,152,341 | | | | 12,575,146 | | | | 93,003 | | | | 696,065 | |
| Reinvested distributions | | | - | | | | 24,642 | | | | - | | | | 21,980 | | | | - | | | | 270,518 | | | | - | | | | 92,269 | |
| Payments for shares redeemed | | | (1,543,426 | ) | | | (7,239,186 | ) | | | (346,782 | ) | | | (873,364 | ) | | | (2,622,981 | ) | | | (8,884,138 | ) | | | (690,206 | ) | | | (2,414,521 | ) |
| Net Increase (Decrease) in | | | | | | | | | | | | | | | | | | | | | | | | | | | | | | | | |
| Net Assets from Class C | | | | | | | | | | | | | | | | | | | | | | | | | | | | | | | | |
| Share Transactions | | | 652,403 | | | | (1,641,686 | ) | | | (171,768 | ) | | | 1,158,611 | | | | (470,640 | ) | | | 3,961,526 | | | | (597,203 | ) | | | (1,626,187 | ) |
| | | | | | | | | | | | | | | | | | | | | | | | | | | | | | | | | |
| Class I | | | | | | | | | | | | | | | | | | | | | | | | | | | | | | | | |
| Proceeds from shares sold | | | 32,059,482 | | | | 42,364,484 | | | | 1,958,517 | | | | 14,556,970 | | | | 41,675,499 | | | | 158,870,883 | | | | 2,090,593 | | | | 9,850,983 | |
| Reinvested distributions | | | - | | | | 423,505 | | | | - | | | | 229,598 | | | | - | | | | 3,036,004 | | | | - | | | | 347,993 | |
| Payments for shares redeemed | | | (8,955,011 | ) | | | (22,610,538 | ) | | | (1,229,271 | ) | | | (13,183,348 | ) | | | (14,748,598 | ) | | | (43,503,585 | ) | | | (1,033,700 | ) | | | (4,424,728 | ) |
| Net Increase in Net | | | | | | | | | | | | | | | | | | | | | | | | | | | | | | | | |
| Assets from Class I | | | | | | | | | | | | | | | | | | | | | | | | | | | | | | | | |
| Share Transactions | | | 23,104,471 | | | | 20,177,451 | | | | 729,246 | | | | 1,603,220 | | | | 26,926,901 | | | | 118,403,302 | | | | 1,056,893 | | | | 5,774,248 | |
| | | | | | | | | | | | | | | | | | | | | | | | | | | | | | | | | |
| Total Increase (Decrease) | | | | | | | | | | | | | | | | | | | | | | | | | | | | | | | | |
| in Net Assets | | | 63,561,923 | | | | (8,004,728 | ) | | | 2,331,230 | | | | (6,123,675 | ) | | | 48,805,938 | | | | (4,070,231 | ) | | | 1,515,232 | | | | (3,536,037 | ) |
| | | | | | | | | | | | | | | | | | | | | | | | | | | | | | | | | |
| Net Assets | | | | | | | | | | | | | | | | | | | | | | | | | | | | | | | | |
| Beginning of period | | | 364,589,006 | | | | 372,593,734 | | | | 25,291,542 | | | | 31,415,217 | | | | 416,760,138 | | | | 420,830,369 | | | | 14,884,763 | | | | 18,420,800 | |
| End of period | | $ | 428,150,929 | | | $ | 364,589,006 | | | $ | 27,622,772 | | | $ | 25,291,542 | | | $ | 465,566,076 | | | $ | 416,760,138 | | | $ | 16,399,995 | | | $ | 14,884,763 | |
| | | | | | | | | | | | | | | | | | | | | | | | | | | | | | | | | |
| Accumulated Net | | | | | | | | | | | | | | | | | | | | | | | | | | | | | | | | |
| Investment Income | | $ | 89,605 | | | $ | 65,769 | | | $ | 67,015 | | | $ | 4,010 | | | $ | 2,562,531 | | | $ | - | | | $ | 79,080 | | | $ | - | |
See accompanying Notes to Financial Statements.
| |
| Page 24 | Diamond Hill Funds Semi-Annual Report June 30, 2009 |
Diamond Hill Funds
Statements of Changes in Net Assets
| | | | | | | | | | | | | | | | | | | |
| | | Long-Short Fund | | | Financial Long-Short Fund | | | Strategic Income Fund | |
| | | For the | | | For the | | | For the | | | For the | | | For the | | | For the | |
| | | Six Months | | | Year | | | Six Months | | | Year | | | Six Months | | | Year | |
| | | Ended | | | Ended | | | Ended | | | Ended | | | Ended | | | Ended | |
| | | June 30, 2009 | | | December 31, | | | June 30, 2009 | | | December 31, | | | June 30, 2009 | | | December 31, | |
| | | (Unaudited) | | | 2008 | | | (Unaudited) | | | 2008 | | | (Unaudited) | | | 2008 | |
| From Operations | | | | | | | | | | | | | | | | | | |
| Net investment income | | $ | 1,972,031 | | | $ | 22,360,236 | | | $ | 94,212 | | | $ | 488,502 | | | $ | 3,972,148 | | | $ | 8,940,503 | |
| Net realized losses from security transactions | | | (405,917,373 | ) | | | (259,701,159 | ) | | | (5,166,226 | ) | | | (12,674,944 | ) | | | (5,146,609 | ) | | | (20,757,242 | ) |
| Net realized gains on closed short positions | | | 28,830,710 | | | | 128,347,041 | | | | 364,694 | | | | 1,386,293 | | | | - | | | | - | |
| Net change in unrealized appreciation/ | | | | | | | | | | | | | | | | | | | | | | | | |
| depreciation on investments | | | 401,361,218 | | | | (621,467,656 | ) | | | 4,614,866 | | | | (1,364,981 | ) | | | 14,091,885 | | | | (8,353,873 | ) |
| Net Change in Net Assets from Operations | | | 26,246,586 | | | | (730,461,538 | ) | | | (92,454 | ) | | | (12,165,130 | ) | | | 12,917,424 | | | | (20,170,612 | ) |
| | | | | | | | | | | | | | | | | | | | | | | | | |
| Distributions to Shareholders | | | | | | | | | | | | | | | | | | | | | | | | |
| From net investment income: | | | | | | | | | | | | | | | | | | | | | | | | |
| Class A | | | - | | | | (11,854,501 | ) | | | - | | | | (358,050 | ) | | | (1,192,373 | ) | | | (2,977,419 | ) |
| Class C | | | - | | | | (563,193 | ) | | | - | | | | (81,776 | ) | | | (554,643 | ) | | | (1,151,871 | ) |
| Class I | | | - | | | | (10,012,416 | ) | | | - | | | | (39,162 | ) | | | (2,218,184 | ) | | | (4,554,082 | ) |
| From net realized gains on investments: | | | | | | | | | | | | | | | | | | | | | | | | |
| Class A | | | - | | | | (5,059,819 | ) | | | - | | | | (5,583 | ) | | | - | | | | - | |
| Class C | | | - | | | | (1,333,024 | ) | | | - | | | | (1,377 | ) | | | - | | | | - | |
| Class I | | | - | | | | (2,974,052 | ) | | | - | | | | (510 | ) | | | - | | | | - | |
| From return of capital: | | | | | | | | | | | | | | | | | | | | | | | | |
| Class A | | | - | | | | - | | | | - | | | | - | | | | - | | | | (57,178 | ) |
| Class C | | | - | | | | - | | | | - | | | | - | | | | - | | | | (22,121 | ) |
| Class I | | | - | | | | - | | | | - | | | | - | | | | - | | | | (87,457 | ) |
| Decrease in Net Assets from | | | | | | | | | | | | | | | | | | | | | | | | |
| Distributions to Shareholders | | | - | | | | (31,797,005 | ) | | | - | | | | (486,458 | ) | | | (3,965,200 | ) | | | (8,850,128 | ) |
| | | | | | | | | | | | | | | | | | | | | | | | | |
| From Capital Transactions | | | | | | | | | | | | | | | | | | | | | | | | |
| Class A | | | | | | | | | | | | | | | | | | | | | | | | |
| Proceeds from shares sold | | | 151,732,718 | | | | 1,166,023,703 | | | | 1,120,677 | | | | 9,353,579 | | | | 8,887,855 | | | | 9,452,448 | |
| Reinvested distributions | | | - | | | | 15,279,830 | | | | - | | | | 330,275 | | | | 890,014 | | | | 2,486,233 | |
| Payments for shares redeemed | | | (383,901,468 | ) | | | (614,489,097 | ) | | | (1,812,246 | ) | | | (19,720,237 | ) | | | (9,766,360 | ) | | | (24,744,018 | ) |
Net Increase (Decrease) in Net Assets from Class A Share Transactions | | | (232,168,750 | ) | | | 566,814,436 | | | | (691,569 | ) | | | (10,036,383 | ) | | | 11,509 | | | | (12,805,337 | ) |
| | | | | | | | | | | | | | | | | | | | | | | | | |
| Class C | | | | | | | | | | | | | | | | | | | | | | | | |
| Proceeds from shares sold | | | 14,136,931 | | | | 154,843,092 | | | | 198,759 | | | | 1,622,586 | | | | 1,908,355 | | | | 4,746,092 | |
| Reinvested distributions | | | - | | | | 1,353,824 | | | | - | | | | 47,913 | | | | 279,371 | | | | 711,970 | |
| Payments for shares redeemed | | | (44,682,682 | ) | | | (78,553,460 | ) | | | (469,418 | ) | | | (1,430,624 | ) | | | (2,541,416 | ) | | | (11,150,900 | ) |
Net Increase (Decrease) in Net Assets from Class C Share Transactions | | | (30,545,751 | ) | | | 77,643,456 | | | | (270,659 | ) | | | 239,875 | | | | (353,690 | ) | | | (5,692,838 | ) |
| | | | | | | | | | | | | | | | | | | | | | | | | |
| Class I | | | | | | | | | | | | | | | | | | | | | | | | |
| Proceeds from shares sold | | | 108,059,113 | | | | 650,508,692 | | | | 27,153 | | | | 1,075,770 | | | | 4,826,362 | | | | 18,134,078 | |
| Reinvested distributions | | | - | | | | 9,295,398 | | | | - | | | | 32,342 | | | | 1,780,441 | | | | 3,635,796 | |
| Payments for shares redeemed | | | (189,724,187 | ) | | | (264,368,176 | ) | | | (178,865 | ) | | | (1,836,714 | ) | | | (4,975,122 | ) | | | (27,345,985 | ) |
Net Increase (Decrease) in Net Assets from Class I Share Transactions | | | (81,665,074 | ) | | | 395,435,914 | | | | (151,712 | ) | | | (728,602 | ) | | | 1,631,681 | | | | (5,576,111 | ) |
| | | | | | | | | | | | | | | | | | | | | | | | | |
| Total Increase (Decrease) in Net Assets | | | (318,132,989 | ) | | | 277,635,263 | | | | (1,206,394 | ) | | | (23,176,698 | ) | | | 10,241,724 | | | | (53,095,026 | ) |
| | | | | | | | | | | | | | | | | | | | | | | | | |
| Net Assets | | | | | | | | | | | | | | | | | | | | | | | | |
| Beginning of period | | | 2,046,712,173 | | | | 1,769,076,910 | | | | 10,171,137 | | | | 33,347,835 | | | | 96,183,055 | | | | 149,278,081 | |
| End of period | | $ | 1,728,579,184 | | | $ | 2,046,712,173 | | | $ | 8,964,743 | | | $ | 10,171,137 | | | $ | 106,424,779 | | | $ | 96,183,055 | |
| | | | | | | | | | | | | | | | | | | | | | | | | |
| Accumulated Net Investment Income | | $ | 1,991,502 | | | $ | 19,471 | | | $ | 103,841 | | | $ | 9,629 | | | $ | 1,855,015 | | | $ | 1,848,067 | |
See accompanying Notes to Financial Statements.
| |
| Diamond Hill Funds Semi-Annual Report June 30, 2009 | Page 25 |
Diamond Hill Funds
Schedule of Capital Share Transactions
| | | | | | | | | | | | | | | | | | | | | | | | | |
| | | Small Cap Fund | | | Small-Mid Cap Fund | | | Large Cap Fund | | | Select Fund | |
| | | For the | | | For the | | | For the | | | For the | | | For the | | | For the | | | For the | | | For the | |
| | | Six Months | | | Year | | | Six Months | | | Year | | | Six Months | | | Year | | | Six Months | | | Year | |
| | | Ended | | | Ended | | | Ended | | | Ended | | | Ended | | | Ended | | | Ended | | | Ended | |
| | | June 30, 2009 | | | December 31, | | | June 30, 2009 | | | December 31, | | | June 30, 2009 | | | December 31, | | | June 30, 2009 | | | December 31, | |
| | | (Unaudited) | | | 2008 | | | (Unaudited) | | | 2008 | | | (Unaudited) | | | 2008 | | | (Unaudited) | | | 2008 | |
| Shares | | | | | | | | | | | | | | | | | | | | | | | | |
| Class A Shares: | | | | | | | | | | | | | | | | | | | | | | | | |
| Issued | | | 6,357,967 | | | | 10,266,061 | | | | 64,636 | | | | 289,014 | | | | 5,753,209 | | | | 13,291,568 | | | | 106,562 | | | | 323,220 | |
| Reinvested | | | - | | | | 137,839 | | | | - | | | | 12,084 | | | | - | | | | 525,497 | | | | - | | | | 27,267 | |
| Redeemed | | | (5,047,399 | ) | | | (5,717,870 | ) | | | (204,910 | ) | | | (264,232 | ) | | | (5,274,278 | ) | | | (8,542,167 | ) | | | (66,273 | ) | | | (404,382 | ) |
| Net increase (decrease) | | | | | | | | | | | | | | | | | | | | | | | | | | | | | | | | |
| in shares outstanding | | | 1,310,568 | | | | 4,686,030 | | | | (140,274 | ) | | | 36,866 | | | | 478,931 | | | | 5,274,898 | | | | 40,289 | | | | (53,895 | ) |
| Shares outstanding, | | | | | | | | | | | | | | | | | | | | | | | | | | | | | | | | |
| beginning of period | | | 18,682,799 | | | | 13,996,769 | | | | 1,041,287 | | | | 1,004,421 | | | | 24,327,857 | | | | 19,052,959 | | | | 590,948 | | | | 644,843 | |
| Shares outstanding, | | | | | | | | | | | | | | | | | | | | | | | | | | | | | | | | |
| end of period | | | 19,993,367 | | | | 18,682,799 | | | | 901,013 | | | | 1,041,287 | | | | 24,806,788 | | | | 24,327,857 | | | | 631,237 | | | | 590,948 | |
| Class C Shares: | | | | | | | | | | | | | | | | | | | | | | | | | | | | | | | | |
| Issued | | | 140,909 | | | | 281,053 | | | | 24,353 | | | | 270,568 | | | | 221,662 | | | | 962,293 | | | | 13,978 | | | | 99,457 | |
| Reinvested | | | - | | | | 1,616 | | | | - | | | | 3,153 | | | | - | | | | 26,397 | | | | - | | | | 13,549 | |
| Redeemed | | | (109,821 | ) | | | (388,155 | ) | | | (54,310 | ) | | | (95,115 | ) | | | (277,768 | ) | | | (672,715 | ) | | | (110,323 | ) | | | (271,176 | ) |
| Net increase (decrease) | | | | | | | | | | | | | | | | | | | | | | | | | | | | | | | | |
| in shares outstanding | | | 31,088 | | | | (105,486 | ) | | | (29,957 | ) | | | 178,606 | | | | (56,106 | ) | | | 315,975 | | | | (96,345 | ) | | | (158,170 | ) |
| Shares outstanding, | | | | | | | | | | | | | | | | | | | | | | | | | | | | | | | | |
| beginning of period | | | 1,068,044 | | | | 1,173,530 | | | | 408,158 | | | | 229,552 | | | | 2,026,265 | | | | 1,710,290 | | | | 496,327 | | | | 654,497 | |
| Shares outstanding, | | | | | | | | | | | | | | | | | | | | | | | | | | | | | | | | |
| end of period | | | 1,099,132 | | | | 1,068,044 | | | | 378,201 | | | | 408,158 | | | | 1,970,159 | | | | 2,026,265 | | | | 399,982 | | | | 496,327 | |
| Class I Shares: | | | | | | | | | | | | | | | | | | | | | | | | | | | | | | | | |
| Issued | | | 1,957,762 | | | | 2,084,582 | | | | 283,871 | | | | 1,736,017 | | | | 4,100,507 | | | | 11,396,090 | | | | 323,871 | | | | 1,137,816 | |
| Reinvested | | | - | | | | 26,236 | | | | - | | | | 32,475 | | | | - | | | | 289,028 | | | | - | | | | 51,050 | |
| Redeemed | | | (608,888 | ) | | | (1,176,261 | ) | | | (158,323 | ) | | | (1,485,008 | ) | | | (1,511,418 | ) | | | (3,369,905 | ) | | | (162,644 | ) | | | (520,927 | ) |
| Net increase in | | | | | | | | | | | | | | | | | | | | | | | | | | | | | | | | |
| shares outstanding | | | 1,348,874 | | | | 934,557 | | | | 125,548 | | | | 283,484 | | | | 2,589,089 | | | | 8,315,213 | | | | 161,227 | | | | 667,939 | |
| Shares outstanding, | | | | | | | | | | | | | | | | | | | | | | | | | | | | | | | | |
| beginning of period | | | 2,355,005 | | | | 1,420,448 | | | | 2,043,339 | | | | 1,759,855 | | | | 13,480,859 | | | | 5,165,646 | | | | 1,108,803 | | | | 440,864 | |
| Shares outstanding, | | | | | | | | | | | | | | | | | | | | | | | | | | | | | | | | |
| end of period | | | 3,703,879 | | | | 2,355,005 | | | | 2,168,887 | | | | 2,043,339 | | | | 16,069,948 | | | | 13,480,859 | | | | 1,270,030 | | | | 1,108,803 | |
See accompanying Notes to Financial Statements.
| |
| Page 26 | Diamond Hill Funds Semi-Annual Report June 30, 2009 |
Diamond Hill Funds
Schedule of Capital Share Transactions
| | | Long-Short Fund | | | Financial Long-Short Fund | | | Strategic Income Fund | |
| | | For the | | | For the | | | For the | | | For the | | | For the | | | For the | |
| | | Six Months | | | Year | | | Six Months | | | Year | | | Six Months | | | Year | |
| | | Ended | | | Ended | | | Ended | | | Ended | | | Ended | | | Ended | |
| | | June 30, 2009 | | | December 31, | | | June 30, 2009 | | | December 31, | | | June 30, 2009 | | | December 31, | |
| | | (Unaudited) | | | 2008 | | | (Unaudited) | | | 2008 | | | (Unaudited) | | | 2008 | |
| Shares | | | | | | | | | | | | | | | | | | |
| Class A Shares: | | | | | | | | | | | | | | | | | | |
| Issued | | | 11,320,459 | | | | 65,179,628 | | | | 177,359 | | | | 634,212 | | | | 1,025,559 | | | | 968,003 | |
| Reinvested | | | - | | | | 1,103,611 | | | | - | | | | 39,945 | | | | 106,618 | | | | 262,156 | |
| Redeemed | | | (29,107,082 | ) | | | (38,412,029 | ) | | | (245,279 | ) | | | (1,481,612 | ) | | | (1,180,189 | ) | | | (2,679,730 | ) |
| Net increase (decrease) in shares outstanding | | | (17,786,623 | ) | | | 27,871,210 | | | | (67,920 | ) | | | (807,455 | ) | | | (48,012 | ) | | | (1,449,571 | ) |
| Shares outstanding, beginning of period | | | 80,345,272 | | | | 52,474,062 | | | | 896,003 | | | | 1,703,458 | | | | 3,778,145 | | | | 5,227,716 | |
| Shares outstanding, end of period | | | 62,558,649 | | | | 80,345,272 | | | | 828,083 | | | | 896,003 | | | | 3,730,133 | | | | 3,778,145 | |
| Class C Shares: | | | | | | | | | | | | | | | | | | | | | | | | |
| Issued | | | 1,096,185 | | | | 8,794,676 | | | | 27,370 | | | | 128,589 | | | | 231,167 | | | | 480,530 | |
| Reinvested | | | - | | | | 100,951 | | | | - | | | | 6,051 | | | | 33,520 | | | | 74,559 | |
| Redeemed | | | (3,576,084 | ) | | | (5,138,019 | ) | | | (85,502 | ) | | | (115,460 | ) | | | (307,032 | ) | | | (1,141,468 | ) |
| Net increase (decrease) in shares outstanding | | | (2,479,899 | ) | | | 3,757,608 | | | | (58,132 | ) | | | 19,180 | | | | (42,345 | ) | | | (586,379 | ) |
| Shares outstanding, beginning of period | | | 20,945,684 | | | | 17,188,076 | | | | 229,828 | | | | 210,648 | | | | 1,781,157 | | | | 2,367,536 | |
| Shares outstanding, end of period | | | 18,465,785 | | | | 20,945,684 | | | | 171,696 | | | | 229,828 | | | | 1,738,812 | | | | 1,781,157 | |
| Class I Shares: | | | | | | | | | | | | | | | | | | | | | | | | |
| Issued | | | 8,008,791 | | | | 36,606,076 | | | | 3,467 | | | | 77,776 | | | | 566,945 | | | | 1,843,387 | |
| Reinvested | | | - | | | | 669,984 | | | | - | | | | 3,935 | | | | 213,739 | | | | 386,928 | |
| Redeemed | | | (14,340,836 | ) | | | (16,952,130 | ) | | | (27,159 | ) | | | (149,858 | ) | | | (618,465 | ) | | | (2,907,219 | ) |
| Net increase (decrease) in shares outstanding | | | (6,332,045 | ) | | | 20,323,930 | | | | (23,692 | ) | | | (68,147 | ) | | | 162,219 | | | | (676,904 | ) |
| Shares outstanding, beginning of period | | | 47,426,700 | | | | 27,102,770 | | | | 84,141 | | | | 152,288 | | | | 6,076,435 | | | | 6,753,339 | |
| Shares outstanding, end of period | | | 41,094,655 | | | | 47,426,700 | | | | 60,449 | | | | 84,141 | | | | 6,238,654 | | | | 6,076,435 | |
See accompanying Notes to Financial Statements.
| |
| Diamond Hill Funds Semi-Annual Report June 30, 2009 | Page 27 |
Diamond Hill Funds
Financial Highlights
For a share outstanding throughout each period.
| | | | | | | | | | | | | | | | | | | | | |
| | | For the Six | | | | | | | | | | | | | | | | | | |
| | | Months Ended | | | | Year Ended | | | Year Ended | | | Year Ended | | | Year Ended | | | | Year Ended | |
| | | June 30, 2009 | | | | December 31, | | | December 31, | | | December 31, | | | December 31, | | | | December 31, | |
| Diamond Hill Small Cap Fund - Class A | | (Unaudited) | | | | 2008 | | | 2007 | | | 2006 | | | | 2005 | (A) | | | 2004 | |
| Net asset value at beginning of period | | $ | 16.53 | | | | $ | 22.53 | | | $ | 25.03 | | | $ | 23.95 | | | $ | 21.41 | | | | $ | 16.82 | |
| Income (loss) from investment operations: | | | | | | | | | | | | | | | | | | | | | | | | | | |
| Net investment income (loss) | | | (0.00 | ) | (E) | | | 0.13 | | | | 0.08 | | | | 0.09 | | | | 0.02 | | | | | (0.03 | ) |
| Net realized and unrealized gains (losses) on investments | | | 0.77 | | | | | (5.98 | ) | | | (1.00 | ) | | | 1.60 | | | | 2.74 | | | | | 4.94 | |
| Total from investment operations | | | 0.77 | | | | | (5.85 | ) | | | (0.92 | ) | | | 1.69 | | | | 2.76 | | | | | 4.91 | |
| Less Distributions: | | | | | | | | | | | | | | | | | | | | | | | | | | |
| Dividends from net investment income | | | - | | | | | (0.12 | ) | | | (0.08 | ) | | | (0.09 | ) | | | (0.01 | ) | | | | - | |
| Distributions from net realized gains | | | - | | | | | (0.03 | ) | | | (1.50 | ) | | | (0.52 | ) | | | (0.21 | ) | | | | (0.32 | ) |
| Total distributions | | | - | | | | | (0.15 | ) | | | (1.58 | ) | | | (0.61 | ) | | | (0.22 | ) | | | | (0.32 | ) |
| Net asset value at end of period | | $ | 17.30 | | | | $ | 16.53 | | | $ | 22.53 | | | $ | 25.03 | | | $ | 23.95 | | | | $ | 21.41 | |
Total return(B) | | | 4.66 | % | (C) | | | (25.99 | )% | | | (3.79 | )% | | | 7.03 | % | | | 12.90 | % | | | | 29.26 | % |
| Net assets at end of period (000s) | | $ | 345,867 | | | | $ | 308,832 | | | $ | 315,378 | | | $ | 431,524 | | | $ | 308,925 | | | | $ | 55,411 | |
| Ratio of net expenses to average net assets | | | 1.36 | % | (D) | | | 1.35 | % | | | 1.39 | % | | | 1.42 | % | | | 1.45 | % | | | | 1.50 | % |
| Ratio of net investment income (loss) to average net assets | | | (0.00 | )% | (D), (F) | | | 0.75 | % | | | 0.29 | % | | | 0.38 | % | | | 0.19 | % | | | | (0.35 | )% |
| Ratio of gross expenses to average net assets | | | 1.36 | % | (D) | | | 1.35 | % | | | 1.39 | % | | | 1.42 | % | | | 1.45 | % | | | | 1.51 | % |
| Portfolio turnover rate | | | 34 | % | (D) | | | 47 | % | | | 21 | % | | | 30 | % | | | 15 | % | | | | 30 | % |
| | | | | | | | | | | | | | | | | | | | | | | | | | | |
| Diamond Hill Small Cap Fund - Class C | | | | | | | | | | | | | | | | | | | | | | | | | | |
| Net asset value at beginning of period | | $ | 15.72 | | | | $ | 21.44 | | | $ | 24.00 | | | $ | 23.08 | | | $ | 20.79 | | | | $ | 16.45 | |
| Income (loss) from investment operations: | | | | | | | | | | | | | | | | | | | | | | | | | | |
| Net investment loss | | | (0.05 | ) | | | | (0.01 | ) | | | (0.15 | ) | | | (0.10 | ) | | | (0.08 | ) | | | | (0.15 | ) |
| Net realized and unrealized gains (losses) on investments | | | 0.72 | | | | | (5.68 | ) | | | (0.91 | ) | | | 1.54 | | | | 2.58 | | | | | 4.81 | |
| Total from investment operations | | | 0.67 | | | | | (5.69 | ) | | | (1.06 | ) | | | 1.44 | | | | 2.50 | | | | | 4.66 | |
| Distributions from net realized gains | | | - | | | | | (0.03 | ) | | | (1.50 | ) | | | (0.52 | ) | | | (0.21 | ) | | | | (0.32 | ) |
| Net asset value at end of period | | $ | 16.39 | | | | $ | 15.72 | | | $ | 21.44 | | | $ | 24.00 | | | $ | 23.08 | | | | $ | 20.79 | |
Total return(B) | | | 4.26 | % | (C) | | | (26.55 | )% | | | (4.51 | )% | | | 6.23 | % | | | 12.05 | % | | | | 28.40 | % |
| Net assets at end of period (000s) | | $ | 18,018 | | | | $ | 16,790 | | | $ | 25,158 | | | $ | 35,035 | | | $ | 41,115 | | | | $ | 15,259 | |
| Ratio of net expenses to average net assets | | | 2.11 | % | (D) | | | 2.11 | % | | | 2.14 | % | | | 2.17 | % | | | 2.20 | % | | | | 2.25 | % |
| Ratio of net investment loss to average net assets | | | (0.75 | )% | (D) | | | (0.03 | )% | | | (0.46 | )% | | | (0.37 | )% | | | (0.61 | )% | | | | (1.20 | )% |
| Ratio of gross expenses to average net assets | | | 2.11 | % | (D) | | | 2.11 | % | | | 2.14 | % | | | 2.17 | % | | | 2.20 | % | | | | 2.26 | % |
| Portfolio turnover rate | | | 34 | % | (D) | | | 47 | % | | | 21 | % | | | 30 | % | | | 15 | % | | | | 30 | % |
| | | | | | | | | | | | | | | | | | | | | | | | | | | |
| Diamond Hill Small Cap Fund - Class I | | | | | | | | | | | | | | | | | | | | | | | | | | |
| Net asset value at beginning of period | | $ | 16.55 | | | | $ | 22.57 | | | $ | 25.08 | | | $ | 23.99 | | | $ | 19.93 | | | | | | |
| Income (loss) from investment operations: | | | | | | | | | | | | | | | | | | | | | | | | | | |
| Net investment income | | | 0.02 | | | | | 0.17 | | | | 0.22 | | | | 0.21 | | | | 0.04 | | | | | | |
| Net realized and unrealized gains (losses) on investments | | | 0.78 | | | | | (5.97 | ) | | | (1.05 | ) | | | 1.59 | | | | 4.27 | | | | | | |
| Total from investment operations | | | 0.80 | | | | | (5.80 | ) | | | (0.83 | ) | | | 1.80 | | | | 4.31 | | | | | | |
| Less Distributions: | | | | | | | | | | | | | | | | | | | | | | | | | | |
| Dividends from net investment income | | | - | | | | | (0.19 | ) | | | (0.18 | ) | | | (0.19 | ) | | | (0.04 | ) | | | | | |
| Distributions from net realized gains | | | - | | | | | (0.03 | ) | | | (1.50 | ) | | | (0.52 | ) | | | (0.21 | ) | | | | | |
| Total distributions | | | - | | | | | (0.22 | ) | | | (1.68 | ) | | | (0.71 | ) | | | (0.25 | ) | | | | | |
| Net asset value at end of period | | $ | 17.35 | | | | $ | 16.55 | | | $ | 22.57 | | | $ | 25.08 | | | $ | 23.99 | | | | | | |
| Total return | | | 4.83 | % | (C) | | | (25.69 | )% | | | (3.41 | )% | | | 7.49 | % | | | 21.63 | % | (C) | | | | |
| Net assets at end of period (000s) | | $ | 64,266 | | | | $ | 38,967 | | | $ | 32,057 | | | $ | 51,381 | | | $ | 35,434 | | | | | | |
| Ratio of net expenses to average net assets | | | 0.99 | % | (D) | | | 0.98 | % | | | 0.98 | % | | | 0.99 | % | | | 0.99 | % | (D) | | | | |
| Ratio of net investment income to average net assets | | | 0.38 | % | (D) | | | 1.17 | % | | | 0.69 | % | | | 0.82 | % | | | 0.74 | % | (D) | | | | |
| Ratio of gross expenses to average net assets | | | 0.99 | % | (D) | | | 0.98 | % | | | 0.98 | % | | | 0.99 | % | | | 0.99 | % | (D) | | | | |
| Portfolio turnover rate | | | 34 | % | (D) | | | 47 | % | | | 21 | % | | | 30 | % | | | 15 | % | | | | | |
| (A) | Class I commenced operations on April 29, 2005. |
| (B) | Total returns shown exclude the effect of applicable sales charges. |
| (E) | Amount rounds to less than 0.005. |
| (F) | Amount rounds to less than 0.005%. |
See accompanying Notes to Financial Statements.
| |
| Page 28 | Diamond Hill Funds Semi-Annual Report June 30, 2009 |
Diamond Hill Funds
Financial Highlights
For a share outstanding throughout each period.
| | | For the Six | | | | | | | | | | | |
| | | Months Ended | | | | Year Ended | | | Year Ended | | | Year Ended | |
| | | June 30, 2009 | | | | December 31, | | | December 31, | | | December 31, | |
| Diamond Hill Small-Mid Cap Fund - Class A | | (Unaudited) | | | | 2008 | | | 2007 | | | | 2006 | (A) |
| Net asset value at beginning of period | | $ | 7.26 | | | | $ | 10.50 | | | $ | 10.91 | | | $ | 10.00 | |
| Income (loss) from investment operations: | | | | | | | | | | | | | | | | | |
| Net investment income | | | 0.02 | | | | | 0.10 | | | | 0.06 | | | | 0.04 | |
| Net realized and unrealized gains (losses) on investments | | | 0.74 | | | | | (3.25 | ) | | | (0.15 | ) | | | 0.94 | |
| Total from investment operations | | | 0.76 | | | | | (3.15 | ) | | | (0.09 | ) | | | 0.98 | |
| Less Distributions: | | | | | | | | | | | | | | | | | |
| Dividends from net investment income | | | - | | | | | (0.09 | ) | | | (0.04 | ) | | | (0.01 | ) |
| Distributions from net realized gains | | | - | | | | | - | | | | (0.28 | ) | | | (0.06 | ) |
| Total distributions | | | - | | | | | (0.09 | ) | | | (0.32 | ) | | | (0.07 | ) |
| Net asset value at end of period | | $ | 8.02 | | | | $ | 7.26 | | | $ | 10.50 | | | $ | 10.91 | |
Total return(B) | | | 10.47 | % | (C) | | | (30.01 | )% | | | (0.91 | )% | | | 9.81 | % |
| Net assets at end of period (000s) | | $ | 7,228 | | | | $ | 7,557 | | | $ | 10,549 | | | $ | 9,608 | |
| Ratio of net expenses to average net assets | | | 1.31 | % | (D) | | | 1.32 | % | | | 1.33 | % | | | 1.21 | % |
| Ratio of net investment income to average net assets | | | 0.36 | % | (D) | | | 1.11 | % | | | 0.54 | % | | | 0.49 | % |
| Ratio of gross expenses to average net assets | | | 1.31 | % | (D) | | | 1.32 | % | | | 1.34 | % | | | 1.34 | % |
| Portfolio turnover rate | | | 66 | % | (D) | | | 91 | % | | | 39 | % | | | 33 | % |
| | | | | | | | | | | | | | | | | | |
| Diamond Hill Small-Mid Cap Fund - Class C | | | | | | | | | | | | | | | | | |
| Net asset value at beginning of period | | $ | 7.15 | | | | $ | 10.40 | | | $ | 10.85 | | | $ | 10.00 | |
| Income (loss) from investment operations: | | | | | | | | | | | | | | | | | |
| Net investment income (loss) | | | (0.02 | ) | | | | 0.04 | | | | (0.02 | ) | | | (0.02 | ) |
| Net realized and unrealized gains (losses) on investments | | | 0.75 | | | | | (3.22 | ) | | | (0.15 | ) | | | 0.93 | |
| Total from investment operations | | | 0.73 | | | | | (3.18 | ) | | | (0.17 | ) | | | 0.91 | |
| Less Distributions: | | | | | | | | | | | | | | | | | |
| Dividends from net investment income | | | - | | | | | (0.07 | ) | | | - | | | | - | |
| Distributions from net realized gains | | | - | | | | | - | | | | (0.28 | ) | | | (0.06 | ) |
| Total distributions | | | - | | | | | (0.07 | ) | | | (0.28 | ) | | | (0.06 | ) |
| Net asset value at end of period | | $ | 7.88 | | | | $ | 7.15 | | | $ | 10.40 | | | $ | 10.85 | |
Total return(B) | | | 10.21 | % | (C) | | | (30.54 | )% | | | (1.65 | )% | | | 9.08 | % |
| Net assets at end of period (000s) | | $ | 2,980 | | | | $ | 2,920 | | | $ | 2,388 | | | $ | 2,368 | |
| Ratio of net expenses to average net assets | | | 2.06 | % | (D) | | | 2.05 | % | | | 2.08 | % | | | 2.00 | % |
| Ratio of net investment income (loss) to average net assets | | | (0.39 | )% | (D) | | | 0.48 | % | | | (0.21 | )% | | | (0.27 | )% |
| Ratio of gross expenses to average net assets | | | 2.06 | % | (D) | | | 2.05 | % | | | 2.09 | % | | | 2.11 | % |
| Portfolio turnover rate | | | 66 | % | (D) | | | 91 | % | | | 39 | % | | | 33 | % |
| | | | | | | | | | | | | | | | | | |
| Diamond Hill Small-Mid Cap Fund - Class I | | | | | | | | | | | | | | | | | |
| Net asset value at beginning of period | | $ | 7.25 | | | | $ | 10.50 | | | $ | 10.91 | | | $ | 10.00 | |
| Income (loss) from investment operations: | | | | | | | | | | | | | | | | | |
| Net investment income | | | 0.03 | | | | | 0.13 | | | | 0.09 | | | | 0.04 | |
| Net realized and unrealized gains (losses) on investments | | | 0.75 | | | | | (3.26 | ) | | | (0.13 | ) | | | 0.98 | |
| Total from investment operations | | | 0.78 | | | | | (3.13 | ) | | | (0.04 | ) | | | 1.02 | |
| Less Distributions: | | | | | | | | | | | | | | | | | |
| Dividends from net investment income | | | - | | | | | (0.12 | ) | | | (0.09 | ) | | | (0.05 | ) |
| Distributions from net realized gains | | | - | | | | | - | | | | (0.28 | ) | | | (0.06 | ) |
| Total distributions | | | - | | | | | (0.12 | ) | | | (0.37 | ) | | | (0.11 | ) |
| Net asset value at end of period | | $ | 8.03 | | | | $ | 7.25 | | | $ | 10.50 | | | $ | 10.91 | |
| Total return | | | 10.76 | % | (C) | | | (29.77 | )% | | | (0.44 | )% | | | 10.18 | % |
| Net assets at end of period (000s) | | $ | 17,415 | | | | $ | 14,815 | | | $ | 18,478 | | | $ | 11,986 | |
| Ratio of net expenses to average net assets | | | 0.94 | % | (D) | | | 0.93 | % | | | 0.93 | % | | | 0.90 | % |
| Ratio of net investment income to average net assets | | | 0.74 | % | (D) | | | 1.49 | % | | | 0.97 | % | | | 1.01 | % |
| Ratio of gross expenses to average net assets | | | 0.94 | % | (D) | | | 0.93 | % | | | 0.94 | % | | | 0.98 | % |
| Portfolio turnover rate | | | 66 | % | (D) | | | 91 | % | | | 39 | % | | | 33 | % |
| (A) | Class A, Class C, and Class I commenced operations on December 31, 2005, and commenced public offering and investment operations on January 3, 2006. |
| (B) | Total returns shown exclude the effect of applicable sales charges. |
See accompanying Notes to Financial Statements.
| |
| Diamond Hill Funds Semi-Annual Report June 30, 2009 | Page 29 |
Diamond Hill Funds
Financial Highlights
For a share outstanding throughout each period.
| | | For the Six | | | | | | | | | | | | | | | | | | |
| | | Months Ended | | | | Year Ended | | | Year Ended | | | Year Ended | | | Year Ended | | | | Year Ended | |
| | | June 30, 2009 | | | | December 31, | | | December 31, | | | December 31, | | | December 31, | | | | December 31, | |
| Diamond Hill Large Cap Fund - Class A | | (Unaudited) | | | | 2008 | | | 2007 | | | 2006 | | | | 2005 | (A) | | | 2004 | |
| Net asset value at beginning of period | | $ | 10.47 | | | | $ | 16.25 | | | $ | 16.36 | | | $ | 14.44 | | | $ | 12.51 | | | | $ | 10.34 | |
| Income (loss) from investment operations: | | | | | | | | | | | | | | | | | | | | | | | | | | |
| Net investment income | | | 0.06 | | | | | 0.15 | | | | 0.21 | | | | 0.15 | | | | 0.05 | | | | | 0.02 | |
| Net realized and unrealized gains (losses) on investments | | | 0.34 | | | | | (5.69 | ) | | | 0.69 | | | | 2.03 | | | | 1.98 | | | | | 2.16 | |
| Total from investment operations | | | 0.40 | | | | | (5.54 | ) | | | 0.90 | | | | 2.18 | | | | 2.03 | | | | | 2.18 | |
| Less Distributions: | | | | | | | | | | | | | | | | | | | | | | | | | | |
| Dividends from net investment income | | | - | | | | | (0.14 | ) | | | (0.19 | ) | | | (0.14 | ) | | | (0.06 | ) | | | | (0.01 | ) |
| Distributions from net realized gains | | | - | | | | | (0.10 | ) | | | (0.82 | ) | | | (0.12 | ) | | | (0.04 | ) | | | | - | |
| Total distributions | | | - | | | | | (0.24 | ) | | | (1.01 | ) | | | (0.26 | ) | | | (0.10 | ) | | | | (0.01 | ) |
| Net asset value at end of period | | $ | 10.87 | | | | $ | 10.47 | | | $ | 16.25 | | | $ | 16.36 | | | $ | 14.44 | | | | $ | 12.51 | |
Total return(B) | | | 3.82 | % | (C) | | | (34.06 | )% | | | 5.42 | % | | | 15.06 | % | | | 16.19 | % | | | | 21.12 | % |
| Net assets at end of period (000s) | | $ | 269,536 | | | | $ | 254,688 | | | $ | 309,617 | | | $ | 338,286 | | | $ | 96,637 | | | | $ | 17,369 | |
| Ratio of net expenses to average net assets | | | 1.16 | % | (D) | | | 1.16 | % | | | 1.18 | % | | | 1.21 | % | | | 1.27 | % | | | | 1.40 | % |
| Ratio of net investment income to average net assets | | | 1.14 | % | (D) | | | 1.23 | % | | | 1.15 | % | | | 1.32 | % | | | 1.08 | % | | | | 0.26 | % |
| Ratio of gross expenses to average net assets | | | 1.16 | % | (D) | | | 1.16 | % | | | 1.19 | % | | | 1.21 | % | | | 1.27 | % | | | | 1.42 | % |
| Portfolio turnover rate | | | 32 | % | (D) | | | 28 | % | | | 44 | % | | | 32 | % | | | 15 | % | | | | 13 | % |
| | | | | | | | | | | | | | | | | | | | | | | | | | | |
| Diamond Hill Large Cap Fund - Class C | | | | | | | | | | | | | | | | | | | | | | | | | | |
| Net asset value at beginning of period | | $ | 10.19 | | | | $ | 15.84 | | | $ | 15.99 | | | $ | 14.15 | | | $ | 12.31 | | | | $ | 10.23 | |
| Income (loss) from investment operations: | | | | | | | | | | | | | | | | | | | | | | | | | | |
| Net investment income (loss) | | | 0.02 | | | | | 0.06 | | | | 0.06 | | | | 0.06 | | | | 0.05 | | | | | (0.04 | ) |
| Net realized and unrealized gains (losses) on investments | | | 0.33 | | | | | (5.55 | ) | | | 0.70 | | | | 1.95 | | | | 1.83 | | | | | 2.12 | |
| Total from investment operations | | | 0.35 | | | | | (5.49 | ) | | | 0.76 | | | | 2.01 | | | | 1.88 | | | | | 2.08 | |
| Less Distributions: | | | | | | | | | | | | | | | | | | | | | | | | | | |
| Dividends from net investment income | | | - | | | | | (0.06 | ) | | | (0.09 | ) | | | (0.05 | ) | | | - | | | | | - | |
| Distributions from net realized gains | | | - | | | | | (0.10 | ) | | | (0.82 | ) | | | (0.12 | ) | | | (0.04 | ) | | | | - | |
| Total distributions | | | - | | | | | (0.16 | ) | | | (0.91 | ) | | | (0.17 | ) | | | (0.04 | ) | | | | - | |
| Net asset value at end of period | | $ | 10.54 | | | | $ | 10.19 | | | $ | 15.84 | | | $ | 15.99 | | | $ | 14.15 | | | | $ | 12.31 | |
Total return(B) | | | 3.43 | % | (C) | | | (34.64 | )% | | | 4.68 | % | | | 14.18 | % | | | 15.25 | % | | | | 20.33 | % |
| Net assets at end of period (000s) | | $ | 20,766 | | | | $ | 20,656 | | | $ | 27,084 | | | $ | 22,438 | | | $ | 9,518 | | | | $ | 1,700 | |
| Ratio of net expenses to average net assets | | | 1.91 | % | (D) | | | 1.91 | % | | | 1.93 | % | | | 1.96 | % | | | 2.02 | % | | | | 2.15 | % |
| Ratio of net investment income (loss) to average net assets | | | 0.39 | % | (D) | | | 0.48 | % | | | 0.43 | % | | | 0.57 | % | | | 0.26 | % | | | | (0.54 | )% |
| Ratio of gross expenses to average net assets | | | 1.91 | % | (D) | | | 1.91 | % | | | 1.93 | % | | | 1.96 | % | | | 2.02 | % | | | | 2.17 | % |
| Portfolio turnover rate | | | 32 | % | (D) | | | 28 | % | | | 44 | % | | | 32 | % | | | 15 | % | | | | 13 | % |
| | | | | | | | | | | | | | | | | | | | | | | | | | | |
| Diamond Hill Large Cap Fund - Class I | | | | | | | | | | | | | | | | | | | | | | | | | | |
| Net asset value at beginning of period | | $ | 10.49 | | | | $ | 16.29 | | | $ | 16.40 | | | $ | 14.47 | | | $ | 12.38 | | | | | | |
| Income (loss) from investment operations: | | | | | | | | | | | | | | | | | | | | | | | | | | |
| Net investment income | | | 0.07 | | | | | 0.23 | | | | 0.25 | | | | 0.13 | | | | 0.08 | | | | | | |
| Net realized and unrealized gains (losses) on investments | | | 0.35 | | | | | (5.74 | ) | | | 0.73 | | | | 2.12 | | | | 2.13 | | | | | | |
| Total from investment operations | | | 0.42 | | | | | (5.51 | ) | | | 0.98 | | | | 2.25 | | | | 2.21 | | | | | | |
| Less Distributions: | | | | | | | | | | | | | | | | | | | | | | | | | | |
| Dividends from net investment income | | | - | | | | | (0.19 | ) | | | (0.27 | ) | | | (0.20 | ) | | | (0.08 | ) | | | | | |
| Distributions from net realized gains | | | - | | | | | (0.10 | ) | | | (0.82 | ) | | | (0.12 | ) | | | (0.04 | ) | | | | | |
| Total distributions | | | - | | | | | (0.29 | ) | | | (1.09 | ) | | | (0.32 | ) | | | (0.12 | ) | | | | | |
| Net asset value at end of period | | $ | 10.91 | | | | $ | 10.49 | | | $ | 16.29 | | | $ | 16.40 | | | $ | 14.47 | | | | | | |
| Total return | | | 4.00 | % | (C) | | | (33.82 | )% | | | 5.88 | % | | | 15.49 | % | | | 17.84 | % | (C) | | | | |
| Net assets at end of period (000s) | | $ | 175,264 | | | | $ | 141,416 | | | $ | 84,129 | | | $ | 59,182 | | | $ | 10,442 | | | | | | |
| Ratio of net expenses to average net assets | | | 0.79 | % | (D) | | | 0.78 | % | | | 0.78 | % | | | 0.78 | % | | | 0.80 | % | (D) | | | | |
| Ratio of net investment income to average net assets | | | 1.52 | % | (D) | | | 1.67 | % | | | 1.60 | % | | | 1.82 | % | | | 1.60 | % | (D) | | | | |
| Ratio of gross expenses to average net assets | | | 0.79 | % | (D) | | | 0.78 | % | | | 0.78 | % | | | 0.78 | % | | | 0.80 | % | (D) | | | | |
| Portfolio turnover rate | | | 32 | % | (D) | | | 28 | % | | | 44 | % | | | 32 | % | | | 15 | % | | | | | |
| (A) | Class I commenced operations on January 31, 2005. |
| | |
| (B) | Total returns shown exclude the effect of applicable sales charges. |
| | |
See accompanying Notes to Financial Statements.
| |
| Page 30 | Diamond Hill Funds Semi-Annual Report June 30, 2009 |
Diamond Hill Funds
Financial Highlights
For a share outstanding throughout each period.
| | | For the Six | | | | | | | | | | | |
| | | Months Ended | | | | Year Ended | | | Year Ended | | | Year Ended | |
| | | June 30, 2009 | | | | December 31, | | | December 31, | | | December 31, | |
| Diamond Hill Select Fund - Class A | | (Unaudited) | | | | 2008 | | | 2007 | | | | 2006 | (A) |
| Net asset value at beginning of period | | $ | 6.82 | | | | $ | 10.61 | | | $ | 11.17 | | | $ | 10.00 | |
| Income (loss) from investment operations: | | | | | | | | | | | | | | | | | |
| Net investment income | | | 0.01 | | | | | 0.09 | | | | 0.12 | | | | 0.10 | |
| Net realized and unrealized gains (losses) on investments | | | 0.31 | | | | | (3.55 | ) | | | 0.53 | | | | 1.27 | |
| Total from investment operations | | | 0.32 | | | | | (3.46 | ) | | | 0.65 | | | | 1.37 | |
| Less Distributions: | | | | | | | | | | | | | | | | | |
| Dividends from net investment income | | | - | | | | | (0.08 | ) | | | (0.09 | ) | | | (0.08 | ) |
| Distributions from net realized gains | | | - | | | | | (0.25 | ) | | | (1.12 | ) | | | (0.12 | ) |
| Total distributions | | | - | | | | | (0.33 | ) | | | (1.21 | ) | | | (0.20 | ) |
| Net asset value at end of period | | $ | 7.14 | | | | $ | 6.82 | | | $ | 10.61 | | | $ | 11.17 | |
Total return(B) | | | 4.69 | % | (C) | | | (32.68 | )% | | | 5.63 | % | | | 13.66 | % |
| Net assets at end of period (000s) | | $ | 4,509 | | | | $ | 4,030 | | | $ | 6,841 | | | $ | 10,036 | |
| Ratio of net expenses to average net assets | | | 1.26 | % | (D) | | | 1.28 | % | | | 1.29 | % | | | 1.31 | % |
| Ratio of net investment income to average net assets | | | 0.48 | % | (D) | | | 1.10 | % | | | 0.90 | % | | | 1.04 | % |
| Ratio of gross expenses to average net assets | | | 1.26 | % | (D) | | | 1.28 | % | | | 1.29 | % | | | 1.32 | % |
| Portfolio turnover rate | | | 87 | % | (D) | | | 85 | % | | | 55 | % | | | 80 | % |
| | | | | | | | | | | | | | | | | | |
| Diamond Hill Select Fund - Class C | | | | | | | | | | | | | | | | | |
| Net asset value at beginning of period | | $ | 6.78 | | | | $ | 10.56 | | | $ | 11.16 | | | $ | 10.00 | |
| Income (loss) from investment operations: | | | | | | | | | | | | | | | | | |
| Net investment income | | | 0.01 | | | | | 0.02 | | | | 0.02 | | | | 0.02 | |
| Net realized and unrealized gains (losses) on investments | | | 0.32 | | | | | (3.55 | ) | | | 0.54 | | | | 1.30 | |
| Total from investment operations | | | 0.33 | | | | | (3.53 | ) | | | 0.56 | | | | 1.32 | |
| Less Distributions: | | | | | | | | | | | | | | | | | |
| Dividends from net investment income | | | - | | | | | - | | | | (0.04 | ) | | | (0.04 | ) |
| Distributions from net realized gains | | | - | | | | | (0.25 | ) | | | (1.12 | ) | | | (0.12 | ) |
| Total distributions | | | - | | | | | (0.25 | ) | | | (1.16 | ) | | | (0.16 | ) |
| Net asset value at end of period | | $ | 7.11 | | | | $ | 6.78 | | | $ | 10.56 | | | $ | 11.16 | |
Total return(B) | | | 4.87 | % | (C) | | | (33.48 | )% | | | 4.78 | % | | | 13.11 | % |
| Net assets at end of period (000s) | | $ | 2,842 | | | | $ | 3,366 | | | $ | 6,912 | | | $ | 5,661 | |
| Ratio of net expenses to average net assets | | | 2.01 | % | (D) | | | 2.01 | % | | | 2.03 | % | | | 2.05 | % |
| Ratio of net investment income to average net assets | | | 0.29 | % | (D) | | | 0.28 | % | | | 0.23 | % | | | 0.32 | % |
| Ratio of gross expenses to average net assets | | | 2.01 | % | (D) | | | 2.02 | % | | | 2.04 | % | | | 2.06 | % |
| Portfolio turnover rate | | | 87 | % | (D) | | | 85 | % | | | 55 | % | | | 80 | % |
| | | | | | | | | | | | | | | | | | |
| Diamond Hill Select Fund - Class I | | | | | | | | | | | | | | | | | |
| Net asset value at beginning of period | | $ | 6.75 | | | | $ | 10.59 | | | $ | 11.16 | | | $ | 10.00 | |
| Income (loss) from investment operations: | | | | | | | | | | | | | | | | | |
| Net investment income | | | 0.05 | | | | | 0.11 | | | | 0.13 | | | | 0.09 | |
| Net realized and unrealized gains (losses) on investments | | | 0.33 | | | | | (3.58 | ) | | | 0.57 | | | | 1.32 | |
| Total from investment operations | | | 0.38 | | | | | (3.47 | ) | | | 0.70 | | | | 1.41 | |
| Less Distributions: | | | | | | | | | | | | | | | | | |
| Dividends from net investment income | | | - | | | | | (0.12 | ) | | | (0.15 | ) | | | (0.13 | ) |
| Distributions from net realized gains | | | - | | | | | (0.25 | ) | | | (1.12 | ) | | | (0.12 | ) |
| Total distributions | | | - | | | | | (0.37 | ) | | | (1.27 | ) | | | (0.25 | ) |
| Net asset value at end of period | | $ | 7.13 | | | | $ | 6.75 | | | $ | 10.59 | | | $ | 11.16 | |
| Total return | | | 5.63 | % | (C) | | | (32.85 | )% | | | 6.10 | % | | | 14.04 | % |
| Net assets at end of period (000s) | | $ | 9,049 | | | | $ | 7,489 | | | $ | 4,667 | | | $ | 3,220 | |
| Ratio of net expenses to average net assets | | | 0.89 | % | (D) | | | 0.87 | % | | | 0.88 | % | | | 0.84 | % |
| Ratio of net investment income to average net assets | | | 1.66 | % | (D) | | | 1.58 | % | | | 1.37 | % | | | 1.47 | % |
| Ratio of gross expenses to average net assets | | | 0.89 | % | (D) | | | 0.87 | % | | | 0.89 | % | | | 0.86 | % |
| Portfolio turnover rate | | | 87 | % | (D) | | | 85 | % | | | 55 | % | | | 80 | % |
| (A) | Class A, Class C, and Class I commenced operations on December 31, 2005, and commenced public offering and investment operations on January 3, 2006. |
| (B) | Total returns shown exclude the effect of applicable sales charges. |
See accompanying Notes to Financial Statements.
| |
| Diamond Hill Funds Semi-Annual Report June 30, 2009 | Page 31 |
Diamond Hill Funds
Financial Highlights
For a share outstanding throughout each period.
| | | For the Six | | | | | | | | | | | | | | | | | | |
| | | Months Ended | | | | Year Ended | | | Year Ended | | | Year Ended | | | Year Ended | | | | Year Ended | |
| | | June 30, 2009 | | | | December 31, | | | December 31, | | | December 31, | | | December 31, | | | | December 31, | |
| Diamond Hill Long-Short Fund - Class A | | (Unaudited) | | | | 2008 | | | 2007 | | | 2006 | | | | 2005(A) | | | | 2004 | |
| Net asset value at beginning of period | | $ | 13.83 | | | | $ | 18.40 | | | $ | 18.57 | | | $ | 16.46 | | | $ | 13.67 | | | | $ | 11.75 | |
| Income (loss) from investment operations: | | | | | | | | | | | | | | | | | | | | | | | | | | |
| Net investment income | | | 0.02 | | | | | 0.16 | | | | 0.44 | | | | 0.26 | | | | 0.10 | | | | | 0.00 | |
| Net realized and unrealized gains (losses) on investments | | | 0.38 | | | | | (4.52 | ) | | | 0.16 | | | | 2.52 | | | | 2.83 | | | | | 1.98 | |
| Total from investment operations | | | 0.40 | | | | | (4.36 | ) | | | 0.60 | | | | 2.78 | | | | 2.93 | | | | | 1.98 | |
| Less Distributions: | | | | | | | | | | | | | | | | | | | | | | | | | | |
| Dividends from net investment income | | | - | | | | | (0.15 | ) | | | (0.42 | ) | | | (0.25 | ) | | | (0.10 | ) | | | | - | |
| Distributions from net realized gains | | | - | | | | | (0.06 | ) | | | (0.35 | ) | | | (0.42 | ) | | | (0.04 | ) | | | | (0.06 | ) |
| Total distributions | | | - | | | | | (0.21 | ) | | | (0.77 | ) | | | (0.67 | ) | | | (0.14 | ) | | | | (0.06 | ) |
| Net asset value at end of period | | $ | 14.23 | | | | $ | 13.83 | | | $ | 18.40 | | | $ | 18.57 | | | $ | 16.46 | | | | $ | 13.67 | |
Total return(C) | | | 2.89 | % | (E) | | | (23.65 | )% | | | 3.14 | % | | | 16.89 | % | | | 21.46 | % | | | | 16.86 | % |
| Net assets at end of period (000s) | | $ | 889,947 | | | | $ | 1,110,982 | | | $ | 965,259 | | | $ | 773,161 | | | $ | 180,035 | | | | $ | 47,008 | |
| Ratio of net expenses to average net assets | | | 1.81 | % | (F) | | | 1.62 | % | | | 1.69 | % | | | 1.77 | % | | | 1.82 | % | | | | 1.78 | % |
| Ratio of net investment income to average net assets | | | 0.20 | % | (F) | | | 0.95 | % | | | 2.46 | % | | | 2.15 | % | | | 1.12 | % | | | | 0.01 | % |
| Ratio of gross expenses to average net assets | | | 1.81 | % | (F) | | | 1.62 | % | | | 1.69 | % | | | 1.77 | % | | | 1.82 | % | | | | 1.79 | % |
| Ratio of net expenses to average net assets, excluding | | | | (F) | | | | | | | | | | | | | | | | | | | | | |
| dividends on securities sold short | | | 1.46 | % | (F) | | | 1.45 | % | | | 1.48 | % | | | 1.51 | % | | | 1.55 | % | | | | 1.60 | % |
| Portfolio turnover rate | | | 51 | % | (F) | | | 59 | % | | | 59 | % | | | 83 | % | | | 58 | % | (D) | | | 53 | % |
| | | | | | | | | | | | | | | | | | | | | | | | | | | |
| Diamond Hill Long-Short Fund - Class C | | | | | | | | | | | | | | | | | | | | | | | | | | |
| Net asset value at beginning of period | | $ | 13.28 | | | | $ | 17.65 | | | $ | 17.88 | | | $ | 15.92 | | | $ | 13.26 | | | | $ | 11.48 | |
| Income (loss) from investment operations: | | | | | | | | | | | | | | | | | | | | | | | | | | |
| Net investment income (loss) | | | (0.04 | ) | | | | 0.04 | | | | 0.27 | | | | 0.16 | | | | 0.03 | | | | | (0.05 | ) |
| Net realized and unrealized gains (losses) on investments | | | 0.37 | | | | | (4.32 | ) | | | 0.16 | | | | 2.38 | | | | 2.70 | | | | | 1.89 | |
| Total from investment operations | | | 0.33 | | | | | (4.28 | ) | | | 0.43 | | | | 2.54 | | | | 2.73 | | | | | 1.84 | |
| Less Distributions: | | | | | | | | | | | | | | | | | | | | | | | | | | |
| Dividends from net investment income | | | - | | | | | (0.03 | ) | | | (0.31 | ) | | | (0.16 | ) | | | (0.03 | ) | | | | - | |
| Distributions from net realized gains | | | - | | | | | (0.06 | ) | | | (0.35 | ) | | | (0.42 | ) | | | (0.04 | ) | | | | (0.06 | ) |
| Total distributions | | | - | | | | | (0.09 | ) | | | (0.66 | ) | | | (0.58 | ) | | | (0.07 | ) | | | | (0.06 | ) |
| Net asset value at end of period | | $ | 13.61 | | | | $ | 13.28 | | | $ | 17.65 | | | $ | 17.88 | | | $ | 15.92 | | | | $ | 13.26 | |
Total return(C) | | | 2.48 | % | (E) | | | (24.26 | )% | | | 2.41 | % | | | 15.98 | % | | | 20.58 | % | | | | 16.04 | % |
| Net assets at end of period (000s) | | $ | 251,268 | | | | $ | 278,069 | | | $ | 303,392 | | | $ | 188,550 | | | $ | 70,891 | | | | $ | 20,810 | |
| Ratio of net expenses to average net assets | | | 2.56 | % | (F) | | | 2.37 | % | | | 2.44 | % | | | 2.52 | % | | | 2.57 | % | | | | 2.53 | % |
| Ratio of net investment income (loss) to average net assets | | | (0.56 | )% | (F) | | | 0.22 | % | | | 1.72 | % | | | 1.40 | % | | | 0.37 | % | | | | (0.73 | )% |
| Ratio of gross expenses to average net assets | | | 2.56 | % | (F) | | | 2.37 | % | | | 2.44 | % | | | 2.52 | % | | | 2.57 | % | | | | 2.54 | % |
| Ratio of net expenses to average net assets, excluding | | | | (F) | | | | | | | | | | | | | | | | | | | | | |
| dividends on securities sold short | | | 2.22 | % | (F) | | | 2.20 | % | | | 2.23 | % | | | 2.26 | % | | | 2.30 | % | | | | 2.35 | % |
| Portfolio turnover rate | | | 51 | % | (F) | | | 59 | % | | | 59 | % | | | 83 | % | | | 58 | % | (D) | | | 53 | % |
| | | | | | | | | | | | | | | | | | | | | | | | | | | |
| Diamond Hill Long-Short Fund - Class I | | | | | | | | | | | | | | | | | | | | | | | | | | |
| Net asset value at beginning of period | | $ | 13.87 | | | | $ | 18.46 | | | $ | 18.63 | | | $ | 16.49 | | | $ | 13.80 | | | | | | |
| Income (loss) from investment operations: | | | | | | | | | | | | | | | | | | | | | | | | | | |
| Net investment income | | | 0.04 | | | | | 0.19 | | | | 0.48 | | | | 0.28 | | | | 0.14 | | | | | | |
| Net realized and unrealized gains (losses) on investments | | | 0.38 | | | | | (4.51 | ) | | | 0.19 | | | | 2.59 | | | | 2.73 | | | | | | |
| Total from investment operations | | | 0.42 | | | | | (4.32 | ) | | | 0.67 | | | | 2.87 | | | | 2.87 | | | | | | |
| Less Distributions: | | | | | | | | | | | | | | | | | | | | | | | | | | |
| Dividends from net investment income | | | - | | | | | (0.21 | ) | | | (0.49 | ) | | | (0.31 | ) | | | (0.14 | ) | | | | | |
| Distributions from net realized gains | | | - | | | | | (0.06 | ) | | | (0.35 | ) | | | (0.42 | ) | | | (0.04 | ) | | | | | |
| Total distributions | | | - | | | | | (0.27 | ) | | | (0.84 | ) | | | (0.73 | ) | | | (0.18 | ) | | | | | |
| Net asset value at end of period | | $ | 14.29 | | | | $ | 13.87 | | | $ | 18.46 | | | $ | 18.63 | | | $ | 16.49 | | | | | | |
| Total return | | | 3.03 | % | (E) | | | (23.36 | )% | | | 3.59 | % | | | 17.37 | % | | | 20.81 | % | (E) | | | | |
| Net assets at end of period (000s) | | $ | 587,364 | | | | $ | 657,662 | | | $ | 500,425 | | | $ | 290,734 | | | $ | 56,873 | | | | | | |
| Ratio of net expenses to average net assets | | | 1.43 | % | (F) | | | 1.24 | % | | | 1.29 | % | | | 1.34 | % | | | 1.39 | % | (F) | | | | |
| Ratio of net investment income to average net assets | | | 0.58 | % | (F) | | | 1.33 | % | | | 2.87 | % | | | 2.60 | % | | | 1.71 | % | (F) | | | | |
| Ratio of gross expenses to average net assets | | | 1.43 | % | (F) | | | 1.24 | % | | | 1.29 | % | | | 1.34 | % | | | 1.39 | % | (F) | | | | |
| Ratio of net expenses to average net assets, excluding | | | | (F) | | | | | | | | | | | | | | | | | (F) | | | | |
| dividends on securities sold short | | | 1.09 | % | (F) | | | 1.08 | % | | | 1.08 | % | | | 1.08 | % | | | 1.10 | % | (F) | | | | |
| Portfolio turnover rate | | | 51 | % | (F) | | | 59 | % | | | 59 | % | | | 83 | % | | | 58 | % | (F) | | | | |
| (A) | Class I commenced operations on January 31, 2005. |
| (B) | Amount rounds to less than $0.005. |
| (C) | Total returns shown exclude the effect of applicable sales charges. |
| (D) | The portfolio turnover rate for December 31, 2005 and December 31, 2004 has been revised to include long-term short selling transactions. |
See accompanying Notes to Financial Statements.
| |
| Page 32 | Diamond Hill Funds Semi-Annual Report June 30, 2009 |
Diamond Hill FundsFinancial Highlights
For a share outstanding throughout each period.
| | | For the Six | | | | | | | | | | | | | | | | | |
| | | Months Ended | | | | Year Ended | | | Year Ended | | | Year Ended | | | Year Ended | | | Year Ended | |
| | | June 30, 2009 | | | | December 31, | | | December 31, | | | December 31, | | | December 31, | | | December 31, | |
| Diamond Hill Financial Long-Short Fund - Class A | | (Unaudited) | | | | 2008 | | | | 2007 | (A) | | 2006 | | | 2005 | | | 2004 | |
| Net asset value at beginning of period | | $ | 8.48 | | | | $ | 16.20 | | | $ | 20.90 | | | $ | 18.48 | | | $ | 19.10 | | | $ | 17.92 | |
| Income (loss) from investment operations: | | | | | | | | | | | | | | | | | | | | | | | | | |
| Net investment income | | | 0.10 | | | | | 0.45 | | | | 0.49 | | | | 0.23 | | | | 0.29 | | | | 0.13 | |
| Net realized and unrealized gains (losses) on investments | | | (0.06 | ) | | | | (7.74 | ) | | | (4.04 | ) | | | 2.79 | | | | (0.24 | ) | | | 2.84 | |
| Total from investment operations | | | 0.04 | | | | | (7.29 | ) | | | (3.55 | ) | | | 3.02 | | | | 0.05 | | | | 2.97 | |
| Less Distributions: | | | | | | | | | | | | | | | | | | | | | | | | | |
| Dividends from net investment income | | | - | | | | | (0.42 | ) | | | (0.47 | ) | | | (0.24 | ) | | | (0.30 | ) | | | (0.13 | ) |
| Distributions from net realized gains | | | - | | | | | (0.01 | ) | | | (0.68 | ) | | | (0.36 | ) | | | (0.37 | ) | | | (1.66 | ) |
| Total distributions | | | - | | | | | (0.43 | ) | | | (1.15 | ) | | | (0.60 | ) | | | (0.67 | ) | | | (1.79 | ) |
| Net asset value at end of period | | $ | 8.52 | | | | $ | 8.48 | | | $ | 16.20 | | | $ | 20.90 | | | $ | 18.48 | | | $ | 19.10 | |
Total return(B) | | | 0.47 | % | (D) | | | (44.98 | )% | | | (17.05 | )% | | | 16.35 | % | | | 0.25 | % | | | 16.67 | % |
| Net assets at end of period (000s) | | $ | 7,056 | | | | $ | 7,596 | | | $ | 27,597 | | | $ | 38,978 | | | $ | 17,366 | | | $ | 20,682 | |
| Ratio of net expenses to average net assets | | | 1.74 | % | (E) | | | 1.85 | % | | | 1.81 | % | | | 1.70 | % | | | 1.67 | % | | | 1.70 | % |
| Ratio of net investment income to average net assets | | | 2.44 | % | (E) | | | 2.37 | % | | | 2.17 | % | | | 1.80 | % | | | 1.41 | % | | | 0.90 | % |
| Ratio of gross expenses to average net assets | | | 1.74 | % | (E) | | | 1.85 | % | | | 1.82 | % | | | 1.70 | % | | | 1.67 | % | | | 1.71 | % |
| Ratio of net expenses to average net assets, excluding | | | | | | | | | | | | | | | | | | | | | | | | | |
| dividends on securities sold short | | | 1.57 | % | (E) | | | 1.56 | % | | | 1.59 | % | | | 1.62 | % | | | - | | | | - | |
| Portfolio turnover rate | | | 100 | % | (E) | | | 74 | % | | | 55 | % | | | 45 | % | | | 28 | % | | | 36 | % |
| | | | | | | | | | | | | | | | | | | | | | | | | | |
| Diamond Hill Financial Long-Short Fund - Class C | | | | | | | | | | | | | | | | | | | | | | | | | |
| Net asset value at beginning of period | | $ | 8.12 | | | | $ | 15.60 | | | $ | 20.10 | | | $ | 17.84 | | | $ | 18.42 | | | $ | 17.39 | |
| Income (loss) from investment operations: | | | | | | | | | | | | | | | | | | | | | | | | | |
| Net investment income | | | 0.01 | | | | | 0.21 | | | | 0.34 | | | | 0.13 | | | | 0.15 | | | | 0.03 | |
| Net realized and unrealized gains (losses) on investments | | | (0.00 | ) | (C) | | | (7.31 | ) | | | (3.88 | ) | | | 2.63 | | | | (0.24 | ) | | | 2.70 | |
| Total from investment operations | | | 0.01 | | | | | (7.10 | ) | | | (3.54 | ) | | | 2.76 | | | | (0.09 | ) | | | 2.73 | |
| Less Distributions: | | | | | | | | | | | | | | | | | | | | | | | | | |
| Dividends from net investment income | | | - | | | | | (0.37 | ) | | | (0.28 | ) | | | (0.14 | ) | | | (0.12 | ) | | | (0.04 | ) |
| Distributions from net realized gains | | | - | | | | | (0.01 | ) | | | (0.68 | ) | | | (0.36 | ) | | | (0.37 | ) | | | (1.66 | ) |
| Total distributions | | | - | | | | | (0.38 | ) | | | (0.96 | ) | | | (0.50 | ) | | | (0.49 | ) | | | (1.70 | ) |
| Net asset value at end of period | | $ | 8.13 | | | | $ | 8.12 | | | $ | 15.60 | | | $ | 20.10 | | | $ | 17.84 | | | $ | 18.42 | |
Total return(B) | | | 0.12 | % | (D) | | | (45.49 | )% | | | (17.68 | )% | | | 15.47 | % | | | (0.49 | )% | | | 15.79 | % |
| Net assets at end of period (000s) | | $ | 1,396 | | | | $ | 1,866 | | | $ | 3,287 | | | $ | 4,620 | | | $ | 2,544 | | | $ | 3,941 | |
| Ratio of net expenses to average net assets | | | 2.50 | % | (E) | | | 2.58 | % | | | 2.56 | % | | | 2.45 | % | | | 2.42 | % | | | 2.45 | % |
| Ratio of net investment income to average net assets | | | 1.69 | % | (E) | | | 1.76 | % | | | 1.42 | % | | | 1.03 | % | | | 0.67 | % | | | 0.20 | % |
| Ratio of gross expenses to average net assets | | | 2.50 | % | (E) | | | 2.58 | % | | | 2.57 | % | | | 2.45 | % | | | 2.42 | % | | | 2.46 | % |
| Ratio of net expenses to average net assets, excluding | | | | | | | | | | | | | | | | | | | | | | | | | |
| dividends on securities sold short | | | 2.32 | % | (E) | | | 2.30 | % | | | 2.34 | % | | | 2.37 | % | | | - | | | | - | |
| Portfolio turnover rate | | | 100 | % | (E) | | | 74 | % | | | 55 | % | | | 45 | % | | | 28 | % | | | 36 | % |
| | | | | | | | | | | | | | | | | | | | | | | | | | |
| Diamond Hill Financial Long-Short Fund - Class I | | | | | | | | | | | | | | | | | | | | | | | | | |
| Net asset value at beginning of period | | $ | 8.43 | | | | $ | 16.18 | | | | 20.90 | | | | | | | | | | | | | |
| Income (loss) from investment operations: | | | | | | | | | | | | | | | | | | | | | | | | | |
| Net investment income | | | 0.17 | | | | | 0.63 | | | | 0.37 | | | | | | | | | | | | | |
| Net realized and unrealized losses on investments | | | (0.11 | ) | | | | (7.89 | ) | | | (3.83 | ) | | | | | | | | | | | | |
| Total from investment operations | | | 0.06 | | | | | (7.26 | ) | | | (3.46 | ) | | | | | | | | | | | | |
| Less Distributions: | | | | | | | | | | | | | | | | | | | | | | | | | |
| Dividends from net investment income | | | - | | | | | (0.48 | ) | | | (0.58 | ) | | | | | | | | | | | | |
| Distributions from net realized gains | | | - | | | | | (0.01 | ) | | | (0.68 | ) | | | | | | | | | | | | |
| Total distributions | | | - | | | | | (0.49 | ) | | | (1.26 | ) | | | | | | | | | | | | |
| Net asset value at end of period | | $ | 8.49 | | | | $ | 8.43 | | | | 16.18 | | | | | | | | | | | | | |
| Total return | | | 0.71 | % | (D) | | | (44.79 | )% | | | (16.61 | )% | | | | | | | | | | | | |
| Net assets at end of period (000s) | | $ | 513 | | | | $ | 709 | | | | 2,464 | | | | | | | | | | | | | |
| Ratio of net expenses to average net assets | | | 1.37 | % | (E) | | | 1.47 | % | | | 1.41 | % | | | | | | | | | | | | |
| Ratio of net investment income to average net assets | | | 2.81 | % | (E) | | | 2.80 | % | | | 2.96 | % | | | | | | | | | | | | |
| Ratio of gross expenses to average net assets | | | 1.37 | % | (E) | | | 1.47 | % | | | 1.42 | % | | | | | | | | | | | | |
| Ratio of net expenses to average net assets, excluding | | | | | | | | | | | | | | | | | | | | | | | | | |
| dividends on securities sold short | | | 1.19 | % | (E) | | | 1.18 | % | | | 1.18 | % | | | | | | | | | | | | |
| Portfolio turnover rate | | | 100 | % | (E) | | | 74 | % | | | 55 | % | | | | | | | | | | | | |
| (A) | Represents the period from commencement of operations (December 31, 2006) through December 31, 2007, and commencement of public offering and investment operations on January 3, 2007 for Class I shares. |
| | |
| (B) | Total returns shown exclude the effect of applicable sales charges. |
| | |
| (C) | Amount rounds to less than $0.005. |
See accompanying Notes to Financial Statements.
| |
| Diamond Hill Funds Semi-Annual Report June 30, 2009 | Page 33 |
Diamond Hill Funds
Financial Highlights
For a share outstanding throughout each period.
| | | For the Six | | | | | | | | | | | | | | | | | | |
| | | Months Ended | | | | Year Ended | | | Year Ended | | | Year Ended | | | Year Ended | | | | Year Ended | |
| | | June 30, 2009 | | | | December 31, | | | December 31, | | | December 31, | | | December 31, | | | | December 31, | |
| Diamond Hill Strategic Income Fund - Class A | | (Unaudited) | | | | 2008 | | | 2007 | | | 2006 | | | | 2005 | (A) | | | 2004 | |
| Net asset value at beginning of period | | $ | 8.28 | | | | $ | 10.41 | | | $ | 11.71 | | | $ | 11.25 | | | $ | 11.63 | | | | $ | 11.58 | |
| Income (loss) from investment operations: | | | | | | | | | | | | | | | | | | | | | | | | | | |
| Net investment income | | | 0.35 | | | | | 0.71 | | | | 0.68 | | | | 0.70 | | | | 0.66 | | | | | 0.64 | |
| Net realized and unrealized gains (losses) on investments | | | 0.82 | | | | | (2.19 | ) | | | (1.20 | ) | | | 0.42 | | | | (0.38 | ) | | | | 0.19 | |
| Total from investment operations | | | 1.17 | | | | | (1.48 | ) | | | (0.52 | ) | | | 1.12 | | | | 0.28 | | | | | 0.83 | |
| Less distributions: | | | | | | | | | | | | | | | | | | | | | | | | | | |
| Dividends from net investment income | | | (0.35 | ) | | | | (0.64 | ) | | | (0.67 | ) | | | (0.66 | ) | | | (0.66 | ) | | | | (0.64 | ) |
| Distributions from net realized gains | | | - | | | | | - | | | | (0.11 | ) | | | - | | | | - | | | | | (0.14 | ) |
| Return of Capital | | | - | | | | | (0.01 | ) | | | - | | | | - | | | | - | | | | | - | |
| Total distributions | | | (0.35 | ) | | | | (0.65 | ) | | | (0.78 | ) | | | (0.66 | ) | | | (0.66 | ) | | | | (0.78 | ) |
| Net asset value at end of period | | $ | 9.10 | | | | $ | 8.28 | | | $ | 10.41 | | | $ | 11.71 | | | $ | 11.25 | | | | $ | 11.63 | |
Total return(B) | | | 14.58 | % | (C) | | | (14.79 | )% | | | (4.78 | )% | | | 10.26 | % | | | 2.41 | % | | | | 7.46 | % |
| Net assets at end of period (000s) | | $ | 33,944 | | | | $ | 31,268 | | | $ | 54,435 | | | $ | 49,372 | | | $ | 31,456 | | | | $ | 31,274 | |
| Ratio of net expenses to average net assets | | | 1.06 | % | (D) | | | 1.06 | % | | | 1.08 | % | | | 1.12 | % | | | 1.17 | % | | | | 1.20 | % |
| Ratio of net investment income to average net assets | | | 8.38 | % | (D) | | | 6.60 | % | | | 6.15 | % | | | 6.38 | % | | | 5.74 | % | | | | 5.75 | % |
| Ratio of gross expenses to average net assets | | | 1.06 | % | (D) | | | 1.06 | % | | | 1.09 | % | | | 1.12 | % | | | 1.17 | % | | | | 1.21 | % |
| Portfolio turnover rate | | | 100 | % | (D) | | | 95 | % | | | 142 | % | | | 43 | % | | | 66 | % | | | | 84 | % |
| | | | | | | | | | | | | | | | | | | | | | | | | | | |
| Diamond Hill Strategic Income Fund - Class C | | | | | | | | | | | | | | | | | | | | | | | | | | |
| Net asset value at beginning of period | | $ | 8.27 | | | | $ | 10.41 | | | $ | 11.70 | | | $ | 11.24 | | | $ | 11.63 | | | | $ | 11.58 | |
| Income (loss) from investment operations: | | | | | | | | | | | | | | | | | | | | | | | | | | |
| Net investment income | | | 0.32 | | | | | 0.65 | | | | 0.62 | | | | 0.62 | | | | 0.58 | | | | | 0.56 | |
| Net realized and unrealized gains (losses) on investments | | | 0.83 | | | | | (2.21 | ) | | | (1.22 | ) | | | 0.41 | | | | (0.40 | ) | | | | 0.19 | |
| Total from investment operations | | | 1.15 | | | | | (1.56 | ) | | | (0.60 | ) | | | 1.03 | | | | 0.18 | | | | | 0.75 | |
| Less distributions: | | | | | | | | | | | | | | | | | | | | | | | | | | |
| Dividends from net investment income | | | (0.32 | ) | | | | (0.57 | ) | | | (0.58 | ) | | | (0.57 | ) | | | (0.57 | ) | | | | (0.56 | ) |
| Distributions from net realized gains | | | - | | | | | - | | | | (0.11 | ) | | | - | | | | - | | | | | (0.14 | ) |
| Return of Capital | | | - | | | | | (0.01 | ) | | | - | | | | - | | | | - | | | | | - | |
| Total distributions | | | (0.32 | ) | | | | (0.58 | ) | | | (0.69 | ) | | | (0.57 | ) | | | (0.57 | ) | | | | (0.70 | ) |
| Net asset value at end of period | | $ | 9.10 | | | | $ | 8.27 | | | $ | 10.41 | | | $ | 11.70 | | | $ | 11.24 | | | | $ | 11.63 | |
Total return(B) | | | 14.31 | % | (C) | | | (15.51 | )% | | | (5.43 | )% | | | 9.43 | % | | | 1.57 | % | | | | 6.70 | % |
| Net assets at end of period (000s) | | $ | 15,816 | | | | $ | 14,730 | | | $ | 24,638 | | | $ | 26,908 | | | $ | 20,257 | | | | $ | 15,560 | |
| Ratio of net expenses to average net assets | | | 1.81 | % | (D) | | | 1.80 | % | | | 1.83 | % | | | 1.87 | % | | | 1.91 | % | | | | 1.95 | % |
| Ratio of net investment income to average net assets | | | 7.63 | % | (D) | | | 5.87 | % | | | 5.35 | % | | | 5.63 | % | | | 5.06 | % | | | | 5.02 | % |
| Ratio of gross expenses to average net assets | | | 1.81 | % | (D) | | | 1.81 | % | | | 1.84 | % | | | 1.87 | % | | | 1.91 | % | | | | 1.96 | % |
| Portfolio turnover rate | | | 100 | % | (D) | | | 95 | % | | | 142 | % | | | 43 | % | | | 66 | % | | | | 84 | % |
| | | | | | | | | | | | | | | | | | | | | | | | | | | |
| Diamond Hill Strategic Income Fund - Class I | | | | | | | | | | | | | | | | | | | | | | | | | | |
| Net asset value at beginning of period | | $ | 8.26 | | | | $ | 10.40 | | | $ | 11.69 | | | $ | 11.23 | | | $ | 11.65 | | | | | | |
| Income (loss) from investment operations: | | | | | | | | | | | | | | | | | | | | | | | | | | |
| Net investment income | | | 0.36 | | | | | 0.70 | | | | 0.71 | | | | 0.73 | | | | 0.65 | | | | | | |
| Net realized and unrealized gains (losses) on investments | | | 0.82 | | | | | (2.15 | ) | | | (1.17 | ) | | | 0.44 | | | | (0.42 | ) | | | | | |
| Total from investment operations | | | 1.18 | | | | | (1.45 | ) | | | (0.46 | ) | | | 1.17 | | | | 0.23 | | | | | | |
| Less distributions: | | | | | | | | | | | | | | | | | | | | | | | | | | |
| Dividends from net investment income | | | (0.36 | ) | | | | (0.68 | ) | | | (0.72 | ) | | | (0.71 | ) | | | (0.65 | ) | | | | | |
| Distributions from net realized gains | | | - | | | | | - | | | | (0.11 | ) | | | - | | | | - | | | | | | |
| Return of Capital | | | - | | | | | (0.01 | ) | | | - | | | | - | | | | - | | | | | | |
| Total distributions | | | (0.36 | ) | | | | (0.69 | ) | | | (0.83 | ) | | | (0.71 | ) | | | (0.65 | ) | | | | | |
| Net asset value at end of period | | $ | 9.08 | | | | $ | 8.26 | | | $ | 10.40 | | | $ | 11.69 | | | $ | 11.23 | | | | | | |
| Total return | | | 14.82 | % | (C) | | | (14.55 | )% | | | (4.31 | )% | | | 10.74 | % | | | 2.03 | % | (C) | | | | |
| Net assets at end of period (000s) | | $ | 56,665 | | | | $ | 50,185 | | | $ | 70,205 | | | $ | 54,302 | | | $ | 25,299 | | | | | | |
| Ratio of net expenses to average net assets | | | 0.69 | % | (D) | | | 0.67 | % | | | 0.68 | % | | | 0.68 | % | | | 0.70 | % | (D) | | | | |
| Ratio of net investment income to average net assets | | | 8.77 | % | (D) | | | 7.05 | % | | | 6.62 | % | | | 6.89 | % | | | 6.57 | % | (D) | | | | |
| Ratio of gross expenses to average net assets | | | 0.69 | % | (D) | | | 0.68 | % | | | 0.68 | % | | | 0.68 | % | | | 0.70 | % | (D) | | | | |
| Portfolio turnover rate | | | 100 | % | (D) | | | 95 | % | | | 142 | % | | | 43 | % | | | 66 | % | | | | | |
| (A) | Represents the period from commencement of operations (January 31, 2005) through December 31, 2005. |
| (B) | Total returns shown exclude the effect of applicable sales charges. |
See accompanying Notes to Financial Statements.
| |
| Page 34 | Diamond Hill Funds Semi-Annual Report June 30, 2009 |
Diamond Hill Funds
Notes to Financial Statements
June 30, 2009 (Unaudited)
Organization
The Diamond Hill Small Cap Fund (“Small Cap Fund”), Diamond Hill Small-Mid Cap Fund (“Small-Mid Cap Fund”), Diamond Hill Large Cap Fund (“Large Cap Fund”), Diamond Hill Select Fund (“Select Fund”), Diamond Hill Long-Short Fund (“Long-Short Fund”), Diamond Hill Financial Long-Short Fund (“Financial Long-Short Fund”) and Diamond Hill Strategic Income Fund (“Strategic Income Fund”), are each a series of the Diamond Hill Funds (the “Trust”) (each a “Fund” and collectively the “Funds”). The Trust is an Ohio business trust, which is registered under the Investment Company Act of 1940, as amended, (the “1940 Act”) as an open-end, management investment company. Each Fund is a diversified series of the Trust.
The Funds offer three classes of shares: Class A, Class C and Class I. Each class of shares for each Fund has identical rights and privileges except with respect to distribution (12b-1) and service fees, voting rights on matters affecting a single class of shares, and the exchange privileges of each class of shares.
Significant Accounting Policies
The following is a summary of the Funds’ significant accounting policies:
Estimates — The preparation of financial statements in conformity with U.S. generally accepted accounting principles (“GAAP”) requires management to make estimates and assumptions that affect the reported amounts of assets and liabilities and disclosure of contingent assets and liabilities at the date of the financial statements and the reported amounts of income and expenses during the reporting period. Actual results could differ from those estimates.
Security valuation — Listed securities for which market quotations are readily available are valued at the closing prices as determined by the primary exchange where the securities are traded. Unlisted securities or listed securities for which the latest sales prices are not readily available are valued at the closing bid price in the principal market where such securities are normally traded. Debt securities are valued on the basis of valuations provided by dealers or by an independent pricing service that determines valuations based upon market transactions for normal, institutional-size trading units of similar securities. Short-term investments maturing in less than 61 days are valued at amortized cost, which approximates market. Securities for which market quotations are not readily available are valued at their “fair value”. In these cases, the Fair Value Committee established and appointed by the Trustees determines in good faith, subject to Trust procedures, the fair value of portfolio securities held by a Fund (“good faith fair valuation”). When a good faith fair valuation of a security is required, consideration is generally given to a number of factors, including, but not limited to the following: dealer quotes, published analyses by dealers or analysts of the situation at issue, transactions implicitly valuing the security (such as a merger, tender offer, etc.), the value of other securities or contracts which derive their value from the security at issue, and the implications (whether negative or positive) of the circumstances which have caused trading in the security to halt. Approximately 0.7% of the Strategic Income Fund’s net assets are being valued using estimates provided by the Fair Value Committee. The Fair Value Committee relied heavily upon analysis of the fund’s portfolio manager in the absence of readily ascertainable market values. These values may differ from the values that would have been used had a ready market for these securities existed, and the differences could be material.
The Funds adopted Statement on Financial Accounting Standards (SFAS) No. 157, “Fair Value Measurements.” SFAS No. 157 establishes a single authoritative definition of fair value, sets out a framework for measuring fair value and requires additional disclosures about fair value measurements. Under SFAS No. 157 various inputs are used in determining the value of the Funds investments. These inputs are summarized in the three broad levels listed below:
| • Level 1 – | quoted prices in active markets for identical securities |
| • Level 2 – | other significant observable inputs (including quoted prices for similar securities, interest rates, prepayment speeds, credit risk, etc.) |
| • Level 3 – | significant unobservable inputs (including the Fund’s own assumptions in determining the fair value of investments) |
The inputs or methodology used for valuing securities are not necessarily an indication of the risk associated with investing in those securities. For example, securities maturing in less than 61 days of the filing are valued using amortized cost, in accordance with rules under the Investment Company Act of 1940. Generally, amortized cost approximates the current fair value of a security, but since the value is not obtained from a quoted price in an active market, such securities are reflected as Level 2.
| |
| Diamond Hill Funds Semi-Annual Report June 30, 2009 | Page 35 |
Diamond Hill Funds
Notes to Financial Statements (Continued)
June 30, 2009 (Unaudited)
The following is a summary of the inputs used to value the Funds net assets as of June 30, 2009:
| | | | | | | | | Level 3 – | |
| | | Level 1 – | | | Other Significant | | | Significant | |
| | | Quoted Prices | | | Observable Inputs | | | Unobservable Inputs | |
| Investments in Securities: | | | | | | | | | |
| (Assets) | | | | | | | | | |
| Small Cap Fund | | | | | | | | | |
| Common Stocks | | $ | 341,521,088 | | | $ | - | | | $ | - | |
| Preferred Stocks | | | 4,591,283 | | | | - | | | | - | |
| Registered Investment Companies | | | 160,427,766 | | | | - | | | | - | |
| Small-Mid Cap Fund | | | | | | | | | | | | |
| Common Stocks | | | 23,903,820 | | | | - | | | | - | |
| Registered Investment Companies | | | 8,741,933 | | | | - | | | | - | |
| Large Cap Fund | | | | | | | | | | | | |
| Common Stocks | | | 423,286,775 | | | | - | | | | - | |
| Registered Investment Companies | | | 165,607,640 | | | | - | | | | - | |
| Select Fund | | | | | | | | | | | | |
| Common Stocks | | | 14,673,925 | | | | - | | | | - | |
| Registered Investment Companies | | | 2,831,930 | | | | - | | | | - | |
| Long-Short Fund | | | | | | | | | | | | |
| Common Stocks | | | 1,486,123,819 | | | | - | | | | - | |
| Registered Investment Companies | | | 390,691,813 | | | | - | | | | - | |
| Financial Long-Short Fund | | | | | | | | | | | | |
| Common Stocks | | | 6,762,778 | | | | - | | | | - | |
| Preferred Stocks | | | 1,444,118 | | | | - | | | | - | |
| Corporate Bonds | | | - | | | | 199,313 | | | | - | |
| Registered Investment Companies | | | 1,997,102 | | | | - | | | | - | |
| Strategic Income Fund | | | | | | | | | | | | |
| Collateralized Debt Obligations | | | - | | | | 536,034 | | | | - | |
| Common Stocks | | | 268,380 | | | | - | | | | - | |
| Preferred Stocks | | | 9,040,995 | | | | 3,151 | | | | - | |
| Corporate Bonds | | | - | | | | 92,151,675 | | | | - | |
| Registered Investment Companies | | | 4,897,602 | | | | - | | | | - | |
| Investments in Securities Sold Short: | | | | | | | | | | | | |
| (Liabilities) | | | | | | | | | | | | |
| Long-Short Fund | | | | | | | | | | | | |
| Common Stocks | | $ | (625,234,072 | ) | | $ | - | | | $ | - | |
| Financial Long-Short Fund | | | | | | | | | | | | |
| Common Stocks | | | (708,278 | ) | | | - | | | | - | |
Short sales — The Long-Short Fund, Financial Long-Short Fund and Strategic Income Fund may sell a security they do not own in anticipation of a decline in the value of that security. When the Funds sell a security short, they must borrow the security sold short and deliver it to the broker-dealer through which they made the short sale. A gain, limited to the price at which the Funds sold the security short, or a loss, unlimited in size, will be recognized upon closing a short sale. Cash received from short sales is maintained by brokers and is used to meet margin requirements for short calls. It is included as “Deposits with brokers for securities sold short” on the Statements of Assets & Liabilities.
| |
| Page 36 | Diamond Hill Funds Semi-Annual Report June 30, 2009 |
Diamond Hill Funds
Notes to Financial Statements (Continued)
June 30, 2009 (Unaudited)
Securities Lending — Under the terms of the securities lending agreement with JPMorgan Chase Bank, N.A. (“JPMorgan”), JPMorgan is authorized to loan securities on behalf of the Funds to approved borrowers. In exchange, the Funds receive cash collateral in the amount of at least 100% of the value of the securities loaned. The cash collateral is invested in short term instruments as noted in the Schedules of Investments. Although risk is mitigated by the collateral, the Funds could experience a delay in recovering their securities and possible loss of income or value if the borrower fails to return them. The agreement indemnifies the Funds from losses incurred in the event of a borrower’s material default of the terms and conditions of the borrower agreement. The agreement provides that after predetermined rebates to brokers, net securities lending income shall first be solely paid as credits and offset against costs and other charges incurred by each Fund with JPMorgan. Any remaining securities lending revenue is then paid to the Funds as securities lending income.
As of June 30, 2009, the value of securities loaned and the collateral held were as follows:
| | | Market Value | | | Value of | |
| | | of Securities Loaned | | | Collateral Received | |
| | | | | | | |
| Small Cap Fund | | $ | 73,195,869 | | | $ | 75,811,300 | |
| Small-Mid Cap Fund | | $ | 4,412,453 | | | $ | 4,565,353 | |
| Large Cap Fund | | $ | 119,634,757 | | | $ | 123,537,669 | |
| Select Fund | | $ | 1,059,187 | | | $ | 1,097,946 | |
| Long-Short Fund | | $ | 135,820,774 | | | $ | 139,782,977 | |
| Financial Long-Short Fund | | $ | 1,325,184 | | | $ | 1,356,515 | |
| Strategic Income Fund | | $ | 2,743,971 | | | $ | 3,261,549 | |
| | | | | | | | | |
Security transactions — Changes in holdings of portfolio securities shall be reflected no later than in the first calculation on the first business day following trade date. However, for financial reporting purposes, portfolio security transactions are reported on trade date. The specific identification method is used for determining realized gains or losses for financial statements and income tax purposes. Dividend income is recognized on the ex-dividend date and interest income is recognized on an accrual basis. Discounts and premiums on securities purchased are amortized using the daily effective yield method.
Share valuation — The net asset value per share of each class of shares of each Fund is calculated daily by dividing the total value of a Fund’s assets attributable to that class, less liabilities attributable to that class, by the number of shares of that class outstanding.
Federal income taxes — Each Fund’s policy is to continue to comply with the requirements of the Internal Revenue Code that are applicable to regulated investment companies and to distribute substantially all of its taxable net investment income and any net realized capital gains to its shareholders. The Funds have analyzed their tax positions taken on Federal income tax returns for all open tax years (tax years ended December 31, 2005 through 2008) and have concluded that no provision for income tax is required in their financial statements.
Distributions to shareholders — Dividends from net investment income are declared and paid monthly for the Strategic Income Fund. Dividends from net investment income are declared and paid on an annual basis for the Small Cap Fund, Small-Mid Cap Fund, Large Cap Fund, Select Fund, Long-Short Fund, and Financial Long-Short Fund. The Funds record distributions received from investments in Real Estate Investment Trusts (REITS) in excess of income from underlying investments as a reduction of cost of investments and/or realized gain. Such amounts are based on estimates if actual amounts are not available and actual amounts of income, realized gain and return of capital may differ from the estimated amounts. The Funds adjust the estimated amounts of the components of distributions (and consequently net investment income) as an increase to unrealized appreciation (depreciation) and realized gain (loss) on investments as necessary once the issuers provide information about the actual composition of the distributions. Dividends are declared separately for each class. No class has preferential dividend rights; differences in per share rates are due to differences in separate class expenses. Net realized capital gains, if any, are distributed at least annually. Distributions from net investment income and from net capital gains are determined in accordance with U.S. income tax regulations, which may differ from GAAP in the United States. These differences are primarily due to differing treatments for paydown gains and losses on mortgage-backed securities, expiring capital loss carryforwards, and deferrals of certain losses. Permanent book and tax basis differences are reclassified among the components of net assets. Certain Funds may utilize earnings and profits distributed to shareholders on redemption of shares as part of the dividends paid deduction for income tax purposes.
| |
| Diamond Hill Funds Semi-Annual Report June 30, 2009 | Page 37 |
Diamond Hill Funds
Notes to Financial Statements (Continued)
June 30, 2009 (Unaudited)
Allocations — Investment income earned, realized capital gains and losses, and unrealized appreciation and depreciation for the Funds are allocated daily to each class of shares based upon its proportionate share of total net assets of the Fund. Class specific expenses are charged directly to the class incurring the expense. Common expenses, which are not attributable to a specific class, are allocated daily to each class of shares based upon its proportionate share of total net assets of the Fund. Expenses not directly billed to a Fund are allocated proportionally among all Funds daily in relation to net assets of each Fund or another reasonable measure.
Recent Accounting Pronouncements
In June 2009, the FASB issued Statement of Financial Accounting Standards No. 168, “The FASB Accounting Standards CodificationTM and the Hierarchy of Generally Accepted Accounting Principles – a replacement of FASB Statement No 162” (“SFAS 168”). SFAS 168 replaces SFAS No. 162, “The Hierarchy of Generally Accepted Accounting Principles” and establishes the “FASB Accounting Standards CodificationTM” (“Codification”) as the source of authoritative accounting principles recognized by the FASB to be applied by nongovernmental entities in the preparation of financial statements in conformity with generally accepted accounting principles in the United States. All guidance contained in the Codification carries an equal level of authority. On the effective date of SFAS 168, the Codification will supersede all then-existing non-SEC accounting and reporting standards. All other nongrandfathered non-SEC accounting literature not included in the Codification will become nonauthoritative. SFAS 168 is effective for financial statements issued for interim and annual periods ending after September 15, 2009. The Fund evaluated this new statement, and has determined that it will not have a significant impact on the determination or reporting of the Funds' financial statements.
Investment Transactions
For the six months ended June 30, 2009, the purchases and sales (including maturities) of investment securities (excluding short-term securities and U.S. government obligations) were as follows:
| | | Purchases | | | Sales | |
| Small Cap Fund | | $ | 79,506,667 | | | $ | 50,242,218 | |
| Small-Mid Cap Fund | | $ | 7,192,587 | | | $ | 9,163,436 | |
| Large Cap Fund | | $ | 83,545,917 | | | $ | 58,959,308 | |
| Select Fund | | $ | 6,355,065 | | | $ | 5,735,147 | |
| Long-Short Fund | | $ | 525,519,621 | | | $ | 1,108,183,987 | |
| Financial Long-Short Fund | | $ | 4,029,986 | | | $ | 4,617,021 | |
| Strategic Income Fund | | $ | 44,188,174 | | | $ | 41,371,502 | |
| | | | | | | | | |
The Funds pay commissions on the purchase and sale of investment securities. The commissions paid are included as part of the cost of purchases or net proceeds on the sale of investment securities and are not included in the presentation of Fund expenses on the Statements of Operations. The Funds paid the following commissions during the six months ended June 30, 2009:
| | | Total Commissions | | | Commissions as a % of Average Net Assets | |
| Small Cap Fund | | $ | 180,009 | | | | 0.05 | % |
| Small-Mid Cap Fund | | $ | 21,696 | | | | 0.09 | % |
| Large Cap Fund | | $ | 154,295 | | | | 0.04 | % |
| Select Fund | | $ | 10,257 | | | | 0.07 | % |
| Long-Short Fund | | $ | 1,655,992 | | | | 0.09 | % |
| Financial Long-Short Fund | | $ | 10,502 | | | | 0.13 | % |
| Strategic Income Fund | | $ | 5,514 | | | | 0.01 | % |
| |
| Page 38 | Diamond Hill Funds Semi-Annual Report June 30, 2009 |
Diamond Hill Funds
Notes to Financial Statements (Continued)
June 30, 2009 (Unaudited)
Investment Advisory Fees and Other Transactions with Affiliates
The Small Cap Fund, Small-Mid Cap Fund, Large Cap Fund, Select Fund, Long-Short Fund, Financial Long-Short Fund, and Strategic Income Fund each receive investment management and advisory services from Diamond Hill Capital Management, Inc. (“DHCM”) under management agreements that provide for fees to be paid at an annual rate of 0.80%, 0.75%, 0.60%, 0.70%, 0.90%, 1.00%, and 0.50% of the Funds’ average daily net assets, respectively. The advisory agreements are subject to annual approval by the Board of Trustees. In addition, each Fund has entered into an administrative services agreement whereby DHCM (“Administrator”) is paid a fee at an annual rate of 0.34% for Class A and Class C Shares and 0.20% for Class I shares of each class’ average daily net assets. Prior to April 30, 2009, the fees paid by Class A, Class C, and Class I shares were paid at an annual rate of 0.30%, 0.30% and 0.18% of each classes’ average daily net assets, respectively. These administrative fees are used to pay most of the Funds’ operating expenses except advisory, distribution, custody, brokerage, taxes, interest, dividend expense on securities sold short, and extraordinary expenses.
Pursuant to rule 12b-1 of the 1940 Act, each Fund has adopted a distribution plan (together, the “Plans”). Under the Plans, Class A shares pay a distribution fee at an annual rate of 0.25% of Class A average daily net assets. Class C shares pay a distribution and shareholder-servicing fee at an annual rate of 0.75% and 0.25%, respectively, of Class C average daily net assets. Class I shares are not subject to any distribution or shareholder-servicing fees. The Trust entered into a Distribution Agreement on behalf of the Funds with BHIL Distributors, Inc. (“Distributor”), an affiliate of DHCM. Pursuant to the Distribution Agreement, the Distributor acts as principal underwriter of each Fund’s shares. Prior to April 30, 2009, IFS Fund Distributors, Inc. acted as Distributor.
For the six months ended June 30, 2009, the Distributors received the following amounts in sales commissions from the sales of Class A shares of the Funds as follows:
| | | IFS Fund Distributors, Inc. | | | BHIL Distributors, Inc. | |
| | | January 1, 2009 – | | | May 1, 2009 – | |
| | | April 30, 2009 | | | June 30, 2009 | |
| Small Cap Fund | | $ | 1,923 | | | $ | 2,025 | |
| Small-Mid Cap Fund | | $ | 65 | | | $ | - | |
| Large Cap Fund | | $ | 1,855 | | | $ | 1,641 | |
| Select Fund | | $ | 5 | | | $ | 278 | |
| Long-Short Fund | | $ | 7,492 | | | $ | 3,288 | |
| Financial Long-Short Fund | | $ | 122 | | | $ | 79 | |
| Strategic Income Fund | | $ | 1,497 | | | $ | 52 | |
The Distributors also received contingent deferred sales charges relating to the redemptions of Class C shares of the Funds for the six months ended June 30, 2009 as follows:
| | | IFS Fund Distributors, Inc. | | | BHIL Distributors, Inc. | |
| | | January 1, 2009 – | | | May 1, 2009 – | |
| | | April 30, 2009 | | | June 30, 2009 | |
| Small Cap Fund | | $ | 984 | | | $ | 205 | |
| Small-Mid Cap Fund | | $ | 78 | | | $ | 617 | |
| Large Cap Fund | | $ | 2,337 | | | $ | 617 | |
| Select Fund | | $ | 94 | | | $ | - | |
| Long-Short Fund | | $ | 58,759 | | | $ | 8,692 | |
| Financial Long-Short Fund | | $ | 1,390 | | | $ | 100 | |
| Strategic Income Fund | | $ | 326 | | | $ | 152 | |
DHCM has an agreement with JPMorgan to provide sub-transfer agent, and sub-administrative services for the Funds. The services to be provided under the agreements include day-to-day administration of matters related to the corporate existence of the Trust and its Funds (other than rendering investment advice), preparation of reports, supervision of the Trust’s arrangement with JPMorgan and assistance in the preparation of the Trust’s registration statement under federal and state laws.
| |
| Diamond Hill Funds Semi-Annual Report June 30, 2009 | Page 39 |
Diamond Hill Funds
Notes to Financial Statements (Continued)
June 30, 2009 (Unaudited)
Certain officers of the Trust are affiliated with DHCM, the Distributor, or JPMorgan. Such officers receive no compensation from the Funds for serving in their respective roles.
Commitments and Contingencies
The Funds indemnify the Trust’s officers and Trustees for certain liabilities that might arise from their performance of their duties to the Funds. Additionally, in the normal course of business, the Funds enter into contracts that contain a variety of representations and warranties and which provide general indemnifications. The Funds’ maximum exposure under these arrangements is unknown, as this would involve future claims that may be made against the Funds that have not yet occurred. However, based on experience, the Funds expect the risk of loss to be remote.
Federal Tax Information
The amount and character of income and capital gain distributions paid by the Funds are determined in accordance with Federal income tax regulations which may differ from GAAP. The tax character of distributions paid differs from the character of distributions shown on the Statements of Changes in Net Assets due primarily to short-term capital gains being treated as ordinary income for tax purposes and the use of equalization.
The tax character of distributions paid during 2008 and 2007 was as follows:
| | | Small Cap Fund | | | Small-Mid Cap Fund | | | Large Cap Fund | | | Select Fund | |
| | | 2008 | | | 2007 | | | 2008 | | | 2007 | | | 2008 | | | 2007 | | | 2008 | | | 2007 | |
| Distributions paid from: | | | | | | | | | | | | | | | | | | | | | | | | |
| Ordinary income | | $ | 3,188,253 | | | $ | 1,804,841 | | | $ | 362,049 | | | $ | 383,749 | | | $ | 6,027,559 | | | $ | 10,040,327 | | | $ | 170,214 | | | $ | 1,494,756 | |
| Long-term capital gains | | | - | | | | 23,287,772 | | | | - | | | | 614,655 | | | | 3,779,308 | | | | 15,104,359 | | | | 568,314 | | | | 678,617 | |
| Total distributions | | $ | 3,188,253 | | | $ | 25,092,613 | | | $ | 362,049 | | | $ | 998,404 | | | $ | 9,806,867 | | | $ | 25,144,686 | | | $ | 738,528 | | | $ | 2,173,373 | |
| | | | | | | | | | | | | | | | | | | | | | | | | | | | | | | | | |
| | | Long-Short Fund | | | Financial Long-Short Fund | | | Strategic Income Fund | |
| | | 2008 | | | 2007 | | | 2008 | | | 2007 | | | 2008 | | | 2007 | |
| Distributions paid from: | | | | | | | | | | | | | | | | | | |
| Ordinary income | | $ | 22,430,110 | | | $ | 56,499,180 | | | $ | 486,458 | | | $ | 1,693,193 | | | $ | 8,683,372 | | | $ | 9,428,087 | |
| Long-term capital gains | | | 9,366,895 | | | | 22,195,381 | | | | - | | | | 616,465 | | | | - | | | | 1,736,617 | |
| Return of capital | | | - | | | | - | | | | - | | | | - | | | | 166,756 | | | | - | |
| Total distributions | | $ | 31,797,005 | | | $ | 78,694,561 | | | $ | 486,458 | | | $ | 2,309,658 | | | $ | 8,850,128 | | | $ | 11,164,704 | |
The following information is computed on a tax basis for each item as of December 31, 2008:
| | | Small | | | Small-Mid | | | Large | | | Select | |
| | | Cap Fund | | | Cap Fund | | | Cap Fund | | | Fund | |
| Tax cost of portfolio investments | | $ | 579,723,830 | | | $ | 40,688,329 | | | $ | 554,507,833 | | | $ | 19,945,928 | |
| Gross unrealized appreciation | | | 22,670,275 | | | | 340,431 | | | | 17,582,358 | | | | 190,967 | |
| Gross unrealized depreciation | | | (124,901,378 | ) | | | (8,287,135 | ) | | | (130,034,793 | ) | | | (4,015,156 | ) |
| Net unrealized depreciation | | | (102,231,103 | ) | | | (7,946,704 | ) | | | (112,452,435 | ) | | | (3,824,189 | ) |
| Undistributed ordinary income | | | 20,271 | | | | 4,010 | | | | - | | | | - | |
| Capital loss carryforwards | | | (5,865,271 | ) | | | (1,041,727 | ) | | | (43,434,203 | ) | | | (495,737 | ) |
| Post-October losses | | | (420,428 | ) | | | (420,969 | ) | | | (398,821 | ) | | | (320,131 | ) |
| Accumulated deficit | | $ | (108,496,531 | ) | | $ | (9,405,390 | ) | | $ | (156,285,459 | ) | | $ | (4,640,057 | ) |
| | | | | | Financial | | | Strategic | |
| | | Long-Short | | | Long-Short | | | Income | |
| | | Fund | | | Fund | | | Fund | |
| Tax cost of portfolio investments | | $ | 2,789,429,013 | | | $ | 15,036,081 | | | $ | 117,660,316 | |
| Gross unrealized appreciation | | | 178,027,798 | | | | 1,187,181 | | | | 5,508,824 | |
| Gross unrealized depreciation | | | (712,048,117 | ) | | | (5,793,329 | ) | | | (27,059,773 | ) |
| Net unrealized depreciation | | | (534,020,319 | ) | | | (4,606,148 | ) | | | (21,550,949 | ) |
| Undistributed ordinary income | | | 19,471 | | | | 9,629 | | | | - | |
| Capital loss carryforwards | | | (101,454,175 | ) | | | (8,949,490 | ) | | | (18,829,658 | ) |
| Post-October losses | | | (33,143,409 | ) | | | (2,591,252 | ) | | | (4,487,697 | ) |
| Accumulated deficit | | $ | (668,598,432 | ) | | $ | (16,137,261 | ) | | $ | (44,868,304 | ) |
| |
| Page 40 | Diamond Hill Funds Semi-Annual Report June 30, 2009 |
Diamond Hill Funds
Notes to Financial Statements (Continued)
June 30, 2009 (Unaudited)
The difference between book basis and tax basis net unrealized depreciation is attributable primarily to the tax deferral of losses on wash sales, investments in Real Estate Investment Trusts and Limited Partnerships.
As of December 31, 2008, the Funds had net capital loss carryforwards expiring as follows:
| | | Amount | | Expires |
| | | | | December 31, |
| Small Cap Fund | | $ | 5,865,271 | | 2016 |
| Small-Mid Cap Fund | | | 1,041,727 | | 2016 |
| Large Cap Fund | | | 43,434,203 | | 2016 |
| Select Fund | | | 495,737 | | 2016 |
| Long-Short Fund | | | 101,454,175 | | 2016 |
| Financial Long-Short Fund | | | 8,949,490 | | 2016 |
| Strategic Income Fund | | | 18,829,658 | | 2016 |
The Funds also elected to defer until their subsequent tax year capital losses incurred after October 31, 2008. These capital loss carryforwards and “Post-October” losses may be utilized in future years to offset net realized capital gains, if any, prior to distributing such gains to shareholders.
Reclassification of capital accounts — Reclassifications result primarily from the difference in the tax treatment of paydown gains and losses, distributions in excess of net investment income, equalization, and investments in Real Estate Investment Trusts and Limited Partnerships. The following reclassifications have no impact on the net assets or net asset value per share of the Funds and are designed to present the Funds’ capital accounts on a tax basis:
| | | | | | Undistributed | | | Accumulated | |
| | | Paid-In | | | Net Investment | | | Net Realized | |
| | | Capital | | | Income (Loss) | | | Gains (Losses) | |
| Small Cap Fund | | $ | - | | | $ | (71,391 | ) | | $ | 71,391 | |
| Large Cap Fund | | | (106 | ) | | | 106 | | | | - | |
| Select Fund | | | (434,685 | ) | | | 3,624 | | | | 431,061 | |
| Long-Short Fund | | | - | | | | 89,345 | | | | (89,345 | ) |
| Financial Long-Short Fund | | | - | | | | 115 | | | | (115 | ) |
| Strategic Income Fund | | | (166,756 | ) | | | 82,356 | | | | 84,400 | |
As of June 30, 2009, the Fund's Federal tax cost of investment securities and net unrealized appreciation (depreciation) was as follows:
| | | | | | | | | | | | Net | |
| | | | | | Gross | | | Gross | | | Unrealized | |
| | | Federal | | | Unrealized | | | Unrealized | | | Appreciation | |
| Fund | | Tax Cost | | | Appreciation | | | Depreciation | | | (Depreciation) | |
| Small Cap Fund | | $ | 546,954,134 | | | $ | 38,643,202 | | | $ | (79,057,199 | ) | | $ | (40,413,997 | ) |
| Small-Mid Cap Fund | | | 35,467,311 | | | | 1,770,297 | | | | (4,591,855 | ) | | | (2,821,558 | ) |
| Large Cap Fund | | | 636,413,538 | | | | 27,252,093 | | | | (74,771,216 | ) | | | (47,519,123 | ) |
| Select Fund | | | 18,548,596 | | | | 790,176 | | | | (1,832,917 | ) | | | (1,042,741 | ) |
| Long-Short Fund | | | 2,028,952,167 | | | | 175,154,546 | | | | (307,813,647 | ) | | | (132,659,101 | ) |
| Financial Long-Short Fund | | | 10,530,391 | | | | 1,175,912 | | | | (1,167,194 | ) | | | 8,718 | |
| Strategic Income Fund | | | 116,197,547 | | | | 6,290,925 | | | | (15,631,888 | ) | | | (9,340,963 | ) |
Subsequent Events
The Funds evaluated subsequent events from June 30, 2009, the date of these financial statements, through August 24, 2009, the date these financial statements were issued and available. There were no subsequent events to report that would have a material impact on the Funds’ financial statements.
| |
| Diamond Hill Funds Semi-Annual Report June 30, 2009 | Page 41 |
Diamond Hill Funds
Other Items
June 30, 2009 (Unaudited)
Proxy Voting
The investment adviser is responsible for exercising the voting rights associated with the securities purchased and held by the Funds. A description of the policies and procedures that the Adviser uses in fulfilling this responsibility and information regarding how those proxies were voted during the twelve month period ended June 30 are available without charge upon request by calling toll free 1-888-226-5595 or on the Securities and Exchange Commission’s website at http://www.sec.gov.
Portfolio Disclosure
The Trust files a complete listing of portfolio holdings as of the end of the first and third quarters of each fiscal year on Form N-Q and each second and fourth quarters of each fiscal year on Form N-CSR. The complete listing (i) is available on the Commission’s website; (ii) may be reviewed and copied at the Commission’s Public Reference Room in Washington, DC; and (iii) will be made available to shareholders upon request by calling 1-888-226-5595. Information on the operation of the Public Reference Room may be obtained by calling 1-800-SEC-0330. Monthly portfolio holdings are also available on www.diamond-hill.com.
Trustee Approval of Investment Advisory Agreements
The Trustees of Diamond Hill Funds (the “Trust”), at a regularly scheduled meeting on May 5, 2009, by a unanimous vote, approved the Management Agreements between the Trust and Diamond Hill Capital Management, Inc. (the “Adviser”), for each series of the Trust (each separately, a “Fund”). The Trustees discussed the following factors, on a Fund-by-Fund basis, in connection with the Trust’s Management Agreements (“investment advisory agreements”):
| a) | The nature, extent and quality of the services provided by the Adviser under the investment advisory agreements, including a review of the investment advisory agreements themselves, the services provided thereunder, the fee formula, fees paid, expenses assumed and termination provisions. The Trustees reviewed the performance history of each fund with a five year track record, noting that four of the five Fund’s performance exceeded its respective benchmark for the five year period ended February 28, 2009. In addition, three of five Funds with a five year track record were also in the top half when compared to their peer groups for the same five year period with two of those three in the top quartile. The Trustees also reviewed the two funds with a track record of less than five years noting that both Funds exceeded its respective benchmark for the three year period ended February 28, 2009. The Trustees also noted that the Adviser continued to invest significant resources in its investment team, by nearly doubling its research staff over the last two years to help enhance the delivery of portfolio management services to the Funds. |
| b) | The reasonableness of the investment advisory fees, with the Trustees noting that the contract rates under the investment advisory agreements as of February 28, 2009 were at or below the mean and median rates of comparable funds within each Fund’s respective peer group. |
| c) | The reasonableness of the total expenses, with the Trustees noting that the total expenses of each class of shares of each of the Funds were generally at or below the mean and median total expenses of comparable funds within each Fund’s respective peer group, with total expenses for Class I shares of each Fund generally in the lower third or quarter of their respective peer groups. |
| d) | With limited exceptions, investment advisory fees charged by the Adviser to the Funds were lower than investment advisory fees the Adviser charges to its other similarly managed accounts (i.e. hedge funds and separate accounts). |
| e) | The reasonableness of each Fund’s profitability to the Adviser, including the Adviser’s methodology for calculating its profitability, with the Trustees noting that the Adviser’s pre-tax profit margin on the investment advisory agreements of each Fund represented a fair and entrepreneurial profit for managing the Fund. The Trustees also noted the Adviser (who is also the Administrator) has a history of voluntarily reducing its fees under the Administration Agreement when asset growth allows for the sharing of the economies of scale realized by the Administrator. |
| |
| Page 42 | Diamond Hill Funds Semi-Annual Report June 30, 2009 |
Diamond Hill Funds
Other Items (Continued)
June 30, 2009 (Unaudited)
| f) | The extent to which economies of scale would be realized as each Fund grows and whether fee levels reflect these economies of scale for the benefit of fund shareholders, with the Trustees noting that the current asset size of the Funds, the current advisory fee for each Fund, and other relevant factors did not warrant additional consideration of fee breakpoints for the Funds at the current time. |
| g) | The ancillary benefits received by the Adviser as a result of its relationship with the Funds. The Board considered that the Adviser has no soft dollar arrangements with respect to securities transactions it executes for the Funds. The Trustees also considered that the Adviser is the Administrator to the Funds (under the Administration Agreement) and is expected to earn fees from the Funds for providing administrative services. The fees were shown separately in the profitability analysis presented to the Trustees. The Trustees also considered revenue and expenses of the Administrator for providing financing arrangements related to the payment of commissions to financial intermediaries for the sale of C Shares of the Funds. |
Having considered (1) the nature, extent and quality of the services provided by the Adviser under the investment advisory agreements, (2) the reasonableness of the investment advisory fees, (3) the reasonableness of the total expenses, (4) the reasonableness of fees charged to other similar clients of the Adviser, (5) the reasonableness of each Fund’s profitability to the Adviser under each investment advisory agreement, (6) the extent to which economies of scale could and should be shared by the Adviser with the Funds, and (7) the ancillary benefits received by the Adviser, as discussed more fully above the Trustees, all of whom qualify as Independent Trustees under the 1940 Act, concluded it was appropriate to renew the investment advisory agreements.
| |
| Diamond Hill Funds Semi-Annual Report June 30, 2009 | Page 43 |
Diamond Hill Funds
Schedule of Shareholder Expenses
Hypothetical Example of a $1,000 Investment at Beginning of Period
(Unaudited)
All mutual funds have operating expenses. These expenses include costs for portfolio management, administrative services, and distribution fees. Operating expenses, which are deducted from a fund’s gross income, directly reduce the investment return of the fund. A fund’s expenses are expressed as a percentage of its net assets. This figure is known as the expense ratio.
We believe it is important for you to understand the impact of costs on your investment. The following example illustrates the costs that you would incur over the six-month period covered by this report if you invested $1,000 in the Fund, using the Funds’ actual return and operating expenses for the six months ended June 30, 2009. The examples use actual net operating expenses applicable to that class. The calculation does not reflect sales charges (loads). If this cost was included, your costs would have been higher. The examples contain two sets of numbers, one using the actual return earned by each class of each Fund during the six months ended June 30, 2009, and one using a hypothetical 5% annual return (2.5% for the reporting period).
| | | | | | | | | | | | | | | | | | | | | | |
| | | Account value | | | Account value | | | Expenses paid | | | Fund’s | |
| | | at the beginning | | | at the end | | | during | | | expense | |
| | | of the period ($) | | | of the period ($) | | | the period ($) | | | ratio (%) | |
| | | Actual | | | Hypothetical | | | Actual | | | Hypothetical | | | Actual | | | Hypothetical | | | Actual | |
| Small Cap Fund | | | | | | | | | | | | | | | | | | | | | |
| Class A | | $ | 1,000.00 | | | $ | 1,000.00 | | | $ | 1,046.60 | | | $ | 1,018.03 | | | $ | 6.92 | | | $ | 6.83 | | | | 1.36 | % |
| Class C | | $ | 1,000.00 | | | $ | 1,000.00 | | | $ | 1,042.60 | | | $ | 1,014.31 | | | $ | 10.71 | | | $ | 10.56 | | | | 2.11 | % |
| Class I | | $ | 1,000.00 | | | $ | 1,000.00 | | | $ | 1,048.30 | | | $ | 1,019.90 | | | $ | 5.01 | | | $ | 4.94 | | | | 0.99 | % |
| Small-Mid Cap Fund | | | | | | | | | | | | | | | | | | | | | | | | | | |
| Class A | | $ | 1,000.00 | | | $ | 1,000.00 | | | $ | 1,104.70 | | | $ | 1,018.28 | | | $ | 6.86 | | | $ | 6.58 | | | | 1.32 | % |
| Class C | | $ | 1,000.00 | | | $ | 1,000.00 | | | $ | 1,102.10 | | | $ | 1,014.56 | | | $ | 10.76 | | | $ | 10.31 | | | | 2.07 | % |
| Class I | | $ | 1,000.00 | | | $ | 1,000.00 | | | $ | 1,107.60 | | | $ | 1,020.15 | | | $ | 4.90 | | | $ | 4.69 | | | | 0.94 | % |
| Large Cap Fund | | | | | | | | | | | | | | | | | | | | | | | | | | | | |
| Class A | | $ | 1,000.00 | | | $ | 1,000.00 | | | $ | 1,038.20 | | | $ | 1,019.02 | | | $ | 5.89 | | | $ | 5.83 | | | | 1.16 | % |
| Class C | | $ | 1,000.00 | | | $ | 1,000.00 | | | $ | 1,034.30 | | | $ | 1,015.33 | | | $ | 9.62 | | | $ | 9.53 | | | | 1.91 | % |
| Class I | | $ | 1,000.00 | | | $ | 1,000.00 | | | $ | 1,040.00 | | | $ | 1,020.89 | | | $ | 3.98 | | | $ | 3.94 | | | | 0.79 | % |
| Select Fund | | | | | | | | | | | | | | | | | | | | | | | | | | | | |
| Class A | | $ | 1,000.00 | | | $ | 1,000.00 | | | $ | 1,046.90 | | | $ | 1,018.52 | | | $ | 6.42 | | | $ | 6.33 | | | | 1.26 | % |
| Class C | | $ | 1,000.00 | | | $ | 1,000.00 | | | $ | 1,048.70 | | | $ | 1,014.80 | | | $ | 10.23 | | | $ | 10.06 | | | | 2.02 | % |
| Class I | | $ | 1,000.00 | | | $ | 1,000.00 | | | $ | 1,056.30 | | | $ | 1,020.40 | | | $ | 4.52 | | | $ | 4.44 | | | | 0.89 | % |
| Long-Short Fund | | | | | | | | | | | | | | | | | | | | | | | | | | | | |
| Class A | | $ | 1,000.00 | | | $ | 1,000.00 | | | $ | 1,028.90 | | | $ | 1,015.84 | | | $ | 9.08 | | | $ | 9.03 | | | | 1.81 | % |
| Class C | | $ | 1,000.00 | | | $ | 1,000.00 | | | $ | 1,024.80 | | | $ | 1,012.12 | | | $ | 12.83 | | | $ | 12.75 | | | | 2.56 | % |
| Class I | | $ | 1,000.00 | | | $ | 1,000.00 | | | $ | 1,030.30 | | | $ | 1,017.71 | | | $ | 7.19 | | | $ | 7.15 | | | | 1.43 | % |
| Financial Long-Short Fund | | | | | | | | | | | | | | | | | | | | | | | | | |
| Class A | | $ | 1,000.00 | | | $ | 1,000.00 | | | $ | 1,004.70 | | | $ | 1,016.14 | | | $ | 8.67 | | | $ | 8.72 | | | | 1.74 | % |
| Class C | | $ | 1,000.00 | | | $ | 1,000.00 | | | $ | 1,001.20 | | | $ | 1,012.41 | | | $ | 12.39 | | | $ | 12.46 | | | | 2.50 | % |
| Class I | | $ | 1,000.00 | | | $ | 1,000.00 | | | $ | 1,007.10 | | | $ | 1,018.02 | | | $ | 6.80 | | | $ | 6.84 | | | | 1.37 | % |
| Strategic Income | | | | | | | | | | | | | | | | | | | | | | | | | | | | |
| Class A | | $ | 1,000.00 | | | $ | 1,000.00 | | | $ | 1,145.80 | | | $ | 1,019.52 | | | $ | 5.66 | | | $ | 5.33 | | | | 1.06 | % |
| Class C | | $ | 1,000.00 | | | $ | 1,000.00 | | | $ | 1,143.10 | | | $ | 1,015.80 | | | $ | 9.64 | | | $ | 9.07 | | | | 1.81 | % |
| Class I | | $ | 1,000.00 | | | $ | 1,000.00 | | | $ | 1,148.20 | | | $ | 1,021.39 | | | $ | 3.66 | | | $ | 3.44 | | | | 0.69 | % |
_____________________
You can find more information about the Fund’s expenses, including annual expense ratios for historical periods in the Financial Statements section of this report. For additional information on operating expenses and other shareholder costs, please refer to the Fund’s prospectus. The prospectus presents hypothetical shareholder costs over various time periods based upon a $10,000 investment and a return of 5% a year. This standardized example, which appears in all mutual fund prospectuses, may be useful to you in comparing the costs of investing in different funds.
| |
| Page 44 | Diamond Hill Funds Semi-Annual Report June 30, 2009 |
Diamond Hill Funds
Management of the Trust (unaudited)
Listed in the charts below is basic information regarding the Trustees and officers of the Trust.
| TRUSTEES: | | | | |
Name/ Address/1 Age | Position(s) Held with Trust | Term of Office2 and Length of Time Served | Principal Occupation(s) At Least The Last 5 Years | Number of Portfolios in Fund Complex Overseen by Trustee |
| | | | | |
Thomas E. Line Year of Birth: 1967 | Chairman Trustee | Since November 2005 | Senior Managing Director and Chief Financial Officer, Red Capital Group (mortgage and investment banking subsidiary of National City Bank), October 2005 to the present; Vice President and Treasurer, Red Capital Group, September 2004 to October 2005; President, Focused Financial Consulting, Inc. (financial consulting), March 2002 to September 2004; Chief Operating Officer, Meeder Financial, Inc. (parent of investment adviser and mutual fund servicing companies), June 1998 to March 2002. | 7 |
| | | | | |
Elizabeth P. Kessler Year of Birth: 1968 | Trustee | Since November 2005 | Attorney and Partner-in-charge, Columbus Ohio office - Jones Day | 7 |
| | | | | |
D’Ray Moore Rice Year of Birth: 1959 | Trustee | Since August 2007 | Retired, Community Volunteer. Trustee of American Performance Funds from October 2004 to October 2007. | 7 |
| | | | | |
George A. Skestos Year of Birth: 1968 | Trustee | Since August 2000 | Managing Member, Arcadia Holdings, LLC (private investment banking firm), May 2001 to the present; President of Homewood Corporation (real estate development firm), January 2000 to the present. | 7 |
| | | | | |
| PRINCIPAL OFFICERS: | |
| | | | |
Name/ Address/1 Age | Position(s) Held with Trust | Term of Office and Length of Time Served | Principal Occupation(s) At Least the Last 5 Years |
| | | | |
James F. Laird, Jr.3 Year of Birth: 1957 | President | Since December 2001 | Chief Financial Officer of Diamond Hill Investment Group, Inc., since December 2001. President of Diamond Hill Securities since July 2001. Vice President Corporate Strategy with Nationwide Insurance from January 2001 to July 2001. Senior Vice President Product Development with Villanova Capital from February 1999 through December 2000. |
| | | | |
Gary R. Young3 Year of Birth: 1969 | Treasurer, Secretary and Chief Compliance Officer | Since May 2004 Since September 2004 | Controller of Diamond Hill Investment Group, Inc. since April 2004.Director of Mutual Fund Administration with Banc One Investment Advisors October 1998 through April 2004. Vice President and Manager of Mutual Fund Accounting and Financial Reporting with First Chicago NBD January 1996 through October 1998. |
| (1) | The address of each Trustee and Officer is 325 John H. McConnell Boulevard - Suite 200, Columbus, Ohio 43215. |
| (2) | Each Trustee is elected to serve in accordance with the Declaration of Trust and Bylaws of the Trust until his or her successor is duly elected and qualified. |
| (3) | Mr. Laird and Mr. Young are each an “interested person” of the Trust as defined in the Investment Company Act of 1940, as amended, because of their relationship with Diamond Hill Capital Management, Inc. |
The Statement of Additional Information contains additional information about the Trustees and is available without charge on www.diamond-hill.com or by calling 1-888-226-5595.
| |
| Diamond Hill Funds Semi-Annual Report June 30, 2009 | Page 45 |
NOTICE OF PRIVACY POLICY
In order to enhance our ability to provide you with the best service possible, the Diamond Hill Funds (referred to as “we” or “us”) collects, uses and shares certain information about you. This policy explains what information we collect and with whom we share it. The practices described in this policy are applicable to all customers, including prospective, current and former customers. The policy also explains how we protect the security and confidentiality of certain customer information. We make reference to our “affiliates” in this policy. Affiliates are companies related to us by common control, including Diamond Hill Capital Management, Inc., Diamond Hill Investment Group, Inc., Beacon Hill Fund Services, and B Hill Distributors, Inc.
SAFEGUARDING PRIVACY
The Diamond Hill Funds maintain physical, electronic and procedural safeguards that comply with federal standards to ensure the safety of non-public personal customer information.
INFORMATION WE COLLECT AND SOURCES OF INFORMATION
We may collect information about our customers to help identify you, evaluate your application, service and manage your account and offer services and products you may find valuable. We collect this information from a variety of sources including:
| | • | Information we receive from you on applications or other forms (e.g. your name, address, date of birth, social security number and investment information. |
| | • | Information about your transactions and experiences with us and our affiliates (e.g. your account balance, transaction history and investment selections); and |
| | • | Information we obtain from third parties regarding their brokerage, investment advisory, custodial or othe relationship with you (e.g. your account number, account balance and transaction history. |
INFORMATION WE SHARE WITH SERVICE PROVIDERS
We may disclose all non-public personal information we collect, as described above, to companies (including affiliates) that perform services on our behalf, including those that assist us in responding to inquiries, processing transactions, preparing and mailing account statements and other forms of shareholder services provided they use the information solely for these purposes and they enter into a confidentiality agreement regarding the information.
INFORMATION WE SHARE WITH AFFILIATES
Our affiliates are financial service providers that offer investment advisory, brokerage and other financial services. In addition to the information we share with affiliates that provide services to us, we may share information among our affiliates to better assist you in achieving your financial goals.
PRIVACY PROMISE FOR CUSTOMERS
We will safeguard, according to federal standards of security and confidentiality, any non-public personal information our customers share with us.
We will limit the collection and use of non-public customer information to the minimum necessary to deliver superior service to our customers that includes advising our customers about our products and services and to administer our business.
We will permit only authorized employees who are trained in the proper handling of non-public customer information to have access to that information.
We will not reveal non-public customer information to any external organization unless we have previously informed the customer in disclosures or agreements, have been authorized by the customer or are required by law or our regulators.
We value you as a customer and take your personal privacy seriously.We will inform you of our policies for collecting, using, securing and sharing non-public personal information the first time we do business and every year that you are a customer of The Diamond Hill Funds or anytime we make a material change to our privacy policy.
| |
| |
| |
| Page 46 | Diamond Hill Funds Semi-Annual Report June 30, 2009 |
[This page left blank intentionally.]
[This page left blank intentionally.]
[This page left blank intentionally.]
Item 2. Code of Ethics.
Not required in Semiannual report filing.
Item 3. Audit Committee Financial Expert.
Not required in Semiannual report filing.
Item 4. Principal Accountant Fees and Services.
Not required in Semiannual report filing.
Item 5. Audit Committee of Listed Companies.
Not applicable.
Item 6. Schedule of Investments.
The schedule is included as part of the report to shareholders filed under Item 1 of this Form.
Item 7. Disclosure of Proxy Voting Policies and Procedures for Closed-End Management Investment Companies.
Not applicable.
Item 8. Portfolio Managers of Closed-End Management Investment Companies.
Not Applicable.
Item 9. Purchases of Equity Securities by Closed-End Management Investment Companies and Affiliated Purchasers.
Not Applicable.
Item 10. Submission of Matters to a Vote of Security Holders.
Not Applicable.
(a) Based on an evaluation of the registrant’s disclosure controls and procedures (as defined in Rule 30a-3(c) under the Investment Company Act of 1940), as of a date within 90 days of the filing date of this report, the registrant’s principal executive officer and principal financial officer have concluded that the registrant’s disclosure controls and procedures are effective.
(b) There were no changes in the registrant’s internal control over financial reporting (as defined in Rule 30a-3(d) under the Investment Company Act of 1940) that occurred during the registrant’s last fiscal half-year that have materially affected, or are reasonably likely to materially affect, the registrant’s internal control over financial reporting.
Item 12. Exhibits.
(a)(1) Not applicable in Semiannual filing.
(a)(2) Certifications required by Item 12(a) of Form N-CSR are filed herewith.
(a)(3) Not applicable.
(b) Certifications required by Item 12(b) of Form N-CSR are filed herewith.
Pursuant to the requirements of the Securities Exchange Act of 1934 and the Investment Company Act of 1940, the registrant has duly caused this report to be signed on its behalf by the undersigned, thereunto duly authorized.
James F. Laird, Jr.
Pursuant to the requirements of the Securities Exchange Act of 1934 and the Investment Company Act of 1940, this report has been signed below by the following persons on behalf of the registrant and in the capacities and on the dates indicated.
James F. Laird, Jr.
Gary R. Young.