UNITED STATES
SECURITIES AND EXCHANGE COMMISSION
Washington, D.C. 20549
FORM N-CSR
CERTIFIED SHAREHOLDER REPORT OF REGISTERED
MANAGEMENT INVESTMENT COMPANIES
Investment Company Act file number: 811-08061
Diamond Hill Funds
(Exact name of registrant as specified in charter)
325 John H. McConnell Boulevard, Suite 200, Columbus, Ohio 43215
(Address of principal executive offices) (Zip code)
Thomas E. Line
325 John H. McConnell Boulevard, Suite 200, Columbus, Ohio 43215
(Name and address of agent for service)
Registrant's telephone number, including area code: 614-255-3333
Date of fiscal year end: December 31
Date of reporting period: December 31, 2021
Form N-CSR is to be used by management investment companies to file reports with the Commission not later than 10 days after the transmission to stockholders of any report that is required to be transmitted to stockholders under Rule 30e-1 under the Investment Company Act of 1940 (17 CFR 270.30e-1). The Commission may use the information provided on Form N-CSR in its regulatory, disclosure review, inspection, and policymaking roles.
A registrant is required to disclose the information specified by Form N-CSR, and the Commission will make this information public. A registrant is not required to respond to the collection of information contained in Form N-CSR unless the Form displays a currently valid Office of Management and Budget ("OMB") control number. Please direct comments concerning the accuracy of the information collection burden estimate and any suggestions for reducing the burden to Secretary, Securities and Exchange Commission, 450 Fifth Street, NW, Washington, DC 20549-0609. The OMB has reviewed this collection of information under the clearance requirements of 44 U.S.C. § 3507.
Item 1. Reports to Stockholders.

Annual Report
December 31, 2021
Small Cap Fund | All Cap Select Fund |
Small-Mid Cap Fund | Long-Short Fund |
Mid Cap Fund | International Fund |
Large Cap Fund | Short Duration Securitized Bond Fund |
Large Cap Concentrated Fund | Core Bond Fund |
This material must be preceded or accompanied by a current prospectus.
Not FDIC insured | No bank guarantee | May lose value

| | |
Vision and Our Shared Investment Principles | 1 |
Management Discussion of Fund Performance (Unaudited) | |
Diamond Hill Small Cap Fund | 2 |
Diamond Hill Small-Mid Cap Fund | 4 |
Diamond Hill Mid Cap Fund | 6 |
Diamond Hill Large Cap Fund | 8 |
Diamond Hill Large Cap Concentrated Fund | 10 |
Diamond Hill All Cap Select Fund | 12 |
Diamond Hill Long-Short Fund | 14 |
Diamond Hill International Fund | 16 |
Diamond Hill Short Duration Securitized Bond Fund | 18 |
Diamond Hill Core Bond Fund | 20 |
Financial Statements | |
Schedules of Investments | 22 |
Statements of Assets & Liabilities | 84 |
Statements of Operations | 86 |
Statements of Changes in Net Assets | 88 |
Financial Highlights | 102 |
Notes to Financial Statements | 122 |
Report of Independent Registered Public Accounting Firm | 138 |
Other Items | 140 |
Schedule of Shareholder Expenses | 144 |
Management of the Trust | 146 |
Cautionary Statement: At Diamond Hill, we pledge that, “we will communicate with our clients about our investment performance in a manner that will allow them to properly assess whether we are deserving of their trust.” Our views and opinions regarding the investment prospects of our portfolio holdings and Funds are “forward looking statements” which may or may not be accurate over the long term. While we believe we have a reasonable basis for our opinions, actual results may differ materially from those we anticipate. Information provided in this report should not be considered a recommendation to purchase or sell any particular security.
You can identify forward looking statements by words like “believe,” “expect,” “anticipate,” or similar expressions when discussing prospects for particular portfolio holdings and/or one of the Funds. We cannot assure future results. You should not place undue reliance on forward-looking statements, which speak only as of the date of this report. We disclaim any obligation to update or alter any forward-looking statements, whether as a result of new information, future events, or otherwise.
This material is not authorized for distribution to prospective investors unless preceded or accompanied by a Prospectus. Carefully consider the Fund’s investment objectives, risks, and expenses. This and other important information are contained in the Fund’s prospectus and summary prospectus, which are available at diamond-hill.com or calling 888.226.5595. Read carefully before investing. The Diamond Hill Funds are distributed by Foreside Financial Services, LLC (Member FINRA). Diamond Hill Capital Management, Inc., a registered investment adviser, serves as Investment Adviser to the Diamond Hill Funds and is paid a fee for its services. Not FDIC insured | No bank guarantee | May lose value
VISION
At Diamond Hill, our goal is to be an exceptional active investment boutique that our clients trust to deliver excellent long-term investment outcomes from a team aligned with their success.
OUR SHARED INVESTMENT PRINCIPLES
ACTIVE, FUNDAMENTAL APPROACH
We believe we can add the most value with an active, fundamentally driven process.
OWNERSHIP
Our investment professionals approach each investment as long-term owners, and they invest heavily alongside our clients. With every employee an owner of company shares their first day, we promote an ownership mentality throughout the firm.
LONG-TERM
We are long-term oriented in both our investment analysis and the management of our business.
VALUATION DISCIPLINE
We invest with a valuation discipline. We believe in taking an ownership stake in an investment at a discount to what we believe it is worth and waiting patiently for value to be realized.
CAPACITY DISCIPLINE
We are committed to capacity discipline. We believe prudent capacity management puts our clients’ interests first.
DIAMOND HILL FUNDS | ANNUAL REPORT | DECEMBER 31, 2021 | DIAMOND-HILL.COM 1 |
Management Discussion of Fund Performance (Unaudited) |
Diamond Hill Small Cap Fund
Investing Environment
2021 marked the second year into the coronavirus pandemic, coinciding with another year of strong gains. US markets, as measured by the Russell 3000® Index, rose 25.7%, while the MSCI All Country World ex-USA Index advanced 7.8%.
The first half of 2021 was marked by optimism as continued distribution of COVID-19 vaccines globally and gradual steps to reopen economies drove broad gains in stocks across sectors. However, the second half of the year proved a bit choppier with the emergence of the Delta variant throughout the summer months, which, combined with inflation concerns and supply chain disruptions, brought into question the pace of economic reopening. Stocks continued to move higher in the fourth quarter as investor concerns were somewhat alleviated with better-than-expected corporate earnings. The emergence of another COVID variant, Omicron, also created economic uncertainty and caused equity markets to fall in late November, but its market impact was short-lived as Omicron proved to be less of a risk than feared.
Performance Discussion
Top contributors within the portfolio during the period included: Las Vegas locals casino operator Red Rock Resorts, Inc.; regional bank Bank OZK; regional bank Sterling Bancorp; self-storage REIT CubeSmart; and distributor of electrical, industrial and communications materials, WESCO International, Inc. Bottom contributors during the period included: rental and leasing services company PROG Holdings, Inc.; provider of regulated medical waste management Stericycle, Inc.; specialty chemicals company Chase Corporation; footwear and apparel company Wolverine World Wide, Inc.; and specialty food manufacturer and marketer Lancaster Colony Corporation.
Fund Changes
During the period, we identified new investment opportunities and added positions to the portfolio including: specialty chemicals company Chase Corporation; regional bank First Interstate BancSystem, Inc.; regional bank Glacier Bancorp, Inc.; metals mining company Taseko Mines Limited; and concrete pumping services provider Concrete Pumping Holdings, Inc. Civitas Resources, Inc., also a new name in the portfolio, is the result of a merger of our prior holding Bonanza Creek Energy and Extraction Oil & Gas and the acquisition of Crestone Peak, which closed November 1, 2021. Throughout the year, we closed positions in companies that reached our estimate of intrinsic value and to fund purchases of more attractive investment opportunities. Larger sales included: freight transportation management company Hub Group, Inc.; specialty chemicals company W R Grace & Co; medical device company LivaNova Plc; airline Alaska Air Group, Inc.; and insurance broker Brown & Brown, Inc. Current and future portfolio holdings are subject to change and risk.
2 DIAMOND HILL FUNDS | ANNUAL REPORT | DECEMBER 31, 2021 | DIAMOND-HILL.COM |
Diamond Hill Small Cap Fund |
AVERAGE ANNUAL TOTAL RETURNS AS OF DECEMBER 31, 2021
| Inception
Date | One
Year | Three
Years | Five
Years | Ten
Years | Expense
Ratio |
PERFORMANCE AT NAV |
Investor Class | 12/29/2000 | 32.45% | 16.93% | 8.46% | 10.52% | 1.26% |
Class I | 4/29/2005 | 32.83 | 17.27 | 8.78 | 10.83 | 0.97 |
Class Y | 12/30/2011 | 32.98 | 17.40 | 8.89 | 10.97 | 0.85 |
BENCHMARK |
Russell 2000 Index | | 14.82 | 20.02 | 12.02 | 13.23 | — |
GROWTH OF $10,000
Comparison of the change in value of a $10,000 Investment in the Diamond Hill Small Cap Fund Class I(A) and the Russell 2000 Index.

(A) | The growth of $10,000 chart represents the performance of Class I shares only, which will vary from the performance of Investor Class and Class Y shares based on the difference in loads and fees paid by shareholders in the different classes. |
| The performance of the above Fund does not reflect the deduction of taxes that a shareholder would pay on Fund distributions or the redemption of Fund shares. |
| The chart above represents a comparison of a hypothetical $10,000 investment and the reinvestment of dividends and capital gains in the indicated share class versus a similar investment in the Russell 2000 Index (“Index”). The Index measures the performance of roughly 2,000 US small-cap companies. The index is unmanaged, market capitalization weighted, includes net reinvested dividends, does not reflect fees or expenses (which would lower the return), and is not available for direct investment. The Fund’s performance reflects the deduction of fees for these services. |
| Past performance is not indicative of future results. Investment returns and principal values will fluctuate so that an investor’s shares, when redeemed, may be worth more or less than their original cost. The Fund’s current performance may be lower or higher than the performance quoted. For current to most recent month-end performance, visit diamond-hill.com. |
DIAMOND HILL FUNDS | ANNUAL REPORT | DECEMBER 31, 2021 | DIAMOND-HILL.COM 3 |
Diamond Hill Small-Mid Cap Fund |
Investing Environment
2021 marked the second year into the coronavirus pandemic, coinciding with another year of strong gains. US markets, as measured by the Russell 3000® Index, rose 25.7%, while the MSCI All Country World ex-USA Index advanced 7.8%.
The first half of 2021 was marked by optimism as continued distribution of COVID-19 vaccines globally and gradual steps to reopen economies drove broad gains in stocks across sectors. However, the second half of the year proved a bit choppier with the emergence of the Delta variant throughout the summer months, which, combined with inflation concerns and supply chain disruptions, brought into question the pace of economic reopening. Stocks continued to move higher in the fourth quarter as investor concerns were somewhat alleviated with better-than-expected corporate earnings. The emergence of another COVID variant, Omicron, also created economic uncertainty and caused equity markets to fall in late November, but its market impact was short-lived as Omicron proved to be less of a risk than feared.
Performance Discussion
Top contributors within the portfolio during the period included: Las Vegas locals casino operator Red Rock Resorts, Inc.; distributor of electrical, industrial and communications materials, WESCO International, Inc.; self-storage REIT CubeSmart; energy and gas exploration and production company Coterra Energy, Inc.; and regional bank Sterling Bancorp. Bottom contributors during the period included: rental and leasing services company PROG Holdings, Inc.; provider of regulated medical waste management Stericycle, Inc.; footwear and apparel company Wolverine World Wide, Inc.; investment management firm Blackstone, Inc.; and fresh egg producer and distributor Cal-Maine Foods, Inc.
Fund Changes
During the period, we identified new investment opportunities and added positions to the portfolio including investment management firm Blackstone, Inc.; regional bank First Interstate BancSystem, Inc.; group-travel business focused REIT Ryman Hospitality Properties, Inc.; producer of industrial pressure exchangers Energy Recovery, Inc.; and manufacturer of specialty foods Lancaster Colony Corporation. Coterra Energy, Inc., also a new name in the portfolio, is the result of a merger of our prior holding Cimarex Energy Co., and Cabot Oil & Gas, which closed October 1, 2021. Throughout the year, we closed positions in companies that reached our estimate of intrinsic value and to fund purchases of more attractive investment opportunities. Larger sales included: medical device company LivaNova Plc; freight transportation management company Hub Group, Inc.; specialty chemicals company W R Grace & Co; multi-family REIT Mid-America Apartment Communities, Inc.; and children’s and infants’ apparel company Carter’s, Inc. Current and future portfolio holdings are subject to change and risk.
4 DIAMOND HILL FUNDS | ANNUAL REPORT | DECEMBER 31, 2021 | DIAMOND-HILL.COM |
Diamond Hill Small-Mid Cap Fund |
AVERAGE ANNUAL TOTAL RETURNS AS OF DECEMBER 31, 2021
| Inception
Date | One
Year | Three
Years | Five
Years | Ten
Years | Expense
Ratio |
PERFORMANCE AT NAV |
Investor Class | 12/30/2005 | 30.78% | 18.93% | 9.71% | 12.70% | 1.20% |
Class I | 12/30/2005 | 31.14 | 19.28 | 10.02 | 13.01 | 0.91 |
Class Y | 12/30/2011 | 31.24 | 19.41 | 10.16 | 13.15 | 0.79 |
BENCHMARK |
Russell 2500 Index | | 18.18 | 21.91 | 13.75 | 14.15 | — |
GROWTH OF $10,000
Comparison of the change in value of a $10,000 Investment in the Diamond Hill Small-Mid Cap Fund Class I(A) and the Russell 2500 Index.

(A) The growth of $10,000 chart represents the performance of Class I shares only, which will vary from the performance of Investor Class and Class Y shares based on the difference in loads and fees paid by shareholders in the different classes.
| The performance of the above Fund does not reflect the deduction of taxes that a shareholder would pay on Fund distributions or the redemption of Fund shares. |
| The chart above represents a comparison of a hypothetical $10,000 investment and the reinvestment of dividends and capital gains in the indicated share class versus a similar investment in the Russell 2500 Index (“Index”). The Index measures the performance of roughly 2,500 US small- to mid-cap companies. The index is unmanaged, market capitalization weighted, includes net reinvested dividends, does not reflect fees or expenses (which would lower the return), and is not available for direct investment. The Fund’s performance reflects the deduction of fees for these services. |
| Past performance is not indicative of future results. Investment returns and principal values will fluctuate so that an investor’s shares, when redeemed, may be worth more or less than their original cost. The Fund’s current performance may be lower or higher than the performance quoted. For current to most recent month-end performance, visit diamond-hill.com. |
DIAMOND HILL FUNDS | ANNUAL REPORT | DECEMBER 31, 2021 | DIAMOND-HILL.COM 5 |
Diamond Hill Mid Cap Fund |
Investing Environment
2021 marked the second year into the coronavirus pandemic, coinciding with another year of strong gains. US markets, as measured by the Russell 3000® Index, rose 25.7%, while the MSCI All Country World ex-USA Index advanced 7.8%.
The first half of 2021 was marked by optimism as continued distribution of COVID-19 vaccines globally and gradual steps to reopen economies drove broad gains in stocks across sectors. However, the second half of the year proved a bit choppier with the emergence of the Delta variant throughout the summer months, which, combined with inflation concerns and supply chain disruptions, brought into question the pace of economic reopening. Stocks continued to move higher in the fourth quarter as investor concerns were somewhat alleviated with better-than-expected corporate earnings. The emergence of another COVID variant, Omicron, also created economic uncertainty and caused equity markets to fall in late November, but its market impact was short-lived as Omicron proved to be less of a risk than feared.
Performance Discussion
Top contributors within the portfolio during the period included: Las Vegas locals casino operator Red Rock Resorts, Inc.; self-storage REIT CubeSmart; financial services company SVB Financial Group; distributor of electrical, industrial and communications materials, WESCO International, Inc.; and energy and gas exploration and production company Coterra Energy, Inc. Bottom contributors during the period included: internet security services provider Check Point Software Technologies Ltd.; provider of regulated medical waste management Stericycle, Inc.; rental and leasing services company PROG Holdings, Inc.; apparel, footwear and accessories company VF Corporation; and property and casualty insurance company Alleghany Corporation.
Fund Changes
During the period, we identified new investment opportunities and added positions to the portfolio including copper-focused mining company Freeport-McMoRan, Inc.; property and casualty insurance company Alleghany Corporation; timberland REIT Rayonier, Inc.; group-travel business focused REIT Ryman Hospitality Properties, Inc.; and manufacturer of specialty foods Lancaster Colony Corporation. Throughout the year, we closed positions in companies that reached our estimate of intrinsic value and to fund purchases of more attractive investment opportunities. Larger sales included: specialty chemicals company W R Grace & Co; multi-family REIT Mid-America Apartment Communities, Inc.; freight transportation management company Hub Group, Inc.; children’s and infants’ apparel company Carter’s, Inc.; and networking technology provider Juniper Networks, Inc. Current and future portfolio holdings are subject to change and risk.
6 DIAMOND HILL FUNDS | ANNUAL REPORT | DECEMBER 31, 2021 | DIAMOND-HILL.COM |
Diamond Hill Mid Cap Fund |
AVERAGE ANNUAL TOTAL RETURNS AS OF DECEMBER 31, 2021
| Inception
Date | One
Year | Three
Years | Five
Years | Since
Inception
(12/31/13) | Expense
Ratio |
PERFORMANCE AT NAV |
Investor Class | 12/31/2013 | 30.87% | 17.15% | 9.63% | 9.21% | 1.06% |
Class I | 12/31/2013 | 31.29 | 17.51 | 9.96 | 9.54 | 0.77 |
Class Y | 12/31/2013 | 31.41 | 17.62 | 10.07 | 9.65 | 0.65 |
BENCHMARK |
Russell Midcap Index | | 22.58 | 23.29 | 15.10 | 12.35 | — |
GROWTH OF $10,000
Comparison of the change in value of a $10,000 Investment in the Diamond Hill Mid Cap Fund Class I(A) and the Russell Midcap Index.

(A) | The growth of $10,000 chart represents the performance of Class I shares only, which will vary from the performance of Investor Class and Class Y shares based on the difference in loads and fees paid by shareholders in the different classes. |
| The performance of the above Fund does not reflect the deduction of taxes that a shareholder would pay on Fund distributions or the redemption of Fund shares. |
| The chart above represents a comparison of a hypothetical $10,000 investment and the reinvestment of dividends and capital gains in the indicated share class versus a similar investment in the Russell Midcap Index (“Index”). The Index measures the performance of roughly 800 US mid-cap companies. The index is unmanaged, market capitalization weighted, includes net reinvested dividends, does not reflect fees or expenses (which would lower the return), and is not available for direct investment. The Fund’s performance reflects the deduction of fees for these services. |
| Past performance is not indicative of future results. Investment returns and principal values will fluctuate so that an investor’s shares, when redeemed, may be worth more or less than their original cost. The Fund’s current performance may be lower or higher than the performance quoted. For current to most recent month-end performance, visit diamond-hill.com. |
DIAMOND HILL FUNDS | ANNUAL REPORT | DECEMBER 31, 2021 | DIAMOND-HILL.COM 7 |
Diamond Hill Large Cap Fund |
Investing Environment
2021 marked the second year into the coronavirus pandemic, coinciding with another year of strong gains. US markets, as measured by the Russell 3000® Index, rose 25.7%, while the MSCI All Country World ex-USA Index advanced 7.8%.
The first half of 2021 was marked by optimism as continued distribution of COVID-19 vaccines globally and gradual steps to reopen economies drove broad gains in stocks across sectors. However, the second half of the year proved a bit choppier with the emergence of the Delta variant throughout the summer months, which, combined with inflation concerns and supply chain disruptions, brought into question the pace of economic reopening. Stocks continued to move higher in the fourth quarter as investor concerns were somewhat alleviated with better-than-expected corporate earnings. The emergence of another COVID variant, Omicron, also created economic uncertainty and caused equity markets to fall in late November, but its market impact was short-lived as Omicron proved to be less of a risk than feared.
Performance Discussion
Top contributors during the period included: property and casualty insurance company American International Group, Inc., private equity firm KKR & Co., Inc., banking and financial services company Bank of America Corporation, biopharmaceutical company Pfizer, Inc., and health care products manufacturer Abbott Laboratories. Bottom contributors during the period included financial services technology company Fidelity National Information Services, Inc., media and entertainment company Walt Disney Company, mobile game developer Zynga, Inc., consumer apparel manufacturer VF Corporation and medical device manufacturer Medtronic plc.
Fund Changes
During the period, we added new positions to the portfolio including copper-focused mining company Freeport-McMoRan, Inc., home improvement retailer Home Depot, Inc., global medical technology company Becton, Dickinson and Company, global technology company Nasdaq, Inc., and pharmaceutical company AbbVie, Inc. Throughout the year, we closed positions in companies that reached our estimate of intrinsic value and to fund purchases of more attractive investment opportunities. Larger sales included banking and financial services company Charles Schwab Corporation, discount apparel retailer TJX Companies, Inc., personal products manufacturer Kimberly-Clark Corporation, financial services firm Morgan Stanley and life insurance company MetLife, Inc. Current and future portfolio holdings are subject to change and risk.
8 DIAMOND HILL FUNDS | ANNUAL REPORT | DECEMBER 31, 2021 | DIAMOND-HILL.COM |
Diamond Hill Large Cap Fund |
AVERAGE ANNUAL TOTAL RETURNS AS OF DECEMBER 31, 2021
| Inception
Date | One
Year | Three
Years | Five
Years | Ten
Years | Expense
Ratio |
PERFORMANCE AT NAV |
Investor Class | 6/29/2001 | 25.42% | 21.55% | 14.19% | 14.00% | 0.96% |
Class I | 1/31/2005 | 25.75 | 21.90 | 14.51 | 14.32 | 0.67 |
Class Y | 12/30/2011 | 25.89 | 22.03 | 14.64 | 14.46 | 0.55 |
BENCHMARK |
Russell 1000 Index | | 26.45 | 26.21 | 18.43 | 16.54 | — |
GROWTH OF $10,000
Comparison of the change in value of a $10,000 Investment in the Diamond Hill Large Cap Fund Class I(A) and the Russell 1000 Index.

(A) | The growth of $10,000 chart represents the performance of Class I shares only, which will vary from the performance of Investor Class and Class Y shares based on the difference in loads and fees paid by shareholders in the different classes. |
| The performance of the above Fund does not reflect the deduction of taxes that a shareholder would pay on Fund distributions or the redemption of Fund shares. |
| The chart above represents a comparison of a hypothetical $10,000 investment and the reinvestment of dividends and capital gains in the indicated share class versus a similar investment in the Russell 1000 Index (“Index”). The Index measures the performance of roughly 1,000 US large-cap companies. The index is unmanaged, market capitalization weighted, includes net reinvested dividends, does not reflect fees or expenses (which would lower the return), and is not available for direct investment. The Fund’s performance reflects the deduction of fees for these services. |
| Past performance is not indicative of future results. Investment returns and principal values will fluctuate so that an investor’s shares, when redeemed, may be worth more or less than their original cost. The Fund’s current performance may be lower or higher than the performance quoted. For current to most recent month-end performance, visit diamond-hill.com. |
DIAMOND HILL FUNDS | ANNUAL REPORT | DECEMBER 31, 2021 | DIAMOND-HILL.COM 9 |
Diamond Hill Large Cap Concentrated Fund |
Investing Environment
2021 marked the second year into the coronavirus pandemic, coinciding with another year of strong gains. US markets, as measured by the Russell 3000® Index, rose 25.7%, while the MSCI All Country World ex-USA Index advanced 7.8%.
The first half of 2021 was marked by optimism as continued distribution of COVID-19 vaccines globally and gradual steps to reopen economies drove broad gains in stocks across sectors. However, the second half of the year proved a bit choppier with the emergence of the Delta variant throughout the summer months, which, combined with inflation concerns and supply chain disruptions, brought into question the pace of economic reopening. Stocks continued to move higher in the fourth quarter as investor concerns were somewhat alleviated with better-than-expected corporate earnings. The emergence of another COVID variant, Omicron, also created economic uncertainty and caused equity markets to fall in late November, but its market impact was short-lived as Omicron proved to be less of a risk than feared.
Performance Discussion
Top contributors during the inception-to-date period included private equity firm KKR & Co., Inc., property and casualty insurance company American International Group, Inc., biopharmaceutical company Pfizer, Inc., consumer snack and beverage manufacturer PepsiCo, Inc. and diversified holding company Berkshire Hathaway, Inc. Bottom contributors during the inception-to-date period included media and entertainment company Walt Disney Company, financial services technology company Fidelity National Information Services, Inc., consumer apparel manufacturer VF Corporation, telecom and media company Charter Communications, Inc. and semiconductor manufacturer Texas Instruments, Inc.
Fund Changes
Following the initial positioning of the portfolio, we added new positions to the portfolio including social media platform Meta Platforms, Inc., copper-focused mining company Freeport-McMoRan, Inc., banking and financial services company Truist Financial Corporation, health insurance company Humana, Inc., and semiconductor manufacturer Texas Instruments, Inc. Throughout the period, we closed positions in companies that reached our estimate of intrinsic value and to fund purchases of more attractive investment opportunities. Sales included consumer products manufacturer Procter & Gamble Co., banking and financial services company Charles Schwab Corporation, financial services technology company Fidelity National Information Services, Inc. and telecom and media company Charter Communications, Inc. Current and future portfolio holdings are subject to change and risk.
10 DIAMOND HILL FUNDS | ANNUAL REPORT | DECEMBER 31, 2021 | DIAMOND-HILL.COM |
Diamond Hill Large Cap Concentrated Fund |
AVERAGE ANNUAL TOTAL RETURNS AS OF DECEMBER 31, 2021
| Inception
Date | Since
Inception
(2/26/21) | Expense
Ratio |
PERFORMANCE AT NAV |
Investor Class | 2/26/2021 | 20.53% | 0.96% |
Class I | 2/26/2021 | 20.92 | 0.67 |
Class Y | 2/26/2021 | 20.98 | 0.55 |
BENCHMARK |
Russell 1000 Index | | 23.91 | — |
GROWTH OF $10,000
Comparison of the change in value of a $10,000 Investment in the Diamond Hill Large Cap Concentrated Fund Class I(A) and the Russell 1000 Index.

(A) | The growth of $10,000 chart represents the performance of Class I shares only, which will vary from the performance of Investor Class and Class Y shares based on the difference in loads and fees paid by shareholders in the different classes. |
| The performance of the above Fund does not reflect the deduction of taxes that a shareholder would pay on Fund distributions or the redemption of Fund shares. |
| The chart above represents a comparison of a hypothetical $10,000 investment and the reinvestment of dividends and capital gains in the indicated share class versus a similar investment in the Russell 1000 Index (“Index”). The Index measures the performance of roughly 1,000 US large-cap companies. The index is unmanaged, market capitalization weighted, includes net reinvested dividends, does not reflect fees or expenses (which would lower the return), and is not available for direct investment. The Fund’s performance reflects the deduction of fees for these services. |
| Past performance is not indicative of future results. Investment returns and principal values will fluctuate so that an investor’s shares, when redeemed, may be worth more or less than their original cost. The Fund’s current performance may be lower or higher than the performance quoted. For current to most recent month-end performance, visit diamond-hill.com. |
DIAMOND HILL FUNDS | ANNUAL REPORT | DECEMBER 31, 2021 | DIAMOND-HILL.COM 11 |
Diamond Hill All Cap Select Fund |
Investing Environment
2021 marked the second year into the coronavirus pandemic, coinciding with another year of strong gains. US markets, as measured by the Russell 3000® Index, rose 25.7%, while the MSCI All Country World ex-USA Index advanced 7.8%.
The first half of 2021 was marked by optimism as continued distribution of COVID-19 vaccines globally and gradual steps to reopen economies drove broad gains in stocks across sectors. However, the second half of the year proved a bit choppier with the emergence of the Delta variant throughout the summer months, which, combined with inflation concerns and supply chain disruptions, brought into question the pace of economic reopening. Stocks continued to move higher in the fourth quarter as investor concerns were somewhat alleviated with better-than-expected corporate earnings. The emergence of another COVID variant, Omicron, also created economic uncertainty and caused equity markets to fall in late November, but its market impact was short-lived as Omicron proved to be less of a risk than feared.
Performance Discussion
Top contributors during the period included electrical and industrial products distributor WESCO International, Inc., Las Vegas locals casino operator Red Rock Resorts, Inc., property and casualty insurance company American International Group, Inc., private equity firm KKR & Co., Inc. and mortgage servicing company Mr. Cooper Group, Inc. Bottom contributors during the period included mobile game developer Zynga, Inc., financial services technology company Fidelity National Information Services, Inc., consumer apparel manufacturer VF Corporation, fresh egg producer Cal-Maine Foods, Inc. and media and entertainment company Walt Disney Company.
Fund Changes
During the period, we added new positions to the portfolio including social media platform Meta Platforms, Inc., copper-focused mining company Freeport-McMoRan, Inc., mobile game developer Zynga, Inc., food products manufacturer Post Holdings, Inc., and health insurance company Humana, Inc. Throughout the year, we closed positions in companies that reached our estimate of intrinsic value and to fund purchases of more attractive investment opportunities. Larger sales included fresh egg producer Cal-Maine Foods, Inc., specialty chemicals producer W.R. Grace & Co., banking and financial services company Charles Schwab Corporation, diversified technology and industrial company Johnson Controls International plc and agricultural commodities and products company Archer-Daniels-Midland Company. Current and future portfolio holdings are subject to change and risk.
12 DIAMOND HILL FUNDS | ANNUAL REPORT | DECEMBER 31, 2021 | DIAMOND-HILL.COM |
Diamond Hill All Cap Select Fund |
AVERAGE ANNUAL TOTAL RETURNS AS OF DECEMBER 31, 2021
| Inception
Date | One
Year | Three
Years | Five
Years | Ten
Years | Expense
Ratio |
PERFORMANCE AT NAV |
Investor Class | 12/30/2005 | 32.91% | 25.59% | 15.81% | 14.89% | 1.16% |
Class I | 12/30/2005 | 33.39 | 25.96 | 16.17 | 15.21 | 0.87 |
Class Y | 12/30/2011 | 33.55 | 26.12 | 16.30 | 15.35 | 0.75 |
BENCHMARK |
Russell 3000 Index | | 25.66 | 25.79 | 17.97 | 16.30 | — |
GROWTH OF $10,000
Comparison of the change in value of a $10,000 Investment in the Diamond Hill All Cap Select Fund Class I(A) and the Russell 3000 Index.

(A) | The growth of $10,000 chart represents the performance of Class I shares only, which will vary from the performance of Investor Class and Class Y shares based on the difference in loads and fees paid by shareholders in the different classes. |
| The performance of the above Fund does not reflect the deduction of taxes that a shareholder would pay on Fund distributions or the redemption of Fund shares. |
| The chart above represents a comparison of a hypothetical $10,000 investment and the reinvestment of dividends and capital gains in the indicated share class versus a similar investment in the Russell 3000 Index (“Index”). The Index measures the performance of roughly 3,000 of the largest US companies. The index is unmanaged, market capitalization weighted, includes net reinvested dividends, does not reflect fees or expenses (which would lower the return), and is not available for direct investment. The Fund’s performance reflects the deduction of fees for these services. |
| Past performance is not indicative of future results. Investment returns and principal values will fluctuate so that an investor’s shares, when redeemed, may be worth more or less than their original cost. The Fund’s current performance may be lower or higher than the performance quoted. For current to most recent month-end performance, visit diamond-hill.com. |
DIAMOND HILL FUNDS | ANNUAL REPORT | DECEMBER 31, 2021 | DIAMOND-HILL.COM 13 |
Diamond Hill Long-Short Fund |
Investing Environment
2021 marked the second year into the coronavirus pandemic, coinciding with another year of strong gains. US markets, as measured by the Russell 3000® Index, rose 25.7%, while the MSCI All Country World ex-USA Index advanced 7.8%.
The first half of 2021 was marked by optimism as continued distribution of COVID-19 vaccines globally and gradual steps to reopen economies drove broad gains in stocks across sectors. However, the second half of the year proved a bit choppier with the emergence of the Delta variant throughout the summer months, which, combined with inflation concerns and supply chain disruptions, brought into question the pace of economic reopening. Stocks continued to move higher in the fourth quarter as investor concerns were somewhat alleviated with better-than-expected corporate earnings. The emergence of another COVID variant, Omicron, also created economic uncertainty and caused equity markets to fall in late November, but its market impact was short-lived as Omicron proved to be less of a risk than feared.
Performance Discussion
Top contributors within the portfolio during the period included: global insurance company American International Group, Inc. (long), private equity firm KKR & Co., Inc. (long), internet software and services firm Alphabet, Inc. (long), oil and gas energy and exploration company Coterra Energy, Inc. (long), and technology company Microsoft Corporation (long). Bottom contributors during the period included: sporting goods retailer Dick’s Sporting Goods, Inc. (short), personnel consultancy Robert Half International, Inc. (short), medical devices company Penumbra, Inc. (short), enterprise technology solutions provider Oracle Corporation (short), and financial services technology company Fidelity National Information Services, Inc. (long).
Fund Changes
During the period, we identified new investment opportunities and added positions to the portfolio including global medical supplies company Becton, Dickinson and Company (long), package delivery company United Parcel Service, Inc. (short), telecommunications company Verizon Communications, Inc. (long), copper-focused mining company Freeport-McMoRan, Inc. (long), and financial services company Wells Fargo & Co. (long). Coterra Energy, Inc., also a new name in the portfolio, is the result of a merger of our prior holding Cimarex Energy Co., and Cabot Oil & Gas, which closed October 1, 2021. Throughout the year, we eliminated positions in companies that reached our estimate of intrinsic value and to fund purchases of more attractive investment opportunities. Larger sales included: specialty chemicals company W R Grace & Co. (long), financial services company Charles Schwab Corporation (long), regional bank First Republic Bank (long), truck designer and manufacturer PACCAR, Inc (short), and automotive aftermarket parts provider Advance Auto Parts, Inc. (long). Current and future portfolio holdings are subject to change and risk.
14 DIAMOND HILL FUNDS | ANNUAL REPORT | DECEMBER 31, 2021 | DIAMOND-HILL.COM |
Diamond Hill Long-Short Fund |
AVERAGE ANNUAL TOTAL RETURNS AS OF DECEMBER 31, 2021
| Inception
Date | One
Year | Three
Years | Five
Years | Ten
Years | Expense
Ratio |
PERFORMANCE AT NAV |
Investor Class | 6/30/2000 | 19.03% | 13.26% | 7.31% | 8.23% | 1.92% |
Class I | 1/31/2005 | 19.40 | 13.60 | 7.63 | 8.54 | 1.63 |
Class Y | 12/30/2011 | 19.55 | 13.71 | 7.75 | 8.67 | 1.51 |
BENCHMARK |
Russell 1000 Index | | 26.45 | 26.21 | 18.43 | 16.54 | — |
60% Russell 1000 Index/40% ICE BofA U.S. T-Bill 0-3 Month Index | | 15.36 | 15.91 | 11.52 | 10.13 | — |
GROWTH OF $10,000
Comparison of the change in value of a $10,000 Investment in the Diamond Hill Long-Short Fund Class I(A), the Russell 1000 Index and the Blended Index (60% Russell 1000 Index and 40% ICE BofA U.S. T-Bill 0-3 Month Index)

(A) | The growth of $10,000 chart represents the performance of Class I shares only, which will vary from the performance of Investor Class and Class Y shares based on the difference in loads and fees paid by shareholders in the different classes. |
| The performance of the above Fund does not reflect the deduction of taxes that a shareholder would pay on Fund distributions or the redemption of Fund shares. |
| The chart above represents a comparison of a hypothetical $10,000 investment and the reinvestment of dividends and capital gains in the indicated share class versus a similar investment in the Russell 1000 Index and the blended index. The Russell 1000 Index measures the performance of roughly 1,000 US large-cap companies. The Blended Index represents a 60/40 weighted blend of the Russell 1000® Index and the ICE BofA U.S. T-Bill 0-3 Month Index. The Russell 1000® Index measures the performance of roughly 1,000 US large-cap companies. The ICE BofA U.S. T-Bill 0-3 Month Index measures the performance of U.S. dollar denominated U.S. Treasury Bills with a term to maturity of less than 3 months. The index(es) are unmanaged, market capitalization weighted, include net reinvested dividends, do not reflect fees or expenses (which would lower the return), and are not available for direct investment. The Fund’s performance reflects the deduction of fees for these services. |
| Past performance is not indicative of future results. Investment returns and principal values will fluctuate so that an investor’s shares, when redeemed, may be worth more or less than their original cost. The Fund’s current performance may be lower or higher than the performance quoted. For current to most recent month-end performance, visit diamond-hill.com. |
DIAMOND HILL FUNDS | ANNUAL REPORT | DECEMBER 31, 2021 | DIAMOND-HILL.COM 15 |
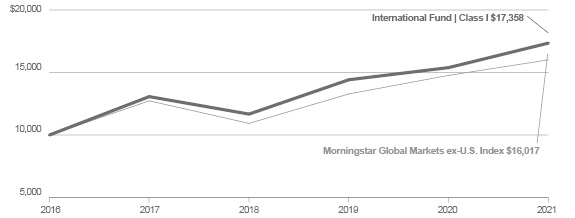
Diamond Hill International Fund |
Investing Environment
2021 closed out another year of strong gains for equity markets globally. The MSCI All Country World Index advanced 18.5%, with the majority of those returns driven by developed markets as emerging markets stocks fell -2.5% as measured by the MSCI Emerging Markets Index. US markets, as measured by the Russell 3000® Index, rose 25.7%. Early in 2021, we saw continued distribution of COVID-19 vaccines globally, gradual steps to reopening economies and broad gains in stocks across sectors. As economic recoveries progressed and the pandemic persisted, economies began facing rising inflation, supply chain disruptions and surging energy prices.
The final months of 2021 proved volatile for investors. Better than expected quarterly earnings reports lifted stocks in October despite macro headwinds. Stocks continued their upward momentum into the early days of November, then traded in a narrow range until the day after Thanksgiving when news of the Omicron variant rocked the world. By mid-December, stocks erased most of the Omicron-induced losses as data emerged that the variant posed less of a risk than previous ones such as Delta. Also in December, the US Federal Reserve announced plans to accelerate the withdrawal of stimulus and signaled interest rates would go up next year, a significant indication of heightened inflation concerns.
Energy stocks were the clear winners in the year, along with technology stocks, driven by economic recoveries around the globe, while the financials and real estate sectors benefited from higher interest rate expectations. The communication services sector as well as more defensive areas of the market such as utilities and consumer staples lagged the robust returns of other sectors but still posted gains.
Performance Discussion
Top contributors during the period included Canadian information security services provider BlackBerry Ltd., UK-based spirits maker Diageo plc, Swiss luxury goods company Compagnie Financiere Richemont SA, US-based media and technology company Alphabet, Inc. and Aurinia Pharmaceuticals, Inc., a Canadian late-stage clinical biopharmaceutical company. Bottom contributors during the period included Chinese internet commerce and services provider Alibaba Group Holding Ltd., UK-based emerging markets debt manager Ashmore Group plc, Belgium-based brewing company Anheuser-Busch InBev SA/NV, Netherlands-based global consumer internet group Prosus NV and US-based mobile game developer Zynga, Inc.
Fund Changes
During the period, we identified new investment opportunities and added positions to the portfolio including Luxembourg-based digital music-streaming services provider Spotify Technology SA, Japanese video game company Nintendo Co., Ltd., UK-based grocery store operator Tesco plc, Swedish door lock manufacturer Assa Abloy AB and US-based copper-focused mining company Freeport-McMoRan, Inc. Throughout the year, we closed positions in companies that reached our estimate of intrinsic value and to fund purchases of more attractive investment opportunities. Larger sales included Belgium-based brewing company Anheuser-Busch InBev SA/NV, Swiss private banking services provider Julius Baer Group Ltd., US-based media and technology company Alphabet, Inc., Japanese convenience store operator Seven & i Holdings Co. Ltd., and Mexican airport operator Grupo Aeroportuario del Sureste SAB de CV. Current and future portfolio holdings are subject to change and risk.
16 DIAMOND HILL FUNDS | ANNUAL REPORT | DECEMBER 31, 2021 | DIAMOND-HILL.COM |
Diamond Hill International Fund |
AVERAGE ANNUAL TOTAL RETURNS AS OF DECEMBER 31, 2021
| Inception
Date | One
Year | Three
Years* | Five
Years* | Since
Inception*
(12/30/16) | Expense
Ratio |
PERFORMANCE AT NAV |
Investor Class | 6/28/2019 | 12.43% | 13.83% | 11.35% | 11.35% | 1.13% |
Class I | 6/28/2019 | 12.74 | 14.13 | 11.66 | 11.66 | 0.84 |
Class Y | 6/28/2019 | 12.88 | 14.25 | 11.78 | 11.78 | 0.72 |
BENCHMARK |
Morningstar Global Markets ex-U.S. Index | | 8.41 | 13.58 | 9.88 | 9.88 | — |
GROWTH OF $10,000
Comparison of the change in value of a $10,000 Investment in the Diamond Hill International Fund Class I(A) and the Morningstar Global Markets ex-U.S. Index.
(A) | The growth of $10,000 chart represents the performance of Class I shares only, which will vary from the performance of Investor Class and Class Y shares based on the difference in loads and fees paid by shareholders in the different classes. |
| The performance of the above Fund does not reflect the deduction of taxes that a shareholder would pay on Fund distributions or the redemption of Fund shares. |
| The chart above represents the comparison of a hypothetical $10,000 investment and the reinvestment of dividends and capital gains in the indicated share class versus a similar investment in the Morningstar Global Markets ex-U.S. Index (“Index”). The Index measures the performance of the stocks located in the developed and emerging countries (excluding the U.S.) as defined by Morningstar. The index is unmanaged, market capitalization weighted, includes net reinvested dividends, does not reflect fees or expenses (which would lower the return), and is not available for direct investment. The Fund’s performance reflects the deduction of fees for these services. |
* | The quoted performance of the Fund reflects the past performance of Diamond Hill International Fund L.P. (the “International Partnership”), a private fund managed with full investment authority by the Fund’s Adviser. The Fund is managed in all material respects in a manner equivalent to the management of the predecessor unregistered fund. The performance of the International Partnership has been restated to reflect the net expenses and maximum applicable sales charge of the Fund for its initial years of investment operation. The International Partnership was not registered under the Investment Company Act of 1940 and therefore was not subject to certain investment restrictions imposed by the 1940 Act. If the International Partnership had been registered under the 1940 Act, its performance may have been adversely affected. Performance is measured from December 30, 2016, the inception of the International Partnership and is not the performance of the Fund. The assets of the International Partnership were converted, based on their value on June 28, 2019, into assets of the Fund. The International Partnership’s past performance is not necessarily an indication of how the Fund will perform in the future either before or after taxes. |
| Past performance is not indicative of future results. Investment returns and principal values will fluctuate so that an investor’s shares, when redeemed, may be worth more or less than their original cost. The Fund’s current performance may be lower or higher than the performance quoted. For current to most recent month-end performance, visit diamond-hill.com. |
DIAMOND HILL FUNDS | ANNUAL REPORT | DECEMBER 31, 2021 | DIAMOND-HILL.COM 17 |
Diamond Hill Short Duration Securitized Bond Fund |
Investing Environment
For only the fourth time in its existence, the US investment grade fixed income market (as measured by the Bloomberg U.S. Aggregate Bond Index) delivered negative returns in a calendar year due largely to a combination of rising rates, economic resurgence post-pandemic shutdowns, and supply/demand dislocations fueling historic inflation levels. The Federal Reserve gradually shifted from viewing inflation as transitory to something that needed to be actively addressed, accelerating expectations for rate hikes to start early 2022 rather than year-end 2022. The Federal Reserve also shifted its stance on tapering — from “thinking about” to “talking about” to “executing” — and is now accelerating the process to complete it by March 2022. While the longer end of the Treasury curve experienced gyrations throughout the year as the Delta and Omicron variants of COVID-19 increased investor uncertainty, the shorter end of the curve generally remained anchored. Only after the Federal Reserve began laying the groundwork for tapering and potential rate hikes in 2022 did the two-year Treasury rate begin to move higher, rising from an average yield of 0.166% from the beginning of the year through the end of August, then climbing through the final four months to finish the year at 0.732%.
Performance Discussion
The Short Duration Securitized Bond Fund outperformed the Bloomberg U.S. 1-3 Yr. Gov./Credit Index in 2021. Despite the meteoric rise in short-term rates in 2021’s latter part, the Fund was able to deliver positive returns while adding relative value through security selection and a significant yield advantage over the benchmark. The recovery in the securitized market seen in 2020’s second half carried into early 2021, delivering strong returns in January. Subsequent months saw the Fund’s yield advantage as well as continued spread tightening in the non-agency commercial mortgage-backed securities market drive performance. Despite a record level of issuance in the asset-backed securities sector, investors had more than enough appetite for yield to push spreads ever tighter throughout 2021. As short-end rates began surging higher in the latter part of 2021, the Fund’s favorable yield offset some of the impact.
Fund Changes
Reflecting the increase in yields on the shorter end of the curve in the later part of 2021, the Short Duration Securitized Bond Fund deployed cash into both short Treasury and short corporate debt securities as these market segments provided additional yield beyond cash equivalents. In the securitized sector, the Fund increased the allocation to non-agency commercial mortgage-backed securities while reducing the allocation to asset-backed securities. The reduction in asset-backed securities was not fueled by sales but rather redirecting monthly paydowns to other market areas that offered better relative value.
18 DIAMOND HILL FUNDS | ANNUAL REPORT | DECEMBER 31, 2021 | DIAMOND-HILL.COM |
Diamond Hill Short Duration Securitized Bond Fund |
AVERAGE ANNUAL TOTAL RETURNS AS OF DECEMBER 31, 2021
| Inception
Date | One
Year | Three
Years | Five
Years | Since
Inception | Expense
Ratio |
PERFORMANCE AT NAV |
Investor Class | 7/5/2016 | 2.42% | 3.24% | 3.31% | 3.24% | 0.81% |
Class I | 7/5/2016 | 2.74 | 3.55 | 3.63 | 3.54 | 0.52 |
Class Y | 7/5/2016 | 2.85 | 3.66 | 3.76 | 3.66 | 0.40 |
BENCHMARK |
Bloomberg U.S. 1-3 Yr. Government/Credit Index | | (0.47) | 2.28 | 1.85 | 1.60 | — |
GROWTH OF $10,000
Comparison of the change in value of a $10,000 Investment in the Diamond Hill Short Duration Securitized Bond Fund Class I(A) and Bloomberg U.S. 1-3 Yr. Government/Credit Index.

(A) | The growth of $10,000 chart represents the performance of Class I shares only, which will vary from the performance of Investor Class and Class Y shares based on the difference in loads and fees paid by shareholders in the different classes. |
| The performance of the above Fund does not reflect the deduction of taxes that a shareholder would pay on Fund distributions or the redemption of Fund shares. |
| The chart above represents a comparison of a hypothetical $10,000 investment and the reinvestment of dividends and capital gains in the indicated share class versus a similar investment in the Bloomberg U.S. 1-3 Yr. Government/Credit Index (“Index”). The Index measures the performance of investment grade government and corporate bonds with maturities of one to three years. The index is unmanaged, includes net reinvested dividends, does not reflect fees or expenses (which would lower the return), and is not available for direct investment. The Fund’s performance reflects the deduction of fees for these services. |
| Past performance is not indicative of future results. Investment returns and principal values will fluctuate so that an investor’s shares, when redeemed, may be worth more or less than their original cost. The Fund’s current performance may be lower or higher than the performance quoted. For current to most recent month-end performance, visit diamond-hill.com. |
DIAMOND HILL FUNDS | ANNUAL REPORT | DECEMBER 31, 2021 | DIAMOND-HILL.COM 19 |
Diamond Hill Core Bond Fund |
Investing Environment
For only the fourth time in its existence, the US investment grade fixed income market (as measured by the Bloomberg U.S. Aggregate Bond Index) delivered negative returns in a calendar year due largely to a combination of rising rates, economic resurgence post-pandemic shutdowns, and supply/demand dislocations fueling historic inflation levels. The Federal Reserve gradually shifted from viewing inflation as transitory to something that needed to be actively addressed, accelerating expectations for rate hikes to start early 2022 rather than year-end 2022. The Federal Reserve also shifted its stance on tapering — from “thinking about” to “talking about” to “executing” — and is now accelerating the process to complete it by March 2022. While the longer end of the Treasury curve experienced gyrations throughout the year as the Delta and Omicron variants of COVID-19 increased investor uncertainty, the shorter end of the curve generally remained anchored. Only after the Federal Reserve began laying the groundwork for tapering and potential rate hikes in 2022 did the two-year Treasury rate begin to move higher, rising from an average yield of 0.166% from the beginning of the year through the end of August, then climbing through the final four months to finish the year at 0.732%.
Performance Discussion
The Core Bond Fund has always been managed with a goal of generating excess returns relative to the Bloomberg U.S. Aggregate Bond Index while working to protect against downside risk. Calendar year 2021 was an example of limiting the downside as some of the impact of rising rates on the portfolio was mitigated through security selection. An underweight position relative to the benchmark in the credit sector as well as a shorter duration posture — the result of our bottom-up approach to security selection and portfolio construction — contributed to relative performance during the year. The Fund’s overweight in the securitized sector also contributed to relative performance during 2021, fueled by security selection in the asset-backed securities (ABS) sector as well as positioning in the mortgage-backed securities (MBS) sector. Within the ABS sector, allocations to non-benchmark market segments such as small business were additive. The Fund’s differentiation in the MBS market, achieved through investments in collateralized mortgage obligations in lieu of plain vanilla pass-through mortgages, contributed to performance. The Fund’s underweight to the Treasury sector as well as a longer duration posture in this market segment contributed to performance as longer duration Treasuries were less volatile than the belly of the curve.
Fund Changes
Sector changes to the Core Bond Fund are based on an investment philosophy focusing on a bottom-up security selection process. The duration positioning (sensitivity to interest rate fluctuations) relative to the benchmark remained at the lower end of the +/- 10% range relative to the benchmark due to the uncertain trajectory of rates during the majority of the year. Sector allocations in the fund remained fairly steady over the year, reflecting the focus on security selection and a bottom-up investment philosophy. As opportunities in the commercial MBS space presented themselves earlier in the year, the Fund shifted by deploying monthly paydowns into that sector, resulting in a slight increase over the previous year-end. The Fund’s allocation to investment grade credit increased slightly over the year while the allocation to agency residential and commercial MBS declined as paydowns were deployed into other areas of the market that offered better relative value.
20 DIAMOND HILL FUNDS | ANNUAL REPORT | DECEMBER 31, 2021 | DIAMOND-HILL.COM |
Diamond Hill Core Bond Fund |
AVERAGE ANNUAL TOTAL RETURNS AS OF DECEMBER 31, 2021
| Inception
Date | One
Year | Three
Years | Five
Years | Since
Inception | Expense
Ratio |
PERFORMANCE AT NAV | |
Investor Class | 7/5/2016 | (1.24)% | 4.58% | 3.77% | 2.99% | 0.76% |
Class I | 7/5/2016 | (0.99) | 4.87 | 4.07 | 3.29 | 0.47 |
Class Y | 7/5/2016 | (0.95) | 4.99 | 4.17 | 3.39 | 0.35 |
BENCHMARK | |
Bloomberg U.S. Aggregate Bond Index | | (1.54) | 4.79 | 3.57 | 2.63 | — |
GROWTH OF $10,000
Comparison of the change in value of a $10,000 Investment in the Diamond Hill Core Bond Fund Class I(A) and Bloomberg U.S. Aggregate Bond Index.

(A) | The growth of $10,000 chart represents the performance of Class I shares only, which will vary from the performance of Investor Class and Class Y shares based on the difference in loads and fees paid by shareholders in the different classes. |
| The performance of the above Fund does not reflect the deduction of taxes that a shareholder would pay on Fund distributions or the redemption of Fund shares. |
| The chart above represents a comparison of a hypothetical $10,000 investment and the reinvestment of dividends and capital gains in the indicated share class versus a similar investment in the Bloomberg U.S. Aggregate Bond Index (“Index”). The Index measures the performance of investment grade, fixed-rate taxable bond market and includes government and corporate bonds, agency mortgage-backed, asset-backed and commercial mortgage-backed securities (agency and non-agency). The index is unmanaged, includes net reinvested dividends, does not reflect fees or expenses (which would lower the return), and is not available for direct investment. The Fund’s performance reflects the deduction of fees for these services. |
| Past performance is not indicative of future results. Investment returns and principal values will fluctuate so that an investor’s shares, when redeemed, may be worth more or less than their original cost. The Fund’s current performance may be lower or higher than the performance quoted. For current to most recent month-end performance, visit diamond-hill.com. |
DIAMOND HILL FUNDS | ANNUAL REPORT | DECEMBER 31, 2021 | DIAMOND-HILL.COM 21 |
Diamond Hill Small Cap Fund
Schedule of Investments
December 31, 2021
| | Shares | | | Fair
Value | |
Common Stocks — 99.1% |
Communication Services — 2.6% |
Live Nation Entertainment, Inc. (a) | | | 124,718 | | | $ | 14,927,497 | |
| |
Consumer Discretionary — 18.4% |
Carter’s, Inc. | | | 49,663 | | | | 5,026,889 | |
Green Brick Partners, Inc. (a) | | | 474,466 | | | | 14,390,554 | |
Hanesbrands, Inc. | | | 526,629 | | | | 8,805,237 | |
Johnson Outdoors, Inc., Class A | | | 13,300 | | | | 1,246,077 | |
PROG Holdings, Inc. (a) | | | 227,842 | | | | 10,277,953 | |
Red Rock Resorts, Inc., Class A (b) | | | 683,035 | | | | 37,573,755 | |
Rocky Brands, Inc. | | | 14,352 | | | | 571,210 | |
Vail Resorts, Inc. | | | 61,601 | | | | 20,198,968 | |
Wolverine World Wide, Inc. | | | 230,232 | | | | 6,632,984 | |
| | | | | | | | 104,723,627 | |
Consumer Staples — 10.4% |
Cal-Maine Foods, Inc. (b) | | | 523,193 | | | | 19,352,909 | |
Flowers Foods, Inc. | | | 311,485 | | | | 8,556,493 | |
Lancaster Colony Corp. | | | 40,921 | | | | 6,776,518 | |
Post Holdings, Inc. (a) | | | 129,017 | | | | 14,544,086 | |
Seaboard Corp. | | | 2,501 | | | | 9,841,460 | |
| | | | | | | | 59,071,466 | |
Energy — 3.0% |
Civitas Resources, Inc. | | | 211,110 | | | | 10,338,057 | |
Coterra Energy, Inc. (b) | | | 345,905 | | | | 6,572,195 | |
| | | | | | | | 16,910,252 | |
Financials — 28.7% |
Bank OZK | | | 616,255 | | | | 28,674,345 | |
BankUnited, Inc. | | | 90,000 | | | | 3,807,900 | |
BOK Financial Corp. | | | 125,300 | | | | 13,217,897 | |
Cadence Bank | | | 200,687 | | | | 5,978,466 | |
Enstar Group Ltd. (a) | | | 68,540 | | | | 16,969,819 | |
First Interstate BancSystem, Inc., Class A (b) | | | 126,303 | | | | 5,136,743 | |
Glacier Bancorp, Inc. | | | 83,859 | | | | 4,754,805 | |
Live Oak Bancshares, Inc. (b) | | | 188,281 | | | | 16,435,048 | |
Mr. Cooper Group, Inc. (a) | | | 336,487 | | | | 14,001,224 | |
ProAssurance Corp. | | | 586,244 | | | | 14,831,973 | |
Reinsurance Group of America, Inc. | | | 21,344 | | | | 2,336,954 | |
| | Shares | | | Fair
Value | |
Financials — 28.7% continued |
RenaissanceRe Holdings Ltd. | | | 19,639 | | | $ | 3,325,472 | |
Sterling Bancorp | | | 1,080,030 | | | | 27,853,974 | |
Triumph Bancorp, Inc. (a) | | | 50,339 | | | | 5,994,368 | |
| | | | | | | | 163,318,988 | |
Health Care — 1.7% |
Integer Holdings Corp. (a) | | | 40,248 | | | | 3,444,826 | |
Natus Medical, Inc. (a) | | | 265,817 | | | | 6,307,837 | |
| | | | | | | | 9,752,663 | |
Industrials — 16.9% |
Allegiant Travel Co. (a) | | | 61,199 | | | | 11,446,661 | |
Allied Motion Technologies, Inc. | | | 64,065 | | | | 2,337,732 | |
Colfax Corp. (a) | | | 486,060 | | | | 22,344,178 | |
Concrete Pumping Holdings, Inc. (a)(b) | | | 533,648 | | | | 4,375,914 | |
Douglas Dynamics, Inc. | | | 129,090 | | | | 5,042,255 | |
Energy Recovery, Inc. (a)(b) | | | 62,955 | | | | 1,352,903 | |
Kirby Corp. (a) | | | 104,633 | | | | 6,217,293 | |
Sensata Technologies Holding plc (a) | | | 46,185 | | | | 2,849,153 | |
SPX FLOW, Inc. | | | 158,773 | | | | 13,730,689 | |
Stericycle, Inc. (a) | | | 107,015 | | | | 6,382,375 | |
WESCO International, Inc. (a) | | | 150,667 | | | | 19,826,270 | |
| | | | | | | | 95,905,423 | |
Information Technology — 4.5% |
Broadridge Financial Solutions, Inc. | | | 16,757 | | | | 3,063,515 | |
Sanmina Corp. (a) | | | 77,895 | | | | 3,229,527 | |
WNS Holdings Ltd. — ADR (a) | | | 218,864 | | | | 19,308,182 | |
| | | | | | | | 25,601,224 | |
Materials — 5.8% |
Ashland Global Holdings, Inc. | | | 136,006 | | | | 14,642,406 | |
Chase Corp. | | | 64,909 | | | | 6,462,340 | |
Taseko Mines Ltd. (a)(b) | | | 2,149,488 | | | | 4,406,450 | |
TriMas Corp. | | | 111,117 | | | | 4,111,329 | |
UFP Technologies, Inc. (a) | | | 46,012 | | | | 3,232,803 | |
| | | | | | | | 32,855,328 | |
22 DIAMOND HILL FUNDS | ANNUAL REPORT | DECEMBER 31, 2021 | DIAMOND-HILL.COM |
Diamond Hill Small Cap Fund
Schedule of Investments (Continued)
December 31, 2021
| | Shares | | | Fair
Value | |
Common Stocks — 99.1% continued |
Real Estate — 4.9% |
CubeSmart | | | 274,912 | | | $ | 15,645,242 | |
Jones Lang LaSalle, Inc. (a) | | | 14,811 | | | | 3,989,195 | |
Rayonier, Inc. (b) | | | 162,226 | | | | 6,547,441 | |
Ryman Hospitality Properties, Inc. (a) | | | 18,266 | | | | 1,679,741 | |
| | | | | | | | 27,861,619 | |
Utilities — 2.2% |
South Jersey Industries, Inc. (b) | | | 226,774 | | | | 5,923,337 | |
UGI Corp. | | | 140,016 | | | | 6,428,135 | |
| | | | | | | | 12,351,472 | |
| |
Total Common Stocks |
(Cost $290,805,047) | | $ | 563,279,559 | |
| |
Registered Investment Companies — 7.2% |
State Street Institutional US Government Money Market Fund — Premier Class, 0.03%(c) | | | 5,380,388 | | | | 5,380,388 | |
State Street Navigator Securities Lending Portfolio I, 0.15%(c)(d) | | | 35,407,806 | | | | 35,407,806 | |
Total Registered Investment Companies |
(Cost $40,788,194) | | $ | 40,788,194 | |
| |
Total Investment Securities — 106.3% |
(Cost $331,593,241) | | $ | 604,067,753 | |
| |
Liabilities in Excess of Other Assets — (6.3)% | | | (35,532,214 | ) |
| |
Net Assets — 100.0% | | $ | 568,535,539 | |
(a) | Non-income producing security. |
(b) | All or a portion of the security is on loan. The total fair value of the securities on loan as of December 31, 2021 was $36,498,982. |
(c) | The rate shown is the 7-day effective yield as of December 31, 2021. |
(d) | This security was purchased using cash collateral held from securities on loan. |
ADR — American Depositary Receipt
plc — Public Limited Company
REIT — Real Estate Investment Trust
See accompanying Notes to Financial Statements.
Diamond Hill Small-Mid Cap Fund
Schedule of Investments
December 31, 2021
| | Shares | | | Fair
Value | |
Common Stocks — 96.5% |
Communication Services — 1.4% |
Liberty Media Corp. - Liberty Formula One - Series C (a)(b) | | | 505,637 | | | $ | 31,976,484 | |
| |
Consumer Discretionary — 17.8% |
Advance Auto Parts, Inc. | | | 79,660 | | | | 19,108,841 | |
BorgWarner, Inc. | | | 601,190 | | | | 27,095,633 | |
Hanesbrands, Inc. | | | 2,518,437 | | | | 42,108,267 | |
NVR, Inc. (b) | | | 10,604 | | | | 62,657,657 | |
Polaris, Inc. (a) | | | 312,720 | | | | 34,371,055 | |
PROG Holdings, Inc. (b) | | | 712,285 | | | | 32,131,176 | |
Red Rock Resorts, Inc., Class A (a) | | | 2,061,520 | | | | 113,404,215 | |
Vail Resorts, Inc. | | | 126,163 | | | | 41,368,848 | |
Wolverine World Wide, Inc. | | | 1,156,353 | | | | 33,314,530 | |
| | | | | | | | 405,560,222 | |
Consumer Staples — 8.4% |
Cal-Maine Foods, Inc. (a) | | | 1,479,619 | | | | 54,731,107 | |
Flowers Foods, Inc. | | | 1,266,285 | | | | 34,784,849 | |
Lancaster Colony Corp. | | | 35,018 | | | | 5,798,981 | |
Molson Coors Beverage Co., Class B (a) | | | 121,431 | | | | 5,628,327 | |
Post Holdings, Inc. (b) | | | 802,679 | | | | 90,486,004 | |
| | | | | | | | 191,429,268 | |
Energy — 2.4% |
Coterra Energy, Inc. | | | 2,905,299 | | | | 55,200,681 | |
| |
Financials — 27.0% |
Alleghany Corp. (b) | | | 49,271 | | | | 32,892,827 | |
Bank OZK | | | 1,089,655 | | | | 50,701,647 | |
BankUnited, Inc. | | | 1,084,596 | | | | 45,889,257 | |
BOK Financial Corp. (a) | | | 584,826 | | | | 61,693,295 | |
Brighthouse Financial, Inc. (b) | | | 506,534 | | | | 26,238,461 | |
Brown & Brown, Inc. | | | 251,162 | | | | 17,651,665 | |
Cadence Bank | | | 449,768 | | | | 13,398,589 | |
Enstar Group Ltd. (b) | | | 81,212 | | | | 20,107,279 | |
First Interstate BancSystem, Inc., Class A (a) | | | 555,837 | | | | 22,605,891 | |
First Republic Bank | | | 185,930 | | | | 38,396,404 | |
Loews Corp. | | | 535,186 | | | | 30,912,343 | |
Mr. Cooper Group, Inc. (b) | | | 999,211 | | | | 41,577,170 | |
DIAMOND HILL FUNDS | ANNUAL REPORT | DECEMBER 31, 2021 | DIAMOND-HILL.COM 23 |
Diamond Hill Small-Mid Cap Fund
Schedule of Investments (Continued)
December 31, 2021
| | Shares | | | Fair
Value | |
Common Stocks — 96.5% continued |
Financials — 27.0% continued |
ProAssurance Corp. | | | 1,045,543 | | | $ | 26,452,238 | |
Reinsurance Group of America, Inc. | | | 171,151 | | | | 18,739,323 | |
RenaissanceRe Holdings Ltd. | | | 198,763 | | | | 33,656,539 | |
Sterling Bancorp | | | 3,255,216 | | | | 83,952,021 | |
SVB Financial Group (b) | | | 74,111 | | | | 50,265,045 | |
| | | | | | | | 615,129,994 | |
Health Care — 1.1% |
Boston Scientific Corp. (b) | | | 244,398 | | | | 10,382,027 | |
Integer Holdings Corp. (b) | | | 160,226 | | | | 13,713,743 | |
| | | | | | | | 24,095,770 | |
Industrials — 21.4% |
Alaska Air Group, Inc. (b) | | | 198,792 | | | | 10,357,063 | |
Allegiant Travel Co. (b) | | | 232,613 | | | | 43,507,935 | |
Colfax Corp. (a)(b) | | | 1,913,881 | | | | 87,981,109 | |
Energy Recovery, Inc. (b) | | | 540,512 | | | | 11,615,603 | |
Gates Industrial Corp. plc (b) | | | 2,455,462 | | | | 39,066,400 | |
Kirby Corp. (b) | | | 837,340 | | | | 49,754,743 | |
Sensata Technologies Holding plc (b) | | | 1,042,466 | | | | 64,309,727 | |
SPX FLOW, Inc. | | | 334,419 | | | | 28,920,555 | |
Stericycle, Inc. (b) | | | 481,890 | | | | 28,739,920 | |
WESCO International, Inc. (b) | | | 938,958 | | | | 123,557,483 | |
| | | | | | | | 487,810,538 | |
Information Technology — 3.2% |
Broadridge Financial Solutions, Inc. | | | 65,435 | | | | 11,962,827 | |
Sanmina Corp. (b) | | | 667,685 | | | | 27,682,220 | |
WNS Holdings Ltd. — ADR (b) | | | 369,062 | | | | 32,558,650 | |
| | | | | | | | 72,203,697 | |
Materials — 2.0% |
Ashland Global Holdings, Inc. | | | 433,927 | | | | 46,716,581 | |
| |
Real Estate — 7.8% |
CubeSmart | | | 1,483,050 | | | | 84,400,375 | |
Douglas Emmett, Inc. | | | 654,342 | | | | 21,920,457 | |
Jones Lang LaSalle, Inc. (b) | | | 65,694 | | | | 17,694,022 | |
| | Shares | | | Fair
Value | |
Real Estate — 7.8% continued |
Rayonier, Inc. | | | 684,873 | | | $ | 27,641,474 | |
Ryman Hospitality Properties, Inc. (b) | | | 141,206 | | | | 12,985,304 | |
UDR, Inc. | | | 212,729 | | | | 12,761,613 | |
| | | | | | | | 177,403,245 | |
Utilities — 4.0% |
South Jersey Industries, Inc. (a) | | | 1,289,262 | | | | 33,675,523 | |
UGI Corp. | | | 1,257,626 | | | | 57,737,610 | |
| | | | | | | | 91,413,133 | |
| |
Total Common Stocks |
(Cost $1,395,273,534) | | $ | 2,198,939,613 | |
| |
Registered Investment Companies — 8.1% |
Diamond Hill Short Duration Securitized Bond Fund – Class Y (c) | | | 2,710,540 | | | | 27,403,556 | |
State Street Institutional US Government Money Market Fund — Premier Class, 0.03% (d) | | | 57,968,754 | | | | 57,968,754 | |
State Street Navigator Securities Lending Portfolio I, 0.15%(d)(e) | | | 99,592,542 | | | | 99,592,542 | |
Total Registered Investment Companies |
(Cost $184,813,220) | | $ | 184,964,852 | |
| |
Total Investment Securities — 104.6% |
(Cost $1,580,086,754) | | $ | 2,383,904,465 | |
| |
Liabilities in Excess of Other Assets — (4.6)% | | | (105,498,319 | ) |
| |
Net Assets — 100.0% | | $ | 2,278,406,146 | |
(a) | All or a portion of the security is on loan. The total fair value of the securities on loan as of December 31, 2021 was $108,883,641. |
(b) | Non-income producing security. |
(d) | The rate shown is the 7-day effective yield as of December 31, 2021. |
(e) | This security was purchased using cash collateral held from securities on loan. |
ADR — American Depositary Receipt
plc — Public Limited Company
REIT — Real Estate Investment Trust
See accompanying Notes to Financial Statements.
24 DIAMOND HILL FUNDS | ANNUAL REPORT | DECEMBER 31, 2021 | DIAMOND-HILL.COM |
Diamond Hill Mid Cap Fund
Schedule of Investments
December 31, 2021
| | Shares | | | Fair
Value | |
Common Stocks — 95.9% |
Communication Services — 1.4% |
Liberty Media Corp. - Liberty Formula One - Series C (a) | | | 61,882 | | | $ | 3,913,418 | |
| |
Consumer Discretionary — 16.8% |
Advance Auto Parts, Inc. | | | 10,543 | | | | 2,529,055 | |
BorgWarner, Inc. | | | 73,346 | | | | 3,305,704 | |
Hanesbrands, Inc. | | | 309,486 | | | | 5,174,606 | |
NVR, Inc. (a) | | | 1,308 | | | | 7,728,802 | |
Polaris, Inc. (b) | | | 30,389 | | | | 3,340,055 | |
PROG Holdings, Inc. (a) | | | 73,723 | | | | 3,325,644 | |
Red Rock Resorts, Inc., Class A | | | 247,560 | | | | 13,618,276 | |
Vail Resorts, Inc. | | | 15,565 | | | | 5,103,763 | |
VF Corp. | | | 52,612 | | | | 3,852,251 | |
| | | | | | | | 47,978,156 | |
Consumer Staples — 7.9% |
Archer-Daniels-Midland Co. | | | 102,137 | | | | 6,903,440 | |
Flowers Foods, Inc. | | | 107,687 | | | | 2,958,162 | |
Lancaster Colony Corp. | | | 4,372 | | | | 724,003 | |
Molson Coors Beverage Co., Class B | | | 23,003 | | | | 1,066,189 | |
Post Holdings, Inc. (a) | | | 96,592 | | | | 10,888,816 | |
| | | | | | | | 22,540,610 | |
Energy — 1.8% |
Coterra Energy, Inc. | | | 278,580 | | | | 5,293,020 | |
| |
Financials — 27.4% |
Alleghany Corp. (a) | | | 5,242 | | | | 3,499,507 | |
American International Group, Inc. | | | 126,138 | | | | 7,172,207 | |
Bank OZK | | | 116,489 | | | | 5,420,233 | |
BankUnited, Inc. | | | 102,620 | | | | 4,341,852 | |
BOK Financial Corp. | | | 35,574 | | | | 3,752,701 | |
Brighthouse Financial, Inc. (a) | | | 67,910 | | | | 3,517,738 | |
Discover Financial Services | | | 15,810 | | | | 1,827,004 | |
Enstar Group Ltd. (a) | | | 8,183 | | | | 2,026,029 | |
First Republic Bank | | | 41,754 | | | | 8,622,619 | |
Hartford Financial Services Group, Inc. (The) | | | 69,470 | | | | 4,796,209 | |
Loews Corp. | | | 80,641 | | | | 4,657,824 | |
| | Shares | | | Fair
Value | |
Financials — 27.4% continued |
Mr. Cooper Group, Inc. (a) | | | 91,954 | | | $ | 3,826,206 | |
Reinsurance Group of America, Inc. | | | 14,655 | | | | 1,604,576 | |
RenaissanceRe Holdings Ltd. | | | 15,134 | | | | 2,562,640 | |
Sterling Bancorp | | | 301,841 | | | | 7,784,479 | |
SVB Financial Group (a) | | | 13,657 | | | | 9,262,724 | |
Willis Towers Watson plc | | | 16,266 | | | | 3,863,012 | |
| | | | | | | | 78,537,560 | |
Health Care — 1.6% |
Boston Scientific Corp. (a) | | | 107,959 | | | | 4,586,098 | |
| |
Industrials — 16.5% |
Alaska Air Group, Inc. (a) | | | 74,772 | | | | 3,895,621 | |
Colfax Corp. (a) | | | 243,265 | | | | 11,182,892 | |
Kirby Corp. (a) | | | 93,276 | | | | 5,542,460 | |
Parker-Hannifin Corp. | | | 21,614 | | | | 6,875,846 | |
Sensata Technologies Holding plc (a) | | | 108,557 | | | | 6,696,881 | |
Stericycle, Inc. (a) | | | 61,429 | | | | 3,663,626 | |
WESCO International, Inc. (a) | | | 71,617 | | | | 9,424,081 | |
| | | | | | | | 47,281,407 | |
Information Technology — 5.3% |
Check Point Software Technologies Ltd. (a) | | | 67,250 | | | | 7,838,660 | |
Cognizant Technology Solutions Corp., Class A | | | 49,122 | | | | 4,358,104 | |
NXP Semiconductors NV | | | 13,549 | | | | 3,086,191 | |
| | | | | | | | 15,282,955 | |
Materials — 4.9% |
Ashland Global Holdings, Inc. | | | 60,917 | | | | 6,558,324 | |
Freeport-McMoRan, Inc. | | | 177,727 | | | | 7,416,548 | |
| | | | | | | | 13,974,872 | |
Real Estate — 8.5% |
CubeSmart | | | 180,197 | | | | 10,255,011 | |
Douglas Emmett, Inc. | | | 85,424 | | | | 2,861,704 | |
Jones Lang LaSalle, Inc. (a) | | | 8,036 | | | | 2,164,416 | |
Rayonier, Inc. | | | 45,162 | | | | 1,822,738 | |
Ryman Hospitality Properties, Inc. (a) | | | 17,520 | | | | 1,611,139 | |
DIAMOND HILL FUNDS | ANNUAL REPORT | DECEMBER 31, 2021 | DIAMOND-HILL.COM 25 |
Diamond Hill Mid Cap Fund
Schedule of Investments (Continued)
December 31, 2021
| | Shares | | | Fair
Value | |
Common Stocks — 95.9% continued |
Real Estate — 8.5% continued |
UDR, Inc. | | | 26,714 | | | $ | 1,602,573 | |
Weyerhaeuser Co. | | | 100,004 | | | | 4,118,165 | |
| | | | | | | | 24,435,746 | |
Utilities — 3.8% |
South Jersey Industries, Inc. | | | 142,519 | | | | 3,722,596 | |
UGI Corp. | | | 153,458 | | | | 7,045,257 | |
| | | | | | | | 10,767,853 | |
| |
Total Common Stocks |
(Cost $165,767,424) | | $ | 274,591,695 | |
| |
Registered Investment Companies — 4.7% |
Diamond Hill Short Duration Securitized Bond Fund - Class Y (c) | | | 165,489 | | | | 1,673,091 | |
State Street Institutional US Government Money Market Fund - Premier Class, 0.03%(d) | | | 10,371,296 | | | | 10,371,296 | |
State Street Navigator Securities Lending Portfolio I, 0.15%(d)(e) | | | 1,589,392 | | | | 1,589,392 | |
Total Registered Investment Companies |
(Cost $13,628,788) | | $ | 13,633,779 | |
| |
Total Investment Securities — 100.6% |
(Cost $179,396,212) | | $ | 288,225,474 | |
| |
Liabilities in Excess of Other Assets — (0.6)% | | | (1,783,104 | ) |
| |
Net Assets — 100.0% | | $ | 286,442,370 | |
(a) | Non-income producing security. |
(b) | All or a portion of the security is on loan. The total fair value of the securities on loan as of December 31, 2021 was $1,559,733. |
(d) | The rate shown is the 7-day effective yield as of December 31, 2021. |
(e) | This security was purchased using cash collateral held from securities on loan. |
NV — Naamloze Vennootschap
plc — Public Limited Company
REIT — Real Estate Investment Trust
See accompanying Notes to Financial Statements.
Diamond Hill Large Cap Fund
Schedule of Investments
December 31, 2021
| | Shares | | | Fair
Value | |
Common Stocks — 98.9% |
Communication Services — 9.8% |
Charter Communications, Inc., Class A (a) | | | 246,358 | | | $ | 160,618,025 | |
Comcast Corp., Class A | | | 3,086,440 | | | | 155,340,525 | |
Meta Platforms, Inc., Class A (a) | | | 951,394 | | | | 320,001,372 | |
Verizon Communications, Inc. | | | 2,635,154 | | | | 136,922,602 | |
Walt Disney Co. (The) (a) | | | 2,169,085 | | | | 335,969,576 | |
Zynga, Inc., Class A (a) | | | 15,257,499 | | | | 97,647,994 | |
| | | | | | | | 1,206,500,094 | |
Consumer Discretionary — 13.2% |
Booking Holdings, Inc. (a) | | | 93,438 | | | | 224,179,253 | |
BorgWarner, Inc. | | | 3,057,576 | | | | 137,804,950 | |
General Motors Co. (a) | | | 5,514,433 | | | | 323,311,207 | |
Hanesbrands, Inc. | | | 7,485,492 | | | | 125,157,426 | |
Home Depot, Inc. (The) | | | 659,810 | | | | 273,827,748 | |
NVR, Inc. (a) | | | 55,298 | | | | 326,748,693 | |
VF Corp. | | | 3,015,300 | | | | 220,780,266 | |
| | | | | | | | 1,631,809,543 | |
Consumer Staples — 10.1% |
Archer-Daniels-Midland Co. | | | 2,819,829 | | | | 190,592,242 | |
Mondelez International, Inc., Class A | | | 5,002,373 | | | | 331,707,354 | |
PepsiCo, Inc. | | | 2,060,992 | | | | 358,014,920 | |
Procter & Gamble Co. (The) | | | 2,250,701 | | | | 368,169,670 | |
| | | | | | | | 1,248,484,186 | |
Energy — 2.6% |
Chevron Corp. | | | 2,782,113 | | | | 326,480,961 | |
| |
Financials — 22.7% |
American International Group, Inc. | | | 9,675,518 | | | | 550,149,953 | |
Bank of America Corp. | | | 8,389,923 | | | | 373,267,674 | |
Berkshire Hathaway, Inc., Class B (a) | | | 1,367,167 | | | | 408,782,933 | |
First Republic Bank | | | 430,719 | | | | 88,947,781 | |
Hartford Financial Services Group, Inc. (The) | | | 3,460,102 | | | | 238,885,442 | |
KKR & Co., Inc. | | | 4,907,611 | | | | 365,617,019 | |
Marsh & McLennan Cos., Inc. | | | 1,098,472 | | | | 190,936,403 | |
26 DIAMOND HILL FUNDS | ANNUAL REPORT | DECEMBER 31, 2021 | DIAMOND-HILL.COM |
Diamond Hill Large Cap Fund
Schedule of Investments (Continued)
December 31, 2021
| | Shares | | | Fair
Value | |
Common Stocks — 98.9% continued |
Financials — 22.7% continued |
Nasdaq, Inc. | | | 900,571 | | | $ | 189,128,916 | |
Truist Financial Corp. | | | 4,589,896 | | | | 268,738,411 | |
Wells Fargo & Co. | | | 2,713,641 | | | | 130,200,495 | |
| | | | | | | | 2,804,655,027 | |
Health Care — 13.7% |
Abbott Laboratories | | | 3,353,940 | | | | 472,033,516 | |
AbbVie, Inc. | | | 1,222,418 | | | | 165,515,397 | |
Becton, Dickinson and Co. | | | 875,648 | | | | 220,207,959 | |
Humana, Inc. | | | 640,693 | | | | 297,191,855 | |
Medtronic plc | | | 2,199,095 | | | | 227,496,378 | |
Pfizer, Inc. | | | 5,370,639 | | | | 317,136,233 | |
| | | | | | | | 1,699,581,338 | |
Industrials — 7.7% |
Carrier Global Corp. | | | 2,637,504 | | | | 143,058,217 | |
Caterpillar, Inc. | | | 810,843 | | | | 167,633,682 | |
Deere & Co. | | | 367,845 | | | | 126,130,372 | |
Honeywell International, Inc. | | | 671,501 | | | | 140,014,674 | |
L3Harris Technologies, Inc. | | | 645,964 | | | | 137,745,363 | |
Parker-Hannifin Corp. | | | 749,936 | | | | 238,569,640 | |
| | | | | | | | 953,151,948 | |
Information Technology — 8.7% |
Cognizant Technology Solutions Corp., Class A | | | 3,146,633 | | | | 279,169,280 | |
Fidelity National Information Services, Inc. | | | 2,108,586 | | | | 230,152,162 | |
SS&C Technologies Holdings, Inc. | | | 1,932,503 | | | | 158,426,596 | |
Texas Instruments, Inc. | | | 1,277,214 | | | | 240,716,523 | |
Visa, Inc., Class A (b) | | | 777,320 | | | | 168,453,017 | |
| | | | | | | | 1,076,917,578 | |
Materials — 5.4% |
Freeport-McMoRan, Inc. | | | 7,007,757 | | | | 292,433,700 | |
Linde plc | | | 591,073 | | | | 204,765,419 | |
Sherwin-Williams Co. (The) | | | 466,095 | | | | 164,140,015 | |
| | | | | | | | 661,339,134 | |
| | Shares | | | Fair
Value | |
Real Estate — 3.8% |
Public Storage REIT | | | 430,238 | | | $ | 161,149,945 | |
SBA Communications Corp. | | | 245,710 | | | | 95,586,104 | |
Weyerhaeuser Co. | | | 5,046,312 | | | | 207,807,128 | |
| | | | | | | | 464,543,177 | |
Utilities — 1.2% |
Dominion Energy, Inc. | | | 1,925,663 | | | | 151,280,085 | |
| |
Total Common Stocks |
(Cost $8,399,511,866) | | $ | 12,224,743,071 | |
| |
Registered Investment Companies — 1.4% |
State Street Institutional US Government Money Market Fund - Premier Class, 0.03%(c) | | | 140,503,238 | | | | 140,503,238 | |
State Street Navigator Securities Lending Portfolio I, 0.15%(c)(d) | | | 35,782,250 | | | | 35,782,250 | |
Total Registered Investment Companies |
(Cost $176,285,488) | | $ | 176,285,488 | |
| |
Total Investment Securities — 100.3% |
(Cost $8,575,797,354) | | $ | 12,401,028,559 | |
| |
Liabilities in Excess of Other Assets — (0.3)% | | | (40,845,981 | ) |
| |
Net Assets — 100.0% | | $ | 12,360,182,578 | |
(a) | Non-income producing security. |
(b) | All or a portion of the security is on loan. The total fair value of the securities on loan as of December 31, 2021 was $141,089,479. |
(c) | The rate shown is the 7-day effective yield as of December 31, 2021. |
(d) | This security was purchased using cash collateral held from securities on loan. |
plc — Public Limited Company
REIT — Real Estate Investment Trust
See accompanying Notes to Financial Statements.
DIAMOND HILL FUNDS | ANNUAL REPORT | DECEMBER 31, 2021 | DIAMOND-HILL.COM 27 |
Diamond Hill Large Cap Concentrated Fund
Schedule of Investments
December 31, 2021
| | Shares | | | Fair
Value | |
Common Stocks — 97.2% |
Communication Services — 9.8% |
Meta Platforms, Inc., Class A (a) | | | 2,432 | | | $ | 818,003 | |
Walt Disney Co. (The) (a) | | | 6,055 | | | | 937,859 | |
| | | | | | | | 1,755,862 | |
Consumer Discretionary — 13.1% |
General Motors Co. (a) | | | 13,837 | | | | 811,263 | |
NVR, Inc. (a) | | | 146 | | | | 862,695 | |
VF Corp. | | | 9,123 | | | | 667,986 | |
| | | | | | | | 2,341,944 | |
Consumer Staples — 10.1% |
Mondelez International, Inc., Class A | | | 13,886 | | | | 920,781 | |
PepsiCo, Inc. | | | 5,178 | | | | 899,470 | |
| | | | | | | | 1,820,251 | |
Energy — 5.0% |
Chevron Corp. | | | 7,587 | | | | 890,335 | |
| |
Financials — 28.2% |
American International Group, Inc. | | | 26,810 | | | | 1,524,417 | |
Bank of America Corp. | | | 18,344 | | | | 816,125 | |
Berkshire Hathaway, Inc., Class B (a) | | | 3,615 | | | | 1,080,885 | |
KKR & Co., Inc. | | | 11,846 | | | | 882,527 | |
Truist Financial Corp. | | | 12,901 | | | | 755,354 | |
| | | | | | | | 5,059,308 | |
Health Care — 15.1% |
Abbott Laboratories | | | 8,199 | | | | 1,153,927 | |
Humana, Inc. | | | 1,619 | | | | 750,989 | |
Pfizer, Inc. | | | 13,668 | | | | 807,095 | |
| | | | | | | | 2,712,011 | |
Industrials — 3.8% |
Parker-Hannifin Corp. | | | 2,136 | | | | 679,504 | |
| |
Information Technology — 7.8% |
Cognizant Technology Solutions Corp., Class A | | | 8,202 | | | | 727,682 | |
Texas Instruments, Inc. | | | 3,592 | | | | 676,984 | |
| | | | | | | | 1,404,666 | |
| | Shares | | | Fair
Value | |
Materials — 4.3% |
Freeport-McMoRan, Inc. | | | 18,575 | | | $ | 775,135 | |
| |
Total Common Stocks |
(Cost $15,109,625) | | $ | 17,439,016 | |
| |
Registered Investment Companies — 2.8% |
State Street Institutional US Government Money Market Fund — Premier Class, 0.03% (b) (Cost $507,574) | | | 507,574 | | | | 507,574 | |
| |
Total Investment Securities — 100.0% |
(Cost $15,617,199) | | $ | 17,946,590 | |
| |
Liabilities in Excess of Other Assets — (0.0)% (c) | | | (779 | ) |
| |
Net Assets — 100.0% | | $ | 17,945,811 | |
(a) | Non-income producing security. |
(b) | The rate shown is the 7-day effective yield as of December 31, 2021. |
(c) | Percentage rounds to less than 0.1%. |
See accompanying Notes to Financial Statements.
28 DIAMOND HILL FUNDS | ANNUAL REPORT | DECEMBER 31, 2021 | DIAMOND-HILL.COM |
Diamond Hill All Cap Select Fund
Schedule of Investments
December 31, 2021
| | Shares | | | Fair
Value | |
Common Stocks — 96.9% |
Communication Services — 7.8% |
Meta Platforms, Inc., Class A (a) | | | 38,936 | | | $ | 13,096,124 | |
Walt Disney Co. (The) (a) | | | 47,866 | | | | 7,413,965 | |
Zynga, Inc., Class A (a) | | | 1,449,251 | | | | 9,275,206 | |
| | | | | | | | 29,785,295 | |
Consumer Discretionary — 13.6% |
Hanesbrands, Inc. | | | 1,325,788 | | | | 22,167,175 | |
Red Rock Resorts, Inc., Class A | | | 374,983 | | | | 20,627,815 | |
VF Corp. | | | 129,678 | | | | 9,495,023 | |
| | | | | | | | 52,290,013 | |
Consumer Staples — 8.2% |
Mondelez International, Inc., Class A | | | 109,179 | | | | 7,239,659 | |
Post Holdings, Inc. (a) | | | 80,022 | | | | 9,020,880 | |
Seaboard Corp. | | | 2,557 | | | | 10,061,821 | |
SunOpta, Inc. (a)(b) | | | 734,034 | | | | 5,101,536 | |
| | | | | | | | 31,423,896 | |
Financials — 30.4% |
Alleghany Corp. (a) | | | 11,206 | | | | 7,481,014 | |
American International Group, Inc. | | | 453,710 | | | | 25,797,951 | |
Bank OZK | | | 155,946 | | | | 7,256,167 | |
Berkshire Hathaway, Inc., Class B (a) | | | 57,451 | | | | 17,177,849 | |
Cadence Bank | | | 300,501 | | | | 8,951,925 | |
KKR & Co., Inc. | | | 193,206 | | | | 14,393,847 | |
Mr. Cooper Group, Inc. (a) | | | 620,339 | | | | 25,812,306 | |
Sterling Bancorp | | | 372,508 | | | | 9,606,981 | |
| | | | | | | | 116,478,040 | |
Health Care — 7.5% |
AbbVie, Inc. | | | 52,327 | | | | 7,085,076 | |
Boston Scientific Corp. (a) | | | 137,317 | | | | 5,833,226 | |
Humana, Inc. | | | 18,244 | | | | 8,462,662 | |
Pfizer, Inc. | | | 128,902 | | | | 7,611,663 | |
| | | | | | | | 28,992,627 | |
| | Shares | | | Fair
Value | |
Industrials — 20.5% |
Cimpress plc (a) | | | 190,449 | | | $ | 13,638,053 | |
Colfax Corp. (a) | | | 311,229 | | | | 14,307,197 | |
Energy Recovery, Inc. (a) | | | 223,165 | | | | 4,795,816 | |
Kirby Corp. (a) | | | 246,350 | | | | 14,638,117 | |
Sensata Technologies Holding plc (a) | | | 93,758 | | | | 5,783,931 | |
WESCO International, Inc. (a) | | | 192,889 | | | | 25,382,264 | |
| | | | | | | | 78,545,378 | |
Information Technology — 3.0% |
Cognizant Technology Solutions Corp., Class A | | | 85,104 | | | | 7,550,427 | |
SS&C Technologies Holdings, Inc. | | | 46,688 | | | | 3,827,482 | |
| | | | | | | | 11,377,909 | |
Materials — 3.9% |
Ashland Global Holdings, Inc. | | | 43,043 | | | | 4,634,009 | |
Freeport-McMoRan, Inc. | | | 247,033 | | | | 10,308,687 | |
| | | | | | | | 14,942,696 | |
Utilities — 2.0% |
UGI Corp. | | | 166,825 | | | | 7,658,936 | |
| |
Total Common Stocks |
(Cost $236,562,876) | | $ | 371,494,790 | |
| |
DIAMOND HILL FUNDS | ANNUAL REPORT | DECEMBER 31, 2021 | DIAMOND-HILL.COM 29 |
Diamond Hill All Cap Select Fund
Schedule of Investments (Continued)
December 31, 2021
| | Shares | | | Fair
Value | |
Registered Investment Companies — 3.1% |
State Street Institutional US Government Money Market Fund — Premier Class, 0.03%(c) | | | 12,009,348 | | | $ | 12,009,348 | |
State Street Navigator Securities Lending Portfolio I, 0.15%(c)(d) | | | 665 | | | | 665 | |
Total Registered Investment Companies |
(Cost $12,010,013) | | $ | 12,010,013 | |
| |
Total Investment Securities — 100.0% |
(Cost $248,572,889) | | $ | 383,504,803 | |
| |
Liabilities in Excess of Other Assets — (0.0)% (e) | | | (106,070 | ) |
| |
Net Assets — 100.0% | | $ | 383,398,733 | |
(a) | Non-income producing security. |
(b) | All or a portion of the security is on loan. The total fair value of the securities on loan as of December 31, 2021 was $660. |
(c) | The rate shown is the 7-day effective yield as of December 31, 2021. |
(d) | This security was purchased using cash collateral held from securities on loan. |
(e) | Percentage rounds to less than 0.1%. |
plc — Public Limited Company
See accompanying Notes to Financial Statements.
Diamond Hill Long-Short Fund
Schedule of Investments
December 31, 2021
| | Shares | | | Fair
Value | |
Common Stocks — 90.4% |
Communication Services — 13.3% |
Alphabet, Inc., Class A (a) | | | 26,025 | | | $ | 75,395,466 | |
Comcast Corp., Class A | | | 768,054 | | | | 38,656,158 | |
Meta Platforms, Inc., Class A (a) | | | 232,414 | | | | 78,172,449 | |
Verizon Communications, Inc. | | | 542,390 | | | | 28,182,584 | |
Walt Disney Co. (The) (a)(b) | | | 286,234 | | | | 44,334,784 | |
| | | | | | | | 264,741,441 | |
Consumer Discretionary — 7.5% |
Booking Holdings, Inc. (a) | | | 10,910 | | | | 26,175,599 | |
BorgWarner, Inc. (b) | | | 362,933 | | | | 16,357,390 | |
Hanesbrands, Inc. (b) | | | 1,760,495 | | | | 29,435,476 | |
TJX Cos., Inc. (The) (b)(c) | | | 366,476 | | | | 27,822,858 | |
VF Corp. (b) | | | 448,888 | | | | 32,867,579 | |
Wolverine World Wide, Inc. | | | 597,400 | | | | 17,211,094 | |
| | | | | | | | 149,869,996 | |
Consumer Staples — 4.4% |
Archer-Daniels-Midland Co. (b) | | | 442,798 | | | | 29,928,717 | |
Constellation Brands, Inc., Class A (b) | | | 117,449 | | | | 29,476,176 | |
Mondelez International, Inc., Class A (b) | | | 441,330 | | | | 29,264,592 | |
| | | | | | | | 88,669,485 | |
Energy — 3.4% |
Chevron Corp. (b) | | | 365,009 | | | | 42,833,806 | |
Coterra Energy, Inc. (b) | | | 1,312,448 | | | | 24,936,512 | |
| | | | | | | | 67,770,318 | |
Financials — 23.9% |
American International Group, Inc. (b) | | | 1,448,580 | | | | 82,366,259 | |
Bank of America Corp. (c) | | | 767,335 | | | | 34,138,734 | |
Bank OZK (b)(c) | | | 479,265 | | | | 22,300,200 | |
Berkshire Hathaway, Inc., Class B (a) | | | 157,384 | | | | 47,057,816 | |
Citigroup, Inc. (c) | | | 907,186 | | | | 54,784,963 | |
Hartford Financial Services Group, Inc. (The) | | | 618,066 | | | | 42,671,277 | |
KKR & Co., Inc. | | | 730,775 | | | | 54,442,738 | |
MetLife, Inc. (b) | | | 399,954 | | | | 24,993,125 | |
30 DIAMOND HILL FUNDS | ANNUAL REPORT | DECEMBER 31, 2021 | DIAMOND-HILL.COM |
Diamond Hill Long-Short Fund
Schedule of Investments (Continued)
December 31, 2021
| | Shares | | | Fair
Value | |
Common Stocks — 90.4% continued |
Financials — 23.9% continued |
Morgan Stanley | | | 232,962 | | | $ | 22,867,550 | |
SVB Financial Group (a)(c) | | | 30,469 | | | | 20,665,295 | |
Truist Financial Corp. (b)(c) | | | 761,745 | | | | 44,600,170 | |
Wells Fargo & Co. (c) | | | 546,128 | | | | 26,203,221 | |
| | | | | | | | 477,091,348 | |
Health Care — 13.1% |
Abbott Laboratories (b) | | | 284,872 | | | | 40,092,885 | |
AbbVie, Inc. (b) | | | 107,761 | | | | 14,590,839 | |
Becton, Dickinson and Co. (b) | | | 135,597 | | | | 34,099,934 | |
CVS Health Corp. | | | 333,799 | | | | 34,434,705 | |
Humana, Inc. | | | 94,920 | | | | 44,029,591 | |
Medtronic plc | | | 368,499 | | | | 38,121,222 | |
Perrigo Co. plc (b) | | | 729,374 | | | | 28,372,649 | |
Pfizer, Inc. | | | 478,910 | | | | 28,279,636 | |
| | | | | | | | 262,021,461 | |
Industrials — 9.6% |
Alaska Air Group, Inc. (a)(c) | | | 532,548 | | | | 27,745,751 | |
Colfax Corp. (a)(b) | | | 456,967 | | | | 21,006,773 | |
Johnson Controls International plc | | | 131,665 | | | | 10,705,681 | |
Kirby Corp. (a)(b) | | | 684,156 | | | | 40,652,550 | |
L3Harris Technologies, Inc. | | | 109,180 | | | | 23,281,543 | |
Parker-Hannifin Corp. (b) | | | 113,111 | | | | 35,982,871 | |
Sensata Technologies Holding plc (a)(b) | | | 526,128 | | | | 32,456,836 | |
| | | | | | | | 191,832,005 | |
| | Shares | | | Fair
Value | |
Information Technology — 11.9% |
Cognizant Technology Solutions Corp., Class A (c) | | | 521,995 | | | $ | 46,311,396 | |
Fidelity National Information Services, Inc. (b)(c) | | | 465,596 | | | | 50,819,803 | |
Microsoft Corp. (c) | | | 172,477 | | | | 58,007,465 | |
Texas Instruments, Inc. (b) | | | 145,701 | | | | 27,460,267 | |
Visa, Inc., Class A (c) | | | 140,892 | | | | 30,532,705 | |
WNS Holdings Ltd. - ADR (a)(c) | | | 280,581 | | | | 24,752,856 | |
| | | | | | | | 237,884,492 | |
Materials — 2.0% |
Ashland Global Holdings, Inc. (b) | | | 116,849 | | | | 12,579,963 | |
Freeport-McMoRan, Inc. (b) | | | 659,024 | | | | 27,501,072 | |
| | | | | | | | 40,081,035 | |
Utilities — 1.3% |
Dominion Energy, Inc. (b) | | | 337,325 | | | | 26,500,252 | |
| |
Total Common Stocks |
(Cost $1,026,190,948) | | $ | 1,806,461,833 | |
| |
DIAMOND HILL FUNDS | ANNUAL REPORT | DECEMBER 31, 2021 | DIAMOND-HILL.COM 31 |
Diamond Hill Long-Short Fund
Schedule of Investments (Continued)
December 31, 2021
| | Shares | | | Fair
Value | |
Registered Investment Companies — 26.4% |
Diamond Hill Short Duration Securitized Bond Fund - Class Y (d) | | | 3,047,685 | | | $ | 30,812,092 | |
State Street Institutional US Government Money Market Fund - Premier Class, 0.03%(e) | | | 142,769,013 | | | | 142,769,013 | |
State Street Navigator Securities Lending Portfolio I, 0.15%(e)(f) | | | 353,432,836 | | | | 353,432,836 | |
Total Registered Investment Companies |
(Cost $526,772,742) | | $ | 527,013,941 | |
| |
Total Investment Securities — 116.8% |
(Cost $1,552,963,690) | | $ | 2,333,475,774 | |
| |
Segregated Cash With Custodian — 31.1% | | | 621,577,793 | |
| |
Investments Sold Short — (30.8)% |
(Proceeds $535,760,111) | | | (614,950,582 | ) |
| |
Liabilities in Excess of Other Assets — (17.1)% | | | (342,115,916 | ) |
| |
Net Assets — 100.0% | | $ | 1,997,987,069 | |
(a) | Non-income producing security. |
(b) | All or a portion of the security is on loan. The total fair value of the securities on loan as of December 31, 2021 was $345,170,733. |
(c) | All or a portion of the shares have been pledged as collateral for open short positions. |
(e) | The rate shown is the 7-day effective yield as of December 31, 2021. |
(f) | This security was purchased using cash collateral held from securities on loan. |
ADR — American Depositary Receipt
plc — Public Limited Company
See accompanying Notes to Financial Statements.
Diamond Hill Long-Short Fund
Schedule of Investments Sold Short
December 31, 2021
| | Shares | | | Fair
Value | |
Common Stocks — 30.8% |
Communication Services — 1.5% |
Cogent Communications Holdings, Inc. | | | 276,595 | | | $ | 20,241,222 | |
Ziff Davis, Inc. | | | 79,989 | | | | 8,867,581 | |
| | | | | | | | 29,108,803 | |
Consumer Discretionary — 6.4% |
Best Buy Co., Inc. | | | 173,261 | | | | 17,603,318 | |
CarMax, Inc. | | | 132,410 | | | | 17,243,754 | |
Dick’s Sporting Goods, Inc. | | | 76,396 | | | | 8,784,776 | |
Etsy, Inc. | | | 40,285 | | | | 8,819,998 | |
Gamestop Corp., Class A | | | 63,085 | | | | 9,361,183 | |
Grand Canyon Education, Inc. | | | 124,297 | | | | 10,653,496 | |
Macy’s, Inc. | | | 339,590 | | | | 8,890,466 | |
Sleep Number Corp. | | | 167,615 | | | | 12,839,309 | |
Tesla, Inc. | | | 5,064 | | | | 5,351,534 | |
Under Armour, Inc., Class A | | | 318,269 | | | | 6,744,120 | |
Whirlpool Corp. | | | 95,240 | | | | 22,349,018 | |
| | | | | | | | 128,640,972 | |
Consumer Staples — 3.4% |
Boston Beer Co., Inc. (The), Class A | | | 5,833 | | | | 2,946,248 | |
Brown-Forman Corp., Class B | | | 491,890 | | | | 35,839,105 | |
WD-40 Co. | | | 121,807 | | | | 29,798,864 | |
| | | | | | | | 68,584,217 | |
Financials — 3.7% |
Bank of Hawaii Corp. | | | 106,880 | | | | 8,952,269 | |
Blackstone Mortgage Trust, Inc., Class A | | | 324,600 | | | | 9,939,252 | |
Commerce Bancshares, Inc. | | | 385,944 | | | | 26,529,791 | |
First Financial Bankshares, Inc. | | | 455,728 | | | | 23,169,212 | |
Westamerica BanCorp. | | | 83,265 | | | | 4,806,888 | |
| | | | | | | | 73,397,412 | |
Health Care — 2.8% |
MultiPlan Corp. | | | 2,078,615 | | | | 9,208,264 | |
Penumbra, Inc. | | | 97,510 | | | | 28,016,573 | |
Waters Corp. | | | 48,415 | | | | 18,039,429 | |
| | | | | | | | 55,264,266 | |
32 DIAMOND HILL FUNDS | ANNUAL REPORT | DECEMBER 31, 2021 | DIAMOND-HILL.COM |
Diamond Hill Long-Short Fund
Schedule of Investments Sold Short (Continued)
December 31, 2021
| | Shares | | | Fair
Value | |
Common Stocks — 30.8% continued |
Industrials — 5.3% |
Avis Budget Group, Inc. | | | 49,045 | | | $ | 10,170,462 | |
Cintas Corp. | | | 47,609 | | | | 21,098,881 | |
Robert Half International, Inc. | | | 269,143 | | | | 30,014,827 | |
United Parcel Service, Inc., Class B | | | 139,240 | | | | 29,844,702 | |
W.W. Grainger, Inc. | | | 11,550 | | | | 5,985,672 | |
Wabtec Corp. | | | 96,330 | | | | 8,872,956 | |
| | | | | | | | 105,987,500 | |
Information Technology — 5.7% |
Badger Meter, Inc. | | | 170,251 | | | | 18,141,947 | |
Blackbaud, Inc. | | | 194,382 | | | | 15,352,290 | |
Cisco Systems, Inc. | | | 431,505 | | | | 27,344,472 | |
Consensus Cloud Solutions, Inc. | | | 46,468 | | | | 2,689,103 | |
F5, Inc. | | | 48,892 | | | | 11,964,361 | |
Oracle Corp. | | | 298,063 | | | | 25,994,074 | |
Teradata Corp. | | | 298,605 | | | | 12,681,754 | |
| | | | | | | | 114,168,001 | |
Materials — 0.5% |
Silgan Holdings, Inc. | | | 223,460 | | | | 9,573,026 | |
| |
Utilities — 1.5% |
Ormat Technologies, Inc. | | | 381,165 | | | | 30,226,385 | |
| |
Total Investments Sold Short — 30.8% |
(Proceeds $535,760,111) | | $ | 614,950,582 | |
| |
Percentages disclosed are based on total net assets of the Fund at December 31, 2021.
See accompanying Notes to Financial Statements.
Diamond Hill International Fund
Schedule of Investments
December 31, 2021
| | Shares | | | Fair
Value | |
Common Stocks — 94.8% |
Brazil — 1.3% |
Hypera SA | | | 138,518 | | | $ | 702,341 | |
| |
Canada — 7.4% |
Aurinia Pharmaceuticals, Inc. (a)(b) | | | 19,184 | | | | 438,738 | |
BlackBerry Ltd. (a) | | | 68,796 | | | | 643,243 | |
Fairfax Financial Holdings Ltd. (b) | | | 3,818 | | | | 1,878,731 | |
Rogers Communications, Inc., Class B | | | 24,670 | | | | 1,175,032 | |
| | | | | | | | 4,135,744 | |
China — 6.7% |
Alibaba Group Holding Ltd. (a) | | | 80,200 | | | | 1,178,735 | |
Baidu, Inc., Class A (a) | | | 27,350 | | | | 510,168 | |
Fu Shou Yuan International Group Ltd. | | | 675,000 | | | | 530,541 | |
Tencent Holdings Ltd. | | | 25,900 | | | | 1,511,486 | |
| | | | | | | | 3,730,930 | |
France — 3.2% |
LVMH Moet Hennessy Louis Vuitton SE | | | 354 | | | | 292,474 | |
Safran SA | | | 3,744 | | | | 458,222 | |
Ubisoft Entertainment SA (a) | | | 15,199 | | | | 741,200 | |
Vivendi SE | | | 21,682 | | | | 293,207 | |
| | | | | | | | 1,785,103 | |
Germany — 1.0% |
Fuchs Petrolub SE | | | 15,753 | | | | 551,711 | |
| |
India — 1.9% |
HDFC Bank Ltd. - ADR | | | 16,373 | | | | 1,065,391 | |
| |
Israel — 3.9% |
Check Point Software Technologies Ltd. (a) | | | 18,502 | | | | 2,156,593 | |
| |
Italy — 1.6% |
doValue SpA | | | 90,854 | | | | 866,787 | |
| |
Japan — 5.9% |
Astellas Pharma, Inc. | | | 87,400 | | | | 1,421,653 | |
DIAMOND HILL FUNDS | ANNUAL REPORT | DECEMBER 31, 2021 | DIAMOND-HILL.COM 33 |
Diamond Hill International Fund
Schedule of Investments (Continued)
December 31, 2021
| | Shares | | | Fair
Value | |
Common Stocks — 94.8% continued |
Japan — 5.9% continued |
Nintendo Co. Ltd. — ADR | | | 24,954 | | | $ | 1,456,565 | |
Shionogi & Co. Ltd. | | | 5,800 | | | | 407,771 | |
| | | | | | | | 3,285,989 | |
Mexico — 2.1% |
Fomento Economico Mexicano SAB de CV | | | 147,233 | | | | 1,144,284 | |
| |
Netherlands — 1.3% |
Universal Music Group NV | | | 25,561 | | | | 722,175 | |
| |
Nigeria — 0.7% |
IHS Holding Ltd. (a) | | | 29,525 | | | | 416,303 | |
| |
Peru — 1.5% |
Credicorp Ltd. | | | 7,056 | | | | 861,326 | |
| |
Poland — 1.8% |
Dino Polska SA (a) | | | 11,237 | | | | 1,020,442 | |
| |
South Korea — 3.0% |
Samsung Electronics Co. Ltd. | | | 25,245 | | | | 1,655,402 | |
| |
Spain — 0.8% |
Banco Bilbao Vizcaya Argentaria SA | | | 78,809 | | | | 467,281 | |
| |
Sweden — 2.1% |
Assa Abloy AB, Class B | | | 38,590 | | | | 1,175,005 | |
| |
Switzerland — 11.5% |
Compagnie Financiere Richemont SA, Class A | | | 6,735 | | | | 1,005,230 | |
Nestlé SA | | | 6,680 | | | | 931,519 | |
Novartis AG — ADR | | | 19,979 | | | | 1,747,563 | |
Roche Holdings AG | | | 3,195 | | | | 1,323,884 | |
Swatch Group AG (The) | | | 4,526 | | | | 1,376,668 | |
| | | | | | | | 6,384,864 | |
| | Shares | | | Fair
Value | |
Taiwan Province of China — 2.8% |
Taiwan Semiconductor Manufacturing Co. Ltd. — ADR | | | 12,921 | | | $ | 1,554,526 | |
| |
Thailand — 0.4% |
Kasikorn Bank pcl | | | 46,800 | | | | 198,968 | |
| |
United Kingdom — 25.1% |
Ashmore Group plc | | | 337,628 | | | | 1,332,659 | |
Beazley plc (a) | | | 179,141 | | | | 1,131,762 | |
BT Group plc | | | 679,522 | | | | 1,561,821 | |
Bunzl plc | | | 27,061 | | | | 1,056,186 | |
Compass Group plc (a) | | | 55,716 | | | | 1,253,233 | |
Diageo plc | | | 36,637 | | | | 2,001,347 | |
GlaxoSmithKline plc | | | 60,772 | | | | 1,321,972 | |
Howden Joinery Group plc | | | 51,205 | | | | 626,631 | |
InterContinental Hotels Group plc (a) | | | 7,505 | | | | 484,750 | |
Tesco plc | | | 303,974 | | | | 1,195,681 | |
Unilever plc | | | 36,727 | | | | 1,968,234 | |
| | | | | | | | 13,934,276 | |
United States — 8.8% |
Freeport-McMoRan, Inc. | | | 25,475 | | | | 1,063,072 | |
Meta Platforms, Inc., Class A (a) | | | 3,317 | | | | 1,115,673 | |
Spotify Technology SA (a) | | | 6,738 | | | | 1,576,894 | |
Walt Disney Co. (The) (a) | | | 7,168 | | | | 1,110,252 | |
| | | | | | | | 4,865,891 | |
| |
Total Common Stocks |
(Cost $49,747,922) | | $ | 52,681,332 | |
| |
Warrants — 0.0%(c) |
Switzerland — 0.0% (c) |
Compagnie Financiere Richemont SA (Cost $0) | | | 8,320 | | | $ | 9,120 | |
| |
34 DIAMOND HILL FUNDS | ANNUAL REPORT | DECEMBER 31, 2021 | DIAMOND-HILL.COM |
Diamond Hill International Fund
Schedule of Investments (Continued)
December 31, 2021
| | Shares | | | Fair
Value | |
Registered Investment Companies — 5.8% |
State Street Institutional US Government Money Market Fund - Premier Class, 0.03% (d) | | | 2,849,570 | | | $ | 2,849,570 | |
State Street Navigator Securities Lending Portfolio I, 0.15% (d)(e) | | | 359,632 | | | | 359,632 | |
Total Registered Investment Companies |
(Cost $3,209,202) | | $ | 3,209,202 | |
| |
Total Investment Securities — 100.6% |
(Cost $52,957,124) | | $ | 55,899,654 | |
| |
Liabilities in Excess of Other Assets — (0.6)% | | | (311,552 | ) |
| |
Net Assets — 100.0% | | $ | 55,588,102 | |
(a) | Non-income producing security. |
(b) | All or a portion of the security is on loan. The total fair value of the securities on loan as of December 31, 2021 was $416,820. |
(c) | Percentage rounds to less than 0.1%. |
(d) | The rate shown is the 7-day effective yield as of December 31, 2021. |
(e) | This security was purchased using cash collateral held from securities on loan. |
AB — Aktiebolag
ADR — American Depositary Receipt.
AG — Aktiengesellschaft
NV — Naamloze Vennootschap
pcl — Public Company Limited
plc — Public Limited Company
SA — Societe Anonyme
SAB de CV— Societe Anonima Bursatil de Capital Variable
SE — Societe Europaea
SpA — Societa per Azioni
See accompanying Notes to Financial Statements.
Diamond Hill Short Duration Securitized Bond Fund
Schedule of Investments
December 31, 2021
| | Coupon | | | Maturity | | | Shares /
Par Value | | | Fair
Value | |
Corporate Credit — 5.8% |
Banking — 3.0% |
American Express Co. | | | 0.750 | % | | | 11/03/23 | | | $ | 1,700,000 | | | $ | 1,694,788 | |
Bank of America Corp. | | | 1.486 | % | | | 05/19/24 | | | | 4,514,000 | | | | 4,546,691 | |
Bank of Nova Scotia | | | 0.400 | % | | | 09/15/23 | | | | 2,200,000 | | | | 2,182,590 | |
Capital One Financial Corp. | | | 4.250 | % | | | 04/30/25 | | | | 1,417,000 | | | | 1,531,094 | |
Citigroup, Inc. | | | 2.876 | % | | | 07/24/23 | | | | 2,800,000 | | | | 2,833,618 | |
Citigroup, Inc. | | | 1.281 | % | | | 11/03/25 | | | | 1,000,000 | | | | 997,311 | |
Discover Financial Services | | | 3.750 | % | | | 03/04/25 | | | | 2,750,000 | | | | 2,909,329 | |
Eaton Vance Corp. | | | 3.625 | % | | | 06/15/23 | | | | 5,000,000 | | | | 5,202,870 | |
Fifth Third Bancorp | | | 1.707 | % | | | 11/01/27 | | | | 1,200,000 | | | | 1,185,234 | |
Goldman Sachs Group, Inc. | | | 0.925 | % | | | 10/21/24 | | | | 3,000,000 | | | | 2,987,095 | |
Goldman Sachs Group, Inc. | | | 1.217 | % | | | 12/06/23 | | | | 1,000,000 | | | | 1,002,554 | |
JPMorgan Chase & Co. (3MO LIBOR + 100) (a) | | | 1.124 | % | | | 01/15/23 | | | | 400,000 | | | | 400,104 | |
JPMorgan Chase & Co. (SOFR + 60) (a) | | | 0.653 | % | | | 09/16/24 | | | | 350,000 | | | | 348,356 | |
JPMorgan Chase & Co. | | | 0.768 | % | | | 08/09/25 | | | | 3,000,000 | | | | 2,952,460 | |
JPMorgan Chase & Co. | | | 1.561 | % | | | 12/10/25 | | | | 2,000,000 | | | | 2,002,133 | |
JPMorgan Chase & Co. | | | 1.470 | % | | | 09/22/27 | | | | 1,600,000 | | | | 1,568,362 | |
Morgan Stanley | | | 0.791 | % | | | 07/22/25 | | | | 3,800,000 | | | | 3,761,502 | |
PNC Bank NA (3MO LIBOR + 32) (a) | | | 1.743 | % | | | 02/24/23 | | | | 420,000 | | | | 420,601 | |
Royal Bank of Canada (b) | | | 0.750 | % | | | 10/07/24 | | | | 2,000,000 | | | | 1,979,723 | |
Toronto-Dominion Bank (The) | | | 1.250 | % | | | 12/13/24 | | | | 500,000 | | | | 500,602 | |
Toronto-Dominion Bank (The) (SOFR + 48) (a)(b) | | | 0.530 | % | | | 01/27/23 | | | | 375,000 | | | | 376,017 | |
Toronto-Dominion Bank (The) (b) | | | 0.700 | % | | | 09/10/24 | | | | 900,000 | | | | 888,293 | |
Truist Financial Corp. | | | 0.449 | % | | | 06/09/25 | | | | 800,000 | | | | 798,816 | |
Wells Fargo & Co., Class MTN (SOFR + 160) (a) | | | 1.654 | % | | | 06/02/24 | | | | 1,000,000 | | | | 1,008,461 | |
| | | | | | | | | | | | | | | | 44,078,604 | |
DIAMOND HILL FUNDS | ANNUAL REPORT | DECEMBER 31, 2021 | DIAMOND-HILL.COM 35 |
Diamond Hill Short Duration Securitized Bond Fund
Schedule of Investments (Continued)
December 31, 2021
| | Coupon | | | Maturity | | | Shares /
Par Value | | | Fair
Value | |
Corporate Credit — 5.8% continued |
Brokerage Asset Managers Exchanges — 0.2% |
Intercontinental Exchange, Inc. (b) | | | 2.350 | % | | | 09/15/22 | | | $ | 2,750,000 | | | $ | 2,783,908 | |
| |
Capital Goods — 0.1% |
Waste Management, Inc. | | | 2.900 | % | | | 09/15/22 | | | | 900,000 | | | | 910,583 | |
Welbilt, Inc. | | | 9.500 | % | | | 02/15/24 | | | | 100,000 | | | | 101,000 | |
| | | | | | | | | | | | | | | | 1,011,583 | |
Communications — 0.0% (c) |
Twenty-First Century Fox, Inc. | | | 4.030 | % | | | 01/25/24 | | | | 450,000 | | | | 475,241 | |
| |
Consumer Cyclical — 0.5% |
Daimler Finance, LLC (b)(d) | | | 1.750 | % | | | 03/10/23 | | | | 1,900,000 | | | | 1,918,993 | |
Ford Motor Credit Co., LLC | | | 5.584 | % | | | 03/18/24 | | | | 250,000 | | | | 269,375 | |
General Motors Financial Co., Inc. | | | 3.250 | % | | | 01/05/23 | | | | 1,130,000 | | | | 1,154,445 | |
Toyota Motor Corp. | | | 0.450 | % | | | 01/11/24 | | | | 3,000,000 | | | | 2,974,550 | |
Toyota Motor Corp. | | | 0.625 | % | | | 09/13/24 | | | | 900,000 | | | | 887,659 | |
| | | | | | | | | | | | | | | | 7,205,022 | |
Consumer Non-Cyclical — 0.5% |
AbbVie, Inc. | | | 2.900 | % | | | 11/06/22 | | | | 2,800,000 | | | | 2,851,630 | |
Baxter International, Inc. (d) | | | 0.868 | % | | | 12/01/23 | | | | 1,800,000 | | | | 1,792,726 | |
Kroger Co. (The) | | | 4.000 | % | | | 02/01/24 | | | | 2,800,000 | | | | 2,945,184 | |
Mondelez International, Inc. (d) | | | 0.750 | % | | | 09/24/24 | | | | 300,000 | | | | 294,966 | |
| | | | | | | | | | | | | | | | 7,884,506 | |
Electric — 0.2% |
DTE Energy Co. | | | 1.050 | % | | | 06/01/25 | | | | 500,000 | | | | 489,881 | |
WEC Energy Group, Inc. | | | 0.800 | % | | | 03/15/24 | | | | 2,750,000 | | | | 2,721,801 | |
| | | | | | | | | | | | | | | | 3,211,682 | |
Energy — 0.2% |
Devon Energy Corp. | | | 5.250 | % | | | 09/15/24 | | | | 1,000,000 | | | | 1,081,929 | |
Energy Transfer Operating LP | | | 4.500 | % | | | 04/15/24 | | | | 925,000 | | | | 980,364 | |
TransCanada Pipeline Strip (b) | | | 1.000 | % | | | 10/12/24 | | | | 750,000 | | | | 743,386 | |
| | | | | | | | | | | | | | | | 2,805,679 | |
| | Coupon | | | Maturity | | | Shares /
Par Value | | | Fair
Value | |
Insurance — 0.9% |
Athene Global Funding (d) | | | 2.500 | % | | | 01/14/25 | | | $ | 1,450,000 | | | $ | 1,487,502 | |
Equitable Financial Life (d) | | | 1.100 | % | | | 11/12/24 | | | | 3,050,000 | | | | 3,013,274 | |
Met Life Global Funding I (d) | | | 1.950 | % | | | 01/13/23 | | | | 780,000 | | | | 790,002 | |
Met Life Global Funding I (d) | | | 0.700 | % | | | 09/27/24 | | | | 1,200,000 | | | | 1,182,180 | |
New York Life Global Funding (b)(d) | | | 0.900 | % | | | 10/29/24 | | | | 800,000 | | | | 794,505 | |
Principal Life Global Funding II (d) | | | 0.750 | % | | | 08/23/24 | | | | 1,265,000 | | | | 1,247,546 | |
Protective Life Global Funding (b)(d) | | | 0.473 | % | | | 01/12/24 | | | | 2,945,000 | | | | 2,905,521 | |
Protective Life Global Funding (d) | | | 0.781 | % | | | 07/05/24 | | | | 1,700,000 | | | | 1,677,615 | |
| | | | | | | | | | | | | | | | 13,098,145 | |
Technology — 0.0% (c) |
Dell International, LLC / EMC Corp. | | | 4.000 | % | | | 07/15/24 | | | | 500,000 | | | | 530,549 | |
| |
Transportation — 0.2% |
Alaska Airlines, Series 2020-1B, Class A (d) | | | 4.800 | % | | | 08/15/27 | | | | 460,806 | | | | 503,450 | |
American Airlines Pass-Through Trust, Series 2016-2, Class AA | | | 3.200 | % | | | 12/15/29 | | | | 1,529,000 | | | | 1,536,798 | |
United Airlines Pass-Through Trust, Series 2007-1, Class A | | | 6.636 | % | | | 01/02/24 | | | | 76,526 | | | | 78,159 | |
United Airlines Pass-Through Trust, Series 2020-1, Class A | | | 5.875 | % | | | 04/15/29 | | | | 1,083,960 | | | | 1,187,340 | |
| | | | | | | | | | | | | | | | 3,305,747 | |
| |
Total Corporate Credit |
(Cost $86,523,230) | | $ | 86,390,666 | |
| |
36 DIAMOND HILL FUNDS | ANNUAL REPORT | DECEMBER 31, 2021 | DIAMOND-HILL.COM |
Diamond Hill Short Duration Securitized Bond Fund
Schedule of Investments (Continued)
December 31, 2021
| | Coupon | | | Maturity | | | Shares /
Par Value | | | Fair
Value | |
Securitized — 85.1% |
ABS-Other — 7.1% |
BXG Receivables, Series 2018-A, Class C (d) | | | 4.440 | % | | | 02/02/34 | | | $ | 914,961 | | | $ | 944,769 | |
Cascade Funding Mortgage Trust, Series 2021-GRN1, Class B (d) | | | 1.830 | % | | | 03/20/41 | | | | 3,588,000 | | | | 3,491,592 | |
Diamond Resorts Owner Trust, Series 2019-1, Class B (d) | | | 3.530 | % | | | 02/20/32 | | | | 442,741 | | | | 449,436 | |
Diamond Resorts Owner Trust, Series 2021-1A, Class B (d) | | | 2.050 | % | | | 11/21/33 | | | | 1,401,026 | | | | 1,394,620 | |
Diamond Resorts Owner Trust, Series 2021-1A, Class C (d) | | | 2.700 | % | | | 11/21/33 | | | | 1,050,770 | | | | 1,045,920 | |
FMC GMSR Issuer Trust, Series 2020-GT1, Class A (a)(d) | | | 4.450 | % | | | 01/25/26 | | | | 4,000,000 | | | | 4,006,938 | |
FMC GMSR Issuer Trust, Series 2021-GT1, Class A (d) | | | 3.620 | % | | | 07/25/26 | | | | 9,000,000 | | | | 8,923,718 | |
FMC GMSR Issuer Trust, Series 2021-GT2, Class A (d) | | | 3.850 | % | | | 10/26/26 | | | | 11,500,000 | | | | 11,404,849 | |
Gold Key Resorts, LLC, Series 2014-A, Class A (d) | | | 3.220 | % | | | 03/17/31 | | | | 50,032 | | | | 50,420 | |
Helios Issuer, LLC, Series 2020-4, Class A (d) | | | 2.980 | % | | | 06/20/47 | | | | 1,722,742 | | | | 1,761,715 | |
Helios Issuer, LLC, Series 2021-A, Class A (d) | | | 1.800 | % | | | 02/20/48 | | | | 1,196,179 | | | | 1,176,930 | |
Hero Funding Trust, Series 2016-3B, Class B (d) | | | 5.240 | % | | | 09/20/42 | | | | 560,919 | | | | 560,802 | |
Hero Funding Trust, Series 2016-4B, Class B (d) | | | 4.990 | % | | | 09/20/47 | | | | 482,689 | | | | 488,498 | |
Holiday Inn Timeshare Trust, Series 2020-A, Class C (d) | | | 3.420 | % | | | 10/09/39 | | | | 1,415,333 | | | | 1,440,409 | |
| | Coupon | | | Maturity | | | Shares /
Par Value | | | Fair
Value | |
ABS-Other — 7.1% continued |
Holiday Inn Timeshare Trust, Series 2020-A, Class D (d) | | | 5.500 | % | | | 10/09/39 | | | $ | 658,294 | | | $ | 680,293 | |
Holiday Inn Timeshare Trust, Series 2020-A, Class E (d) | | | 6.500 | % | | | 10/09/39 | | | | 3,752,278 | | | | 3,845,246 | |
Loanpal Solar Loan Ltd., Series 2021-1GS, Class A (d) | | | 2.290 | % | | | 01/20/48 | | | | 3,029,554 | | | | 3,028,251 | |
Loanpal Solar Loan Ltd., Series 2021-2GS, Class A (d) | | | 2.220 | % | | | 03/20/48 | | | | 2,237,821 | | | | 2,219,149 | |
Mosaic Solar Loans, LLC, Series 2017-2, Class B (d) | | | 4.770 | % | | | 06/22/43 | | | | 523,836 | | | | 554,542 | |
Mosaic Solar Loans, LLC, Series 2020-1, Class A (d) | | | 2.100 | % | | | 04/20/46 | | | | 1,911,353 | | | | 1,916,607 | |
Mosaic Solar Loans, LLC, Series 2020-1A, Class B (d) | | | 3.100 | % | | | 04/20/46 | | | | 1,529,082 | | | | 1,576,961 | |
Mosaic Solar Loans, LLC, Series 2021-1, Class D (d) | | | 3.710 | % | | | 12/20/46 | | | | 895,000 | | | | 887,732 | |
MVW Own Trust, Series 2021-1WA, Class C (d) | | | 1.940 | % | | | 01/22/41 | | | | 2,767,061 | | | | 2,726,087 | |
NRZ Excess Spread Collateralization, Series 2021-GNT1, Class A (d) | | | 3.474 | % | | | 11/25/26 | | | | 12,465,475 | | | | 12,452,594 | |
OCWEN Master Advance Receivables Trust, Series 2020-T1, Class E-T1 (d) | | | 5.419 | % | | | 08/15/52 | | | | 2,000,000 | | | | 2,000,738 | |
PNMAC GMSR Issuer Trust, Series 2018-GT1, Class A (1* 1MO LIBOR + 285) (a)(d) | | | 2.952 | % | | | 02/25/23 | | | | 7,000,000 | | | | 7,017,670 | |
DIAMOND HILL FUNDS | ANNUAL REPORT | DECEMBER 31, 2021 | DIAMOND-HILL.COM 37 |
Diamond Hill Short Duration Securitized Bond Fund
Schedule of Investments (Continued)
December 31, 2021
| | Coupon | | | Maturity | | | Shares /
Par Value | | | Fair
Value | |
Securitized — 85.1% continued |
ABS-Other — 7.1% continued |
PNMAC GMSR Issuer Trust, Series 2018-GT2, Class NT (1* 1MO LIBOR + 265) (a)(d) | | | 2.742 | % | | | 08/25/23 | | | $ | 9,400,000 | | | $ | 9,410,097 | |
Renew Financial, LLC, Series 2017-1, Class A (d) | | | 3.670 | % | | | 09/20/52 | | | | 1,062,239 | | | | 1,093,832 | |
Renew Financial, LLC, Series 2017-1, Class B (d) | | | 5.750 | % | | | 09/20/52 | | | | 540,912 | | | | 547,606 | |
SPS Servicer Advance Receivables, Series 2020-T1, Class DT1 (d) | | | 2.370 | % | | | 11/15/52 | | | | 700,000 | | | | 699,692 | |
SPS Servicer Advance Receivables, Series 2020-T2, Class D (d) | | | 3.160 | % | | | 11/15/55 | | | | 3,000,000 | | | | 2,907,994 | |
TES, LLC, Series 2017-1, Class A (d) | | | 4.330 | % | | | 10/20/47 | | | | 4,260,880 | | | | 4,450,043 | |
TES, LLC, Series 2017-1, Class B (d) | | | 7.740 | % | | | 10/20/47 | | | | 2,000,000 | | | | 1,916,193 | |
Westgate Resorts, Series 2018-1, Class B (d) | | | 3.580 | % | | | 12/20/31 | | | | 442,509 | | | | 444,524 | |
Westgate Resorts, Series 2018-1, Class C (d) | | | 4.100 | % | | | 12/20/31 | | | | 1,055,988 | | | | 1,059,807 | |
Westgate Resorts, Series 2020-1, Class B (d) | | | 3.963 | % | | | 03/20/34 | | | | 3,552,927 | | | | 3,633,307 | |
Westgate Resorts, Series 2020-1A, Class C (d) | | | 6.213 | % | | | 03/20/34 | | | | 4,303,736 | | | | 4,487,513 | |
| | | | | | | | | | | | | | | | 106,697,094 | |
Agency MBS CMO — 1.4% |
FHLMC, Series 2979, Class FP (1* 1MO LIBOR + 45) (a) | | | 0.560 | % | | | 05/15/35 | | | | 341,647 | | | | 345,238 | |
FHLMC, Series 3121, Class FM (1* 1MO LIBOR + 40) (a) | | | 0.510 | % | | | 03/15/36 | | | | 332,587 | | | | 335,292 | |
| | Coupon | | | Maturity | | | Shares /
Par Value | | | Fair
Value | |
Agency MBS CMO — 1.4% continued |
FHLMC, Series 4613, Class AF (1* 1MO LIBOR + 110) (a) | | | 1.210 | % | | | 11/15/37 | | | $ | 622,612 | | | $ | 630,606 | |
FHLMC, Series 3925, Class FL (1* 1MO LIBOR + 45) (a) | | | 0.560 | % | | | 01/15/41 | | | | 118,436 | | | | 118,929 | |
FHLMC, Series 3895, Class BF (1* 1MO LIBOR + 50) (a) | | | 0.610 | % | | | 07/15/41 | | | | 256,974 | | | | 259,909 | |
FHLMC, Series 4314, Class PF (1* 1MO LIBOR + 40) (a) | | | 0.510 | % | | | 07/15/43 | | | | 137,059 | | | | 137,611 | |
FHLMC, Series 5171, Class UK | | | 2.000 | % | | | 12/25/51 | | | | 2,996,027 | | | | 2,941,752 | |
FNMA, Series 2006-56, Class DC (1* 1MO LIBOR + 65) (a) | | | 0.752 | % | | | 07/25/36 | | | | 680,934 | | | | 686,892 | |
FNMA, Series 2006-108, Class FD (1* 1MO LIBOR + 38) (a) | | | 0.482 | % | | | 11/25/36 | | | | 278,168 | | | | 281,737 | |
FNMA, Series 2010-136, Class FA (1* 1MO LIBOR + 50) (a) | | | 0.602 | % | | | 12/25/40 | | | | 262,054 | | | | 266,008 | |
FNMA, Series 2011-86, Class KF (1* 1MO LIBOR + 55) (a) | | | 0.652 | % | | | 09/25/41 | | | | 444,307 | | | | 452,287 | |
FNMA, Series 2011-127, Class ZU | | | 3.500 | % | | | 12/25/41 | | | | 6,213,817 | | | | 6,538,285 | |
FNMA, Series 2012-9, Class FC (1* 1MO LIBOR + 40) (a) | | | 0.502 | % | | | 02/25/42 | | | | 190,632 | | | | 192,656 | |
FNMA, Series 2012-33, Class F (1* 1MO LIBOR + 52) (a) | | | 0.622 | % | | | 04/25/42 | | | | 148,486 | | | | 150,219 | |
FNMA, Series 2013-34, Class GP | | | 3.000 | % | | | 05/25/42 | | | | 3,271,368 | | | | 3,322,747 | |
FNMA, Series 2017-28, Class LK | | | 4.000 | % | | | 03/25/53 | | | | 2,116,243 | | | | 2,179,685 | |
GNMA, Series 2007-18, Class FD (1* 1MO LIBOR + 30) (a) | | | 0.404 | % | | | 04/20/37 | | | | 401,474 | | | | 402,081 | |
38 DIAMOND HILL FUNDS | ANNUAL REPORT | DECEMBER 31, 2021 | DIAMOND-HILL.COM |
Diamond Hill Short Duration Securitized Bond Fund
Schedule of Investments (Continued)
December 31, 2021
| | Coupon | | | Maturity | | | Shares /
Par Value | | | Fair
Value | |
Securitized — 85.1% continued |
Agency MBS CMO — 1.4% continued |
GNMA, Series 2008-16, Class FC (1* 1MO LIBOR + 50) (a) | | | 0.604 | % | | | 02/20/38 | | | $ | 324,151 | | | $ | 325,936 | |
GNMA, Series 2012-149, Class GF (1* 1MO LIBOR + 30) (a) | | | 0.404 | % | | | 12/20/42 | | | | 162,485 | | | | 163,064 | |
GNMA, Series 2012-H29, Class SA (1* 1MO LIBOR + 52) (a) | | | 0.596 | % | | | 10/20/62 | | | | 560,623 | | | | 562,503 | |
GNMA, Series 2012-H23, Class SA (1* 1MO LIBOR + 53) (a) | | | 0.611 | % | | | 10/20/62 | | | | 635,890 | | | | 643,853 | |
GNMA, Series 2016-H11, Class FD (1* 12MO LIBOR + 40) (a) | | | 0.681 | % | | | 05/20/66 | | | | 96,301 | | | | 95,860 | |
GNMA, Series 2017-H11, Class FP (1* 1MO LIBOR + 22) (a) | | | 0.301 | % | | | 04/20/67 | | | | 58,010 | | | | 57,944 | |
| | | | | | | | | | | | | | | | 21,091,094 | |
Agency MBS CMO Derivatives — 0.2% |
FHLMC, Series 3946, Class SB (IO) (-1* 1MO LIBOR + 675) (a) | | | 6.640 | % | | | 10/15/26 | | | | 131,196 | | | | 11,639 | |
FHLMC, Series 237, Class S14 (IO) (-1* 1MO LIBOR + 660) (a) | | | 6.490 | % | | | 05/15/36 | | | | 587,259 | | | | 134,267 | |
FNMA, Series 2011-75, Class MI (IO) | | | 3.500 | % | | | 08/25/26 | | | | 240,262 | | | | 8,668 | |
FNMA, Series 2012-148, Class IA (IO) | | | 4.000 | % | | | 01/25/28 | | | | 2,359,775 | | | | 175,467 | |
FNMA, Series 301, Class I (PO) | | | 0.000 | % | | | 04/25/29 | | | | 242,077 | | | | 230,542 | |
FNMA, Series 348, Class II (IO) | | | 6.000 | % | | | 01/25/34 | | | | 618,817 | | | | 122,854 | |
FNMA, Series 2010-44, Class CS (IO) (-1* 1MO LIBOR + 655) (a) | | | 6.448 | % | | | 05/25/40 | | | | 395,214 | | | | 66,407 | |
FNMA, Series 2011-14, Class PI (IO) | | | 5.000 | % | | | 06/25/40 | | | | 33,648 | | | | 241 | |
| | Coupon | | | Maturity | | | Shares /
Par Value | | | Fair
Value | |
Agency MBS CMO Derivatives — 0.2% continued |
FNMA, Series 3998, Class NS (IO) (-1* 1MO LIBOR + 660) (a) | | | 6.490 | % | | | 09/15/40 | | | $ | 1,499,619 | | | $ | 51,900 | |
FNMA, Series 2014-45, Class IO (IO) | | | 4.000 | % | | | 08/25/44 | | | | 464,961 | | | | 51,997 | |
GNMA, Series 2011-145, Class QI (IO) | | | 5.000 | % | | | 11/16/41 | | | | 981,770 | | | | 146,768 | |
GNMA, Series 2015-16, Class IL (IO) | | | 4.000 | % | | | 03/20/42 | | | | 2,437,921 | | | | 120,513 | |
GNMA, Series 2014-141, Class IE (IO) | | | 4.000 | % | | | 08/20/43 | | | | 1,057,204 | | | | 19,910 | |
GNMA, Series 2010-H01, Class CI (IO) (a) | | | 2.068 | % | | | 01/20/60 | | | | 434,975 | | | | 47,852 | |
GNMA, Series 2012-H02, Class AI (IO) (a) | | | 1.885 | % | | | 01/20/62 | | | | 507,121 | | | | 24,433 | |
GNMA, Series 2013-H13, Class T1 (IO) (a) | | | 0.466 | % | | | 05/20/63 | | | | 27,243,566 | | | | 262,053 | |
GNMA, Series 2016-H20, Class GI (IO) (a) | | | 0.346 | % | | | 08/20/66 | | | | 24,268,180 | | | | 242,968 | |
GNMA, Series 2017-H11, Class PI (IO) (a) | | | 3.978 | % | | | 04/20/67 | | | | 313,721 | | | | 6,788 | |
GNMA, Series 2017-H22, Class ID (IO) (a) | | | 4.210 | % | | | 11/20/67 | | | | 155,525 | | | | 11,072 | |
GNMA, Series 2018-H08, Class NI (IO) (a) | | | 0.830 | % | | | 05/20/68 | | | | 13,963,622 | | | | 301,959 | |
GNMA, Series 2019-H04, Class IO (IO) (a) | | | 1.537 | % | | | 03/20/69 | | | | 20,885,889 | | | | 671,857 | |
| | | | | | | | | | | | | | | | 2,710,155 | |
Agency MBS Passthrough — 0.0% (c) |
FHLMC, Pool #FG G60257 | | | 5.500 | % | | | 06/01/41 | | | | 496,265 | | | | 568,105 | |
| |
Auto Loan — 8.6% |
ACC Auto Trust, Series 2021-A, Class A (d) | | | 1.080 | % | | | 04/15/27 | | | | 1,871,668 | | | | 1,866,864 | |
ACC Trust, Series 2021-1, Class B (d) | | | 1.430 | % | | | 07/22/24 | | | | 4,750,000 | | | | 4,730,534 | |
DIAMOND HILL FUNDS | ANNUAL REPORT | DECEMBER 31, 2021 | DIAMOND-HILL.COM 39 |
Diamond Hill Short Duration Securitized Bond Fund
Schedule of Investments (Continued)
December 31, 2021
| | Coupon | | | Maturity | | | Shares /
Par Value | | | Fair
Value | |
Securitized — 85.1% continued |
Auto Loan — 8.6% continued |
American Credit Acceptance Receivables Trust, Series 2020-3, Class F (d) | | | 5.940 | % | | | 06/14/27 | | | $ | 6,750,000 | | | $ | 7,109,826 | |
American Credit Acceptance Receivables Trust, Series 2020-4, Class F (d) | | | 5.220 | % | | | 08/13/27 | | | | 2,800,000 | | | | 2,880,810 | |
Arivo Acceptance Auto Loan Receivables Trust, Series 2021-1A, Class A (d) | | | 1.190 | % | | | 01/15/27 | | | | 5,711,110 | | | | 5,691,601 | |
Arivo Acceptance Auto Loan Receivables Trust, Series 2021-1A, Class B (d) | | | 2.020 | % | | | 02/16/27 | | | | 2,223,000 | | | | 2,208,082 | |
Avid Automobile Receivables Trust, Series 2019-1, Class E (d) | | | 6.760 | % | | | 05/17/27 | | | | 2,500,000 | | | | 2,578,463 | |
CarNow Auto Receivables Trust, Series 2021-1A, Class B (d) | | | 1.380 | % | | | 02/17/26 | | | | 1,000,000 | | | | 998,989 | |
CarNow Auto Receivables Trust, Series 2021-1A, Class C (d) | | | 2.160 | % | | | 02/17/26 | | | | 2,000,000 | | | | 1,994,756 | |
CarNow Auto Receivables Trust, Series 2021-1A, Class D (d) | | | 3.640 | % | | | 02/17/26 | | | | 2,250,000 | | | | 2,233,850 | |
CarNow Auto Receivables Trust, Series 2021-1A, Class E (d) | | | 5.120 | % | | | 07/15/27 | | | | 2,500,000 | | | | 2,482,959 | |
Chase Credit Linked Notes, Series 2020-1, Class D (d) | | | 1.886 | % | | | 01/25/28 | | | | 1,039,390 | | | | 1,043,816 | |
| | Coupon | | | Maturity | | | Shares /
Par Value | | | Fair
Value | |
Auto Loan — 8.6% continued |
Chase Credit Linked Notes, Series 2021-3, Class D (d) | | | 1.009 | % | | | 02/26/29 | | | $ | 2,572,467 | | | $ | 2,551,094 | |
Chase Credit Linked Notes, Series 2021-3, Class E (d) | | | 2.102 | % | | | 02/26/29 | | | | 2,143,723 | | | | 2,130,449 | |
CIG Auto Receivables Trust, Series 2020-1, Class D (d) | | | 2.350 | % | | | 01/12/26 | | | | 2,400,000 | | | | 2,410,220 | |
CIG Auto Receivables Trust, Series 2019-1, Class D (d) | | | 4.850 | % | | | 05/15/26 | | | | 2,120,000 | | | | 2,149,495 | |
CPS Auto Receivables Trust, Series 2018-C, Class D (d) | | | 4.400 | % | | | 06/17/24 | | | | 641,519 | | | | 649,564 | |
CPS Auto Receivables Trust, Series 2020-B, Class D (d) | | | 4.750 | % | | | 04/15/26 | | | | 5,000,000 | | | | 5,178,661 | |
Credit Acceptance Auto Loan Trust, Series 2020-2, Class C (d) | | | 2.730 | % | | | 11/15/29 | | | | 3,000,000 | | | | 3,059,203 | |
Credit Acceptance Auto Loan Trust, Series 2020-3A, Class C (d) | | | 2.280 | % | | | 02/15/30 | | | | 2,500,000 | | | | 2,521,974 | |
Credito RL USA, Series 2021-1, Class A (d) | | | 1.350 | % | | | 02/16/27 | | | | 3,874,728 | | | | 3,866,692 | |
FHF Trust, Series 2020-1, Class A (d) | | | 2.590 | % | | | 12/15/23 | | | | 913,280 | | | | 917,372 | |
FHF Trust, Series 2020-1, Class B (d) | | | 3.100 | % | | | 09/15/25 | | | | 4,500,000 | | | | 4,564,307 | |
FHF Trust, Series 2021-1, Class A (d) | | | 1.270 | % | | | 03/15/27 | | | | 2,148,252 | | | | 2,134,394 | |
First Help Financial, LLC, Series 2021-2A, Class A (d) | | | 0.830 | % | | | 12/15/26 | | | | 6,536,559 | | | | 6,490,896 | |
40 DIAMOND HILL FUNDS | ANNUAL REPORT | DECEMBER 31, 2021 | DIAMOND-HILL.COM |
Diamond Hill Short Duration Securitized Bond Fund
Schedule of Investments (Continued)
December 31, 2021
| | Coupon | | | Maturity | | | Shares /
Par Value | | | Fair
Value | |
Securitized — 85.1% continued |
Auto Loan — 8.6% continued |
First Help Financial, LLC, Series 2021-2A, Class B (d) | | | 1.630 | % | | | 09/15/27 | | | $ | 6,500,000 | | | $ | 6,390,786 | |
Foursight Capital Automobile Receivables, Series 2020-1, Class C (d) | | | 2.410 | % | | | 08/15/25 | | | | 4,400,000 | | | | 4,443,514 | |
GLS Auto Receivables Trust, Series 2021-1A, Class D (d) | | | 1.680 | % | | | 01/15/27 | | | | 5,000,000 | | | | 4,968,878 | |
Hertz Vehicle Finance, Series 2021-2, Class D (d) | | | 4.340 | % | | | 12/25/27 | | | | 5,000,000 | | | | 4,987,186 | |
JPMorgan Chase Bank, NA, Series 2021-2, Class D (d) | | | 1.138 | % | | | 12/26/28 | | | | 2,063,968 | | | | 2,055,456 | |
JPMorgan Chase Bank, NA, Series 2021-2, Class E (d) | | | 2.280 | % | | | 12/26/28 | | | | 1,719,974 | | | | 1,712,928 | |
OneMain Direct Auto Receivables, Series 2019-1, Class D (d) | | | 4.680 | % | | | 04/14/31 | | | | 5,500,000 | | | | 5,920,691 | |
Santander Consumer Auto Receivables, Series 2020-B, Class D (d) | | | 2.140 | % | | | 12/15/26 | | | | 2,000,000 | | | | 2,017,262 | |
Skopos Auto Receivables Trust, Series 2018-1, Class C (d) | | | 4.770 | % | | | 04/17/23 | | | | 127,109 | | | | 127,281 | |
Tesla Auto Lease Trust, Series 2021-B, Class D (d) | | | 1.320 | % | | | 09/22/25 | | | | 9,500,000 | | | | 9,340,764 | |
Veros Auto Receivables Trust, Series 2020-1, Class A (d) | | | 1.670 | % | | | 09/15/23 | | | | 170,369 | | | | 170,440 | |
| | Coupon | | | Maturity | | | Shares /
Par Value | | | Fair
Value | |
Auto Loan — 8.6% continued |
Veros Auto Receivables Trust, Series 2020-1, Class B (d) | | | 2.190 | % | | | 06/16/25 | | | $ | 2,500,000 | | | $ | 2,510,526 | |
Veros Auto Receivables Trust, Series 2021-1, Class B (d) | | | 1.490 | % | | | 10/15/26 | | | | 4,500,000 | | | | 4,457,519 | |
Veros Auto Receivables Trust, Series 2021-1, Class C (d) | | | 3.640 | % | | | 08/15/28 | | | | 5,000,000 | | | | 4,971,676 | |
| | | | | | | | | | | | | | | | 128,519,778 | |
CRE/CLO — 9.9% |
A10 Securitization, Series 2020-C, Class A (d)(e) | | | 2.033 | % | | | 08/15/40 | | | | 697,859 | | | | 698,934 | |
A10 Securitization, Series 2020-C, Class B (d)(e) | | | 2.617 | % | | | 08/15/40 | | | | 2,100,000 | | | | 2,088,954 | |
A10 Securitization, Series 2020-C, Class C (d)(e) | | | 3.363 | % | | | 08/15/40 | | | | 2,800,000 | | | | 2,759,128 | |
A10 Securitization, Series 2020-C, Class D (d)(e) | | | 4.129 | % | | | 08/15/40 | | | | 1,950,000 | | | | 1,942,565 | |
A10 Securitization, Series 2020-C, Class E (d)(e) | | | 5.465 | % | | | 08/15/40 | | | | 1,050,000 | | | | 1,048,906 | |
Acre Mortgage Trust, Series 2021-FL1, Class B (d) | | | 1.904 | % | | | 10/18/36 | | | | 3,800,000 | | | | 3,799,996 | |
Acre Mortgage Trust, Series 2021-FL4, Class D (1* 1MO LIBOR + 260) (a)(d) | | | 2.689 | % | | | 12/15/37 | | | | 6,000,000 | | | | 5,985,744 | |
Acre Mortgage Trust, Series 2021-FL4, Class E (1* 1MO LIBOR + 310) (a)(d) | | | 3.189 | % | | | 12/15/37 | | | | 2,000,000 | | | | 1,995,236 | |
DIAMOND HILL FUNDS | ANNUAL REPORT | DECEMBER 31, 2021 | DIAMOND-HILL.COM 41 |
Diamond Hill Short Duration Securitized Bond Fund
Schedule of Investments (Continued)
December 31, 2021
| | Coupon | | | Maturity | | | Shares /
Par Value | | | Fair
Value | |
Securitized — 85.1% continued |
CRE/CLO — 9.9% continued |
Bancorp Commercial Mortgage Trust (The), Series 2017-CRE2, Class C (1* 1MO LIBOR + 235) (a)(d) | | | 2.460 | % | | | 08/15/32 | | | $ | 2,185,267 | | | $ | 2,163,446 | |
Bancorp Commercial Mortgage Trust (The), Series 2018-CR3, Class D (1* 1MO LIBOR + 270) (a)(d) | | | 2.810 | % | | | 03/16/35 | | | | 4,075,424 | | | | 4,055,861 | |
Bancorp Commercial Mortgage Trust (The), Series 2017-CRE2, Class D (1* 1MO LIBOR + 375) (a)(d) | | | 3.860 | % | | | 08/17/32 | | | | 2,000,000 | | | | 1,794,910 | |
BDS Ltd., Series 2021-FL8, Class D (d) | | | 1.989 | % | | | 01/18/36 | | | | 2,750,000 | | | | 2,730,106 | |
BDS Ltd., Series 2021-FL8, Class E (d) | | | 2.339 | % | | | 01/18/36 | | | | 1,750,000 | | | | 1,733,410 | |
Benefit Street Partners Realty Trust, Inc., Series 2018-FL4, Class D (d) | | | 2.860 | % | | | 09/17/35 | | | | 3,500,000 | | | | 3,492,401 | |
BXMT Ltd., Series 2020-FL2, Class D (1* 1MO LIBOR + 195) (a)(d) | | | 2.114 | % | | | 02/16/37 | | | | 3,725,000 | | | | 3,707,541 | |
BXMT Ltd., Series 2020-FL2, Class E (1* 1MO LIBOR + 205) (a)(d) | | | 2.214 | % | | | 02/16/37 | | | | 3,500,000 | | | | 3,430,000 | |
BXMT Ltd., Series 2020-FL2, Class B (1* 1MO LIBOR + 140) (a)(d) | | | 1.564 | % | | | 02/18/38 | | | | 3,650,000 | | | | 3,637,451 | |
| | Coupon | | | Maturity | | | Shares /
Par Value | | | Fair
Value | |
CRE/CLO — 9.9% continued |
BXMT Ltd., Series 2021-FL4, Class A (1* 1MO LIBOR + 105) (a)(d) | | | 1.160 | % | | | 05/17/38 | | | $ | 8,250,000 | | | $ | 8,234,531 | |
BXMT Ltd., Series 2021-FL4, Class D (1* 1MO LIBOR + 225) (a)(d) | | | 2.360 | % | | | 05/17/38 | | | | 8,250,000 | | | | 8,193,281 | |
Exantas Capital Corp., Series 2020-RS09, Class D (1* 1MO LIBOR + 550) (a)(d) | | | 5.664 | % | | | 04/17/37 | | | | 7,059,000 | | | | 7,165,554 | |
HGI CRE CLO Ltd., Series 2021-FL2, Class B (d) | | | 1.589 | % | | | 09/19/26 | | | | 3,000,000 | | | | 2,987,070 | |
HGI CRE CLO Ltd., Series 2021-FL1, Class AS (1* 1MO LIBOR + 140) (a)(d) | | | 1.508 | % | | | 06/16/36 | | | | 2,750,000 | | | | 2,732,488 | |
KKR Financial Management, Series 2021-FL2, Class A (d) | | | 1.179 | % | | | 02/15/39 | | | | 4,000,000 | | | | 3,992,668 | |
LoanCore Issuer Ltd., Series 2019-CRE3, Class D (d) | | | 2.610 | % | | | 05/15/36 | | | | 7,200,000 | | | | 7,069,644 | |
MF1 Ltd., Series 2020-FL3, Class B (1* 1MO LIBOR + 375) (a)(d) | | | 3.914 | % | | | 07/15/35 | | | | 5,100,000 | | | | 5,171,028 | |
MF1 Ltd., Series 2020-FL3, Class C (1* 1MO LIBOR + 450) (a)(d) | | | 4.664 | % | | | 07/15/35 | | | | 1,000,000 | | | | 1,008,025 | |
MF1 Ltd., Series 2020-FL3, Class A-S (1* 1MO LIBOR + 285) (a)(d) | | | 3.014 | % | | | 07/16/35 | | | | 1,500,000 | | | | 1,519,119 | |
MF1 Multifamily Housing Mortgage, Series 2020-FL4, Class D (d) | | | 4.264 | % | | | 11/15/35 | | | | 10,500,000 | | | | 10,631,686 | |
42 DIAMOND HILL FUNDS | ANNUAL REPORT | DECEMBER 31, 2021 | DIAMOND-HILL.COM |
Diamond Hill Short Duration Securitized Bond Fund
Schedule of Investments (Continued)
December 31, 2021
| | Coupon | | | Maturity | | | Shares /
Par Value | | | Fair
Value | |
Securitized — 85.1% continued |
CRE/CLO — 9.9% continued |
Multi Family Housing Mortgage Loan, Series 2020-FL4, Class A (1* 1MO LIBOR + 170) (a)(d) | | | 1.864 | % | | | 11/15/35 | | | $ | 4,000,000 | | | $ | 4,015,784 | |
PFP III, Series 2021-7, Class D (1* 1MO LIBOR + 240) (a)(d) | | | 2.508 | % | | | 04/14/38 | | | | 1,749,913 | | | | 1,745,692 | |
PFP Ltd., Series 2019-5, Class B (1* 1MO LIBOR + 165) (a)(d) | | | 1.757 | % | | | 04/16/36 | | | | 2,150,000 | | | | 2,145,016 | |
ReadyCap Commercial Mortgage Trust, Series 2020-FL4, Class A (1* 1MO LIBOR + 215) (a)(d) | | | 2.252 | % | | | 02/25/35 | | | | 6,051,411 | | | | 6,088,330 | |
ReadyCap Commercial Mortgage Trust, Series 2020-FL4, Class B (1* 1MO LIBOR + 385) (a)(d) | | | 3.952 | % | | | 02/25/35 | | | | 4,000,000 | | | | 4,040,608 | |
ReadyCap Commercial Mortgage Trust, Series 2020-FL4, Class C (1* 1MO LIBOR + 475) (a)(d) | | | 4.852 | % | | | 02/25/35 | | | | 4,000,000 | | | | 4,044,837 | |
ReadyCap Commercial Mortgage Trust, Series 2021-1A, Class C (d) | | | 2.000 | % | | | 07/25/36 | | | | 1,800,000 | | | | 1,779,925 | |
ReadyCap Commercial Mortgage Trust, Series 2021-1A, Class (d) | | | 2.500 | % | | | 07/25/36 | | | | 7,545,000 | | | | 7,441,256 | |
ReadyCap Commercial Mortgage Trust, Series 2021-1A, Class A (d) | | | 3.000 | % | | | 07/25/36 | | | | 3,500,000 | | | | 3,499,997 | |
| | Coupon | | | Maturity | | | Shares /
Par Value | | | Fair
Value | |
CRE/CLO — 9.9% continued |
ReadyCap Commercial Mortgage Trust (d) | | | 3.030 | % | | | 11/25/36 | | | $ | 3,450,000 | | | $ | 3,443,583 | |
Shelter Growth Capital Partners, LLC, Series 2021-FL3, Class C (d) | | | 2.260 | % | | | 09/15/36 | | | | 3,800,000 | | | | 3,799,996 | |
| | | | | | | | | | | | | | | | 147,814,707 | |
Credit Cards — 7.3% |
Brex, Inc., Series 2021-1, Class A (d) | | | 2.090 | % | | | 07/17/24 | | | | 8,300,000 | | | | 8,328,487 | |
Continental Credit Card, LLC, Series 2017-1, Class B (d) | | | 6.410 | % | | | 01/15/25 | | | | 701,358 | | | | 705,603 | |
Continental Credit Card, LLC, Series 2019-1, Class A (d) | | | 3.830 | % | | | 08/15/26 | | | | 11,576,728 | | | | 11,761,841 | |
Continental Credit Card, LLC, Series 2019-1, Class B (d) | | | 4.950 | % | | | 08/15/26 | | | | 7,450,000 | | | | 7,693,555 | |
Continental Credit Card, LLC, Series 2019-1, Class C (d) | | | 6.160 | % | | | 08/15/26 | | | | 3,000,000 | | | | 3,083,630 | |
Continental Credit Card, LLC, Series 2020-A, Class A (d) | | | 2.240 | % | | | 12/15/28 | | | | 3,600,000 | | | | 3,582,439 | |
Continental Credit Card, LLC, Series 2020-A, Class B (d) | | | 3.660 | % | | | 12/15/28 | | | | 6,800,000 | | | | 6,772,351 | |
Continental Credit Card, LLC, Series 2021-A, Class B (d) | | | 3.490 | % | | | 12/17/29 | | | | 6,700,000 | | | | 6,693,599 | |
Continental Credit Card, LLC, Series 2021-A, Class C (d) | | | 4.020 | % | | | 12/17/29 | | | | 6,900,000 | | | | 6,896,902 | |
Continental Credit Card, LLC, Series 2021-A, Class D (d) | | | 6.010 | % | | | 12/17/29 | | | | 16,210,000 | | | | 16,206,153 | |
DIAMOND HILL FUNDS | ANNUAL REPORT | DECEMBER 31, 2021 | DIAMOND-HILL.COM 43 |
Diamond Hill Short Duration Securitized Bond Fund
Schedule of Investments (Continued)
December 31, 2021
| | Coupon | | | Maturity | | | Shares /
Par Value | | | Fair
Value | |
Securitized — 85.1% continued |
Credit Cards — 7.3% continued |
Genesis Private Label Amortization Trust, Series 2020-1, Class D (d) | | | 6.630 | % | | | 07/20/26 | | | $ | 9,500,000 | | | $ | 9,667,581 | |
Genesis Private Label Amortization Trust, Series 2020-1, Class C (d) | | | 4.190 | % | | | 07/20/30 | | | | 1,680,000 | | | | 1,682,520 | |
Genesis Private Label Amortization Trust, Series 2020-1, Class E (d) | | | 9.760 | % | | | 07/20/30 | | | | 2,625,000 | | | | 2,659,523 | |
Genesis Sales Finance Master Trust, Series 2020-AA, Class B (d) | | | 2.240 | % | | | 09/22/25 | | | | 2,500,000 | | | | 2,504,996 | |
Genesis Sales Finance Master Trust, Series 2020-AA, Class C (d) | | | 2.990 | % | | | 09/22/25 | | | | 1,000,000 | | | | 1,002,041 | |
Genesis Sales Finance Master Trust, Series 2021-AA, Class D (d) | | | 2.090 | % | | | 12/21/26 | | | | 2,350,000 | | | | 2,318,738 | |
Genesis Sales Finance Master Trust, Series 2021-AA, Class E (d) | | | 3.770 | % | | | 12/21/26 | | | | 6,000,000 | | | | 5,922,013 | |
Genesis Sales Finance Master Trust, Series 2021-AA, Class F (d) | | | 5.590 | % | | | 12/21/26 | | | | 4,000,000 | | | | 3,949,686 | |
Mercury Financial Credit Card, Series 2021-1A, Class B (d) | | | 2.330 | % | | | 03/20/26 | | | | 3,700,000 | | | | 3,668,742 | |
Mercury Financial Credit Card, Series 2021-1A, Class D (d) | | | 6.260 | % | | | 03/20/26 | | | | 4,000,000 | | | | 3,996,710 | |
| | | | | | | | | | | | | | | | 109,097,110 | |
| | Coupon | | | Maturity | | | Shares /
Par Value | | | Fair
Value | |
Equipment — 2.2% |
Business Jet Securities, LLC, Series 2019-1, Class B (d) | | | 5.193 | % | | | 07/15/34 | | | $ | 1,753,318 | | | $ | 1,760,303 | |
Business Jet Securities, LLC, Series 2019-1, Class C, Pool #2019-1 (d) | | | 6.948 | % | | | 07/15/34 | | | | 2,885,183 | | | | 2,930,222 | |
Business Jet Securities, LLC, Series 2020-1, Class B (d) | | | 3.967 | % | | | 11/15/35 | | | | 985,636 | | | | 989,287 | |
Business Jet Securities, LLC, Series 2020-1, Class C (d) | | | 7.142 | % | | | 11/15/35 | | | | 1,946,041 | | | | 1,987,848 | |
Business Jet Securities, LLC, Series 2021-1A, Class B (d) | | | 2.918 | % | | | 04/15/36 | | | | 1,299,373 | | | | 1,272,507 | |
Business Jet Securities, LLC, Series 2021-1A, Class C (d) | | | 5.067 | % | | | 04/15/36 | | | | 2,397,652 | | | | 2,373,296 | |
CCG Receivables Trust, Series 2018-2, Class C (d) | | | 3.870 | % | | | 12/15/25 | | | | 2,395,000 | | | | 2,403,313 | |
Encina Equipment Finance, Series 2021-1A, Class E (d) | | | 4.360 | % | | | 03/15/29 | | | | 1,340,000 | | | | 1,348,247 | |
HPEFS Equipment Trust, Series 2021-2A, Class D (d) | | | 1.290 | % | | | 03/20/29 | | | | 3,750,000 | | | | 3,693,523 | |
Octane Receivables Trust, Series 2019-1, Class A (d) | | | 3.160 | % | | | 09/20/23 | | | | 424,300 | | | | 426,370 | |
Octane Receivables Trust, Series 2020-1, Class C (d) | | | 2.890 | % | | | 03/20/26 | | | | 4,750,000 | | | | 4,809,660 | |
Octane Receivables Trust, Series 2021-1A, Class C (d) | | | 2.230 | % | | | 11/20/28 | | | | 1,800,000 | | | | 1,782,489 | |
44 DIAMOND HILL FUNDS | ANNUAL REPORT | DECEMBER 31, 2021 | DIAMOND-HILL.COM |
Diamond Hill Short Duration Securitized Bond Fund
Schedule of Investments (Continued)
December 31, 2021
| | Coupon | | | Maturity | | | Shares /
Par Value | | | Fair
Value | |
Securitized — 85.1% continued |
Equipment — 2.2% continued |
Stellar Jay Ireland Dac, Series 2021-1, Class B (d)(e) | | | 5.926 | % | | | 03/15/28 | | | $ | 7,730,994 | | | $ | 7,649,633 | |
| | | | | | | | | | | | | | | | 33,426,698 | |
HECM — 2.3% |
Brean ABS Trust, Series 2021-RM2, Class A (d) | | | 1.750 | % | | | 10/25/61 | | | | 9,932,603 | | | | 9,594,340 | |
Cascade Funding Mortgage Trust, Series 2021-HB7, Class M3 (d) | | | 3.849 | % | | | 10/27/31 | | | | 3,000,000 | | | | 2,979,537 | |
Finance of America HECM, Series 2020-HB2, Class A (d) | | | 1.710 | % | | | 07/25/30 | | | | 4,738,171 | | | | 4,744,268 | |
Finance of America HECM, Series 2021-HB1, Class M3 (d) | | | 3.640 | % | | | 02/25/31 | | | | 2,000,000 | | | | 1,981,717 | |
RMF Buyout Issuance Trust, Series 2021-HB1, Class M3 (d) | | | 3.690 | % | | | 11/25/31 | | | | 3,000,000 | | | | 2,993,779 | |
RMF Buyout Issuance Trust, Series 2021-HB1, Class M4 (d) | | | 4.704 | % | | | 11/25/31 | | | | 5,000,000 | | | | 4,990,061 | |
RMF Proprietary Issuance Trust, Series 2021-2, Class A (d) | | | 2.125 | % | | | 09/25/61 | | | | 5,203,229 | | | | 5,120,103 | |
RMF Proprietary Issuance Trust, Series 2021-2, Class A (d)(e) | | | 2.125 | % | | | 09/25/61 | | | | 2,512,861 | | | | 2,083,998 | |
| | | | | | | | | | | | | | | | 34,487,803 | |
Hospitality — 3.9% |
BHMS Mortgage Trust, Series 2018-ATLS, Class A (1* 1MO LIBOR + 125) (a)(d) | | | 1.360 | % | | | 07/16/35 | | | | 4,400,000 | | | | 4,397,176 | |
BX Trust, Series 2018-GW, Class C (d) | | | 1.330 | % | | | 05/15/37 | | | | 2,500,000 | | | | 2,487,419 | |
| | Coupon | | | Maturity | | | Shares /
Par Value | | | Fair
Value | |
Hospitality — 3.9% continued |
BX Trust, Series 2018-GW, Class E (1* 1MO LIBOR+ 197) (a)(d) | | | 2.080 | % | | | 05/15/37 | | | $ | 5,000,000 | | | $ | 4,952,915 | |
Champlain Housing Mortgage Trust, Series 2017-COSMO, Class B (1* 1MO LIBOR + 140) (a)(d) | | | 1.510 | % | | | 11/17/36 | | | | 3,600,000 | | | | 3,597,789 | |
Cosmopolitan Hotel Trust, Series 2017-COSMO, Class D (1* 1MO LIBOR + 225) (a)(d) | | | 2.360 | % | | | 11/15/36 | | | | 4,900,000 | | | | 4,896,993 | |
Cosmopolitan Hotel Trust, Series 2017-COSMO, Class A (1* 1MO LIBOR + 93) (a)(d) | | | 1.040 | % | | | 11/17/36 | | | | 4,000,000 | | | | 3,997,544 | |
Extended Stay America Trust, Series 2021-ESH, Class E (1* 1MO LIBOR + 285) (a)(d) | | | 2.960 | % | | | 07/15/38 | | | | 4,576,193 | | | | 4,576,185 | |
Extended Stay America Trust, Series 2021-ESH, Class F (1* 1MO LIBOR + 370) (a)(d) | | | 3.810 | % | | | 07/15/38 | | | | 11,152,978 | | | | 11,152,993 | |
Fontainebleau Miami Beach, Series 2019-FBLU, Class C (d) | | | 3.750 | % | | | 12/12/36 | | | | 2,000,000 | | | | 2,040,897 | |
Goldman Sachs Mortgage Securities Corp. Trust, Series 2018-HULA, Class B (1* 1MO LIBOR + 125) (a)(d) | | | 1.360 | % | | | 07/16/35 | | | | 4,615,249 | | | | 4,597,815 | |
Hawaii Hotel Trust, Series 2019-MAUI, Class A (1* 1MO LIBOR + 115) (a)(d) | | | 1.260 | % | | | 05/17/38 | | | | 2,245,000 | | | | 2,243,615 | |
DIAMOND HILL FUNDS | ANNUAL REPORT | DECEMBER 31, 2021 | DIAMOND-HILL.COM 45 |
Diamond Hill Short Duration Securitized Bond Fund
Schedule of Investments (Continued)
December 31, 2021
| | Coupon | | | Maturity | | | Shares /
Par Value | | | Fair
Value | |
Securitized — 85.1% continued |
Hospitality — 3.9% continued |
Motel 6 Trust, Series 2021-MTL6, Class D (d) | | | 2.210 | % | | | 09/15/38 | | | $ | 1,500,000 | | | $ | 1,499,548 | |
Motel 6 Trust, Series 2021-MTL6, Class E (d) | | | 2.810 | % | | | 09/15/38 | | | | 2,800,000 | | | | 2,799,154 | |
Motel 6 Trust, Series 2021-MTL6, Class F (d) | | | 3.660 | % | | | 09/15/38 | | | | 2,850,000 | | | | 2,849,138 | |
Motel 6 Trust, Series 2021-MTL6, Class G (d) | | | 4.810 | % | | | 09/15/38 | | | | 3,000,000 | | | | 2,999,091 | |
| | | | | | | | | | | | | | | | 59,088,272 | |
Industrial — 2.3% |
BX Commercial Mortgage Trust, Series 2020-FOX, Class D (1* 1MO LIBOR + 210) (a)(d) | | | 2.210 | % | | | 11/15/32 | | | | 2,528,411 | | | | 2,527,651 | |
BX Trust, Series 2021-VOLT, Class D (d) | | | 1.760 | % | | | 09/15/23 | | | | 14,500,000 | | | | 14,371,935 | |
Cold Storage Trust, Series 2020-ICE5, Class F (1* 1MO LIBOR + 349) (a)(d) | | | 3.602 | % | | | 11/15/37 | | | | 4,914,953 | | | | 4,908,304 | |
Cold Storage Trust, Series 2020-ICE5, Class E (1* 1MO LIBOR + 277) (a)(d) | | | 2.875 | % | | | 11/16/37 | | | | 2,457,476 | | | | 2,448,102 | |
Credit Suisse First Boston, Series 2020-UNFI, Class A (d) | | | 4.168 | % | | | 12/06/22 | | | | 10,400,000 | | | | 10,411,099 | |
| | | | | | | | | | | | | | | | 34,667,091 | |
Manufactured Housing — 0.1% |
Cascade Funding Mortgage Trust, Series 2019-MH1, Class M (d) | | | 5.985 | % | | | 11/25/44 | | | | 1,100,000 | | | | 1,133,214 | |
| |
Mixed-Use — 0.3% |
20 Times Square Trust, Series 2018-20TS, Class B (a)(d) | | | 3.203 | % | | | 05/17/35 | | | | 4,400,000 | | | | 4,383,771 | |
| |
| | Coupon | | | Maturity | | | Shares /
Par Value | | | Fair
Value | |
Multifamily — 5.8% |
BX Commercial Mortgage Trust, Series 2021-MFM1, Class D (1* 1MO LIBOR + 150) (a)(d) | | | 1.610 | % | | | 01/15/34 | | | $ | 2,000,000 | | | $ | 1,968,673 | |
Freedom Mortgage Trust, Series 2017-KF39, Class B (1* 1MO LIBOR + 250) (a)(d) | | | 2.594 | % | | | 11/25/24 | | | | 3,844,388 | | | | 3,830,040 | |
Freedom Mortgage Trust, Series 2018-KF53, Class B (1* 1MO LIBOR + 205) (a)(d) | | | 2.138 | % | | | 10/27/25 | | | | 2,607,471 | | | | 2,591,232 | |
Freedom Mortgage Trust, Series 2019-KF61, Class B (1* 1MO LIBOR + 220) (a)(d) | | | 2.294 | % | | | 03/25/29 | | | | 3,224,712 | | | | 3,232,303 | |
FREMF Mortgage Trust, Series 2018-KF42, Class B (d) | | | 2.288 | % | | | 12/25/24 | | | | 968,352 | | | | 964,145 | |
FREMF Mortgage Trust, Series 2018-KF44, Class B (1* 1MO LIBOR + 215) (a)(d) | | | 2.244 | % | | | 02/25/25 | | | | 1,942,143 | | | | 1,929,750 | |
FREMF Mortgage Trust, Series 2018-KF43, Class B (1* 1MO LIBOR + 215) (a)(d) | | | 2.238 | % | | | 01/25/28 | | | | 2,840,763 | | | | 2,832,858 | |
FREMF Mortgage Trust, Series 2018-KF50, Class B (1* 1MO LIBOR + 190) (a)(d) | | | 1.987 | % | | | 07/25/28 | | | | 3,163,581 | | | | 3,120,719 | |
FREMF Mortgage Trust, Series 2019-KF57, Class B (1* 1MO LIBOR + 225) (a)(d) | | | 2.344 | % | | | 01/25/29 | | | | 4,522,069 | | | | 4,493,274 | |
FREMF Mortgage Trust, Series 2019-KF59, Class B (d) | | | 2.444 | % | | | 02/25/29 | | | | 1,673,649 | | | | 1,673,648 | |
46 DIAMOND HILL FUNDS | ANNUAL REPORT | DECEMBER 31, 2021 | DIAMOND-HILL.COM |
Diamond Hill Short Duration Securitized Bond Fund
Schedule of Investments (Continued)
December 31, 2021
| | Coupon | | | Maturity | | | Shares /
Par Value | | | Fair
Value | |
Securitized — 85.1% continued |
Multifamily — 5.8% continued |
FREMF Mortgage Trust, Series 2019-KF67, Class B (1* 1MO LIBOR + 225) (a)(d) | | | 2.344 | % | | | 08/25/29 | | | $ | 6,296,545 | | | $ | 6,266,389 | |
Multi Family Connecticut Avenue, Series 2019-01, Class M-7 (1* 1MO LIBOR + 170) (a)(d) | | | 1.802 | % | | | 10/15/49 | | | | 5,899,538 | | | | 5,876,590 | |
Multi Family Connecticut Avenue, Series 2019-01, Class M10 (1* 1MO LIBOR + 325) (a)(d) | | | 3.352 | % | | | 10/15/49 | | | | 3,000,000 | | | | 2,962,345 | |
Multi Family Connecticut Avenue, Series 2019-01, Class B-10 (1* 1MO LIBOR + 550) (a)(d) | | | 5.602 | % | | | 10/15/49 | | | | 1,500,000 | | | | 1,522,150 | |
Multi Family Connecticut Avenue, Series 2020-01, Class M-7 (1* 1MO LIBOR + 195) (a)(d) | | | 2.042 | % | | | 03/25/50 | | | | 4,430,623 | | | | 4,438,484 | |
Multi Family Connecticut Avenue, Series 2020-01, Class M-10 (1* 1MO LIBOR + 375) (a)(d) | | | 3.842 | % | | | 03/25/50 | | | | 15,000,000 | | | | 15,219,180 | |
Multi Family Connecticut Avenue, Series 2020-01, Class CE (1* 1MO LIBOR + 750) (a)(d) | | | 7.592 | % | | | 03/25/50 | | | | 1,500,000 | | | | 1,604,532 | |
Multifamily Structured Credit Risk, Series 2021-MN2, Class M-1 (d) | | | 1.850 | % | | | 07/25/41 | | | | 2,964,067 | | | | 2,908,419 | |
| | Coupon | | | Maturity | | | Shares /
Par Value | | | Fair
Value | |
Multifamily — 5.8% continued |
Multifamily Structured Credit Risk, Series 2021-MN1, Class M-1 (1* SOFR30A + 200) (a)(d) | | | 2.050 | % | | | 01/25/51 | | | $ | 10,743,077 | | | $ | 10,690,363 | |
Multifamily Structured Credit Risk, Series 2021-MN3, Class M1 (d) | | | 2.350 | % | | | 11/25/51 | | | | 7,000,000 | | | | 6,955,848 | |
Multifamily Structured Credit Risk, Series 2021-MN3, Class B1 (d) | | | 6.900 | % | | | 11/25/51 | | | | 2,500,000 | | | | 2,530,354 | |
| | | | | | | | | | | | | | | | 87,611,296 | |
Non Agency MBS CMO — 0.5% |
Chase Mortgage Finance Corp., Series 2021-CL1, Class M3 | | | 1.600 | % | | | 02/25/50 | | | | 2,946,729 | | | | 2,947,330 | |
J.P. Morgan Wealth Management, Series 2021-CL1, Class M1 (1* SOFR30A + 130) (a)(d) | | | 1.350 | % | | | 02/26/71 | | | | 2,327,408 | | | | 2,330,208 | |
J.P. Morgan Wealth Management, Series 2021-CL1, Class M3 (1* SOFR30A + 180) (a)(d) | | | 1.850 | % | | | 02/26/71 | | | | 1,756,623 | | | | 1,763,070 | |
| | | | | | | | | | | | | | | | 7,040,608 | |
Non-Performing Loan — 0.1% |
Cascade Funding Mortgage Trust, Series 2021-EBO1, Class M3 (d) | | | 3.086 | % | | | 11/25/50 | | | | 1,662,000 | | | | 1,657,734 | |
| |
Non-QM — 0.0% (c) |
Citigroup Mortgage Loan Trust, Inc., Series 2004-UST1, Class A3 (a) | | | 2.018 | % | | | 08/25/34 | | | | 5,395 | | | | 5,544 | |
| |
DIAMOND HILL FUNDS | ANNUAL REPORT | DECEMBER 31, 2021 | DIAMOND-HILL.COM 47 |
Diamond Hill Short Duration Securitized Bond Fund
Schedule of Investments (Continued)
December 31, 2021
| | Coupon | | | Maturity | | | Shares /
Par Value | | | Fair
Value | |
Securitized — 85.1% continued |
Office — 1.2% |
Drop Mortgage Trust, Series 2021-FILE, Class C (1* 1MO LIBOR + 225) (a)(d) | | | 2.360 | % | | | 04/15/26 | | | $ | 12,000,000 | | | $ | 11,992,792 | |
Goldman Sachs Mortgage Securities Corp. Trust, Series 2021-ROSS, Class D (d) | | | 2.610 | % | | | 05/15/26 | | | | 5,750,000 | | | | 5,729,409 | |
| | | | | | | | | | | | | | | | 17,722,201 | |
Residential Transition Loan — 4.5% |
AlphaFlow Transitional Mortgage Co., Series 2021-WL1, Class A1 (d) | | | 3.280 | % | | | 03/25/25 | | | | 6,275,000 | | | | 6,325,764 | |
AlphaFlow Transitional Mortgage Co., Series 2021-WL1, Class A2 (d) | | | 5.610 | % | | | 03/25/25 | | | | 9,500,000 | | | | 9,613,953 | |
Antler Mortgage Trust, Series 2021-RTL1, Class M (d) | | | 5.438 | % | | | 05/25/25 | | | | 16,188,000 | | | | 16,121,992 | |
Colony American Finance Ltd., Series 2021-RTL1, Class A2 (d) | | | 3.104 | % | | | 03/26/29 | | | | 7,500,000 | | | | 7,372,390 | |
LHOME Mortgage Trust, Series 2021-RTL3, Class A2 (d) | | | 3.228 | % | | | 09/25/26 | | | | 8,250,000 | | | | 8,174,933 | |
LHOME Mortgage Trust, Series 2021-RTL1, Class M (d) | | | 4.458 | % | | | 09/25/26 | | | | 5,750,000 | | | | 5,665,444 | |
LHOME Mortgage Trust, Series 2021-RTL3, Class M (d) | | | 5.193 | % | | | 09/25/26 | | | | 5,000,000 | | | | 4,955,562 | |
ROC Securities Trust, Series 2021-RTL1, Class A2 (d) | | | 3.351 | % | | | 08/25/26 | | | | 3,200,000 | | | | 3,164,366 | |
ROC Securities Trust, Series 2021-RTL1, Class M (d) | | | 5.682 | % | | | 08/25/26 | | | | 6,745,000 | | | | 6,674,526 | |
| | | | | | | | | | | | | | | | 68,068,930 | |
| | Coupon | | | Maturity | | | Shares /
Par Value | | | Fair
Value | |
Retail — 3.4% |
BB-UBS Trust, Series 2012-SHOW, Class A (d) | | | 3.430 | % | | | 11/05/36 | | | $ | 5,000,000 | | | $ | 5,177,955 | |
BX Trust, Series 2021-VIEW, Class E (d) | | | 3.710 | % | | | 06/15/23 | | | | 2,730,500 | | | | 2,724,936 | |
BX Trust, Series 2018-EXCL, Class A (1* 1MO LIBOR + 109) (a)(d) | | | 1.198 | % | | | 09/15/37 | | | | 10,639,248 | | | | 10,587,904 | |
BX Trust, Series 2018-EXCL, Class B (d) | | | 1.435 | % | | | 09/15/37 | | | | 617,914 | | | | 602,573 | |
BX Trust, Series 2018-EXCL, Class C (d) | | | 2.085 | % | | | 09/15/37 | | | | 12,580,355 | | | | 12,150,964 | |
Citigroup Commercial Mortgage, Series 2017-MDRB, Class D (1* 1MO LIBOR + 325) (a)(d) | | | 3.360 | % | | | 07/15/30 | | | | 9,650,000 | | | | 9,603,334 | |
Citigroup Commercial Mortgage, Series 2017-MDRB, Class A (1* 1MO LIBOR + 110) (a)(d) | | | 1.210 | % | | | 07/15/30 | | | | 190,335 | | | | 189,800 | |
Credit Suisse First Boston, Series 2018-SITE, Class C (a)(d) | | | 4.941 | % | | | 04/17/36 | | | | 4,575,000 | | | | 4,609,297 | |
Wells Fargo Mortgage Trust, Series 2021-SAVE, Class C (1* 1MO LIBOR + 180) (a)(d) | | | 1.910 | % | | | 02/15/40 | | | | 2,318,006 | | | | 2,307,445 | |
Wells Fargo Mortgage Trust, Series 2021-SAVE, Class D (1* 1MO LIBOR + 250) (a)(d) | | | 2.610 | % | | | 02/15/40 | | | | 1,704,416 | | | | 1,694,705 | |
Wells Fargo Mortgage Trust, Series 2021-SAVE, Class E (1* 1MO LIBOR + 365) (a)(d) | | | 3.760 | % | | | 02/15/40 | | | | 1,681,690 | | | | 1,681,974 | |
| | | | | | | | | | | | | | | | 51,330,887 | |
48 DIAMOND HILL FUNDS | ANNUAL REPORT | DECEMBER 31, 2021 | DIAMOND-HILL.COM |
Diamond Hill Short Duration Securitized Bond Fund
Schedule of Investments (Continued)
December 31, 2021
| | Coupon | | | Maturity | | | Shares /
Par Value | | | Fair
Value | |
Securitized — 85.1% continued |
Single Family Rental — 2.6% |
American Homes 4 Rent, Series 2015-SFR2, Class D (d) | | | 5.036 | % | | | 10/18/52 | | | $ | 1,171,000 | | | $ | 1,257,887 | |
AMSR Trust, Series 2020-SFR2, Class G (d) | | | 4.000 | % | | | 07/17/37 | | | | 500,000 | | | | 497,943 | |
Colony American Finance Ltd., Series 2020-4, Class B (d) | | | 1.707 | % | | | 12/15/52 | | | | 4,750,000 | | | | 4,616,509 | |
Home Partners of America Trust, Series 2021-2, Class D (d) | | | 2.652 | % | | | 12/17/26 | | | | 6,496,186 | | | | 6,403,996 | |
Invitation Homes Trust, Series 2018-SFR3, Class A (1* 1MO LIBOR + 100) (a)(d) | | | 1.109 | % | | | 07/17/37 | | | | 2,885,079 | | | | 2,883,549 | |
Progress Residential Trust, Series 2021-SFR1, Class B (d) | | | 1.303 | % | | | 04/17/38 | | | | 2,500,000 | | | | 2,400,293 | |
Progress Residential Trust, Series 2021-SFR1, Class E (d) | | | 2.106 | % | | | 04/17/38 | | | | 1,900,000 | | | | 1,832,167 | |
Star Trust, Series 2021-SFR1, Class E (1* 1MO LIBOR + 170) (a)(d) | | | 1.809 | % | | | 04/17/38 | | | | 18,300,000 | | | | 18,262,824 | |
| | | | | | | | | | | | | | | | 38,155,168 | |
Small Business — 6.3% |
Credibility Asset Securitization, Series 2021-1A, Class A (d) | | | 2.390 | % | | | 04/15/26 | | | | 8,000,000 | | | | 7,981,138 | |
Credibility Asset Securitization, Series 2021-1A, Class C (d) | | | 3.380 | % | | | 04/15/26 | | | | 1,375,000 | | | | 1,372,423 | |
Credibility Asset Securitization, Series 2021-1A, Class B (d) | | | 5.930 | % | | | 04/15/26 | | | | 2,676,000 | | | | 2,688,867 | |
| | Coupon | | | Maturity | | | Shares /
Par Value | | | Fair
Value | |
Small Business — 6.3% continued |
FORA Financial Asset Securitization, Series 2021-1A, Class A (d) | | | 2.620 | % | | | 05/15/27 | | | $ | 11,000,000 | | | $ | 11,000,681 | |
FORA Financial Asset Securitization, Series 2021-1A, Class B (d) | | | 2.970 | % | | | 05/15/27 | | | | 2,600,000 | | | | 2,582,117 | |
FORA Financial Asset Securitization, Series 2021-1A, Class C (d) | | | 3.850 | % | | | 05/15/27 | | | | 3,000,000 | | | | 2,979,032 | |
Newtek Small Business Loan Trust, Series 2018-1, Class A (1* Prime - 55) (a)(d) | | | 2.700 | % | | | 02/25/44 | | | | 1,025,074 | | | | 1,027,819 | |
Newtek Small Business Loan Trust, Series 2018-1, Class B (1* Prime + 75) (d) | | | 4.000 | % | | | 02/25/44 | | | | 2,255,162 | | | | 2,265,834 | |
Newtek Small Business Loan Trust, Series 2019-01, Class A (1* Prime - 90) (d) | | | 2.350 | % | | | 12/25/44 | | | | 2,850,284 | | | | 2,840,084 | |
OnDeck Asset Securitization Trust, Series 2021-1A, Class B (d) | | | 2.280 | % | | | 05/17/27 | | | | 3,500,000 | | | | 3,479,351 | |
OnDeck Asset Securitization Trust, Series 2021-1A, Class C (d) | | | 2.970 | % | | | 05/17/27 | | | | 3,250,000 | | | | 3,230,798 | |
OnDeck Asset Securitization Trust, Series 2021-1A, Class D (d) | | | 4.940 | % | | | 05/17/27 | | | | 5,000,000 | | | | 4,985,586 | |
SFS Asset Securitization, LLC, Series 2019-1, Class A (d) | | | 4.238 | % | | | 06/10/25 | | | | 8,215,000 | | | | 8,214,280 | |
DIAMOND HILL FUNDS | ANNUAL REPORT | DECEMBER 31, 2021 | DIAMOND-HILL.COM 49 |
Diamond Hill Short Duration Securitized Bond Fund
Schedule of Investments (Continued)
December 31, 2021
| | Coupon | | | Maturity | | | Shares /
Par Value | | | Fair
Value | |
Securitized — 85.1% continued |
Small Business — 6.3% continued |
SFS Asset Securitization, LLC, Series 2019-1, Class B (d) | | | 5.023 | % | | | 06/10/25 | | | $ | 2,000,000 | | | $ | 1,992,020 | |
SFS Asset Securitization, LLC, Series 2019-1, Class C (d) | | | 6.390 | % | | | 06/10/25 | | | | 746,000 | | | | 743,426 | |
Small Business Lending Trust, Series 2019-A, Class B (d) | | | 3.420 | % | | | 07/15/26 | | | | 72,609 | | | | 72,631 | |
Small Business Lending Trust, Series 2019-A, Class C (d) | | | 4.310 | % | | | 07/15/26 | | | | 11,055,000 | | | | 11,111,178 | |
Small Business Lending Trust, Series 2019-A, Class D (d) | | | 6.300 | % | | | 07/15/26 | | | | 5,000,000 | | | | 5,015,275 | |
Small Business Lending Trust, Series 2020-A, Class A (d) | | | 2.620 | % | | | 12/15/26 | | | | 412,579 | | | | 412,961 | |
Small Business Lending Trust, Series 2020-A, Class B (d) | | | 3.200 | % | | | 12/15/26 | | | | 8,500,000 | | | | 8,527,736 | |
Small Business Lending Trust, Series 2020-A, Class C (d) | | | 5.010 | % | | | 12/15/26 | | | | 12,000,000 | | | | 12,021,440 | |
| | | | | | | | | | | | | | | | 94,544,677 | |
Student Loan — 0.9% |
College Ave Student Loans, Series 2018-A, Class B (d) | | | 4.750 | % | | | 12/26/47 | | | | 1,145,860 | | | | 1,198,939 | |
College Ave Student Loans, Series 2018-A, Class C (d) | | | 5.500 | % | | | 12/26/47 | | | | 698,669 | | | | 722,158 | |
College Ave Student Loans, Series 2019-A, Class C (d) | | | 4.460 | % | | | 12/28/48 | | | | 3,463,465 | | | | 3,574,490 | |
College Ave Student Loans, Series 2021-A, Class B (d) | | | 2.320 | % | | | 07/25/51 | | | | 2,500,000 | | | | 2,481,360 | |
| | Coupon | | | Maturity | | | Shares /
Par Value | | | Fair
Value | |
Student Loan — 0.9% continued |
College Ave Student Loans, Series 2021-A, Class D (d) | | | 4.120 | % | | | 07/25/51 | | | $ | 1,250,000 | | | $ | 1,251,935 | |
CommonBond Student Loan Trust, Series 2017-BGS, Class C (d) | | | 4.440 | % | | | 09/25/42 | | | | 90,650 | | | | 93,488 | |
Earnest Student Loan Program, LLC, Series 2016-D, Class R (d)(e)(f) | | | 0.000 | % | | | 01/25/41 | | | | 5,000 | | | | 0 | |
Laurel Road Prime Student Loan, Series 2019-A, Class BFX(d) | | | 3.000 | % | | | 10/25/48 | | | | 1,842,378 | | | | 1,855,504 | |
Prodigy Finance, Series 2021-1A, Class A (d) | | | 1.352 | % | | | 07/25/51 | | | | 2,384,086 | | | | 2,383,518 | |
| | | | | | | | | | | | | | | | 13,561,392 | |
Unsecured Consumer — 14.2% |
Avant Loans Funding Trust, Series 2021-REV1, Class C (d) | | | 2.300 | % | | | 07/15/30 | | | | 5,000,000 | | | | 4,952,490 | |
Consumer Loan Underlying Bond Credit Trust, Series 2019-P1, Class C (d) | | | 4.660 | % | | | 07/15/26 | | | | 10,000,000 | | | | 10,125,384 | |
Consumer Loan Underlying Bond Credit Trust, Series 2019-HP1, Class B (d) | | | 3.480 | % | | | 12/15/26 | | | | 5,000,000 | | | | 5,056,900 | |
Freedom Financial, Series 2019-2, Class C (d) | | | 4.860 | % | | | 11/18/26 | | | | 5,500,000 | | | | 5,581,759 | |
Freedom Financial, Series 2020-FP1, Class B (d) | | | 3.060 | % | | | 03/18/27 | | | | 5,886,409 | | | | 5,918,176 | |
Freedom Financial, Series 2020-FP1, Class C (d) | | | 4.370 | % | | | 03/18/27 | | | | 3,250,000 | | | | 3,293,774 | |
Freedom Financial, Series 2020-3FP, Class B (d) | | | 4.180 | % | | | 09/20/27 | | | | 1,691,166 | | | | 1,699,439 | |
50 DIAMOND HILL FUNDS | ANNUAL REPORT | DECEMBER 31, 2021 | DIAMOND-HILL.COM |
Diamond Hill Short Duration Securitized Bond Fund
Schedule of Investments (Continued)
December 31, 2021
| | Coupon | | | Maturity | | | Shares /
Par Value | | | Fair
Value | |
Securitized — 85.1% continued |
Unsecured Consumer — 14.2% continued |
Freedom Financial, Series 2020-3FP, Class C (d) | | | 6.960 | % | | | 09/20/27 | | | $ | 2,500,000 | | | $ | 2,595,350 | |
Freedom Financial, Series 2021-1CP, Class B (d) | | | 1.410 | % | | | 03/20/28 | | | | 4,000,000 | | | | 3,991,545 | |
Freedom Financial, Series 2021-1CP, Class C (d) | | | 2.830 | % | | | 03/20/28 | | | | 3,250,000 | | | | 3,253,912 | |
Freedom Financial, Series 2021-3FP, Class C (d) | | | 1.600 | % | | | 11/20/28 | | | | 5,300,000 | | | | 5,230,660 | |
Freedom Financial, Series 2020-2CP, Class B (d) | | | 5.500 | % | | | 06/18/27 | | | | 1,450,179 | | | | 1,468,372 | |
Freedom Mortgage Trust, Series 2020-2CP, Class C (d) | | | 6.000 | % | | | 06/18/27 | | | | 12,585,000 | | | | 12,984,268 | |
Lendmark Funding Trust, Series 2020-2A, Class C (d) | | | 4.690 | % | | | 04/21/31 | | | | 1,000,000 | | | | 1,060,005 | |
Liberty Lending Services, Series 2021-1A, Class A (d) | | | 1.070 | % | | | 05/15/29 | | | | 8,007,229 | | | | 7,965,078 | |
Liberty Lending Services, Series 2021-1A, Class B (d) | | | 2.170 | % | | | 05/15/29 | | | | 1,650,000 | | | | 1,626,641 | |
Liberty Lending Services, Series 2021-1A, Class C (d) | | | 3.540 | % | | | 05/15/29 | | | | 6,700,000 | | | | 6,597,913 | |
LL ABS Trust, Series 2020-1, Class A (d) | | | 2.330 | % | | | 07/15/22 | | | | 1,356,525 | | | | 1,360,844 | |
LL ABS Trust, Series 2020-1, Class B (d) | | | 3.790 | % | | | 03/15/23 | | | | 7,000,000 | | | | 7,099,193 | |
LL ABS Trust, Series 2020-1, Class C (d) | | | 6.540 | % | | | 11/15/23 | | | | 2,200,000 | | | | 2,322,742 | |
LL ABS Trust, Series 2019-1, Class B (d) | | | 3.520 | % | | | 03/15/27 | | | | 1,404,096 | | | | 1,407,275 | |
| | Coupon | | | Maturity | | | Shares /
Par Value | | | Fair
Value | |
Unsecured Consumer — 14.2% continued |
LL ABS Trust, Series 2019-1, Class C (d) | | | 5.070 | % | | | 03/15/27 | | | $ | 4,500,000 | | | $ | 4,576,530 | |
Mariner Finance Issuance Trust, Series 2020-A, Class D (d) | | | 5.750 | % | | | 08/21/34 | | | | 8,000,000 | | | | 8,171,706 | |
Mariner Finance Issuance Trust, Series 2019-A, Class C (d) | | | 4.010 | % | | | 07/20/32 | | | | 2,120,000 | | | | 2,147,571 | |
Mariner Finance Issuance Trust, Series 2021-AA, Class D (d) | | | 4.340 | % | | | 03/20/36 | | | | 1,390,000 | | | | 1,405,948 | |
Oportun Funding XIV, LLC, Series 2021-A, Class C (d) | | | 3.440 | % | | | 03/08/28 | | | | 6,950,000 | | | | 6,999,109 | |
Oportun Funding, LLC, Series 2021-B, Class A (d) | | | 1.470 | % | | | 05/08/31 | | | | 3,500,000 | | | | 3,477,724 | |
Oportun Funding, LLC, Series 2021-B, Class C (d) | | | 3.650 | % | | | 05/08/31 | | | | 8,350,000 | | | | 8,357,922 | |
Oportun Funding, LLC, Series 2021-B, Class D (d) | | | 5.410 | % | | | 05/08/31 | | | | 2,080,000 | | | | 2,080,617 | |
Oportun Funding, LLC, Series 2021-C, Class C (d) | | | 3.610 | % | | | 10/08/31 | | | | 3,750,000 | | | | 3,720,698 | |
Oportun Funding, LLC, Series 2021-C, Class D (d) | | | 5.570 | % | | | 10/08/31 | | | | 1,750,000 | | | | 1,739,208 | |
Prosper Marketplace Issuance Trust, Series 2019-3A, Class CERT (d) | | | 0.000 | % | | | 07/15/25 | | | | 81,061,702 | | | | 799,998 | |
Prosper Marketplace Issuance Trust, Series 2019-4, Class B (d) | | | 3.200 | % | | | 02/17/26 | | | | 1,215,864 | | | | 1,218,017 | |
Regional Management Issuance Trust, Series 2019-1, Class C (d) | | | 4.110 | % | | | 11/15/28 | | | | 2,000,000 | | | | 2,007,854 | |
DIAMOND HILL FUNDS | ANNUAL REPORT | DECEMBER 31, 2021 | DIAMOND-HILL.COM 51 |
Diamond Hill Short Duration Securitized Bond Fund
Schedule of Investments (Continued)
December 31, 2021
| | Coupon | | | Maturity | | | Shares /
Par Value | | | Fair
Value | |
Securitized — 85.1% continued |
Unsecured Consumer — 14.2% continued |
Regional Management Issuance Trust, Series 2020-1, Class A (d) | | | 2.340 | % | | | 10/15/30 | | | $ | 2,000,000 | | | $ | 2,013,621 | |
Regional Management Issuance Trust, Series 2020-1, Class B (d) | | | 3.230 | % | | | 10/15/30 | | | | 2,500,000 | | | | 2,513,946 | |
Regional Management Issuance Trust, Series 2021-1, Class B (d) | | | 2.420 | % | | | 03/17/31 | | | | 895,000 | | | | 884,159 | |
Regional Management Issuance Trust, Series 2021-1, Class C (d) | | | 3.040 | % | | | 03/17/31 | | | | 1,550,000 | | | | 1,541,348 | |
Upgrade Master Pass-Thru Trust, Series 2019-ST1, Class A (d) | | | 4.000 | % | | | 07/15/25 | | | | 890,093 | | | | 897,462 | |
Upgrade Master Pass-Thru Trust, Series 2019-ST3, Class A (d) | | | 3.750 | % | | | 11/15/25 | | | | 627,944 | | | | 632,762 | |
Upstart Pass Through Trust, Series 2021-ST5, Class A (d) | | | 2.000 | % | | | 07/20/27 | | | | 6,802,305 | | | | 6,742,664 | |
Upstart Pass Through Trust, Series 2021-ST9, Class A (d) | | | 1.700 | % | | | 11/20/29 | | | | 4,819,365 | | | | 4,780,887 | |
Upstart Pass-Through Trust, Series 2020-ST6, Class A (d) | | | 3.000 | % | | | 01/20/27 | | | | 5,103,532 | | | | 5,123,348 | |
Upstart Pass-Through Trust, Series 2021-ST4, Class A (d) | | | 2.000 | % | | | 07/20/27 | | | | 6,435,315 | | | | 6,378,939 | |
Upstart Pass-Through Trust, Series 2020-ST1, Class A (d) | | | 3.750 | % | | | 02/20/28 | | | | 1,690,707 | | | | 1,715,411 | |
Upstart Pass-Through Trust, Series 2020-ST2, Class A (d) | | | 3.500 | % | | | 03/20/28 | | | | 1,670,240 | | | | 1,691,894 | |
| | Coupon | | | Maturity | | | Shares /
Par Value | | | Fair
Value | |
Unsecured Consumer — 14.2% continued |
Upstart Pass-Through Trust, Series 2020-ST3, Class A (d) | | | 3.350 | % | | | 04/20/28 | | | $ | 2,041,845 | | | $ | 2,065,987 | |
Upstart Pass-Through Trust, Series 2021-1A, Class C (d) | | | 1.750 | % | | | 10/20/29 | | | | 3,749,996 | | | | 3,717,309 | |
Upstart Securitization Trust, Series 2021-ST1, Class A (d) | | | 2.750 | % | | | 02/20/27 | | | | 2,060,990 | | | | 2,069,913 | |
Upstart Securitization Trust, Series 2021-ST2, Class A (d) | | | 2.500 | % | | | 04/20/27 | | | | 6,573,192 | | | | 6,593,035 | |
Upstart Securitization Trust, Series 2019-2, Class B (d) | | | 3.734 | % | | | 09/20/29 | | | | 5,305,420 | | | | 5,334,392 | |
Upstart Securitization Trust, Series 2019-2, Class C (d) | | | 4.783 | % | | | 09/20/29 | | | | 5,587,000 | | | | 5,654,447 | |
Upstart Securitization Trust, Series 2019-3, Class B (d) | | | 3.829 | % | | | 01/21/30 | | | | 3,727,112 | | | | 3,755,294 | |
Upstart Securitization Trust, Series 2021-1, Class B (d) | | | 1.890 | % | | | 03/20/31 | | | | 1,850,000 | | | | 1,841,041 | |
Upstart Securitization Trust, Series 2021-1, Class C (d) | | | 4.060 | % | | | 03/20/31 | | | | 1,000,000 | | | | 1,006,673 | |
Upstart Securitization Trust, Series 2021-2, Class B (d) | | | 1.750 | % | | | 06/20/31 | | | | 3,250,000 | | | | 3,222,987 | |
| | | | | | | | | | | | | | | | 212,472,141 | |
| |
Total Securitized |
| (Cost $1,269,157,020) | | | $ | 1,275,855,470 | |
52 DIAMOND HILL FUNDS | ANNUAL REPORT | DECEMBER 31, 2021 | DIAMOND-HILL.COM |
Diamond Hill Short Duration Securitized Bond Fund
Schedule of Investments (Continued)
December 31, 2021
| | Coupon | | | Maturity | | | Shares /
Par Value | | | Fair
Value | |
Treasury — 5.0% |
U.S. Treasury Notes | | | 0.125 | % | | | 10/15/23 | | | $ | 10,000,000 | | | $ | 9,900,000 | |
U.S. Treasury Notes (b) | | | 2.750 | % | | | 11/15/23 | | | | 10,000,000 | | | | 10,377,734 | |
U.S. Treasury Notes | | | 2.625 | % | | | 12/31/23 | | | | 10,000,000 | | | | 10,372,266 | |
U.S. Treasury Notes | | | 1.750 | % | | | 06/30/24 | | | | 15,000,000 | | | | 15,326,953 | |
U.S. Treasury Notes (b) | | | 0.375 | % | | | 09/15/24 | | | | 10,000,000 | | | | 9,858,594 | |
U.S. Treasury Notes | | | 0.625 | % | | | 10/15/24 | | | | 10,000,000 | | | | 9,918,750 | |
U.S. Treasury Notes (b) | | | 0.750 | % | | | 11/15/24 | | | | 10,000,000 | | | | 9,943,750 | |
Total Treasury | | | | | | | | |
(Cost $75,976,133) | | | | | | $ | 75,698,047 | |
| |
Registered Investment Companies — 6.4% |
State Street Institutional Liquid Reserves Fund - Premier Class, 0.04% (g) | | | 60,678,242 | | | | 60,684,309 | |
State Street Navigator Securities Lending Portfolio I, 0.15% (g)(h) | | | 35,236,950 | | | | 35,236,950 | |
Total Registered Investment Companies |
(Cost $95,839,535) | | $ | 95,921,259 | |
| | | | | | | | | |
Total Investment Securities — 102.3% |
(Cost $1,527,495,918) | | $ | 1,533,865,442 | |
| |
Liabilities in Excess of Other Assets — (2.3)% | | | | | | | (35,155,385 | ) |
| | | | | | | | | |
Net Assets — 100.0% | | | | | | $ | 1,498,710,057 | |
(a) | Variable rate security. The rate shown is the effective interest rate as of December 31, 2021. The benchmark on which the rate is calculated is shown parenthetically, if applicable. Certain variable rate securities are not based on a published rate and spread but are determined by the issuer or agent and may be based on index changes, prepayment of underlying positions and/or other variables. These securities do not indicate a reference rate and spread in their description above. |
(b) | All or a portion of the security is on loan. The total fair value of the securities on loan as of December 31, 2021 was $34,452,998. |
(c) | Percentage rounds to less than 0.1%. |
(d) | Securities exempt from registration under Rule 144A of the Securities Act of 1933. These securities have been deemed liquid under procedures approved by the Fund’s Board of Trustees and may normally be sold to qualified institutional buyers in transactions exempt from registration. The total fair value of these securities as of December 31, 2021 was $1,266,141,522, representing 84.5% of net assets. |
(e) | Illiquid security as determined under procedures approved by the Board of Trustees. The total fair value of these securities as of December 31, 2021 was $18,272,118, representing 1.2% of net assets. |
(f) | Security is fair valued under procedures established by the Board of Trustees. This security has received its final distribution and is valued at $0, which represents 0.0% of net assets. |
(g) | The rate shown is the 7-day effective yield as of December 31, 2021. |
(h) | This security was purchased using cash collateral held from securities on loan. |
IO — Interest Only
LIBOR — London Interbank Offered Rate
NA — National Association
PO — Principal Only
SOFR — Secured Overnight Financing Rate
See accompanying Notes to Financial Statements.
DIAMOND HILL FUNDS | ANNUAL REPORT | DECEMBER 31, 2021 | DIAMOND-HILL.COM 53 |
Diamond Hill Core Bond Fund
Schedule of Investments
December 31, 2021
| | Coupon | | | Maturity | | | Shares /
Par Value | | | Fair
Value | |
Corporate Credit — 17.3% |
Banking — 6.1% |
Bank of America Corp. (3MO LIBOR + 102) (a) | | | 2.881 | % | | | 04/24/23 | | | $ | 100,000 | | | $ | 100,648 | |
Bank of America Corp. | | | 1.486 | % | | | 05/19/24 | | | | 830,000 | | | | 836,011 | |
Bank of America Corp. (3MO LIBOR + 97) (a) | | | 3.458 | % | | | 03/15/25 | | | | 425,000 | | | | 444,470 | |
Bank of America Corp. | | | 3.875 | % | | | 08/01/25 | | | | 300,000 | | | | 325,173 | |
Bank of America Corp. (3MO LIBOR + 64) (a) | | | 2.015 | % | | | 02/13/26 | | | | 400,000 | | | | 405,148 | |
Bank of America Corp. (SOFR + 115) (a) | | | 1.319 | % | | | 06/19/26 | | | | 150,000 | | | | 148,407 | |
Bank of America Corp. (SOFR + 91) (a) | | | 1.658 | % | | | 03/11/27 | | | | 250,000 | | | | 248,245 | |
Bank of America Corp. (3MO LIBOR + 158) (a) | | | 3.824 | % | | | 01/20/28 | | | | 100,000 | | | | 108,288 | |
Bank of America Corp. (SOFR + 215) (a) | | | 2.592 | % | | | 04/29/31 | | | | 450,000 | | | | 454,579 | |
Bank of Montreal France | | | 0.949 | % | | | 01/22/27 | | | | 630,000 | | | | 609,517 | |
Canadian Imperial Bank of Commerce (3MO LIBOR + 79) (a) | | | 2.606 | % | | | 07/22/23 | | | | 100,000 | | | | 101,032 | |
Capital One Financial Corp. | | | 3.750 | % | | | 07/28/26 | | | | 100,000 | | | | 107,229 | |
Capital One Financial Corp. | | | 1.878 | % | | | 11/02/27 | | | | 775,000 | | | | 771,038 | |
Citigroup, Inc (SOFR + 167) (a) | | | 1.678 | % | | | 05/15/24 | | | | 500,000 | | | | 505,544 | |
Citigroup, Inc. (3MO LIBOR + 90) (a) | | | 3.352 | % | | | 04/24/25 | | | | 200,000 | | | | 208,830 | |
Citigroup, Inc. (b) | | | 3.300 | % | | | 04/27/25 | | | | 100,000 | | | | 106,207 | |
Citigroup, Inc. (3MO LIBOR + 125) (a) | | | 1.381 | % | | | 07/01/26 | | | | 100,000 | | | | 102,423 | |
Citigroup, Inc. (3MO LIBOR + 156) (a) | | | 3.887 | % | | | 01/10/28 | | | | 500,000 | | | | 542,085 | |
Citigroup, Inc. | | | 4.125 | % | | | 07/25/28 | | | | 150,000 | | | | 164,611 | |
Citigroup, Inc. (SOFR + 142) (a) | | | 2.976 | % | | | 11/05/30 | | | | 180,000 | | | | 186,922 | |
Citizens Financial Group | | | 2.850 | % | | | 07/27/26 | | | | 225,000 | | | | 234,382 | |
| | Coupon | | | Maturity | | | Shares /
Par Value | | | Fair
Value | |
Banking — 6.1% continued |
Comerica Bank, Series BKNT (b) | | | 2.500 | % | | | 07/23/24 | | | $ | 250,000 | | | $ | 258,112 | |
Cooperative Rabobank UA (c) | | | 2.625 | % | | | 07/22/24 | | | | 250,000 | | | | 258,103 | |
Discover Bank | | | 4.650 | % | | | 09/13/28 | | | | 700,000 | | | | 794,889 | |
Discover Bank | | | 2.700 | % | | | 02/06/30 | | | | 250,000 | | | | 253,163 | |
Discover Financial Services | | | 4.100 | % | | | 02/09/27 | | | | 100,000 | | | | 108,389 | |
Eaton Vance Corp. | | | 3.625 | % | | | 06/15/23 | | | | 478,000 | | | | 497,394 | |
Fifth Third Bancorp | | | 2.375 | % | | | 01/28/25 | | | | 275,000 | | | | 282,317 | |
Fifth Third Bancorp | | | 1.707 | % | | | 11/01/27 | | | | 450,000 | | | | 444,463 | |
First Horizon Bank | | | 5.750 | % | | | 05/01/30 | | | | 250,000 | | | | 299,024 | |
Goldman Sachs Group, Inc. | | | 0.657 | % | | | 09/10/24 | | | | 375,000 | | | | 371,853 | |
Goldman Sachs Group, Inc. | | | 3.500 | % | | | 01/23/25 | | | | 405,000 | | | | 426,967 | |
Goldman Sachs Group, Inc. | | | 3.500 | % | | | 04/01/25 | | | | 250,000 | | | | 264,358 | |
Goldman Sachs Group, Inc. | | | 3.500 | % | | | 11/16/26 | | | | 350,000 | | | | 372,995 | |
Goldman Sachs Group, Inc. (SOFR + 79) (a) | | | 1.093 | % | | | 12/09/26 | | | | 250,000 | | | | 243,615 | |
Goldman Sachs Group, Inc. | | | 3.800 | % | | | 03/15/30 | | | | 500,000 | | | | 550,408 | |
Goldman Sachs Group, Inc. (SOFR + 128) (a) | | | 2.615 | % | | | 04/22/32 | | | | 800,000 | | | | 805,745 | |
Huntington Bancshares, Inc. | | | 2.625 | % | | | 08/06/24 | | | | 125,000 | | | | 128,718 | |
JPMorgan Chase & Co. (SOFR + 60) (a) | | | 0.653 | % | | | 09/16/24 | | | | 150,000 | | | | 149,295 | |
JPMorgan Chase & Co. (3MO LIBOR + 100) (a) | | | 4.023 | % | | | 12/05/24 | | | | 550,000 | | | | 579,902 | |
JPMorgan Chase & Co. (SOFR + 80) (a) | | | 1.045 | % | | | 11/19/26 | | | | 500,000 | | | | 487,104 | |
JPMorgan Chase & Co. (SOFR + 89) (a) | | | 1.578 | % | | | 04/22/27 | | | | 400,000 | | | | 395,286 | |
JPMorgan Chase & Co. | | | 1.470 | % | | | 09/22/27 | | | | 400,000 | | | | 392,091 | |
JPMorgan Chase & Co. (3MO LIBOR + 134) (a) | | | 3.782 | % | | | 02/01/28 | | | | 100,000 | | | | 108,253 | |
JPMorgan Chase & Co. (3MO LIBOR + 95) (a) | | | 3.509 | % | | | 01/23/29 | | | | 100,000 | | | | 107,124 | |
54 DIAMOND HILL FUNDS | ANNUAL REPORT | DECEMBER 31, 2021 | DIAMOND-HILL.COM |
Diamond Hill Core Bond Fund
Schedule of Investments (Continued)
December 31, 2021
| | Coupon | | | Maturity | | | Shares /
Par Value | | | Fair
Value | |
Corporate Credit — 17.3% continued |
Banking — 6.1% continued |
JPMorgan Chase & Co. (SOFR + 151) (a) | | | 2.739 | % | | | 10/15/30 | | | $ | 100,000 | | | $ | 102,748 | |
JPMorgan Chase & Co. (SOFR + 204) (a) | | | 2.522 | % | | | 04/22/31 | | | | 750,000 | | | | 758,049 | |
KeyBank NA (SOFR + 34) (a)(b) | | | 0.423 | % | | | 01/03/24 | | | | 500,000 | | | | 498,154 | |
KeyCorp | | | 2.550 | % | | | 10/01/29 | | | | 385,000 | | | | 394,181 | |
Morgan Stanley (SOFR + 46) (a) | | | 0.529 | % | | | 01/25/24 | | | | 500,000 | | | | 498,281 | |
Morgan Stanley (3MO LIBOR + 85) (a) | | | 3.737 | % | | | 04/24/24 | | | | 100,000 | | | | 103,454 | |
Morgan Stanley (b) | | | 3.700 | % | | | 10/23/24 | | | | 100,000 | | | | 106,495 | |
Morgan Stanley | | | 3.875 | % | | | 01/27/26 | | | | 500,000 | | | | 540,666 | |
Morgan Stanley | | | 3.125 | % | | | 07/27/26 | | | | 100,000 | | | | 105,932 | |
Morgan Stanley | | | 3.625 | % | | | 01/20/27 | | | | 100,000 | | | | 108,416 | |
Morgan Stanley, Series GMTN (SOFR + 114) (a) | | | 2.699 | % | | | 01/22/31 | | | | 175,000 | | | | 179,040 | |
Morgan Stanley (SOFR + 103) (a) | | | 1.794 | % | | | 02/13/32 | | | | 500,000 | | | | 473,273 | |
PNC Bank NA | | | 2.700 | % | | | 10/22/29 | | | | 250,000 | | | | 258,267 | |
PNC Financial Services (b) | | | 2.600 | % | | | 07/23/26 | | | | 250,000 | | | | 262,117 | |
Regions Financial Corp. | | | 2.250 | % | | | 05/18/25 | | | | 275,000 | | | | 280,382 | |
Royal Bank of Canada | | | 1.150 | % | | | 06/10/25 | | | | 365,000 | | | | 361,845 | |
Royal Bank of Canada (b) | | | 1.150 | % | | | 07/14/26 | | | | 200,000 | | | | 195,627 | |
State Street Corp. (SOFR + 94) (a)(b) | | | 2.354 | % | | | 11/01/25 | | | | 175,000 | | | | 180,362 | |
Toronto-Dominion Bank (The) | | | 0.750 | % | | | 01/06/26 | | | | 350,000 | | | | 339,169 | |
Toronto-Dominion Bank (The) | | | 1.200 | % | | | 06/03/26 | | | | 200,000 | | | | 196,519 | |
Truist Financial Corp. (b) | | | 2.150 | % | | | 12/06/24 | | | | 250,000 | | | | 257,561 | |
Truist Financial Corp. (SOFR + 61) (a) | | | 1.267 | % | | | 03/02/27 | | | | 600,000 | | | | 588,665 | |
Truist Financial Corp. | | | 1.887 | % | | | 06/07/29 | | | | 500,000 | | | | 492,349 | |
US Bancorp | | | 2.400 | % | | | 07/30/24 | | | | 350,000 | | | | 361,611 | |
Wells Fargo & Co. | | | 3.550 | % | | | 09/29/25 | | | | 925,000 | | | | 985,657 | |
Wells Fargo & Co. (SOFR + 200) (a) | | | 2.188 | % | | | 04/30/26 | | | | 275,000 | | | | 279,857 | |
Wells Fargo & Co. (SOFR + 210) (a) | | | 2.393 | % | | | 06/02/28 | | | | 250,000 | | | | 254,082 | |
| | | | | | | | | | | | | | | | 24,453,116 | |
| | Coupon | | | Maturity | | | Shares /
Par Value | | | Fair
Value | |
Basic Industry — 0.3% |
FMC Corp. | | | 3.450 | % | | | 10/01/29 | | | $ | 300,000 | | | $ | 319,430 | |
Nucor Corp. | | | 2.000 | % | | | 06/01/25 | | | | 250,000 | | | | 254,907 | |
PPG Industries, Inc. | | | 2.400 | % | | | 08/15/24 | | | | 110,000 | | | | 113,399 | |
PPG Industries, Inc. | | | 2.550 | % | | | 06/15/30 | | | | 300,000 | | | | 304,822 | |
Sherwin-Williams Co. | | | 2.300 | % | | | 05/15/30 | | | | 250,000 | | | | 249,305 | |
| | | | | | | | | | | | | | | | 1,241,863 | |
Brokerage Asset Managers Exchanges — 0.3% |
Ameriprise Financial, Inc. (b) | | | 3.000 | % | | | 04/02/25 | | | | 250,000 | | | | 260,975 | |
CBOE Holdings, Inc. | | | 3.650 | % | | | 01/12/27 | | | | 100,000 | | | | 108,730 | |
Charles Schwab Corp. (The) | | | 0.900 | % | | | 03/11/26 | | | | 500,000 | | | | 487,609 | |
International Exchange, Inc. | | | 0.700 | % | | | 06/15/23 | | | | 275,000 | | | | 274,356 | |
| | | | | | | | | | | | | | | | 1,131,670 | |
Capital Goods — 0.3% |
Carrier Global Corp. | | | 2.700 | % | | | 02/15/31 | | | | 250,000 | | | | 253,914 | |
General Electric Capital Corp. | | | 6.750 | % | | | 03/15/32 | | | | 162,000 | | | | 220,928 | |
L3 Harris Technologies, Inc. | | | 3.850 | % | | | 12/15/26 | | | | 50,000 | | | | 54,372 | |
Lennox International, Inc. | | | 3.000 | % | | | 11/15/23 | | | | 100,000 | | | | 102,840 | |
Republic Services, Inc. | | | 2.500 | % | | | 08/15/24 | | | | 200,000 | | | | 205,813 | |
Waste Management, Inc. (b) | | | 1.150 | % | | | 03/15/28 | | | | 300,000 | | | | 286,304 | |
| | | | | | | | | | | | | | | | 1,124,171 | |
Communications — 1.5% |
American Tower Corp. (b) | | | 1.450 | % | | | 09/15/26 | | | | 300,000 | | | | 293,543 | |
American Tower Corp. | | | 3.800 | % | | | 08/15/29 | | | | 100,000 | | | | 108,791 | |
American Tower Corp. | | | 2.100 | % | | | 06/15/30 | | | | 100,000 | | | | 96,284 | |
AT&T, Inc. | | | 2.300 | % | | | 06/01/27 | | | | 650,000 | | | | 661,280 | |
AT&T, Inc. | | | 2.550 | % | | | 12/01/33 | | | | 114,000 | | | | 111,497 | |
AT&T, Inc. | | | 4.500 | % | | | 05/15/35 | | | | 100,000 | | | | 115,520 | |
British Telecommunications plc (c) | | | 3.250 | % | | | 11/08/29 | | | | 275,000 | | | | 281,108 | |
Comcast Corp. | | | 3.950 | % | | | 10/15/25 | | | | 750,000 | | | | 818,798 | |
Comcast Corp. | | | 2.650 | % | | | 02/01/30 | | | | 100,000 | | | | 103,710 | |
DIAMOND HILL FUNDS | ANNUAL REPORT | DECEMBER 31, 2021 | DIAMOND-HILL.COM 55 |
Diamond Hill Core Bond Fund
Schedule of Investments (Continued)
December 31, 2021
| | Coupon | | | Maturity | | | Shares /
Par Value | | | Fair
Value | |
Corporate Credit — 17.3% continued |
Communications — 1.5% continued |
Comcast Corp. (b) | | | 1.950 | % | | | 01/15/31 | | | $ | 250,000 | | | $ | 244,947 | |
Comcast Corp. | | | 3.969 | % | | | 11/01/47 | | | | 144,000 | | | | 165,794 | |
Deutsche Telekom International Finance (c) | | | 4.750 | % | | | 06/21/38 | | | | 100,000 | | | | 121,080 | |
Twenty-First Century Fox, Inc. | | | 4.030 | % | | | 01/25/24 | | | | 50,000 | | | | 52,805 | |
Verizon Communications, Inc. (3MO LIBOR + 110) (a) | | | 1.256 | % | | | 05/15/25 | | | | 100,000 | | | | 101,922 | |
Verizon Communications, Inc. | | | 4.125 | % | | | 03/16/27 | | | | 100,000 | | | | 111,153 | |
Verizon Communications, Inc. | | | 3.000 | % | | | 03/22/27 | | | | 120,000 | | | | 126,801 | |
Verizon Communications, Inc. | | | 1.750 | % | | | 01/20/31 | | | | 500,000 | | | | 473,227 | |
Verizon Communications, Inc. (c) | | | 2.355 | % | | | 03/15/32 | | | | 1,237,000 | | | | 1,218,838 | |
Verizon Communications, Inc. | | | 2.987 | % | | | 10/30/56 | | | | 143,000 | | | | 135,363 | |
Walt Disney Co. (The) | | | 1.750 | % | | | 08/30/24 | | | | 175,000 | | | | 177,773 | |
Walt Disney Co. (The) | | | 2.000 | % | | | 09/01/29 | | | | 550,000 | | | | 547,093 | |
Walt Disney Co. (The) (b) | | | 3.800 | % | | | 03/22/30 | | | | 100,000 | | | | 112,168 | |
| | | | | | | | | | | | | | | | 6,179,495 | |
Consumer Cyclical — 0.9% |
BMW US Capital, LLC (b)(c) | | | 3.900 | % | | | 04/09/25 | | | | 300,000 | | | | 322,646 | |
CVS Health Corp. | | | 3.750 | % | | | 04/01/30 | | | | 500,000 | | | | 548,176 | |
CVS Health Corp. | | | 5.050 | % | | | 03/25/48 | | | | 250,000 | | | | 326,859 | |
Daimler Finance, LLC (b)(c) | | | 1.750 | % | | | 03/10/23 | | | | 275,000 | | | | 277,749 | |
Ford Motor Co. | | | 4.346 | % | | | 12/08/26 | | | | 100,000 | | | | 109,075 | |
General Motors Financial Co., Inc. | | | 4.300 | % | | | 07/13/25 | | | | 700,000 | | | | 754,561 | |
General Motors Financial Co., Inc. | | | 4.000 | % | | | 10/06/26 | | | | 100,000 | | | | 107,977 | |
Lowes Cos., Inc. | | | 2.625 | % | | | 04/01/31 | | | | 300,000 | | | | 306,932 | |
Toyota Motor Credit Corp. (b) | | | 0.500 | % | | | 06/18/24 | | | | 500,000 | | | | 492,608 | |
| | Coupon | | | Maturity | | | Shares /
Par Value | | | Fair
Value | |
Consumer Cyclical — 0.9% continued |
Toyota Motor Credit Corp. | | | 0.800 | % | | | 01/09/26 | | | $ | 300,000 | | | $ | 291,686 | |
Walgreens Boots Alliance, Inc. (b) | | | 3.200 | % | | | 04/15/30 | | | | 250,000 | | | | 264,686 | |
| | | | | | | | | | | | | | | | 3,802,955 | |
Consumer Non-Cyclical — 1.0% |
Abbott Laboratories (b) | | | 4.750 | % | | | 11/30/36 | | | | 100,000 | | | | 127,612 | |
AbbVie, Inc. | | | 2.950 | % | | | 11/21/26 | | | | 335,000 | | | | 353,046 | |
AbbVie, Inc. | | | 4.550 | % | | | 03/15/35 | | | | 100,000 | | | | 120,239 | |
Amgen, Inc. | | | 1.900 | % | | | 02/21/25 | | | | 310,000 | | | | 315,805 | |
Anheuser-Busch Cos., LLC | | | 4.700 | % | | | 02/01/36 | | | | 100,000 | | | | 120,681 | |
Anheuser-Busch InBev SA/NV | | | 4.750 | % | | | 01/23/29 | | | | 100,000 | | | | 116,394 | |
Anheuser-Busch InBev SA/NV | | | 3.500 | % | | | 06/01/30 | | | | 600,000 | | | | 657,631 | |
Baxter International, Inc. (c) | | | 1.915 | % | | | 02/01/27 | | | | 300,000 | | | | 301,100 | |
Kroger Co. (The) | | | 2.650 | % | | | 10/15/26 | | | | 100,000 | | | | 103,908 | |
Kroger Co. (The) | | | 2.200 | % | | | 05/01/30 | | | | 125,000 | | | | 124,506 | |
Kroger Co. (The) (b) | | | 1.700 | % | | | 01/15/31 | | | | 550,000 | | | | 522,206 | |
Laboratory Corp. of American Holdings | | | 1.550 | % | | | 06/01/26 | | | | 375,000 | | | | 370,696 | |
Mondelez International, Inc. (c) | | | 1.250 | % | | | 09/24/26 | | | | 300,000 | | | | 292,335 | |
Zoetics, Inc., Series 4006 | | | 2.000 | % | | | 05/15/30 | | | | 525,000 | | | | 517,521 | |
| | | | | | | | | | | | | | | | 4,043,680 | |
Electric — 1.7% |
Ameren Corp. | | | 2.500 | % | | | 09/15/24 | | | | 130,000 | | | | 133,481 | |
American Electric Power, Inc. (b) | | | 1.000 | % | | | 11/01/25 | | | | 500,000 | | | | 488,920 | |
CMS Energy Corp. | | | 2.950 | % | | | 02/15/27 | | | | 100,000 | | | | 103,760 | |
Dominion Energy, Inc. | | | 1.450 | % | | | 04/15/26 | | | | 750,000 | | | | 741,318 | |
DTE Energy Co., Series C | | | 2.529 | % | | | 10/01/24 | | | | 150,000 | | | | 154,385 | |
DTE Energy Co., Series E | | | 2.850 | % | | | 10/01/26 | | | | 100,000 | | | | 104,233 | |
DTE Energy Co., Series H | | | 2.950 | % | | | 03/01/30 | | | | 125,000 | | | | 128,182 | |
Duke Energy Indiana, LLC | | | 2.750 | % | | | 04/01/50 | | | | 370,000 | | | | 359,862 | |
Duke Energy Progress, Inc. | | | 2.000 | % | | | 08/15/31 | | | | 600,000 | | | | 586,105 | |
56 DIAMOND HILL FUNDS | ANNUAL REPORT | DECEMBER 31, 2021 | DIAMOND-HILL.COM |
Diamond Hill Core Bond Fund
Schedule of Investments (Continued)
December 31, 2021
| | Coupon | | | Maturity | | | Shares /
Par Value | | | Fair
Value | |
Corporate Credit — 17.3% continued |
Electric — 1.7% continued |
Georgia Power Co., Series 2020-A | | | 2.100 | % | | | 07/30/23 | | | $ | 230,000 | | | $ | 234,044 | |
MidAmerican Energy Co. | | | 3.650 | % | | | 04/15/29 | | | | 350,000 | | | | 385,683 | |
Northern States Power Co. of Wisconsin (b) | | | 2.250 | % | | | 04/01/31 | | | | 500,000 | | | | 504,032 | |
Northern States Power Co. of Wisconsin | | | 2.900 | % | | | 03/01/50 | | | | 125,000 | | | | 126,197 | |
Oncor Electric Delivery Co., LLC | | | 3.750 | % | | | 04/01/45 | | | | 490,000 | | | | 557,387 | |
PECO Energy Co. | | | 3.000 | % | | | 09/15/49 | | | | 200,000 | | | | 201,883 | |
PPL Electric Utilities | | | 3.000 | % | | | 10/01/49 | | | | 160,000 | | | | 163,714 | |
Public Service Electric & Gas Co. | | | 2.250 | % | | | 09/15/26 | | | | 100,000 | | | | 102,737 | |
Southwestern Electric Power | | | 2.750 | % | | | 10/01/26 | | | | 100,000 | | | | 103,429 | |
WEC Energy Group, Inc. | | | 0.800 | % | | | 03/15/24 | | | | 700,000 | | | | 692,822 | |
Wisconsin Power & Light | | | 1.950 | % | | | 09/16/31 | | | | 800,000 | | | | 778,254 | |
| | | | | | | | | | | | | | | | 6,650,428 | |
Energy — 0.7% |
BP Capital Markets plc | | | 3.194 | % | | | 04/06/25 | | | | 175,000 | | | | 184,565 | |
Coterra Energy, Inc. (c) | | | 3.900 | % | | | 05/15/27 | | | | 100,000 | | | | 107,462 | |
Diamondback Energy, Inc. | | | 3.250 | % | | | 12/01/26 | | | | 200,000 | | | | 210,925 | |
Energy Transfer Operating LP | | | 4.500 | % | | | 04/15/24 | | | | 75,000 | | | | 79,489 | |
Exxon Mobil Corp. | | | 2.992 | % | | | 03/19/25 | | | | 240,000 | | | | 252,221 | |
Helmerich & Payne, Inc. (c) | | | 2.900 | % | | | 09/29/31 | | | | 650,000 | | | | 637,876 | |
Phillips 66 Partners LP | | | 3.700 | % | | | 04/06/23 | | | | 250,000 | | | | 258,439 | |
Phillips 66 Partners LP | | | 2.450 | % | | | 12/15/24 | | | | 100,000 | | | | 101,671 | |
Phillips 66 Partners LP | | | 3.550 | % | | | 10/01/26 | | | | 100,000 | | | | 106,391 | |
Royal Dutch Shell plc | | | 2.375 | % | | | 11/07/29 | | | | 320,000 | | | | 326,841 | |
Shell International Finance BV | | | 6.375 | % | | | 12/15/38 | | | | 73,000 | | | | 106,303 | |
Suncor Energy, Inc. | | | 2.800 | % | | | 05/15/23 | | | | 300,000 | | | | 306,909 | |
| | Coupon | | | Maturity | | | Shares /
Par Value | | | Fair
Value | |
Energy — 0.7% continued |
Total Capital International SA | | | 2.829 | % | | | 01/10/30 | | | $ | 120,000 | | | $ | 125,648 | |
Valero Energy Corp. | | | 3.400 | % | | | 09/15/26 | | | | 100,000 | | | | 106,818 | |
| | | | | | | | | | | | | | | | 2,911,558 | |
Insurance — 1.9% |
Athene Global Funding (c) | | | 2.500 | % | | | 01/14/25 | | | | 225,000 | | | | 230,819 | |
Equitable Financial Life (c) | | | 1.800 | % | | | 03/08/28 | | | | 609,000 | | | | 598,862 | |
Lincoln National Corp. | | | 3.625 | % | | | 12/12/26 | | | | 100,000 | | | | 108,434 | |
MassMutual Global Funding (c) | | | 1.200 | % | | | 07/16/26 | | | | 400,000 | | | | 391,917 | |
MassMutual Global Funding (c) | | | 2.150 | % | | | 03/09/31 | | | | 500,000 | | | | 497,262 | |
Met Life Global Funding I (c) | | | 1.550 | % | | | 01/07/31 | | | | 500,000 | | | | 472,643 | |
New York Life Global Funding (c) | | | 2.900 | % | | | 01/17/24 | | | | 100,000 | | | | 103,634 | |
New York Life Global Funding (c) | | | 2.350 | % | | | 07/14/26 | | | | 50,000 | | | | 51,625 | |
New York Life Global Funding (c) | | | 1.200 | % | | | 08/07/30 | | | | 1,250,000 | | | | 1,166,346 | |
Pacific Life Global Fund II (c) | | | 1.450 | % | | | 01/20/28 | | | | 500,000 | | | | 484,249 | |
Pricoa Global Funding (c) | | | 3.450 | % | | | 09/01/23 | | | | 160,000 | | | | 166,796 | |
Principal Life Global Funding II (c) | | | 1.250 | % | | | 06/23/25 | | | | 525,000 | | | | 518,749 | |
Principal Life Global Funding II (c) | | | 0.875 | % | | | 01/12/26 | | | | 500,000 | | | | 483,857 | |
Progressive Corp. | | | 3.200 | % | | | 03/26/30 | | | | 240,000 | | | | 258,928 | |
Protective Life Global Funding (c) | | | 1.900 | % | | | 07/05/28 | | | | 650,000 | | | | 634,466 | |
Protective Life Global Funding (c) | | | 1.737 | % | | | 09/21/30 | | | | 1,100,000 | | | | 1,046,036 | |
RGA Global Funding (c) | | | 2.000 | % | | | 11/30/26 | | | | 300,000 | | | | 301,018 | |
| | | | | | | | | | | | | | | | 7,515,641 | |
Natural Gas — 0.1% |
Atmos Energy Corp. | | | 2.625 | % | | | 09/15/29 | | | | 310,000 | | | | 318,713 | |
DIAMOND HILL FUNDS | ANNUAL REPORT | DECEMBER 31, 2021 | DIAMOND-HILL.COM 57 |
Diamond Hill Core Bond Fund
Schedule of Investments (Continued)
December 31, 2021
| | Coupon | | | Maturity | | | Shares /
Par Value | | | Fair
Value | |
Corporate Credit — 17.3% continued |
Other Utility — 0.3% |
American Water Capital Corp. | | | 2.800 | % | | | 05/01/30 | | | $ | 300,000 | | | $ | 310,906 | |
American Water Capital Corp. (b) | | | 2.300 | % | | | 06/01/31 | | | | 825,000 | | | | 824,961 | |
| | | | | | | | | | | | | | | | 1,135,867 | |
REITS — 1.0% |
Alexandria Real Estate Equities, Inc. | | | 3.950 | % | | | 01/15/28 | | | | 100,000 | | | | 110,404 | |
American Campus Communities, Inc. | | | 3.750 | % | | | 04/15/23 | | | | 309,000 | | | | 317,361 | |
American Campus Communities, Inc. | | | 3.625 | % | | | 11/15/27 | | | | 100,000 | | | | 106,787 | |
American Homes 4 Rent | | | 4.250 | % | | | 02/15/28 | | | | 100,000 | | | | 110,780 | |
Boston Properties LP | | | 2.750 | % | | | 10/01/26 | | | | 50,000 | | | | 52,027 | |
CubeSmart LP | | | 3.125 | % | | | 09/01/26 | | | | 50,000 | | | | 52,463 | |
CubeSmart LP | | | 3.000 | % | | | 02/15/30 | | | | 280,000 | | | | 291,806 | |
CubeSmart LP | | | 2.000 | % | | | 02/15/31 | | | | 200,000 | | | | 192,647 | |
ERP Operating LP (b) | | | 2.850 | % | | | 11/01/26 | | | | 100,000 | | | | 105,189 | |
ERP Operating LP | | | 2.500 | % | | | 02/15/30 | | | | 150,000 | | | | 153,879 | |
Life Storage LP | | | 3.875 | % | | | 12/15/27 | | | | 100,000 | | | | 109,693 | |
Public Storage | | | 1.850 | % | | | 05/01/28 | | | | 800,000 | | | | 798,345 | |
Realty Income Corp. (b) | | | 3.875 | % | | | 04/15/25 | | | | 100,000 | | | | 107,567 | |
Realty Income Corp. | | | 0.750 | % | | | 03/15/26 | | | | 625,000 | | | | 599,981 | |
Realty Income Corp. (b) | | | 3.000 | % | | | 01/15/27 | | | | 100,000 | | | | 105,494 | |
Spirit Realty LP | | | 4.450 | % | | | 09/15/26 | | | | 100,000 | | | | 110,008 | |
Spirit Realty LP | | | 2.100 | % | | | 03/15/28 | | | | 250,000 | | | | 243,325 | |
Spirit Realty LP | | | 4.000 | % | | | 07/15/29 | | | | 60,000 | | | | 65,909 | |
Spirit Realty LP | | | 3.200 | % | | | 02/15/31 | | | | 250,000 | | | | 258,369 | |
| | | | | | | | | | | | | | | | 3,892,034 | |
Technology — 0.5% |
Apple, Inc. | | | 2.200 | % | | | 09/11/29 | | | | 250,000 | | | | 255,883 | |
Apple, Inc. | | | 1.650 | % | | | 05/11/30 | | | | 300,000 | | | | 291,956 | |
Dell International, LLC / EMC Corp. | | | 5.300 | % | | | 10/01/29 | | | | 100,000 | | | | 117,219 | |
Fidelity National Information Services (b) | | | 1.650 | % | | | 03/01/28 | | | | 300,000 | | | | 290,461 | |
Oracle Corp. | | | 2.800 | % | | | 04/01/27 | | | | 300,000 | | | | 309,295 | |
Oracle Corp. | | | 2.300 | % | | | 03/25/28 | | | | 300,000 | | | | 299,070 | |
Oracle Corp. (b) | | | 3.250 | % | | | 05/15/30 | | | | 500,000 | | | | 518,335 | |
| | | | | | | | | | | | | | | | 2,082,219 | |
| | Coupon | | | Maturity | | | Shares /
Par Value | | | Fair
Value | |
Transportation — 0.7% |
Alaska Airlines, Series 2020-1B, Class A (c) | | | 4.800 | % | | | 08/15/27 | | | $ | 138,239 | | | $ | 151,032 | |
American Airlines Pass-Through Trust, Series 2016-2, Class AA | | | 3.200 | % | | | 12/15/29 | | | | 344,025 | | | | 345,780 | |
CSX Corp. | | | 4.250 | % | | | 11/01/66 | | | | 100,000 | | | | 122,199 | |
FedEx Corp. | | | 2.400 | % | | | 05/15/31 | | | | 500,000 | | | | 501,001 | |
FedEx Corp. | | | 1.875 | % | | | 02/20/34 | | | | 496,927 | | | | 489,230 | |
Kirby Corp. | | | 4.200 | % | | | 03/01/28 | | | | 100,000 | | | | 107,668 | |
Southwest Airlines Co. (b) | | | 3.000 | % | | | 11/15/26 | | | | 100,000 | | | | 104,238 | |
U.S. Airways Pass-Through Trust, Series 2011-1, Class A | | | 7.125 | % | | | 04/22/25 | | | | 28,083 | | | | 29,584 | |
United Airlines Pass-Through Trust, Series 2007-1, Class A | | | 6.636 | % | | | 01/02/24 | | | | 20,871 | | | | 21,316 | |
United Airlines Pass-Through Trust, Series 2020-1, Class B | | | 4.875 | % | | | 07/15/27 | | | | 449,000 | | | | 467,455 | |
United Airlines Pass-Through Trust, Series 2020-1, Class A | | | 5.875 | % | | | 04/15/29 | | | | 270,990 | | | | 296,835 | |
| | | | | | | | | | | | | | | | 2,636,338 | |
| |
Total Corporate Credit |
(Cost $68,668,281) | | $ | 69,119,748 | |
| |
Government Related — 0.2% |
Government Owned, No Guarantee — 0.2% |
Tennessee Valley Authority (Cost $770,224) | | | 4.625 | % | | | 09/15/60 | | | | 525,000 | | | | 803,680 | |
| |
Securitized — 61.2% |
ABS-Other — 4.8% |
BXG Receivables, Series 2018-A, Class C (c) | | | 4.440 | % | | | 02/02/34 | | | | 297,660 | | | | 307,357 | |
Cascade Funding Mortgage Trust, Series 2021-GRN1, Class B (c) | | | 1.830 | % | | | 03/20/41 | | | | 1,000,000 | | | | 973,130 | |
Diamond Resorts Owner Trust, Series 2019-1, Class B (c) | | | 3.530 | % | | | 02/20/32 | | | | 106,258 | | | | 107,865 | |
58 DIAMOND HILL FUNDS | ANNUAL REPORT | DECEMBER 31, 2021 | DIAMOND-HILL.COM |
Diamond Hill Core Bond Fund
Schedule of Investments (Continued)
December 31, 2021
| | Coupon | | | Maturity | | | Shares /
Par Value | | | Fair
Value | |
Securitized — 61.2% continued |
ABS-Other — 4.8% continued |
Diamond Resorts Owner Trust, Series 2021-1A, Class B (c) | | | 2.050 | % | | | 11/21/33 | | | $ | 525,385 | | | $ | 522,983 | |
Diamond Resorts Owner Trust, Series 2021-1A, Class C (c) | | | 2.700 | % | | | 11/21/33 | | | | 315,231 | | | | 313,776 | |
FMC GMSR Issuer Trust, Series 2020-GT1, Class A (a)(c) | | | 4.450 | % | | | 01/25/26 | | | | 1,000,000 | | | | 1,001,734 | |
FMC GMSR Issuer Trust, Series 2021-GT1, Class A (c) | | | 3.620 | % | | | 07/25/26 | | | | 1,250,000 | | | | 1,239,405 | |
FMC GMSR Issuer Trust, Series 2021-GT2, Class A (c) | | | 3.850 | % | | | 10/26/26 | | | | 1,000,000 | | | | 991,726 | |
Gold Key Resorts, LLC, Series 2014-A, Class A (c) | | | 3.220 | % | | | 03/17/31 | | | | 15,010 | | | | 15,126 | |
GoodGreen Trust, Series 2017-1A, Class A (c) | | | 3.740 | % | | | 10/15/52 | | | | 62,404 | | | | 64,573 | |
GoodGreen Trust, Series 2020-1A, Class A (c) | | | 2.630 | % | | | 04/15/55 | | | | 357,919 | | | | 357,080 | |
Helios Issuer, LLC, Series 2019-AA, Class A (c) | | | 3.750 | % | | | 06/20/46 | | | | 104,021 | | | | 108,162 | |
Helios Issuer, LLC, Series 2020-4, Class A (c) | | | 2.980 | % | | | 06/20/47 | | | | 246,106 | | | | 251,674 | |
Helios Issuer, LLC, Series 2021-A, Class A (c) | | | 1.800 | % | | | 02/20/48 | | | | 575,086 | | | | 565,832 | |
Hero Funding Trust, Series 2016-2A, Class A (c) | | | 3.750 | % | | | 09/20/41 | | | | 117,762 | | | | 121,738 | |
Hero Funding Trust, Series 2016-3A, Class A1 (c) | | | 3.080 | % | | | 09/20/42 | | | | 184,134 | | | | 188,570 | |
Hero Funding Trust, Series 2016-3B, Class B (c) | | | 5.240 | % | | | 09/20/42 | | | | 94,630 | | | | 94,610 | |
| | Coupon | | | Maturity | | | Shares /
Par Value | | | Fair
Value | |
ABS-Other — 4.8% continued |
Hero Funding Trust, Series 2016-4A, Class A1 (c) | | | 3.570 | % | | | 09/20/47 | | | $ | 172,146 | | | $ | 178,077 | |
Hero Funding Trust, Series 2016-4B, Class B (c) | | | 4.990 | % | | | 09/20/47 | | | | 96,538 | | | | 97,700 | |
Hero Funding Trust, Series 2017-3A, Class A1 (c) | | | 3.190 | % | | | 09/20/48 | | | | 152,148 | | | | 155,683 | |
Hero Funding Trust, Series 2018-1A, Class A2 (c) | | | 4.670 | % | | | 09/20/48 | | | | 58,687 | | | | 61,625 | |
Holiday Inn Timeshare Trust, Series 2020-A, Class C (c) | | | 3.420 | % | | | 10/09/39 | | | | 477,263 | | | | 485,719 | |
Loanpal Solar Loan Ltd., Series 2020-3GS, Class B (c) | | | 3.450 | % | | | 12/20/47 | | | | 600,000 | | | | 620,835 | |
Loanpal Solar Loan Ltd., Series 2021-1GS, Class A (c) | | | 2.290 | % | | | 01/20/48 | | | | 597,938 | | | | 597,681 | |
Loanpal Solar Loan Ltd., Series 2021-1GS, Class B (c) | | | 2.840 | % | | | 01/20/48 | | | | 962,099 | | | | 971,749 | |
Loanpal Solar Loan Ltd., Series 2021-2GS, Class A (c) | | | 2.220 | % | | | 03/20/48 | | | | 860,701 | | | | 853,519 | |
Mill City Solar Loan Ltd., Series 2019-2GS, Class A (c) | | | 3.690 | % | | | 07/20/43 | | | | 153,727 | | | | 161,085 | |
Mosaic Solar Loans, LLC, Series 2018-1, Class A (c) | | | 4.010 | % | | | 06/22/43 | | | | 87,945 | | | | 92,771 | |
Mosaic Solar Loans, LLC, Series 2017-2, Class B (c) | | | 4.770 | % | | | 06/22/43 | | | | 52,384 | | | | 55,454 | |
Mosaic Solar Loans, LLC, Series 2020-1, Class A (c) | | | 2.100 | % | | | 04/20/46 | | | | 222,991 | | | | 223,604 | |
MVW Own Trust, Series 2021-1WA, Class C (c) | | | 1.940 | % | | | 01/22/41 | | | | 553,412 | | | | 545,217 | |
DIAMOND HILL FUNDS | ANNUAL REPORT | DECEMBER 31, 2021 | DIAMOND-HILL.COM 59 |
Diamond Hill Core Bond Fund
Schedule of Investments (Continued)
December 31, 2021
| | Coupon | | | Maturity | | | Shares /
Par Value | | | Fair
Value | |
Securitized — 61.2% continued |
ABS-Other — 4.8% continued |
NRZ Excess Spread Collateralization, Series 2021-GNT1, Class A (c) | | | 3.474 | % | | | 11/25/26 | | | $ | 767,106 | | | $ | 766,313 | |
Ocwen Master Advance Receivables, Series 2020-T1, Class A-T1 (c) | | | 1.300 | % | | | 08/15/52 | | | | 670,000 | | | | 669,879 | |
PNMAC GMSR Issuer Trust, Series 2018-GT2, Class NT (1* 1MO LIBOR + 265) (c) | | | 2.742 | % | | | 08/25/23 | | | | 1,000,000 | | | | 1,001,074 | |
Renew Financial, LLC, Series 2017-1, Class A (c) | | | 3.670 | % | | | 09/20/52 | | | | 354,080 | | | | 364,611 | |
Renew Financial, LLC, Series 2017-1, Class B (c) | | | 5.750 | % | | | 09/20/52 | | | | 30,126 | | | | 30,499 | |
Renew Financial, LLC, Series 2017-2, Class A (c) | | | 3.220 | % | | | 09/22/53 | | | | 40,503 | | | | 41,723 | |
SPS Servicer Advance Receivables, Series 2020-T1, Class DT1 (c) | | | 2.370 | % | | | 11/15/52 | | | | 199,000 | | | | 198,913 | |
SPS Servicer Advance Receivables, Series 2020-T2, Class D (c) | | | 3.160 | % | | | 11/15/55 | | | | 494,000 | | | | 478,850 | |
Sunnova Solar Issuer, LLC, Series 2020-2A, Class A (c) | | | 2.730 | % | | | 11/01/55 | | | | 1,078,303 | | | | 1,076,555 | |
TES, LLC, Series 2017-1, Class A (c) | | | 4.330 | % | | | 10/20/47 | | | | 284,059 | | | | 296,670 | |
Westgate Resorts, Series 2018-1, Class B (c) | | | 3.580 | % | | | 12/20/31 | | | | 50,285 | | | | 50,514 | |
Westgate Resorts, Series 2018-1, Class C (c) | | | 4.100 | % | | | 12/20/31 | | | | 50,285 | | | | 50,467 | |
Westgate Resorts, Series 2020-1, Class B (c) | | | 3.963 | % | | | 03/20/34 | | | | 686,854 | | | | 702,393 | |
| | Coupon | | | Maturity | | | Shares /
Par Value | | | Fair
Value | |
ABS-Other — 4.8% continued |
Westgate Resorts, Series 2020-1A, Class C (c) | | | 6.213 | % | | | 03/20/34 | | | $ | 979,471 | | | $ | 1,021,296 | |
| | | | | | | | | | | | | | | | 19,075,817 | |
Agency CMBS — 2.7% |
FARM Mortgage Trust, Series 2021-1, Class A (c) | | | 2.180 | % | | | 01/25/51 | | | | 6,146,806 | | | | 6,108,683 | |
FNMA, Pool #FN AN3047 | | | 2.370 | % | | | 10/01/26 | | | | 126,126 | | | | 130,270 | |
FNMA, Pool #FN BM6011 | | | 3.353 | % | | | 11/01/26 | | | | 902,319 | | | | 966,221 | |
FNMA, Series 2019-M21, Class 1A1 | | | 1.950 | % | | | 04/25/28 | | | | 505,111 | | | | 515,836 | |
FNMA, Pool #FN AN3598 | | | 2.550 | % | | | 12/01/28 | | | | 271,224 | | | | 284,657 | |
FNMA, Pool #FN BL4548 | | | 2.430 | % | | | 10/01/29 | | | | 191,437 | | | | 199,986 | |
FNMA, Pool #FN 464107 | | | 4.820 | % | | | 12/01/29 | | | | 118,551 | | | | 130,991 | |
FNMA, Pool #FN AM9491 | | | 3.550 | % | | | 08/01/30 | | | | 170,679 | | | | 188,695 | |
FNMA, Pool #FN AN6149 | | | 3.140 | % | | | 07/01/32 | | | | 750,000 | | | | 829,488 | |
FNMA, Pool #FN AN7612 | | | 3.280 | % | | | 12/01/32 | | | | 250,000 | | | | 277,206 | |
FNMA, Pool #FN 469130 | | | 4.870 | % | | | 10/01/41 | | | | 126,689 | | | | 141,740 | |
FNMA, Pool #FN AM5015 | | | 4.940 | % | | | 12/01/43 | | | | 753,112 | | | | 876,044 | |
| | | | | | | | | | | | | | | | 10,649,817 | |
Agency MBS CMO — 18.2% |
FHLMC, Series 306, Class F3, Pool #FG S20432 (1* 1MO LIBOR + 30) (a) | | | 0.410 | % | | | 05/15/28 | | | | 62,078 | | | | 61,526 | |
FHLMC, Series 4847, Class CV | | | 3.500 | % | | | 02/15/30 | | | | 420,016 | | | | 443,556 | |
FHLMC, Series 2646, Class ZH | | | 5.000 | % | | | 07/15/33 | | | | 125,329 | | | | 152,104 | |
FHLMC, Series 4265, Class FD (1* 1MO LIBOR + 40) (a) | | | 0.510 | % | | | 01/15/35 | | | | 269,296 | | | | 271,427 | |
FHLMC, Series 2006-71, Class ZH | | | 6.000 | % | | | 07/25/36 | | | | 318,673 | | | | 368,202 | |
60 DIAMOND HILL FUNDS | ANNUAL REPORT | DECEMBER 31, 2021 | DIAMOND-HILL.COM |
Diamond Hill Core Bond Fund
Schedule of Investments (Continued)
December 31, 2021
| | Coupon | | | Maturity | | | Shares /
Par Value | | | Fair
Value | |
Securitized — 61.2% continued |
Agency MBS CMO — 18.2% continued |
FHLMC, Series 4613, Class AF (1* 1MO LIBOR + 110) (a) | | | 1.210 | % | | | 11/15/37 | | | $ | 88,945 | | | $ | 90,087 | |
FHLMC, Series 3605, Class PB | | | 4.500 | % | | | 11/15/39 | | | | 78,257 | | | | 85,656 | |
FHLMC, Series 3617, Class PC | | | 4.500 | % | | | 12/15/39 | | | | 88,936 | | | | 97,375 | |
FHLMC, Series 3740, Class FC (1* 1MO LIBOR + 50) (a) | | | 0.610 | % | | | 10/15/40 | | | | 91,341 | | | | 92,482 | |
FHLMC, Series 3759, Class ME | | | 4.000 | % | | | 11/15/40 | | | | 555,000 | | | | 583,547 | |
FHLMC, Series 3811, Class TA | | | 5.000 | % | | | 02/15/41 | | | | 262,142 | | | | 297,011 | |
FHLMC, Series 3895, Class BF (1* 1MO LIBOR + 50) (a) | | | 0.610 | % | | | 07/15/41 | | | | 90,268 | | | | 91,299 | |
FHLMC, Series 4074, Class JY | | | 2.500 | % | | | 07/15/42 | | | | 475,000 | | | | 485,751 | |
FHLMC, Series 4165, Class ZT | | | 3.000 | % | | | 02/15/43 | | | | 158,215 | | | | 158,416 | |
FHLMC, Series 4180, Class ZB | | | 3.000 | % | | | 03/15/43 | | | | 232,725 | | | | 234,032 | |
FHLMC, Series 4210, Class Z | | | 3.000 | % | | | 05/15/43 | | | | 337,893 | | | | 346,931 | |
FHLMC, Series 4447, Class YZ | | | 4.000 | % | | | 08/15/43 | | | | 1,469,522 | | | | 1,586,950 | |
FHLMC, Series 4333, Class GL | | | 3.500 | % | | | 04/15/44 | | | | 250,000 | | | | 276,869 | |
FHLMC, Series 4408, Class BC | | | 3.000 | % | | | 11/15/44 | | | | 1,020,410 | | | | 1,060,896 | |
FHLMC, Series 4673, Class PH | | | 3.500 | % | | | 01/15/45 | | | | 355,559 | | | | 367,427 | |
FHLMC, Series 4473, Class Z | | | 3.000 | % | | | 05/15/45 | | | | 389,777 | | | | 406,200 | |
FHLMC, Series 4531, Class PZ | | | 3.500 | % | | | 11/15/45 | | | | 1,353,167 | | | | 1,408,335 | |
FHLMC, Series 4738, Class TW | | | 3.000 | % | | | 11/15/46 | | | | 1,385,000 | | | | 1,446,746 | |
FHLMC, Series 4857, Class H | | | 4.000 | % | | | 11/15/46 | | | | 471,592 | | | | 481,255 | |
FHLMC, Series 4736, Class CL | | | 3.000 | % | | | 12/15/47 | | | | 441,240 | | | | 468,375 | |
FHLMC, Series 4753, Class EZ | | | 3.500 | % | | | 12/15/47 | | | | 2,016,988 | | | | 2,144,564 | |
FHLMC, Series 4745, Class CZ | | | 3.500 | % | | | 01/15/48 | | | | 2,645,091 | | | | 2,827,909 | |
FHLMC, Series 4801, Class ZN | | | 4.000 | % | | | 05/15/48 | | | | 1,153,839 | | | | 1,226,325 | |
| | Coupon | | | Maturity | | | Shares /
Par Value | | | Fair
Value | |
Agency MBS CMO — 18.2% continued |
FHLMC, Series 4941, Class NW | | | 2.500 | % | | | 05/25/49 | | | $ | 758,520 | | | $ | 754,988 | |
FHLMC, Series 4911, Class JM | | | 3.500 | % | | | 09/25/49 | | | | 1,000,000 | | | | 1,102,772 | |
FHLMC, Series 5011, Class DB | | | 2.000 | % | | | 09/25/50 | | | | 262,000 | | | | 228,395 | |
FHLMC, Series 4377, Class KZ | | | 3.500 | % | | | 02/15/52 | | | | 805,592 | | | | 893,473 | |
FNMA, Series 2010-155, Class JH | | | 4.000 | % | | | 12/25/28 | | | | 120,000 | | | | 128,810 | |
FNMA, Series 2018-091, Class VL | | | 3.500 | % | | | 10/20/29 | | | | 1,511,480 | | | | 1,594,625 | |
FNMA, Series 2013-35, Class YT | | | 6.500 | % | | | 09/25/32 | | | | 194,593 | | | | 224,209 | |
FNMA, Series 2012-129, Class HT | | | 2.000 | % | | | 12/25/32 | | | | 73,439 | | | | 73,206 | |
FNMA, Series 2002-86, Class PG | | | 6.000 | % | | | 12/25/32 | | | | 59,112 | | | | 68,598 | |
FNMA, Series 2004-56, Class Z | | | 7.500 | % | | | 03/25/34 | | | | 119,237 | | | | 142,644 | |
FNMA, Series 2004-17, Class BA | | | 6.000 | % | | | 04/25/34 | | | | 244,941 | | | | 297,308 | |
FNMA, Series 2005-3, Class CG | | | 5.500 | % | | | 02/25/35 | | | | 148,426 | | | | 164,308 | |
FNMA, Series 2005-62, Class ZL | | | 5.500 | % | | | 07/25/35 | | | | 268,653 | | | | 298,975 | |
FNMA, Series 2006-56, Class DC (1* 1MO LIBOR + 65) (a) | | | 0.752 | % | | | 07/25/36 | | | | 523,519 | | | | 528,100 | |
FNMA, Series 2009-19, Class TD | | | 5.000 | % | | | 08/25/36 | | | | 88,678 | | | | 98,971 | |
FNMA, Series 2007-95, Class A3 | | | 0.339 | % | | | 08/27/36 | | | | 1,600,000 | | | | 1,491,485 | |
FNMA, Series 2006-108, Class FD (1* 1MO LIBOR + 38) (a) | | | 0.482 | % | | | 11/25/36 | | | | 127,368 | | | | 129,003 | |
FNMA, Series 2007-39, Class NB | | | 4.250 | % | | | 05/25/37 | | | | 119,455 | | | | 127,786 | |
FNMA, Series 2008-60, Class JC | | | 5.000 | % | | | 07/25/38 | | | | 190,657 | | | | 212,479 | |
DIAMOND HILL FUNDS | ANNUAL REPORT | DECEMBER 31, 2021 | DIAMOND-HILL.COM 61 |
Diamond Hill Core Bond Fund
Schedule of Investments (Continued)
December 31, 2021
| | Coupon | | | Maturity | | | Shares /
Par Value | | | Fair
Value | |
Securitized — 61.2% continued |
Agency MBS CMO — 18.2% continued |
FNMA, Series 2009-103, Class MB | | | 1.986 | % | | | 12/25/39 | | | $ | 39,016 | | | $ | 40,706 | |
FNMA, Series 2010-2, Class LC | | | 5.000 | % | | | 02/25/40 | | | | 200,000 | | | | 226,614 | |
FNMA, Series 2011-14, Class PB | | | 5.000 | % | | | 03/25/41 | | | | 570,000 | | | | 640,697 | |
FNMA, Series 2011-57, Class PD | | | 4.000 | % | | | 07/25/41 | | | | 321,407 | | | | 360,119 | |
FNMA, Series 2011-62, Class UA | | | 4.500 | % | | | 07/25/41 | | | | 765,149 | | | | 808,859 | |
FNMA, Series 2012-9, Class FC (1* 1MO LIBOR + 40) (a) | | | 0.502 | % | | | 02/25/42 | | | | 124,962 | | | | 126,289 | |
FNMA, Series 2013-34, Class GP | | | 3.000 | % | | | 05/25/42 | | | | 446,096 | | | | 453,102 | |
FNMA, Series 2012-52, Class PQ | | | 3.500 | % | | | 05/25/42 | | | | 1,741,006 | | | | 1,890,554 | |
FNMA, Series 2012-79, Class QB | | | 2.000 | % | | | 07/25/42 | | | | 250,183 | | | | 249,557 | |
FNMA, Series 2003-W2, Class 1-1A | | | 6.500 | % | | | 07/25/42 | | | | 733,180 | | | | 837,603 | |
FNMA, Series 411, Class A3 | | | 3.000 | % | | | 08/25/42 | | | | 111,546 | | | | 115,420 | |
FNMA, Series 2012-99, Class UY | | | 2.500 | % | | | 09/25/42 | | | | 329,000 | | | | 335,600 | |
FNMA, Series 2013-35, Class LP | | | 3.000 | % | | | 01/25/43 | | | | 352,000 | | | | 358,001 | |
FNMA, Series 2013-35, Class CV | | | 3.000 | % | | | 02/25/43 | | | | 350,000 | | | | 367,226 | |
FNMA, Series 2013-13, Class WH | | | 3.500 | % | | | 03/25/43 | | | | 1,000,000 | | | | 1,018,241 | |
FNMA, Series 2013-31, Class NT | | | 3.000 | % | | | 04/25/43 | | | | 55,712 | | | | 55,540 | |
FNMA, Series 2003-W10, Class 3A-5 | | | 4.299 | % | | | 06/25/43 | | | | 596,799 | | | | 634,339 | |
| | Coupon | | | Maturity | | | Shares /
Par Value | | | Fair
Value | |
Agency MBS CMO — 18.2% continued |
FNMA, Series 2013-104, Class CY | | | 5.000 | % | | | 10/25/43 | | | $ | 250,000 | | | $ | 300,450 | |
FNMA, Series 2013-115, Class PB | | | 4.500 | % | | | 11/25/43 | | | | 300,000 | | | | 362,178 | |
FNMA, Series 2015-11, Class MZ | | | 4.000 | % | | | 12/25/43 | | | | 4,780,703 | | | | 5,176,853 | |
FNMA, Series 2014-2, Class PB | | | 4.000 | % | | | 02/25/44 | | | | 660,434 | | | | 677,822 | |
FNMA, Series 2017-16, Class UW | | | 3.000 | % | | | 07/25/45 | | | | 2,044,494 | | | | 2,174,594 | |
FNMA, Series 2016-68, Class AL | | | 3.000 | % | | | 10/25/46 | | | | 850,000 | | | | 896,806 | |
FNMA, Series 2017-77, Class HZ | | | 3.500 | % | | | 10/25/47 | | | | 1,300,629 | | | | 1,341,870 | |
FNMA, Series 2018-08, Class DZ | | | 3.500 | % | | | 02/25/48 | | | | 913,148 | | | | 942,036 | |
FNMA, Series 2018-31, Class KQ | | | 3.500 | % | | | 05/25/48 | | | | 847,826 | | | | 891,289 | |
FNMA, Series 2018-66, Class PZ | | | 4.000 | % | | | 09/25/48 | | | | 547,607 | | | | 617,922 | |
FNMA, Series 2019-01, Class MH | | | 3.000 | % | | | 02/25/49 | �� | | | 307,882 | | | | 318,117 | |
FNMA, Series 2019-8, Class ZD | | | 3.500 | % | | | 03/25/49 | | | | 552,045 | | | | 607,201 | |
FNMA, Series 2019-038, Class MT | | | 3.000 | % | | | 07/25/49 | | | | 1,176,237 | | | | 1,222,189 | |
FNMA, Series 2019-40, Class PL | | | 4.000 | % | | | 07/25/49 | | | | 318,000 | | | | 355,139 | |
FNMA, Series 2019-60, Class WZ | | | 2.750 | % | | | 10/25/49 | | | | 557,124 | | | | 571,817 | |
FNMA, Series 2019-83, Class EB | | | 2.000 | % | | | 01/25/50 | | | | 171,000 | | | | 156,631 | |
FNMA, Series 2020-15, Class KY | | | 3.000 | % | | | 03/25/50 | | | | 2,077,414 | | | | 2,165,438 | |
FNMA, Series 2021-149, Class ZB | | | 3.000 | % | | | 08/20/51 | | | | 1,207,314 | | | | 1,203,646 | |
62 DIAMOND HILL FUNDS | ANNUAL REPORT | DECEMBER 31, 2021 | DIAMOND-HILL.COM |
Diamond Hill Core Bond Fund
Schedule of Investments (Continued)
December 31, 2021
| | Coupon | | | Maturity | | | Shares /
Par Value | | | Fair
Value | |
Securitized — 61.2% continued |
Agency MBS CMO — 18.2% continued |
GNMA, Series 2015-161, Class AV | | | 3.000 | % | | | 01/20/29 | | | $ | 368,923 | | | $ | 383,980 | |
GNMA, Series 2018-139, Class DV | | | 3.500 | % | | | 01/20/30 | | | | 453,900 | | | | 467,836 | |
GNMA, Series 2004-49, Class MZ | | | 6.000 | % | | | 06/20/34 | | | | 407,576 | | | | 461,955 | |
GNMA, Series 2005-13, Class BG | | | 5.000 | % | | | 02/20/35 | | | | 226,503 | | | | 249,602 | |
GNMA, Series 2015-123, Class VB | | | 3.500 | % | | | 09/20/35 | | | | 436,000 | | | | 456,567 | |
GNMA, Series 2006-17, Class JN | | | 6.000 | % | | | 04/20/36 | | | | 189,868 | | | | 211,978 | |
GNMA, Series 2008-51, Class PH | | | 5.250 | % | | | 06/20/38 | | | | 113,279 | | | | 123,436 | |
GNMA, Series 2009-2, Class PA | | | 5.000 | % | | | 12/20/38 | | | | 79,677 | | | | 85,140 | |
GNMA, Series 2010-9, Class FA (1* 1MO LIBOR + 52) (a) | | | 0.628 | % | | | 01/16/40 | | | | 120,174 | | | | 121,371 | |
GNMA, Series 2014-79, Class HU | | | 3.000 | % | | | 02/16/40 | | | | 544,189 | | | | 563,528 | |
GNMA, Series 2010-105, Class ZC | | | 4.500 | % | | | 08/16/40 | | | | 499,111 | | | | 574,458 | |
GNMA, Series 2013-22, Class GA | | | 2.500 | % | | | 10/20/41 | | | | 12,097 | | | | 12,551 | |
GNMA, Series 2012-74, Class LY | | | 2.500 | % | | | 06/20/42 | | | | 318,000 | | | | 317,422 | |
GNMA, Series 2012-134, Class KM | | | 2.000 | % | | | 09/20/42 | | | | 342,000 | | | | 331,473 | |
GNMA, Series 2012-113, Class NZ | | | 4.500 | % | | | 09/20/42 | | | | 275,745 | | | | 283,509 | |
GNMA, Series 2013-6, Class PE | | | 2.000 | % | | | 01/20/43 | | | | 100,000 | | | | 98,771 | |
GNMA, Series 2013-5, Class GY | | | 3.000 | % | | | 01/20/43 | | | | 532,000 | | | | 573,622 | |
| | Coupon | | | Maturity | | | Shares /
Par Value | | | Fair
Value | |
Agency MBS CMO — 18.2% continued |
GNMA, Series 2015-179, Class ZB | | | 2.500 | % | | | 02/20/45 | | | $ | 57,264 | | | $ | 56,707 | |
GNMA, Series 2016-37, Class YA | | | 3.000 | % | | | 12/20/45 | | | | 1,052,870 | | | | 1,134,074 | |
GNMA, Series 2016-38, Class ZP | | | 3.500 | % | | | 03/20/46 | | | | 73,354 | | | | 78,875 | |
GNMA, Series 2016-74, Class PL | | | 3.000 | % | | | 05/20/46 | | | | 1,411,460 | | | | 1,454,215 | |
GNMA, Series 2016-120, Class YZ | | | 3.000 | % | | | 09/20/46 | | | | 1,000,000 | | | | 1,056,835 | |
GNMA, Series 2017-080, Class BZ | | | 3.500 | % | | | 05/20/47 | | | | 410,804 | | | | 451,918 | |
GNMA, Series 2018-006, Class JY | | | 2.750 | % | | | 01/20/48 | | | | 284,000 | | | | 263,303 | |
GNMA, Series 2018-14, Class MZ | | | 3.000 | % | | | 01/20/48 | | | | 387,958 | | | | 396,921 | |
GNMA, Series 2018-097, Class GY | | | 4.000 | % | | | 07/20/48 | | | | 1,162,000 | | | | 1,258,656 | |
GNMA, Series 2018-120, Class PY | | | 3.500 | % | | | 09/20/48 | | | | 689,379 | | | | 717,973 | |
GNMA, Series 2019-20, Class JK | | | 3.500 | % | | | 02/20/49 | | | | 206,237 | | | | 217,534 | |
GNMA, Series 2019-031, Class AZ | | | 5.000 | % | | | 03/20/49 | | | | 330,747 | | | | 362,192 | |
GNMA, Series 2019-052, Class HL | | | 4.000 | % | | | 04/20/49 | | | | 490,565 | | | | 526,484 | |
GNMA, Series 2019-99, Class EW | | | 3.000 | % | | | 08/20/49 | | | | 540,446 | | | | 583,350 | |
GNMA, Series 2019-99, Class GP | | | 3.500 | % | | | 08/20/49 | | | | 517,000 | | | | 566,252 | |
GNMA, Series 2020-093, Class AZ | | | 3.000 | % | | | 04/20/50 | | | | 810,691 | | | | 866,936 | |
GNMA, Series 2020-097, Class ML | | | 2.500 | % | | | 07/20/50 | | | | 1,975,000 | | | | 1,959,002 | |
GNMA, Series 2017-H18, Class EB (a) | | | 4.459 | % | | | 06/20/63 | | | | 221,362 | | | | 229,676 | |
DIAMOND HILL FUNDS | ANNUAL REPORT | DECEMBER 31, 2021 | DIAMOND-HILL.COM 63 |
Diamond Hill Core Bond Fund
Schedule of Investments (Continued)
December 31, 2021
| | Coupon | | | Maturity | | | Shares /
Par Value | | | Fair
Value | |
Securitized — 61.2% continued |
Agency MBS CMO — 18.2% continued |
GNMA, Series 2014-H14, Class FA (1* 1MO LIBOR + 50) (a) | | | 0.575 | % | | | 07/20/64 | | | $ | 310,414 | | | $ | 311,424 | |
GNMA, Series 2014-H15, Class FA (1* 1MO LIBOR + 50) (a) | | | 0.581 | % | | | 07/20/64 | | | | 79,611 | | | | 79,905 | |
GNMA, Series 2016-H11, Class FD (1* 12MO LIBOR + 40) (a) | | | 0.681 | % | | | 05/20/66 | | | | 218,924 | | | | 217,923 | |
GNMA, Series 2017-H16, Class DB (a) | | | 4.593 | % | | | 08/20/67 | | | | 161,414 | | | | 165,424 | |
| | | | | | | | | | | | | | | | 72,894,631 | |
Agency MBS CMO Derivatives — 2.6% |
FHLMC, Series 3919, Class QS (IO) (-1*1MO LIBOR + 670) (a) | | | 6.590 | % | | | 08/15/30 | | | | 1,687,863 | | | | 211,336 | |
FHLMC, Series 4214, Class CI (IO) | | | 3.000 | % | | | 06/15/31 | | | | 636,328 | | | | 19,929 | |
FHLMC, Series 4114, Class IM (IO) | | | 3.500 | % | | | 07/15/31 | | | | 965,664 | | | | 34,726 | |
FHLMC, Series 4169, Class SA (-1.2*1MO LIBOR + 546) (a) | | | 5.356 | % | | | 02/15/33 | | | | 558,788 | | | | 577,913 | |
FHLMC, Series 226, Class PO (PO) | | | 0.000 | % | | | 02/01/34 | | | | 138,788 | | | | 127,639 | |
FHLMC, Series 3107, Class DC (IO) (-1*1MO LIBOR + 670) (a) | | | 6.590 | % | | | 06/15/35 | | | | 1,646,462 | | | | 79,044 | |
FHLMC, Series 3102, Class TA (IO) (-1*1MO LIBOR + 5250) (a) | | | 7.500 | % | | | 01/15/36 | | | | 216,233 | | | | 241,628 | |
FHLMC, Series 3607, Class AO (PO) | | | 0.000 | % | | | 04/15/36 | | | | 92,703 | | | | 83,552 | |
FHLMC, Series 237, Class S14 (IO) (-1*1MO LIBOR + 660) (a) | | | 6.490 | % | | | 05/15/36 | | | | 364,101 | | | | 83,246 | |
FHLMC, Series 3199, Class OC (PO) | | | 0.000 | % | | | 08/15/36 | | | | 139,315 | | | | 127,849 | |
| | Coupon | | | Maturity | | | Shares /
Par Value | | | Fair
Value | |
Agency MBS CMO Derivatives — 2.6% continued |
FHLMC, Series 379, Class I (PO) | | | 0.000 | % | | | 05/25/37 | | | $ | 48,728 | | | $ | 44,798 | |
FHLMC, Series 3607, Class OP (PO) | | | 0.000 | % | | | 07/15/37 | | | | 327,499 | | | | 291,623 | |
FHLMC, Series 4006, Class IA (IO) | | | 4.500 | % | | | 09/15/41 | | | | 485,345 | | | | 48,344 | |
FHLMC, Series 4422, Class DO PO) | | | 0.000 | % | | | 10/15/41 | | | | 1,399,258 | | | | 1,294,315 | |
FHLMC, Series 4116, Class LI (IO) | | | 4.500 | % | | | 02/15/42 | | | | 1,424,022 | | | | 175,000 | |
FHLMC, Series 4074, Class SJ (IO) (-1*1MO LIBOR + 662) (a) | | | 6.510 | % | | | 07/15/42 | | | | 928,486 | | | | 213,101 | |
FHLMC, Pool #S0-6050 (PO) | | | 0.000 | % | | | 08/15/42 | | | | 197,133 | | | | 173,999 | |
FHLMC, Pool #S0-6829 (PO) | | | 0.000 | % | | | 09/15/43 | | | | 341,702 | | | | 294,940 | |
FNMA, Series 2012-128, Class EI (IO) | | | 3.500 | % | | | 11/25/27 | | | | 378,576 | | | | 23,485 | |
FNMA, Series 2012-148, Class IA (IO) | | | 4.000 | % | | | 01/25/28 | | | | 212,210 | | | | 15,779 | |
FNMA, Series 2004-91, Class SP (-2.4*1MO LIBOR + 1680) (a) | | | 16.555 | % | | | 11/25/31 | | | | 199,095 | | | | 255,522 | |
FNMA, Series 2004-61, Class GO (PO) | | | 0.000 | % | | | 11/25/32 | | | | 456,526 | | | | 426,443 | |
FNMA, Series 2013-89, Class DI (IO) | | | 4.000 | % | | | 08/25/33 | | | | 1,671,084 | | | | 167,424 | |
FNMA, Series 348, Class II (IO) | | | 6.000 | % | | | 01/25/34 | | | | 88,296 | | | | 17,529 | |
FNMA, Series 2015-82, Class AI (IO) | | | 3.500 | % | | | 06/25/34 | | | | 983,252 | | | | 82,754 | |
FNMA, Series 2016-28, Class DI (IO) | | | 3.500 | % | | | 03/25/35 | | | | 819,637 | | | | 74,122 | |
FNMA, Series 384, Class 11 (IO) | | | 5.000 | % | | | 03/25/35 | | | | 708,199 | | | | 112,628 | |
64 DIAMOND HILL FUNDS | ANNUAL REPORT | DECEMBER 31, 2021 | DIAMOND-HILL.COM |
Diamond Hill Core Bond Fund
Schedule of Investments (Continued)
December 31, 2021
| | Coupon | | | Maturity | | | Shares /
Par Value | | | Fair
Value | |
Securitized — 61.2% continued |
Agency MBS CMO Derivatives — 2.6% continued |
FNMA, Series 2005-52, Class JH (IO) (-1*1MO LIBOR + 660) (a) | | | 6.498 | % | | | 05/25/35 | | | $ | 371,783 | | | $ | 51,702 | |
FNMA, Series 378, Class (IO) | | | 5.000 | % | | | 06/01/35 | | | | 737,574 | | | | 115,946 | |
FNMA, Series 2016-24, Class KI (IO) | | | 3.500 | % | | | 07/25/35 | | | | 482,164 | | | | 48,885 | |
FNMA, Series 368, Class (IO) | | | 5.000 | % | | | 02/01/36 | | | | 581,904 | | | | 75,624 | |
FNMA, Series 2006-96, Class MO (PO) | | | 0.000 | % | | | 10/25/36 | | | | 42,565 | | | | 39,962 | |
FNMA, Series 398, Class C5 (IO) | | | 5.000 | % | | | 05/25/39 | | | | 802,644 | | | | 146,961 | |
FNMA, Series 2010-44, Class CS (IO) (-1*1MO LIBOR + 655) (a) | | | 6.448 | % | | | 05/25/40 | | | | 56,459 | | | | 9,487 | |
FNMA, Series 2012-63, Class NI (IO) | | | 4.000 | % | | | 06/25/40 | | | | 991,356 | | | | 34,516 | |
FNMA, Series 2011-14, Class PI (IO) | | | 5.000 | % | | | 06/25/40 | | | | 11,743 | | | | 84 | |
FNMA, Series 2012-100, Class MI (IO) | | | 4.500 | % | | | 12/25/40 | | | | 94,621 | | | | 1,460 | |
FNMA, Series 409, Class C1 | | | 4.000 | % | | | 04/01/42 | | | | 1,341,251 | | | | 186,330 | |
FNMA, Series 2012-99, Class QS (IO) (-1*1MO LIBOR + 660) (a) | | | 6.498 | % | | | 09/25/42 | | | | 2,259,483 | | | | 420,887 | |
FNMA, Series 2012-128, Class SH (-1*1MO LIBOR + 400) (a) | | | 3.898 | % | | | 11/25/42 | | | | 360,917 | | | | 356,876 | |
FNMA, Series 2016-32, Class GO (PO) | | | 0.000 | % | | | 01/25/43 | | | | 22,389 | | | | 18,831 | |
FNMA, Series 2016-30, Class IN (IO) | | | 3.500 | % | | | 02/25/43 | | | | 1,667,522 | | | | 106,272 | |
FNMA, Series 2013-30, Class SA (-1*1MO LIBOR + 400) (a) | | | 3.914 | % | | | 04/25/43 | | | | 417,774 | | | | 400,307 | |
| | Coupon | | | Maturity | | | Shares /
Par Value | | | Fair
Value | |
Agency MBS CMO Derivatives — 2.6% continued |
FNMA, Series 2003-W10, Class 3IO (IO) (a) | | | 0.538 | % | | | 06/25/43 | | | $ | 10,508,520 | | | $ | 160,888 | |
FNMA, Series 2013-82, Class SB (-2.67*1MO LIBOR + 1173) (a) | | | 11.503 | % | | | 08/25/43 | | | | 350,236 | | | | 423,695 | |
FNMA, Series 2013-101, Class DO (PO) | | | 0.000 | % | | | 10/25/43 | | | | 122,757 | | | | 103,936 | |
FNMA, Series 2014-42, Class SN (IO) (-1*1MO LIBOR + 605) (a) | | | 5.948 | % | | | 07/25/44 | | | | 473,958 | | | | 84,648 | |
FNMA, Series 2019-31, Class CI (IO) | | | 4.000 | % | | | 02/25/47 | | | | 1,520,993 | | | | 99,953 | |
FNMA, Series 2018-11B, Class QI (IO) | | | 4.000 | % | | | 01/25/48 | | | | 2,841,661 | | | | 276,675 | |
GNMA, Series 2010-47, Class PX (IO) (-1*1MO LIBOR + 670) (a) | | | 6.596 | % | | | 06/20/37 | | | | 698,080 | | | | 120,289 | |
GNMA, Series 2012-146, Class AI (IO) | | | 3.000 | % | | | 10/20/37 | | | | 1,484,521 | | | | 53,552 | |
GNMA, Series 2011-139, Class LS (IO) | | | 4.914 | % | | | 03/16/38 | | | | 1,704,118 | | | | 253,676 | |
GNMA, Series 2008-38, Class ID (IO) | | | 6.000 | % | | | 03/20/38 | | | | 200,885 | | | | 12,253 | |
GNMA, Series 2013-124, Class ES (-1.33*1MO LIBOR + 867) (a) | | | 8.528 | % | | | 04/20/39 | | | | 16,733 | | | | 17,050 | |
GNMA, Series 2013-147, Class SD (IO) (-1*1MO LIBOR + 665) (a) | | | 6.546 | % | | | 12/20/39 | | | | 1,677,392 | | | | 322,033 | |
GNMA, Series 2011-21, Class SA (IO) (-1*1MO LIBOR + 600) (a) | | | 5.893 | % | | | 02/16/41 | | | | 1,945,059 | | | | 332,083 | |
GNMA, Series 2011-145, Class QI (IO) | | | 5.000 | % | | | 11/16/41 | | | | 203,966 | | | | 30,492 | |
GNMA, Series 2013-113, Class QS (IO) (-1*1MO LIBOR + 620) (a) | | | 6.096 | % | | | 02/20/42 | | | | 408,694 | | | | 42,320 | |
DIAMOND HILL FUNDS | ANNUAL REPORT | DECEMBER 31, 2021 | DIAMOND-HILL.COM 65 |
Diamond Hill Core Bond Fund
Schedule of Investments (Continued)
December 31, 2021
| | Coupon | | | Maturity | | | Shares /
Par Value | | | Fair
Value | |
Securitized — 61.2% continued |
Agency MBS CMO Derivatives — 2.6% continued |
GNMA, Series 2014-141, Class IE (IO) | | | 4.000 | % | | | 08/20/43 | | | $ | 124,202 | | | $ | 2,339 | |
GNMA, Series 2017-004, Class WI (IO) | | | 4.000 | % | | | 02/20/44 | | | | 1,188,812 | | | | 82,324 | |
GNMA, Series 2016-32, Class MS (IO) (-1*1MO LIBOR + 605) (a) | | | 5.946 | % | | | 03/20/46 | | | | 1,830,038 | | | | 327,889 | |
GNMA, Series 2019-98, Class BI (IO) | | | 3.000 | % | | | 06/20/49 | | | | 847,484 | | | | 266,918 | |
GNMA, Series 2019-120, Class DI (IO) | | | 3.500 | % | | | 08/20/49 | | | | 2,076,614 | | | | 218,427 | |
GNMA, Series 2012-H02, Class AI (IO) (a) | | | 1.885 | % | | | 01/20/62 | | | | 47,332 | | | | 2,280 | |
GNMA, Series 2013-H13, Class T1 (IO) (a) | | | 0.466 | % | | | 05/20/63 | | | | 1,753,804 | | | | 16,870 | |
GNMA, Series 2016-H20, Class GI (IO) (a) | | | 0.346 | % | | | 08/20/66 | | | | 1,443,166 | | | | 14,449 | |
GNMA, Series 2017-H11, Class PI (IO) (a) | | | 3.978 | % | | | 04/20/67 | | | | 14,248 | | | | 308 | |
GNMA, Series 2017-H22, Class ID (IO) (a) | | | 4.210 | % | | | 11/20/67 | | | | 18,780 | | | | 1,337 | |
GNMA, Series 2018-H08, Class NI (IO) (a) | | | 0.830 | % | | | 05/20/68 | | | | 998,677 | | | | 21,596 | |
| | | | | | | | | | | | | | | | 10,601,078 | |
Agency MBS Passthrough — 2.2% |
FHLMC, Pool #FG G14973 | | | 4.000 | % | | | 12/01/28 | | | | 131,686 | | | | 140,765 | |
FHLMC, Pool #FG U59010 | | | 4.000 | % | | | 11/01/34 | | | | 357,415 | | | | 383,693 | |
FHLMC, Pool #FG G61909 | | | 4.500 | % | | | 12/01/37 | | | | 486,673 | | | | 535,563 | |
FHLMC, Pool #FG G06085 | | | 6.500 | % | | | 09/01/38 | | | | 61,239 | | | | 71,307 | |
FNMA, Pool #FN 252409 | | | 6.500 | % | | | 03/01/29 | | | | 75,879 | | | | 82,617 | |
FNMA, Pool #FN AL5850 | | | 3.500 | % | | | 10/01/29 | | | | 302,953 | | | | 321,592 | |
FNMA, Pool #FN AS7287 | | | 3.500 | % | | | 06/01/31 | | | | 519,432 | | | | 556,060 | |
FNMA, Pool #FN AL3200 | | | 3.500 | % | | | 02/01/33 | | | | 350,574 | | | | 372,809 | |
| | Coupon | | | Maturity | | | Shares /
Par Value | | | Fair
Value | |
Agency MBS Passthrough — 2.2% continued |
FNMA, Pool #FN AT7120 | | | 3.500 | % | | | 06/01/33 | | | $ | 445,366 | | | $ | 473,828 | |
FNMA, Pool #FN AL5166 | | | 3.000 | % | | | 11/01/33 | | | | 309,625 | | | | 322,541 | |
FNMA, Pool #FN AL6685 | | | 4.000 | % | | | 01/01/35 | | | | 526,707 | | | | 565,239 | |
FNMA, Pool #FN MA2198 | | | 3.500 | % | | | 03/01/35 | | | | 335,912 | | | | 359,266 | |
FNMA, Pool #FN BM1486 | | | 4.000 | % | | | 03/01/35 | | | | 1,063,681 | | | | 1,147,706 | |
FNMA, Pool #FN MA3050 | | | 4.500 | % | | | 06/01/37 | | | | 694,334 | | | | 756,978 | |
FNMA, Pool #FN AS4073 | | | 4.000 | % | | | 12/01/44 | | | | 212,135 | | | | 233,378 | |
FNMA, Pool #FN MA2778 | | | 3.500 | % | | | 10/01/46 | | | | 115,758 | | | | 120,299 | |
GNMA, Pool #MA5738M | | | 4.000 | % | | | 02/20/34 | | | | 267,600 | | | | 282,706 | |
GNMA, Pool #GN 784279 | | | 5.500 | % | | | 11/15/38 | | | | 378,282 | | | | 432,526 | |
GNMA, Pool #711522X | | | 4.500 | % | | | 07/15/40 | | | | 296,012 | | | | 345,085 | |
GNMA, Pool #GN 78541 | | | 4.500 | % | | | 06/15/46 | | | | 142,559 | | | | 159,821 | |
GNMA, Pool #G2 784792 | | | 4.500 | % | | | 08/20/49 | | | | 965,781 | | | | 1,008,389 | |
| | | | | | | | | | | | | | | | 8,672,168 | |
ARM — 0.0% (d) |
Structured Asset Securities Corp., Series 2003-37A, Class 2-A (a) | | | 2.045 | % | | | 12/25/33 | | | | 10,070 | | | | 10,342 | |
| |
Auto Loan — 2.8% |
ACC Auto Trust, Series 2021-A, Class A (c) | | | 1.080 | % | | | 04/15/27 | | | | 486,634 | | | | 485,385 | |
ACC Trust, Series 2021-1, Class B (c) | | | 1.430 | % | | | 07/22/24 | | | | 1,000,000 | | | | 995,902 | |
CarNow Auto Receivables Trust, Series 2021-1A, Class C (c) | | | 2.160 | % | | | 02/17/26 | | | | 750,000 | �� | | | 748,033 | |
CIG Auto Receivables Trust, Series 2020-1, Class D (c) | | | 2.350 | % | | | 01/12/26 | | | | 300,000 | | | | 301,277 | |
66 DIAMOND HILL FUNDS | ANNUAL REPORT | DECEMBER 31, 2021 | DIAMOND-HILL.COM |
Diamond Hill Core Bond Fund
Schedule of Investments (Continued)
December 31, 2021
| | Coupon | | | Maturity | | | Shares /
Par Value | | | Fair
Value | |
Securitized — 61.2% continued |
Auto Loan — 2.8% continued |
CIG Auto Receivables Trust, Series 2020-1, Class C (c) | | | 1.750 | % | | | 02/12/26 | | | $ | 460,000 | | | $ | 461,770 | |
CPS Auto Trust, Series 2017-D, Class D (c) | | | 3.730 | % | | | 09/15/23 | | | | 66,027 | | | | 66,322 | |
Credit Acceptance Auto Loan Trust, Series 2019-3, Class C (c) | | | 3.060 | % | | | 03/15/29 | | | | 400,000 | | | | 408,546 | |
Credit Acceptance Auto Loan Trust, Series 2020-3A, Class C (c) | | | 2.280 | % | | | 02/15/30 | | | | 550,000 | | | | 554,834 | |
Credito RL USA, Series 2021-1, Class A (c) | | | 1.350 | % | | | 02/16/27 | | | | 645,788 | | | | 644,449 | |
FHF Trust, Series 2020-1, Class A (c) | | | 2.590 | % | | | 12/15/23 | | | | 187,340 | | | | 188,179 | |
FHF Trust, Series 2021-1, Class A (c) | | | 1.270 | % | | | 03/15/27 | | | | 644,476 | | | | 640,318 | |
First Help Financial, LLC, Series 2021-2A, Class A (c) | | | 0.830 | % | | | 12/15/26 | | | | 933,794 | | | | 927,271 | |
First Help Financial, LLC, Series 2021-2A, Class B (c) | | | 1.630 | % | | | 09/15/27 | | | | 1,090,000 | | | | 1,071,686 | |
OneMain Direct Auto Receivables, Series 2018-1, Class B (c) | | | 3.710 | % | | | 04/14/25 | | | | 410,000 | | | | 410,785 | |
OneMain Direct Auto Receivables, Series 2019-1, Class D (c) | | | 4.680 | % | | | 04/14/31 | | | | 675,000 | | | | 726,630 | |
Santander Consumer Auto Receivables, Series 2020-B, Class D (c) | | | 2.140 | % | | | 12/15/26 | | | | 400,000 | | | | 403,452 | |
Tesla Auto Lease Trust, Series 2021-B, Class D (c) | | | 1.320 | % | | | 09/22/25 | | | | 1,400,000 | | | | 1,376,534 | |
| | Coupon | | | Maturity | | | Shares /
Par Value | | | Fair
Value | |
Auto Loan — 2.8% continued |
Veros Auto Receivables Trust, Series 2021-1, Class B (c) | | | 1.490 | % | | | 10/15/26 | | | $ | 1,000,000 | | | $ | 990,560 | |
| | | | | | | | | | | | | | | | 11,401,933 | |
CRE/CLO — 4.3% |
A10 Securitization, Series 2020-C, Class A (c)(e) | | | 2.033 | % | | | 08/15/40 | | | | 324,006 | | | | 324,505 | |
A10 Securitization, Series 2020-C, Class B (c)(e) | | | 2.617 | % | | | 08/15/40 | | | | 300,000 | | | | 298,422 | |
A10 Securitization, Series 2020-C, Class D (c)(e) | | | 4.129 | % | | | 08/15/40 | | | | 250,000 | | | | 249,047 | |
A10 Securitization, Series 2020-C, Class E (c)(e) | | | 5.465 | % | | | 08/15/40 | | | | 250,000 | | | | 249,739 | |
Acre Mortgage Trust, Series 2021-FL4, Class D (1* 1MO LIBOR + 260) (a)(c) | | | 2.689 | % | | | 12/15/37 | | | | 1,000,000 | | | | 997,624 | |
Acre Mortgage Trust, Series 2021-FL4, Class E (1* 1MO LIBOR + 310) (a)(c) | | | 3.189 | % | | | 12/15/37 | | | | 675,000 | | | | 673,392 | |
Bancorp Commercial Mortgage Trust (The), Series 2017-CRE2, Class C (1* 1MO LIBOR + 235) (a)(c) | | | 2.460 | % | | | 08/15/32 | | | | 115,014 | | | | 113,866 | |
Bancorp Commercial Mortgage Trust (The), Series 2018-CR3, Class D (1* 1MO LIBOR + 270) (a)(c) | | | 2.810 | % | | | 03/16/35 | | | | 293,431 | | | | 292,022 | |
BDS Ltd., Series 2021-FL8, Class D (c) | | | 1.989 | % | | | 01/18/36 | | | | 1,000,000 | | | | 992,766 | |
DIAMOND HILL FUNDS | ANNUAL REPORT | DECEMBER 31, 2021 | DIAMOND-HILL.COM 67 |
Diamond Hill Core Bond Fund
Schedule of Investments (Continued)
December 31, 2021
| | Coupon | | | Maturity | | | Shares /
Par Value | | | Fair
Value | |
Securitized — 61.2% continued |
CRE/CLO — 4.3% continued |
BSPRT Issuer Ltd., Series 2018-FL4, Class A (1* 1MO LIBOR + 105) (a)(c) | | | 1.160 | % | | | 09/17/35 | | | $ | 158,894 | | | $ | 158,776 | |
BXMT, Series 2021-FL4, Class D (1* 1MO LIBOR + 225) (a)(c) | | | 2.360 | % | | | 05/17/38 | | | | 750,000 | | | | 744,844 | |
BXMT Ltd., Series 2020-FL2, Class D (1* 1MO LIBOR + 195) (a)(c) | | | 2.114 | % | | | 02/16/37 | | | | 625,000 | | | | 622,071 | |
BXMT Ltd., Series 2020-FL2, Class B (1* 1MO LIBOR + 140) (a)(c) | | | 1.564 | % | | | 02/18/38 | | | | 1,000,000 | | | | 996,562 | |
Exantas Capital Corp., Series 2020-RS09, Class D (1* 1MO LIBOR + 550) (a)(c) | | | 5.664 | % | | | 04/17/37 | | | | 362,620 | | | | 368,094 | |
KKR Financial Management, Series 2021-FL2, Class A (c) | | | 1.179 | % | | | 02/15/39 | | | | 1,000,000 | | | | 998,167 | |
LoanCore Issuer Ltd., Series 2019-CRE3, Class D (c) | | | 2.610 | % | | | 05/15/36 | | | | 1,170,000 | | | | 1,148,817 | |
LoanCore Issuer Ltd., Series 2021-CRE5, Class A (c) | | | 1.410 | % | | | 07/15/36 | | | | 1,000,000 | | | | 999,700 | |
MF1 Ltd., Series 2020-FL3, Class B (1* 1MO LIBOR + 375) (a)(c) | | | 3.914 | % | | | 07/15/35 | | | | 1,150,000 | | | | 1,166,016 | |
MF1 Ltd., Series 2020-FL3, Class A-S (1* 1MO LIBOR + 285) (a)(c) | | | 3.014 | % | | | 07/16/35 | | | | 800,000 | | | | 810,197 | |
| | Coupon | | | Maturity | | | Shares /
Par Value | | | Fair
Value | |
CRE/CLO — 4.3% continued |
Multi Family Housing Mortgage Loan, Series 2020-FL4, Class A (1* 1MO LIBOR + 170) (a)(c) | | | 1.864 | % | | | 11/15/35 | | | $ | 600,000 | | | $ | 602,368 | |
PFP III, Series 2021-7, Class D (1* 1MO LIBOR + 240) (a)(c) | | | 2.508 | % | | | 04/14/38 | | | | 749,963 | | | | 748,154 | |
PFP Ltd., Series 2019-5, Class B (1* 1MO LIBOR + 165) (a)(c) | | | 1.757 | % | | | 04/16/36 | | | | 650,000 | | | | 648,493 | |
ReadyCap Commercial Mortgage Trust, Series 2020-FL4, Class A (1* 1MO LIBOR + 215) (a)(c) | | | 2.252 | % | | | 02/25/35 | | | | 909,987 | | | | 915,538 | |
ReadyCap Commercial Mortgage Trust, Series 2021-1A, Class C (c) | | | 2.000 | % | | | 07/25/36 | | | | 500,000 | | | | 494,423 | |
ReadyCap Commercial Mortgage Trust, Series 2021-1A, Class B (c) | | | 2.500 | % | | | 07/25/36 | | | | 1,000,000 | | | | 986,250 | |
TPG Real Estate Finance, Series 2019-FL3, Class A (1* 1MO LIBOR + 115) (a)(c) | | | 1.314 | % | | | 10/15/34 | | | | 482,988 | | | | 482,837 | |
| | | | | | | | | | | | | | | | 17,082,690 | |
Credit Cards — 2.3% |
Brex, Inc., Series 2021-1, Class A (c) | | | 2.090 | % | | | 07/17/24 | | | | 1,000,000 | | | | 1,003,432 | |
Continental Credit Card, LLC, Series 2017-1, Class B (c) | | | 6.410 | % | | | 01/15/25 | | | | 42,082 | | | | 42,336 | |
Continental Credit Card, LLC, Series 2019-1, Class A (c) | | | 3.830 | % | | | 08/15/26 | | | | 1,068,621 | | | | 1,085,708 | |
68 DIAMOND HILL FUNDS | ANNUAL REPORT | DECEMBER 31, 2021 | DIAMOND-HILL.COM |
Diamond Hill Core Bond Fund
Schedule of Investments (Continued)
December 31, 2021
| | Coupon | | | Maturity | | | Shares /
Par Value | | | Fair
Value | |
Securitized — 61.2% continued |
Credit Cards — 2.3% continued |
Continental Credit Card, LLC, Series 2019-1, Class B (c) | | | 4.950 | % | | | 08/15/26 | | | $ | 300,000 | | | $ | 309,808 | |
Continental Credit Card, LLC, Series 2020-A, Class A (c) | | | 2.240 | % | | | 12/15/28 | | | | 1,350,000 | | | | 1,343,415 | |
Continental Credit Card, LLC, Series 2020-A, Class B (c) | | | 3.660 | % | | | 12/15/28 | | | | 1,200,000 | | | | 1,195,121 | |
Continental Credit Card, LLC, Series 2021-A, Class B (c) | | | 3.490 | % | | | 12/17/29 | | | | 500,000 | | | | 499,522 | |
Continental Credit Card, LLC, Series 2021-A, Class C (c) | | | 4.020 | % | | | 12/17/29 | | | | 500,000 | | | | 499,775 | |
Genesis Private Label Amortization Trust, Series 2020-1, Class D (c) | | | 6.630 | % | | | 07/20/26 | | | | 750,000 | | | | 763,230 | |
Genesis Private Label Amortization Trust, Series 2020-1, Class C (c) | | | 4.190 | % | | | 07/20/30 | | | | 200,000 | | | | 200,300 | |
Genesis Sales Finance Master Trust, Series 2020-AA, Class B (c) | | | 2.240 | % | | | 09/22/25 | | | | 535,000 | | | | 536,069 | |
Genesis Sales Finance Master Trust, Series 2020-AA, Class C (c) | | | 2.990 | % | | | 09/22/25 | | | | 300,000 | | | | 300,612 | |
Genesis Sales Finance Master Trust, Series 2021-AA, Class D (c) | | | 2.090 | % | | | 12/21/26 | | | | 750,000 | | | | 740,023 | |
Mercury Financial Credit Card, Series 2021-1A, Class B (c) | | | 2.330 | % | | | 03/20/26 | | | | 800,000 | | | | 793,241 | |
| | | | | | | | | | | | | | | | 9,312,592 | |
| | Coupon | | | Maturity | | | Shares /
Par Value | | | Fair
Value | |
Equipment — 1.0% |
Business Jet Securities, LLC, Series 2019-1, Class B (c) | | | 5.193 | % | | | 07/15/34 | | | $ | 360,977 | | | $ | 362,415 | |
Business Jet Securities, LLC, Series 2020-1, Class B (c) | | | 3.967 | % | | | 11/15/35 | | | | 255,535 | | | | 256,482 | |
Business Jet Securities, LLC, Series 2021-1A, Class B (c) | | | 2.918 | % | | | 04/15/36 | | | | 346,499 | | | | 339,335 | |
CLI Funding VI, LLC, Series 2020-1, Class B (c) | | | 3.620 | % | | | 09/18/45 | | | | 562,413 | | | | 566,271 | |
HPEFS Equipment Trust, Series 2021-2A, Class D (c) | | | 1.290 | % | | | 03/20/29 | | | | 750,000 | | | | 738,705 | |
Octane Receivables Trust, Series 2019-1, Class A (c) | | | 3.160 | % | | | 09/20/23 | | | | 18,858 | | | | 18,950 | |
Octane Receivables Trust, Series 2021-1A, Class C (c) | | | 2.230 | % | | | 11/20/28 | | | | 550,000 | | | | 544,650 | |
Stellar Jay Ireland Dac, Series 2021-1, Class B (c)(e) | | | 5.926 | % | | | 03/15/28 | | | | 984,840 | | | | 974,476 | |
| | | | | | | | | | | | | | | | 3,801,284 | |
HECM — 1.1% |
Brean ABS Trust, Series 2021-RM2, Class A (c) | | | 1.750 | % | | | 10/25/61 | | | | 1,589,216 | | | | 1,535,094 | |
Finance of America HECM, Series 2020-HB2, Class A (c) | | | 1.710 | % | | | 07/25/30 | | | | 266,939 | | | | 267,283 | |
Finance of America HECM, Series 2021-HB1, Class M3 (c) | | | 3.640 | % | | | 02/25/31 | | | | 700,000 | | | | 693,601 | |
RMF Buyout Issuance Trust, Series 2021-HB1, Class M3 (c) | | | 3.690 | % | | | 11/25/31 | | | | 550,000 | | | | 548,859 | |
DIAMOND HILL FUNDS | ANNUAL REPORT | DECEMBER 31, 2021 | DIAMOND-HILL.COM 69 |
Diamond Hill Core Bond Fund
Schedule of Investments (Continued)
December 31, 2021
| | Coupon | | | Maturity | | | Shares /
Par Value | | | Fair
Value | |
Securitized — 61.2% continued |
HECM — 1.1% continued |
RMF Proprietary Issuance Trust, Series 2021-2, Class A (c) | | | 2.125 | % | | | 09/25/61 | | | $ | 1,189,310 | | | $ | 1,170,309 | |
| | | | | | | | | | | | | | | | 4,215,146 | |
Hospitality — 1.9% |
BHMS Mortgage Trust, Series 2018-ATLS, Class A (1* 1MO LIBOR + 125) (a)(c) | | | 1.360 | % | | | 07/16/35 | | | | 280,000 | | | | 279,820 | |
BX Commercial Mortgage Trust, Series 2020-VIV3, Class B (c) | | | 3.544 | % | | | 03/09/44 | | | | 1,300,000 | | | | 1,345,099 | |
BX Trust, Series 2018-GW, Class E (1* 1XUS0001M + 197) (a)(c) | | | 2.080 | % | | | 05/15/37 | | | | 1,200,000 | | | | 1,188,700 | |
BX Trust, Series 2019-OC11, Class A (c) | | | 3.202 | % | | | 12/11/41 | | | | 1,177,000 | | | | 1,238,867 | |
Champlain Housing Mortgage Trust, Series 2017-COSMO, Class B (1* 1MO LIBOR + 140) (a)(c) | | | 1.510 | % | | | 11/17/36 | | | | 100,000 | | | | 99,939 | |
Cosmopolitan Hotel Trust, Series 2017-COSMO, Class D (1* 1MO LIBOR + 225) (a)(c) | | | 2.360 | % | | | 11/15/36 | | | | 100,000 | | | | 99,939 | |
Extended Stay America Trust, Series 2021-ESH, Class E (1* 1MO LIBOR + 285) (a)(c) | | | 2.960 | % | | | 07/15/38 | | | | 994,825 | | | | 994,823 | |
Motel 6 Trust, Series 2021-MTL6, Class C (c) | | | 1.610 | % | | | 09/15/38 | | | | 650,000 | | | | 649,803 | |
Motel 6 Trust, Series 2021-MTL6, Class D (c) | | | 2.210 | % | | | 09/15/38 | | | | 500,000 | | | | 499,849 | |
| | Coupon | | | Maturity | | | Shares /
Par Value | | | Fair
Value | |
Hospitality — 1.9% continued |
Motel 6 Trust, Series 2021-MTL6, Class E (c) | | | 2.810 | % | | | 09/15/38 | | | $ | 1,220,000 | | | $ | 1,219,631 | |
| | | | | | | | | | | | | | | | 7,616,470 | |
Industrial — 1.0% |
BX Commercial Mortgage Trust, Series 2020-FOX, Class D (1* 1MO LIBOR + 210) (a)(c) | | | 2.210 | % | | | 11/15/32 | | | | 1,011,364 | | | | 1,011,060 | |
BX Trust, Series 2021-VOLT, Class D (c) | | | 1.760 | % | | | 09/15/23 | | | | 1,500,000 | | | | 1,486,752 | |
Cold Storage Trust, Series 2020-ICE5, Class E (1* 1MO LIBOR + 277) (a)(c) | | | 2.875 | % | | | 11/16/37 | | | | 491,495 | | | | 489,620 | |
Credit Suisse First Boston, Series 2020-UNFI, Class A (c) | | | 4.168 | % | | | 12/06/22 | | | | 1,000,000 | | | | 1,001,067 | |
| | | | | | | | | | | | | | | | 3,988,499 | |
Manufactured Housing — 0.0% (d) |
Cascade Funding Mortgage Trust, Series 2019-MH1, Class M (c) | | | 5.985 | % | | | 11/25/44 | | | | 100,000 | | | | 103,019 | |
| |
Mixed-Use — 0.1% |
20 Times Square Trust, Series 2018-20TS, Class B (a)(c) | | | 3.203 | % | | | 05/17/35 | | | | 300,000 | | | | 298,893 | |
| |
Multifamily — 1.7% |
Freedom Mortgage Trust, Series 2016-KF17, Class B (c) | | | 5.934 | % | | | 03/25/23 | | | | 561,849 | | | | 560,576 | |
Freedom Mortgage Trust, Series 2017-KF39, Class B (1* 1MO LIBOR + 250) (a)(c) | | | 2.594 | % | | | 11/25/24 | | | | 330,814 | | | | 329,579 | |
70 DIAMOND HILL FUNDS | ANNUAL REPORT | DECEMBER 31, 2021 | DIAMOND-HILL.COM |
Diamond Hill Core Bond Fund
Schedule of Investments (Continued)
December 31, 2021
| | Coupon | | | Maturity | | | Shares /
Par Value | | | Fair
Value | |
Securitized — 61.2% continued |
Multifamily — 1.7% continued |
Freedom Mortgage Trust, Series 2018-KF53, Class B (1* 1MO LIBOR + 205) (a)(c) | | | 2.138 | % | | | 10/27/25 | | | $ | 377,757 | | | $ | 375,405 | |
FREMF Mortgage Trust, Series 2018-KF44, Class B (1* 1MO LIBOR + 215) (a)(c) | | | 2.244 | % | | | 02/25/25 | | | | 277,449 | | | | 275,679 | |
FREMF Mortgage Trust, Series 2018-KF43, Class B (1* 1MO LIBOR + 215) (a)(c) | | | 2.238 | % | | | 01/25/28 | | | | 297,604 | | | | 296,776 | |
FREMF Mortgage Trust, Series 2018-KF50, Class B (1* 1MO LIBOR+ 190) (a)(c) | | | 1.987 | % | | | 07/25/28 | | | | 427,511 | | | | 421,719 | |
FREMF Mortgage Trust, Series 2019-KF57, Class B (1* 1MO LIBOR + 225) (a)(c) | | | 2.344 | % | | | 01/25/29 | | | | 726,272 | | | | 721,647 | |
FREMF Mortgage Trust, Series 2019-KF67, Class B (1* 1MO LIBOR + 225) (a)(c) | | | 2.344 | % | | | 08/25/29 | | | | 442,285 | | | | 440,166 | |
Multi Family Connecticut Avenue, Series 2019-01, Class M-7 (1* 1MO LIBOR + 170) (a)(c) | | | 1.802 | % | | | 10/15/49 | | | | 509,779 | | | | 507,796 | |
Multi Family Connecticut Avenue, Series 2020-01, Class M-7 (1* 1MO LIBOR + 195) (a)(c) | | | 2.042 | % | | | 03/25/50 | | | | 656,875 | | | | 658,041 | |
Multifamily Structured Credit Risk, Series 2021-MN2, Class M-1 (c) | | | 1.850 | % | | | 07/25/41 | | | | 988,022 | | | | 969,473 | |
| | Coupon | | | Maturity | | | Shares /
Par Value | | | Fair
Value | |
Multifamily — 1.7% continued |
Multifamily Structured Credit Risk, Series 2021-MN1, Class M-1 (1* SOFR30A + 200) (a)(c) | | | 2.050 | % | | | 01/25/51 | | | $ | 1,078,832 | | | $ | 1,073,538 | |
| | | | | | | | | | | | | | | | 6,630,395 | |
Non Agency MBS CMO — 0.6% |
Chase Mortgage Finance Corp., Series 2021-CL1, Class M3 | | | 1.600 | % | | | 02/25/50 | | | | 903,664 | | | | 903,848 | |
J.P. Morgan Wealth Management, Series 2021-CL1, Class M1 (1* SOFR30A + 130) (a)(c) | | | 1.350 | % | | | 02/26/71 | | | | 775,803 | | | | 776,736 | |
J.P. Morgan Wealth Management, Series 2021-CL1, Class M3 (1* SOFR30A + 180) (a)(c) | | | 1.850 | % | | | 02/26/71 | | | | 585,541 | | | | 587,690 | |
| | | | | | | | | | | | | | | | 2,268,274 | |
Office — 0.6% |
Drop Mortgage Trust, Series 2021-FILE, Class C (1* 1MO LIBOR + 225) (a)(c) | | | 2.360 | % | | | 04/15/26 | | | | 1,500,000 | | | | 1,499,099 | |
Goldman Sachs Mortgage Securities Corp. Trust, Series 2021-ROSS, Class D (c) | | | 2.610 | % | | | 05/15/26 | | | | 1,000,000 | | | | 996,419 | |
| | | | | | | | | | | | | | | | 2,495,518 | |
Residential Transition Loan — 1.7% |
AlphaFlow Transitional Mortgage Co., Series 2021-WL1, Class A1 (c) | | | 3.280 | % | | | 03/25/25 | | | | 800,000 | | | | 806,472 | |
DIAMOND HILL FUNDS | ANNUAL REPORT | DECEMBER 31, 2021 | DIAMOND-HILL.COM 71 |
Diamond Hill Core Bond Fund
Schedule of Investments (Continued)
December 31, 2021
| | Coupon | | | Maturity | | | Shares /
Par Value | | | Fair
Value | |
Securitized — 61.2% continued |
Residential Transition Loan — 1.7% continued |
AlphaFlow Transitional Mortgage Co., Series 2021-WL1, Class A2 (c) | | | 5.610 | % | | | 03/25/25 | | | $ | 500,000 | | | $ | 505,998 | |
Antler Mortgage Trust, Series 2021-RTL1, Class M (c) | | | 5.438 | % | | | 05/25/25 | | | | 1,750,000 | | | | 1,742,864 | |
Colony American Finance Ltd., Series 2021-RTL1, Class A2 (c) | | | 3.104 | % | | | 03/26/29 | | | | 1,000,000 | | | | 982,985 | |
LHFC Depositor, LLC, Series 2020-RTL1, Class A2 (c) | | | 3.721 | % | | | 10/25/24 | | | | 750,000 | | | | 750,193 | |
LHOME Mortgage Trust, Series 2019-RTL2, Class A-2 (c) | | | 4.335 | % | | | 03/25/24 | | | | 700,000 | | | | 704,095 | |
LHOME Mortgage Trust, Series 2021-RTL1, Class M (c) | | | 4.458 | % | | | 09/25/26 | | | | 1,500,000 | | | | 1,477,934 | |
| | | | | | | | | | | | | | | | 6,970,541 | |
Retail — 1.5% |
Aventura Mall Trust, Series 2018-AVM, Class C (c) | | | 4.249 | % | | | 07/09/40 | | | | 650,000 | | | | 672,393 | |
BB-UBS Trust, Series 2012-SHOW, Class A (c) | | | 3.430 | % | | | 11/05/36 | | | | 335,000 | | | | 346,923 | |
BX Trust, Series 2021-VIEW, Class B (c) | | | 1.910 | % | | | 06/15/23 | | | | 1,150,000 | | | | 1,148,537 | |
BX Trust, Series 2018-EXCL, Class A (1* 1MO LIBOR + 109) (a)(c) | | | 1.198 | % | | | 09/15/37 | | | | 1,235,829 | | | | 1,229,865 | |
BX Trust, Series 2018-EXCL, Class B (c) | | | 1.435 | % | | | 09/15/37 | | | | 205,971 | | | | 200,858 | |
BX Trust, Series 2018-EXCL, Class C (c) | | | 2.085 | % | | | 09/15/37 | | | | 823,886 | | | | 795,765 | |
| | Coupon | | | Maturity | | | Shares /
Par Value | | | Fair
Value | |
Retail — 1.5% continued |
Citigroup Commercial Mortgage, Series 2017-MDRB, Class D (1* 1MO LIBOR + 325) (c) | | | 3.360 | % | | | 07/15/30 | | | $ | 150,000 | | | $ | 149,275 | |
Citigroup Commercial Mortgage, Series 2017-MDRB, Class A (1* 1MO LIBOR + 110) (a)(c) | | | 1.210 | % | | | 07/15/30 | | | | 63,445 | | | | 63,267 | |
Credit Suisse First Boston, Series 2018-SITE, Class A (c) | | | 4.284 | % | | | 04/17/36 | | | | 127,000 | | | | 130,276 | |
Credit Suisse First Boston, Series 2018-SITE, Class C (a)(c) | | | 4.941 | % | | | 04/17/36 | | | | 435,000 | | | | 434,838 | |
Wells Fargo Mortgage Trust, Series 2021-SAVE, Class C (1* 1MO LIBOR + 180) (a)(c) | | | 1.910 | % | | | 02/15/40 | | | | 386,334 | | | | 384,574 | |
Wells Fargo Mortgage Trust, Series 2021-SAVE, Class D (1* 1MO LIBOR + 250) (a)(c) | | | 2.610 | % | | | 02/15/40 | | | | 454,511 | | | | 451,921 | |
| | | | | | | | | | | | | | | | 6,008,492 | |
Single Family Rental — 1.9% |
American Homes 4 Rent, Series 2014-SFR2, Class E (c) | | | 6.231 | % | | | 10/17/36 | | | | 300,000 | | | | 322,180 | |
American Homes 4 Rent, Series 2014-SFR2, Class D (c) | | | 3.678 | % | | | 12/17/36 | | | | 326,269 | | | | 341,527 | |
American Homes 4 Rent, Series 2014-SFR3, Class E (c) | | | 6.418 | % | | | 12/18/36 | | | | 300,000 | | | | 324,535 | |
American Homes 4 Rent, Series 2015-SFR1, Class A (c) | | | 3.467 | % | | | 04/17/52 | | | | 113,104 | | | | 118,311 | |
72 DIAMOND HILL FUNDS | ANNUAL REPORT | DECEMBER 31, 2021 | DIAMOND-HILL.COM |
Diamond Hill Core Bond Fund
Schedule of Investments (Continued)
December 31, 2021
| | Coupon | | | Maturity | | | Shares /
Par Value | | | Fair
Value | |
Securitized — 61.2% continued |
Single Family Rental — 1.9% continued |
Colony American Finance Ltd., Series 2020-4, Class B (c) | | | 1.707 | % | | | 12/15/52 | | | $ | 800,000 | | | $ | 777,517 | |
Colony American Finance Ltd., Series 2020-4, Class E (c) | | | 3.379 | % | | | 12/15/52 | | | | 750,000 | | | | 721,159 | |
Home Partners of America Trust, Series 2021-2, Class D (c) | | | 2.652 | % | | | 12/17/26 | | | | 999,413 | | | | 985,230 | |
Home Partners of America Trust, Series 2019-1, Class B (c) | | | 3.157 | % | | | 09/17/27 | | | | 530,997 | | | | 544,759 | |
Home Partners of America Trust, Series 2019-2, Class B (c) | | | 2.922 | % | | | 10/19/39 | | | | 610,079 | | | | 608,627 | |
Invitation Homes Trust, Series 2018-SFR3, Class A (1* 1MO LIBOR + 100) (a)(c) | | | 1.109 | % | | | 07/17/37 | | | | 265,163 | | | | 265,023 | |
Progress Residential Trust, Series 2021-SFR1, Class B (c) | | | 1.303 | % | | | 04/17/38 | | | | 850,000 | | | | 816,100 | |
Progress Residential Trust, Series 2021-SFR1, Class E (c) | | | 2.106 | % | | | 04/17/38 | | | | 700,000 | | | | 675,009 | |
Star Trust, Series 2021-SFR1, Class E (1* 1MO LIBOR + 170) (a)(c) | | | 1.809 | % | | | 04/17/38 | | | | 1,200,000 | | | | 1,197,562 | |
| | | | | | | | | | | | | | | | 7,697,539 | |
Small Business — 1.5% |
Credibility Asset Securitization, Series 2021-1A, Class A (c) | | | 2.390 | % | | | 04/15/26 | | | | 1,000,000 | | | | 997,642 | |
Credibility Asset Securitization, Series 2021-1A, Class C (c) | | | 3.380 | % | | | 04/15/26 | | | | 500,000 | | | | 499,063 | |
| | Coupon | | | Maturity | | | Shares /
Par Value | | | Fair
Value | |
Small Business — 1.5% continued |
FORA Financial Asset Securitization, Series 2021-1A, Class C (c) | | | 3.850 | % | | | 05/15/27 | | | $ | 418,000 | | | $ | 415,078 | |
Newtek Small Business Loan Trust, Series 2018-1, Class A (1* Prime — 55) (a)(c) | | | 2.700 | % | | | 02/25/44 | | | | 584,292 | | | | 585,857 | |
Newtek Small Business Loan Trust, Series 2018-1, Class B (1* Prime + 75) (a)(c) | | | 4.000 | % | | | 02/25/44 | | | | 153,761 | | | | 154,489 | |
Newtek Small Business Loan Trust, Series 2019-01, Class A (1* Prime — 90) (a)(c) | | | 2.350 | % | | | 12/25/44 | | | | 714,142 | | | | 711,586 | |
Newtek Small Business Loan Trust, Series 2019-01, Class B (1* Prime + 25) (a)(c) | | | 3.500 | % | | | 12/25/44 | | | | 242,808 | | | | 242,518 | |
OnDeck Asset Securitization Trust, Series 2021-1A, Class B (c) | | | 2.280 | % | | | 05/17/27 | | | | 750,000 | | | | 745,575 | |
OnDeck Asset Securitization Trust, Series 2021-1A, Class C (c) | | | 2.970 | % | | | 05/17/27 | | | | 650,000 | | | | 646,160 | |
SFS Asset Securitization, LLC, Series 2019-1, Class B (c) | | | 5.023 | % | | | 06/10/25 | | | | 150,000 | | | | 149,401 | |
Small Business Lending Trust, Series 2020-A, Class B (c) | | | 3.200 | % | | | 12/15/26 | | | | 746,000 | | | | 748,434 | |
| | | | | | | | | | | | | | | | 5,895,803 | |
Student Loan — 1.4% |
College Ave Student Loans, Series 2018-A, Class B (c) | | | 4.750 | % | | | 12/26/47 | | | | 84,432 | | | | 88,343 | |
DIAMOND HILL FUNDS | ANNUAL REPORT | DECEMBER 31, 2021 | DIAMOND-HILL.COM 73 |
Diamond Hill Core Bond Fund
Schedule of Investments (Continued)
December 31, 2021
| | Coupon | | | Maturity | | | Shares /
Par Value | | | Fair
Value | |
Securitized — 61.2% continued |
Student Loan — 1.4% continued |
College Ave Student Loans, Series 2018-A, Class C (c) | | | 5.500 | % | | | 12/26/47 | | | $ | 77,630 | | | $ | 80,240 | |
College Ave Student Loans, Series 2019-A, Class A1 (1* 1MO LIBOR + 140) (a)(c) | | | 1.502 | % | | | 12/28/48 | | | | 125,743 | | | | 128,357 | |
College Ave Student Loans, Series 2019-A, Class C (c) | | | 4.460 | % | | | 12/28/48 | | | | 216,467 | | | | 223,406 | |
College Ave Student Loans, Series 2021-A, Class B (c) | | | 2.320 | % | | | 07/25/51 | | | | 675,000 | | | | 669,967 | |
College Ave Student Loans, Series 2021-A, Class D (c) | | | 4.120 | % | | | 07/25/51 | | | | 500,000 | | | | 500,774 | |
Laurel Road Prime Student Loan, Series 2018-B, Class A2 (c) | | | 3.540 | % | | | 05/26/43 | | | | 29,266 | | | | 29,639 | |
Laurel Road Prime Student Loan, Series 2019-A, Class A2FX (c) | | | 2.730 | % | | | 10/25/48 | | | | 105,072 | | | | 105,941 | |
Prodigy Finance, Series 2021-1A, Class A (c) | | | 1.352 | % | | | 07/25/51 | | | | 596,021 | | | | 595,880 | |
SMB Private Education Loan Trust, Series 2018-C, Class B (c) | | | 4.000 | % | | | 11/17/42 | | | | 200,000 | | | | 209,495 | |
Social Professional Loan Program, Series 2017-B, Class CFX (c) | | | 4.440 | % | | | 05/25/40 | | | | 150,000 | | | | 154,711 | |
Social Professional Loan Program, Series 2017-E, Class A-2B (c) | | | 2.720 | % | | | 11/26/40 | | | | 64,149 | | | | 64,814 | |
Social Professional Loan Program, Series 2017-E, Class C (c) | | | 4.160 | % | | | 11/26/40 | | | | 700,000 | | | | 722,186 | |
| | Coupon | | | Maturity | | | Shares /
Par Value | | | Fair
Value | |
Student Loan — 1.4% continued |
Social Professional Loan Program, Series 2016-E, Class C (c) | | | 4.430 | % | | | 10/25/41 | | | $ | 200,000 | | | $ | 204,397 | |
Social Professional Loan Program, Series 2020-A, Class BFX (c) | | | 3.120 | % | | | 05/15/46 | | | | 425,000 | | | | 430,941 | |
Social Professional Loan Program, Series 2018-D, Class BFX (c) | | | 4.140 | % | | | 02/25/48 | | | | 500,000 | | | | 515,046 | |
Social Professional Loan Program, Series 2019-C, Class BFX (c) | | | 3.050 | % | | | 11/16/48 | | | | 730,000 | | | | 736,321 | |
| | | | | | | | | | | | | | | | 5,460,458 | |
Unsecured Consumer — 5.3% |
Avant Loans Funding Trust, Series 2021-REV1, Class C (c) | | | 2.300 | % | | | 07/15/30 | | | | 800,000 | | | | 792,398 | |
Freedom Financial, Series 2020-FP1, Class B (c) | | | 3.060 | % | | | 03/18/27 | | | | 501,435 | | | | 504,141 | |
Freedom Financial, Series 2021-1CP, Class C (c) | | | 2.830 | % | | | 03/20/28 | | | | 425,000 | | | | 425,512 | |
Freedom Mortgage Trust, Series 2020-2CP, Class C (c) | | | 6.000 | % | | | 06/18/27 | | | | 1,484,000 | | | | 1,531,081 | |
Lendmark Funding Trust, Series 2020-2A, Class C (c) | | | 4.690 | % | | | 04/21/31 | | | | 550,000 | | | | 583,003 | |
Lendmark Funding Trust, Series 21-1A, Class C (c) | | | 3.410 | % | | | 11/20/31 | | | | 750,000 | | | | 762,182 | |
Liberty Lending Services, Series 2021-1A, Class A (c) | | | 1.070 | % | | | 05/15/29 | | | | 842,866 | | | | 838,429 | |
Liberty Lending Services, Series 2021-1A, Class B (c) | | | 2.170 | % | | | 05/15/29 | | | | 1,250,000 | | | | 1,232,304 | |
74 DIAMOND HILL FUNDS | ANNUAL REPORT | DECEMBER 31, 2021 | DIAMOND-HILL.COM |
Diamond Hill Core Bond Fund
Schedule of Investments (Continued)
December 31, 2021
| | Coupon | | | Maturity | | | Shares /
Par Value | | | Fair
Value | |
Securitized — 61.2% continued |
Unsecured Consumer — 5.3% continued |
LL ABS Trust, Series 2020-1, Class A (c) | | | 2.330 | % | | | 07/15/22 | | | $ | 130,808 | | | $ | 131,224 | |
LL ABS Trust, Series 2020-1, Class B (c) | | | 3.790 | % | | | 03/15/23 | | | | 1,500,000 | | | | 1,521,256 | |
LL ABS Trust, Series 2019-1, Class B (c) | | | 3.520 | % | | | 03/15/27 | | | | 37,949 | | | | 38,034 | |
Mariner Finance Issuance Trust, Series 2021-AA, Class D (c) | | | 4.340 | % | | | 03/20/36 | | | | 1,000,000 | | | | 1,011,473 | |
Oportun Funding XIII, LLC, Series 2019-13, Class B (c) | | | 3.870 | % | | | 08/08/25 | | | | 500,000 | | | | 505,381 | |
Oportun Funding XIV, LLC, Series 2021-A, Class C (c) | | | 3.440 | % | | | 03/08/28 | | | | 1,500,000 | | | | 1,510,599 | |
Oportun Funding, LLC, Series 2020-1, Class B (c) | | | 3.450 | % | | | 05/15/24 | | | | 800,000 | | | | 807,625 | |
Oportun Funding, LLC, Series 2021-B, Class A (c) | | | 1.470 | % | | | 05/08/31 | | | | 750,000 | | | | 745,227 | |
Oportun Funding, LLC, Series 2021-B, Class C (c) | | | 3.650 | % | | | 05/08/31 | | | | 650,000 | | | | 650,617 | |
Prosper Marketplace Issuance Trust, Series 2019-4, Class B (c) | | | 3.200 | % | | | 02/17/26 | | | | 54,038 | | | | 54,134 | |
Regional Management Issuance Trust, Series 2019-1, Class C (c) | | | 4.110 | % | | | 11/15/28 | | | | 200,000 | | | | 200,785 | |
Regional Management Issuance Trust, Series 2020-1, Class A (c) | | | 2.340 | % | | | 10/15/30 | | | | 250,000 | | | | 251,703 | |
Regional Management Issuance Trust, Series 2021-1, Class C (c) | | | 3.040 | % | | | 03/17/31 | | | | 625,000 | | | | 621,511 | |
| | Coupon | | | Maturity | | | Shares /
Par Value | | | Fair
Value | |
Unsecured Consumer — 5.3% continued |
Regional Management Issuance Trust, Series 2021-2, Class C (c) | | | 3.230 | % | | | 08/15/33 | | | $ | 650,000 | | | $ | 638,135 | |
Upgrade Master Pass-Thru Trust, Series 2019-ST1, Class A (c) | | | 4.000 | % | | | 07/15/25 | | | | 95,511 | | | | 96,302 | |
Upgrade Master Pass-Thru Trust, Series 2019-ST3, Class A (c) | | | 3.750 | % | | | 11/15/25 | | | | 40,188 | | | | 40,497 | |
Upstart Pass-Through Trust, Series 2020-ST6, Class A (c) | | | 3.000 | % | | | 01/20/27 | | | | 424,797 | | | | 426,446 | |
Upstart Pass-Through Trust, Series 2021-ST4, Class A (c) | | | 2.000 | % | | | 07/20/27 | | | | 1,237,561 | | | | 1,226,719 | |
Upstart Pass-Through Trust, Series 2020-ST1, Class A (c) | | | 3.750 | % | | | 02/20/28 | | | | 106,273 | | | | 107,826 | |
Upstart Pass-Through Trust, Series 2020-ST2, Class A (c) | | | 3.500 | % | | | 03/20/28 | | | | 167,024 | | | | 169,189 | |
Upstart Pass-Through Trust, Series 2020-ST3, Class A (c) | | | 3.350 | % | | | 04/20/28 | | | | 86,887 | | | | 87,914 | |
Upstart Pass-Through Trust, Series 2021-1A, Class C (c) | | | 1.750 | % | | | 10/20/29 | | | | 656,249 | | | | 650,529 | |
Upstart Securitization Trust, Series 2021-ST1, Class A (c) | | | 2.750 | % | | | 02/20/27 | | | | 686,997 | | | | 689,971 | |
Upstart Securitization Trust, Series 2021-ST2, Class A (c) | | | 2.500 | % | | | 04/20/27 | | | | 912,943 | | | | 915,699 | |
Upstart Securitization Trust, Series 2019-3, Class B (c) | | | 3.829 | % | | | 01/21/30 | | | | 496,948 | | | | 500,706 | |
DIAMOND HILL FUNDS | ANNUAL REPORT | DECEMBER 31, 2021 | DIAMOND-HILL.COM 75 |
Diamond Hill Core Bond Fund
Schedule of Investments (Continued)
December 31, 2021
| | Coupon | | | Maturity | | | Shares /
Par Value | | | Fair
Value | |
Securitized — 61.2% continued |
Unsecured Consumer — 5.3% continued |
Upstart Securitization Trust, Series 2021-2, Class B (c) | | | 1.750 | % | | | 06/20/31 | | | $ | 1,000,000 | | | $ | 991,688 | |
| | | | | | | | | | | | | | | | 21,260,240 | |
| |
Total Securitized |
(Cost $245,611,500) | | $ | 244,411,639 | |
| |
Treasury — 19.6% |
U.S. Treasury Notes (b) | | | 0.375 | % | | | 09/15/24 | | | | 300,000 | | | | 295,758 | |
U.S. Treasury STRIPS | | | 0.000 | % | | | 02/15/25 | | | | 300,000 | | | | 290,741 | |
U.S. Treasury Notes | | | 1.625 | % | | | 02/15/26 | | | | 3,000,000 | | | | 3,051,562 | |
U.S. Treasury STRIPS | | | 0.000 | % | | | 05/15/28 | | | | 1,000,000 | | | | 911,278 | |
U.S. Treasury Notes (b) | | | 2.875 | % | | | 08/15/28 | | | | 5,500,000 | | | | 6,006,602 | |
U.S. Treasury Notes (b) | | | 1.250 | % | | | 09/30/28 | | | | 400,000 | | | | 395,297 | |
U.S. Treasury STRIPS (b) | | | 0.000 | % | | | 05/15/29 | | | | 2,000,000 | | | | 1,785,720 | |
U.S. Treasury Notes | | | 0.625 | % | | | 08/15/30 | | | | 4,563,900 | | | | 4,256,193 | |
U.S. Treasury Notes | | | 0.875 | % | | | 11/15/30 | | | | 3,700,000 | | | | 3,517,746 | |
U.S. Treasury STRIPS | | | 0.000 | % | | | 11/15/31 | | | | 2,000,000 | | | | 1,699,693 | |
U.S. Treasury STRIPS | | | 0.000 | % | | | 02/15/33 | | | | 2,000,000 | | | | 1,651,634 | |
U.S. Treasury STRIPS | | | 0.000 | % | | | 05/15/33 | | | | 600,000 | | | | 492,522 | |
U.S. Treasury STRIPS | | | 0.000 | % | | | 08/15/34 | | | | 4,000,000 | | | | 3,185,041 | |
U.S. Treasury STRIPS | | | 0.000 | % | | | 05/15/35 | | | | 3,000,000 | | | | 2,349,841 | |
U.S. Treasury STRIPS | | | 0.000 | % | | | 02/15/36 | | | | 6,000,000 | | | | 4,602,880 | |
U.S. Treasury STRIPS | | | 0.000 | % | | | 02/15/37 | | | | 5,500,000 | | | | 4,120,919 | |
U.S. Treasury STRIPS | | | 0.000 | % | | | 02/15/38 | | | | 6,000,000 | | | | 4,393,110 | |
U.S. Treasury STRIPS | | | 0.000 | % | | | 11/15/38 | | | | 6,000,000 | | | | 4,301,394 | |
U.S. Treasury Bonds | | | 3.500 | % | | | 02/15/39 | | | | 235,000 | | | | 294,815 | |
U.S. Treasury Bonds | | | 1.125 | % | | | 08/15/40 | | | | 5,000,000 | | | | 4,365,625 | |
U.S. Treasury Bonds | | | 1.375 | % | | | 11/15/40 | | | | 5,000,000 | | | | 4,556,641 | |
| | Coupon | | | Maturity | | | Shares /
Par Value | | | Fair
Value | |
Treasury — 19.6% continued |
U.S. Treasury STRIPS | | | 0.000 | % | | | 08/15/41 | | | $ | 1,000,000 | | | $ | 662,852 | |
U.S. Treasury Bonds | | | 2.750 | % | | | 11/15/42 | | | | 600,000 | | | | 683,812 | |
U.S. Treasury Bonds | | | 3.750 | % | | | 11/15/43 | | | | 1,500,000 | | | | 1,983,691 | |
U.S. Treasury Bonds | | | 2.250 | % | | | 08/15/46 | | | | 1,780,000 | | | | 1,882,072 | |
U.S. Treasury Bonds | | | 3.000 | % | | | 02/15/48 | | | | 3,000,000 | | | | 3,661,641 | |
U.S. Treasury Bonds (b) | | | 2.000 | % | | | 02/15/50 | | | | 4,500,000 | | | | 4,570,840 | |
U.S. Treasury Bonds | | | 1.250 | % | | | 05/15/50 | | | | 10,000,000 | | | | 8,491,797 | |
Total Treasury |
(Cost $79,755,774) | | $ | 78,461,717 | |
| |
Registered Investment Companies — 6.3% |
State Street Institutional Liquid Reserves Fund - Premier Class, 0.04% (f) | | | 5,601,970 | | | | 5,602,530 | |
State Street Navigator Securities Lending Portfolio I, 0.15% (f)(g) | | | 19,357,714 | | | | 19,357,714 | |
Total Registered Investment Companies |
(Cost $24,960,244) | | $ | 24,960,244 | |
| | | | | | | | | |
Total Investment Securities — 104.6% |
(Cost $419,766,023) | | $ | 417,757,028 | |
| |
Liabilities in Excess of Other Assets — (4.6)% | | | | | | | (18,331,621 | ) |
| | | | | | | | | |
Net Assets — 100.0% | | | | | | $ | 399,425,407 | |
(a) | Variable rate security. The rate shown is the effective interest rate as of December 31, 2021. The benchmark on which the rate is calculated is shown parenthetically, if applicable. Certain variable rate securities are not based on a published rate and spread but are determined by the issuer or agent and may be based on index changes, prepayment of underlying positions and/or other variables. These securities do not indicate a reference rate and spread in their description above. |
(b) | All or a portion of the security is on loan. The total fair value of the securities on loan as of December 31, 2021 was $18,890,580. |
(c) | Securities exempt from registration under Rule 144A of the Securities Act of 1933. These securities have been deemed liquid under procedures approved by the Fund’s Board of Trustees and may normally be sold to qualified institutional buyers in transactions exempt from registration. The total fair value of these securities as of December 31, 2021 was $157,906,046, representing 39.5% of net assets. |
(d) | Percentage rounds to less than 0.1%. |
76 DIAMOND HILL FUNDS | ANNUAL REPORT | DECEMBER 31, 2021 | DIAMOND-HILL.COM |
Diamond Hill Core Bond Fund
Schedule of Investments (Continued)
December 31, 2021
(e) | Illiquid security as determined under procedures approved by the Board of Trustees. The total fair value of these securities as of December 31, 2021 was $2,096,189, representing 0.5% of net assets. |
(f) | The rate shown is the 7-day effective yield as of December 31, 2021. |
(g) | This security was purchased using cash collateral held from securities on loan. |
BV — Besloten Vennootschap
IO — Interest Only
LIBOR — London Interbank Offered Rate
NA — National Association
NV — Naamloze Vennootschap
plc — Public Limited Company
PO — Principal Only
REIT — Real Estate Investment Trust
SA — Societe Anonyme
SOFR — Secured Overnight Financing Rate.
UA — Uitgesloten Aansprakelijkheid
See accompanying Notes to Financial Statements.
DIAMOND HILL FUNDS | ANNUAL REPORT | DECEMBER 31, 2021 | DIAMOND-HILL.COM 77 |
Diamond Hill Funds
Tabular Presentation of Schedules of Investments
December 31, 2021 (Unaudited)
Diamond Hill Small Cap Fund |
Sector Allocation | % of
Net Assets |
Financials | 28.7% |
Consumer Discretionary | 18.4% |
Industrials | 16.9% |
Consumer Staples | 10.4% |
Materials | 5.8% |
Real Estate | 4.9% |
Information Technology | 4.5% |
Energy | 3.0% |
Communication Services | 2.6% |
Utilities | 2.2% |
Health Care | 1.7% |
Registered Investment Companies | 7.2% |
Other | |
Net Other Assets (Liabilities) | -6.3% |
| | 100.0% |
| | |
Russell 2000 Index
Sector Allocation | % of
Index |
Financials | 15.9% |
Consumer Discretionary | 11.4% |
Industrials | 15.1% |
Consumer Staples | 3.4% |
Materials | 3.8% |
Real Estate | 7.5% |
Information Technology | 14.5% |
Energy | 4.4% |
Communication Services | 3.1% |
Utilities | 2.7% |
Health Care | 18.2% |
| | 100.0% |
Diamond Hill Small-Mid Cap Fund |
Sector Allocation | % of
Net Assets |
Financials | 27.0% |
Industrials | 21.4% |
Consumer Discretionary | 17.8% |
Consumer Staples | 8.4% |
Real Estate | 7.8% |
Utilities | 4.0% |
Information Technology | 3.2% |
Energy | 2.4% |
Materials | 2.0% |
Communication Services | 1.4% |
Health Care | 1.1% |
Registered Investment Companies | 8.1% |
Other | |
Net Other Assets (Liabilities) | -4.6% |
| | 100.0% |
| | |
Russell 2500 Index
Sector Allocation | % of
Index |
Financials | 14.6% |
Industrials | 16.4% |
Consumer Discretionary | 12.0% |
Consumer Staples | 3.1% |
Real Estate | 8.7% |
Utilities | 2.6% |
Information Technology | 16.8% |
Energy | 3.8% |
Materials | 5.5% |
Communication Services | 2.6% |
Health Care | 13.9% |
| | 100.0% |
78 DIAMOND HILL FUNDS | ANNUAL REPORT | DECEMBER 31, 2021 | DIAMOND-HILL.COM |
Diamond Hill Funds
Tabular Presentation of Schedules of Investments (Continued)
December 31, 2021 (Unaudited)
Diamond Hill Mid Cap Fund |
Sector Allocation | % of
Net Assets |
Financials | 27.4% |
Consumer Discretionary | 16.8% |
Industrials | 16.5% |
Real Estate | 8.5% |
Consumer Staples | 7.9% |
Information Technology | 5.3% |
Materials | 4.9% |
Utilities | 3.8% |
Energy | 1.8% |
Health Care | 1.6% |
Communication Services | 1.4% |
Registered Investment Companies | 4.7% |
Other | |
Net Other Assets (Liabilities) | -0.6% |
| | 100.0% |
| | |
Russell Midcap Index
Sector Allocation | % of
Index |
Financials | 12.3% |
Consumer Discretionary | 12.3% |
Industrials | 15.3% |
Real Estate | 8.4% |
Consumer Staples | 3.4% |
Information Technology | 19.4% |
Materials | 5.5% |
Utilities | 4.7% |
Energy | 3.8% |
Health Care | 11.2% |
Communication Services | 3.7% |
| | 100.0% |
Diamond Hill Large Cap Fund |
Sector Allocation | % of
Net Assets |
Financials | 22.7% |
Health Care | 13.7% |
Consumer Discretionary | 13.2% |
Consumer Staples | 10.1% |
Communication Services | 9.8% |
Information Technology | 8.7% |
Industrials | 7.7% |
Materials | 5.4% |
Real Estate | 3.8% |
Energy | 2.6% |
Utilities | 1.2% |
Registered Investment Companies | 1.4% |
Other | |
Net Other Assets (Liabilities) | -0.3% |
| | 100.0% |
| | |
Russell 1000 Index
Sector Allocation | % of
Index |
Financials | 11.0% |
Health Care | 13.1% |
Consumer Discretionary | 12.4% |
Consumer Staples | 5.6% |
Communication Services | 9.6% |
Information Technology | 29.2% |
Industrials | 8.5% |
Materials | 2.3% |
Real Estate | 3.4% |
Energy | 2.6% |
Utilities | 2.3% |
| | 100.0% |
DIAMOND HILL FUNDS | ANNUAL REPORT | DECEMBER 31, 2021 | DIAMOND-HILL.COM 79 |
Diamond Hill Funds
Tabular Presentation of Schedules of Investments (Continued)
December 31, 2021 (Unaudited)
Diamond Hill Large Cap Concentrated
Fund |
Sector Allocation | % of
Net Assets |
Financials | 28.2% |
Health Care | 15.1% |
Consumer Discretionary | 13.1% |
Consumer Staples | 10.1% |
Communication Services | 9.8% |
Information Technology | 7.8% |
Energy | 5.0% |
Materials | 4.3% |
Industrials | 3.8% |
Registered Investment Companies | 2.8% |
Other | |
Net Other Assets (Liabilities) | 0.0%* |
| | 100.0% |
| | |
Russell 1000 Index
Sector Allocation | % of
Index |
Financials | 11.0% |
Health Care | 13.1% |
Consumer Discretionary | 12.4% |
Consumer Staples | 5.6% |
Communication Services | 9.6% |
Information Technology | 29.2% |
Energy | 2.6% |
Materials | 2.3% |
Industrials | 8.5% |
Real Estate | 3.4% |
Utilities | 2.3% |
| | 100.0% |
* | Percentage rounds to less than 0.1%. |
Diamond Hill All Cap Select Fund |
Sector Allocation | % of
Net Assets |
Financials | 30.4% |
Industrials | 20.5% |
Consumer Discretionary | 13.6% |
Consumer Staples | 8.2% |
Communication Services | 7.8% |
Health Care | 7.5% |
Materials | 3.9% |
Information Technology | 3.0% |
Utilities | 2.0% |
Registered Investment Companies | 3.1% |
Other | |
Net Other Assets (Liabilities) | -0.0%* |
| | 100.0% |
| | |
Russell 3000 Index
Sector Allocation | % of
Index |
Financials | 11.3% |
Industrials | 8.9% |
Consumer Discretionary | 12.4% |
Consumer Staples | 5.4% |
Communication Services | 9.2% |
Health Care | 13.4% |
Materials | 2.4% |
Information Technology | 28.3% |
Utilities | 2.4% |
Real Estate | 3.6% |
Energy | 2.7% |
| | 100.0% |
* | Percentage rounds to less than 0.1%. |
80 DIAMOND HILL FUNDS | ANNUAL REPORT | DECEMBER 31, 2021 | DIAMOND-HILL.COM |
Diamond Hill Funds
Tabular Presentation of Schedules of Investments (Continued)
December 31, 2021 (Unaudited)
Diamond Hill Long-Short Fund |
Long Portfolio
Sector Allocation | % of
Net Assets |
Financials | 23.9% |
Communication Services | 13.3% |
Health Care | 13.1% |
Information Technology | 11.9% |
Industrials | 9.6% |
Consumer Discretionary | 7.5% |
Consumer Staples | 4.4% |
Energy | 3.4% |
Materials | 2.0% |
Utilities | 1.3% |
Registered Investment Companies | 26.4% |
| | |
Short Portfolio
Sector Allocation | % of
Net Assets |
Consumer Discretionary | -6.4% |
Information Technology | -5.7% |
Industrials | -5.3% |
Financials | -3.7% |
Consumer Staples | -3.4% |
Health Care | -2.8% |
Communication Services | -1.5% |
Utilities | -1.5% |
Materials | -0.5% |
Other | |
Segregated Cash With Custodian | 31.1% |
Net Other Assets (Liabilities) | -17.1% |
| | 100.0% |
| | |
Russell 1000 Index
Sector Allocation | % of
Index |
Financials | 11.0% |
Communication Services | 9.6% |
Health Care | 13.1% |
Information Technology | 29.2% |
Industrials | 8.5% |
Consumer Discretionary | 12.4% |
Consumer Staples | 5.6% |
Energy | 2.6% |
Materials | 2.3% |
Utilities | 2.3% |
Real Estate | 3.4% |
| | 100.0% |
Diamond Hill International Fund |
Sector Allocation | % of
Net Assets |
Communication Services | 21.9% |
Consumer Staples | 14.9% |
Financials | 14.0% |
Health Care | 13.3% |
Consumer Discretionary | 11.0% |
Information Technology | 10.8% |
Industrials | 6.0% |
Materials | 2.9% |
Registered Investment Companies | 5.8% |
Other | |
Net Other Assets (Liabilities) | -0.6% |
| | 100.0% |
| | |
Morningstar Global
Markets ex-U.S. Index
Sector Allocation | % of
Index |
Communication Services | 5.8% |
Consumer Staples | 8.1% |
Financials | 18.1% |
Health Care | 9.0% |
Consumer Discretionary | 12.2% |
Information Technology | 12.9% |
Industrials | 14.1% |
Materials | 8.6% |
Energy | 4.5% |
Real Estate | 3.6% |
Utilities | 3.1% |
| | 100.0% |
DIAMOND HILL FUNDS | ANNUAL REPORT | DECEMBER 31, 2021 | DIAMOND-HILL.COM 81 |
Diamond Hill Funds
Tabular Presentation of Schedules of Investments (Continued)
December 31, 2021 (Unaudited)
Diamond Hill Short Duration
Securitized Bond Fund |
Sector Allocation | % of
Net Assets |
Securitized | 85.1% |
Corporate Credit | 5.8% |
Treasury | 5.0% |
Registered Investment Companies | 6.4% |
Other | |
Net Other Assets (Liabilities) | -2.3% |
| | 100.0% |
| | |
Bloomberg U.S. 1-3 Yr. Gov./
Credit Index Sector Allocation | % of
Index |
Treasury | 68.3% |
Corporate Credit | 22.1% |
Non-Corporate Credit | 6.3% |
Agency | 3.3% |
| | 100.0% |
Diamond Hill Core Bond Fund |
Sector Allocation | % of
Net Assets |
Securitized | 61.2% |
Treasury | 19.6% |
Corporate Credit | 17.3% |
Government Related | 0.2% |
Registered Investment Companies | 6.3% |
Other | |
Net Other Assets (Liabilities) | -4.6% |
| | 100.0% |
| | |
Bloomberg U.S. Aggregate
Bond Index Sector Allocation | % of
Index |
Treasury | 38.9% |
Agency RMBS/CMBS | 28.3% |
Corporate Credit | 25.8% |
Non-Corporate Credit | 4.2% |
Agency | 1.4% |
Non-Agency RMBS/CMBS | 1.1% |
Asset-Backed Securities | 0.3% |
| | 100.0% |
82 DIAMOND HILL FUNDS | ANNUAL REPORT | DECEMBER 31, 2021 | DIAMOND-HILL.COM |
(Page intentionally left blank)
DIAMOND HILL FUNDS | ANNUAL REPORT | DECEMBER 31, 2021 | DIAMOND-HILL.COM 83 |
Diamond Hill Funds
Statements of Assets & Liabilities
December 31, 2021
| | | Small Cap
Fund | | | Small-Mid
Cap
Fund | | | Mid Cap
Fund | |
Assets | | | | | | | | | | | | |
Investment in unaffiliated securities, at cost | | $ | 331,593,241 | | | $ | 1,552,834,830 | | | $ | 177,728,112 | |
Investment in affiliated securities, at cost | | | — | | | | 27,251,924 | | | | 1,668,100 | |
Investment in unaffiliated securities, at fair value* | | $ | 604,067,753 | | | $ | 2,356,500,909 | | | $ | 286,552,383 | |
Investment affiliated securities, at fair value | | | — | | | | 27,403,556 | | | | 1,673,091 | |
Cash | | | — | | | | — | | | | — | |
Cash denominated in foreign currency (Cost $—,$—, $—, $—, $—, $—, $—, $5,765, $—, and $—) | | | — | | | | — | | | | — | |
Cash deposits with custodian for securities sold short | | | — | | | | — | | | | — | |
Receivable for investments sold | | | — | | | | — | | | | — | |
Receivable for fund shares issued | | | 355,225 | | | | 447,572 | | | | 113,746 | |
Receivable for dividends and interest | | | 326,789 | | | | 1,759,825 | | | | 226,437 | |
Tax reclaims receivable | | | — | | | | — | | | | — | |
Total Assets | | | 604,749,767 | | | | 2,386,111,862 | | | | 288,565,657 | |
| | | | | | | | | | | | | |
Liabilities | | | | | | | | | | | | |
Investments sold short, at fair value (proceeds $—, $—, $—, $—, $—, $—, $535,760,111, $—, $—, and $—) | | | — | | | | — | | | | — | |
Payable for securities purchased | | | 55,265 | | | | 750,296 | | | | — | |
Payable for fund shares redeemed | | | 259,971 | | | | 5,682,539 | | | | 346,419 | |
Payable for dividend expense on securities sold short | | | — | | | | — | | | | — | |
Payable for return of collateral received for securities on loan | | | 35,407,806 | | | | 99,592,542 | | | | 1,589,392 | |
Payable to Investment Adviser | | | 382,416 | | | | 1,409,434 | | | | 141,403 | |
Payable to Administrator | | | 80,143 | | | | 227,322 | | | | 38,950 | |
Accrued distribution and service fees | | | 26,027 | | | | 43,283 | | | | 6,823 | |
Other accrued expenses | | | 2,600 | | | | 300 | | | | 300 | |
Total Liabilities | | | 36,214,228 | | | | 107,705,716 | | | | 2,123,287 | |
| | | | | | | | | | | | | |
Net Assets | | $ | 568,535,539 | | | $ | 2,278,406,146 | | | $ | 286,442,370 | |
| | | | | | | | | | | | | |
Components of Net Assets | | | | | | | | | | | | |
Paid-in capital | | $ | 287,592,163 | | | $ | 1,475,597,067 | | | $ | 191,660,372 | |
Distributable earnings (accumulated deficit) | | | 280,943,376 | | | | 802,809,079 | | | | 94,781,998 | |
Net Assets | | $ | 568,535,539 | | | $ | 2,278,406,146 | | | $ | 286,442,370 | |
Net Assets | | | | | | | | | | | | |
Investor Shares | | $ | 123,975,075 | | | $ | 208,109,707 | | | $ | 33,006,480 | |
Class I Shares | | $ | 391,856,062 | | | $ | 1,059,286,799 | | | $ | 229,696,488 | |
Class Y Shares | | $ | 52,704,402 | | | $ | 1,011,009,640 | | | $ | 23,739,402 | |
Shares of beneficial interest outstanding (unlimited number of shares authorized, no par value) | | | | | | | | | | | | |
Investor Shares | | | 3,569,988 | | | | 7,416,970 | | | | 1,772,851 | |
Class I Shares | | | 11,057,164 | | | | 37,325,873 | | | | 12,292,202 | |
Class Y Shares | | | 1,484,868 | | | | 35,533,459 | | | | 1,266,507 | |
Net Asset Value, offering and redemption price per share: | | | | | | | | | | | | |
Investor Shares | | $ | 34.73 | | | $ | 28.06 | | | $ | 18.62 | |
Class I Shares | | $ | 35.44 | | | $ | 28.38 | | | $ | 18.69 | |
Class Y Shares | | $ | 35.49 | | | $ | 28.45 | | | $ | 18.74 | |
* Includes value of securities on loan | | $ | 36,498,982 | | | $ | 108,883,641 | | | $ | 1,559,733 | |
See accompanying Notes to Financial Statements.
84 DIAMOND HILL FUNDS | ANNUAL REPORT | DECEMBER 31, 2021 | DIAMOND-HILL.COM |
| | Large Cap
Fund | | | Large Cap
Concentrated
Fund | | | All Cap
Select
Fund | | | Long-Short
Fund | | | International
Fund | | | Short Duration
Securitized
Bond Fund | | | Core Bond
Fund | |
| | | | | | | | | | | | | | | | | | | | | | | | | | | | |
| | $ | 8,575,797,354 | | | $ | 15,617,199 | | | $ | 248,572,889 | | | $ | 1,522,392,797 | | | $ | 52,957,124 | | | $ | 1,527,495,918 | | | $ | 419,766,023 | |
| | | — | | | | — | | | | — | | | | 30,570,893 | | | | — | | | | — | | | | — | |
| | $ | 12,401,028,559 | | | $ | 17,946,590 | | | $ | 383,504,803 | | | $ | 2,302,663,682 | | | $ | 55,899,654 | | | $ | 1,533,865,442 | | | | 417,757,028 | |
| | | — | | | | — | | | | — | | | | 30,812,092 | | | | — | | | | — | | | | — | |
| | | 1,761,884 | | | | 3,151 | | | | — | | | | 1,611 | | | | — | | | | 19,400 | | | | 2,587 | |
| | | — | | | | — | | | | — | | | | — | | | | 5,809 | | | | — | | | | — | |
| | | — | | | | — | | | | — | | | | 621,577,793 | | | | — | | | | — | | | | — | |
| | | 387,974 | | | | — | | | | — | | | | 18,038,210 | | | | — | | | | — | | | | — | |
| | | 8,034,819 | | | | — | | | | 4,780,732 | | | | 3,068,524 | | | | — | | | | 3,417,013 | | | | 192,289 | |
| | | 7,870,728 | | | | 11,094 | | | | 164,852 | | | | 677,903 | | | | 63,216 | | | | 2,465,470 | | | | 1,253,026 | |
| | | — | | | | — | | | | — | | | | — | | | | 12,417 | | | | — | | | | — | |
| | | 12,419,083,964 | | | | 17,960,835 | | | | 388,450,387 | | | | 2,976,839,815 | | | | 55,981,096 | | | | 1,539,767,325 | | | | 419,204,930 | |
| | | | | | | | | | | | | | | | | | | | | | | | | | | | |
| | | | | | | | | | | | | | | | | | | | | | | | | | | | |
| | | — | | | | — | | | | — | | | | 614,950,582 | | | | — | | | | — | | | | — | |
| | | — | | | | — | | | | 4,715,043 | | | | — | | | | — | | | | — | | | | — | |
| | | 16,289,648 | | | | 6,805 | | | | 74,070 | | | | 8,116,675 | | | | — | | | | 5,136,674 | | | | 264,397 | |
| | | — | | | | — | | | | — | | | | 474,452 | | | | — | | | | — | | | | — | |
| | | 35,782,250 | | | | — | | | | 665 | | | | 353,432,836 | | | | 359,632 | | | | 35,236,950 | | | | 19,357,714 | |
| | | 5,156,962 | | | | 7,009 | | | | 214,944 | | | | 1,543,503 | | | | 28,434 | | | | 463,270 | | | | 102,410 | |
| | | 1,465,717 | | | | 903 | | | | 41,195 | | | | 295,238 | | | | 2,890 | | | | 211,484 | | | | 52,365 | |
| | | 206,509 | | | | 7 | | | | 5,437 | | | | 35,660 | | | | 88 | | | | 8,590 | | | | 2,112 | |
| | | 300 | | | | 300 | | | | 300 | | | | 3,800 | | | | 1,950 | | | | 300 | | | | 525 | |
| | | 58,901,386 | | | | 15,024 | | | | 5,051,654 | | | | 978,852,746 | | | | 392,994 | | | | 41,057,268 | | | | 19,779,523 | |
| | | | | | | | | | | | | | | | | | | | | | | | | | | | |
| | $ | 12,360,182,578 | | | $ | 17,945,811 | | | $ | 383,398,733 | | | $ | 1,997,987,069 | | | $ | 55,588,102 | | | $ | 1,498,710,057 | | | $ | 399,425,407 | |
| | | | | | | | | | | | | | | | | | | | | | | | | | | | |
| | | | | | | | | | | | | | | | | | | | | | | | | | | | |
| | $ | 8,432,647,848 | | | $ | 15,754,405 | | | $ | 247,052,065 | | | $ | 1,262,299,858 | | | $ | 52,774,852 | | | $ | 1,492,494,379 | | | $ | 402,031,485 | |
| | | 3,927,534,730 | | | | 2,191,406 | | | | 136,346,668 | | | | 735,687,211 | | | | 2,813,250 | | | | 6,215,678 | | | | (2,606,078 | ) |
| | $ | 12,360,182,578 | | | $ | 17,945,811 | | | $ | 383,398,733 | | | $ | 1,997,987,069 | | | $ | 55,588,102 | | | $ | 1,498,710,057 | | | $ | 399,425,407 | |
| | | | | | | | | | | | | | | | | | | | | | | | | | | | |
| | $ | 986,598,293 | | | $ | 32,596 | | | $ | 31,064,294 | | | $ | 168,464,590 | | | $ | 449,354 | | | $ | 40,035,069 | | | $ | 10,090,947 | |
| | $ | 8,168,470,399 | | | $ | 2,014,897 | | | $ | 232,051,317 | | | $ | 1,792,279,517 | | | $ | 9,010,079 | | | $ | 1,313,888,107 | | | $ | 330,666,116 | |
| | $ | 3,205,113,886 | | | $ | 15,898,318 | | | $ | 120,283,122 | | | $ | 37,242,962 | | | $ | 46,128,669 | | | $ | 144,786,881 | | | $ | 58,668,344 | |
| | | | | | | | | | | | | | | | | | | | | | | | | | | | |
| | | 27,794,290 | | | | 2,738 | | | | 1,448,737 | | | | 6,068,794 | | | | 26,813 | | | | 3,965,474 | | | | 970,283 | |
| | | 228,866,733 | | | | 169,064 | | | | 10,681,148 | | | | 62,502,221 | | | | 536,658 | | | | 130,142,926 | | | | 31,837,920 | |
| | | 89,721,716 | | | | 1,333,443 | | | | 5,513,572 | | | | 1,291,085 | | | | 2,744,976 | | | | 14,327,533 | | | | 5,644,999 | |
| | | | | | | | | | | | | | | | | | | | | | | | | | | | |
| | $ | 35.50 | | | $ | 11.90 | | | $ | 21.44 | | | $ | 27.76 | | | $ | 16.76 | | | $ | 10.10 | | | $ | 10.40 | |
| | $ | 35.69 | | | $ | 11.92 | | | $ | 21.73 | | | $ | 28.68 | | | $ | 16.79 | | | $ | 10.10 | | | $ | 10.39 | |
| | $ | 35.72 | | | $ | 11.92 | | | $ | 21.82 | | | $ | 28.85 | | | $ | 16.80 | | | $ | 10.11 | | | $ | 10.39 | |
| | $ | 141,089,479 | | | $ | — | | | $ | 660 | | | $ | 345,170,733 | | | $ | 416,820 | | | $ | 34,452,998 | | | $ | 18,890,580 | |
DIAMOND HILL FUNDS | ANNUAL REPORT | DECEMBER 31, 2021 | DIAMOND-HILL.COM 85 |
Diamond Hill Funds
Statements of Operations
For the Year ended December 31, 2021(a)
| | | Small Cap
Fund | | | Small-Mid
Cap
Fund | | | Mid Cap
Fund | | | Large Cap
Fund | | | Large Cap
Concentrated
Fund | |
Investment Income | | | | | | | | | | | | | | | | | | | | |
Dividends | | $ | 8,539,101 | | | $ | 29,503,585 | | | $ | 3,759,428 | | | $ | 181,560,011 | | | $ | 175,942 | |
Income distributions from affiliated investments | | | — | | | | 731,783 | | | | 44,678 | | | | — | | | | — | |
Securities lending income | | | 37,031 | | | | 114,636 | | | | 996 | | | | 175,083 | | | | 121 | |
Foreign taxes withheld | | | — | | | | — | | | | (5,065 | ) | | | (9,835 | ) | | | — | |
Total Investment Income | | | 8,576,132 | | | | 30,350,004 | | | | 3,800,037 | | | | 181,725,259 | | | | 176,063 | |
| | | | | | | | | | | | | | | | | | | | | |
Expenses | | | | | | | | | | | | | | | | | | | | |
Investment advisory fees | | | 4,644,791 | | | | 16,442,113 | | | | 1,670,944 | | | | 55,444,574 | | | | 56,441 | |
Administration fees | | | 972,249 | | | | 2,625,242 | | | | 455,788 | | | | 15,799,800 | | | | 6,850 | |
Distribution and service fees — Investor | | | 331,483 | | | | 495,450 | | | | 82,318 | | | | 2,357,463 | | | | 43 | |
Distribution and service fees — Class C | | | 10,258 | | | | 21,199 | | | | — | | | | 97,926 | | | | — | |
Other fees | | | 4,454 | | | | 4,698 | | | | 1,683 | | | | 19,501 | | | | 1,019 | |
Total Expenses | | | 5,963,235 | | | | 19,588,702 | | | | 2,210,733 | | | | 73,719,264 | | | | 64,353 | |
Advisory fees waived by Adviser | | | — | | | | (94,675 | ) | | | (5,780 | ) | | | — | | | | — | |
Net Expenses | | | 5,963,235 | | | | 19,494,027 | | | | 2,204,953 | | | | 73,719,264 | | | | 64,353 | |
| | | | | | | | | | | | | | | | | | | | | |
Net Investment Income | | | 2,612,897 | | | | 10,855,977 | | | | 1,595,084 | | | | 108,005,995 | | | | 111,710 | |
| | | | | | | | | | | | | | | | | | | | | |
Realized and Unrealized Gains on Investments | | | | | | | | | | | | | | | | | | | | |
Net realized gains on investment transactions | | | 103,273,892 | | | | 136,375,252 | | | | 15,385,784 | | | | 882,568,677 | | | | 9,882 | |
Net realized gains from in-kind redemptions | | | — | | | | — | | | | — | | | | 33,460,273 | | | | — | |
Long-term capital gain distributions from investments in affiliates | | | — | | | | 6,219 | | | | 380 | | | | — | | | | — | |
Net change in unrealized appreciation (depreciation) on unaffiliated investments | | | 56,290,235 | | | | 435,657,381 | | | | 57,930,518 | | | | 1,425,650,740 | | | | 2,329,391 | |
Net change in unrealized appreciation (depreciation) on affiliated investments | | | — | | | | 22,235 | | | | 1,358 | | | | — | | | | — | |
Net Realized and Unrealized Gains on Investments | | | 159,564,127 | | | | 572,061,087 | | | | 73,318,040 | | | | 2,341,679,690 | | | | 2,339,273 | |
| | | | | | | | | | | | | | | | | | | | | |
Change in Net Assets from Operations | | $ | 162,177,024 | | | $ | 582,917,064 | | | $ | 74,913,124 | | | $ | 2,449,685,685 | | | $ | 2,450,983 | |
(a) | Except for the Diamond Hill Large Cap Concentrated Fund, which represents the period from the commencement of operations (February 26, 2021) through December 31, 2021. |
See accompanying Notes to Financial Statements.
86 DIAMOND HILL FUNDS | ANNUAL REPORT | DECEMBER 31, 2021 | DIAMOND-HILL.COM |
Diamond Hill Funds
Statements of Operations
For the Year ended December 31, 2021
| | | All Cap
Select
Fund | | | Long-Short
Fund | | | International
Fund | | | Short Duration
Securitized
Bond Fund | | | Core Bond
Fund | |
Investment Income | | | | | | | | | | | | | | | | | | | | |
Dividends | | $ | 5,225,367 | | | $ | 31,058,078 | | | $ | 502,584 | | | $ | 113,398 | | | $ | 4,765 | |
Non-cash dividend income | | | — | | | | — | | | | 467,469 | | | | — | | | | — | |
Income distributions from affiliated investments | | | — | | | | 894,741 | | | | — | | | | — | | | | — | |
Securities lending income | | | 1,279 | | | | 141,591 | | | | 36,499 | | | | 10,706 | | | | 30,189 | |
Foreign taxes withheld | | | — | | | | — | | | | (114,126 | ) | | | — | | | | — | |
Interest | | | — | | | | — | | | | — | | | | 41,234,519 | | | | 9,887,871 | |
Total Investment Income | | | 5,226,646 | | | | 32,094,410 | | | | 892,426 | | | | 41,358,623 | | | | 9,922,825 | |
| | | | | | | | | | | | | | | | | | | | | |
Expenses | | | | | | | | | | | | | | | | | | | | |
Investment advisory fees | | | 2,518,553 | | | | 18,546,616 | | | | 168,772 | | | | 4,769,728 | | | | 1,164,025 | |
Administration fees | | | 449,750 | | | | 3,498,289 | | | | 19,439 | | | | 2,136,569 | | | | 595,293 | |
Distribution and service fees — Investor | | | 44,170 | | | | 437,687 | | | | 988 | | | | 109,758 | | | | 63,481 | |
Distribution and service fees — Class C | | | 4,661 | | | | 33,746 | | | | — | | | | — | | | | — | |
Other fees | | | 2,302 | | | | 7,774 | | | | 6,318 | | | | 3,260 | | | | 2,029 | |
Brokerage expense on securities sold short | | | — | | | | 2,070,741 | | | | — | | | | — | | | | — | |
Dividend expense | | | — | | | | 9,776,978 | | | | — | | | | — | | | | — | |
Total Expenses | | | 3,019,436 | | | | 34,371,831 | | | | 195,517 | | | | 7,019,315 | | | | 1,824,828 | |
Advisory fees waived by Adviser | | | — | | | | (115,380 | ) | | | — | | | | — | | | | — | |
Net Expenses | | | 3,019,436 | | | | 34,256,451 | | | | 195,517 | | | | 7,019,315 | | | | 1,824,828 | |
| | | | | | | | | | | | | | | | | | | | | |
Net Investment Income (Loss) | | | 2,207,210 | | | | (2,162,041 | ) | | | 696,909 | | | | 34,339,308 | | | | 8,097,997 | |
| | | | | | | | | | | | | | | | | | | | | |
Realized and Unrealized Gains (Losses) on Investments | | | | | | | | | | | | | | | | | | | | |
Net realized gains on investment transactions | | | 57,418,119 | | | | 377,191,589 | | | | 1,614,077 | | | | 8,213,378 | | | | 144,588 | |
Net realized losses on closed short positions | | | — | | | | (102,806,374 | ) | | | — | | | | — | | | | — | |
Net realized gains on sales from affiliated investments | | | — | | | | 62,759 | | | | — | | | | — | | | | — | |
Long-term capital gain distributions from investments in affiliates | | | — | | | | 6,992 | | | | — | | | | — | | | | — | |
Net realized gains on foreign currency transactions | | | — | | | | 51 | | | | 473 | | | | — | | | | — | |
Net change in unrealized appreciation (depreciation) on unaffiliated investments and foreign currency translations | | | 42,373,052 | | | | 86,244,282 | | | | 234,999 | | | | (9,622,308 | ) | | | (11,721,241 | ) |
Net changes in unrealized appreciation (depreciation) on affiliated investments | | | — | | | | 10,722 | | | | — | | | | — | | | | — | |
Net Realized and Unrealized Gains (Losses) on Investments | | | 99,791,171 | | | | 360,710,021 | | | | 1,849,549 | | | | (1,408,930 | ) | | | (11,576,653 | ) |
| | | | | | | | | | | | | | | | | | | | | |
Change in Net Assets from Operations | | $ | 101,998,381 | | | $ | 358,547,980 | | | $ | 2,546,458 | | | $ | 32,930,378 | | | $ | (3,478,656 | ) |
See accompanying Notes to Financial Statements.
DIAMOND HILL FUNDS | ANNUAL REPORT | DECEMBER 31, 2021 | DIAMOND-HILL.COM 87 |
Diamond Hill Funds
Statements of Changes in Net Assets
| | | Small Cap Fund | | | | Small-Mid Cap Fund | |
| | | For the
year ended
December 31,
2021 | | | For the
year ended
December 31,
2020 | | | | For the
year ended
December 31,
2021 | | | For the
year ended
December 31,
2020 | |
From Operations | | | | | | | | | | | | | | | | | |
Net investment income | | $ | 2,612,897 | | | $ | 1,386,988 | | | | $ | 10,855,977 | | | $ | 9,330,097 | |
Net realized gains on investment transactions | | | 103,273,892 | | | | 27,434,258 | | | | | 136,375,252 | | | | 20,356,175 | |
Net realized losses on sales from affiliated investments | | | — | | | | — | | | | | — | | | | (9,028 | ) |
Long-term capital gain distributions from investments in affiliates | | | — | | | | — | | | | | 6,219 | | | | — | |
Net change in unrealized appreciation (depreciation) on investments | | | 56,290,235 | | | | (59,087,783 | ) | | | | 435,679,616 | | | | (113,906,866 | ) |
Change in Net Assets from Operations | | | 162,177,024 | | | | (30,266,537 | ) | | | | 582,917,064 | | | | (84,229,622 | ) |
| | | | | | | | | | | | | | | | | | |
Distributions to Shareholders | | | | | | | | | | | | | | | | | |
Investor | | | (19,007,456 | ) | | | (375,118 | ) | | | | (11,043,927 | ) | | | (794,357 | ) |
Class C | | | — | | | | — | | | | | — | | | | (7,160 | ) |
Class I | | | (60,282,089 | ) | | | (2,149,700 | ) | | | | (58,954,716 | ) | | | (6,470,466 | ) |
Class Y | | | (8,053,914 | ) | | | (400,788 | ) | | | | (56,549,238 | ) | | | (7,445,410 | ) |
Change in Net Assets from Distributions to Shareholders | | | (87,343,459 | ) | | | (2,925,606 | ) | | | | (126,547,881 | ) | | | (14,717,393 | ) |
Change in Net Assets from Capital Transactions | | | (37,671,773 | ) | | | (188,317,587 | ) | | | | (133,242,999 | ) | | | (382,235,477 | ) |
| | | | | | | | | | | | | | | | | | |
Total Change in Net Assets | | | 37,161,792 | | | | (221,509,730 | ) | | | | 323,126,184 | | | | (481,182,492 | ) |
| | | | | | | | | | | | | | | | | | |
Net Assets: | | | | | | | | | | | | | | | | | |
Beginning of year | | | 531,373,747 | | | | 752,883,477 | | | | | 1,955,279,962 | | | | 2,436,462,454 | |
End of year | | $ | 568,535,539 | | | $ | 531,373,747 | | | | $ | 2,278,406,146 | | | $ | 1,955,279,962 | |
See accompanying Notes to Financial Statements.
88 DIAMOND HILL FUNDS | ANNUAL REPORT | DECEMBER 31, 2021 | DIAMOND-HILL.COM |
Diamond Hill Funds
Statements of Changes in Net Assets
| | | Small Cap Fund | | | | Small-Mid Cap Fund | |
| | | For the
year ended
December 31,
2021 | | | For the
year ended
December 31,
2020 | | | | For the
year ended
December 31,
2021 | | | For the
year ended
December 31,
2020 | |
Capital Transactions | | | | | | | | | | | | | | | | | |
Investor | | | | | | | | | | | | | | | | | |
Proceeds from shares sold | | $ | 16,798,404 | | | $ | 23,733,959 | | | | $ | 27,390,076 | | | $ | 24,448,991 | |
Reinvested distributions | | | 16,131,838 | | | | 314,746 | | | | | 10,859,344 | | | | 783,648 | |
Payments for shares redeemed | | | (51,349,042 | ) | | | (63,068,608 | ) | | | | (47,716,185 | ) | | | (44,318,189 | ) |
Exchanged from Class C | | | 7,261,878 | | | | — | | | | | 14,702,216 | | | | — | |
Change in Net Assets from Investor Share Transactions | | | (11,156,922 | ) | | | (39,019,903 | ) | | | | 5,235,451 | | | | (19,085,550 | ) |
Class C | | | | | | | | | | | | | | | | | |
Proceeds from shares sold | | | — | | | | 611,220 | | | | | — | | | | 649,284 | |
Reinvested distributions | | | — | | | | — | | | | | — | | | | 6,509 | |
Payments for shares redeemed | | | (540,169 | ) | | | (5,650,487 | ) | | | | (1,856,889 | ) | | | (7,579,456 | ) |
Exchanged for Investor Shares | | | (7,261,878 | ) | | | — | | | | | (14,702,216 | ) | | | — | |
Change in Net Assets from Class C Share Transactions | | | (7,802,047 | ) | | | (5,039,267 | ) | | | | (16,559,105 | ) | | | (6,923,663 | ) |
Class I | | | | | | | | | | | | | | | | | |
Proceeds from shares sold | | | 44,143,747 | | | | 103,453,931 | | | | | 157,380,132 | | | | 274,659,187 | |
Reinvested distributions | | | 55,432,012 | | | | 1,994,067 | | | | | 47,435,035 | | | | 4,986,493 | |
Payments for shares redeemed | | | (106,129,791 | ) | | | (205,621,642 | ) | | | | (242,286,208 | ) | | | (434,226,524 | ) |
Change in Net Assets from Class I Share Transactions | | | (6,554,032 | ) | | | (100,173,644 | ) | | | | (37,471,041 | ) | | | (154,580,844 | ) |
Class Y | | | | | | | | | | | | | | | | | |
Proceeds from shares sold | | | 10,556,918 | | | | 13,656,080 | | | | | 144,991,118 | | | | 132,544,137 | |
Reinvested distributions | | | 8,053,857 | | | | 400,779 | | | | | 54,959,250 | | | | 6,965,221 | |
Payments for shares redeemed | | | (30,769,547 | ) | | | (58,141,632 | ) | | | | (284,398,672 | ) | | | (341,154,778 | ) |
Change in Net Assets from Class Y Share Transactions | | | (12,158,772 | ) | | | (44,084,773 | ) | | | | (84,448,304 | ) | | | (201,645,420 | ) |
Change in Net Assets from Capital Transactions | | $ | (37,671,773 | ) | | $ | (188,317,587 | ) | | | $ | (133,242,999 | ) | | $ | (382,235,477 | ) |
See accompanying Notes to Financial Statements.
DIAMOND HILL FUNDS | ANNUAL REPORT | DECEMBER 31, 2021 | DIAMOND-HILL.COM 89 |
Diamond Hill Funds
Statements of Changes in Net Assets
| | | Small Cap Fund | | | | Small-Mid Cap Fund | |
| | | For the
year ended
December 31,
2021 | | | For the
year ended
December 31,
2020 | | | | For the
year ended
December 31,
2021 | | | For the
year ended
December 31,
2020 | |
Share Transactions: | | | | | | | | | | | | | | | | | |
Investor | | | | | | | | | | | | | | | | | |
Issued | | | 459,761 | | | | 1,333,737 | | | | | 1,073,586 | | | | 1,410,527 | |
Reinvested | | | 480,612 | | | | 296,221 | | | | | 399,947 | | | | 34,702 | |
Redeemed | | | (1,378,049 | ) | | | (4,136,880 | ) | | | | (1,811,009 | ) | | | (2,426,981 | ) |
Exchanged from Class C | | | 212,296 | | | | — | | | | | 587,472 | | | | — | |
Change in Shares Outstanding | | | (225,380 | ) | | | (2,506,922 | ) | | | | 249,996 | | | | (981,752 | ) |
Class C | | | | | | | | | | | | | | | | | |
Issued | | | — | | | | 6,934 | | | | | — | | | | 38,307 | |
Reinvested | | | — | | | | 33,444 | | | | | — | | | | 329 | |
Redeemed | | | (19,676 | ) | | | (594,042 | ) | | | | (86,902 | ) | | | (450,222 | ) |
Exchanged for Investor Shares | | | (253,200 | ) | | | — | | | | | (653,293 | ) | | | — | |
Change in Shares Outstanding | | | (272,876 | ) | | | (553,664 | ) | | | | (740,195 | ) | | | (411,586 | ) |
Class I | | | | | | | | | | | | | | | | | |
Issued | | | 1,193,318 | | | | 3,294,020 | | | | | 5,700,906 | | | | 15,498,884 | |
Reinvested | | | 1,612,614 | | | | 943,203 | | | | | 1,720,884 | | | | 218,333 | |
Redeemed | | | (2,875,623 | ) | | | (12,106,669 | ) | | | | (8,866,009 | ) | | | (24,395,824 | ) |
Change in Shares Outstanding | | | (69,691 | ) | | | (7,869,446 | ) | | | | (1,444,219 | ) | | | (8,678,607 | ) |
Class Y | | | | | | | | | | | | | | | | | |
Issued | | | 283,071 | | | | 665,331 | | | | | 5,242,139 | | | | 7,249,838 | |
Reinvested | | | 233,583 | | | | 225,846 | | | | | 1,985,682 | | | | 304,225 | |
Redeemed | | | (821,559 | ) | | | (2,849,504 | ) | | | | (10,342,236 | ) | | | (19,138,809 | ) |
Change in Shares Outstanding | | | (304,905 | ) | | | (1,958,327 | ) | | | | (3,114,415 | ) | | | (11,584,746 | ) |
Change in Total Shares Outstanding | | | (872,852 | ) | | | (12,888,359 | ) | | | | (5,048,833 | ) | | | (21,656,691 | ) |
See accompanying Notes to Financial Statements.
90 DIAMOND HILL FUNDS | ANNUAL REPORT | DECEMBER 31, 2021 | DIAMOND-HILL.COM |
Diamond Hill Funds
Statements of Changes in Net Assets
| | | Mid Cap Fund | | | | Large Cap Fund | |
| | | For the
year ended
December 31,
2021 | | | For the
year ended
December 31,
2020 | | | | For the
year ended
December 31,
2021 | | | For the
year ended
December 31,
2020 | |
From Operations | | | | | | | | | | | | | | | | | |
Net investment income | | $ | 1,595,084 | | | $ | 1,523,789 | | | | $ | 108,005,995 | | | $ | 86,692,884 | |
Net realized gains (losses) on investment transactions | | | 15,385,784 | | | | (28,759,549 | ) | | | | 916,028,950 | | | | 294,727,927 | |
Net realized losses on sales from affiliated investments | | | — | | | | (75,396 | ) | | | | — | | | | — | |
Long-term capital gain distributions from investments in affiliates | | | 380 | | | | — | | | | | — | | | | — | |
Net change in unrealized appreciation (depreciation) on investments | | | 57,931,876 | | | | 23,469,866 | | | | | 1,425,650,740 | | | | 365,974,269 | |
Change in Net Assets from Operations | | | 74,913,124 | | | | (3,841,290 | ) | | | | 2,449,685,685 | | | | 747,395,080 | |
| | | | | | | | | | | | | | | | | | |
Distributions to Shareholders | | | | | | | | | | | | | | | | | |
Investor | | | (97,307 | ) | | | (175,191 | ) | | | | (68,232,864 | ) | | | (22,298,991 | ) |
Class C | | | — | | | | — | | | | | — | | | | (1,861,129 | ) |
Class I | | | (1,346,510 | ) | | | (1,482,682 | ) | | | | (584,144,558 | ) | | | (174,347,503 | ) |
Class Y | | | (164,161 | ) | | | (213,621 | ) | | | | (231,667,679 | ) | | | (80,994,298 | ) |
Change in Net Assets from Distributions to Shareholders | | | (1,607,978 | ) | | | (1,871,494 | ) | | | | (884,045,101 | ) | | | (279,501,921 | ) |
Change in Net Assets from Capital Transactions | | | (37,642,983 | ) | | | 26,506,292 | | | | | 2,482,776,230 | | | | 1,071,050,896 | |
| | | | | | | | | | | | | | | | | | |
Total Change in Net Assets | | | 35,662,163 | | | | 20,793,508 | | | | | 4,048,416,814 | | | | 1,538,944,055 | |
| | | | | | | | | | | | | | | | | | |
Net Assets: | | | | | | | | | | | | | | | | | |
Beginning of year | | | 250,780,207 | | | | 229,986,699 | | | | | 8,311,765,764 | | | | 6,772,821,709 | |
End of year | | $ | 286,442,370 | | | $ | 250,780,207 | | | | $ | 12,360,182,578 | | | $ | 8,311,765,764 | |
See accompanying Notes to Financial Statements.
DIAMOND HILL FUNDS | ANNUAL REPORT | DECEMBER 31, 2021 | DIAMOND-HILL.COM 91 |
Diamond Hill Funds
Statements of Changes in Net Assets
| | | Mid Cap Fund | | | | Large Cap Fund | |
| | | For the
year ended
December 31,
2021 | | | For the
year ended
December 31,
2020 | | | | For the
year ended
December 31,
2021 | | | For the
year ended
December 31,
2020 | |
Capital Transactions | | | | | | | | | | | | | | | | | |
Investor | | | | | | | | | | | | | | | | | |
Proceeds from shares sold | | $ | 7,872,408 | | | $ | 13,431,553 | | | | $ | 158,402,643 | | | $ | 149,464,843 | |
Reinvested distributions | | | 77,675 | | | | 164,900 | | | | | 64,318,096 | | | | 21,250,713 | |
Payments for shares redeemed | | | (17,037,657 | ) | | | (13,070,139 | ) | | | | (207,723,899 | ) | | | (690,852,940 | ) |
Exchanged from Class C | | | — | | | | — | | | | | 68,882,202 | | | | — | |
Change in Net Assets from Investor Share Transactions | | | (9,087,574 | ) | | | 526,314 | | | | | 83,879,042 | | | | (520,137,384 | ) |
Class C | | | | | | | | | | | | | | | | | |
Proceeds from shares sold | | | — | | | | — | | | | | 12 | | | | 6,876,257 | |
Reinvested distributions | | | — | | | | — | | | | | — | | | | 1,704,162 | |
Payments for shares redeemed | | | — | | | | — | | | | | (2,762,175 | ) | | | (24,373,041 | ) |
Exchanged for Investor Shares | | | — | | | | — | | | | | (68,882,202 | ) | | | — | |
Change in Net Assets from Class C Share Transactions | | | — | | | | — | | | | | (71,644,365 | ) | | | (15,792,622 | ) |
Class I | | | | | | | | | | | | | | | | | |
Proceeds from shares sold | | | 37,780,057 | | | | 150,185,900 | | | | | 3,092,916,270 | | | | 2,084,600,703 | |
Reinvested distributions | | | 1,261,010 | | | | 1,419,804 | | | | | 466,886,033 | | | | 131,982,936 | |
Payments for shares redeemed | | | (61,338,468 | ) | | | (127,460,056 | ) | | | | (1,542,375,603 | ) | | | (1,275,039,176 | ) |
Change in Net Assets from Class I Share Transactions | | | (22,297,401 | ) | | | 24,145,648 | | | | | 2,017,426,700 | | | | 941,544,463 | |
Class Y | | | | | | | | | | | | | | | | | |
Proceeds from shares sold | | | 3,872,775 | | | | 10,272,471 | | | | | 833,695,875 | | | | 975,327,302 | |
Reinvested distributions | | | 121,588 | | | | 177,984 | | | | | 213,178,870 | | | | 73,568,411 | |
Payments for shares redeemed | | | (10,252,371 | ) | | | (8,616,125 | ) | | | | (593,759,892 | ) | | | (383,459,274 | ) |
Change in Net Assets from Class Y Share Transactions | | | (6,258,008 | ) | | | 1,834,330 | | | | | 453,114,853 | | | | 665,436,439 | |
Change in Net Assets from Capital Transactions | | $ | (37,642,983 | ) | | $ | 26,506,292 | | | | $ | 2,482,776,230 | | | $ | 1,071,050,896 | |
See accompanying Notes to Financial Statements.
92 DIAMOND HILL FUNDS | ANNUAL REPORT | DECEMBER 31, 2021 | DIAMOND-HILL.COM |
Diamond Hill Funds
Statements of Changes in Net Assets
| | | Mid Cap Fund | | | | Large Cap Fund | |
| | | For the
year ended
December 31,
2021 | | | For the
year ended
December 31,
2020 | | | | For the
year ended
December 31,
2021 | | | For the
year ended
December 31,
2020 | |
Share Transactions: | | | | | | | | | | | | | | | | | |
Investor | | | | | | | | | | | | | | | | | |
Issued | | | 469,070 | | | | 1,216,594 | | | | | 4,652,274 | | | | 5,690,207 | |
Reinvested | | | 4,181 | | | | 11,690 | | | | | 1,848,010 | | | | 711,742 | |
Redeemed | | | (1,025,969 | ) | | | (1,087,987 | ) | | | | (5,949,368 | ) | | | (24,420,335 | ) |
Exchanged from Class C | | | — | | | | — | | | | | 2,174,100 | | | | — | |
Change in Shares Outstanding | | | (552,718 | ) | | | 140,297 | | | | | 2,725,016 | | | | (18,018,386 | ) |
Class C | | | | | | | | | | | | | | | | | |
Issued | | | — | | | | — | | | | | 1 | | | | 272,394 | |
Reinvested | | | — | | | | — | | | | | — | | | | 61,118 | |
Redeemed | | | — | | | | — | | | | | (95,010 | ) | | | (1,003,488 | ) |
Exchanged for Investor Shares | | | — | | | | — | | | | | (2,315,245 | ) | | | — | |
Change in Shares Outstanding | | | — | | | | — | | | | | (2,410,254 | ) | | | (669,976 | ) |
Class I | | | | | | | | | | | | | | | | | |
Issued | | | 2,260,946 | | | | 12,972,552 | | | | | 91,420,467 | | | | 79,573,495 | |
Reinvested | | | 67,615 | | | | 99,970 | | | | | 13,298,023 | | | | 4,378,428 | |
Redeemed | | | (3,608,920 | ) | | | (11,587,276 | ) | | | | (44,007,228 | ) | | | (49,291,182 | ) |
Change in Shares Outstanding | | | (1,280,359 | ) | | | 1,485,246 | | | | | 60,711,262 | | | | 34,660,741 | |
Class Y | | | | | | | | | | | | | | | | | |
Issued | | | 241,628 | | | | 867,672 | | | | | 24,114,211 | | | | 34,446,877 | |
Reinvested | | | 6,499 | | | | 12,497 | | | | | 6,060,803 | | | | 2,436,886 | |
Redeemed | | | (600,204 | ) | | | (649,898 | ) | | | | (16,938,901 | ) | | | (14,332,012 | ) |
Change in Shares Outstanding | | | (352,077 | ) | | | 230,271 | | | | | 13,236,113 | | | | 22,551,751 | |
Change in Total Shares Outstanding | | | (2,185,154 | ) | | | 1,855,814 | | | | | 74,262,137 | | | | 38,524,130 | |
See accompanying Notes to Financial Statements.
DIAMOND HILL FUNDS | ANNUAL REPORT | DECEMBER 31, 2021 | DIAMOND-HILL.COM 93 |
Diamond Hill Funds
Statements of Changes in Net Assets
| | | Large Cap
Concentrated
Fund | | | | All Cap Select Fund | |
| | | For the
period ended
December 31,
2021(A) | | | | For the
year ended
December 31,
2021 | | | For the
year ended
December 31,
2020 | |
From Operations | | | | | | | | | | | | | |
Net investment income | | $ | 111,710 | | | | $ | 2,207,210 | | | $ | 1,678,985 | |
Net realized gains on investment transactions | | | 9,882 | | | | | 57,418,119 | | | | 2,068,554 | |
Net change in unrealized appreciation (depreciation) on investments | | | 2,329,391 | | | | | 42,373,052 | | | | 47,293,692 | |
Change in Net Assets from Operations | | | 2,450,983 | | | | | 101,998,381 | | | | 51,041,231 | |
| | | | | | | | | | | | | | |
Distributions to Shareholders | | | | | | | | | | | | | |
Investor | | | (408 | ) | | | | (3,236,869 | ) | | | (28,543 | ) |
Class C | | | — | | | | | — | | | | — | |
Class I | | | (28,081 | ) | | | | (27,370,311 | ) | | | (889,515 | ) |
Class Y | | | (231,281 | ) | | | | (14,578,750 | ) | | | (872,601 | ) |
Change in Net Assets from Distributions to Shareholders | | | (259,770 | ) | | | | (45,185,930 | ) | | | (1,790,659 | ) |
Change in Net Assets from Capital Transactions | | | 15,754,598 | | | | | 628,866 | | | | 4,357,128 | |
| | | | | | | | | | | | | | |
Total Change in Net Assets | | | 17,945,811 | | | | | 57,441,317 | | | | 53,607,700 | |
| | | | | | | | | | | | | | |
Net Assets: | | | | | | | | | | | | | |
Beginning of period | | | — | | | | | 325,957,416 | | | | 272,349,716 | |
End of period | | $ | 17,945,811 | | | | $ | 383,398,733 | | | $ | 325,957,416 | |
(A) | Fund commenced operations on February 26, 2021. |
See accompanying Notes to Financial Statements.
94 DIAMOND HILL FUNDS | ANNUAL REPORT | DECEMBER 31, 2021 | DIAMOND-HILL.COM |
Diamond Hill Funds
Statements of Changes in Net Assets
| | | Large Cap
Concentrated
Fund | | | | All Cap Select Fund | |
| | | For the
period ended
December 31,
2021(A) | | | | For the
year ended
December 31,
2021 | | | For the
year ended
December 31,
2020 | |
Capital Transactions | | | | | | | | | | | | | |
Investor | | | | | | | | | | | | | |
Proceeds from shares sold | | $ | 28,929 | | | | $ | 17,763,304 | | | $ | 887,231 | |
Reinvested distributions | | | 408 | | | | | 3,072,437 | | | | 26,209 | |
Payments for shares redeemed | | | (18 | ) | | | | (4,410,555 | ) | | | (2,697,607 | ) |
Exchanged from Class C | | | — | | | | | 3,270,942 | | | | — | |
Change in Net Assets from Investor Share Transactions | | | 29,319 | | | | | 19,696,128 | | | | (1,784,167 | ) |
Class C | | | | | | | | | | | | | |
Proceeds from shares sold | | | — | | | | | — | | | | 110,353 | |
Payments for shares redeemed | | | — | | | | | (239,006 | ) | | | (1,843,071 | ) |
Exchanged for Investor Shares | | | — | | | | | (3,270,942 | ) | | | — | |
Change in Net Assets from Class C Share Transactions | | | — | | | | | (3,509,948 | ) | | | (1,732,718 | ) |
Class I | | | | | | | | | | | | | |
Proceeds from shares sold | | | 1,829,726 | | | | | 70,913,609 | | | | 38,513,095 | |
Reinvested distributions | | | 28,081 | | | | | 26,990,592 | | | | 874,867 | |
Payments for shares redeemed | | | (49 | ) | | | | (64,762,971 | ) | | | (46,712,143 | ) |
Change in Net Assets from Class I Share Transactions | | | 1,857,758 | | | | | 33,141,230 | | | | (7,324,181 | ) |
Class Y | | | | | | | | | | | | | |
Proceeds from shares sold | | | 13,649,517 | | | | | 10,456,599 | | | | 30,166,804 | |
Reinvested distributions | | | 231,281 | | | | | 14,399,140 | | | | 832,932 | |
Payments for shares redeemed | | | (13,277 | ) | | | | (73,554,283 | ) | | | (15,801,542 | ) |
Change in Net Assets from Class Y Share Transactions | | | 13,867,521 | | | | | (48,698,544 | ) | | | 15,198,194 | |
Change in Net Assets from Capital Transactions | | $ | 15,754,598 | | | | $ | 628,866 | | | $ | 4,357,128 | |
(A) | Fund commenced operations on February 26, 2021. |
See accompanying Notes to Financial Statements.
DIAMOND HILL FUNDS | ANNUAL REPORT | DECEMBER 31, 2021 | DIAMOND-HILL.COM 95 |
Diamond Hill Funds
Statements of Changes in Net Assets
| | | Large Cap
Concentrated
Fund | | | | All Cap Select Fund | |
| | | For the
period ended
December 31,
2021(A) | | | | For the
year ended
December 31,
2021 | | | For the
year ended
December 31,
2020 | |
Share Transactions: | | | | | | | | | | | | | |
Investor | | | | | | | | | | | | | |
Issued | | | 2,705 | | | | | 783,981 | | | | 62,432 | |
Reinvested | | | 35 | | | | | 147,635 | | | | 1,429 | |
Redeemed | | | (2 | ) | | | | (200,218 | ) | | | (193,208 | ) |
Exchanged from Class C | | | — | | | | | 163,425 | | | | — | |
Change in Shares Outstanding | | | 2,738 | | | | | 894,823 | | | | (129,347 | ) |
Class C | | | | | | | | | | | | | |
Issued | | | — | | | | | — | | | | 8,726 | |
Redeemed | | | — | | | | | (13,473 | ) | | | (134,671 | ) |
Exchanged for Investor Shares | | | — | | | | | (177,396 | ) | | | — | |
Change in Shares Outstanding | | | — | | | | | (190,869 | ) | | | (125,945 | ) |
Class I | | | | | | | | | | | | | |
Issued | | | 166,684 | | | | | 3,090,803 | | | | 3,286,070 | |
Reinvested | | | 2,385 | | | | | 1,279,252 | | | | 47,239 | |
Redeemed | | | (5 | ) | | | | (2,894,876 | ) | | | (3,477,940 | ) |
Change in Shares Outstanding | | | 169,064 | | | | | 1,475,179 | | | | (144,631 | ) |
Class Y | | | | | | | | | | | | | |
Issued | | | 1,314,940 | | | | | 498,469 | | | | 2,233,911 | |
Reinvested | | | 19,629 | | | | | 679,212 | | | | 44,829 | |
Redeemed | | | (1,126 | ) | | | | (3,231,802 | ) | | | (1,062,608 | ) |
Change in Shares Outstanding | | | 1,333,443 | | | | | (2,054,121 | ) | | | 1,216,132 | |
Change in Total Shares Outstanding | | | 1,505,245 | | | | | 125,012 | | | | 816,209 | |
(A) | Fund commenced operations on February 26, 2021. |
See accompanying Notes to Financial Statements.
96 DIAMOND HILL FUNDS | ANNUAL REPORT | DECEMBER 31, 2021 | DIAMOND-HILL.COM |
Diamond Hill Funds
Statements of Changes in Net Assets
| | | Long-Short Fund | | | | International Fund | |
| | | For the
year ended
December 31,
2021 | | | For the
year ended
December 31,
2020 | | | | For the
year ended
December 31,
2021 | | | For the
year ended
December 31,
2020 | |
From Operations | | | | | | | | | | | | | | | | | |
Net investment income (loss) | | $ | (2,162,041 | ) | | $ | 8,842,127 | | | | $ | 696,909 | | | $ | 110,613 | |
Net realized gains (losses) on investment transactions | | | 377,191,589 | | | | 63,273,106 | | | | | 1,614,077 | | | | (295,613 | ) |
Net realized losses on closed short positions | | | (102,806,374 | ) | | | (59,320,359 | ) | | | | — | | | | — | |
Net realized gains (losses) on sales from affiliated investments | | | 62,759 | | | | (1,126,909 | ) | | | | — | | | | — | |
Long-term capital gain distributions from investments in affiliates | | | 6,992 | | | | — | | | | | — | | | | — | |
Net realized gains (losses) on foreign currency transactions | | | 51 | | | | (56 | ) | | | | 473 | | | | (2,926 | ) |
Net change in unrealized appreciation (depreciation) on investments and foreign currency translations | | | 86,255,004 | | | | (261,836,003 | ) | | | | 234,999 | | | | 1,492,806 | |
Change in Net Assets from Operations | | | 358,547,980 | | | | (250,168,094 | ) | | | | 2,546,458 | | | | 1,304,880 | |
| | | | | | | | | | | | | | | | | | |
Distributions to Shareholders | | | | | | | | | | | | | | | | | |
Investor | | | (16,791,269 | ) | | | (1,582,517 | ) | | | | (15,156 | ) | | | (2,988 | ) |
Class C | | | — | | | | (223,421 | ) | | | | — | | | | — | |
Class I | | | (180,573,008 | ) | | | (21,897,354 | ) | | | | (261,170 | ) | | | (41,683 | ) |
Class Y | | | (3,406,687 | ) | | | (982,487 | ) | | | | (1,822,382 | ) | | | (144,229 | ) |
Change in Net Assets from Distributions to Shareholders | | | (200,770,964 | ) | | | (24,685,779 | ) | | | | (2,098,708 | ) | | | (188,900 | ) |
Change in Net Assets from Capital Transactions | | | (215,563,549 | ) | | | (1,197,389,878 | ) | | | | 38,272,566 | | | | 2,261,513 | |
| | | | | | | | | | | | | | | | | | |
Total Change in Net Assets | | | (57,786,533 | ) | | | (1,472,243,751 | ) | | | | 38,720,316 | | | | 3,377,493 | |
| | | | | | | | | | | | | | | | | | |
Net Assets: | | | | | | | | | | | | | | | | | |
Beginning of year | | | 2,055,773,602 | | | | 3,528,017,353 | | | | | 16,867,786 | | | | 13,490,293 | |
End of year | | $ | 1,997,987,069 | | | $ | 2,055,773,602 | | | | $ | 55,588,102 | | | $ | 16,867,786 | |
See accompanying Notes to Financial Statements.
DIAMOND HILL FUNDS | ANNUAL REPORT | DECEMBER 31, 2021 | DIAMOND-HILL.COM 97 |
Diamond Hill Funds
Statements of Changes in Net Assets
| | | Long-Short Fund | | | | International Fund | |
| | | For the
year ended
December 31,
2021 | | | For the
year ended
December 31,
2020 | | | | For the
year ended
December 31,
2021 | | | For the
year ended
December 31,
2020 | |
Capital Transactions | | | | | | | | | | | | | | | | | |
Investor | | | | | | | | | | | | | | | | | |
Proceeds from shares sold | | $ | 11,903,875 | | | $ | 25,128,153 | | | | $ | 169,101 | | | $ | 260,824 | |
Reinvested distributions | | | 14,843,221 | | | | 1,385,332 | | | | | 15,156 | | | | 2,988 | |
Payments for shares redeemed | | | (58,014,082 | ) | | | (91,047,343 | ) | | | | (102,099 | ) | | | (34,822 | ) |
Net assets received in conjunction with fund merger | | | — | | | | 5,435,645 | | | | | — | | | | — | |
Exchanged from Class C | | | 23,084,351 | | | | — | | | | | — | | | | — | |
Change in Net Assets from Investor Share Transactions | | | (8,182,635 | ) | | | (59,098,213 | ) | | | | 82,158 | | | | 228,990 | |
Class C | | | | | | | | | | | | | | | | | |
Proceeds from shares sold | | | — | | | | 1,481,104 | | | | | — | | | | — | |
Reinvested distributions | | | — | | | | 210,563 | | | | | — | | | | — | |
Payments for shares redeemed | | | (2,012,571 | ) | | | (16,999,894 | ) | | | | — | | | | — | |
Net assets received in conjunction with fund merger | | | — | | | | 762,183 | | | | | — | | | | — | |
Exchanged for Investor Shares | | | (23,084,351 | ) | | | — | | | | | — | | | | — | |
Change in Net Assets from Class C Share Transactions | | | (25,096,922 | ) | | | (14,546,044 | ) | | | | — | | | | — | |
Class I | | | | | | | | | | | | | | | | | |
Proceeds from shares sold | | | 264,577,589 | | | | 483,242,457 | | | | | 4,721,918 | | | | 1,739,698 | |
Reinvested distributions | | | 143,862,280 | | | | 17,182,498 | | | | | 221,495 | | | | 41,683 | |
Payments for shares redeemed | | | (543,968,163 | ) | | | (1,457,248,575 | ) | | | | (197,622 | ) | | | (2,038,253 | ) |
Net assets received in conjunction with fund merger | | | — | | | | 12,333,406 | | | | | — | | | | — | |
Change in Net Assets from Class I Share Transactions | | | (135,528,294 | ) | | | (944,490,214 | ) | | | | 4,745,791 | | | | (256,872 | ) |
Class Y | | | | | | | | | | | | | | | | | |
Proceeds from shares sold | | | 5,577,406 | | | | 12,232,813 | | | | | 32,277,497 | | | | 2,752,361 | |
Reinvested distributions | | | 3,262,981 | | | | 667,666 | | | | | 1,822,382 | | | | 144,229 | |
Payments for shares redeemed | | | (55,596,085 | ) | | | (208,868,989 | ) | | | | (655,262 | ) | | | (607,195 | ) |
Net assets received in conjunction with fund merger | | | — | | | | 16,713,103 | | | | | — | | | | — | |
Change in Net Assets from Class Y Share Transactions | | | (46,755,698 | ) | | | (179,255,407 | ) | | | | 33,444,617 | | | | 2,289,395 | |
Change in Net Assets from Capital Transactions | | $ | (215,563,549 | ) | | $ | (1,197,389,878 | ) | | | $ | 38,272,566 | | | $ | 2,261,513 | |
See accompanying Notes to Financial Statements.
98 DIAMOND HILL FUNDS | ANNUAL REPORT | DECEMBER 31, 2021 | DIAMOND-HILL.COM |
Diamond Hill Funds
Statements of Changes in Net Assets
| | | Long-Short Fund | | | | International Fund | |
| | | For the
year ended
December 31,
2021 | | | For the
year ended
December 31,
2020 | | | | For the
year ended
December 31,
2021 | | | For the
year ended
December 31,
2020 | |
Share Transactions: | | | | | | | | | | | | | | | | | |
Investor | | | | | | | | | | | | | | | | | |
Issued | | | 422,488 | | | | 1,072,538 | | | | | 10,095 | | | | 20,908 | |
Reinvested | | | 544,505 | | | | 54,303 | | | | | 927 | | | | 196 | |
Redeemed | | | (2,032,391 | ) | | | (4,006,508 | ) | | | | (6,069 | ) | | | (2,340 | ) |
Received in conjunction with fund merger | | | — | | | | 226,265 | | | | | — | | | | — | |
Exchanged from Class C | | | 865,791 | | | | — | | | | | — | | | | — | |
Change in Shares Outstanding | | | (199,607 | ) | | | (2,653,402 | ) | | | | 4,953 | | | | 18,764 | |
Class C | | | | | | | | | | | | | | | | | |
Issued | | | — | | | | 70,563 | | | | | — | | | | — | |
Reinvested | | | — | | | | 9,498 | | | | | — | | | | — | |
Redeemed | | | (88,225 | ) | | | (842,802 | ) | | | | — | | | | — | |
Received in conjunction with fund merger | | | — | | | | 36,363 | | | | | — | | | | — | |
Exchanged for Investor Shares | | | (993,908 | ) | | | — | | | | | — | | | | — | |
Change in Shares Outstanding | | | (1,082,133 | ) | | | (726,378 | ) | | | | — | | | | — | |
Class I | | | | | | | | | | | | | | | | | |
Issued | | | 8,921,724 | | | | 20,035,736 | | | | | 282,350 | | | | 133,427 | |
Reinvested | | | 5,108,746 | | | | 653,624 | | | | | 13,476 | | | | 2,713 | |
Redeemed | | | (19,025,356 | ) | | | (63,402,777 | ) | | | | (11,551 | ) | | | (144,348 | ) |
Received in conjunction with fund merger | | | — | | | | 499,138 | | | | | — | | | | — | |
Change in Shares Outstanding | | | (4,994,886 | ) | | | (42,214,279 | ) | | | | 284,275 | | | | (8,208 | ) |
Class Y | | | | | | | | | | | | | | | | | |
Issued | | | 188,330 | | | | 484,890 | | | | | 1,858,838 | | | | 197,656 | |
Reinvested | | | 115,218 | | | | 25,279 | | | | | 110,694 | | | | 9,375 | |
Redeemed | | | (1,822,548 | ) | | | (9,140,669 | ) | | | | (37,912 | ) | | | (48,413 | ) |
Received in conjunction with fund merger | | | — | | | | 672,947 | | | | | — | | | | — | |
Change in Shares Outstanding | | | (1,519,000 | ) | | | (7,957,553 | ) | | | | 1,931,620 | | | | 158,618 | |
Change in Total Shares Outstanding | | | (7,795,626 | ) | | | (53,551,612 | ) | | | | 2,220,848 | | | | 169,174 | |
See accompanying Notes to Financial Statements.
DIAMOND HILL FUNDS | ANNUAL REPORT | DECEMBER 31, 2021 | DIAMOND-HILL.COM 99 |
Diamond Hill Funds
Statements of Changes in Net Assets
| | | Short Duration
Securitized Bond Fund | | | | Core Bond Fund | |
| | | For the
year ended
December 31,
2021 | | | For the
year ended
December 31,
2020 | | | | For the
year ended
December 31,
2021 | | | For the
year ended
December 31,
2020 | |
From Operations | | | | | | | | | | | | | | | | | |
Net investment income | | $ | 34,339,308 | | | $ | 26,871,333 | | | | $ | 8,097,997 | | | $ | 4,782,107 | |
Net realized gains (losses) on investment transactions | | | 8,213,378 | | | | (7,018,420 | ) | | | | 144,588 | | | | 532,828 | |
Net change in unrealized appreciation (depreciation) on investments | | | (9,622,308 | ) | | | 14,436,789 | | | | | (11,721,241 | ) | | | 8,109,845 | |
Change in Net Assets from Operations | | | 32,930,378 | | | | 34,289,702 | | | | | (3,478,656 | ) | | | 13,424,780 | |
| | | | | | | | | | | | | | | | | | |
Distributions to Shareholders | | | | | | | | | | | | | | | | | |
Investor | | | (1,014,436 | ) | | | (1,533,265 | ) | | | | (494,552 | ) | | | (247,377 | ) |
Class I | | | (29,997,903 | ) | | | (22,083,714 | ) | | | | (6,937,784 | ) | | | (3,229,425 | ) |
Class Y | | | (4,460,361 | ) | | | (6,492,319 | ) | | | | (1,520,485 | ) | | | (1,529,783 | ) |
Change in Net Assets from Distributions to Shareholders | | | (35,472,700 | ) | | | (30,109,298 | ) | | | | (8,952,821 | ) | | | (5,006,585 | ) |
Change in Net Assets from Capital Transactions | | | 368,786,448 | | | | 319,626,459 | | | | | 74,612,134 | | | | 206,778,242 | |
| | | | | | | | | | | | | | | | | | |
Total Change in Net Assets | | | 366,244,126 | | | | 323,806,863 | | | | | 62,180,657 | | | | 215,196,437 | |
| | | | | | | | | | | | | | | | | | |
Net Assets: | | | | | | | | | | | | | | | | | |
Beginning of year | | | 1,132,465,931 | | | | 808,659,068 | | | | | 337,244,750 | | | | 122,048,313 | |
End of year | | $ | 1,498,710,057 | | | $ | 1,132,465,931 | | | | $ | 399,425,407 | | | $ | 337,244,750 | |
See accompanying Notes to Financial Statements.
100 DIAMOND HILL FUNDS | ANNUAL REPORT | DECEMBER 31, 2021 | DIAMOND-HILL.COM |
Diamond Hill Funds
Statements of Changes in Net Assets
| | | Short Duration
Securitized Bond Fund | | | | Core Bond Fund | |
| | | For the
year ended
December 31,
2021 | | | For the
year ended
December 31,
2020 | | | | For the
year ended
December 31,
2021 | | | For the
year ended
December 31,
2020 | |
Capital Transactions | | | | | | | | | | | | | | | | | |
Investor | | | | | | | | | | | | | | | | | |
Proceeds from shares sold | | $ | 15,385,631 | | | $ | 36,648,916 | | | | $ | 31,191,335 | | | $ | 13,873,310 | |
Reinvested distributions | | | 1,004,386 | | | | 1,526,415 | | | | | 493,030 | | | | 246,004 | |
Payments for shares redeemed | | | (23,496,660 | ) | | | (45,846,520 | ) | | | | (37,931,802 | ) | | | (1,142,423 | ) |
Change in Net Assets from Investor Share Transactions | | | (7,106,643 | ) | | | (7,671,189 | ) | | | | (6,247,437 | ) | | | 12,976,891 | |
Class I | | | | | | | | | | | | | | | | | |
Proceeds from shares sold | | | 908,885,299 | | | | 745,458,041 | | | | | 152,107,527 | | | | 216,896,893 | |
Reinvested distributions | | | 21,607,786 | | | | 14,066,984 | | | | | 6,388,424 | | | | 2,860,509 | |
Payments for shares redeemed | | | (510,769,552 | ) | | | (394,978,915 | ) | | | | (78,595,612 | ) | | | (30,497,567 | ) |
Change in Net Assets from Class I Share Transactions | | | 419,723,533 | | | | 364,546,110 | | | | | 79,900,339 | | | | 189,259,835 | |
Class Y | | | | | | | | | | | | | | | | | |
Proceeds from shares sold | | | 39,410,005 | | | | 109,069,427 | | | | | 9,460,470 | | | | 14,157,339 | |
Reinvested distributions | | | 4,413,617 | | | | 6,307,783 | | | | | 1,360,043 | | | | 1,358,200 | |
Payments for shares redeemed | | | (87,654,064 | ) | | | (152,625,672 | ) | | | | (9,861,281 | ) | | | (10,974,023 | ) |
Change in Net Assets from Class Y Share Transactions | | | (43,830,442 | ) | | | (37,248,462 | ) | | | | 959,232 | | | | 4,541,516 | |
Change in Net Assets from Capital Transactions | | $ | 368,786,448 | | | $ | 319,626,459 | | | | $ | 74,612,134 | | | $ | 206,778,242 | |
Share Transactions: | | | | | | | | | | | | | | | | | |
Investor | | | | | | | | | | | | | | | | | |
Issued | | | 1,512,678 | | | | 3,680,417 | | | | | 2,972,547 | | | | 1,315,970 | |
Reinvested | | | 98,877 | | | | 156,709 | | | | | 47,020 | | | | 23,010 | |
Redeemed | | | (2,310,327 | ) | | | (4,683,727 | ) | | | | (3,633,825 | ) | | | (107,686 | ) |
Change in Shares Outstanding | | | (698,772 | ) | | | (846,601 | ) | | | | (614,258 | ) | | | 1,231,294 | |
Class I | | | | | | | | | | | | | | | | | |
Issued | | | 89,370,537 | | | | 76,022,724 | | | | | 14,475,570 | | | | 20,345,170 | |
Reinvested | | | 2,127,770 | | | | 1,438,429 | | | | | 610,214 | | | | 268,174 | |
Redeemed | | | (50,272,163 | ) | | | (40,544,177 | ) | | | | (7,488,937 | ) | | | (2,867,968 | ) |
Change in Shares Outstanding | | | 41,226,144 | | | | 36,916,976 | | | | | 7,596,847 | | | | 17,745,376 | |
Class Y | | | | | | | | | | | | | | | | | |
Issued | | | 3,870,691 | | | | 11,362,853 | | | | | 889,349 | | | | 1,341,553 | |
Reinvested | | | 434,055 | | | | 645,835 | | | | | 129,805 | | | | 127,759 | |
Redeemed | | | (8,607,135 | ) | | | (15,797,601 | ) | | | | (942,446 | ) | | | (1,028,435 | ) |
Change in Shares Outstanding | | | (4,302,389 | ) | | | (3,788,913 | ) | | | | 76,708 | | | | 440,877 | |
Change in Total Shares Outstanding | | | 36,224,983 | | | | 32,281,462 | | | | | 7,059,297 | | | | 19,417,547 | |
See accompanying Notes to Financial Statements.
DIAMOND HILL FUNDS | ANNUAL REPORT | DECEMBER 31, 2021 | DIAMOND-HILL.COM 101 |
Small Cap Fund
Financial Highlights
Selected data for a share outstanding throughout the periods indicated
Small Cap Fund | | Net asset
value,
beginning of
year | | | Net
investment
income(A) | | | Net realized
and
unrealized
gains
(losses) on
investments | | | Total from
investment
operations | | | Dividends
from net
investment
income | |
Investor | | | | | | | | | | | | | | | | | | | | |
For the year ended December 31, 2021 | | $ | 30.96 | | | | 0.07 | | | | 9.75 | | | | 9.82 | | | | (0.07 | ) |
For the year ended December 31, 2020 | | $ | 31.23 | | | | 0.01 | | | | (0.18 | ) | | | (0.17 | ) | | | (0.10 | ) |
For the year ended December 31, 2019 | | $ | 27.54 | | | | 0.06 | | | | 5.80 | | | | 5.86 | | | | (0.34 | ) |
For the year ended December 31, 2018 | | $ | 35.62 | | | | 0.12 | | | | (5.37 | ) | | | (5.25 | ) | | | — | |
For the year ended December 31, 2017 | | $ | 34.39 | | | | 0.06 | | | | 3.55 | | | | 3.61 | | | | (0.13 | ) |
|
Class I | | | | | | | | | | | | | | | | | | | | |
For the year ended December 31, 2021 | | $ | 31.49 | | | | 0.19 | | | | 9.92 | | | | 10.11 | | | | (0.18 | ) |
For the year ended December 31, 2020 | | $ | 31.77 | | | | 0.09 | | | | (0.18 | ) | | | (0.09 | ) | | | (0.19 | ) |
For the year ended December 31, 2019 | | $ | 27.98 | | | | 0.16 | | | | 5.90 | | | | 6.06 | | | | (0.44 | ) |
For the year ended December 31, 2018 | | $ | 36.15 | | | | 0.23 | | | | (5.48 | ) | | | (5.25 | ) | | | (0.09 | ) |
For the year ended December 31, 2017 | | $ | 34.87 | | | | 0.17 | | | | 3.61 | | | | 3.78 | | | | (0.25 | ) |
|
Class Y | | | | | | | | | | | | | | | | | | | | |
For the year ended December 31, 2021 | | $ | 31.52 | | | | 0.22 | | | | 9.95 | | | | 10.17 | | | | (0.22 | ) |
For the year ended December 31, 2020 | | $ | 31.80 | | | | 0.12 | | | | (0.17 | ) | | | (0.05 | ) | | | (0.23 | ) |
For the year ended December 31, 2019 | | $ | 28.01 | | | | 0.19 | | | | 5.91 | | | | 6.10 | | | | (0.48 | ) |
For the year ended December 31, 2018 | | $ | 36.17 | | | | 0.27 | | | | (5.48 | ) | | | (5.21 | ) | | | (0.12 | ) |
For the year ended December 31, 2017 | | $ | 34.89 | | | | 0.20 | | | | 3.62 | | | | 3.82 | | | | (0.29 | ) |
|
(A) | Net investment income per share has been calculated using the average daily shares outstanding during the period. |
(B) | Total returns shown exclude the effect of applicable sales charges for years prior to December 31, 2021. |
(C) | The Fund’s adviser has contractually agreed to waive fees in the pro-rata amount of the management fee charged by the underlying Diamond Hill Fund on each Fund’s investment in such other Diamond Hill Fund. If such fee waiver had not occurred, the ratios would have been as indicated. |
(D) | Portfolio turnover rate is calculated on the basis of the Fund as a whole without distinguishing between classes of shares issued. |
See accompanying Notes to Financial Statements.
102 DIAMOND HILL FUNDS | ANNUAL REPORT | DECEMBER 31, 2021 | DIAMOND-HILL.COM |
| | Distributions
from net
realized
capital gains | | | Total
distributions | | | Net asset
value, end of
year | | | Total return(B) | | | Net assets,
end of year
(000’s) | | | Ratio of
total net
expenses to
average net
assets | | | Ratio of
total gross
expenses to
average net
assets(C) | | | Ratio of net
investment
income to
average
net assets | | | Portfolio
turnover
rate(D) | |
| | | | | | | | | | | | | | | | | | | | | | | | | | | | | | | | | | | | |
| | | (5.98 | ) | | | (6.05 | ) | | $ | 34.73 | | | | 32.45 | % | | $ | 123,975 | | | | 1.26 | % | | | 1.26 | % | | | 0.20 | % | | | 20 | % |
| | | — | | | | (0.10 | ) | | $ | 30.96 | | | | (0.55 | )% | | $ | 117,491 | | | | 1.26 | % | | | 1.26 | % | | | 0.05 | % | | | 34 | % |
| | | (1.83 | ) | | | (2.17 | ) | | $ | 31.23 | | | | 21.36 | % | | $ | 165,339 | | | | 1.27 | % | | | 1.27 | % | | | 0.23 | % | | | 22 | % |
| | | (2.83 | ) | | | (2.83 | ) | | $ | 27.54 | | | | (15.12 | )% | | $ | 214,831 | | | | 1.25 | % | | | 1.26 | % | | | 0.31 | % | | | 23 | % |
| | | (2.25 | ) | | | (2.38 | ) | | $ | 35.62 | | | | 10.62 | % | | $ | 357,512 | | | | 1.27 | % | | | 1.28 | % | | | 0.11 | % | | | 7 | % |
| | | |
| | | | | | | | | | | | | | | | | | | | | | | | | | | | | | | | | | | | |
| | | (5.98 | ) | | | (6.16 | ) | | $ | 35.44 | | | | 32.83 | % | | $ | 391,856 | | | | 0.97 | % | | | 0.97 | % | | | 0.52 | % | | | 20 | % |
| | | — | | | | (0.19 | ) | | $ | 31.49 | | | | (0.28 | )% | | $ | 350,375 | | | | 0.97 | % | | | 0.97 | % | | | 0.33 | % | | | 34 | % |
| | | (1.83 | ) | | | (2.27 | ) | | $ | 31.77 | | | | 21.75 | % | | $ | 469,014 | | | | 0.98 | % | | | 0.98 | % | | | 0.52 | % | | | 22 | % |
| | | (2.83 | ) | | | (2.92 | ) | | $ | 27.98 | | | | (14.88 | )% | | $ | 633,323 | | | | 0.96 | % | | | 0.97 | % | | | 0.64 | % | | | 23 | % |
| | | (2.25 | ) | | | (2.50 | ) | | $ | 36.15 | | | | 10.95 | % | | $ | 877,913 | | | | 0.97 | % | | | 0.98 | % | | | 0.41 | % | | | 7 | % |
| | | |
| | | | | | | | | | | | | | | | | | | | | | | | | | | | | | | | | | | | |
| | | (5.98 | ) | | | (6.20 | ) | | $ | 35.49 | | | | 32.98 | % | | $ | 52,704 | | | | 0.85 | % | | | 0.85 | % | | | 0.59 | % | | | 20 | % |
| | | — | | | | (0.23 | ) | | $ | 31.52 | | | | (0.17 | )% | | $ | 56,417 | | | | 0.85 | % | | | 0.85 | % | | | 0.46 | % | | | 34 | % |
| | | (1.83 | ) | | | (2.31 | ) | | $ | 31.80 | | | | 21.88 | % | | $ | 105,030 | | | | 0.86 | % | | | 0.86 | % | | | 0.62 | % | | | 22 | % |
| | | (2.83 | ) | | | (2.95 | ) | | $ | 28.01 | | | | (14.79 | )% | | $ | 147,363 | | | | 0.84 | % | | | 0.85 | % | | | 0.74 | % | | | 23 | % |
| | | (2.25 | ) | | | (2.54 | ) | | $ | 36.17 | | | | 11.06 | % | | $ | 207,770 | | | | 0.87 | % | | | 0.88 | % | | | 0.53 | % | | | 7 | % |
| | | |
DIAMOND HILL FUNDS | ANNUAL REPORT | DECEMBER 31, 2021 | DIAMOND-HILL.COM 103 |
Small-Mid Cap Fund
Financial Highlights
Selected data for a share outstanding throughout the periods indicated
Small-Mid Cap Fund | | Net asset
value,
beginning of
year | | | Net
investment
income(A) | | | Net realized
and
unrealized
gains
(losses) on
investments | | | Total from
investment
operations | | | Dividends
from net
investment
income | |
Investor | | | | | | | | | | | | | | | | | | | | |
For the year ended December 31, 2021 | | $ | 22.69 | | | | 0.05 | | | | 6.87 | | | | 6.92 | | | | (0.05 | ) |
For the year ended December 31, 2020 | | $ | 22.57 | | | | 0.03 | | | | 0.20 | | | | 0.23 | | | | (0.10 | ) |
For the year ended December 31, 2019 | | $ | 18.59 | | | | 0.04 | | | | 5.02 | | | | 5.06 | | | | (0.14 | ) |
For the year ended December 31, 2018 | | $ | 22.24 | | | | 0.05 | | | | (2.86 | ) | | | (2.81 | ) | | | (0.04 | ) |
For the year ended December 31, 2017 | | $ | 21.18 | | | | 0.03 | | | | 1.73 | | | | 1.76 | | | | (0.03 | ) |
|
Class I | | | | | | | | | | | | | | | | | | | | |
For the year ended December 31, 2021 | | $ | 22.93 | | | | 0.12 | | | | 6.96 | | | | 7.08 | | | | (0.13 | ) |
For the year ended December 31, 2020 | | $ | 22.80 | | | | 0.09 | | | | 0.21 | | | | 0.30 | | | | (0.16 | ) |
For the year ended December 31, 2019 | | $ | 18.76 | | | | 0.11 | | | | 5.08 | | | | 5.19 | | | | (0.21 | ) |
For the year ended December 31, 2018 | | $ | 22.45 | | | | 0.12 | | | | (2.91 | ) | | | (2.79 | ) | | | (0.10 | ) |
For the year ended December 31, 2017 | | $ | 21.39 | | | | 0.10 | | | | 1.74 | | | | 1.84 | | | | (0.11 | ) |
|
Class Y | | | | | | | | | | | | | | | | | | | | |
For the year ended December 31, 2021 | | $ | 22.99 | | | | 0.16 | | | | 6.96 | | | | 7.12 | | | | (0.16 | ) |
For the year ended December 31, 2020 | | $ | 22.84 | | | | 0.12 | | | | 0.22 | | | | 0.34 | | | | (0.18 | ) |
For the year ended December 31, 2019 | | $ | 18.80 | | | | 0.13 | | | | 5.08 | | | | 5.21 | | | | (0.23 | ) |
For the year ended December 31, 2018 | | $ | 22.49 | | | | 0.15 | | | | (2.91 | ) | | | (2.76 | ) | | | (0.13 | ) |
For the year ended December 31, 2017 | | $ | 21.42 | | | | 0.12 | | | | 1.75 | | | | 1.87 | | | | (0.13 | ) |
|
(A) | Net investment income per share has been calculated using the average daily shares outstanding during the period. |
(B) | Total returns shown exclude the effect of applicable sales charges for years prior to December 31, 2021. |
(C) | The Fund’s adviser has contractually agreed to waive fees in the pro-rata amount of the management fee charged by the underlying Diamond Hill Fund on each Fund’s investment in such other Diamond Hill Fund. If such fee waiver had not occurred, the ratios would have been as indicated. |
See accompanying Notes to Financial Statements.
104 DIAMOND HILL FUNDS | ANNUAL REPORT | DECEMBER 31, 2021 | DIAMOND-HILL.COM |
| | Distributions
from net
realized
capital gains | | | Total
distributions | | | Net asset
value, end of
year | | | Total return(B) | | | Net assets,
end of year
(000’s) | | | Ratio of
total net
expenses to
average net
assets | | | Ratio of
total gross
expenses to
average net
assets(C) | | | Ratio of net
investment
income to
average
net assets | | | Portfolio
turnover
rate(D) | |
| | | | | | | | | | | | | | | | | | | | | | | | | | | | | | | | | | | | |
| | | (1.50 | ) | | | (1.55 | ) | | $ | 28.06 | | | | 30.78 | % | | $ | 208,110 | | | | 1.20 | % | | | 1.21 | % | | | 0.18 | % | | | 14 | % |
| | | (0.01 | ) | | | (0.11 | ) | | $ | 22.69 | | | | 1.03 | % | | $ | 162,637 | | | | 1.20 | % | | | 1.21 | % | | | 0.19 | % | | | 31 | %(E) |
| | | (0.94 | ) | | | (1.08 | ) | | $ | 22.57 | | | | 27.33 | % | | $ | 183,914 | | | | 1.21 | % | | | 1.22 | % | | | 0.21 | % | | | 14 | % |
| | | (0.80 | ) | | | (0.84 | ) | | $ | 18.59 | | | | (12.80 | )% | | $ | 164,037 | | | | 1.20 | % | | | 1.21 | % | | | 0.21 | % | | | 26 | % |
| | | (0.67 | ) | | | (0.70 | ) | | $ | 22.24 | | | | 8.35 | % | | $ | 229,411 | | | | 1.22 | % | | | 1.23 | % | | | 0.09 | % | | | 15 | % |
| | | |
| | | | | | | | | | | | | | | | | | | | | | | | | | | | | | | | | | | | |
| | | (1.50 | ) | | | (1.63 | ) | | $ | 28.38 | | | | 31.14 | % | | $ | 1,059,287 | | | | 0.91 | % | | | 0.92 | % | | | 0.45 | % | | | 14 | % |
| | | (0.01 | ) | | | (0.17 | ) | | $ | 22.93 | | | | 1.31 | % | | $ | 889,148 | | | | 0.91 | % | | | 0.92 | % | | | 0.49 | % | | | 31 | %(E) |
| | | (0.94 | ) | | | (1.15 | ) | | $ | 22.80 | | | | 27.74 | % | | $ | 1,081,619 | | | | 0.92 | % | | | 0.93 | % | | | 0.50 | % | | | 14 | % |
| | | (0.80 | ) | | | (0.90 | ) | | $ | 18.76 | | | | (12.56 | )% | | $ | 889,471 | | | | 0.91 | % | | | 0.92 | % | | | 0.52 | % | | | 26 | % |
| | | (0.67 | ) | | | (0.78 | ) | | $ | 22.45 | | | | 8.63 | % | | $ | 1,114,337 | | | | 0.92 | % | | | 0.93 | % | | | 0.41 | % | | | 15 | % |
| | | |
| | | | | | | | | | | | | | | | | | | | | | | | | | | | | | | | | | | | |
| | | (1.50 | ) | | | (1.66 | ) | | $ | 28.45 | | | | 31.24 | % | | $ | 1,011,010 | | | | 0.79 | % | | | 0.80 | % | | | 0.59 | % | | | 14 | % |
| | | (0.01 | ) | | | (0.19 | ) | | $ | 22.99 | | | | 1.50 | % | | $ | 888,375 | | | | 0.79 | % | | | 0.80 | % | | | 0.61 | % | | | 31 | %(E) |
| | | (0.94 | ) | | | (1.17 | ) | | $ | 22.84 | | | | 27.82 | % | | $ | 1,147,458 | | | | 0.80 | % | | | 0.81 | % | | | 0.62 | % | | | 14 | % |
| | | (0.80 | ) | | | (0.93 | ) | | $ | 18.80 | | | | (12.42 | )% | | $ | 924,995 | | | | 0.79 | % | | | 0.80 | % | | | 0.63 | % | | | 26 | % |
| | | (0.67 | ) | | | (0.80 | ) | | $ | 22.49 | | | | 8.77 | % | | $ | 1,131,583 | | | | 0.82 | % | | | 0.83 | % | | | 0.51 | % | | | 15 | % |
| | | |
(D) | Portfolio turnover rate is calculated on the basis of the Fund as a whole without distinguishing between classes of shares issued. |
(E) | Portfolio turnover does not include redemptions in-kind. |
See accompanying Notes to Financial Statements.
DIAMOND HILL FUNDS | ANNUAL REPORT | DECEMBER 31, 2021 | DIAMOND-HILL.COM 105 |
Mid Cap Fund
Financial Highlights
Selected data for a share outstanding throughout the periods indicated
Mid Cap Fund | | Net asset
value,
beginning of
year | | | Net
investment
income (A) | | | Net realized
and
unrealized
gains
(losses) on
investments | | | Total from
investment
operations | | | Dividends
from net
investment
income | |
Investor | | | | | | | | | | | | | | | | | | | | |
For the year ended December 31, 2021 | | $ | 14.27 | | | | 0.05 | | | | 4.36 | | | | 4.41 | | | | (0.06 | ) |
For the year ended December 31, 2020 | | $ | 14.64 | | | | 0.05 | | | | (0.34 | ) | | | (0.29 | ) | | | (0.06 | ) |
For the year ended December 31, 2019 | | $ | 11.89 | | | | 0.05 | | | | 2.96 | | | | 3.01 | | | | (0.05 | ) |
For the year ended December 31, 2018 | | $ | 13.66 | | | | 0.06 | | | | (1.49 | ) | | | (1.43 | ) | | | (0.06 | ) |
For the year ended December 31, 2017 | | $ | 12.59 | | | | 0.04 | | | | 1.23 | | | | 1.27 | | | | (0.03 | ) |
|
Class I | | | | | | | | | | | | | | | | | | | | |
For the year ended December 31, 2021 | | $ | 14.32 | | | | 0.10 | | | | 4.38 | | | | 4.48 | | | | (0.11 | ) |
For the year ended December 31, 2020 | | $ | 14.69 | | | | 0.09 | | | | (0.35 | ) | | | (0.26 | ) | | | (0.09 | ) |
For the year ended December 31, 2019 | | $ | 11.92 | | | | 0.10 | | | | 2.97 | | | | 3.07 | | | | (0.09 | ) |
For the year ended December 31, 2018 | | $ | 13.70 | | | | 0.10 | | | | (1.50 | ) | | | (1.40 | ) | | | (0.10 | ) |
For the year ended December 31, 2017 | | $ | 12.62 | | | | 0.08 | | | | 1.24 | | | | 1.32 | | | | (0.07 | ) |
|
Class Y | | | | | | | | | | | | | | | | | | | | |
For the year ended December 31, 2021 | | $ | 14.36 | | | | 0.11 | | | | 4.40 | | | | 4.51 | | | | (0.13 | ) |
For the year ended December 31, 2020 | | $ | 14.73 | | | | 0.10 | | | | (0.35 | ) | | | (0.25 | ) | | | (0.10 | ) |
For the year ended December 31, 2019 | | $ | 11.95 | | | | 0.11 | | | | 2.98 | | | | 3.09 | | | | (0.10 | ) |
For the year ended December 31, 2018 | | $ | 13.73 | | | | 0.12 | | | | (1.50 | ) | | | (1.38 | ) | | | (0.12 | ) |
For the year ended December 31, 2017 | | $ | 12.65 | | | | 0.09 | | | | 1.24 | | | | 1.33 | | | | (0.08 | ) |
|
(A) | Net investment income per share has been calculated using the average daily shares outstanding during the period. |
(B) | Total returns shown exclude the effect of applicable sales charges for years prior to December 31, 2021. |
(C) | The Fund’s adviser has contractually agreed to waive fees in the pro-rata amount of the management fee charged by the underlying Diamond Hill Fund on each Fund’s investment in such other Diamond Hill Fund. If such fee waiver had not occurred, the ratios would have been as indicated. |
(D) | Portfolio turnover rate is calculated on the basis of the Fund as a whole without distinguishing between classes of shares issued. |
See accompanying Notes to Financial Statements.
106 DIAMOND HILL FUNDS | ANNUAL REPORT | DECEMBER 31, 2021 | DIAMOND-HILL.COM |
| | Distributions
from net
realized
capital gains | | | Total
distributions | | | Net asset
value, end of
year | | | Total return(B) | | | Net assets,
end of year
(000’s) | | | Ratio of
total net
expenses to
average net
assets | | | Ratio of
total gross
expenses to
average net
assets(C) | | | Ratio of net
investment
income to
average
net assets | | | Portfolio
turnover
rate(D) | |
| | | | | | | | | | | | | | | | | | | | | | | | | | | | | | | | | | | | |
| | | — | | | | (0.06 | ) | | $ | 18.62 | | | | 30.87 | % | | $ | 33,006 | | | | 1.06 | % | | | 1.06 | % | | | 0.30 | % | | | 12 | % |
| | | (0.02 | ) | | | (0.08 | ) | | $ | 14.27 | | | | (2.01 | )% | | $ | 33,178 | | | | 1.06 | % | | | 1.06 | % | | | 0.41 | % | | | 52 | % |
| | | (0.21 | ) | | | (0.26 | ) | | $ | 14.64 | | | | 25.36 | % | | $ | 31,997 | | | | 1.06 | % | | | 1.07 | % | | | 0.36 | % | | | 31 | % |
| | | (0.28 | ) | | | (0.34 | ) | | $ | 11.89 | | | | (10.56 | )% | | $ | 21,085 | | | | 1.05 | % | | | 1.06 | % | | | 0.43 | % | | | 20 | % |
| | | (0.17 | ) | | | (0.20 | ) | | $ | 13.66 | | | | 10.13 | % | | $ | 25,853 | | | | 1.07 | % | | | 1.08 | % | | | 0.28 | % | | | 11 | % |
| | | |
| | | | | | | | | | | | | | | | | | | | | | | | | | | | | | | | | | | | |
| | | — | | | | (0.11 | ) | | $ | 18.69 | | | | 31.29 | % | | $ | 229,696 | | | | 0.77 | % | | | 0.77 | % | | | 0.60 | % | | | 12 | % |
| | | (0.02 | ) | | | (0.11 | ) | | $ | 14.32 | | | | (1.76 | )% | | $ | 194,354 | | | | 0.77 | % | | | 0.77 | % | | | 0.71 | % | | | 52 | % |
| | | (0.21 | ) | | | (0.30 | ) | | $ | 14.69 | | | | 25.82 | % | | $ | 177,536 | | | | 0.77 | % | | | 0.78 | % | | | 0.68 | % | | | 31 | % |
| | | (0.28 | ) | | | (0.38 | ) | | $ | 11.92 | | | | (10.31 | )% | | $ | 55,045 | | | | 0.76 | % | | | 0.77 | % | | | 0.72 | % | | | 20 | % |
| | | (0.17 | ) | | | (0.24 | ) | | $ | 13.70 | | | | 10.47 | % | | $ | 63,298 | | | | 0.77 | % | | | 0.79 | % | | | 0.57 | % | | | 11 | % |
| | | |
| | | | | | | | | | | | | | | | | | | | | | | | | | | | | | | | | | | | |
| | | — | | | | (0.13 | ) | | $ | 18.74 | | | | 31.41 | % | | $ | 23,739 | | | | 0.65 | % | | | 0.65 | % | | | 0.69 | % | | | 12 | % |
| | | (0.02 | ) | | | (0.12 | ) | | $ | 14.36 | | | | (1.66 | )% | | $ | 23,248 | | | | 0.65 | % | | | 0.65 | % | | | 0.82 | % | | | 52 | % |
| | | (0.21 | ) | | | (0.31 | ) | | $ | 14.73 | | | | 25.91 | % | | $ | 20,454 | | | | 0.65 | % | | | 0.66 | % | | | 0.74 | % | | | 31 | % |
| | | (0.28 | ) | | | (0.40 | ) | | $ | 11.95 | | | | (10.17 | )% | | $ | 27,761 | | | | 0.64 | % | | | 0.65 | % | | | 0.83 | % | | | 20 | % |
| | | (0.17 | ) | | | (0.25 | ) | | $ | 13.73 | | | | 10.51 | % | | $ | 32,943 | | | | 0.67 | % | | | 0.68 | % | | | 0.65 | % | | | 11 | % |
| | | |
DIAMOND HILL FUNDS | ANNUAL REPORT | DECEMBER 31, 2021 | DIAMOND-HILL.COM 107 |
Large Cap Fund
Financial Highlights
Selected data for a share outstanding throughout the periods indicated
Large Cap Fund | | Net asset
value,
beginning of
year | | | Net
investment
income(A) | | | Net realized
and
unrealized
gains
(losses) on
investments | | | Total from
investment
operations | |
Investor | | | | | | | | | | | | | | | | |
For the year ended December 31, 2021 | | $ | 30.42 | | | | 0.23 | | | | 7.43 | | | | 7.66 | |
For the year ended December 31, 2020 | | $ | 28.86 | | | | 0.28 | | | | 2.19 | | | | 2.47 | |
For the year ended December 31, 2019 | | $ | 22.89 | | | | 0.28 | | | | 6.99 | | | | 7.27 | |
For the year ended December 31, 2018 | | $ | 26.45 | | | | 0.25 | | | | (2.83 | ) | | | (2.58 | ) |
For the year ended December 31, 2017 | | $ | 23.06 | | | | 0.24 | | | | 4.35 | | | | 4.59 | |
|
Class I | | | | | | | | | | | | | | | | |
For the year ended December 31, 2021 | | $ | 30.57 | | | | 0.34 | | | | 7.46 | | | | 7.80 | |
For the year ended December 31, 2020 | | $ | 29.05 | | | | 0.36 | | | | 2.22 | | | | 2.58 | |
For the year ended December 31, 2019 | | $ | 23.03 | | | | 0.36 | | | | 7.04 | | | | 7.40 | |
For the year ended December 31, 2018 | | $ | 26.62 | | | | 0.33 | | | | (2.86 | ) | | | (2.53 | ) |
For the year ended December 31, 2017 | | $ | 23.20 | | | | 0.32 | | | | 4.38 | | | | 4.70 | |
|
Class Y | | | | | | | | | | | | | | | | |
For the year ended December 31, 2021 | | $ | 30.59 | | | | 0.38 | | | | 7.47 | | | | 7.85 | |
For the year ended December 31, 2020 | | $ | 29.07 | | | | 0.40 | | | | 2.21 | | | | 2.61 | |
For the year ended December 31, 2019 | | $ | 23.04 | | | | 0.40 | | | | 7.05 | | | | 7.45 | |
For the year ended December 31, 2018 | | $ | 26.64 | | | | 0.36 | | | | (2.87 | ) | | | (2.51 | ) |
For the year ended December 31, 2017 | | $ | 23.21 | | | | 0.35 | | | | 4.38 | | | | 4.73 | |
|
(A) | Net investment income per share has been calculated using the average daily shares outstanding during the period. |
(B) | Total returns shown exclude the effect of applicable sales charges for years prior to December 31, 2021. |
(C) | Portfolio turnover rate is calculated on the basis of the Fund as a whole without distinguishing between classes of shares issued. |
See accompanying Notes to Financial Statements.
108 DIAMOND HILL FUNDS | ANNUAL REPORT | DECEMBER 31, 2021 | DIAMOND-HILL.COM |
| | Dividends
from net
investment
income | | | Distributions
from net
realized
capital gains | | | Total
distributions | | | Net asset
value, end of
year | | | Total return(B) | | | Net assets,
end of year
(000,000’s) | | | Ratio of total
expenses to
average net
assets | | | Ratio of net
investment
income to
average
net assets | | | Portfolio
turnover
rate(C) | |
| | | | | | | | | | | | | | | | | | | | | | | | | | | | | | | | | | | | |
| | | (0.21 | ) | | | (2.37 | ) | | | (2.58 | ) | | $ | 35.50 | | | | 25.42 | % | | $ | 987 | | | | 0.96 | % | | | 0.68 | % | | | 22 | %(D) |
| | | (0.18 | ) | | | (0.73 | ) | | | (0.91 | ) | | $ | 30.42 | | | | 8.65 | % | | $ | 763 | | | | 0.96 | % | | | 1.04 | % | | | 33 | % |
| | | (0.26 | ) | | | (1.04 | ) | | | (1.30 | ) | | $ | 28.86 | | | | 31.80 | % | | $ | 1,243 | | | | 0.97 | % | | | 1.03 | % | | | 22 | %(E) |
| | | (0.26 | ) | | | (0.72 | ) | | | (0.98 | ) | | $ | 22.89 | | | | (9.88 | )% | | $ | 1,031 | | | | 0.96 | % | | | 0.95 | % | | | 29 | %(D) |
| | | (0.20 | ) | | | (1.00 | ) | | | (1.20 | ) | | $ | 26.45 | | | | 19.95 | % | | $ | 1,347 | | | | 0.98 | % | | | 0.96 | % | | | 18 | % |
| | | |
| | | | | | | | | | | | | | | | | | | | | | | | | | | | | | | | | | | | |
| | | (0.31 | ) | | | (2.37 | ) | | | (2.68 | ) | | $ | 35.69 | | | | 25.75 | % | | $ | 8,168 | | | | 0.67 | % | | | 0.97 | % | | | 22 | %(D) |
| | | (0.33 | ) | | | (0.73 | ) | | | (1.06 | ) | | $ | 30.57 | | | | 8.97 | % | | $ | 5,140 | | | | 0.67 | % | | | 1.33 | % | | | 33 | % |
| | | (0.34 | ) | | | (1.04 | ) | | | (1.38 | ) | | $ | 29.05 | | | | 32.18 | % | | $ | 3,878 | | | | 0.68 | % | | | 1.32 | % | | | 22 | %(E) |
| | | (0.34 | ) | | | (0.72 | ) | | | (1.06 | ) | | $ | 23.03 | | | | (9.63 | )% | | $ | 2,978 | | | | 0.67 | % | | | 1.23 | % | | | 29 | %(D) |
| | | (0.28 | ) | | | (1.00 | ) | | | (1.28 | ) | | $ | 26.62 | | | | 20.30 | % | | $ | 3,539 | | | | 0.68 | % | | | 1.25 | % | | | 18 | % |
| | | |
| | | | | | | | | | | | | | | | | | | | | | | | | | | | | | | | | | | | |
| | | (0.35 | ) | | | (2.37 | ) | | | (2.72 | ) | | $ | 35.72 | | | | 25.89 | % | | $ | 3,205 | | | | 0.55 | % | | | 1.09 | % | | | 22 | %(D) |
| | | (0.36 | ) | | | (0.73 | ) | | | (1.09 | ) | | $ | 30.59 | | | | 9.07 | % | | $ | 2,340 | | | | 0.55 | % | | | 1.45 | % | | | 33 | % |
| | | (0.38 | ) | | | (1.04 | ) | | | (1.42 | ) | | $ | 29.07 | | | | 32.34 | % | | $ | 1,568 | | | | 0.56 | % | | | 1.44 | % | | | 22 | %(E) |
| | | (0.37 | ) | | | (0.72 | ) | | | (1.09 | ) | | $ | 23.04 | | | | (9.53 | )% | | $ | 992 | | | | 0.55 | % | | | 1.35 | % | | | 29 | %(D) |
| | | (0.30 | ) | | | (1.00 | ) | | | (1.30 | ) | | $ | 26.64 | | | | 20.42 | % | | $ | 845 | | | | 0.58 | % | | | 1.36 | % | | | 18 | % |
| | | |
(D) | Portfolio turnover does not include redemptions in-kind. |
(E) | Portfolio turnover does not include in-kind subscriptions. |
See accompanying Notes to Financial Statements.
DIAMOND HILL FUNDS | ANNUAL REPORT | DECEMBER 31, 2021 | DIAMOND-HILL.COM 109 |
Large Cap Concentrated Fund
Financial Highlights
Selected data for a share outstanding throughout the periods indicated
Large Cap Concentrated Fund(A) | | Net asset
value,
beginning of
period | | | Net
investment
income(B) | | | Net realized
and
unrealized
gains on
investments | | | Total from
investment
operations | |
Investor | | | | | | | | | | | | | | | | |
For the period ended December 31, 2021 | | $ | 10.00 | | | | 0.05 | | | | 2.00 | | | | 2.05 | |
|
Class I | | | | | | | | | | | | | | | | |
For the period ended December 31, 2021 | | $ | 10.00 | | | | 0.07 | | | | 2.02 | | | | 2.09 | |
|
Class Y | | | | | | | | | | | | | | | | |
For the period ended December 31, 2021 | | $ | 10.00 | | | | 0.09 | | | | 2.01 | | | | 2.10 | |
|
(A) | Inception date of the Fund is February 26, 2021. Fund commenced public offering on May 3, 2021. |
(B) | Net investment income per share has been calculated using the average daily shares outstanding during the period. |
(C) | Portfolio turnover rate is calculated on the basis of the Fund as a whole without distinguishing between classes of shares issued. |
See accompanying Notes to Financial Statements.
110 DIAMOND HILL FUNDS | ANNUAL REPORT | DECEMBER 31, 2021 | DIAMOND-HILL.COM |
| | Dividends
from net
investment
income | | | Distributions
from net
realized
capital gains | | | Total
distributions | | | Net asset
value, end of
period | | | Total
return | | | Net assets,
end of
period
(000’s) | | | Ratio of total
expenses to
average net
assets | | | Ratio of net
investment
income to
average
net assets | | | Portfolio
turnover
rate(C) | |
| | | | | | | | | | | | | | | | | | | | | | | | | | | | | | | | | | | | |
| | | (0.05 | ) | | | (0.10 | ) | | | (0.15 | ) | | | 11.90 | | | | 20.53 | %(D) | | | 33 | | | | 0.96 | %(E) | | | 0.56 | %(E) | | | 18 | %(D) |
| | | |
| | | | | | | | | | | | | | | | | | | | | | | | | | | | | | | | | | | | |
| | | (0.07 | ) | | | (0.10 | ) | | | (0.17 | ) | | | 11.92 | | | | 20.92 | %(D) | | | 2,015 | | | | 0.67 | %(E) | | | 0.77 | %(E) | | | 18 | %(D) |
| | | |
| | | | | | | | | | | | | | | | | | | | | | | | | | | | | | | | | | | | |
| | | (0.08 | ) | | | (0.10 | ) | | | (0.18 | ) | | | 11.92 | | | | 20.98 | %(D) | | | 15,898 | | | | 0.55 | %(E) | | | 1.00 | %(E) | | | 18 | %(D) |
| | | |
See accompanying Notes to Financial Statements.
DIAMOND HILL FUNDS | ANNUAL REPORT | DECEMBER 31, 2021 | DIAMOND-HILL.COM 111 |
All Cap Select Fund
Financial Highlights
Selected data for a share outstanding throughout the periods indicated
All Cap Select Fund | | Net asset
value,
beginning of
year | | | Net
investment
income(A) | | | Net realized
and
unrealized
gains
(losses) on
investments | | | Total from
investment
operations | | | Dividends
from net
investment
income | |
Investor | | | | | | | | | | | | | | | | | | | | |
For the year ended December 31, 2021 | | $ | 18.43 | | | | 0.10 | | | | 5.85 | | | | 5.95 | | | | (0.17 | ) |
For the year ended December 31, 2020 | | $ | 16.17 | | | | 0.05 | | | | 2.26 | | | | 2.31 | | | | (0.05 | ) |
For the year ended December 31, 2019 | | $ | 12.64 | | | | 0.06 | | | | 3.78 | | | | 3.84 | | | | — | |
For the year ended December 31, 2018 | | $ | 16.01 | | | | 0.05 | | | | (1.96 | ) | | | (1.91 | ) | | | (0.06 | ) |
For the year ended December 31, 2017 | | $ | 13.35 | | | | 0.03 | | | | 2.63 | | | | 2.66 | | | | — | |
|
Class I | | | | | | | | | | | | | | | | | | | | |
For the year ended December 31, 2021 | | $ | 18.60 | | | | 0.14 | | | | 5.96 | | | | 6.10 | | | | (0.20 | ) |
For the year ended December 31, 2020 | | $ | 16.32 | | | | 0.09 | | | | 2.29 | | | | 2.38 | | | | (0.10 | ) |
For the year ended December 31, 2019 | | $ | 12.72 | | | | 0.11 | | | | 3.80 | | | | 3.91 | | | | — | |
For the year ended December 31, 2018 | | $ | 16.11 | | | | 0.10 | | | | (1.97 | ) | | | (1.87 | ) | | | (0.12 | ) |
For the year ended December 31, 2017 | | $ | 13.40 | | | | 0.07 | | | | 2.65 | | | | 2.72 | | | | (0.01 | ) |
|
Class Y | | | | | | | | | | | | | | | | | | | | |
For the year ended December 31, 2021 | | $ | 18.66 | | | | 0.14 | | | | 6.01 | | | | 6.15 | | | | (0.22 | ) |
For the year ended December 31, 2020 | | $ | 16.37 | | | | 0.11 | | | | 2.30 | | | | 2.41 | | | | (0.12 | ) |
For the year ended December 31, 2019 | | $ | 12.74 | | | | 0.13 | | | | 3.81 | | | | 3.94 | | | | — | |
For the year ended December 31, 2018 | | $ | 16.14 | | | | 0.12 | | | | (1.99 | ) | | | (1.87 | ) | | | (0.13 | ) |
For the year ended December 31, 2017 | | $ | 13.42 | | | | 0.09 | | | | 2.65 | | | | 2.74 | | | | (0.02 | ) |
|
(A) | Net investment income per share has been calculated using the average daily shares outstanding during the period. |
(B) | Total returns shown exclude the effect of applicable sales charges for years prior to December 31, 2021. |
(C) | The Fund’s adviser has contractually agreed to waive fees in the pro-rata amount of the management fee charged by the underlying Diamond Hill Fund on each Fund’s investment in such other Diamond Hill Fund. If such fee waiver had not occurred, the ratios would have been as indicated. |
(D) | Portfolio turnover rate is calculated on the basis of the Fund as a whole without distinguishing between classes of shares issued. |
See accompanying Notes to Financial Statements.
112 DIAMOND HILL FUNDS | ANNUAL REPORT | DECEMBER 31, 2021 | DIAMOND-HILL.COM |
| | Distributions
from net
realized
capital gains | | | Total
distributions | | | Net asset
value, end of
year | | | Total return(B) | | | Net assets,
end of year
(000’s) | | | Ratio of
total net
expenses to
average net
assets | | | Ratio of
total gross
expenses to
average net
assets(C) | | | Ratio of net
investment
income to
average
net assets | | | Portfolio
turnover
rate(D) | |
| | | | | | | | | | | | | | | | | | | | | | | | | | | | | | | | | | | | |
| | | (2.77 | ) | | | (2.94 | ) | | $ | 21.44 | | | | 32.91 | % | | $ | 31,064 | | | | 1.16 | % | | | 1.16 | % | | | 0.44 | % | | | 55 | % |
| | | — | | | | (0.05 | ) | | $ | 18.43 | | | | 14.30 | % | | $ | 10,207 | | | | 1.16 | % | | | 1.16 | % | | | 0.33 | % | | | 76 | % |
| | | (0.31 | ) | | | (0.31 | ) | | $ | 16.17 | | | | 30.41 | % | | $ | 11,049 | | | | 1.17 | % | | | 1.17 | % | | | 0.46 | % | | | 45 | % |
| | | (1.40 | ) | | | (1.46 | ) | | $ | 12.64 | | | | (12.31 | )% | | $ | 8,963 | | | | 1.16 | % | | | 1.16 | % | | | 0.29 | % | | | 84 | % |
| | | — | | | | — | | | $ | 16.01 | | | | 19.93 | % | | $ | 13,480 | | | | 1.17 | % | | | 1.18 | % | | | 0.21 | % | | | 52 | % |
| | | |
| | | | | | | | | | | | | | | | | | | | | | | | | | | | | | | | | | | | |
| | | (2.77 | ) | | | (2.97 | ) | | $ | 21.73 | | | | 33.39 | % | | $ | 232,051 | | | | 0.87 | % | | | 0.87 | % | | | 0.61 | % | | | 55 | % |
| | | — | | | | (0.10 | ) | | $ | 18.60 | | | | 14.57 | % | | $ | 171,263 | | | | 0.87 | % | | | 0.87 | % | | | 0.62 | % | | | 76 | % |
| | | (0.31 | ) | | | (0.31 | ) | | $ | 16.32 | | | | 30.77 | % | | $ | 152,591 | | | | 0.88 | % | | | 0.88 | % | | | 0.75 | % | | | 45 | % |
| | | (1.40 | ) | | | (1.52 | ) | | $ | 12.72 | | | | (12.02 | )% | | $ | 114,571 | | | | 0.87 | % | | | 0.87 | % | | | 0.60 | % | | | 84 | % |
| | | — | | | | (0.01 | ) | | $ | 16.11 | | | | 20.33 | % | | $ | 136,233 | | | | 0.87 | % | | | 0.88 | % | | | 0.52 | % | | | 52 | % |
| | | |
| | | | | | | | | | | | | | | | | | | | | | | | | | | | | | | | | | | | |
| | | (2.77 | ) | | | (2.99 | ) | | $ | 21.82 | | | | 33.55 | % | | $ | 120,283 | | | | 0.75 | % | | | 0.75 | % | | | 0.64 | % | | | 55 | % |
| | | — | | | | (0.12 | ) | | $ | 18.66 | | | | 14.70 | % | | $ | 141,244 | | | | 0.75 | % | | | 0.75 | % | | | 0.74 | % | | | 76 | % |
| | | (0.31 | ) | | | (0.31 | ) | | $ | 16.37 | | | | 30.96 | % | | $ | 103,963 | | | | 0.76 | % | | | 0.76 | % | | | 0.86 | % | | | 45 | % |
| | | (1.40 | ) | | | (1.53 | ) | | $ | 12.74 | | | | (11.95 | )% | | $ | 65,218 | | | | 0.75 | % | | | 0.75 | % | | | 0.73 | % | | | 84 | % |
| | | — | | | | (0.02 | ) | | $ | 16.14 | | | | 20.45 | % | | $ | 21,628 | | | | 0.77 | % | | | 0.78 | % | | | 0.61 | % | | | 52 | % |
| | | |
DIAMOND HILL FUNDS | ANNUAL REPORT | DECEMBER 31, 2021 | DIAMOND-HILL.COM 113 |
Long-Short Fund
Financial Highlights
Selected data for a share outstanding throughout the periods indicated
Long-Short Fund | | Net asset
value,
beginning of
year | | | Net
investment
income
(loss)(A) | | | Net realized
and
unrealized
gains
(losses) on
investments | | | Total from
investment
operations | | | Dividends
from net
investment
income | |
Investor | | | | | | | | | | | | | | | | | | | | |
For the year ended December 31, 2021 | | $ | 25.89 | | | | (0.11 | ) | | | 4.98 | | | | 4.87 | | | | — | |
For the year ended December 31, 2020 | | $ | 26.29 | | | | 0.02 | | | | (0.17 | ) | | | (0.15 | ) | | | (0.05 | ) |
For the year ended December 31, 2019 | | $ | 22.78 | | | | 0.13 | | | | 5.04 | | | | 5.17 | | | | (0.17 | ) |
For the year ended December 31, 2018 | | $ | 25.76 | | | | 0.10 | | | | (1.96 | ) | | | (1.86 | ) | | | (0.07 | ) |
For the year ended December 31, 2017 | | $ | 24.91 | | | | (0.05 | ) | | | 1.45 | | | | 1.40 | | | | — | |
|
Class I | | | | | | | | | | | | | | | | | | | | |
For the year ended December 31, 2021 | | $ | 26.58 | | | | (0.03 | ) | | | 5.13 | | | | 5.10 | | | | — | |
For the year ended December 31, 2020 | | $ | 26.98 | | | | 0.09 | | | | (0.17 | ) | | | (0.08 | ) | | | (0.12 | ) |
For the year ended December 31, 2019 | | $ | 23.32 | | | | 0.22 | | | | 5.16 | | | | 5.38 | | | | (0.23 | ) |
For the year ended December 31, 2018 | | $ | 26.39 | | | | 0.18 | | | | (2.01 | ) | | | (1.83 | ) | | | (0.19 | ) |
For the year ended December 31, 2017 | | $ | 25.43 | | | | 0.02 | | | | 1.50 | | | | 1.52 | | | | (0.01 | ) |
|
Class Y | | | | | | | | | | | | | | | | | | | | |
For the year ended December 31, 2021 | | $ | 26.69 | | | | 0.02 | | | | 5.14 | | | | 5.16 | | | | — | |
For the year ended December 31, 2020 | | $ | 27.10 | | | | 0.14 | | | | (0.20 | ) | | | (0.06 | ) | | | (0.15 | ) |
For the year ended December 31, 2019 | | $ | 23.42 | | | | 0.25 | | | | 5.18 | | | | 5.43 | | | | (0.26 | ) |
For the year ended December 31, 2018 | | $ | 26.49 | | | | 0.21 | | | | (2.01 | ) | | | (1.80 | ) | | | (0.22 | ) |
For the year ended December 31, 2017 | | $ | 25.53 | | | | 0.05 | | | | 1.49 | | | | 1.54 | | | | (0.03 | ) |
|
(A) | Net investment income (loss) per share has been calculated using the average daily shares outstanding during the period. |
(B) | Total returns shown exclude the effect of applicable sales charges for years prior to December 31, 2021. |
(C) | This Fund invests in short positions and as such incurs certain expenses and fees. If such expenses and fees had not occurred, the ratios of total expenses to average net assets would have been 1.35% for Investor, 1.06% for Class I, and 0.94% for Class Y. |
See accompanying Notes to Financial Statements.
114 DIAMOND HILL FUNDS | ANNUAL REPORT | DECEMBER 31, 2021 | DIAMOND-HILL.COM |
| | Distributions
from net
realized
capital gains | | | Total
distributions | | | Net asset
value, end of
year | | | Total return(B) | | | Net assets,
end of year
(000,000’s) | | | Ratio of
total net
expenses to
average net
assets(C) | | | Ratio of
total gross
expenses to
average net
assets(D) | | | Ratio of net
investment
income
(loss) to
average
net assets | | | Portfolio
turnover
rate(E) | |
| | | | | | | | | | | | | | | | | | | | | | | | | | | | | | | | | | | | |
| | | (3.00 | ) | | | (3.00 | ) | | $ | 27.76 | | | | 19.03 | % | | $ | 168 | | | | 1.92 | % | | | 1.93 | % | | | (0.38 | )% | | | 33 | %(F) |
| | | (0.20 | ) | | | (0.25 | ) | | $ | 25.89 | | | | (0.55 | )% | | $ | 162 | | | | 1.81 | % | | | 1.82 | % | | | 0.09 | % | | | 65 | %(F) |
| | | (1.49 | ) | | | (1.66 | ) | | $ | 26.29 | | | | 22.74 | % | | $ | 235 | | | | 1.85 | % | | | 1.86 | % | | | 0.51 | % | | | 54 | %(F) |
| | | (1.05 | ) | | | (1.12 | ) | | $ | 22.78 | | | | (7.30 | )% | | $ | 189 | | | | 1.72 | % | | | 1.73 | % | | | 0.38 | % | | | 64 | %(F) |
| | | (0.55 | ) | | | (0.55 | ) | | $ | 25.76 | | | | 5.65 | % | | $ | 358 | | | | 1.95 | % | | | 1.96 | % | | | (0.22 | )% | | | 43 | %(F) |
| | | |
| | | | | | | | | | | | | | | | | | | | | | | | | | | | | | | | | | | | |
| | | (3.00 | ) | | | (3.00 | ) | | $ | 28.68 | | | | 19.40 | % | | $ | 1,792 | | | | 1.63 | % | | | 1.64 | % | | | (0.08 | )% | | | 33 | %(F) |
| | | (0.20 | ) | | | (0.32 | ) | | $ | 26.58 | | | | (0.27 | )% | | $ | 1,794 | | | | 1.52 | % | | | 1.53 | % | | | 0.39 | % | | | 65 | %(F) |
| | | (1.49 | ) | | | (1.72 | ) | | $ | 26.98 | | | | 23.11 | % | | $ | 2,960 | | | | 1.56 | % | | | 1.57 | % | | | 0.84 | % | | | 54 | %(F) |
| | | (1.05 | ) | | | (1.24 | ) | | $ | 23.32 | | | | (7.04 | )% | | $ | 3,111 | | | | 1.43 | % | | | 1.44 | % | | | 0.68 | % | | | 64 | %(F) |
| | | (0.55 | ) | | | (0.56 | ) | | $ | 26.39 | | | | 5.99 | % | | $ | 4,033 | | | | 1.65 | % | | | 1.66 | % | | | 0.09 | % | | | 43 | %(F) |
| | | |
| | | | | | | | | | | | | | | | | | | | | | | | | | | | | | | | | | | | |
| | | (3.00 | ) | | | (3.00 | ) | | $ | 28.85 | | | | 19.55 | % | | $ | 37 | | | | 1.51 | % | | | 1.52 | % | | | 0.08 | % | | | 33 | %(F) |
| | | (0.20 | ) | | | (0.35 | ) | | $ | 26.69 | | | | (0.19 | )% | | $ | 75 | | | | 1.40 | % | | | 1.41 | % | | | 0.57 | % | | | 65 | %(F) |
| | | (1.49 | ) | | | (1.75 | ) | | $ | 27.10 | | | | 23.23 | % | | $ | 292 | | | | 1.44 | % | | | 1.45 | % | | | 0.93 | % | | | 54 | %(F) |
| | | (1.05 | ) | | | (1.27 | ) | | $ | 23.42 | | | | (6.89 | )% | | $ | 214 | | | | 1.31 | % | | | 1.32 | % | | | 0.80 | % | | | 64 | %(F) |
| | | (0.55 | ) | | | (0.58 | ) | | $ | 26.49 | | | | 6.07 | % | | $ | 261 | | | | 1.55 | % | | | 1.56 | % | | | 0.19 | % | | | 43 | %(F) |
| | | |
(D) | The Fund’s adviser has contractually agreed to waive fees in the pro-rata amount of the management fee charged by the underlying Diamond Hill Fund on each Fund’s investment in such other Diamond Hill Fund. If such fee waiver had not occurred, the ratios would have been as indicated. |
(E) | Portfolio turnover rate is calculated on the basis of the Fund as a whole without distinguishing between classes of shares issued. |
(F) | The portfolio turnover rate for 2021, 2020, 2019, 2018 and 2017 would have been 30%, 47%, 42%, 51% and 32%, respectively, if the absolute value of securities sold short liability was included in the denominator of the calculation. |
See accompanying Notes to Financial Statements.
DIAMOND HILL FUNDS | ANNUAL REPORT | DECEMBER 31, 2021 | DIAMOND-HILL.COM 115 |
International Fund
Financial Highlights
Selected data for a share outstanding throughout the periods indicated
International Fund(A) | | Net asset
value,
beginning of
period | | | Net
investment
income(B) | | | Net realized
and
unrealized
gains on
investments | | | Total from
investment
operations | |
Investor | | | | | | | | | | | | | | | | |
For the year ended December 31, 2021 | | $ | 15.48 | | | | 0.38 | | | | 1.52 | | | | 1.90 | |
For the year ended December 31, 2020 | | $ | 14.67 | | | | 0.05 | | | | 0.90 | | | | 0.95 | |
For the period ended December 31, 2019 | | $ | 13.55 | | | | 0.02 | | | | 1.15 | | | | 1.17 | |
|
Class I | | | | | | | | | | | | | | | | |
For the year ended December 31, 2021 | | $ | 15.51 | | | | 0.42 | | | | 1.53 | | | | 1.95 | |
For the year ended December 31, 2020 | | $ | 14.69 | | | | 0.09 | | | | 0.90 | | | | 0.99 | |
For the period ended December 31, 2019 | | $ | 13.55 | | | | 0.04 | | | | 1.15 | | | | 1.19 | |
|
Class Y | | | | | | | | | | | | | | | | |
For the year ended December 31, 2021 | | $ | 15.51 | | | | 0.47 | | | | 1.51 | | | | 1.98 | |
For the year ended December 31, 2020 | | $ | 14.69 | | | | 0.11 | | | | 0.89 | | | | 1.00 | |
For the period ended December 31, 2019 | | $ | 13.55 | | | | 0.05 | | | | 1.15 | | | | 1.20 | |
|
(A) | Inception date of the Fund is June 28, 2019. Fund commenced public offering and operations on July 1, 2019. |
(B) | Net investment income per share has been calculated using the average daily shares outstanding during the period. |
(C) | Total returns shown exclude the effect of applicable sales charges for periods prior to December 31, 2021. |
See accompanying Notes to Financial Statements.
116 DIAMOND HILL FUNDS | ANNUAL REPORT | DECEMBER 31, 2021 | DIAMOND-HILL.COM |
| | Dividends
from net
investment
income | | | Distributions
from net
realized
capital gains | | | Total
distributions | | | Net asset
value, end of
period | | | Total return(C) | | | Net assets,
end of
period
(000’s) | | | Ratio of total
expenses to
average net
assets | | | Ratio of net
investment
income to
average
net assets | | | Portfolio
turnover
rate(D) | |
| | | | | | | | | | | | | | | | | | | | | | | | | | | | | | | | | | | | |
| | | (0.15 | ) | | | (0.47 | ) | | | (0.62 | ) | | $ | 16.76 | | | | 12.43 | % | | $ | 449 | | | | 1.13 | % | | | 2.20 | % | | | 33 | % |
| | | (0.06 | ) | | | (0.08 | ) | | | (0.14 | ) | | $ | 15.48 | | | | 6.48 | % | | $ | 338 | | | | 1.14 | % | | | 0.43 | % | | | 49 | % |
| | | (0.04 | ) | | | (0.01 | ) | | | (0.05 | ) | | $ | 14.67 | | | | 8.64 | %(E) | | $ | 45 | | | | 1.21 | %(F) | | | 0.25 | %(F) | | | 8 | %(E) |
| | | |
| | | | | | | | | | | | | | | | | | | | | | | | | | | | | | | | | | | | |
| | | (0.20 | ) | | | (0.47 | ) | | | (0.67 | ) | | $ | 16.79 | | | | 12.74 | % | | $ | 9,010 | | | | 0.84 | % | | | 2.43 | % | | | 33 | % |
| | | (0.09 | ) | | | (0.08 | ) | | | (0.17 | ) | | $ | 15.51 | | | | 6.74 | % | | $ | 3,913 | | | | 0.85 | % | | | 0.74 | % | | | 49 | % |
| | | (0.04 | ) | | | (0.01 | ) | | | (0.05 | ) | | $ | 14.69 | | | | 8.80 | %(E) | | $ | 3,828 | | | | 0.92 | %(F) | | | 0.61 | %(F) | | | 8 | %(E) |
| | | |
| | | | | | | | | | | | | | | | | | | | | | | | | | | | | | | | | | | | |
| | | (0.22 | ) | | | (0.47 | ) | | | (0.69 | ) | | $ | 16.80 | | | | 12.88 | % | | $ | 46,129 | | | | 0.72 | % | | | 2.74 | % | | | 33 | % |
| | | (0.10 | ) | | | (0.08 | ) | | | (0.18 | ) | | $ | 15.51 | | | | 6.81 | % | | $ | 12,616 | | | | 0.73 | % | | | 0.87 | % | | | 49 | % |
| | | (0.05 | ) | | | (0.01 | ) | | | (0.06 | ) | | $ | 14.69 | | | | 8.85 | %(E) | | $ | 9,616 | | | | 0.80 | %(F) | | | 0.70 | %(F) | | | 8 | %(E) |
| | | |
(D) | Portfolio turnover rate is calculated on the basis of the Fund as a whole without distinguishing between classes of shares issued. |
See accompanying Notes to Financial Statements.
DIAMOND HILL FUNDS | ANNUAL REPORT | DECEMBER 31, 2021 | DIAMOND-HILL.COM 117 |
Short Duration Securitized Bond Fund
Financial Highlights
Selected data for a share outstanding throughout the periods indicated
Short Duration Securitized Bond Fund | | Net asset
value,
beginning of
year | | | Net
investment
income(A) | | | Net realized
and
unrealized
gains
(losses) on
investments | | | Total from
investment
operations | | | | | |
Investor | | | | | | | | | | | | | | | | | | | | |
For the year ended December 31, 2021 | | $ | 10.09 | | | | 0.23 | | | | 0.01 | | | | 0.24 | | | | | |
For the year ended December 31, 2020 | | $ | 10.11 | | | | 0.26 | | | | 0.02 | | | | 0.28 | | | | | |
For the year ended December 31, 2019 | | $ | 10.05 | | | | 0.38 | | | | 0.06 | | | | 0.44 | | | | | |
For the year ended December 31, 2018 | | $ | 10.11 | | | | 0.33 | | | | (0.04 | ) | | | 0.29 | | | | | |
For the year ended December 31, 2017 | | $ | 10.04 | | | | 0.30 | | | | 0.09 | | | | 0.39 | | | | | |
| | | | |
Class I | | | | | | | | | | | | | | | | | | | | |
For the year ended December 31, 2021 | | $ | 10.09 | | | | 0.25 | | | | 0.02 | | | | 0.27 | | | | | |
For the year ended December 31, 2020 | | $ | 10.12 | | | | 0.28 | | | | 0.02 | | | | 0.30 | | | | | |
For the year ended December 31, 2019 | | $ | 10.05 | | | | 0.41 | | | | 0.07 | | | | 0.48 | | | | | |
For the year ended December 31, 2018 | | $ | 10.11 | | | | 0.36 | | | | (0.04 | ) | | | 0.32 | | | | | |
For the year ended December 31, 2017 | | $ | 10.03 | | | | 0.33 | | | | 0.10 | | | | 0.43 | | | | | |
| | | | |
Class Y | | | | | | | | | | | | | | | | | | | | |
For the year ended December 31, 2021 | | $ | 10.10 | | | | 0.27 | | | | 0.01 | | | | 0.28 | | | | | |
For the year ended December 31, 2020 | | $ | 10.12 | | | | 0.30 | | | | 0.02 | | | | 0.32 | | | | | |
For the year ended December 31, 2019 | | $ | 10.06 | | | | 0.42 | | | | 0.06 | | | | 0.48 | | | | | |
For the year ended December 31, 2018 | | $ | 10.11 | | | | 0.38 | | | | (0.04 | ) | | | 0.34 | | | | | |
For the year ended December 31, 2017 | | $ | 10.03 | | | | 0.34 | | | | 0.10 | | | | 0.44 | | | | | |
| | | | |
(A) | Net investment income per share has been calculated using the average daily shares outstanding during the period. |
(B) | Total returns shown exclude the effect of applicable sales charges for years prior to December 31, 2021. |
(C) | Portfolio turnover rate is calculated on the basis of the Fund as a whole without distinguishing between classes of shares issued. |
(D) | Amount is less than $0.005. |
See accompanying Notes to Financial Statements.
118 DIAMOND HILL FUNDS | ANNUAL REPORT | DECEMBER 31, 2021 | DIAMOND-HILL.COM |
Dividends
from net
investment
income | | | Distributions
from net
realized
capital gains | | | Total
distributions | | | Net asset
value, end of
year | | | Total return(B) | | | Net assets,
end of year
(000’s) | | | Ratio of total
expenses to
average net
assets | | | Ratio of net
investment
income to
average
net assets | | | Portfolio
turnover
rate(C) | |
| | | | | | | | | | | | | | | | | | | | | | | | | | | | | | | | | | |
| (0.23 | ) | | | (0.00 | )(D) | | | (0.23 | ) | | $ | 10.10 | | | | 2.42 | % | | $ | 40,035 | | | | 0.81 | % | | | 2.26 | % | | | 48 | % |
| (0.30 | ) | | | — | | | | (0.30 | ) | | $ | 10.09 | | | | 2.87 | % | | $ | 47,059 | | | | 0.82 | % | | | 2.68 | % | | | 72 | % |
| (0.38 | ) | | | (0.00 | )(D) | | | (0.38 | ) | | $ | 10.11 | | | | 4.44 | % | | $ | 55,727 | | | | 0.82 | % | | | 3.72 | % | | | 54 | % |
| (0.34 | ) | | | (0.01 | ) | | | (0.35 | ) | | $ | 10.05 | | | | 2.88 | % | | $ | 18,789 | | | | 0.81 | % | | | 3.30 | % | | | 67 | % |
| (0.31 | ) | | | (0.01 | ) | | | (0.32 | ) | | $ | 10.11 | | | | 3.97 | % | | $ | 20,511 | | | | 0.83 | % | | | 3.03 | % | | | 82 | % |
| | | | | | | | | | | | | | | | | | | | | | | | | | | | | | | | | | |
| | | | | | | | | | | | | | | | | | | | | | | | | | | | | | | | | | |
| (0.26 | ) | | | (0.00 | )(D) | | | (0.26 | ) | | $ | 10.10 | | | | 2.74 | % | | $ | 1,313,888 | | | | 0.52 | % | | | 2.50 | % | | | 48 | % |
| (0.33 | ) | | | — | | | | (0.33 | ) | | $ | 10.09 | | | | 3.08 | % | | $ | 897,232 | | | | 0.53 | % | | | 2.93 | % | | | 72 | % |
| (0.41 | ) | | | (0.00 | )(D) | | | (0.41 | ) | | $ | 10.12 | | | | 4.85 | % | | $ | 525,994 | | | | 0.53 | % | | | 4.00 | % | | | 54 | % |
| (0.37 | ) | | | (0.01 | ) | | | (0.38 | ) | | $ | 10.05 | | | | 3.18 | % | | $ | 308,341 | | | | 0.52 | % | | | 3.62 | % | | | 67 | % |
| (0.34 | ) | | | (0.01 | ) | | | (0.35 | ) | | $ | 10.11 | | | | 4.33 | % | | $ | 61,136 | | | | 0.53 | % | | | 3.29 | % | | | 82 | % |
| | | | | | | | | | | | | | | | | | | | | | | | | | | | | | | | | | |
| | | | | | | | | | | | | | | | | | | | | | | | | | | | | | | | | | |
| (0.27 | ) | | | (0.00 | )(D) | | | (0.27 | ) | | $ | 10.11 | | | | 2.85 | % | | $ | 144,787 | | | | 0.40 | % | | | 2.68 | % | | | 48 | % |
| (0.34 | ) | | | — | | | | (0.34 | ) | | $ | 10.10 | | | | 3.29 | % | | $ | 188,175 | | | | 0.41 | % | | | 3.09 | % | | | 72 | % |
| (0.42 | ) | | | (0.00 | )(D) | | | (0.42 | ) | | $ | 10.12 | | | | 4.84 | % | | $ | 226,938 | | | | 0.41 | % | | | 4.09 | % | | | 54 | % |
| (0.38 | ) | | | (0.01 | ) | | | (0.39 | ) | | $ | 10.06 | | | | 3.38 | % | | $ | 252,137 | | | | 0.40 | % | | | 3.72 | % | | | 67 | % |
| (0.35 | ) | | | (0.01 | ) | | | (0.36 | ) | | $ | 10.11 | | | | 4.43 | % | | $ | 231,290 | | | | 0.43 | % | | | 3.33 | % | | | 82 | % |
| | | | | | | | | | | | | | | | | | | | | | | | | | | | | | | | | | �� |
DIAMOND HILL FUNDS | ANNUAL REPORT | DECEMBER 31, 2021 | DIAMOND-HILL.COM 119 |
Core Bond Fund
Financial Highlights
Selected data for a share outstanding throughout the periods indicated
Core Bond Fund | | Net asset
value,
beginning of
year | | | Net
investment
income(A) | | | Net realized
and
unrealized
gains
(losses) on
investments | | | Total from
investment
operations | |
Investor | | | | | | | | | | | | | | | | |
For the year ended December 31, 2021 | | $ | 10.74 | | | | 0.19 | | | | (0.32 | ) | | | (0.13 | ) |
For the year ended December 31, 2020 | | $ | 10.19 | | | | 0.21 | | | | 0.56 | | | | 0.77 | |
For the year ended December 31, 2019 | | $ | 9.71 | | | | 0.24 | | | | 0.49 | | | | 0.73 | |
For the year ended December 31, 2018 | | $ | 9.85 | | | | 0.25 | | | | (0.13 | ) | | | 0.12 | |
For the year ended December 31, 2017 | | $ | 9.70 | | | | 0.21 | | | | 0.16 | | | | 0.37 | |
|
Class I | | | | | | | | | | | | | | | | |
For the year ended December 31, 2021 | | $ | 10.74 | | | | 0.22 | | | | (0.33 | ) | | | (0.11 | ) |
For the year ended December 31, 2020 | | $ | 10.19 | | | | 0.24 | | | | 0.56 | | | | 0.80 | |
For the year ended December 31, 2019 | | $ | 9.71 | | | | 0.26 | | | | 0.50 | | | | 0.76 | |
For the year ended December 31, 2018 | | $ | 9.85 | | | | 0.28 | | | | (0.13 | ) | | | 0.15 | |
For the year ended December 31, 2017 | | $ | 9.70 | | | | 0.24 | | | | 0.16 | | | | 0.40 | |
|
Class Y | | | | | | | | | | | | | | | | |
For the year ended December 31, 2021 | | $ | 10.75 | | | | 0.23 | | | | (0.33 | ) | | | (0.10 | ) |
For the year ended December 31, 2020 | | $ | 10.20 | | | | 0.26 | | | | 0.55 | | | | 0.81 | |
For the year ended December 31, 2019 | | $ | 9.71 | | | | 0.28 | | | | 0.50 | | | | 0.78 | |
For the year ended December 31, 2018 | | $ | 9.85 | | | | 0.29 | | | | (0.13 | ) | | | 0.16 | |
For the year ended December 31, 2017 | | $ | 9.70 | | | | 0.25 | | | | 0.16 | | | | 0.41 | |
|
(A) | Net investment income per share has been calculated using the average daily shares outstanding during the period. |
(B) | Total returns shown exclude the effect of applicable sales charges for years prior to December 31, 2021. |
(C) | Portfolio turnover rate is calculated on the basis of the Fund as a whole without distinguishing between classes of shares issued. |
See accompanying Notes to Financial Statements.
120 DIAMOND HILL FUNDS | ANNUAL REPORT | DECEMBER 31, 2021 | DIAMOND-HILL.COM |
| | Dividends
from net
investment
income | | | Distributions
from net
realized
capital gains | | | Total
distributions | | | Net asset
value, end of
year | | | Total return(B) | | | Net assets,
end of year
(000’s) | | | Ratio of total
expenses to
average net
assets | | | Ratio of net
investment
income to
average
net assets | | | Portfolio
turnover
rate(C) | |
| | | | | | | | | | | | | | | | | | | | | | | | | | | | | | | | | | | | |
| | | (0.21 | ) | | | — | | | | (0.21 | ) | | $ | 10.40 | | | | (1.24 | )% | | $ | 10,091 | | | | 0.76 | % | | | 1.78 | % | | | 37 | % |
| | | (0.22 | ) | | | — | | | | (0.22 | ) | | $ | 10.74 | | | | 7.60 | % | | $ | 17,024 | | | | 0.76 | % | | | 1.98 | % | | | 28 | % |
| | | (0.25 | ) | | | — | | | | (0.25 | ) | | $ | 10.19 | | | | 7.63 | % | | $ | 3,599 | | | | 0.77 | % | | | 2.43 | % | | | 29 | % |
| | | (0.26 | ) | | | — | | | | (0.26 | ) | | $ | 9.71 | | | | 1.28 | % | | $ | 2,976 | | | | 0.76 | % | | | 2.60 | % | | | 25 | % |
| | | (0.22 | ) | | | — | | | | (0.22 | ) | | $ | 9.85 | | | | 3.85 | % | | $ | 3,480 | | | | 0.78 | % | | | 2.10 | % | | | 35 | % |
| | | |
| | | | | | | | | | | | | | | | | | | | | | | | | | | | | | | | | | | | |
| | | (0.24 | ) | | | — | | | | (0.24 | ) | | $ | 10.39 | | | | (0.99 | )% | | $ | 330,666 | | | | 0.47 | % | | | 2.08 | % | | | 37 | % |
| | | (0.25 | ) | | | — | | | | (0.25 | ) | | $ | 10.74 | | | | 7.94 | % | | $ | 260,365 | | | | 0.47 | % | | | 2.28 | % | | | 28 | % |
| | | (0.28 | ) | | | — | | | | (0.28 | ) | | $ | 10.19 | | | | 7.93 | % | | $ | 66,174 | | | | 0.48 | % | | | 2.61 | % | | | 29 | % |
| | | (0.29 | ) | | | — | | | | (0.29 | ) | | $ | 9.71 | | | | 1.59 | % | | $ | 14,574 | | | | 0.47 | % | | | 2.92 | % | | | 25 | % |
| | | (0.25 | ) | | | — | | | | (0.25 | ) | | $ | 9.85 | | | | 4.17 | % | | $ | 9,604 | | | | 0.48 | % | | | 2.40 | % | | | 35 | % |
| | | |
| | | | | | | | | | | | | | | | | | | | | | | | | | | | | | | | | | | | |
| | | (0.26 | ) | | | — | | | | (0.26 | ) | | $ | 10.39 | | | | (0.95 | )% | | $ | 58,668 | | | | 0.35 | % | | | 2.21 | % | | | 37 | % |
| | | (0.26 | ) | | | — | | | | (0.26 | ) | | $ | 10.75 | | | | 8.04 | % | | $ | 59,856 | | | | 0.35 | % | | | 2.46 | % | | | 28 | % |
| | | (0.29 | ) | | | — | | | | (0.29 | ) | | $ | 10.20 | | | | 8.15 | % | | $ | 52,275 | | | | 0.36 | % | | | 2.83 | % | | | 29 | % |
| | | (0.30 | ) | | | — | | | | (0.30 | ) | | $ | 9.71 | | | | 1.69 | % | | $ | 37,713 | | | | 0.35 | % | | | 3.03 | % | | | 25 | % |
| | | (0.26 | ) | | | — | | | | (0.26 | ) | | $ | 9.85 | | | | 4.22 | % | | $ | 30,740 | | | | 0.38 | % | | | 2.49 | % | | | 35 | % |
| | | |
DIAMOND HILL FUNDS | ANNUAL REPORT | DECEMBER 31, 2021 | DIAMOND-HILL.COM 121 |
Diamond Hill Funds
Notes to Financial Statements
December 31, 2021
Organization
The Diamond Hill Small Cap Fund (“Small Cap Fund”), Diamond Hill Small-Mid Cap Fund (“Small-Mid Cap Fund”), Diamond Hill Mid Cap Fund (“Mid Cap Fund”), Diamond Hill Large Cap Fund (“Large Cap Fund”), Diamond Hill Large Cap Concentrated Fund (“Large Cap Concentrated Fund”), Diamond Hill All Cap Select Fund (“All Cap Select Fund”), Diamond Hill Long-Short Fund (“Long-Short Fund”), Diamond Hill International Fund (“International Fund”), Diamond Hill Short Duration Securitized Bond Fund (“Short Duration Fund”) and Diamond Hill Core Bond Fund (“Core Bond Fund”) are each a diversified series, except for All Cap Select Fund and Large Cap Concentrated Fund which are non-diversified, of the Diamond Hill Funds (the “Trust”) (each a “Fund” and collectively the “Funds”). The Trust is registered under the Investment Company Act of 1940, as amended (the “1940 Act”), as an open-end management company. Each Fund follows accounting and reporting guidance under Financial Accounting Standards Board (“FASB”) Accounting Standards Codification Topic 946, “Financial Services – Investment Companies.”
The shareholders of the Diamond Hill Research Opportunities Fund (“Research Opportunities Fund”) approved an Agreement and Plan of Reorganization providing for the transfer of all assets and liabilities of the Research Opportunities Fund to the Long-Short Fund. The tax-free reorganization took place on October 23, 2020.
The following is a summary of shares outstanding, net assets, net asset value (“NAV”) per share and unrealized appreciation immediately before and after the reorganization.
| | | Before Reorganization | | | After
Reorganization | |
| | | Research
Opportunities
Fund | | | Long-Short
Fund | | | Long-Short
Fund | |
Class A | | | | | | | | | | | | |
Shares | | | 243,462 | | | | 6,253,187 | | | | 6,479,452 | |
Net Assets | | $ | 5,435,645 | | | $ | 150,222,454 | | | $ | 155,658,099 | |
Net Asset Value | | $ | 22.33 | | | $ | 24.02 | | | $ | 24.02 | |
| | | | | | | | | | | | | |
Class C | | | | | | | | | | | | |
Shares | | | 36,823 | | | | 1,118,057 | | | | 1,154,420 | |
Net Assets | | $ | 762,183 | | | $ | 23,434,970 | | | $ | 24,197,153 | |
Net Asset Value | | $ | 20.70 | | | $ | 20.96 | | | $ | 20.96 | |
| | | | | | | | | | | | | |
Class I | | | | | | | | | | | | |
Shares | | | 543,462 | | | | 70,251,484 | | | | 70,750,622 | |
Net Assets | | $ | 12,333,406 | | | $ | 1,735,872,171 | | | $ | 1,748,205,577 | |
Net Asset Value | | $ | 22.69 | | | $ | 24.71 | | | $ | 24.71 | |
| | | | | | | | | | | | | |
Class Y | | | | | | | | | | | | |
Shares | | | 734,442 | | | | 2,221,312 | | | | 2,894,259 | |
Net Assets | | $ | 16,713,103 | | | $ | 55,167,785 | | | $ | 71,880,888 | |
Net Asset Value | | $ | 22.76 | | | $ | 24.84 | | | $ | 24.84 | |
| | | | | | | | | | | | | |
122 DIAMOND HILL FUNDS | ANNUAL REPORT | DECEMBER 31, 2021 | DIAMOND-HILL.COM |
Diamond Hill Funds
Notes to Financial Statements (Continued)
December 31, 2021
| | | Before Reorganization | | | After
Reorganization | |
| | | Research
Opportunities
Fund | | | Long-Short
Fund | | | Long-Short
Fund | |
Fund Total | | | | | | | | | | | | |
Shares | | | 1,558,189 | | | | 79,844,040 | | | | 81,278,753 | |
Net Assets | | $ | 35,244,337 | | | $ | 1,964,697,380 | | | $ | 1,999,941,717 | |
Unrealized Appreciation | | $ | 4,237,914 | | | $ | 444,804,189 | | | $ | 449,042,103 | |
For financial reporting purposes, assets received, and shares issued by the Long-Short Fund were recorded at fair value; however, the cost basis of the investments received from the Research Opportunities Fund was carried forward to align ongoing reporting of the Long-Short Fund’s realized and unrealized gains and losses with amounts distributable to shareholders for tax purposes.
All Funds currently offer three classes of shares: Investor, Class I and Class Y. Prior to February 22, 2021, the Small Cap Fund, Small-Mid Cap Fund, Large Cap Fund, All Cap Select Fund and Long-Short Fund offered four classes of shares including Class C (sold with a contingent deferred sales charge of 1.00% for shares redeemed within one year of the purchase date). On February 22, 2021, all existing Class C shares were converted to Investor shares at the Investor shares NAV per share as of February 22, 2021. On February 28, 2021, all Class A shares were renamed to Investor shares and the initial sales charge on the shares was eliminated. Each class of shares for each Fund has identical rights and privileges except with respect to distribution (12b-1) and service fees, voting rights on matters affecting a single class of shares, exchange privileges of each class of shares.
New Accounting Pronouncement
In March 2020, the FASB issued Accounting Standards Update No. 2020-04 (“ASU 2020-04”), “Reference Rate Reform (Topic 848): Facilitation of the Effects of Reference Rate Reform on Financial Reporting”. ASU 2020-04 provides optional temporary financial reporting relief from the effect of certain types of contract modifications due to the discontinuation of the London Interbank Offered Rate (“LIBOR”) and other interbank-offered based reference rates at the end of 2021. ASU 2020-04 is effective for certain reference rate-related contract modifications that occur during the period March 12, 2020 through December 31, 2022. The Funds will consider this optional guidance prospectively, if applicable.
Significant Accounting Policies
The following is a summary of the Funds’ significant accounting policies:
Estimates — The financial statements are prepared in conformity with accounting principles generally accepted in the United States of America (“GAAP”), which requires management to make estimates and assumptions that affect the reported amounts of assets and liabilities and disclosure of contingent assets and liabilities at the date of the financial statements and the reported amounts of income and expenses during the reporting period. Actual results could differ from those estimates.
DIAMOND HILL FUNDS | ANNUAL REPORT | DECEMBER 31, 2021 | DIAMOND-HILL.COM 123 |
Diamond Hill Funds
Notes to Financial Statements (Continued)
December 31, 2021
Security valuation — The Funds record their investments at fair value. Fair value is defined as the price that would be received to sell an asset or paid to transfer a liability in an orderly transaction between market participants at the measurement date. The valuation techniques used by the Funds maximize the use of observable inputs and minimize the use of unobservable inputs in determining fair value. These inputs are summarized in the three broad levels listed below:
● | Level 1 — quoted prices in active markets for identical securities |
● | Level 2 — other significant observable inputs (including quoted prices for similar securities, interest rates, prepayment speeds, credit risk, etc.) |
● | Level 3 — significant unobservable inputs (including the Funds’ own assumptions in determining the fair value of investments) |
Listed securities for which market quotations are readily available are valued at the closing prices as determined by the primary exchange where the securities are traded. Unlisted securities or listed securities for which the latest sales prices are not readily available are valued at the closing bid (long positions) or ask (short positions) price in the principal market where such securities are normally traded. Investments in other open-end investment companies are valued at their reported NAV per share. In each of these situations, valuations are typically categorized as Level 1 in the fair value hierarchy.
Debt securities are valued on the basis of valuations provided by dealers or by an independent pricing service which take into account appropriate factors such as trading activity (i.e., market transactions for normal, institutional-size trading units of similar securities), readily available market quotations (including broker quotes), yield, quality, coupon rate, maturity, type of issue, trading characteristic, call features, credit ratings and other data. Short-term debt investments of sufficient credit quality maturing in less than 61 days may be valued at amortized cost, if amortized cost is determined to approximate fair value. In each of these situations, valuations are typically categorized as Level 2 in the fair value hierarchy.
Securities for which market quotations are not readily available (e.g., an approved pricing service does not provide a price, a price becomes stale, or an event occurs that materially affects the furnished price) are valued by the Valuation & Liquidity Committee. In these cases, the Valuation & Liquidity Committee, established and appointed by the Board of Trustees, determines in good faith, subject to Trust procedures, the fair value of portfolio securities held by a Fund (“good faith fair valuation”). When a good faith fair valuation of a security is required, consideration is generally given to a number of factors, including, but not limited to the following: dealer quotes, published analyses by dealers or analysts of the situation at issue, transactions implicitly valuing the security (such as a merger, tender offer, etc.), the value of other securities or contracts which derive their value from the security at issue, and the implications (whether negative or positive) of the circumstances which have caused trading in the security to halt. Depending on the source and relative significance of the valuation inputs in these instances, the valuations for these securities may be classified as Level 2 or Level 3 in the fair value hierarchy.
124 DIAMOND HILL FUNDS | ANNUAL REPORT | DECEMBER 31, 2021 | DIAMOND-HILL.COM |
Diamond Hill Funds
Notes to Financial Statements (Continued)
December 31, 2021
In accordance with procedures adopted by the Trust’s Board of Trustees, fair value pricing may be used if events materially affecting the value of foreign equity securities occur between the time the exchange on which they are traded closes and the time the Funds’ NAVs are calculated. The Funds use a systematic valuation model, provided daily by an independent third party, to fair value their international equity securities. These valuations are considered as Level 2 in the fair value hierarchy.
Changes in valuation techniques may result in transfers in or out of an assigned level within the disclosure hierarchy.
The inputs or methodology used for valuing securities are not necessarily an indication of the risks associated with investing in those securities. For example, short-term debt securities of sufficient credit quality maturing in less than 61 days may be valued using amortized cost in accordance with rules under the 1940 Act. Generally, amortized cost approximates the current fair value of a security, but since the value is not obtained from a quoted price in an active market, such securities are reflected as Level 2. The following is a summary of the Funds’ investments and the inputs used to value the investments as of December 31, 2021:
| | | Level 1 -
Quoted Prices | | | Level 2 - Other
Significant
Observable
Inputs | | | Level 3 -
Significant
Unobservable
Inputs | | | Total | |
Investments in Securities (Assets) | | | | | | | | | | | | |
Small Cap Fund | | | | | | | | | | | | | | | | |
Common Stocks* | | $ | 563,279,559 | | | $ | — | | | $ | — | | | $ | 563,279,559 | |
Registered Investment Companies | | | 40,788,194 | | | | — | | | | — | | | | 40,788,194 | |
Total | | $ | 604,067,753 | | | $ | — | | | $ | — | | | $ | 604,067,753 | |
Small-Mid Cap Fund | | | | | | | | | | | | | | | | |
Common Stocks* | | $ | 2,198,939,613 | | | $ | — | | | $ | — | | | $ | 2,198,939,613 | |
Registered Investment Companies | | | 184,964,852 | | | | — | | | | — | | | | 184,964,852 | |
Total | | $ | 2,383,904,465 | | | $ | — | | | $ | — | | | $ | 2,383,904,465 | |
Mid Cap Fund | | | | | | | | | | | | | | | | |
Common Stocks* | | $ | 274,591,695 | | | $ | — | | | $ | — | | | $ | 274,591,695 | |
Registered Investment Companies | | | 13,633,779 | | | | — | | | | — | | | | 13,633,779 | |
Total | | $ | 288,225,474 | | | $ | — | | | $ | — | | | $ | 288,225,474 | |
Large Cap Fund | | | | | | | | | | | | | | | | |
Common Stocks* | | $ | 12,224,743,071 | | | $ | — | | | $ | — | | | $ | 12,224,743,071 | |
Registered Investment Companies | | | 176,285,488 | | | | — | | | | — | | | | 176,285,488 | |
Total | | $ | 12,401,028,559 | | | $ | — | | | $ | — | | | $ | 12,401,028,559 | |
Large Cap Concentrated Fund | | | | | | | | | | | | | | | | |
Common Stocks* | | $ | 17,439,016 | | | $ | — | | | $ | — | | | $ | 17,439,016 | |
Registered Investment Companies | | | 507,574 | | | | — | | | | — | | | | 507,574 | |
Total | | $ | 17,946,590 | | | $ | — | | | $ | — | | | $ | 17,946,590 | |
All Cap Select Fund | | | | | | | | | | | | | | | | |
Common Stocks* | | $ | 371,494,790 | | | $ | — | | | $ | — | | | $ | 371,494,790 | |
Registered Investment Companies | | | 12,010,013 | | | | — | | | | — | | | | 12,010,013 | |
Total | | $ | 383,504,803 | | | $ | — | | | $ | — | | | $ | 383,504,803 | |
DIAMOND HILL FUNDS | ANNUAL REPORT | DECEMBER 31, 2021 | DIAMOND-HILL.COM 125 |
Diamond Hill Funds
Notes to Financial Statements (Continued)
December 31, 2021
| | | Level 1 -
Quoted Prices | | | Level 2 - Other
Significant
Observable
Inputs | | | Level 3 -
Significant
Unobservable
Inputs | | | Total | |
Long-Short Fund | | | | | | | | | | | | | | | | |
Common Stocks* | | $ | 1,806,461,833 | | | $ | — | | | $ | — | | | $ | 1,806,461,833 | |
Registered Investment Companies | | | 527,013,941 | | | | — | | | | — | | | | 527,013,941 | |
Total | | $ | 2,333,475,774 | | | $ | — | | | $ | — | | | $ | 2,333,475,774 | |
International Fund | | | | | | | | | | | | | | | | |
Common Stocks | | $ | 20,106,527 | | | $ | 32,574,805 | | | $ | — | | | $ | 52,681,332 | |
Warrants | | | 9,120 | | | | — | | | | — | | | | 9,120 | |
Registered Investment Companies | | | 3,209,202 | | | | — | | | | — | | | | 3,209,202 | |
Total | | $ | 23,324,849 | | | $ | 32,574,805 | | | $ | — | | | $ | 55,899,654 | |
Short Duration Fund | | | | | | | | | | | | | | | | |
Corporate Credit* | | $ | — | | | $ | 86,390,666 | | | $ | — | | | $ | 86,390,666 | |
Securitized* | | | — | | | | 1,275,855,470 | | | | — | | | | 1,275,855,470 | |
Treasury | | | — | | | | 75,698,047 | | | | — | | | | 75,698,047 | |
Registered Investment Companies | | | 95,921,259 | | | | — | | | | — | | | | 95,921,259 | |
Total | | $ | 95,921,259 | | | $ | 1,437,944,183 | | | $ | — | | | $ | 1,533,865,442 | |
Core Bond Fund | | | | | | | | | | | | | | | | |
Corporate Credit* | | $ | — | | | $ | 69,119,748 | | | $ | — | | | $ | 69,119,748 | |
Government Related* | | | — | | | | 803,680 | | | | — | | | | 803,680 | |
Securitized* | | | — | | | | 244,411,639 | | | | — | | | | 244,411,639 | |
Treasury | | | — | | | | 78,461,717 | | | | — | | | | 78,461,717 | |
Registered Investment Companies | | | 24,960,244 | | | | — | | | | — | | | | 24,960,244 | |
Total | | $ | 24,960,244 | | | $ | 392,796,784 | | | $ | — | | | $ | 417,757,028 | |
Investments in Securities Sold Short (Liabilities) | | | | | | | | | | | | |
Long-Short Fund | | | | | | | | | | | | | | | | |
Common Stocks* | | $ | (614,950,582 | ) | | $ | — | | | $ | — | | | $ | (614,950,582 | ) |
Total | | $ | (614,950,582 | ) | | $ | — | | | $ | — | | | $ | (614,950,582 | ) |
* | See Schedule of Investments and Schedule of Investments Sold Short for industry classification. |
There were no transfers into or out of Level 3 for the year or period ended December 31, 2021.
Short sales — The Long-Short Fund and International Fund are permitted to make short sales of securities. Short sales are effective when it is believed that the price of a particular security will decline and involves the sale of a security that the Fund does not own in hope of purchasing the same security at a later date at a lower price. To make delivery to the buyer, a Fund must borrow the security, and the Fund is obligated to return the security to the lender, which is accomplished by a later purchase of the security by the Fund. Cash received from short sales and other liquid securities are maintained by the custodian and are used as collateral. Cash collateral is shown as “Cash deposits with custodian for securities sold short” on the Statements of Assets & Liabilities and “Segregated Cash With Custodian” on the Schedules of Investments. Liquid securities pledged as collateral are noted on the Schedules of Investments.
126 DIAMOND HILL FUNDS | ANNUAL REPORT | DECEMBER 31, 2021 | DIAMOND-HILL.COM |
Diamond Hill Funds
Notes to Financial Statements (Continued)
December 31, 2021
A Fund will incur a loss as a result of a short sale if the price of the security increases between the date of the short sale and the date on which the Fund purchases the security to replace the borrowed security. Although a Fund’s gain is limited to the amount at which it sold a security short, its potential loss is not limited. The use of short sales may cause a Fund to have higher expenses (specifically dividend expenses) than those of other equity mutual funds. Short sales are speculative transactions and involve special risks, including greater reliance on the ability of the Funds’ investment adviser, Diamond Hill Capital Management, Inc. (“DHCM”), to accurately anticipate the future value of a security.
A Fund may also incur stock loan fees which represent the cost of borrowing securities used for short sale transactions. A Fund may also earn rebates as an element of the custodian arrangement, which are recorded as an offset to stock loan fees on short sales transactions. The stock loan fees on short sales are recognized on the Statements of Operations. In the event that rebates exceed the stock loan fees on short sales, the net rebates are recognized as a component of investment income on the Statements of Operations.
Securities lending — Under the terms of the securities lending agreement with State Street Bank and Trust Company (“State Street���), State Street is authorized to loan securities on behalf of the Funds to approved borrowers. The contractual maturity of securities lending transactions is on an overnight and continuous basis. In exchange, the Funds receive cash and/or U.S. Treasury and government agency securities as collateral in the amount of at least 100% of the value of the securities loaned. Any collateral shortfalls due to changes in security market prices are adjusted the next business day. The cash collateral is invested in short-term instruments as noted in each Fund’s Schedule of Investments. Although risk is mitigated by the collateral, the Funds could experience a delay in recovering their securities and possible loss of income or value if the borrower fails to return them. The agreement indemnifies the Funds from losses incurred in the event of a borrower’s material default of the terms and conditions of the borrower agreement. The agreement provides that after predetermined rebates to borrowers, the Funds each retain a portion of their respective net securities lending income and pay State Street the remaining portion. The Funds manage credit exposure arising from these lending transactions by, in appropriate circumstances, entering into a master netting agreement and collateral agreement with State Street that provide the Funds, in the event of default (such as bankruptcy or borrower’s failure to pay or perform), the right to net rights and obligations under such agreements and liquidate and set off collateral against the net amount owed to the Funds.
DIAMOND HILL FUNDS | ANNUAL REPORT | DECEMBER 31, 2021 | DIAMOND-HILL.COM 127 |
Diamond Hill Funds
Notes to Financial Statements (Continued)
December 31, 2021
As of December 31, 2021, the fair value of securities on loan and the collateral held were as follows:
| | | | | | | Fair Value of Collateral | |
| | | Fair Value of
Securities
Loaned | | | Cash Collateral | | | Non-Cash
Collateral* | | | Total Collateral | |
Small Cap Fund | | $ | 36,498,982 | | | $ | 35,407,806 | | | $ | 1,748,772 | | | $ | 37,156,578 | |
Small-Mid Cap Fund | | | 108,883,641 | | | | 99,592,542 | | | | 11,472,504 | | | | 111,065,046 | |
Mid Cap Fund | | | 1,559,733 | | | | 1,589,392 | | | | — | | | | 1,589,392 | |
Large Cap Fund | | | 141,089,479 | | | | 35,782,250 | | | | 108,914,057 | | | | 144,696,307 | |
All Cap Select Fund | | | 660 | | | | 665 | | | | — | | | | 665 | |
Long-Short Fund | | | 345,170,733 | | | | 353,432,836 | | | | — | | | | 353,432,836 | |
International Fund | | | 416,820 | | | | 359,632 | | | | 65,449 | | | | 425,081 | |
Short Duration Fund | | | 34,452,998 | | | | 35,236,950 | | | | — | | | | 35,236,950 | |
Core Bond Fund | | | 18,890,580 | | | | 19,357,714 | | | | — | | | | 19,357,714 | |
* | These securities are held for the benefit of the Funds at the Funds’ custodian. The Funds cannot repledge or resell this collateral. As such, collateral is excluded from the Statements of Assets & Liabilities. |
Security transactions — Throughout the reporting period, investment transactions are generally recorded on trade date but no later than the first business day following trade date. For financial reporting purposes, investments are recorded on trade date. The specific identification method is used for determining realized gains or losses for financial statements and income tax purposes. Dividend income and expense are recognized on the ex-dividend date and interest income is recognized on an accrual basis. Non-cash dividends included in dividend income, if any, are recorded at the fair market value of the securities received. Taxes on foreign dividends and/or capital gains have been recorded for in accordance with the Funds’ understanding of the applicable country’s tax rules and rates. Discounts and premiums on securities purchased are amortized using the daily effective yield method and included in interest income. The Funds record distributions received from investments in real estate investment trusts (also known as “REITs”) and partnerships in excess of income from underlying investments as a reduction of cost of investments and/or realized gain. Such amounts are based on estimates if actual amounts are not available, and actual amounts of income, realized gain and return of capital may differ from the estimated amounts. The Funds adjust the estimated amounts once the issuers provide information about the actual composition of the distributions. Interest only stripped mortgage-backed securities (“IO Strips”) are securities that receive only interest payments from a pool of mortgage loans. Little to no principal will be received by the Funds upon maturity of an IO Strip. Periodic adjustments are recorded to reduce the cost of the security until maturity, which are included in interest income.
Share valuation — The NAV per share of each class of shares of each Fund is calculated daily by dividing the total value of a Fund’s assets attributable to that class, less liabilities attributable to that class, by the number of shares of that class outstanding.
Income taxes — The Funds may be subject to taxes imposed by countries in which they invest. Such taxes are generally based on income and/or capital gains earned or repatriated. Taxes are accrued and applied to net investment income, net realized gains and unrealized appreciation as such income and/or gains are earned.
128 DIAMOND HILL FUNDS | ANNUAL REPORT | DECEMBER 31, 2021 | DIAMOND-HILL.COM |
Diamond Hill Funds
Notes to Financial Statements (Continued)
December 31, 2021
Each Fund has complied and intends to continue to comply with the requirements of the Internal Revenue Code that are applicable to regulated investment companies and to distribute substantially all of its taxable net investment income and any net realized capital gains to its shareholders.
The Funds recognize tax benefits or expenses of uncertain tax positions only when the position is “more likely than not” to be sustained assuming examination by tax authorities. Management of the Funds has reviewed tax positions taken in tax years that remain subject to examination by all major tax jurisdictions, including federal (i.e., the previous three tax year ends and the interim tax period since then, as applicable), and has concluded that no provision for unrecognized tax benefits or expenses is required in these financial statements and does not expect this to change over the next twelve months. The Funds recognize interest and penalties, if any, related to unrecognized tax benefits as income tax expense on the Statements of Operations. During the year ended December 31, 2021, the Funds did not incur any interest or penalties.
Distributions to shareholders — Dividends from net investment income are declared and paid monthly for the Short Duration Fund and Core Bond Fund. Dividends from net investment income are declared and paid on an annual basis for the Small Cap Fund, Small-Mid Cap Fund, Mid Cap Fund, Large Cap Fund, Large Cap Concentrated Fund, All Cap Select Fund, Long-Short Fund and International Fund. Dividends are declared separately for each class. No class has preferential dividend rights; differences in per share rates are due to differences in the expenses of each class. Net realized capital gains, if any, are distributed at least annually. Distributions from net investment income and from net capital gains are determined in accordance with U.S. income tax regulations, which may differ from GAAP. These differences are primarily due to differing treatments for paydown gains and losses on mortgage-backed securities and deferrals of certain losses. Permanent book and tax basis differences are reclassified among the components of net assets. Certain Funds may utilize earnings and profits distributed to shareholders on redemption of shares as part of the dividends paid deduction for income tax purposes.
Allocations — Investment income earned, realized capital gains and losses, and unrealized appreciation and depreciation are allocated daily to each class of shares of a Fund based upon its proportionate share of total net assets of the Fund. Class specific expenses are charged directly to the class incurring the expense. Common expenses, which are not attributable to a specific class, are allocated daily to each class of shares based upon its proportionate share of total net assets of the Fund. Expenses not directly billed to a Fund are allocated proportionally among all Funds daily in relation to net assets of each Fund or another reasonable measure.
Foreign securities risk — Investing in non-U.S. securities may entail risk due to foreign economic and political developments; this risk may be higher when investing in emerging markets. Changes in currency exchange rates and differences in accounting and taxation policies outside the U.S. can raise or lower returns.
Foreign currency translation — The books and records of the Funds are maintained in U.S. dollars. Investment securities and other assets and liabilities denominated in a foreign currency are translated into U.S. dollars on the date of valuation. The Funds do not isolate that portion of realized or unrealized gains and losses resulting from changes in the foreign
DIAMOND HILL FUNDS | ANNUAL REPORT | DECEMBER 31, 2021 | DIAMOND-HILL.COM 129 |
Diamond Hill Funds
Notes to Financial Statements (Continued)
December 31, 2021
exchange rate from fluctuations arising from changes in the market prices of the securities. These gains and losses are included in net realized and unrealized gains (losses) on investments on the Statements of Operations. Net realized and unrealized gains (losses) on foreign currency transactions represent net foreign exchange gains or losses from foreign currency exchange contracts, disposition of foreign currencies, currency gains or losses realized between trade and settlement dates on securities transactions and the difference between the amount of the investment income and foreign withholding taxes recorded on the Funds’ books and the U.S. dollar equivalent amounts actually received or paid.
Investment Transactions
For the year or period ended December 31, 2021, purchases and sales (including maturities) of investment securities (excluding short-term securities, U.S. government obligations and in-kind transactions) were as follows:
| | | Purchases | | | Sales | |
Small Cap Fund | | $ | 113,643,924 | | | $ | 234,761,352 | |
Small-Mid Cap Fund | | | 292,452,326 | | | | 516,541,592 | |
Mid Cap Fund | | | 32,185,870 | | | | 65,852,250 | |
Large Cap Fund | | | 4,295,170,108 | | | | 2,347,590,690 | |
Large Cap Concentrated Fund | | | 17,475,178 | | | | 2,375,436 | |
All Cap Select Fund | | | 191,220,823 | | | | 238,665,344 | |
Long-Short Fund | | | 748,124,279 | | | | 1,353,018,710 | |
International Fund | | | 42,570,132 | | | | 8,624,075 | |
Short Duration Fund | | | 1,055,664,766 | | | | 554,758,942 | |
Core Bond Fund | | | 221,324,766 | | | | 140,542,576 | |
The Funds pay commissions on the purchase and sale of investment securities. The commissions are treated as transaction costs and, therefore, are included as part of the cost of purchases or net proceeds on the sale of investment securities and are not included in the presentation of Fund expenses on the Statements of Operations. The Funds paid the following commissions during the year or period ended December 31, 2021:
| | | Total
Commissions | | | Commissions
as a % of
Average Net
Assets | |
Small Cap Fund | | $ | 180,008 | | | | 0.03 | % |
Small-Mid Cap Fund | | | 320,182 | | | | 0.01 | % |
Mid Cap Fund | | | 29,658 | | | | 0.01 | % |
Large Cap Fund | | | 1,786,054 | | | | 0.02 | % |
Large Cap Concentrated Fund | | | 4,155 | | | | 0.03 | % |
All Cap Select Fund | | | 219,323 | | | | 0.06 | % |
Long-Short Fund | | | 591,945 | | | | 0.03 | % |
International Fund | | | 56,538 | | | | 0.22 | % |
130 DIAMOND HILL FUNDS | ANNUAL REPORT | DECEMBER 31, 2021 | DIAMOND-HILL.COM |
Diamond Hill Funds
Notes to Financial Statements (Continued)
December 31, 2021
Investment Advisory Fees and Other Transactions with Affiliates
As of December 31, 2021, the Small Cap Fund, Small-Mid Cap Fund, Mid Cap Fund, Large Cap Fund, Large Cap Concentrated Fund, All Cap Select Fund, Long-Short Fund, International Fund, Short Duration Fund and Core Bond Fund each receive investment management and advisory services from DHCM under management agreements that provide for fees to be paid monthly at an annual rate of 0.80%, 0.75%, 0.60%, 0.50%, 0.50%, 0.70%, 0.90%, 0.65%, 0.35% and 0.30%, respectively, of each Fund’s average daily net assets. The management agreements are subject to annual approval by the Board of Trustees. In addition, each Fund has entered into an administrative services agreement whereby DHCM is paid a fee monthly at an annual rate of 0.21% for Investor shares, 0.17% for Class I shares and 0.05% for Class Y shares of each class’ average daily net assets. These administrative fees are used to pay most of the Funds’ operating expenses except advisory fees, distribution fees, custody fees, brokerage fees, taxes, interest and dividend expense on securities sold short and extraordinary expenses.
Pursuant to Rule 12b-1 under the 1940 Act, the Trust has adopted a distribution plan on behalf of each Fund’s Investor shares (the “Plan”). Under the Plan, Investor shares pay a distribution fee monthly at an annual rate of 0.25% of Investor shares average daily net assets. Class I and Class Y shares are not subject to any distribution fees. The Trust has entered into a Distribution Agreement on behalf of the Funds with Foreside Financial Services, LLC (“Distributor”). Pursuant to the Distribution Agreement, the Distributor acts as principal underwriter of each Fund’s shares.
DHCM, as the financing agent for Class C shares, received contingent deferred sales charges relating to the redemptions of Class C shares of the Funds during the year ended December 31, 2021 as follows:
The Funds may invest in one or more Diamond Hill Funds. The Funds’ adviser has contractually agreed to waive fees in the pro-rata amount of the management fee charged by the underlying Diamond Hill Fund on each Fund’s investment in such other Diamond Hill Funds. This fee waiver is accrued daily and settled monthly. During the year ended December 31, 2021, the Funds reduced investment advisory fees as follows:
Small-Mid Cap Fund | | $ | 94,675 | |
Mid Cap Fund | | | 5,780 | |
Long-Short Fund | | | 115,380 | |
The Small-Mid Cap Fund, Mid Cap Fund and Long-Short Fund each own Class Y shares of the Short Duration Fund, thereby making the Short Duration Fund an affiliated company as defined by the 1940 Act.
DIAMOND HILL FUNDS | ANNUAL REPORT | DECEMBER 31, 2021 | DIAMOND-HILL.COM 131 |
Diamond Hill Funds
Notes to Financial Statements (Continued)
December 31, 2021
Information regarding the Funds’ holdings in the Short Duration Fund during the year ended December 31, 2021 is as follows:
Affiliated Fund | | Small-Mid
Cap Fund | | | Mid Cap
Fund | | | Long-Short
Fund | |
Diamond Hill Short Duration Securitized Bond Fund | | | | |
Value, December 31, 2020 | | $ | 26,643,319 | | | $ | 1,626,675 | | | $ | 34,836,878 | |
Purchases | | | 738,002 | | | | 45,058 | | | | 901,733 | |
Sales | | | — | | | | — | | | | (5,000,000 | ) |
Realized Gains | | | — | | | | — | | | | 62,759 | |
Change in Unrealized Appreciation (Depreciation) | | | 22,235 | | | | 1,358 | | | | 10,722 | |
Value, December 31, 2021 | | $ | 27,403,556 | | | $ | 1,673,091 | | | $ | 30,812,092 | |
Income Distributions | | $ | 731,783 | | | $ | 44,678 | | | $ | 894,741 | |
Long-Term Capital Gain Distributions | | $ | 6,219 | | | $ | 380 | | | $ | 6,992 | |
DHCM is a majority shareholder of the Large Cap Concentrated and International Funds.
The Officers of the Trust are affiliated with DHCM. Such Officers receive no compensation from the Funds for serving in their respective roles.
Trustee Fees
The Independent Trustees are compensated for their services to the Funds by DHCM as part of the administration services agreement. The Independent Trustees were paid $486,000 in fees during the year or period ended December 31, 2021. In addition, DHCM reimburses Trustees for out-of-pocket expenses incurred in conjunction with attendance of meetings.
Commitments and Contingencies
The Funds indemnify the Trust’s Officers and Trustees for certain liabilities that might arise from their performance of their duties to the Funds. Additionally, in the normal course of business, the Funds enter into contracts that contain a variety of representations and warranties and which provide general indemnifications. The Funds’ maximum exposure under these arrangements is unknown, as this would involve future claims that may be made against the Funds that have not yet occurred. However, based on experience, the Funds expect the risk of loss to be remote.
Federal Tax Information
The amount and character of income and capital gain distributions paid by the Funds are determined in accordance with Federal income tax regulations, which may differ from GAAP.
132 DIAMOND HILL FUNDS | ANNUAL REPORT | DECEMBER 31, 2021 | DIAMOND-HILL.COM |
Diamond Hill Funds
Notes to Financial Statements (Continued)
December 31, 2021
The tax character of distributions paid during the years or period ended December 31, 2021 and 2020 was as follows:
| | | Small Cap Fund | | | Small-Mid Cap Fund | | | Mid Cap Fund | |
| | | 2021 | | | 2020 | | | 2021 | | | 2020 | | | 2021 | | | 2020 | |
Distributions paid from: | | | | | | | | | | | | | | | | | | | | | | | | |
Ordinary income | | $ | 4,964,628 | | | $ | 2,925,606 | | | $ | 11,018,560 | | | $ | 13,930,483 | | | $ | 1,591,509 | | | $ | 1,495,087 | |
Long-term capital gains | | | 82,378,831 | | | | — | | | | 115,529,321 | | | | 786,910 | | | | 16,469 | | | | 376,407 | |
Total distributions | | $ | 87,343,459 | | | $ | 2,925,606 | | | $ | 126,547,881 | | | $ | 14,717,393 | | | $ | 1,607,978 | | | $ | 1,871,494 | |
| | | Large Cap Fund | | | Large Cap
Concentrated
Fund | | | All Cap Select Fund | |
| | | 2021 | | | 2020 | | | 2021 | | | 2021 | | | 2020 | |
Distributions paid from: | | | | | | | | | | | | | | | | | | | | |
Ordinary income | | $ | 168,926,355 | | | $ | 86,692,884 | | | $ | 259,770 | | | $ | 12,924,865 | | | $ | 1,790,659 | |
Long-term capital gains | | | 715,118,746 | | | | 192,809,037 | | | | — | | | | 32,261,065 | | | | — | |
Total distributions | | $ | 884,045,101 | | | $ | 279,501,921 | | | $ | 259,770 | | | $ | 45,185,930 | | | $ | 1,790,659 | |
| | | Long-Short Fund | | | International Fund | | | Short Duration Fund | |
| | | 2021 | | | 2020 | | | 2021 | | | 2020 | | | 2021 | | | 2020 | |
Distributions paid from: | | | | | | | | | | | | | | | | | | | | | | | | |
Ordinary income | | $ | — | | | $ | 8,842,071 | | | $ | 1,499,231 | | | $ | 109,630 | | | $ | 35,095,985 | | | $ | 30,109,298 | |
Long-term capital gains | | | 200,770,964 | | | | 15,843,708 | | | | 599,477 | | | | 79,270 | | | | 376,715 | | | | — | |
Total distributions | | $ | 200,770,964 | | | $ | 24,685,779 | | | $ | 2,098,708 | | | $ | 188,900 | | | $ | 35,472,700 | | | $ | 30,109,298 | |
| | | Core Bond Fund | |
| | | 2021 | | | 2020 | |
Distributions paid from: | | | | | | | | |
Ordinary income | | $ | 8,952,821 | | | $ | 5,006,585 | |
Long-term capital gains | | | — | | | | — | |
Total distributions | | $ | 8,952,821 | | | $ | 5,006,585 | |
The following information is computed on a tax basis for each item as of December 31, 2021:
| | | Small Cap
Fund | | | Small-Mid
Cap Fund | | | Mid Cap Fund | | | Large Cap
Fund | |
Net unrealized appreciation on portfolio investments | | $ | 272,053,825 | | | $ | 797,101,753 | | | $ | 93,992,587 | | | $ | 3,808,484,562 | |
Undistributed ordinary income | | | — | | | | 200,223 | | | | — | | | | 2,246,248 | |
Undistributed capital gains | | | 8,889,551 | | | | 5,507,103 | | | | 789,411 | | | | 116,803,920 | |
Distributable earnings | | $ | 280,943,376 | | | $ | 802,809,079 | | | $ | 94,781,998 | | | $ | 3,927,534,730 | |
DIAMOND HILL FUNDS | ANNUAL REPORT | DECEMBER 31, 2021 | DIAMOND-HILL.COM 133 |
Diamond Hill Funds
Notes to Financial Statements (Continued)
December 31, 2021
| | | Large Cap
Concentrated
Fund | | | All Cap
Select Fund | | | Long-Short
Fund | | | International
Fund | |
Net unrealized appreciation on portfolio investments | | $ | 2,329,308 | | | $ | 131,060,003 | | | $ | 684,497,840 | | | $ | 2,679,259 | |
Undistributed ordinary income | | | — | | | | 341,941 | | | | — | | | | — | |
Undistributed capital gains | | | — | | | | 4,944,724 | | | | 51,189,371 | | | | 133,991 | |
Post October capital losses | | | (137,902 | ) | | | — | | | | — | | | | — | |
Distributable earnings | | $ | 2,191,406 | | | $ | 136,346,668 | | | $ | 735,687,211 | | | $ | 2,813,250 | |
| | | Short Duration
Fund | | | Core Bond
Fund | |
Net unrealized appreciation (depreciation) on portfolio investments | | $ | 6,369,524 | | | $ | (2,129,594 | ) |
Post October capital losses | | | (153,846 | ) | | | — | |
Accumulated capital and other losses | | | — | | | | (476,484 | ) |
Distributable earnings (accumulated deficit) | | $ | 6,215,678 | | | $ | (2,606,078 | ) |
Post October capital losses listed above incurred after October 31, 2021 and within the taxable year, are deemed to arise on the first day of the Funds’ next taxable year.
As of December 31, 2021, the Funds’ federal tax cost of portfolio investments and net unrealized appreciation (depreciation) on portfolio investments including short sales, where applicable, were as follows:
| | | Small Cap
Fund | | | Small-Mid
Cap Fund | | | Mid Cap Fund | | | Large Cap
Fund | |
Tax cost of portfolio investments | | $ | 332,013,928 | | | $ | 1,586,802,712 | | | $ | 194,232,887 | | | $ | 8,592,543,997 | |
Gross unrealized appreciation | | | 276,567,455 | | | | 829,878,638 | | | | 98,647,070 | | | | 3,951,899,575 | |
Gross unrealized depreciation | | | (4,513,630 | ) | | | (32,776,885 | ) | | | (4,654,483 | ) | | | (143,415,013 | ) |
Net unrealized appreciation on portfolio investments | | $ | 272,053,825 | | | $ | 797,101,753 | | | $ | 93,992,587 | | | $ | 3,808,484,562 | |
| | | Large Cap
Concentrated
Fund | | | All Cap
Select Fund | | | Long-Short
Fund | | | International
Fund | |
Tax cost of portfolio investments | | $ | 15,617,282 | | | $ | 252,444,800 | | | $ | 1,034,027,352 | | | $ | 53,220,395 | |
Gross unrealized appreciation | | | 2,534,099 | | | | 134,585,087 | | | | 799,138,001 | | | | 5,009,570 | |
Gross unrealized depreciation | | | (204,791 | ) | | | (3,525,084 | ) | | | (114,640,161 | ) | | | (2,330,311 | ) |
Net unrealized appreciation on portfolio investments | | $ | 2,329,308 | | | $ | 131,060,003 | | | $ | 684,497,840 | | | $ | 2,679,259 | |
134 DIAMOND HILL FUNDS | ANNUAL REPORT | DECEMBER 31, 2021 | DIAMOND-HILL.COM |
Diamond Hill Funds
Notes to Financial Statements (Continued)
December 31, 2021
| | | Short Duration
Fund | | | Core Bond
Fund | |
Tax cost of portfolio investments | | $ | 1,527,495,918 | | | $ | 419,886,622 | |
Gross unrealized appreciation | | | 23,481,927 | | | | 5,956,077 | |
Gross unrealized depreciation | | | (17,112,403 | ) | | | (8,085,671 | ) |
Net unrealized appreciation (depreciation) on portfolio investments | | $ | 6,369,524 | | | $ | (2,129,594 | ) |
The difference between book basis and tax basis net unrealized appreciation (depreciation) is attributable primarily to the tax deferral of losses on wash sales.
For the latest tax year ended December 31, 2021, the following Fund has capital loss carry forwards (“CLCFs”) as summarized below.
CLCFs not subject to expiration:
| | | Core Bond
Fund | |
No expiration - short-term | | $ | 476,484 | |
No expiration - long-term | | | — | |
| | | $ | 476,484 | |
During the year ended December 31, 2021, Small Mid-Cap Fund utilized $3,918,871 of short-term CLCFs, Mid Cap Fund utilized $8,200,674 of short-term CLCFs and $4,178,742 of long-term CLCFs, All Cap Select Fund utilized $54,851 of short-term CLCFs, Long-Short Fund utilized $118,542 of short-term CLCFs, International Fund utilized $112,610 of short-term CLCFs and $87,147 of long-term CLCFs and Short Duration Fund utilized $4,821,867 of short-term CLCFs and $2,442,921 of long-term CLCFs. These CLCFs were utilized to offset current year realized gains.
Reclassifications of capital accounts – Reclassifications result primarily from utilization of earnings and profits on shareholder redemptions and net operating losses. The following reclassifications have no impact on the net assets or NAV per share of the Funds and are designed to present each Fund’s capital accounts on a tax basis:
| | | Paid-In
Capital | | | Distributable
Earnings | |
Small Cap Fund | | $ | 16,511,015 | | | $ | (16,511,015 | ) |
Small-Mid Cap Fund | | | 12,874,771 | | | | (12,874,771 | ) |
Mid Cap Fund | | | 3,575 | | | | (3,575 | ) |
Large Cap Fund | | | 107,464,718 | | | | (107,464,718 | ) |
Large Cap Concentrated Fund | | | (193 | ) | | | 193 | |
All Cap Select Fund | | | 9,923,630 | | | | (9,923,630 | ) |
Long-Short Fund | | | 27,159,734 | | | | (27,159,734 | ) |
International Fund | | | 47,674 | | | | (47,674 | ) |
Short Duration Fund | | | (30,956 | ) | | | 30,956 | |
Core Bond Fund | | | (14,637 | ) | | | 14,637 | |
DIAMOND HILL FUNDS | ANNUAL REPORT | DECEMBER 31, 2021 | DIAMOND-HILL.COM 135 |
Diamond Hill Funds
Notes to Financial Statements (Continued)
December 31, 2021
In-Kind Redemption Transactions
During the year ended December 31, 2021, Large Cap Fund realized $33,460,273 of net capital gains resulting from in-kind redemptions (redemptions in which shareholders who redeemed Fund shares received investment securities held by the Fund rather than cash). The Fund recognizes a gain on in-kind redemptions to the extent that the value of the distributed investment securities on the date of redemption exceeds the cost of those investment securities. Such gains are not taxable to the Fund and are not required to be distributed to shareholders. The Fund has reclassified this amount against paid-in capital on the Statements of Assets and Liabilities. Such reclassification, the result of permanent differences between the financial statement and income tax reporting requirements, had no effect on the Fund’s net assets or NAV per share.
Borrowings
The Small Cap Fund, Small-Mid Cap Fund, Mid Cap Fund, Large Cap Fund, Large Cap Concentrated Fund, All Cap Select Fund, Long-Short Fund, International Fund, Short Duration Fund and Core Bond Fund each has an unsecured line of credit up to 20.0%, 20.0%, 20.0%, 33.3%, 20.0%, 25.0%, 15.0%, 20.0%, 20.0% and 20.0%, respectively, of its net assets, with a total maximum of $40,000,000.
Borrowings under the agreement bear interest at the sum of 0.10% plus the higher of Federal Funds Effective Rate or the Overnight Bank Funding Rate plus 1.25%. The line of credit is available until June 1, 2022, unless extended, when any advances are to be repaid. During the year or period ended December 31, 2021, no amounts were drawn from the available line.
In accordance with an exemptive order (the “Order”) from the U.S. Securities and Exchange Commission (“SEC”), the Funds may participate in a joint lending and borrowing facility for temporary purposes (the “Interfund Lending Program”), subject to compliance with the terms and conditions of the Order, and to the extent permitted by each Fund’s investment policies and restrictions. A lending fund may lend in aggregate up to 15% of its net assets, but may not lend more than 5% of its net assets to anyone borrowing fund through the Interfund Lending Program. A borrowing fund may not borrow through the Interfund Lending Program or from any other source more than 33 1/3% of its total assets (or any lower threshold provided for by the fund’s investment restrictions). If a borrowing fund’s total outstanding borrowings exceed 10% of its total assets, each of its outstanding interfund loans will be subject to collateralization of at least 102% of the outstanding principal value of the loan. All interfund loans are for temporary or emergency purposes and the interest rate to be charged will be the average of the highest current overnight repurchase agreement rate available to a lending fund and the bank loan rate, as calculated according to a formula established by the Board. During the year ended December 31, 2021, none of the Funds participated in the Interfund Lending Program.
136 DIAMOND HILL FUNDS | ANNUAL REPORT | DECEMBER 31, 2021 | DIAMOND-HILL.COM |
Diamond Hill Funds
Notes to Financial Statements (Continued)
December 31, 2021
Other Matters
The global spread of novel coronavirus disease (COVID-19) was declared a pandemic by the World Health Organization. This pandemic has resulted in significant disruptions to economies and markets, adversely impacting individual companies, sectors, industries, currencies, interest and inflation rates, credit ratings, and investor sentiment. COVID-19 has caused volatility, severe market dislocations and liquidity constraints in many markets, including markets for the securities the Funds hold, and may adversely affect the Funds’ investments and operations. The duration and extent of COVID-19 over the long-term cannot be reasonably estimated at this time. There have been no comparable recent events that provide guidance as to the effect the spread of COVID-19 as a global pandemic may have on the Funds’ financial performance. In addition, COVID-19 and governmental responses to COVID-19 may negatively impact the capabilities of the Funds’ service providers and disrupt the Funds’ operations. This pandemic may result in substantial market volatility and may adversely impact the prices and liquidity of a Fund’s investments. Management continues to monitor and evaluate this situation.
Subsequent Events
The Funds evaluated events from December 31, 2021 through the date that these financial statements were issued. There were no subsequent events to report that would have a material impact on the Funds’ financial statements.
DIAMOND HILL FUNDS | ANNUAL REPORT | DECEMBER 31, 2021 | DIAMOND-HILL.COM 137 |
Report of Independent Registered
Public Accounting Firm
To the Shareholders and Board of Trustees of
Diamond Hill Funds
Opinion on the Financial Statements
We have audited the accompanying statements of assets and liabilities, including the schedules of investments and investments sold short, of Diamond Hill Funds comprising the funds listed below (the “Funds”) as of December 31, 2021, the related statements of operations, the statements of changes in net assets, the related notes, and the financial highlights for each of the periods indicated below (collectively referred to as the “financial statements”). In our opinion, the financial statements present fairly, in all material respects, the financial position of the each of the Funds as of December 31, 2021, the results of their operations, the changes in net assets, and the financial highlights for each of the periods indicated below in conformity with accounting principles generally accepted in the United States of America.
Fund Name | Statements of
Operations | Statements of
Changes in Net
Assets | Financial Highlights |
Diamond Hill Small Cap Fund, Diamond Hill Small-Mid Cap Fund, Diamond Hill Mid Cap Fund, Diamond Hill Large Cap Fund, Diamond Hill All Cap Select Fund, Diamond Hill Long-Short Fund, Diamond Hill Short Duration Securitized Bond Fund, Diamond Hill Core Bond Fund | For the year ended December 31, 2021 | For the years ended December 31, 2021 and 2020 | For the years ended December 31, 2021, 2020, 2019, and 2018 |
Diamond Hill International Fund | For the year ended December 31, 2021 | For the years ended December 31, 2021 and 2020 | For the years ended December 31, 2021 and 2020, and for the period July 1, 2019 (commencement of operations) through December 31, 2019 |
Diamond Hill Large Cap Concentrated Fund | For the period February 26, 2021 (commencement of operations) through December 31, 2021 |
The Funds’ financial highlights for the years or periods ended December 31, 2017, were audited by other auditors whose report dated February 16, 2018, expressed an unqualified opinion on those financial highlights.
138 DIAMOND HILL FUNDS | ANNUAL REPORT | DECEMBER 31, 2021 | DIAMOND-HILL.COM |
Report of Independent Registered
Public Accounting Firm (Continued)
Basis for Opinion
These financial statements are the responsibility of the Funds’ management. Our responsibility is to express an opinion on the Funds’ financial statements based on our audits. We are a public accounting firm registered with the Public Company Accounting Oversight Board (United States) (“PCAOB”) and are required to be independent with respect to the Funds in accordance with the U.S. federal securities laws and the applicable rules and regulations of the Securities and Exchange Commission and the PCAOB.
We conducted our audits in accordance with the standards of the PCAOB. Those standards require that we plan and perform the audit to obtain reasonable assurance about whether the financial statements are free of material misstatement whether due to error or fraud.
Our audits included performing procedures to assess the risks of material misstatement of the financial statements, whether due to error or fraud, and performing procedures that respond to those risks. Such procedures included examining, on a test basis, evidence regarding the amounts and disclosures in the financial statements. Our procedures included confirmation of securities owned as of December 31, 2021, by correspondence with the custodian and brokers; when replies were not received from brokers, we performed other auditing procedures. Our audits also included evaluating the accounting principles used and significant estimates made by management, as well as evaluating the overall presentation of the financial statements. We believe that our audits provide a reasonable basis for our opinion.
We have served as the auditor of one or more funds advised by Diamond Hill Capital Management, Inc. since 2015.
COHEN & COMPANY, LTD.
Cleveland, Ohio
February 18, 2022
DIAMOND HILL FUNDS | ANNUAL REPORT | DECEMBER 31, 2021 | DIAMOND-HILL.COM 139 |
Diamond Hill Funds
Other Items
December 31, 2021 (Unaudited)
Proxy Voting
The investment adviser is responsible for exercising the voting rights associated with the securities purchased and held by the Funds. A description of the policies and procedures that the adviser uses in fulfilling this responsibility and information regarding how those proxies were voted during the twelve-month period ended June 30 are available without charge upon request by calling toll free number 1-888-226-5595, or through the Funds’ website, or on the Securities and Exchange Commission’s (“Commission”) website at www.sec.gov.
Portfolio Disclosure
The Trust files a complete listing of portfolio holdings for each Fund as of the end of the first and third quarters of each fiscal year on Part F to Form N-PORT. The complete listing is available on the Commission’s website. Monthly portfolio holdings are also available on www.diamond-hill.com.
Dividends Received Deduction
For corporate shareholders, the following percentages of ordinary dividends paid during the year or period ended December 31, 2021 qualify for the corporate dividends received deduction:
Small Cap Fund | | | 100.00 | % |
Small-Mid Cap Fund | | | 100.00 | % |
Mid Cap Fund | | | 100.00 | % |
Large Cap Fund | | | 100.00 | % |
Large Cap Concentrated Fund | | | 63.31 | % |
All Cap Select Fund | | | 49.91 | % |
Long-Short Fund | | | 0.00 | % |
International Fund | | | 0.00 | % |
Short Duration Fund | | | 0.00 | % |
Core Bond Fund | | | 0.00 | % |
Qualified Dividend Income
The Funds have designated the maximum amount allowable of their taxable income as qualified dividend income as provided in the Jobs and Growth Tax Relief Reconciliation Act of 2003. This amount was reflected on form 1099-DIV for the calendar year 2021.
140 DIAMOND HILL FUNDS | ANNUAL REPORT | DECEMBER 31, 2021 | DIAMOND-HILL.COM |
Diamond Hill Funds
Other Items
December 31, 2021 (Continued)
Capital Gain Distribution
For the year ended December 31, 2021, the following Funds designated long-term capital gain distributions:
Small Cap Fund | | | $98,889,846 | |
Small-Mid Cap Fund | | | 128,401,948 | |
Mid Cap Fund | | | 16,469 | |
Large Cap Fund | | | 789,810,528 | |
All Cap Select Fund | | | 42,184,695 | |
Long-Short Fund | | | 226,787,134 | |
International Fund | | | 647,150 | |
Short Duration Fund | | | 376,715 | |
International Fund intends to elect to pass through to shareholders the income tax credit for taxes paid to foreign countries. The Fund’s foreign source income per share was $0.304 and the foreign tax expense per share was $0.010. The pass-through of the foreign tax credit will only affect those persons who are shareholders on the dividend record date. These shareholders will receive more detailed information with their 2021 Form 1099-DIV.
Trustee Approval of Investment Advisory Agreement
Renewal of Management Agreement for All Funds
The Board of Trustees of Diamond Hill Funds (the “Trust”) requested and the Adviser provided a broad range of information in connection with its consideration of the continuance of the Amended and Restated Investment Management Agreement (“Management Agreement”) between the Trust and Diamond Hill Capital Management, Inc. (the “Adviser”), for each series of the Trust (each separately, a “Fund”). In approving the Management Agreement of the Trust, the Board considered a variety of factors, including those discussed below. The Board also considered other factors (including conditions and trends prevailing generally in the economy, the securities markets, and the industry) and did not treat any single factor as determinative, and each Trustee may have attributed different weights to different factors. The Board based its conclusions in part on its consideration of the advisory arrangements in prior years and the Board’s ongoing regular review of fund performance and operations throughout the year. The Board reviewed the information at regularly scheduled meetings on July 20, 2021, and August 19, 2021, and by unanimous vote approved continuation of the Management Agreement. In concluding to renew the Management Agreement, the Board discussed the following factors, on a Fund-by-Fund basis:
a) | Nature, Extent and Quality of Services. In considering the nature, extent, and quality of services provided by the Adviser to the Trust, the Board reviewed information provided by the Adviser relating to its operations and personnel, descriptions of its organizational and management structure, and information regarding the Adviser’s compliance and regulatory history, including its Form ADV. The Trustees considered the nature, extent and quality of the services provided by the Adviser under the Management Agreement, including a review of the services provided thereunder and the Adviser’s overall |
DIAMOND HILL FUNDS | ANNUAL REPORT | DECEMBER 31, 2021 | DIAMOND-HILL.COM 141 |
Diamond Hill Funds
Other Items
December 31, 2021 (Continued)
reputation, integrity, and mission to serve its clients through a disciplined intrinsic-value-based approach to investment that aligns the Adviser’s interests with those of its clients. The Trustees noted the qualifications of the investment staff and other key personnel of the Adviser and that the Adviser continues to invest significant resources in human capital to attract and retain top talent. The Trustees also reviewed the Adviser’s succession plan for key investment and management staff. In addition, the Trustees reviewed information related to the compensation structure for portfolio managers and other key investment personnel. Finally, the Trustees noted that the Adviser provides administrative services to the Trust under an Amended and Restated Administrative, Fund Accounting and Transfer Agency Services Agreement (“Administration Agreement”).
b) | Investment Performance of the Funds. In evaluating the performance of each Fund, the Board receives detailed performance information for each Fund and reviews it at its regularly scheduled meetings. In connection with the consideration of the advisory agreement, the Trustees reviewed each Fund’s absolute performance, performance relative to its passive benchmark, performance relative to a custom peer group, and performance relative to the Fund’s Morningstar category, each as of June 30, 2021. The Trustees concluded that the performance of each Fund is being monitored and reasonably addressed, where appropriate. |
c) | Reasonableness of Investment Advisory Fees. The Trustees noted that the contractual fee rate for each Fund under the Management Agreement was in line with or below the average and median rates of the applicable Fund’s Morningstar category. |
d) | Reasonableness of Total Expenses. The Trustees noted that with exception of two Funds, the total expenses for Class I and Class Y shares of all Funds were at or below the median total expenses of comparable funds within each Fund’s applicable Morningstar category. The total expenses for those two Funds were within 4 basis points of the median total expenses of comparable funds. As it relates to Investor Class, the total expenses are at or below the median total expenses of comparable funds with the applicable Fund’s Morningstar category for all except Short Duration Securitized Bond Fund, which was 8 basis points higher. Except for the Short Duration Securitized Bond Fund, the total expense ratio for the Investor shares, Class I and Class Y shares for all Funds is below the 50th percentile of the Morningstar peer group. |
e) | Reasonableness of Investment Advisory Fees as Compared to Fees Charged to Other Clients. The Trustees reviewed the fees paid by each of the Adviser’s other clients, as well as a summary of the differences in services provided and how these differences affect fees, including the difference between serving as an adviser versus a sub-adviser. With limited exceptions, the Trustees observed that the investment advisory fees charged by the Adviser to the Funds were comparable to the investment advisory fees the Adviser charges its other similarly managed accounts (i.e., separately managed accounts). |
f) | Profitability. The Trustees considered each Fund’s profitability to the Adviser and the Adviser’s methodology for calculating its profitability. The Trustees observed that the Adviser’s pre-tax profit margin under the Management Agreement represented a fair and entrepreneurial profit for managing the Funds. The Trustees discussed that the Adviser is also the administrator to the Funds and the Trustees reviewed a separate profitability |
142 DIAMOND HILL FUNDS | ANNUAL REPORT | DECEMBER 31, 2021 | DIAMOND-HILL.COM |
Diamond Hill Funds
Other Items
December 31, 2021 (Continued)
analysis relating to the administrative services provided to the Funds. The Trustees noted that the profit margin under the Administration Agreement represented a fair and entrepreneurial profit for serving as administrator to the Funds.
g) | Economies of Scale. The Trustees reviewed the potential extent to which economies of scale would be realized as each Fund grows and whether fee levels reflect these economies of scale for the benefit of Fund shareholders. They noted that while many advisory firms reduce fees as assets under management increase with predetermined break points, the Adviser has adopted a different strategy. The Trustees considered that rather than instituting break points, the Adviser has targeted its advisory fees to correspond to its mission to add value, meaning that rather than charging a lower fee on assets above a certain level, the Adviser prefers to close a strategy to new investors so that it can efficiently manage the Fund’s assets and attempt to fulfill its responsibility to add value to existing investors. The Trustees noted that two of the Funds currently are closed to most new investors. The Trustees also noted that the Adviser has a history of voluntarily reducing its fees under the Administration Agreement when asset growth allows for the sharing of economies of scale, with the most recent reduction having taken place on February 28, 2018. |
h) | Ancillary Benefits. The Trustees considered ancillary benefits received by the Adviser as a result of its relationship with the Funds, including the ability to negotiate favorable commissions rates and have access to research that benefits all of the Adviser’s clients and the ability to serve as sub-adviser to other mutual funds. The Trustees noted that as administrator to the Funds the Adviser is expected to earn fees from the Funds for providing administrative services. The fees were shown separately in the profitability analysis presented to the Trustees. |
In their deliberations, there was a comprehensive consideration of each of the factors above in connection with each Fund, and the Trustees, all of whom qualify as Independent Trustees under the 1940 Act, concluded the compensation to be received by the Adviser from each Fund was fair and reasonable and the continuance of the Management Agreement for all of the Funds was in the best interests of each Fund and its shareholders.
DIAMOND HILL FUNDS | ANNUAL REPORT | DECEMBER 31, 2021 | DIAMOND-HILL.COM 143 |
Diamond Hill Funds
Schedule of Shareholder Expenses
Hypothetical Example of a $1,000 Investment at Beginning of Period
(Unaudited)
As a Fund shareholder, you may incur two types of costs: (1) transaction costs, including wire redemption fees and sales charges (loads) as applicable; and (2) ongoing costs, including management fees; distribution and service (12b-1) fees; and other Fund expenses. These examples are intended to help you understand your ongoing costs (in dollars) of investing in a Fund and to compare these costs with the ongoing costs of investing in other mutual funds. Please note that the expenses shown in the tables are meant to highlight your ongoing costs only and do not reflect any transactional costs or other fees that may apply, such as sales charges and fees for low balance accounts. Therefore, the examples are useful in comparing ongoing costs only and will not help you determine the relative total cost of owning different funds. In addition, if these transactional costs and other fees were included, your costs would have been higher.
These examples are based on an investment of $1,000 invested at July 1, 2021 and held for the entire period from July 1, 2021 through December 31, 2021.
The Actual Expense example below provides information about actual account values and actual expenses. You may use this information, together with the amount you invested, to estimate the expenses that you paid over the period. Simply divide your account value by $1,000 (for example, an $8,600 account value divided by $1,000 = 8.6), then multiply the result by the number in the table under the heading entitled “Expenses paid during the period” to estimate the expenses you paid on your account during this period.
The Hypothetical Expense example below provides information about hypothetical account values and hypothetical expenses based on each Fund’s actual expense ratio and an assumed rate of return of 5% per year before expenses, which is not each Fund’s actual return. The hypothetical account values and expenses may not be used to estimate the actual ending account balance or expenses you paid for the period. You may use this information to compare the ongoing costs of investing in this Fund and other funds. To do so, compare this 5% hypothetical example with the 5% hypothetical examples that appear in the shareholder reports of the other funds.
| | Account value
at the beginning
of the period ($) | Account value
at the end
of the period ($) | Expenses paid
during
the period ($)* | Funds
annualized
expense
ratio (%) |
| Actual | Hypothetical | Actual | Hypothetical | Actual | Hypothetical | Actual |
Small Cap Fund |
Investor | 1,000.00 | 1,000.00 | 1,097.60 | 1,018.85 | 6.67 | 6.42 | 1.26% |
Class I | 1,000.00 | 1,000.00 | 1,099.00 | 1,020.31 | 5.14 | 4.94 | 0.97% |
Class Y | 1,000.00 | 1,000.00 | 1,099.60 | 1,020.92 | 4.50 | 4.34 | 0.85% |
Small-Mid Cap Fund |
Investor | 1,000.00 | 1,000.00 | 1,081.80 | 1,019.13 | 6.33 | 6.14 | 1.21% |
Class I | 1,000.00 | 1,000.00 | 1,083.20 | 1,020.59 | 4.81 | 4.66 | 0.92% |
Class Y | 1,000.00 | 1,000.00 | 1,083.70 | 1,021.19 | 4.18 | 4.05 | 0.80% |
Mid Cap Fund |
Investor | 1,000.00 | 1,000.00 | 1,088.90 | 1,019.87 | 5.57 | 5.39 | 1.06% |
Class I | 1,000.00 | 1,000.00 | 1,090.50 | 1,021.33 | 4.05 | 3.91 | 0.77% |
Class Y | 1,000.00 | 1,000.00 | 1,090.80 | 1,021.94 | 3.42 | 3.30 | 0.65% |
144 DIAMOND HILL FUNDS | ANNUAL REPORT | DECEMBER 31, 2021 | DIAMOND-HILL.COM |
Diamond Hill Funds
Schedule of Shareholder Expenses
Hypothetical Example of a $1,000 Investment at Beginning of Period
(Unaudited) (Continued)
| | Account value
at the beginning
of the period ($) | Account value
at the end
of the period ($) | Expenses paid
during
the period ($)* | Funds
annualized
expense
ratio (%) |
| Actual | Hypothetical | Actual | Hypothetical | Actual | Hypothetical | Actual |
Large Cap Fund |
Investor | 1,000.00 | 1,000.00 | 1,089.40 | 1,020.37 | 5.05 | 4.89 | 0.96% |
Class I | 1,000.00 | 1,000.00 | 1,090.60 | 1,021.83 | 3.53 | 3.41 | 0.67% |
Class Y | 1,000.00 | 1,000.00 | 1,091.30 | 1,022.43 | 2.90 | 2.80 | 0.55% |
Large Cap Concentrated Fund |
Investor | 1,000.00 | 1,000.00 | 1,097.70 | 1,020.38 | 5.06 | 4.87 | 0.96% |
Class I | 1,000.00 | 1,000.00 | 1,100.30 | 1,021.84 | 3.53 | 3.40 | 0.67% |
Class Y | 1,000.00 | 1,000.00 | 1,100.80 | 1,022.45 | 2.90 | 2.79 | 0.55% |
All Cap Select Fund |
Investor | 1,000.00 | 1,000.00 | 1,086.70 | 1,019.36 | 6.09 | 5.90 | 1.16% |
Class I | 1,000.00 | 1,000.00 | 1,088.60 | 1,020.82 | 4.58 | 4.43 | 0.87% |
Class Y | 1,000.00 | 1,000.00 | 1,089.20 | 1,021.42 | 3.95 | 3.82 | 0.75% |
Long-Short Fund |
Investor | 1,000.00 | 1,000.00 | 1,051.80 | 1,017.95 | 7.44 | 7.32 | 1.44% |
Class I | 1,000.00 | 1,000.00 | 1,053.70 | 1,019.41 | 5.95 | 5.85 | 1.15% |
Class Y | 1,000.00 | 1,000.00 | 1,054.10 | 1,020.02 | 5.33 | 5.24 | 1.03% |
International Fund |
Investor | 1,000.00 | 1,000.00 | 980.50 | 1,019.52 | 5.63 | 5.74 | 1.13% |
Class I | 1,000.00 | 1,000.00 | 981.80 | 1,020.99 | 4.18 | 4.26 | 0.84% |
Class Y | 1,000.00 | 1,000.00 | 981.90 | 1,021.59 | 3.58 | 3.65 | 0.72% |
Short Duration Fund |
Investor | 1,000.00 | 1,000.00 | 1,002.70 | 1,021.12 | 4.09 | 4.13 | 0.81% |
Class I | 1,000.00 | 1,000.00 | 1,004.20 | 1,022.59 | 2.63 | 2.65 | 0.52% |
Class Y | 1,000.00 | 1,000.00 | 1,005.70 | 1,023.19 | 2.02 | 2.04 | 0.40% |
Core Bond Fund |
Investor | 1,000.00 | 1,000.00 | 998.80 | 1,021.36 | 3.84 | 3.89 | 0.76% |
Class I | 1,000.00 | 1,000.00 | 1,000.00 | 1,022.83 | 2.37 | 2.40 | 0.47% |
Class Y | 1,000.00 | 1,000.00 | 1,000.60 | 1,023.44 | 1.77 | 1.79 | 0.35% |
* | Expenses are equal to the Fund’s annualized net expense ratio, multiplied by the average account value over the period, multiplied by the number of days in the most recent fiscal half-year divided by the number of days in the fiscal year (to reflect the one-half year period). |
You can find more information about the Fund’s expenses, including annual expense ratios for historical periods in the Financial Highlights section of this report. For additional information on operating expenses and other shareholder costs, please refer to the Fund’s prospectus. The prospectus presents hypothetical shareholder costs over various time periods based upon a $10,000 investment and a return of 5% a year. The standardized example, which appears in all mutual fund prospectuses, may be useful to you in comparing the costs of investing in different funds.
DIAMOND HILL FUNDS | ANNUAL REPORT | DECEMBER 31, 2021 | DIAMOND-HILL.COM 145 |
Diamond Hill Funds
Management of the Trust
(Unaudited)
Listed in the charts below is basic information regarding the Trustees and Officers of the Trust.
INDEPENDENT TRUSTEES:
Name/Address/1
Age | Position(s)
Held with
Trust | Term of
Office2
and
Length
of Time
Served | Principal Occupation(s)
At Least The Last 5 Years | Number of
Portfolios
in Fund
Complex
Overseen
by Trustee | Other
Directorships Held
by
Trustee |
Tamara L. Fagely
Year of Birth: 1958 | Trustee | Since November 2014 | Retired, January 2014 to present; Chief Operations Officer, Hartford Funds, 2012 to 2013; Chief Financial Officer, Hartford Funds, 2010 to 2012; Treasurer, Hartford Funds, 2001 to 2012. | 10 | Allianz Variable Insurance Products Trust and Allianz Variable Insurance Products Fund of Funds Trust, December 2017 to present; AIM ETF Products Trust, February 2020 to present |
Jody T. Foster
Year of Birth: 1969 | Trustee | Since February 2022 | Chief Executive Officer, Symphony Consulting, 2010 to present | 10 | Hussman Investment Trust, June 2016 to present |
John T.
Kelly-Jones
Year of Birth: 1960 | Trustee | Since May 2019 | Retired, December 2017 to present; Partner, COO and CCO, Independent Franchise Partners, LLP June 2009 to November 2017. | 10 | None |
D’Ray Moore
Year of Birth: 1959 | Chairperson Trustee | Since February 2014 Since August 2007 | Retired, Community Volunteer, November 2001 to present. | 10 | Advisors Investment Trust, July 2011 to present |
Nancy M. Morris
Year of Birth: 1952 | Trustee | Since May 2019 | Retired, August 2018 to present; Chief Compliance Officer, Wellington Management Company LLP April 2012 to July 2018. | 10 | The Arbitrage Funds, December 2018 to present, AltShares Trust January 2020 to present |
146 DIAMOND HILL FUNDS | ANNUAL REPORT | DECEMBER 31, 2021 | DIAMOND-HILL.COM |
Diamond Hill Funds
Management of the Trust
(Unaudited) (Continued)
PRINCIPAL OFFICERS:
Name/Address/1
Age | Position(s)
Held with Trust | Term of Office and
Length of Time Served2 | Principal Occupation(s)
At Least The Last 5 Years |
Thomas E. Line Year of Birth: 1967 | President | Since May 2020 | Chief Executive Officer of the Trust, November 2014 to May 2020; Chief Financial Officer of Diamond Hill Investment Group, Inc., January 2015 to present; Managing Director - Finance of Diamond Hill Investment Group, Inc., April 2014 to December 2014. |
Karen R. Colvin Year of Birth: 1966 | Vice President Secretary | Since November 2011 Since November 2014 | Director-Fund Administration & Sales Support, Diamond Hill Capital Management, Inc., June 2009 to present. |
Gary R. Young Year of Birth: 1969 | Chief Compliance Officer | Since May 2020 | President of the Trust, November 2014 to May 2020; Secretary of the Trust, May 2004 to November 2014; Chief Administrative Officer of the Trust, October 2010 to November 2014; Chief Risk Officer of Diamond Hill Capital Management, Inc. May 2020 to present; Chief Compliance Officer of Diamond Hill Capital Management Inc., October 2010 to present; Controller of Diamond Hill Investment Group, Inc., April 2004 to March 2015. |
Julie A. Roach Year of Birth: 1971 | Treasurer | Since October 2017 | Director-Fund Administration, Diamond Hill Capital Management, Inc., September 2017 to present; Assistant Treasurer - Head of Valuation Oversight, J.P. Morgan Asset Management, August 2012 to 2017. |
1 | The address of each Trustee and Officer is 325 John H. McConnell Boulevard — Suite 200, Columbus, Ohio 43215. |
2 | Each Trustee is elected to serve in accordance with the Declaration of Trust and Bylaws of the Trust until their resignation, removal or retirement. Trustees have a 15-year term limit. Each Officer is elected by the Trustees for a 1-year term to serve the Trust or until their resignation, removal or retirement. |
The Statement of Additional Information contains additional information about the Trustees and is available without charge on www.diamond-hill.com or by calling 1-888-226-5595.
DIAMOND HILL FUNDS | ANNUAL REPORT | DECEMBER 31, 2021 | DIAMOND-HILL.COM 147 |
(Page intentionally left blank)
148 DIAMOND HILL FUNDS | ANNUAL REPORT | DECEMBER 31, 2021 | DIAMOND-HILL.COM |
(Page intentionally left blank)
DIAMOND HILL FUNDS | ANNUAL REPORT | DECEMBER 31, 2021 | DIAMOND-HILL.COM 149 |

INVESTMENT ADVISER: DIAMOND HILL CAPITAL MANAGEMENT, INC.
DISTRIBUTOR: FORESIDE FINANCIAL SERVICES, LLC (MEMBER FINRA)
DIAMOND-HILL.COM | 855.255.8955 | 325 JOHN H. MCCONNELL BLVD | SUITE 200 | COLUMBUS, OHIO | 43215
DH-AR123121
Item 2. Code of Ethics.
The registrant has adopted a code of ethics that applies to the registrant's principal executive officer and principal financial officer. The registrant has made minor amendments to its code of ethics during the period covered by this report. The registrant has not granted any waivers from any provisions of the code of ethics during the period covered by this report. A copy of the registrant's Code of Ethics is filed herewith.
Item 3. Audit Committee Financial Expert.
3(a)(1) The registrant's board of directors has determined that the registrant has at least one audit committee financial expert serving on its audit committee.
3(a)(2) The audit committee financial experts are Ms. Tamara L. Fagely and Jody T. Foster, who are "independent" for purposes of this Item 3 of Form N-CSR.
Item 4. Principal Accountant Fees and Services.
(a) Audit Fees. Audit fees totaled $152,788 and $180,500 in fiscal 2021 and 2020, respectively. 2021 and 2020 fees include fees associated with the annual audit and filings of the registrant's Form N-1A and Form N-CEN.
(b) Audit-Related Fees. There were no audit-related fees in fiscal 2021 and 2020.
(c) Tax Fees. Fees for tax compliance services totaled $45,000 and $63,000 in fiscal 2021 and 2020, respectively.
(d) All Other Fees. All other fees totaled $1,164 and $0 in fiscal 2021 and 2020, respectively.
(e)(1) Audit Committee Pre-Approval Policies. The Audit Committee's pre-approval policies describe the types of audit, audit-related, tax and other services that may receive the general pre-approval of the Audit Committee. The pre-approval policies provide that annual audit service fees, tax services not specifically granted pre-approval, services exceeding pre-approved cost levels and other services that have not received general pre-approval will be subject to specific pre-approval by the Audit Committee. The pre-approval policies further provide that the Committee may grant general pre-approval to other audit services (statutory audits and services associated with SEC registration statements, periodic reports and other documents filed with the SEC or other documents issued in connection with securities offerings), audit-related services (accounting consultations related to accounting, financial reporting or disclosure matters not classified as "audit services," assistance with understanding and implementing new accounting and financial reporting guidance from rulemaking authorities, agreed-upon or expanded audit procedures related to accounting and/or billing records required to respond to or comply with financial, accounting or regulatory reporting matters and assistance with internal control reporting requirements under Form N-CEN and Form N-CSR), tax services that have historically been provided by the auditor that the Committee believes would not impair the independence of the auditor and are consistent with the SEC's rules on auditor independence and permissible non-audit services classified as "all other services" that are routine and recurring services.
(e)(2) All of the services described in paragraphs (b) through (d) of Item 4 were approved by the Audit Committee.
(f) During the audit of registrant's financial statements for the most recent fiscal year, less than 50 percent of the hours expended on the principal accountant's engagement were attributed to work performed by persons other than the principal accountant's full-time, permanent employee.
(g) The aggregate non-audit fees for services to the registrant, its investment adviser and any entity controlling, controlled by, or under common control with the adviser that provides ongoing services to the registrant were $21,750 and $0 in 2021 and 2020, respectively.
(h) The registrant's audit committee of the board of trustees has considered whether the provision of non-audit services that were rendered to the registrant's investment adviser (not including any sub-adviser whose role is primarily portfolio management and is subcontracted with or overseen by another investment adviser), and any entity adviser that provides ongoing services to the registrant that were not pre-approved pursuant to paragraph (c)(7)(ii) of Rule 2-01 of Regulation S-X is compatible with maintaining the principal accountant's independence.
Item 5. Audit Committee of Listed Registrants.
Not applicable.
Item 6. Schedule of Investments.
(a) The Schedule of Investments is included in the Annual Report to Shareholders filed under Item 1 of this Form.
(b) Not applicable.
Item 7. Disclosure of Proxy Voting Policies and Procedures for Closed-End Management Investment Companies.
Not applicable.
Item 8. Portfolio Managers of Closed-End Management Investment Companies.
Not applicable.
Item 9. Purchases of Equity Securities by Closed-End Management Investment Company and Affiliated Purchasers.
Not applicable.
Item 10. Submission of Matters to a Vote of Security Holders.
Not applicable.
Item 11. Controls and Procedures.
(a)The registrant's principal executive officer and principal financial officer have concluded, based on their evaluation of the registrant's disclosure controls and procedures as conducted within 90 days of the filing date of this report, that these disclosure controls and procedures are adequately designed and are operating effectively to ensure that information required to be disclosed by the registrant on Form N-CSR is recorded, processed, summarized and reported within the time periods specified in the Securities and Exchange Commission's rules and forms.
(b)There were no changes in the registrant's internal control over financial reporting (as defined in Rule 30a-3(d) under the Act (17 CFR 270.30a-3(d))) that occurred during the period covered by this report that have materially affected or are reasonably likely to materially affected, the registrant's internal control over financial reporting.
Item 12. Disclosure of Securities Lending Activities for Closed-End Management Investment Companies.
Not applicable.
Item 13. Exhibits.
| (a)(1) | | Code of Ethics for Senior Financial Officers is filed herewith. |
| | | |
| (a)(2) | | A separate certification for each principal executive officer and principal financial officer of the registrant as required by Rule 30a-2(a) under the Act (17 CFR 270.30a-2(a)): Attached hereto |
| | | |
(a)(3) (a)(4) | | Not applicable. Change in the registrant's independent public accountants: Not applicable |
| | | |
| (b) | | Certification required by Rule 30a-2(b) under the Act (17 CFR 270.30a-2(b)): Attached hereto |
SIGNATURES
Pursuant to the requirements of the Securities Exchange Act of 1934 and the Investment Company Act of 1940, the registrant has duly caused this report to be signed on its behalf by the undersigned, thereunto duly authorized.
| Registrant | Diamond Hill Funds | |
| | | |
| By (Signature and Title) | /s/ Thomas E. Line | |
| | Thomas E. Line, President | |
| | | |
| Date: | February 23, 2022 | |
Pursuant to the requirements of the Securities Exchange Act of 1934 and the Investment Company Act of 1940, this report has been signed below by the following persons on behalf of the registrant and in the capacities and on the dates indicated.
| By (Signature and Title) | /s/ Thomas E. Line | |
| | Thomas E. Line, President | |
| | | |
| Date: | February 23, 2022 | |
| | | |
| By (Signature and Title) | /s/ Julie A. Roach | |
| | Julie A. Roach, Principal Financial Officer | |
| | | |
| Date: | February 23, 2022 | |