UNITED STATES
SECURITIES AND EXCHANGE COMMISSION
Washington, D.C. 20549
FORM N-CSR
CERTIFIED SHAREHOLDER REPORT OF REGISTERED
MANAGEMENT INVESTMENT COMPANIES
Investment Company Act file number: 811-08061
Diamond Hill Funds
(Exact name of registrant as specified in charter)
325 John H. McConnell Boulevard, Suite 200, Columbus, Ohio 43215
(Address of principal executive offices) (Zip code)
Thomas E. Line
325 John H. McConnell Boulevard, Suite 200, Columbus, Ohio 43215
(Name and address of agent for service)
Registrant’s telephone number, including area code:614-255-3333
Date of fiscal year end:December 31
Date of reporting period:December 31, 2019
Form N-CSR is to be used by management investment companies to file reports with the Commission not later than 10 days after the transmission to stockholders of any report that is required to be transmitted to stockholders under Rule 30e-1 under the Investment Company Act of 1940 (17 CFR 270.30e-1). The Commission may use the information provided on Form N-CSR in its regulatory, disclosure review, inspection, and policymaking roles.
A registrant is required to disclose the information specified by Form N-CSR, and the Commission will make this information public. A registrant is not required to respond to the collection of information contained in Form N-CSR unless the Form displays a currently valid Office of Management and Budget (“OMB”) control number. Please direct comments concerning the accuracy of the information collection burden estimate and any suggestions for reducing the burden to Secretary, Securities and Exchange Commission, 450 Fifth Street, NW, Washington, DC 20549-0609. The OMB has reviewed this collection of information under the clearance requirements of 44 U.S.C. § 3507.
Item 1. Reports to Stockholders.
Beginning on January 1, 2021, as permitted by regulations adopted by the U.S. Securities and Exchange Commission, paper copies of the Diamond Hill Funds’ (“Fund”) shareholder reports will no longer be sent by mail, unless you specifically request paper copies of the reports from your financial intermediary, such as a broker-dealer or bank, or from the Diamond Hill Funds, if you invest directly with the Fund. Instead, the reports will be made available on a website, and you will be notified by mail each time a report is posted and provided with a website link to access the report.
If you have already elected to receive shareholder reports electronically, you will not be affected by this change and you need not take any action. You may elect to receive shareholder reports and other communications from the Fund electronically by contacting your financial intermediary (such as a broker-dealer or bank) or, if you invest directly with the Fund, by calling 888-226-5595.
You may elect to receive all future reports in paper free of charge. If you invest through a financial intermediary, you can contact your financial intermediary to request that you continue to receive paper copies of your shareholder reports. If you invest directly in a Diamond Hill Fund, you can call 888-226-5595 to let the Fund know of your request. Your election to receive reports in paper will apply to all funds held in your account, if you invest through your financial intermediary, or all Diamond Hill Funds, if you invest directly with the Fund.
| | |
Letter to Shareholders | 1 |
Mission and Guiding Principles | 5 |
Management Discussion of Fund Performance (Unaudited) | |
Diamond Hill Small Cap Fund | 7 |
Diamond Hill Small-Mid Cap Fund | 10 |
Diamond Hill Mid Cap Fund | 13 |
Diamond Hill Large Cap Fund | 16 |
Diamond Hill All Cap Select Fund | 20 |
Diamond Hill Long-Short Fund | 23 |
Diamond Hill Research Opportunities Fund | 26 |
Diamond Hill Global Fund | 29 |
Diamond Hill International Fund | 32 |
Diamond Hill Short Duration Total Return Fund | 35 |
Diamond Hill Core Bond Fund | 38 |
Diamond Hill Corporate Credit Fund | 41 |
Diamond Hill High Yield Fund | 44 |
Financial Statements | |
Schedules of Investments | 47 |
Statements of Assets & Liabilities | 106 |
Statements of Operations | 109 |
Statements of Changes in Net Assets | 112 |
Financial Highlights | 128 |
Notes to Financial Statements | 154 |
Report of Independent Registered Public Accounting Firm | 174 |
Other Items | 176 |
Schedule of Shareholder Expenses | 182 |
Management of the Trust | 185 |
Cautionary Statement: At Diamond Hill, we pledge that, “we will communicate with our clients about our investment performance in a manner that will allow them to properly assess whether we are deserving of their trust.” Our views and opinions regarding the investment prospects of our portfolio holdings and Funds are “forward looking statements” which may or may not be accurate over the long term. While we believe we have a reasonable basis for our opinions, actual results may differ materially from those we anticipate. Information provided in this report should not be considered a recommendation to purchase or sell any particular security.
You can identify forward looking statements by words like “believe,” “expect,” “anticipate,” or similar expressions when discussing prospects for particular portfolio holdings and/or one of the Funds. We cannot assure future results. You should not place undue reliance on forward-looking statements, which speak only as of the date of this report. We disclaim any obligation to update or alter any forward-looking statements, whether as a result of new information, future events, or otherwise.
This material is not authorized for distribution to prospective investors unless preceded or accompanied by a Prospectus. Investors should consider the investment objectives, risks, charges, and expenses of the Diamond Hill Funds carefully before investing. The prospectus or summary prospectus contain this and other important information about the Fund(s) and are available at diamond-hill.com or by calling 888.226.5595. Please read the prospectus or summary prospectus carefully before investing. The Diamond Hill Funds are distributed by Foreside Financial Services, LLC (Member FINRA). Diamond Hill Capital Management, Inc., a registered investment adviser, serves as Investment Adviser to the Diamond Hill Funds and is paid a fee for its services. Diamond Hill Funds are not FDIC insured, may lose value, and have no bank guarantee.
Dear Fellow Shareholders:
We are pleased to provide you with this year-end update for the Diamond Hill Funds.
Equity markets reached new all-time highs in 2019, with the Russell 1000 Index returning 31.43% for the year, the strongest annual return for the Index since 2013 and the second-best return since 1997. Most of the market’s return was driven by price/earnings multiple expansion, as corporate earnings grew at a very modest rate. With the exception of a short rally for value stocks in September, growth stocks continued to outperform value stocks, with the Russell 1000 Growth Index outperforming the Russell 1000 Value index by just under 1,000 basis points for the year. The 50% return for the information technology sector was particularly notable.
The trend toward passive management persisted in 2019. We continue to believe that Diamond Hill strategies will outperform their respective passive benchmarks over a full market cycle, supported by a shared commitment to our intrinsic value-based investment philosophy, long-term perspective, disciplined approach, and alignment with our clients’ interests. As of December 31, 2019, the since-inception returns for most of our strategies exceeded their respective benchmark returns.
2019 Financial Markets
The first quarter of 2019 was the best in nearly a decade for the Russell 1000 Index, returning 14.0% and recovering nearly all of the double-digit decline in the fourth quarter of 2018. Concern that the Federal Reserve would tighten monetary policy too far contributed to the sell-off at the end of 2018, but Chairman Powell’s comments in January 2019 about being “patient and flexible” seemed to allay those fears.
Much of the market’s movement in the second quarter of 2019 was driven by interest rates and expectations around a resolution to global trade tensions. After a strong April, markets slid in May on concern that trade talks were falling apart. Renewed optimism around a deal, along with a developing perception that a low interest rate environment would persist for some time, led to a bounce-back in June.
Equity markets increased modestly in the third quarter. The on and off progress of trade negotiations continued to move markets, as did the rapid fluctuation of interest rates. Equity markets finished the year strong, with the Russell 1000 Index returning 9.04% in the fourth quarter to again reach new all-time highs. The sharp move was likely driven by incremental progress on a trade deal with China.
Interestingly, only three sectors outperformed the Russell 1000 Index for the full year, and two of them – financials and communication services – outperformed by just a small margin. This speaks to just how much the 50% return for the information technology sector drove the overall market in 2019, as the sector was responsible for approximately one-third of the overall market’s return. Drilling one level deeper, just four information technology stocks – Apple, Microsoft, Mastercard, and Visa – contributed about 17% of the Russell 1000 Index’s return.
DIAMOND HILL FUNDS | ANNUAL REPORT | DECEMBER 31, 2019 | DIAMOND-HILL.COM 1 |
The dominant theme in the fixed income markets throughout the year was the complete suppression of volatility by the Federal Reserve, a theme that was evident in the two Federal Open Market Committee (FOMC) meetings in the fourth quarter. After spending the majority of 2018 working to get out of the business of suppressing volatility, we expected the Federal Reserve to recalibrate policy in 2019, as there was no need to push the economy close to recession with both actual and expected inflation contained. However, the Federal Reserve did far more than recalibrate policy. It reversed three of the four 2018 rate hikes and resumed balance sheet expansion in the fourth quarter to placate concerns that arose from money market volatility in September. The combination of the Federal Reserve’s lowering rates, increasing its balance sheet, resolution to the U.K. election (with Boris Johnson consolidating his power), and a potential agreement on a phase one trade deal between the U.S. and China fueled risk markets. Equity markets led the charge higher, with both high yield and investment grade corporate bonds following suit. Longer-term Treasury yields moved higher as investors moved away from haven assets and piled into risk.
The 30-year Treasury returned 16.43% in 2019, its best calendar year performance since 2014 (29.38%). Similar to the performance of the 30-year Treasury, the 2019 performance for the 10-year Treasury, 8.90%, was the best since 2014’s return of 10.74%. Overall, the Treasury market gained 6.86% in 2019.
The Bloomberg Barclays U.S. Corporate Index returned 14.54% in 2019. The Index finished the year with one month of negative performance (September’s decline of 65 bps, which was fueled by a deluge of new issuance), matching the record for positive performing months in a calendar year set in 1995. The ICE BofA U.S. High Yield Index also posted strong returns for the year, ending 2019 with a 14.41% return.
Outlook
U.S. real GDP growth remains healthy, driven by a strong labor market, business investment, and increased government spending. However, growth has slowed from peak levels in 2018 and some economic indicators suggest continued slowing. There is also the risk that things like domestic politics or geopolitical events can alter the trajectory of growth in the near term. For example, ongoing disputes over international trade policy have the potential to negatively impact growth if they are not resolved.
The size of recently implemented tariffs is small relative to the total economy, but for certain companies the impact is large. While tariffs are not impacting how we are positioning our portfolios, we continually assess the impact on a company-by-company basis. The likelihood of reaching a trade deal seems to rapidly fluctuate, but we believe cooler heads will eventually prevail and a deal will be reached.
Corporate tax reform provided a boost to corporate earnings in 2018, but the challenging year-over-year comparison made earnings growth more difficult in 2019. Earnings for many companies were also pressured by higher input costs, including wages and transportation. Earnings growth is expected to be higher in 2020 as some of these factors start to normalize.
2 DIAMOND HILL FUNDS | ANNUAL REPORT | DECEMBER 31, 2019 | DIAMOND-HILL.COM |
The modest deleveraging of the U.S. household sector over the past several years continues to be a positive story. These lower debt levels combined with low interest rates have allowed consumer debt-service burdens to improve to very low levels by historical standards. This debt-service ability remains very much tied to interest rate levels, so the current low levels should continue to help support a strong consumer.
The Federal Reserve’s hawkish commentary in late 2018 spooked equity markets, causing concern that they may go too far in tightening monetary policy and increase the probability of a recession. The Federal Reserve walked back those comments in early 2019 by describing its approach as flexible, sparking a rally in equity markets and very strong returns for the year. The Federal Reserve cut the Federal Funds rate in July, September, and October, and along with its decision to leave rates unchanged in December, signaled that it is comfortable with current levels given its favorable economic outlook.
Low interest rates, high corporate profit margins, and steady economic growth with low inflation have driven strong equity market returns since the Great Recession of 2008, often making it difficult for us to find new investments for our portfolios. This continues to be the case after the market’s significant move upward in 2019. As always, we remain focused on assessing risk, which we define as the permanent loss of capital.
Current price/earnings multiples are slightly above historical averages, and although they are not excessive, expected returns could be held back if historically high corporate profit margins and below-average interest rates revert toward long-term averages. Considering these factors, mid-single digit returns seem reasonable for equity markets over the next five years.
We believe we can achieve better-than-market returns over the next five years through active portfolio management, and our primary focus is always on achieving value-added results for our existing clients. Our intrinsic value investment philosophy is shared by all of our portfolio managers and research analysts, allowing us to apply our investment discipline consistently across strategies.
Thank you for your continued support,
Diamond Hill Capital Management, Inc.

| 
|
Austin Hawley, CFA
Chief Investment Officer | Bill Zox, CFA
Chief Investment Officer –
Fixed Income |
DIAMOND HILL FUNDS | ANNUAL REPORT | DECEMBER 31, 2019 | DIAMOND-HILL.COM 3 |
The views expressed are as of December 31, 2019, and they are subject to change. These opinions are not intended to be a forecast of future events, a guarantee of future results, or investment advice. All data referenced are from sources deemed to be reliable but cannot be guaranteed. Securities and sectors referenced should not be construed as a solicitation or recommendation or be used as the sole basis for any investment decision.
The Russell 1000 Index is an unmanaged market capitalization weighted index measuring the performance of the largest 1,000 companies by market capitalization in the Russell 3000 Index. The Russell 3000 Index is an unmanaged market capitalization weighted index measuring the performance of the 3,000 largest U.S. companies based on total market capitalization. The Russell 1000 Value Index is an unmanaged market capitalization weighted index measuring the performance of the large cap value segment of the U.S. equity universe including those Russell 1000 Index companies with lower expected growth values. The Russell 1000 Growth Index is an unmanaged market capitalization weighted index measuring the performance of the large cap growth segment of the U.S. equity universe including those Russell 1000 Index companies with higher price-to-book ratios and higher forecasted growth values.
The Bloomberg Barclays U.S. Corporate Index is an unmanaged index measuring the investment grade, fixed-rate, taxable corporate bond market. It includes USD denominated securities publicly issued by U.S. and non-U.S. industrial, utility and financial issuers.
The ICE BofA U.S. High Yield Index is an unmanaged index measuring the performance of U.S. dollar denominated below investment grade corporate debt publicly issued in the U.S. domestic market. The index data referenced herein is the property of ICE Data Indices, LLC, its affiliates (“ICE Data”) and/or its third party suppliers and has been licensed for use by Diamond Hill Capital Management, Inc. ICE Data and its third party suppliers accept no liability in connection with its use. See diamond-hill.com for a full copy of the disclaimer.
These indices do not reflect the deduction of fees associated with a mutual fund such as investment management and accounting fees. Investors cannot invest directly in an index although they can invest in the underlying securities.
4 DIAMOND HILL FUNDS | ANNUAL REPORT | DECEMBER 31, 2019 | DIAMOND-HILL.COM |
Our Mission
At Diamond Hill, we serve our clients by providing investment strategies that deliver lasting value through a shared commitment to our intrinsic value-based investment philosophy, long-term perspective, disciplined approach and alignment with our clients’ interests.
VALUE
We believe market price and intrinsic value are independent in the short-term but tend to converge over time.
LONG-TERM
We maintain a long-term focus both in investment analysis and management of our business.
DISCIPLINE
We invest with discipline to increase potential return and protect capital.
PARTNERSHIP
We align our interests with those of our clients through significant personal investment in our strategies.
DIAMOND HILL FUNDS | ANNUAL REPORT | DECEMBER 31, 2019 | DIAMOND-HILL.COM 5 |
The Guiding Principles of our Intrinsic Value Philosophy |
| | ● | Recognize that market price and intrinsic value tend to converge over a reasonable period of time |
| | ● | Possess a long-term investment temperament (five years or longer) |
| | ● | Only invest when the market price is below (above for short positions) intrinsic value |
| | ● | Treat every investment as a partial ownership interest in that company |
Our intrinsic value philosophy is shared by all of our portfolio managers and research analysts, allowing us to apply our investment discipline consistently across all equity and fixed income strategies.
Each portfolio is supported by our entire research team, all of whom are dedicated to bottom-up, fundamental analysis and provide research coverage across the capital structure. Each team member covers small, mid and large capitalization companies, long and short opportunities, equity and debt, as well as global and domestic companies.
We believe we can achieve better-than-market returns over the long term through active portfolio management, and our primary focus is always on achieving value-added results for our clients.
6 DIAMOND HILL FUNDS | ANNUAL REPORT | DECEMBER 31, 2019 | DIAMOND-HILL.COM |
Management Discussion of Fund Performance (Unaudited) |
Diamond Hill Small Cap Fund
2019 Portfolio Commentary
For 2019, the Small Cap Fund (Class I) delivered a 21.75% return. We are pleased with the absolute result for the year but continue to struggle to keep pace with the Russell 2000 Index’s 25.52% return. Hats off to our industrials team as they delivered nearly half the performance while representing less than a quarter the exposure. Two companies we would like to highlight are Aircastle and Allegiant Travel.
Aircastle is a superb example of patience. We have owned the business for over five years, watching book value compound at 6% and collecting a reasonable yield along the way, all while having the multiple contract. Then in early November, the company received a cash offer of $32 per share, delivering a 95% return for us this year and over 17% annualized since our initial purchase in 2014. While the market tests your commitment, we believe if we follow the fundamentals and trust our analysis, in time we will realize the true value of the business.
As for Allegiant Travel, this is an excellent illustration of our alignment with an owner’s mindset. The founder and management own over 20% of the business and believed an investment in refreshing the company’s portfolio of planes would deliver excellent results to both the customer and the bottom line. We agreed and felt we had the opportunity to acquire a portion of the company at a price which gave management little to no credit for margin improvement. Allegiant more than exceeded our expectations as on-time performance improved 7.5 percentage points over the last two years and profitability was up over 600 basis points through the first three quarters of 2019. With these results, the stock price followed, increasing over 75%. When incentives are aligned, it is a good recipe for positive outcomes for all constituencies.
Autophagy of a Portfolio
For those not familiar with the biological function of autophagy, it is essentially our body’s method of natural selection for cells. When the body is stressed through exercise, fasting, or other extreme processes, it breaks down weaker cellular structures and recycles those building blocks to construct a stronger, more durable entity. In essence, this is the same process we have put the portfolio through since taking over management in February. While we cannot guarantee performance, a hallmark that we would like our portfolio to possess is resiliency in the face of difficult market environments. Therefore, we have eliminated weaker positions and recycled the capital into higher quality companies or opportunities with a greater margin of safety. This is illustrated in many of the eliminated positions throughout the past year.
Inheriting a portfolio with 69 holdings, we immediately sold seven smaller positions of companies like TiVo, which lacked strategic direction, and Cincinnati Bell, where we weren’t comfortable with the level of financial leverage. We also eliminated companies where the market provided us opportunities to sell at narrowed discounts to our intrinsic value estimate for less-than-stellar businesses like Avis Budget which delivered a nearly 60% return this year or Option Care Health which rebounded after a difficult start.
DIAMOND HILL FUNDS | ANNUAL REPORT | DECEMBER 31, 2019 | DIAMOND-HILL.COM 7 |
Diamond Hill Small Cap Fund |
The last category of portfolio autophagy we would like to highlight were situations where our thesis moved against us and risks began increasing to uncomfortable levels, such as Tenneco. The company had recently acquired Federal Mogul in an attempt to form a company that could be split into two more-focused entities. While we did not necessarily agree with the strategic rationale for the acquisition the valuation seemed too compelling to exit our position. After multiple operational missteps, continued fundamental deterioration, and a weakening balance sheet, we felt the eventual success or failure of the company was less in their control and would be dictated by the path of their end markets. Therefore, we exited this position with a 59% loss this year.
When the year was settled, we had decisively eliminated 16 positions and constructed a portfolio of 57 companies that we believe together represent a stronger, more resilient portfolio of diversified business cash flows. At the top of that list are companies like Live Nation Entertainment and Vail Resorts that we believe would be extremely difficult to replicate, cyclical companies such as Kirby and Cal-Maine Foods with the capacity to improve their position while others suffer, and uniquely positioned financial institutions such as Sterling Bancorp and Enstar Group.
The Future
We understand any portfolio management change can be unsettling. We greatly appreciate your continued support and partnership. Thank you. While we will not be flawless, through continued portfolio reflection we will strive to construct a collection of excellent long-term businesses with a significant margin of safety. We will be invested alongside you and will transparently strive to deliver strong and resilient risk-adjusted returns to our partners.
We would also like to thank our analyst team for their support throughout the year. We understand change is not easy for them either, so we thank them for their efforts to make this a successful long-term endeavor.
We are excited with the direction of the portfolio and remain convicted in our long-term, intrinsic value investment philosophy.
Sincerely,

| 
|
Aaron Monroe, CFA
Portfolio Manager | Chris Welch, CFA
Portfolio Manager |
8 DIAMOND HILL FUNDS | ANNUAL REPORT | DECEMBER 31, 2019 | DIAMOND-HILL.COM |
Diamond Hill Small Cap Fund |
AVERAGE ANNUAL TOTAL RETURNS AS OF DECEMBER 31, 2019
| Inception
Date | One
Year | Three
Years | Five
Years | Ten
Years | Expense
Ratio* |
PERFORMANCE AT NAV WITHOUT SALES CHARGES |
Class A Shares | 12/29/2000 | 21.36% | 4.45% | 4.59% | 8.95% | 1.26% |
Class C Shares | 2/20/2001 | 20.46 | 3.67 | 3.80 | 8.14 | 2.01 |
Class I Shares | 4/29/2005 | 21.75 | 4.76 | 4.90 | 9.26 | 0.97 |
Class Y Shares | 12/30/2011 | 21.88 | 4.87 | 5.01 | 9.31 | 0.85 |
BENCHMARK |
Russell 2000 Index | | 25.52 | 8.59 | 8.23 | 11.83 | — |
PERFORMANCE AT PUBLIC OFFERING PRICE INCLUDING SALES CHARGES** |
Class A Shares | 12/29/2000 | 15.29 | 2.68 | 3.52 | 8.40 | 1.26 |
Class C Shares | 2/20/2001 | 19.46 | 3.67 | 3.80 | 8.14 | 2.01 |
* Reflects the expense ratio as reported in the Prospectus dated February 28, 2020. ** The maximum sales charge for Class A shares on purchases and for Class C shares on certain redemptions are 5.00% and 1.00%, respectively. |
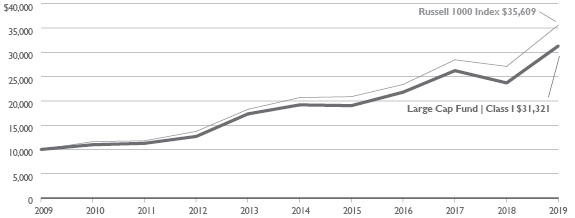
GROWTH OF $10,000
Comparison of the change in value of a $10,000 Investment in the Diamond Hill Small Cap Fund Class I(A) and the Russell 2000 Index.
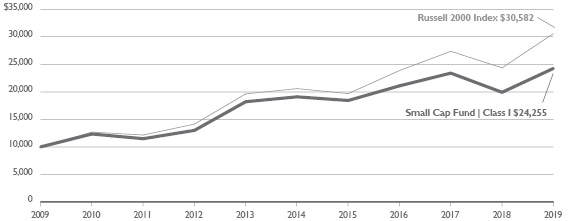
(A) | The growth of $10,000 chart represents the performance of Class I shares only, which will vary from the performance of Class A, Class C and Class Y shares based on the difference in loads and fees paid by shareholders in the different classes. |
| The performance of the above Fund does not reflect the deduction of taxes that a shareholder would pay on Fund distributions or the redemption of Fund shares. |
| The chart above represents a comparison of a hypothetical $10,000 investment and the reinvestment of dividends and capital gains in the indicated share class versus a similar investment in the Russell 2000 Index (“Index”). The Index is an unmanaged market capitalization weighted index measuring performance of the smallest 2,000 companies by market capitalization in the Russell 3000 Index. The Russell 3000 Index is an unmanaged market capitalization weighted index measuring the performance of the 3,000 largest U.S. companies based on total market capitalization. The Index does not reflect the deduction of fees associated with a mutual fund such as investment management and accounting fees. The Fund’s performance reflects the deduction of fees for these services. Investors cannot invest directly in an index although they can invest in the underlying securities. |
| Historical performance for Class Y shares prior to its inception is based on the performance of Class A shares. Class Y performance has been adjusted to reflect differences in sales charges and expenses between classes. |
| Past performance does not guarantee future results. The performance data quoted represents past performance and current returns may be lower or higher. The investment return and principal value will fluctuate so that an investor’s shares, when redeemed, may be worth more or less than the original cost. To obtain performance information current to the most recent month end, please visit www.diamond-hill.com. |
DIAMOND HILL FUNDS | ANNUAL REPORT | DECEMBER 31, 2019 | DIAMOND-HILL.COM 9 |
Diamond Hill Small-Mid Cap Fund |
2019 Portfolio Commentary
The Diamond Hill Small-Mid Cap Fund (Class I) returned 27.74% in 2019 compared to a 27.77% return for the benchmark Russell 2500 Index. For the five-year period ended December 31, 2019, the Fund’s return was 7.76%, while the Russell 2500 Index returned 8.93% over the same period. In the 14 years since inception, the Fund’s return of 8.91% was approximately in line with the 8.84% benchmark return. The 2019 results were positively impacted by favorable stock selection in the industrials and consumer discretionary sectors, offset by a sizable underweight in the high-returning information technology sector as well as our mid- to high-single-digit average cash position in the strong up market.
With U.S. equity markets hitting multiple new highs during 2019, it has been especially important for us to maintain our valuation discipline. We estimate the intrinsic value of businesses using our internal research and valuation framework, in which maintaining a long-term time horizon is an essential part of our process. We buy securities for the portfolio when we feel there is a satisfactory discount, or margin of safety, between the market price and our estimate of intrinsic value.
There were limited opportunities to deploy capital in such discounted equity securities in 2019, but we took advantage of the openings that arose. One such opportunity involved adding to our position in electrical industrial distributor WESCO International, Inc. (WCC) during the late summer time frame. We initially purchased WCC in the second quarter of 2019 after the stock sold off on fears of both an economic slowdown and competition from Amazon. We believed WCC was well-positioned for the long-term based on the value-added services it provides to customers, so we initiated a small position.
As the calendar moved to July and August, investor concerns continued, and WCC’s stock price eventually fell to approximately eight times our estimate of normalized earnings. We believed this valuation level implied either a steadily declining business, which we were confident was not the case, or a significantly lower level of normalized earnings relative to our estimates. After performing additional research and stress tests, we felt comfortable more than doubling the position size of WCC in the portfolio by the end of August to approximately 1.5%. As investors’ fears diminished over the course of the remainder of the year and WCC explored potential consolidation activity in the industrial distribution sector, the stock rose as much as 40% from our lowest purchase price in August.
We encountered a similar experience with auto supplier BorgWarner, Inc. (BWA), where we were also able to add to the position in August at a valuation of around eight times our estimate of normalized earnings, a level we viewed as far too low for a company with BWA’s favorable business position and strong balance sheet. The short-term concerns about tariff pressures and an economic slowdown faded through year-end, allowing the roughly 40% gain in BWA’s stock price from our lowest buy price.
The volatility in late summer also presented us with an opportunity to add another new position, Wolverine World Wide (WWW), to the portfolio at the lower end of our market cap range. We monitored WWW closely for the last two years and were drawn to the quality of its primary
10 DIAMOND HILL FUNDS | ANNUAL REPORT | DECEMBER 31, 2019 | DIAMOND-HILL.COM |
Diamond Hill Small-Mid Cap Fund |
footwear brands, but we thought the valuation was too high to provide an adequate margin of safety. When WWW traded down sharply on trade concerns, we understood WWW’s exposure to tariffs and thought the decline in the stock price more than reflected the potential impact from tariffs. We took the opportunity to establish a position at a share price that has since increased more than 35% from our initial purchase.
In a market environment where valuations are high and opportunities are few, we must maintain our discipline while being aggressively optimistic when we get the chance. We did that in the case of the above examples, and also in the fourth quarter of 2018, as explained in last year’s annual letter. Despite these opportunities, cash averaged over 6% for the full year and was a meaningful drag on portfolio returns in the strong up market. We will continue to show patience and discipline, while maintaining our intent to stay at least 90% invested at all times.
I’d like to once again acknowledge our large team of analysts and research associates who work hard to generate ideas and deliver strong returns to clients. Their breadth and depth of research allows us to always maintain a portfolio that we believe is best positioned to deliver favorable returns to you over the next five years.
Historically low interest rates as well as renewed balance sheet expansion from the Federal Reserve have created a positive environment for equities. This has been reinforced by more favorable sentiment on trade. While price-to-earnings ratios are short of historical peak levels, a key variable will be the ability of companies to maintain profit margins at their current all-time high levels. This factor, largely the result of the favorable macro backdrop, has generally supported higher multiples and returns from equities. If we continue to benefit from this scenario, equities will likely generate adequate returns going forward. However, it would not take much to disrupt the favorable environment to which equity investors have grown accustomed, and the Federal Reserve has far less flexibility to support valuations through accommodative policy measures at this point.
We thus remind investors that our approach to investing centers on maintaining a margin of safety in our stock selections, and we remain ever-mindful of key risks when we assess investment opportunities for the portfolio. Through our focused research process, we are always prepared to take advantage of price dislocations to drive long-term favorable returns for our investors, but we are first and foremost focused on preserving the capital you place with us.
We appreciate your ongoing support and look forward to continuing to work with you in the coming years.

Chris Welch, CFA
Portfolio Manager
DIAMOND HILL FUNDS | ANNUAL REPORT | DECEMBER 31, 2019 | DIAMOND-HILL.COM 11 |
Diamond Hill Small-Mid Cap Fund |
AVERAGE ANNUAL TOTAL RETURNS AS OF DECEMBER 31, 2019
| Inception
Date | One
Year | Three
Years | Five
Years | Ten
Years | Expense
Ratio* |
PERFORMANCE AT NAV WITHOUT SALES CHARGES |
Class A Shares | 12/30/2005 | 27.33% | 6.35% | 7.43% | 11.42% | 1.20% |
Class C Shares | 12/30/2005 | 26.40 | 5.55 | 6.64 | 10.59 | 1.95 |
Class I Shares | 12/30/2005 | 27.74 | 6.66 | 7.76 | 11.74 | 0.91 |
Class Y Shares | 12/30/2011 | 27.82 | 6.78 | 7.87 | 11.78 | 0.79 |
BENCHMARK |
Russell 2500 Index | | 27.77 | 10.33 | 8.93 | 12.58 | — |
PERFORMANCE AT PUBLIC OFFERING PRICE INCLUDING SALES CHARGES** |
Class A Shares | 12/30/2005 | 20.96 | 4.56 | 6.34 | 10.84 | 1.20 |
Class C Shares | 12/30/2005 | 25.40 | 5.55 | 6.64 | 10.59 | 1.95 |
* Reflects the expense ratio as reported in the Prospectus dated February 28, 2020. ** The maximum sales charge for Class A shares on purchases and for Class C shares on certain redemptions are 5.00% and 1.00%, respectively. |
GROWTH OF $10,000
Comparison of the change in value of a $10,000 Investment in the Diamond Hill Small-Mid Cap Fund Class I(A) and the Russell 2500 Index.
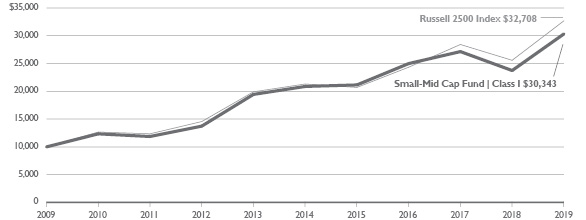
| (A) | The growth of $10,000 chart represents the performance of Class I shares only, which will vary from the performance of Class A, Class C and Class Y shares based on the difference in loads and fees paid by shareholders in the different classes. |
| The performance of the above Fund does not reflect the deduction of taxes that a shareholder would pay on Fund distributions or the redemption of Fund shares. |
| The chart above represents a comparison of a hypothetical $10,000 investment and the reinvestment of dividends and capital gains in the indicated share class versus a similar investment in the Russell 2500 Index (“Index”). The Index is an unmanaged market capitalization weighted index measuring performance of the smallest 2,500 companies by market capitalization in the Russell 3000 Index. The Russell 3000 Index is an unmanaged market capitalization weighted index measuring the performance of the 3,000 largest U.S. companies based on total market capitalization. The Index does not reflect the deduction of fees associated with a mutual fund such as investment management and accounting fees. The Fund’s performance reflects the deduction of fees for these services. Investors cannot invest directly in an index although they can invest in the underlying securities. |
| Historical performance for Class Y shares prior to its inception is based on the performance of Class A shares. Class Y performance has been adjusted to reflect differences in sales charges and expenses between classes. |
| Past performance does not guarantee future results. The performance data quoted represents past performance and current returns may be lower or higher. The investment return and principal value will fluctuate so that an investor’s shares, when redeemed, may be worth more or less than the original cost. To obtain performance information current to the most recent month end, please visit www.diamond-hill.com. |
12 DIAMOND HILL FUNDS | ANNUAL REPORT | DECEMBER 31, 2019 | DIAMOND-HILL.COM |
Diamond Hill Mid Cap Fund |
2019 Portfolio Commentary
The Diamond Hill Mid Cap Fund (Class I) returned 25.82% in 2019 compared to a 30.54% return for the benchmark Russell Midcap Index. For the five-year period ended December 31, 2019, the Fund’s return was 8.29%, while the Russell Midcap Index returned 9.33% over the same period. The 2019 underperformance relative to the benchmark was driven by our high- single-digit average cash position in a strong up market, as well as a sizable underweight in the information technology sector plus unfavorable stock selection in the technology and financials sectors. These items were partially offset by favorable stock selection in the consumer discretionary and communication services sectors.
With U.S. equity markets hitting multiple new highs during 2019, it has been especially important for us to maintain our valuation discipline. We estimate the intrinsic value of businesses using our internal research and valuation framework, in which maintaining a long-term time horizon is an essential part of our process. We buy securities for the portfolio when we feel there is a satisfactory discount, or margin of safety, between the market price and our estimate of intrinsic value.
There were limited opportunities to deploy capital in such discounted equity securities in 2019, but we took advantage of the openings that arose. One such opportunity involved adding to our position in electrical industrial distributor WESCO International, Inc. (WCC) during the late summer time frame. We initially purchased WCC in the second quarter of 2019 after the stock sold off on fears of both an economic slowdown and competition from Amazon. We believed WCC was well-positioned for the long-term based on the value-added services it provides to customers, so we initiated a small position.
As the calendar moved to July and August, investor concerns continued, and WCC’s stock price eventually fell to approximately eight times our estimate of normalized earnings. We believed this valuation level implied either a steadily declining business, which we were confident was not the case, or a significantly lower level of normalized earnings relative to our estimates. After performing additional research and stress tests, we felt comfortable more than doubling the position size of WCC in the portfolio by the end of August to approximately 1.25%. As investors’ fears diminished over the course of the remainder of the year and WCC explored potential consolidation activity in the industrial distribution sector, the stock rose as much as 40% from our lowest purchase price in August.
We encountered a similar experience with auto supplier BorgWarner, Inc. (BWA), where we were also able to add to the position in August at a valuation of around eight times our estimate of normalized earnings, a level we viewed as far too low for a company with BWA’s favorable business position and strong balance sheet. The short-term concerns about tariff pressures and an economic slowdown faded through year-end, allowing the roughly 40% gain in BWA’s stock price from our lowest buy price.
The volatility in late summer also presented us with an opportunity to add another new position, Wolverine World Wide (WWW), to the portfolio at the lower end of our market cap range. We monitored WWW closely for the last two years and were drawn to the quality of its primary
DIAMOND HILL FUNDS | ANNUAL REPORT | DECEMBER 31, 2019 | DIAMOND-HILL.COM 13 |
Diamond Hill Mid Cap Fund |
footwear brands, but we thought the valuation was too high to provide an adequate margin of safety. When WWW traded down sharply on trade concerns, we understood WWW’s exposure to tariffs and thought the decline in the stock price more than reflected the potential impact from tariffs. We took the opportunity to establish a position at a share price that has since increased more than 35% from our initial purchase.
In a market environment where valuations are high and opportunities are few, we must maintain our discipline while being aggressively optimistic when we get the chance. We did that in the case of the above examples, and also in the fourth quarter of 2018, as explained in last year’s annual letter. Despite these opportunities, cash averaged over 7% for the full year and was a meaningful drag on portfolio returns in the strong up market. We will continue to show patience and discipline, while maintaining our intent to stay at least 90% invested at all times.
I’d like to once again acknowledge our large team of analysts and research associates who work hard to generate ideas and deliver strong returns to clients. Their breadth and depth of research allows us to always maintain a portfolio that we believe is best positioned to deliver favorable returns to you over the next five years.
Historically low interest rates as well as renewed balance sheet expansion from the Federal Reserve have created a positive environment for equities. This has been reinforced by more favorable sentiment on trade. While price-to-earnings ratios are short of historical peak levels, a key variable will be the ability of companies to maintain profit margins at their current all-time high levels. This factor, largely the result of the favorable macro backdrop, has generally supported higher multiples and returns from equities. If we continue to benefit from this scenario, equities will likely generate adequate returns going forward. However, it would not take much to disrupt the favorable environment to which equity investors have grown accustomed, and the Federal Reserve has far less flexibility to support valuations through accommodative policy measures at this point.
We thus remind investors that our approach to investing centers on maintaining a margin of safety in our stock selections, and we remain ever-mindful of key risks when we assess investment opportunities for the portfolio. Through our focused research process, we are always prepared to take advantage of price dislocations to drive long-term favorable returns for our investors, but we are first and foremost focused on preserving the capital you place with us.
We appreciate your ongoing support and look forward to continuing to work with you in the coming years.

Chris Welch, CFA
Portfolio Manager
14 DIAMOND HILL FUNDS | ANNUAL REPORT | DECEMBER 31, 2019 | DIAMOND-HILL.COM |
Diamond Hill Mid Cap Fund |
AVERAGE ANNUAL TOTAL RETURNS AS OF DECEMBER 31, 2019
| Inception
Date | One
Year | Three
Years | Five
Years | Since
Inception
(12/31/13) | Expense
Ratio* |
PERFORMANCE AT NAV WITHOUT SALES CHARGES |
Class A Shares | 12/31/2013 | 25.36% | 7.28% | 7.97% | 7.90% | 1.05% |
Class I Shares | 12/31/2013 | 25.82 | 7.62 | 8.29 | 8.22 | 0.76 |
Class Y Shares | 12/31/2013 | 25.91 | 7.72 | 8.40 | 8.34 | 0.64 |
BENCHMARK |
Russell Midcap Index | | 30.54 | 12.06 | 9.33 | 9.97 | — |
PERFORMANCE AT PUBLIC OFFERING PRICE INCLUDING SALES CHARGES** |
Class A Shares | 12/31/2013 | 19.05 | 5.47 | 6.87 | 6.98 | 1.05 |
* Reflects the expense ratio as reported in the Prospectus dated February 28, 2020. ** The maximum sales charge for Class A shares on purchases is 5.00%. |
GROWTH OF $10,000
Comparison of the change in value of a $10,000 Investment in the Diamond Hill Mid Cap Fund Class I(A) and the Russell Midcap Index.
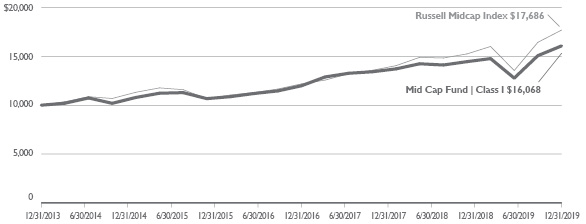
(A) | The growth of $10,000 chart represents the performance of Class I shares only, which will vary from the performance of Class A and Class Y shares based on the difference in loads and fees paid by shareholders in the different classes. |
| The performance of the above Fund does not reflect the deduction of taxes that a shareholder would pay on Fund distributions or the redemption of Fund shares. |
| The chart above represents a comparison of a hypothetical $10,000 investment and the reinvestment of dividends and capital gains in the indicated share class versus a similar investment in the Russell Midcap Index (“Index”). The Index is an unmanaged market capitalization weighted index measuring performance of the smallest 800 companies by market capitalization in the Russell 1000 Index. The Russell 1000 Index is an unmanaged market capitalization weighted index measuring the performance of the largest 1,000 companies by market capitalization in the Russell 3000 Index. The Russell 3000 Index is an unmanaged market capitalization weighted index measuring the performance of the 3,000 largest U.S. companies based on total market capitalization. The Index does not reflect the deduction of fees associated with a mutual fund such as investment management and accounting fees. The Fund’s performance reflects the deduction of fees for these services. Investors cannot invest directly in an index although they can invest in the underlying securities. |
| Past performance does not guarantee future results. The performance data quoted represents past performance and current returns may be lower or higher. The investment return and principal value will fluctuate so that an investor’s shares, when redeemed, may be worth more or less than the original cost. To obtain performance information current to the most recent month end, please visit www.diamond-hill.com. |
DIAMOND HILL FUNDS | ANNUAL REPORT | DECEMBER 31, 2019 | DIAMOND-HILL.COM 15 |
Diamond Hill Large Cap Fund |
2019 Portfolio Commentary
The Diamond Hill Large Cap Fund (Class I) returned 32.18% in 2019 compared to 31.43% for the Russell 1000 Index. The year was very gratifying as the strong performance followed an extremely disappointing fourth quarter of 2018. The selloff at the end of 2018 provided attractive valuations which led to the outsized opportunity in 2019. Much of the 2019 performance can be explained by the actions of the Federal Reserve. Following several tightening moves in the preceding year, the Federal Reserve began the easing process which led to the rapid market recovery. The rally was somewhat counterintuitive in light of very muted corporate earnings growth during the calendar year. However, earnings multiples expanded in an environment of accommodative central bank action and low long-term interest rates. As 2019 came to an end the market was at an all-time high and earnings multiples had expanded meaningfully. While these valuations are historically high, they appear justified in an environment of secularly low long-term interest rates and continued economic expansion.
The impact of Federal Reserve easing can be seen in the sector performance as well. The financials sector was the largest contributor to the Fund’s outperformance in 2019. This represented a recovery from the previous year’s performance during the Federal Reserve tightening cycle. The largest holding in the portfolio, Citigroup, Inc., returned in excess of 50% as an inexpensive valuation combined with an improvement in earnings provided meaningful outperformance for the stock. Other financials sector holdings such as Discover Financial Services and JPMorgan Chase & Co. returned in excess of 40% for the year, illustrating the value of maintaining a long-term perspective even when near-term fundamentals may be challenging. The financials sector disappointed in 2018 due to concerns about a slowing economy, but valuations continued to be attractive. By maintaining these positions during periods of temporary duress the Fund was able to benefit from the 2019 recovery.
The communications services sector also contributed meaningfully to the Fund’s positive performance in 2019. Charter Communications, Inc. returned slightly more than 70% for the year and the company continued to focus on its high-speed digital services. The legacy cable entertainment business remains important, but the strategic direction of the company is in the higher growth digital services business. Walt Disney Co. was the largest holding in the communications services sector, and it returned 34% for the year. We increased the Fund’s position in Disney during the year as market skepticism toward the successful transition to streaming services allowed us to purchase the shares at an attractive valuation. The combination of the company’s unique assets combined with some of the best management in corporate America gave us the confidence to make this a top 10 holding.
The consumer discretionary sector holdings reflect a wide variety of industries tied to the health of the domestic economy. Our most successful investment in this sector for 2019 was NVR, Inc. This is a high-quality homebuilder whose shares had become unusually inexpensive due to concerns regarding rising interest rates. As interest rates retreated during the year the share price increased. Housing activity remained strong throughout the year allowing the company to achieve its financial goals. Similarly, TJX Cos., Inc. was very strong throughout the year as the retailer continued to gain market share from traditional mall-based department stores. Rising
16 DIAMOND HILL FUNDS | ANNUAL REPORT | DECEMBER 31, 2019 | DIAMOND-HILL.COM |
Diamond Hill Large Cap Fund |
costs did pressure margins, but the continued strong revenue growth allowed TJX to report a very successful 2019. Our weaker holdings in the consumer discretionary sector were generally tied to the automotive industry. General Motors Co. provided a positive return, but it trailed the market as domestic and Chinese automotive sales were disappointing. While the shares remain inexpensive, the disappointing worldwide automotive market remains a risk to the company.
Our small underweight position in the information technology sector was the largest detractor to 2019 relative performance, more than offsetting very good stock selection in the sector. Microsoft Corp. was a large holding that returned in excess of 57% as strong growth in its cloud business drove improved earnings growth and an expansion of the earnings multiple. Microsoft remains a large holding as we are optimistic regarding its future growth opportunities. Fidelity National Information Systems entered the portfolio as a result of the Worldpay acquisition. The 85% return this security provided made this our best performer in 2019. We still own the shares in the portfolio as the growth opportunity is compelling. However, the strong performance of Fidelity National Information Systems and Microsoft was not enough to compensate for our relatively small exposure to the group.
As 2019 concludes, the financials sector remains the largest exposure for the portfolio. This sector has been attractive for several years as the continued recovery in profitability combined with inexpensive valuations to make this sector an attractive investment in an environment of record-high equity valuations. However, while the financials sector weight was stable there has been meaningful rotation of the holdings within the sector. The property/casualty insurers are much bigger weightings in the portfolio as are new specialty financial services companies such as Charles Schwab Corp. In order to provide capital for these investments, we have reduced our exposure to the traditional banking sector. Citigroup, Inc. remains the largest position, but other banks have been trimmed or eliminated.
2019 was an excellent year for investors despite relatively slow earnings growth for corporate America. In an environment where 10-year Treasury bonds yield less than 2%, equities have provided an attractive alternative. And while we remain optimistic, it would be prudent for investors to remain disciplined regarding expected future returns. Higher equity valuation levels will require future returns to come from earnings growth and dividend yield, with less opportunity for multiple expansion. Fortunately, earnings growth should improve in 2020 and dividend yields are reasonable considering the low interest rate environment. Therefore, long-term equity investors should be able to receive a normal equity risk premium at current market valuations.
DIAMOND HILL FUNDS | ANNUAL REPORT | DECEMBER 31, 2019 | DIAMOND-HILL.COM 17 |
Diamond Hill Large Cap Fund |
We appreciate the faith investors have placed in us. We have experienced a wide variety of market environments and each provides unique challenges. We have found these challenges are best met with a long-term perspective. Thank you for your continued support and we look forward to new opportunities in the new decade ahead.

| 
|
Chuck Bath, CFA
Portfolio Manager | Austin Hawley, CFA
Portfolio Manager |
18 DIAMOND HILL FUNDS | ANNUAL REPORT | DECEMBER 31, 2019 | DIAMOND-HILL.COM |
Diamond Hill Large Cap Fund |
AVERAGE ANNUAL TOTAL RETURNS AS OF DECEMBER 31, 2019
| Inception
Date | One
Year | Three
Years | Five
Years | Ten
Years | Expense
Ratio* |
PERFORMANCE AT NAV WITHOUT SALES CHARGES |
Class A Shares | 6/29/2001 | 31.80% | 12.52% | 9.99% | 11.78% | 0.96% |
Class C Shares | 9/25/2001 | 30.84 | 11.68 | 9.17 | 10.94 | 1.71 |
Class I Shares | 1/31/2005 | 32.18 | 12.84 | 10.31 | 12.09 | 0.67 |
Class Y Shares | 12/30/2011 | 32.34 | 12.97 | 10.43 | 12.14 | 0.55 |
BENCHMARK |
Russell 1000 Index | | 31.43 | 15.05 | 11.48 | 13.54 | — |
PERFORMANCE AT PUBLIC OFFERING PRICE INCLUDING SALES CHARGES** |
Class A Shares | 6/29/2001 | 25.23 | 10.62 | 8.87 | 11.20 | 0.96 |
Class C Shares | 9/25/2001 | 29.84 | 11.68 | 9.17 | 10.94 | 1.71 |
* Reflects the expense ratio as reported in the Prospectus dated February 28, 2020. ** The maximum sales charge for Class A shares on purchases and for Class C shares on certain redemptions are 5.00% and 1.00%, respectively. |
GROWTH OF $10,000
Comparison of the change in value of a $10,000 Investment in the Diamond Hill Large Cap Fund Class I(A) and the Russell 1000 Index.
(A) | The growth of $10,000 chart represents the performance of Class I shares only, which will vary from the performance of Class A, Class C and Class Y shares based on the difference in loads and fees paid by shareholders in the different classes. |
| The performance of the above Fund does not reflect the deduction of taxes that a shareholder would pay on Fund distributions or the redemption of Fund shares. |
| The chart above represents a comparison of a hypothetical $10,000 investment and the reinvestment of dividends and capital gains in the indicated share class versus a similar investment in the Russell 1000 Index (“Index”). The Index is an unmanaged market capitalization weighted index measuring the performance of the largest 1,000 companies by market capitalization in the Russell 3000 Index. The Russell 3000 Index is an unmanaged market capitalization weighted index measuring the performance of the 3,000 largest U.S. companies based on total market capitalization. The Index does not reflect the deduction of fees associated with a mutual fund such as investment management and accounting fees. The Fund’s performance reflects the deduction of fees for these services. Investors cannot invest directly in an index although they can invest in the underlying securities. |
| Historical performance for Class Y shares prior to its inception is based on the performance of Class A shares. Class Y performance has been adjusted to reflect differences in sales charges and expenses between classes. |
| Past performance does not guarantee future results. The performance data quoted represents past performance and current returns may be lower or higher. The investment return and principal value will fluctuate so that an investor’s shares, when redeemed, may be worth more or less than the original cost. To obtain performance information current to the most recent month end, please visit www.diamond-hill.com. |
DIAMOND HILL FUNDS | ANNUAL REPORT | DECEMBER 31, 2019 | DIAMOND-HILL.COM 19 |
Diamond Hill All Cap Select Fund |
2019 Portfolio Commentary
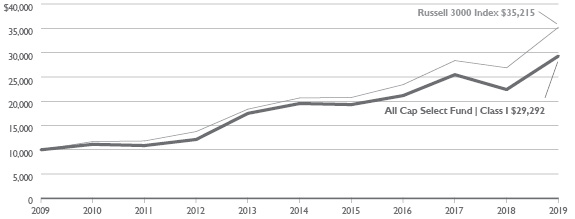
Equity markets posted very strong performance in 2019. By May 1, the fourth quarter selloff in 2018 had largely been recovered, and from that point to the end of the year, the Russell 3000 Index gained another 9%, finishing the year up 31.02%. Growth stocks again outperformed value stocks, with the Russell 3000 Growth Index returning 35.85%, while the Russell 3000 Value Index returned 26.26%. Additionally, larger companies again outperformed, with the Russell 1000 Index returning 31.43% while the Russell 2000 Index returned 25.52%. Despite these headwinds, the All Cap Select Fund (Class I) managed to keep pace with the exceptional returns of the Russell 3000 Index, returning 30.77%.
Equity market returns were aided by more accommodative central bank behavior, with the Federal Reserve reducing short-term interest rates three times in 2019. Sentiment on trade negotiations with China was volatile, seeming to bounce back and forth with each presidential tweet, but directionally trade tensions eased through the year. The combination of more dovish Federal Reserve policy and optimism about a potential resolution to ongoing trade tensions provided tailwinds for more economically sensitive sectors of the market. The energy sector was a clear exception to these trends, posting the worst returns of any sector in 2019 despite rising Brent Crude and West Texas Intermediate oil prices. The divergence between energy stocks and the underlying commodities was likely due to the realization that transportation infrastructure to move U.S. shale oil is constrained and that the quick-cycle nature of shale oil drilling ensures that excess returns are very quickly competed away. On the positive side, the information technology sector continued its strong run of performance, with the sector up nearly 50% and shares of several of the largest companies rising considerably more. Apple, the largest U.S.-based company, saw its shares rise nearly 90% to a market capitalization of almost $2 trillion.
Our largest sector exposure throughout 2019, and the past several years, was financials. The financials sector was the largest absolute contributor to Fund return in 2019 and a modestly positive contributor to relative return. Several holdings in the financials sector appreciated by 30% or more during the year, with specialty banking franchises Bank OZK and First Republic Bank producing the strongest returns at nearly 40%. New holdings KKR & Co., Inc. (Cl A) and Charles Schwab Corp. were strong contributors to performance over relatively short holding periods, reflecting strong earnings prospects and value creating M&A activity. All of our holdings in the financials sector benefitted to some degree from looser monetary policy and the resulting recovery in economic growth expectations, which allowed most of our holdings to more than recover the sharp losses experienced in the fourth quarter of 2018.
Industrials were once again a bright spot for the Fund, with six out of seven holdings in 2019 producing returns of more than 30%, and the sector registering our largest positive relative performance during the year. The industrials sector benefitted from an improving economic growth outlook over the course of 2019, and our focus on niche businesses like Cimpress PLC, Colfax Corp., Hub Group, Inc. and Kirby Corp. as well as improving airline fundamentals have helped us produce strong relative returns over the past couple of years.
20 DIAMOND HILL FUNDS | ANNUAL REPORT | DECEMBER 31, 2019 | DIAMOND-HILL.COM |
Diamond Hill All Cap Select Fund |
Information technology was the Fund’s worst-performing sector relative to its benchmark, driven by our significant underweight to the sector compared to the Russell 3000 Index. Through most of 2019 we held a stake in only one technology company, Sanmina Corp. Sanmina produced improved earnings in 2019 and saw its stock price appreciate by over 40%, but trailed the 49% return of the information technology sector of the benchmark. While the Fund continues to be meaningfully underweight in the technology sector, we believe this analysis underrepresents the exposure we have to innovative and fast-growing firms. Alphabet, Inc. and Facebook, Inc. are notable examples of firms that we think of as providing “technology” exposure, and each produced strong results in 2019, but both reside in the communications service sector.
Another challenging sector for us was energy, one in which we owned two U.S. shale oil producers but ultimately exited those holdings. Our view has been, and still is, that U.S. shale producers will increasingly be called upon to balance the world market as OPEC has learned that it is a losing battle to attempt to protect market share by capping prices. This still appears to be accurate, but we now also believe, as mentioned above, that the structure of the U.S. shale oil industry is such that reasonable returns on capital will be very difficult to achieve. There are multiple problems: unlike deep water wells, shale wells can be drilled and begin producing very quickly, meaning demand-driven price increases are very short lived; secrets are hard to keep in the oil patch, meaning any technology edge gained by an individual driller is quickly incorporated by its competitors; when volumes do ramp up to meet demand, there is a chronic lack of capacity in the transportation system to affordably move product to market; and the market for formerly valuable by-products such as natural gas and natural gas-liquids (NGL) is proving to be inelastic resulting in significant price declines and lost profits.
As we discussed in last year’s annual letter, we were busier than usual in the final quarter of 2018, repositioning the Fund to capitalize on the sharp sell-off in both existing holdings and new ideas that had been on our on-deck list. On balance, our activity during that brief period provided a modest positive boost to Fund results in 2019. In contrast, our turnover has been greatly reduced over the course of 2019 as valuations for many businesses we would like to own have moved higher and higher, eroding any margin of safety that may have existed. We continue to scour our universe of potential investments for overlooked and misunderstood companies, but in the absence of more significant market volatility we are happy to participate in the value creating activities of our current portfolio holdings, whether it be investments for future growth or returns of cash to shareholders via dividends and buybacks.
We appreciate your continued support.

| 
|
Austin Hawley, CFA
Portfolio Manager | Rick Snowdon, CFA
Portfolio Manager |
DIAMOND HILL FUNDS | ANNUAL REPORT | DECEMBER 31, 2019 | DIAMOND-HILL.COM 21 |
Diamond Hill All Cap Select Fund |
AVERAGE ANNUAL TOTAL RETURNS AS OF DECEMBER 31, 2019
| Inception
Date | One
Year | Three
Years | Five
Years | Ten
Years | Expense
Ratio* |
PERFORMANCE AT NAV WITHOUT SALES CHARGES |
Class A Shares | 12/30/2005 | 30.41% | 11.10% | 8.13% | 11.04% | 1.16% |
Class C Shares | 12/30/2005 | 29.39 | 10.29 | 7.32 | 10.21 | 1.91 |
Class I Shares | 12/30/2005 | 30.77 | 11.45 | 8.45 | 11.35 | 0.87 |
Class Y Shares | 12/30/2011 | 30.96 | 11.58 | 8.56 | 11.39 | 0.75 |
BENCHMARK |
Russell 3000 Index | | 31.02 | 14.57 | 11.24 | 13.42 | — |
PERFORMANCE AT PUBLIC OFFERING PRICE INCLUDING SALES CHARGES** |
Class A Shares | 12/30/2005 | 23.85 | 9.23 | 7.03 | 10.47 | 1.16 |
Class C Shares | 12/30/2005 | 28.39 | 10.29 | 7.32 | 10.21 | 1.91 |
* Reflects the expense ratio as reported in the Prospectus dated February 28, 2020. ** The maximum sales charge for Class A shares on purchases and for Class C shares on certain redemptions are 5.00% and 1.00%, respectively. |
GROWTH OF $10,000
Comparison of the change in value of a $10,000 Investment in the Diamond Hill All Cap Select Fund Class I(A) and the Russell 3000 Index.
(A) | The growth of $10,000 chart represents the performance of Class I shares only, which will vary from the performance of Class A, Class C and Class Y shares based on the difference in loads and fees paid by shareholders in the different classes. |
| The performance of the above Fund does not reflect the deduction of taxes that a shareholder would pay on Fund distributions or the redemption of Fund shares. |
| The chart above represents a comparison of a hypothetical $10,000 investment and the reinvestment of dividends and capital gains in the indicated share class versus a similar investment in the Russell 3000 Index (“Index”). The Index is an unmanaged market capitalization weighted index measuring the performance of the 3,000 largest U.S. companies by total market capitalization. The Index does not reflect the deduction of fees associated with a mutual fund such as investment management and accounting fees. The Fund’s performance reflects the deduction of fees for these services. Investors cannot invest directly in an index although they can invest in the underlying securities. |
| Historical performance for Class Y shares prior to its inception is based on the performance of Class A shares. Class Y performance has been adjusted to reflect differences in sales charges and expenses between classes. |
| Past performance does not guarantee future results. The performance data quoted represents past performance and current returns may be lower or higher. The investment return and principal value will fluctuate so that an investor’s shares, when redeemed, may be worth more or less than the original cost. To obtain performance information current to the most recent month end, please visit www.diamond-hill.com. |
22 DIAMOND HILL FUNDS | ANNUAL REPORT | DECEMBER 31, 2019 | DIAMOND-HILL.COM |
Diamond Hill Long-Short Fund |
2019 Portfolio Commentary
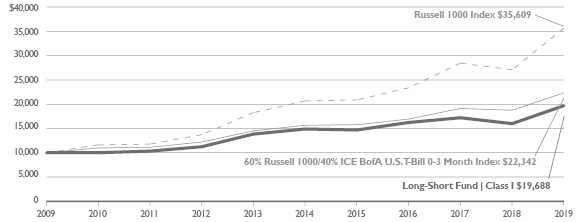
The Diamond Hill Long-Short Fund (Class I) returned 23.11% in 2019 compared to 31.43% for the long-only Russell 1000 Index and 19.15% for the blended benchmark (60% Russell 1000 Index/40% ICE BofA U.S. T-Bill 0-3 Month Index). The portfolio lagged the long-only benchmark in a strong market, but outperformed the blended benchmark, which considers the portfolio’s general 60% net long bias, by close to 4% for the year. The Fund’s five-year annualized return was 5.74%. This trailed both the Russell 1000 Index and blended benchmark, which increased 11.48% and 7.37% respectively. During the year, the long side of the portfolio outperformed the Russell 1000 Index by 187 basis points while the short portfolio underperformed by 1,243 basis points. We are pleased with the relative performance from both sides of the portfolio for the year, particularly the short portfolio.
The net exposure of the portfolio declined throughout the year. We entered the year with net exposure of 69%, towards the upper end of our range and well above our long-term average of around 60%. The strong market sell-off in December of 2018 presented us with attractive opportunities on the long side of the portfolio and reduced the opportunity set on the short side as we entered 2019. As the market rallied throughout the year, this situation reversed itself with narrower discounts to our intrinsic value estimates in the long portfolio and short opportunities becoming more plentiful. As a result, we reduced net exposure throughout the year and ended the year with net exposure of 57%, slightly below our long-term average. Gross exposure moved higher throughout the year, starting the year at 109% and ending 2019 at 116%. This is consistent with our intention to increase gross exposure from the levels of recent years.
On the long side of the portfolio, the largest positive contributions to performance came from the financials sector lead by Citigroup, the Fund’s largest position throughout the year. Citi continues to improve its return profile as it executes its expense initiatives. Improvements in the company’s credit card business, along with expense controls, created operating leverage and resulted in operating earnings growth throughout the year despite a sluggish overall revenue environment. Further, the company continues to return capital to shareholders at a healthy pace and the stock price remains relatively attractive despite its strong outperformance in 2019.
We had several long positions announce agreements to be acquired during 2019, including World Pay, which was acquired by Fidelity National Information Services, Inc. We like the strategic positioning of the combined company in the global payments industry and we remain shareholders of Fidelity National Information Services as the stock is trading below our estimate of intrinsic value. Allergan PLC announced an agreement to be acquired by AbbVie, Inc. for a combination of stock and cash in a transaction we view as favorable for both companies. The deal is expected to close by the end of the first quarter of 2020.
Other strong contributors to the long portfolio were Facebook, Inc. (Cl A) and Johnson Controls International PLC. Facebook reported strong revenue growth throughout the year and customer engagement trends are encouraging. Entering 2019, Facebook’s valuation was depressed, reflecting concerns regarding data privacy issues. Throughout 2019 the multiple expanded, reflecting reduced concerns as the company has managed the data privacy issues reasonably well to date. The company continues to face regulatory concerns, but we expect this to be manageable
DIAMOND HILL FUNDS | ANNUAL REPORT | DECEMBER 31, 2019 | DIAMOND-HILL.COM 23 |
Diamond Hill Long-Short Fund |
over the long term. Finally, Johnson Controls’ fundamental performance continues to improve as improving free cash flow conversion is allowing the company to reinvest in the business, de-lever the balance sheet, and repurchase shares at attractive prices.
We were pleased that the short portfolio meaningfully underperformed the Russell 1000 Index during the year. The largest contributor to the short portfolio was Stamps.com, Inc., which declined 75% from the beginning of the year through when we covered the position during the second quarter. Stamps.com was a long-time short position and was a negative contributor to performance for most of the holding period through 2018. However, early this year our thesis came to fruition as the U.S. Postal Service modified its relationship with Stamps.com including changes to the postage reseller program, which we estimated represented a disproportionate amount of the company’s profitability. As a result, Stamps.com issued disappointing 2019 guidance in February and significantly reduced guidance further in May. At that point, we exited the position as the stock price approached our estimate of intrinsic value and reflected our estimate of normalized profitability.
Last year we wrote that the outlook for domestic equities had improved meaningfully after the sell-off in late 2018. As we write this in early 2020, our outlook for long-term returns are more muted following a 30%-plus return from the equity markets in 2019. We view mid-single-digit long-term returns from the domestic equity market as a reasonable expectation from current levels. This should be a favorable environment for the Fund relative to the long-only benchmark. We remain focused on adding alpha on both the long and short sides of the portfolio. Notably, if we achieve these goals, the Fund should achieve better relative returns in a lower return environment while experiencing lower long-term volatility than long-only alternatives.
We appreciate your continued support.

| 
|
Chris Bingaman, CFA
Portfolio Manager | Jason Downey, CFA
Portfolio Manager |
| | |

| 
|
Chuck Bath, CFA
Assistant Portfolio Manager | Nate Palmer, CFA
Assistant Portfolio Manager |
24 DIAMOND HILL FUNDS | ANNUAL REPORT | DECEMBER 31, 2019 | DIAMOND-HILL.COM |
Diamond Hill Long-Short Fund |
AVERAGE ANNUAL TOTAL RETURNS AS OF DECEMBER 31, 2019
| Inception
Date | One
Year | Three
Years | Five
Years | Ten
Years | Expense
Ratio* |
PERFORMANCE AT NAV WITHOUT SALES CHARGES |
Class A Shares | 6/30/2000 | 22.74% | 6.33% | 5.44% | 6.70% | 1.84% |
Class C Shares | 2/13/2001 | 21.80 | 5.53 | 4.65 | 5.91 | 2.59 |
Class I Shares | 1/31/2005 | 23.11 | 6.65 | 5.74 | 7.01 | 1.55 |
Class Y Shares | 12/30/2011 | 23.23 | 6.76 | 5.87 | 7.05 | 1.43 |
BENCHMARK |
Russell 1000 Index | | 31.43 | 15.05 | 11.48 | 13.54 | — |
60% Russell 1000 Index/40% ICE BofA U.S. T-Bill 0-3 Month Index | | 19.15 | 9.69 | 7.37 | 8.37 | — |
PERFORMANCE AT PUBLIC OFFERING PRICE INCLUDING SALES CHARGES** |
Class A Shares | 6/30/2000 | 16.60 | 4.53 | 4.36 | 6.16 | 1.84 |
Class C Shares | 2/13/2001 | 20.80 | 5.53 | 4.65 | 5.91 | 2.59 |
* Reflects the expense ratio as reported in the Prospectus dated February 28, 2020. ** The maximum sales charge for Class A shares on purchases and for Class C shares on certain redemptions are 5.00% and 1.00%, respectively. |
GROWTH OF $10,000
Comparison of the change in value of a $10,000 Investment in the Diamond Hill Long-Short Fund Class I(A), the Russell 1000 Index and the Blended Index (60% Russell 1000 Index and 40% ICE BofA U.S. T-Bill 0-3 Month Index)
(A) | The growth of $10,000 chart represents the performance of Class I shares only, which will vary from the performance of Class A, Class C and Class Y shares based on the difference in loads and fees paid by shareholders in the different classes. |
| The performance of the above Fund does not reflect the deduction of taxes that a shareholder would pay on Fund distributions or the redemption of Fund shares. |
| The chart above represents a comparison of a hypothetical $10,000 investment and the reinvestment of dividends and capital gains in the indicated share class versus a similar investment in the Russell 1000 Index and the blended index. The Russell 1000 Index is an unmanaged market capitalization weighted index measuring the performance of the largest 1,000 companies by market capitalization in the Russell 3000 Index. The Russell 3000 Index is an unmanaged market capitalization weighted index measuring the performance of the 3,000 largest U.S. companies based on total market capitalization. The Blended Index represents a 60% weighting of the Russell 1000 Index as described above and a 40% weighting of the ICE BofA U.S. T-Bill 0-3 Month Index. The ICE BofA U.S. T-Bill 0-3 Month Index is an unmanaged index measuring the performance of U.S. dollar denominated U.S. Treasury Bills with a term to maturity of less than 3 months. The index data referenced herein is the property of ICE Data Indices, LLC, its affiliates (“ICE Data”) and/or its third party suppliers and has been licensed for use by Diamond Hill Capital Management, Inc. ICE Data and its third party suppliers accept no liability in connection with its use. See diamond-hill.com for a full copy of the disclaimer. These indices do not incur fees and expenses (which would lower returns) and are not available for direct investment. ICE Data was not involved in the creation of the blended index. Both indices do not reflect the deduction of fees associated with a mutual fund such as investment management and accounting fees. The Fund’s performance reflects the deduction of fees for these services. Investors cannot invest directly in an index although they can invest in the underlying securities. |
| Historical performance for Class Y shares prior to its inception is based on the performance of Class A shares. Class Y performance has been adjusted to reflect differences in sales charges and expenses between classes. |
| Past performance does not guarantee future results. The performance data quoted represents past performance and current returns may be lower or higher. The investment return and principal value will fluctuate so that an investor’s shares, when redeemed, may be worth more or less than the original cost. To obtain performance information current to the most recent month end, please visit www.diamond-hill.com. |
DIAMOND HILL FUNDS | ANNUAL REPORT | DECEMBER 31, 2019 | DIAMOND-HILL.COM 25 |
Diamond Hill Research Opportunities Fund |
2019 Portfolio Commentary
The Diamond Hill Research Opportunities Fund (Class I) returned 25.51% during 2019 compared to a 31.02% return for our primary benchmark, the long-only Russell 3000 Index. At Diamond Hill, we have a long-term investment horizon and evaluate our performance over rolling five-year periods. At the end of 2019, our five-year annualized return was 5.29% versus 11.24% for the Russell 3000 Index. A secondary benchmark, which reflects our long-term average net exposure, is comprised of 75% Russell 3000 Index and 25% ICE BofA U.S. T-Bill 0-3 Month Index. The performance of this secondary benchmark was 23.38% and 8.75% for the trailing one-year and five-year periods, respectively.
Our most recent five-year results have not met the standards we set for ourselves. During the strong market in 2019, our long portfolio mostly kept up with the Russell 3000 Index, while the short portfolio was a detractor. Net exposure was relatively consistent throughout the year in the mid-to high-80s and we ended the year with net exposure of 79%, compared to the Fund’s five-year average of 75. Gross exposure ended 2019 at 116%, compared to 123% at year-end 2018.
The two largest contributors to absolute performance during 2019 were holdings Facebook, Inc. (Cl A) and Allergan PLC. Social media company Facebook’s advertising initiatives continue to drive revenue growth for the company at attractive margins. The company continues to face regulatory concerns from the Federal Trade Commission and other regulatory bodies. However, we expect the company to resolve these regulatory issues over the long term.
Specialty pharmaceutical company Allergan PLC has outperformed since the company agreed to a merger with AbbVie, Inc. during the second quarter of 2019. Fears over drug rebates have subsided and generic competition for Botox has been less of a threat than some investors had feared. We like the deal for both companies and see plentiful opportunities for value creation going forward.
The largest detractors from absolute return during 2019 were a long position in biopharmaceutical company Acorda Therapeutics, Inc. and a short position in electric car manufacturer Tesla, Inc. We initiated a position in Acorda in the first quarter with a view that the market was undervaluing commercial potential for the company’s inhalable drug delivery platform anchored by Inbrija, a Parkinson’s Disease treatment. Over the year, the company struggled with the launch of Inbrija and reported disappointing sales results. After the company’s recent debt and operational restructurings, we felt the risks have been elevated and our upside was limited; therefore, we chose to exit the position.
We initiated a short position in electric car manufacturer Tesla, Inc. in the first half of 2018. At the time, the company was having difficulty hitting production targets on its mass-market Model 3 and was getting dangerously low on cash and its production facility appeared to be at capacity. Tesla continued to disappoint through much of 2019 with lower-than-expected vehicle deliveries. However, the shares rose dramatically during the fourth quarter, as Tesla completed construction of a Chinese factory and began production. We believe most of the upside is in the current valuation and the competitive environment may still be a risk.
26 DIAMOND HILL FUNDS | ANNUAL REPORT | DECEMBER 31, 2019 | DIAMOND-HILL.COM |
Diamond Hill Research Opportunities Fund |
As of December 31, 2019, the Fund held 97 long and 46 short positions, with the top 10 positions representing 30.5% of net assets. Non-U.S. based investments made up 10.2% of fund assets, slightly down from 15.3% at year-end 2018.
We want to thank shareholders for their support and look forward to working together in the years ahead.
Diamond Hill Research Analysts
DIAMOND HILL FUNDS | ANNUAL REPORT | DECEMBER 31, 2019 | DIAMOND-HILL.COM 27 |
Diamond Hill Research Opportunities Fund |
AVERAGE ANNUAL TOTAL RETURNS AS OF DECEMBER 31, 2019
| Inception
Date | One
Year | Three
Years | Five
Years | Ten
Years* | Expense
Ratio** |
PERFORMANCE AT NAV WITHOUT SALES CHARGES |
Class A Shares | 12/30/2011 | 25.13% | 7.12% | 5.00% | 8.60% | 1.79% |
Class C Shares | 12/30/2011 | 24.28 | 6.32 | 4.21 | 7.80 | 2.54 |
Class I Shares | 12/30/2011 | 25.51 | 7.42 | 5.29 | 8.90 | 1.50 |
Class Y Shares | 12/30/2011 | 25.64 | 7.56 | 5.42 | 9.04 | 1.38 |
BENCHMARK |
Russell 3000 Index | | 31.02 | 14.57 | 11.24 | 13.42 | — |
75% Russell 3000 Index/25% ICE BofA U.S. T-Bill 0-3 Month Index | | 23.38 | 11.36 | 8.75 | 10.23 | — |
PERFORMANCE AT PUBLIC OFFERING PRICE INCLUDING SALES CHARGES*** |
Class A Shares | 12/30/2011 | 18.84 | 5.30 | 3.92 | 8.05 | 1.79 |
Class C Shares | 12/30/2011 | 23.28 | 6.32 | 4.21 | 7.80 | 2.54 |
** Reflects the expense ratio as reported in the Prospectus dated February 28, 2020. *** The maximum sales charge for Class A shares on purchases and for Class C shares on certain redemptions are 5.00% and 1.00%, respectively. |
GROWTH OF $10,000
Comparison of the change in value of a $10,000 Investment in the Diamond Hill Research Opportunities Fund Class I(A), the Russell 3000 Index and the Blended Index (75% Russell 3000 Index and 25% ICE BofA U.S. T-Bill 0-3 Month Index).
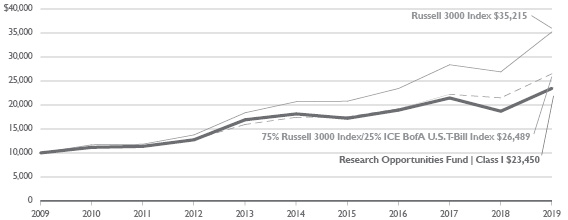
(A) | The growth of $10,000 chart represents the performance of Class I shares only, which will vary from the performance of Class A, Class C and Class Y shares based on the difference in loads and fees paid by shareholders in the different classes. |
| The performance of the above Fund does not reflect the deduction of taxes that a shareholder would pay on Fund distributions or the redemption of Fund shares. |
| The chart above represents a comparison of a hypothetical $10,000 investment and the reinvestment of dividends and capital gains in the indicated share class versus a similar investment in the Russell 3000 Index (“Index”). The Index is an unmanaged market capitalization weighted index comprised of the 3,000 largest U.S. companies by total market capitalization. The Blended Index represents a 75% weighting of the Russell 3000 Index and a 25% weighting of the ICE BofA U.S. T-Bill 0-3 Month Index. The ICE BofA U.S. T-Bill 0-3 Month Index is an unmanaged index measuring the performance of U.S. dollar denominated U.S. Treasury Bills with a term to maturity of less than 3 months. The index data referenced herein is the property of ICE Data Indices, LLC, its affiliates (“ICE Data”) and/or its third party suppliers and has been licensed for use by Diamond Hill Capital Management, Inc. ICE Data and its third party suppliers accept no liability in connection with its use. See diamond-hill.com for a full copy of the disclaimer. These indices do not incur fees and expenses (which would lower returns) and are not available for direct investment. ICE Data was not involved in the creation of the blended index. Both indices do not reflect the deduction of fees associated with a mutual fund such as investment management and accounting fees. The Fund’s performance reflects the deduction of fees for these services. Investors cannot invest directly in an index although they can invest in the underlying securities. |
* | The quoted performance for the Fund reflects the past performance of Diamond Hill Research Partners, L. P. (the “Research Partnership”), a private fund managed with full investment authority by the Fund’s Adviser for periods prior to the fund’s inception date. The Fund is managed in all material respects in a manner equivalent to the management of the predecessor unregistered fund. The Fund’s objectives, policies, guidelines and restrictions are in all material respects equivalent to the predecessor, and the Fund was created for reasons entirely unrelated to the establishment of a performance record. The assets of the Research Partnership were converted into assets of the Fund prior to commencement of operation of the Fund. The Fund’s inception date is December 30, 2011. The performance of the Research Partnership has been restated to reflect the net expenses and maximum applicable sales charge of the Fund for its initial years of investment operations. The Research Partnership was not registered under the Investment Company Act of 1940 and therefore was not subject to certain investment restrictions imposed by the 1940 Act. If the Research Partnership had been registered under the 1940 Act, its performance may have been adversely affected. Performance is measured from March 31, 2009, the inception of the Research Partnership and is not the performance of the Fund for the period prior to December 30, 2011. The Research Partnership’s past performance is not necessarily an indication of how the Fund will perform in the future either before or after taxes. |
| Past performance does not guarantee future results. The performance data quoted represents past performance and current returns may be lower or higher. The investment return and principal value will fluctuate so that an investor’s shares, when redeemed, may be worth more or less than the original cost. To obtain performance information current to the most recent month end, please visit www.diamond-hill.com. |
28 DIAMOND HILL FUNDS | ANNUAL REPORT | DECEMBER 31, 2019 | DIAMOND-HILL.COM |
2019 Portfolio Commentary
During 2019, the Diamond Hill Global Fund (Class I) delivered a 30.34% return, compared to a 26.24% return for our benchmark, the Morningstar Global Markets Index. For the five years ended December 31, 2019, the Fund delivered an annualized return of 8.51%, compared to an 8.37% return for our benchmark.
Equity markets in nearly every major country appreciated during 2019, while the U.S. dollar was relatively stable compared to most currencies to which our fund is exposed. We attribute a significant portion of the Fund’s strong gains in 2019 to attractive valuations for much of the portfolio at the beginning of the year. Today, portfolio valuations look reasonable, but not exceptionally compelling.
Every sector of our benchmark except energy generated returns of over 20%, and even the lagging energy sector generated a double-digit benchmark return. The near uniform strength of equity returns by both sector and country is reflected in the returns of the Global Fund’s individual holdings. Only two businesses owned in the Fund had a material negative contribution to the Fund’s performance in 2019. And even these two, Cimarex Energy Co. and Baidu, Inc., together subtracted only about one percentage point from the Fund’s full-year return. Moreover, approximately 80% of the Fund holdings generated double-digit returns, and more than a third of the Fund’s holdings generated individual returns of greater than 40%. Clearly, 2019 was a stellar year for equity investors.
Given our view that valuations are less attractive today than they were at the end of 2018, we also expect forward five-year returns to be lower today than they were at the end of 2018.
Moreover, global geopolitical and macroeconomic issues that contributed to weak equity returns in 2018 have not been resolved. The U.K. finally appears to be on track to exit the European Union, but the two blocks have yet to negotiate terms of the exit. The U.S. has announced an initial trade deal with China, but tariffs remain in place and important long-term issues such as market access and intellectual property protection will likely linger. The U.S. yield curve is no longer inverted, but inflation and long-term interest rates remain stubbornly low. Finally, global economic growth slowed throughout 2019, and while forecasters expect improvement in 2020, this outcome is far from certain.
The issues listed above could lead to significant but temporary declines in stock prices that are based on sentiment or short-term fundamental weakness rather than declines in business valuations. We’re confident that the companies owned in the Global Fund can weather any potential economic weakness. Several of them are positioned to potentially take share from
DIAMOND HILL FUNDS | ANNUAL REPORT | DECEMBER 31, 2019 | DIAMOND-HILL.COM 29 |
weaker competitors or acquire attractively valued assets in the event of a downturn. We’ll seek to take advantage when a company’s stock price declines without a corresponding decline in intrinsic value.
Thank you for your continued support.

| 
|
Grady Burkett, CFA
Portfolio Manager | Rick Snowdon, CFA
Portfolio Manager |
30 DIAMOND HILL FUNDS | ANNUAL REPORT | DECEMBER 31, 2019 | DIAMOND-HILL.COM |
AVERAGE ANNUAL TOTAL RETURNS AS OF DECEMBER 31, 2019
| Inception
Date | One
Year | Three
Years* | Five
Years* | Since
Inception* | Expense
Ratio** |
PERFORMANCE AT NAV WITHOUT SALES CHARGES |
Class A Shares | 12/29/2017 | 29.96% | 12.64% | 8.19% | 7.21% | 1.14% |
Class I Shares | 12/29/2017 | 30.34 | 12.97 | 8.51 | 7.53 | 0.85 |
Class Y Shares | 12/29/2017 | 30.54 | 13.11 | 8.64 | 7.65 | 0.73 |
BENCHMARK |
Morningstar Global Markets Index | | 26.24 | 12.14 | 8.37 | 7.63 | — |
PERFORMANCE AT PUBLIC OFFERING PRICE INCLUDING SALES CHARGES*** |
Class A Shares | 12/29/2017 | 23.50 | 10.73 | 7.09 | 6.29 | 1.14 |
** Reflects the expense ratio as reported in the Prospectus dated February 28, 2020. *** The maximum sales charge for Class A shares on purchases is 5.00%. |
GROWTH OF $10,000
Comparison of the change in value of a $10,000 Investment in the Diamond Hill Global Fund Class I(A) and the Morningstar Global Markets Index.
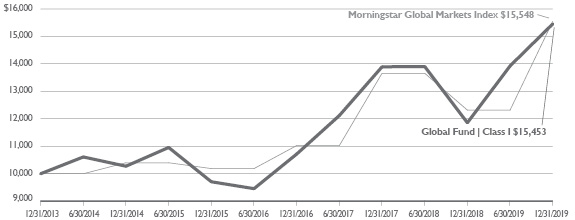
(A) | The growth of $10,000 chart represents the performance of Class I shares only, which will vary from the performance of Class A and Class Y shares based on the difference in loads and fees paid by shareholders in the different classes. |
| The performance of the above Fund does not reflect the deduction of taxes that a shareholder would pay on Fund distributions or the redemption of Fund shares. |
| The chart above represents the comparison of a hypothetical $10,000 investment and the reinvestment of dividends and capital gains in the indicated share class versus a similar investment in the Morningstar Global Markets Index (“Index”). The Index is an unmanaged, float market capitalization weighted index measuring the performance of more than 7,000 securities and is designed to cover 97% of the equity market capitalization of developed and emerging markets. The index (net) returns are calculated applying dividend withholding rates applicable to non-resident persons who do not benefit from double taxation treaties. Withholding rates applicable to the fund may be lower. The Index does not reflect the deduction of fees associated with a mutual fund such as investment management and accounting fees. The Fund’s performance reflects the deduction of fees for these services. Investors cannot invest directly in an index although they can invest in the underlying securities. |
* | The quoted performance of the Fund reflects the past performance of Diamond Hill Global Fund L.P. (the “Global Partnership”), a private fund managed with full investment authority by the Fund’s Adviser. The Fund is managed in all material respects in a manner equivalent to the management of the predecessor unregistered fund. The assets of the Global Partnership were converted into assets of the Fund prior to commencement of operation of the Fund. The performance of the Global Partnership has been restated to reflect the net expenses and maximum applicable sales charge of the Fund for its initial years of investment operation. The Global Partnership was not registered under the Investment Company Act of 1940 and therefore was not subject to certain investment restrictions imposed by the 1940 Act. If the Global Partnership had been registered under the 1940 Act, its performance may have been adversely affected. Performance is measured from December 31, 2013, the inception of the Global Partnership and is not the performance of the Fund. The assets of the Global Partnership were converted, based on their value on January 2, 2018, in assets of the Fund. The Global Partnership’s past performance is not necessarily an indication of how the Fund will perform in the future either before or after taxes. |
| Past performance does not guarantee future results. The performance data quoted represents past performance and current returns may be lower or higher. The investment return and principal value will fluctuate so that an investor’s shares, when redeemed, maybe worth more or less than the original cost. To obtain performance information current to the most recent month end, please visit www.diamond-hill.com. |
DIAMOND HILL FUNDS | ANNUAL REPORT | DECEMBER 31, 2019 | DIAMOND-HILL.COM 31 |
Diamond Hill International Fund |
2019 Portfolio Commentary
During 2019, the Diamond Hill International Fund (Class I) delivered a 23.56% return, compared to a 21.57% return for our benchmark, the Morningstar Global Markets ex-US Index. Since inception, the Fund has delivered an annualized return of 12.99%, compared to a 9.94% return for our benchmark.
Equity markets in nearly every major country appreciated during 2019, while the U.S. dollar was relatively stable compared to most currencies to which our fund is exposed. We attribute a significant portion of the Fund’s strong gains in 2019 to attractive valuations for much of the portfolio at the beginning of the year. Today, portfolio valuations look reasonable, but not exceptionally compelling.
Every sector of our benchmark generated double-digit returns, and the majority of sectors delivered returns above 20%. The near uniform strength of equity returns by both sector and country is reflected in the returns of the International Fund’s individual holdings. Only a few businesses owned in the Fund had negative contributions to the Fund’s performance in 2019. And combined, these companies subtracted less than two percentage points from total performance. Moreover, roughly 70% of the Fund’s holdings generated double-digit returns, and more than half of the Fund’s holdings generated individual returns of greater than 20%. Clearly, 2019 was a stellar year for equity investors.
Given our view that valuations are less attractive today than they were at the end of 2018, we also expect forward five-year returns to be lower today than they were at the end of 2018.
Moreover, global geopolitical and macroeconomic issues that contributed to weak equity returns in 2018 have not been resolved. At the end of 2019, the U.K. finally appears to be on track to exit the European Union, but the two blocks have yet to negotiate terms of the exit. The U.S. has announced an initial trade deal with China, but tariffs remain in place and important long-term issues such as market access and intellectual property protection will likely linger. Populist movements and political tensions continue to surface in various emerging economies. As seen recently with Iran, these events can quickly sour global market sentiment, at least temporarily. Finally, world economic growth slowed throughout 2019, and while forecasters expect improvement in 2020, this outcome is far from certain.
The issues listed above could lead to significant but temporary declines in stock prices that are based on sentiment or short-term fundamental weakness rather than declines in business valuations. We’re confident that the companies owned in the International Fund can weather any potential economic weakness. Several of them are positioned to potentially gain share from weaker competitors or acquire attractively valued assets in the event of a downturn. And we’ll seek to take advantage when a company’s stock price declines without a corresponding decline in intrinsic value.
32 DIAMOND HILL FUNDS | ANNUAL REPORT | DECEMBER 31, 2019 | DIAMOND-HILL.COM |
Diamond Hill International Fund |
In 2019, Diamond Hill created a dedicated research team to support the International strategy including Research Analyst Yiting Liu and Research Associates Chendhore Veerappan and Chris Piel. We also continue to benefit from contributions and insights provided by the firm’s entire research team.
Thank you for your continued support.

| 
|
Grady Burkett, CFA
Portfolio Manager | Krishna Mohanraj, CFA
Portfolio Manager |
DIAMOND HILL FUNDS | ANNUAL REPORT | DECEMBER 31, 2019 | DIAMOND-HILL.COM 33 |
Diamond Hill International Fund |
AVERAGE ANNUAL TOTAL RETURNS AS OF DECEMBER 31, 2019
| Inception
Date | One
Year* | Three
Years* | Expense
Ratio** |
PERFORMANCE AT NAV WITHOUT SALES CHARGES |
Class A Shares | 6/28/2019 | 23.20% | 12.66% | 1.21% |
Class I Shares | 6/28/2019 | 23.56 | 12.99 | 0.92 |
Class Y Shares | 6/28/2019 | 23.69 | 13.12 | 0.80 |
BENCHMARK |
Morningstar Global Markets ex U.S. Index | | 21.57 | 9.94 | — |
PERFORMANCE AT PUBLIC OFFERING PRICE INCLUDING SALES CHARGES*** |
Class A Shares | 6/28/2019 | 16.99 | 10.74 | 1.21 |
** Reflects the expense ratio as reported in the Prospectus dated February 28, 2020. *** The maximum sales charge for Class A shares on purchases is 5.00%. |
GROWTH OF $10,000
Comparison of the change in value of a $10,000 Investment in the Diamond Hill International Fund Class I(A) and the Morningstar Global Markets ex U.S. Index.
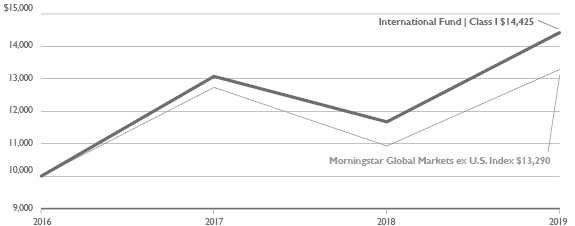
(A) | The growth of $10,000 chart represents the performance of Class I shares only, which will vary from the performance of Class A and Class Y shares based on the difference in loads and fees paid by shareholders in the different classes. |
| The performance of the above Fund does not reflect the deduction of taxes that a shareholder would pay on Fund distributions or the redemption of Fund shares. |
| The chart above represents the comparison of a hypothetical $10,000 investment and the reinvestment of dividends and capital gains in the indicated share class versus a similar investment in the Morningstar Global Markets ex U.S. Index (“Index”). The Index ex U.S. is an unmanaged, float market capitalization weighted index measuring the performance of more than 6,000 securities and is designed to cover 97% of the equity market capitalization of developed and emerging markets excluding the United States. The index (net) returns are calculated applying dividend withholding rates applicable to non-resident persons who do not benefit from double taxation treaties. Withholding rates applicable to the fund may be lower. The Index does not reflect the deduction of fees associated with a mutual fund such as investment management and accounting fees. The Fund’s performance reflects the deduction of fees for these services. Investors cannot invest directly in an index although they can invest in the underlying securities. |
* | The quoted performance of the Fund reflects the past performance of Diamond Hill International Fund L.P. (the “International Partnership”), a private fund managed with full investment authority by the Fund’s Adviser. The Fund is managed in all material respects in a manner equivalent to the management of the predecessor unregistered fund. The assets of the International Partnership were converted into assets of the Fund prior to commencement of operation of the Fund. The performance of the International Partnership has been restated to reflect the net expenses and maximum applicable sales charge of the Fund for its initial years of investment operation. The International Partnership was not registered under the Investment Company Act of 1940 and therefore was not subject to certain investment restrictions imposed by the 1940 Act. If the International Partnership had been registered under the 1940 Act, its performance may have been adversely affected. Performance is measured from December 31, 2016, the inception of the International Partnership and is not the performance of the Fund. The assets of the International Partnership were converted, based on their value on June 28, 2019, in assets of the Fund. The International Partnership’s past performance is not necessarily an indication of how the Fund will perform in the future either before or after taxes. |
| Past performance does not guarantee future results. The performance data quoted represents past performance and current returns may be lower or higher. The investment return and principal value will fluctuate so that an investor’s shares, when redeemed, maybe worth more or less than the original cost. To obtain performance information current to the most recent month end, please visit www.diamond-hill.com. |
34 DIAMOND HILL FUNDS | ANNUAL REPORT | DECEMBER 31, 2019 | DIAMOND-HILL.COM |
Diamond Hill Short Duration Total Return Fund |
2019 Portfolio Commentary
After one of the more volatile finishes to a calendar year in recent history, markets spent the majority of 2019 erasing the bad memories of the last three months of 2018. The Federal Reserve’s capitulation on interest rates by reversing three of the four increases in 2018 and their eventual decision to re-introduce the concept of quantitative easing (without actually calling it quantitative easing) set the markets on a mostly one-way course higher. The only real turbulence during the year was a ramp-up of trade war rhetoric in late summer that re-introduced the world to the concept of an inverted curve. Yields on 2- and 10-year Treasury notes moved through the year on a lower trajectory, with small periods of movements higher, usually fueled by developments in the trade war between the U.S. and China. The 2- and 10-year Treasury notes finished the year lower by 90 and 77 basis points (bps), respectively. Spreads on corporate bonds, as measured by the Bloomberg Barclays Corporate Index, moved lower throughout the year, with most of the movement coming in early 2019 as investors returned to risk assets after fleeing dramatically at the end of 2018. The option adjusted spread of the Bloomberg Barclays Corporate Index returned to the exact same level at the end of 2019 as it achieved at the end of 2017, 93 bps. Instances of short-lived volatility associated with the trade war between U.S. and China, the presidential impeachment process, Brexit and upheaval in the Middle East weren’t enough to derail one of the strongest equity and fixed income markets in recent memory. Throughout the year volatility created some angst in the markets, but those periods were short-lived and reversed rather quickly. We believe our long-term philosophy and focused, bottom-up security selection continues to serve our clients well in all environments, though 2019 was a challenging year as corporate debt delivered the strongest returns in a decade.
Backpedaling from a poorly received meeting in December 2018 the Federal Reserve spent the first six months of 2019 walking back expectations for continued rate increases and remained on hold through their June meeting. The markets rejoiced at the Federal Reserve’s decision to remain on the sideline, pushing equities (as measured by the S&P 500) to returns in excess of 18% through June 2019. As volatility increased in the summer months due to the vitriolic ramp-up of rhetoric between the United States and China regarding the ongoing trade war, the Federal Reserve stepped in and began an easing cycle that covered three of the final four meetings of 2019, bringing the range of Federal Funds to 1.50 – 1.75% after starting the year at 2.25%-2.50%.
Volatility peaked during August despite Federal Reserve Chairman Jerome Powell managing to deliver a ‘dovish’ message as well as a 25-bps reduction in the Federal Funds rate without rattling the markets too much, despite some intra-press conference volatility. It was the war of words between the U.S. and China reaching a crescendo that unhinged the markets. On August 1, the day after the FOMC meeting, President Trump tweeted the initiation of additional tariffs on Chinese goods and the 10-year Treasury rallied 12.1 basis points, the largest move since the initial Brexit vote in June 2016. The United States declared China to be a currency manipulator the following week and China retaliated by suspending new agricultural purchases from the U.S., causing the 10-year Treasury to rally another 13.8 bps. On August 13, the United States delayed tariffs on certain products and removed items from the original list over fear of the impact on the holiday shopping season. The U.S and China agreed to resume talks in two weeks as the 10-year Treasury moved 5.9 bps higher and then rallied 12.5 bps the following day.
DIAMOND HILL FUNDS | ANNUAL REPORT | DECEMBER 31, 2019 | DIAMOND-HILL.COM 35 |
Diamond Hill Short Duration Total Return Fund |
As the trade war rhetoric increased throughout August, the 10-year Treasury rallied 51.7 bps to finish the month at 1.49% while the 2-year Treasury finished at 1.51%, inverting the relationship between the two benchmark yields in the month’s final days. The inversion lasted through the final week of August as forthcoming positive news about progress in the trade war resulted in a steepening of the yield curve and the spread between the 2- and 10-year Treasuries finished the year at 35 basis points. The 10-year Treasury experienced three of the 10 largest single-day moves lower in yield over the past five years during August, all on the heels of trade announcements or rebukes. The S&P 500 lost 1.58% in the month of August while the Bloomberg Barclays U.S. Aggregate Bond index gained 2.59% and the Treasury index gained 3.40%.
It is said that a rising tide lifts all boats and that adage has never been more evident than in the fixed income markets in 2019. The degree to which those boats rose was predicated on the amount of risk associated with those securities, as investors hungry for yield drove risk assets to some of their best performance returns in recent years. While not the strongest-performing sector in U.S. domestic fixed income, the securitized sector, led by commercial mortgage-backed securities (CMBS) which delivered 8.29% return in 2019 followed by residential mortgage-backed securities (RMBS) at 6.35% and asset-backed securities (ABS) at 4.53%, delivered significant returns on the shorter end of the curve. The Short Duration Total Return Fund is managed with a focus on the securitized sector with 62.4% of the portfolio invested in ABS, 8.1% in RMBS and 13.7% in CMBS, as of December 31, 2019. Many asset-backed and mortgage-backed securities have amortizing structures that return portions of their principal on a monthly basis. These principal payments can be reinvested at higher interest rates as spreads and the general level of interest rates rise.
We believe our fundamental, bottom-up security selection continued to make the Short Duration Total Return Fund an attractive fixed income option in a market facing such headwinds. The Fund’s focus on the asset-backed securities and mortgage-backed securities sectors allows us to find short duration assets we believe have more attractive yields and risks than the corporate bond market generally has to offer.
Despite market conditions, we remained confident that the Fund’s significant yield advantage over its benchmark would generate value and income for our clients. The Fund finished the year with a return of 4.85% (Class I), exceeding the Bloomberg Barclays U.S. 1-3 Year Government/Credit Index return of 4.03% by 82 basis points.
As always, we appreciate the opportunity to serve our clients.

| 
|
Henry Song, CFA
Portfolio Manager | Mark Jackson, CFA
Portfolio Manager |
36 DIAMOND HILL FUNDS | ANNUAL REPORT | DECEMBER 31, 2019 | DIAMOND-HILL.COM |
Diamond Hill Short Duration Total Return Fund |
AVERAGE ANNUAL TOTAL RETURNS AS OF DECEMBER 31, 2019
| Inception
Date | One
Year | Three
Years | Since
Inception | Expense
Ratio* |
PERFORMANCE AT NAV WITHOUT SALES CHARGES |
Class A Shares | 7/5/2016 | 4.44% | 3.76% | 3.58% | 0.81% |
Class I Shares | 7/5/2016 | 4.85 | 4.12 | 3.90 | 0.52 |
Class Y Shares | 7/5/2016 | 4.84 | 4.22 | 4.00 | 0.40 |
BENCHMARK |
Bloomberg Barclays U.S. 1-3 Yr. Gov./Credit Index | | 4.03 | 2.15 | 1.71 | — |
PERFORMANCE AT PUBLIC OFFERING PRICE INCLUDING SALES CHARGES** |
Class A Shares | 7/5/2016 | 2.10 | 2.98 | 2.90 | 0.81 |
* Reflects the expense ratio as reported in the Prospectus dated February 28, 2020. ** The maximum sales charge for Class A shares on purchases is 2.25%. |
GROWTH OF $10,000
Comparison of the change in value of a $10,000 Investment in the Diamond Hill Short Duration Total Return Fund Class I(A) and Bloomberg Barclays U.S. 1-3 Yr. Government/Credit Index.
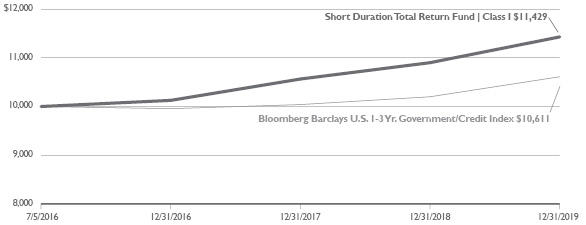
(A) | The growth of $10,000 chart represents the performance of Class I shares only, which will vary from the performance of Class A and Class Y shares based on the difference in loads and fees paid by shareholders in the different classes. |
| The performance of the above Fund does not reflect the deduction of taxes that a shareholder would pay on Fund distributions or the redemption of Fund shares. |
| The chart above represents a comparison of a hypothetical $10,000 investment and the reinvestment of dividends and capital gains in the indicated share class versus a similar investment in the Bloomberg Barclays U.S. 1-3 Yr. Government/Credit Index (“Index”). The Index is an unmanaged index measuring the performance of investment grade government and corporate bonds with maturities of one to three years. The Index does not reflect the deduction of fees associated with a mutual fund such as investment management and accounting fees. The Fund’s performance reflects the deduction of fees for these services. Investors cannot invest directly in an index although they can invest in the underlying securities. |
| Past performance does not guarantee future results. The performance data quoted represents past performance and current returns may be lower or higher. The investment return and principal value will fluctuate so that an investor’s shares, when redeemed, may be worth more or less than the original cost. To obtain performance information current to the most recent month end, please visit www.diamond-hill.com. |
DIAMOND HILL FUNDS | ANNUAL REPORT | DECEMBER 31, 2019 | DIAMOND-HILL.COM 37 |
Diamond Hill Core Bond Fund |
2019 Portfolio Commentary
After one of the more volatile finishes to a calendar year in recent history, markets spent the majority of 2019 erasing the bad memories of the last three months of 2018. The Federal Reserve’s capitulation on interest rates by reversing three of the four increases in 2018 and their eventual decision to re-introduce the concept of quantitative easing (without actually calling it quantitative easing) set the markets on a mostly one-way course higher. The only real turbulence during the year was a ramp-up of trade war rhetoric in late summer that re-introduced the world to the concept of an inverted yield curve. Yields on 2- and 10-year Treasury notes moved through the year on a lower trajectory, with small periods of movements higher, usually fueled by developments in the trade war between the U.S. and China. The 2- and 10-year Treasury notes finished the year lower by 90 and 77 basis points (bps), respectively. Spreads on corporate bonds, as measured by the Bloomberg Barclays Corporate Index, moved lower throughout the year, with most of the movement coming in early 2019 as investors returned to risk assets after fleeing dramatically at the end of 2018. Lowered hedging costs and historically low yields at home drove yield starved overseas investors to the U.S. corporate bond market, contributing to the rally in corporate debt. The option adjusted spread of the Bloomberg Barclays Corporate Index returned to the exact same level at the end of 2019 as it achieved at the end of 2017, 93 bps. Instances of short-lived volatility associated with the trade war between U.S. and China, the presidential impeachment process, Brexit and upheaval in the Middle East weren’t enough to derail one of the strongest equity and fixed income markets in recent memory. Throughout the year volatility created some angst in the markets, but those periods were short-lived and reversed rather quickly. We believe our long-term philosophy and focused, bottom-up security selection continues to serve our clients well in all environments, though 2019 was a challenging year as corporate debt delivered the strongest returns in a decade.
Backpedaling from a poorly received meeting in December 2018, the Federal Reserve spent the first six months of 2019 walking back expectations for continued rate increases and remained on hold through their June meeting. The markets rejoiced at the Federal Reserve’s decision to remain on the sideline, pushing equities (as measured by the S&P 500) to returns in excess of 18% through June 2019. As volatility increased in the summer months due to the vitriolic ramp-up of rhetoric between the United States and China regarding the ongoing trade war, the Federal Reserve stepped in and began an easing cycle that covered three of the final four meetings of 2019, bringing the range of Federal Funds to 1.50 – 1.75% after starting the year at 2.25%-2.50%.
Volatility peaked during August despite Federal Reserve Chairman Jerome Powell managing to deliver a ‘dovish’ message as well as a 25-bps reduction in the Federal Funds rate without rattling the markets too much, despite some intra-press conference volatility. It was the war of words between the U.S. and China reaching a crescendo that unhinged the markets. On August 1, the day after the FOMC meeting, President Trump tweeted the initiation of additional tariffs on Chinese goods and the 10-year Treasury rallied 12.1 basis points, the largest move since the initial Brexit vote in June 2016. The United States declared China to be a currency manipulator the following week and China retaliated by suspending new agricultural purchases from the U.S., causing the 10-year Treasury to rally another 13.8 bps. On August 13, the United States delayed
38 DIAMOND HILL FUNDS | ANNUAL REPORT | DECEMBER 31, 2019 | DIAMOND-HILL.COM |
Diamond Hill Core Bond Fund |
tariffs on certain products and removed items from the original list on fear over the impact on the holiday shopping season. The U.S and China agreed to resume talks in two weeks as the 10-year Treasury moved 5.9 bps higher and then rallied 12.5 bps the following day.
As the trade war rhetoric increased throughout August, the 10-year Treasury rallied 51.7 bps to finish the month at 1.49% while the 2-year Treasury finished at 1.51% inverting the relationship between the two benchmark yields in the month’s final days. The inversion lasted through the final week of August as forthcoming positive news about progress in the trade war resulted in a steepening of the yield curve and the spread between the 2- and 10-year Treasuries finished the year at 35 basis points. The 10-year Treasury experienced three of the 10 largest single-day moves lower in yield over the past five years during August, all on the heels of trade announcements or rebukes. The S&P 500 lost 1.58% in the month of August while the Bloomberg Barclays U.S. Aggregate Bond index gained 2.59% and the Treasury index gained 3.40%.
Security selection and sector allocation were the main drivers of performance in 2019. The Core Bond Fund’s allocation to asset-backed securities (19.0% as of December 31, 2019 compared to 0.50% for the Bloomberg Barclays U.S. Aggregate Bond Index) and residential mortgage-backed securities (28.3% compared to 27.2%) delivered strong relative returns during 2019 as security selection in these sectors drove performance. The Bloomberg Barclays U.S. Corporate Index delivered its best performance since 2009, generating 14.54% during the year. The Core Bond Fund’s focus on higher quality credit as well as an underweight position in corporate bonds relative to the benchmark (16.4% for the Fund vs. 25.1% for the Bloomberg Barclays U.S. Aggregate Bond Index) detracted from performance as the “risk on” trade was driven by the lower credit quality segment of the corporate index with the BBB Corporate Index return 16.26%.
It is said that a rising tide lifts all boats and that adage has never been more evident than in the fixed income markets in 2019. The degree to which those boats rose was predicated on the amount of risk associated with those securities, as investors hungry for yield drove risk assets to some of their best performance returns in recent years. Strong absolute returns in the investment grade fixed income universe is evident with the 8.72% return by the Bloomberg Barclays U.S. Aggregate Index. Delivering a return of 7.93% in the Core Bond Fund (Class I) was disappointing from a relative standpoint but given the characteristics of the historic rally in investment-grade fixed income during the year and the Fund’s positioning relative to the Index, it does not come as a surprise. Maintaining a focus on long-term results rather than on a single year, we believe the Fund is well positioned as spreads at these levels are not sustainable.
As always, we appreciate the opportunity to be the stewards of our clients’ capital.

| 
|
Henry Song, CFA
Portfolio Manager | Mark Jackson, CFA
Portfolio Manager |
DIAMOND HILL FUNDS | ANNUAL REPORT | DECEMBER 31, 2019 | DIAMOND-HILL.COM 39 |
Diamond Hill Core Bond Fund |
AVERAGE ANNUAL TOTAL RETURNS AS OF DECEMBER 31, 2019
| Inception
Date | One
Year | Three
Years | Since
Inception | Expense
Ratio* |
PERFORMANCE AT NAV WITHOUT SALES CHARGES |
Class A Shares | 7/5/2016 | 7.63% | 4.22% | 2.93% | 0.76% |
Class I Shares | 7/5/2016 | 7.93 | 4.53 | 3.24 | 0.47 |
Class Y Shares | 7/5/2016 | 8.15 | 4.65 | 3.35 | 0.35 |
BENCHMARK |
Bloomberg Barclays U.S. Aggregate Index | | 8.72 | 4.03 | 2.49 | — |
PERFORMANCE AT PUBLIC OFFERING PRICE INCLUDING SALES CHARGES** |
Class A Shares | 7/5/2016 | 3.88 | 3.00 | 1.90 | 0.76 |
* Reflects the expense ratio as reported in the Prospectus dated February 28, 2020. ** The maximum sales charge for Class A shares on purchases is 3.50%. |
GROWTH OF $10,000
Comparison of the change in value of a $10,000 Investment in the Diamond Hill Core Bond Fund Class I(A) and Bloomberg Barclays U.S. Aggregate Index.
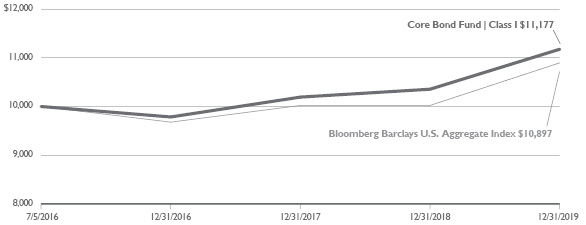
(A) | The growth of $10,000 chart represents the performance of Class I shares only, which will vary from the performance of Class A and Class Y shares based on the difference in loads and fees paid by shareholders in the different classes. |
| The performance of the above Fund does not reflect the deduction of taxes that a shareholder would pay on Fund distributions or the redemption of Fund shares. |
| The chart above represents a comparison of a hypothetical $10,000 investment and the reinvestment of dividends and capital gains in the indicated share class versus a similar investment in the Bloomberg Barclays U.S. Aggregate Index (“Index”). The Index is an unmanaged index measuring performance of the U.S. investment grade fixed rate bond market, with index components for government and corporate securities, mortgage passthrough, and asset-backed securities. The Index does not reflect the deduction of fees associated with a mutual fund such as investment management and accounting fees. The Fund’s performance reflects the deduction of fees for these services. Investors cannot invest directly in an index although they can invest in the underlying securities. |
| Past performance does not guarantee future results. The performance data quoted represents past performance and current returns may be lower or higher. The investment return and principal value will fluctuate so that an investor’s shares, when redeemed, may be worth more or less than the original cost. To obtain performance information current to the most recent month end, please visit www.diamond-hill.com. |
40 DIAMOND HILL FUNDS | ANNUAL REPORT | DECEMBER 31, 2019 | DIAMOND-HILL.COM |
Diamond Hill Corporate Credit Fund |
2019 Portfolio Commentary
The Diamond Hill Corporate Credit Fund (Class I) generated a 13.20% total return in 2019 compared to 14.28% for the ICE BofA U.S. Corporate & High Yield Index. For the trailing five years, the Fund generated an annualized total return of 6.95% compared to 4.89% for the Corporate & High Yield Index.
Unlike most corporate bond funds, the Diamond Hill Corporate Credit Fund is not managed against any index. Instead, the Fund is managed against absolute objectives within a range of inflation plus 3% and 7% nominal, each measured over rolling five-year periods. Our goal is to generate a yield and total return within that range while minimizing the risk of downside volatility over longer time periods. Although the Fund’s investable universe (and the Corporate & High Yield Index) includes both investment grade and high yield corporate bonds, since early 2010 the Fund has been largely focused on the high yield portion of the market to achieve these objectives. About 72% of the Fund was in high yield corporate bonds at the end of 2019.
The high yield portion of the U.S. corporate bond market, as represented by the ICE BofA U.S. High Yield Index, began the year with a yield-to-worst (YTW) of 7.95% and option-adjusted spread (OAS) of 533 basis points (bps). After generating a 14.41% total return for the year, the High Yield Index ended the year with a 5.41% YTW and OAS of 360 basis points. This strong High Yield Index return more than offset the -4.67% return in the fourth quarter of last year, illustrating the resilience of the high yield asset class. Over the last five quarters, the High Yield Index generated a 9.07% return compared to the S&P 500 at 13.70% and the Russell 2000 at 0.12%.
We are particularly pleased to be at the high end of the inflation plus 3% and 7% nominal range over the trailing five years. We did that by preserving capital well in down markets and then capturing our fair share of the upside in strong markets. 2015 and 2018 were down years in the high yield market and the Fund was positive in both years. 2016 and 2019 were very strong years and we believe the Fund captured its fair share of the upside. Although “coupon clipping” years are frequently forecast they are relatively rare in experience. 2017 was the only “coupon clipping” year in the last five and we were able to outperform in that year as well.
The dominant theme of 2019 was the complete suppression of volatility in financial assets by the Federal Reserve. In 2018, the Federal Reserve was intent on getting out of the business of suppressing volatility. Largely in response to the Federal Reserve, in the fourth quarter of 2018 stocks fell precipitously while the Treasury yield curve declined and flattened. We expected the Federal Reserve to recalibrate policy in 2019 as there was no need to push the economy close to recession with inflation and inflation expectations contained.
But the Federal Reserve has done far more than recalibrate policy. It reversed three of the four 2018 rate hikes and resumed the expansion of its balance sheet. Aside from some volatility in late summer caused largely by the trade wars, volatility has been suppressed in all financial assets. The 10-year Treasury Inflation-Protected Security (TIPS) yield declined by 84 bps during the year from 0.97% to 0.13%. The OAS of the High Yield Index declined 173 bps during 2019 from 533 bps to 360 bps. This decline in the real (i.e., after-inflation) yield and the decline in risk premia (i.e., the additional return that investors demand for bearing risk beyond that of a government bond)
DIAMOND HILL FUNDS | ANNUAL REPORT | DECEMBER 31, 2019 | DIAMOND-HILL.COM 41 |
Diamond Hill Corporate Credit Fund |
account for virtually all of the performance of financial assets in 2019 as earnings and inflation expectations were relatively flat. Further, they likely had the effect of pulling future returns into 2019 thereby lowering returns in 2020 and beyond.
An important factor going forward is whether economic growth and earnings growth will validate the high valuations of financial assets. And if they do, will interest rates increase thereby offsetting some of the fundamental improvement? While we expected much more volatility in 2019, we continue to be most confident that positioning for increased volatility in the corporate bond market is appropriate now. There is a limit to how long central banks can suppress volatility. While it is difficult to forecast volatility, we have always been rewarded for defensive positioning with yields and credit spreads at these levels.
The Fund’s YTW is typically somewhere in the range of our absolute objectives, although it was well below the low end of the range in late June 2014 and well above the high end of the range in early February 2016. At the end of the year, the Fund’s YTW was 4.18%, below the low end of the range. The Fund’s duration was 3.13, within the typical 2.0-3.5 range and below the High Yield Index duration of 3.30 and the Corporate & High Yield Index duration of 7.02. The duration of the High Yield Index is considerably below the historical 4.0-4.5 range, reflecting the call-constrained nature of a large portion of the high yield market. In other words, many high yield bonds have limited potential price upside but significant downside. This is a key justification for the defensive posture of the Fund.
We believe our unique and durable competitive advantages — we don’t manage against a benchmark, the deep and talented Diamond Hill research team, the flexibility to be nimble in the secondary market and selective in the new issue market, concentration in our best ideas, and patient shareholders who share our long-term time horizon — have allowed us to generate a yield and total return in the range of our objectives without undue risk.
Again, we remain confident that volatility will come back as is typical later in the economic and market cycles. We want to be in a strong position to take advantage of that volatility. As always, we are focused on delivering risk-adjusted returns over a complete market cycle by holding up better during down markets and capturing our fair share of the upside in strong markets. Our partnership with you continues to be one of our most important advantages.

| 
|
Bill Zox, CFA
Portfolio Manager | John McClain, CFA
Portfolio Manager |
42 DIAMOND HILL FUNDS | ANNUAL REPORT | DECEMBER 31, 2019 | DIAMOND-HILL.COM |
Diamond Hill Corporate Credit Fund |
AVERAGE ANNUAL TOTAL RETURNS AS OF DECEMBER 31, 2019
| Inception
Date | One
Year | Three
Years | Five
Years | Ten
Years | Expense
Ratio* |
PERFORMANCE AT NAV WITHOUT SALES CHARGES |
Class A Shares | 9/30/2002 | 12.85% | 6.76% | 6.63% | 6.81% | 0.89% |
Class C Shares | 9/30/2002 | 12.06 | 5.98 | 5.84 | 6.01 | 1.64 |
Class I Shares | 1/31/2005 | 13.20 | 7.11 | 6.95 | 7.12 | 0.60 |
Class Y Shares | 12/30/2011 | 13.35 | 7.21 | 7.06 | 7.15 | 0.48 |
BENCHMARK |
ICE BofA U.S. Corporate & High Yield Index | | 14.28 | 6.03 | 4.89 | 5.97 | — |
Consumer Price Index - All Urban Consumers from the Bureau of Labor Statistics plus 3% annual risk premium | | 5.29 | 5.10 | 4.82 | 4.75 | — |
PERFORMANCE AT PUBLIC OFFERING PRICE INCLUDING SALES CHARGES** |
Class A Shares | 9/30/2002 | 8.91 | 5.51 | 5.86 | 6.43 | 0.89 |
Class C Shares | 9/30/2002 | 11.06 | 5.98 | 5.84 | 6.01 | 1.64 |
* Reflects the expense ratio as reported in the Prospectus dated February 28, 2020. ** The maximum sales charge for Class A shares on purchases and for Class C shares on certain redemptions are 3.50% and 1.00%, respectively. |
GROWTH OF $10,000
Comparison of the change in value of a $10,000 Investment in the Diamond Hill Corporate Credit Fund Class I(A), ICE BofA U.S. Corporate & High Yield Index, and Consumer Price Index - All Urban Consumers from the Bureau of Labor Statistics plus 3% annual risk premium.
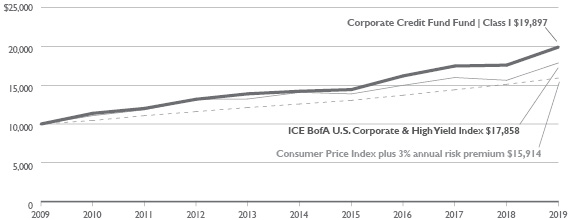
(A) | The growth of $10,000 chart represents the performance of Class I shares only, which will vary from the performance of Class A, Class C and Class Y shares based on the difference in loads and fees paid by shareholders in the different classes. |
| The performance of the above Fund does not reflect the deduction of taxes that a shareholder would pay on Fund distributions or the redemption of Fund shares. |
| The chart above represents a comparison of a hypothetical $10,000 investment and the reinvestment of dividends and capital gains in the indicated share class versus a similar investment in the ICE BofA U.S. Corporate & High Yield Index and the Consumer Price Index — All Urban Consumers from the Bureau of Labor Statistics (CPI) plus 3% risk premium. The ICE BofA U.S. Corporate and High Yield Index is an unmanaged index measuring the performance of U.S. dollar denominated investment grade and below investment grade corporate debt publicly issued in the U.S. domestic market. The index data referenced herein is the property of ICE Data Indices, LLC, its affiliates (“ICE Data”) and/or its third party suppliers and has been licensed for use by Diamond Hill Capital Management, Inc. ICE Data and its third party suppliers accept no liability in connection with its use. See diamond-hill.com for a full copy of the disclaimer. The CPI is increased by a 3 percent risk premium to correspond with the Fund’s long-term goals of achieving returns above the rate of inflation. The CPI is an economic metric that measures prices for a basket of goods and services sold to urban consumers. The index is considered a more accurate record of prices due to higher population density within the sales area. Both indices do not reflect the deduction of fees associated with a mutual fund such as investment management and accounting fees. The Fund’s performance reflects the deduction of fees for these services. Investors cannot invest directly in an index although they can invest in the underlying securities. |
| Historical performance for Class Y shares prior to its inception is based on the performance of Class A shares. Class Y performance has been adjusted to reflect differences in sales charges and expenses between classes. |
| Past performance does not guarantee future results. The performance data quoted represents past performance and current returns may be lower or higher. The investment return and principal value will fluctuate so that an investor’s shares, when redeemed, may be worth more or less than the original cost. To obtain performance information current to the most recent month end, please visit www.diamond-hill.com. This material must be preceded or accompanied by a current prospectus. |
DIAMOND HILL FUNDS | ANNUAL REPORT | DECEMBER 31, 2019 | DIAMOND-HILL.COM 43 |
Diamond Hill High Yield Fund |
2019 Portfolio Commentary
The Diamond Hill High Yield Fund (Class I) generated a 15.44% total return in 2019 compared to 14.41% for the ICE BofA U.S. High Yield Index. For the trailing five years, the Fund generated an annualized total return of 8.18% compared to 6.13% for the ICE BofA U.S. High Yield Index. While we are pleased with the Fund’s relative performance, it is important to note that the ICE BofA U.S. High Yield Index is not an investable alternative. Therefore, performance relative to peers is the best metric to evaluate the Fund.
The High Yield Index began the year with a yield-to-worst (YTW) of 7.95% and an option-adjusted spread (OAS) of 533 basis points (bps). After generating a 14.41% total return for the year, the High Yield Index ended the year with a 5.41% YTW and OAS of 360 basis points. The strong 14.41% return for the High Yield Index more than offsets the -4.67% return in the fourth quarter of last year. This is another example of the resilience of the high yield asset class. Over the last five quarters, the High Yield Index generated a 9.07% return compared to the S&P 500 at 13.70% and the Russell 2000 at 0.12%.
We are very pleased with the Fund’s first five years with strong absolute returns that were well ahead of peers and the High Yield Index. We did that by preserving capital in down markets and then capturing our fair share of the upside in strong markets. 2015 and 2018 were down years in the high yield market and the Fund was positive in both years. 2016 and 2019 were very strong years and we believe the Fund captured its fair share of the upside. Although “coupon clipping” years are frequently forecast they are relatively rare in experience. 2017 was the only “coupon clipping” year in the last five and we performed quite well in that year also.
The dominant theme of 2019 was the complete suppression of volatility in financial assets by the Federal Reserve. In 2018, the Federal Reserve was intent on getting out of the business of suppressing volatility. Largely in response to the Federal Reserve, in the fourth quarter of 2018 stocks fell precipitously while the Treasury yield curve declined and flattened. We expected the Federal Reserve to recalibrate policy in 2019 as there was no need to push the economy close to recession with inflation and inflation expectations contained.
But the Federal Reserve has done far more than recalibrate policy. It reversed three of the four 2018 rate hikes and resumed the expansion of its balance sheet. Aside from some volatility in late summer caused largely by the trade wars, volatility has been suppressed in all financial assets. The 10-year Treasury Inflation-Protected Security (TIPS) yield declined by 84 bps during the year from 0.97% to 0.13%. The OAS of the High Yield Index declined 173 bps during the year from 533 bps to 360 bps. This decline in the real (i.e., after-inflation) yield and the decline in risk premia (i.e., the additional return that investors demand for bearing risk beyond that of a government bond) account for virtually all of the performance of financial assets in 2019 as earnings and inflation expectations were relatively flat. Further, they likely had the effect of pulling future returns into 2019 thereby lowering returns in 2020 and beyond.
An important factor going forward is whether economic growth and earnings growth will validate the high valuations of financial assets. And if they do, will interest rates increase thereby offsetting some of the fundamental improvement? While we expected much more volatility in 2019, we
44 DIAMOND HILL FUNDS | ANNUAL REPORT | DECEMBER 31, 2019 | DIAMOND-HILL.COM |
Diamond Hill High Yield Fund |
continue to be most confident that positioning for increased volatility in the high yield market is appropriate now. There is a limit on how long central banks can suppress volatility. While it is difficult to forecast volatility, we have always been rewarded for defensive positioning with yields and credit spreads at these levels.
We believe we have unique and durable competitive advantages: we have a deep and talented Diamond Hill research team; we have the flexibility to be nimble in the secondary market and selective in the new issue market; the Fund is concentrated in our best ideas; and we have patient shareholders who share our long-term time horizon. These advantages have allowed us to deliver good performance since inception and have positioned us well to achieve our primary goal of ranking highly in our peer group over rolling five-year periods.
We appreciate your ongoing support and look forward to continuing to work with you in the coming years.

| 
|
Bill Zox, CFA
Portfolio Manager | John McClain, CFA
Portfolio Manager |
DIAMOND HILL FUNDS | ANNUAL REPORT | DECEMBER 31, 2019 | DIAMOND-HILL.COM 45 |
Diamond Hill High Yield Fund |
AVERAGE ANNUAL TOTAL RETURNS AS OF DECEMBER 31, 2019
| Inception
Date | One
Year | Three
Year | Five
Year* | Since
Inception* | Expense
Ratio** |
PERFORMANCE AT NAV WITHOUT SALES CHARGES |
Class A Shares | 12/31/2015 | 15.04% | 8.50% | 7.86% | 7.81% | 0.96% |
Class I Shares | 12/31/2015 | 15.44 | 8.82 | 8.18 | 8.12 | 0.67 |
Class Y Shares | 12/31/2015 | 15.56 | 8.94 | 8.29 | 8.24 | 0.55 |
BENCHMARK |
ICE BofA U.S. High Yield Index | | 14.41 | 6.32 | 6.13 | 5.91 | — |
PERFORMANCE AT PUBLIC OFFERING PRICE INCLUDING SALES CHARGES*** |
Class A Shares | 12/31/2015 | 11.02 | 7.21 | 7.10 | 7.06 | 0.96 |
** Reflects the expense ratio as reported in the Prospectus dated February 28, 2020. *** The maximum sales charge for Class A shares on purchases is 3.50%. |
GROWTH OF $10,000
Comparison of the change in value of a $10,000 Investment in the Diamond Hill High Yield Fund Class I(A) and ICE BofA U.S. High Yield Index.
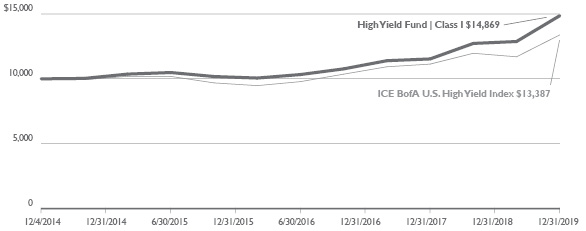
(A) | The growth of $10,000 chart represents the performance of Class I shares only, which will vary from the performance of Class A and Class Y shares based on the difference in loads and fees paid by shareholders in the different classes. |
| The performance of the above Fund does not reflect the deduction of taxes that a shareholder would pay on Fund distributions or the redemption of Fund shares. |
| The chart above represents a comparison of a hypothetical $10,000 investment and the reinvestment of dividends and capital gains in the indicated share class versus a similar investment in the ICE BofA U.S. High Yield Index. (“Index”). The Index is an unmanaged index measuring the performance of U.S. dollar denominated below investment grade corporate debt publicly issued in the U.S. domestic market. The index data referenced herein is the property of ICE Data Indices, LLC, its affiliates (“ICE Data”) and/or its third party suppliers and has been licensed for use by Diamond Hill Capital Management, Inc. ICE Data and its third party suppliers accept no liability in connection with its use. See diamond-hill.com for a full copy of the disclaimer. The Index does not reflect the deduction of fees associated with a mutual fund such as investment management and accounting fees. The Fund’s performance reflects the deduction of fees for these services. Investors cannot invest directly in an index although they can invest in the underlying securities. |
* | The quoted performance for the Fund reflects the past performance of Diamond Hill High Yield Fund L.P. (the “High Yield Partnership”), a private fund managed with full investment authority by the Fund’s Adviser. The Fund is managed in all material respects in a manner equivalent to the management of the predecessor unregistered fund. The assets of the High Yield Partnership were converted into assets of the Fund prior to commencement of operation of the Fund. The performance of the High Yield Partnership has been restated to reflect the net expenses and maximum applicable sales charge of the Fund for its initial years of investment operations. The High Yield Partnership was not registered under the Investment Company Act of 1940 and therefore was not subject to certain investment restrictions imposed by the 1940 Act. If the High Yield Partnership had been registered under the 1940 Act, its performance may have been adversely affected. Performance is measured from December 4, 2014, the inception of the High Yield Partnership and is not the performance of the Fund. The High Yield Partnership’s past performance is not necessarily an indication of how the Fund will perform in the future either before or after taxes |
| Past performance does not guarantee future results. The performance data quoted represents past performance and current returns may be lower or higher. The investment return and principal value will fluctuate so that an investor’s shares, when redeemed, may be worth more or less than the original cost. To obtain performance information current to the most recent month end, please visit www.diamond-hill.com. This material must be preceded or accompanied by a current prospectus. |
46 DIAMOND HILL FUNDS | ANNUAL REPORT | DECEMBER 31, 2019 | DIAMOND-HILL.COM |
Diamond Hill Small Cap Fund
Schedule of Investments
December 31, 2019
| | Shares | | | Fair
Value | |
Common Stocks — 97.3% |
Communication Services — 5.6% |
Live Nation Entertainment, Inc. (a)(b) | | | 590,668 | | | $ | 42,215,042 | |
Consumer Discretionary — 13.5% |
Aaron’s, Inc. | | | 117,768 | | | | 6,725,730 | |
Carter’s, Inc. (a) | | | 93,925 | | | | 10,269,759 | |
Century Communities, Inc. (b) | | | 157,828 | | | | 4,316,596 | |
Green Brick Partners, Inc. (b) | | | 814,944 | | | | 9,355,557 | |
Red Rock Resorts, Inc., Class A (a) | | | 1,193,242 | | | | 28,578,146 | |
Vail Resorts, Inc. (a) | | | 164,313 | | | | 39,407,187 | |
Wolverine World Wide, Inc. (a) | | | 78,675 | | | | 2,654,494 | |
| | | | | | | | 101,307,469 | |
Consumer Staples — 7.7% |
B&G Foods, Inc. (a) | | | 277,318 | | | | 4,972,312 | |
Cal-Maine Foods, Inc. (a) | | | 516,600 | | | | 22,084,650 | |
Flowers Foods, Inc. | | | 526,116 | | | | 11,437,762 | |
Post Holdings, Inc. (b) | | | 178,654 | | | | 19,491,151 | |
| | | | | | | | 57,985,875 | |
Energy — 3.1% |
Cimarex Energy Co. | | | 224,297 | | | | 11,773,350 | |
WPX Energy, Inc. (b) | | | 856,726 | | | | 11,771,415 | |
| | | | | | | | 23,544,765 | |
Financials — 24.4% |
Assured Guaranty Ltd. | | | 96,224 | | | | 4,716,900 | |
Bank OZK | | | 831,803 | | | | 25,374,150 | |
BankUnited, Inc. | | | 334,150 | | | | 12,216,524 | |
BOK Financial Corp. (a) | | | 119,868 | | | | 10,476,463 | |
Brown & Brown, Inc. | | | 262,936 | | | | 10,380,713 | |
Cadence BanCorp | | | 905,490 | | | | 16,416,534 | |
Enstar Group Ltd. (b) | | | 115,272 | | | | 23,845,166 | |
First of Long Island Corp. (The) | | | 348,684 | | | | 8,744,995 | |
Live Oak Bancshares, Inc. (a) | | | 209,352 | | | | 3,979,781 | |
Mr. Cooper Group, Inc. (b) | | | 736,012 | | | | 9,207,510 | |
ProAssurance Corp. | | | 368,123 | | | | 13,303,965 | |
Reinsurance Group of America, Inc. | | | 26,221 | | | | 4,275,596 | |
RenaissanceRe Holdings Ltd. | | | 57,327 | | | | 11,237,239 | |
| | Shares | | | Fair
Value | |
Financials — 24.4% continued |
Sterling Bancorp | | | 1,395,699 | | | $ | 29,421,335 | |
| | | | | | | | 183,596,871 | |
Health Care — 2.1% |
Integer Holdings Corp. (b) | | | 49,097 | | | | 3,948,872 | |
Natus Medical, Inc. (b) | | | 354,888 | | | | 11,707,755 | |
| | | | | | | | 15,656,627 | |
Industrials — 24.9% |
Aircastle Ltd. | | | 49,890 | | | | 1,596,979 | |
Alaska Air Group, Inc. | | | 225,462 | | | | 15,275,050 | |
Allegiant Travel Co. (a) | | | 108,520 | | | | 18,886,821 | |
Arcosa, Inc. | | | 121,014 | | | | 5,391,174 | |
Colfax Corp. (a)(b) | | | 432,122 | | | | 15,720,598 | |
Hub Group, Inc., Class A (b) | | | 557,765 | | | | 28,607,767 | |
Hyster-Yale Materials Handling, Inc. (a) | | | 136,962 | | | | 8,075,280 | |
Kelly Services, Inc., Class A | | | 202,086 | | | | 4,563,102 | |
Kirby Corp. (b) | | | 246,631 | | | | 22,080,873 | |
SPX FLOW, Inc. (b) | | | 359,926 | | | | 17,589,584 | |
Stericycle, Inc. (a)(b) | | | 159,724 | | | | 10,191,988 | |
Toro Co. (The) | | | 144,085 | | | | 11,479,252 | |
TriMas Corp. (b) | | | 242,370 | | | | 7,612,842 | |
Trinity Industries, Inc. (a) | | | 540,277 | | | | 11,967,136 | |
WESCO International, Inc. (b) | | | 141,419 | | | | 8,398,874 | |
| | | | | | | | 187,437,320 | |
Information Technology — 5.3% |
Broadridge Financial Solutions, Inc. | | | 141,188 | | | | 17,442,366 | |
Sanmina Corp. (b) | | | 331,795 | | | | 11,360,661 | |
WNS Holdings Ltd. - ADR (b) | | | 167,113 | | | | 11,054,525 | |
| | | | | | | | 39,857,552 | |
Materials — 2.3% |
Ashland Global Holdings, Inc. | | | 154,320 | | | | 11,810,110 | |
W.R. Grace & Co. | | | 73,481 | | | | 5,132,648 | |
| | | | | | | | 16,942,758 | |
Real Estate — 6.0% |
American Campus Communities, Inc. REIT | | | 147,523 | | | | 6,938,007 | |
CubeSmart REIT | | | 571,039 | | | | 17,976,308 | |
iStar, Inc. REIT (a) | | | 566,732 | | | | 8,223,281 | |
DIAMOND HILL FUNDS | ANNUAL REPORT | DECEMBER 31, 2019 | DIAMOND-HILL.COM 47 |
Diamond Hill Small Cap Fund
Schedule of Investments (Continued)
December 31, 2019
| | Shares | | | Fair
Value | |
Common Stocks — 97.3% continued |
Real Estate — 6.0% continued |
Jones Lang LaSalle, Inc. | | | 45,566 | | | $ | 7,932,585 | |
Tanger Factory Outlet Centers, Inc. REIT (a) | | | 284,121 | | | | 4,185,102 | |
| | | | | | | | 45,255,283 | |
Utilities — 2.4% |
South Jersey Industries, Inc. (a) | | | 338,907 | | | | 11,177,153 | |
UGI Corp. | | | 156,507 | | | | 7,067,856 | |
| | | | | | | | 18,245,009 | |
Total Common Stocks | | $ | 732,044,571 | |
Registered Investment Companies — 9.6% |
State Street Institutional Liquid Reserves Fund, Premier Class, 1.73% (c) | | | 18,605,051 | | | | 18,606,912 | |
State Street Navigator Securities Lending Portfolio I, 1.86% (c)(d) | | | 53,910,257 | | | | 53,910,257 | |
Total Registered Investment Companies | | $ | 72,517,169 | |
Total Investment Securities — 106.9% |
(Cost $529,289,680) | | $ | 804,561,740 | |
Liabilities in Excess of Other Assets — (6.9)% | | | (51,678,263 | ) |
Net Assets — 100.0% | | $ | 752,883,477 | |
(a) | All or a portion of the security is on loan. The total fair value of the securities on loan as of December 31, 2019 was $162,695,070. |
(b) | Non-income producing security. |
(c) | The rate shown is the 7-day effective yield as of December 31, 2019. |
(d) | This security was purchased with cash collateral held from securities on loan. The total value of such securities as of December 31, 2019 was $53,910,257. Securities on loan are also collateralized by various U.S. Treasury and government agency securities in the amount of $112,117,573. |
ADR - American Depositary Receipt
REIT - Real Estate Investment Trust
See accompanying Notes to Financial Statements.
Diamond Hill Small-Mid Cap Fund
Schedule of Investments
December 31, 2019
| | Shares | | | Fair
Value | |
Common Stocks — 92.8% |
Communication Services — 2.4% |
Liberty Media Corp. - Liberty Formula One - Series C (a) | | | 1,257,893 | | | $ | 57,819,052 | |
Consumer Discretionary — 12.1% |
BorgWarner, Inc. | | | 1,944,303 | | | | 84,343,864 | |
Carter’s, Inc. (b) | | | 245,421 | | | | 26,834,332 | |
Hanesbrands, Inc. (b) | | | 1,541,376 | | | | 22,889,434 | |
NVR, Inc. (a) | | | 14,297 | | | | 54,448,838 | |
Red Rock Resorts, Inc., Class A | | | 2,762,097 | | | | 66,152,223 | |
Vail Resorts, Inc. (b) | | | 136,618 | | | | 32,765,095 | |
Wolverine World Wide, Inc. | | | 222,017 | | | | 7,490,854 | |
| | | | | | | | 294,924,640 | |
Consumer Staples — 7.1% |
B&G Foods, Inc. (b) | | | 866,325 | | | | 15,533,207 | |
Cal-Maine Foods, Inc. (b) | | | 828,058 | | | | 35,399,479 | |
Flowers Foods, Inc. | | | 1,635,295 | | | | 35,551,313 | |
Molson Coors Brewing Co. | | | 327,305 | | | | 17,641,739 | |
Post Holdings, Inc. (a) | | | 636,678 | | | | 69,461,570 | |
| | | | | | | | 173,587,308 | |
Energy — 3.3% |
Cimarex Energy Co. | | | 720,061 | | | | 37,796,002 | |
Devon Energy Corp. | | | 515,173 | | | | 13,379,043 | |
WPX Energy, Inc. (a) | | | 2,118,062 | | | | 29,102,172 | |
| | | | | | | | 80,277,217 | |
Financials — 24.3% |
Bank OZK | | | 1,354,829 | | | | 41,329,059 | |
BankUnited, Inc. | | | 1,514,139 | | | | 55,356,922 | |
BOK Financial Corp. | | | 336,090 | | | | 29,374,266 | |
Brighthouse Financial, Inc. (a) | | | 569,359 | | | | 22,335,954 | |
Brown & Brown, Inc. | | | 631,549 | | | | 24,933,554 | |
Cadence BanCorp (b) | | | 1,508,397 | | | | 27,347,238 | |
Enstar Group Ltd. (a) | | | 89,340 | | | | 18,480,872 | |
First Horizon National Corp. | | | 748,496 | | | | 12,395,094 | |
First Republic Bank | | | 390,090 | | | | 45,816,070 | |
Mr. Cooper Group, Inc. (a) | | | 2,378,796 | | | | 29,758,738 | |
Popular, Inc. | | | 229,231 | | | | 13,467,321 | |
ProAssurance Corp. | | | 474,160 | | | | 17,136,142 | |
Reinsurance Group of America, Inc. | | | 276,378 | | | | 45,066,197 | |
48 DIAMOND HILL FUNDS | ANNUAL REPORT | DECEMBER 31, 2019 | DIAMOND-HILL.COM |
Diamond Hill Small-Mid Cap Fund
Schedule of Investments (Continued)
December 31, 2019
| | Shares | | | Fair
Value | |
Common Stocks — 92.8% continued |
Financials — 24.3% continued |
RenaissanceRe Holdings Ltd. | | | 192,838 | | | $ | 37,800,105 | |
Sterling Bancorp | | | 2,604,770 | | | | 54,908,552 | |
SVB Financial Group (a) | | | 154,745 | | | | 38,847,185 | |
Willis Towers Watson plc | | | 378,430 | | | | 76,420,154 | |
| | | | | | | | 590,773,423 | |
Health Care — 2.2% |
Boston Scientific Corp. (a) | | | 1,191,685 | | | | 53,887,996 | |
Industrials — 19.7% |
Aircastle Ltd. | | | 1,075,721 | | | | 34,433,829 | |
Alaska Air Group, Inc. | | | 650,894 | | | | 44,098,068 | |
Allegiant Travel Co. (b) | | | 291,045 | | | | 50,653,472 | |
Colfax Corp. (a)(b) | | | 1,290,539 | | | | 46,949,809 | |
Hub Group, Inc., Class A (a) | | | 1,223,164 | | | | 62,736,082 | |
Kirby Corp. (a) | | | 785,636 | | | | 70,337,991 | |
Parker-Hannifin Corp. | | | 85,903 | | | | 17,680,555 | |
Sensata Technologies Holding plc (a) | | | 889,785 | | | | 47,932,718 | |
SPX FLOW, Inc. (a) | | | 516,627 | | | | 25,247,561 | |
Stericycle, Inc. (a)(b) | | | 548,614 | | | | 35,007,059 | |
WESCO International, Inc. (a) | | | 766,618 | | | | 45,529,443 | |
| | | | | | | | 480,606,587 | |
Information Technology — 4.1% |
Avnet, Inc. | | | 582,557 | | | | 24,723,719 | |
Broadridge Financial Solutions, Inc. | | | 93,555 | | | | 11,557,785 | |
Juniper Networks, Inc. | | | 1,053,366 | | | | 25,944,405 | |
Sanmina Corp. (a) | | | 1,100,670 | | | | 37,686,941 | |
| | | | | | | | 99,912,850 | |
Materials — 5.9% |
Ashland Global Holdings, Inc. | | | 534,557 | | | | 40,909,647 | |
Axalta Coating Systems Ltd. (a) | | | 1,782,309 | | | | 54,182,194 | |
RPM International, Inc. (b) | | | 313,238 | | | | 24,044,149 | |
W.R. Grace & Co. | | | 364,442 | | | | 25,456,274 | |
| | | | | | | | 144,592,264 | |
| | Shares | | | Fair
Value | |
Real Estate — 8.1% |
American Campus Communities, Inc. REIT | | | 1,176,248 | | | $ | 55,318,943 | |
CubeSmart REIT | | | 1,775,017 | | | | 55,877,535 | |
iStar, Inc. REIT (b) | | | 2,125,926 | | | | 30,847,186 | |
Jones Lang LaSalle, Inc. | | | 136,477 | | | | 23,759,281 | |
Mid-America Apartment Communities, Inc. REIT | | | 232,913 | | | | 30,711,908 | |
| | | | | | | | 196,514,853 | |
Utilities — 3.6% |
South Jersey Industries, Inc. (b) | | | 943,662 | | | | 31,121,973 | |
UGI Corp. | | | 1,247,057 | | | | 56,317,094 | |
| | | | | | | | 87,439,067 | |
Total Common Stocks | | $ | 2,260,335,257 | |
| |
DIAMOND HILL FUNDS | ANNUAL REPORT | DECEMBER 31, 2019 | DIAMOND-HILL.COM 49 |
Diamond Hill Small-Mid Cap Fund
Schedule of Investments (Continued)
December 31, 2019
| | Shares | | | Fair
Value | |
Registered Investment Companies — 11.8% |
Diamond Hill Short Duration Total Return Fund, Class Y (c) | | | 4,026,827 | | | $ | 40,751,490 | |
State Street Institutional US Government Money Market Fund, Premier Class, 1.53% (d) | | | 138,992,143 | | | | 138,992,143 | |
State Street Navigator Securities Lending Portfolio I, 1.86% (d)(e) | | | 109,189,881 | | | | 109,189,881 | |
Total Registered Investment Companies | | $ | 288,933,514 | |
Total Investment Securities — 104.6% |
(Cost $2,067,223,810) | | $ | 2,549,268,771 | |
Liabilities in Excess of Other Assets — (4.6)% | | | (112,806,317 | ) |
Net Assets — 100.0% | | $ | 2,436,462,454 | |
(a) | Non-income producing security. |
(b) | All or a portion of the security is on loan. The total fair value of the securities on loan as of December 31, 2019 was $190,937,589. |
(d) | The rate shown is the 7-day effective yield as of December 31, 2019. |
(e) | This security was purchased with cash collateral held from securities on loan. The total value of such securities as of December 31, 2019 was $109,189,881. Securities on loan are also collateralized by various U.S. Treasury and government agency securities in the amount of $85,991,351. |
plc - Public Limited Company
REIT - Real Estate Investment Trust
See accompanying Notes to Financial Statements.
Diamond Hill Mid Cap Fund
Schedule of Investments
December 31, 2019
| | Shares | | | Fair
Value | |
Common Stocks — 91.7% |
Communication Services — 2.4% |
Liberty Media Corp. - Liberty Formula One - Series C (a) | | | 117,829 | | | $ | 5,416,010 | |
Consumer Discretionary — 12.2% |
Advance Auto Parts, Inc. | | | 10,558 | | | | 1,690,969 | |
BorgWarner, Inc. | | | 181,354 | | | | 7,867,137 | |
Carter’s, Inc. | | | 18,090 | | | | 1,977,961 | |
Hanesbrands, Inc. | | | 139,564 | | | | 2,072,525 | |
NVR, Inc. (a) | | | 1,326 | | | | 5,049,952 | |
Red Rock Resorts, Inc., Class A | | | 264,599 | | | | 6,337,146 | |
Vail Resorts, Inc. | | | 12,805 | | | | 3,071,023 | |
| | | | | | | | 28,066,713 | |
Consumer Staples — 7.3% |
Archer-Daniels-Midland Co. | | | 58,461 | | | | 2,709,667 | |
B&G Foods, Inc. (b) | | | 45,577 | | | | 817,196 | |
Flowers Foods, Inc. | | | 121,043 | | | | 2,631,475 | |
Molson Coors Brewing Co. | | | 79,196 | | | | 4,268,664 | |
Post Holdings, Inc. (a) | | | 58,653 | | | | 6,399,042 | |
| | | | | | | | 16,826,044 | |
Energy — 3.5% |
Cimarex Energy Co. | | | 76,389 | | | | 4,009,659 | |
Devon Energy Corp. | | | 47,824 | | | | 1,241,989 | |
Noble Energy, Inc. | | | 117,486 | | | | 2,918,352 | |
| | | | | | | | 8,170,000 | |
Financials — 27.5% |
Bank OZK | | | 109,249 | | | | 3,332,641 | |
BankUnited, Inc. | | | 140,673 | | | | 5,143,005 | |
BOK Financial Corp. | | | 28,565 | | | | 2,496,581 | |
Brighthouse Financial, Inc. (a) | | | 58,224 | | | | 2,284,128 | |
Discover Financial Services | | | 52,884 | | | | 4,485,621 | |
Enstar Group Ltd. (a) | | | 7,938 | | | | 1,642,055 | |
First Republic Bank | | | 44,321 | | | | 5,205,501 | |
Franklin Resources, Inc. | | | 64,848 | | | | 1,684,751 | |
Hartford Financial Services Group, Inc. (The) | | | 69,176 | | | | 4,203,826 | |
Loews Corp. | | | 202,871 | | | | 10,648,699 | |
Mr. Cooper Group, Inc. (a) | | | 163,991 | | | | 2,051,527 | |
Reinsurance Group of America, Inc. | | | 16,445 | | | | 2,681,522 | |
50 DIAMOND HILL FUNDS | ANNUAL REPORT | DECEMBER 31, 2019 | DIAMOND-HILL.COM |
Diamond Hill Mid Cap Fund
Schedule of Investments (Continued)
December 31, 2019
| | Shares | | | Fair
Value | |
Common Stocks — 91.7% continued |
Financials — 27.5% continued |
RenaissanceRe Holdings Ltd. | | | 16,266 | | | $ | 3,188,461 | |
Sterling Bancorp | | | 233,712 | | | | 4,926,649 | |
SVB Financial Group (a) | | | 14,132 | | | | 3,547,697 | |
Willis Towers Watson plc | | | 28,678 | | | | 5,791,235 | |
| | | | | | | | 63,313,899 | |
Health Care — 2.3% |
Boston Scientific Corp. (a) | | | 115,114 | | | | 5,205,455 | |
Industrials — 17.2% |
Alaska Air Group, Inc. | | | 62,052 | | | | 4,204,023 | |
Colfax Corp. (a)(b) | | | 123,453 | | | | 4,491,220 | |
Deere & Co. | | | 6,267 | | | | 1,085,820 | |
Hub Group, Inc., Class A (a) | | | 54,548 | | | | 2,797,767 | |
Kirby Corp. (a) | | | 74,859 | | | | 6,702,126 | |
Parker-Hannifin Corp. | | | 23,406 | | | | 4,817,423 | |
Sensata Technologies Holding plc (a) | | | 83,383 | | | | 4,491,842 | |
Stericycle, Inc. (a)(b) | | | 52,517 | | | | 3,351,110 | |
United Airlines Holdings, Inc. (a) | | | 43,883 | | | | 3,865,653 | |
WESCO International, Inc. (a) | | | 62,281 | | | | 3,698,869 | |
| | | | | | | | 39,505,853 | |
Information Technology — 3.6% |
Avnet, Inc. | | | 54,539 | | | | 2,314,635 | |
Check Point Software Technologies Ltd. (a)(b) | | | 30,864 | | | | 3,424,669 | |
Juniper Networks, Inc. | | | 100,570 | | | | 2,477,039 | |
| | | | | | | | 8,216,343 | |
Materials — 5.8% |
Ashland Global Holdings, Inc. | | | 49,826 | | | | 3,813,184 | |
Axalta Coating Systems Ltd. (a) | | | 166,117 | | | | 5,049,957 | |
RPM International, Inc. | | | 28,334 | | | | 2,174,918 | |
W.R. Grace & Co. | | | 34,113 | | | | 2,382,793 | |
| | | | | | | | 13,420,852 | |
Real Estate — 6.3% |
American Campus Communities, Inc. REIT | | | 97,429 | | | | 4,582,086 | |
CubeSmart REIT | | | 163,107 | | | | 5,134,608 | |
| | Shares | | | Fair
Value | |
Real Estate — 6.3% continued |
Jones Lang LaSalle, Inc. | | | 11,822 | | | $ | 2,058,092 | |
Mid-America Apartment Communities, Inc. REIT | | | 19,946 | | | | 2,630,080 | |
| | | | | | | | 14,404,866 | |
Utilities — 3.6% |
South Jersey Industries, Inc. | | | 88,924 | | | | 2,932,713 | |
UGI Corp. | | | 119,080 | | | | 5,377,653 | |
| | | | | | | | 8,310,366 | |
Total Common Stocks | | $ | 210,856,401 | |
Registered Investment Companies — 10.2% |
Diamond Hill Short Duration Total Return Fund, Class Y (c) | | | 231,759 | | | | 2,345,400 | |
State Street Institutional US Government Money Market Fund, Premier Class, 1.53% (d) | | | 17,064,549 | | | | 17,064,549 | |
State Street Navigator Securities Lending Portfolio I, 1.86% (d)(e) | | | 4,102,191 | | | | 4,102,191 | |
Total Registered Investment Companies | | $ | 23,512,140 | |
Total Investment Securities — 101.9% |
(Cost $206,941,021) | | $ | 234,368,541 | |
Liabilities in Excess of Other Assets — (1.9)% | | | (4,381,842 | ) |
Net Assets — 100.0% | | $ | 229,986,699 | |
(a) | Non-income producing security. |
(b) | All or a portion of the security is on loan. The total fair value of the securities on loan as of December 31, 2019 was $5,712,625. |
(d) | The rate shown is the 7-day effective yield as of December 31, 2019. |
(e) | This security was purchased with cash collateral held from securities on loan. The total value of such securities as of December 31, 2019 was $4,102,191. Securities on loan are also collateralized by various U.S. Treasury and government agency securities in the amount of $1,737,150. |
plc - Public Limited Company
REIT - Real Estate Investment Trust
See accompanying Notes to Financial Statements.
DIAMOND HILL FUNDS | ANNUAL REPORT | DECEMBER 31, 2019 | DIAMOND-HILL.COM 51 |
Diamond Hill Large Cap Fund
Schedule of Investments
December 31, 2019
| | Shares | | | Fair
Value | |
Common Stocks — 97.3% |
Communication Services — 12.0% |
Alphabet, Inc., Class A (a) | | | 168,470 | | | $ | 225,647,033 | |
Charter Communications, Inc., Class A (a) | | | 273,073 | | | | 132,462,251 | |
Comcast Corp., Class A | | | 2,608,773 | | | | 117,316,522 | |
Facebook, Inc., Class A (a) | | | 677,923 | | | | 139,143,696 | |
Walt Disney Co. (The) | | | 1,379,358 | | | | 199,496,547 | |
| | | | | | | | 814,066,049 | |
Consumer Discretionary — 13.3% |
Booking Holdings, Inc. (a) | | | 58,886 | | | | 120,935,945 | |
BorgWarner, Inc. | | | 3,263,913 | | | | 141,588,546 | |
General Motors Co. | | | 3,537,346 | | | | 129,466,864 | |
Hanesbrands, Inc. (b) | | | 5,424,663 | | | | 80,556,245 | |
NVR, Inc. (a) | | | 37,611 | | | | 143,238,108 | |
O’Reilly Automotive, Inc. (a) | | | 201,480 | | | | 88,300,625 | |
TJX Cos., Inc. (The) | | | 3,259,530 | | | | 199,026,902 | |
| | | | | | | | 903,113,235 | |
Consumer Staples — 10.5% |
Archer-Daniels-Midland Co. | | | 1,589,088 | | | | 73,654,229 | |
Kimberly-Clark Corp. | | | 932,522 | | | | 128,268,401 | |
PepsiCo, Inc. | | | 1,229,342 | | | | 168,014,171 | |
Philip Morris International, Inc. | | | 2,272,295 | | | | 193,349,582 | |
Procter & Gamble Co. (The) | | | 1,197,139 | | | | 149,522,661 | |
| | | | | | | | 712,809,044 | |
Energy — 3.6% |
Chevron Corp. | | | 1,431,282 | | | | 172,483,794 | |
Cimarex Energy Co. | | | 1,356,520 | | | | 71,203,735 | |
| | | | | | | | 243,687,529 | |
Financials — 27.5% |
American International Group, Inc. | | | 3,494,002 | | | | 179,347,123 | |
Berkshire Hathaway, Inc., Class B (a) | | | 975,278 | | | | 220,900,467 | |
Charles Schwab Corp. (The) | | | 2,449,083 | | | | 116,478,387 | |
Citigroup, Inc. | | | 3,755,102 | | | | 299,995,099 | |
Discover Financial Services | | | 1,452,550 | | | | 123,205,291 | |
First Republic Bank | | | 924,108 | | | | 108,536,485 | |
Hartford Financial Services Group, Inc. (The) | | | 1,847,593 | | | | 112,278,227 | |
| | Shares | | | Fair
Value | |
Financials — 27.5% continued |
JPMorgan Chase & Co. | | | 727,981 | | | $ | 101,480,551 | |
KKR & Co., Inc., Class A | | | 4,653,926 | | | | 135,755,021 | |
Loews Corp. | | | 1,170,903 | | | | 61,460,698 | |
Marsh & McLennan Cos., Inc. | | | 662,646 | | | | 73,825,391 | |
MetLife, Inc. | | | 4,045,200 | | | | 206,183,844 | |
Morgan Stanley | | | 2,448,193 | | | | 125,151,626 | |
| | | | | | | | 1,864,598,210 | |
Health Care — 13.8% |
Abbott Laboratories | | | 3,139,685 | | | | 272,713,039 | |
Gilead Sciences, Inc. | | | 1,137,463 | | | | 73,912,346 | |
Humana, Inc. | | | 302,486 | | | | 110,867,169 | |
Medtronic plc | | | 1,683,181 | | | | 190,956,884 | |
Pfizer, Inc. | | | 3,977,538 | | | | 155,839,939 | |
Thermo Fisher Scientific, Inc. | | | 401,983 | | | | 130,592,217 | |
| | | | | | | | 934,881,594 | |
Industrials — 7.5% |
Honeywell International, Inc. | | | 472,617 | | | | 83,653,209 | |
Parker-Hannifin Corp. | | | 703,123 | | | | 144,716,776 | |
United Airlines Holdings, Inc. (a) | | | 952,738 | | | | 83,926,690 | |
United Technologies Corp. | | | 1,294,534 | | | | 193,869,412 | |
| | | | | | | | 506,166,087 | |
Information Technology — 5.7% |
Fidelity National Information Services, Inc. | | | 766,886 | | | | 106,666,174 | |
Microsoft Corp. | | | 1,043,366 | | | | 164,538,818 | |
Texas Instruments, Inc. | | | 885,408 | | | | 113,588,992 | |
| | | | | | | | 384,793,984 | |
Materials — 3.4% |
Axalta Coating Systems Ltd. (a) | | | 1,787,147 | | | | 54,329,269 | |
Eastman Chemical Co. | | | 869,478 | | | | 68,914,826 | |
Linde plc | | | 491,071 | | | | 104,549,016 | |
| | | | | | | | 227,793,111 | |
Total Common Stocks | | $ | 6,591,908,843 | |
52 DIAMOND HILL FUNDS | ANNUAL REPORT | DECEMBER 31, 2019 | DIAMOND-HILL.COM |
Diamond Hill Large Cap Fund
Schedule of Investments (Continued)
December 31, 2019
| | Shares | | | Fair
Value | |
Registered Investment Companies — 2.6% |
State Street Institutional Liquid Reserves Fund, Premier Class, 1.73% (c) | | | 163,935,121 | | | $ | 163,951,515 | |
State Street Navigator Securities Lending Portfolio I, 1.86% (c)(d) | | | 9,680,181 | | | | 9,680,151 | |
Total Registered Investment Companies | | $ | 173,631,666 | |
Total Investment Securities — 99.9% |
(Cost $4,731,934,313) | | $ | 6,765,540,509 | |
Other Assets in Excess of Liabilities — 0.1% | | | 7,281,200 | |
Net Assets — 100.0% | | $ | 6,772,821,709 | |
(a) | Non-income producing security. |
(b) | All or a portion of the security is on loan. The total fair value of the securities on loan as of December 31, 2019 was $31,194,489. |
(c) | The rate shown is the 7-day effective yield as of December 31, 2019. |
(d) | This security was purchased with cash collateral held from securities on loan. The total value of such securities as of December 31, 2019 was $9,680,151. Securities on loan are also collateralized by various U.S. Treasury and government agency securities in the amount of $22,354,594. |
plc - Public Limited Company
See accompanying Notes to Financial Statements.
Diamond Hill All Cap Select Fund
Schedule of Investments
December 31, 2019
| | Shares | | | Fair
Value | |
Common Stocks — 94.8% |
Communication Services — 7.9% |
Alphabet, Inc., Class A (a) | | | 9,055 | | | $ | 12,128,176 | |
Facebook, Inc., Class A (a) | | | 26,245 | | | | 5,386,786 | |
Liberty Media Corp. - Liberty Formula One - Series C (a) | | | 88,957 | | | | 4,088,909 | |
| | | | | | | | 21,603,871 | |
Consumer Discretionary — 15.2% |
BorgWarner, Inc. | | | 203,865 | | | | 8,843,664 | |
Hanesbrands, Inc. | | | 232,259 | | | | 3,449,046 | |
NVR, Inc. (a) | | | 1,258 | | | | 4,790,980 | |
Red Rock Resorts, Inc., Class A | | | 594,515 | | | | 14,238,634 | |
Vail Resorts, Inc. | | | 42,026 | | | | 10,079,096 | |
| | | | | | | | 41,401,420 | |
Consumer Staples — 8.7% |
Archer-Daniels-Midland Co. | | | 72,705 | | | | 3,369,877 | |
Cal-Maine Foods, Inc. (b) | | | 190,710 | | | | 8,152,853 | |
Philip Morris International, Inc. | | | 142,422 | | | | 12,118,688 | |
| | | | | | | | 23,641,418 | |
Financials — 30.6% |
American International Group, Inc. | | | 255,077 | | | | 13,093,102 | |
Bank OZK | | | 153,321 | | | | 4,677,057 | |
Berkshire Hathaway, Inc., Class B (a) | | | 63,213 | | | | 14,317,745 | |
Charles Schwab Corp. (The) | | | 69,854 | | | | 3,322,256 | |
Citigroup, Inc. | | | 85,761 | | | | 6,851,446 | |
First Republic Bank | | | 40,590 | | | | 4,767,296 | |
KKR & Co., Inc., Class A | | | 279,139 | | | | 8,142,485 | |
MetLife, Inc. | | | 266,113 | | | | 13,563,780 | |
Mr. Cooper Group, Inc. (a) | | | 1,158,093 | | | | 14,487,743 | |
| | | | | | | | 83,222,910 | |
Health Care — 8.7% |
Allergan plc | | | 49,694 | | | | 9,500,002 | |
Gilead Sciences, Inc. | | | 112,685 | | | | 7,322,271 | |
GlaxoSmithKline plc - ADR (b) | | | 145,069 | | | | 6,816,792 | |
| | | | | | | | 23,639,065 | |
DIAMOND HILL FUNDS | ANNUAL REPORT | DECEMBER 31, 2019 | DIAMOND-HILL.COM 53 |
Diamond Hill All Cap Select Fund
Schedule of Investments (Continued)
December 31, 2019
| | Shares | | | Fair
Value | |
Common Stocks — 94.8% continued |
Industrials — 16.5% |
Colfax Corp. (a) | | | 206,530 | | | $ | 7,513,561 | |
Copa Holdings SA, Class A | | | 76,043 | | | | 8,218,727 | |
Hub Group, Inc., Class A (a) | | | 186,115 | | | | 9,545,838 | |
Johnson Controls International plc | | | 149,619 | | | | 6,090,989 | |
Kirby Corp. (a) | | | 77,279 | | | | 6,918,789 | |
United Airlines Holdings, Inc. (a) | | | 76,613 | | | | 6,748,839 | |
| | | | | | | | 45,036,743 | |
Information Technology — 4.2% |
Cognizant Technology Solutions Corp., Class A | | | 109,259 | | | | 6,776,243 | |
Sanmina Corp. (a) | | | 139,450 | | | | 4,774,768 | |
| | | | | | | | 11,551,011 | |
Materials — 3.0% |
Ashland Global Holdings, Inc. | | | 44,438 | | | | 3,400,840 | |
Sherwin-Williams Co. (The) | | | 8,250 | | | | 4,814,205 | |
| | | | | | | | 8,215,045 | |
Total Common Stocks | | $ | 258,311,483 | |
Registered Investment Companies — 8.0% |
State Street Institutional US Government Money Market Fund, Premier Class, 1.53% (c) | | | 14,025,924 | | | | 14,025,924 | |
State Street Navigator Securities Lending Portfolio I, 1.86% (c)(d) | | | 7,741,480 | | | | 7,741,480 | |
Total Registered Investment Companies | | $ | 21,767,404 | |
Total Investment Securities — 102.8% |
(Cost $234,813,717) | | $ | 280,078,887 | |
Liabilities in Excess of Other Assets — (2.8)% | | | (7,729,171 | ) |
Net Assets — 100.0% | | $ | 272,349,716 | |
(a) | Non-income producing security. |
(b) | All or a portion of the security is on loan. The total fair value of the securities on loan as of December 31, 2019 was $7,554,023. |
(c) | The rate shown is the 7-day effective yield as of December 31, 2019. |
(d) | This security was purchased with cash collateral held from securities on loan. The total value of such securities as of December 31, 2019 was $7,741,480. |
ADR - American Depositary Receipt
plc - Public Limited Company
SA - Societe Anonyme
See accompanying Notes to Financial Statements.
54 DIAMOND HILL FUNDS | ANNUAL REPORT | DECEMBER 31, 2019 | DIAMOND-HILL.COM |
Diamond Hill Long-Short Fund
Schedule of Investments
December 31, 2019
| | Shares | | | Fair
Value | |
Common Stocks — 86.5% |
Communication Services — 10.0% |
Alphabet, Inc., Class A (a) | | | 97,275 | | | $ | 130,289,162 | |
Comcast Corp., Class A (b)(c) | | | 1,494,980 | | | | 67,229,251 | |
Facebook, Inc., Class A (a)(c) | | | 424,610 | | | | 87,151,202 | |
Walt Disney Co. (The) (b) | | | 478,204 | | | | 69,162,644 | |
| | | | | | | | 353,832,259 | |
Consumer Discretionary — 7.3% |
Advance Auto Parts, Inc. (b) | | | 284,385 | | | | 45,547,102 | |
Booking Holdings, Inc. (a)(b) | | | 30,205 | | | | 62,032,915 | |
BorgWarner, Inc. (b) | | | 1,530,840 | | | | 66,407,839 | |
Hanesbrands, Inc. (b)(c) | | | 2,715,465 | | | | 40,324,655 | |
TJX Cos., Inc. (The) (b) | | | 716,108 | | | | 43,725,554 | |
| | | | | | | | 258,038,065 | |
Consumer Staples — 2.9% |
Archer-Daniels-Midland Co. (b) | | | 959,645 | | | | 44,479,546 | |
Constellation Brands, Inc., Class A (b) | | | 295,614 | | | | 56,092,756 | |
| | | | | | | | 100,572,302 | |
Energy — 2.3% |
Cimarex Energy Co. | | | 1,367,699 | | | | 71,790,521 | |
Devon Energy Corp. (b) | | | 364,865 | | | | 9,475,544 | |
| | | | | | | | 81,266,065 | |
Financials — 24.8% |
American International Group, Inc. (b) | | | 1,931,585 | | | | 99,148,258 | |
Bank OZK (b) | | | 2,066,509 | | | | 63,038,857 | |
BankUnited, Inc. (b) | | | 713,128 | | | | 26,071,960 | |
Berkshire Hathaway, Inc., Class B (a)(c) | | | 440,505 | | | | 99,774,383 | |
Charles Schwab Corp. (The) (b) | | | 946,740 | | | | 45,026,954 | |
Citigroup, Inc. (b)(c) | | | 1,923,349 | | | | 153,656,352 | |
Discover Financial Services (b) | | | 452,704 | | | | 38,398,353 | |
First Republic Bank (b)(c) | | | 286,685 | | | | 33,671,153 | |
Hartford Financial Services Group, Inc. (The) (b) | | | 775,401 | | | | 47,121,119 | |
JPMorgan Chase & Co. (b)(c) | | | 220,310 | | | | 30,711,214 | |
KKR & Co., Inc., Class A (b) | | | 1,120,937 | | | | 32,697,732 | |
| | Shares | | | Fair
Value | |
Financials — 24.8% continued |
MetLife, Inc. (b)(c) | | | 1,914,759 | | | $ | 97,595,266 | |
Morgan Stanley | | | 867,793 | | | | 44,361,578 | |
SVB Financial Group (a)(b) | | | 184,745 | | | | 46,378,385 | |
Wells Fargo & Co. | | | 328,982 | | | | 17,699,232 | |
| | | | | | | | 875,350,796 | |
Health Care — 12.1% |
Abbott Laboratories (b) | | | 482,480 | | | | 41,908,213 | |
Allergan plc (c) | | | 512,277 | | | | 97,931,994 | |
CVS Health Corp. | | | 376,629 | | | | 27,979,768 | |
Humana, Inc. | | | 206,620 | | | | 75,730,362 | |
Medtronic plc (c) | | | 703,359 | | | | 79,796,079 | |
Perrigo Co. plc (b) | | | 1,076,500 | | | | 55,611,990 | |
Pfizer, Inc. (b) | | | 1,268,520 | | | | 49,700,614 | |
| | | | | | | | 428,659,020 | |
Industrials — 13.8% |
Alaska Air Group, Inc. (b) | | | 798,735 | | | | 54,114,296 | |
Johnson Controls International plc (b)(c) | | | 2,223,154 | | | | 90,504,599 | |
Kirby Corp. (a)(b) | | | 771,796 | | | | 69,098,896 | |
Parker-Hannifin Corp. (b) | | | 182,430 | | | | 37,547,743 | |
Sensata Technologies Holding plc (a)(b) | | | 998,277 | | | | 53,777,182 | |
United Airlines Holdings, Inc. (a)(c) | | | 1,500,265 | | | | 132,158,344 | |
United Technologies Corp. (c) | | | 324,885 | | | | 48,654,778 | |
| | | | | | | | 485,855,838 | |
Information Technology — 7.9% |
Cognizant Technology Solutions Corp., Class A | | | 1,251,595 | | | | 77,623,922 | |
Fidelity National Information Services, Inc. | | | 416,256 | | | | 57,897,047 | |
Microsoft Corp. (c) | | | 590,982 | | | | 93,197,861 | |
Texas Instruments, Inc. | | | 397,615 | | | | 51,010,028 | |
| | | | | | | | 279,728,858 | |
Materials — 5.4% |
Ashland Global Holdings, Inc. (b) | | | 696,113 | | | | 53,273,528 | |
Axalta Coating Systems Ltd. (a)(b) | | | 1,499,129 | | | | 45,573,522 | |
RPM International, Inc. (b) | | | 559,875 | | | | 42,976,005 | |
W.R. Grace & Co. (b) | | | 680,070 | | | | 47,502,889 | |
| | | | | | | | 189,325,944 | |
Total Common Stocks | | $ | 3,052,629,147 | |
DIAMOND HILL FUNDS | ANNUAL REPORT | DECEMBER 31, 2019 | DIAMOND-HILL.COM 55 |
Diamond Hill Long-Short Fund
Schedule of Investments (Continued)
December 31, 2019
| | Shares | | | Fair
Value | |
Registered Investment Companies — 27.4% |
Diamond Hill Short Duration Total Return Fund, Class Y (d) | | | 6,762,157 | | | $ | 68,433,025 | |
State Street Institutional Liquid Reserves Fund, Premier Class, 1.73% (e) | | | 367,800,439 | | | | 367,837,219 | |
State Street Navigator Securities Lending Portfolio I, 1.86% (e)(f) | | | 528,811,125 | | | | 528,811,125 | |
Total Registered Investment Companies | | $ | 965,081,369 | |
Total Investment Securities — 113.9% |
(Cost $3,051,143,489) | | $ | 4,017,710,516 | |
Segregated Cash With Custodian — 30.2% | | | 1,064,461,553 | |
Investments Sold Short — (30.0)% |
(Proceeds $963,079,987) | | | (1,056,982,316 | ) |
Liabilities in Excess of Other Assets — (14.1)% | | | (497,172,400 | ) |
Net Assets — 100.0% | | $ | 3,528,017,353 | |
(a) | Non-income producing security. |
(b) | All or a portion of the security is on loan. The total fair value of the securities on loan as of December 31, 2019 was $518,894,516. |
(c) | All or a portion of the shares have been pledged as collateral for open short positions. |
(e) | The rate shown is the 7-day effective yield as of December 31, 2019. |
(f) | This security was purchased with cash collateral held from securities on loan. The total value of such securities as of December 31, 2019 was $528,811,125. |
plc - Public Limited Company
See accompanying Notes to Financial Statements.
Diamond Hill Long-Short Fund
Schedule of Investments Sold Short
December 31, 2019
| | Shares | | | Fair
Value | |
Common Stocks — 30.0% |
Communication Services — 0.6% |
Cogent Communications Holdings, Inc. | | | 193,845 | | | $ | 12,756,940 | |
Omnicom Group, Inc. | | | 113,837 | | | | 9,223,074 | |
| | | | | | | | 21,980,014 | |
Consumer Discretionary — 9.3% |
AutoNation, Inc. | | | 510,307 | | | | 24,816,230 | |
Best Buy Co., Inc. | | | 344,354 | | | | 30,234,281 | |
Cheesecake Factory, Inc. (The) | | | 365,308 | | | | 14,195,869 | |
Dick’s Sporting Goods, Inc. | | | 1,032,006 | | | | 51,073,977 | |
Grand Canyon Education, Inc. | | | 291,416 | | | | 27,914,739 | |
PulteGroup, Inc. | | | 723,395 | | | | 28,067,726 | |
Tesla, Inc. | | | 151,192 | | | | 63,248,149 | |
Under Armour, Inc., Class A | | | 1,406,194 | | | | 30,373,790 | |
Walmart, Inc. | | | 143,842 | | | | 17,094,183 | |
Whirlpool Corp. | | | 279,370 | | | | 41,215,456 | |
| | | | | | | | 328,234,400 | |
Consumer Staples — 2.5% |
Boston Beer Co., Inc., Class A | | | 116,735 | | | | 44,108,320 | |
Brown-Forman Corp., Class B | | | 667,720 | | | | 45,137,872 | |
| | | | | | | | 89,246,192 | |
Financials — 4.5% |
Bank of Hawaii Corp. | | | 501,252 | | | | 47,699,140 | |
Cincinnati Financial Corp. | | | 501,161 | | | | 52,697,079 | |
Commerce Bancshares, Inc. | | | 722,811 | | | | 49,107,779 | |
First American Financial Corp. | | | 140,618 | | | | 8,200,842 | |
| | | | | | | | 157,704,840 | |
Health Care — 2.1% |
Encompass Health Corp. | | | 102,485 | | | | 7,099,136 | |
Henry Schein, Inc. | | | 132,630 | | | | 8,849,074 | |
Integra LifeSciences Holdings Corp. | | | 471,935 | | | | 27,504,372 | |
Waters Corp. | | | 120,805 | | | | 28,226,088 | |
| | | | | | | | 71,678,670 | |
56 DIAMOND HILL FUNDS | ANNUAL REPORT | DECEMBER 31, 2019 | DIAMOND-HILL.COM |
Diamond Hill Long-Short Fund
Schedule of Investments Sold Short
(Continued)
December 31, 2019
| | Shares | | | Fair
Value | |
Common Stocks — 30.0% continued |
Industrials — 4.9% |
Hawaiian Holdings, Inc. | | | 598,515 | | | $ | 17,530,504 | |
Lennox International, Inc. | | | 35,560 | | | | 8,675,573 | |
PACCAR, Inc. | | | 832,827 | | | | 65,876,616 | |
Robert Half International, Inc. | | | 311,350 | | | | 19,661,753 | |
W.W. Grainger, Inc. | | | 141,978 | | | | 48,062,393 | |
Wabtec Corp. | | | 176,890 | | | | 13,762,042 | |
| | | | | | | | 173,568,881 | |
Information Technology — 3.9% |
Blackbaud, Inc. | | | 167,968 | | | | 13,370,253 | |
Cisco Systems, Inc. | | | 610,418 | | | | 29,275,647 | |
j2 Global, Inc. | | | 359,554 | | | | 33,693,805 | |
Oracle Corp. | | | 667,830 | | | | 35,381,633 | |
Western Union Co. (The) | | | 987,733 | | | | 26,451,490 | |
| | | | | | | | 138,172,828 | |
Materials — 0.5% |
Silgan Holdings, Inc. | | | 558,075 | | | | 17,344,971 | |
Real Estate — 0.3% |
VEREIT, Inc. | | | 1,062,605 | | | | 9,818,470 | |
Utilities — 1.4% |
Consolidated Edison, Inc. | | | 544,192 | | | | 49,233,050 | |
Total Investments Sold Short — 30.0% |
(Proceeds $963,079,987) | | $ | 1,056,982,316 | |
Percentages disclosed are based on total net assets of the Fund at December 31, 2019.
See accompanying Notes to Financial Statements.
Diamond Hill Research
Opportunities Fund
Schedule of Investments
December 31, 2019
| | Shares | | | Fair
Value | |
Common Stocks — 96.6% |
Communication Services — 15.9% |
Alphabet, Inc., Class A (a)(b) | | | 2,539 | | | $ | 3,400,711 | |
Baidu, Inc. - ADR (a)(c) | | | 4,933 | | | | 623,531 | |
Bollore SA (FR) | | | 256,626 | | | | 1,121,438 | |
Charter Communications, Inc., Class A (a)(c) | | | 1,089 | | | | 528,252 | |
Facebook, Inc., Class A (a)(b) | | | 11,421 | | | | 2,344,160 | |
Fox Corp., Class B | | | 5,856 | | | | 213,158 | |
Liberty Media Corp. - Liberty Formula One - Series C (a)(c) | | | 42,985 | | | | 1,975,806 | |
Tencent Holdings Ltd. (HK) | | | 19,000 | | | | 915,336 | |
Walt Disney Co. (The) (b) | | | 4,506 | | | | 651,703 | |
Zynga, Inc., Class A (a)(c) | | | 60,496 | | | | 370,235 | |
| | | | | | | | 12,144,330 | |
Consumer Discretionary — 11.1% |
Advance Auto Parts, Inc. (b) | | | 3,131 | | | | 501,461 | |
EssilorLuxottica SA (FR) | | | 4,173 | | | | 637,977 | |
Hanesbrands, Inc. (c) | | | 18,900 | | | | 280,665 | |
McDonald’s Corp. | | | 2,310 | | | | 456,479 | |
NVR, Inc. (a) | | | 275 | | | | 1,047,313 | |
O’Reilly Automotive, Inc. (a) | | | 1,018 | | | | 446,149 | |
Red Rock Resorts, Inc., Class A (b) | | | 95,518 | | | | 2,287,656 | |
Starbucks Corp. | | | 3,850 | | | | 338,492 | |
TJX Cos., Inc. (The) | | | 3,522 | | | | 215,053 | |
Vail Resorts, Inc. (c) | | | 9,400 | | | | 2,254,402 | |
| | | | | | | | 8,465,647 | |
Consumer Staples — 3.9% |
Archer-Daniels-Midland Co. | | | 7,000 | | | | 324,450 | |
Cal-Maine Foods, Inc. (c) | | | 32,200 | | | | 1,376,550 | |
Constellation Brands, Inc., Class A (c) | | | 1,600 | | | | 303,600 | |
Seaboard Corp. (c) | | | 240 | | | | 1,020,132 | |
| | | | | | | | 3,024,732 | |
Energy — 0.5% |
Chevron Corp. | | | 2,188 | | | | 263,676 | |
WPX Energy, Inc. (a) | | | 9,851 | | | | 135,353 | |
| | | | | | | | 399,029 | |
DIAMOND HILL FUNDS | ANNUAL REPORT | DECEMBER 31, 2019 | DIAMOND-HILL.COM 57 |
Diamond Hill Research Opportunities Fund
Schedule of Investments (Continued)
December 31, 2019
| | Shares | | | Fair
Value | |
Common Stocks — 96.6% continued |
Financials — 13.5% |
Banco Bilbao Vizcaya Argentaria SA (ES) | | | 28,347 | | | $ | 159,150 | |
Bank of New York Mellon Corp. (The) (c) | | | 16,685 | | | | 839,756 | |
Bank OZK | | | 46,020 | | | | 1,403,840 | |
BankUnited, Inc. | | | 13,920 | | | | 508,915 | |
Cadence BanCorp (c) | | | 21,718 | | | | 393,747 | |
Credit Suisse Group AG (SW) (a) | | | 36,601 | | | | 494,847 | |
Discover Financial Services (c) | | | 3,972 | | | | 336,905 | |
Fairfax India Holdings Corp. (a) | | | 41,012 | | | | 527,455 | |
First Republic Bank (c) | | | 7,928 | | | | 931,144 | |
Julius Baer Group Ltd. (SW) (a) | | | 9,897 | | | | 510,309 | |
Kasikornbank pcl – NVDR (TH) | | | 17,100 | | | | 86,668 | |
KKR & Co., Inc., Class A | | | 11,833 | | | | 345,169 | |
Live Oak Bancshares, Inc. (c) | | | 15,000 | | | | 285,150 | |
Morgan Stanley | | | 12,538 | | | | 640,943 | |
Mr. Cooper Group, Inc. (a) | | | 142,664 | | | | 1,784,727 | |
SCOR SE (FR) | | | 1,000 | | | | 42,096 | |
SVB Financial Group (a)(c) | | | 4,220 | | | | 1,059,389 | |
| | | | | | | | 10,350,210 | |
Health Care — 11.0% |
Acorda Therapeutics, Inc. (a)(c) | | | 65,638 | | | | 133,902 | |
Allergan plc (b) | | | 5,310 | | | | 1,015,113 | |
Endo International plc (a)(c) | | | 156,560 | | | | 734,266 | |
Humana, Inc. | | | 2,580 | | | | 945,622 | |
Ironwood Pharmaceuticals, Inc. (a)(c) | | | 20,512 | | | | 273,015 | |
McKesson Corp. | | | 5,475 | | | | 757,302 | |
Medtronic plc | | | 9,250 | | | | 1,049,412 | |
Perrigo Co. plc | | | 27,974 | | | | 1,445,137 | |
Shandong Weigo Group Medical Polymer Co. Ltd., Class H (HK) | | | 320,000 | | | | 383,435 | |
Thermo Fisher Scientific, Inc. (c) | | | 2,877 | | | | 934,651 | |
WellCare Health Plans, Inc. (a) | | | 2,285 | | | | 754,530 | |
| | | | | | | | 8,426,385 | |
| | Shares | | | Fair
Value | |
Industrials — 18.2% |
Alaska Air Group, Inc. (c) | | | 9,393 | | | $ | 636,376 | |
Allegiant Travel Co. (c) | | | 1,090 | | | | 189,704 | |
Colfax Corp. (a) | | | 9,460 | | | | 344,155 | |
Copa Holdings SA, Class A (c) | | | 12,312 | | | | 1,330,681 | |
Fastenal Co. (c) | | | 7,000 | | | | 258,650 | |
Honeywell International, Inc. | | | 2,167 | | | | 383,559 | |
Howden Joinery Group plc (GB) | | | 57,500 | | | | 512,319 | |
Hub Group, Inc., Class A (a)(b) | | | 50,015 | | | | 2,565,269 | |
Johnson Controls International plc | | | 6,609 | | | | 269,052 | |
Kirby Corp. (a)(c) | | | 10,180 | | | | 911,415 | |
Sensata Technologies Holding plc (a)(b) | | | 42,581 | | | | 2,293,838 | |
Southwest Airlines Co. | | | 2,400 | | | | 129,552 | |
SPX FLOW, Inc. (a)(c) | | | 3,534 | | | | 172,707 | |
Stericycle, Inc. (a)(c) | | | 22,630 | | | | 1,444,020 | |
United Airlines Holdings, Inc. (a) | | | 17,274 | | | | 1,521,667 | |
United Technologies Corp. | | | 2,849 | | | | 426,666 | |
Welbilt, Inc. (a)(c) | | | 13,800 | | | | 215,418 | |
WESCO International, Inc. (a)(c) | | | 5,678 | | | | 337,216 | |
| | | | | | | | 13,942,264 | |
Information Technology — 13.3% |
Analog Devices, Inc. | | | 4,409 | | | | 523,966 | |
Avnet, Inc. | | | 6,761 | | | | 286,937 | |
Cognizant Technology Solutions Corp., Class A (b) | | | 36,245 | | | | 2,247,915 | |
Fidelity National Information Services, Inc. | | | 5,154 | | | | 716,870 | |
Fiserv, Inc. (a)(c) | | | 6,655 | | | | 769,518 | |
Microsoft Corp. | | | 11,170 | | | | 1,761,509 | |
Sanmina Corp. (a)(b) | | | 33,541 | | | | 1,148,444 | |
TE Connectivity Ltd. | | | 5,806 | | | | 556,447 | |
Texas Instruments, Inc. | | | 7,757 | | | | 995,146 | |
WNS Holdings Ltd. - ADR (a) | | | 17,244 | | | | 1,140,691 | |
| | | | | | | | 10,147,443 | |
Materials — 6.4% |
Ashland Global Holdings, Inc. | | | 22,187 | | | | 1,697,971 | |
58 DIAMOND HILL FUNDS | ANNUAL REPORT | DECEMBER 31, 2019 | DIAMOND-HILL.COM |
Diamond Hill Research Opportunities Fund
Schedule of Investments (Continued)
December 31, 2019
| | Shares | | | Fair
Value | |
Common Stocks — 96.6% continued |
Materials — 6.4% continued |
Axalta Coating Systems Ltd. (a)(c) | | | 15,534 | | | $ | 472,234 | |
LANXESS AG (DE) | | | 9,250 | | | | 621,079 | |
RPM International, Inc. | | | 6,650 | | | | 510,454 | |
Sherwin-Williams Co. (The) | | | 900 | | | | 525,186 | |
W.R. Grace & Co. (b) | | | 15,850 | | | | 1,107,122 | |
| | | | | | | | 4,934,046 | |
Real Estate — 2.6% |
American Campus Communities, Inc. REIT | | | 6,005 | | | | 282,415 | |
American Homes 4 Rent, Class A | | | 7,867 | | | | 206,194 | |
CubeSmart REIT (c) | | | 8,661 | | | | 272,648 | |
Douglas Emmett, Inc. | | | 3,250 | | | | 142,675 | |
iStar, Inc. REIT (c) | | | 45,214 | | | | 656,055 | |
Mid-America Apartment Communities, Inc. REIT | | | 1,550 | | | | 204,383 | |
Public Storage REIT (c) | | | 1,086 | | | | 231,275 | |
| | | | | | | | 1,995,645 | |
Utilities — 0.2% |
UGI Corp. (c) | | | 3,647 | | | | 164,698 | |
Total Common Stocks | | $ | 73,994,429 | |
| | Coupon | | | Maturity | | | Shares /
Par Value | | | Fair
Value | |
Corporate Bonds — 1.2% |
Energy — 1.2% |
Welltec A/S (d) | | | 9.500 | % | | | 12/01/22 | | | $ | 900,000 | | | $ | 891,000 | |
| | Shares | | | Fair
Value | |
Registered Investment Companies — 23.9% |
State Street Institutional Liquid Reserves Fund, Premier Class, 1.73% (e) | | | 1,116,705 | | | $ | 1,116,817 | |
State Street Navigator Securities Lending Portfolio I, 1.86% (e)(f) | | | 17,217,746 | | | | 17,217,746 | |
Total Registered Investment Companies | | $ | 18,334,563 | |
| | Shares | | | Fair
Value | |
Total Investment Securities — 121.7% |
(Cost $79,961,550) | | $ | 93,219,992 | |
Segregated Cash With Custodian — 20.9% | | | 15,980,900 | |
Investments Sold Short — (18.7)% |
(Proceeds $11,981,934) | | | (14,354,983 | ) |
Liabilities in Excess of Other Assets — (23.9)% | | | (18,274,528 | ) |
Net Assets — 100.0% | | $ | 76,571,380 | |
(a) | Non-income producing security. |
(b) | All or a portion of the shares have been pledged as collateral for open short positions. |
(c) | All or a portion of the security is on loan. The total fair value of the securities on loan as of December 31, 2019 was $16,911,205. |
(d) | Securities exempt from registration under Rule 144A of the Securities Act of 1933. These securities have been deemed liquid under procedures approved by the Fund’s Board of Trustees and may normally be sold to qualified institutional buyers in transactions exempt from registration. The total fair value of these securities as of December 31, 2019 was $891,000, representing 1.2% of net assets. |
(e) | The rate shown is the 7-day effective yield as of December 31, 2019. |
(f) | This security was purchased with cash collateral held from securities on loan. The total value of such securities as of December 31, 2019 was $17,217,746. |
ADR - American Depositary Receipt
AG - Aktiengesellschaft
A/S - Aktieselskab
DE - German Security
ES - Spanish Security
FR - French Security
GB - British Security
HK - Hong Kong Security
NVDR - Non-Voting Depositary Receipt
pcl - Public Company Limited
plc - Public Limited Company
REIT - Real Estate Investment Trust
SA - Societe Anonyme
SE - Societas Europaea
SW - Swiss Security
TH - Thai Security
See accompanying Notes to Financial Statements.
DIAMOND HILL FUNDS | ANNUAL REPORT | DECEMBER 31, 2019 | DIAMOND-HILL.COM 59 |
Diamond Hill Research Opportunities Fund
Schedule of Investments Sold Short
December 31, 2019
| | Shares | | | Fair
Value | |
Common Stocks — 18.7% |
Communication Services — 0.6% |
Cogent Communications Holdings, Inc. | | | 6,035 | | | $ | 397,163 | |
Omnicom Group, Inc. | | | 714 | | | | 57,848 | |
| | | | | | | | 455,011 | |
Consumer Discretionary — 7.7% |
AutoNation, Inc. | | | 2,385 | | | | 115,983 | |
Best Buy Co., Inc. | | | 3,005 | | | | 263,839 | |
Career Education Corp. | | | 6,300 | | | | 115,857 | |
Cheesecake Factory, Inc. (The) | | | 2,754 | | | | 107,020 | |
Dick’s Sporting Goods, Inc. | | | 9,865 | | | | 488,219 | |
Fossil Group, Inc. | | | 2,480 | | | | 19,542 | |
Grand Canyon Education, Inc. | | | 5,806 | | | | 556,157 | |
lululemon athletica, inc. | | | 2,206 | | | | 511,064 | |
PulteGroup, Inc. | | | 14,760 | | | | 572,688 | |
Tesla, Inc. | | | 5,258 | | | | 2,199,579 | |
Under Armour, Inc., Class A | | | 23,979 | | | | 517,946 | |
Walmart, Inc. | | | 700 | | | | 83,188 | |
Whirlpool Corp. | | | 2,180 | | | | 321,615 | |
| | | | | | | | 5,872,697 | |
Consumer Staples — 0.7% |
Boston Beer Co., Inc., Class A | | | 896 | | | | 338,554 | |
Brown-Forman Corp., Class B | | | 3,500 | | | | 236,600 | |
| | | | | | | | 575,154 | |
Financials — 3.3% |
Apollo Commercial Real Estate Finance, Inc. | | | 9,728 | | | | 177,925 | |
Ares Commercial Real Estate Corp. | | | 4,527 | | | | 71,708 | |
Bank of Hawaii Corp. | | | 5,630 | | | | 535,751 | |
Cincinnati Financial Corp. | | | 1,335 | | | | 140,375 | |
Commerce Bancshares, Inc. | | | 5,317 | | | | 361,237 | |
First Financial Bankshares, Inc. | | | 12,775 | | | | 448,403 | |
Granite Point Mortgage Trust, Inc. | | | 8,018 | | | | 147,371 | |
Northwest Bancshares, Inc. | | | 6,620 | | | | 110,091 | |
| | Shares | | | Fair
Value | |
Financials — 3.3% continued |
Starwood Property Trust, Inc. | | | 2,411 | | | $ | 59,937 | |
Westamerica Bancorp. | | | 6,765 | | | | 458,464 | |
| | | | | | | | 2,511,262 | |
Health Care — 1.2% |
Henry Schein, Inc. | | | 5,100 | | | | 340,272 | |
Waters Corp. | | | 2,575 | | | | 601,649 | |
| | | | | | | | 941,921 | |
Industrials — 1.1% |
Boeing Co. (The) | | | 409 | | | | 133,236 | |
Cintas Corp. | | | 114 | | | | 30,675 | |
Hawaiian Holdings, Inc. | | | 8,839 | | | | 258,894 | |
Lennox International, Inc. | | | 330 | | | | 80,510 | |
PACCAR, Inc. | | | 1,400 | | | | 110,740 | |
Robert Half International, Inc. | | | 1,152 | | | | 72,749 | |
W.W. Grainger, Inc. | | | 557 | | | | 188,556 | |
| | | | | | | | 875,360 | |
Information Technology — 3.3% |
Amkor Technology, Inc. | | | 34,857 | | | | 453,141 | |
Blackbaud, Inc. | | | 4,394 | | | | 349,762 | |
Cisco Systems, Inc. | | | 10,823 | | | | 519,071 | |
j2 Global, Inc. | | | 460 | | | | 43,107 | |
Oracle Corp. | | | 11,246 | | | | 595,813 | |
Western Union Co. (The) | | | 20,426 | | | | 547,008 | |
| | | | | | | | 2,507,902 | |
Materials — 0.1% |
Silgan Holdings, Inc. | | | 3,450 | | | | 107,226 | |
| |
Real Estate — 0.3% |
EastGroup Properties, Inc. | | | 1,411 | | | | 187,197 | |
VEREIT, Inc. | | | 5,590 | | | | 51,652 | |
| | | | | | | | 238,849 | |
Utilities — 0.4% |
Consolidated Edison, Inc. | | | 2,980 | | | | 269,601 | |
Total Investments Sold Short — 18.7% |
(Proceeds $11,981,934) | | $ | 14,354,983 | |
Percentages disclosed are based on total net assets of the Fund at December 31, 2019.
See accompanying Notes to Financial Statements.
60 DIAMOND HILL FUNDS | ANNUAL REPORT | DECEMBER 31, 2019 | DIAMOND-HILL.COM |
Diamond Hill Global Fund
Schedule of Investments
December 31, 2019
| | Shares | | | Value | |
Common Stocks — 97.5% |
Belgium — 3.3% |
Anheuser-Busch InBev SA/NV | | | 8,867 | | | $ | 726,214 | |
China — 3.6% |
Baidu, Inc. - ADR (a) | | | 3,460 | | | | 437,344 | |
Shandong Weigao Group Medical Polymer Co. Ltd., Class H | | | 288,280 | | | | 345,427 | |
| | | | | | | | 782,771 | |
France — 8.0% |
EssilorLuxottica SA | | | 3,802 | | | | 581,258 | |
Euronext NV | | | 4,800 | | | | 392,353 | |
SCOR SE | | | 18,421 | | | | 775,451 | |
| | | | | | | | 1,749,062 | |
Germany — 2.2% |
Fuchs Petrolub SE | | | 10,916 | | | | 488,251 | |
Israel — 2.5% |
Check Point Software Technologies Ltd. (a)(b) | | | 4,904 | | | | 544,148 | |
Japan — 2.5% |
Seven & i Holdings Co. Ltd. | | | 14,700 | | | | 538,795 | |
South Korea — 2.8% |
Samsung Electronics Co. Ltd. | | | 12,835 | | | | 619,089 | |
Switzerland — 3.6% |
Julius Baer Group Ltd. (a) | | | 15,033 | | | | 775,131 | |
United Kingdom — 10.8% |
Ashmore Group plc | | | 32,252 | | | | 221,252 | |
Beazley plc | | | 51,467 | | | | 378,712 | |
BT Group plc | | | 138,105 | | | | 351,944 | |
GlaxoSmithKline plc | | | 30,127 | | | | 707,947 | |
Howden Joinery Group plc | | | 77,469 | | | | 690,241 | |
| | | | | | | | 2,350,096 | |
| | Shares | | | Value | |
United States — 58.2% |
Allergan plc | | | 2,300 | | | $ | 439,691 | |
Alphabet, Inc., Class C (a) | | | 400 | | | | 534,808 | |
American International Group, Inc. | | | 13,625 | | | | 699,371 | |
Bank OZK | | | 6,698 | | | | 204,323 | |
Berkshire Hathaway, Inc., Class B (a) | | | 3,609 | | | | 817,439 | |
BorgWarner, Inc. | | | 17,266 | | | | 748,999 | |
Charles Schwab Corp. (The) | | | 4,370 | | | | 207,837 | |
Citigroup, Inc. | | | 5,557 | | | | 443,949 | |
Cognizant Technology Solutions Corp., Class A | | | 5,279 | | | | 327,404 | |
Copa Holdings SA, Class A | | | 7,252 | | | | 783,796 | |
Facebook, Inc., Class A (a) | | | 2,212 | | | | 454,013 | |
Gilead Sciences, Inc. | | | 6,730 | | | | 437,315 | |
Hub Group, Inc., Class A (a) | | | 10,632 | | | | 545,315 | |
Johnson Controls International plc | | | 10,712 | | | | 436,086 | |
Kirby Corp. (a) | | | 5,906 | | | | 528,764 | |
KKR & Co., Inc., Class A | | | 20,312 | | | | 592,501 | |
MetLife, Inc. | | | 15,040 | | | | 766,589 | |
NVR, Inc. (a) | | | 86 | | | | 327,523 | |
Philip Morris International, Inc. | | | 7,677 | | | | 653,236 | |
Red Rock Resorts, Inc., Class A | | | 39,071 | | | | 935,750 | |
Sanmina Corp. (a) | | | 14,666 | | | | 502,164 | |
Sherwin-Williams Co. (The) | | | 664 | | | | 387,471 | |
United Airlines Holdings, Inc. (a) | | | 4,887 | | | | 430,496 | |
Vail Resorts, Inc. | | | 2,173 | | | | 521,151 | |
| | | | | | | | 12,725,991 | |
Total Common Stocks | | $ | 21,299,548 | |
DIAMOND HILL FUNDS | ANNUAL REPORT | DECEMBER 31, 2019 | DIAMOND-HILL.COM 61 |
Diamond Hill Global Fund
Schedule of Investments (Continued)
December 31, 2019
| | Shares | | | Value | |
| |
Registered Investment Companies — 5.0% |
State Street Institutional Liquid Reserves Fund, Premier Class, 1.73% (c) | | | 535,330 | | | $ | 535,384 | |
State Street Navigator Securities Lending Portfolio I, 1.86% (c)(d) | | | 559,056 | | | | 559,056 | |
Total Registered Investment Companies | | $ | 1,094,440 | |
Total Investments at Value — 102.5% |
(Cost $20,190,747) | | $ | 22,393,988 | |
Liabilities in Excess of Other Assets — (2.5)% | | | (538,994 | ) |
Net Assets — 100.0% | | $ | 21,854,994 | |
(a) | Non-income producing security. |
(b) | All or a portion of the security is on loan. The total fair value of the securities on loan as of December 31, 2019 was $544,148. |
(c) | The rate shown is the 7-day effective yield as of December 31, 2019. |
(d) | This security was purchased with cash collateral held from securities on loan. The total value of such securities as of December 31, 2019 was $559,056. |
ADR - American Depositary Receipt
NV - Naamloze Vennootschap
plc - Public Limited Company
SA - Societe Anonyme
SE - Societas Europaea
See accompanying Notes to Financial Statements.
Diamond Hill International Fund
Schedule of Investments
December 31, 2019
| | Shares | | | Value | |
Common Stocks — 98.1% |
Belgium — 4.1% |
Anheuser-Busch InBev SA/NV | | | 6,728 | | | $ | 551,028 | |
Canada — 6.4% |
Fairfax Financial Holdings Ltd. | | | 897 | | | | 421,210 | |
Fairfax India Holdings Corp. (a) | | | 34,895 | | | | 448,785 | |
| | | | | | | | 869,995 | |
China — 5.2% |
Baidu, Inc. - ADR (a) | | | 2,459 | | | | 310,818 | |
Noah Holdings Ltd. - ADR (a)(b) | | | 5,942 | | | | 210,169 | |
Shandong Weigao Group Medical Polymer Co. Ltd., Class H | | | 146,000 | | | | 174,942 | |
| | | | | | | | 695,929 | |
France — 15.5% |
Amundi SA | | | 1,457 | | | | 114,574 | |
Bollore SA | | | 67,938 | | | | 296,884 | |
EssilorLuxottica SA | | | 1,779 | | | | 271,978 | |
Euronext NV | | | 2,621 | | | | 214,241 | |
LVMH Moet Hennessy Louis Vuitton SE | | | 354 | | | | 164,948 | |
Safran SA | | | 1,719 | | | | 265,517 | |
Sanofi | | | 2,056 | | | | 206,480 | |
SCOR SE | | | 7,104 | | | | 299,050 | |
Vivendi SA | | | 9,008 | | | | 260,851 | |
| | | | | | | | 2,094,523 | |
Germany — 3.8% |
Beiersdorf AG | | | 842 | | | | 100,547 | |
Fuchs Petrolub SE | | | 5,907 | | | | 293,482 | |
LANXESS AG | | | 1,722 | | | | 115,621 | |
| | | | | | | | 509,650 | |
Hong Kong — 2.7% |
Tencent Holdings Ltd. | | | 7,700 | | | | 370,952 | |
India — 0.9% |
HDFC Bank Ltd. - ADR | | | 1,890 | | | | 119,769 | |
Israel — 2.7% |
Check Point Software Technologies Ltd. (a)(b) | | | 3,265 | | | | 362,284 | |
62 DIAMOND HILL FUNDS | ANNUAL REPORT | DECEMBER 31, 2019 | DIAMOND-HILL.COM |
Diamond Hill International Fund
Schedule of Investments (Continued)
December 31, 2019
| | Shares | | | Value | |
Common Stocks — 98.1% continued |
Japan — 7.4% |
Astellas Pharma, Inc. | | | 13,900 | | | $ | 237,255 | |
Kao Corp. | | | 800 | | | | 65,975 | |
KDDI Corp. | | | 13,500 | | | | 402,761 | |
Seven & i Holdings Co. Ltd. | | | 8,100 | | | | 296,887 | |
| | | | | | | | 1,002,878 | |
Mexico — 3.8% |
Grupo Aeroportuario del Sureste SAB de CV, Class B | | | 15,990 | | | | 299,584 | |
Telesites SAB de CV (a) | | | 283,146 | | | | 209,658 | |
| | | | | | | | 509,242 | |
Netherlands — 3.2% |
Unilever NV | | | 7,568 | | | | 434,335 | |
South Korea — 2.8% |
Samsung Electronics Co. Ltd. - GDR | | | 314 | | | | 375,762 | |
Spain — 1.8% |
Banco Bilbao Vizcaya Argentaria SA | | | 42,786 | | | | 240,216 | |
Switzerland — 10.9% |
Compagnie Financiere Richemont SA | | | 2,852 | | | | 222,926 | |
Credit Suisse Group AG (a) | | | 20,981 | | | | 283,664 | |
Julius Baer Group Ltd. (a) | | | 4,502 | | | | 232,132 | |
Novartis AG - ADR | | | 3,001 | | | | 284,165 | |
Roche Holdings AG | | | 770 | | | | 250,296 | |
Swatch Group AG (The) | | | 715 | | | | 199,667 | |
| | | | | | | | 1,472,850 | |
Taiwan Province of China — 1.1% |
Taiwan Semiconductor Manufacturing Co. Ltd. - ADR | | | 2,574 | | | | 149,549 | |
Thailand — 2.6% |
Kasikornbank pcl - NVDR | | | 69,400 | | | | 351,739 | |
| | Shares | | | Value | |
United Kingdom — 15.7% |
Ashmore Group plc | | | 37,534 | | | $ | 257,487 | |
Beazley plc | | | 17,796 | | | | 130,949 | |
BT Group plc | | | 124,136 | | | | 316,345 | |
Diageo plc | | | 11,302 | | | | 476,264 | |
GlaxoSmithKline plc | | | 19,904 | | | | 467,719 | |
Howden Joinery Group plc | | | 53,269 | | | | 474,622 | |
| | | | | | | | 2,123,386 | |
United States — 7.5% |
Copa Holdings SA, Class A | | | 2,573 | | | | 278,090 | |
Liberty Media Corp. - Liberty Formula One, Series C (a) | | | 5,494 | | | | 252,532 | |
Walt Disney Co. (The) | | | 3,274 | | | | 473,519 | |
| | | | | | | | 1,004,141 | |
Total Common Stocks | | $ | 13,238,228 | |
DIAMOND HILL FUNDS | ANNUAL REPORT | DECEMBER 31, 2019 | DIAMOND-HILL.COM 63 |
Diamond Hill International Fund
Schedule of Investments (Continued)
December 31, 2019
| | | Shares | | | Value | |
| Registered Investment Companies — 4.6% |
State Street Institutional Liquid Reserves Fund, Premier Class, 1.73% (c) | | | 244,382 | | | $ | 244,407 | |
State Street Navigator Securities Lending Portfolio I, 1.86% (c)(d) | | | 372,210 | | | | 372,210 | |
| Total Registered Investment Companies | | | | | | $ | 616,617 | |
| Total Investments at Value — 102.7% |
| (Cost $12,639,731) | | | | | | $ | 13,854,845 | |
| Liabilities in Excess of Other Assets — (2.7)% | | | | | | | (364,552 | ) |
| Net Assets — 100.0% | | | | | | $ | 13,490,293 | |
(a) | Non-income producing security. |
(b) | All or a portion of the security is on loan. The total fair value of the securities on loan as of December 31, 2019 was $572,453. |
(c) | The rate shown is the 7-day effective yield as of December 31, 2019. |
(d) | This security was purchased with cash collateral held from securities on loan. The total value of such securities as of December 31, 2019 was $372,210. Securities on loan are also collateralized by various U.S. Treasury and government agency securities in the amount of $215,398. |
ADR - American Depositary Receipt
AG - Aktiengesellschaft
GDR - Global Depositary Receipt
NV - Naamloze Vennootschap
NVDR - Non-voting Depositary Receipt
pcl- Public Company Limited
plc - Public Limited Company
SA - Societe Anonyme
SAB de CV - Societe Anonima Bursatil de Capital Variable
SE - Societas Europaea
See accompanying Notes to Financial Statements.
Diamond Hill Short Duration
Total Return Fund
Schedule of Investments
December 31, 2019
| | Coupon | | | Maturity | | | Shares /
Par Value | | | Fair
Value | |
Corporate Credit — 4.9% |
Banking — 2.6% |
Bank of New York Mellon Corp. (The), Series MTN | | | 1.950 | % | | | 08/23/22 | | | $ | 500,000 | | | $ | 500,846 | |
Capital One Financial Corp. | | | 2.500 | % | | | 05/12/20 | | | | 500,000 | | | | 500,658 | |
Capital One NA | | | 2.150 | % | | | 09/06/22 | | | | 750,000 | | | | 751,160 | |
Citibank NA | | | 3.400 | % | | | 07/23/21 | | | | 500,000 | | | | 510,664 | |
Citigroup, Inc. | | | 2.350 | % | | | 08/02/21 | | | | 500,000 | | | | 502,959 | |
Citigroup, Inc. | | | 2.900 | % | | | 12/08/21 | | | | 750,000 | | | | 762,152 | |
Citigroup, Inc. | | | 2.312 | % | | | 11/04/22 | | | | 1,000,000 | | | | 1,002,903 | |
Cooperatieve Rabobank UA (a) | | | 2.625 | % | | | 07/22/24 | | | | 1,500,000 | | | | 1,516,478 | |
DBS Group Holdings Ltd. (3MO LIBOR + 49) (a)(b) | | | 2.375 | % | | | 06/08/20 | | | | 1,500,000 | | | | 1,501,082 | |
Goldman Sachs Group, Inc. | | | 2.600 | % | | | 12/27/20 | | | | 1,000,000 | | | | 1,002,067 | |
Goldman Sachs Group, Inc. | | | 2.625 | % | | | 04/25/21 | | | | 2,930,000 | | | | 2,954,991 | |
Goldman Sachs Group, Inc. (3MO LIBOR + 111) (b) | | | 3.046 | % | | | 04/26/22 | | | | 450,000 | | | | 454,514 | |
Huntington National Bank (3MO LIBOR + 51) (b) | | | 2.401 | % | | | 03/10/20 | | | | 1,000,000 | | | | 1,000,818 | |
JPMorgan Chase Bank NA | | | 3.086 | % | | | 04/26/21 | | | | 500,000 | | | | 501,691 | |
JPMorgan Chase & Co. | | | 2.550 | % | | | 10/29/20 | | | | 1,000,000 | | | | 1,004,504 | |
JPMorgan Chase & Co. (3MO LIBOR + 100) (b) | | | 3.001 | % | | | 01/15/23 | | | | 400,000 | | | | 404,228 | |
KeyBank NA | | | 3.350 | % | | | 06/15/21 | | | | 500,000 | | | | 510,714 | |
KeyBank NA | | | 3.300 | % | | | 02/01/22 | | | | 500,000 | | | | 513,489 | |
Mizuho Financial Group | | | 2.273 | % | | | 09/13/21 | | | | 500,000 | | | | 501,915 | |
Morgan Stanley | | | 2.650 | % | | | 01/27/20 | | | | 486,000 | | | | 486,159 | |
Morgan Stanley (3MO LIBOR + 118) (b) | | | 3.146 | % | | | 01/20/22 | | | | 1,000,000 | | | | 1,009,109 | |
National Australia Bank, New York | | | 2.250 | % | | | 01/10/20 | | | | 500,000 | | | | 500,019 | |
Rabobank Nederland NY | | | 2.250 | % | | | 01/14/20 | | | | 300,000 | | | | 300,018 | |
SunTrust Bank | | | 3.525 | % | | | 10/26/21 | | | | 900,000 | | | | 910,861 | |
Wells Fargo & Co. | | | 2.400 | % | | | 01/15/20 | | | | 1,750,000 | | | | 1,750,255 | |
| | | | | | | | | | | | | | | | 21,354,254 | |
Basic Industry — 0.1% |
PPG Industries, Inc. (c) | | | 2.400 | % | | | 08/15/24 | | | | 700,000 | | | | 706,376 | |
| |
64 DIAMOND HILL FUNDS | ANNUAL REPORT | DECEMBER 31, 2019 | DIAMOND-HILL.COM |
Diamond Hill Short Duration Total Return Fund
Schedule of Investments (Continued)
December 31, 2019
| | Coupon | | | Maturity | | | Shares /
Par Value | | | Fair
Value | |
Corporate Credit — 4.9% continued |
Capital Goods — 0.0% (d) |
Welbilt, Inc. | | | 9.500 | % | | | 02/15/24 | | | $ | 100,000 | | | $ | 106,000 | |
Zekelman Industries, Inc. (a) | | | 9.875 | % | | | 06/15/23 | | | | 200,000 | | | | 210,250 | |
| | | | | | | | | | | | | | | | 316,250 | |
Communications — 0.3% |
American Tower Corp. | | | 2.250 | % | | | 01/15/22 | | | | 250,000 | | | | 250,713 | |
British Telecommunications plc | | | 4.500 | % | | | 12/04/23 | | | | 500,000 | | | | 537,893 | |
Cogent Communications, Inc. (a) | | | 5.625 | % | | | 04/15/21 | | | | 200,000 | | | | 201,750 | |
Comcast Corp. | | | 3.450 | % | | | 10/01/21 | | | | 900,000 | | | | 926,183 | |
Crown Castle International Corp. | | | 2.250 | % | | | 09/01/21 | | | | 425,000 | | | | 426,122 | |
Twenty-First Century Fox, Inc. (a) | | | 4.030 | % | | | 01/25/24 | | | | 450,000 | | | | 479,455 | |
| | | | | | | | | | | | | | | | 2,822,116 | |
Consumer Cyclical — 0.6% |
CCM Merger, Inc. (a) | | | 6.000 | % | | | 03/15/22 | | | | 200,000 | | | | 204,000 | |
Fiat Chrysler Automobiles NV | | | 4.500 | % | | | 04/15/20 | | | | 200,000 | | | | 201,250 | |
Ford Motor Credit Co. LLC | | | 2.681 | % | | | 01/09/20 | | | | 200,000 | | | | 200,015 | |
Ford Motor Credit Co. LLC | | | 5.596 | % | | | 01/07/22 | | | | 750,000 | | | | 790,109 | |
Ford Motor Credit Co. LLC (c) | | | 5.584 | % | | | 03/18/24 | | | | 250,000 | | | | 270,427 | |
General Motors Financial Co., Inc. | | | 3.200 | % | | | 07/06/21 | | | | 25,000 | | | | 25,339 | |
General Motors Financial Co., Inc. | | | 4.200 | % | | | 11/06/21 | | | | 950,000 | | | | 984,761 | |
Toyota Motor Credit Corp (3MO LIBOR + 54) (b) | | | 2.567 | % | | | 01/08/21 | | | | 1,000,000 | | | | 1,004,090 | |
Toyota Motor Credit Corp. | | | 1.950 | % | | | 04/17/20 | | | | 425,000 | | | | 424,990 | |
Volkswagen AG (a) | | | 3.875 | % | | | 11/13/20 | | | | 500,000 | | | | 508,138 | |
| | | | | | | | | | | | | | | | 4,613,119 | |
Consumer Non-Cyclical — 0.2% |
Amgen, Inc. | | | 2.650 | % | | | 05/11/22 | | | | 860,000 | | | | 872,772 | |
Zoetis, Inc. | | | 3.250 | % | | | 08/20/21 | | | | 450,000 | | | | 458,222 | |
| | | | | | | | | | | | | | | | 1,330,994 | |
| | Coupon | | | Maturity | | | Shares /
Par Value | | | Fair
Value | |
Electric — 0.1% |
WEC Energy Group, Inc. | | | 3.375 | % | | | 06/15/21 | | | $ | 950,000 | | | $ | 968,971 | |
Energy — 0.3% |
Aker BP ASA (a) | | | 6.000 | % | | | 07/01/22 | | | | 500,000 | | | | 513,750 | |
Aker BP ASA (a) | | | 4.750 | % | | | 06/15/24 | | | | 350,000 | | | | 363,125 | |
Energy Transfer Operating LP | | | 4.500 | % | | | 04/15/24 | | | | 925,000 | | | | 984,011 | |
Welltec A/S (a) | | | 9.500 | % | | | 12/01/22 | | | | 200,000 | | | | 198,000 | |
| | | | | | | | | | | | | | | | 2,058,886 | |
Finance Companies — 0.1% |
Credit Acceptance Corp. | | | 7.375 | % | | | 03/15/23 | | | | 200,000 | | | | 205,250 | |
Nationstar Mortgage / Capital Corp. | | | 6.500 | % | | | 07/01/21 | | | | 491,000 | | | | 492,228 | |
Nationstar Mortgage / Capital Corp. | | | 6.500 | % | | | 06/01/22 | | | | 100,000 | | | | 100,067 | |
| | | | | | | | | | | | | | | | 797,545 | |
Insurance — 0.4% |
Jackson National Life Global Funding (3MO LIBOR + 48) (a)(b) | | | 2.368 | % | | | 06/11/21 | | | | 950,000 | | | | 953,526 | |
Jackson National Life Global Funding (a) | | | 2.100 | % | | | 10/25/21 | | | | 200,000 | | | | 200,438 | |
Met Life Global Funding I (3MO LIBOR + 40) (a)(b) | | | 2.287 | % | | | 06/12/20 | | | | 1,000,000 | | | | 1,001,511 | |
Met Life Global Funding I (a) | | | 3.375 | % | | | 01/11/22 | | | | 500,000 | | | | 513,866 | |
Principal Life Global Funding II (a) | | | 2.375 | % | | | 11/21/21 | | | | 400,000 | | | | 402,152 | |
| | | | | | | | | | | | | | | | 3,071,493 | |
Leisure — 0.0% (d) |
Jack Ohio Finance, LLC (a) | | | 6.750 | % | | | 11/15/21 | | | | 64,000 | | | | 65,280 | |
Services — 0.1% |
Stericycle, Inc. (a) | | | 5.375 | % | | | 07/15/24 | | | | 500,000 | | | | 525,000 | |
Technology — 0.1% |
Dell International LLC (a) | | | 4.000 | % | | | 07/15/24 | | | | 500,000 | | | | 523,419 | |
DIAMOND HILL FUNDS | ANNUAL REPORT | DECEMBER 31, 2019 | DIAMOND-HILL.COM 65 |
Diamond Hill Short Duration Total Return Fund
Schedule of Investments (Continued)
December 31, 2019
| | Coupon | | | Maturity | | | Shares /
Par Value | | | Fair
Value | |
Corporate Credit — 4.9% continued |
Transportation — 0.0% (d) |
Continental Airlines Pass-Through Trust, Series 2012-1, Class B | | | 6.250 | % | | | 10/11/21 | | | $ | 59,711 | | | $ | 60,195 | |
U.S. Airways Pass-Through Trust, Series 2012-2, Class B | | | 6.750 | % | | | 12/03/22 | | | | 134,837 | | | | 141,524 | |
United Airlines Pass-Through Trust, Series 2013-1, Class B | | | 5.375 | % | | | 02/15/23 | | | | 81,130 | | | | 84,015 | |
United Airlines Pass-Through Trust, Series 2007-1, Class A | | | 6.636 | % | | | 01/02/24 | | | | 115,752 | | | | 122,908 | |
| | | | | | | | | | | | | | | | 408,642 | |
Total Corporate Credit | | $ | 39,562,345 | |
Securitized — 84.2% |
ABS-Other — 13.7% |
Access Point Financial, Inc., Series 2017-A, Class C (a) | | | 5.820 | % | | | 04/15/29 | | | | 4,750,000 | | | | 4,837,917 | |
Access Point Financial, Inc., Series 2017-A, Class D (a) | | | 6.000 | % | | | 04/15/29 | | | | 5,000,000 | | | | 5,094,129 | |
BXG Receivables Note Trust, Series 2012-A, Class B (a) | | | 3.990 | % | | | 12/02/27 | | | | 310,974 | | | | 310,951 | |
Credibly Asset Securitization LLC, Pool #FN 252409, Series 2018-1A, Class A (a) | | | 4.800 | % | | | 11/15/23 | | | | 2,000,000 | | | | 2,038,479 | |
Diamond Resorts Owner Trust, Series 2019-1A, Class B (a) | | | 3.530 | % | | | 02/20/32 | | | | 1,104,990 | | | | 1,103,687 | |
FMC GMSR Issuer Trust, Series 2019-GT2, Class A (a) | | | 4.230 | % | | | 09/25/24 | | | | 5,000,000 | | | | 4,956,172 | |
FORA Financial Asset Securitization LLC, Series 2019-1, Class A (a) | | | 4.018 | % | | | 10/15/24 | | | | 5,000,000 | | | | 5,059,658 | |
| | Coupon | | | Maturity | | | Shares /
Par Value | | | Fair
Value | |
ABS-Other — 13.7% continued |
FORA Financial Asset Securitization LLC, Series 2019-1, Class C (a) | | | 6.269 | % | | | 10/15/24 | | | $ | 835,000 | | | $ | 842,393 | |
Gold Key Resorts LLC, Series 2014-A, Class A (a) | | | 3.220 | % | | | 03/17/31 | | | | 127,963 | | | | 128,030 | |
Helios Issuer LLC, Series 2019-AA, Class A (a) | | | 3.750 | % | | | 06/20/46 | | | | 2,120,852 | | | | 2,123,284 | |
Hero Funding Trust, Series 2016-3B, Class B (a) | | | 5.240 | % | | | 09/20/42 | | | | 280,254 | | | | 284,400 | |
Hero Funding Trust, Series 2016-1R, Class A1 (a) | | | 4.500 | % | | | 09/21/42 | | | | 471,862 | | | | 470,829 | |
Hero Funding Trust, Series 2016-4B, Class B (a) | | | 4.990 | % | | | 09/20/47 | | | | 847,624 | | | | 859,206 | |
Kabbage Funding LLC, Series 2019-1, Class A (a) | | | 3.825 | % | | | 03/15/24 | | | | 8,500,000 | | | | 8,592,919 | |
Kabbage Funding LLC, Series 2019-1, Class C (a) | | | 4.611 | % | | | 03/15/24 | | | | 2,400,000 | | | | 2,427,448 | |
Kabbage Funding LLC, Series 2019-1, Class D (a) | | | 5.688 | % | | | 03/15/24 | | | | 1,550,000 | | | | 1,568,600 | |
LTCG Securitization, Series 2018-A, Class A (a) | | | 4.590 | % | | | 06/15/48 | | | | 1,453,087 | | | | 1,464,257 | |
MarketPlace Loan Trust, Series 2017-BS1, Class A (a)(b) | | | 3.500 | % | | | 01/18/22 | | | | 266,943 | | | | 266,988 | |
Mosaic Solar Loans LLC, Series 2017-2A, Class A (a) | | | 3.820 | % | | | 06/22/43 | | | | 1,665,227 | | | | 1,694,746 | |
Mosaic Solar Loans LLC, Series 2017-2A, Class B (a) | | | 4.770 | % | | | 06/22/43 | | | | 828,832 | | | | 847,820 | |
Mosaic Solar Loans LLC, Series 2017-2A, Class D (PO) (a) | | | 0.000 | % | | | 06/22/43 | | | | 2,557,305 | | | | 2,398,103 | |
Nationstar HECM Loan Trust, Series 2019-1A, Class A (a) | | | 2.651 | % | | | 06/25/29 | | | | 962,941 | | | | 963,353 | |
66 DIAMOND HILL FUNDS | ANNUAL REPORT | DECEMBER 31, 2019 | DIAMOND-HILL.COM |
Diamond Hill Short Duration Total Return Fund
Schedule of Investments (Continued)
December 31, 2019
| | Coupon | | | Maturity | | | Shares /
Par Value | | | Fair
Value | |
Securitized — 84.2% continued |
ABS-Other — 13.7% continued |
Newtek Small Business Loan Trust, Series 2018-1, Class B (1MO LIBOR + 300) (a)(b) | | | 4.792 | % | | | 02/25/44 | | | $ | 2,873,939 | | | $ | 2,896,966 | |
Newtek Small Business Loan Trust, Series 2019-01, Class A (1MO LIBOR + 165) (a)(b) | | | 3.442 | % | | | 12/25/44 | | | | 3,810,703 | | | | 3,810,699 | |
NFAS LLC, Series 2019-1, Class A (a) | | | 4.172 | % | | | 08/15/24 | | | | 3,000,000 | | | | 3,018,495 | |
Octane Receivables Trust, Series 2019-1A, Class A (a) | | | 3.160 | % | | | 09/20/23 | | | | 4,500,000 | | | | 4,496,526 | |
Ocwen Master Advance Receivables, Series 2019-T1, Class DT1 (a) | | | 3.107 | % | | | 08/15/50 | | | | 1,350,000 | | | | 1,353,683 | |
Ocwen Master Advance Receivables, Series 2019-T1, Class ET1 (a) | | | 4.436 | % | | | 08/15/50 | | | | 1,250,000 | | | | 1,253,304 | |
Ocwen Master Advance Receivables, Series 2019-T2, Class ET2 (a) | | | 4.322 | % | | | 08/15/51 | | | | 1,700,000 | | | | 1,707,933 | |
OnDeck Asset Securitization Trust, Series 2018-1A, Class B (a) | | | 4.020 | % | | | 04/18/22 | | | | 1,400,000 | | | | 1,401,474 | |
OnDeck Asset Securitization Trust, Series 2019-1A, Class D (a) | | | 4.020 | % | | | 11/18/24 | | | | 5,650,000 | | | | 5,666,385 | |
OnDeck Asset Securitization Trust, Series 2019-1A, Class E (a) | | | 5.150 | % | | | 11/18/24 | | | | 3,950,000 | | | | 3,962,245 | |
PNMAC GMSR Issuer Trust, Series 2018-GT1, Class A (1MO LIBOR + 285) (a)(b) | | | 4.642 | % | | | 02/25/23 | | | | 2,000,000 | | | | 2,011,800 | |
Renew Financial LLC, Series 2017-1A, Class B (a)(b) | | | 5.750 | % | | | 09/20/52 | | | | 1,036,332 | | | | 1,032,280 | |
SFS Asset Securitization LLC, Series 2019-1, Class A (a) | | | 4.238 | % | | | 06/10/25 | | | | 4,250,000 | | | | 4,260,602 | |
| | Coupon | | | Maturity | | | Shares /
Par Value | | | Fair
Value | |
ABS-Other — 13.7% continued |
SFS Asset Securitization LLC, Series 2019-1, Class B (a) | | | 5.023 | % | | | 06/10/25 | | | $ | 2,000,000 | | | $ | 2,004,882 | |
SFS Asset Securitization LLC, Series 2019-1, Class C (a) | | | 6.390 | % | | | 06/10/25 | | | | 746,000 | | | | 747,740 | |
Small Business Lending Trust, Series 2019-A, Class A (a) | | | 2.850 | % | | | 07/15/26 | | | | 1,893,047 | | | | 1,893,094 | |
Small Business Lending Trust, Series 2019-A, Class C (a) | | | 4.310 | % | | | 07/15/26 | | | | 4,700,000 | | | | 4,700,398 | |
Small Business Lending Trust, Series 2019-A, Class D (a) | | | 6.300 | % | | | 07/15/26 | | | | 5,000,000 | | | | 5,041,019 | |
TES LLC, Series 2017-1A, Class A (a) | | | 4.330 | % | | | 10/20/47 | | | | 4,356,608 | | | | 4,338,845 | |
TES LLC, Series 2017-1A, Class B (a) | | | 7.740 | % | | | 10/20/47 | | | | 2,000,000 | | | | 1,988,270 | |
Westgate Resorts, Series 2016-1A, Class A (a) | | | 3.500 | % | | | 12/20/28 | | | | 696,085 | | | | 698,154 | |
Westgate Resorts, Series 2018-1A, Class B (a) | | | 3.580 | % | | | 12/20/31 | | | | 1,316,193 | | | | 1,329,733 | |
Westgate Resorts, Series 2018-1A, Class C (a) | | | 4.100 | % | | | 12/20/31 | | | | 3,140,914 | | | | 3,171,565 | |
| | | | | | | | | | | | | | | | 111,119,461 | |
Agency CMBS — 0.5% |
FNMA, Pool #FN AE0834 (b) | | | 4.135 | % | | | 01/01/21 | | | | 116,325 | | | | 118,337 | |
FNMA, Series 2019-M21, Class 1A1 | | | 1.950 | % | | | 04/25/28 | | | | 3,960,119 | | | | 3,902,507 | |
| | | | | | | | | | | | | | | | 4,020,844 | |
Agency MBS CMO — 1.9% |
FHLMC, Series 2814, Class PH | | | 6.000 | % | | | 06/15/34 | | | | 243,172 | | | | 275,927 | |
FHLMC, Series 2979, Class FP (1MO LIBOR + 45) (b) | | | 2.190 | % | | | 05/15/35 | | | | 470,917 | | | | 466,452 | |
FHLMC, Series 3121, Class FM (1MO LIBOR + 40) (b) | | | 2.140 | % | | | 03/15/36 | | | | 443,398 | | | | 442,604 | |
DIAMOND HILL FUNDS | ANNUAL REPORT | DECEMBER 31, 2019 | DIAMOND-HILL.COM 67 |
Diamond Hill Short Duration Total Return Fund
Schedule of Investments (Continued)
December 31, 2019
| | Coupon | | | Maturity | | | Shares /
Par Value | | | Fair
Value | |
Securitized — 84.2% continued |
Agency MBS CMO — 1.9% continued |
FHLMC, Series 4613, Class AF (1MO LIBOR + 110) (b) | | | 2.840 | % | | | 11/15/37 | | | $ | 899,727 | | | $ | 915,450 | |
FHLMC, Series 4085, Class FB (1MO LIBOR+40) (b) | | | 2.140 | % | | | 01/15/39 | | | | 441,638 | | | | 443,744 | |
FHLMC, Series 4095, Class FB (1MO LIBOR +40) (b) | | | 2.140 | % | | | 04/15/39 | | | | 206,643 | | | | 207,600 | |
FHLMC, Series 3925, Class FL (1MO LIBOR + 45) (b) | | | 2.190 | % | | | 01/15/41 | | | | 412,811 | | | | 414,000 | |
FHLMC, Series 3895, Class BF (1MO LIBOR + 50) (b) | | | 2.240 | % | | | 07/15/41 | | | | 435,418 | | | | 433,985 | |
FHLMC, Series 4314, Class PF (1MO LIBOR + 40) (b) | | | 2.140 | % | | | 07/15/43 | | | | 397,262 | | | | 396,835 | |
FNMA, Series 1994-4, Class ZC | | | 6.500 | % | | | 01/25/24 | | | | 29,694 | | | | 31,765 | |
FNMA, Series 2012-3, Class EA | | | 3.500 | % | | | 10/25/29 | | | | 60,512 | | | | 60,721 | |
FNMA, Series 2002-86, Class PG | | | 6.000 | % | | | 12/25/32 | | | | 254,544 | | | | 288,361 | |
FNMA, Series 2003-131, Class CH | | | 5.500 | % | | | 01/25/34 | | | | 76,750 | | | | 85,732 | |
FNMA, Series 2006-9, Class KZ | | | 6.000 | % | | | 03/25/36 | | | | 210,046 | | | | 235,894 | |
FNMA, Series 2006-56, Class DC (1MO LIBOR + 65) (b) | | | 2.442 | % | | | 07/25/36 | | | | 1,038,404 | | | | 1,042,169 | |
FNMA, Series 2006-108, Class FD (1MO LIBOR + 38) (b) | | | 2.172 | % | | | 11/25/36 | | | | 413,273 | | | | 412,019 | |
FNMA, Series 2007-39, Class NB | | | 4.250 | % | | | 05/25/37 | | | | 361,227 | | | | 389,697 | |
FNMA, Series 2010-136, Class FA (1MO LIBOR + 50) (b) | | | 2.292 | % | | | 12/25/40 | | | | 435,212 | | | | 434,601 | |
FNMA, Series 2011-86, Class KF (1MO LIBOR +55) (b) | | | 2.342 | % | | | 09/25/41 | | | | 621,236 | | | | 623,857 | |
| | Coupon | | | Maturity | | | Shares /
Par Value | | | Fair
Value | |
Agency MBS CMO — 1.9% continued |
FNMA, Series 2012-9, Class FC (1MO LIBOR + 40) (b) | | | 2.192 | % | | | 02/25/42 | | | $ | 290,913 | | | $ | 290,312 | |
FNMA, Series 2012-33, Class F (1MO LIBOR + 52) (b) | | | 2.312 | % | | | 04/25/42 | | | | 272,050 | | | | 271,919 | |
GNMA, Series 2007-18, Class FD (1MO LIBOR + 30) (b) | | | 2.065 | % | | | 04/20/37 | | | | 668,732 | | | | 667,260 | |
GNMA, Series 2008-16, Class FC (1MO LIBOR + 50) (b) | | | 2.265 | % | | | 02/20/38 | | | | 542,770 | | | | 543,644 | |
GNMA, Series 2011-18, Class NA | | | 4.000 | % | | | 05/20/39 | | | | 4,818 | | | | 4,821 | |
GNMA, Series 2012-149, Class GF (1MO LIBOR + 30) (b) | | | 2.065 | % | | | 12/20/42 | | | | 308,318 | | | | 304,917 | |
GNMA, Series 2012-H29, Class SA (1MO LIBOR + 51.5) (b) | | | 2.289 | % | | | 10/20/62 | | | | 712,472 | | | | 711,649 | |
GNMA, Series 2012-H23, Class SA (1MO LIBOR + 53)(b) | | | 2.304 | % | | | 10/20/62 | | | | 621,428 | | | | 625,561 | |
GNMA, Series 2017-H18, Class FE (1MO LIBOR + 20) (b) | | | 1.974 | % | | | 06/20/63 | | | | 143,094 | | | | 142,809 | |
GNMA, Series 2015-H09, Class FA (1MO LIBOR + 62) (b) | | | 2.394 | % | | | 04/20/65 | | | | 665,819 | | | | 665,305 | |
GNMA, Series 2015-H15, Class FC (1MO LIBOR + 58) (b) | | | 2.354 | % | | | 06/20/65 | | | | 1,249,049 | | | | 1,246,160 | |
GNMA, Series 2016-H11, Class FD (12MO LIBOR + 40) (b) | | | 3.130 | % | | | 05/20/66 | | | | 125,285 | | | | 125,238 | |
GNMA, Series 2017-H11, Class FP (1MO LIBOR + 22) (b) | | | 1.994 | % | | | 04/20/67 | | | | 1,959,868 | | | | 1,956,243 | |
68 DIAMOND HILL FUNDS | ANNUAL REPORT | DECEMBER 31, 2019 | DIAMOND-HILL.COM |
Diamond Hill Short Duration Total Return Fund
Schedule of Investments (Continued)
December 31, 2019
| | Coupon | | | Maturity | | | Shares /
Par Value | | | Fair
Value | |
Securitized — 84.2% continued |
Agency MBS CMO — 1.9% continued |
Vendee Mortgage Trust, Series 1995-3, Class 1Z | | | 7.250 | % | | | 09/15/25 | | | $ | 93,889 | | | $ | 103,900 | |
| | | | | | | | | | | | | | | | 15,261,151 | |
Agency MBS CMO Derivatives — 0.9% |
FHLMC, Series 3994, Class EI (IO) | | | 3.000 | % | | | 02/15/22 | | | | 808,298 | | | | 18,194 | |
FHLMC, Series 3874, Class KI (IO) | | | 4.500 | % | | | 08/15/25 | | | | 536,433 | | | | 10,231 | |
FHLMC, Series 3946, Class SB (IO) (-1*1MO LIBOR + 675) (b) | | | 5.010 | % | | | 10/15/26 | | | | 301,630 | | | | 31,780 | |
FHLMC, Series 237, Class S14 (IO) (-1*1MO LIBOR + 660) (b) | | | 4.860 | % | | | 05/15/36 | | | | 1,025,972 | | | | 191,628 | |
FNMA, Series 2011-75, Class MI (IO) | | | 3.500 | % | | | 08/25/26 | | | | 578,469 | | | | 36,853 | |
FNMA, Series 2012-148, Class IA (IO) | | | 4.000 | % | | | 01/25/28 | | | | 4,641,768 | | | | 439,768 | |
FNMA, Series 301, Class I (PO) | | | 0.000 | % | | | 04/25/29 | | | | 398,428 | | | | 367,274 | |
FNMA, Series 348, Class II (IO) | | | 6.000 | % | | | 01/25/34 | | | | 922,609 | | | | 219,057 | |
FNMA, Series 2013-120, Class JI (IO) | | | 4.000 | % | | | 02/25/40 | | | | 12,314,682 | | | | 647,156 | |
FNMA, Series 2010-44, Class CS (IO) (-1*1MO LIBOR + 655) (b) | | | 4.758 | % | | | 05/25/40 | | | | 1,023,117 | | | | 128,197 | |
FNMA, Series 2011-14, Class PI (IO) | | | 5.000 | % | | | 06/25/40 | | | | 514,093 | | | | 37,362 | |
FNMA, Series 2014-45, Class IO (IO) | | | 4.000 | % | | | 08/25/44 | | | | 1,132,713 | | | | 126,629 | |
GNMA, Series 2013-124, Class ST (-1.333 X 1MO LIBOR + 880) (b) | | | 6.447 | % | | | 08/20/39 | | | | 827,738 | | | | 850,511 | |
GNMA, Series 2011-145, Class QI (IO) | | | 5.000 | % | | | 11/16/41 | | | | 1,523,562 | | | | 258,278 | |
GNMA, Series 2014-141, Class IE (IO) | | | 4.000 | % | | | 08/20/43 | | | | 3,992,611 | | | | 237,445 | |
GNMA, Series 2010-H01, Class CI (IO) (b) | | | 2.217 | % | | | 01/20/60 | | | | 1,699,260 | | | | 159,372 | |
| | Coupon | | | Maturity | | | Shares /
Par Value | | | Fair
Value | |
Agency MBS CMO Derivatives — 0.9% continued |
GNMA, Series 2012-H02, Class AI (IO) (b) | | | 1.886 | % | | | 01/20/62 | | | $ | 2,416,283 | | | $ | 120,396 | |
GNMA, Series 2013-H13, Class T1 (IO) (b) | | | 0.474 | % | | | 05/20/63 | | | | 37,769,095 | | | | 578,600 | |
GNMA, Series 2016-H20, Class GI (IO) (b) | | | 0.103 | % | | | 08/20/66 | | | | 42,282,868 | | | | 436,042 | |
GNMA, Series 2017-H11, Class PI (IO) (b) | | | 2.152 | % | | | 04/20/67 | | | | 10,599,070 | | | | 145,272 | |
GNMA, Series 2017-H22, Class ID (IO) (b) | | | 2.139 | % | | | 11/20/67 | | | | 1,836,069 | | | | 38,995 | |
GNMA, Series 2018-H08, Class NI (IO) (b) | | | 0.506 | % | | | 05/20/68 | | | | 20,882,990 | | | | 483,416 | |
GNMA, Series 2019-H04, Class IO (IO) (b) | | | 1.469 | % | | | 03/20/69 | | | | 44,652,222 | | | | 1,544,199 | |
| | | | | | | | | | | | | | | | 7,106,655 | |
Agency MBS Passthrough — 0.1% |
FHLMC, Pool #FG G60257 | | | 5.500 | % | | | 06/01/41 | | | | 845,772 | | | | 949,777 | |
Auto Loan — 16.7% |
ACC Trust, Series 2018-1, Class A (a) | | | 3.700 | % | | | 12/21/20 | | | | 76,011 | | | | 76,061 | |
ACC Trust, Series 2019-1, Class A (a) | | | 3.750 | % | | | 05/20/22 | | | | 838,348 | | | | 842,852 | |
ACC Trust, Series 2019-2, Class A (a) | | | 2.820 | % | | | 02/21/23 | | | | 2,740,797 | | | | 2,745,117 | |
American Credit Acceptance Receivables Trust, Series 2017-1, Class D (a) | | | 3.540 | % | | | 03/13/23 | | | | 1,283,035 | | | | 1,291,971 | |
American Credit Acceptance Receivables Trust, Series 2017-1, Class E (a) | | | 5.440 | % | | | 03/13/24 | | | | 2,900,000 | | | | 2,958,483 | |
American Credit Acceptance Receivables Trust, Series 2018-3, Class D (a) | | | 4.140 | % | | | 10/15/24 | | | | 3,900,000 | | | | 3,974,284 | |
American Credit Acceptance Receivables Trust, Series 2019-3, Class F (a) | | | 5.420 | % | | | 05/12/26 | | | | 1,000,000 | | | | 998,674 | |
DIAMOND HILL FUNDS | ANNUAL REPORT | DECEMBER 31, 2019 | DIAMOND-HILL.COM 69 |
Diamond Hill Short Duration Total Return Fund
Schedule of Investments (Continued)
December 31, 2019
| | Coupon | | | Maturity | | | Shares /
Par Value | | | Fair
Value | |
Securitized — 84.2% continued |
Auto Loan — 16.7% continued |
Arivo Acceptance Auto Loan Receivables Trust, Series 2019-1, Class A (a) | | | 2.990 | % | | | 07/15/24 | | | $ | 1,287,524 | | | $ | 1,285,210 | |
Avid Automobile Receivables Trust, Series 2019-1, Class E (a) | | | 6.760 | % | | | 05/17/27 | | | | 2,500,000 | | | | 2,489,685 | |
Bank of the West Auto Trust, Series 2017-1, Class B (a) | | | 2.620 | % | | | 11/15/23 | | | | 400,000 | | | | 400,834 | |
California Republic Auto Receivables Trust, Series 2015-4, Class C (a) | | | 4.230 | % | | | 09/15/22 | | | | 85,000 | | | | 85,324 | |
CarNow Auto Receivables Trust, Series 2018-1A, Class A (a) | | | 3.610 | % | | | 10/15/21 | | | | 1,160,037 | | | | 1,162,357 | |
CarNow Auto Receivables Trust, Series 2018-1A, Class B (a) | | | 4.260 | % | | | 09/15/23 | | | | 5,000,000 | | | | 5,048,896 | |
CarNow Auto Receivables Trust, Series 2017-1A, Class C (a) | | | 5.750 | % | | | 10/16/23 | | | | 4,000,000 | | | | 4,047,999 | |
CarNow Auto Receivables Trust, Series 2019-1A, Class C (a) | | | 3.360 | % | | | 06/17/24 | | | | 4,500,000 | | | | 4,486,404 | |
Carvana Auto Receivable Trust, Series 2019-3A, Class A2 (a) | | | 2.420 | % | | | 04/15/22 | | | | 4,200,000 | | | | 4,201,719 | |
Carvana Auto Receivable Trust, Series 2019-2A, Class D (a) | | | 3.280 | % | | | 01/15/25 | | | | 4,300,000 | | | | 4,336,620 | |
Carvana Auto Receivable Trust, Series 2019-3A, Class D (a) | | | 3.040 | % | | | 04/15/25 | | | | 2,190,000 | | | | 2,182,658 | |
Chesapeake Funding II LLC, Series 2018-1A, Class A1 (a) | | | 3.040 | % | | | 04/15/30 | | | | 3,161,279 | | | | 3,196,665 | |
CIG Auto Receivables Trust, Series 2017-1A, Class C (a) | | | 5.330 | % | | | 12/16/24 | | | | 1,600,000 | | | | 1,610,638 | |
| | Coupon | | | Maturity | | | Shares /
Par Value | | | Fair
Value | |
Auto Loan — 16.7% continued |
CPS Auto Trust, Series 2018-C, Class D (a) | | | 4.400 | % | | | 06/17/24 | | | $ | 850,000 | | | $ | 875,502 | |
CPS Auto Trust, Series 2019-A, Class D (a) | | | 4.350 | % | | | 12/16/24 | | | | 1,400,000 | | | | 1,445,491 | |
CPS Auto Trust, Series 2019-B, Class D (a) | | | 3.690 | % | | | 03/17/25 | | | | 4,900,000 | | | | 4,972,768 | |
Drive Auto Receivables Trust, Series 2016-CA, Class D (a) | | | 4.180 | % | | | 03/15/24 | | | | 1,328,488 | | | | 1,344,501 | |
Exeter Automobile Receivables Trust, Series 2016-3A, Class D (a) | | | 6.400 | % | | | 07/17/23 | | | | 3,750,000 | | | | 3,906,920 | |
Flagship Credit Auto Trust, Series 2015-2, Class D (a) | | | 5.980 | % | | | 08/15/22 | | | | 2,140,000 | | | | 2,151,890 | |
Flagship Credit Auto Trust, Series 2015-3, Class D (a) | | | 7.120 | % | | | 11/15/22 | | | | 2,500,000 | | | | 2,561,056 | |
GLS Auto Receivables Trust, Series 2019-3A, Class C (a) | | | 2.960 | % | | | 05/15/25 | | | | 4,500,000 | | | | 4,506,418 | |
GLS Auto Receivables Trust, Series 2019-4A, Class C (a) | | | 3.060 | % | | | 08/15/25 | | | | 4,000,000 | | | | 4,004,085 | |
Hertz Fleet Lease Funding LP, Series 2017-1, Class E (a) | | | 5.800 | % | | | 04/10/31 | | | | 900,000 | | | | 907,791 | |
Hertz Fleet Lease Funding LP, Series 2018-1, Class E (a) | | | 5.550 | % | | | 05/10/32 | | | | 2,750,000 | | | | 2,814,550 | |
Hertz Fleet Lease Funding LP, Series 2019-1, Class E (a) | | | 4.620 | % | | | 01/10/33 | | | | 3,400,000 | | | | 3,433,069 | |
Navistar Financial Dealer Note Master Trust, Series 2018-1, Class D (1MO LIBOR + 155) (a)(b) | | | 3.342 | % | | | 09/25/23 | | | | 2,191,000 | | | | 2,194,214 | |
Navistar Financial Dealer Note Master Trust, Series 2019-1, Class D (1MO LIBOR + 145) (a)(b) | | | 3.242 | % | | | 05/28/24 | | | | 1,200,000 | | | | 1,200,930 | |
70 DIAMOND HILL FUNDS | ANNUAL REPORT | DECEMBER 31, 2019 | DIAMOND-HILL.COM |
Diamond Hill Short Duration Total Return Fund
Schedule of Investments (Continued)
December 31, 2019
| | Coupon | | | Maturity | | | Shares /
Par Value | | | Fair
Value | |
Securitized — 84.2% continued |
Auto Loan — 16.7% continued |
NextGear Floorplan Master Owner Trust, Series 2018-1A, Class A1 (1MO LIBOR + 64) (a)(b) | | | 2.380 | % | | | 02/15/23 | | | $ | 4,175,000 | | | $ | 4,185,265 | |
NextGear Floorplan Master Owner Trust, Series 2019-1A, Class A1 (1MO LIBOR + 65) (a)(b) | | | 2.390 | % | | | 02/15/24 | | | | 2,000,000 | | | | 2,003,312 | |
OneMain Direct Auto Receivables Trust, Series 2017-2A, Class D (a) | | | 3.420 | % | | | 10/15/24 | | | | 1,500,000 | | | | 1,509,521 | |
OneMain Direct Auto Receivables Trust, Series 2017-2A, Class E (a) | | | 4.740 | % | | | 11/14/25 | | | | 3,050,000 | | | | 3,088,649 | |
OSCAR US Funding Trust, Series 2018-1A, Class A2B (1MO LIBOR + 49) (a)(b) | | | 2.205 | % | | | 04/12/21 | | | | 642,819 | | | | 642,924 | |
OSCAR US Funding Trust, Series 2017-1A, Class A3 (a)(b) | | | 2.820 | % | | | 06/10/21 | | | | 859,967 | | | | 860,951 | |
OSCAR US Funding Trust, Series 2018-2A, Class A2A (a) | | | 3.150 | % | | | 08/10/21 | | | | 1,136,905 | | | | 1,139,680 | |
OSCAR US Funding Trust, Series 2019-2A, Class A2 (a) | | | 2.490 | % | | | 08/10/22 | | | | 1,000,000 | | | | 1,001,623 | |
Prestige Auto Receivables Trust, Series 2016-1A, Class D (a) | | | 5.150 | % | | | 11/15/21 | | | | 400,000 | | | | 406,152 | |
Skopos Auto Receivables Trust, Series 2019-1A, Class A (a) | | | 2.900 | % | | | 12/15/22 | | | | 2,436,837 | | | | 2,440,723 | |
Skopos Auto Receivables Trust, Series 2018-1A, Class C (a)(b) | | | 4.770 | % | | | 04/17/23 | | | | 3,000,000 | | | | 3,032,718 | |
Skopos Auto Receivables Trust, Series 2019-1A, Class B (a) | | | 3.430 | % | | | 09/15/23 | | | | 6,000,000 | | | | 5,994,151 | |
| | Coupon | | | Maturity | | | Shares /
Par Value | | | Fair
Value | |
Auto Loan — 16.7% continued |
Skopos Auto Receivables Trust, Series 2019-1A, Class D (a) | | | 5.240 | % | | | 04/15/25 | | | $ | 680,000 | | | $ | 676,893 | |
Tesla Auto Lease Trust, Series 2018-A, Class E (a)(b) | | | 4.940 | % | | | 03/22/21 | | | | 7,350,000 | | | | 7,386,599 | |
Tesla Auto Lease Trust, Series 2018-B, Class D (a) | | | 5.290 | % | | | 11/22/21 | | | | 3,550,000 | | | | 3,662,657 | |
Tesla Auto Lease Trust, Series 2018-B, Class E (a) | | | 7.870 | % | | | 06/20/22 | | | | 2,000,000 | | | | 2,088,821 | |
Tesla Auto Lease Trust, Series 2019-A, Class E (a) | | | 5.480 | % | | | 05/22/23 | | | | 2,580,000 | | | | 2,588,284 | |
United Auto Credit Securitization Trust, Series 2018-2, Class D (a) | | | 4.260 | % | | | 05/10/23 | | | | 2,800,000 | | | | 2,836,541 | |
United Auto Credit Securitization Trust, Series 2019-1, Class D (a) | | | 3.470 | % | | | 08/12/24 | | | | 4,500,000 | | | | 4,545,995 | |
Veros Auto Receivables Trust, Series 2018-1, Class A (a) | | | 3.630 | % | | | 05/15/23 | | | | 886,707 | | | | 888,811 | |
| | | | | | | | | | | | | | | | 134,721,906 | |
Consumer — 21.8% |
Avant Loans Funding Trust, Series 2019-A, Class A (a) | | | 3.480 | % | | | 07/15/22 | | | | 2,390,981 | | | | 2,399,666 | |
Consumer Lending Receivables Trust, Series 2019-A, Class A (a) | | | 3.520 | % | | | 04/15/26 | | | | 1,055,364 | | | | 1,060,562 | |
Consumer Lending Receivables Trust, Series 2019-A, Class CERT (a) | | | 0.000 | % | | | 04/15/26 | | | | 150,000 | | | | 3,442,485 | |
Consumer Loan Underlying Bond Credit Trust, Series 2017-P1, Class B (a) | | | 3.560 | % | | | 09/15/23 | | | | 179,248 | | | | 179,280 | |
Consumer Loan Underlying Bond Credit Trust, Series 2017-P1, Class C (a) | | | 5.020 | % | | | 09/15/23 | | | | 2,000,000 | | | | 2,014,074 | |
DIAMOND HILL FUNDS | ANNUAL REPORT | DECEMBER 31, 2019 | DIAMOND-HILL.COM 71 |
Diamond Hill Short Duration Total Return Fund
Schedule of Investments (Continued)
December 31, 2019
| | Coupon | | | Maturity | | | Shares /
Par Value | | | Fair
Value | |
Securitized — 84.2% continued |
Consumer — 21.8% continued |
Consumer Loan Underlying Bond Credit Trust, Series 2017-NP2, Class C (a)(b) | | | 4.870 | % | | | 01/16/24 | | | $ | 2,560,644 | | | $ | 2,570,715 | |
Consumer Loan Underlying Bond Credit Trust, Series 2018-NP1, Class C (a)(b) | | | 4.740 | % | | | 05/15/24 | | | | 1,143,815 | | | | 1,149,225 | |
Consumer Loan Underlying Bond Credit Trust, Series 2018-P3, Class A (a) | | | 3.820 | % | | | 01/15/26 | | | | 1,391,201 | | | | 1,403,042 | |
Consumer Loan Underlying Bond Credit Trust, Series 2019-P1, Class A (a) | | | 2.940 | % | | | 07/15/26 | | | | 1,042,993 | | | | 1,046,864 | |
Consumer Loan Underlying Bond Credit Trust, Series 2019-HP1, Class B (a) | | | 3.480 | % | | | 12/15/26 | | | | 5,000,000 | | | | 4,990,018 | |
Consumer Loan Underlying Bond Credit Trust, Series 2019-HP1, Class C (a) | | | 4.700 | % | | | 12/15/26 | | | | 1,565,000 | | | | 1,560,286 | |
Freedom Financial, Series 2018-1, Class A (a) | | | 3.610 | % | | | 07/18/24 | | | | 1,564,521 | | | | 1,571,327 | |
Freedom Financial, Series 2018-1, Class B (a) | | | 4.560 | % | | | 07/18/24 | | | | 5,400,000 | | | | 5,489,468 | |
Freedom Financial, Series 2018-2, Class A (a) | | | 3.990 | % | | | 10/20/25 | | | | 2,257,050 | | | | 2,272,598 | |
Freedom Financial, Series 2018-2, Class C (a) | | | 5.880 | % | | | 10/20/25 | | | | 3,000,000 | | | | 3,066,001 | |
Freedom Financial, Series 2019-1, Class A (a) | | | 3.420 | % | | | 06/18/26 | | | | 1,552,511 | | | | 1,558,854 | |
Freedom Financial, Series 2019-1, Class B (a) | | | 3.870 | % | | | 06/18/26 | | | | 3,300,000 | | | | 3,341,882 | |
Freedom Financial, Series 2019-2, Class C (a) | | | 4.860 | % | | | 11/18/26 | | | | 4,500,000 | | | | 4,483,055 | |
| | Coupon | | | Maturity | | | Shares /
Par Value | | | Fair
Value | |
Consumer — 21.8% continued |
LendingPoint Asset Securitization Trust, Series 2019-1, Class A (a) | | | 3.154 | % | | | 08/15/25 | | | $ | 5,065,189 | | | $ | 5,073,109 | |
LendingPoint Asset Securitization Trust, Series 2019-1, Class B (a) | | | 3.613 | % | | | 08/15/25 | | | | 1,500,000 | | | | 1,496,815 | |
LendingPoint Asset Securitization Trust, Series 2019-1, Class C (a) | | | 4.504 | % | | | 08/15/25 | | | | 2,000,000 | | | | 1,992,083 | |
LendingPoint Asset Securitization Trust, Series 2019-2, Class A (a) | | | 3.071 | % | | | 11/10/25 | | | | 7,368,969 | | | | 7,366,604 | |
LendingPoint Asset Securitization Trust, Series 2019-2, Class C (a) | | | 4.660 | % | | | 11/10/25 | | | | 3,700,000 | | | | 3,688,742 | |
LL ABS Trust, Series 2019-1A, Class A (a) | | | 2.870 | % | | | 03/15/27 | | | | 4,200,000 | | | | 4,199,646 | |
LL ABS Trust, Series 2019-1A, Class B (a) | | | 3.520 | % | | | 03/15/27 | | | | 2,950,000 | | | | 2,950,937 | |
LL ABS Trust, Series 2019-1A, Class C (a) | | | 5.070 | % | | | 03/15/27 | | | | 4,500,000 | | | | 4,508,046 | |
Mariner Finance Issuance Trust, Series 2018-AA, Class C (a) | | | 5.110 | % | | | 11/20/30 | | | | 2,750,000 | | | | 2,836,471 | |
Mariner Finance Issuance Trust, Series 2018-AA, Class D (a) | | | 6.570 | % | | | 11/20/30 | | | | 4,725,000 | | | | 4,882,276 | |
Marlette Funding Trust, Series 2017-2A, Class B (a) | | | 3.190 | % | | | 07/15/24 | | | | 26,836 | | | | 26,841 | |
Marlette Funding Trust, Series 2018-1A, Class C (a) | | | 3.690 | % | | | 03/15/28 | | | | 814,000 | | | | 819,144 | |
Oportun Funding LLC, Series 2018-C, Class D (a) | | | 6.790 | % | | | 10/08/24 | | | | 3,972,000 | | | | 4,083,023 | |
Oportun Funding LLC, Series 2018-D, Class B (a) | | | 4.830 | % | | | 12/09/24 | | | | 2,900,000 | | | | 2,957,512 | |
Oportun Funding LLC, Series 2018-D, Class D (a) | | | 7.170 | % | | | 12/09/24 | | | | 4,000,000 | | | | 4,074,730 | |
Oportun Funding VI LLC, Series 2017-A, Class B (a) | | | 3.970 | % | | | 06/08/23 | | | | 2,500,000 | | | | 2,501,480 | |
72 DIAMOND HILL FUNDS | ANNUAL REPORT | DECEMBER 31, 2019 | DIAMOND-HILL.COM |
Diamond Hill Short Duration Total Return Fund
Schedule of Investments (Continued)
December 31, 2019
| | Coupon | | | Maturity | | | Shares /
Par Value | | | Fair
Value | |
Securitized — 84.2% continued |
Consumer — 21.8% continued |
Oportun Funding VII LLC, Series 2017-B, Class B (a) | | | 4.260 | % | | | 10/10/23 | | | $ | 2,500,000 | | | $ | 2,515,934 | |
Prosper Marketplace Issuance Trust, Series 2019-1A, Class A (a) | | | 3.540 | % | | | 04/15/25 | | | | 498,442 | | | | 500,178 | |
Prosper Marketplace Issuance Trust, Series 2019-1A, Class B (a) | | | 4.030 | % | | | 04/15/25 | | | | 1,750,000 | | | | 1,767,438 | |
Prosper Marketplace Issuance Trust, Series 2019-3A, Class A (a) | | | 3.190 | % | | | 07/15/25 | | | | 3,584,115 | | | | 3,602,116 | |
Prosper Marketplace Issuance Trust, Series 2019-3A, Class B (a) | | | 3.590 | % | | | 07/15/25 | | | | 7,600,000 | | | | 7,640,169 | |
Prosper Marketplace Issuance Trust, Series 2019-3A, Class CERT (a) | | | 0.000 | % | | | 07/15/25 | | | | 81,061,702 | | | | 3,096,557 | |
Prosper Marketplace Issuance Trust, Series 2019-4A, Class B (a) | | | 3.200 | % | | | 02/17/26 | | | | 4,500,000 | | | | 4,492,824 | |
Prosper Marketplace Issuance Trust, Series 2019-4A, Class C (a) | | | 4.950 | % | | | 02/17/26 | | | | 6,886,000 | | | | 6,873,187 | |
Purchasing Power Funding, Series 2018-A, Class B (a) | | | 3.580 | % | | | 08/15/22 | | | | 3,000,000 | | | | 3,003,047 | |
Purchasing Power Funding, Series 2018-A, Class C (a) | | | 3.780 | % | | | 08/15/22 | | | | 1,400,000 | | | | 1,401,278 | |
Purchasing Power Funding, Series 2018-A, Class D (a) | | | 4.660 | % | | | 08/15/22 | | | | 1,000,000 | | | | 1,000,772 | |
Regional Management Issuance Trust, Series 2019-1, Class C (a) | | | 4.110 | % | | | 11/15/28 | | | | 2,000,000 | | | | 1,993,426 | |
| | Coupon | | | Maturity | | | Shares /
Par Value | | | Fair
Value | |
Consumer — 21.8% continued |
Republic Finance Issuance Trust, Series 2019-A, Class A (a) | | | 3.430 | % | | | 11/22/27 | | | $ | 4,250,000 | | | $ | 4,241,125 | |
Upgrade Master Pass-Thru Trust, Series 2019-ST1, Class A (a) | | | 4.000 | % | | | 07/15/25 | | | | 4,723,200 | | | | 4,744,461 | |
Upgrade Master Pass-Thru Trust, Series 2019-ST3, Class A (a) | | | 3.750 | % | | | 11/15/25 | | | | 2,780,435 | | | | 2,781,425 | |
Upgrade Receivables Trust, Series 2018-1A, Class A (a) | | | 3.760 | % | | | 11/15/24 | | | | 1,551,127 | | | | 1,554,528 | |
Upgrade Receivables Trust, Series 2019-1A, Class A (a) | | | 3.480 | % | | | 03/15/25 | | | | 1,161,920 | | | | 1,165,000 | |
Upgrade Receivables Trust, Series 2019-1A, Class B (a) | | | 4.090 | % | | | 03/15/25 | | | | 2,650,000 | | | | 2,666,382 | |
Upstart Securitization Trust, Series 2019-1, Class B (a) | | | 4.190 | % | | | 04/20/26 | | | | 2,900,000 | | | | 2,922,768 | |
Upstart Securitization Trust, Series 2019-2, Class A (a) | | | 2.897 | % | | | 09/20/29 | | | | 4,446,788 | | | | 4,458,912 | |
Upstart Securitization Trust, Series 2019-2, Class B (a) | | | 3.734 | % | | | 09/20/29 | | | | 9,050,000 | | | | 9,042,917 | |
Upstart Securitization Trust, Series 2019-2, Class C (a) | | | 4.783 | % | | | 09/20/29 | | | | 5,587,000 | | | | 5,476,383 | |
Upstart Securitization Trust, Series 2019-3, Class B (a) | | | 3.829 | % | | | 01/21/30 | | | | 2,450,000 | | | | 2,450,167 | |
| | | | | | | | | | | | | | | | 176,447,855 | |
Credit Cards — 3.1% |
Continental Credit Card LLC, Series 2019-1A, Class A (a) | | | 3.830 | % | | | 08/15/26 | | | | 5,000,000 | | | | 5,034,102 | |
DIAMOND HILL FUNDS | ANNUAL REPORT | DECEMBER 31, 2019 | DIAMOND-HILL.COM 73 |
Diamond Hill Short Duration Total Return Fund
Schedule of Investments (Continued)
December 31, 2019
| | Coupon | | | Maturity | | | Shares /
Par Value | | | Fair
Value | |
Securitized — 84.2% continued |
Credit Cards — 3.1% continued |
Continental Credit Card LLC, Series 2019-1A, Class B (a) | | | 4.950 | % | | | 08/15/26 | | | $ | 2,600,000 | | | $ | 2,619,404 | |
Fortiva Retail Credit Master Note, Series 2018-1, Class A (a) | | | 5.540 | % | | | 11/15/23 | | | | 10,850,000 | | | | 11,050,765 | |
Fortiva Retail Credit Master Note, Series 2018-1, Class C (a) | | | 7.730 | % | | | 11/15/23 | | | | 2,750,000 | | | | 2,829,572 | |
Genesis Sales Finance Master Trust, Series 2019-AA, Class A (a) | | | 4.680 | % | | | 08/20/23 | | | | 1,200,000 | | | | 1,221,417 | |
Genesis Sales Finance Master Trust, Series 2019-AA, Class C (a) | | | 6.880 | % | | | 08/20/23 | | | | 1,700,000 | | | | 1,723,706 | |
Genesis Sales Finance Master Trust, Series 2019-AA, Class D (a) | | | 9.540 | % | | | 08/20/23 | | | | 1,000,000 | | | | 1,018,915 | |
| | | | | | | | | | | | | | | | 25,497,881 | |
Equipment — 5.7% |
Ascentium Equipment Receivables Trust, Series 2016-2A, Class E (a) | | | 6.790 | % | | | 10/10/24 | | | | 900,000 | | | | 913,418 | |
Business Jet Securities LLC, Series 2018-1, Class A (a)(b) | | | 4.335 | % | | | 02/15/33 | | | | 4,551,159 | | | | 4,599,909 | |
Business Jet Securities LLC, Series 2018-1, Class B (a)(b) | | | 6.048 | % | | | 02/15/33 | | | | 903,062 | | | | 927,933 | |
Business Jet Securities LLC, Series 2018-2, Class A (a) | | | 4.447 | % | | | 06/15/33 | | | | 3,938,896 | | | | 3,996,250 | |
Business Jet Securities LLC, Series 2018-2, Class B (a) | | | 5.437 | % | | | 06/15/33 | | | | 4,667,677 | | | | 4,730,785 | |
Business Jet Securities LLC, Pool #2019-1, Series 2019-1, Class B (a) | | | 5.193 | % | | | 07/15/34 | | | | 1,188,319 | | | | 1,203,696 | |
| | Coupon | | | Maturity | | | Shares /
Par Value | | | Fair
Value | |
Equipment — 5.7% continued |
Business Jet Securities LLC, Pool #2019-1, Series 2019-1, Class C (a) | | | 6.948 | % | | | 07/15/34 | | | $ | 6,401,967 | | | $ | 6,434,873 | |
CAL Funding Ltd., Series 2018-2A, Class B (a) | | | 5.220 | % | | | 09/25/43 | | | | 3,500,000 | | | | 3,598,582 | |
CCG Receivables Trust, Series 2018-2, Class C (a) | | | 3.870 | % | | | 12/15/25 | | | | 2,395,000 | | | | 2,457,102 | |
CLI Funding LLC, Series 2017-1A, Class A (a) | | | 3.620 | % | | | 05/18/42 | | | | 2,749,425 | | | | 2,729,591 | |
Global SC Finance II SRL, Series 2013-1A, Class A (a) | | | 2.980 | % | | | 04/17/28 | | | | 416,667 | | | | 416,236 | |
Global SC Finance SRL, Series 2014-1A, Class A2 (a) | | | 3.090 | % | | | 07/17/29 | | | | 1,031,250 | | | | 1,029,725 | |
HPEFS Equipment Trust, Series 2019-1A, Class A2 (a) | | | 2.190 | % | | | 09/20/29 | | | | 1,475,000 | | | | 1,476,228 | |
Pawnee Equipment Receivables, Series 2019-1, Class A1 (a) | | | 2.294 | % | | | 10/15/20 | | | | 7,048,762 | | | | 7,050,677 | |
SCF Equipment Trust LLC, Series 2017-1A, Class A (a) | | | 3.770 | % | | | 01/20/23 | | | | 2,358,791 | | | | 2,370,940 | |
TAL Advantage LLC, Series 2014-3A, Class A (a) | | | 3.270 | % | | | 11/21/39 | | | | 2,010,917 | | | | 2,010,965 | |
| | | | | | | | | | | | | | | | 45,946,910 | |
Non Agency CMBS — 13.2% |
A10 Securitization, Series 2017-1A, Class C (a) | | | 4.050 | % | | | 03/15/36 | | | | 5,750,000 | | | | 5,798,875 | |
A10 Securitization, Series 2017-1A, Class D (a) | | | 4.700 | % | | | 03/15/36 | | | | 3,250,000 | | | | 3,261,797 | |
AREIT Trust, Series 2018-CRE1, Class B (1MO LIBOR + 165) (a)(b)(e) | | | 3.390 | % | | | 02/14/35 | | | | 900,000 | | | | 899,717 | |
B2R Mortgage Trust, Series 2015-2, Class A (a) | | | 3.336 | % | | | 11/15/48 | | | | 68,181 | | | | 68,376 | |
74 DIAMOND HILL FUNDS | ANNUAL REPORT | DECEMBER 31, 2019 | DIAMOND-HILL.COM |
Diamond Hill Short Duration Total Return Fund
Schedule of Investments (Continued)
December 31, 2019
| | Coupon | | | Maturity | | | Shares /
Par Value | | | Fair
Value | |
Securitized — 84.2% continued |
Non Agency CMBS — 13.2% continued |
Bancorp Commercial Mortgage Trust (The), Series 2017-CRE2, Class C (1MO LIBOR + 235) (a)(b) | | | 4.115 | % | | | 08/15/32 | | | $ | 4,750,000 | | | $ | 4,783,829 | |
Bancorp Commercial Mortgage Trust (The), Series 2018-CR3, Class A (1MO LIBOR + 85) (a)(b) | | | 2.590 | % | | | 01/15/33 | | | | 2,182,919 | | | | 2,180,934 | |
Bancorp Commercial Mortgage Trust (The), Series 2016-CRE1, Class D (1MO LIBOR + 603.665) (a)(b) | | | 7.156 | % | | | 11/15/33 | | | | 3,220,966 | | | | 3,220,500 | |
BTH Mortgage-Backed Securities Trust, Series 2018-13, Class A (1MO LIBOR + 250) (a)(b) | | | 4.209 | % | | | 08/01/21 | | | | 4,000,000 | | | | 4,004,429 | |
BXT Trust, Series 2018-EXCL, Class A (1MO LIBOR + 1088) (a)(b) | | | 2.727 | % | | | 09/15/20 | | | | 5,353,585 | | | | 5,341,823 | |
BXT Trust, Series 2018-GW, Class A (1MO LIBOR + 80) (a)(b) | | | 2.540 | % | | | 05/15/34 | | | | 5,000,000 | | | | 4,984,521 | |
Cosmopolitan Hotel Trust, Series 2017-CSMO, Class D (1MO LIBOR + 225) (a)(b) | | | 3.990 | % | | | 11/15/36 | | | | 4,900,000 | | | | 4,903,002 | |
Exantas Capital Corp., Series 2019-RS07, Class AS (1MO LIBOR + 150) (a)(b)(e) | | | 3.262 | % | | | 04/15/36 | | | | 3,900,000 | | | | 3,899,988 | |
FREMF Mortgage Trust, Series 2019-K735, Class B (a)(b) | | | 4.157 | % | | | 05/25/26 | | | | 750,000 | | | | 779,153 | |
Invitation Homes Trust, Series 2017-SFR2, Class D (1MO LIBOR + 180) (a)(b) | | | 3.537 | % | | | 12/17/36 | | | | 2,995,604 | | | | 2,999,865 | |
| | Coupon | | | Maturity | | | Shares /
Par Value | | | Fair
Value | |
Non Agency CMBS — 13.2% continued |
Invitation Homes Trust, Series 2018-SFR1, Class B (1MO LIBOR + 95) (a)(b) | | | 2.712 | % | | | 03/17/37 | | | $ | 1,700,000 | | | $ | 1,684,162 | |
Invitation Homes Trust, Series 2018-SFR1, Class E (1MO LIBOR + 200) (a)(b) | | | 3.763 | % | | | 03/17/37 | | | | 2,599,645 | | | | 2,602,132 | |
Invitation Homes Trust, Series 2018-SFR2, Class E (1MO LIBOR + 200) (a)(b) | | | 3.765 | % | | | 06/17/37 | | | | 3,500,000 | | | | 3,508,706 | |
Invitation Homes Trust, Series 2018-SFR3, Class D (1MO LIBOR + 165) (a)(b) | | | 3.413 | % | | | 07/17/37 | | | | 2,850,000 | | | | 2,859,759 | |
Invitation Homes Trust, Series 2018-SFR3, Class E (1MO LIBOR + 200) (a)(b) | | | 3.763 | % | | | 07/17/37 | | | | 3,500,000 | | | | 3,510,960 | |
KKR Real Estate Finance Trust, Inc., Series 2018-FL1, Class A (1MO LIBOR + 110) (a)(b)(e) | | | 2.737 | % | | | 06/15/36 | | | | 3,500,000 | | | | 3,505,460 | |
Multi Family Connecticut Avenue, Series 2019-01, Class B10 (1MO LIBOR + 550) (a)(b) | | | 7.292 | % | | | 10/15/49 | | | | 1,500,000 | | | | 1,560,104 | |
Multi Family Connecticut Avenue, Series 2019-01, Class M10 (1MO LIBOR + 325) (a)(b) | | | 5.042 | % | | | 10/15/49 | | | | 500,000 | | | | 520,946 | |
Multi Family Housing Mortgage Loan, Series 2019-FL2, Class C (1MO LIBOR + 200) (a)(b)(e) | | | 3.792 | % | | | 12/25/34 | | | | 3,500,000 | | | | 3,503,648 | |
PFP III, Series 2019-5, Class AS (1MO LIBOR + 142) (a)(b)(e) | | | 3.160 | % | | | 04/14/36 | | | | 1,747,000 | | | | 1,746,993 | |
DIAMOND HILL FUNDS | ANNUAL REPORT | DECEMBER 31, 2019 | DIAMOND-HILL.COM 75 |
Diamond Hill Short Duration Total Return Fund
Schedule of Investments (Continued)
December 31, 2019
| | Coupon | | | Maturity | | | Shares /
Par Value | | | Fair
Value | |
Securitized — 84.2% continued |
Non Agency CMBS — 13.2% continued |
Progress Residential Trust, Series 2015-SFR3, Class A (a) | | | 3.067 | % | | | 11/12/32 | | | $ | 98,694 | | | $ | 98,566 | |
Progress Residential Trust, Series 2015-SFR3, Class D (a) | | | 4.673 | % | | | 11/12/32 | | | | 135,000 | | | | 134,845 | |
Progress Residential Trust, Series 2019-SFR3, Class E (a) | | | 3.369 | % | | | 09/17/36 | | | | 5,500,000 | | | | 5,453,485 | |
Progress Residential Trust, Series 2019-SFR3, Class F (a) | | | 3.867 | % | | | 09/17/36 | | | | 2,000,000 | | | | 1,991,691 | |
ReadyCap Commercial Mortgage Trust, Series 2019-FL3, Class A (1MO LIBOR + 100) (a)(b)(e) | | | 2.792 | % | | | 03/25/34 | | | | 5,415,000 | | | | 5,403,591 | |
ReadyCap Commercial Mortgage Trust, Series 2018-FL2, Class D (1MO LIBOR + 270) (a)(b)(e) | | | 4.492 | % | | | 06/25/35 | | | | 6,600,000 | | | | 6,583,170 | |
Shelter Growth, Series 2019-FL2, Class AS (1MO LIBOR + 145) (a)(b)(e) | | | 3.190 | % | | | 05/15/36 | | | | 3,899,604 | | | | 3,898,395 | |
TPG Real Estate Finance, Series 2019-FL3, Class A (1MO LIBOR + 115) (a)(b)(e) | | | 2.890 | % | | | 10/15/34 | | | | 5,000,000 | | | | 4,996,880 | |
VMC Finance LLC, Series 2018-FL2, Class A (1MO LIBOR + 92) (a)(b) | | | 2.657 | % | | | 10/15/35 | | | | 3,618,418 | | | | 3,612,307 | |
VMC Finance LLC, Series 2019-FL3, Class AS (1MO LIBOR + 140) (a)(b) | | | 3.137 | % | | | 09/15/36 | | | | 1,478,072 | | | | 1,478,771 | |
WF-RBS Commercial Mortgage Trust, Series 2011-C2, Class D (a)(b) | | | 5.839 | % | | | 02/15/44 | | | | 665,000 | | | | 676,934 | |
| | | | | | | | | | | | | | | | 106,458,314 | |
| | Coupon | | | Maturity | | | Shares /
Par Value | | | Fair
Value | |
Non Agency MBS CMO — 5.2% |
Antler Mortgage Trust, Series 2018-RTL1, Class A2 (a) | | | 4.703 | % | | | 07/25/22 | | | $ | 4,500,000 | | | $ | 4,500,802 | |
Antler Mortgage Trust, Series 2018-RTL1, Class M (a) | | | 7.385 | % | | | 05/25/23 | | | | 2,000,000 | | | | 2,015,363 | |
Arroyo Mortgage Trust, Series 2018-1, Class A1 (a) | | | 3.763 | % | | | 04/25/48 | | | | 2,217,282 | | | | 2,242,996 | |
Arroyo Mortgage Trust, Series 2019-2, Class M1 (a) | | | 4.760 | % | | | 04/25/49 | | | | 1,900,000 | | | | 1,957,686 | |
Cascade Funding Mortgage Trust, Series 2019-MH1, Class M (a) | | | 5.339 | % | | | 11/25/44 | | | | 1,100,000 | | | | 1,098,995 | |
Cascade Funding Mortgage Trust, Series 2018-RM1, Class A1 (a) | | | 4.580 | % | | | 06/25/48 | | | | 4,101,289 | | | | 4,093,847 | |
Cascade Funding Mortgage Trust, Series 2018-RM1, Class A2 (a) | | | 5.875 | % | | | 06/25/48 | | | | 2,800,000 | | | | 2,805,644 | |
Citigroup Mortgage Loan Trust, Inc., Series 2004-UST1, Class A3 (b) | | | 3.954 | % | | | 08/25/34 | | | | 7,678 | | | | 7,628 | |
COLT Funding LLC, Series 2019-1, Class A1 (a) | | | 3.705 | % | | | 03/25/49 | | | | 999,279 | | | | 1,004,815 | |
Finance of America Structured Securities, Series 2018-HB1, Class M3 (a) | | | 4.392 | % | | | 09/25/28 | | | | 2,750,000 | | | | 2,750,731 | |
LHFC Depositor LLC, Series 2019-RLT1, Class A2 (a) | | | 4.948 | % | | | 10/25/23 | | | | 4,544,000 | | | | 4,593,257 | |
LHFC Depositor LLC, Series 2019-RLT1, Class M (a) | | | 6.899 | % | | | 10/25/23 | | | | 2,750,000 | | | | 2,747,298 | |
Nationstar HECM Loan Trust, Series 2018-3A, Class M2 (a) | | | 4.155 | % | | | 11/25/28 | | | | 9,900,000 | | | | 10,016,503 | |
RiverView HECM Trust, Series 2007-1, Class A (TREASURY 1Y + 50) (a)(b) | | | 2.100 | % | | | 05/25/47 | | | | 120,643 | | | | 92,499 | |
76 DIAMOND HILL FUNDS | ANNUAL REPORT | DECEMBER 31, 2019 | DIAMOND-HILL.COM |
Diamond Hill Short Duration Total Return Fund
Schedule of Investments (Continued)
December 31, 2019
| | Coupon | | | Maturity | | | Shares /
Par Value | | | Fair
Value | |
Securitized — 84.2% continued |
Non Agency MBS CMO — 5.2% continued |
RMF Buyout Issuance Trust, Series 2018-1, Class M3 (a) | | | 4.448 | % | | | 11/25/28 | | | $ | 1,900,000 | | | $ | 1,898,961 | |
| | | | | | | | | | | | | | | | 41,827,025 | |
Student Loan — 1.4% |
College Ave Student Loans, Series 2018-A, Class B (a)(b) | | | 4.750 | % | | | 12/26/47 | | | | 1,900,000 | | | | 1,974,379 | |
College Ave Student Loans, Series 2018-A, Class C (a)(b) | | | 5.500 | % | | | 12/26/47 | | | | 900,000 | | | | 935,928 | |
College Ave Student Loans, Series 2019-A, Class C (a) | | | 4.460 | % | | | 12/28/48 | | | | 4,000,000 | | | | 3,959,504 | |
CommonBond Student Loan Trust, Series 2017-BGS, Class C (a) | | | 4.440 | % | | | 09/25/42 | | | | 408,589 | | | | 404,734 | |
Earnest Student Loan Program LLC, Series 2016-C, Class A2 (a) | | | 2.680 | % | | | 07/25/35 | | | | 224,489 | | | | 224,866 | |
Earnest Student Loan Program LLC, Series 2016-C, Class A1 (1MO LIBOR + 185) (a)(b) | | | 3.642 | % | | | 10/27/36 | | | | 798,033 | | | | 804,657 | |
Earnest Student Loan Program LLC, Series 2016-D, Class R (a) | | | 0.000 | % | | | 01/25/41 | | | | 5,000 | | | | 132,993 | |
Laurel Road Prime Student Loan, Series 2019-A, Class BFX (a) | | | 3.000 | % | | | 10/25/48 | | | | 2,290,000 | | | | 2,277,145 | |
Social Professional Loan Program, Series 2016-D, Class A1 (1MO LIBOR + 95) (a)(b) | | | 2.742 | % | | | 01/25/39 | | | | 476,790 | | | | 478,695 | |
| | Coupon | | | Maturity | | | Shares /
Par Value | | | Fair
Value | |
Student Loan — 1.4% continued |
Social Professional Loan Program, Series 2018-A, Class A1 (1MO LIBOR + 35) (a)(b) | | | 2.142 | % | | | 02/25/42 | | | $ | 459,820 | | | $ | 458,135 | |
| | | | | | | | | | | | | | | | 11,651,036 | |
Total Securitized | | $ | 681,008,815 | |
Treasury — 6.6% |
U.S. Treasury Notes (c) | | | 1.375 | % | | | 01/31/20 | | | | 12,000,000 | | | | 11,997,313 | |
U.S. Treasury Notes (c) | | | 1.500 | % | | | 04/15/20 | | | | 12,000,000 | | | | 11,996,719 | |
U.S. Treasury Notes | | | 2.500 | % | | | 06/30/20 | | | | 15,000,000 | | | | 15,063,281 | |
U.S. Treasury Notes (c) | | | 1.375 | % | | | 08/31/20 | | | | 14,000,000 | | | | 13,976,207 | |
Total Treasury | | $ | 53,033,520 | |
| | Shares | | | Fair
Value | |
Registered Investment Companies — 9.3% |
State Street Institutional Liquid Reserves Fund, Premier Class, 1.73% (f) | | | 36,897,266 | | | $ | 36,900,956 | |
State Street Navigator Securities Lending Portfolio I, 1.86% (f)(g) | | | 38,637,375 | | | | 38,637,375 | |
Total Registered Investment Companies | | $ | 75,538,331 | |
Total Investment Securities — 105.0% |
(Cost $847,587,968) | | $ | 849,143,011 | |
Liabilities in Excess of Other Assets — (5.0)% | | | (40,483,943 | ) |
Net Assets — 100.0% | | $ | 808,659,068 | |
DIAMOND HILL FUNDS | ANNUAL REPORT | DECEMBER 31, 2019 | DIAMOND-HILL.COM 77 |
Diamond Hill Short Duration Total Return Fund
Schedule of Investments (Continued)
December 31, 2019
(a) | Securities exempt from registration under Rule 144A of the Securities Act of 1933. These securities have been deemed liquid under procedures approved by the Fund’s Board of Trustees and may normally be sold to qualified institutional buyers in transactions exempt from registration. The total fair value of these securities as of December 31, 2019 was $663,543,980, representing 82.1% of net assets. |
(b) | Variable rate security. The rate shown is the effective interest rate as of December 31, 2019. The benchmark on which the rate is calculated is shown parenthetically, if applicable. Certain variable rate securities are not based on a published rate and spread, but are determined by the issuer or agent and may be based on index changes, prepayment of underlying positions and/or other variables. These securities do not indicate a reference rate and spread in their description above. |
(c) | All or a portion of the security is on loan. The total fair value of the securities on loan as of December 31, 2019 was $38,613,433. |
(d) | Percentage rounds to less than 0.1%. |
(e) | Illiquid security as determined under procedures approved by the Board of Trustees. The total fair value of these securities as of December 31, 2019 was $34,437,842, representing 4.3% of net assets. |
(f) | The rate shown is the 7-day effective yield as of December 31, 2019. |
(g) | This security was purchased with cash collateral held from securities on loan. The total value of such securities as of December 31, 2019 was $38,637,375. Securities on loan are also collateralized by various U.S. Treasury and government agency securities in the amount of $959,045. |
AG - Aktiengesellschaft
A/S - Aktieselskab
ASA - Allmennaksjeselskap
IO - Interest Only
LIBOR - London Interbank Offered Rate
NA - National Association
NV - Naamloze Vennotschap
plc - Public Limited Company
PO - Principal Only
UA - Uitgesloten Aansprakelijkheid
See accompanying Notes to Financial Statements.
Diamond Hill Core Bond Fund
Schedule of Investments
December 31, 2019
| | Coupon | | | Maturity | | | Shares /
Par Value | | | Fair
Value | |
Corporate Credit — 16.4% |
Banking — 6.9% |
Bank of America Corp. | | | 2.881 | % | | | 04/24/23 | | | $ | 100,000 | | | $ | 101,730 | |
Bank of America Corp. | | | 3.458 | % | | | 03/15/25 | | | | 425,000 | | | | 443,650 | |
Bank of America Corp. (a) | | | 3.824 | % | | | 01/20/28 | | | | 100,000 | | | | 107,549 | |
Bank of New York Mellon Corp. (The), Series MTN | | | 1.950 | % | | | 08/23/22 | | | | 175,000 | | | | 175,296 | |
Bank of New York Mellon Corp. (The) | | | 3.000 | % | | | 10/30/28 | | | | 100,000 | | | | 102,394 | |
Branch Banking & Trust Co. | | | 2.150 | % | | | 12/06/24 | | | | 250,000 | | | | 249,364 | |
Canadian Imperial Bank of Commerce | | | 2.606 | % | | | 07/22/23 | | | | 100,000 | | | | 101,041 | |
Capital One Financial Corp. | | | 3.750 | % | | | 07/28/26 | | | | 100,000 | | | | 105,253 | |
Capital One NA | | | 2.150 | % | | | 09/06/22 | | | | 250,000 | | | | 250,387 | |
Citigroup, Inc. | | | 3.352 | % | | | 04/24/25 | | | | 200,000 | | | | 208,161 | |
Citigroup, Inc. | | | 3.300 | % | | | 04/27/25 | | | | 100,000 | | | | 104,865 | |
Citigroup, Inc. (3MO LIBOR + 125) (a) | | | 3.349 | % | | | 07/01/26 | | | | 100,000 | | | | 102,594 | |
Citigroup, Inc. | | | 4.125 | % | | | 07/25/28 | | | | 150,000 | | | | 163,501 | |
Citigroup, Inc. | | | 2.976 | % | | | 11/05/30 | | | | 180,000 | | | | 182,524 | |
Citizens Financial Group (b) | | | 2.850 | % | | | 07/27/26 | �� | | | 225,000 | | | | 228,982 | |
Comerica Bank, Series BKNT (b) | | | 2.500 | % | | | 07/23/24 | | | | 250,000 | | | | 252,995 | |
Cooperatieve Rabobank UA (c) | | | 2.625 | % | | | 07/22/24 | | | | 250,000 | | | | 252,746 | |
Discover Financial Services | | | 4.100 | % | | | 02/09/27 | | | | 100,000 | | | | 107,641 | |
Fifth Third Bancorp | | | 2.375 | % | | | 01/28/25 | | | | 275,000 | | | | 275,180 | |
Goldman Sachs Group, Inc. | | | 2.625 | % | | | 04/25/21 | | | | 50,000 | | | | 50,426 | |
Goldman Sachs Group, Inc. (3MO LIBOR + 111) (a) | | | 3.046 | % | | | 04/26/22 | | | | 50,000 | | | | 50,502 | |
Goldman Sachs Group, Inc. | | | 3.500 | % | | | 01/23/25 | | | | 205,000 | | | | 214,929 | |
Goldman Sachs Group, Inc. | | | 3.500 | % | | | 11/16/26 | | | | 350,000 | | | | 367,848 | |
Huntington Bancshares, Inc. | | | 2.300 | % | | | 01/14/22 | | | | 100,000 | | | | 100,510 | |
Huntington Bancshares, Inc. | | | 2.625 | % | | | 08/06/24 | | | | 125,000 | | | | 126,726 | |
JP Morgan Chase Bank NA | | | 3.086 | % | | | 04/26/21 | | | | 250,000 | | | | 250,845 | |
JPMorgan Chase & Co. (3MO LIBOR + 100) (a) | | | 3.001 | % | | | 01/15/23 | | | | 100,000 | | | | 101,057 | |
78 DIAMOND HILL FUNDS | ANNUAL REPORT | DECEMBER 31, 2019 | DIAMOND-HILL.COM |
Diamond Hill Core Bond Fund
Schedule of Investments (Continued)
December 31, 2019
| | Coupon | | | Maturity | | | Shares /
Par Value | | | Fair
Value | |
Corporate Credit — 16.4% continued |
Banking — 6.9% continued |
JPMorgan Chase & Co. | | | 4.023 | % | | | 12/05/24 | | | $ | 200,000 | | | $ | 213,162 | |
JPMorgan Chase & Co. (a) | | | 3.782 | % | | | 02/01/28 | | | | 100,000 | | | | 107,718 | |
JPMorgan Chase & Co. | | | 3.509 | % | | | 01/23/29 | | | | 100,000 | | | | 106,156 | |
JPMorgan Chase & Co. | | | 2.739 | % | | | 10/15/30 | | | | 100,000 | | | | 99,857 | |
Key Bank NA | | | 2.500 | % | | | 11/22/21 | | | | 250,000 | | | | 252,751 | |
KeyCorp | | | 2.550 | % | | | 10/01/29 | | | | 385,000 | | | | 375,930 | |
Morgan Stanley | | | 3.737 | % | | | 04/24/24 | | | | 100,000 | | | | 104,462 | |
Morgan Stanley | | | 3.700 | % | | | 10/23/24 | | | | 100,000 | | | | 106,169 | |
Morgan Stanley | | | 3.125 | % | | | 07/27/26 | | | | 100,000 | | | | 103,145 | |
Morgan Stanley | | | 3.625 | % | | | 01/20/27 | | | | 100,000 | | | | 106,363 | |
PNC Bank NA | | | 2.700 | % | | | 10/22/29 | | | | 250,000 | | | | 249,489 | |
PNC Financial Services | | | 2.600 | % | | | 07/23/26 | | | | 250,000 | | | | 253,123 | |
Regions Financial Corp. | | | 2.750 | % | | | 08/14/22 | | | | 250,000 | | | | 254,395 | |
State Street Corp. | | | 2.354 | % | | | 11/01/25 | | | | 175,000 | | | | 175,602 | |
SunTrust Bank | | | 3.525 | % | | | 10/26/21 | | | | 100,000 | | | | 101,207 | |
US Bancorp | | | 2.400 | % | | | 07/30/24 | | | | 350,000 | | | | 354,460 | |
Wells Fargo & Co. | | | 2.400 | % | | | 01/15/20 | | | | 250,000 | | | | 250,036 | |
Wells Fargo & Co. | | | 3.550 | % | | | 09/29/25 | | | | 425,000 | | | | 449,710 | |
| | | | | | | | | | | | | | | | 8,442,431 | |
Basic Industry — 0.3% |
FMC Corp. | | | 3.450 | % | | | 10/01/29 | | | | 300,000 | | | | 309,748 | |
PPG Industries, Inc. | | | 2.400 | % | | | 08/15/24 | | | | 110,000 | | | | 111,002 | |
| | | | | | | | | | | | | | | | 420,750 | |
Brokerage Asset Managers Exchanges — 0.1% |
CBOE Holdings, Inc. (b) | | | 3.650 | % | | | 01/12/27 | | | | 100,000 | | | | 107,292 | |
| |
Capital Goods — 0.4% |
General Electric Capital Corp. | | | 6.750 | % | | | 03/15/32 | | | | 100,000 | | | | 128,270 | |
L3 Harris Technologies, Inc. (c) | | | 3.850 | % | | | 12/15/26 | | | | 50,000 | | | | 53,598 | |
Lennox International, Inc. | | | 3.000 | % | | | 11/15/23 | | | | 100,000 | | | | 101,702 | |
Republic Services, Inc. | | | 2.500 | % | | | 08/15/24 | | | | 200,000 | | | | 202,111 | |
| | | | | | | | | | | | | | | | 485,681 | |
Communications — 1.5% |
American Tower Corp. | | | 2.250 | % | | | 01/15/22 | | | | 50,000 | | | | 50,143 | |
American Tower Corp. (b) | | | 3.800 | % | | | 08/15/29 | | | | 100,000 | | | | 106,762 | |
AT&T, Inc. | | | 3.200 | % | | | 03/01/22 | | | | 50,000 | | | | 51,196 | |
AT&T, Inc. | | | 3.800 | % | | | 02/15/27 | | | | 100,000 | | | | 106,488 | |
| | Coupon | | | Maturity | | | Shares /
Par Value | | | Fair
Value | |
Communications — 1.5% continued |
AT&T, Inc. | | | 4.500 | % | | | 05/15/35 | | | $ | 100,000 | | | $ | 111,202 | |
British Telecommunications plc (c) | | | 3.250 | % | | | 11/08/29 | | | | 275,000 | | | | 274,388 | |
Comcast Corp. | | | 3.450 | % | | | 10/01/21 | | | | 100,000 | | | | 102,909 | |
Comcast Corp. | | | 2.650 | % | | | 02/01/30 | | | | 100,000 | | | | 100,274 | |
Comcast Corp. | | | 3.969 | % | | | 11/01/47 | | | | 144,000 | | | | 158,373 | |
Crown Castle International Corp. | | | 2.250 | % | | | 09/01/21 | | | | 75,000 | | | | 75,198 | |
Deutsche Telekom International Finance (c) | | | 4.750 | % | | | 06/21/38 | | | | 100,000 | | | | 114,263 | |
Twenty-First Century Fox, Inc. (c) | | | 4.030 | % | | | 01/25/24 | | | | 50,000 | | | | 53,273 | |
Verizon Communications, Inc. (3MO LIBOR + 110) (a) | | | 3.010 | % | | | 05/15/25 | | | | 100,000 | | | | 102,292 | |
Verizon Communications, Inc. | | | 4.125 | % | | | 03/16/27 | | | | 100,000 | | | | 110,900 | |
Verizon Communications, Inc. | | | 5.500 | % | | | 03/16/47 | | | | 100,000 | | | | 135,381 | |
Walt Disney Co. (The) (b) | | | 1.750 | % | | | 08/30/24 | | | | 175,000 | | | | 173,351 | |
| | | | | | | | | | | | | | | | 1,826,393 | |
Consumer Cyclical — 0.9% |
CVS Health Corp. | | | 5.050 | % | | | 03/25/48 | | | | 250,000 | | | | 295,370 | |
Ford Motor Co. (b) | | | 4.346 | % | | | 12/08/26 | | | | 100,000 | | | | 103,226 | |
Ford Motor Co. | | | 7.450 | % | | | 07/16/31 | | | | 75,000 | | | | 88,970 | |
General Motors Financial Co., Inc. | | | 3.200 | % | | | 07/06/21 | | | | 35,000 | | | | 35,475 | |
General Motors Financial Co., Inc. | | | 4.200 | % | | | 11/06/21 | | | | 50,000 | | | | 51,830 | |
General Motors Financial Co., Inc. | | | 4.000 | % | | | 10/06/26 | | | | 100,000 | | | | 104,755 | |
Home Depot, Inc. (The) | | | 3.500 | % | | | 09/15/56 | | | | 100,000 | | | | 103,773 | |
Toyota Motor Credit Corp. | | | 1.950 | % | | | 04/17/20 | | | | 75,000 | | | | 74,998 | |
Volkswagen AG (c) | | | 2.500 | % | | | 09/24/21 | | | | 200,000 | | | | 201,696 | |
| | | | | | | | | | | | | | | | 1,060,093 | |
Consumer Non-Cyclical — 1.0% |
Abbott Laboratories | | | 4.750 | % | | | 11/30/36 | | | | 100,000 | | | | 124,803 | |
AbbVie, Inc. (c) | | | 2.950 | % | | | 11/21/26 | | | | 335,000 | | | | 340,010 | |
Actavis Funding SCS | | | 4.550 | % | | | 03/15/35 | | | | 100,000 | | | | 109,080 | |
Amgen, Inc. (b) | | | 2.650 | % | | | 05/11/22 | | | | 140,000 | | | | 142,079 | |
DIAMOND HILL FUNDS | ANNUAL REPORT | DECEMBER 31, 2019 | DIAMOND-HILL.COM 79 |
Diamond Hill Core Bond Fund
Schedule of Investments (Continued)
December 31, 2019
| | Coupon | | | Maturity | | | Shares /
Par Value | | | Fair
Value | |
Corporate Credit — 16.4% continued |
Consumer Non-Cyclical — 1.0% continued |
Anheuser-Busch Cos., LLC (b) | | | 4.700 | % | | | 02/01/36 | | | $ | 100,000 | | | $ | 115,335 | |
Anheuser-Busch InBev SA/NV | | | 4.750 | % | | | 01/23/29 | | | | 100,000 | | | | 115,766 | |
Kimberly-Clark Corp. | | | 3.950 | % | | | 11/01/28 | | | | 100,000 | | | | 110,982 | |
Kroger Co. (The) (b) | | | 2.650 | % | | | 10/15/26 | | | | 100,000 | | | | 100,565 | |
Zoetis, Inc. | | | 3.250 | % | | | 08/20/21 | | | | 50,000 | | | | 50,914 | |
| | | | | | | | | | | | | | | | 1,209,534 | |
Electric — 1.4% |
Ameren Corp. | | | 2.500 | % | | | 09/15/24 | | | | 130,000 | | | | 131,012 | |
CMS Energy Corp. | | | 2.950 | % | | | 02/15/27 | | | | 100,000 | | | | 100,953 | |
DTE Energy Co., Series C (a) | | | 2.529 | % | | | 10/01/24 | | | | 150,000 | | | | 150,588 | |
DTE Energy Co. | | | 2.850 | % | | | 10/01/26 | | | | 100,000 | | | | 100,777 | |
DTE Energy Co. | | | 2.950 | % | | | 03/01/30 | | | | 125,000 | | | | 123,605 | |
Entergy Corp. | | | 2.950 | % | | | 09/01/26 | | | | 50,000 | | | | 50,755 | |
MidAmerican Energy Co. | | | 3.650 | % | | | 04/15/29 | | | | 350,000 | | | | 382,218 | |
Northern States Power Co. of Minnesota | | | 2.900 | % | | | 03/01/50 | | | | 125,000 | | | | 119,066 | |
PECO Energy Co. (b) | | | 3.000 | % | | | 09/15/49 | | | | 200,000 | | | | 191,614 | |
PPL Electric Utilities | | | 3.000 | % | | | 10/01/49 | | | | 160,000 | | | | 152,429 | |
Public Service Electric | | | 2.250 | % | | | 09/15/26 | | | | 100,000 | | | | 99,029 | |
Southwestern Electric Power | | | 2.750 | % | | | 10/01/26 | | | | 100,000 | | | | 100,024 | |
WEC Energy Group, Inc. | | | 3.375 | % | | | 06/15/21 | | | | 50,000 | | | | 50,998 | |
| | | | | | | | | | | | | | | | 1,753,068 | |
Energy — 0.9% |
Cimarex Energy Co. | | | 3.900 | % | | | 05/15/27 | | | | 100,000 | | | | 103,361 | |
Diamondback Energy, Inc., Class B | | | 3.250 | % | | | 12/01/26 | | | | 200,000 | | | | 202,211 | |
Energy Transfer Operating LP | | | 4.500 | % | | | 04/15/24 | | | | 75,000 | | | | 79,785 | |
Occidental Petroleum Corp. | | | 2.700 | % | | | 08/15/22 | | | | 225,000 | | | | 227,285 | |
Phillips 66 Partners LP | | | 2.450 | % | | | 12/15/24 | | | | 100,000 | | | | 99,988 | |
Phillips 66 Partners LP | | | 3.550 | % | | | 10/01/26 | | | | 100,000 | | | | 104,656 | |
Shell International Finance BV | | | 6.375 | % | | | 12/15/38 | | | | 73,000 | | | | 106,300 | |
Total Capital International SA | | | 2.829 | % | | | 01/10/30 | | | | 120,000 | | | | 123,169 | |
Valero Energy Corp. | | | 3.400 | % | | | 09/15/26 | | | | 100,000 | | | | 104,714 | |
| | | | | | | | | | | | | | | | 1,151,469 | |
| | Coupon | | | Maturity | | | Shares /
Par Value | | | Fair
Value | |
Insurance — 0.5% |
Jackson National Life Global Funding (3MO LIBOR + 48) (a)(c) | | | 2.368 | % | | | 06/11/21 | | | $ | 50,000 | | | $ | 50,186 | |
Jackson National Life Global Funding (b)(c) | | | 2.100 | % | | | 10/25/21 | | | | 50,000 | | | | 50,109 | |
Lincoln National Corp. | | | 3.625 | % | | | 12/12/26 | | | | 100,000 | | | | 105,570 | |
New York Life Global Funding (c) | | | 2.900 | % | | | 01/17/24 | | | | 100,000 | | | | 103,104 | |
New York Life Global Funding (c) | | | 2.350 | % | | | 07/14/26 | | | | 50,000 | | | | 50,036 | |
Pricoa Global Funding (c) | | | 3.450 | % | | | 09/01/23 | | | | 160,000 | | | | 167,640 | |
Principal Life Global Funding II (c) | | | 2.375 | % | | | 11/21/21 | | | | 100,000 | | | | 100,538 | |
| | | | | | | | | | | | | | | | 627,183 | |
Natural Gas — 0.3% |
Atmos Energy Corp. | | | 2.625 | % | | | 09/15/29 | | | | 310,000 | | | | 312,995 | |
REITS — 1.4% |
Alexandria Real Estate Equities, Inc. | | | 3.950 | % | | | 01/15/28 | | | | 100,000 | | | | 107,321 | |
American Campus Communities, Inc. | | | 3.625 | % | | | 11/15/27 | | | | 100,000 | | | | 105,361 | |
American Homes 4 Rent | | | 4.250 | % | | | 02/15/28 | | | | 100,000 | | | | 106,405 | |
Boston Properties LP | | | 2.750 | % | | | 10/01/26 | | | | 50,000 | | | | 50,663 | |
CubeSmart LP | | | 3.125 | % | | | 09/01/26 | | | | 50,000 | | | | 50,817 | |
CubeSmart LP | | | 3.000 | % | | | 02/15/30 | | | | 280,000 | | | | 276,447 | |
ERP Operating LP | | | 2.850 | % | | | 11/01/26 | | | | 100,000 | | | | 102,527 | |
ERP Operating LP | | | 2.500 | % | | | 02/15/30 | | | | 150,000 | | | | 148,706 | |
Life Storage LP | | | 3.875 | % | | | 12/15/27 | | | | 100,000 | | | | 105,363 | |
Realty Income Corp. | | | 3.875 | % | | | 04/15/25 | | | | 100,000 | | | | 107,748 | |
Realty Income Corp. | | | 3.000 | % | | | 01/15/27 | | | | 100,000 | | | | 103,173 | |
Simon Property Group LP | | | 2.000 | % | | | 09/13/24 | | | | 320,000 | | | | 318,172 | |
Spirit Realty LP | | | 4.450 | % | | | 09/15/26 | | | | 100,000 | | | | 107,369 | |
Spirit Realty LP | | | 4.000 | % | | | 07/15/29 | | | | 60,000 | | | | 63,104 | |
| | | | | | | | | | | | | | | | 1,753,176 | |
Technology — 0.4% |
Apple, Inc. | | | 3.000 | % | | | 06/20/27 | | | | 100,000 | | | | 104,711 | |
Apple, Inc. | | | 2.200 | % | | | 09/11/29 | | | | 250,000 | | | | 244,928 | |
Dell International LLC (b)(c) | | | 5.300 | % | | | 10/01/29 | | | | 100,000 | | | | 112,607 | |
| | | | | | | | | | | | | | | | 462,246 | |
80 DIAMOND HILL FUNDS | ANNUAL REPORT | DECEMBER 31, 2019 | DIAMOND-HILL.COM |
Diamond Hill Core Bond Fund
Schedule of Investments (Continued)
December 31, 2019
| | Coupon | | | Maturity | | | Shares /
Par Value | | | Fair
Value | |
Corporate Credit — 16.4% continued |
Transportation — 0.4% |
Continental Airlines Pass-Through Trust, Series 2012-1, Class B | | | 6.250 | % | | | 10/11/21 | | | $ | 25,591 | | | $ | 25,798 | |
CSX Corp. | | | 4.250 | % | | | 11/01/66 | | | | 100,000 | | | | 106,542 | |
Kirby Corp. | | | 4.200 | % | | | 03/01/28 | | | | 100,000 | | | | 105,637 | |
Southwest Airlines Co. | | | 3.000 | % | | | 11/15/26 | | | | 100,000 | | | | 102,414 | |
U.S. Airways Pass-Through Trust, Series 2011-1, Class A | | | 7.125 | % | | | 04/22/25 | | | | 36,946 | | | | 41,475 | |
United Airlines Pass-Through Trust, Series 2013-1, Class B | | | 5.375 | % | | | 02/15/23 | | | | 32,452 | | | | 33,606 | |
United Airlines Pass-Through Trust, Series 2007-1, Class A | | | 6.636 | % | | | 01/02/24 | | | | 31,569 | | | | 33,520 | |
| | | | | | | | | | | | | | | | 448,992 | |
Total Corporate Credit | | $ | 20,061,303 | |
Government Related — 0.5% |
Government Guaranteed — 0.4% |
Tunisian Republic | | | 1.416 | % | | | 08/05/21 | | | | 500,000 | | | | 491,150 | |
Government Owned, No Guarantee — 0.1% |
Tennessee Valley Authority | | | 4.625 | % | | | 09/15/60 | | | | 125,000 | | | | 171,149 | |
Total Government Related | | $ | 662,299 | |
Securitized — 58.1% |
ABS-Other — 4.3% |
BXG Receivables Note Trust, Series 2012-A, Class B (c) | | | 3.990 | % | | | 12/02/27 | | | | 34,553 | | | | 34,550 | |
Diamond Resorts Owner Trust, Series 2019-1A, Class B (c) | | | 3.530 | % | | | 02/20/32 | | | | 265,198 | | | | 264,885 | |
FMC GMSR Issuer Trust, Series 2019-GT2, Class A (c) | | | 4.230 | % | | | 09/25/24 | | | | 400,000 | | | | 396,494 | |
FORA Financial Asset Securitization LLC, Series 2019-1, Class A (c) | | | 4.018 | % | | | 10/15/24 | | | | 200,000 | | | | 202,386 | |
Gold Key Resorts LLC, Series 2014-A, Class A (c) | | | 3.220 | % | | | 03/17/31 | | | | 34,124 | | | | 34,141 | |
| | Coupon | | | Maturity | | | Shares /
Par Value | | | Fair
Value | |
ABS-Other — 4.3% continued |
GoodGreen Trust, Series 2017-1A, Class A (c) | | | 3.740 | % | | | 10/15/52 | | | $ | 97,373 | | | $ | 100,321 | |
Helios Issuer LLC, Series 2019-AA, Class A (c) | | | 3.750 | % | | | 06/20/46 | | | | 138,316 | | | | 138,475 | |
Hero Funding Trust, Series 2016-2A, Class A (c) | | | 3.750 | % | | | 09/20/41 | | | | 108,632 | | | | 110,661 | |
Hero Funding Trust, Series 2016-3A, Class A1 (c) | | | 3.080 | % | | | 09/20/42 | | | | 185,428 | | | | 186,120 | |
Hero Funding Trust, Series 2016-3B, Class B (c) | | | 5.240 | % | | | 09/20/42 | | | | 31,139 | | | | 31,600 | |
Hero Funding Trust, Series 2016-1R, Class A1 (c) | | | 4.500 | % | | | 09/21/42 | | | | 24,835 | | | | 24,781 | |
Hero Funding Trust, Series 2016-4A, Class A1 (c) | | | 3.570 | % | | | 09/20/47 | | | | 101,366 | | | | 103,770 | |
Hero Funding Trust, Series 2016-4B, Class B (c) | | | 4.990 | % | | | 09/20/47 | | | | 44,612 | | | | 45,221 | |
Hero Funding Trust, Series 2017-3A, Class A1 (c) | | | 3.190 | % | | | 09/20/48 | | | | 101,973 | | | | 101,643 | |
Hero Funding Trust, Series 2018-1A, Class A2 (c) | | | 4.670 | % | | | 09/20/48 | | | | 109,435 | | | | 113,808 | |
Kabbage Funding LLC, Series 2019-1, Class C (c) | | | 4.611 | % | | | 03/15/24 | | | | 100,000 | | | | 101,144 | |
LTCG Securitization, Series 2018-A, Class A (c) | | | 4.590 | % | | | 06/15/48 | | | | 76,478 | | | | 77,066 | |
MarketPlace Loan Trust, Series 2017-BS1, Class A (c) | | | 3.500 | % | | | 01/18/22 | | | | 17,796 | | | | 17,799 | |
Mill City Solar Loan Ltd., Series 2019-2GS, Class A (c) | | | 3.690 | % | | | 07/20/43 | | | | 236,406 | | | | 238,796 | |
Mosaic Solar Loans LLC, Series 2018-1A, Class A (c) | | | 4.010 | % | | | 06/22/43 | | | | 137,324 | | | | 140,935 | |
Mosaic Solar Loans LLC, Series 2017-2A, Class B (c) | | | 4.770 | % | | | 06/22/43 | | | | 82,883 | | | | 84,782 | |
Newtek Small Business Loan Trust, Series 2018-1, Class B (1MO LIBOR + 300) (a)(c) | | | 4.792 | % | | | 02/25/44 | | | | 164,225 | | | | 165,541 | |
DIAMOND HILL FUNDS | ANNUAL REPORT | DECEMBER 31, 2019 | DIAMOND-HILL.COM 81 |
Diamond Hill Core Bond Fund
Schedule of Investments (Continued)
December 31, 2019
| | Coupon | | | Maturity | | | Shares /
Par Value | | | Fair
Value | |
Securitized — 58.1% continued |
ABS-Other — 4.3% continued |
NFAS LLC, Series 2019-1, Class A (c) | | | 4.172 | % | | | 08/15/24 | | | $ | 400,000 | | | $ | 402,466 | |
Octane Receivables Trust, Series 2019-1A, Class A (c) | | | 3.160 | % | | | 09/20/23 | | | | 200,000 | | | | 199,846 | |
Ocwen Master Advance Receivables, Series 19-T1, Class DT1 (c) | | | 3.107 | % | | | 08/15/50 | | | | 400,000 | | | | 401,091 | |
OnDeck Asset Securitization Trust, Series 2018-1A, Class B (c) | | | 4.020 | % | | | 04/18/22 | | | | 100,000 | | | | 100,105 | |
Renew Financial LLC, Series 2017-1A, Class A (c) | | | 3.670 | % | | | 09/20/52 | | | | 114,852 | | | | 117,780 | |
Renew Financial LLC, Series 2017-1A, Class B (c) | | | 5.750 | % | | | 09/20/52 | | | | 57,734 | | | | 57,509 | |
Renew Financial LLC, Series 2017-2A, Class A (c)(d) | | | 3.220 | % | | | 09/22/53 | | | | 66,852 | | | | 68,829 | |
SFS Asset Securitization LLC, Series 2019-1, Class A (c) | | | 4.238 | % | | | 06/10/25 | | | | 150,000 | | | | 150,374 | |
SFS Asset Securitization LLC, Series 2019-1, Class B (c) | | | 5.023 | % | | | 06/10/25 | | | | 150,000 | | | | 150,366 | |
Small Business Lending Trust, Series 2019-A, Class A (c) | | | 2.850 | % | | | 07/15/26 | | | | 336,542 | | | | 336,550 | |
TES LLC, Series 2017-1A, Class A (c) | | | 4.330 | % | | | 10/20/47 | | | | 290,441 | | | | 289,256 | |
Westgate Resorts, Series 2018-1A, Class B (c) | | | 3.580 | % | | | 12/20/31 | | | | 149,567 | | | | 151,106 | |
Westgate Resorts, Series 2018-1A, Class C (c) | | | 4.100 | % | | | 12/20/31 | | | | 149,567 | | | | 151,027 | |
| | | | | | | | | | | | | | | | 5,291,224 | |
Agency CMBS — 2.2% |
FNMA, Pool #FN AE0834 (a) | | | 4.135 | % | | | 01/01/21 | | | | 29,081 | | | | 29,584 | |
FNMA, Pool #FN AN2213 | | | 2.810 | % | | | 07/01/26 | | | | 694,984 | | | | 704,240 | |
FNMA, Series 2019-M21, Class 1A1 | | | 1.950 | % | | | 04/25/28 | | | | 594,018 | | | | 585,376 | |
| | Coupon | | | Maturity | | | Shares /
Par Value | | | Fair
Value | |
Agency CMBS — 2.2% continued |
FNMA, Pool #FN 464107 | | | 4.820 | % | | | 12/01/29 | | | $ | 139,633 | | | $ | 155,997 | |
FNMA, Pool #FN AM9491 | | | 3.550 | % | | | 08/01/30 | | | | 177,457 | | | | 191,789 | |
FNMA, Pool #FN 469130 | | | 4.870 | % | | | 10/01/41 | | | | 132,467 | | | | 144,955 | |
FNMA, Pool #FN AM5015 | | | 4.940 | % | | | 12/01/43 | | | | 779,888 | | | | 910,732 | |
| | | | | | | | | | | | | | | | 2,722,673 | |
Agency MBS CMO — 19.8% |
FHLMC, Pool #FG S20432, Series 306, Class F3 (1MO LIBOR + 30) (a) | | | 2.040 | % | | | 05/15/28 | | | | 113,957 | | | | 114,078 | |
FHLMC, Series 2018-1, Class A2 (c) | | | 3.500 | % | | | 06/25/28 | | | | 200,000 | | | | 207,074 | |
FHLMC, Series 2646, Class ZH | | | 5.000 | % | | | 07/15/33 | | | | 113,426 | | | | 138,025 | |
FHLMC, Series 2814, Class PH | | | 6.000 | % | | | 06/15/34 | | | | 48,634 | | | | 55,185 | |
FHLMC, Series 4265, Class FD (1MO LIBOR + 40) (a) | | | 2.140 | % | | | 01/15/35 | | | | 454,102 | | | | 452,920 | |
FHLMC, Series 4613, Class AF (1MO LIBOR + 110) (a) | | | 2.840 | % | | | 11/15/37 | | | | 128,532 | | | | 130,779 | |
FHLMC, Series 3605, Class PB | | | 4.500 | % | | | 11/15/39 | | | | 100,000 | | | | 108,101 | |
FHLMC, Series 3617, Class PC | | | 4.500 | % | | | 12/15/39 | | | | 109,000 | | | | 120,178 | |
FHLMC, Series 3740, Class FC (1MO LIBOR + 50) (a) | | | 2.240 | % | | | 10/15/40 | | | | 211,716 | | | | 211,416 | |
FHLMC, Series 3811, Class TA (a) | | | 5.000 | % | | | 02/15/41 | | | | 262,142 | | | | 304,218 | |
FHLMC, Series 3895, Class BF (1MO LIBOR + 50) (a) | | | 2.240 | % | | | 07/15/41 | | | | 152,951 | | | | 152,448 | |
FHLMC, Series 4116, Class UB | | | 2.500 | % | | | 05/15/42 | | | | 440,000 | | | | 407,939 | |
FHLMC, Series 263, Class F5 (1MO LIBOR + 50) (a) | | | 2.240 | % | | | 06/15/42 | | | | 663,217 | | | | 658,339 | |
FHLMC, Series 4180, Class ZB | | | 3.000 | % | | | 03/15/43 | | | | 880,456 | | | | 896,103 | |
FHLMC, Series 4210, Class Z | | | 3.000 | % | | | 05/15/43 | | | | 362,611 | | | | 355,801 | |
82 DIAMOND HILL FUNDS | ANNUAL REPORT | DECEMBER 31, 2019 | DIAMOND-HILL.COM |
Diamond Hill Core Bond Fund
Schedule of Investments (Continued)
December 31, 2019
| | Coupon | | | Maturity | | | Shares /
Par Value | | | Fair
Value | |
Securitized — 58.1% continued |
Agency MBS CMO — 19.8% continued |
FHLMC, Series 4830, Class DA | | | 4.500 | % | | | 11/15/44 | | | $ | 319,771 | | | $ | 328,359 | |
FHLMC, Series 4731, Class EA | | | 3.000 | % | | | 10/15/45 | | | | 405,021 | | | | 413,515 | |
FHLMC, Series 4377, Class KZ (a) | | | 3.500 | % | | | 02/15/52 | | | | 751,205 | | | | 801,823 | |
FNMA, Series 1994-4, Class ZC | | | 6.500 | % | | | 01/25/24 | | | | 31,526 | | | | 33,724 | |
FNMA, Series 2012-129, Class HT | | | 2.000 | % | | | 12/25/32 | | | | 81,672 | | | | 75,315 | |
FNMA, Series 2002-86, Class PG | | | 6.000 | % | | | 12/25/32 | | | | 94,331 | | | | 106,863 | |
FNMA, Series 2004-56, Class Z | | | 7.500 | % | | | 03/25/34 | | | | 192,877 | | | | 225,523 | |
FNMA, Series 2004-17, Class BA | | | 6.000 | % | | | 04/25/34 | | | | 204,117 | | | | 256,226 | |
FNMA, Series 2005-3, Class CG | | | 5.500 | % | | | 02/25/35 | | | | 201,078 | | | | 226,045 | |
FNMA, Series 2006-56, Class DC (1MO LIBOR + 65) (a) | | | 2.442 | % | | | 07/25/36 | | | | 159,755 | | | | 160,334 | |
FNMA, Series 2009-19, Class TD | | | 5.000 | % | | | 08/25/36 | | | | 86,952 | | | | 97,726 | |
FNMA, Series 2006-108, Class FD (1MO LIBOR + 38) (a) | | | 2.172 | % | | | 11/25/36 | | | | 189,231 | | | | 188,657 | |
FNMA, Series 2007-39, Class NB | | | 4.250 | % | | | 05/25/37 | | | | 178,988 | | | | 193,095 | |
FNMA, Series 2008-60, Class JC | | | 5.000 | % | | | 07/25/38 | | | | 296,159 | | | | 325,858 | |
FNMA, Series 2009-103, Class MB (a) | | | 4.432 | % | | | 12/25/39 | | | | 65,912 | | | | 68,683 | |
FNMA, Series 2010-2, Class LC | | | 5.000 | % | | | 02/25/40 | | | | 200,000 | | | | 227,688 | |
FNMA, Series 2011-14, Class PB | | | 5.000 | % | | | 03/25/41 | | | | 570,000 | | | | 648,229 | |
FNMA, Series 2011-57, Class PD | | | 4.000 | % | | | 07/25/41 | | | | 321,407 | | | | 355,561 | |
FNMA, Series 11 62, Class UA | | | 4.500 | % | | | 07/25/41 | | | | 1,145,843 | | | | 1,280,944 | |
FNMA, Series 2012-9, Class FC (1MO LIBOR + 40) (a) | | | 2.192 | % | | | 02/25/42 | | | | 90,069 | | | | 89,883 | |
FNMA, Series 2012-79, Class QB | | | 2.000 | % | | | 07/25/42 | | | | 363,000 | | | | 353,674 | |
FNMA, Series 411, Class A3 | | | 3.000 | % | | | 08/25/42 | | | | 76,843 | | | | 77,914 | |
FNMA, Series 12 84, Class JL | | | 2.000 | % | | | 08/25/42 | | | | 290,004 | | | | 256,986 | |
FNMA, Series 4102, Class CP | | | 2.000 | % | | | 09/15/42 | | | | 38,858 | | | | 38,482 | |
| | Coupon | | | Maturity | | | Shares /
Par Value | | | Fair
Value | |
Agency MBS CMO — 19.8% continued |
FNMA, Series 2012-99, Class UY | | | 2.500 | % | | | 09/25/42 | | | $ | 329,000 | | | $ | 314,264 | |
FNMA, Series 2013-35, Class LP | | | 3.000 | % | | | 01/25/43 | | | | 352,000 | | | | 362,325 | |
FNMA, Series 2013-35, Class CV | | | 3.000 | % | | | 02/25/43 | | | | 350,000 | | | | 361,843 | |
FNMA, Series 13 6, Class QA | | | 2.500 | % | | | 02/25/43 | | | | 846,171 | | | | 790,166 | |
FNMA, Series 13 31, Class NT | | | 3.000 | % | | | 04/25/43 | | | | 353,161 | | | | 355,907 | |
FNMA, Series 2013-104, Class CY | | | 5.000 | % | | | 10/25/43 | | | | 250,000 | | | | 296,566 | |
FNMA, Series 2013-115, Class PB | | | 4.500 | % | | | 11/25/43 | | | | 300,000 | | | | 347,415 | |
FNMA, Series 2017-58, Class CZ | | | 3.000 | % | | | 08/25/47 | | | | 470,133 | | | | 464,462 | |
FNMA, Series 2018-31, Class KB | | | 3.500 | % | | | 05/25/48 | | | | 247,826 | | | | 255,945 | |
FNMA, Series 2019-8, Class ZD | | | 3.500 | % | | | 03/25/49 | | | | 514,776 | | | | 535,647 | |
GNMA, Series 2004-49, Class MZ | | | 6.000 | % | | | 06/20/34 | | | | 331,252 | | | | 388,232 | |
GNMA, Series 2005-13, Class BG | | | 5.000 | % | | | 02/20/35 | | | | 170,000 | | | | 191,226 | |
GNMA, Series 2015-123, Class VB | | | 3.500 | % | | | 09/20/35 | | | | 100,000 | | | | 104,104 | |
GNMA, Series 2006-17, Class JN | | | 6.000 | % | | | 04/20/36 | | | | 309,936 | | | | 344,601 | |
GNMA, Series 2008-51, Class PH | | | 5.250 | % | | | 06/20/38 | | | | 199,694 | | | | 217,523 | |
GNMA, Series 2009-2, Class PA | | | 5.000 | % | | | 12/20/38 | | | | 84,416 | | | | 90,249 | |
GNMA, Series 2010-9, Class FA (1MO LIBOR + 52) (a) | | | 2.260 | % | | | 01/16/40 | | | | 197,842 | | | | 198,932 | |
GNMA, Series 2010-105, Class ZC | | | 4.500 | % | | | 08/16/40 | | | | 456,230 | | | | 517,499 | |
GNMA, Series 2011-93, Class WB | | | 4.000 | % | | | 03/20/41 | | | | 3,926 | | | | 3,917 | |
GNMA, Series 2013-22, Class GA | | | 2.500 | % | | | 10/20/41 | | | | 83,527 | | | | 80,725 | |
GNMA, Series 2012-74, Class LY | | | 2.500 | % | | | 06/20/42 | | | | 225,000 | | | | 211,245 | |
| |
GNMA, Series 12-134, Class KM | | | 2.000 | % | | | 09/20/42 | | | | 342,000 | | | | 304,661 | |
GNMA, Series 2012-113, Class NZ | | | 4.500 | % | | | 09/20/42 | | | | 252,055 | | | | 283,544 | |
DIAMOND HILL FUNDS | ANNUAL REPORT | DECEMBER 31, 2019 | DIAMOND-HILL.COM 83 |
Diamond Hill Core Bond Fund
Schedule of Investments (Continued)
December 31, 2019
| | Coupon | | | Maturity | | | Shares /
Par Value | | | Fair
Value | |
Securitized — 58.1% continued |
Agency MBS CMO — 19.8% continued |
GNMA, Series 2012-143, Class EG | | | 2.000 | % | | | 12/20/42 | | | $ | 973,942 | | | $ | 907,699 | |
GNMA, Series 13 5, Class GY | | | 3.000 | % | | | 01/20/43 | | | | 437,000 | | | | 439,737 | |
GNMA, Series 2013-6, Class PE | | | 2.000 | % | | | 01/20/43 | | | | 100,000 | | | | 89,553 | |
GNMA, Series 2015-179, Class ZB | | | 2.500 | % | | | 02/20/45 | | | | 54,474 | | | | 50,696 | |
GNMA, Series 2016-37, Class YA | | | 3.000 | % | | | 12/20/45 | | | | 1,052,917 | | | | 1,055,655 | |
GNMA, Series 2016-38, Class ZP | | | 3.500 | % | | | 03/20/46 | | | | 68,402 | | | | 65,964 | |
GNMA, Series 2016-111, Class HA | | | 2.500 | % | | | 08/20/46 | | | | 206,460 | | | | 189,495 | |
GNMA, Series 2019-20, Class JK | | | 3.500 | % | | | 02/20/49 | | | | 370,686 | | | | 388,771 | |
GNMA, Series 2019-86, Class WL | | | 3.000 | % | | | 07/20/49 | | | | 500,000 | | | | 492,943 | |
GNMA, Series 2019-99, Class EW | | | 3.000 | % | | | 08/20/49 | | | | 540,446 | | | | 533,595 | |
GNMA, Series 2019-99, Class GP | | | 3.500 | % | | | 08/20/49 | | | | 517,000 | | | | 541,212 | |
GNMA, Series 2017-H18, Class EB (12MO LIBOR + 22) (a) | | | 4.267 | % | | | 06/20/63 | | | | 364,859 | | | | 387,374 | |
GNMA, Series 2014-H15, Class FA (1MO LIBOR + 50) (a) | | | 2.274 | % | | | 07/20/64 | | | | 99,137 | | | | 98,944 | |
GNMA, Series 2014-H14, Class FA (1MO LIBOR + 50) (a) | | | 2.497 | % | | | 07/20/64 | | | | 138,898 | | | | 138,664 | |
GNMA, Series 2016-H11, Class FD (12MO LIBOR + 40) (a) | | | 3.130 | % | | | 05/20/66 | | | | 284,815 | | | | 284,707 | |
GNMA, Series 2017-H16, Class DB (a) | | | 4.443 | % | | | 08/20/67 | | | | 266,943 | | | | 278,275 | |
Vendee Mortgage Trust, Series 1995-3, Class 1Z | | | 7.250 | % | | | 09/15/25 | | | | 46,944 | | | | 51,950 | |
| | | | | | | | | | | | | | | | 24,159,943 | |
| | Coupon | | | Maturity | | | Shares /
Par Value | | | Fair
Value | |
Agency MBS CMO Derivatives — 3.6% |
FHLMC, Series 3994, Class EI (IO) | | | 3.000 | % | | | 02/15/22 | | | $ | 299,280 | | | $ | 6,736 | |
FHLMC, Series 3874, Class KI (IO) | | | 4.500 | % | | | 08/15/25 | | | | 144,752 | | | | 2,761 | |
FHLMC, Series 4214, Class CI (IO) | | | 3.000 | % | | | 06/15/31 | | | | 1,560,902 | | | | 87,126 | |
FHLMC, Series 4114, Class IM (IO) | | | 3.500 | % | | | 07/15/31 | | | | 2,717,595 | | | | 206,559 | |
FHLMC, Series 3102, Class TA | | | 7.500 | % | | | 01/15/36 | | | | 267,133 | | | | 298,993 | |
FHLMC, Series 3607, Class AO (PO) | | | 0.000 | % | | | 04/15/36 | | | | 144,266 | | | | 126,267 | |
FHLMC, Series 237, Class S14 (IO) (-1*1MO LIBOR + 660) (a) | | | 4.860 | % | | | 05/15/36 | | | | 636,103 | | | | 118,809 | |
FHLMC, Series 3199, Class OC (PO) | | | 0.000 | % | | | 08/15/36 | | | | 230,178 | | | | 203,257 | |
FHLMC, Series 3318, Class AO (PO) | | | 0.000 | % | | | 05/15/37 | | | | 6,715 | | | | 6,061 | |
FHLMC, Series 379, Class I (PO) | | | 0.000 | % | | | 05/25/37 | | | | 83,398 | | | | 74,904 | |
FHLMC, Series 3607, Class OP (PO) | | | 0.000 | % | | | 07/15/37 | | | | 186,680 | | | | 161,546 | |
FHLMC, Series 3594, Class SP (1MO LIBOR + 184.6) (a) | | | 3.586 | % | | | 12/15/37 | | | | 33,316 | | | | 34,938 | |
FNMA, Series 2012-128, Class EI (IO) | | | 3.500 | % | | | 11/25/27 | | | | 776,556 | | | | 57,096 | |
FNMA, Series 2012-148, Class IA (IO) | | | 4.000 | % | | | 01/25/28 | | | | 417,426 | | | | 39,548 | |
FNMA, Series 348, Class II (IO) | | | 6.000 | % | | | 01/25/34 | | | | 131,643 | | | | 31,256 | |
FNMA, Series 2015-82, Class AI (IO) | | | 3.500 | % | | | 06/25/34 | | | | 1,849,489 | | | | 190,710 | |
FNMA, Series 2005-45, Class PQ (IO) (-1*1MO LIBOR + 550) (a) | | | 3.708 | % | | | 10/25/34 | | | | 401,156 | | | | 27,125 | |
FNMA, Series 390, Class 32 (IO) | | | 6.500 | % | | | 12/25/34 | | | | 194,751 | | | | 39,879 | |
FNMA, Series 2016-28, Class DI (IO) | | | 3.500 | % | | | 03/25/35 | | | | 1,853,266 | | | | 201,561 | |
FNMA, Series 2016-24, Class KI (IO) | | | 3.500 | % | | | 07/25/35 | | | | 859,788 | | | | 100,450 | |
84 DIAMOND HILL FUNDS | ANNUAL REPORT | DECEMBER 31, 2019 | DIAMOND-HILL.COM |
Diamond Hill Core Bond Fund
Schedule of Investments (Continued)
December 31, 2019
| | Coupon | | | Maturity | | | Shares /
Par Value | | | Fair
Value | |
Securitized — 58.1% continued |
Agency MBS CMO Derivatives — 3.6% continued |
FNMA, Series 2006-96, Class MO (PO) | | | 0.000 | % | | | 10/25/36 | | | $ | 85,427 | | | $ | 79,193 | |
FNMA, Series 2013-120, Class JI (IO) | | | 4.000 | % | | | 02/25/40 | | | | 985,175 | | | | 51,772 | |
FNMA, Series 2010-44, Class CS (IO) (-1*1MO LIBOR + 655) (a) | | | 4.758 | % | | | 05/25/40 | | | | 146,160 | | | | 18,314 | |
FNMA, Series 2012-63, Class NI (IO) | | | 4.000 | % | | | 06/25/40 | | | | 2,662,556 | | | | 166,602 | |
FNMA, Series 2011-14, Class PI (IO) | | | 5.000 | % | | | 06/25/40 | | | | 179,413 | | | | 13,039 | |
FNMA, Series 2012-100, Class MI (IO) | | | 4.500 | % | | | 12/25/40 | | | | 808,597 | | | | 62,654 | |
FNMA, Series 2013-82, Class SB (-2.67*1MO LIBOR + 1173) (a) | | | 6.983 | % | | | 08/25/43 | | | | 406,211 | | | | 485,510 | |
FNMA, Series 2013-101, Class DO (PO) | | | 0.000 | % | | | 10/25/43 | | | | 204,513 | | | | 177,116 | |
FNMA, Series 2014-42, Class SN (IO) (-1*1MO LIBOR + 605) (a) | | | 4.258 | % | | | 07/25/44 | | | | 925,318 | | | | 159,744 | |
GMNA, Series 2019-98, Class BI (IO) | | | 3.000 | % | | | 06/20/49 | | | | 847,484 | | | | 309,565 | |
GNMA, Series 2010-47, Class PX (IO) (-1*1MO LIBOR + 670) (a) | | | 4.935 | % | | | 06/20/37 | | | | 686,150 | | | | 104,810 | |
GNMA, Series 2008-38, Class ID (IO) | | | 6.000 | % | | | 03/20/38 | | | | 517,561 | | | | 58,900 | |
GNMA, Series 2008-40, Class SA (IO) (-1*1MO LIBOR + 640) (a) | | | 4.660 | % | | | 05/16/38 | | | | 79,476 | | | | 11,969 | |
GNMA, Series 2013-124, Class ES (-1.333 X 1MO LIBOR + 866.7) (a) | | | 6.314 | % | | | 04/20/39 | | | | 232,171 | | | | 235,308 | |
GNMA, Series 2011-145, Class QI (IO) | | | 5.000 | % | | | 11/16/41 | | | | 316,525 | | | | 53,658 | |
GNMA, Series 2013-113, Class QS (IO) (-1*1MO LIBOR + 620) (a) | | | 4.435 | % | | | 02/20/42 | | | | 1,059,665 | | | | 184,898 | |
GNMA, Series 2014-141, Class IE (IO) | | | 4.000 | % | | | 08/20/43 | | | | 469,058 | | | | 27,895 | |
| | Coupon | | | Maturity | | | Shares /
Par Value | | | Fair
Value | |
Agency MBS CMO Derivatives — 3.6% continued |
GNMA, Series 2012-H02, Class AI (IO) (a) | | | 1.886 | % | | | 01/20/62 | | | $ | 226,428 | | | $ | 11,282 | |
GNMA, Series 2013-H13, Class T1 (IO) (a) | | | 0.474 | % | | | 05/20/63 | | | | 2,431,385 | | | | 37,247 | |
GNMA, Series 2016-H20, Class GI (IO) (a) | | | 0.103 | % | | | 08/20/66 | | | | 2,514,454 | | | | 25,930 | |
GNMA, Series 2017-H11, Class PI (IO) (a) | | | 2.152 | % | | | 04/20/67 | | | | 481,351 | | | | 6,597 | |
GNMA, Series 2017-H22, Class ID (IO) (a) | | | 2.139 | % | | | 11/20/67 | | | | 221,704 | | | | 4,709 | |
GNMA, Series 2018-H08, Class NI (IO) (a) | | | 0.506 | % | | | 05/20/68 | | | | 1,493,550 | | | | 34,574 | |
| | | | | | | | | | | | | | | | 4,336,868 | |
Agency MBS Passthrough — 4.2% |
FHLMC, Pool #FG G06085 | | | 6.500 | % | | | 09/01/38 | | | | 93,767 | | | | 106,158 | |
FNMA, Pool #FN 252409 | | | 6.500 | % | | | 03/01/29 | | | | 125,982 | | | | 139,913 | |
FNMA, Pool #AS7287 | | | 3.500 | % | | | 06/01/31 | | | | 887,998 | | | | 930,969 | |
FNMA, Pool #FN AT7120 | | | 3.500 | % | | | 06/01/33 | | | | 196,209 | | | | 203,295 | |
FNMA, Pool #MA3050 | | | 4.500 | % | | | 06/01/37 | | | | 1,329,349 | | | | 1,416,056 | |
FNMA, Pool #FN AS4073 | | | 4.000 | % | | | 12/01/44 | | | | 263,812 | | | | 281,956 | |
FNMA, Pool #BN5247 | | | 5.000 | % | | | 02/01/49 | | | | 942,172 | | | | 1,006,417 | |
GNMA, Pool #GN 784279 | | | 5.500 | % | | | 11/15/38 | | | | 615,115 | | | | 691,980 | |
GNMA, Pool #GN 78541 | | | 4.500 | % | | | 06/15/46 | | | | 269,211 | | | | 292,360 | |
| | | | | | | | | | | | | | | | 5,069,104 | |
Auto Loan — 5.4% |
ACC Trust, Series 2018-1, Class A (c) | | | 3.700 | % | | | 12/21/20 | | | | 4,852 | | | | 4,855 | |
American Credit Acceptance Receivables Trust, Series 2017-1, Class D (c) | | | 3.540 | % | | | 03/13/23 | | | | 109,406 | | | | 110,168 | |
American Credit Acceptance Receivables Trust, Series 2017-1, Class E (c) | | | 5.440 | % | | | 03/13/24 | | | | 100,000 | | | | 102,017 | |
DIAMOND HILL FUNDS | ANNUAL REPORT | DECEMBER 31, 2019 | DIAMOND-HILL.COM 85 |
Diamond Hill Core Bond Fund
Schedule of Investments (Continued)
December 31, 2019
| | Coupon | | | Maturity | | | Shares /
Par Value | | | Fair
Value | |
Securitized — 58.1% continued |
Auto Loan — 5.4% continued |
American Credit Acceptance Receivables Trust, Series 2018-3, Class D (c) | | | 4.140 | % | | | 10/15/24 | | | $ | 100,000 | | | $ | 101,905 | |
Arivo Acceptance Auto Loan Receivables Trust, Series 2019-1, Class A (c) | | | 2.990 | % | | | 07/15/24 | | | | 171,670 | | | | 171,361 | |
Bank of the West Auto Trust, Series 2017-1, Class B (c) | | | 2.620 | % | | | 11/15/23 | | | | 100,000 | | | | 100,208 | |
California Republic Auto Receivables Trust, Series 2015-4, Class C (c) | | | 4.230 | % | | | 09/15/22 | | | | 100,000 | | | | 100,381 | |
CarNow Auto Receivables Trust, Series 2019-1A, Class C (c) | | | 3.360 | % | | | 06/17/24 | | | | 500,000 | | | | 498,489 | |
Carvana Auto Receivable Trust, Series 2019-3A, Class A2 (c) | | | 2.420 | % | | | 04/15/22 | | | | 500,000 | | | | 500,205 | |
Carvana Auto Receivable Trust, Series 2019-2A, Class D (c) | | | 3.280 | % | | | 01/15/25 | | | | 300,000 | | | | 302,555 | |
Carvana Auto Receivable Trust, Series 2019-3A, Class D (c) | | | 3.040 | % | | | 04/15/25 | | | | 270,000 | | | | 269,095 | |
Carvana Auto Receivable Trust, Series 2019-4A, Class D (c) | | | 3.070 | % | | | 07/15/25 | | | | 250,000 | | | | 249,698 | |
CPS Auto Trust, Series 2017-D, Class C (c) | | | 3.010 | % | | | 10/17/22 | | | | 100,000 | | | | 100,263 | |
CPS Auto Trust, Series 2019-A, Class D (c) | | | 4.350 | % | | | 12/16/24 | | | | 100,000 | | | | 103,249 | |
CPS Auto Trust, Series 2019-B, Class D (c) | | | 3.690 | % | | | 03/17/25 | | | | 100,000 | | | | 101,485 | |
CPS Auto Trust, Series 2019-C, Class C (c) | | | 2.840 | % | | | 06/16/25 | | | | 250,000 | | | | 251,063 | |
DT Auto Owner Trust, Series 2016-2A, Class D (c) | | | 5.430 | % | | | 11/15/22 | | | | 19,236 | | | | 19,349 | |
| | Coupon | | | Maturity | | | Shares /
Par Value | | | Fair
Value | |
Auto Loan — 5.4% continued |
First Investors Auto Owner Trust, Series 2017-3A, Class D (c) | | | 3.440 | % | | | 03/15/24 | | | $ | 132,000 | | | $ | 133,543 | |
GLS Auto Receivables Trust, Series 2019-3A, Class C (c) | | | 2.960 | % | | | 05/15/25 | | | | 250,000 | | | | 250,357 | |
Hertz Fleet Lease Funding LP, Series 2017-1, Class C (c) | | | 3.140 | % | | | 04/10/31 | | | | 172,000 | | | | 172,445 | |
Hertz Fleet Lease Funding LP, Series 2017-1, Class E (c) | | | 5.800 | % | | | 04/10/31 | | | | 100,000 | | | | 100,866 | |
Hertz Fleet Lease Funding LP, Series 2018-1, Class E (c) | | | 5.550 | % | | | 05/10/32 | | | | 250,000 | | | | 255,868 | |
Hertz Fleet Lease Funding LP, Series 2019-1, Class E (c) | | | 4.620 | % | | | 01/10/33 | | | | 100,000 | | | | 100,973 | |
Navistar Financial Dealer Note Master Trust, Series 2018-1, Class D (1MO LIBOR + 155) (a)(c) | | | 3.342 | % | | | 09/25/23 | | | | 150,000 | | | | 150,220 | |
Navistar Financial Dealer Note Master Trust, Series 2019-1, Class D (1MO LIBOR + 145) (a)(c) | | | 3.242 | % | | | 05/28/24 | | | | 285,000 | | | | 285,221 | |
NextGear Floorplan Master Owner Trust, Series 2018-1A, Class A1 (1MO LIBOR + 64) (a)(c) | | | 2.380 | % | | | 02/15/23 | | | | 150,000 | | | | 150,369 | |
OneMain Direct Auto Receivables Trust, Series 2017-2A, Class D (c) | | | 3.420 | % | | | 10/15/24 | | | | 500,000 | | | | 503,174 | |
OSCAR US Funding Trust, Series 2018-1A, Class A2B (1MO LIBOR + 49) (a)(c) | | | 2.205 | % | | | 04/12/21 | | | | 13,254 | | | | 13,256 | |
OSCAR US Funding Trust, Series 2019-2A, Class A2 (c) | | | 2.490 | % | | | 08/10/22 | | | | 225,000 | | | | 225,365 | |
Skopos Auto Receivables Trust, Series 2019-1A, Class A (c) | | | 2.900 | % | | | 12/15/22 | | | | 324,912 | | | | 325,430 | |
86 DIAMOND HILL FUNDS | ANNUAL REPORT | DECEMBER 31, 2019 | DIAMOND-HILL.COM |
Diamond Hill Core Bond Fund
Schedule of Investments (Continued)
December 31, 2019
| | Coupon | | | Maturity | | | Shares /
Par Value | | | Fair
Value | |
Securitized — 58.1% continued |
Auto Loan — 5.4% continued |
Skopos Auto Receivables Trust, Series 2019-1A, Class B (c) | | | 3.430 | % | | | 09/15/23 | | | $ | 600,000 | | | $ | 599,415 | |
Tesla Auto Lease Trust, Series 2018-B, Class D (c) | | | 5.290 | % | | | 11/22/21 | | | | 100,000 | | | | 103,173 | |
United Auto Credit Securitization Trust, Series 2018-2, Class D (c) | | | 4.260 | % | | | 05/10/23 | | | | 100,000 | | | | 101,305 | |
Veros Auto Receivables Trust, Series 2018-1, Class A (c) | | | 3.630 | % | | | 05/15/23 | | | | 22,736 | | | | 22,790 | |
| | | | | | | | | | | | | | | | 6,580,116 | |
Consumer — 3.6% |
Avant Loans Funding Trust, Series 2019-A, Class A (c) | | | 3.480 | % | | | 07/15/22 | | | | 40,525 | | | | 40,672 | |
Consumer Loan Underlying Bond Credit Trust, Series 2017-NP2, Class C (c) | | | 4.870 | % | | | 01/16/24 | | | | 149,371 | | | | 149,958 | |
Consumer Loan Underlying Bond Credit Trust, Series 2018-P3, Class A (c) | | | 3.820 | % | | | 01/15/26 | | | | 67,316 | | | | 67,889 | |
Consumer Loan Underlying Bond Credit Trust, Series 2019-P1, Class A (c) | | | 2.940 | % | | | 07/15/26 | | | | 106,791 | | | | 107,187 | |
Freedom Financial, Series 2018-1, Class B (c) | | | 4.560 | % | | | 07/18/24 | | | | 350,000 | | | | 355,799 | |
Freedom Financial, Series 2018-2, Class A (c) | | | 3.990 | % | | | 10/20/25 | | | | 53,316 | | | | 53,683 | |
Freedom Financial, Series 2019-1, Class B (c) | | | 3.870 | % | | | 06/18/26 | | | | 200,000 | | | | 202,538 | |
LendingPoint Asset Securitization Trust, Series 2019-1, Class A (c) | | | 3.154 | % | | | 08/15/25 | | | | 289,439 | | | | 289,892 | |
LendingPoint Asset Securitization Trust, Series 2019-1, Class B (c) | | | 3.613 | % | | | 08/15/25 | | | | 400,000 | | | | 399,151 | |
| | Coupon | | | Maturity | | | Shares /
Par Value | | | Fair
Value | |
Consumer — 3.6% continued |
Marlette Funding Trust, Series 2018-1A, Class B (c) | | | 3.190 | % | | | 03/15/28 | | | $ | 97,460 | | | $ | 97,561 | |
Newtek Small Business Loan Trust, Series 2019-01, Class B (1MO LIBOR + 250) (a)(c) | | | 4.292 | % | | | 12/25/44 | | | | 404,887 | | | | 404,886 | |
Oportun Funding LLC, Series 2018-D, Class B (c) | | | 4.830 | % | | | 12/09/24 | | | | 100,000 | | | | 101,983 | |
Prosper Marketplace Issuance Trust, Series 2019-3A, Class B (c) | | | 3.590 | % | | | 07/15/25 | | | | 150,000 | | | | 150,793 | |
Prosper Marketplace Issuance Trust, Series 2019-4A, Class B (c) | | | 3.200 | % | | | 02/17/26 | | | | 200,000 | | | | 199,681 | |
Regional Management Issuance Trust, Series 2019-1, Class C (c) | | | 4.110 | % | | | 11/15/28 | | | | 200,000 | | | | 199,343 | |
Republic Finance Issuance Trust, Series 2019-A, Class A (c) | | | 3.430 | % | | | 11/22/27 | | | | 300,000 | | | | 299,374 | |
Upgrade Master Pass-Thru Trust, Series 2019-ST1, Class A (c) | | | 4.000 | % | | | 07/15/25 | | | | 123,214 | | | | 123,769 | |
Upgrade Master Pass-Thru Trust, Series 2019-ST3, Class A (c) | | | 3.750 | % | | | 11/15/25 | | | | 177,948 | | | | 178,011 | |
Upgrade Receivables Trust, Series 2018-1A, Class A (c) | | | 3.760 | % | | | 11/15/24 | | | | 22,480 | | | | 22,529 | |
Upgrade Receivables Trust, Series 2019-1A, Class B (c) | | | 4.090 | % | | | 03/15/25 | | | | 100,000 | | | | 100,618 | |
Upstart Securitization Trust, Series 2019-1, Class B (c) | | | 4.190 | % | | | 04/20/26 | | | | 100,000 | | | | 100,785 | |
Upstart Securitization Trust, Series 2019-2, Class A (c) | | | 2.897 | % | | | 09/20/29 | | | | 251,705 | | | | 252,391 | |
DIAMOND HILL FUNDS | ANNUAL REPORT | DECEMBER 31, 2019 | DIAMOND-HILL.COM 87 |
Diamond Hill Core Bond Fund
Schedule of Investments (Continued)
December 31, 2019
| | Coupon | | | Maturity | | | Shares /
Par Value | | | Fair
Value | |
Securitized — 58.1% continued |
Consumer — 3.6% continued |
Upstart Securitization Trust, Series 2019-2, Class B (c) | | | 3.734 | % | | | 09/20/29 | | | $ | 325,000 | | | $ | 324,746 | |
Upstart Securitization Trust, Series 2019-3, Class B (c) | | | 3.829 | % | | | 01/21/30 | | | | 200,000 | | | | 200,014 | |
| | | | | | | | | | | | | | | | 4,423,253 | |
Credit Cards — 0.7% |
Continental Credit Card LLC, Series 2019-1A, Class A (c) | | | 3.830 | % | | | 08/15/26 | | | | 400,000 | | | | 402,728 | |
Continental Credit Card LLC, Series 2019-1A, Class B (c) | | | 4.950 | % | | | 08/15/26 | | | | 150,000 | | | | 151,119 | |
Fortiva Retail Credit Master Note, Series 2018-1, Class A (c) | | | 5.540 | % | | | 11/15/23 | | | | 150,000 | | | | 152,776 | |
Genesis Sales Finance Master Trust, Series 2019-AA, Class A (c) | | | 4.680 | % | | | 08/20/23 | | | | 100,000 | | | | 101,785 | |
| | | | | | | | | | | | | | | | 808,408 | |
Equipment — 1.8% |
Business Jet Securities LLC, Series 2018-1, Class A (c) | | | 4.335 | % | | | 02/15/33 | | | | 73,292 | | | | 74,077 | |
Business Jet Securities LLC, Series 2018-1, Class B (c) | | | 6.048 | % | | | 02/15/33 | | | | 64,504 | | | | 66,281 | |
Business Jet Securities LLC, Series 2018-2, Class A (c) | | | 4.447 | % | | | 06/15/33 | | | | 184,405 | | | | 187,090 | |
Business Jet Securities LLC, Series 2018-2, Class B (c) | | | 5.437 | % | | | 06/15/33 | | | | 77,152 | | | | 78,195 | |
Business Jet Securities LLC, Series 2019-1, Class B (c) | | | 5.193 | % | | | 07/15/34 | | | | 142,598 | | | | 144,443 | |
CAL Funding Ltd., Series 2018-1A, Class A (c) | | | 3.960 | % | | | 02/25/43 | | | | 285,833 | | | | 286,709 | |
| | Coupon | | | Maturity | | | Shares /
Par Value | | | Fair
Value | |
Equipment — 1.8% continued |
CLI Funding LLC, Series 2017-1A, Class A (c) | | | 3.620 | % | | | 05/18/42 | | | $ | 144,707 | | | $ | 143,663 | |
Global SC Finance II SRL, Series 2013-1A, Class A (c) | | | 2.980 | % | | | 04/17/28 | | | | 166,667 | | | | 166,494 | |
Global SC Finance SRL, Series 2014-1A, Class A2 (c) | | | 3.090 | % | | | 07/17/29 | | | | 91,667 | | | | 91,531 | |
HPEFS Equipment Trust, Series 2019-1A, Class A2 (c) | | | 2.190 | % | | | 09/20/29 | | | | 200,000 | | | | 200,167 | |
Pawnee Equipment Receivables, Series 2019-1, Class A1 (c) | | | 2.294 | % | | | 10/15/20 | | | | 548,237 | | | | 548,386 | |
SCF Equipment Trust LLC, Series 2017-1A, Class A (c) | | | 3.770 | % | | | 01/20/23 | | | | 36,856 | | | | 37,046 | |
TAL Advantage LLC, Series 2014-3A, Class A (c) | | | 3.270 | % | | | 11/21/39 | | | | 196,667 | | | | 196,671 | |
| | | | | | | | | | | | | | | | 2,220,753 | |
Non Agency CMBS — 8.6% |
A10 Securitization, Series 2017-1A, Class C (c) | | | 4.050 | % | | | 03/15/36 | | | | 250,000 | | | | 252,125 | |
A10 Securitization, Series 2017-1A, Class D (c) | | | 4.700 | % | | | 03/15/36 | | | | 250,000 | | | | 250,907 | |
American Homes 4 Rent, Series 2014-SFR2, Class D (c) | | | 3.678 | % | | | 12/17/36 | | | | 204,933 | | | | 212,637 | |
American Homes 4 Rent, Series 2015-SFR1, Class A (c) | | | 3.467 | % | | | 04/17/52 | | | | 118,003 | | | | 121,512 | |
AREIT Trust, Series 2018-CRE1, Class B (1MO LIBOR + 165) (a)(c)(d) | | | 3.390 | % | | | 02/14/35 | | | | 100,000 | | | | 99,969 | |
B2R Mortgage Trust, Series 2015-2, Class A (c) | | | 3.336 | % | | | 11/15/48 | | | | 45,606 | | | | 45,737 | |
Bancorp Commercial Mortgage Trust (The), Series 2017-CRE2, Class C (1MO LIBOR + 235) (a)(c) | | | 4.115 | % | | | 08/15/32 | | | | 250,000 | | | | 251,780 | |
88 DIAMOND HILL FUNDS | ANNUAL REPORT | DECEMBER 31, 2019 | DIAMOND-HILL.COM |
Diamond Hill Core Bond Fund
Schedule of Investments (Continued)
December 31, 2019
| | Coupon | | | Maturity | | | Shares /
Par Value | | | Fair
Value | |
Securitized — 58.1% continued |
Non Agency CMBS — 8.6% continued |
Bancorp Commercial Mortgage Trust (The), Series 2018-CR3, Class A (1MO LIBOR + 85) (a)(c) | | | 2.590 | % | | | 01/15/33 | | | $ | 60,738 | | | $ | 60,683 | |
Bancorp Commercial Mortgage Trust (The), Series 2016-CRE1, Class D (1MO LIBOR + 603.665) (a)(c) | | | 7.156 | % | | | 11/15/33 | | | | 82,589 | | | | 82,577 | |
Barclays Commercial Mortgage Securities LLC, Series 2015-STP, Class D (a)(c) | | | 4.427 | % | | | 09/10/20 | | | | 150,000 | | | | 150,589 | |
BX Trust, Series 2019-OC11, Class B (c) | | | 3.605 | % | | | 12/09/41 | | | | 300,000 | | | | 307,246 | |
BX Trust, Series 2019-OC11, Class D (c) | | | 4.075 | % | | | 12/09/41 | | | | 225,000 | | | | 228,674 | |
BXT Trust, Series 2018-EXCL, Class A (1MO LIBOR + 1088) (a)(c) | | | 2.727 | % | | | 09/15/20 | | | | 90,739 | | | | 90,539 | |
Colony American Finance Ltd., Series 2016-1, Class A (c) | | | 2.544 | % | | | 06/15/48 | | | | 37,108 | | | | 37,033 | |
Colony American Finance Ltd., Series 2016-2, Class B (c) | | | 3.141 | % | | | 11/15/48 | | | | 150,000 | | | | 149,668 | |
Cosmopolitan Hotel Trust, Series 2017-CSMO, Class D (1MO LIBOR + 225) (a)(c) | | | 3.990 | % | | | 11/15/36 | | | | 100,000 | | | | 100,061 | |
Exantas Capital Corp., Series 2019-RS07, Class AS (1MO LIBOR + 150) (a)(c)(d) | | | 3.262 | % | | | 04/15/36 | | | | 100,000 | | | | 100,000 | |
FREMF Mortgage Trust, Series 2019-K735, Class B(c) | | | 4.157 | % | | | 05/25/26 | | | | 500,000 | | | | 519,436 | |
| | Coupon | | | Maturity | | | Shares /
Par Value | | | Fair
Value | |
Non Agency CMBS — 8.6% continued |
FREMF Mortgage Trust, Series 2019-K736, Class B (a)(c) | | | 3.884 | % | | | 07/25/26 | | | $ | 650,000 | | | $ | 665,418 | |
Goldman Sachs Mortgage Securities Trust, Series 2015-GC28, Class A2 | | | 2.898 | % | | | 02/10/48 | | | | 300,000 | | | | 299,843 | |
Home Partners of America Trust, Series 2019-1, Class B (c) | | | 3.157 | % | | | 09/17/27 | | | | 594,234 | | | | 587,915 | |
Home Partners of America Trust, Series 2019-2, Class B (c) | | | 2.922 | % | | | 10/19/39 | | | | 649,330 | | | | 638,266 | |
Invitation Homes Trust, Series 2017-SFR2, Class A (1MO LIBOR + 85) (a)(c) | | | 2.587 | % | | | 12/17/36 | | | | 513,050 | | | | 511,099 | |
Invitation Homes Trust, Series 2018-SFR1, Class E (1MO LIBOR + 200) (a)(c) | | | 3.763 | % | | | 03/17/37 | | | | 149,980 | | | | 150,123 | |
Invitation Homes Trust, Series 2018-SFR3, Class D (1MO LIBOR + 165) (a)(c) | | | 3.413 | % | | | 07/17/37 | | | | 150,000 | | | | 150,514 | |
KKR Real Estate Finance Trust, Inc., Series 2018-FL1, Class A (1MO LIBOR + 110) (a)(c)(d) | | | 2.737 | % | | | 06/15/36 | | | | 500,000 | | | | 500,780 | |
Multi Family Connecticut Avenue, Series 2019-01, Class M7 (1MO LIBOR + 170) (a)(c) | | | 3.492 | % | | | 10/15/49 | | | | 199,683 | | | | 200,439 | |
Multi Family Housing Mortgage Loan, Series 2019-FL2, Class C (1MO LIBOR + 200) (a)(c)(d) | | | 3.792 | % | | | 12/25/34 | | | | 200,000 | | | | 200,208 | |
PFP III, Series 2019-5, Class AS (1MO LIBOR + 142) (a)(c)(d) | | | 3.160 | % | | | 04/14/36 | | | | 100,000 | | | | 100,000 | |
DIAMOND HILL FUNDS | ANNUAL REPORT | DECEMBER 31, 2019 | DIAMOND-HILL.COM 89 |
Diamond Hill Core Bond Fund
Schedule of Investments (Continued)
December 31, 2019
| | Coupon | | | Maturity | | | Shares /
Par Value | | | Fair
Value | |
Securitized — 58.1% continued |
Non Agency CMBS — 8.6% continued |
Progress Residential Trust, Series 2015-SFR3, Class A (c) | | | 3.067 | % | | | 11/12/32 | | | $ | 212,193 | | | $ | 211,918 | |
Progress Residential Trust, Series 2015-SFR3, Class D (c) | | | 4.673 | % | | | 11/12/32 | | | | 100,000 | | | | 99,885 | |
Progress Residential Trust, Series 2017-SFR2, Class B (c) | | | 3.196 | % | | | 12/17/34 | | | | 100,000 | | | | 99,843 | |
Progress Residential Trust, Series 2019-SFR3, Class A (c) | | | 2.271 | % | | | 09/17/36 | | | | 500,000 | | | | 489,156 | |
Progress Residential Trust, Series 2019-SFR3, Class B (c) | | | 2.571 | % | | | 09/17/36 | | | | 500,000 | | | | 491,383 | |
Progress Residential Trust, Series 2019-SFR3, Class E (c) | | | 3.369 | % | | | 09/17/36 | | | | 200,000 | | | | 198,309 | |
ReadyCap Commercial Mortgage Trust, Series 2018-FL2, Class A (1MO LIBOR + 85) (a)(c)(d) | | | 2.642 | % | | | 06/25/35 | | | | 72,091 | | | | 71,960 | |
ReadyCap Commercial Mortgage Trust, Series 2018-FL2, Class D (1MO LIBOR + 270) (a)(c)(d) | | | 4.492 | % | | | 06/25/35 | | | | 50,000 | | | | 49,872 | |
Shelter Growth, Series 2019-FL2, Class AS (1MO LIBOR + 145) (a)(c)(d) | | | 3.190 | % | | | 05/15/36 | | | | 99,990 | | | | 99,959 | |
TPG Real Estate Finance, Series 2019-FL3, Class A (1MO LIBOR + 115) (a)(c)(d) | | | 2.890 | % | | | 10/15/34 | | | | 400,000 | | | | 399,750 | |
Tricon American Homes, Series 2016-SFR1, Class C (c) | | | 3.487 | % | | | 11/17/33 | | | | 100,000 | | | | 100,156 | |
Tricon American Homes, Series 2018-SFR1, Class A (c) | | | 3.530 | % | | | 05/17/37 | | | | 200,000 | | | | 205,391 | |
VMC Finance LLC, Series 2018-FL2, Class A (1MO LIBOR + 92) (a)(c) | | | 2.657 | % | | | 10/15/35 | | | | 476,108 | | | | 475,304 | |
| | Coupon | | | Maturity | | | Shares /
Par Value | | | Fair
Value | |
Non Agency CMBS — 8.6% continued |
VMC Finance LLC, Series 2019-FL3, Class AS (1MO LIBOR + 140) (a)(c) | | | 3.137 | % | | | 09/15/36 | | | $ | 295,614 | | | $ | 295,754 | |
WF-RBS Commercial Mortgage Trust, Series 2011-C2, Class D (a)(c) | | | 5.839 | % | | | 02/15/44 | | | | 100,000 | | | | 101,795 | |
| | | | | | | | | | | | | | | | 10,456,213 | |
Non Agency MBS CMO — 0.7% |
Arroyo Mortgage Trust, Series 2018-1, Class A1 (c) | | | 3.763 | % | | | 04/25/48 | | | | 99,281 | | | | 100,433 | |
Arroyo Mortgage Trust, Series 2019-2, Class M1 (c) | | | 4.760 | % | | | 04/25/49 | | | | 100,000 | | | | 103,036 | |
Cascade Funding Mortgage Trust, Series 2019-MH1, Class M (c) | | | 5.339 | % | | | 11/25/44 | | | | 100,000 | | | | 99,909 | |
Cascade Funding Mortgage Trust, Series 2018-RM1, Class A1 (c) | | | 4.580 | % | | | 06/25/48 | | | | 96,881 | | | | 96,705 | |
Finance of America Structured Securities, Series 2018-HB1, Class M3 (c) | | | 4.392 | % | | | 09/25/28 | | | | 100,000 | | | | 100,027 | |
LHFC Depositor LLC, Series 2019-RLT1, Class A2 (c) | | | 4.948 | % | | | 10/25/23 | | | | 100,000 | | | | 101,084 | |
Nationstar HECM Loan Trust, Series 2018-3A, Class M2 (c) | | | 4.155 | % | | | 11/25/28 | | | | 100,000 | | | | 101,177 | |
RMF Buyout Issuance Trust, Series 2018-1, Class M3 (c) | | | 4.448 | % | | | 11/25/28 | | | | 100,000 | | | | 99,945 | |
Structured Asset Securities Corp., Series 2003-37A, Class 2A (a) | | | 4.192 | % | | | 12/25/33 | | | | 13,434 | | | | 13,747 | |
| | | | | | | | | | | | | | | | 816,063 | |
Student Loan — 3.2% |
College Ave Student Loans, Series 2018-A, Class B (c) | | | 4.750 | % | | | 12/26/47 | | | | 140,000 | | | | 145,481 | |
College Ave Student Loans, Series 2018-A, Class C (c) | | | 5.500 | % | | | 12/26/47 | | | | 100,000 | | | | 103,992 | |
90 DIAMOND HILL FUNDS | ANNUAL REPORT | DECEMBER 31, 2019 | DIAMOND-HILL.COM |
Diamond Hill Core Bond Fund
Schedule of Investments (Continued)
December 31, 2019
| | Coupon | | | Maturity | | | Shares /
Par Value | | | Fair
Value | |
Securitized — 58.1% continued |
Student Loan — 3.2% continued |
College Ave Student Loans, Series 2019-A, Class A1 (1MO LIBOR + 140) (a)(c) | | | 3.192 | % | | | 12/28/48 | | | $ | 191,636 | | | $ | 188,585 | |
College Ave Student Loans, Series 2019-A, Class C (c) | | | 4.460 | % | | | 12/28/48 | | | | 250,000 | | | | 247,469 | |
Earnest Student Loan Program LLC, Series 2016-C, Class A2 (c) | | | 2.680 | % | | | 07/25/35 | | | | 57,726 | | | | 57,823 | |
Earnest Student Loan Program LLC, Series 2017-A, Class B (c) | | | 3.590 | % | | | 01/25/41 | | | | 112,584 | | | | 113,744 | |
Laurel Road Prime Student Loan, Series 2018-B, Class A2 (c) | | | 3.540 | % | | | 05/26/43 | | | | 143,132 | | | | 146,319 | |
Laurel Road Prime Student Loan, Series 2019-A, Class A2FX (c) | | | 2.730 | % | | | 10/25/48 | | | | 300,000 | | | | 298,013 | |
SMB Private Education Loan Trust, Series 2018-C, Class B (c) | | | 4.000 | % | | | 11/17/42 | | | | 200,000 | | | | 205,540 | |
Social Professional Loan Program, Series 2015-B, Class A2 (c) | | | 2.510 | % | | | 09/27/32 | | | | 62,794 | | | | 62,880 | |
Social Professional Loan Program, Series 2016-C, Class A2B (c) | | | 2.360 | % | | | 12/27/32 | | | | 159,569 | | | | 158,883 | |
Social Professional Loan Program, Series 2015-D, Class B (c) | | | 3.590 | % | | | 10/26/37 | | | | 151,501 | | | | 153,758 | |
Social Professional Loan Program, Series 2017-B, Class CFX (c) | | | 4.440 | % | | | 05/25/40 | | | | 150,000 | | | | 155,144 | |
Social Professional Loan Program, Series 2017-E, Class A2B (c) | | | 2.720 | % | | | 11/26/40 | | | | 225,000 | | | | 226,766 | |
Social Professional Loan Program, Series 2017-E, Class C (c) | | | 4.160 | % | | | 11/26/40 | | | | 700,000 | | | | 715,797 | |
| | Coupon | | | Maturity | | | Shares /
Par Value | | | Fair
Value | |
Student Loan — 3.2% continued |
Social Professional Loan Program, Series 2016-E, Class C (c) | | | 4.430 | % | | | 10/25/41 | | | $ | 200,000 | | | $ | 206,927 | |
Social Professional Loan Program, Series 2018-A, Class A1 (1MO LIBOR + 35) (a)(c) | | | 2.142 | % | | | 02/25/42 | | | | 114,955 | | | | 114,534 | |
Social Professional Loan Program, Series 2018-D, Class BFX (c) | | | 4.140 | % | | | 02/25/48 | | | | 200,000 | | | | 208,015 | |
Social Professional Loan Program, Series 2019-C, Class BFX (c) | | | 3.050 | % | | | 11/16/48 | | | | 400,000 | | | | 385,238 | |
| | | | | | | | | | | | | | | | 3,894,908 | |
Total Securitized | | $ | 70,779,526 | |
Treasury — 21.4% |
U.S. Treasury Notes (b) | | | 1.375 | % | | | 04/30/21 | | | | 300,000 | | | | 299,041 | |
U.S. Treasury Notes (b) | | | 1.625 | % | | | 11/15/22 | | | | 1,000,000 | | | | 1,000,187 | |
U.S. Treasury Notes | | | 2.000 | % | | | 11/30/22 | | | | 2,000,000 | | | | 2,021,456 | |
U.S. Treasury Bonds | | | 1.500 | % | | | 03/31/23 | | | | 1,500,000 | | | | 1,493,570 | |
U.S. Treasury Notes (b) | | | 1.625 | % | | | 04/30/23 | | | | 100,000 | | | | 99,925 | |
U.S. Treasury Notes (b) | | | 2.500 | % | | | 05/15/24 | | | | 1,000,000 | | | | 1,033,832 | |
U.S. Treasury Notes (b) | | | 2.250 | % | | | 11/15/24 | | | | 250,000 | | | | 256,309 | |
U.S. Treasury STRIPS | | | 0.000 | % | | | 02/15/25 | | | | 300,000 | | | | 273,500 | |
U.S. Treasury Notes (b) | | | 2.000 | % | | | 08/15/25 | | | | 1,000,000 | | | | 1,012,641 | |
U.S. Treasury Notes | | | 2.250 | % | | | 11/15/25 | | | | 2,000,000 | | | | 2,052,254 | |
U.S. Treasury Notes | | | 1.625 | % | | | 02/15/26 | | | | 3,000,000 | | | | 2,970,271 | |
U.S. Treasury STRIPS | | | 0.000 | % | | | 05/15/28 | | | | 1,000,000 | | | | 844,068 | |
U.S. Treasury Notes | | | 2.875 | % | | | 08/15/28 | | | | 1,375,000 | | | | 1,480,959 | |
U.S. Treasury STRIPS | | | 0.000 | % | | | 11/15/31 | | | | 500,000 | | | | 386,246 | |
U.S. Treasury STRIPS | | | 0.000 | % | | | 02/15/33 | | | | 800,000 | | | | 597,223 | |
U.S. Treasury STRIPS | | | 0.000 | % | | | 05/15/35 | | | | 1,000,000 | | | | 700,649 | |
U.S. Treasury STRIPS | | | 0.000 | % | | | 02/15/37 | | | | 1,500,000 | | | | 1,002,942 | |
U.S. Treasury Bonds | | | 3.500 | % | | | 02/15/39 | | | | 235,000 | | | | 281,304 | |
U.S. Treasury Bonds | | | 4.250 | % | | | 05/15/39 | | | | 500,000 | | | | 657,251 | |
U.S. Treasury Bonds | | | 3.875 | % | | | 08/15/40 | | | | 550,000 | | | | 692,393 | |
U.S. Treasury Notes | | | 4.250 | % | | | 11/15/40 | | | | 300,000 | | | | 396,561 | |
DIAMOND HILL FUNDS | ANNUAL REPORT | DECEMBER 31, 2019 | DIAMOND-HILL.COM 91 |
Diamond Hill Core Bond Fund
Schedule of Investments (Continued)
December 31, 2019
| | Coupon | | | Maturity | | | Shares /
Par Value | | | Fair
Value | |
Treasury — 21.4% continued |
U.S. Treasury Bonds | | | 4.750 | % | | | 02/15/41 | | | $ | 450,000 | | | $ | 634,056 | |
U.S. Treasury STRIPS | | | 0.000 | % | | | 08/15/41 | | | | 500,000 | | | | 292,990 | |
U.S. Treasury Bonds | | | 2.750 | % | | | 11/15/42 | | | | 350,000 | | | | 373,063 | |
U.S. Treasury Bonds | | | 3.750 | % | | | 11/15/43 | | | | 1,500,000 | | | | 1,873,564 | |
U.S. Treasury Bonds | | | 2.250 | % | | | 08/15/46 | | | | 1,125,000 | | | | 1,091,916 | |
U.S. Treasury Bonds | | | 3.000 | % | | | 02/15/48 | | | | 2,000,000 | | | | 2,245,723 | |
Total Treasury | | $ | 26,063,894 | |
| | Shares | | | Fair
Value | |
Registered Investment Companies — 6.2% |
State Street Institutional Liquid Reserves Fund, Premier Class, 1.73% (e) | | | 4,785,300 | | | $ | 4,785,779 | |
State Street Navigator Securities Lending Portfolio I, 1.86% (e)(f) | | | 2,838,375 | | | | 2,838,375 | |
Total Registered Investment Companies | | $ | 7,624,154 | |
Total Investment Securities — 102.6% |
(Cost $123,588,775) | | $ | 125,191,176 | |
Liabilities in Excess of Other Assets — (2.6)% | | | (3,142,863 | ) |
Net Assets — 100.0% | | $ | 122,048,313 | |
(a) | Variable rate security. The rate shown is the effective interest rate as of December 31, 2019. The benchmark on which the rate is calculated is shown parenthetically, if applicable. Certain variable rate securities are not based on a published rate and spread but are determined by the issuer or agent and may be based on index changes, prepayment of underlying positions and/or other variables. These securities do not indicate a reference rate and spread in their description above. |
(b) | All or a portion of the security is on loan. The total fair value of the securities on loan as of December 31, 2019 was $5,076,017. |
(c) | Securities exempt from registration under Rule 144A of the Securities Act of 1933. These securities have been deemed liquid under procedures approved by the Fund’s Board of Trustees and may normally be sold to qualified institutional buyers in transactions exempt from registration. The total fair value of these securities as of December 31, 2019 was $36,308,616, representing 29.7% of net assets. |
(d) | Illiquid security as determined under procedures approved by the Board of Trustees. The total fair value of these securities as of December 31, 2019 was $1,691,327, representing 1.4% of net assets. |
(e) | The rate shown is the 7-day effective yield as of December 31, 2019. |
(f) | This security was purchased with cash collateral held from securities on loan. The total value of such securities as of December 31, 2019 was $2,838,375. Securities on loan are also collateralized by various U.S. Treasury and government agency securities in the amount of $2,379,000. |
AG - Aktiengesellschaft
BV - Besloten Vennootschap
IO - Interest Only
LIBOR - London Interbank Offered Rate
plc - Public Limited Company
NA - National Association
NV - Naamloze Vennotschap
PO - Principal Only
SA - Societe Anonyme
UA - Uitgesloten Aansprakelijkheid
See accompanying Notes to Financial Statements.
92 DIAMOND HILL FUNDS | ANNUAL REPORT | DECEMBER 31, 2019 | DIAMOND-HILL.COM |
Diamond Hill Corporate Credit Fund
Schedule of Investments
December 31, 2019
| | Coupon | | | Maturity | | | Shares /
Par Value | | | Fair
Value | |
Collateralized Debt Obligations — 0.1% |
Alesco Preferred Funding Ltd. * | | | | | | | 03/23/35 | | | $ | 336,608 | | | $ | 138,354 | |
Alesco Preferred Funding Ltd. VI * | | | | | | | 03/23/35 | | | | 621,631 | | | | 268,048 | |
Fort Sheridan ABS CDO Ltd., Series 05-1A * | | | | | | | 11/05/41 | | | | 611,948 | | | | 317,234 | |
Taberna Preferred Funding Ltd., Class PPN2 * | | | | | | | 07/05/35 | | | | 1,175,564 | | | | 506,273 | |
Total Collateralized Debt Obligations | | $ | 1,229,909 | |
Corporate Bonds — 80.9% |
Automotive — 2.1% |
Fiat Chrysler Automobiles NV | | | 4.500 | % | | | 04/15/20 | | | | 580,000 | | | | 583,625 | |
Ford Motor Credit Co. LLC | | | 5.596 | % | | | 01/07/22 | | | | 450,000 | | | | 474,065 | |
General Motors Co. | | | 6.250 | % | | | 10/02/43 | | | | 9,980,000 | | | | 11,185,600 | |
Lear Corp. | | | 5.250 | % | | | 05/15/49 | | | | 11,695,000 | | | | 12,107,280 | |
| | | | | | | | | | | | | | | | 24,350,570 | |
Banking — 1.9% |
Popular, Inc. | | | 6.125 | % | | | 09/14/23 | | | | 20,350,000 | | | | 21,901,688 | |
Basic Industry — 7.8% |
Ashland Global Holdings, Inc. | | | 6.875 | % | | | 05/15/43 | | | | 10,207,000 | | | | 11,687,015 | |
Century Communities, Inc. | | | 5.875 | % | | | 07/15/25 | | | | 9,401,000 | | | | 9,788,791 | |
Century Communities, Inc. (a) | | | 6.750 | % | | | 06/01/27 | | | | 1,620,000 | | | | 1,736,964 | |
GCP Applied Technologies, Inc. (a) | | | 5.500 | % | | | 04/15/26 | | | | 4,800,000 | | | | 5,040,000 | |
MDC Holdings, Inc. | | | 6.000 | % | | | 01/15/43 | | | | 6,137,000 | | | | 6,382,480 | |
Mueller Industries, Inc. (b) | | | 6.000 | % | | | 03/01/27 | | | | 24,598,000 | | | | 25,182,203 | |
Summit Materials LLC | | | 6.125 | % | | | 07/15/23 | | | | 13,727,000 | | | | 13,950,063 | |
Summit Materials LLC (a) | | | 6.500 | % | | | 03/15/27 | | | | 3,852,000 | | | | 4,140,900 | |
Valvoline, Inc. | | | 5.500 | % | | | 07/15/24 | | | | 8,460,000 | | | | 8,777,250 | |
Zekelman Industries, Inc. (a) | | | 9.875 | % | | | 06/15/23 | | | | 2,391,000 | | | | 2,513,539 | |
| | | | | | | | | | | | | | | | 89,199,205 | |
Capital Goods — 3.8% |
Hillenbrand, Inc. | | | 4.500 | % | | | 09/15/26 | | | | 7,265,000 | | | | 7,591,041 | |
SPX Flow, Inc. (a) | | | 5.625 | % | | | 08/15/24 | | | | 1,662,000 | | | | 1,730,558 | |
TransDigm, Inc. | | | 6.500 | % | | | 07/15/24 | | | | 17,161,000 | | | | 17,698,997 | |
Welbilt, Inc. | | | 9.500 | % | | | 02/15/24 | | | | 15,792,000 | | | | 16,739,520 | |
| | | | | | | | | | | | | | | | 43,760,116 | |
| | Coupon | | | Maturity | | | Shares /
Par Value | | | Fair
Value | |
Consumer Goods — 4.3% |
Altria Group, Inc. | | | 5.950 | % | | | 02/14/49 | | | $ | 900,000 | | | $ | 1,088,145 | |
Bacardi Ltd. (a) | | | 5.150 | % | | | 05/15/38 | | | | 3,012,000 | | | | 3,396,238 | |
BAT Capital Corp. | | | 4.540 | % | | | 08/15/47 | | | | 3,760,000 | | | | 3,770,481 | |
Hasbro, Inc. | | | 3.900 | % | | | 11/19/29 | | | | 4,295,000 | | | | 4,320,747 | |
Hasbro, Inc. | | | 6.350 | % | | | 03/15/40 | | | | 16,540,000 | | | | 19,164,633 | |
Hasbro, Inc. | | | 5.100 | % | | | 05/15/44 | | | | 6,902,000 | | | | 6,846,353 | |
Pilgrim’s Pride Corp. (a) | | | 5.750 | % | | | 03/15/25 | | | | 7,787,000 | | | | 8,048,878 | |
US Foods, Inc. (a) | | | 5.875 | % | | | 06/15/24 | | | | 2,515,000 | | | | 2,590,450 | |
| | | | | | | | | | | | | | | | 49,225,925 | |
Energy — 9.8% |
Aker BP ASA (a) | | | 6.000 | % | | | 07/01/22 | | | | 2,240,000 | | | | 2,301,600 | |
Apergy Corp. | | | 6.375 | % | | | 05/01/26 | | | | 17,611,000 | | | | 18,579,605 | |
Energen Corp. | | | 7.125 | % | | | 02/15/28 | | | | 22,389,000 | | | | 26,468,109 | |
Floatel International Ltd. (c) | | | 9.000 | % | | | 04/11/24 | | | | 6,400,000 | | | | 2,432,000 | |
Floatel International Ltd. (c) | | | 12.750 | % | | | 04/11/24 | | | | 3,400,000 | | | | 595,000 | |
Magnolia Oil & Gas Corp. (a) | | | 6.000 | % | | | 08/01/26 | | | | 18,755,000 | | | | 19,223,875 | |
Welltec A/S (a) | | | 9.500 | % | | | 12/01/22 | | | | 35,583,000 | | | | 35,227,170 | |
WPX Energy, Inc. | | | 5.250 | % | | | 10/15/27 | | | | 6,331,000 | | | | 6,679,205 | |
| | | | | | | | | | | | | | | | 111,506,564 | |
Financial Services — 14.4% |
AG Merger Sub II, Inc. (a) | | | 10.750 | % | | | 08/01/27 | | | | 4,100,000 | | | | 4,100,000 | |
Alliance Data Systems Corp. (a) | | | 4.750 | % | | | 12/15/24 | | | | 16,563,000 | | | | 16,521,593 | |
Credit Acceptance Corp. | | | 7.375 | % | | | 03/15/23 | | | | 26,660,000 | | | | 27,359,825 | |
Credit Acceptance Corp. (a) | | | 5.125 | % | | | 12/31/24 | | | | 9,590,000 | | | | 9,958,831 | |
Credit Acceptance Corp. (a) | | | 6.625 | % | | | 03/15/26 | | | | 2,700,000 | | | | 2,919,375 | |
FirstCash, Inc. (a) | | | 5.375 | % | | | 06/01/24 | | | | 16,235,000 | | | | 16,803,225 | |
FS KKR Capital Corp. | | | 4.125 | % | | | 02/01/25 | | | | 22,681,000 | | | | 22,979,849 | |
Nationstar Mortgage / Capital Corp. | | | 6.500 | % | | | 07/01/21 | | | | 43,301,000 | | | | 43,409,252 | |
Nationstar Mortgage / Capital Corp. | | | 6.500 | % | | | 06/01/22 | | | | 13,106,000 | | | | 13,114,787 | |
Quicken Loans, Inc. (a) | | | 5.750 | % | | | 05/01/25 | | | | 6,941,000 | | | | 7,175,259 | |
| | | | | | | | | | | | | | | | 164,341,996 | |
DIAMOND HILL FUNDS | ANNUAL REPORT | DECEMBER 31, 2019 | DIAMOND-HILL.COM 93 |
Diamond Hill Corporate Credit Fund
Schedule of Investments (Continued)
December 31, 2019
| | Coupon | | | Maturity | | | Shares /
Par Value | | | Fair
Value | |
Corporate Bonds — 80.9% continued |
Health Care — 5.7% |
DaVita Healthcare Partners, Inc. | | | 5.125 | % | | | 07/15/24 | | | $ | 17,772,000 | | | $ | 18,216,299 | |
Molina Healthcare, Inc. (a) | | | 4.875 | % | | | 06/15/25 | | | | 7,993,000 | | | | 8,212,808 | |
Mylan NV | | | 5.250 | % | | | 06/15/46 | | | | 7,922,000 | | | | 8,885,596 | |
Par Pharmaceutical, Inc. (a) | | | 7.500 | % | | | 04/01/27 | | | | 8,812,000 | | | | 8,767,940 | |
Teva Pharmaceuticals Finance Netherlands III BV (a)(b) | | | 7.125 | % | | | 01/31/25 | | | | 2,450,000 | | | | 2,516,640 | |
Teva Pharmaceuticals Finance Netherlands III BV | | | 3.150 | % | | | 10/01/26 | | | | 21,530,000 | | | | 17,923,725 | |
| | | | | | | | | | | | | | | | 64,523,008 | |
Insurance — 2.7% |
AssuredPartners, Inc. (a) | | | 7.000 | % | | | 08/15/25 | | | | 14,958,000 | | | | 15,215,277 | |
GTCR AP Finance, Inc. (a)(b) | | | 8.000 | % | | | 05/15/27 | | | | 7,926,000 | | | | 8,243,040 | |
Hub International Ltd. (a) | | | 7.000 | % | | | 05/01/26 | | | | 3,097,000 | | | | 3,275,078 | |
USIS Merger Subordinated, Inc. (a) | | | 6.875 | % | | | 05/01/25 | | | | 3,509,000 | | | | 3,586,900 | |
| | | | | | | | | | | | | | | | 30,320,295 | |
Leisure — 2.5% |
CCM Merger, Inc. (a) | | | 6.000 | % | | | 03/15/22 | | | | 1,030,000 | | | | 1,050,600 | |
Jack Ohio Finance, LLC (a) | | | 6.750 | % | | | 11/15/21 | | | | 975,000 | | | | 994,500 | |
Speedway Motorsports, LLC (a) | | | 4.875 | % | | | 11/01/27 | | | | 11,100,000 | | | | 11,252,625 | |
Station Casinos LLC (a)(b) | | | 5.000 | % | | | 10/01/25 | | | | 14,796,000 | | | | 15,054,930 | |
| | | | | | | | | | | | | | | | 28,352,655 | |
Media — 5.2% |
Cimpress NV (a) | | | 7.000 | % | | | 06/15/26 | | | | 33,888,000 | | | | 36,344,880 | |
Twitter, Inc. (a) | | | 3.875 | % | | | 12/15/27 | | | | 23,138,000 | | | | 23,125,968 | |
| | | | | | | | | | | | | | | | 59,470,848 | |
| | Coupon | | | Maturity | | | Shares /
Par Value | | | Fair
Value | |
Real Estate — 2.9% |
Forestar Group, Inc. (a) | | | 8.000 | % | | | 04/15/24 | | | $ | 11,667,000 | | | $ | 12,687,863 | |
iStar, Inc. | | | 4.250 | % | | | 08/01/25 | | | | 13,165,000 | | | | 13,309,288 | |
Kennedy Wilson, Inc. | | | 5.875 | % | | | 04/01/24 | | | | 2,024,000 | | | | 2,074,600 | |
RHP Hotel Properties LP | | | 5.000 | % | | | 04/15/23 | | | | 4,956,000 | | | | 5,055,120 | |
| | | | | | | | | | | | | | | | 33,126,871 | |
Retail — 8.4% |
DriveTime Automotive Group (a) | | | 8.000 | % | | | 06/01/21 | | | | 19,400,000 | | | | 19,715,250 | |
Golden Nugget, Inc. (a) | | | 6.750 | % | | | 10/15/24 | | | | 1,507,000 | | | | 1,559,745 | |
GrubHub Holdings, Inc. (a) | | | 5.500 | % | | | 07/01/27 | | | | 21,002,000 | | | | 19,664,173 | |
Liberty Interactive LLC | | | 8.500 | % | | | 07/15/29 | | | | 6,000,000 | | | | 5,947,500 | |
Liberty Interactive LLC | | | 8.250 | % | | | 02/01/30 | | | | 20,193,000 | | | | 19,940,588 | |
Nathan’s Famous, Inc. (a) | | | 6.625 | % | | | 11/01/25 | | | | 27,929,000 | | | | 28,487,579 | |
| | | | | | | | | | | | | | | | 95,314,835 | |
Services — 4.3% |
IAA Spinco, Inc. (a) | | | 5.500 | % | | | 06/15/27 | | | | 11,461,000 | | | | 12,177,313 | |
KAR Auction Services, Inc. (a) | | | 5.125 | % | | | 06/01/25 | | | | 15,080,000 | | | | 15,683,200 | |
Korn Ferry International (a) | | | 4.625 | % | | | 12/15/27 | | | | 6,706,000 | | | | 6,739,530 | |
Mobile Mini, Inc. | | | 5.875 | % | | | 07/01/24 | | | | 8,885,000 | | | | 9,240,400 | |
Stericycle, Inc. (a) | | | 5.375 | % | | | 07/15/24 | | | | 5,286,000 | | | | 5,550,300 | |
| | | | | | | | | | | | | | | | 49,390,743 | |
Technology & Electronics — 0.9% |
Dell International LLC (a) | | | 8.100 | % | | | 07/15/36 | | | | 4,933,000 | | | | 6,474,533 | |
Juniper Networks, Inc. | | | 5.950 | % | | | 03/15/41 | | | | 3,609,000 | | | | 4,190,728 | |
| | | | | | | | | | | | | | | | 10,665,261 | |
Telecommunications — 4.0% |
Cogent Communications, Inc. (a) | | | 5.625 | % | | | 04/15/21 | | | | 26,401,000 | | | | 26,632,009 | |
Cogent Communications, Inc. (a) | | | 5.375 | % | | | 03/01/22 | | | | 4,655,000 | | | | 4,864,475 | |
Frontier Communications Corp. (a) | | | 8.000 | % | | | 04/01/27 | | | | 9,785,000 | | | | 10,225,325 | |
US Cellular Corp. | | | 6.700 | % | | | 12/15/33 | | | | 3,534,000 | | | | 3,869,730 | |
| | | | | | | | | | | | | | | | 45,591,539 | |
94 DIAMOND HILL FUNDS | ANNUAL REPORT | DECEMBER 31, 2019 | DIAMOND-HILL.COM |
Diamond Hill Corporate Credit Fund
Schedule of Investments (Continued)
December 31, 2019
| | Coupon | | | Maturity | | | Shares /
Par Value | | | Fair
Value | |
Corporate Bonds — 80.9% continued |
Transportation — 0.2% |
United Airlines Pass-Through Trust, Series 2013-1 | | | 5.375 | % | | | 02/15/23 | | | $ | 228,786 | | | $ | 236,921 | |
United Continental Holdings, Inc. | | | 4.250 | % | | | 10/01/22 | | | | 350,000 | | | | 365,750 | |
XPO Logistics, Inc. (a) | | | 6.125 | % | | | 09/01/23 | | | | 913,000 | | | | 942,490 | |
| | | | | | | | | | | | | | | | 1,545,161 | |
Total Corporate Bonds | | $ | 922,587,280 | |
| | Shares | | | Fair
Value | |
Registered Investment Companies — 17.9% |
Diamond Hill Short Duration Total Return Fund, Class Y (d) | | | 5,041,676 | | | $ | 51,021,763 | |
State Street Institutional Liquid Reserves Fund, Premier Class, 1.73% (e) | | | 152,075,278 | | | | 152,090,485 | |
State Street Navigator Securities Lending Portfolio I, 1.86% (e)(f) | | | 1,106,825 | | | | 1,106,825 | |
Total Registered Investment Companies | | $ | 204,219,073 | |
Total Investment Securities — 98.9% |
(Cost $1,114,247,733) | | $ | 1,128,036,262 | |
Other Assets in Excess of Liabilities — 1.1% | | | 12,691,438 | |
Net Assets — 100.0% | | $ | 1,140,727,700 | |
(a) | Securities exempt from registration under Rule 144A of the Securities Act of 1933. These securities have been deemed liquid under procedures approved by the Fund’s Board of Trustees and may normally be sold to qualified institutional buyers in transactions exempt from registration. The total fair value of these securities as of December 31, 2019 was $452,473,424, representing 39.7% of net assets. |
(b) | All or a portion of the security is on loan. The total fair value of the securities on loan as of December 31, 2019 was $1,074,785. |
(c) | Illiquid security as determined under procedures approved by the Board of Trustees. The total fair value of these securities as of December 31, 2019 was $3,027,000, representing 0.3% of net assets. |
(e) | The rate shown is the 7-day effective yield as of December 31,2019. |
(f) | This security was purchased with cash collateral held from securities on loan. The total value of such securities as of December 31, 2019 was $1,106,825. |
* | Non-income producing security. Restricted and illiquid securities not registered under the securities act of 1933 and valued at fair value by the Valuation & Liquidity Committee based on procedures approved by the Board of Trustees are as follows: |
| | | Acquisition Date | | | Current
Cost | | | Fair
Value | | | Value as a % of Net Assets | |
Alesco Preferred Funding Ltd. VI, Class PNN | | | December-04 | | | $ | 621,631 | | | $ | 268,048 | | | | 0.02 | % |
Alesco Preferred Funding Ltd., Class PNNE | | | March-05 | | | $ | 336,608 | | | $ | 138,354 | | | | 0.01 | % |
Fort Sheridan ABS CDO Ltd., Series 05-1A, Class PPN2 | | | March-05 | | | $ | 518,422 | | | $ | 317,234 | | | | 0.03 | % |
Taberna Preferred Funding Ltd., Class PPN2 | | | March-05 | | | $ | 1,050,365 | | | $ | 506,273 | | | | 0.04 | % |
| | | | | | | $ | 2,527,026 | | | $ | 1,229,909 | | | | 0.10 | % |
ASA - Allmennaksjeselskap
A/S - Ansvarlig Selskap
BV - Besloten Vennootschap
NV - Naamloze Vennootschap
See accompanying Notes to Financial Statements.
DIAMOND HILL FUNDS | ANNUAL REPORT | DECEMBER 31, 2019 | DIAMOND-HILL.COM 95 |
Diamond Hill High Yield Fund
Schedule of Investments
December 31, 2019
| | Coupon | | | Maturity | | | Shares /
Par Value | | | Fair
Value | |
Corporate Bonds — 90.6% |
Automotive — 2.6% |
Ford Motor Credit Co. LLC | | | 5.596 | % | | | 01/07/22 | | | $ | 250,000 | | | $ | 263,370 | |
General Motors Co. | | | 6.250 | % | | | 10/02/43 | | | | 1,350,000 | | | | 1,513,082 | |
Lear Corp. | | | 5.250 | % | | | 05/15/49 | | | | 1,675,000 | | | | 1,734,048 | |
| | | | | | | | | | | | | | | | 3,510,500 | |
Banking — 1.0% |
Popular, Inc. | | | 6.125 | % | | | 09/14/23 | | | | 1,275,000 | | | | 1,372,219 | |
Basic Industry — 8.4% |
Ashland Global Holdings, Inc. | | | 6.875 | % | | | 05/15/43 | | | | 1,375,000 | | | | 1,574,375 | |
Century Communities, Inc. (a) | | | 6.750 | % | | | 06/01/27 | | | | 1,850,000 | | | | 1,983,570 | |
GCP Applied Technologies, Inc. (a) | | | 5.500 | % | | | 04/15/26 | | | | 640,000 | | | | 672,000 | |
MDC Holdings, Inc. | | | 6.000 | % | | | 01/15/43 | | | | 900,000 | | | | 936,000 | |
Mueller Industries, Inc. | | | 6.000 | % | | | 03/01/27 | | | | 2,800,000 | | | | 2,866,500 | |
Summit Materials LLC | | | 6.125 | % | | | 07/15/23 | | | | 1,750,000 | | | | 1,778,437 | |
Summit Materials LLC (a) | | | 6.500 | % | | | 03/15/27 | | | | 400,000 | | | | 430,000 | |
Valvoline, Inc. | | | 5.500 | % | | | 07/15/24 | | | | 200,000 | | | | 207,500 | |
Zekelman Industries, Inc. (a) | | | 9.875 | % | | | 06/15/23 | | | | 852,000 | | | | 895,665 | |
| | | | | | | | | | | | | | | | 11,344,047 | |
Capital Goods — 4.1% |
Hillenbrand, Inc. | | | 4.500 | % | | | 09/15/26 | | | | 700,000 | | | | 731,415 | |
SPX Flow, Inc. (a) | | | 5.625 | % | | | 08/15/24 | | | | 100,000 | | | | 104,125 | |
TransDigm, Inc. | | | 6.500 | % | | | 07/15/24 | | | | 2,100,000 | | | | 2,165,835 | |
Welbilt, Inc. | | | 9.500 | % | | | 02/15/24 | | | | 2,400,000 | | | | 2,544,000 | |
| | | | | | | | | | | | | | | | 5,545,375 | |
Consumer Goods — 4.3% |
Altria Group, Inc. | | | 5.950 | % | | | 02/14/49 | | | | 100,000 | | | | 120,905 | |
Bacardi Ltd. (a) | | | 5.150 | % | | | 05/15/38 | | | | 150,000 | | | | 169,135 | |
BAT Capital Corp. | | | 4.540 | % | | | 08/15/47 | | | | 550,000 | | | | 551,533 | |
Hasbro, Inc. | | | 3.900 | % | | | 11/19/29 | | | | 155,000 | | | | 155,929 | |
Hasbro, Inc. | | | 6.350 | % | | | 03/15/40 | | | | 3,000,000 | | | | 3,476,052 | |
Hasbro, Inc. | | | 5.100 | % | | | 05/15/44 | | | | 950,000 | | | | 942,341 | |
Pilgrim’s Pride Corp. (a) | | | 5.750 | % | | | 03/15/25 | | | | 350,000 | | | | 361,770 | |
| | | | | | | | | | | | | | | | 5,777,665 | |
Energy — 13.4% |
Aker BP ASA (a) | | | 6.000 | % | | | 07/01/22 | | | | 550,000 | | | | 565,125 | |
Apergy Corp. | | | 6.375 | % | | | 05/01/26 | | | | 2,725,000 | | | | 2,874,875 | |
Energen Corp. | | | 7.125 | % | | | 02/15/28 | | | | 4,350,000 | | | | 5,142,538 | |
Floatel International Ltd. | | | 9.000 | % | | | 04/11/24 | | | | 600,000 | | | | 228,000 | |
| | Coupon | | | Maturity | | | Shares /
Par Value | | | Fair
Value | |
Energy — 13.4% continued |
Floatel International Ltd. (b) | | | 12.750 | % | | | 04/11/24 | | | $ | 600,000 | | | $ | 105,000 | |
Magnolia Oil & Gas Corp. (a) | | | 6.000 | % | | | 08/01/26 | | | | 3,575,000 | | | | 3,664,375 | |
Welltec A/S (a) | | | 9.500 | % | | | 12/01/22 | | | | 4,450,000 | | | | 4,405,500 | |
WPX Energy, Inc. | | | 5.250 | % | | | 10/15/27 | | | | 1,050,000 | | | | 1,107,750 | |
| | | | | | | | | | | | | | | | 18,093,163 | |
Financial Services — 16.9% |
AG Merger Sub II, Inc. (a) | | | 10.750 | % | | | 08/01/27 | | | | 900,000 | | | | 900,000 | |
Alliance Data Systems Corp. (a) | | | 4.750 | % | | | 12/15/24 | | | | 3,000,000 | | | | 2,992,500 | |
Credit Acceptance Corp. | | | 7.375 | % | | | 03/15/23 | | | | 2,300,000 | | | | 2,360,375 | |
Credit Acceptance Corp. (a) | | | 5.125 | % | | | 12/31/24 | | | | 1,550,000 | | | | 1,609,613 | |
Credit Acceptance Corp. (a) | | | 6.625 | % | | | 03/15/26 | | | | 500,000 | | | | 540,625 | |
FirstCash, Inc. (a) | | | 5.375 | % | | | 06/01/24 | | | | 1,075,000 | | | | 1,112,625 | |
FS KKR Capital Corp. | | | 4.125 | % | | | 02/01/25 | | | | 3,300,000 | | | | 3,343,481 | |
Nationstar Mortgage / Capital Corp. | | | 6.500 | % | | | 07/01/21 | | | | 5,050,000 | | | | 5,062,625 | |
Nationstar Mortgage / Capital Corp. | | | 6.500 | % | | | 06/01/22 | | | | 3,590,000 | | | | 3,592,407 | |
Quicken Loans, Inc. (a) | | | 5.750 | % | | | 05/01/25 | | | | 1,275,000 | | | | 1,318,031 | |
| | | | | | | | | | | | | | | | 22,832,282 | |
Health Care — 6.5% |
DaVita Healthcare Partners, Inc. | | | 5.125 | % | | | 07/15/24 | | | | 2,150,000 | | | | 2,203,750 | |
Molina Healthcare, Inc. (a) | | | 4.875 | % | | | 06/15/25 | | | | 580,000 | | | | 595,950 | |
Mylan NV | | | 5.250 | % | | | 06/15/46 | | | | 675,000 | | | | 757,104 | |
Par Pharmaceutical, Inc. (a) | | | 7.500 | % | | | 04/01/27 | | | | 1,175,000 | | | | 1,169,125 | |
Teva Pharmaceuticals Finance Netherlands III BV (a)(c) | | | 7.125 | % | | | 01/31/25 | | | | 400,000 | | | | 410,880 | |
Teva Pharmaceuticals Finance Netherlands III BV | | | 3.150 | % | | | 10/01/26 | | | | 4,400,000 | | | | 3,663,000 | |
| | | | | | | | | | | | | | | | 8,799,809 | |
96 DIAMOND HILL FUNDS | ANNUAL REPORT | DECEMBER 31, 2019 | DIAMOND-HILL.COM |
Diamond Hill High Yield Fund
Schedule of Investments (Continued)
December 31, 2019
| | Coupon | | | Maturity | | | Shares /
Par Value | | | Fair
Value | |
Corporate Bonds — 90.6% continued |
Insurance — 3.6% |
AssuredPartners, Inc. (a) | | | 7.000 | % | | | 08/15/25 | | | $ | 2,450,000 | | | $ | 2,492,140 | |
GTCR AP Finance, Inc. (a) | | | 8.000 | % | | | 05/15/27 | | | | 1,275,000 | | | | 1,326,000 | |
Hub International Ltd. (a) | | | 7.000 | % | | | 05/01/26 | | | | 250,000 | | | | 264,375 | |
USIS Merger Subordinated, Inc. (a) | | | 6.875 | % | | | 05/01/25 | | | | 750,000 | | | | 766,650 | |
| | | | | | | | | | | | | | | | 4,849,165 | |
Leisure — 2.7% |
CCM Merger, Inc. (a) | | | 6.000 | % | | | 03/15/22 | | | | 169,000 | | | | 172,380 | |
Jack Ohio Finance, LLC (a) | | | 6.750 | % | | | 11/15/21 | | | | 245,000 | | | | 249,900 | |
Speedway Motorsports, LLC (a) | | | 4.875 | % | | | 11/01/27 | | | | 1,700,000 | | | | 1,723,375 | |
Station Casinos LLC (a) | | | 5.000 | % | | | 10/01/25 | | | | 1,450,000 | | | | 1,475,375 | |
| | | | | | | | | | | | | | | | 3,621,030 | |
Media — 5.7% |
Cimpress NV (a) | | | 7.000 | % | | | 06/15/26 | | | | 3,850,000 | | | | 4,129,125 | |
Twitter, Inc. (a) | | | 3.875 | % | | | 12/15/27 | | | | 3,500,000 | | | | 3,498,180 | |
| | | | | | | | | | | | | | | | 7,627,305 | |
Real Estate — 2.5% |
Forestar Group, Inc. (a) | | | 8.000 | % | | | 04/15/24 | | | | 1,325,000 | | | | 1,440,938 | |
iStar, Inc | | | 4.250 | % | | | 08/01/25 | | | | 1,285,000 | | | | 1,299,084 | |
RHP Hotel Properties LP | | | 5.000 | % | | | 04/15/23 | | | | 675,000 | | | | 688,500 | |
| | | | | | | | | | | | | | | | 3,428,522 | |
Retail — 10.1% |
DriveTime Automotive Group (a) | | | 8.000 | % | | | 06/01/21 | | | | 2,850,000 | | | | 2,896,312 | |
Golden Nugget, Inc. (a) | | | 6.750 | % | | | 10/15/24 | | | | 150,000 | | | | 155,250 | |
GrubHub Holdings, Inc. (a) | | | 5.500 | % | | | 07/01/27 | | | | 3,275,000 | | | | 3,066,383 | |
Liberty Interactive LLC | | | 8.500 | % | | | 07/15/29 | | | | 700,000 | | | | 693,875 | |
Liberty Interactive LLC | | | 8.250 | % | | | 02/01/30 | | | | 3,125,000 | | | | 3,085,937 | |
Nathan’s Famous, Inc. (a) | | | 6.625 | % | | | 11/01/25 | | | | 3,600,000 | | | | 3,672,000 | |
| | | | | | | | | | | | | | | | 13,569,757 | |
| | Coupon | | | Maturity | | | Shares /
Par Value | | | Fair
Value | |
Services — 5.0% |
IAA Spinco, Inc. (a) | | | 5.500 | % | | | 06/15/27 | | | $ | 2,150,000 | | | $ | 2,284,375 | |
KAR Auction Services, Inc. (a) | | | 5.125 | % | | | 06/01/25 | | | | 1,500,000 | | | | 1,560,000 | |
Korn Ferry International (a) | | | 4.625 | % | | | 12/15/27 | | | | 1,050,000 | | | | 1,055,250 | |
Mobile Mini, Inc. | | | 5.875 | % | | | 07/01/24 | | | | 1,100,000 | | | | 1,144,000 | |
Stericycle, Inc. (a) | | | 5.375 | % | | | 07/15/24 | | | | 600,000 | | | | 630,000 | |
| | | | | | | | | | | | | | | | 6,673,625 | |
Technology & Electronics — 1.0% |
Dell International LLC (a) | | | 8.100 | % | | | 07/15/36 | | | | 265,000 | | | | 347,811 | |
Juniper Networks, Inc. | | | 5.950 | % | | | 03/15/41 | | | | 800,000 | | | | 928,950 | |
| | | | | | | | | | | | | | | | 1,276,761 | |
Telecommunications — 2.4% |
Cogent Communications, Inc. (a) | | | 5.625 | % | | | 04/15/21 | | | | 1,500,000 | | | | 1,513,125 | |
Frontier Communications Corp. (a) | | | 8.000 | % | | | 04/01/27 | | | | 1,100,000 | | | | 1,149,500 | |
US Cellular Corp. | | | 6.700 | % | | | 12/15/33 | | | | 550,000 | | | | 602,250 | |
| | | | | | | | | | | | | | | | 3,264,875 | |
Transportation — 0.4% |
Continental Airlines Pass-Through Trust, Series 2012-1 | | | 6.250 | % | | | 10/11/21 | | | | 200,971 | | | | 202,599 | |
Continental Airlines Pass-Through Trust, Series 2012-2 | | | 5.500 | % | | | 04/29/22 | | | | 95,556 | | | | 97,321 | |
U.S. Airways Pass-Through Trust, Series 2012-2 | | | 6.750 | % | | | 12/03/22 | | | | 202,930 | | | | 212,994 | |
| | | | | | | | | | | | | | | | 512,914 | |
Total Corporate Bonds | | $ | 122,099,014 | |
Securitized — 3.7% |
ABS-Other — 0.4% |
Access Point Financial, Inc., Series 2017-A, Class C (a) | | | 5.820 | % | | | 04/15/29 | | | | 250,000 | | | | 254,627 | |
Kabbage Funding LLC, Series 2019-1, Class D (a) | | | 5.688 | % | | | 03/15/24 | | | | 250,000 | | | | 253,000 | |
| | | | | | | | | | | | | | | | 507,627 | |
DIAMOND HILL FUNDS | ANNUAL REPORT | DECEMBER 31, 2019 | DIAMOND-HILL.COM 97 |
Diamond Hill High Yield Fund
Schedule of Investments (Continued)
December 31, 2019
| | Coupon | | | Maturity | | | Shares /
Par Value | | | Fair
Value | |
Securitized — 3.7% continued |
Auto Loan — 0.5% |
CIG Auto Receivables Trust, Series 2017-1A, Class C (a) | | | 5.330 | % | | | 12/16/24 | | | $ | 400,000 | | | $ | 402,659 | |
Skopos Auto Receivables Trust, Series 2019-1A, Class D (a) | | | 5.240 | % | | | 04/15/25 | | | | 320,000 | | | | 318,538 | |
| | | | | | | | | | | | | | | | 721,197 | |
Consumer — 2.4% |
Freedom Financial, Series 2019-2, Class C (a) | | | 4.860 | % | | | 11/18/26 | | | | 1,000,000 | | | | 996,235 | |
LendingPoint Asset Securitization Trust, Series 2019-2, Class C (a) | | | 4.660 | % | | | 11/10/25 | | | | 441,000 | | | | 439,658 | |
Mariner Finance Issuance Trust, Series 2018-AA, Class D (a) | | | 6.570 | % | | | 11/20/30 | | | | 275,000 | | | | 284,154 | |
Oportun Funding LLC, Series 2018-C, Class D (a) | | | 6.790 | % | | | 10/08/24 | | | | 500,000 | | | | 513,976 | |
Prosper Marketplace Issuance Trust, Series 2019-4A, Class C (a) | | | 4.950 | % | | | 02/17/26 | | | | 1,000,000 | | | | 998,139 | |
| | | | | | | | | | | | | | | | 3,232,162 | |
Credit Cards — 0.2% |
Fortiva Retail Credit Master Note, Series 2018-1, Class C (a) | | | 7.730 | % | | | 11/15/23 | | | | 250,000 | | | | 257,234 | |
Equipment — 0.1% |
Ascentium Equipment Receivables Trust, Series 2016-2A, Class E (a) | | | 6.790 | % | | | 10/10/24 | | | | 100,000 | | | | 101,491 | |
Non Agency MBS CMO — 0.1% |
Cascade Funding Mortgage Trust, Series 2018-RM1, Class A2 (a) | | | 5.875 | % | | | 06/25/48 | | | | 200,000 | | | | 200,403 | |
Total Securitized | | $ | 5,020,114 | |
| |
| | Shares | | | Fair
Value | |
Registered Investment Companies — 4.3% |
State Street Institutional Liquid Reserves Fund, Premier Class, 1.73% (d) | | | 5,645,820 | | | $ | 5,646,385 | |
State Street Navigator Securities Lending Portfolio I, 1.86% (d)(e) | | | 136,500 | | | | 136,500 | |
Total Registered Investment Companies | | $ | 5,782,885 | |
Total Investment Securities — 98.6% |
(Cost $130,854,658) | | $ | 132,902,013 | |
Other Assets in Excess of Liabilities — 1.4% | | | 1,855,450 | |
Net Assets — 100.0% | | $ | 134,757,463 | |
(a) | Securities exempt from registration under Rule 144A of the Securities Act of 1933. These securities have been deemed liquid under procedures approved by the Fund’s Board of Trustees and may normally be sold to qualified institutional buyers in transactions exempt from registration. The total fair value of these securities as of December 31, 2019 was $64,789,172, representing 48.1% of net assets. |
(b) | Illiquid security as determined under procedures approved by the Board of Trustees. The total fair value of these securities as of December 31, 2019 was $105,000, representing 0.1% of net assets. |
(c) | All or a portion of the security is on loan. The total fair value of the securities on loan as of December 31, 2019 was $133,536. |
(d) | The rate shown is the 7-day effective yield as of December 31, 2019. |
(e) | This security was purchased with cash collateral held from securities on loan. The total value of such securities as of December 31, 2019 was $136,500. |
ASA - Allmennaksjeselskap
A/S - Ansvarlig Selskap
BV - Besloten Vennootschap
NV - Naamloze Vennootschap
See accompanying Notes to Financial Statements.
98 DIAMOND HILL FUNDS | ANNUAL REPORT | DECEMBER 31, 2019 | DIAMOND-HILL.COM |
Diamond Hill Funds
Tabular Presentation of Schedules of Investments
December 31, 2019 (Unaudited)
Diamond Hill Small Cap Fund |
Sector Allocation | % of
Net Assets |
Industrials | 24.9% |
Financials | 24.4% |
Consumer Discretionary | 13.5% |
Consumer Staples | 7.7% |
Real Estate | 6.0% |
Communication Services | 5.6% |
Information Technology | 5.3% |
Energy | 3.1% |
Utilities | 2.4% |
Materials | 2.3% |
Health Care | 2.1% |
Registered Investment Companies | 9.6% |
Other | |
Net Other Assets (Liabilities) | -6.9% |
| | 100.0% |
| | |
Russell 2000 Index
Sector Allocation | % of
Index |
Industrials | 15.7% |
Financials | 17.7% |
Consumer Discretionary | 10.9% |
Consumer Staples | 3.0% |
Real Estate | 7.8% |
Communication Services | 2.3% |
Information Technology | 13.6% |
Energy | 3.1% |
Utilities | 3.7% |
Materials | 3.9% |
Health Care | 18.3% |
| | 100.0% |
Diamond Hill Small-Mid Cap Fund |
Sector Allocation | % of
Net Assets |
Financials | 24.3% |
Industrials | 19.7% |
Consumer Discretionary | 12.1% |
Real Estate | 8.1% |
Consumer Staples | 7.1% |
Materials | 5.9% |
Information Technology | 4.1% |
Utilities | 3.6% |
Energy | 3.3% |
Communication Services | 2.4% |
Health Care | 2.2% |
Registered Investment Companies | 11.8% |
Other | |
Net Other Assets (Liabilities) | -4.6% |
| | 100.0% |
| | |
Russell 2500 Index
Sector Allocation | % of
Index |
Financials | 16.1% |
Industrials | 15.0% |
Consumer Discretionary | 11.3% |
Real Estate | 10.2% |
Consumer Staples | 2.9% |
Materials | 5.1% |
Information Technology | 16.1% |
Utilities | 3.6% |
Energy | 2.7% |
Communication Services | 3.1% |
Health Care | 13.9% |
| | 100.0% |
DIAMOND HILL FUNDS | ANNUAL REPORT | DECEMBER 31, 2019 | DIAMOND-HILL.COM 99 |
Diamond Hill Funds
Tabular Presentation of Schedules of Investments (Continued)
December 31, 2019 (Unaudited)
Diamond Hill Mid Cap Fund |
Sector Allocation | % of
Net Assets |
Financials | 27.5% |
Industrials | 17.2% |
Consumer Discretionary | 12.2% |
Consumer Staples | 7.3% |
Real Estate | 6.3% |
Materials | 5.8% |
Utilities | 3.6% |
Information Technology | 3.6% |
Energy | 3.5% |
Communication Services | 2.4% |
Health Care | 2.3% |
Registered Investment Companies | 10.2% |
Other | |
Net Other Assets (Liabilities) | -1.9% |
| | 100.0% |
| | |
Russell Midcap Index
Sector Allocation | % of
Index |
Financials | 12.9% |
Industrials | 13.8% |
Consumer Discretionary | 11.3% |
Consumer Staples | 4.1% |
Real Estate | 9.5% |
Materials | 5.2% |
Utilities | 6.8% |
Information Technology | 18.0% |
Energy | 3.9% |
Communication Services | 4.3% |
Health Care | 10.2% |
| | 100.0% |
Diamond Hill Large Cap Fund |
Sector Allocation | % of
Net Assets |
Financials | 27.5% |
Health Care | 13.8% |
Consumer Discretionary | 13.3% |
Communication Services | 12.0% |
Consumer Staples | 10.5% |
Industrials | 7.5% |
Information Technology | 5.7% |
Energy | 3.6% |
Materials | 3.4% |
Registered Investment Companies | 2.6% |
Other | |
Net Other Assets (Liabilities) | 0.1% |
| | 100.0% |
| | |
Russell 1000 Index
Sector Allocation | % of
Index |
Financials | 13.2% |
Health Care | 13.9% |
Consumer Discretionary | 10.5% |
Communication Services | 9.9% |
Consumer Staples | 6.1% |
Industrials | 9.5% |
Information Technology | 23.1% |
Energy | 4.1% |
Materials | 2.8% |
Real Estate | 3.7% |
Utilities | 3.2% |
| | 100.0% |
100 DIAMOND HILL FUNDS | ANNUAL REPORT | DECEMBER 31, 2019 | DIAMOND-HILL.COM |
Diamond Hill Funds
Tabular Presentation of Schedules of Investments (Continued)
December 31, 2019 (Unaudited)
Diamond Hill All Cap Select Fund |
Sector Allocation | % of
Net Assets |
Financials | 30.6% |
Industrials | 16.5% |
Consumer Discretionary | 15.2% |
Consumer Staples | 8.7% |
Health Care | 8.7% |
Communication Services | 7.9% |
Information Technology | 4.2% |
Materials | 3.0% |
Registered Investment Companies | 8.0% |
Other | |
Net Other Assets (Liabilities) | -2.8% |
| | 100.0% |
| | |
Russell 3000 Index
Sector Allocation | % of
Index |
Financials | 13.5% |
Industrials | 9.9% |
Consumer Discretionary | 10.6% |
Consumer Staples | 5.9% |
Health Care | 14.2% |
Communication Services | 9.4% |
Information Technology | 22.4% |
Materials | 2.8% |
Energy | 4.1% |
Real Estate | 4.0% |
Utilities | 3.2% |
| | 100.0% |
Diamond Hill Long-Short Fund |
Long Portfolio
Sector Allocation | % of
Net Assets |
Financials | 24.8% |
Industrials | 13.8% |
Health Care | 12.1% |
Communication Services | 10.0% |
Information Technology | 7.9% |
Consumer Discretionary | 7.3% |
Materials | 5.4% |
Consumer Staples | 2.9% |
Energy | 2.3% |
Registered Investment Companies | 27.4% |
| | |
Short Portfolio
Sector Allocation | % of
Net Assets |
Consumer Discretionary | -9.3% |
Industrials | -4.9% |
Financials | -4.5% |
Information Technology | -3.9% |
Consumer Staples | -2.5% |
Health Care | -2.1% |
Utilities | -1.4% |
Communication Services | -0.6% |
Materials | -0.5% |
Real Estate | -0.3% |
Other | |
Segregated Cash With Custodian | 30.2% |
Net Other Assets (Liabilities) | -14.1% |
| | 100.0% |
| | |
Russell 1000 Index
Sector Allocation | % of
Index |
Financials | 13.2% |
Industrials | 9.5% |
Health Care | 13.9% |
Communication Services | 9.9% |
Information Technology | 23.1% |
Consumer Discretionary | 10.5% |
Materials | 2.8% |
Consumer Staples | 6.1% |
Energy | 4.1% |
Utilities | 3.2% |
Real Estate | 3.7% |
| | 100.0% |
DIAMOND HILL FUNDS | ANNUAL REPORT | DECEMBER 31, 2019 | DIAMOND-HILL.COM 101 |
Diamond Hill Funds
Tabular Presentation of Schedules of Investments (Continued)
December 31, 2019 (Unaudited)
Diamond Hill Research Opportunities Fund |
Long Portfolio
Sector Allocation | % of
Net Assets |
Industrials | 18.2% |
Communication Services | 15.9% |
Financials | 13.5% |
Information Technology | 13.3% |
Consumer Discretionary | 11.1% |
Health Care | 11.0% |
Materials | 6.4% |
Consumer Staples | 3.9% |
Real Estate | 2.6% |
Energy | 1.7% |
Utilities | 0.2% |
Registered Investment Companies | 23.9% |
| | |
Short Portfolio
Sector Allocation | % of
Net Assets |
Consumer Discretionary | -7.7% |
Financials | -3.3% |
Information Technology | -3.3% |
Health Care | -1.2% |
Industrials | -1.1% |
Consumer Staples | -0.7% |
Communication Services | -0.6% |
Utilities | -0.4% |
Real Estate | -0.3% |
Materials | -0.1% |
Other | |
Segregated Cash With Custodian | 20.9% |
Net Other Assets (Liabilities) | -23.9% |
| | 100.0% |
| | |
Russell 3000 Index
Sector Allocation | % of
Index |
Industrials | 9.9% |
Communication Services | 9.4% |
Financials | 13.5% |
Information Technology | 22.4% |
Consumer Discretionary | 10.6% |
Health Care | 14.2% |
Materials | 2.8% |
Consumer Staples | 5.9% |
Real Estate | 4.0% |
Energy | 4.1% |
Utilities | 3.2% |
| | 100.0% |
Diamond Hill Global Fund |
Sector Allocation | % of
Net Assets |
Financials | 28.7% |
Industrials | 15.6% |
Consumer Discretionary | 14.3% |
Information Technology | 9.1% |
Health Care | 8.8% |
Consumer Staples | 8.8% |
Communication Services | 8.1% |
Materials | 4.1% |
Registered Investment Companies | 5.0% |
Other | |
Net Other Assets (Liabilities) | -2.5% |
| | 100.0% |
| | |
Morningstar Global
Markets Index
Sector Allocation | % of
Index |
Financials | 16.5% |
Industrials | 11.4% |
Consumer Discretionary | 11.3% |
Information Technology | 16.4% |
Health Care | 11.5% |
Consumer Staples | 7.4% |
Communication Services | 8.1% |
Materials | 5.1% |
Energy | 4.9% |
Real Estate | 4.2% |
Utilities | 3.2% |
| | 100.0% |
102 DIAMOND HILL FUNDS | ANNUAL REPORT | DECEMBER 31, 2019 | DIAMOND-HILL.COM |
Diamond Hill Funds
Tabular Presentation of Schedules of Investments (Continued)
December 31, 2019 (Unaudited)
Diamond Hill International Fund |
Sector Allocation | % of
Net Assets |
Financials | 24.6% |
Communication Services | 21.5% |
Consumer Staples | 14.3% |
Health Care | 12.0% |
Industrials | 9.8% |
Information Technology | 6.6% |
Consumer Discretionary | 6.4% |
Materials | 2.9% |
Registered Investment Companies | 4.6% |
Other | |
Net Other Assets (Liabilities) | -2.7% |
| | 100.0% |
| | |
Morningstar Global
Markets ex U.S. Index
Sector Allocation | % of
Index |
Financials | 20.0% |
Communication Services | 6.3% |
Consumer Staples | 8.9% |
Health Care | 8.7% |
Industrials | 13.4% |
Information Technology | 9.1% |
Consumer Discretionary | 12.0% |
Materials | 7.7% |
Energy | 6.0% |
Real Estate | 4.5% |
Utilities | 3.4% |
| | 100.0% |
Diamond Hill Short Duration
Total Return Fund |
Sector Allocation | % of
Net Assets |
Securitized | 84.2% |
Treasury | 6.6% |
Corporate Credit | 4.9% |
Registered Investment Companies | 9.3% |
Other | |
Net Other Assets (Liabilities) | -5.0% |
| | 100.0% |
| | |
Bloomberg Barclays U.S.
1-3 Yr. Gov./Credit Index
Sector Allocation | % of
Index |
Treasury | 67.0% |
Corporate Credit | 23.1% |
Non-Corporate Credit | 7.0% |
Agency | 2.9% |
| | 100.0% |
Diamond Hill Core Bond Fund |
Sector Allocation | % of
Net Assets |
Securitized | 58.1% |
Treasury | 21.4% |
Corporate Credit | 16.4% |
Government Related | 0.5% |
Registered Investment Companies | 6.2% |
Other | |
Net Other Assets (Liabilities) | -2.6% |
| | 100.0% |
| | |
Bloomberg Barclays
U.S. Aggregate Index
Sector Allocation | % of
Index |
Treasury | 39.6% |
Corporate Credit | 25.1% |
Agency | 1.3% |
Agency RMBS/CMBS | 27.9% |
Asset-Backed Securities | 0.4% |
Non-Agency RMBS/CMBS | 1.3% |
Non-Corporate Credit | 4.4% |
| | 100.0% |
DIAMOND HILL FUNDS | ANNUAL REPORT | DECEMBER 31, 2019 | DIAMOND-HILL.COM 103 |
Diamond Hill Funds
Tabular Presentation of Schedules of Investments (Continued)
December 31, 2019 (Unaudited)
Diamond Hill Corporate Credit Fund |
Sector Allocation | % of
Net Assets |
Financial Services | 14.4% |
Energy | 9.8% |
Retail | 8.4% |
Basic Industry | 7.8% |
Health Care | 5.7% |
Media | 5.2% |
Services | 4.3% |
Consumer Goods | 4.3% |
Telecommunications | 4.0% |
Capital Goods | 3.8% |
Real Estate | 2.9% |
Insurance | 2.7% |
Leisure | 2.5% |
Automotive | 2.1% |
Banking | 1.9% |
Technology & Electronics | 0.9% |
Transportation | 0.2% |
Registered Investment Companies | 17.9% |
Other | |
Collateralized Debt Obligations | 0.1% |
Net Other Assets (Liabilities) | 1.1% |
| | 100.0% |
| | |
ICE BofA U.S. Corporate &
High Yield Index
Sector Allocation | % of
Index |
Financial Services | 2.8% |
Energy | 11.6% |
Retail | 3.4% |
Basic Industry | 5.4% |
Health Care | 9.5% |
Media | 4.4% |
Services | 1.7% |
Consumer Goods | 5.8% |
Telecommunications | 5.2% |
Capital Goods | 4.8% |
Real Estate | 2.5% |
Insurance | 3.6% |
Leisure | 1.0% |
Automotive | 2.5% |
Banking | 19.0% |
Technology & Electronics | 7.1% |
Transportation | 2.2% |
Utility | 7.5% |
| | 100.0% |
Diamond Hill High Yield Fund |
Sector Allocation | % of
Net Assets |
Financial Services | 16.9% |
Energy | 13.4% |
Retail | 10.1% |
Basic Industry | 8.4% |
Health Care | 6.5% |
Media | 5.7% |
Services | 5.0% |
Consumer Goods | 4.3% |
Capital Goods | 4.1% |
Insurance | 3.6% |
Leisure | 2.7% |
Automotive | 2.6% |
Real Estate | 2.5% |
Telecommunications | 2.4% |
Consumer | 2.4% |
Banking | 1.0% |
Technology & Electronics | 1.0% |
Auto Loan | 0.5% |
Transportation | 0.4% |
ABS - Other | 0.4% |
Credit Cards | 0.2% |
Non Agency MBS CMO | 0.1% |
Equipment | 0.1% |
Registered Investment Companies | 4.3% |
Other | |
Net Other Assets (Liabilities) | 1.4% |
| | 100.0% |
| | |
ICE BofA U.S. High Yield Index
Sector Allocation | % of
Index |
Financial Services | 4.4% |
Energy | 12.5% |
Retail | 4.7% |
Basic Industry | 10.4% |
Health Care | 10.4% |
Media | 10.8% |
Services | 5.8% |
Consumer Goods | 3.5% |
Capital Goods | 6.6% |
Insurance | 1.1% |
Leisure | 5.0% |
Automotive | 2.0% |
Real Estate | 1.7% |
Telecommunications | 10.6% |
Banking | 1.7% |
Technology & Electronics | 5.1% |
Transportation | 1.1% |
Utility | 2.6% |
| | 100.0% |
104 DIAMOND HILL FUNDS | ANNUAL REPORT | DECEMBER 31, 2019 | DIAMOND-HILL.COM |
(Page intentionally left blank)
DIAMOND HILL FUNDS | ANNUAL REPORT | DECEMBER 31, 2019 | DIAMOND-HILL.COM 105 |
Diamond Hill Funds
Statements of Assets & Liabilities
December 31, 2019
| | | Small Cap
Fund | | | Small-Mid
Cap
Fund | | | Mid Cap
Fund | |
Assets | | | | | | | | | | | | |
Investment in unaffiliated securities, at cost | | $ | 529,289,680 | | | $ | 2,026,657,200 | | | $ | 204,600,124 | |
Investment in affiliated securities, at cost | | | — | | | | 40,566,610 | | | | 2,340,897 | |
Investment in unaffiliated securities, at fair value* | | $ | 804,561,740 | | | $ | 2,508,517,281 | | | $ | 232,023,141 | |
Investments in affiliated securities, at fair value | | | — | | | | 40,751,490 | | | | 2,345,400 | |
Cash | | | — | | | | — | | | | — | |
Cash deposits with custodian for securities sold short | | | — | | | | — | | | | — | |
Receivable for fund shares issued | | | 388,178 | | | | 778,472 | | | | 365,466 | |
Receivable for investments sold | | | 2,115,419 | | | | — | | | | — | |
Receivable for dividends and interest | | | 1,113,020 | | | | 2,532,480 | | | | 223,489 | |
Prepaid expenses and other assets | | | 129 | | | | 165 | | | | — | |
Total Assets | | | 808,178,486 | | | | 2,552,579,888 | | | | 234,957,496 | |
| | | | | | | | | | | | | |
Liabilities | | | | | | | | | | | | |
Investments sold short, at fair value (proceeds $–,$–,$–,$–,$–, $963,079,987,$11,981,934,$–,$– and $–) | | | — | | | | — | | | | — | |
Due to custodian | | | — | | | | — | | | | — | |
Payable for securities purchased | | | — | | | | — | | | | 377,875 | |
Payable for fund shares redeemed | | | 715,851 | | | | 5,102,813 | | | | 336,985 | |
Payable for dividend expense on securities sold short | | | — | | | | — | | | | — | |
Payable for return of collateral received for securities on loan | | | 53,910,257 | | | | 109,189,881 | | | | 4,102,191 | |
Payable to Investment Adviser | | | 515,872 | | | | 1,525,989 | | | | 114,690 | |
Payable to Administrator | | | 105,256 | | | | 239,970 | | | | 31,721 | |
Accrued distribution and service fees | | | 47,173 | | | | 58,181 | | | | 6,735 | |
Other accrued expenses | | | 600 | | | | 600 | | | | 600 | |
Total Liabilities | | | 55,295,009 | | | | 116,117,434 | | | | 4,970,797 | |
| | | | | | | | | | | | | |
Net Assets | | $ | 752,883,477 | | | $ | 2,436,462,454 | | | $ | 229,986,699 | |
| | | | | | | | | | | | | |
Components of Net Assets | | | | | | | | | | | | |
Paid-in capital | | $ | 479,027,360 | | | $ | 1,965,855,300 | | | $ | 202,797,063 | |
Distributable earnings | | | 273,856,117 | | | | 470,607,154 | | | | 27,189,636 | |
Net Assets | | $ | 752,883,477 | | | $ | 2,436,462,454 | | | $ | 229,986,699 | |
Net Assets | | | | | | | | | | | | |
Class A Shares | | $ | 165,338,606 | | | $ | 183,913,631 | | | $ | 31,996,543 | |
Class C Shares | | $ | 13,500,892 | | | $ | 23,472,157 | | | $ | — | |
Class I Shares | | $ | 469,013,677 | | | $ | 1,081,618,933 | | | $ | 177,536,070 | |
Class Y Shares | | $ | 105,030,302 | | | $ | 1,147,457,733 | | | $ | 20,454,086 | |
Shares of beneficial interest outstanding (unlimited number of shares authorized, no par value) | | | | | | | | | | | | |
Class A Shares | | | 5,293,946 | | | | 8,148,726 | | | | 2,185,272 | |
Class C Shares | | | 512,712 | | | | 1,151,781 | | | | — | |
Class I Shares | | | 14,763,400 | | | | 47,448,699 | | | | 12,087,315 | |
Class Y Shares | | | 3,303,256 | | | | 50,232,620 | | | | 1,388,313 | |
Net Asset Value, offering (except Class A Shares) and redemption price per share: | | | | | | | | | | | | |
Class A Shares | | $ | 31.23 | | | $ | 22.57 | | | $ | 14.64 | |
Class C Shares(A) | | $ | 26.33 | | | $ | 20.38 | | | $ | — | |
Class I Shares | | $ | 31.77 | | | $ | 22.80 | | | $ | 14.69 | |
Class Y Shares | | $ | 31.80 | | | $ | 22.84 | | | $ | 14.73 | |
Maximum Offering Price | | | | | | | | | | | | |
Maximum sales charge — Class A Shares | | | 5.00 | % | | | 5.00 | % | | | 5.00 | % |
(100%/(100%-maximum sales charge) of net asset value adjusted to the nearest cent) per share Class A Shares | | $ | 32.87 | | | $ | 23.76 | | | $ | 15.41 | |
* Includes value of securities on loan | | $ | 162,695,070 | | | $ | 190,937,589 | | | $ | 5,712,625 | |
(A) | Redemption price per share varies based on the holding period. |
See accompanying Notes to Financial Statements.
106 DIAMOND HILL FUNDS | ANNUAL REPORT | DECEMBER 31, 2019 | DIAMOND-HILL.COM |
| | Large Cap
Fund | | | All Cap
Select
Fund | | | Long-Short
Fund | | | Research
Opportunities
Fund | | | Global
Fund | | | International
Fund | | | Short
Duration Total
Return Fund | |
| | | | | | | | | | | | | | | | | | | | | | | | | | | | |
| | $ | 4,731,934,313 | | | $ | 234,813,717 | | | $ | 2,983,089,376 | | | $ | 79,961,550 | | | $ | 20,190,747 | | | $ | 12,639,731 | | | $ | 847,587,968 | |
| | | — | | | | — | | | | 68,054,113 | | | | — | | | | — | | | | — | | | | — | |
| | $ | 6,765,540,509 | | | $ | 280,078,887 | | | $ | 3,949,277,491 | | | $ | 93,219,992 | | | $ | 22,393,988 | | | $ | 13,854,845 | | | $ | 849,143,011 | |
| | | — | | | | — | | | | 68,433,025 | | | | — | | | | — | | | | — | | | | — | |
| | | — | | | | — | | | | — | | | | 35 | | | | 4 | | | | — | | | | 592 | |
| | | — | | | | — | | | | 1,064,461,553 | | | | 15,980,900 | | | | — | | | | — | | | | — | |
| | | 18,884,300 | | | | 72,347 | | | | 4,921,994 | | | | 15,415 | | | | — | | | | — | | | | 1,137,805 | |
| | | — | | | | — | | | | 35,297,238 | | | | 1,870,969 | | | | — | | | | — | | | | 59,376 | |
| | | 8,511,066 | | | | 348,080 | | | | 3,512,396 | | | | 66,307 | | | | 35,360 | | | | 17,452 | | | | 2,085,160 | |
| | | 567 | | | | 90 | | | | 96 | | | | 48 | | | | — | | | | — | | | | — | |
| | | 6,792,936,442 | | | | 280,499,404 | | | | 5,125,903,793 | | | | 111,153,666 | | | | 22,429,352 | | | | 13,872,297 | | | | 852,425,944 | |
| | | | | | | | | | | | | | | | | | | | | | | | | | | | |
| | | | | | | | | | | | | | | | | | | | | | | | | | | | |
| | | — | | | | — | | | | 1,056,982,316 | | | | 14,354,983 | | | | — | | | | — | | | | — | |
| | | — | | | | — | | | | — | | | | — | | | | — | | | | 476 | | | | — | |
| | | — | | | | 210,448 | | | | 3,393,556 | | | | 2,886,492 | | | | — | | | | — | | | | 3,909,784 | |
| | | 6,387,143 | | | | 12,263 | | | | 2,615,757 | | | | 11,330 | | | | — | | | | — | | | | 877,005 | |
| | | — | | | | — | | | | 2,817,453 | | | | 34,079 | | | | — | | | | — | | | | — | |
| | | 9,680,151 | | | | 7,741,480 | | | | 528,811,125 | | | | 17,217,746 | | | | 559,056 | | | | 372,210 | | | | 38,637,375 | |
| | | 2,854,741 | | | | 150,247 | | | | 2,688,268 | | | | 62,957 | | | | 11,555 | | | | 7,248 | | | | 237,313 | |
| | | 859,866 | | | | 28,295 | | | | 491,641 | | | | 9,660 | | | | 1,534 | | | | 942 | | | | 93,293 | |
| | | 332,232 | | | | 6,355 | | | | 85,724 | | | | 3,479 | | | | 23 | | | | 6 | | | | 11,506 | |
| | | 600 | | | | 600 | | | | 600 | | | | 1,560 | | | | 2,190 | | | | 1,122 | | | | 600 | |
| | | 20,114,733 | | | | 8,149,688 | | | | 1,597,886,440 | | | | 34,582,286 | | | | 574,358 | | | | 382,004 | | | | 43,766,876 | |
| | | | | | | | | | | | | | | | | | | | | | | | | | | | |
| | $ | 6,772,821,709 | | | $ | 272,349,716 | | | $ | 3,528,017,353 | | | $ | 76,571,380 | | | $ | 21,854,994 | | | $ | 13,490,293 | | | $ | 808,659,068 | |
| | | | | | | | | | | | | | | | | | | | | | | | | | | | |
| | | | | | | | | | | | | | | | | | | | | | | | | | | | |
| | $ | 4,755,924,926 | | | $ | 232,142,441 | | | $ | 2,644,188,839 | | | $ | 65,665,345 | | | $ | 20,158,733 | | | $ | 12,193,099 | | | $ | 807,120,281 | |
| | | 2,016,896,783 | | | | 40,207,275 | | | | 883,828,514 | | | | 10,906,035 | | | | 1,696,261 | | | | 1,297,194 | | | | 1,538,787 | |
| | $ | 6,772,821,709 | | | $ | 272,349,716 | | | $ | 3,528,017,353 | | | $ | 76,571,380 | | | $ | 21,854,994 | | | $ | 13,490,293 | | | $ | 808,659,068 | |
| | | | | | | | | | | | | | | | | | | | | | | | | | | | |
| | $ | 1,243,451,953 | | | $ | 11,049,177 | | | $ | 234,584,494 | | | $ | 10,645,629 | | | $ | 110,699 | | | $ | 45,426 | | | $ | 55,727,173 | |
| | $ | 83,935,756 | | | $ | 4,747,329 | | | $ | 41,746,730 | | | $ | 1,367,982 | | | $ | — | | | $ | — | | | $ | — | |
| | $ | 3,877,615,544 | | | $ | 152,590,686 | | | $ | 2,959,933,116 | | | $ | 45,157,860 | | | $ | 6,216,195 | | | $ | 3,828,422 | | | $ | 525,994,114 | |
| | $ | 1,567,818,456 | | | $ | 103,962,524 | | | $ | 291,753,013 | | | $ | 19,399,909 | | | $ | 15,528,100 | | | $ | 9,616,445 | | | $ | 226,937,781 | |
| | | | | | | | | | | | | | | | | | | | | | | | | | | | |
| | | 43,087,660 | | | | 683,261 | | | | 8,921,803 | | | | 454,175 | | | | 7,354 | | | | 3,096 | | | | 5,510,847 | |
| | | 3,080,230 | | | | 316,814 | | | | 1,808,511 | | | | 62,472 | | | | — | | | | — | | | | — | |
| | | 133,494,730 | | | | 9,350,600 | | | | 109,711,386 | | | | 1,896,300 | | | | 412,135 | | | | 260,591 | | | | 51,999,806 | |
| | | 53,933,852 | | | | 6,351,561 | | | | 10,767,638 | | | | 811,548 | | | | 1,028,641 | | | | 654,738 | | | | 22,418,835 | |
| | | | | | | | | | | | | | | | | | | | | | | | | | | | |
| | $ | 28.86 | | | $ | 16.17 | | | $ | 26.29 | | | $ | 23.44 | | | $ | 15.05 | | | $ | 14.67 | | | $ | 10.11 | |
| | $ | 27.25 | | | $ | 14.98 | | | $ | 23.08 | | | $ | 21.90 | | | $ | — | | | $ | — | | | $ | — | |
| | $ | 29.05 | | | $ | 16.32 | | | $ | 26.98 | | | $ | 23.81 | | | $ | 15.08 | | | $ | 14.69 | | | $ | 10.12 | |
| | $ | 29.07 | | | $ | 16.37 | | | $ | 27.10 | | | $ | 23.90 | | | $ | 15.10 | | | $ | 14.69 | | | $ | 10.12 | |
| | | | | | | | | | | | | | | | | | | | | | | | | | | | |
| | | 5.00 | % | | | 5.00 | % | | | 5.00 | % | | | 5.00 | % | | | 5.00 | % | | | 5.00 | % | | | 2.25 | % |
| | $ | 30.38 | | | $ | 17.02 | | | $ | 27.67 | | | $ | 24.67 | | | $ | 15.84 | | | $ | 15.44 | | | $ | 10.34 | |
| | $ | 31,194,489 | | | $ | 7,554,023 | | | $ | 518,894,516 | | | $ | 16,911,205 | | | $ | 544,148 | | | $ | 572,453 | | | $ | 38,613,433 | |
DIAMOND HILL FUNDS | ANNUAL REPORT | DECEMBER 31, 2019 | DIAMOND-HILL.COM 107 |
Diamond Hill Funds
Statements of Assets & Liabilities (Continued)
December 31, 2019
| | | Core Bond
Fund | | | Corporate
Credit Fund | | | High Yield
Fund | |
Assets | | | | | | | | | | | | |
Investment in unaffiliated securities, at cost | | $ | 123,588,775 | | | $ | 1,063,384,870 | | | $ | 130,854,658 | |
Investment in affiliated securities, at cost | | | — | | | | 50,862,863 | | | | — | |
Investment in unaffiliated securities, at fair value* | | $ | 125,191,176 | | | $ | 1,077,014,499 | | | $ | 132,902,013 | |
Investments in affiliated securities, at fair value | | | — | | | | 51,021,763 | | | | — | |
Cash | | | 53 | | | | — | | | | — | |
Receivable for fund shares issued | | | 193,277 | | | | 4,565,118 | | | | 416,749 | |
Receivable for investments sold | | | — | | | | 3,373,716 | | | | 759,455 | |
Receivable for dividends and interest | | | 535,456 | | | | 14,576,231 | | | | 1,887,774 | |
Total Assets | | | 125,919,962 | | | | 1,150,551,327 | | | | 135,965,991 | |
| | | | | | | | | | | | | |
Liabilities | | | | | | | | | | | | |
Due to custodian | | | — | | | | 21 | | | | — | |
Payable for securities purchased | | | — | | | | 7,252,878 | | | | 920,452 | |
Payable for fund shares redeemed | | | 988,464 | | | | 842,729 | | | | 72,902 | |
Payable for return of collateral received for securities on loan | | | 2,838,375 | | | | 1,106,825 | | | | 136,500 | |
Payable to Investment Adviser | | | 31,072 | | | | 414,311 | | | | 56,580 | |
Payable to Administrator | | | 12,387 | | | | 158,791 | | | | 17,640 | |
Accrued distribution and service fees | | | 751 | | | | 47,472 | | | | 3,854 | |
Other accrued expenses | | | 600 | | | | 600 | | | | 600 | |
Total Liabilities | | | 3,871,649 | | | | 9,823,627 | | | | 1,208,528 | |
| | | | | | | | | | | | | |
Net Assets | | $ | 122,048,313 | | | $ | 1,140,727,700 | | | $ | 134,757,463 | |
| | | | | | | | | | | | | |
Components of Net Assets | | | | | | | | | | | | |
Paid-in capital | | $ | 120,655,746 | | | $ | 1,122,169,966 | | | $ | 131,837,569 | |
Distributable earnings | | | 1,392,567 | | | | 18,557,734 | | | | 2,919,894 | |
Net Assets | | $ | 122,048,313 | | | $ | 1,140,727,700 | | | $ | 134,757,463 | |
Net Assets | | | | | | | | | | | | |
Class A Shares | | $ | 3,599,039 | | | $ | 120,013,949 | | | $ | 18,004,320 | |
Class C Shares | | $ | — | | | $ | 26,683,204 | | | $ | — | |
Class I Shares | | $ | 66,173,945 | | | $ | 911,514,487 | | | $ | 96,563,319 | |
Class Y Shares | | $ | 52,275,329 | | | $ | 82,516,060 | | | $ | 20,189,824 | |
Shares of beneficial interest outstanding (unlimited number of shares authorized, no par value) | | | | | | | | | | | | |
Class A Shares | | | 353,247 | | | | 10,459,062 | | | | 1,633,799 | |
Class C Shares | | | ��� | | | | 2,334,112 | | | | — | |
Class I Shares | | | 6,495,697 | | | | 79,707,838 | | | | 8,757,564 | |
Class Y Shares | | | 5,127,414 | | | | 7,219,377 | | | | 1,831,170 | |
Net Asset Value, offering (except Class A Shares) and redemption price per share: | | | | | | | | | | | | |
Class A Shares | | $ | 10.19 | | | $ | 11.47 | | | $ | 11.02 | |
Class C Shares(A) | | $ | — | | | $ | 11.43 | | | $ | — | |
Class I Shares | | $ | 10.19 | | | $ | 11.44 | | | $ | 11.03 | |
Class Y Shares | | $ | 10.20 | | | $ | 11.43 | | | $ | 11.03 | |
Maximum Offering Price | | | | | | | | | | | | |
Maximum sales charge — Class A Shares | | | 3.50 | % | | | 3.50 | % | | | 3.50 | % |
(100%/(100%-maximum sales charge) of net asset value adjusted to the nearest cent) per share Class A Shares | | $ | 10.56 | | | $ | 11.89 | | | $ | 11.42 | |
* Includes value of securities on loan | | $ | 5,076,017 | | | $ | 1,074,785 | | | $ | 133,536 | |
(A) | Redemption price per share varies based on the holding period. |
See accompanying Notes to Financial Statements.
108 DIAMOND HILL FUNDS | ANNUAL REPORT | DECEMBER 31, 2019 | DIAMOND-HILL.COM |
Diamond Hill Funds
Statements of Operations
For the year ended December 31, 2019
| | | Small Cap
Fund | | | Small-Mid
Cap
Fund | | | Mid Cap
Fund | | | Large Cap
Fund | | | All Cap
Select
Fund | |
Investment Income | | | | | | | | | | | | | | | | | | | | |
Dividends | | $ | 12,464,669 | | | $ | 30,239,915 | | | $ | 2,427,247 | | | $ | 120,084,775 | | | $ | 3,674,807 | |
Income distributions from affiliated investments | | | 213,534 | | | | 1,652,814 | | | | 95,126 | | | | — | | | | — | |
Securities lending income | | | 411,899 | | | | 958,024 | | | | 38,037 | | | | 129,216 | | | | 23,297 | |
Foreign taxes withheld | | | (13,943 | ) | | | (44,060 | ) | | | — | | | | — | | | | (4,125 | ) |
Total Investment Income | | | 13,076,159 | | | | 32,806,693 | | | | 2,560,410 | | | | 120,213,991 | | | | 3,693,979 | |
| | | | | | | | | | | | | | | | | | | | | |
Expenses | | | | | | | | | | | | | | | | | | | | |
Investment advisory fees | | | 7,026,511 | | | | 17,260,636 | | | | 1,066,902 | | | | 30,038,587 | | | | 1,589,379 | |
Administration fees | | | 1,426,229 | | | | 2,704,173 | | | | 285,349 | | | | 9,158,582 | | | | 302,209 | |
Distribution and service fees — Class A | | | 469,751 | | | | 441,377 | | | | 71,694 | | | | 2,936,863 | | | | 24,165 | |
Distribution and service fees — Class C | | | 214,510 | | | | 260,763 | | | | — | | | | 845,970 | | | | 62,451 | |
Proxy expenses | | | 69,504 | | | | 186,663 | | | | 14,718 | | | | 470,810 | | | | 17,099 | |
Other fees | | | 3,588 | | | | 6,140 | | | | 1,866 | | | | 13,145 | | | | 1,923 | |
Total Expenses | | | 9,210,093 | | | | 20,859,752 | | | | 1,440,529 | | | | 43,463,957 | | | | 1,997,226 | |
Advisory fees waived by Adviser | | | (20,711 | ) | | | (139,722 | ) | | | (8,042 | ) | | | — | | | | — | |
Net Expenses | | | 9,189,382 | | | | 20,720,030 | | | | 1,432,487 | | | | 43,463,957 | | | | 1,997,226 | |
| | | | | | | | | | | | | | | | | | | | | |
Net Investment Income | | | 3,886,777 | | | | 12,086,663 | | | | 1,127,923 | | | | 76,750,034 | | | | 1,696,753 | |
| | | | | | | | | | | | | | | | | | | | | |
Realized and Unrealized Gains (Losses) on Investments | | | | | | | | | | | | | | | | | | | | |
Net realized gains (losses) on investment transactions | | | 43,407,684 | | | | 108,293,002 | | | | 4,287,802 | | | | 153,325,517 | | | | (5,032,474 | ) |
Net realized gains on sales from affiliated investments | | | 71,515 | | | | — | | | | — | | | | — | | | | — | |
Net change in unrealized appreciation (depreciation) on unaffiliated investments | | | 134,515,832 | | | | 426,831,327 | | | | 29,182,564 | | | | 1,396,404,458 | | | | 63,270,956 | |
Net change in unrealized appreciation (depreciation) on affiliated investments | | | 31,853 | | | | 229,651 | | | | 13,217 | | | | — | | | | — | |
Net Realized and Unrealized Gains on Investments | | | 178,026,884 | | | | 535,353,980 | | | | 33,483,583 | | | | 1,549,729,975 | | | | 58,238,482 | |
| | | | | | | | | | | | | | | | | | | | | |
Change in Net Assets from Operations | | $ | 181,913,661 | | | $ | 547,440,643 | | | $ | 34,611,506 | | | $ | 1,626,480,009 | | | $ | 59,935,235 | |
See accompanying Notes to Financial Statements.
DIAMOND HILL FUNDS | ANNUAL REPORT | DECEMBER 31, 2019 | DIAMOND-HILL.COM 109 |
Diamond Hill Funds
Statements of Operations
For the year ended December 31, 2019(A)
| | | Long-Short
Fund | | | Research
Opportunities
Fund | | | Global
Fund | | | International
Fund | |
Investment Income | | | | | | | | | | | | | | | | |
Dividends | | $ | 60,427,697 | | | $ | 861,858 | | | $ | 390,746 | | | $ | 94,085 | |
Non-cash income | | | 5,115,549 | | | | 77,784 | | | | — | | | | — | |
Income distributions from affiliated investments | | | 3,230,799 | | | | — | | | | — | | | | — | |
Rebates on short sales, net of fees | | | 16,610,428 | | | | 164,043 | | | | — | | | | — | |
Interest | | | — | | | | 45,172 | | | | — | | | | — | |
Securities lending income | | | 1,332,804 | | | | 30,084 | | | | 4,985 | | | | 228 | |
Foreign taxes withheld | | | — | | | | (5,925 | ) | | | (15,107 | ) | | | (6,669 | ) |
Total Investment Income | | | 86,717,277 | | | | 1,173,016 | | | | 380,624 | | | | 87,644 | |
| | | | | | | | | | | | | | | | | |
Expenses | | | | | | | | | | | | | | | | |
Investment advisory fees | | | 32,578,051 | | | | 664,051 | | | | 119,608 | | | | 35,821 | |
Administration fees | | | 5,888,590 | | | | 99,764 | | | | 15,834 | | | | 4,676 | |
Distribution and service fees — Class A | | | 507,594 | | | | 20,142 | | | | 254 | | | | 21 | |
Distribution and service fees — Class C | | | 729,624 | | | | 15,287 | | | | — | | | | — | |
Proxy expenses | | | 302,590 | | | | 6,017 | | | | 1,426 | | | | — | |
Other fees | | | 5,340 | | | | 3,748 | | | | 5,328 | | | | 5,391 | |
Dividend expense | | | 17,681,502 | | | | 260,784 | | | | — | | | | — | |
Total Expenses | | | 57,693,291 | | | | 1,069,793 | | | | 142,450 | | | | 45,909 | |
Advisory fees waived by Adviser | | | (280,403 | ) | | | — | | | | — | | | | — | |
Net Expenses | | | 57,412,888 | | | | 1,069,793 | | | | 142,450 | | | | 45,909 | |
| | | | | | | | | | | | | | | | | |
Net Investment Income | | | 29,304,389 | | | | 103,223 | | | | 238,174 | | | | 41,735 | |
| | | | | | | | | | | | | | | | | |
Realized and Unrealized Gains (Losses) on Investments | | | | | | | | | | | | | | | | |
Net realized gains (losses) on investment transactions | | | 258,373,667 | | | | 6,019,111 | | | | (545,811 | ) | | | 96,557 | |
Net realized losses on closed short positions | | | (10,450,631 | ) | | | (1,297,905 | ) | | | — | | | | — | |
Net realized gains on sales from affiliated investments | | | 217,544 | | | | — | | | | — | | | | — | |
Net realized gains (losses) on foreign currency transactions | | | — | | | | 23 | | | | (2,919 | ) | | | (4,314 | ) |
Net change in unrealized appreciation (depreciation) on unaffiliated investments and foreign currency translations | | | 475,370,983 | | | | 11,101,262 | | | | 5,007,625 | | | | 988,061 | |
Net change in unrealized appreciation (depreciation) on affiliated investments | | | 541,718 | | | | — | | | | — | | | | — | |
Net Realized and Unrealized Gains on Investments | | | 724,053,281 | | | | 15,822,491 | | | | 4,458,895 | | | | 1,080,304 | |
| | | | | | | | | | | | | | | | | |
Change in Net Assets from Operations | | $ | 753,357,670 | | | $ | 15,925,714 | | | $ | 4,697,069 | | | $ | 1,122,039 | |
(A) | Except for the International Fund, which represents the period from the commencement of operations on July 1, 2019. |
See accompanying Notes to Financial Statements.
110 DIAMOND HILL FUNDS | ANNUAL REPORT | DECEMBER 31, 2019 | DIAMOND-HILL.COM |
Diamond Hill Funds
Statements of Operations
For the year ended December 31, 2019
| | | Short
Duration Total
Return Fund | | | Core Bond
Fund | | | Corporate
Credit Fund | | | High Yield
Fund | |
Investment Income | | | | | | | | | | | | | | | | |
Dividends | | $ | 403,928 | | | $ | 44,304 | | | $ | 2,650,294 | | | $ | 127,459 | |
Income distributions from affiliated investments | | | — | | | | — | | | | 1,820,369 | | | | — | |
Interest | | | 30,298,211 | | | | 2,525,262 | | | | 52,441,161 | | | | 6,159,350 | |
Securities lending income | | | 72,492 | | | | 7,523 | | | | 174,354 | | | | 15,086 | |
Total Investment Income | | | 30,774,631 | | | | 2,577,089 | | | | 57,086,178 | | | | 6,301,895 | |
| | | | | | | | | | | | | | | | | |
Expenses | | | | | | | | | | | | | | | | |
Investment advisory fees | | | 2,381,851 | | | | 245,137 | | | | 4,300,483 | | | | 484,423 | |
Administration fees | | | 879,530 | | | | 87,830 | | | | 1,611,466 | | | | 135,610 | |
Distribution and service fees — Class A | | | 82,536 | | | | 8,166 | | | | 238,144 | | | | 26,750 | |
Distribution and service fees — Class C | | | — | | | | — | | | | 269,929 | | | | — | |
Proxy expenses | | | 55,839 | | | | 4,978 | | | | 77,673 | | | | 7,575 | |
Other fees | | | 3,065 | | | | 1,808 | | | | 3,406 | | | | 1,874 | |
Total Expenses | | | 3,402,821 | | | | 347,919 | | | | 6,501,101 | | | | 656,232 | |
Advisory fees waived by Adviser | | | — | | | | — | | | | (151,035 | ) | | | — | |
Net Expenses | | | 3,402,821 | | | | 347,919 | | | | 6,350,066 | | | | 656,232 | |
| | | | | | | | | | | | | | | | | |
Net Investment Income | | | 27,371,810 | | | | 2,229,170 | | | | 50,736,112 | | | | 5,645,663 | |
| | | | | | | | | | | | | | | | | |
Realized and Unrealized Gains on Investments | | | | | | | | | | | | | | | | |
Net realized gains on investment transactions | | | 1,015,899 | | | | 60,911 | | | | 17,453,211 | | | | 2,638,308 | |
Net change in unrealized appreciation (depreciation) on unaffiliated investments | | | 2,725,507 | | | | 2,528,695 | | | | 42,821,716 | | | | 3,988,723 | |
Net change in unrealized appreciation (depreciation) on affiliated investments | | | — | | | | — | | | | 172,727 | | | | — | |
Net Realized and Unrealized Gains on Investments | | | 3,741,406 | | | | 2,589,606 | | | | 60,447,654 | | | | 6,627,031 | |
| | | | | | | | | | | | | | | | | |
Change in Net Assets from Operations | | $ | 31,113,216 | | | $ | 4,818,776 | | | $ | 111,183,766 | | | $ | 12,272,694 | |
See accompanying Notes to Financial Statements.
DIAMOND HILL FUNDS | ANNUAL REPORT | DECEMBER 31, 2019 | DIAMOND-HILL.COM 111 |
Diamond Hill Funds
Statements of Changes in Net Assets
| | | Small Cap Fund | | | | Small-Mid Cap Fund | |
| | | For the year
ended
December 31,
2019 | | | For the year
ended
December 31,
2018 | | | | For the year
ended
December 31,
2019 | | | For the year
ended
December 31,
2018 | |
From Operations | | | | | | | | | | | | | | | | | |
Net investment income | | $ | 3,886,777 | | | $ | 7,671,377 | | | | $ | 12,086,663 | | | $ | 12,937,051 | |
Net realized gains on investment transactions | | | 43,407,684 | | | | 121,921,045 | | | | | 108,293,002 | | | | 101,430,784 | |
Net realized gains (losses) on sales from affiliated investments | | | 71,515 | | | | (41,074 | ) | | | | — | | | | (52,594 | ) |
Net change in unrealized appreciation (depreciation) on investments | | | 134,547,685 | | | | (326,779,711 | ) | | | | 427,060,978 | | | | (414,263,031 | ) |
Change in Net Assets from Operations | | | 181,913,661 | | | | (197,228,363 | ) | | | | 547,440,643 | | | | (299,947,790 | ) |
| | | | | | | | | | | | | | | | | | |
Distributions to Shareholders | | | | | | | | | | | | | | | | | |
Class A | | | (11,081,916 | ) | | | (21,544,214 | ) | | | | (8,510,329 | ) | | | (7,233,763 | ) |
Class C | | | (914,244 | ) | | | (3,026,893 | ) | | | | (1,042,724 | ) | | | (1,242,375 | ) |
Class I | | | (32,495,066 | ) | | | (65,045,099 | ) | | | | (53,022,453 | ) | | | (44,066,789 | ) |
Class Y | | | (7,210,933 | ) | | | (14,178,428 | ) | | | | (56,784,896 | ) | | | (44,583,827 | ) |
Change in Net Assets from Distributions to Shareholders | | | (51,702,159 | ) | | | (103,794,634 | ) | | | | (119,360,402 | ) | | | (97,126,754 | ) |
Change in Net Assets from Capital Transactions | | | (397,795,555 | ) | | | (168,572,434 | ) | | | | 4,058,507 | | | | (111,405,115 | ) |
| | | | | | | | | | | | | | | | | | |
Total Change in Net Assets | | | (267,584,053 | ) | | | (469,595,431 | ) | | | | 432,138,748 | | | | (508,479,659 | ) |
| | | | | | | | | | | | | | | | | | |
Net Assets: | | | | | | | | | | | | | | | | | |
Beginning of year | | | 1,020,467,530 | | | | 1,490,062,961 | | | | | 2,004,323,706 | | | | 2,512,803,365 | |
End of year | | $ | 752,883,477 | | | $ | 1,020,467,530 | | | | $ | 2,436,462,454 | | | $ | 2,004,323,706 | |
See accompanying Notes to Financial Statements.
112 DIAMOND HILL FUNDS | ANNUAL REPORT | DECEMBER 31, 2019 | DIAMOND-HILL.COM |
Diamond Hill Funds
Statements of Changes in Net Assets
| | | Small Cap Fund | | | | Small-Mid Cap Fund | |
| | | For the year
ended
December 31,
2019 | | | For the year
ended
December 31,
2018 | | | | For the year
ended
December 31,
2019 | | | For the year
ended
December 31,
2018 | |
Capital Transactions | | | | | | | | | | | | | | | | | |
Class A | | | | | | | | | | | | | | | | | |
Proceeds from shares sold | | $ | 40,572,163 | | | $ | 34,510,105 | | | | $ | 19,071,426 | | | $ | 29,154,498 | |
Reinvested distributions | | | 9,218,750 | | | | 18,530,587 | | | | | 8,403,243 | | | | 7,147,518 | |
Payments for shares redeemed | | | (127,190,166 | ) | | | (131,914,433 | ) | | | | (41,483,324 | ) | | | (70,032,277 | ) |
Change in Net Assets from Class A Share Transactions | | | (77,399,253 | ) | | | (78,873,741 | ) | | | | (14,008,655 | ) | | | (33,730,261 | ) |
Class C | | | | | | | | | | | | | | | | | |
Proceeds from shares sold | | | 180,767 | | | | 549,752 | | | | | 1,276,636 | | | | 2,782,074 | |
Reinvested distributions | | | 868,236 | | | | 2,876,706 | | | | | 943,392 | | | | 1,109,830 | |
Payments for shares redeemed | | | (15,421,215 | ) | | | (16,993,873 | ) | | | | (9,570,431 | ) | | | (10,027,604 | ) |
Change in Net Assets from Class C Share Transactions | | | (14,372,212 | ) | | | (13,567,415 | ) | | | | (7,350,403 | ) | | | (6,135,700 | ) |
Class I | | | | | | | | | | | | | | | | | |
Proceeds from shares sold | | | 102,690,833 | | | | 230,352,106 | | | | | 166,954,890 | | | | 244,977,494 | |
Reinvested distributions | | | 29,931,706 | | | | 60,550,870 | | | | | 45,265,874 | | | | 37,120,193 | |
Payments for shares redeemed | | | (377,598,787 | ) | | | (347,680,284 | ) | | | | (210,272,651 | ) | | | (323,849,577 | ) |
Change in Net Assets from Class I Share Transactions | | | (244,976,248 | ) | | | (56,777,308 | ) | | | | 1,948,113 | | | | (41,751,890 | ) |
Class Y | | | | | | | | | | | | | | | | | |
Proceeds from shares sold | | | 21,087,012 | | | | 26,337,863 | | | | | 132,509,204 | | | | 124,365,405 | |
Reinvested distributions | | | 7,178,960 | | | | 14,137,621 | | | | | 54,789,928 | | | | 42,827,667 | |
Payments for shares redeemed | | | (89,313,814 | ) | | | (59,829,454 | ) | | | | (163,829,680 | ) | | | (196,980,336 | ) |
Change in Net Assets from Class Y Share Transactions | | | (61,047,842 | ) | | | (19,353,970 | ) | | | | 23,469,452 | | | | (29,787,264 | ) |
Change in Net Assets from Capital Transactions | | $ | (397,795,555 | ) | | $ | (168,572,434 | ) | | | $ | 4,058,507 | | | $ | (111,405,115 | ) |
Share Transactions: | | | | | | | | | | | | | | | | | |
Class A | | | | | | | | | | | | | | | | | |
Issued | | | 1,333,737 | | | | 986,785 | | | | | 887,064 | | | | 1,306,428 | |
Reinvested | | | 296,221 | | | | 640,089 | | | | | 375,472 | | | | 366,891 | |
Redeemed | | | (4,136,880 | ) | | | (3,861,581 | ) | | | | (1,937,682 | ) | | | (3,165,194 | ) |
Change in Shares Outstanding | | | (2,506,922 | ) | | | (2,234,707 | ) | | | | (675,146 | ) | | | (1,491,875 | ) |
Class C | | | | | | | | | | | | | | | | | |
Issued | | | 6,934 | | | | 18,165 | | | | | 64,646 | | | | 136,112 | |
Reinvested | | | 33,444 | | | | 116,892 | | | | | 47,005 | | | | 62,667 | |
Redeemed | | | (594,042 | ) | | | (581,601 | ) | | | | (489,352 | ) | | | (506,947 | ) |
Change in Shares Outstanding | | | (553,664 | ) | | | (446,544 | ) | | | | (377,701 | ) | | | (308,168 | ) |
Class I | | | | | | | | | | | | | | | | | |
Issued | | | 3,294,020 | | | | 6,469,596 | | | | | 7,731,393 | | | | 10,914,435 | |
Reinvested | | | 943,203 | | | | 2,055,846 | | | | | 1,997,774 | | | | 1,889,328 | |
Redeemed | | | (12,106,669 | ) | | | (10,175,333 | ) | | | | (9,684,134 | ) | | | (15,040,034 | ) |
Change in Shares Outstanding | | | (7,869,446 | ) | | | (1,649,891 | ) | | | | 45,033 | | | | (2,236,271 | ) |
Class Y | | | | | | | | | | | | | | | | | |
Issued | | | 665,331 | | | | 746,997 | | | | | 6,120,553 | | | | 5,553,632 | |
Reinvested | | | 225,846 | | | | 479,487 | | | | | 2,411,139 | | | | 2,178,268 | |
Redeemed | | | (2,849,504 | ) | | | (1,709,248 | ) | | | | (7,506,290 | ) | | | (8,832,488 | ) |
Change in Shares Outstanding | | | (1,958,327 | ) | | | (482,764 | ) | | | | 1,025,402 | | | | (1,100,588 | ) |
Change in Total Shares Outstanding | | | (12,888,359 | ) | | | (4,813,906 | ) | | | | 17,588 | | | | (5,136,902 | ) |
See accompanying Notes to Financial Statements.
DIAMOND HILL FUNDS | ANNUAL REPORT | DECEMBER 31, 2019 | DIAMOND-HILL.COM 113 |
Diamond Hill Funds
Statements of Changes in Net Assets
| | | Mid Cap Fund | | | | Large Cap Fund | |
| | | For the year
ended
December 31,
2019 | | | For the year
ended
December 31,
2018 | | | | For the year
ended
December 31,
2019 | | | For the year
ended
December 31,
2018 | |
From Operations | | | | | | | | | | | | | | | | | |
Net investment income | | $ | 1,127,923 | | | $ | 848,122 | | | | $ | 76,750,034 | | | $ | 70,349,031 | |
Net realized gains on investment transactions | | | 4,287,802 | | | | 3,311,555 | | | | | 153,325,517 | | | | 279,290,704 | |
Net change in unrealized appreciation (depreciation) on investments | | | 29,195,781 | | | | (16,660,795 | ) | | | | 1,396,404,458 | | | | (903,759,453 | ) |
Change in Net Assets from Operations | | | 34,611,506 | | | | (12,501,118 | ) | | | | 1,626,480,009 | | | | (554,119,718 | ) |
| | | | | | | | | | | | | | | | | | |
Distributions to Shareholders | | | | | | | | | | | | | | | | | |
Class A | | | (565,161 | ) | | | (607,785 | ) | | | | (54,024,543 | ) | | | (42,973,985 | ) |
Class C | | | — | | | | — | | | | | (3,228,719 | ) | | | (3,022,671 | ) |
Class I | | | (3,624,271 | ) | | | (1,753,044 | ) | | | | (179,345,975 | ) | | | (135,443,095 | ) |
Class Y | | | (428,127 | ) | | | (908,418 | ) | | | | (72,817,302 | ) | | | (44,567,794 | ) |
Change in Net Assets from Distributions to Shareholders | | | (4,617,559 | ) | | | (3,269,247 | ) | | | | (309,416,539 | ) | | | (226,007,545 | ) |
Change in Net Assets from Capital Transactions | | | 96,102,055 | | | | (2,432,496 | ) | | | | 369,588,329 | | | | 19,855,058 | |
| | | | | | | | | | | | | | | | | | |
Total Change in Net Assets | | | 126,096,002 | | | | (18,202,861 | ) | | | | 1,686,651,799 | | | | (760,272,205 | ) |
| | | | | | | | | | | | | | | | | | |
Net Assets: | | | | | | | | | | | | | | | | | |
Beginning of year | | | 103,890,697 | | | | 122,093,558 | | | | | 5,086,169,910 | | | | 5,846,442,115 | |
End of year | | $ | 229,986,699 | | | $ | 103,890,697 | | | | $ | 6,772,821,709 | | | $ | 5,086,169,910 | |
See accompanying Notes to Financial Statements.
114 DIAMOND HILL FUNDS | ANNUAL REPORT | DECEMBER 31, 2019 | DIAMOND-HILL.COM |
Diamond Hill Funds
Statements of Changes in Net Assets
| | | Mid Cap Fund | | | | Large Cap Fund | |
| | | For the year
ended
December 31,
2019 | | | For the year
ended
December 31,
2018 | | | | For the year
ended
December 31,
2019 | | | For the year
ended
December 31,
2018 | |
Capital Transactions | | | | | | | | | | | | | | | | | |
Class A | | | | | | | | | | | | | | | | | |
Proceeds from shares sold | | $ | 13,900,679 | | | $ | 5,814,215 | | | | $ | 130,379,141 | | | $ | 134,088,327 | |
Reinvested distributions | | | 524,072 | | | | 590,761 | | | | | 53,321,788 | | | | 42,554,511 | |
Payments for shares redeemed | | | (8,830,284 | ) | | | (8,020,151 | ) | | | | (234,420,865 | ) | | | (334,751,828 | ) |
Change in Net Assets from Class A Share Transactions | | | 5,594,467 | | | | (1,615,175 | ) | | | | (50,719,936 | ) | | | (158,108,990 | ) |
Class C | | | | | | | | | | | | | | | | | |
Proceeds from shares sold | | | — | | | | — | | | | | 13,866,584 | | | | 18,239,425 | |
Reinvested distributions | | | — | | | | — | | | | | 2,984,735 | | | | 2,866,575 | |
Payments for shares redeemed | | | — | | | | — | | | | | (36,940,608 | ) | | | (38,402,933 | ) |
Change in Net Assets from Class C Share Transactions | | | — | | | | — | | | | | (20,089,289 | ) | | | (17,296,933 | ) |
Class I | | | | | | | | | | | | | | | | | |
Proceeds from shares sold | | | 144,323,693 | | | | 22,427,800 | | | | | 1,280,093,450 | | | | 1,219,552,284 | |
Reinvested distributions | | | 3,394,634 | | | | 1,567,052 | | | | | 130,477,136 | | | | 109,297,493 | |
Payments for shares redeemed | | | (44,342,499 | ) | | | (23,733,185 | ) | | | | (1,273,672,485 | ) | | | (1,421,061,212 | ) |
Change in Net Assets from Class I Share Transactions | | | 103,375,828 | | | | 261,667 | | | | | 136,898,101 | | | | (92,211,435 | ) |
Class Y | | | | | | | | | | | | | | | | | |
Proceeds from shares sold | | | 6,533,676 | | | | 2,318,014 | | | | | 419,841,438 | | | | 416,446,517 | |
Reinvested distributions | | | 428,127 | | | | 411,311 | | | | | 69,292,612 | | | | 43,239,876 | |
Payments for shares redeemed | | | (19,830,043 | ) | | | (3,808,313 | ) | | | | (185,634,597 | ) | | | (172,213,977 | ) |
Change in Net Assets from Class Y Share Transactions | | | (12,868,240 | ) | | | (1,078,988 | ) | | | | 303,499,453 | | | | 287,472,416 | |
Change in Net Assets from Capital Transactions | | $ | 96,102,055 | | | $ | (2,432,496 | ) | | | $ | 369,588,329 | | | $ | 19,855,058 | |
Share Transactions: | | | | | | | | | | | | | | | | | |
Class A | | | | | | | | | | | | | | | | | |
Issued | | | 1,011,685 | | | | 427,804 | | | | | 4,792,494 | | | | 5,132,397 | |
Reinvested | | | 36,074 | | | | 47,860 | | | | | 1,847,890 | | | | 1,784,300 | |
Redeemed | | | (636,358 | ) | | | (594,950 | ) | | | | (8,612,249 | ) | | | (12,771,019 | ) |
Change in Shares Outstanding | | | 411,401 | | | | (119,286 | ) | | | | (1,971,865 | ) | | | (5,854,322 | ) |
Class C | | | | | | | | | | | | | | | | | |
Issued | | | — | | | | — | | | | | 540,314 | | | | 733,395 | |
Reinvested | | | — | | | | — | | | | | 110,194 | | | | 126,253 | |
Redeemed | | | — | | | | — | | | | | (1,468,691 | ) | | | (1,558,019 | ) |
Change in Shares Outstanding | | | — | | | | — | | | | | (818,183 | ) | | | (698,371 | ) |
Class I | | | | | | | | | | | | | | | | | |
Issued | | | 10,415,779 | | | | 1,636,063 | | | | | 47,317,625 | | | | 46,184,790 | |
Reinvested | | | 232,262 | | | | 126,931 | | | | | 4,483,819 | | | | 4,560,424 | |
Redeemed | | | (3,178,229 | ) | | | (1,766,431 | ) | | | | (47,651,984 | ) | | | (54,350,160 | ) |
Change in Shares Outstanding | | | 7,469,812 | | | | (3,437 | ) | | | | 4,149,460 | | | | (3,604,946 | ) |
Class Y | | | | | | | | | | | | | | | | | |
Issued | | | 469,310 | | | | 166,609 | | | | | 15,230,940 | | | | 16,006,236 | |
Reinvested | | | 29,197 | | | | 33,261 | | | | | 2,377,859 | | | | 1,805,940 | |
Redeemed | | | (1,433,038 | ) | | | (276,018 | ) | | | | (6,736,458 | ) | | | (6,486,843 | ) |
Change in Shares Outstanding | | | (934,531 | ) | | | (76,148 | ) | | | | 10,872,341 | | | | 11,325,333 | |
Change in Total Shares Outstanding | | | 6,946,682 | | | | (198,871 | ) | | | | 12,231,753 | | | | 1,167,694 | |
See accompanying Notes to Financial Statements.
DIAMOND HILL FUNDS | ANNUAL REPORT | DECEMBER 31, 2019 | DIAMOND-HILL.COM 115 |
Diamond Hill Funds
Statements of Changes in Net Assets
| | | All Cap Select Fund | | | | Long-Short Fund | |
| | | For the year
ended
December 31,
2019 | | | For the year
ended
December 31,
2018 | | | | For the year
ended
December 31,
2019 | | | For the year
ended
December 31,
2018 | |
From Operations | | | | | | | | | | | | | | | | | |
Net investment income | | $ | 1,696,753 | | | $ | 1,197,222 | | | | $ | 29,304,389 | | | $ | 27,161,321 | |
Net realized gains (losses) on investment transactions | | | (5,032,474 | ) | | | 24,031,957 | | | | | 258,373,667 | | | | 407,824,863 | |
Net realized losses on closed short positions | | | — | | | | — | | | | | (10,450,631 | ) | | | (182,385,479 | ) |
Net realized gains (losses) on sales from affiliated investments | | | — | | | | (578 | ) | | | | 217,544 | | | | — | |
Net change in unrealized appreciation (depreciation) on investments | | | 63,270,956 | | | | (50,981,014 | ) | | | | 475,912,701 | | | | (542,827,836 | ) |
Change in Net Assets from Operations | | | 59,935,235 | | | | (25,752,413 | ) | | | | 753,357,670 | | | | (290,227,131 | ) |
| | | | | | | | | | | | | | | | | | |
Distributions to Shareholders | | | | | | | | | | | | | | | | | |
Class A | | | (212,393 | ) | | | (962,373 | ) | | | | (14,200,792 | ) | | | (9,818,635 | ) |
Class C | | | (96,609 | ) | | | (697,278 | ) | | | | (2,603,566 | ) | | | (4,159,580 | ) |
Class I | | | (2,860,902 | ) | | | (12,423,242 | ) | | | | (182,341,938 | ) | | | (163,197,637 | ) |
Class Y | | | (1,564,705 | ) | | | (6,615,307 | ) | | | | (18,201,675 | ) | | | (11,726,819 | ) |
Change in Net Assets from Distributions to Shareholders | | | (4,734,609 | ) | | | (20,698,200 | ) | | | | (217,347,971 | ) | | | (188,902,671 | ) |
Change in Net Assets from Capital Transactions | | | 21,447,359 | | | | 59,738,574 | | | | | (602,354,115 | ) | | | (693,233,205 | ) |
| | | | | | | | | | | | | | | | | | |
Total Change in Net Assets | | | 76,647,985 | | | | 13,287,961 | | | | | (66,344,416 | ) | | | (1,172,363,007 | ) |
| | | | | | | | | | | | | | | | | | |
Net Assets: | | | | | | | | | | | | | | | | | |
Beginning of year | | | 195,701,731 | | | | 182,413,770 | | | | | 3,594,361,769 | | | | 4,766,724,776 | |
End of year | | $ | 272,349,716 | | | $ | 195,701,731 | | | | $ | 3,528,017,353 | | | $ | 3,594,361,769 | |
See accompanying Notes to Financial Statements.
116 DIAMOND HILL FUNDS | ANNUAL REPORT | DECEMBER 31, 2019 | DIAMOND-HILL.COM |
Diamond Hill Funds
Statements of Changes in Net Assets
| | | All Cap Select Fund | | | | Long-Short Fund | |
| | | For the year
ended
December 31,
2019 | | | For the year
ended
December 31,
2018 | | | | For the year
ended
December 31,
2019 | | | For the year
ended
December 31,
2018 | |
Capital Transactions | | | | | | | | | | | | | | | | | |
Class A | | | | | | | | | | | | | | | | | |
Proceeds from shares sold | | $ | 2,713,138 | | | $ | 1,029,827 | | | | $ | 68,264,153 | | | $ | 31,976,347 | |
Reinvested distributions | | | 202,386 | | | | 909,034 | | | | | 12,806,230 | | | | 8,946,323 | |
Payments for shares redeemed | | | (3,246,105 | ) | | | (4,233,192 | ) | | | | (62,919,872 | ) | | | (184,392,682 | ) |
Change in Net Assets from Class A Share Transactions | | | (330,581 | ) | | | (2,294,331 | ) | | | | 18,150,511 | | | | (143,470,012 | ) |
Class C | | | | | | | | | | | | | | | | | |
Proceeds from shares sold | | | 490,191 | | | | 1,406,068 | | | | | 2,181,254 | | | | 1,540,547 | |
Reinvested distributions | | | 86,185 | | | | 608,788 | | | | | 2,322,234 | | | | 3,825,851 | |
Payments for shares redeemed | | | (4,283,014 | ) | | | (4,508,024 | ) | | | | (54,901,135 | ) | | | (28,493,244 | ) |
Change in Net Assets from Class C Share Transactions | | | (3,706,638 | ) | | | (2,493,168 | ) | | | | (50,397,647 | ) | | | (23,126,846 | ) |
Class I | | | | | | | | | | | | | | | | | |
Proceeds from shares sold | | | 30,864,663 | | | | 33,057,946 | | | | | 654,036,936 | | | | 1,057,311,953 | |
Reinvested distributions | | | 2,785,198 | | | | 12,134,969 | | | | | 132,497,687 | | | | 128,782,521 | |
Payments for shares redeemed | | | (28,499,677 | ) | | | (39,140,368 | ) | | | | (1,398,453,685 | ) | | | (1,695,594,795 | ) |
Change in Net Assets from Class I Share Transactions | | | 5,150,184 | | | | 6,052,547 | | | | | (611,919,062 | ) | | | (509,500,321 | ) |
Class Y | | | | | | | | | | | | | | | | | |
Proceeds from shares sold | | | 30,239,702 | | | | 60,908,838 | | | | | 372,508,150 | | | | 38,689,181 | |
Reinvested distributions | | | 1,537,009 | | | | 6,472,106 | | | | | 13,026,467 | | | | 6,857,954 | |
Payments for shares redeemed | | | (11,442,317 | ) | | | (8,907,418 | ) | | | | (343,722,534 | ) | | | (62,683,161 | ) |
Change in Net Assets from Class Y Share Transactions | | | 20,334,394 | | | | 58,473,526 | | | | | 41,812,083 | | | | (17,136,026 | ) |
Change in Net Assets from Capital Transactions | | $ | 21,447,359 | | | $ | 59,738,574 | | | | $ | (602,354,115 | ) | | $ | (693,233,205 | ) |
Share Transactions: | | | | | | | | | | | | | | | | | |
Class A | | | | | | | | | | | | | | | | | |
Issued | | | 182,077 | | | | 65,422 | | | | | 2,587,425 | | | | 1,247,212 | |
Reinvested | | | 12,578 | | | | 68,534 | | | | | 486,718 | | | | 382,607 | |
Redeemed | | | (220,262 | ) | | | (267,337 | ) | | | | (2,444,510 | ) | | | (7,249,574 | ) |
Change in Shares Outstanding | | | (25,607 | ) | | | (133,381 | ) | | | | 629,633 | | | | (5,619,755 | ) |
Class C | | | | | | | | | | | | | | | | | |
Issued | | | 35,925 | | | | 111,050 | | | | | 94,412 | | | | 68,120 | |
Reinvested | | | 5,780 | | | | 49,175 | | | | | 101,142 | | | | 184,913 | |
Redeemed | | | (312,776 | ) | | | (305,252 | ) | | | | (2,369,257 | ) | | | (1,261,873 | ) |
Change in Shares Outstanding | | | (271,071 | ) | | | (145,027 | ) | | | | (2,173,703 | ) | | | (1,008,840 | ) |
Class I | | | | | | | | | | | | | | | | | |
Issued | | | 2,083,187 | | | | 2,069,967 | | | | | 24,748,870 | | | | 40,784,867 | |
Reinvested | | | 171,608 | | | | 907,673 | | | | | 4,901,190 | | | | 5,375,291 | |
Redeemed | | | (1,911,294 | ) | | | (2,428,993 | ) | | | | (53,316,381 | ) | | | (65,606,826 | ) |
Change in Shares Outstanding | | | 343,501 | | | | 548,647 | | | | | (23,666,321 | ) | | | (19,446,668 | ) |
Class Y | | | | | | | | | | | | | | | | | |
Issued | | | 1,917,982 | | | | 3,837,167 | | | | | 14,132,854 | | | | 1,434,655 | |
Reinvested | | | 94,411 | | | | 483,225 | | | | | 479,280 | | | | 284,612 | |
Redeemed | | | (778,981 | ) | | | (542,690 | ) | | | | (12,987,277 | ) | | | (2,417,997 | ) |
Change in Shares Outstanding | | | 1,233,412 | | | | 3,777,702 | | | | | 1,624,857 | | | | (698,730 | ) |
Change in Total Shares Outstanding | | | 1,280,235 | | | | 4,047,941 | | | | | (23,585,534 | ) | | | (26,773,993 | ) |
See accompanying Notes to Financial Statements.
DIAMOND HILL FUNDS | ANNUAL REPORT | DECEMBER 31, 2019 | DIAMOND-HILL.COM 117 |
Diamond Hill Funds
Statements of Changes in Net Assets
| | | Research Opportunities Fund | | | | Global Fund | |
| | | For the year
ended
December 31,
2019 | | | For the year
ended
December 31,
2018 | | | | For the year
ended
December 31,
2019 | | | For the year
ended
December 31,
2018(A) | |
From Operations | | | | | | | | | | | | | | | | | |
Net investment income | | $ | 103,223 | | | $ | 89,015 | | | | $ | 238,174 | | | $ | 168,356 | |
Net realized gains (losses) on investment transactions | | | 6,019,111 | | | | 3,949,983 | | | | | (545,811 | ) | | | 435,303 | |
Net realized losses on closed short positions | | | (1,297,905 | ) | | | (2,344,000 | ) | | | | — | | | | — | |
Net realized gains (losses) on foreign currency transactions | | | 23 | | | | (592 | ) | | | | (2,919 | ) | | | (3,746 | ) |
Net change in unrealized appreciation (depreciation) on investments and foreign currency translations | | | 11,101,262 | | | | (9,443,474 | ) | | | | 5,007,625 | | | | (3,114,675 | ) |
Change in Net Assets from Operations | | | 15,925,714 | | | | (7,749,068 | ) | | | | 4,697,069 | | | | (2,514,762 | ) |
| | | | | | | | | | | | | | | | | | |
Distributions to Shareholders | | | | | | | | | | | | | | | | | |
Class A | | | (510,119 | ) | | | (191,585 | ) | | | | (849 | ) | | | (770 | ) |
Class C | | | (69,065 | ) | | | (45,812 | ) | | | | — | | | | — | |
Class I | | | (2,239,693 | ) | | | (1,235,466 | ) | | | | (63,955 | ) | | | (30,830 | ) |
Class Y | | | (990,738 | ) | | | (743,430 | ) | | | | (175,824 | ) | | | (524,109 | ) |
Change in Net Assets from Distributions to Shareholders | | | (3,809,615 | ) | | | (2,216,293 | ) | | | | (240,628 | ) | | | (555,709 | ) |
Change in Net Assets from Capital Transactions | | | 9,402,607 | | | | (3,867,046 | ) | | | | 2,679,247 | | | | 17,789,777 | |
| | | | | | | | | | | | | | | | | | |
Total Change in Net Assets | | | 21,518,706 | | | | (13,832,407 | ) | | | | 7,135,688 | | | | 14,719,306 | |
| | | | | | | | | | | | | | | | | | |
Net Assets: | | | | | | | | | | | | | | | | | |
Beginning of year | | | 55,052,674 | | | | 68,885,081 | | | | | 14,719,306 | | | | — | |
End of year | | $ | 76,571,380 | | | $ | 55,052,674 | | | | $ | 21,854,994 | | | $ | 14,719,306 | |
(A) | Inception date of the Fund is December 29, 2017. Fund commenced operations on January 2, 2018. |
See accompanying Notes to Financial Statements.
118 DIAMOND HILL FUNDS | ANNUAL REPORT | DECEMBER 31, 2019 | DIAMOND-HILL.COM |
Diamond Hill Funds
Statements of Changes in Net Assets
| | | Research Opportunities Fund | | | | Global Fund | |
| | | For the year
ended
December 31,
2019 | | | For the year
ended
December 31,
2018 | | | | For the year
ended
December 31,
2019 | | | For the year
ended
December 31,
2018(A) | |
Capital Transactions | | | | | | | | | | | | | | | | | |
Class A | | | | | | | | | | | | | | | | | |
Proceeds from shares sold | | $ | 1,571,772 | | | $ | 1,861,558 | | | | $ | 64,243 | | | $ | 72,594 | |
Reinvested distributions | | | 469,247 | | | | 190,753 | | | | | 849 | | | | 770 | |
Payments for shares redeemed | | | (2,905,577 | ) | | | (6,603,046 | ) | | | | (41,469 | ) | | | (95 | ) |
Net Assets received in conjunction with fund merger | | | 5,169,992 | | | | — | | | | | — | | | | — | |
Change in Net Assets from Class A Share Transactions | | | 4,305,434 | | | | (4,550,735 | ) | | | | 23,623 | | | | 73,269 | |
Class C | | | | | | | | | | | | | | | | | |
Proceeds from shares sold | | | 49,128 | | | | 270,414 | | | | | — | | | | — | |
Reinvested distributions | | | 63,984 | | | | 41,210 | | | | | — | | | | — | |
Payments for shares redeemed | | | (1,558,534 | ) | | | (1,725,854 | ) | | | | — | | | | — | |
Net Assets received in conjunction with fund merger | | | 1,370,862 | | | | — | | | | | — | | | | — | |
Change in Net Assets from Class C Share Transactions | | | (74,560 | ) | | | (1,414,230 | ) | | | | — | | | | — | |
Class I | | | | | | | | | | | | | | | | | |
Proceeds from shares sold | | | 2,990,450 | | | | 11,908,042 | | | | | 1,307,952 | | | | 7,305,173 | |
Reinvested distributions | | | 2,127,614 | | | | 1,225,012 | | | | | 63,955 | | | | 30,829 | |
Payments for shares redeemed | | | (15,001,293 | ) | | | (11,017,809 | ) | | | | (966,146 | ) | | | (2,262,677 | ) |
Net Assets received in conjunction with fund merger | | | 16,194,234 | | | | — | | | | | — | | | | — | |
Change in Net Assets from Class I Share Transactions | | | 6,311,005 | | | | 2,115,245 | | | | | 405,761 | | | | 5,073,325 | |
Class Y | | | | | | | | | | | | | | | | | |
Proceeds from shares sold | | | 1,214,334 | | | | 530,474 | | | | | 2,115,001 | | | | 12,125,774 | |
Reinvested distributions | | | 990,738 | | | | 179,381 | | | | | 175,824 | | | | 524,109 | |
Payments for shares redeemed | | | (3,344,344 | ) | | | (727,181 | ) | | | | (40,962 | ) | | | (6,700 | ) |
Change in Net Assets from Class Y Share Transactions | | | (1,139,272 | ) | | | (17,326 | ) | | | | 2,249,863 | | | | 12,643,183 | |
Change in Net Assets from Capital Transactions | | $ | 9,402,607 | | | $ | (3,867,046 | ) | | | $ | 2,679,247 | | | $ | 17,789,777 | |
(A) | Inception date of the Fund is December 29, 2017. Fund commenced operations on January 2, 2018. |
See accompanying Notes to Financial Statements.
DIAMOND HILL FUNDS | ANNUAL REPORT | DECEMBER 31, 2019 | DIAMOND-HILL.COM 119 |
Diamond Hill Funds
Statements of Changes in Net Assets
| | | Research Opportunities Fund | | | | Global Fund | |
| | | For the year
ended
December 31,
2019 | | | For the year
ended
December 31,
2018 | | | | For the year
ended
December 31,
2019 | | | For the year
ended
December 31,
2018(A) | |
Share Transactions: | | | | | | | | | | | | | | | | | |
Class A | | | | | | | | | | | | | | | | | |
Issued | | | 69,525 | | | | 82,552 | | | | | 4,785 | | | | 5,565 | |
Reinvested | | | 20,143 | | | | 9,202 | | | | | 57 | | | | 58 | |
Redeemed | | | (128,701 | ) | | | (285,089 | ) | | | | (3,103 | ) | | | (8 | ) |
Receive in conjunction with fund merger | | | 239,409 | | | | — | | | | | — | | | | — | |
Change in Shares Outstanding | | | 200,376 | | | | (193,335 | ) | | | | 1,739 | | | | 5,615 | |
Class C | | | | | | | | | | | | | | | | | |
Issued | | | 2,399 | | | | 13,799 | | | | | — | | | | — | |
Reinvested | | | 2,947 | | | | 2,111 | | | | | — | | | | — | |
Redeemed | | | (73,786 | ) | | | (78,053 | ) | | | | — | | | | — | |
Receive in conjunction with fund merger | | | 67,645 | | | | — | | | | | — | | | | — | |
Change in Shares Outstanding | | | (795 | ) | | | (62,143 | ) | | | | — | | | | — | |
Class I | | | | | | | | | | | | | | | | | |
Issued | | | 131,536 | | | | 536,075 | | | | | 94,181 | | | | 532,321 | |
Reinvested | | | 89,717 | | | | 58,316 | | | | | 4,249 | | | | 2,559 | |
Redeemed | | | (652,708 | ) | | | (475,012 | ) | | | | (66,115 | ) | | | (155,060 | ) |
Receive in conjunction with fund merger | | | 738,570 | | | | — | | | | | — | | | | — | |
Change in Shares Outstanding | | | 307,115 | | | | 119,379 | | | | | 32,315 | | | | 379,820 | |
Class Y | | | | | | | | | | | | | | | | | |
Issued | | | 52,685 | | | | 22,590 | | | | | 146,805 | | | | 836,198 | |
Reinvested | | | 41,587 | | | | 8,513 | | | | | 11,675 | | | | 37,466 | |
Redeemed | | | (142,215 | ) | | | (31,142 | ) | | | | (2,988 | ) | | | (515 | ) |
Change in Shares Outstanding | | | (47,943 | ) | | | (39 | ) | | | | 155,492 | | | | 873,149 | |
Change in Total Shares Outstanding | | | 458,753 | | | | (136,138 | ) | | | | 189,546 | | | | 1,258,584 | |
(A) | Inception date of the Fund is December 29, 2017. Fund commenced operations on January 2, 2018. |
See accompanying Notes to Financial Statements.
120 DIAMOND HILL FUNDS | ANNUAL REPORT | DECEMBER 31, 2019 | DIAMOND-HILL.COM |
Diamond Hill Funds
Statements of Changes in Net Assets
| | | International
Fund | | | | Short Duration
Total Return Fund | |
| | | For the period
ended
December 31,
2019(A) | | | | For the year
ended
December 31,
2019 | | | For the year
ended
December 31,
2018 | |
From Operations | | | | | | | | | | | | | |
Net investment income | | $ | 41,735 | | | | $ | 27,371,810 | | | $ | 15,766,264 | |
Net realized gains on investment transactions | | | 96,557 | | | | | 1,015,899 | | | | 330,598 | |
Net realized losses on foreign currency transactions | | | (4,314 | ) | | | | — | | | | — | |
Net change in unrealized appreciation (depreciation) on investments and foreign currency translations | | | 988,061 | | | | | 2,725,507 | | | | (1,797,173 | ) |
Change in Net Assets from Operations | | | 1,122,039 | | | | | 31,113,216 | | | | 14,299,689 | |
| | | | | | | | | | | | | | |
Distributions to Shareholders | | | | | | | | | | | | | |
Class A | | | (143 | ) | | | | (1,319,478 | ) | | | (567,400 | ) |
Class I | | | (13,473 | ) | | | | (16,872,294 | ) | | | (5,931,136 | ) |
Class Y | | | (38,282 | ) | | | | (9,988,734 | ) | | | (10,149,114 | ) |
Change in Net Assets from Distributions to Shareholders | | | (51,898 | ) | | | | (28,180,506 | ) | | | (16,647,650 | ) |
| | | | | | | | | | | | | | |
Change in Net Assets from Capital Transactions | | | 12,420,152 | | | | | 226,459,319 | | | | 268,677,695 | |
| | | | | | | | | | | | | | |
Total Change in Net Assets | | | 13,490,293 | | | | | 229,392,029 | | | | 266,329,734 | |
| | | | | | | | | | | | | | |
Net Assets: | | | | | | | | | | | | | |
Beginning of period | | | — | | | | | 579,267,039 | | | | 312,937,305 | |
End of period | | $ | 13,490,293 | | | | $ | 808,659,068 | | | $ | 579,267,039 | |
(A) | Inception date of the Fund is June 28, 2019. Fund commenced operations on July 1, 2019. |
See accompanying Notes to Financial Statements.
DIAMOND HILL FUNDS | ANNUAL REPORT | DECEMBER 31, 2019 | DIAMOND-HILL.COM 121 |
Diamond Hill Funds
Statements of Changes in Net Assets
| | | International
Fund | | | | Short Duration
Total Return Fund | |
| | | For the period
ended
December 31,
2019(A) | | | | For the year
ended
December 31,
2019 | | | For the year
ended
December 31,
2018 | |
Capital Transactions | | | | | | | | | | | | | |
Class A | | | | | | | | | | | | | |
Proceeds from shares sold | | $ | 43,301 | | | | $ | 48,113,995 | | | $ | 12,484,958 | |
Reinvested distributions | | | 143 | | | | | 1,313,656 | | | | 562,445 | |
Payments for shares redeemed | | | — | | | | | (12,494,211 | ) | | | (14,664,571 | ) |
Change in Net Assets from Class A Share Transactions | | | 43,444 | | | | | 36,933,440 | | | | (1,617,168 | ) |
Class I | | | | | | | | | | | | | |
Proceeds from shares sold | | | 748,412 | | | | | 319,471,858 | | | | 274,496,139 | |
Reinvested distributions | | | 13,473 | | | | | 10,587,671 | | | | 3,745,433 | |
Payments for shares redeemed | | | (1,223,590 | ) | | | | (113,699,802 | ) | | | (30,194,180 | ) |
Received in conjunction with fund reorganization | | | 3,996,233 | | | | | — | | | | — | |
Change in Net Assets from Class I Share Transactions | | | 3,534,528 | | | | | 216,359,727 | | | | 248,047,392 | |
Class Y | | | | | | | | | | | | | |
Proceeds from shares sold | | | 8,803,963 | | | | | 106,606,092 | | | | 79,398,806 | |
Reinvested distributions | | | 38,282 | | | | | 9,667,968 | | | | 9,701,665 | |
Payments for shares redeemed | | | (65 | ) | | | | (143,107,908 | ) | | | (66,853,000 | ) |
Change in Net Assets from Class Y Share Transactions | | | 8,842,180 | | | | | (26,833,848 | ) | | | 22,247,471 | |
Change in Net Assets from Capital Transactions | | $ | 12,420,152 | | | | $ | 226,459,319 | | | $ | 268,677,695 | |
Share Transactions: | | | | | | | | | | | | | |
Class A | | | | | | | | | | | | | |
Issued | | | 3,086 | | | | | 4,744,357 | | | | 1,239,196 | |
Reinvested | | | 10 | | | | | 129,679 | | | | 55,888 | |
Redeemed | | | — | | | | | (1,233,129 | ) | | | (1,454,782 | ) |
Change in Shares Outstanding | | | 3,096 | | | | | 3,640,907 | | | | (159,698 | ) |
Class I | | | | | | | | | | | | | |
Issued | | | 54,023 | | | | | 31,501,854 | | | | 27,246,541 | |
Reinvested | | | 923 | | | | | 1,045,405 | | | | 372,234 | |
Redeemed | | | (89,355 | ) | | | | (11,219,030 | ) | | | (2,995,033 | ) |
Received in conjunction with fund reorganization | | | 295,000 | | | | | — | | | | — | |
Change in Shares Outstanding | | | 260,591 | | | | | 21,328,229 | | | | 24,623,742 | |
Class Y | | | | | | | | | | | | | |
Issued | | | 652,121 | | | | | 10,495,911 | | | | 7,865,844 | |
Reinvested | | | 2,622 | | | | | 954,132 | | | | 963,285 | |
Redeemed | | | (5 | ) | | | | (14,100,128 | ) | | | (6,632,856 | ) |
Change in Shares Outstanding | | | 654,738 | | | | | (2,650,085 | ) | | | 2,196,273 | |
Change in Total Shares Outstanding | | | 918,425 | | | | | 22,319,051 | | | | 26,660,317 | |
(A) | Inception date of the Fund is June 28, 2019. Fund commenced operations on July 1, 2019. |
See accompanying Notes to Financial Statements.
122 DIAMOND HILL FUNDS | ANNUAL REPORT | DECEMBER 31, 2019 | DIAMOND-HILL.COM |
Diamond Hill Funds
Statements of Changes in Net Assets
| | | Core Bond Fund | | | | Corporate Credit Fund | |
| | | For the year
ended
December 31,
2019 | | | For the year
ended
December 31,
2018 | | | | For the year
ended
December 31,
2019 | | | For the year
ended
December 31,
2018 | |
From Operations | | | | | | | | | | | | | | | | | |
Net investment income | | $ | 2,229,170 | | | $ | 1,514,530 | | | | $ | 50,736,112 | | | $ | 39,197,350 | |
Net realized gains (losses) on investment transactions | | | 60,911 | | | | (100,559 | ) | | | | 17,453,211 | | | | (2,959,670 | ) |
Net change in unrealized appreciation (depreciation) on investments | | | 2,528,695 | | | | (423,877 | ) | | | | 42,994,443 | | | | (33,990,609 | ) |
Change in Net Assets from Operations | | | 4,818,776 | | | | 990,094 | | | | | 111,183,766 | | | | 2,247,071 | |
| | | | | | | | | | | | | | | | | | |
Distributions to Shareholders | | | | | | | | | | | | | | | | | |
Class A | | | (82,564 | ) | | | (95,722 | ) | | | | (5,736,383 | ) | | | (3,604,270 | ) |
Class C | | | — | | | | — | | | | | (1,361,042 | ) | | | (1,125,316 | ) |
Class I | | | (967,749 | ) | | | (358,186 | ) | | | | (48,838,336 | ) | | | (32,678,437 | ) |
Class Y | | | (1,272,843 | ) | | | (1,121,154 | ) | | | | (3,543,594 | ) | | | (1,482,737 | ) |
Change in Net Assets from Distributions to Shareholders | | | (2,323,156 | ) | | | (1,575,062 | ) | | | | (59,479,355 | ) | | | (38,890,760 | ) |
Change in Net Assets from Capital Transactions | | | 64,289,996 | | | | 12,024,196 | | | | | 345,584,960 | | | | 127,710,401 | |
| | | | | | | | | | | | | | | | | | |
Total Change in Net Assets | | | 66,785,616 | | | | 11,439,228 | | | | | 397,289,371 | | | | 91,066,712 | |
| | | | | | | | | | | | | | | | | | |
Net Assets: | | | | | | | | | | | | | | | | | |
Beginning of year | | | 55,262,697 | | | | 43,823,469 | | | | | 743,438,329 | | | | 652,371,617 | |
End of year | | $ | 122,048,313 | | | $ | 55,262,697 | | | | $ | 1,140,727,700 | | | $ | 743,438,329 | |
See accompanying Notes to Financial Statements.
DIAMOND HILL FUNDS | ANNUAL REPORT | DECEMBER 31, 2019 | DIAMOND-HILL.COM 123 |
Diamond Hill Funds
Statements of Changes in Net Assets
| | | Core Bond Fund | | | | Corporate Credit Fund | |
| | | For the year
ended
December 31,
2019 | | | For the year
ended
December 31,
2018 | | | | For the year
ended
December 31,
2019 | | | For the year
ended
December 31,
2018 | |
Capital Transactions | | | | | | | | | | | | | | | | | |
Class A | | | | | | | | | | | | | | | | | |
Proceeds from shares sold | | $ | 1,354,031 | | | $ | 1,862,848 | | | | $ | 84,048,110 | | | $ | 42,006,960 | |
Reinvested distributions | | | 81,833 | | | | 94,793 | | | | | 5,426,724 | | | | 3,342,802 | |
Payments for shares redeemed | | | (963,018 | ) | | | (2,415,665 | ) | | | | (43,556,800 | ) | | | (36,709,141 | ) |
Change in Net Assets from Class A Share Transactions | | | 472,846 | | | | (458,024 | ) | | | | 45,918,034 | | | | 8,640,621 | |
Class C | | | | | | | | | | | | | | | | | |
Proceeds from shares sold | | | — | | | | — | | | | | 7,178,621 | | | | 4,464,849 | |
Reinvested distributions | | | — | | | | — | | | | | 1,141,126 | | | | 916,480 | |
Payments for shares redeemed | | | — | | | | — | | | | | (8,252,666 | ) | | | (5,839,348 | ) |
Change in Net Assets from Class C Share Transactions | | | — | | | | — | | | | | 67,081 | | | | (458,019 | ) |
Class I | | | | | | | | | | | | | | | | | |
Proceeds from shares sold | | | 63,249,959 | | | | 6,378,246 | | | | | 390,481,338 | | | | 260,176,282 | |
Reinvested distributions | | | 783,275 | | | | 350,714 | | | | | 39,753,964 | | | | 26,754,111 | |
Payments for shares redeemed | | | (12,979,958 | ) | | | (1,659,266 | ) | | | | (184,904,560 | ) | | | (169,633,889 | ) |
Change in Net Assets from Class I Share Transactions | | | 51,053,276 | | | | 5,069,694 | | | | | 245,330,742 | | | | 117,296,504 | |
Class Y | | | | | | | | | | | | | | | | | |
Proceeds from shares sold | | | 13,676,984 | | | | 6,336,590 | | | | | 60,211,534 | | | | 4,499,011 | |
Reinvested distributions | | | 1,272,843 | | | | 1,121,155 | | | | | 2,650,434 | | | | 1,419,254 | |
Payments for shares redeemed | | | (2,185,953 | ) | | | (45,219 | ) | | | | (8,592,865 | ) | | | (3,686,970 | ) |
Change in Net Assets from Class Y Share Transactions | | | 12,763,874 | | | | 7,412,526 | | | | | 54,269,103 | | | | 2,231,295 | |
Change in Net Assets from Capital Transactions | | $ | 64,289,996 | | | $ | 12,024,196 | | | | $ | 345,584,960 | | | $ | 127,710,401 | |
Share Transactions: | | | | | | | | | | | | | | | | | |
Class A | | | | | | | | | | | | | | | | | |
Issued | | | 134,674 | | | | 193,450 | | | | | 7,393,054 | | | | 3,755,414 | |
Reinvested | | | 8,134 | | | | 9,840 | | | | | 476,584 | | | | 300,509 | |
Redeemed | | | (96,045 | ) | | | (250,177 | ) | | | | (3,849,473 | ) | | | (3,291,168 | ) |
Change in Shares Outstanding | | | 46,763 | | | | (46,887 | ) | | | | 4,020,165 | | | | 764,755 | |
Class C | | | | | | | | | | | | | | | | | |
Issued | | | — | | | | — | | | | | 635,280 | | | | 403,002 | |
Reinvested | | | — | | | | — | | | | | 100,781 | | | | 82,646 | |
Redeemed | | | — | | | | — | | | | | (728,062 | ) | | | (523,564 | ) |
Change in Shares Outstanding | | | — | | | | — | | | | | 7,999 | | | | (37,916 | ) |
Class I | | | | | | | | | | | | | | | | | |
Issued | | | 6,190,313 | | | | 661,895 | | | | | 34,538,089 | | | | 23,388,422 | |
Reinvested | | | 77,203 | | | | 36,434 | | | | | 3,507,059 | | | | 2,413,397 | |
Redeemed | | | (1,273,116 | ) | | | (172,381 | ) | | | | (16,356,968 | ) | | | (15,323,191 | ) |
Change in Shares Outstanding | | | 4,994,400 | | | | 525,948 | | | | | 21,688,180 | | | | 10,478,628 | |
Class Y | | | | | | | | | | | | | | | | | |
Issued | | | 1,331,980 | | | | 651,059 | | | | | 5,304,606 | | | | 402,682 | |
Reinvested | | | 126,280 | | | | 116,371 | | | | | 233,877 | | | | 128,064 | |
Redeemed | | | (213,723 | ) | | | (4,688 | ) | | | | (762,895 | ) | | | (332,089 | ) |
Change in Shares Outstanding | | | 1,244,537 | | | | 762,742 | | | | | 4,775,588 | | | | 198,657 | |
Change in Total Shares Outstanding | | | 6,285,700 | | | | 1,241,803 | | | | | 30,491,932 | | | | 11,404,124 | |
See accompanying Notes to Financial Statements.
124 DIAMOND HILL FUNDS | ANNUAL REPORT | DECEMBER 31, 2019 | DIAMOND-HILL.COM |
Diamond Hill Funds
Statements of Changes in Net Assets
| | | High Yield Fund | |
| | | For the year
ended
December 31,
2019 | | | For the year
ended
December 31,
2018 | |
From Operations | | | | | | | | |
Net investment income | | $ | 5,645,663 | | | $ | 2,905,803 | |
Net realized gains on investment transactions | | | 2,638,308 | | | | 77,981 | |
Net change in unrealized appreciation (depreciation) on investments | | | 3,988,723 | | | | (2,547,436 | ) |
Change in Net Assets from Operations | | | 12,272,694 | | | | 436,348 | |
| | | | | | | | | |
Distributions to Shareholders | | | | | | | | |
Class A | | | (796,983 | ) | | | (78,163 | ) |
Class I | | | (4,386,518 | ) | | | (1,250,208 | ) |
Class Y | | | (1,822,190 | ) | | | (1,821,292 | ) |
Change in Net Assets from Distributions to Shareholders | | | (7,005,691 | ) | | | (3,149,663 | ) |
| | | | | | | | | |
Change in Net Assets from Capital Transactions | | | 75,043,471 | | | | 26,056,635 | |
| | | | | | | | | |
Total Change in Net Assets | | | 80,310,474 | | | | 23,343,320 | |
| | | | | | | | | |
Net Assets: | | | | | | | | |
Beginning of year | | | 54,446,989 | | | | 31,103,669 | |
End of year | | $ | 134,757,463 | | | $ | 54,446,989 | |
See accompanying Notes to Financial Statements.
DIAMOND HILL FUNDS | ANNUAL REPORT | DECEMBER 31, 2019 | DIAMOND-HILL.COM 125 |
Diamond Hill Funds
Statements of Changes in Net Assets
| | | High Yield Fund | |
| | | For the year
ended
December 31,
2019 | | | For the year
ended
December 31,
2018 | |
Capital Transactions | | | | | | | | |
Class A | | | | | | | | |
Proceeds from shares sold | | $ | 24,132,673 | | | $ | 1,814,664 | |
Reinvested distributions | | | 772,176 | | | | 67,891 | |
Payments for shares redeemed | | | (8,860,856 | ) | | | (425,936 | ) |
Change in Net Assets from Class A Share Transactions | | | 16,043,993 | | | | 1,456,619 | |
Class I | | | | | | | | |
Proceeds from shares sold | | | 80,759,941 | | | | 14,823,061 | |
Reinvested distributions | | | 4,012,733 | | | | 1,209,963 | |
Payments for shares redeemed | | | (14,335,085 | ) | | | (5,611,216 | ) |
Change in Net Assets from Class I Share Transactions | | | 70,437,589 | | | | 10,421,808 | |
Class Y | | | | | | | | |
Proceeds from shares sold | | | 1,794,451 | | | | 13,775,217 | |
Reinvested distributions | | | 1,822,190 | | | | 1,821,292 | |
Payments for shares redeemed | | | (15,054,752 | ) | | | (1,418,301 | ) |
Change in Net Assets from Class Y Share Transactions | | | (11,438,111 | ) | | | 14,178,208 | |
Change in Net Assets from Capital Transactions | | $ | 75,043,471 | | | $ | 26,056,635 | |
| | | | | | | | | |
Share Transactions: | | | | | | | | |
Class A | | | | | | | | |
Issued | | | 2,209,446 | | | | 170,006 | |
Reinvested | | | 70,396 | | | | 6,414 | |
Redeemed | | | (809,905 | ) | | | (40,014 | ) |
Change in Shares Outstanding | | | 1,469,937 | | | | 136,406 | |
Class I | | | | | | | | |
Issued | | | 7,403,376 | | | | 1,393,776 | |
Reinvested | | | 366,633 | | | | 114,195 | |
Redeemed | | | (1,311,148 | ) | | | (525,318 | ) |
Change in Shares Outstanding | | | 6,458,861 | | | | 982,653 | |
Class Y | | | | | | | | |
Issued | | | 165,683 | | | | 1,282,293 | |
Reinvested | | | 167,582 | | | | 171,783 | |
Redeemed | | | (1,366,303 | ) | | | (132,516 | ) |
Change in Shares Outstanding | | | (1,033,038 | ) | | | 1,321,560 | |
Change in Total Shares Outstanding | | | 6,895,760 | | | | 2,440,619 | |
See accompanying Notes to Financial Statements.
126 DIAMOND HILL FUNDS | ANNUAL REPORT | DECEMBER 31, 2019 | DIAMOND-HILL.COM |
(Page intentionally left blank)
DIAMOND HILL FUNDS | ANNUAL REPORT | DECEMBER 31, 2019 | DIAMOND-HILL.COM 127 |
Small Cap Fund
Financial Highlights
Selected data for a share outstanding throughout the periods indicated
Small Cap Fund | | Net asset
value,
beginning of
period | | | Net
investment
income
(loss)(A) | | | Net realized
and
unrealized
gains
(losses) on
investments | | | Total from
investment
operations | | | Dividends
from net
investment
income | |
Class A | | | | | | | | | | | | | | | | | | | | |
For the year ended December 31, 2019 | | $ | 27.54 | | | | 0.06 | | | | 5.80 | | | | 5.86 | | | | (0.34 | ) |
For the year ended December 31, 2018 | | $ | 35.62 | | | | 0.12 | | | | (5.37 | ) | | | (5.25 | ) | | | — | |
For the year ended December 31, 2017 | | $ | 34.39 | | | | 0.06 | | | | 3.55 | | | | 3.61 | | | | (0.13 | ) |
For the year ended December 31, 2016 | | $ | 30.89 | | | | 0.00 | (E) | | | 4.36 | | | | 4.36 | | | | — | |
For the year ended December 31, 2015 | | $ | 32.61 | | | | (0.05 | ) | | | (1.17 | ) | | | (1.22 | ) | | | (0.09 | ) |
|
Class C | | | | | | | | | | | | | | | | | | | | |
For the year ended December 31, 2019 | | $ | 23.40 | | | | (0.16 | ) | | | 4.92 | | | | 4.76 | | | | (0.00 | )(E) |
For the year ended December 31, 2018 | | $ | 30.98 | | | | (0.17 | ) | | | (4.58 | ) | | | (4.75 | ) | | | — | |
For the year ended December 31, 2017 | | $ | 30.30 | | | | (0.19 | ) | | | 3.12 | | | | 2.93 | | | | — | |
For the year ended December 31, 2016 | | $ | 27.51 | | | | (0.23 | ) | | | 3.88 | | | | 3.65 | | | | — | |
For the year ended December 31, 2015 | | $ | 29.23 | | | | (0.25 | ) | | | (1.06 | ) | | | (1.31 | ) | | | — | |
|
Class I | | | | | | | | | | | | | | | | | | | | |
For the year ended December 31, 2019 | | $ | 27.98 | | | | 0.16 | | | | 5.90 | | | | 6.06 | | | | (0.44 | ) |
For the year ended December 31, 2018 | | $ | 36.15 | | | | 0.23 | | | | (5.48 | ) | | | (5.25 | ) | | | (0.09 | ) |
For the year ended December 31, 2017 | | $ | 34.87 | | | | 0.17 | | | | 3.61 | | | | 3.78 | | | | (0.25 | ) |
For the year ended December 31, 2016 | | $ | 31.28 | | | | 0.10 | | | | 4.42 | | | | 4.52 | | | | (0.07 | ) |
For the year ended December 31, 2015 | | $ | 33.04 | | | | 0.05 | | | | (1.20 | ) | | | (1.15 | ) | | | (0.20 | ) |
|
Class Y | | | | | | | | | | | | | | | | | | | | |
For the year ended December 31, 2019 | | $ | 28.01 | | | | 0.19 | | | | 5.91 | | | | 6.10 | | | | (0.48 | ) |
For the year ended December 31, 2018 | | $ | 36.17 | | | | 0.27 | | | | (5.48 | ) | | | (5.21 | ) | | | (0.12 | ) |
For the year ended December 31, 2017 | | $ | 34.89 | | | | 0.20 | | | | 3.62 | | | | 3.82 | | | | (0.29 | ) |
For the year ended December 31, 2016 | | $ | 31.29 | | | | 0.13 | | | | 4.43 | | | | 4.56 | | | | (0.10 | ) |
For the year ended December 31, 2015 | | $ | 33.05 | | | | 0.12 | | | | (1.23 | ) | | | (1.11 | ) | | | (0.24 | ) |
|
(A) | Net investment income (loss) per share has been calculated using the average daily shares outstanding during the period. |
(B) | Total returns shown exclude the effect of applicable sales charges. |
(C) | The Fund’s adviser has contractually agreed to waive fees in the pro-rata amount of the management fee charged by the underlying Diamond Hill Fund on each Fund’s investment in such other Diamond Hill Fund. If such fee waiver had not occurred, the ratios would have been as indicated. |
See accompanying Notes to Financial Statements.
128 DIAMOND HILL FUNDS | ANNUAL REPORT | DECEMBER 31, 2019 | DIAMOND-HILL.COM |
| | Distributions
from net
realized
capital gains | | | Total
distributions | | | Net asset
value, end of
period | | | Total
return(B) | | | Net assets,
end of
period
(000’s) | | | Ratio of total
net expenses
to average
net assets | | | Ratio of
total gross
expenses to
average net
assets(C) | | | Ratio of net
investment
income
(loss) to
average net
assets | | | Portfolio
turnover
rate(D) | |
| | | | | | | | | | | | | | | | | | | | | | | | | | | | | | | | | | | | |
| | | (1.83 | ) | | | (2.17 | ) | | $ | 31.23 | | | | 21.36 | % | | $ | 165,339 | | | | 1.27 | % | | | 1.27 | % | | | 0.23 | % | | | 22 | % |
| | | (2.83 | ) | | | (2.83 | ) | | $ | 27.54 | | | | (15.12 | )% | | $ | 214,831 | | | | 1.25 | % | | | 1.26 | % | | | 0.31 | % | | | 23 | % |
| | | (2.25 | ) | | | (2.38 | ) | | $ | 35.62 | | | | 10.62 | % | | $ | 357,512 | | | | 1.27 | % | | | 1.28 | % | | | 0.11 | % | | | 7 | % |
| | | (0.86 | ) | | | (0.86 | ) | | $ | 34.39 | | | | 14.10 | % | | $ | 439,681 | | | | 1.29 | % | | | 1.29 | % | | | 0.00 | %(F) | | | 15 | % |
| | | (0.41 | ) | | | (0.50 | ) | | $ | 30.89 | | | | (3.73 | )% | | $ | 492,810 | | | | 1.29 | % | | | 1.29 | % | | | (0.15 | )% | | | 17 | % |
| | | |
| | | | | | | | | | | | | | | | | | | | | | | | | | | | | | | | | | | | |
| | | (1.83 | ) | | | (1.83 | ) | | $ | 26.33 | | | | 20.46 | % | | $ | 13,501 | | | | 2.02 | % | | | 2.02 | % | | | (0.59 | )% | | | 22 | % |
| | | (2.83 | ) | | | (2.83 | ) | | $ | 23.40 | | | | (15.77 | )% | | $ | 24,951 | | | | 2.00 | % | | | 2.01 | % | | | (0.45 | )% | | | 23 | % |
| | | (2.25 | ) | | | (2.25 | ) | | $ | 30.98 | | | | 9.80 | % | | $ | 46,868 | | | | 2.02 | % | | | 2.03 | % | | | (0.67 | )% | | | 7 | % |
| | | (0.86 | ) | | | (0.86 | ) | | $ | 30.30 | | | | 13.25 | % | | $ | 54,664 | | | | 2.04 | % | | | 2.04 | % | | | (0.75 | )% | | | 15 | % |
| | | (0.41 | ) | | | (0.41 | ) | | $ | 27.51 | | | | (4.47 | )% | | $ | 57,875 | | | | 2.04 | % | | | 2.04 | % | | | (0.87 | )% | | | 17 | % |
| | | |
| | | | | | | | | | | | | | | | | | | | | | | | | | | | | | | | | | | | |
| | | (1.83 | ) | | | (2.27 | ) | | $ | 31.77 | | | | 21.75 | % | | $ | 469,014 | | | | 0.98 | % | | | 0.98 | % | | | 0.52 | % | | | 22 | % |
| | | (2.83 | ) | | | (2.92 | ) | | $ | 27.98 | | | | (14.88 | )% | | $ | 633,323 | | | | 0.96 | % | | | 0.97 | % | | | 0.64 | % | | | 23 | % |
| | | (2.25 | ) | | | (2.50 | ) | | $ | 36.15 | | | | 10.95 | % | | $ | 877,913 | | | | 0.97 | % | | | 0.98 | % | | | 0.41 | % | | | 7 | % |
| | | (0.86 | ) | | | (0.93 | ) | | $ | 34.87 | | | | 14.45 | % | | $ | 1,073,671 | | | | 0.99 | % | | | 0.99 | % | | | 0.32 | % | | | 15 | % |
| | | (0.41 | ) | | | (0.61 | ) | | $ | 31.28 | | | | (3.47 | )% | | $ | 882,350 | | | | 1.02 | % | | | 1.02 | % | | | 0.16 | % | | | 17 | % |
| | | |
| | | | | | | | | | | | | | | | | | | | | | | | | | | | | | | | | | | | |
| | | (1.83 | ) | | | (2.31 | ) | | $ | 31.80 | | | | 21.88 | % | | $ | 105,030 | | | | 0.86 | % | | | 0.86 | % | | | 0.62 | % | | | 22 | % |
| | | (2.83 | ) | | | (2.95 | ) | | $ | 28.01 | | | | (14.79 | )% | | $ | 147,363 | | | | 0.84 | % | | | 0.85 | % | | | 0.74 | % | | | 23 | % |
| | | (2.25 | ) | | | (2.54 | ) | | $ | 36.17 | | | | 11.06 | % | | $ | 207,770 | | | | 0.87 | % | | | 0.88 | % | | | 0.53 | % | | | 7 | % |
| | | (0.86 | ) | | | (0.96 | ) | | $ | 34.89 | | | | 14.57 | % | | $ | 221,827 | | | | 0.89 | % | | | 0.89 | % | | | 0.40 | % | | | 15 | % |
| | | (0.41 | ) | | | (0.65 | ) | | $ | 31.29 | | | | (3.36 | )% | | $ | 221,624 | | | | 0.90 | % | | | 0.90 | % | | | 0.37 | % | | | 17 | % |
| | | |
(D) | Portfolio turnover rate is calculated on the basis of the Fund as a whole without distinguishing between classes of shares issued. |
(E) | Amount is less than $0.005. |
(F) | Amount is less than 0.005%. |
See accompanying Notes to Financial Statements.
DIAMOND HILL FUNDS | ANNUAL REPORT | DECEMBER 31, 2019 | DIAMOND-HILL.COM 129 |
Small-Mid Cap Fund
Financial Highlights
Selected data for a share outstanding throughout the periods indicated
Small-Mid Cap Fund | | Net asset
value,
beginning of
period | | | Net
investment
income
(loss)(A) | | | Net realized
and
unrealized
gains
(losses) on
investments | | | Total from
investment
operations | | | Dividends
from net
investment
income | |
Class A | | | | | | | | | | | | | | | | | | | | |
For the year ended December 31, 2019 | | $ | 18.59 | | | | 0.04 | | | | 5.02 | | | | 5.06 | | | | (0.14 | ) |
For the year ended December 31, 2018 | | $ | 22.24 | | | | 0.05 | | | | (2.86 | ) | | | (2.81 | ) | | | (0.04 | ) |
For the year ended December 31, 2017 | | $ | 21.18 | | | | 0.03 | | | | 1.73 | | | | 1.76 | | | | (0.03 | ) |
For the year ended December 31, 2016 | | $ | 18.29 | | | | 0.01 | | | | 3.25 | | | | 3.26 | | | | (0.01 | ) |
For the year ended December 31, 2015 | | $ | 18.33 | | | | 0.01 | | | | 0.17 | | | | 0.18 | | | | (0.03 | ) |
|
Class C | | | | | | | | | | | | | | | | | | | | |
For the year ended December 31, 2019 | | $ | 16.88 | | | | (0.12 | ) | | | 4.56 | | | | 4.44 | | | | — | |
For the year ended December 31, 2018 | | $ | 20.39 | | | | (0.10 | ) | | | (2.61 | ) | | | (2.71 | ) | | | — | |
For the year ended December 31, 2017 | | $ | 19.60 | | | | (0.13 | ) | | | 1.59 | | | | 1.46 | | | | — | |
For the year ended December 31, 2016 | | $ | 17.06 | | | | (0.12 | ) | | | 3.02 | | | | 2.90 | | | | — | |
For the year ended December 31, 2015 | | $ | 17.21 | | | | (0.12 | ) | | | 0.16 | | | | 0.04 | | | | — | |
|
Class I | | | | | | | | | | | | | | | | | | | | |
For the year ended December 31, 2019 | | $ | 18.76 | | | | 0.11 | | | | 5.08 | | | | 5.19 | | | | (0.21 | ) |
For the year ended December 31, 2018 | | $ | 22.45 | | | | 0.12 | | | | (2.91 | ) | | | (2.79 | ) | | | (0.10 | ) |
For the year ended December 31, 2017 | | $ | 21.39 | | | | 0.10 | | | | 1.74 | | | | 1.84 | | | | (0.11 | ) |
For the year ended December 31, 2016 | | $ | 18.46 | | | | 0.07 | | | | 3.29 | | | | 3.36 | | | | (0.07 | ) |
For the year ended December 31, 2015 | | $ | 18.47 | | | | 0.07 | | | | 0.17 | | | | 0.24 | | | | (0.06 | ) |
|
Class Y | | | | | | | | | | | | | | | | | | | | |
For the year ended December 31, 2019 | | $ | 18.80 | | | | 0.13 | | | | 5.08 | | | | 5.21 | | | | (0.23 | ) |
For the year ended December 31, 2018 | | $ | 22.49 | | | | 0.15 | | | | (2.91 | ) | | | (2.76 | ) | | | (0.13 | ) |
For the year ended December 31, 2017 | | $ | 21.42 | | | | 0.12 | | | | 1.75 | | | | 1.87 | | | | (0.13 | ) |
For the year ended December 31, 2016 | | $ | 18.48 | | | | 0.09 | | | | 3.29 | | | | 3.38 | | | | (0.08 | ) |
For the year ended December 31, 2015 | | $ | 18.49 | | | | 0.09 | | | | 0.17 | | | | 0.26 | | | | (0.08 | ) |
|
(A) | Net investment income (loss) per share has been calculated using the average daily shares outstanding during the period. |
(B) | Total returns shown exclude the effect of applicable sales charges. |
See accompanying Notes to Financial Statements.
130 DIAMOND HILL FUNDS | ANNUAL REPORT | DECEMBER 31, 2019 | DIAMOND-HILL.COM |
| | Distributions
from net
realized
capital gains | | | Total
distributions | | | Net asset
value, end of
period | | | Total
return(B) | | | Net assets,
end of
period
(000’s) | | | Ratio of total
net expenses
to average
net assets | | | Ratio of
total gross
expenses to
average net
assets(C) | | | Ratio of net
investment
income
(loss) to
average net
assets | | | Portfolio
turnover
rate(D) | |
| | | | | | | | | | | | | | | | | | | | | | | | | | | | | | | | | | | | |
| | | (0.94 | ) | | | (1.08 | ) | | $ | 22.57 | | | | 27.33 | % | | $ | 183,914 | | | | 1.21 | % | | | 1.22 | % | | | 0.21 | % | | | 14 | % |
| | | (0.80 | ) | | | (0.84 | ) | | $ | 18.59 | | | | (12.80 | )% | | $ | 164,037 | | | | 1.20 | % | | | 1.21 | % | | | 0.21 | % | | | 26 | % |
| | | (0.67 | ) | | | (0.70 | ) | | $ | 22.24 | | | | 8.35 | % | | $ | 229,411 | | | | 1.22 | % | | | 1.23 | % | | | 0.09 | % | | | 15 | % |
| | | (0.36 | ) | | | (0.37 | ) | | $ | 21.18 | | | | 17.81 | % | | $ | 288,634 | | | | 1.24 | % | | | 1.24 | % | | | 0.12 | % | | | 17 | % |
| | | (0.19 | ) | | | (0.22 | ) | | $ | 18.29 | | | | 0.98 | % | | $ | 156,122 | | | | 1.24 | % | | | 1.24 | % | | | 0.06 | % | | | 21 | % |
| | | |
| | | | | | | | | | | | | | | | | | | | | | | | | | | | | | | | | | | | |
| | | (0.94 | ) | | | (0.94 | ) | | $ | 20.38 | | | | 26.40 | % | | $ | 23,472 | | | | 1.96 | % | | | 1.97 | % | | | (0.58 | )% | | | 14 | % |
| | | (0.80 | ) | | | (0.80 | ) | | $ | 16.88 | | | | (13.46 | )% | | $ | 25,821 | | | | 1.95 | % | | | 1.96 | % | | | (0.55 | )% | | | 26 | % |
| | | (0.67 | ) | | | (0.67 | ) | | $ | 20.39 | | | | 7.49 | % | | $ | 37,472 | | | | 1.97 | % | | | 1.98 | % | | | (0.66 | )% | | | 15 | % |
| | | (0.36 | ) | | | (0.36 | ) | | $ | 19.60 | | | | 16.98 | % | | $ | 42,875 | | | | 1.99 | % | | | 1.99 | % | | | (0.65 | )% | | | 17 | % |
| | | (0.19 | ) | | | (0.19 | ) | | $ | 17.06 | | | | 0.24 | % | | $ | 32,963 | | | | 1.99 | % | | | 1.99 | % | | | (0.69 | )% | | | 21 | % |
| | | |
| | | | | | | | | | | | | | | | | | | | | | | | | | | | | | | | | | | | |
| | | (0.94 | ) | | | (1.15 | ) | | $ | 22.80 | | | | 27.74 | % | | $ | 1,081,619 | | | | 0.92 | % | | | 0.93 | % | | | 0.50 | % | | | 14 | % |
| | | (0.80 | ) | | | (0.90 | ) | | $ | 18.76 | | | | (12.56 | )% | | $ | 889,471 | | | | 0.91 | % | | | 0.92 | % | | | 0.52 | % | | | 26 | % |
| | | (0.67 | ) | | | (0.78 | ) | | $ | 22.45 | | | | 8.63 | % | | $ | 1,114,337 | | | | 0.92 | % | | | 0.93 | % | | | 0.41 | % | | | 15 | % |
| | | (0.36 | ) | | | (0.43 | ) | | $ | 21.39 | | | | 18.18 | % | | $ | 1,015,403 | | | | 0.94 | % | | | 0.94 | % | | | 0.41 | % | | | 17 | % |
| | | (0.19 | ) | | | (0.25 | ) | | $ | 18.46 | | | | 1.32 | % | | $ | 506,730 | | | | 0.97 | % | | | 0.97 | % | | | 0.35 | % | | | 21 | % |
| | | |
| | | | | | | | | | | | | | | | | | | | | | | | | | | | | | | | | | | | |
| | | (0.94 | ) | | | (1.17 | ) | | $ | 22.84 | | | | 27.82 | % | | $ | 1,147,458 | | | | 0.80 | % | | | 0.81 | % | | | 0.62 | % | | | 14 | % |
| | | (0.80 | ) | | | (0.93 | ) | | $ | 18.80 | | | | (12.42 | )% | | $ | 924,995 | | | | 0.79 | % | | | 0.80 | % | | | 0.63 | % | | | 26 | % |
| | | (0.67 | ) | | | (0.80 | ) | | $ | 22.49 | | | | 8.77 | % | | $ | 1,131,583 | | | | 0.82 | % | | | 0.83 | % | | | 0.51 | % | | | 15 | % |
| | | (0.36 | ) | | | (0.44 | ) | | $ | 21.42 | | | | 18.29 | % | | $ | 961,721 | | | | 0.84 | % | | | 0.84 | % | | | 0.49 | % | | | 17 | % |
| | | (0.19 | ) | | | (0.27 | ) | | $ | 18.48 | | | | 1.41 | % | | $ | 602,951 | | | | 0.85 | % | | | 0.85 | % | | | 0.48 | % | | | 21 | % |
| | | |
(C) | The Fund’s adviser has contractually agreed to waive fees in the pro-rata amount of the management fee charged by the underlying Diamond Hill Fund on each Fund’s investment in such other Diamond Hill Fund. If such fee waiver had not occurred, the ratios would have been as indicated. |
(D) | Portfolio turnover rate is calculated on the basis of the Fund as a whole without distinguishing between classes of shares issued. |
See accompanying Notes to Financial Statements.
DIAMOND HILL FUNDS | ANNUAL REPORT | DECEMBER 31, 2019 | DIAMOND-HILL.COM 131 |
Mid Cap Fund
Financial Highlights
Selected data for a share outstanding throughout the periods indicated
Mid Cap Fund | | Net asset
value,
beginning of
period | | | Net
investment
income(A) | | | Net realized
and
unrealized
gains
(losses) on
investments | | | Total from
investment
operations | | | Dividends
from net
investment
income | |
Class A | | | | | | | | | | | | | | | | | | | | |
For the year ended December 31, 2019 | | $ | 11.89 | | | | 0.05 | | | | 2.96 | | | | 3.01 | | | | (0.05 | ) |
For the year ended December 31, 2018 | | $ | 13.66 | | | | 0.06 | | | | (1.49 | ) | | | (1.43 | ) | | | (0.06 | ) |
For the year ended December 31, 2017 | | $ | 12.59 | | | | 0.04 | | | | 1.23 | | | | 1.27 | | | | (0.03 | ) |
For the year ended December 31, 2016 | | $ | 10.71 | | | | 0.03 | | | | 1.93 | | | | 1.96 | | | | (0.02 | ) |
For the year ended December 31, 2015 | | $ | 10.70 | | | | 0.04 | | | | 0.01 | | | | 0.05 | | | | (0.04 | ) |
|
Class I | | | | | | | | | | | | | | | | | | | | |
For the year ended December 31, 2019 | | $ | 11.92 | | | | 0.10 | | | | 2.97 | | | | 3.07 | | | | (0.09 | ) |
For the year ended December 31, 2018 | | $ | 13.70 | | | | 0.10 | | | | (1.50 | ) | | | (1.40 | ) | | | (0.10 | ) |
For the year ended December 31, 2017 | | $ | 12.62 | | | | 0.08 | | | | 1.24 | | | | 1.32 | | | | (0.07 | ) |
For the year ended December 31, 2016 | | $ | 10.74 | | | | 0.07 | | | | 1.92 | | | | 1.99 | | | | (0.05 | ) |
For the year ended December 31, 2015 | | $ | 10.72 | | | | 0.07 | | | | 0.01 | | | | 0.08 | | | | (0.06 | ) |
|
Class Y | | | | | | | | | | | | | | | | | | | | |
For the year ended December 31, 2019 | | $ | 11.95 | | | | 0.11 | | | | 2.98 | | | | 3.09 | | | | (0.10 | ) |
For the year ended December 31, 2018 | | $ | 13.73 | | | | 0.12 | | | | (1.50 | ) | | | (1.38 | ) | | | (0.12 | ) |
For the year ended December 31, 2017 | | $ | 12.65 | | | | 0.09 | | | | 1.24 | | | | 1.33 | | | | (0.08 | ) |
For the year ended December 31, 2016 | | $ | 10.75 | | | | 0.08 | | | | 1.94 | | | | 2.02 | | | | (0.06 | ) |
For the year ended December 31, 2015 | | $ | 10.73 | | | | 0.08 | | | | 0.01 | | | | 0.09 | | | | (0.07 | ) |
|
(A) | Net investment income per share has been calculated using the average daily shares outstanding during the period. |
(B) | Total returns shown exclude the effect of applicable sales charges. |
See accompanying Notes to Financial Statements.
132 DIAMOND HILL FUNDS | ANNUAL REPORT | DECEMBER 31, 2019 | DIAMOND-HILL.COM |
| | Distributions
from net
realized
capital gains | | | Total
distributions | | | Net asset
value, end of
period | | | Total
return(B) | | | Net assets,
end of
period
(000’s) | | | Ratio of total
net expenses
to average
net assets | | | Ratio of
total gross
expenses to
average net
assets(C) | | | Ratio of net
investment
income
(loss) to
average net
assets | | | Portfolio
turnover
rate(D) | |
| | | | | | | | | | | | | | | | | | | | | | | | | | | | | | | | | | | | |
| | | (0.21 | ) | | | (0.26 | ) | | $ | 14.64 | | | | 25.36 | % | | $ | 31,997 | | | | 1.06 | % | | | 1.07 | % | | | 0.36 | % | | | 31 | % |
| | | (0.28 | ) | | | (0.34 | ) | | $ | 11.89 | | | | (10.56 | )% | | $ | 21,085 | | | | 1.05 | % | | | 1.06 | % | | | 0.43 | % | | | 20 | % |
| | | (0.17 | ) | | | (0.20 | ) | | $ | 13.66 | | | | 10.13 | % | | $ | 25,853 | | | | 1.07 | % | | | 1.08 | % | | | 0.28 | % | | | 11 | % |
| | | (0.06 | ) | | | (0.08 | ) | | $ | 12.59 | | | | 18.29 | % | | $ | 7,403 | | | | 1.14 | % | | | 1.14 | % | | | 0.31 | % | | | 17 | % |
| | | — | | | | (0.04 | ) | | $ | 10.71 | | | | 0.44 | % | | $ | 3,082 | | | | 1.14 | % | | | 1.14 | % | | | 0.35 | % | | | 29 | % |
| | | |
| | | | | | | | | | | | | | | | | | | | | | | | | | | | | | | | | | | | |
| | | (0.21 | ) | | | (0.30 | ) | | $ | 14.69 | | | | 25.82 | % | | $ | 177,536 | | | | 0.77 | % | | | 0.78 | % | | | 0.68 | % | | | 31 | % |
| | | (0.28 | ) | | | (0.38 | ) | | $ | 11.92 | | | | (10.31 | )% | | $ | 55,045 | | | | 0.76 | % | | | 0.77 | % | | | 0.72 | % | | | 20 | % |
| | | (0.17 | ) | | | (0.24 | ) | | $ | 13.70 | | | | 10.47 | % | | $ | 63,298 | | | | 0.77 | % | | | 0.79 | % | | | 0.57 | % | | | 11 | % |
| | | (0.06 | ) | | | (0.11 | ) | | $ | 12.62 | | | | 18.56 | % | | $ | 28,031 | | | | 0.85 | % | | | 0.85 | % | | | 0.67 | % | | | 17 | % |
| | | — | | | | (0.06 | ) | | $ | 10.74 | | | | 0.74 | % | | $ | 3,337 | | | | 0.87 | % | | | 0.87 | % | | | 0.61 | % | | | 29 | % |
| | | |
| | | | | | | | | | | | | | | | | | | | | | | | | | | | | | | | | | | | |
| | | (0.21 | ) | | | (0.31 | ) | | $ | 14.73 | | | | 25.91 | % | | $ | 20,454 | | | | 0.65 | % | | | 0.66 | % | | | 0.74 | % | | | 31 | % |
| | | (0.28 | ) | | | (0.40 | ) | | $ | 11.95 | | | | (10.17 | )% | | $ | 27,761 | | | | 0.64 | % | | | 0.65 | % | | | 0.83 | % | | | 20 | % |
| | | (0.17 | ) | | | (0.25 | ) | | $ | 13.73 | | | | 10.51 | % | | $ | 32,943 | | | | 0.67 | % | | | 0.68 | % | | | 0.65 | % | | | 11 | % |
| | | (0.06 | ) | | | (0.12 | ) | | $ | 12.65 | | | | 18.76 | % | | $ | 23,383 | | | | 0.75 | % | | | 0.75 | % | | | 0.71 | % | | | 17 | % |
| | | — | | | | (0.07 | ) | | $ | 10.75 | | | | 0.84 | % | | $ | 12,077 | | | | 0.75 | % | | | 0.75 | % | | | 0.72 | % | | | 29 | % |
| | | |
(C) | The Fund’s adviser has contractually agreed to waive fees in the pro-rata amount of the management fee charged by the underlying Diamond Hill Fund on each Fund’s investment in such other Diamond Hill Fund. If such fee waiver had not occurred, the ratios would have been as indicated. |
(D) | Portfolio turnover rate is calculated on the basis of the Fund as a whole without distinguishing between classes of shares issued. |
See accompanying Notes to Financial Statements.
DIAMOND HILL FUNDS | ANNUAL REPORT | DECEMBER 31, 2019 | DIAMOND-HILL.COM 133 |
Large Cap Fund
Financial Highlights
Selected data for a share outstanding throughout the periods indicated
Large Cap Fund | | Net asset
value,
beginning of
period | | | Net
investment
income(A) | | | Net realized
and
unrealized
gains
(losses) on
investments | | | Total from
investment
operations | | | Dividends
from net
investment
income | |
Class A | | | | | | | | | | | | | | | | | | | | |
For the year ended December 31, 2019 | | $ | 22.89 | | | | 0.28 | | | | 6.99 | | | | 7.27 | | | | (0.26 | ) |
For the year ended December 31, 2018 | | $ | 26.45 | | | | 0.25 | | | | (2.83 | ) | | | (2.58 | ) | | | (0.26 | ) |
For the year ended December 31, 2017 | | $ | 23.06 | | | | 0.24 | | | | 4.35 | | | | 4.59 | | | | (0.20 | ) |
For the year ended December 31, 2016 | | $ | 21.44 | | | | 0.25 | | | | 2.82 | | | | 3.07 | | | | (0.24 | ) |
For the year ended December 31, 2015 | | $ | 22.71 | | | | 0.19 | | | | (0.43 | ) | | | (0.24 | ) | | | (0.18 | ) |
|
Class C | | | | | | | | | | | | | | | | | | | | |
For the year ended December 31, 2019 | | $ | 21.67 | | | | 0.07 | | | | 6.61 | | | | 6.68 | | | | (0.06 | ) |
For the year ended December 31, 2018 | | $ | 25.07 | | | | 0.05 | | | | (2.67 | ) | | | (2.62 | ) | | | (0.06 | ) |
For the year ended December 31, 2017 | | $ | 21.94 | | | | 0.05 | | | | 4.12 | | | | 4.17 | | | | (0.04 | ) |
For the year ended December 31, 2016 | | $ | 20.49 | | | | 0.08 | | | | 2.68 | | | | 2.76 | | | | (0.10 | ) |
For the year ended December 31, 2015 | | $ | 21.77 | | | | 0.02 | | | | (0.41 | ) | | | (0.39 | ) | | | (0.04 | ) |
|
Class I | | | | | | | | | | | | | | | | | | | | |
For the year ended December 31, 2019 | | $ | 23.03 | | | | 0.36 | | | | 7.04 | | | | 7.40 | | | | (0.34 | ) |
For the year ended December 31, 2018 | | $ | 26.62 | | | | 0.33 | | | | (2.86 | ) | | | (2.53 | ) | | | (0.34 | ) |
For the year ended December 31, 2017 | | $ | 23.20 | | | | 0.32 | | | | 4.38 | | | | 4.70 | | | | (0.28 | ) |
For the year ended December 31, 2016 | | $ | 21.55 | | | | 0.31 | | | | 2.86 | | | | 3.17 | | | | (0.31 | ) |
For the year ended December 31, 2015 | | $ | 22.83 | | | | 0.25 | | | | (0.44 | ) | | | (0.19 | ) | | | (0.24 | ) |
|
Class Y | | | | | | | | | | | | | | | | | | | | |
For the year ended December 31, 2019 | | $ | 23.04 | | | | 0.40 | | | | 7.05 | | | | 7.45 | | | | (0.38 | ) |
For the year ended December 31, 2018 | | $ | 26.64 | | | | 0.36 | | | | (2.87 | ) | | | (2.51 | ) | | | (0.37 | ) |
For the year ended December 31, 2017 | | $ | 23.21 | | | | 0.35 | | | | 4.38 | | | | 4.73 | | | | (0.30 | ) |
For the year ended December 31, 2016 | | $ | 21.56 | | | | 0.34 | | | | 2.85 | | | | 3.19 | | | | (0.33 | ) |
For the year ended December 31, 2015 | | $ | 22.84 | | | | 0.28 | | | | (0.44 | ) | | | (0.16 | ) | | | (0.27 | ) |
|
(A) | Net investment income per share has been calculated using the average daily shares outstanding during the period. |
(B) | Total returns shown exclude the effect of applicable sales charges. |
See accompanying Notes to Financial Statements.
134 DIAMOND HILL FUNDS | ANNUAL REPORT | DECEMBER 31, 2019 | DIAMOND-HILL.COM |
| | | | | Distributions
from net
realized capital
gains | | | Total
distributions | | | Net asset
value, end of
period | | | Total
return(B) | | | Net assets,
end of
period
(000’s) | | | Ratio
of total
expenses
to average
net assets | | | Ratio of net
investment
income
(loss) to
average net
assets | | | Portfolio
turnover
rate(C) | |
| | | | | | | | | | | | | | | | | | | | | | | | | | | | | | | | | | | | |
| | | | | | | (1.04 | ) | | | (1.30 | ) | | $ | 28.86 | | | | 31.80 | % | | $ | 1,243,452 | | | | 0.97 | % | | | 1.03 | % | | | 22 | %(D) |
| | | | | | | (0.72 | ) | | | (0.98 | ) | | $ | 22.89 | | | | (9.88 | )% | | $ | 1,031,252 | | | | 0.96 | % | | | 0.95 | % | | | 29 | %(E) |
| | | | | | | (1.00 | ) | | | (1.20 | ) | | $ | 26.45 | | | | 19.95 | % | | $ | 1,346,869 | | | | 0.98 | % | | | 0.96 | % | | | 18 | % |
| | | | | | | (1.21 | ) | | | (1.45 | ) | | $ | 23.06 | | | | 14.26 | % | | $ | 1,158,652 | | | | 0.99 | % | | | 1.12 | % | | | 23 | % |
| | | | | | | (0.85 | ) | | | (1.03 | ) | | $ | 21.44 | | | | (1.10 | )% | | $ | 1,122,165 | | | | 1.04 | % | | | 0.85 | % | | | 20 | % |
| | | |
| | | | | | | | | | | | | | | | | | | | | | | | | | | | | | | | | | | | |
| | | | | | | (1.04 | ) | | | (1.10 | ) | | $ | 27.25 | | | | 30.84 | % | | $ | 83,936 | | | | 1.72 | % | | | 0.28 | % | | | 22 | %(D) |
| | | | | | | (0.72 | ) | | | (0.78 | ) | | $ | 21.67 | | | | (10.57 | )% | | $ | 84,485 | | | | 1.71 | % | | | 0.20 | % | | | 29 | %(E) |
| | | | | | | (1.00 | ) | | | (1.04 | ) | | $ | 25.07 | | | | 19.04 | % | | $ | 115,257 | | | | 1.73 | % | | | 0.21 | % | | | 18 | % |
| | | | | | | (1.21 | ) | | | (1.31 | ) | | $ | 21.94 | | | | 13.40 | % | | $ | 95,923 | | | | 1.74 | % | | | 0.37 | % | | | 23 | % |
| | | | | | | (0.85 | ) | | | (0.89 | ) | | $ | 20.49 | | | | (1.83 | )% | | $ | 84,550 | | | | 1.79 | % | | | 0.10 | % | | | 20 | % |
| | | |
| | | | | | | | | | | | | | | | | | | | | | | | | | | | | | | | | | | | |
| | | | | | | (1.04 | ) | | | (1.38 | ) | | $ | 29.05 | | | | 32.18 | % | | $ | 3,877,616 | | | | 0.68 | % | | | 1.32 | % | | | 22 | %(D) |
| | | | | | | (0.72 | ) | | | (1.06 | ) | | $ | 23.03 | | | | (9.63 | )% | | $ | 2,978,377 | | | | 0.67 | % | | | 1.23 | % | | | 29 | %(E) |
| | | | | | | (1.00 | ) | | | (1.28 | ) | | $ | 26.62 | | | | 20.30 | % | | $ | 3,538,859 | | | | 0.68 | % | | | 1.25 | % | | | 18 | % |
| | | | | | | (1.21 | ) | | | (1.52 | ) | | $ | 23.20 | | | | 14.63 | % | | $ | 2,156,390 | | | | 0.70 | % | | | 1.41 | % | | | 23 | % |
| | | | | | | (0.85 | ) | | | (1.09 | ) | | $ | 21.55 | | | | (0.85 | )% | | $ | 1,803,130 | | | | 0.77 | % | | | 1.11 | % | | | 20 | % |
| | | |
| | | | | | | | | | | | | | | | | | | | | | | | | | | | | | | | | | | | |
| | | | | | | (1.04 | ) | | | (1.42 | ) | | $ | 29.07 | | | | 32.34 | % | | $ | 1,567,818 | | | | 0.56 | % | | | 1.44 | % | | | 22 | %(D) |
| | | | | | | (0.72 | ) | | | (1.09 | ) | | $ | 23.04 | | | | (9.53 | )% | | $ | 992,056 | | | | 0.55 | % | | | 1.35 | % | | | 29 | %(E) |
| | | | | | | (1.00 | ) | | | (1.30 | ) | | $ | 26.64 | | | | 20.42 | % | | $ | 845,457 | | | | 0.58 | % | | | 1.36 | % | | | 18 | % |
| | | | | | | (1.21 | ) | | | (1.54 | ) | | $ | 23.21 | | | | 14.74 | % | | $ | 666,756 | | | | 0.60 | % | | | 1.49 | % | | | 23 | % |
| | | | | | | (0.85 | ) | | | (1.12 | ) | | $ | 21.56 | | | | (0.74 | )% | | $ | 430,568 | | | | 0.65 | % | | | 1.23 | % | | | 20 | % |
| | | |
(C) | Portfolio turnover rate is calculated on the basis of the Fund as a whole without distinguishing between classes of shares issued. |
(D) | Portfolio turnover does not include in-kind subscriptions. |
(E) | Portfolio turnover does not include redemptions in-kind. |
See accompanying Notes to Financial Statements.
DIAMOND HILL FUNDS | ANNUAL REPORT | DECEMBER 31, 2019 | DIAMOND-HILL.COM 135 |
All Cap Select Fund
Financial Highlights
Selected data for a share outstanding throughout the periods indicated
All Cap Select Fund | | Net asset
value,
beginning of
period | | | Net
investment
income
(loss)(A) | | | Net realized
and
unrealized
gains
(losses) on
investments | | | Total from
investment
operations | | | Dividends
from net
investment
income | |
Class A | | | | | | | | | | | | | | | | | | | | |
For the year ended December 31, 2019 | | $ | 12.64 | | | | 0.06 | | | | 3.78 | | | | 3.84 | | | | — | |
For the year ended December 31, 2018 | | $ | 16.01 | | | | 0.05 | | | | (1.96 | ) | | | (1.91 | ) | | | (0.06 | ) |
For the year ended December 31, 2017 | | $ | 13.35 | | | | 0.03 | | | | 2.63 | | | | 2.66 | | | | — | |
For the year ended December 31, 2016 | | $ | 12.36 | | | | (0.01 | ) | | | 1.17 | | | | 1.16 | | | | — | |
For the year ended December 31, 2015 | | $ | 12.96 | | | | 0.00 | (E) | | | (0.19 | ) | | | (0.19 | ) | | | — | |
|
Class C | | | | | | | | | | | | | | | | | | | | |
For the year ended December 31, 2019 | | $ | 11.82 | | | | (0.05 | ) | | | 3.52 | | | | 3.47 | | | | — | |
For the year ended December 31, 2018 | | $ | 15.11 | | | | (0.07 | ) | | | (1.82 | ) | | | (1.89 | ) | | | — | |
For the year ended December 31, 2017 | | $ | 12.69 | | | | (0.07 | ) | | | 2.49 | | | | 2.42 | | | | — | |
For the year ended December 31, 2016 | | $ | 11.85 | | | | (0.09 | ) | | | 1.10 | | | | 1.01 | | | | — | |
For the year ended December 31, 2015 | | $ | 12.54 | | | | (0.10 | ) | | | (0.18 | ) | | | (0.28 | ) | | | — | |
|
Class I | | | | | | | | | | | | | | | | | | | | |
For the year ended December 31, 2019 | | $ | 12.72 | | | | 0.11 | | | | 3.80 | | | | 3.91 | | | | — | |
For the year ended December 31, 2018 | | $ | 16.11 | | | | 0.10 | | | | (1.97 | ) | | | (1.87 | ) | | | (0.12 | ) |
For the year ended December 31, 2017 | | $ | 13.40 | | | | 0.07 | | | | 2.65 | | | | 2.72 | | | | (0.01 | ) |
For the year ended December 31, 2016 | | $ | 12.39 | | | | 0.03 | | | | 1.16 | | | | 1.19 | | | | (0.01 | ) |
For the year ended December 31, 2015 | | $ | 12.95 | | | | 0.03 | | | | (0.18 | ) | | | (0.15 | ) | | | — | |
|
Class Y | | | | | | | | | | | | | | | | | | | | |
For the year ended December 31, 2019 | | $ | 12.74 | | | | 0.13 | | | | 3.81 | | | | 3.94 | | | | — | |
For the year ended December 31, 2018 | | $ | 16.14 | | | | 0.12 | | | | (1.99 | ) | | | (1.87 | ) | | | (0.13 | ) |
For the year ended December 31, 2017 | | $ | 13.42 | | | | 0.09 | | | | 2.65 | | | | 2.74 | | | | (0.02 | ) |
For the year ended December 31, 2016 | | $ | 12.41 | | | | 0.04 | | | | 1.17 | | | | 1.21 | | | | (0.03 | ) |
For the year ended December 31, 2015 | | $ | 12.96 | | | | 0.05 | | | | (0.19 | ) | | | (0.14 | ) | | | — | |
|
(A) | Net investment income (loss) per share has been calculated using the average daily shares outstanding during the period. |
(B) | Total returns shown exclude the effect of applicable sales charges. |
(C) | The Fund’s adviser has contractually agreed to waive fees in the pro-rata amount of the management fee charged by the underlying Diamond Hill Fund on each Fund’s investment in such other Diamond Hill Fund. If such fee waiver had not occurred, the ratios would have been as indicated. |
See accompanying Notes to Financial Statements.
136 DIAMOND HILL FUNDS | ANNUAL REPORT | DECEMBER 31, 2019 | DIAMOND-HILL.COM |
| | Distributions
from net
realized
capital gains | | | Total
distributions | | | Net asset
value, end of
period | | | Total
return(B) | | | Net assets,
end of
period
(000’s) | | | Ratio of total
net expenses
to average
net assets | | | Ratio of
total gross
expenses to
average net
assets(C) | | | Ratio of net
investment
income
(loss) to
average net
assets | | | Portfolio
turnover
rate(D) | |
| | | | | | | | | | | | | | | | | | | | | | | | | | | | | | | | | | | | |
| | | (0.31 | ) | | | (0.31 | ) | | $ | 16.17 | | | | 30.41 | % | | $ | 11,049 | | | | 1.17 | % | | | 1.17 | % | | | 0.46 | % | | | 45 | % |
| | | (1.40 | ) | | | (1.46 | ) | | $ | 12.64 | | | | (12.31 | )% | | $ | 8,963 | | | | 1.16 | % | | | 1.16 | % | | | 0.29 | % | | | 84 | % |
| | | — | | | | — | | | $ | 16.01 | | | | 19.93 | % | | $ | 13,480 | | | | 1.17 | % | | | 1.18 | % | | | 0.21 | % | | | 52 | % |
| | | (0.17 | ) | | | (0.17 | ) | | $ | 13.35 | | | | 9.37 | % | | $ | 14,963 | | | | 1.19 | % | | | 1.19 | % | | | (0.09 | )% | | | 70 | % |
| | | (0.41 | ) | | | (0.41 | ) | | $ | 12.36 | | | | (1.44 | )% | | $ | 43,638 | | | | 1.19 | % | | | 1.19 | % | | | (0.01 | )% | | | 89 | % |
| | | |
| | | | | | | | | | | | | | | | | | | | | | | | | | | | | | | | | | | | |
| | | (0.31 | ) | | | (0.31 | ) | | $ | 14.98 | | | | 29.39 | % | | $ | 4,747 | | | | 1.92 | % | | | 1.92 | % | | | (0.32 | )% | | | 45 | % |
| | | (1.40 | ) | | | (1.40 | ) | | $ | 11.82 | | | | (12.93 | )% | | $ | 6,950 | | | | 1.91 | % | | | 1.91 | % | | | (0.46 | )% | | | 84 | % |
| | | — | | | | — | | | $ | 15.11 | | | | 19.07 | % | | $ | 11,072 | | | | 1.92 | % | | | 1.93 | % | | | (0.54 | )% | | | 52 | % |
| | | (0.17 | ) | | | (0.17 | ) | | $ | 12.69 | | | | 8.51 | % | | $ | 12,269 | | | | 1.94 | % | | | 1.94 | % | | | (0.81 | )% | | | 70 | % |
| | | (0.41 | ) | | | (0.41 | ) | | $ | 11.85 | | | | (2.21 | )% | | $ | 15,022 | | | | 1.94 | % | | | 1.94 | % | | | (0.78 | )% | | | 89 | % |
| | | |
| | | | | | | | | | | | | | | | | | | | | | | | | | | | | | | | | | | | |
| | | (0.31 | ) | | | (0.31 | ) | | $ | 16.32 | | | | 30.77 | % | | $ | 152,591 | | | | 0.88 | % | | | 0.88 | % | | | 0.75 | % | | | 45 | % |
| | | (1.40 | ) | | | (1.52 | ) | | $ | 12.72 | | | | (12.02 | )% | | $ | 114,571 | | | | 0.87 | % | | | 0.87 | % | | | 0.60 | % | | | 84 | % |
| | | — | | | | (0.01 | ) | | $ | 16.11 | | | | 20.33 | % | | $ | 136,233 | | | | 0.87 | % | | | 0.88 | % | | | 0.52 | % | | | 52 | % |
| | | (0.17 | ) | | | (0.18 | ) | | $ | 13.40 | | | | 9.62 | % | | $ | 93,192 | | | | 0.90 | % | | | 0.90 | % | | | 0.24 | % | | | 70 | % |
| | | (0.41 | ) | | | (0.41 | ) | | $ | 12.39 | | | | (1.14 | )% | | $ | 81,408 | | | | 0.92 | % | | | 0.92 | % | | | 0.25 | % | | | 89 | % |
| | | |
| | | | | | | | | | | | | | | | | | | | | | | | | | | | | | | | | | | | |
| | | (0.31 | ) | | | (0.31 | ) | | $ | 16.37 | | | | 30.96 | % | | $ | 103,963 | | | | 0.76 | % | | | 0.76 | % | | | 0.86 | % | | | 45 | % |
| | | (1.40 | ) | | | (1.53 | ) | | $ | 12.74 | | | | (11.95 | )% | | $ | 65,218 | | | | 0.75 | % | | | 0.75 | % | | | 0.73 | % | | | 84 | % |
| | | — | | | | (0.02 | ) | | $ | 16.14 | | | | 20.45 | % | | $ | 21,628 | | | | 0.77 | % | | | 0.78 | % | | | 0.61 | % | | | 52 | % |
| | | (0.17 | ) | | | (0.20 | ) | | $ | 13.42 | | | | 9.72 | % | | $ | 18,456 | | | | 0.80 | % | | | 0.80 | % | | | 0.36 | % | | | 70 | % |
| | | (0.41 | ) | | | (0.41 | ) | | $ | 12.41 | | | | (1.06 | )% | | $ | 10,703 | | | | 0.80 | % | | | 0.80 | % | | | 0.35 | % | | | 89 | % |
| | | |
(D) | Portfolio turnover rate is calculated on the basis of the Fund as a whole without distinguishing between classes of shares issued. |
(E) | Amount is less than $0.005. |
See accompanying Notes to Financial Statements.
DIAMOND HILL FUNDS | ANNUAL REPORT | DECEMBER 31, 2019 | DIAMOND-HILL.COM 137 |
Long-Short Fund
Financial Highlights
Selected data for a share outstanding throughout the periods indicated
Long-Short Fund | | Net asset
value,
beginning of
period | | | Net
investment
income
(loss)(A) | | | Net realized
and
unrealized
gains
(losses) on
investments | | | Total from
investment
operations | | | Dividends
from net
investment
income | |
Class A | | | | | | | | | | | | | | | | | | | | |
For the year ended December 31, 2019 | | $ | 22.78 | | | | 0.13 | | | | 5.04 | | | | 5.17 | | | | (0.17 | ) |
For the year ended December 31, 2018 | | $ | 25.76 | | | | 0.10 | | | | (1.96 | ) | | | (1.86 | ) | | | (0.07 | ) |
For the year ended December 31, 2017 | | $ | 24.91 | | | | (0.05 | ) | | | 1.45 | | | | 1.40 | | | | — | |
For the year ended December 31, 2016 | | $ | 23.36 | | | | (0.09 | ) | | | 2.49 | | | | 2.40 | | | | — | |
For the year ended December 31, 2015 | | $ | 23.87 | | | | (0.11 | ) | | | (0.29 | ) | | | (0.40 | ) | | | — | |
|
Class C | | | | | | | | | | | | | | | | | | | | |
For the year ended December 31, 2019 | | $ | 20.18 | | | | (0.04 | ) | | | 4.43 | | | | 4.39 | | | | — | |
For the year ended December 31, 2018 | | $ | 23.04 | | | | (0.08 | ) | | | (1.73 | ) | | | (1.81 | ) | | | — | |
For the year ended December 31, 2017 | | $ | 22.51 | | | | (0.22 | ) | | | 1.30 | | | | 1.08 | | | | — | |
For the year ended December 31, 2016 | | $ | 21.34 | | | | (0.24 | ) | | | 2.26 | | | | 2.02 | | | | — | |
For the year ended December 31, 2015 | | $ | 21.98 | | | | (0.27 | ) | | | (0.26 | ) | | | (0.53 | ) | | | — | |
|
Class I | | | | | | | | | | | | | | | | | | | | |
For the year ended December 31, 2019 | | $ | 23.32 | | | | 0.22 | | | | 5.16 | | | | 5.38 | | | | (0.23 | ) |
For the year ended December 31, 2018 | | $ | 26.39 | | | | 0.18 | | | | (2.01 | ) | | | (1.83 | ) | | | (0.19 | ) |
For the year ended December 31, 2017 | | $ | 25.43 | | | | 0.02 | | | | 1.50 | | | | 1.52 | | | | (0.01 | ) |
For the year ended December 31, 2016 | | $ | 23.77 | | | | (0.02 | ) | | | 2.53 | | | | 2.51 | | | | — | |
For the year ended December 31, 2015 | | $ | 24.22 | | | | (0.05 | ) | | | (0.29 | ) | | | (0.34 | ) | | | — | |
|
Class Y | | | | | | | | | | | | | | | | | | | | |
For the year ended December 31, 2019 | | $ | 23.42 | | | | 0.25 | | | | 5.18 | | | | 5.43 | | | | (0.26 | ) |
For the year ended December 31, 2018 | | $ | 26.49 | | | | 0.21 | | | | (2.01 | ) | | | (1.80 | ) | | | (0.22 | ) |
For the year ended December 31, 2017 | | $ | 25.53 | | | | 0.05 | | | | 1.49 | | | | 1.54 | | | | (0.03 | ) |
For the year ended December 31, 2016 | | $ | 23.83 | | | | 0.01 | | | | 2.54 | | | | 2.55 | | | | — | |
For the year ended December 31, 2015 | | $ | 24.25 | | | | (0.02 | ) | | | (0.29 | ) | | | (0.31 | ) | | | — | |
|
(A) | Net investment income (loss) per share has been calculated using the average daily shares outstanding during the period. |
(B) | Total returns shown exclude the effect of applicable sales charges. |
(C) | This fund invests in short positions and as such incurs certain expenses and fees. If such expenses and fees had not occurred, the ratios of total expenses to average net assets would have been 1.36% for Class A, 2.11% for Class C, 1.07% for Class I and 0.95% for Class Y. |
See accompanying Notes to Financial Statements.
138 DIAMOND HILL FUNDS | ANNUAL REPORT | DECEMBER 31, 2019 | DIAMOND-HILL.COM |
| | Distributions
from net
realized
capital gains | | | Total
distributions | | | Net asset
value, end of
period | | | Total
return(B) | | | Net assets,
end of
period
(000’s) | | | Ratio of total
net expenses
to average
net assets(C) | | | Ratio of
total gross
expenses to
average net
assets(D) | | | Ratio of net
investment
income
(loss) to
average net
assets | | | Portfolio
turnover
rate(E) | |
| | | | | | | | | | | | | | | | | | | | | | | | | | | | | | | | | | | | |
| | | (1.49 | ) | | | (1.66 | ) | | $ | 26.29 | | | | 22.74 | % | | $ | 234,584 | | | | 1.85 | % | | | 1.86 | % | | | 0.51 | % | | | 54 | %(F) |
| | | (1.05 | ) | | | (1.12 | ) | | $ | 22.78 | | | | (7.30 | )% | | $ | 188,932 | | | | 1.72 | % | | | 1.73 | % | | | 0.38 | % | | | 64 | %(F) |
| | | (0.55 | ) | | | (0.55 | ) | | $ | 25.76 | | | | 5.65 | % | | $ | 358,395 | | | | 1.95 | % | | | 1.96 | % | | | (0.22 | )% | | | 43 | %(F) |
| | | (0.85 | ) | | | (0.85 | ) | | $ | 24.91 | | | | 10.26 | % | | $ | 460,104 | | | | 2.06 | % | | | 2.06 | % | | | (0.20 | )% | | | 45 | % |
| | | (0.11 | ) | | | (0.11 | ) | | $ | 23.36 | | | | (1.67 | )% | | $ | 569,218 | | | | 1.89 | % | | | 1.89 | % | | | (0.47 | )% | | | 81 | % |
| | | |
| | | | | | | | | | | | | | | | | | | | | | | | | | | | | | | | | | | | |
| | | (1.49 | ) | | | (1.49 | ) | | $ | 23.08 | | | | 21.80 | % | | $ | 41,747 | | | | 2.60 | % | | | 2.61 | % | | | (0.16 | )% | | | 54 | %(F) |
| | | (1.05 | ) | | | (1.05 | ) | | $ | 20.18 | | | | (7.96 | )% | | $ | 80,351 | | | | 2.47 | % | | | 2.48 | % | | | (0.37 | )% | | | 64 | %(F) |
| | | (0.55 | ) | | | (0.55 | ) | | $ | 23.04 | | | | 4.83 | % | | $ | 115,009 | | | | 2.70 | % | | | 2.71 | % | | | (0.97 | )% | | | 43 | %(F) |
| | | (0.85 | ) | | | (0.85 | ) | | $ | 22.51 | | | | 9.45 | % | | $ | 145,313 | | | | 2.81 | % | | | 2.81 | % | | | (1.13 | )% | | | 45 | % |
| | | (0.11 | ) | | | (0.11 | ) | | $ | 21.34 | | | | (2.40 | )% | | $ | 169,861 | | | | 2.64 | % | | | 2.64 | % | | | (1.22 | )% | | | 81 | % |
| | | |
| | | | | | | | | | | | | | | | | | | | | | | | | | | | | | | | | | | | |
| | | (1.49 | ) | | | (1.72 | ) | | $ | 26.98 | | | | 23.11 | % | | $ | 2,959,933 | | | | 1.56 | % | | | 1.57 | % | | | 0.84 | % | | | 54 | %(F) |
| | | (1.05 | ) | | | (1.24 | ) | | $ | 23.32 | | | | (7.04 | )% | | $ | 3,110,940 | | | | 1.43 | % | | | 1.44 | % | | | 0.68 | % | | | 64 | %(F) |
| | | (0.55 | ) | | | (0.56 | ) | | $ | 26.39 | | | | 5.99 | % | | $ | 4,032,586 | | | | 1.65 | % | | | 1.66 | % | | | 0.09 | % | | | 43 | %(F) |
| | | (0.85 | ) | | | (0.85 | ) | | $ | 25.43 | | | | 10.55 | % | | $ | 3,589,749 | | | | 1.76 | % | | | 1.76 | % | | | (0.09 | )% | | | 45 | % |
| | | (0.11 | ) | | | (0.11 | ) | | $ | 23.77 | | | | (1.40 | )% | | $ | 3,382,697 | | | | 1.62 | % | | | 1.62 | % | | | (0.21 | )% | | | 81 | % |
| | | |
| | | | | | | | | | | | | | | | | | | | | | | | | | | | | | | | | | | | |
| | | (1.49 | ) | | | (1.75 | ) | | $ | 27.10 | | | | 23.23 | % | | $ | 291,753 | | | | 1.44 | % | | | 1.45 | % | | | 0.93 | % | | | 54 | %(F) |
| | | (1.05 | ) | | | (1.27 | ) | | $ | 23.42 | | | | (6.89 | )% | | $ | 214,138 | | | | 1.31 | % | | | 1.32 | % | | | 0.80 | % | | | 64 | %(F) |
| | | (0.55 | ) | | | (0.58 | ) | | $ | 26.49 | | | | 6.07 | % | | $ | 260,735 | | | | 1.55 | % | | | 1.56 | % | | | 0.19 | % | | | 43 | %(F) |
| | | (0.85 | ) | | | (0.85 | ) | | $ | 25.53 | | | | 10.69 | % | | $ | 227,680 | | | | 1.67 | % | | | 1.67 | % | | | 0.02 | % | | | 45 | % |
| | | (0.11 | ) | | | (0.11 | ) | | $ | 23.83 | | | | (1.27 | )% | | $ | 290,928 | | | | 1.50 | % | | | 1.50 | % | | | (0.08 | )% | | | 81 | % |
| | | |
(D) | The Fund’s adviser has contractually agreed to waive fees in the pro-rata amount of the management fee charged by the underlying Diamond Hill Fund on each Fund’s investment in such other Diamond Hill Fund. If such fee waiver had not occurred, the ratios would have been as indicated. |
(E) | Portfolio turnover rate is calculated on the basis of the Fund as a whole without distinguishing between classes of shares issued. |
(F) | The portfolio turnover rate for 2019, 2018 and 2017 would have been 42%, 51% and 32%, respectively, if the absolute value of securities sold short liability was included in the denominator of the calculation. |
See accompanying Notes to Financial Statements.
DIAMOND HILL FUNDS | ANNUAL REPORT | DECEMBER 31, 2019 | DIAMOND-HILL.COM 139 |
Research Opportunities Fund
Financial Highlights
Selected data for a share outstanding throughout the periods indicated
Research Opportunities Fund | | Net asset
value,
beginning of
period | | | Net
investment
income
(loss)(A) | | | Net realized
and
unrealized
gains
(losses) on
investments | | | Total from
investment
operations | | | Dividends
from net
investment
income | |
Class A | | | | | | | | | | | | | | | | | | | | |
For the year ended December 31, 2019 | | $ | 19.67 | | | | (0.05 | ) | | | 4.98 | | | | 4.93 | | | | (0.07 | ) |
For the year ended December 31, 2018 | | $ | 23.56 | | | | (0.02 | ) | | | (3.01 | ) | | | (3.03 | ) | | | — | |
For the year ended December 31, 2017 | | $ | 21.44 | | | | (0.12 | ) | | | 2.89 | | | | 2.77 | | | | — | |
For the year ended December 31, 2016 | | $ | 19.70 | | | | (0.04 | ) | | | 1.94 | | | | 1.90 | | | | — | |
For the year ended December 31, 2015 | | $ | 22.52 | | | | (0.06 | ) | | | (1.14 | ) | | | (1.20 | ) | | | — | |
|
Class C | | | | | | | | | | | | | | | | | | | | |
For the year ended December 31, 2019 | | $ | 18.51 | | | | (0.21 | ) | | | 4.69 | | | | 4.48 | | | | — | |
For the year ended December 31, 2018 | | $ | 22.40 | | | | (0.19 | ) | | | (2.84 | ) | | | (3.03 | ) | | | — | |
For the year ended December 31, 2017 | | $ | 20.57 | | | | (0.28 | ) | | | 2.76 | | | | 2.48 | | | | — | |
For the year ended December 31, 2016 | | $ | 19.06 | | | | (0.19 | ) | | | 1.86 | | | | 1.67 | | | | — | |
For the year ended December 31, 2015 | | $ | 22.00 | | | | (0.21 | ) | | | (1.11 | ) | | | (1.32 | ) | | | — | |
|
Class I | | | | | | | | | | | | | | | | | | | | |
For the year ended December 31, 2019 | | $ | 19.94 | | | | 0.04 | | | | 5.03 | | | | 5.07 | | | | (0.11 | ) |
For the year ended December 31, 2018 | | $ | 23.83 | | | | 0.05 | | | | (3.07 | ) | | | (3.02 | ) | | | (0.01 | ) |
For the year ended December 31, 2017 | | $ | 21.61 | | | | (0.06 | ) | | | 2.93 | | | | 2.87 | | | | — | |
For the year ended December 31, 2016 | | $ | 19.81 | | | | 0.02 | | | | 1.94 | | | | 1.96 | | | | — | |
For the year ended December 31, 2015 | | $ | 22.61 | | | | (0.01 | ) | | | (1.13 | ) | | | (1.14 | ) | | | (0.04 | ) |
|
Class Y | | | | | | | | | | | | | | | | | | | | |
For the year ended December 31, 2019 | | $ | 20.01 | | | | 0.08 | | | | 5.04 | | | | 5.12 | | | | (0.14 | ) |
For the year ended December 31, 2018 | | $ | 23.88 | | | | 0.07 | | | | (3.06 | ) | | | (2.99 | ) | | | (0.02 | ) |
For the year ended December 31, 2017 | | $ | 21.63 | | | | (0.03 | ) | | | 2.93 | | | | 2.90 | | | | — | |
For the year ended December 31, 2016 | | $ | 19.80 | | | | 0.04 | | | | 1.95 | | | | 1.99 | | | | — | |
For the year ended December 31, 2015 | | $ | 22.64 | | | | 0.02 | | | | (1.14 | ) | | | (1.12 | ) | | | (0.10 | ) |
|
(A) | Net investment income (loss) per share has been calculated using the average daily shares outstanding during the period. |
(B) | Total returns shown exclude the effect of applicable sales charges. |
(C) | This fund invests in short positions and as such incurs certain expenses and fees. If such expenses and fees had not occurred, the ratios of total expenses to average net assets would have been 1.43% for Class A, 2.18% for Class C, 1.14% for Class I and 1.02% for Class Y. |
See accompanying Notes to Financial Statements.
140 DIAMOND HILL FUNDS | ANNUAL REPORT | DECEMBER 31, 2019 | DIAMOND-HILL.COM |
| | | Distributions
from net
realized
capital gains | | | Total
distributions | | | Net asset
value, end of
period | | | Total
return(B) | | | Net assets,
end of
period
(000’s) | | | Ratio of total
expenses to
average net
assets(C) | | | Ratio of net
investment
income
(loss) to
average net
assets | | | Portfolio
turnover
rate(D) | |
| | | | | | | | | | | | | | | | | | | | | | | | | | | | | | | | | |
| | | | (1.09 | ) | | | (1.16 | ) | | $ | 23.44 | | | | 25.13 | % | | $ | 10,646 | | | | 1.80 | % | | | (0.22 | )% | | | 74 | %(E) |
| | | | (0.86 | ) | | | (0.86 | ) | | $ | 19.67 | | | | (13.06 | )% | | $ | 4,991 | | | | 1.80 | % | | | (0.17 | )% | | | 88 | %(E) |
| | | | (0.65 | ) | | | (0.65 | ) | | $ | 23.56 | | | | 12.98 | % | | $ | 10,533 | | | | 1.84 | % | | | (0.52 | )% | | | 83 | %(E) |
| | | | (0.16 | ) | | | (0.16 | ) | | $ | 21.44 | | | | 9.64 | % | | $ | 4,162 | | | | 2.10 | % | | | (0.16 | )% | | | 67 | % |
| | | | (1.62 | ) | | | (1.62 | ) | | $ | 19.70 | | | | (5.29 | )% | | $ | 8,637 | | | | 1.83 | % | | | (0.27 | )% | | | 147 | % |
| | | |
| | | | | | | | | | | | | | | | | | | | | | | | | | | | | | | | | |
| | | | (1.09 | ) | | | (1.09 | ) | | $ | 21.90 | | | | 24.28 | % | | $ | 1,368 | | | | 2.55 | % | | | (0.99 | )% | | | 74 | %(E) |
| | | | (0.86 | ) | | | (0.86 | ) | | $ | 18.51 | | | | (13.74 | )% | | $ | 1,171 | | | | 2.55 | % | | | (0.90 | )% | | | 88 | %(E) |
| | | | (0.65 | ) | | | (0.65 | ) | | $ | 22.40 | | | | 12.12 | % | | $ | 2,810 | | | | 2.59 | % | | | (1.31 | )% | | | 83 | %(E) |
| | | | (0.16 | ) | | | (0.16 | ) | | $ | 20.57 | | | | 8.76 | % | | $ | 2,986 | | | | 2.85 | % | | | (0.93 | )% | | | 67 | % |
| | | | (1.62 | ) | | | (1.62 | ) | | $ | 19.06 | | | | (5.96 | )% | | $ | 5,097 | | | | 2.58 | % | | | (0.96 | )% | | | 147 | % |
| | | |
| | | | | | | | | | | | | | | | | | | | | | | | | | | | | | | | | |
| | | | (1.09 | ) | | | (1.20 | ) | | $ | 23.81 | | | | 25.51 | % | | $ | 45,158 | | | | 1.51 | % | | | 0.16 | % | | | 74 | %(E) |
| | | | (0.86 | ) | | | (0.87 | ) | | $ | 19.94 | | | | (12.86 | )% | | $ | 31,692 | | | | 1.51 | % | | | 0.17 | % | | | 88 | %(E) |
| | | | (0.65 | ) | | | (0.65 | ) | | $ | 23.83 | | | | 13.34 | % | | $ | 35,021 | | | | 1.54 | % | | | (0.23 | )% | | | 83 | %(E) |
| | | | (0.16 | ) | | | (0.16 | ) | | $ | 21.61 | | | | 9.89 | % | | $ | 27,588 | | | | 1.80 | % | | | 0.05 | % | | | 67 | % |
| | | | (1.62 | ) | | | (1.66 | ) | | $ | 19.81 | | | | (5.00 | )% | | $ | 26,186 | | | | 1.57 | % | | | (0.03 | )% | | | 147 | % |
| | | |
| | | | | | | | | | | | | | | | | | | | | | | | | | | | | | | | | |
| | | | (1.09 | ) | | | (1.23 | ) | | $ | 23.90 | | | | 25.64 | % | | $ | 19,400 | | | | 1.39 | % | | | 0.36 | % | | | 74 | %(E) |
| | | | (0.86 | ) | | | (0.88 | ) | | $ | 20.01 | | | | (12.73 | )% | | $ | 17,198 | | | | 1.39 | % | | | 0.29 | % | | | 88 | %(E) |
| | | | (0.65 | ) | | | (0.65 | ) | | $ | 23.88 | | | | 13.47 | % | | $ | 20,521 | | | | 1.44 | % | | | (0.14 | )% | | | 83 | %(E) |
| | | | (0.16 | ) | | | (0.16 | ) | | $ | 21.63 | | | | 10.05 | % | | $ | 16,755 | | | | 1.70 | % | | | 0.19 | % | | | 67 | % |
| | | | (1.62 | ) | | | (1.72 | ) | | $ | 19.80 | | | | (4.91 | )% | | $ | 15,285 | | | | 1.44 | % | | | 0.10 | % | | | 147 | % |
| | | |
(D) | Portfolio turnover rate is calculated on the basis of the Fund as a whole without distinguishing between classes of shares issued. |
(E) | The portfolio turnover rate for 2019, 2018 and 2017 would have been 62%, 70% and 68%, respectively, if the absolute value of securities sold short liability was included in the denominator of the calculation. |
See accompanying Notes to Financial Statements.
DIAMOND HILL FUNDS | ANNUAL REPORT | DECEMBER 31, 2019 | DIAMOND-HILL.COM 141 |
Global Fund
Financial Highlights
Selected data for a share outstanding throughout the periods indicated
Global Fund(A) | | Net asset
value,
beginning of
period | | | Net
investment
income (B) | | | Net realized
and
unrealized
gains
(losses) on
investments | | | Total from
investment
operations | | | Dividends
from net
investment
income | |
Class A | | | | | | | | | | | | | | | | | | | | |
For the year ended December 31, 2019 | | $ | 11.67 | | | | 0.16 | | | | 3.34 | | | | 3.50 | | | | (0.12 | ) |
For the year ended December 31, 2018 | | $ | 14.42 | | | | 0.11 | | | | (2.14 | ) | | | (2.03 | ) | | | (0.05 | ) |
|
Class I | | | | | | | | | | | | | | | | | | | | |
For the year ended December 31, 2019 | | $ | 11.69 | | | | 0.15 | | | | 3.40 | | | | 3.55 | | | | (0.16 | ) |
For the year ended December 31, 2018 | | $ | 14.42 | | | | 0.15 | | | | (2.14 | ) | | | (1.99 | ) | | | (0.07 | ) |
|
Class Y | | | | | | | | | | | | | | | | | | | | |
For the year ended December 31, 2019 | | $ | 11.70 | | | | 0.19 | | | | 3.38 | | | | 3.57 | | | | (0.17 | ) |
For the year ended December 31, 2018 | | $ | 14.42 | | | | 0.16 | | | | (2.14 | ) | | | (1.98 | ) | | | (0.07 | ) |
|
(A) | Inception date of the Fund is December 29, 2017. Fund commenced public offering on January 2, 2018. |
(B) | Net investment income per share has been calculated using the average daily shares outstanding during the period. |
See accompanying Notes to Financial Statements.
142 DIAMOND HILL FUNDS | ANNUAL REPORT | DECEMBER 31, 2019 | DIAMOND-HILL.COM |
| | | Distributions
from net
realized
capital gains | | | Total
distributions | | | Net asset
value, end of
period | | | Total
return(C) | | | Net assets,
end of
period
(000’s) | | | Ratio of total
expenses to
average net
assets | | | Ratio of net
investment
income
(loss) to
average net
assets | | | Portfolio
turnover
rate(D) | |
| | | | | | | | | | | | | | | | | | | | | | | | | | | | | | | | | |
| | | | — | | | | (0.12 | ) | | $ | 15.05 | | | | 29.96 | % | | $ | 111 | | | | 1.15 | % | | | 1.18 | % | | | 29 | % |
| | | | (0.67 | ) | | | (0.72 | ) | | $ | 11.67 | | | | (14.91 | )% | | $ | 66 | | | | 1.18 | % | | | 0.86 | % | | | 84 | % |
| | | |
| | | | | | | | | | | | | | | | | | | | | | | | | | | | | | | | | |
| | | | — | | | | (0.16 | ) | | $ | 15.08 | | | | 30.34 | % | | $ | 6,216 | | | | 0.86 | % | | | 1.10 | % | | | 29 | % |
| | | | (0.67 | ) | | | (0.74 | ) | | $ | 11.69 | | | | (14.66 | )% | | $ | 4,440 | | | | 0.89 | % | | | 1.09 | % | | | 84 | % |
| | | |
| | | | | | | | | | | | | | | | | | | | | | | | | | | | | | | | | |
| | | | — | | | | (0.17 | ) | | $ | 15.10 | | | | 30.54 | % | | $ | 15,528 | | | | 0.74 | % | | | 1.37 | % | | | 29 | % |
| | | | (0.67 | ) | | | (0.74 | ) | | $ | 11.70 | | | | (14.55 | )% | | $ | 10,214 | | | | 0.77 | % | | | 1.24 | % | | | 84 | % |
| | | |
(C) | Total returns shown exclude the effect of applicable sales charges. |
(D) | Portfolio turnover rate is calculated on the basis of the Fund as a whole without distinguishing between classes of shares issued. |
See accompanying Notes to Financial Statements.
DIAMOND HILL FUNDS | ANNUAL REPORT | DECEMBER 31, 2019 | DIAMOND-HILL.COM 143 |
International Fund
Financial Highlights
Selected data for a share outstanding throughout the periods indicated
International Fund(A) | | Net asset
value,
beginning of
period | | | Net
investment
income (B) | | | Net realized
and
unrealized
gains on
investments | | | Total from
investment
operations | | | Dividends
from net
investment
income | |
Class A | | | | | | | | | | | | | | | | | | | | |
For the six months ended December 31, 2019 | | $ | 13.55 | | | | 0.02 | | | | 1.15 | | | | 1.17 | | | | (0.04 | ) |
|
Class I | | | | | | | | | | | | | | | | | | | | |
For the six months ended December 31, 2019 | | $ | 13.55 | | | | 0.04 | | | | 1.15 | | | | 1.19 | | | | (0.04 | ) |
|
Class Y | | | | | | | | | | | | | | | | | | | | |
For the six months ended December 31, 2019 | | $ | 13.55 | | | | 0.05 | | | | 1.15 | | | | 1.20 | | | | (0.05 | ) |
|
(A) | Inception date of the Fund is June 28, 2019. The Fund commenced public offering and operations on July 1, 2019. |
(B) | Net investment income per share has been calculated using the average daily shares outstanding during the period. |
(C) | Total returns shown exclude the effect of applicable sales charges. |
See accompanying Notes to Financial Statements.
144 DIAMOND HILL FUNDS | ANNUAL REPORT | DECEMBER 31, 2019 | DIAMOND-HILL.COM |
| | | Distributions
from net
realized
capital gains | | | Total
distributions | | | Net asset
value, end of
period | | | Total
return(C)(D) | | | Net assets,
end of
period
(000’s) | | | Ratio of total
expenses to
average net
assets(E) | | | Ratio of net
investment
income
(loss) to
average net
assets(E) | | | Portfolio
turnover
rate(D)(F) | |
| | | | | | | | | | | | | | | | | | | | | | | | | | | | | | | | | |
| | | | (0.01 | ) | | | (0.05 | ) | | $ | 14.67 | | | | 8.64 | % | | $ | 45 | | | | 1.21 | % | | | 0.25 | % | | | 8 | % |
| | | |
| | | | | | | | | | | | | | | | | | | | | | | | | | | | | | | | | |
| | | | (0.01 | ) | | | (0.05 | ) | | $ | 14.69 | | | | 8.80 | % | | $ | 3,828 | | | | 0.92 | % | | | 0.61 | % | | | 8 | % |
| | | |
| | | | | | | | | | | | | | | | | | | | | | | | | | | | | | | | | |
| | | | (0.01 | ) | | | (0.06 | ) | | $ | 14.69 | | | | 8.85 | % | | $ | 9,616 | | | | 0.80 | % | | | 0.70 | % | | | 8 | % |
| | | |
(F) | Portfolio turnover rate is calculated on the basis of the Fund as a whole without distinguishing between classes of shares issued. |
See accompanying Notes to Financial Statements.
DIAMOND HILL FUNDS | ANNUAL REPORT | DECEMBER 31, 2019 | DIAMOND-HILL.COM 145 |
Short Duration Total Return Fund
Financial Highlights
Selected data for a share outstanding throughout the periods indicated
Short Duration Total Return Fund(A) | | Net asset
value,
beginning of
period | | | Net
investment
income(B) | | | Net realized
and
unrealized
gains
(losses) on
investments | | | Total from
investment
operations | | | Dividends
from net
investment
income | |
Class A | | | | | | | | | | | | | | | | | | | | |
For the year ended December 31, 2019 | | $ | 10.05 | | | | 0.38 | | | | 0.06 | | | | 0.44 | | | | (0.38 | ) |
For the year ended December 31, 2018 | | $ | 10.11 | | | | 0.33 | | | | (0.04 | ) | | | 0.29 | | | | (0.34 | ) |
For the year ended December 31, 2017 | | $ | 10.04 | | | | 0.30 | | | | 0.09 | | | | 0.39 | | | | (0.31 | ) |
For the period ended December 31, 2016 | | $ | 10.00 | | | | 0.09 | | | | 0.03 | | | | 0.12 | | | | (0.08 | ) |
|
Class I | | | | | | | | | | | | | | | | | | | | |
For the year ended December 31, 2019 | | $ | 10.05 | | | | 0.41 | | | | 0.07 | | | | 0.48 | | | | (0.41 | ) |
For the year ended December 31, 2018 | | $ | 10.11 | | | | 0.36 | | | | (0.04 | ) | | | 0.32 | | | | (0.37 | ) |
For the year ended December 31, 2017 | | $ | 10.03 | | | | 0.33 | | | | 0.10 | | | | 0.43 | | | | (0.34 | ) |
For the period ended December 31, 2016 | | $ | 10.00 | | | | 0.10 | | | | 0.03 | | | | 0.13 | | | | (0.10 | ) |
|
Class Y | | | | | | | | | | | | | | | | | | | | |
For the year ended December 31, 2019 | | $ | 10.06 | | | | 0.42 | | | | 0.06 | | | | 0.48 | | | | (0.42 | ) |
For the year ended December 31, 2018 | | $ | 10.11 | | | | 0.38 | | | | (0.04 | ) | | | 0.34 | | | | (0.38 | ) |
For the year ended December 31, 2017 | | $ | 10.03 | | | | 0.34 | | | | 0.10 | | | | 0.44 | | | | (0.35 | ) |
For the period ended December 31, 2016 | | $ | 10.00 | | | | 0.11 | | | | 0.02 | | | | 0.13 | | | | (0.10 | ) |
|
(A) | Inception date of the Fund is July 5, 2016. The Fund commenced public offering and operations on July 5, 2016. |
(B) | Net investment income per share has been calculated using the average daily shares outstanding during the period. |
(C) | Total returns shown exclude the effect of applicable sales charges. |
See accompanying Notes to Financial Statements.
146 DIAMOND HILL FUNDS | ANNUAL REPORT | DECEMBER 31, 2019 | DIAMOND-HILL.COM |
| | | Distributions
from net
realized
capital gains | | | Total
distributions | | | Net asset
value, end of
period | | | Total
return(C) | | | Net assets,
end of
period
(000’s) | | | Ratio of total
expenses to
average net
assets | | | Ratio of net
investment
income
(loss) to
average net
assets | | | Portfolio
turnover
rate(D) | |
| | | | | | | | | | | | | | | | | | | | | | | | | | | | | | | | | |
| | | | (0.00 | )(E) | | | (0.38 | ) | | $ | 10.11 | | | | 4.44 | % | | $ | 55,727 | | | | 0.82 | % | | | 3.72 | % | | | 54 | % |
| | | | (0.01 | ) | | | (0.35 | ) | | $ | 10.05 | | | | 2.88 | % | | $ | 18,789 | | | | 0.81 | % | | | 3.30 | % | | | 67 | % |
| | | | (0.01 | ) | | | (0.32 | ) | | $ | 10.11 | | | | 3.97 | % | | $ | 20,511 | | | | 0.83 | % | | | 3.30 | % | | | 82 | % |
| | | | — | | | | (0.08 | ) | | $ | 10.04 | | | | 1.19 | %(F) | | $ | 222 | | | | 0.83 | %(G) | | | 1.12 | %(G) | | | 19 | %(F) |
| | | |
| | | | | | | | | | | | | | | | | | | | | | | | | | | | | | | | | |
| | | | (0.00 | )(E) | | | (0.41 | ) | | $ | 10.12 | | | | 4.85 | % | | $ | 525,994 | | | | 0.53 | % | | | 4.00 | % | | | 54 | % |
| | | | (0.01 | ) | | | (0.38 | ) | | $ | 10.05 | | | | 3.18 | % | | $ | 308,341 | | | | 0.52 | % | | | 3.62 | % | | | 67 | % |
| | | | (0.01 | ) | | | (0.35 | ) | | $ | 10.11 | | | | 4.33 | % | | $ | 61,136 | | | | 0.53 | % | | | 3.29 | % | | | 82 | % |
| | | | — | | | | (0.10 | ) | | $ | 10.03 | | | | 1.26 | %(F) | | $ | 14,707 | | | | 0.53 | %(G) | | | 1.32 | %(G) | | | 19 | %(F) |
| | | |
| | | | | | | | | | | | | | | | | | | | | | | | | | | | | | | | | |
| | | | (0.00 | )(E) | | | (0.42 | ) | | $ | 10.12 | | | | 4.84 | % | | $ | 226,938 | | | | 0.41 | % | | | 4.09 | % | | | 54 | % |
| | | | (0.01 | ) | | | (0.39 | ) | | $ | 10.06 | | | | 3.38 | % | | $ | 252,137 | | | | 0.40 | % | | | 3.72 | % | | | 67 | % |
| | | | (0.01 | ) | | | (0.36 | ) | | $ | 10.11 | | | | 4.43 | % | | $ | 231,290 | | | | 0.43 | % | | | 3.33 | % | | | 82 | % |
| | | | — | | | | (0.10 | ) | | $ | 10.03 | | | | 1.29 | %(F) | | $ | 182,527 | | | | 0.44 | %(G) | | | 1.25 | %(G) | | | 19 | %(F) |
| | | |
(D) | Portfolio turnover rate is calculated on the basis of the Fund as a whole without distinguishing between classes of shares issued. |
(E) | Amount is less than $0.005. |
See accompanying Notes to Financial Statements.
DIAMOND HILL FUNDS | ANNUAL REPORT | DECEMBER 31, 2019 | DIAMOND-HILL.COM 147 |
Core Bond Fund
Financial Highlights
Selected data for a share outstanding throughout the periods indicated
Core Bond Fund(A) | | Net asset
value,
beginning of
period | | | Net
investment
income(B) | | | Net realized
and
unrealized
gains
(losses) on
investments | | | Total from
investment
operations | | | Dividends
from net
investment
income | |
Class A | | | | | | | | | | | | | | | | | | | | |
For the year ended December 31, 2019 | | $ | 9.71 | | | | 0.24 | | | | 0.49 | | | | 0.73 | | | | (0.25 | ) |
For the year ended December 31, 2018 | | $ | 9.85 | | | | 0.25 | | | | (0.13 | ) | | | 0.12 | | | | (0.26 | ) |
For the year ended December 31, 2017 | | $ | 9.70 | | | | 0.21 | | | | 0.16 | | | | 0.37 | | | | (0.22 | ) |
For the period ended December 31, 2016 | | $ | 10.00 | | | | 0.07 | | | | (0.28 | ) | | | (0.21 | ) | | | (0.09 | ) |
|
Class I | | | | | | | | | | | | | | | | | | | | |
For the year ended December 31, 2019 | | $ | 9.71 | | | | 0.26 | | | | 0.50 | | | | 0.76 | | | | (0.28 | ) |
For the year ended December 31, 2018 | | $ | 9.85 | | | | 0.28 | | | | (0.13 | ) | | | 0.15 | | | | (0.29 | ) |
For the year ended December 31, 2017 | | $ | 9.70 | | | | 0.24 | | | | 0.16 | | | | 0.40 | | | | (0.25 | ) |
For the period ended December 31, 2016 | | $ | 10.00 | | | | 0.09 | | | | (0.30 | ) | | | (0.21 | ) | | | (0.09 | ) |
|
Class Y | | | | | | | | | | | | | | | | | | | | |
For the year ended December 31, 2019 | | $ | 9.71 | | | | 0.28 | | | | 0.50 | | | | 0.78 | | | | (0.29 | ) |
For the year ended December 31, 2018 | | $ | 9.85 | | | | 0.29 | | | | (0.13 | ) | | | 0.16 | | | | (0.30 | ) |
For the year ended December 31, 2017 | | $ | 9.70 | | | | 0.25 | | | | 0.16 | | | | 0.41 | | | | (0.26 | ) |
For the period ended December 31, 2016 | | $ | 10.00 | | | | 0.09 | | | | (0.30 | ) | | | (0.21 | ) | | | (0.09 | ) |
|
(A) | Inception date of the Fund is July 5, 2016. The Fund commenced public offering and operations on July 5, 2016. |
(B) | Net investment income per share has been calculated using the average daily shares outstanding during the period. |
(C) | Total returns shown exclude the effect of applicable sales charges. |
See accompanying Notes to Financial Statements.
148 DIAMOND HILL FUNDS | ANNUAL REPORT | DECEMBER 31, 2019 | DIAMOND-HILL.COM |
| | | Distributions
from net
realized
capital gains | | | Total
distributions | | | Net asset
value, end of
period | | | Total
return(C) | | | Net assets,
end of
period
(000’s) | | | Ratio of total
expenses to
average net
assets | | | Ratio of net
investment
income
(loss) to
average net
assets | | | Portfolio
turnover
rate(D) | |
| | | | | | | | | | | | | | | | | | | | | | | | | | | | | | | | | |
| | | | — | | | | (0.25 | ) | | $ | 10.19 | | | | 7.63 | % | | $ | 3,599 | | | | 0.77 | % | | | 2.43 | % | | | 29 | % |
| | | | — | | | | (0.26 | ) | | $ | 9.71 | | | | 1.28 | % | | $ | 2,976 | | | | 0.76 | % | | | 2.60 | % | | | 25 | % |
| | | | — | | | | (0.22 | ) | | $ | 9.85 | | | | 3.85 | % | | $ | 3,480 | | | | 0.78 | % | | | 2.10 | % | | | 35 | % |
| | | | — | | | | (0.09 | ) | | $ | 9.70 | | | | (2.28 | )%(E) | | $ | 2,183 | | | | 0.78 | %(F) | | | 0.87 | %(F) | | | 8 | %(E) |
| | | |
| | | | | | | | | | | | | | | | | | | | | | | | | | | | | | | | | |
| | | | — | | | | (0.28 | ) | | $ | 10.19 | | | | 7.93 | % | | $ | 66,174 | | | | 0.48 | % | | | 2.61 | % | | | 29 | % |
| | | | — | | | | (0.29 | ) | | $ | 9.71 | | | | 1.59 | % | | $ | 14,574 | | | | 0.47 | % | | | 2.92 | % | | | 25 | % |
| | | | — | | | | (0.25 | ) | | $ | 9.85 | | | | 4.17 | % | | $ | 9,604 | | | | 0.48 | % | | | 2.40 | % | | | 35 | % |
| | | | — | | | | (0.09 | ) | | $ | 9.70 | | | | (2.14 | )%(E) | | $ | 8,033 | | | | 0.49 | %(F) | | | 1.02 | %(F) | | | 8 | %(E) |
| | | |
| | | | | | | | | | | | | | | | | | | | | | | | | | | | | | | | | |
| | | | — | | | | (0.29 | ) | | $ | 10.20 | | | | 8.15 | % | | $ | 52,275 | | | | 0.36 | % | | | 2.83 | % | | | 29 | % |
| | | | — | | | | (0.30 | ) | | $ | 9.71 | | | | 1.69 | % | | $ | 37,713 | | | | 0.35 | % | | | 3.03 | % | | | 25 | % |
| | | | — | | | | (0.26 | ) | | $ | 9.85 | | | | 4.22 | % | | $ | 30,740 | | | | 0.38 | % | | | 2.49 | % | | | 35 | % |
| | | | — | | | | (0.09 | ) | | $ | 9.70 | | | | (2.11 | )%(E) | | $ | 29,468 | | | | 0.39 | %(F) | | | 1.00 | %(F) | | | 8 | %(E) |
| | | |
(D) | Portfolio turnover rate is calculated on the basis of the Fund as a whole without distinguishing between classes of shares issued. |
See accompanying Notes to Financial Statements.
DIAMOND HILL FUNDS | ANNUAL REPORT | DECEMBER 31, 2019 | DIAMOND-HILL.COM 149 |
Corporate Credit Fund
Financial Highlights
Selected data for a share outstanding throughout the periods indicated
Corporate Credit Fund | | Net asset
value,
beginning of
period | | | Net
investment
income(A) | | | Net realized
and
unrealized
gains
(losses) on
investments | | | Total from
investment
operations | | | Dividends
from net
investment
income | |
Class A | | | | | | | | | | | | | | | | | | | | |
For the year ended December 31, 2019 | | $ | 10.77 | | | | 0.58 | | | | 0.78 | | | | 1.36 | | | | (0.57 | ) |
For the year ended December 31, 2018 | | $ | 11.32 | | | | 0.59 | | | | (0.56 | ) | | | 0.03 | | | | (0.58 | ) |
For the year ended December 31, 2017 | | $ | 11.13 | | | | 0.58 | | | | 0.24 | | | | 0.82 | | | | (0.58 | ) |
For the year ended December 31, 2016 | | $ | 10.53 | | | | 0.63 | | | | 0.60 | | | | 1.23 | | | | (0.62 | ) |
For the year ended December 31, 2015 | | $ | 10.94 | | | | 0.58 | | | | (0.44 | ) | | | 0.14 | | | | (0.55 | ) |
|
Class C | | | | | | | | | | | | | | | | | | | | |
For the year ended December 31, 2019 | | $ | 10.73 | | | | 0.49 | | | | 0.79 | | | | 1.28 | | | | (0.49 | ) |
For the year ended December 31, 2018 | | $ | 11.28 | | | | 0.51 | | | | (0.56 | ) | | | (0.05 | ) | | | (0.50 | ) |
For the year ended December 31, 2017 | | $ | 11.09 | | | | 0.49 | | | | 0.25 | | | | 0.74 | | | | (0.50 | ) |
For the year ended December 31, 2016 | | $ | 10.51 | | | | 0.54 | | | | 0.60 | | | | 1.14 | | | | (0.55 | ) |
For the year ended December 31, 2015 | | $ | 10.92 | | | | 0.49 | | | | (0.43 | ) | | | 0.06 | | | | (0.47 | ) |
|
Class I | | | | | | | | | | | | | | | | | | | | |
For the year ended December 31, 2019 | | $ | 10.74 | | | | 0.61 | | | | 0.79 | | | | 1.40 | | | | (0.61 | ) |
For the year ended December 31, 2018 | | $ | 11.28 | | | | 0.62 | | | | (0.54 | ) | | | 0.08 | | | | (0.62 | ) |
For the year ended December 31, 2017 | | $ | 11.09 | | | | 0.61 | | | | 0.24 | | | | 0.85 | | | | (0.61 | ) |
For the year ended December 31, 2016 | | $ | 10.50 | | | | 0.66 | | | | 0.59 | | | | 1.25 | | | | (0.65 | ) |
For the year ended December 31, 2015 | | $ | 10.91 | | | | 0.60 | | | | (0.43 | ) | | | 0.17 | | | | (0.58 | ) |
|
Class Y | | | | | | | | | | | | | | | | | | | | |
For the year ended December 31, 2019 | | $ | 10.73 | | | | 0.62 | | | | 0.79 | | | | 1.41 | | | | (0.62 | ) |
For the year ended December 31, 2018 | | $ | 11.27 | | | | 0.64 | | | | (0.55 | ) | | | 0.09 | | | | (0.63 | ) |
For the year ended December 31, 2017 | | $ | 11.09 | | | | 0.62 | | | | 0.24 | | | | 0.86 | | | | (0.63 | ) |
For the year ended December 31, 2016 | | $ | 10.50 | | | | 0.67 | | | | 0.59 | | | | 1.26 | | | | (0.66 | ) |
For the year ended December 31, 2015 | | $ | 10.91 | | | | 0.62 | | | | (0.44 | ) | | | 0.18 | | | | (0.59 | ) |
|
(A) | Net investment income per share has been calculated using the average daily shares outstanding during the period. |
(B) | Total returns shown exclude the effect of applicable sales charges. |
See accompanying Notes to Financial Statements.
150 DIAMOND HILL FUNDS | ANNUAL REPORT | DECEMBER 31, 2019 | DIAMOND-HILL.COM |
| | Distributions
from net
realized
capital gains | | | Total
distributions | | | Net asset
value, end of
period | | | Total
return(B) | | | Net assets,
end of
period
(000’s) | | | Ratio of total
net expenses
to average
net assets | | | Ratio of
total gross
expenses to
average net
assets(C) | | | Ratio of net
investment
income
(loss) to
average net
assets | | | Portfolio
turnover
rate(D) | |
| | | | | | | | | | | | | | | | | | | | | | | | | | | | | | | | | | | | |
| | | (0.09 | ) | | | (0.66 | ) | | $ | 11.47 | | | | 12.85 | % | | $ | 120,014 | | | | 0.90 | % | | | 0.92 | % | | | 5.05 | % | | | 132 | % |
| | | — | | | | (0.58 | ) | | $ | 10.77 | | | | 0.25 | % | | $ | 69,363 | | | | 0.90 | % | | | 0.91 | % | | | 5.30 | % | | | 112 | % |
| | | (0.05 | ) | | | (0.63 | ) | | $ | 11.32 | | | | 7.56 | % | | $ | 64,204 | | | | 0.92 | % | | | 0.93 | % | | | 5.07 | % | | | 83 | % |
| | | (0.01 | ) | | | (0.63 | ) | | $ | 11.13 | | | | 11.94 | % | | $ | 71,075 | | | | 0.93 | % | | | 0.93 | % | | | 5.72 | % | | | 119 | % |
| | | — | | | | (0.55 | ) | | $ | 10.53 | | | | 1.19 | % | | $ | 44,354 | | | | 0.95 | % | | | 0.95 | % | | | 5.24 | % | | | 48 | % |
| | | |
| | | | | | | | | | | | | | | | | | | | | | | | | | | | | | | | | | | | |
| | | (0.09 | ) | | | (0.58 | ) | | $ | 11.43 | | | | 12.06 | % | | $ | 26,683 | | | | 1.65 | % | | | 1.67 | % | | | 4.34 | % | | | 132 | % |
| | | — | | | | (0.50 | ) | | $ | 10.73 | | | | (0.51 | )% | | $ | 24,968 | | | | 1.65 | % | | | 1.66 | % | | | 4.56 | % | | | 112 | % |
| | | (0.05 | ) | | | (0.55 | ) | | $ | 11.28 | | | | 6.77 | % | | $ | 26,656 | | | | 1.67 | % | | | 1.68 | % | | | 4.33 | % | | | 83 | % |
| | | (0.01 | ) | | | (0.56 | ) | | $ | 11.09 | | | | 11.06 | % | | $ | 29,607 | | | | 1.68 | % | | | 1.68 | % | | | 4.98 | % | | | 119 | % |
| | | — | | | | (0.47 | ) | | $ | 10.51 | | | | 0.44 | % | | $ | 23,649 | | | | 1.70 | % | | | 1.70 | % | | | 4.47 | % | | | 48 | % |
| | | |
| | | | | | | | | | | | | | | | | | | | | | | | | | | | | | | | | | | | |
| | | (0.09 | ) | | | (0.70 | ) | | $ | 11.44 | | | | 13.20 | % | | $ | 911,514 | | | | 0.61 | % | | | 0.63 | % | | | 5.36 | % | | | 132 | % |
| | | — | | | | (0.62 | ) | | $ | 10.74 | | | | 0.64 | % | | $ | 622,887 | | | | 0.61 | % | | | 0.62 | % | | | 5.59 | % | | | 112 | % |
| | | (0.05 | ) | | | (0.66 | ) | | $ | 11.28 | | | | 7.87 | % | | $ | 536,203 | | | | 0.62 | % | | | 0.63 | % | | | 5.39 | % | | | 83 | % |
| | | (0.01 | ) | | | (0.66 | ) | | $ | 11.09 | | | | 12.21 | % | | $ | 411,465 | | | | 0.64 | % | | | 0.64 | % | | | 6.00 | % | | | 119 | % |
| | | — | | | | (0.58 | ) | | $ | 10.50 | | | | 1.49 | % | | $ | 247,522 | | | | 0.75 | % | | | 0.75 | % | | | 5.51 | % | | | 48 | % |
| | | |
| | | | | | | | | | | | | | | | | | | | | | | | | | | | | | | | | | | | |
| | | (0.09 | ) | | | (0.71 | ) | | $ | 11.43 | | | | 13.35 | % | | $ | 82,516 | | | | 0.49 | % | | | 0.51 | % | | | 5.43 | % | | | 132 | % |
| | | — | | | | (0.63 | ) | | $ | 10.73 | | | | 0.75 | % | | $ | 26,221 | | | | 0.49 | % | | | 0.50 | % | | | 5.71 | % | | | 112 | % |
| | | (0.05 | ) | | | (0.68 | ) | | $ | 11.27 | | | | 7.89 | % | | $ | 25,309 | | | | 0.52 | % | | | 0.53 | % | | | 5.49 | % | | | 83 | % |
| | | (0.01 | ) | | | (0.67 | ) | | $ | 11.09 | | | | 12.34 | % | | $ | 21,310 | | | | 0.54 | % | | | 0.54 | % | | | 6.33 | % | | | 119 | % |
| | | — | | | | (0.59 | ) | | $ | 10.50 | | | | 1.60 | % | | $ | 18,013 | | | | 0.56 | % | | | 0.56 | % | | | 5.62 | % | | | 48 | % |
| | | |
(C) | The Fund’s adviser has contractually agreed to waive fees in the pro-rata amount of the management fee charged by the underlying Diamond Hill Fund on the Fund’s investment in such other Diamond Hill Fund. If such fee waiver had not occurred, the ratios would have been as indicated. |
(D) | Portfolio turnover rate is calculated on the basis of the Fund as a whole without distinguishing between classes of shares issued. |
See accompanying Notes to Financial Statements.
DIAMOND HILL FUNDS | ANNUAL REPORT | DECEMBER 31, 2019 | DIAMOND-HILL.COM 151 |
High Yield Fund
Financial Highlights
Selected data for a share outstanding throughout the periods indicated
High Yield Fund(A) | | Net asset
value,
beginning of
period | | | Net
investment
income(B) | | | Net realized
and
unrealized
gains
(losses) on
investments | | | Total from
investment
operations | | | Dividends
from net
investment
income | |
Class A | | | | | | | | | | | | | | | | | | | | |
For the year ended December 31, 2019 | | $ | 10.22 | | | | 0.60 | | | | 0.91 | | | | 1.51 | | | | (0.60 | ) |
For the year ended December 31, 2018 | | $ | 10.77 | | | | 0.62 | | | | (0.51 | ) | | | 0.11 | | | | (0.61 | ) |
For the year ended December 31, 2017 | | $ | 10.65 | | | | 0.65 | | | | 0.38 | | | | 1.03 | | | | (0.65 | ) |
For the year ended December 31, 2016 | | $ | 10.14 | | | | 0.70 | | | | 0.71 | | | | 1.41 | | | | (0.66 | ) |
|
Class I | | | | | | | | | | | | | | | | | | | | |
For the year ended December 31, 2019 | | $ | 10.22 | | | | 0.63 | | | | 0.91 | | | | 1.54 | | | | (0.62 | ) |
For the year ended December 31, 2018 | | $ | 10.78 | | | | 0.65 | | | | (0.52 | ) | | | 0.13 | | | | (0.64 | ) |
For the year ended December 31, 2017 | | $ | 10.65 | | | | 0.68 | | | | 0.39 | | | | 1.07 | | | | (0.68 | ) |
For the year ended December 31, 2016 | | $ | 10.14 | | | | 0.73 | | | | 0.71 | | | | 1.44 | | | | (0.69 | ) |
|
Class Y | | | | | | | | | | | | | | | | | | | | |
For the year ended December 31, 2019 | | $ | 10.22 | | | | 0.65 | | | | 0.91 | | | | 1.56 | | | | (0.64 | ) |
For the year ended December 31, 2018 | | $ | 10.78 | | | | 0.67 | | | | (0.53 | ) | | | 0.14 | | | | (0.65 | ) |
For the year ended December 31, 2017 | | $ | 10.65 | | | | 0.69 | | | | 0.40 | | | | 1.09 | | | | (0.70 | ) |
For the year ended December 31, 2016 | | $ | 10.14 | | | | 0.74 | | | | 0.71 | | | | 1.45 | | | | (0.70 | ) |
|
(A) | Inception date of the Fund is December 31, 2015. Fund commenced public offering on January 4, 2016. |
(B) | Net investment income per share has been calculated using the average daily shares outstanding during the period. |
See accompanying Notes to Financial Statements.
152 DIAMOND HILL FUNDS | ANNUAL REPORT | DECEMBER 31, 2019 | DIAMOND-HILL.COM |
| | | Distributions
from net
realized
capital gains | | | Total
distributions | | | Net asset
value, end of
period | | | Total
return(C) | | | Net assets,
end of
period
(000’s) | | | Ratio of total
expenses to
average net
assets | | | Ratio of net
investment
income
(loss) to
average net
assets | | | Portfolio
turnover
rate(D) | |
| | | | | | | | | | | | | | | | | | | | | | | | | | | | | | | | | |
| | | | (0.11 | ) | | | (0.71 | ) | | $ | 11.02 | | | | 15.04 | % | | $ | 18,004 | | | | 0.97 | % | | | 5.49 | % | | | 164 | % |
| | | | (0.05 | ) | | | (0.66 | ) | | $ | 10.22 | | | | 0.97 | % | | $ | 1,674 | | | | 0.96 | % | | | 5.81 | % | | | 145 | % |
| | | | (0.26 | ) | | | (0.91 | ) | | $ | 10.77 | | | | 9.96 | % | | $ | 296 | | | | 0.99 | % | | | 5.89 | % | | | 137 | % |
| | | | (0.24 | ) | | | (0.90 | ) | | $ | 10.65 | | | | 14.29 | % | | $ | 185 | | | | 0.99 | % | | | 6.51 | % | | | 123 | % |
| | | |
| | | | | | | | | | | | | | | | | | | | | | | | | | | | | | | | | |
| | | | (0.11 | ) | | | (0.73 | ) | | $ | 11.03 | | | | 15.44 | % | | $ | 96,563 | | | | 0.68 | % | | | 5.79 | % | | | 164 | % |
| | | | (0.05 | ) | | | (0.69 | ) | | $ | 10.22 | | | | 1.16 | % | | $ | 23,499 | | | | 0.67 | % | | | 6.10 | % | | | 145 | % |
| | | | (0.26 | ) | | | (0.94 | ) | | $ | 10.78 | | | | 10.36 | % | | $ | 14,185 | | | | 0.69 | % | | | 6.23 | % | | | 137 | % |
| | | | (0.24 | ) | | | (0.93 | ) | | $ | 10.65 | | | | 14.62 | % | | $ | 23,989 | | | | 0.70 | % | | | 6.80 | % | | | 123 | % |
| | | |
| | | | | | | | | | | | | | | | | | | | | | | | | | | | | | | | | |
| | | | (0.11 | ) | | | (0.75 | ) | | $ | 11.03 | | | | 15.56 | % | | $ | 20,190 | | | | 0.56 | % | | | 5.99 | % | | | 164 | % |
| | | | (0.05 | ) | | | (0.70 | ) | | $ | 10.22 | | | | 1.27 | % | | $ | 29,274 | | | | 0.55 | % | | | 6.23 | % | | | 145 | % |
| | | | (0.26 | ) | | | (0.96 | ) | | $ | 10.78 | | | | 10.48 | % | | $ | 16,623 | | | | 0.59 | % | | | 6.28 | % | | | 137 | % |
| | | | (0.24 | ) | | | (0.94 | ) | | $ | 10.65 | | | | 14.73 | % | | $ | 7,752 | | | | 0.60 | % | | | 7.07 | % | | | 123 | % |
| | | |
(C) | Total returns shown exclude the effect of applicable sales charges. |
(D) | Portfolio turnover rate is calculated on the basis of the Fund as a whole without distinguishing between classes of shares issued. |
See accompanying Notes to Financial Statements.
DIAMOND HILL FUNDS | ANNUAL REPORT | DECEMBER 31, 2019 | DIAMOND-HILL.COM 153 |
Diamond Hill Funds
Notes to Financial Statements
December 31, 2019
Organization
The Diamond Hill Small Cap Fund (“Small Cap Fund”), Diamond Hill Small-Mid Cap Fund (“Small-Mid Cap Fund”), Diamond Hill Mid Cap Fund (“Mid Cap Fund”), Diamond Hill Large Cap Fund (“Large Cap Fund”), Diamond Hill All Cap Select Fund (“All Cap Select Fund”), Diamond Hill Long-Short Fund (“Long-Short Fund”), Diamond Hill Research Opportunities Fund (“Research Opportunities Fund”), Diamond Hill Global Fund (“Global Fund”), Diamond Hill International Fund (“International Fund”), Diamond Hill Short Duration Total Return Fund (“Short Duration Fund”), Diamond Hill Core Bond Fund (“Core Bond Fund”), Diamond Hill Corporate Credit Fund (“Corporate Credit Fund”) and Diamond Hill High Yield Fund (“High Yield Fund”) are each a diversified series, except for the All Cap Select Fund which is non-diversified, of the Diamond Hill Funds (the “Trust”) (each a “Fund” and collectively the “Funds”). The Trust is registered under the Investment Company Act of 1940, as amended (the “1940 Act”), as an open-end management company. Each Fund follows accounting and reporting guidance under Financial Accounting Standards Board (“FASB”) Accounting Standards Codification Topic 946, “Financial Services – Investment Companies.”
In June 2019, the partners of the Diamond Hill International Fund, L.P. (the “International Partnership”) approved the conversion of the International Partnership into the International Fund effective July 1, 2019. The International Fund is a successor to the International Partnership and has substantially the same investment objectives and strategies as did the International Partnership. The net assets contributed resulting from these tax-free transactions was $3,996,233, including net unrealized appreciation of $227,053. In addition, limited partners of the International Partnership were issued shares in the International Fund based on the July 1, 2019 opening net asset value (“NAV”) per share of the International Fund. A total of 295,000 shares were issued at a NAV per share of $13.55. For financial reporting purposes, assets received and shares issued were recorded at fair value; however, the cost basis of the investments received was carried forward to align ongoing reporting of the International Fund’s realized and unrealized gains and losses with amounts distributable to shareholders for tax purposes.
The shareholders of the Diamond Hill Financial Long-Short Fund (“Financial Long-Short Fund”) approved an Agreement and Plan of Reorganization providing for the transfer of all assets and liabilities of the Financial Long-Short Fund to the Research Opportunities Fund. The tax-free reorganization took place on June 7, 2019.
154 DIAMOND HILL FUNDS | ANNUAL REPORT | DECEMBER 31, 2019 | DIAMOND-HILL.COM |
Diamond Hill Funds
Notes to Financial Statements (Continued)
December 31, 2019
The following is a summary of shares outstanding, net assets, NAV per share and unrealized appreciation immediately before and after the reorganization.
| | | Before Reorganization | | | After
Reorganization | |
| | | Financial
Long-Short
Fund | | | Research
Opportunities
Fund | | | Research
Opportunities
Fund | |
Class A | | | | | | | | | | | | |
Shares | | | 230,759 | | | | 231,602 | | | | 471,011 | |
Net Assets | | $ | 5,169,992 | | | $ | 5,001,391 | | | $ | 10,171,383 | |
Net Asset Value | | $ | 22.40 | | | $ | 21.59 | | | $ | 21.59 | |
| | | | | | | | | | | | | |
Class C | | | | | | | | | | | | |
Shares | | | 67,429 | | | | 42,440 | | | | 110,085 | |
Net Assets | | $ | 1,370,862 | | | $ | 860,074 | | | $ | 2,230,936 | |
Net Asset Value | | $ | 20.33 | | | $ | 20.27 | | | $ | 20.27 | |
| | | | | | | | | | | | | |
Class I | | | | | | | | | | | | |
Shares | | | 721,321 | | | | 1,473,970 | | | | 2,212,540 | |
Net Assets | | $ | 16,194,234 | | | $ | 32,318,945 | | | $ | 48,513,179 | |
Net Asset Value | | $ | 22.45 | | | $ | 21.93 | | | $ | 21.93 | |
| | | | | | | | | | | | | |
Class Y | | | | | | | | | | | | |
Shares | | | N/A | | | | 816,821 | | | | 816,821 | |
Net Assets | | | N/A | | | $ | 17,980,227 | | | $ | 17,980,227 | |
Net Asset Value | | | N/A | | | $ | 22.01 | | | $ | 22.01 | |
| | | | | | | | | | | | | |
Fund Total | | | | | | | | | | | | |
Shares | | | 1,019,509 | | | | 2,564,833 | | | | 3,610,457 | |
Net Assets | | $ | 22,735,088 | | | $ | 56,160,637 | | | $ | 78,895,725 | |
Unrealized Appreciation | | $ | 1,140,469 | | | $ | 2,966,361 | | | $ | 4,106,830 | |
Assuming the reorganization had been completed on January 1, 2019, the beginning of the annual reporting period of the Research Opportunities Fund, the Research Opportunities Fund’s pro forma results of operations for the year ended December 31, 2019, would have been as follows:
Net Investment Income | Net Realized Gains and
Net Change in Unrealized
Appreciation (Depreciation) on
Investments | Change in Net Assets from
Operations |
$358,858 | $18,374,542 | $18,733,400 |
DIAMOND HILL FUNDS | ANNUAL REPORT | DECEMBER 31, 2019 | DIAMOND-HILL.COM 155 |
Diamond Hill Funds
Notes to Financial Statements (Continued)
December 31, 2019
Because the combined investment portfolios have been managed as a single integrated portfolio since the reorganization was completed, it is not practical to separate the amounts of revenue and earnings of the Financial Long-Short Fund that have been included in the Research Opportunities Fund’s Statement of Operations since June 7, 2019.
For financial reporting purposes, assets received and shares issued by the Research Opportunities Fund were recorded at fair value; however, the cost basis of the investments received from the Financial Long-Short Fund was carried forward to align ongoing reporting of the Research Opportunities Fund’s realized and unrealized gains and losses with amounts distributable to shareholders for tax purposes.
With the exception of the Mid Cap Fund, Global Fund, International Fund, Short Duration Fund, Core Bond Fund and High Yield Fund, the Funds offer four classes of shares: Class A, Class C, Class I and Class Y. The Mid Cap Fund, Global Fund, International Fund, Short Duration Fund, Core Bond Fund and High Yield Fund offer three classes of shares: Class A, Class I and Class Y. Each class of shares for each Fund has identical rights and privileges except with respect to distribution (12b-1) and service fees, voting rights on matters affecting a single class of shares, exchange privileges of each class of shares and sales charges. With the exception of the Short Duration Fund, Core Bond Fund, Corporate Credit Fund and High Yield Fund, Class A has a maximum sales charge on purchases of 5.00% as a percentage of the original purchase price. The Short Duration Fund has a maximum sales charge on purchases of 2.25% and the Core Bond Fund, Corporate Credit Fund and High Yield Fund have a maximum sales charge on purchases of 3.50% as a percentage of the original purchase price. Class C has a contingent deferred sales charge of 1.00% for shares redeemed within one year of the purchase date.
New Accounting Pronouncement
In March 2017, FASB issued Accounting Standards Update No. 2017-08 (“ASU 2017-08”), “Receivables – Nonrefundable Fees and Other Costs (Subtopic 310-20): Premium Amortization on Purchased Callable Debt Securities.” ASU 2017-08 shortens the amortization period for certain callable debt securities held at a premium. Under the new guidance, the premium amortization of purchased callable debt securities that have explicit, non-contingent call features and are callable at fixed prices will be amortized to the earliest call date. ASU 2017-08 does not require an accounting change for securities held at a discount, which continue to be accreted to maturity. ASU 2017-08 is effective for fiscal years and interim periods within those fiscal years beginning after December 15, 2018. The Funds are complying with ASU 2017-08 and the impact is not deemed to be material to the Funds.
Significant Accounting Policies
The following is a summary of the Funds’ significant accounting policies:
Estimates — The financial statements are prepared in conformity with accounting principles generally accepted in the United States of America (“GAAP”), which requires management to make estimates and assumptions that affect the reported amounts of assets and liabilities and
156 DIAMOND HILL FUNDS | ANNUAL REPORT | DECEMBER 31, 2019 | DIAMOND-HILL.COM |
Diamond Hill Funds
Notes to Financial Statements (Continued)
December 31, 2019
disclosure of contingent assets and liabilities at the date of the financial statements and the reported amounts of income and expenses during the reporting period. Actual results could differ from those estimates.
Security valuation — The Funds record their investments at fair value. Fair value is defined as the price that would be received to sell an asset or paid to transfer a liability in an orderly transaction between market participants at the measurement date. The valuation techniques used by the Funds maximize the use of observable inputs and minimize the use of unobservable inputs in determining fair value. These inputs are summarized in the three broad levels listed below:
● | Level 1 — quoted prices in active markets for identical securities |
● | Level 2 — other significant observable inputs (including quoted prices for similar securities, interest rates, prepayment speeds, credit risk, etc.) |
● | Level 3 — significant unobservable inputs (including the Funds’ own assumptions in determining the fair value of investments) |
Listed securities for which market quotations are readily available are valued at the closing prices as determined by the primary exchange where the securities are traded. Unlisted securities or listed securities for which the latest sales prices are not readily available are valued at the closing bid (long positions) or ask (short positions) price in the principal market where such securities are normally traded. Investments in other open-end investment companies are valued at their reported NAV per share. In each of these situations, valuations are typically categorized as Level 1 in the fair value hierarchy.
Debt securities are valued on the basis of valuations provided by dealers or by an independent pricing service which take into account appropriate factors such as trading activity (i.e., market transactions for normal, institutional-size trading units of similar securities), readily available market quotations (including broker quotes), yield, quality, coupon rate, maturity, type of issue, trading characteristic, call features, credit ratings and other data. Short-term debt investments of sufficient credit quality maturing in less than 61 days may be valued at amortized cost, if amortized cost is determined to approximate fair value. In each of these situations, valuations are typically categorized as Level 2 in the fair value hierarchy.
Securities for which market quotations are not readily available (e.g., an approved pricing service does not provide a price, a price becomes stale, or an event occurs that materially affects the furnished price) are valued by the Valuation & Liquidity Committee. In these cases, the Valuation & Liquidity Committee, established and appointed by the Board of Trustees, determines in good faith, subject to Trust procedures, the fair value of portfolio securities held by a Fund (“good faith fair valuation”). When a good faith fair valuation of a security is required, consideration is generally given to a number of factors, including, but not limited to the following: dealer quotes, published analyses by dealers or analysts of the situation at issue, transactions implicitly valuing the security (such as a merger, tender offer, etc.), the value of other securities or contracts which derive their value from the security at issue, and the implications (whether negative or positive)
DIAMOND HILL FUNDS | ANNUAL REPORT | DECEMBER 31, 2019 | DIAMOND-HILL.COM 157 |
Diamond Hill Funds
Notes to Financial Statements (Continued)
December 31, 2019
of the circumstances which have caused trading in the security to halt. Depending on the source and relative significance of the valuation inputs in these instances, the valuations for these securities may be classified as Level 2 or Level 3 in the fair value hierarchy.
In accordance with procedures adopted by the Trust’s Board of Trustees, fair value pricing may be used if events materially affecting the value of foreign equity securities occur between the time the exchange on which they are traded closes and the time the Funds’ NAVs are calculated. The Funds use a systematic valuation model, provided daily by an independent third party, to fair value their international equity securities. These valuations are considered as Level 2 in the fair value hierarchy.
Changes in valuation techniques may result in transfers in or out of an assigned level within the disclosure hierarchy.
The inputs or methodology used for valuing securities are not necessarily an indication of the risks associated with investing in those securities. For example, short-term debt securities of sufficient credit quality maturing in less than 61 days may be valued using amortized cost in accordance with rules under the 1940 Act. Generally, amortized cost approximates the current fair value of a security, but since the value is not obtained from a quoted price in an active market, such securities are reflected as Level 2. The following is a summary of the inputs used to value the Funds’ investments as of December 31, 2019:
| | | Level 1 -
Quoted Prices | | |
Level 2 - Other
Significant
Observable
Inputs
| | | Level 3 -
Significant
Unobservable
Inputs | | | Total | |
Investments in Securities (Assets) | | | | | | | | | | | | |
Small Cap Fund | | | | | | | | | | | | | | | | |
Common Stocks* | | $ | 732,044,571 | | | $ | — | | | $ | — | | | $ | 732,044,571 | |
Registered Investment Companies | | | 72,517,169 | | | | — | | | | — | | | | 72,517,169 | |
Total | | $ | 804,561,740 | | | $ | — | | | $ | — | | | $ | 804,561,740 | |
Small-Mid Cap Fund | | | | | | | | | | | | | | | | |
Common Stocks* | | $ | 2,260,335,257 | | | $ | — | | | $ | — | | | $ | 2,260,335,257 | |
Registered Investment Companies | | | 288,933,514 | | | | — | | | | — | | | | 288,933,514 | |
Total | | $ | 2,549,268,771 | | | $ | — | | | $ | — | | | $ | 2,549,268,771 | |
Mid Cap Fund | | | | | | | | | | | | | | | | |
Common Stocks* | | $ | 210,856,401 | | | $ | — | | | $ | — | | | $ | 210,856,401 | |
Registered Investment Companies | | | 23,512,140 | | | | — | | | | — | | | | 23,512,140 | |
Total | | $ | 234,368,541 | | | $ | — | | | $ | — | | | $ | 234,368,541 | |
Large Cap Fund | | | | | | | | | | | | | | | | |
Common Stocks* | | $ | 6,591,908,843 | | | $ | — | | | $ | — | | | $ | 6,591,908,843 | |
Registered Investment Companies | | | 173,631,666 | | | | — | | | | — | | | | 173,631,666 | |
Total | | $ | 6,765,540,509 | | | $ | — | | | $ | — | | | $ | 6,765,540,509 | |
158 DIAMOND HILL FUNDS | ANNUAL REPORT | DECEMBER 31, 2019 | DIAMOND-HILL.COM |
Diamond Hill Funds
Notes to Financial Statements (Continued)
December 31, 2019
| | | Level 1 -
Quoted Prices | | |
Level 2 - Other
Significant
Observable
Inputs
| | | Level 3 -
Significant
Unobservable
Inputs | | | Total | |
All Cap Select Fund | | | | | | | | | | | | | | | | |
Common Stocks* | | $ | 258,311,483 | | | $ | — | | | $ | — | | | $ | 258,311,483 | |
Registered Investment Companies | | | 21,767,404 | | | | — | | | | — | | | | 21,767,404 | |
Total | | $ | 280,078,887 | | | $ | — | | | $ | — | | | $ | 280,078,887 | |
Long-Short Fund | | | | | | | | | | | | | | | | |
Common Stocks* | | $ | 3,052,629,147 | | | $ | — | | | $ | — | | | $ | 3,052,629,147 | |
Registered Investment Companies | | | 965,081,369 | | | | — | | | | — | | | | 965,081,369 | |
Total | | $ | 4,017,710,516 | | | $ | — | | | $ | — | | | $ | 4,017,710,516 | |
Research Opportunities Fund | | | | | | | | | | | | | | | | |
Common Stocks* | | $ | 68,509,775 | | | $ | 5,484,654 | | | $ | — | | | $ | 73,994,429 | |
Corporate Bonds* | | | — | | | | 891,000 | | | | — | | | | 891,000 | |
Registered Investment Companies | | | 18,334,563 | | | | — | | | | — | | | | 18,334,563 | |
Total | | $ | 86,844,338 | | | $ | 6,375,654 | | | $ | — | | | $ | 93,219,992 | |
Global Fund | | | | | | | | | | | | | | | | |
Common Stocks* | | $ | 13,707,483 | | | $ | 7,592,065 | | | $ | — | | | $ | 21,299,548 | |
Registered Investment Companies | | | 1,094,440 | | | | — | | | | — | | | | 1,094,440 | |
Total | | $ | 14,801,923 | | | $ | 7,592,065 | | | $ | — | | | $ | 22,393,988 | |
International Fund | | | | | | | | | | | | | | | | |
Common Stocks* | | $ | 3,820,132 | | | $ | 9,418,096 | | | $ | — | | | $ | 13,238,228 | |
Registered Investment Companies | | | 616,617 | | | | — | | | | — | | | | 616,617 | |
Total | | $ | 4,436,749 | | | $ | 9,418,096 | | | $ | — | | | $ | 13,854,845 | |
Short Duration Fund | | | | | | | | | | | | | | | | |
Corporate Credit* | | $ | — | | | $ | 39,562,345 | | | $ | — | | | $ | 39,562,345 | |
Securitized* | | | — | | | | 681,008,815 | | | | — | | | | 681,008,815 | |
Treasury | | | — | | | | 53,033,520 | | | | — | | | | 53,033,520 | |
Registered Investment Companies | | | 75,538,331 | | | | — | | | | — | | | | 75,538,331 | |
Total | | $ | 75,538,331 | | | $ | 773,604,680 | | | $ | — | | | $ | 849,143,011 | |
Core Bond Fund | | | | | | | | | | | | | | | | |
Corporate Credit* | | $ | — | | | $ | 20,061,303 | | | $ | — | | | $ | 20,061,303 | |
Government Related | | | — | | | | 662,299 | | | | — | | | | 662,299 | |
Securitized* | | | — | | | | 70,779,526 | | | | — | | | | 70,779,526 | |
Treasury | | | — | | | | 26,063,894 | | | | — | | | | 26,063,894 | |
Registered Investment Companies | | | 7,624,154 | | | | — | | | | — | | | | 7,624,154 | |
Total | | $ | 7,624,154 | | | $ | 117,567,022 | | | $ | — | | | $ | 125,191,176 | |
Corporate Credit Fund | | | | | | | | | | | | | | | | |
Collateralized Debt Obligations | | $ | — | | | $ | 1,229,909 | | | $ | — | | | $ | 1,229,909 | |
Corporate Bonds* | | | — | | | | 922,587,280 | | | | — | | | | 922,587,280 | |
Registered Investment Companies | | | 204,219,073 | | | | — | | | | — | | | | 204,219,073 | |
Total | | $ | 204,219,073 | | | $ | 923,817,189 | | | $ | — | | | $ | 1,128,036,262 | |
DIAMOND HILL FUNDS | ANNUAL REPORT | DECEMBER 31, 2019 | DIAMOND-HILL.COM 159 |
Diamond Hill Funds
Notes to Financial Statements (Continued)
December 31, 2019
| | | Level 1 -
Quoted Prices | | |
Level 2 - Other
Significant
Observable
Inputs
| | | Level 3 -
Significant
Unobservable
Inputs | | | Total | |
High Yield Fund | | | | | | | | | | | | | | | | |
Corporate Bonds* | | $ | — | | | $ | 122,099,014 | | | $ | — | | | $ | 122,099,014 | |
Securitized* | | | — | | | | 5,020,114 | | | | — | | | | 5,020,114 | |
Registered Investment Companies | | | 5,782,885 | | | | — | | | | — | | | | 5,782,885 | |
Total | | $ | 5,782,885 | | | $ | 127,119,128 | | | $ | — | | | $ | 132,902,013 | |
Investments in Securities Sold Short: (Liabilities) | | | | | | | | | | | | |
Long-Short Fund | | | | | | | | | | | | | | | | |
Common Stocks* | | $ | (1,056,982,316 | ) | | $ | — | | | $ | — | | | $ | (1,056,982,316 | ) |
Total | | $ | (1,056,982,316 | ) | | $ | — | | | $ | — | | | $ | (1,056,982,316 | ) |
Research Opportunities Fund | | | | | | | | | | | | | | | | |
Common Stocks* | | $ | (14,354,983 | ) | | $ | — | | | $ | — | | | $ | (14,354,983 | ) |
Total | | $ | (14,354,983 | ) | | $ | — | | | $ | — | | | $ | (14,354,983 | ) |
* | See Schedule of Investments and Schedule of Investments Sold Short for industry classification. |
The following table presents the Small Cap Fund’s assets measured at fair value on a recurring basis using significant unobservable inputs (Level 3) for the year ended December 31, 2019.
| | | Common
Stocks | |
Value, December 31, 2018 | | $ | 1,797,682 | |
Purchases | | | — | |
Sales* | | | (632,152 | ) |
Net realized gains | | | 632,152 | |
Net Change in unrealized appreciation (depreciation) | | | (1,797,682 | ) |
Value, December 31, 2019 | | $ | — | |
* | Includes return of capital distributions. |
There were no transfers into or out of Level 3 for the year ended December 31, 2019.
Short sales — The Long-Short Fund, Research Opportunities Fund, Global Fund, International Fund, Corporate Credit Fund and High Yield Fund are permitted to make short sales of securities. Short sales are effective when it is believed that the price of a particular security will decline and involves the sale of a security that the Fund does not own in hope of purchasing the same security at a later date at a lower price. To make delivery to the buyer, a Fund must borrow the security, and the Fund is obligated to return the security to the lender, which is accomplished by a later purchase of the security by the Fund. Cash received from short sales and other liquid securities are maintained by the custodian and are used as collateral. Cash collateral is shown as “Cash deposits with custodian for securities sold short” on the Statements of Assets & Liabilities and “Segregated Cash With Custodian” on the Schedules of Investments. Liquid securities pledged as collateral are noted on the Schedules of Investments.
160 DIAMOND HILL FUNDS | ANNUAL REPORT | DECEMBER 31, 2019 | DIAMOND-HILL.COM |
Diamond Hill Funds
Notes to Financial Statements (Continued)
December 31, 2019
A Fund will incur a loss as a result of a short sale if the price of the security increases between the date of the short sale and the date on which the Fund purchases the security to replace the borrowed security. The use of short sales may cause a Fund to have higher expenses (specifically dividend expenses) than those of other equity mutual funds. Short sales are speculative transactions and involve special risks, including greater reliance on the ability of the Funds’ investment adviser, Diamond Hill Capital Management, Inc. (“DHCM”), to accurately anticipate the future value of a security.
A Fund may also incur stock loan fees which represent the cost of borrowing securities used for short sale transactions. A Fund may also earn rebates as an element of the custodian arrangement, which are recorded as an offset to stock loan fees on short sales transactions. The stock loan fees on short sales are recognized on the Statements of Operations. In the event that rebates exceed the stock loan fees on short sales, the net rebates are recognized as a component of investment income on the Statements of Operations.
Securities lending — Under the terms of the securities lending agreement with State Street Bank and Trust Company (“State Street”), State Street is authorized to loan securities on behalf of the Funds to approved borrowers. The contractual maturity of securities lending transactions is on an overnight and continuous basis. In exchange, the Funds receive cash and/or U.S. Treasury and government agency securities as collateral in the amount of at least 100% of the value of the securities loaned. Any collateral shortfalls due to changes in security market prices are adjusted the next business day. The cash collateral is invested in short-term instruments as noted in each Fund’s Schedule of Investments. Although risk is mitigated by the collateral, the Funds could experience a delay in recovering their securities and possible loss of income or value if the borrower fails to return them. The agreement indemnifies the Funds from losses incurred in the event of a borrower’s material default of the terms and conditions of the borrower agreement. The agreement provides that after predetermined rebates to borrowers, the Funds each retain a portion of their respective net securities lending income and pay State Street the remaining portion. The Funds manage credit exposure arising from these lending transactions by, in appropriate circumstances, entering into a master netting agreement and collateral agreement with State Street that provide the Funds, in the event of default (such as bankruptcy or borrower’s failure to pay or perform), the right to net rights and obligations under such agreements and liquidate and set off collateral against the net amount owed to the Funds.
As of December 31, 2019, the fair value of securities on loan and the collateral held were as follows:
| | | Fair Value of
Securities | | | Fair Value of Collateral | |
| | | Loaned | | | Cash | | | Non-Cash* | | | Total | |
Small Cap Fund | | $ | 162,695,070 | | | $ | 53,910,257 | | | $ | 112,117,573 | | | $ | 166,027,830 | |
Small-Mid Cap Fund | | | 190,937,589 | | | | 109,189,881 | | | | 85,991,351 | | | | 195,181,232 | |
Mid Cap Fund | | | 5,712,625 | | | | 4,102,191 | | | | 1,737,150 | | | | 5,839,341 | |
Large Cap Fund | | | 31,194,489 | | | | 9,680,151 | | | | 22,354,594 | | | | 32,034,745 | |
DIAMOND HILL FUNDS | ANNUAL REPORT | DECEMBER 31, 2019 | DIAMOND-HILL.COM 161 |
Diamond Hill Funds
Notes to Financial Statements (Continued)
December 31, 2019
| | | Fair Value of
Securities | | | Fair Value of Collateral | |
| | | Loaned | | | Cash | | | Non-Cash* | | | Total | |
All Cap Select Fund | | $ | 7,554,023 | | | $ | 7,741,480 | | | $ | — | | | $ | 7,741,480 | |
Long-Short Fund | | | 518,894,516 | | | | 528,811,125 | | | | — | | | | 528,811,125 | |
Research Opportunities Fund | | | 16,911,205 | | | | 17,217,746 | | | | — | | | | 17,217,746 | |
Global Fund | | | 544,148 | | | | 559,056 | | | | — | | | | 559,056 | |
International Fund | | | 572,453 | | | | 372,210 | | | | 215,398 | | | | 587,608 | |
Short Duration Fund | | | 38,613,433 | | | | 38,637,375 | | | | 959,045 | | | | 39,596,420 | |
Core Bond Fund | | | 5,076,017 | | | | 2,838,375 | | | | 2,379,000 | | | | 5,217,375 | |
Corporate Credit Fund | | | 1,074,785 | | | | 1,106,825 | | | | — | | | | 1,106,825 | |
High Yield Fund | | | 133,536 | | | | 136,500 | | | | — | | | | 136,500 | |
* | These securities are held for the benefit of the Funds at the Funds’ custodian. The Funds cannot repledge or resell this collateral. As such, collateral is excluded from the Statements of Assets & Liabilities. |
Security transactions — Throughout the reporting period, investment transactions are generally recorded on trade date but no later than the first business day following trade date. For financial reporting purposes, investments are recorded on trade date. The specific identification method is used for determining realized gains or losses for financial statements and income tax purposes. Dividend income and expense are recognized on the ex-dividend date and interest income is recognized on an accrual basis. Non-cash dividends included in dividend income, if any, are recorded at the fair market value of the securities received. Taxes on foreign dividends and/or capital gains have been recorded for in accordance with the Funds’ understanding of the applicable country’s tax rules and rates. Discounts and premiums on securities purchased are amortized using the daily effective yield method and included in interest income. The Funds record distributions received from investments in real estate investment trusts (also known as “REITs”) and partnerships in excess of income from underlying investments as a reduction of cost of investments and/or realized gain. Such amounts are based on estimates if actual amounts are not available, and actual amounts of income, realized gain and return of capital may differ from the estimated amounts. The Funds adjust the estimated amounts once the issuers provide information about the actual composition of the distributions. Interest only stripped mortgage-backed securities (“IO Strips”) are securities that receive only interest payments from a pool of mortgage loans. Little to no principal will be received by the Funds upon maturity of an IO Strip. Periodic adjustments are recorded to reduce the cost of the security until maturity, which are included in interest income.
Share valuation — The NAV per share of each class of shares of each Fund is calculated daily by dividing the total value of a Fund’s assets attributable to that class, less liabilities attributable to that class, by the number of shares of that class outstanding.
Federal income taxes — The Funds may be subject to taxes imposed by countries in which they invest. Such taxes are generally based on income and/or capital gains earned or repatriated. Taxes are accrued and applied to net investment income, net realized gains and unrealized appreciation as such income and/or gains are earned.
162 DIAMOND HILL FUNDS | ANNUAL REPORT | DECEMBER 31, 2019 | DIAMOND-HILL.COM |
Diamond Hill Funds
Notes to Financial Statements (Continued)
December 31, 2019
Each Fund has complied and intends to continue to comply with the requirements of the Internal Revenue Code that are applicable to regulated investment companies and to distribute substantially all of its taxable net investment income and any net realized capital gains to its shareholders.
The Funds recognize tax benefits or expenses of uncertain tax positions only when the position is “more likely than not” to be sustained assuming examination by tax authorities. Management of the Funds has reviewed tax positions taken in tax years that remain subject to examination by all major tax jurisdictions, including federal (i.e., the previous three tax year ends and the interim tax period since then, as applicable), and has concluded that no provision for unrecognized tax benefits or expenses is required in these financial statements and does not expect this to change over the next twelve months. The Funds recognize interest and penalties, if any, related to unrecognized tax benefits as income tax expense on the Statements of Operations. During the year ended December 31, 2019, the Funds did not incur any interest or penalties.
Distributions to shareholders — Dividends from net investment income are declared and paid monthly for the Short Duration Fund, Core Bond Fund, Corporate Credit Fund and High Yield Fund. Dividends from net investment income are declared and paid on an annual basis for the Small Cap Fund, Small-Mid Cap Fund, Mid Cap Fund, Large Cap Fund, All Cap Select Fund, Long-Short Fund, Research Opportunities Fund, Global Fund and International Fund. Dividends are declared separately for each class. No class has preferential dividend rights; differences in per share rates are due to differences in the expenses of each class. Net realized capital gains, if any, are distributed at least annually. Distributions from net investment income and from net capital gains are determined in accordance with U.S. income tax regulations, which may differ from GAAP. These differences are primarily due to differing treatments for paydown gains and losses on mortgage-backed securities and deferrals of certain losses. Permanent book and tax basis differences are reclassified among the components of net assets. Certain Funds may utilize earnings and profits distributed to shareholders on redemption of shares as part of the dividends paid deduction for income tax purposes.
Allocations — Investment income earned, realized capital gains and losses, and unrealized appreciation and depreciation are allocated daily to each class of shares of a Fund based upon its proportionate share of total net assets of the Fund. Class specific expenses are charged directly to the class incurring the expense. Common expenses, which are not attributable to a specific class, are allocated daily to each class of shares based upon its proportionate share of total net assets of the Fund. Expenses not directly billed to a Fund are allocated proportionally among all Funds daily in relation to net assets of each Fund or another reasonable measure.
Foreign securities risk — Investing in non-U.S. securities may entail risk due to foreign economic and political developments; this risk may be higher when investing in emerging markets. Changes in currency exchange rates and differences in accounting and taxation policies outside the U.S. can raise or lower returns.
DIAMOND HILL FUNDS | ANNUAL REPORT | DECEMBER 31, 2019 | DIAMOND-HILL.COM 163 |
Diamond Hill Funds
Notes to Financial Statements (Continued)
December 31, 2019
Foreign currency translation — The books and records of the Funds are maintained in U.S. dollars. Investment securities and other assets and liabilities denominated in a foreign currency are translated into U.S. dollars on the date of valuation. The Funds do not isolate that portion of realized or unrealized gains and losses resulting from changes in the foreign exchange rate from fluctuations arising from changes in the market prices of the securities. These gains and losses are included in net realized and unrealized gains (losses) on investments on the Statements of Operations. Net realized and unrealized gains (losses) on foreign currency transactions represent net foreign exchange gains or losses from foreign currency exchange contracts, disposition of foreign currencies, currency gains or losses realized between trade and settlement dates on securities transactions and the difference between the amount of the investment income and foreign withholding taxes recorded on the Funds’ books and the U.S. dollar equivalent amounts actually received or paid.
Investment Transactions
For the year ended December 31, 2019, purchases and sales (including maturities) of investment securities (excluding short-term securities, U.S. government obligations and in-kind transactions) were as follows:
| | | Purchases | | | Sales | |
Small Cap Fund | | $ | 185,773,584 | | | $ | 611,180,245 | |
Small-Mid Cap Fund | | | 313,275,156 | | | | 488,559,329 | |
Mid Cap Fund | | | 129,448,025 | | | | 51,717,831 | |
Large Cap Fund | | | 1,260,650,745 | | | | 1,266,906,397 | |
All Cap Select Fund | | | 111,055,902 | | | | 100,067,538 | |
Long-Short Fund | | | 1,700,977,372 | | | | 2,523,607,290 | |
Research Opportunities Fund | | | 53,578,283 | | | | 77,295,820 | |
Global Fund | | | 8,682,352 | | | | 5,074,193 | |
International Fund | | | 9,449,385 | | | | 908,456 | |
Short Duration Fund | | | 546,703,429 | | | | 328,772,619 | |
Core Bond Fund | | | 62,295,624 | | | | 17,255,439 | |
Corporate Credit Fund | | | 1,305,555,536 | | | | 1,092,711,454 | |
High Yield Fund | | | 214,089,860 | | | | 145,898,649 | |
164 DIAMOND HILL FUNDS | ANNUAL REPORT | DECEMBER 31, 2019 | DIAMOND-HILL.COM |
Diamond Hill Funds
Notes to Financial Statements (Continued)
December 31, 2019
The Funds pay commissions on the purchase and sale of investment securities. The commissions are treated as transaction costs and, therefore, are included as part of the cost of purchases or net proceeds on the sale of investment securities and are not included in the presentation of Fund expenses on the Statements of Operations. The Funds paid the following commissions during the year ended December 31, 2019:
| | | Total
Commissions | | | Commissions
as a % of
Average Net
Assets | |
Small Cap Fund | | $ | 539,707 | | | | 0.06 | % |
Small-Mid Cap Fund | | | 351,377 | | | | 0.02 | % |
Mid Cap Fund | | | 68,329 | | | | 0.04 | % |
Large Cap Fund | | | 715,268 | | | | 0.01 | % |
All Cap Select Fund | | | 101,419 | | | | 0.04 | % |
Long-Short Fund | | | 1,334,852 | | | | 0.04 | % |
Research Opportunities Fund | | | 78,141 | | | | 0.11 | % |
Global Fund | | | 10,462 | | | | 0.06 | % |
International Fund | | | 9,249 | | | | 0.08 | % |
Investment Advisory Fees and Other Transactions with Affiliates
As of December 31, 2019, the Small Cap Fund, Small-Mid Cap Fund, Mid Cap Fund, Large Cap Fund, All Cap Select Fund, Long-Short Fund, Research Opportunities Fund, Global Fund, International Fund, Short Duration Fund, Core Bond Fund, Corporate Credit Fund and High Yield Fund each receive investment management and advisory services from DHCM under management agreements that provide for fees to be paid monthly at an annual rate of 0.80%, 0.75%, 0.60%, 0.50%, 0.70%, 0.90%, 0.95%, 0.65%, 0.65%, 0.35%, 0.30%, 0.45% and 0.50%, respectively, of the Fund’s average daily net assets. Prior to February 28, 2019, the Global Fund paid fees at an annual rate of 0.70% of the Fund’s average daily net assets. The management agreements are subject to annual approval by the Board of Trustees. In addition, each Fund has entered into an administrative services agreement whereby DHCM is paid a fee monthly at an annual rate of 0.21% for Class A Shares and Class C Shares, 0.17% for Class I Shares and 0.05% for Class Y shares of each class’ average daily net assets. These administrative fees are used to pay most of the Funds’ operating expenses except advisory fees, distribution fees, custody fees, brokerage fees, taxes, interest and dividend expense on securities sold short and extraordinary expenses.
Pursuant to Rule 12b-1 under the 1940 Act, the Trust has adopted a distribution plan on behalf of each Fund’s Class A and Class C Shares (the “Plan”). Under the Plan, Class A shares pay a distribution fee monthly at an annual rate of 0.25% of Class A average daily net assets. Class C shares pay distribution and shareholder-servicing fees monthly at an annual rate of 0.75% and 0.25%, respectively, of Class C’s average daily net assets. Class I and Class Y shares are not subject
DIAMOND HILL FUNDS | ANNUAL REPORT | DECEMBER 31, 2019 | DIAMOND-HILL.COM 165 |
Diamond Hill Funds
Notes to Financial Statements (Continued)
December 31, 2019
to any distribution or shareholder-servicing fees. The Trust has entered into a Distribution Agreement on behalf of the Funds with Foreside Financial Services, LLC (“Distributor”). Pursuant to the Distribution Agreement, the Distributor acts as principal underwriter of each Fund’s shares.
During the year ended December 31, 2019, the Distributor retained the following amounts in sales commissions from the sales of Class A shares of the Funds as follows:
Small Cap Fund | | $ | 1,805 | |
Small-Mid Cap Fund | | | 1,454 | |
Mid Cap Fund | | | 4,081 | |
Large Cap Fund | | | 37,896 | |
All Cap Select Fund | | | 309 | |
Long-Short Fund | | | 16,750 | |
Research Opportunities Fund | | | 407 | |
International Fund | | | 69 | |
Short Duration Fund | | | 2,406 | |
Core Bond Fund | | | 12 | |
Corporate Credit Fund | | | 8,771 | |
High Yield Fund | | | 4,059 | |
DHCM, as the financing agent for Class C shares, received contingent deferred sales charges relating to the redemptions of Class C shares of the Funds during the year ended December 31, 2019 as follows:
Small Cap Fund | | $ | 165 | |
Small-Mid Cap Fund | | | 382 | |
Large Cap Fund | | | 717 | |
Long-Short Fund | | | 94 | |
Research Opportunities Fund | | | 150 | |
Corporate Credit Fund | | | 1,025 | |
166 DIAMOND HILL FUNDS | ANNUAL REPORT | DECEMBER 31, 2019 | DIAMOND-HILL.COM |
Diamond Hill Funds
Notes to Financial Statements (Continued)
December 31, 2019
The Funds may invest in one or more Diamond Hill Funds. The Fund’s adviser has contractually agreed to waive fees in the pro-rata amount of the management fee charged by the underlying Diamond Hill Fund on each Fund’s investment in such other Diamond Hill Funds. This fee waiver is accrued daily and settled monthly. During the year ended December 31, 2019, the Funds reduced investment advisory fees as follows:
Small Cap Fund | | $ | 20,711 | |
Small-Mid Cap Fund | | | 139,722 | |
Mid Cap Fund | | | 8,042 | |
Long-Short Fund | | | 280,403 | |
Corporate Credit Fund | | | 151,035 | |
The Small-Mid Cap Fund, Mid Cap Fund, Long-Short Fund and Corporate Credit Fund each own Class Y shares of the Short Duration Fund, thereby making the Short Duration Fund an affiliated company as defined by the 1940 Act.
Information regarding the Funds’ holdings in the Short Duration Fund during the year ended December 31, 2019 is as follows:
Affiliated Fund | | Small Cap
Fund | | | Small-Mid
Cap Fund | | | Mid Cap
Fund | | | Long-Short
Fund | | | Corporate
Credit Fund | |
Diamond Hill Short Duration Total Return Fund | | | | | | | | |
Value, December 31, 2018 | | $ | 39,405,005 | | | $ | 38,869,026 | | | $ | 2,237,057 | | | $ | 91,442,964 | | | $ | 32,028,667 | |
Purchases | | | 213,534 | | | | 1,652,813 | | | | 95,126 | | | | 3,230,799 | | | | 18,820,369 | |
Sales | | | (39,721,907 | ) | | | — | | | | — | | | | (27,000,000 | ) | | | — | |
Realized Gains | | | 71,515 | | | | — | | | | — | | | | 217,544 | | | | — | |
Change in Unrealized Appreciation/Depreciation | | | 31,853 | | | | 229,651 | | | | 13,217 | | | | 541,718 | | | | 172,727 | |
Value, December 31, 2019 | | $ | — | | | $ | 40,751,490 | | | $ | 2,345,400 | | | $ | 68,433,025 | | | $ | 51,021,763 | |
Income Distributions | | $ | 213,534 | | | $ | 1,652,814 | | | $ | 95,126 | | | $ | 3,230,799 | | | $ | 1,820,369 | |
The Officers of the Trust are affiliated with DHCM. Such Officers receive no compensation from the Funds for serving in their respective roles.
Trustee Fees
The Independent Trustees are compensated for their services to the Funds by DHCM as part of the administration services agreement. Each Trustee receives an annual retainer of $60,000, an in-person meeting fee of $9,125 and a July telephonic meeting fee of $5,000 from DHCM. The Independent Chairperson of the Board also receives an additional $3,000 for each in person meeting. The Audit and Nominating Committee Chairpersons receive an additional $2,000 per Committee meeting. Collectively, the Independent Trustees were paid $564,625 in fees during the year ended December 31, 2019. In addition, DHCM reimburses Trustees for out-of-pocket expenses incurred in conjunction with attendance of meetings.
DIAMOND HILL FUNDS | ANNUAL REPORT | DECEMBER 31, 2019 | DIAMOND-HILL.COM 167 |
Diamond Hill Funds
Notes to Financial Statements (Continued)
December 31, 2019
Commitments and Contingencies
The Funds indemnify the Trust’s Officers and Trustees for certain liabilities that might arise from their performance of their duties to the Funds. Additionally, in the normal course of business, the Funds enter into contracts that contain a variety of representations and warranties and which provide general indemnifications. The Funds’ maximum exposure under these arrangements is unknown, as this would involve future claims that may be made against the Funds that have not yet occurred. However, based on experience, the Funds expect the risk of loss to be remote.
Federal Tax Information
The amount and character of income and capital gain distributions paid by the Funds are determined in accordance with Federal income tax regulations, which may differ from GAAP.
The tax character of distributions paid during the year ended December 31, 2019 and 2018 were as follows:
| | | Small Cap Fund | | | Small-Mid Cap Fund | | | Mid Cap Fund | |
| | | 2019 | | | 2018 | | | 2019 | | | 2018 | | | 2019 | | | 2018 | |
Distributions paid from: | | | | | | | | | | | | | | | | | | | | | | | | |
Ordinary income | | $ | 9,777,452 | | | $ | 2,748,773 | | | $ | 22,520,202 | | | $ | 11,364,354 | | | $ | 1,309,016 | | | $ | 836,404 | |
Long-term capital gains | | | 41,924,707 | | | | 101,045,861 | | | | 96,840,200 | | | | 85,762,400 | | | | 3,308,543 | | | | 2,432,843 | |
Total distributions | | $ | 51,702,159 | | | $ | 103,794,634 | | | $ | 119,360,402 | | | $ | 97,126,754 | | | $ | 4,617,559 | | | $ | 3,269,247 | |
| | | Large Cap Fund | | | All Cap Select Fund | | | Long-Short Fund | |
| | | 2019 | | | 2018 | | | 2019 | | | 2018 | | | 2019 | | | 2018 | |
Distributions paid from: | | | | | | | | | | | | | | | | | | | | | | | | |
Ordinary income | | $ | 76,750,034 | | | $ | 79,248,954 | | | $ | 378,966 | | | $ | 3,669,241 | | | $ | 29,241,845 | | | $ | 27,187,756 | |
Long-term capital gains | | | 232,666,505 | | | | 146,758,591 | | | | 4,355,643 | | | | 17,028,959 | | | | 188,106,126 | | | | 161,714,915 | |
Total distributions | | $ | 309,416,539 | | | $ | 226,007,545 | | | $ | 4,734,609 | | | $ | 20,698,200 | | | $ | 217,347,971 | | | $ | 188,902,671 | |
| | | Research Opportunities
Fund | | | Global Fund | | | International
Fund | | |
| | | 2019 | | | 2018 | | | 2019 | | | 2018 | | | 2019 | | |
Distributions paid from: | | | | | | | | | | | | | | | | | | | | | |
Ordinary income | | $ | 353,668 | | | $ | 21,893 | | | $ | 240,628 | | | $ | 372,462 | | | $ | 48,725 | | |
Long-term capital gains | | | 3,455,947 | | | | 2,194,400 | | | | — | | | | 183,247 | | | | 3,173 | | |
Total distributions | | $ | 3,809,615 | | | $ | 2,216,293 | | | $ | 240,628 | | | $ | 555,709 | | | $ | 51,898 | | |
| | | Short Duration Fund | | | Core Bond Fund | | | Corporate Credit Fund | |
| | | 2019 | | | 2018 | | | 2019 | | | 2018 | | | 2019 | | | 2018 | |
Distributions paid from: | | | | | | | | | | | | | | | | | | | | | | | | |
Ordinary income | | $ | 28,180,506 | | | $ | 16,643,635 | | | $ | 2,323,156 | | | $ | 1,575,062 | | | $ | 57,866,445 | | | $ | 38,890,760 | |
Long-term capital gains | | | — | | | | 4,015 | | | | — | | | | — | | | | 1,612,910 | | | | — | |
Total distributions | | $ | 28,180,506 | | | $ | 16,647,650 | | | $ | 2,323,156 | | | $ | 1,575,062 | | | $ | 59,479,355 | | | $ | 38,890,760 | |
168 DIAMOND HILL FUNDS | ANNUAL REPORT | DECEMBER 31, 2019 | DIAMOND-HILL.COM |
Diamond Hill Funds
Notes to Financial Statements (Continued)
December 31, 2019
| | | High Yield Fund | |
| | | 2019 | | | 2018 | |
Distributions paid from: | | | | | | | | |
Ordinary income | | $ | 7,005,691 | | | $ | 2,950,438 | |
Long-term capital gains | | | — | | | | 199,225 | |
Total distributions | | $ | 7,005,691 | | | $ | 3,149,663 | |
The following information is computed on a tax basis for each item as of December 31, 2019:
| | | Small Cap
Fund | | | Small-Mid
Cap Fund | | | Mid Cap Fund | | | Large Cap
Fund | |
Net unrealized appreciation on portfolio investments | | $ | 274,237,010 | | | $ | 463,978,701 | | | $ | 26,792,544 | | | $ | 2,030,699,844 | |
Undistributed ordinary income | | | 2,506,448 | | | | 4,969,112 | | | | — | | | | — | |
Undistributed capital gains | | | — | | | | 1,659,341 | | | | 401,825 | | | | — | |
Qualified late-year losses | | | (2,887,341 | ) | | | — | | | | (4,733 | ) | | | (13,803,061 | ) |
Distributable earnings | | $ | 273,856,117 | | | $ | 470,607,154 | | | $ | 27,189,636 | | | $ | 2,016,896,783 | |
| | | All Cap
Select Fund | | | Long-Short
Fund | | | Research
Opportunities
Fund | | | Global Fund | |
Net unrealized appreciation on portfolio investments | | $ | 42,611,460 | | | $ | 868,047,927 | | | $ | 10,247,107 | | | $ | 2,128,810 | |
Undistributed ordinary income | | | 1,790,440 | | | | — | | | | 92,036 | | | | 42,245 | |
Undistributed capital gains | | | — | | | | 15,780,587 | | | | 566,892 | | | | — | |
Accumulated capital and other losses | | | (4,194,625 | ) | | | — | | | | — | | | | (474,794 | ) |
Distributable earnings | | $ | 40,207,275 | | | $ | 883,828,514 | | | $ | 10,906,035 | | | $ | 1,696,261 | |
| | | International
Fund | | | Short
Duration Total
Return Fund | | | Core Bond
Fund | | | Corporate
Credit Fund | |
Net unrealized appreciation on portfolio investments | | $ | 1,208,823 | | | $ | 1,555,043 | | | $ | 1,585,746 | | | $ | 13,329,740 | |
Undistributed ordinary income | | | 9,101 | | | | — | | | | — | | | | 4,407,964 | |
Undistributed capital gains | | | 79,270 | | | | — | | | | — | | | | 820,030 | |
Qualified late-year losses | | | — | | | | (16,256 | ) | | | — | | | | — | |
Accumulated capital and other losses | | | — | | | | — | | | | (193,179 | ) | | | — | |
Distributable earnings | | $ | 1,297,194 | | | $ | 1,538,787 | | | $ | 1,392,567 | | | $ | 18,557,734 | |
DIAMOND HILL FUNDS | ANNUAL REPORT | DECEMBER 31, 2019 | DIAMOND-HILL.COM 169 |
Diamond Hill Funds
Notes to Financial Statements (Continued)
December 31, 2019
| | | High Yield
Fund | |
Net unrealized appreciation on portfolio investments | | $ | 2,014,737 | |
Undistributed ordinary income | | | 870,667 | |
Undistributed capital gains | | | 34,490 | |
Distributable earnings | | $ | 2,919,894 | |
Qualified late-year losses listed above incurred after October 31, 2019 and within the taxable year, are deemed to arise on the first day of the Funds’ next taxable year.
As of December 31, 2019, the Funds’ federal tax cost of portfolio investments and net unrealized appreciation (depreciation) on portfolio investments including short sales, where applicable, were as follows:
| | | Small Cap
Fund | | | Small-Mid
Cap Fund | | | Mid Cap Fund | | | Large Cap
Fund | |
Tax cost of portfolio investments | | $ | 530,324,730 | | | $ | 2,085,290,070 | | | $ | 207,575,997 | | | $ | 4,734,840,665 | |
Gross unrealized appreciation | | | 286,671,927 | | | | 557,569,076 | | | | 33,635,734 | | | | 2,167,574,938 | |
Gross unrealized depreciation | | | (12,434,917 | ) | | | (93,590,375 | ) | | | (6,843,190 | ) | | | (136,875,094 | ) |
Net unrealized appreciation on portfolio investments | | $ | 274,237,010 | | | $ | 463,978,701 | | | $ | 26,792,544 | | | $ | 2,030,699,844 | |
| | | All Cap
Select Fund | | | Long-Short
Fund | | | Research
Opportunities
Fund | | | Global Fund | |
Tax cost of portfolio investments | | $ | 237,467,427 | | | $ | 2,092,680,273 | | | $ | 68,617,902 | | | $ | 20,265,178 | |
Gross unrealized appreciation | | | 45,788,076 | | | | 881,317,626 | | | | 12,375,820 | | | | 2,829,522 | |
Gross unrealized depreciation | | | (3,176,616 | ) | | | (13,269,699 | ) | | | (2,128,713 | ) | | | (700,712 | ) |
Net unrealized appreciation on portfolio investments | | $ | 42,611,460 | | | $ | 868,047,927 | | | $ | 10,247,107 | | | $ | 2,128,810 | |
| | | International
Fund | | | Short
Duration Total
Return Fund | | | Core Bond
Fund | | | Corporate
Credit Fund | |
Tax cost of portfolio investments | | $ | 12,646,022 | | | $ | 847,587,968 | | | $ | 123,605,430 | | | $ | 1,114,706,522 | |
Gross unrealized appreciation | | | 1,522,962 | | | | 9,541,394 | | | | 2,956,016 | | | | 25,353,103 | |
Gross unrealized depreciation | | | (314,139 | ) | | | (7,986,351 | ) | | | (1,370,270 | ) | | | (12,023,363 | ) |
Net unrealized appreciation on portfolio investments | | $ | 1,208,823 | | | $ | 1,555,043 | | | $ | 1,585,746 | | | $ | 13,329,740 | |
170 DIAMOND HILL FUNDS | ANNUAL REPORT | DECEMBER 31, 2019 | DIAMOND-HILL.COM |
Diamond Hill Funds
Notes to Financial Statements (Continued)
December 31, 2019
| | | High Yield
Fund | |
Tax cost of portfolio investments | | $ | 130,887,276 | |
Gross unrealized appreciation | | | 3,339,608 | |
Gross unrealized depreciation | | | (1,324,871 | ) |
Net unrealized appreciation on portfolio investments | | $ | 2,014,737 | |
The difference between book basis and tax basis net unrealized appreciation (depreciation) is attributable primarily to the tax deferral of losses on wash sales and unreversed inclusions of Passive Foreign Investment Companies.
For the latest tax year ended December 31, 2019, the following Funds have capital loss carry forwards (“CLCFs”) as summarized below.
CLCFs not subject to expiration:
| | | All Cap Select
Fund | | | Global Fund | | | Core Bond
Fund | |
No expiration - short-term | | $ | 2,078,521 | | | $ | 71,958 | | | $ | 68,818 | |
No expiration - long-term | | | 2,116,104 | | | | 402,836 | | | | 124,361 | |
| | | $ | 4,194,625 | | | $ | 474,794 | | | $ | 193,179 | |
As a result of the reorganization of the Financial Long-Short Fund into the Research Opportunities Fund, the Research Opportunities Fund acquired $1,890 of long-term CLCFs from the Financial Long-Short Fund. During the year ended December 31, 2019, Research Opportunities utilized the $1,890 of long-term CLCFs to offset current year realized gains and the Corporate Credit Fund utilized $2,412,492 of short-term CLCFs to offset current year realized gains.
DIAMOND HILL FUNDS | ANNUAL REPORT | DECEMBER 31, 2019 | DIAMOND-HILL.COM 171 |
Diamond Hill Funds
Notes to Financial Statements (Continued)
December 31, 2019
Reclassification of capital accounts — Reclassifications result primarily from utilization of earnings and profits on shareholder redemptions. The following reclassifications have no impact on the net assets or NAV per share of the Funds and are designed to present each Fund’s capital accounts on a tax basis:
| | | Paid-In
Capital | | | Distributable
Earnings | |
Small Cap Fund | | $ | 18,806,046 | | | $ | (18,806,046 | ) |
Small-Mid Cap Fund | | | 9,142,133 | | | | (9,142,133 | ) |
Mid Cap Fund | | | 1,052,170 | | | | (1,052,170 | ) |
Large Cap Fund | | | 37,633,104 | | | | (37,633,104 | ) |
All Cap Select Fund | | | — | | | | — | |
Long-Short Fund | | | 56,674,352 | | | | (56,674,352 | ) |
Research Opportunities Fund | | | 435,782 | | | | (435,782 | ) |
Global Fund | | | — | | | | — | |
International Fund | | | — | | | | — | |
Short Duration Fund | | | (59,315 | ) | | | 59,315 | |
Core Bond Fund | | | (4,631 | ) | | | 4,631 | |
Corporate Credit Fund | | | 961,978 | | | | (961,978 | ) |
High Yield Fund | | | 256,738 | | | | (256,738 | ) |
Borrowings
The Small Cap Fund, Small-Mid Cap Fund, Mid Cap Fund, Large Cap Fund, All Cap Select Fund, Long-Short Fund, Research Opportunities Fund, Global Fund, International Fund, Short Duration Fund, Core Bond Fund, Corporate Credit Fund and High Yield Fund each has an unsecured line of credit up to 20.0%, 20.0%, 20.0%, 33.3%, 25.0%, 15.0%, 15.0%, 20.0%, 20.0%, 20.0%, 20.0%, 15.0% and 15.0%, respectively, of its net assets, with a total maximum of $40,000,000.
Borrowings under the agreement bear interest at the higher of Federal Funds Rate or one month LIBOR plus 1.25%. The line of credit is available until June 3, 2020, unless extended, when any advances are to be repaid. During the year ended December 31, 2019, no amounts were drawn from the available lines.
In accordance with an exemptive order (the “Order”) from the U.S. Securities and Exchange Commission (“SEC”), the Funds may participate in a joint lending and borrowing facility for temporary purposes (the “Interfund Lending Program”), subject to compliance with the terms and conditions of the Order, and to the extent permitted by each Fund’s investment policies and restrictions. A lending fund may lend in aggregate up to 15% of its net assets, but may not lend more than 5% of its net assets to any one borrowing fund through the Interfund Lending Program. A borrowing fund may not borrow through the Interfund Lending Program or from any other source more than 33 1/3% of its total assets (or any lower threshold provided for by the fund’s investment restrictions). If a borrowing fund’s total outstanding borrowings exceed 10%
172 DIAMOND HILL FUNDS | ANNUAL REPORT | DECEMBER 31, 2019 | DIAMOND-HILL.COM |
Diamond Hill Funds
Notes to Financial Statements (Continued)
December 31, 2019
of its total assets, each of its outstanding interfund loans will be subject to collateralization of at least 102% of the outstanding principal value of the loan. All interfund loans are for temporary or emergency purposes and the interest rate to be charged will be the average of the highest current overnight repurchase agreement rate available to a lending fund and the bank loan rate, as calculated according to a formula established by the Board. During the year ended December 31, 2019, none of the Funds participated in the Interfund Lending Program.
In-Kind Subscriptions Transactions
During the year ended December 31, 2019, the Large Cap Fund, Class Y received securities in lieu of cash for two shareholder purchases. The purchases were as follows:
Fund | | Date | | | Amount
Purchased | | | Securities
Received | | | Cash
Received | | | Shares
Issued | |
Large Cap Fund | | | 04/05/19 | | | $ | 5,153,011 | | | $ | 4,881,551 | | | $ | 271,460 | | | | 192,564 | |
Large Cap Fund | | | 04/05/19 | | | | 1,736,514 | | | | 1,640,808 | | | | 95,706 | | | | 64,892 | |
Subsequent Events
The Funds evaluated events from December 31, 2019 through the date that these financial statements were issued. There were no subsequent events to report that would have a material impact on the Funds’ financial statements.
DIAMOND HILL FUNDS | ANNUAL REPORT | DECEMBER 31, 2019 | DIAMOND-HILL.COM 173 |
Report of Independent Registered Public Accounting Firm
To the Shareholders and Board of Trustees of Diamond Hill Funds
Opinion on the Financial Statements
We have audited the accompanying statements of assets and liabilities, including the schedules of investments and investments sold short, of Diamond Hill Funds comprising Diamond Hill Small Cap Fund, Diamond Hill Small-Mid Cap Fund, Diamond Hill Mid Cap Fund, Diamond Hill Large Cap Fund, Diamond Hill All Cap Select Fund, Diamond Hill Long-Short Fund, Diamond Hill Research Opportunities Fund, Diamond Hill Global Fund, Diamond Hill International Fund, Diamond Hill Short Duration Total Return Fund, Diamond Hill Core Bond Fund, Diamond Hill Corporate Credit Fund, and Diamond Hill High Yield Fund (the “Funds”) as of December 31, 2019, the related statements of operations for the year then ended, the statements of changes in net assets, including the related notes, and the financial highlights for each of the two years in the period then ended for Diamond Hill Small Cap Fund, Diamond Hill Small-Mid Cap Fund, Diamond Hill Mid Cap Fund, Diamond Hill Large Cap Fund, Diamond Hill All Cap Select Fund, Diamond Hill Long-Short Fund, Diamond Hill Research Opportunities Fund, Diamond Hill Global Fund, Diamond Hill Short Duration Total Return Fund, Diamond Hill Core Bond Fund, Diamond Hill Corporate Credit Fund, and Diamond Hill High Yield Fund, and the related statements of operations and changes in net assets, including the related notes, and the financial highlights for the period July 1, 2019 (commencement of operations) through December 31, 2019, for Diamond Hill International Fund (collectively referred to as the “financial statements”). In our opinion, the financial statements present fairly, in all material respects, the financial position of each of the Funds as of December 31, 2019, the results of their operations, the changes in their net assets and the financial highlights for each of the periods indicated above, in conformity with accounting principles generally accepted in the United States of America.
The Funds’ financial highlights for the years or periods ended December 31, 2017, and prior, were audited by other auditors whose report dated February 16, 2018, expressed an unqualified opinion on those financial highlights.
Basis for Opinion
These financial statements are the responsibility of the Funds’ management. Our responsibility is to express an opinion on the Funds’ financial statements based on our audits. We are a public accounting firm registered with the Public Company Accounting Oversight Board (United States) (“PCAOB”) and are required to be independent with respect to the Funds in accordance with the U.S. federal securities laws and the applicable rules and regulations of the Securities and Exchange Commission and the PCAOB.
We conducted our audits in accordance with the standards of the PCAOB. Those standards require that we plan and perform the audit to obtain reasonable assurance about whether the financial statements are free of material misstatement whether due to error or fraud.
174 DIAMOND HILL FUNDS | ANNUAL REPORT | DECEMBER 31, 2019 | DIAMOND-HILL.COM |
Report of Independent Registered Public Accounting Firm (Continued)
Our audits included performing procedures to assess the risks of material misstatement of the financial statements, whether due to error or fraud, and performing procedures that respond to those risks. Such procedures included examining, on a test basis, evidence regarding the amounts and disclosures in the financial statements. Our procedures included confirmation of securities owned as of December 31, 2019, by correspondence with the custodian and brokers or by other appropriate auditing procedures where replies from brokers or counterparties were not received. Our audits also included evaluating the accounting principles used and significant estimates made by management, as well as evaluating the overall presentation of the financial statements. We believe that our audits provide a reasonable basis for our opinion.
We have served as the auditor of one or more funds advised by Diamond Hill Capital Management, Inc. since 2015.
COHEN & COMPANY, LTD.
Cleveland, Ohio
February 14, 2020
DIAMOND HILL FUNDS | ANNUAL REPORT | DECEMBER 31, 2019 | DIAMOND-HILL.COM 175 |
Diamond Hill Funds
Other Items
December 31, 2019 (Unaudited)
Proxy Voting
The investment adviser is responsible for exercising the voting rights associated with the securities purchased and held by the Funds. A description of the policies and procedures that the adviser uses in fulfilling this responsibility and information regarding how those proxies were voted during the twelve-month period ended June 30 are available without charge upon request by calling toll free number 1-888-226-5595, or through the Funds’ website, or on the Securities and Exchange Commission’s (“Commission”) website at www.sec.gov.
Portfolio Disclosure
The Trust files a complete listing of portfolio holdings for each Fund as of the end of the first and third quarters of each fiscal year on Part F to Form N-PORT. The complete listing is available on the Commission’s website. Monthly portfolio holdings are also available on www.diamond-hill.com.
Dividends Received Deduction
For corporate shareholders, the following percentages of ordinary dividends paid during the year ended December 31, 2019 qualify for the corporate dividends received deduction:
Small Cap Fund | | | 59.57 | % |
Small-Mid Cap Fund | | | 68.25 | % |
Mid Cap Fund | | | 100.00 | % |
Large Cap Fund | | | 100.00 | % |
All Cap Select Fund | | | 67.56 | % |
Long-Short Fund | | | 100.00 | % |
Research Opportunities Fund | | | 86.67 | % |
Global Fund | | | 3.68 | % |
International Fund | | | 5.57 | % |
Short Duration Fund | | | 0.00 | % |
Core Bond Fund | | | 0.00 | % |
Corporate Credit Fund | | | 0.00 | % |
High Yield Fund | | | 0.00 | % |
Qualified Dividend Income
The Funds have designated the maximum amount allowable of their taxable income as qualified dividend income as provided in the Jobs and Growth Tax Relief Reconciliation Act of 2003. This amount was reflected on form 1099-DIV for the calendar year 2019.
176 DIAMOND HILL FUNDS | ANNUAL REPORT | DECEMBER 31, 2019 | DIAMOND-HILL.COM |
Diamond Hill Funds
Other Items
December 31, 2019 (Unaudited) (Continued)
Capital Gain Distribution
For the year ended December 31, 2019, the following Funds designated long-term capital gain distributions:
Small Cap Fund | | $ | 41,924,707 | |
Small-Mid Cap Fund | | | 96,840,200 | |
Mid Cap Fund | | | 3,308,543 | |
Large Cap Fund | | | 232,666,505 | |
All Cap Select Fund | | | 4,355,643 | |
Long-Short Fund | | | 188,106,126 | |
Research Opportunities Fund | | | 3,455,947 | |
International Fund | | | 3,173 | |
Corporate Credit Fund | | | 1,612,910 | |
Trustee Approval of Investment Advisory Agreement
Renewal of Management Agreement for All Funds
The Board of Trustees of Diamond Hill Funds (the “Trust”) requested and the Adviser provided a broad range of information in connection with its consideration of the continuance of the Amended and Restated Investment Management Agreement (“Management Agreement”) between the Trust and Diamond Hill Capital Management, Inc. (the “Adviser”), for each series of the Trust (each separately, a “Fund”). The Board reviewed the information at regularly scheduled meetings on July 17, 2019, and August 15, 2019, and by unanimous vote approved continuation of the Management Agreement. In concluding to renew the Management Agreement, the Board discussed the following factors, on a Fund-by-Fund basis:
a) | Nature, Extent and Quality of Services. The Trustees considered the nature, extent and quality of the services provided by the Adviser under the Management Agreement, including a review of the services provided thereunder and the Adviser’s overall reputation, integrity and mission to serve its clients through a disciplined intrinsic-value-based approach to investment that aligns the Adviser’s interests with those of its clients. The Trustees noted the qualifications of the investment staff and other key personnel of the Adviser and that the Adviser continues to invest significant resources in human capital to attract and retain top talent. The Trustees also reviewed the Adviser’s succession plan for key investment and management staff. In addition, the Trustees reviewed information related to the compensation structure for portfolio managers and other key investment personnel. Finally, the Trustees noted that the Adviser provides administrative services to the Trust under an Amended and Restated Administrative, Fund Accounting and Transfer Agency Services Agreement (“Administration Agreement”). |
DIAMOND HILL FUNDS | ANNUAL REPORT | DECEMBER 31, 2019 | DIAMOND-HILL.COM 177 |
Diamond Hill Funds
Other Items
December 31, 2019 (Unaudited) (Continued)
b) | Investment Performance of the Funds. In evaluating the performance of each Fund, the Trustees reviewed each Fund’s absolute performance, performance relative to its passive benchmark, performance relative to a custom peer group, and performance relative to the Fund’s Morningstar category, each as of June 30, 2019. |
c) | Reasonableness of Investment Advisory Fees. The Trustees noted that the contractual fee rate for each Fund under the Management Agreement was at or below the average and median rates of the applicable Fund’s custom peer group. |
d) | Reasonableness of Total Expenses. The Trustees noted that the total expenses for all Class I and Class Y shares, except for Short Duration Total Return Class I, were at or below both the average and median total expenses of comparable funds within the applicable Fund’s Morningstar category and custom peer group. As it relates to Class A and Class C, the total expenses are at or below both the average and median total expenses of comparable funds with the applicable Fund’s Morningstar category and custom peer group for all but four share classes. |
e) | Reasonableness of Investment Advisory Fees as Compared to Fees Charged to Other Clients. The Trustees reviewed the fees paid by each of the Adviser’s other clients, as well as a summary of the differences in services provided and how these differences affect fees, including the difference between serving as an adviser versus a sub-adviser. With limited exceptions, the Trustees observed that the investment advisory fees charged by the Adviser to the Funds were comparable to the investment advisory fees the Adviser charges its other similarly managed accounts (i.e., private partnerships and separately managed accounts). |
f) | Profitability. The Trustees considered each Fund’s profitability to the Adviser and the Adviser’s methodology for calculating its profitability. The Trustees concluded that the Adviser’s pre-tax profit margin under the Management Agreement represented a fair and entrepreneurial profit for managing the Funds. The Trustees noted that the Adviser is also the administrator to the Funds and the Trustees reviewed a separate profitability analysis relating to the administrative services provided to the Funds. The Trustees concluded that the profit margin under the Administration Agreement represented a fair and entrepreneurial profit for serving as administrator to the Funds. |
g) | Economies of Scale. The Trustees reviewed the potential extent to which economies of scale would be realized as each Fund grows and whether fee levels reflect these economies of scale for the benefit of Fund shareholders. They noted that while many advisory firms reduce fees as assets under management increase with predetermined break points, the Adviser has adopted a different strategy. The Trustees considered that rather than instituting break points, the Adviser has targeted its advisory fees to correspond to its mission to add value, meaning that rather than charging a lower fee on assets above a certain level, the Adviser prefers to close a strategy to new investors so that it can efficiently manage the Fund’s assets and attempt to fulfill its responsibility to add value to existing investors. The Trustees noted that one of the Funds currently is closed to most new investors. The Trustees also noted that the Adviser has a |
178 DIAMOND HILL FUNDS | ANNUAL REPORT | DECEMBER 31, 2019 | DIAMOND-HILL.COM |
Diamond Hill Funds
Other Items
December 31, 2019 (Unaudited) (Continued)
history of voluntarily reducing its fees under the Administration Agreement when asset growth allows for the sharing of economies of scale, with the most recent reduction having taken place on February 28, 2018.
h) | Ancillary Benefits. The Trustees considered ancillary benefits received by the Adviser as a result of its relationship with the Funds, including the ability to negotiate favorable commissions rates and have access to research that benefits all of the Adviser’s clients and the ability to serve as sub-adviser to other mutual funds. The Trustees noted that as administrator to the Funds the Adviser is expected to earn fees from the Funds for providing administrative services. The fees were shown separately in the profitability analysis presented to the Trustees. The Trustees also considered revenue and expenses of the Administrator for providing financing arrangements related to the payment of commissions to financial intermediaries for the sale of Class C Shares of the Funds. |
In their deliberations, there was a comprehensive consideration of each of the factors above in connection with each Fund, and the Trustees, all of whom qualify as Independent Trustees under the 1940 Act, concluded the compensation to be received by the Adviser from each Fund was fair and reasonable and the continuance of the Management Agreement for all of the Funds was in the best interests of each Fund and its shareholders.
Initial Approval of Management Agreement for the Diamond Hill International Fund
The Board of Trustees of Diamond Hill Funds (the “Trust”) requested and the Adviser provided a broad range of information in connection with its consideration of approval of the Amended and Restated Investment Management Agreement (“Management Agreement”) between the Trust and Diamond Hill Capital Management, Inc. (the “Adviser”), for the Diamond Hill International Fund (“International Fund”), a newly organized series of the Trust. The Board reviewed the information at a regularly scheduled meeting on February 14, 2019 and by a unanimous vote approved the Management Agreement. The Board had previously renewed the Management Agreement for all series of the Trust on August 16, 2018. In concluding to approve the Management Agreement for the International Fund, the Board discussed the following factors, on a Fund-by-Fund basis:
a) | Nature, Extent and Quality of Services. The Trustees considered the nature, extent and quality of the services provided by the Adviser under the Management Agreement, including a review of the services provided thereunder and the Adviser’s overall reputation, integrity and mission to serve its clients through a disciplined intrinsic-value-based approach to investment that aligns the Adviser’s interests with those of its clients. The Trustees noted the qualifications of the investment staff and other key personnel of the Adviser and that the Adviser continues to invest significant resources in human capital to attract and retain top talent. Finally, the Trustees noted that the Adviser provides administrative services to the Trust under an Amended and Restated Administrative, Fund Accounting and Transfer Agency Services Agreement (“Administration Agreement”). |
DIAMOND HILL FUNDS | ANNUAL REPORT | DECEMBER 31, 2019 | DIAMOND-HILL.COM 179 |
Diamond Hill Funds
Other Items
December 31, 2019 (Unaudited) (Continued)
b) | Investment Performance of the Fund. In evaluating performance, the Trustees reviewed the Adviser’s absolute and relative return goals for the International Fund and performance information for the Diamond Hill International Fund, L.P. (“International LP”), noting that the International LP will be converted into the International Fund. The Trustees determined that because the International Fund has not commenced operations, the Trustees would review performance over time. |
c) | Reasonableness of Investment Advisory Fees. The Trustees noted that the contractual fee rate under the Management Agreement was below both the average and median rates of the Morningstar Foreign Large Value Category. |
d) | Reasonableness of Total Expenses. The Trustees noted that the estimated total expenses of each class of shares of the International Fund was below both the average and median total expenses of the Morningstar Foreign Large Value Category. |
e) | Profitability. The Trustees considered the profitability of the Adviser’s future relationship with the International Fund. The Adviser discussed the level of assets the International Fund will need to reach before becoming profitable. As such, the Adviser represented that the International Fund will likely not generate a profit until a performance track-record has been established and asset growth begins to increase in line with expectations. After discussion, the Trustees determined that they would continue to evaluate the Adviser’s profitability in connection with the next annual renewal of the Management Agreement. The Trustees noted that the Adviser is also the administrator to the International Fund and the Trustees had previously reviewed a separate profitability analysis relating to the administrative services provided to all the funds of the Trust. The Trustees concluded that the profit margin under the Administration Agreement represented a fair and entrepreneurial profit for serving as administrator to the Funds. |
f) | Economies of Scale. The Trustees had previously reviewed the potential extent to which economies of scale would be realized as each of the other funds in the Trust grow and whether fee levels reflect these economies of scale for the benefit of Fund shareholders. They noted that while many advisory firms reduce fees as assets under management increase with predetermined break points, the Adviser has adopted a different strategy. The Trustees considered that rather than instituting break points, the Adviser has targeted its advisory fees to correspond to its mission to add value, meaning that rather than charging a lower fee on assets above a certain level, the Adviser prefers to close a strategy to new investors so that it can efficiently manage the Fund’s assets and attempt to fulfill its responsibility to add value to existing investors. The Trustees noted that three of the other funds in the Trust are currently closed to most new investors. The Trustees also noted that the Adviser has a history of voluntarily reducing its fees under the Administration Agreement when asset growth allows for the sharing of economies of scale, with the most recent reduction taking place on February 28, 2018. The Adviser represented that the strategy for the International Fund will be the same as the other funds in the Trust. |
180 DIAMOND HILL FUNDS | ANNUAL REPORT | DECEMBER 31, 2019 | DIAMOND-HILL.COM |
Diamond Hill Funds
Other Items
December 31, 2019 (Unaudited) (Continued)
g) | Ancillary Benefits. The Trustees considered ancillary benefits received by the Adviser as a result of its relationship with all the funds in the Trust, including the ability to negotiate favorable commissions rates and have access to research that benefits all of the Adviser’s clients, the ability to serve as sub-adviser to other mutual funds, and the ability to launch an exchange-traded fund. |
In their deliberations, there was a comprehensive consideration of each of the factors above in connection with the International Fund, and the Trustees, all of whom qualify as Independent Trustees under the 1940 Act, concluded the compensation to be received by the Adviser from the International Fund was fair and reasonable and the approval of the Management Agreement for the International Fund was in the best interests of the International Fund and its shareholders.
DIAMOND HILL FUNDS | ANNUAL REPORT | DECEMBER 31, 2019 | DIAMOND-HILL.COM 181 |
Diamond Hill Funds
Schedule of Shareholder Expenses
Hypothetical Example of a $1,000 Investment at Beginning of Period
(Unaudited)
As a Fund shareholder, you may incur two types of costs: (1) transaction costs, including wire redemption fees and sales charges (loads) as applicable; and (2) ongoing costs, including management fees; distribution and service (12b-1) fees; and other Fund expenses. These examples are intended to help you understand your ongoing costs (in dollars) of investing in a Fund and to compare these costs with the ongoing costs of investing in other mutual funds. Please note that the expenses shown in the tables are meant to highlight your ongoing costs only and do not reflect any transactional costs or other fees that may apply, such as sales charges and fees for low balance accounts. Therefore, the examples are useful in comparing ongoing costs only and will not help you determine the relative total cost of owning different funds. In addition, if these transactional costs and other fees were included, your costs would have been higher.
These examples are based on an investment of $1,000 invested at July 1, 2019 and held for the entire period from July 1, 2019 through December 31, 2019.
The Actual Expense example below provides information about actual account values and actual expenses. You may use this information, together with the amount you invested, to estimate the expenses that you paid over the period. Simply divide your account value by $1,000 (for example, an $8,600 account value divided by $1,000 = 8.6), then multiply the result by the number in the table under the heading entitled “Expenses paid during the period” to estimate the expenses you paid on your account during this period.
The Hypothetical Expense example below provides information about hypothetical account values and hypothetical expenses based on each Fund’s actual expense ratio and an assumed rate of return of 5% per year before expenses, which is not each Fund’s actual return. The hypothetical account values and expenses may not be used to estimate the actual ending account balance or expenses you paid for the period. You may use this information to compare the ongoing costs of investing in this Fund and other funds. To do so, compare this 5% hypothetical example with the 5% hypothetical examples that appear in the shareholder reports of the other funds.
| | Account value
at the beginning
of the period ($) | Account value
at the end
of the period ($) | Expenses paid
during
the period ($) | Funds annualized expense ratio (%) |
| Actual | Hypothetical | Actual | Hypothetical | Actual | Hypothetical | Actual |
Small Cap Fund |
Class A | 1,000.00 | 1,000.00 | 1,085.50 | 1,018.79 | 6.69 | 6.47 | 1.27% |
Class C | 1,000.00 | 1,000.00 | 1,081.70 | 1,014.99 | 10.63 | 10.29 | 2.03% |
Class I | 1,000.00 | 1,000.00 | 1,087.30 | 1,020.25 | 5.17 | 5.00 | 0.98% |
Class Y | 1,000.00 | 1,000.00 | 1,087.90 | 1,020.86 | 4.54 | 4.39 | 0.86% |
Small-Mid Cap Fund |
Class A | 1,000.00 | 1,000.00 | 1,082.30 | 1,019.08 | 6.38 | 6.18 | 1.21% |
Class C | 1,000.00 | 1,000.00 | 1,078.10 | 1,015.30 | 10.30 | 9.99 | 1.97% |
Class I | 1,000.00 | 1,000.00 | 1,083.90 | 1,020.54 | 4.86 | 4.71 | 0.92% |
Class Y | 1,000.00 | 1,000.00 | 1,084.40 | 1,021.15 | 4.23 | 4.10 | 0.80% |
182 DIAMOND HILL FUNDS | ANNUAL REPORT | DECEMBER 31, 2019 | DIAMOND-HILL.COM |
Diamond Hill Funds
Schedule of Shareholder Expenses
Hypothetical Example of a $1,000 Investment at Beginning of Period
(Unaudited) (Continued)
| | Account value
at the beginning
of the period ($) | Account value
at the end
of the period ($) | Expenses paid
during
the period ($) | Funds annualized expense ratio (%) |
| Actual | Hypothetical | Actual | Hypothetical | Actual | Hypothetical | Actual |
Mid Cap Fund |
Class A | 1,000.00 | 1,000.00 | 1,064.60 | 1,019.83 | 5.55 | 5.43 | 1.07% |
Class I | 1,000.00 | 1,000.00 | 1,065.90 | 1,021.29 | 4.04 | 3.96 | 0.78% |
Class Y | 1,000.00 | 1,000.00 | 1,066.40 | 1,021.90 | 3.42 | 3.35 | 0.66% |
Large Cap Fund |
Class A | 1,000.00 | 1,000.00 | 1,090.70 | 1,020.32 | 5.11 | 4.94 | 0.97% |
Class C | 1,000.00 | 1,000.00 | 1,086.80 | 1,016.53 | 9.05 | 8.74 | 1.72% |
Class I | 1,000.00 | 1,000.00 | 1,092.20 | 1,021.78 | 3.59 | 3.46 | 0.68% |
Class Y | 1,000.00 | 1,000.00 | 1,092.90 | 1,022.38 | 2.95 | 2.85 | 0.56% |
All Cap Select Fund |
Class A | 1,000.00 | 1,000.00 | 1,119.10 | 1,019.31 | 6.25 | 5.95 | 1.17% |
Class C | 1,000.00 | 1,000.00 | 1,114.70 | 1,015.52 | 10.24 | 9.76 | 1.92% |
Class I | 1,000.00 | 1,000.00 | 1,120.90 | 1,020.77 | 4.70 | 4.48 | 0.88% |
Class Y | 1,000.00 | 1,000.00 | 1,122.00 | 1,021.38 | 4.06 | 3.87 | 0.76% |
Long-Short Fund |
Class A | 1,000.00 | 1,000.00 | 1,055.90 | 1,015.50 | 9.98 | 9.78 | 1.93% |
Class C | 1,000.00 | 1,000.00 | 1,052.20 | 1,011.70 | 13.86 | 13.59 | 2.68% |
Class I | 1,000.00 | 1,000.00 | 1,057.40 | 1,016.96 | 8.48 | 8.32 | 1.64% |
Class Y | 1,000.00 | 1,000.00 | 1,058.30 | 1,017.56 | 7.86 | 7.71 | 1.52% |
Research Opportunities Fund |
Class A | 1,000.00 | 1,000.00 | 1,100.20 | 1,016.16 | 9.50 | 9.12 | 1.79% |
Class C | 1,000.00 | 1,000.00 | 1,096.50 | 1,012.36 | 13.47 | 12.93 | 2.55% |
Class I | 1,000.00 | 1,000.00 | 1,102.00 | 1,017.62 | 7.97 | 7.65 | 1.50% |
Class Y | 1,000.00 | 1,000.00 | 1,102.70 | 1,018.22 | 7.34 | 7.04 | 1.38% |
Global Fund |
Class A | 1,000.00 | 1,000.00 | 1,107.80 | 1,019.41 | 6.10 | 5.85 | 1.15% |
Class I | 1,000.00 | 1,000.00 | 1,109.80 | 1,020.88 | 4.57 | 4.38 | 0.86% |
Class Y | 1,000.00 | 1,000.00 | 1,110.80 | 1,021.48 | 3.93 | 3.77 | 0.74% |
International Fund |
Class A | 1,000.00 | 1,000.00 | 1,086.40 | 1,019.12 | 6.35 | 6.14 | 1.21% |
Class I | 1,000.00 | 1,000.00 | 1,088.00 | 1,020.60 | 4.81 | 4.66 | 0.91% |
Class Y | 1,000.00 | 1,000.00 | 1,088.50 | 1,021.20 | 4.18 | 4.04 | 0.79% |
Short Duration Fund |
Class A | 1,000.00 | 1,000.00 | 1,013.80 | 1,021.08 | 4.16 | 4.17 | 0.82% |
Class I | 1,000.00 | 1,000.00 | 1,016.10 | 1,022.53 | 2.70 | 2.70 | 0.53% |
Class Y | 1,000.00 | 1,000.00 | 1,015.70 | 1,023.14 | 2.09 | 2.09 | 0.41% |
Core Bond Fund |
Class A | 1,000.00 | 1,000.00 | 1,017.50 | 1,021.34 | 3.90 | 3.91 | 0.77% |
Class I | 1,000.00 | 1,000.00 | 1,018.90 | 1,022.80 | 2.43 | 2.43 | 0.48% |
Class Y | 1,000.00 | 1,000.00 | 1,020.40 | 1,023.40 | 1.82 | 1.82 | 0.36% |
DIAMOND HILL FUNDS | ANNUAL REPORT | DECEMBER 31, 2019 | DIAMOND-HILL.COM 183 |
Diamond Hill Funds
Schedule of Shareholder Expenses
Hypothetical Example of a $1,000 Investment at Beginning of Period
(Unaudited) (Continued)
| | Account value
at the beginning
of the period ($) | Account value
at the end
of the period ($) | Expenses paid
during
the period ($) | Funds annualized expense ratio (%) |
| Actual | Hypothetical | Actual | Hypothetical | Actual | Hypothetical | Actual |
Corporate Credit Fund |
Class A | 1,000.00 | 1,000.00 | 1,037.20 | 1,020.65 | 4.64 | 4.60 | 0.90% |
Class C | 1,000.00 | 1,000.00 | 1,033.40 | 1,016.86 | 8.48 | 8.41 | 1.65% |
Class I | 1,000.00 | 1,000.00 | 1,039.70 | 1,022.11 | 3.16 | 3.13 | 0.61% |
Class Y | 1,000.00 | 1,000.00 | 1,039.50 | 1,022.71 | 2.54 | 2.52 | 0.49% |
High Yield Fund |
Class A | 1,000.00 | 1,000.00 | 1,042.80 | 1,020.32 | 4.99 | 4.93 | 0.97% |
Class I | 1,000.00 | 1,000.00 | 1,045.10 | 1,021.78 | 3.50 | 3.46 | 0.68% |
Class Y | 1,000.00 | 1,000.00 | 1,045.70 | 1,022.38 | 2.89 | 2.85 | 0.56% |
* | Expenses are equal to the Fund’s annualized net expense ratio, multiplied by the average account value over the period, multiplied by the number of days in the most recent fiscal half-year divided by the number of days in the fiscal year (to reflect the one-half year period). |
You can find more information about the Fund’s expenses, including annual expense ratios for historical periods in the Financial Highlights section of this report. For additional information on operating expenses and other shareholder costs, please refer to the Fund’s prospectus. The prospectus presents hypothetical shareholder costs over various time periods based upon a $10,000 investment and a return of 5% a year. The standardized example, which appears in all mutual fund prospectuses, may be useful to you in comparing the costs of investing in different funds.
184 DIAMOND HILL FUNDS | ANNUAL REPORT | DECEMBER 31, 2019 | DIAMOND-HILL.COM |
Diamond Hill Funds
Management of the Trust
(Unaudited)
Listed in the charts below is basic information regarding the Trustees and Officers of the Trust.
INDEPENDENT TRUSTEES:
Name/Address/1
Age | Position(s)
Held with
Trust | Term of
Office2
and
Length
of Time
Served | Principal Occupation(s)
At Least The Last 5 Years | Number of
Portfolios
in Fund
Complex
Overseen
by Trustee | Other
Directorships
Held by
Trustee |
Tamara L. Fagely
Year of Birth: 1958 | Trustee | Since November 2014 | Retired, January 2014 to present; Chief Operations Officer, Hartford Funds, 2012 to 2013; Chief Financial Officer, Hartford Funds, 2010 to 2012; Treasurer, Hartford Funds, 2001 to 2012. | 13 | Allianz Variable Insurance Products Trust and Allianz Variable Insurance Products Fund of Funds Trust, December 2017 to present; AIM ETF Products Trust, February 2020 to present |
John T. Kelly-Jones
Year of Birth: 1960 | Trustee | Since May 2019 | Retired, December 2017 to present; Partner, COO and CCO, Independent Franchise Partners, LLP June 2009 to November 2017. | 13 | None |
Elizabeth P. Kessler
Year of Birth: 1968 | Trustee | Since November 2005 | Partner in Charge, Columbus Ohio Office, Jones Day, January 2009 to present. | 13 | None |
Nancy M. Morris
Year of Birth: 1952 | Trustee | Since May 2019 | Retired, August 2018 to present; Chief Compliance Officer, Wellington Management Company LLP April 2012 to July 2018. | 13 | The Arbitrage Funds, December 2018 to present, AltShares Trust January 2020 to present |
D’Ray Moore Rice
Year of Birth: 1959 | Chairperson Trustee | Since February 2014 Since August 2007 | Retired, Community Volunteer, November 2001 to present. | 13 | Advisors Investment Trust, July 2011 to present |
Peter E. Sundman Year of Birth: 1959 | Trustee | Since November 2012 | Retired, 2012 to present. | 13 | Artisan Partners Funds, Inc., January 2020 to present |
DIAMOND HILL FUNDS | ANNUAL REPORT | DECEMBER 31, 2019 | DIAMOND-HILL.COM 185 |
Diamond Hill Funds
Management of the Trust
(Unaudited) (Continued)
PRINCIPAL OFFICERS:
Name/Address/1
Age | Position(s)
Held with Trust | Term of Office and
Length of Time Served2 | Principal Occupation(s)
At Least The Last 5 Years |
Thomas E. Line Year of Birth: 1967 | Chief Executive Officer | Since November 2014 | Chief Financial Officer and Treasurer of Diamond Hill Investment Group, Inc., from January 2015 to present. Managing Director – Finance of Diamond Hill Investment Group, Inc., April 2014 to January 2015. |
Gary R. Young Year of Birth: 1969 | President | Since November 2014 | Secretary of the Trust, May 2004 to November 2014; Chief Administrative Officer of the Trust, October 2010 to November 2014; Managing Director — Administration of Diamond Hill Capital Management, Inc., January 2015 to present; Chief Compliance Officer of Diamond Hill Capital Management Inc., October 2010 to present; Controller of Diamond Hill Investment Group, Inc., April 2004 to March 2015. |
Karen R. Colvin Year of Birth: 1966 | Vice President Secretary | Since November 2011 Since November 2014 | Director-Fund Administration & Sales Support, Diamond Hill Capital Management, Inc., June 2009 to present. |
Maureen K. Goldenberg Year of Birth: 1968 | Chief Compliance Officer | Since October 2017 | Director-Compliance, Diamond Hill Capital Management, Inc., September 2017 to present; Chief Compliance Officer, Rockbridge Capital LLC, 2016 to 2017; Partner/Chief Compliance Officer North America Investments & Canada, Mercer Investments, Inc., 2015 to 2016; Vice President and Chief Compliance Officer, Fund Evaluation Group, LLC, 2011 to 2015. |
Julie A. Roach Year of Birth: 1971 | Treasurer | Since October 2017 | Director-Fund Administration, Diamond Hill Capital Management, Inc., September 2017 to present; Assistant Treasurer - Head of Valuation Oversight, J.P. Morgan Asset Management, August 2012 to 2017. |
1 | The address of each Trustee and Officer is 325 John H. McConnell Boulevard — Suite 200, Columbus, Ohio 43215. |
2 | Each Trustee is elected to serve in accordance with the Declaration of Trust and Bylaws of the Trust until their resignation, removal or retirement. Trustees have a 15-year term limit. Each Officer is elected by the Trustees for a 1-year term to serve the Trust or until their resignation, removal or retirement. |
The Statement of Additional Information contains additional information about the Trustees and is available without charge on www.diamond-hill.com or by calling 1-888-226-5595.
186 DIAMOND HILL FUNDS | ANNUAL REPORT | DECEMBER 31, 2019 | DIAMOND-HILL.COM |
(Page intentionally left blank)
DIAMOND HILL FUNDS | ANNUAL REPORT | DECEMBER 31, 2019 | DIAMOND-HILL.COM 187 |
(Page intentionally left blank)
188 DIAMOND HILL FUNDS | ANNUAL REPORT | DECEMBER 31, 2019 | DIAMOND-HILL.COM |
(Page intentionally left blank)
DIAMOND HILL FUNDS | ANNUAL REPORT | DECEMBER 31, 2019 | DIAMOND-HILL.COM 189 |

INVESTMENT ADVISER: DIAMOND HILL CAPITAL MANAGEMENT, INC.
DISTRIBUTOR: FORESIDE FINANCIAL SERVICES, LLC (MEMBER FINRA)
DIAMOND-HILL.COM | 855.255.8955 | 325 JOHN H. MCCONNELL BLVD | SUITE 200 | COLUMBUS, OHIO | 43215
DH-AR123119
Item 2. Code of Ethics.
The registrant has adopted a code of ethics that applies to the registrant's principal executive officer and principal financial officer. The registrant has not made any amendments to its code of ethics during the period covered by this report. The registrant has not granted any waivers from any provisions of the code of ethics during the period covered by this report. A copy of the registrant’s Code of Ethics is filed herewith.
Item 3. Audit Committee Financial Expert.
3(a)(1) The registrant’s board of directors has determined that the registrant has at least one audit committee financial expert serving on its audit committee.
3(a)(2) The audit committee financial expert is Ms. Tamara L. Fagely, who is “independent” for purposes of this Item 3 of Form N-CSR.
Item 4. Principal Accountant Fees and Services.
(a)Audit Fees. Audit fees totaled $201,000 and $201,000 in fiscal 2019 and 2018, respectively. 2019 and 2018 fees include fees associated with the annual audit and filings of the registrant’s Form N-1A and Form N-CEN.
(b)Audit-Related Fees. There were no audit-related fees in fiscal 2019 and 2018.
(c)Tax Fees. Fees for tax compliance services totaled $58,500 and $58,500 in fiscal 2019 and 2018, respectively.
(d)All Other Fees. All other fees totaled $8,494 and $0 in fiscal 2019 and 2018, respectively.
(e)(1)Audit Committee Pre-Approval Policies. The Audit Committee’s pre-approval policies describe the types of audit, audit-related, tax and other services that may receive the general pre-approval of the Audit Committee. The pre-approval policies provide that annual audit service fees, tax services not specifically granted pre-approval, services exceeding pre-approved cost levels and other services that have not received general pre-approval will be subject to specific pre-approval by the Audit Committee. The pre-approval policies further provide that the Committee may grant general pre-approval to other audit services (statutory audits and services associated with SEC registration statements, periodic reports and other documents filed with the SEC or other documents issued in connection with securities offerings), audit-related services (accounting consultations related to accounting, financial reporting or disclosure matters not classified as “audit services,” assistance with understanding and implementing new accounting and financial reporting guidance from rulemaking authorities, agreed-upon or expanded audit procedures related to accounting and/or billing records required to respond to or comply with financial, accounting or regulatory reporting matters and assistance with internal control reporting requirements under Form N-CEN and Form N-CSR), tax services that have historically been provided by the auditor that the Committee believes would not impair the independence of the auditor and are consistent with the SEC’s rules on auditor independence and permissible non-audit services classified as “all other services” that are routine and recurring services.
(e)(2) All of the services described in paragraphs (b) through (d) of Item 4 were approved by the Audit Committee.
(f) During the audit of registrant’s financial statements for the most recent fiscal year, less than 50 percent of the hours expended on the principal accountant’s engagement were attributed to work performed by persons other than the principal accountant’s full-time, permanent employee.
(g) The aggregate non-audit fees for services to the registrant, its investment adviser and any entity controlling, controlled by, or under common control with the adviser that provides ongoing services to the registrant were $37,000 and $71,000 in 2019 and 2018, respectively.
(h) The registrant's audit committee of the board of trustees has considered whether the provision of non-audit services that were rendered to the registrant's investment adviser (not including any sub-adviser whose role is primarily portfolio management and is subcontracted with or overseen by another investment adviser), and any entity adviser that provides ongoing services to the registrant that were not pre-approved pursuant to paragraph (c)(7)(ii) of Rule 2-01 of Regulation S-X is compatible with maintaining the principal accountant's independence.
Item 5. Audit Committee of Listed Registrants.
Not applicable.
Item 6. Schedule of Investments.
(a) The Schedule of Investments is included in the Annual Report to Shareholders filed under Item 1 of this Form.
(b) Not applicable.
Item 7. Disclosure of Proxy Voting Policies and Procedures for Closed-End Management Investment Companies.
Not applicable.
Item 8. Portfolio Managers of Closed-End Management Investment Companies.
Not applicable.
Item 9. Purchases of Equity Securities by Closed-End Management Investment Company and Affiliated Purchasers.
Not applicable.
Item 10. Submission of Matters to a Vote of Security Holders.
Not applicable.
Item 11. Controls and Procedures.
(a)The registrant’s principal executive officer and principal financial officer have concluded, based on their evaluation of the registrant's disclosure controls and procedures as conducted within 90 days of the filing date of this report, that these disclosure controls and procedures are adequately designed and are operating effectively to ensure that information required to be disclosed by the registrant on Form N-CSR is recorded, processed, summarized and reported within the time periods specified in the Securities and Exchange Commission's rules and forms.
(b)There were no changes in the registrant’s internal control over financial reporting (as defined in Rule 30a-3(d) under the Act (17 CFR 270.30a-3(d))) that occurred during the second fiscal quarter of the period covered by this report that have materially affected or are reasonably likely to materially affected, the registrant’s internal control over financial reporting.
Item 12. Disclosure of Securities Lending Activities for Closed-End Management Investment Companies.
Not applicable.
Item 13. Exhibits.
| (a)(1) | | Code of Ethics for Senior Financial Officers is filed herewith. |
| | | |
| (a)(2) | | A separate certification for each principal executive officer and principal financial officer of the registrant as required by Rule 30a-2(a) under the Act (17 CFR 270.30a-2(a)): Attached hereto |
| | | |
(a)(3) (a)(4) | | Not applicable. Change in the registrant’s independent public accountants: Not applicable |
| | | |
| (b) | | Certification required by Rule 30a-2(b) under the Act (17 CFR 270.30a-2(b)): Attached hereto |
SIGNATURES
Pursuant to the requirements of the Securities Exchange Act of 1934 and the Investment Company Act of 1940, the registrant has duly caused this report to be signed on its behalf by the undersigned, thereunto duly authorized.
| Registrant | Diamond Hill Funds | |
| | | |
| By (Signature and Title) | /s/ Thomas E. Line | |
| | Thomas E. Line, Chief Executive Officer | |
| | | |
| Date: | February 20, 2020 | |
Pursuant to the requirements of the Securities Exchange Act of 1934 and the Investment Company Act of 1940, this report has been signed below by the following persons on behalf of the registrant and in the capacities and on the dates indicated.
| By (Signature and Title) | /s/ Thomas E. Line | |
| | Thomas E. Line, Chief Executive Officer | |
| | | |
| Date: | February 20, 2020 | |
| | | |
| By (Signature and Title) | /s/ Julie A. Roach | |
| | Julie A. Roach, Principal Financial Officer | |
| | | |
| Date: | February 20, 2020 | |