UNITED STATES
SECURITIES AND EXCHANGE COMMISSION
Washington, D.C. 20549
FORM N-CSR
CERTIFIED SHAREHOLDER REPORT OF REGISTERED
MANAGEMENT INVESTMENT COMPANIES
| Investment Company Act file number: | 811-08061 | |
Diamond Hill Funds
(Exact name of registrant as specified in charter)
| 325 John H. McConnell Boulevard, Suite 200, Columbus, Ohio | 43215 |
| (Address of principal executive offices) | (Zip code) |
Thomas E. Line, 325 John H. McConnell Boulevard, Suite 200, Columbus, Ohio 43215
(Name and address of agent for service)
| Registrant’s telephone number, including area code: | 614-255-3333 | |
| Date of fiscal year end: | December 31 | |
| Date of reporting period: | December 31, 2017 | |
Item 1. Reports to Stockholders.

Letter to Shareholders | 1 |
Mission and Guiding Principles | 4 |
| | |
Management Discussion of Fund Performance (Unaudited) | |
Diamond Hill Small Cap Fund | 6 |
Diamond Hill Small-Mid Cap Fund | 9 |
Diamond Hill Mid Cap Fund | 12 |
Diamond Hill Large Cap Fund | 15 |
Diamond Hill All Cap Select Fund | 18 |
Diamond Hill Long-Short Fund | 21 |
Diamond Hill Research Opportunities Fund | 24 |
Diamond Hill Financial Long-Short Fund | 27 |
Diamond Hill Short Duration Total Return Fund | 30 |
Diamond Hill Core Bond Fund | 32 |
Diamond Hill Corporate Credit Fund | 34 |
Diamond Hill High Yield Fund | 37 |
| | |
Financial Statements | |
Schedules of Investments | 40 |
Statements of Assets & Liabilities | 88 |
Statements of Operations | 91 |
Statements of Changes in Net Assets | 94 |
Financial Highlights | 106 |
Notes to Financial Statements | 130 |
Report of Independent Registered Accounting Firm | 147 |
Other Items | 149 |
Schedule of Shareholder Expenses | 153 |
Management of the Trust | 156 |
Cautionary Statement: At Diamond Hill, we pledge that, “we will communicate with our clients about our investment performance in a manner that will allow them to properly assess whether we are deserving of their trust.” Our views and opinions regarding the investment prospects of our portfolio holdings and Funds are “forward looking statements” which may or may not be accurate over the long term. While we believe we have a reasonable basis for our opinions, actual results may differ materially from those we anticipate. Information provided in this report should not be considered a recommendation to purchase or sell any particular security.
You can identify forward looking statements by words like “believe,” “expect,” “anticipate,” or similar expressions when discussing prospects for particular portfolio holdings and/or one of the Funds. We cannot assure future results. You should not place undue reliance on forward-looking statements, which speak only as of the date of this report. We disclaim any obligation to update or alter any forward-looking statements, whether as a result of new information, future events, or otherwise.
This material is not authorized for distribution to prospective investors unless preceded or accompanied by a Prospectus. Investors should consider the investment objectives, risks, charges, and expenses of the Diamond Hill Funds carefully before investing. The prospectus or summary prospectus contain this and other important information about the Fund(s) and are available at diamond-hill.com or by calling 888.226.5595. Please read the prospectus or summary prospectus carefully before investing. The Diamond Hill Funds are distributed by l Services, LLC (Member FINRA). Diamond Hill Capital Management, Inc., a registered investment adviser, serves as Investment Adviser to the Diamond Hill Funds and is paid a fee for its services. Diamond Hill Funds are not FDIC insured, may lose value, and have no bank guarantee.
Dear Fellow Shareholders:
We are pleased to provide you with this year-end update for the Diamond Hill Funds.
2017 was an extremely strong year for U.S. equity markets, with all major indices finishing the year at all-time highs. A major theme in 2017 was the performance of growth over value, a gap which continued to widen as the year went on. Investors placed a premium on growth which propelled the Russell 1000 Growth Index to a more than 16% lead over the Russell 1000 Value Index. This environment makes it more challenging for long-term intrinsic value managers like Diamond Hill to outperform our respective benchmarks.
Additionally, the ongoing discussion around active versus passive management continued in 2017. We continue to believe that Diamond Hill strategies will outperform their respective passive benchmarks over a full market cycle, supported by a shared commitment to our intrinsic value-based investment philosophy, long-term perspective, disciplined approach, and alignment with our clients’ interests.
Absolute returns for all of our investment strategies were positive in 2017, and as of December 31, 2017 the since-inception returns for nearly all of our strategies exceeded their respective benchmark returns. Our Mid Cap, Short Duration Total Return, Core Bond, and High Yield strategies have less than a five-year track record and, as always, we remain focused on five-year periods to evaluate our results.
2017 Financial Markets
Following a volatile 2016, U.S. equity markets remained on a steady upward trend throughout 2017. Despite a number of geopolitical events and uncertainty in Washington, stocks experienced one of the lowest levels of volatility in history.
As mentioned above, growth drastically outperformed value and sector performance further explains this gap: the Russell 1000 Growth has more than 50% of its weight in technology and health care stocks which both outperformed in 2017, while the Russell 1000 Value is heavily weighted in underperforming sectors (energy, telecommunication, and consumer staples).
For the full year, information technology was the top-performing sector (+38.45%), significantly outperforming the Russell 1000 (+21.69%). The consumer discretionary, materials, health care, financials, and industrials sectors all delivered returns above 20%.
While equities soared in 2017, the yield on longer-term U.S. Treasury bonds remained low. The yield curve continued to flatten throughout the year, with the shorter end of the curve climbing and the longer end contracting.
Both investment grade and high yield corporate bonds performed well in 2017. High yield benefited from a default rate that declined materially during the year to a level below half the historic average. Like most other major asset classes, volatility in the high yield market was muted during 2017.
DIAMOND HILL FUNDS | ANNUAL REPORT | DECEMBER 31, 2017 | DIAMOND-HILL.COM 1 |
The Federal Reserve began the process of normalizing interest rates and monetary policy, increasing the federal funds rate three times during the year and indicating plans for three additional increases in 2018.
Outlook
Assessing the impact of macroeconomic factors has been a more important part of estimating the long-term intrinsic value of companies in recent years; however, it is still just one of many factors that we consider. As always, bottom-up analysis is of primary importance in estimating the intrinsic value of an individual company, which includes both valuation and business fundamentals.
Low interest rates, high corporate profit margins, and steady economic growth with low inflation have continued to contribute to historically high stock valuations. Despite high valuations and extremely low volatility, we see no immediate signs of fundamental excess. Business fundamentals are strong and corporate profit margins are near all-time highs.
High valuations make it more challenging for us to find opportunities to add new names to our equity portfolios. In this environment, where the discount to our estimate of intrinsic value is likely to be narrower, we have focused on maintaining or upgrading the quality of the names we own. When evaluating new and current positions with a smaller discount to our estimate of intrinsic value, we remain focused on assessing risk, which we define as permanent loss of capital.
At current valuation levels, we’ve historically seen annual stock market returns of 5% or less. We continue to expect positive but below-average equity market returns over the next five years. Prospective returns are likely to be tempered by the combination of above-average price/earnings multiples applied to already very strong levels of corporate profit margins.
Corporate tax reform is likely to boost earnings growth in the near term with most U.S. companies benefiting from a reduced tax burden. In addition, repatriation of cash held overseas and a more competitive tax regime may lead to increased levels of investment in the United States. However, we believe that for most companies, these benefits will largely be competed away over the longer term. Our research team is evaluating the impact of tax reform on a company-by-company basis and updating our estimates of intrinsic value accordingly.
Spread levels in both the investment grade and high yield credit markets remain compressed as investors continue their search for yield. As such, we believe strong fundamental analysis and a focus on long-term company and collateral performance are the keys to security selection in our fixed income strategies.
2 DIAMOND HILL FUNDS | ANNUAL REPORT | DECEMBER 31, 2017 | DIAMOND-HILL.COM |
We believe we can achieve better-than-market returns over the next five years through active portfolio management, and our primary focus is always on achieving value-added results for our existing clients. Our intrinsic value investment philosophy is shared by all of our portfolio managers and research analysts, allowing us to apply our investment discipline consistently across strategies.
Thank you for your continued support.
Diamond Hill Capital Management, Inc.

| 
| 
|
Chris Welch, CFA
Co-Chief Investment Officer | Austin Hawley, CFA
Co-Chief Investment Officer | Bill Zox, CFA
Chief Investment Officer –
Fixed Income |
The views expressed are those of the portfolio managers as of December 31, 2017, are subject to change, and may differ from the views of other portfolio managers or the firm as a whole. These opinions are not intended to be a forecast of future events, a guarantee of future results, or investment advice. All data referenced are from sources deemed to be reliable but cannot be guaranteed. Securities and sectors referenced should not be construed as a solicitation or recommendation or be used as the sole basis for any investment decision.
The Russell 1000 Growth Index is created by selecting the 1000 largest U.S. common stocks within the Russell 3000 Growth Index. The index is used to provide a gauge of the performance of growth stocks in the U.S. Companies within the Russell 3000 Index that exhibit higher price-to-book and forecasted earnings are used to form the Russell 3000 Growth Index.
The Russell 1000 Value Index is created by selecting the 1000 largest U.S. common stocks within the Russell 3000 Value Index. The index is used to provide a gauge of the performance of value stocks in the U.S. Companies within the Russell 3000 Index that exhibit lower price-to-book ratios and lower expected growth rates are used to form the Russell 3000 Value Index.
These indexes do not incur fees and expenses (which would lower the return) and are not available for direct investment.
DIAMOND HILL FUNDS | ANNUAL REPORT | DECEMBER 31, 2017 | DIAMOND-HILL.COM 3 |
Our Mission
At Diamond Hill, we serve our clients by providing investment strategies that deliver lasting value through a shared commitment to our intrinsic value-based investment philosophy, long-term perspective, disciplined approach and alignment with our clients’ interests.
VALUE
We believe market price and intrinsic value are independent in the short-term but tend to converge over time.
LONG-TERM
We maintain a long-term focus both in investment analysis and management of our business.
DISCIPLINE
We invest with discipline to increase potential return and protect capital.
PARTNERSHIP
We align our interests with those of our clients through significant personal investment in our strategies.
4 DIAMOND HILL FUNDS | ANNUAL REPORT | DECEMBER 31, 2017 | DIAMOND-HILL.COM |
The Guiding Principles of our Intrinsic Value Philosophy |
| | ● | Recognize that market price and intrinsic value tend to converge over a reasonable period of time |
| | ● | Possess a long-term investment temperament (five years or longer) |
| | ● | Only invest when the market price is below (above for short positions) intrinsic value |
| | ● | Treat every investment as a partial ownership interest in that company |
Our intrinsic value philosophy is shared by all of our portfolio managers and research analysts, allowing us to apply our investment discipline consistently across all equity and fixed income strategies.
Each portfolio is supported by our entire research team, all of whom are dedicated to bottom-up, fundamental analysis and provide research coverage across the capital structure. Each team member covers small, mid and large capitalization companies, long and short opportunities, equity and debt, as well as global and domestic companies.
We believe we can achieve better-than-market returns over the long term through active portfolio management, and our primary focus is always on achieving value-added results for our clients.
DIAMOND HILL FUNDS | ANNUAL REPORT | DECEMBER 31, 2017 | DIAMOND-HILL.COM 5 |
Management Discussion of Fund Performance (Unaudited) |
Diamond Hill Small Cap Fund
2017 Portfolio Commentary
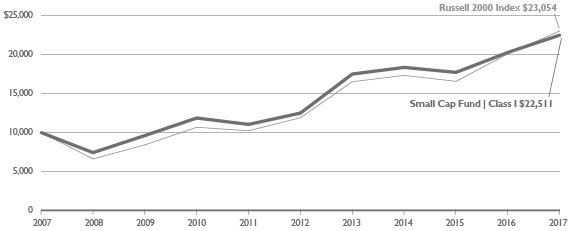
In 2017, the Diamond Hill Small Cap Fund (Class I) returned 10.95%, trailing the Russell 2000 Index return of 14.65% by 370 basis points. In 2017, there was a large divergence between growth and value style indices. The Russell 2000 Growth Index returned 22.17%, while the Russell 2000 Value Index returned just 7.84%. Through the 17-year history of the Diamond Hill Small Cap Fund, the Fund has generated an annualized return of 11.02%, above the Russell 2000 Index return of 8.47%, by following an intrinsic value approach to investing.
In a rough attribution of the year’s performance relative to the Index, there were four areas that contributed to the underperformance:
| | 1. | A relative lack of exposure to the health care sector, which was by far the best performing sector. |
| | 2. | An average cash balance in the mid-teens as a percentage of net assets. |
| | 3. | A relative lack of exposure to the information technology and materials sectors, both of which returned slightly above the Index average. |
| | 4. | Poor security selection in the consumer staples sector, including portfolio holding Edgewell Personal Care which declined 18% and B&G Foods which declined 15%. |
Partially offsetting these factors were the following:
| | 1. | Very strong security selection in consumer discretionary stocks including Live Nation Entertainment, Red Rock Resorts, Vail Resorts, Aaron’s, and Carter’s. |
| | 2. | An overweight position and decent stock selection in the industrials sector. |
| | 3. | The acquisition of Fortress Investment Group by Softbank and the purchase of Alere by Abbott at a renegotiated price of $51 per share, down from $56. |
In 2016, it was noted that four stocks – Avis Budget Group, DST Systems, Carter’s, and Live Nation Entertainment – had lagged the Index materially during the year despite fundamentals we believed to be performing in line with our internal expectations. Each of these stocks increased materially in 2017.
Live Nation continues to dominate in both live music concert promotion and ticketing. Through the first nine months of 2017, the company saw concert revenues increase 19%, ticketing revenue increase 16%, and the very profitable sponsorship and advertising revenue increase 20%, with each division recording increases in operating profit as well. For the year, Live Nation’s stock price increased 60%.
Avis Budget Group continues to be the largest holding in the Fund. Avis Budget saw fundamentals deteriorate meaningfully in the first half of the year and a declining stock price before posting better results for the third quarter. Industry over-fleeting led year-over-year pricing comparisons
6 DIAMOND HILL FUNDS | ANNUAL REPORT | DECEMBER 31, 2017 | DIAMOND-HILL.COM |
Diamond Hill Small Cap Fund |
to decline in the Americas in the first half of the year, despite facing significant increases in unit fleet costs as residual values declined. The company also noted that Florida demand did not materialize as expected in the winter months. Pricing turned positive in the third quarter, leading to roughly flat EBITDA compared to the same period in 2016, and forward commentary and data suggests that the industry fleet size will enter 2018 in better balance. Avis Budget’s stock price increased about 20% for the year.
DST Systems had a total return of approximately 17% in 2017, and more importantly announced an agreement to be acquired by SS&C Technologies Holdings for a substantial premium in early 2018. Carter’s, which has a hybrid wholesale and retail model, returned approximately 38% in 2017. While we have largely avoided retail companies, we believe Carter’s does occupy a strong niche in children’s clothes and has shown the ability to increase earnings consistently on both revenue growth and margin expansion.
In addition, Trinity Industries delivered a 37% total return for the year. The company had a materially negative verdict in a false claims act case reversed, allowing it to resume repurchasing shares. The company later announced its intention to separate into two businesses by spinning off its barge, construction products, and wind energy divisions from its railcar manufacturing and leasing businesses. Bioscrip was up 180% for the year, recovering from steep share price losses by showing some progress in cutting costs leading to higher EBITDA.
On the negative side, Navigators Group fell about 17% for the year after experiencing negative reserve developments in certain long-tail business lines. Popular, a Puerto Rican bank, also fell 17% due to fears of further economic losses on the island following the damage brought by Hurricane Maria. Several real estate companies declined during the year, likely due in part to higher Treasury interest rates. iStar fell 9%, Colony Northstar fell 15%, and Tanger Factory Outlet Centers, which also saw some tenant bankruptcies during the year, fell 22%. Lastly, Alaska Air Group was down about 16% as there are some concerns about unit revenues in the very competitive West Coast markets. The company also will see increases in pilot costs after the latest contract negotiation, which should lead to 2017 being the first year of earnings decline for the company in quite some time. However, we believe it is a quality airline that can resume growth and it now trades at roughly 10x earnings, dramatically lower than the overall market.
Energy was the only sector in the Russell 2000 Index that declined during the year, and both our weighting and security selection in the sector performed similarly to that of the Index.
Thank you for your continued support.

Tom Schindler, CFA
Portfolio Manager
DIAMOND HILL FUNDS | ANNUAL REPORT | DECEMBER 31, 2017 | DIAMOND-HILL.COM 7 |
Diamond Hill Small Cap Fund |
AVERAGE ANNUAL TOTAL RETURNS AS OF DECEMBER 31, 2017
| Inception
Date | One
Year | Three
Years | Five
Years | Ten
Years | Expense
Ratio* |
PERFORMANCE AT NAV WITHOUT SALES CHARGES |
Class A Shares | 12/29/2000 | 10.62% | 6.71% | 12.17% | 8.12% | 1.27% |
Class C Shares | 2/20/2001 | 9.80 | 5.91 | 11.33 | 7.32 | 2.02 |
Class I Shares | 4/29/2005 | 10.95 | 7.02 | 12.48 | 8.45 | 0.98 |
Class Y Shares | 12/30/2011 | 11.06 | 7.13 | 12.62 | 8.38 | 0.86 |
BENCHMARK |
Russell 2000 Index | | 14.65 | 9.96 | 14.12 | 8.71 | — |
PERFORMANCE AT PUBLIC OFFERING PRICE INCLUDING SALES CHARGES** |
Class A Shares | 12/29/2000 | 5.09 | 4.90 | 11.03 | 7.57 | 1.27 |
Class C Shares | 2/20/2001 | 8.80 | 5.91 | 11.33 | 7.32 | 2.02 |
| * | Reflects the expense ratio as reported in the Prospectus dated February 28, 2018. |
| ** | The maximum sales charge for Class A shares on purchases and for Class C shares on certain redemptions are 5.00% and 1.00%, respectively. |
GROWTH OF $10,000
Comparison of the change in value of a $10,000 Investment in the Diamond Hill Small Cap Fund Class I(A) and the Russell 2000 Index.
(A) | The growth of $10,000 chart represents the performance of Class I shares only, which will vary from the performance of Class A, Class C and Class Y shares based on the difference in loads and fees paid by shareholders in the different classes. |
| The performance of the above Fund does not reflect the deduction of taxes that a shareholder would pay on Fund distributions or the redemption of Fund shares. |
| The chart above represents a comparison of a hypothetical $10,000 investment and the reinvestment of dividends and capital gains in the indicated share class versus a similar investment in the Russell 2000 Index (“Index”). The Index is a market capitalization-weighted index measuring performance of the smallest 2,000 companies, on a market capitalization basis, in the Russell 3000 Index. The Index is unmanaged, and does not reflect the deduction of fees associated with a mutual fund such as investment management and accounting fees. The Fund’s performance reflects the deduction of fees for these services. Investors cannot invest directly in an index although they can invest in the underlying securities. |
| Historical performance for Class Y shares prior to its inception is based on the performance of Class A shares. Class Y performance has been adjusted to reflect differences in sales charges and expenses between classes. |
| Past performance does not guarantee future results. The performance data quoted represents past performance and current returns may be lower or higher. The investment return and principal value will fluctuate so that an investor’s shares, when redeemed, may be worth more or less than the original cost. To obtain performance information current to the most recent month end, please visit www.diamond-hill.com. |
8 DIAMOND HILL FUNDS | ANNUAL REPORT | DECEMBER 31, 2017 | DIAMOND-HILL.COM |
Diamond Hill Small-Mid Cap Fund |
2017 Portfolio Commentary
The Diamond Hill Small-Mid Cap Fund (Class I) gained 8.63% in 2017 compared to a 16.81% increase in the benchmark Russell 2500 Index. For the five-year period ended December 31, 2017, the Fund’s return was 14.61% annually while the Russell 2500 Index returned 14.33% over the same period. In the 12 years since inception, the Fund’s annualized return of 9.46% outpaced the 9.10% benchmark return. 2017 relative results were driven by unfavorable stock selection in the consumer staples, health care, and information technology sectors, partially offset by favorable stock selection in the consumer discretionary sector. The unfavorable relative stock selection in many cases was not so much due to big losses in our holdings, but rather big gains in stocks in the benchmark that we did not own. For example, all of our technology stocks were positive for the year, but the average return of our holdings in the sector significantly trailed the average return of technology stocks in the benchmark.
It has been a very difficult environment in which to find attractively valued new ideas for the portfolio. This view is supported by the high levels of valuation in the broad stock market, but more specifically it is the result of our bottom-up, security-by-security search for investments. In such an environment, there are three primary ways of responding: 1) allow the cash weight to increase; 2) buy some stocks earlier, or at smaller discounts to our estimates of intrinsic value, than we otherwise would; 3) continue to own some securities longer, or at more narrow discounts to our intrinsic value estimates, than we would in what we might perceive as a more “normal” environment. During 2017, we did a little bit of each of these.
In terms of cash, we have managed the portfolio to a 10% limit on cash for a number of years. While the cash level bounced around in the 9-10% range during most of the year, we intend to maintain that limit and do not foresee increasing cash above that level. As a reminder, we have quickly deployed cash in the past when we saw appealing ideas present themselves, such as during the third quarter of 2011 and late summer of 2015.
In a couple of cases, we bought new stocks for the portfolio at prices reflecting modestly narrower discounts to our intrinsic value estimates than we would have liked, all things equal. In two of those cases – Bermuda-based insurance and reinsurance company Validus Holdings and student housing real estate investment trust American Campus Communities – the stock prices subsequently fell and we added to our positions.
We also continued to own larger positions than we otherwise might have in some high-quality companies such as Boston Scientific, Willis Towers Watson, and NVR. We trimmed our position in all of these stocks at some point over the past couple of years, but we continue to own sizable positions in each. Our experience has been that companies with strong business fundamentals, talented management teams, and a reasonable degree of differentiation from the competition have often been able to compound returns at attractive rates over time. Nevertheless, we still maintain a strong focus on valuation and will only own stocks which we continue to believe trade at a discount to our estimates of their intrinsic value.
DIAMOND HILL FUNDS | ANNUAL REPORT | DECEMBER 31, 2017 | DIAMOND-HILL.COM 9 |
Diamond Hill Small-Mid Cap Fund |
It is possible that we have been too cautious in our appraisal of value for some companies we have considered. Certainly, we missed some near-term investment opportunities in 2017, as stocks which we hoped to buy at prices 5-10% lower than their market price ended up appreciating 10-20% from those levels while we watched from the sidelines. I recall similar trends in the markets of 1999 and 2006-2007. We believe our valuation discipline will pay off in the long term.
I’d like to once again highlight our excellent team of analysts and research associates who work hard to generate ideas and deliver strong returns to clients. Their breadth and depth of research allows us to maintain at all times a portfolio that we believe is best positioned to deliver favorable returns to you over the next five years.
The stock market responded favorably to continued steady growth both in the economy and corporate profits, as well as to the tax reform bill which will have a positive impact on earnings. These positives were undiminished by any increase in interest rates in 2017, as 10-year bond yields were approximately flat for the year. The current historically high stock market valuation levels incorporate a lot of good news into stock prices. As such, we have emphasized investing in companies where we believe there is low risk of permanent loss of investor capital. By limiting the frequency and magnitude of losses, we increase the odds that we will have enough successful investments to outperform both the benchmark and peers over longer time periods.
We appreciate your ongoing support and look forward to continuing to work with you in the coming years.

Chris Welch, CFA
Portfolio Manager
10 DIAMOND HILL FUNDS | ANNUAL REPORT | DECEMBER 31, 2017 | DIAMOND-HILL.COM |
Diamond Hill Small-Mid Cap Fund |
AVERAGE ANNUAL TOTAL RETURNS AS OF DECEMBER 31, 2017
| Inception
Date | One
Year | Three
Years | Five
Years | Ten
Years | Expense
Ratio* |
PERFORMANCE AT NAV WITHOUT SALES CHARGES |
Class A Shares | 12/30/2005 | 8.35% | 8.83% | 14.30% | 10.09% | 1.22% |
Class C Shares | 12/30/2005 | 7.49 | 8.02 | 13.45 | 9.28 | 1.97 |
Class I Shares | 12/30/2005 | 8.63 | 9.16 | 14.61 | 10.43 | 0.93 |
Class Y Shares | 12/30/2011 | 8.77 | 9.27 | 14.78 | 10.36 | 0.81 |
BENCHMARK |
Russell 2500 Index | | 16.81 | 10.07 | 14.33 | 9.22 | — |
PERFORMANCE AT PUBLIC OFFERING PRICE INCLUDING SALES CHARGES** |
Class A Shares | 12/30/2005 | 2.95 | 6.99 | 13.14 | 9.53 | 1.22 |
Class C Shares | 12/30/2005 | 6.49 | 8.02 | 13.45 | 9.28 | 1.97 |
| * | Reflects the expense ratio as reported in the Prospectus dated February 28, 2018. |
| ** | The maximum sales charge for Class A shares on purchases and for Class C shares on certain redemptions are 5.00% and 1.00%, respectively. |
GROWTH OF $10,000
Comparison of the change in value of a $10,000 Investment in the Diamond Hill Small-Mid Cap Fund Class I(A) and the Russell 2500 Index.

| (A) | The growth of $10,000 chart represents the performance of Class I shares only, which will vary from the performance of Class A, Class C and Class Y shares based on the difference in loads and fees paid by shareholders in the different classes. |
| The performance of the above Fund does not reflect the deduction of taxes that a shareholder would pay on Fund distributions or the redemption of Fund shares. |
| The chart above represents a comparison of a hypothetical $10,000 investment and the reinvestment of dividends and capital gains in the indicated share class versus a similar investment in the Russell 2500 Index (“Index”). The Index is a market capitalization-weighted index measuring performance of the smallest 2,500 companies, on a market capitalization basis, in the Russell 3000 Index. The Index is unmanaged, and does not reflect the deduction of fees associated with a mutual fund such as investment management and accounting fees. The Fund’s performance reflects the deduction of fees for these services. Investors cannot invest directly in an index although they can invest in the underlying securities. |
| Historical performance for Class Y shares prior to its inception is based on the performance of Class A shares. Class Y performance has been adjusted to reflect differences in sales charges and expenses between classes. |
| Past performance does not guarantee future results. The performance data quoted represents past performance and current returns may be lower or higher. The investment return and principal value will fluctuate so that an investor’s shares, when redeemed, may be worth more or less than the original cost. To obtain performance information current to the most recent month end, please visit www.diamond-hill.com. |
DIAMOND HILL FUNDS | ANNUAL REPORT | DECEMBER 31, 2017 | DIAMOND-HILL.COM 11 |
Diamond Hill Mid Cap Fund |
2017 Portfolio Commentary
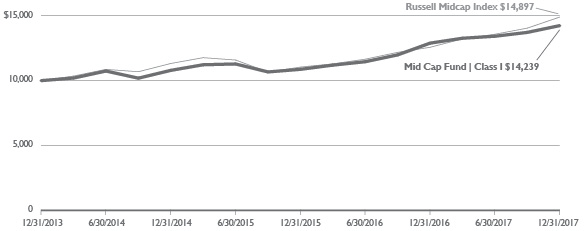
The Diamond Hill Mid Cap Fund (Class I) gained 10.47% in 2017 compared to an 18.52% increase in the benchmark Russell Midcap Index. For the four-year period since inception, the Fund’s return was 9.24% annually while the Russell Midcap Index returned 10.48% over the same period. 2017 relative results were driven by unfavorable stock selection in the information technology, financials and consumer staples sectors, partially offset by favorable stock selection in the consumer discretionary sector. The unfavorable relative stock selection in many cases was not so much due to big losses in our holdings, but rather big gains in stocks in the benchmark that we did not own. For example, all of our technology stocks were positive for the year, but the average return of our holdings in the sector significantly trailed the average return of technology stocks in the benchmark.
It has been a very difficult environment in which to find attractively valued new ideas for the portfolio. This view is supported by the high levels of valuation in the broad stock market, but more specifically it is the result of our bottom-up, security-by-security search for investments. In such an environment, there are three primary ways of responding: 1) allow the cash weight to increase; 2) buy some stocks earlier, or at smaller discounts to our estimates of intrinsic value, than we otherwise would; 3) continue to own some securities longer, or at more narrow discounts to our intrinsic value estimates, than we would in what we might perceive as a more “normal” environment. During 2017, we did a little bit of each of these.
In terms of cash, we have managed the portfolio to a 10% limit on cash for a number of years. While the cash level bounced around in the 9-10% range during most of the year, we intend to maintain that limit and do not foresee increasing cash above that level. As a reminder, we have quickly deployed cash in the past when we saw appealing ideas present themselves, such as during the late summer of 2015.
In a few cases, we bought new stocks for the portfolio at prices reflecting modestly narrower discounts to our intrinsic value estimates than we would have liked, all things equal. In the case of data analytics provider Verisk Analytics, this worked out well as the stock gained nearly 15% following our purchase. However, with Bermuda-based insurance and reinsurance company Validus Holdings and student housing real estate investment trust American Campus Communities, the stock prices subsequently fell and we added to our positions.
We also continued to own larger positions than we otherwise might have in some high-quality companies such as Boston Scientific, Willis Towers Watson, and NVR. We trimmed our position in all of these stocks at some point over the past couple of years, but we continue to own sizable positions in each. Our experience has been that companies with strong business fundamentals, talented management teams, and a reasonable degree of differentiation from the competition have often been able to compound returns at attractive rates over time. Nevertheless, we still maintain a strong focus on valuation and will only own stocks which we continue to believe trade at a discount to our estimates of their intrinsic value.
12 DIAMOND HILL FUNDS | ANNUAL REPORT | DECEMBER 31, 2017 | DIAMOND-HILL.COM |
Diamond Hill Mid Cap Fund |
It is possible that we have been too cautious in our appraisal of value for some companies we have considered. Certainly, we missed some near-term investment opportunities in 2017, as stocks which we hoped to buy at prices 5-10% lower than their market price ended up appreciating 10-20% from those levels while we watched from the sidelines. I recall similar trends in the markets of 1999 and 2006-2007. We believe our valuation discipline will pay off in the long term.
I’d like to once again highlight our excellent team of analysts and research associates who work hard to generate ideas and deliver strong returns to clients. Their breadth and depth of research allows us to maintain at all times a portfolio that we believe is best positioned to deliver favorable returns to you over the next five years.
The stock market responded favorably to continued steady growth both in the economy and corporate profits, as well as to the tax reform bill which will have a positive impact on earnings. These positives were undiminished by any increase in interest rates in 2017, as 10-year bond yields were approximately flat for the year. The current historically high stock market valuation levels incorporate a lot of good news into stock prices. As such, we have emphasized investing in companies where we believe there is low risk of permanent loss of investor capital. By limiting the frequency and magnitude of losses, we increase the odds that we will have enough successful investments to outperform both the benchmark and peers over longer time periods.
We appreciate your ongoing support and look forward to continuing to work with you in the coming years.

Chris Welch, CFA
Portfolio Manager
DIAMOND HILL FUNDS | ANNUAL REPORT | DECEMBER 31, 2017 | DIAMOND-HILL.COM 13 |
Diamond Hill Mid Cap Fund |
AVERAGE ANNUAL TOTAL RETURNS AS OF DECEMBER 31, 2017
| Inception
Date | One
Year | Three
Years | Since Inception (12/31/13) | Expense
Ratio* |
PERFORMANCE AT NAV WITHOUT SALES CHARGES |
Class A Shares | 12/31/2013 | 10.13% | 9.38% | 8.92% | 1.07% |
Class I Shares | 12/31/2013 | 10.47 | 9.68 | 9.24 | 0.78 |
Class Y Shares | 12/31/2013 | 10.51 | 9.79 | 9.35 | 0.66 |
BENCHMARK |
Russell Midcap Index | | 18.52 | 9.58 | 10.48 | — |
PERFORMANCE AT PUBLIC OFFERING PRICE INCLUDING SALES CHARGES** |
Class A Shares | 12/31/2013 | 4.65 | 7.53 | 7.53 | 1.07 |
| * | Reflects the expense ratio as reported in the Prospectus dated February 28, 2018. |
| ** | The maximum sales charge for Class A shares on purchases is 5.00%. |
GROWTH OF $10,000
Comparison of the change in value of a $10,000 Investment in the Diamond Hill Mid Cap Fund Class I(A) and the Russell Midcap Index.
(A) | The growth of $10,000 chart represents the performance of Class I shares only, which will vary from the performance of Class A and Class Y shares based on the difference in loads and fees paid by shareholders in the different classes. |
| The performance of the above Fund does not reflect the deduction of taxes that a shareholder would pay on Fund distributions or the redemption of Fund shares. |
| The chart above represents a comparison of a hypothetical $10,000 investment and the reinvestment of dividends and capital gains in the indicated share class versus a similar investment in the Russell Midcap Index (“Index”). The Index is a market capitalization-weighted index measuring performance of the 800 smallest companies in the Russell 1000 Index. The Index is unmanaged, and does not reflect the deduction of fees associated with a mutual fund such as investment management and accounting fees. The Fund’s performance reflects the deduction of fees for these services. Investors cannot invest directly in an index although they can invest in the underlying securities. |
| Past performance does not guarantee future results. The performance data quoted represents past performance and current returns may be lower or higher. The investment return and principal value will fluctuate so that an investor’s shares, when redeemed, may be worth more or less than the original cost. To obtain performance information current to the most recent month end, please visit www.diamond-hill.com. |
14 DIAMOND HILL FUNDS | ANNUAL REPORT | DECEMBER 31, 2017 | DIAMOND-HILL.COM |
Diamond Hill Large Cap Fund |
2017 Portfolio Commentary
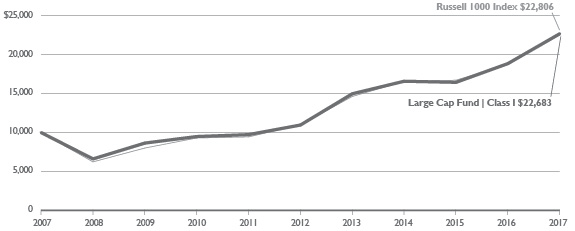
The Diamond Hill Large Cap Fund (Class I) returned 20.30% in 2017 compared to a 21.69% return for the Russell 1000 Index. The year was characterized by very strong performance by the large capitalization growth stocks, particularly technology companies. We owned several of those large cap stocks but their weighting in our portfolio was meaningfully less than their weighting in the Index. This went a long way toward explaining the relative underperformance of the portfolio in 2017. The strength in the overall market was not surprising, as we have felt for a long time that equities were inexpensive relative to other financial assets. This conviction led us to make a concerted effort to keep the portfolio fully invested for the past several years. However, as the year was drawing to a close, the market became more fairly valued. Much of the year-end boost in equity prices was driven by the recent significant corporate tax cut, which could help drive earnings growth in 2018. Combined with accelerating economic growth, this increased the levels of optimism in the market. However, we believe the period of significant excess returns in the equities markets may be nearing an end. This does not mean prospects are negative; however, the double-digit returns achieved since the bear market bottom of 2009 will be more difficult to achieve in future years.
The health care sector provided the greatest positive contribution to the Fund’s performance in 2017. Our health care sector weighting was not particularly large during the year but positive stock selection contributed greatly to the strong performance in the sector. Abbott Laboratories was the Fund’s largest holding in the sector and returned 52.0% for the year. The stock benefited from inexpensive valuation at the beginning of the year as integration problems with the St. Jude acquisition combined with controversy surrounding the Alere acquisition caused investors to question the corporate growth strategy. However, management worked through these problems and earnings growth began to improve. This allowed the valuation to increase meaningfully throughout the year. The other strong contributor in the health care sector was Aetna. In December 2017 it was announced CVS Health Corp. would acquire Aetna in a cash and stock deal. This was the catalyst to the stock’s strong performance, much to the benefit of shareholders. This deal is symptomatic of the large acquisitions which are becoming more prevalent in the U.S. marketplace. This activity should continue in 2018, helping to drive equity returns even in the face of fair valuation.
Sometimes the relative performance of the portfolio can be driven by avoiding problem areas of the market, and that was the case for the Diamond Hill Large Cap Fund in 2017. Our small weighting in the energy sector helped us avoid many of the issues in the sector, even as our individual holdings performed poorly. Cimarex was our largest energy holding, and the stock’s -10.0% return was disappointing for shareholders. However, for much of the year Cimarex represented our only energy holding. Our relatively small weighting in the sector was very additive to our relative performance. As the year was concluding, we began adding to our energy investments as the valuations became more attractive. Still, energy remains a small weighting in the portfolio.
The industrials sector was also a strong contributor to performance in 2017. Parker-Hannifin is a diversified manufacturer whose earnings grew nicely throughout the year due to strong performance in its end markets combined with strategically sound acquisitions. Parker-Hannifin is characterized by strong competitive positions in attractive end markets with good management at attractive valuation.
DIAMOND HILL FUNDS | ANNUAL REPORT | DECEMBER 31, 2017 | DIAMOND-HILL.COM 15 |
Diamond Hill Large Cap Fund |
The Fund has held a position in Parker-Hannifin for more than a decade and it has been a rewarding position for shareholders. In 2017 the stock returned 44.9% as earnings growth remained strong in an anemic economic environment. A similarly well-managed industrial company, Honeywell International, was added to the portfolio early in the year. The stock returned 35.1% for the year as the market began to appreciate the growth opportunities for this attractively valued company.
As mentioned earlier, we were hurt in 2017 by the Fund’s relatively small weighting in large cap information technology stocks. While we owned large positons in Microsoft, Alphabet, and Apple, our technology exposure remained meaningfully less than the Index. Also, our investments in networking companies lagged the market as intense levels of competition hindered the profitability growth of these firms. Juniper Networks was the worst performer as its 2.3% return meaningfully lagged the market.
The consumer discretionary sector was disappointing again in 2018. Whirlpool provided a -4.9% return for the year. Intense levels of competition from foreign competitors caused domestic profitability to lag. Meanwhile, their European operations continued to disappoint despite a meaningful acquisition a couple of years ago which we believed would drive European earnings growth. At year-end, our position in Whirlpool had been meaningfully reduced. Hanesbrands also provided a slightly negative return, down 0.3%. There was considerable displacement in their retail chain customers in 2017 and we expect this to continue in 2018. However, the attractive valuation and strong competitive position outweigh the near term risks. We have maintained our investment in Hanesbrands.
2017 was an excellent year for the markets and for Diamond Hill Large Cap Fund shareholders. The lengthy bull market recovery from the 2009 lows has continued. As we enter 2018, economic growth is improving and earnings growth should receive a boost from the recent reduction in corporate tax rates. As always, we will be applying our intrinsic value discipline even as markets continue to rise. It is that discipline that drives us to find good value in a rapidly rising market. Finding good value will not be easy, but we believe opportunities remain.
As I finish my 15th year as portfolio manager of the Diamond Hill Large Cap Fund, I am grateful to shareholders for their continued support. As of December 31, 2017, Austin Hawley has joined me as co-manager of the Fund. I have worked with Austin for several years in his capacity as assistant portfolio manager and I look forward to working with him as co-manager. We enjoy the challenge of applying our investment discipline in a variety of market environments and we look forward to the challenges 2018 will provide.

| 
|
Chuck Bath, CFA
Portfolio Manager | Austin Hawley, CFA
Portfolio Manager |
16 DIAMOND HILL FUNDS | ANNUAL REPORT | DECEMBER 31, 2017 | DIAMOND-HILL.COM |
Diamond Hill Large Cap Fund |
AVERAGE ANNUAL TOTAL RETURNS AS OF DECEMBER 31, 2017
| Inception
Date | One
Year | Three
Years | Five
Years | Ten
Years | Expense
Ratio* |
PERFORMANCE AT NAV WITHOUT SALES CHARGES |
Class A Shares | 6/29/2001 | 19.95% | 10.67% | 15.33% | 8.21% | 0.96% |
Class C Shares | 9/25/2001 | 19.04 | 9.84 | 14.47 | 7.39 | 1.71 |
Class I Shares | 1/31/2005 | 20.30 | 10.99 | 15.64 | 8.54 | 0.67 |
Class Y Shares | 12/30/2011 | 20.42 | 11.10 | 15.79 | 8.47 | 0.55 |
BENCHMARK |
Russell 1000 Index | | 21.69 | 11.23 | 15.71 | 8.59 | — |
PERFORMANCE AT PUBLIC OFFERING PRICE INCLUDING SALES CHARGES** |
Class A Shares | 6/29/2001 | 13.97 | 8.79 | 14.15 | 7.65 | 0.96 |
Class C Shares | 9/25/2001 | 18.04 | 9.84 | 14.47 | 7.39 | 1.71 |
| * | Reflects the expense ratio as reported in the Prospectus dated February 28, 2018. |
| ** | The maximum sales charge for Class A shares on purchases and for Class C shares on certain redemptions are 5.00% and 1.00%, respectively. |
GROWTH OF $10,000
Comparison of the change in value of a $10,000 Investment in the Diamond Hill Large Cap Fund Class I(A) and the Russell 1000 Index.
(A) | The growth of $10,000 chart represents the performance of Class I shares only, which will vary from the performance of Class A, Class C and Class Y shares based on the difference in loads and fees paid by shareholders in the different classes. |
| The performance of the above Fund does not reflect the deduction of taxes that a shareholder would pay on Fund distributions or the redemption of Fund shares. |
| The chart above represents a comparison of a hypothetical $10,000 investment and the reinvestment of dividends and capital gains in the indicated share class versus a similar investment in the Russell 1000 Index (“Index”). The Index is a market capitalization-weighted index measuring performance of the largest 1,000 companies, on a market capitalization basis, in the Russell 3000 Index. The Index is unmanaged, and does not reflect the deduction of fees associated with a mutual fund such as investment management and accounting fees. The Fund’s performance reflects the deduction of fees for these services. Investors cannot invest directly in an index although they can invest in the underlying securities. |
| Historical performance for Class Y shares prior to its inception is based on the performance of Class A shares. Class Y performance has been adjusted to reflect differences in sales charges and expenses between classes. |
| Past performance does not guarantee future results. The performance data quoted represents past performance and current returns may be lower or higher. The investment return and principal value will fluctuate so that an investor’s shares, when redeemed, may be worth more or less than the original cost. To obtain performance information current to the most recent month end, please visit www.diamond-hill.com. |
DIAMOND HILL FUNDS | ANNUAL REPORT | DECEMBER 31, 2017 | DIAMOND-HILL.COM 17 |
Diamond Hill All Cap Select Fund |
2017 Portfolio Commentary
Value stocks roared into 2017 on the heels of a surprise U.S. presidential election, but any hopes of a broad shift in favor of more price-sensitive stock pickers quickly gave way to the dominant themes of 2017: steady, almost mechanical, upward momentum for all risk assets; increasing valuation multiples; and significant outperformance of growth stocks relative to their value counterparts. The S&P 500 increased in every month of 2017 with the most significant intra-year decline a paltry 3%, and the S&P 500 Growth Index bested the S&P 500 Value Index by over 1,200 basis points.
High prices, low volatility, and a strong sentiment toward growth investments are not a combination that value investors dream about, but given the environment, we are pleased with the All Cap Select Fund’s performance in 2017. The Fund's Class I shares appreciated by 20.33% for the year, managing to nearly keep pace with the 21.13% return for the Russell 3000 Index. Strong security selection in the health care and consumer discretionary sectors were the largest relative contributors for the Fund, while poor security selection in financials and an underweight position in the information technology sector were the most significant relative detractors. Despite low volatility, we were able to capitalize on opportunities that arose throughout the year. While our return expectations came down somewhat as valuation multiples increased, we believe portfolio additions in 2017 were, on average, of higher quality than the names we exited and will lead to a less cyclical, more diversified portfolio that is well positioned to deliver attractive risk-adjusted returns.
Willis Towers Watson and Avis Budget Group are two of the more noteworthy eliminations from the portfolio in 2017. Over time, our expectations for Willis’ ability to grow earnings and create value had become tempered, narrowing the gap between price and our estimate of intrinsic value. Avis was eliminated in the fourth quarter after appreciating significantly in response to greater industry discipline around capacity and pricing.
Validus Holdings, Molson Coors Brewing, and Philip Morris International are some of the more significant additions to the portfolio in the past year. Validus is a Bermudian insurance company with a good track record of underwriting and shareholder value creation. The company underwrites reinsurance and specialty insurance, and is also a manager of third-party capital dedicated to insurance-linked securities. Molson Coors Brewing is the second largest brewer in North America with leading beer brands such as Miller Lite, Coors Light, and Blue Moon. Their recent acquisition of SAB Miller’s stake in Miller Coors is expected to result in significant margin expansion over the next few years. Philip Morris is a high-quality company with which we are very familiar because we owned it previously. Since our last period of ownership, the company has had strong traction with their iQOS smokeless tobacco products which have attractive margins and are leading to market share gains.
Some of the largest contributors to absolute performance in 2017 were Abbott Laboratories, Deere, and NVR, with each returning more than 50% for the year. Abbott’s performance was largely driven by continued solid execution, promising performance of new products, and indications that Abbott is ahead of schedule in resolving some of the thornier issues inherited with the St. Jude acquisition. Deere’s strength was based on continued strong fundamental
18 DIAMOND HILL FUNDS | ANNUAL REPORT | DECEMBER 31, 2017 | DIAMOND-HILL.COM |
Diamond Hill All Cap Select Fund |
performance and the realization that trough, mid, and peak-cycle earnings are all dramatically higher than in previous cycles. Finally, all homebuilder stocks did well in 2017 due to tailwinds from very strong new-home demand, but NVR far outpaced the rest. NVR stands out for its conservative management and high returns on invested capital.
Two of the new holdings mentioned above, Validus and Philip Morris, were also some of the larger detractors from the Fund’s absolute performance during the past year. This is an occurrence we welcome, as it provides a chance to continue building a position at even more attractive prices. Validus shares slumped in September in response to potential losses from Hurricanes Harvey and Irma. While Validus did incur meaningful losses from the hurricanes, firmer industry pricing will be a positive offset. Philip Morris’s weakness was caused by softer-than-expected third-quarter earnings and reduced guidance related to transitory issues with pricing in Russia and an abrupt tobacco tax hike in Saudi Arabia. Earnings are still growing 10% per year in constant currency, and the iQOS smokeless system should continue to enhance margins and help the company take share.
2017 concludes our fifth year as portfolio managers of the All Cap Select Fund. We achieved our objective of delivering a better return than the Russell 3000 Index over the past five years, but the margin was less than we would have liked. Our research team generated many attractive ideas that helped us outperform the benchmark, and with one notable exception (Valeant Pharmaceuticals), the underperformers were only modest disappointments. We are confident that our collective experience and research capabilities position us well to take advantage of the opportunities that will emerge over the next five years.
We appreciate your support and look forward to 2018.

| 
|
Austin Hawley, CFA
Portfolio Manager | Rick Snowdon, CFA
Portfolio Manager |
DIAMOND HILL FUNDS | ANNUAL REPORT | DECEMBER 31, 2017 | DIAMOND-HILL.COM 19 |
Diamond Hill All Cap Select Fund |
AVERAGE ANNUAL TOTAL RETURNS AS OF DECEMBER 31, 2017
| Inception
Date | One
Year | Three
Years | Five
Years | Ten
Years | Expense
Ratio* |
PERFORMANCE AT NAV WITHOUT SALES CHARGES |
Class A Shares | 12/30/2005 | 19.93% | 8.93% | 15.69% | 8.29% | 1.16% |
Class C Shares | 12/30/2005 | 19.07 | 8.11 | 14.83 | 7.48 | 1.91 |
Class I Shares | 12/30/2005 | 20.33 | 9.25 | 16.00 | 8.61 | 0.87 |
Class Y Shares | 12/30/2011 | 20.45 | 9.35 | 16.15 | 8.55 | 0.75 |
BENCHMARK |
Russell 3000 Index | | 21.13 | 11.12 | 15.58 | 8.60 | — |
PERFORMANCE AT PUBLIC OFFERING PRICE INCLUDING SALES CHARGES** |
Class A Shares | 12/30/2005 | 13.95 | 7.09 | 14.51 | 7.74 | 1.16 |
Class C Shares | 12/30/2005 | 18.07 | 8.11 | 14.83 | 7.48 | 1.91 |
| * | Reflects the expense ratio as reported in the Prospectus dated February 28, 2018. |
| ** | The maximum sales charge for Class A shares on purchases and for Class C shares on certain redemptions are 5.00% and 1.00%, respectively. |
GROWTH OF $10,000
Comparison of the change in value of a $10,000 Investment in the Diamond Hill All Cap Select Fund Class I(A) and the Russell 3000 Index.

(A) | The growth of $10,000 chart represents the performance of Class I shares only, which will vary from the performance of Class A, Class C and Class Y shares based on the difference in loads and fees paid by shareholders in the different classes. |
| The performance of the above Fund does not reflect the deduction of taxes that a shareholder would pay on Fund distributions or the redemption of Fund shares. |
| The chart above represents a comparison of a hypothetical $10,000 investment and the reinvestment of dividends and capital gains in the indicated share class versus a similar investment in the Russell 3000 Index (“Index”). The Index is a widely recognized market capitalization-weighted index measuring the performance of the 3,000 largest U.S. companies based on total market capitalization. The Index is unmanaged, and does not reflect the deduction of fees associated with a mutual fund such as investment management and accounting fees. The Fund’s performance reflects the deduction of fees for these services. Investors cannot invest directly in an index although they can invest in the underlying securities. |
| Historical performance for Class Y shares prior to its inception is based on the performance of Class A shares. Class Y performance has been adjusted to reflect differences in sales charges and expenses between classes. |
| Past performance does not guarantee future results. The performance data quoted represents past performance and current returns may be lower or higher. The investment return and principal value will fluctuate so that an investor’s shares, when redeemed, may be worth more or less than the original cost. To obtain performance information current to the most recent month end, please visit www.diamond-hill.com. |
20 DIAMOND HILL FUNDS | ANNUAL REPORT | DECEMBER 31, 2017 | DIAMOND-HILL.COM |
Diamond Hill Long-Short Fund |
2017 Portfolio Commentary
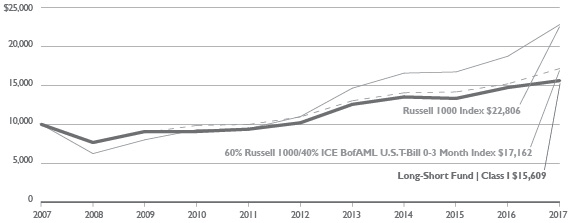
The Diamond Hill Long-Short Fund (Class I) returned 5.99% in 2017 compared to 21.69% for the long-only Russell 1000 Index and 12.92% for the blended benchmark (60% Russell 1000 Index/40% ICE Bank of America Merrill Lynch U.S. T-Bill 0-3 Month Index). The portfolio lagged the blended benchmark, which takes into account the portfolio’s general 60% net long bias, by nearly 7% for the year. We strive to outperform the blended benchmark in all market environments; therefore, we were disappointed to have trailed that benchmark by a wide margin in 2017. However, we also constantly emphasize long-term results and in that regard, we were much more satisfied with our five-year annualized return, which nearly matched the blended benchmark. During the year the long side of the portfolio underperformed modestly, while the short portfolio was up much more than the benchmark as a number of our short positions had meaningful negative contributions for the period.
The net exposure of the portfolio remained roughly in line with our blended benchmark. We maintained net long exposure of between 53% and 59% during 2017 and finished the year just slightly below our long-term average of 60%. The increase was driven primarily by a reduction in our gross short exposure.
Leadership was once again concentrated in the more cyclical areas of the market. On the long side of the portfolio, information technology, consumer discretionary, financials and industrials provided the biggest positive contributions to return. Within the information technology sector, Apple, Alphabet (Google), and Microsoft were the largest contributors. Other holdings that meaningfully added to the return for the year were Abbott Laboratories, Citigroup, BorgWarner, and Discover Financial Services.
As mentioned above, the short portfolio detracted from results in 2017 as some of our largest positions — Best Buy, Boeing, and Arista Networks — appreciated considerably. We generally maintained our position in Best Buy as our view regarding the fundamental outlook remains the same. The company has clearly executed on the expense side of the business but appears challenged to grow revenue. And while the expense levers look largely behind them, the revenue headwinds remain while the valuation appears lofty. Additionally on the short side, we meaningfully reduced the size of our Boeing position as we grew less confident that our investment thesis would play out. Roughly half of the position in Arista Networks was also covered in the back half of the year due to continued strong fundamentals including persistently healthy topline performance. While 2017 was a ‘growth’ year as evidenced by the wide gap in returns between the Russell 1000 Growth Index and the Russell 1000 Value Index, we were nonetheless disappointed in the performance of our short book. We are focused on improvement in this area as it remains a core component of this investment strategy.
Finally, regarding the overall market environment, we continue to believe the five-year outlook for domestic equities includes total returns at the low end of historical ranges and, as always, we are focused on long time horizons and buying good (or better) businesses at average (or better) prices. Our exposures and net positioning will, at any given point in time, be dictated by the sum of the individual opportunities we are finding in the market.
DIAMOND HILL FUNDS | ANNUAL REPORT | DECEMBER 31, 2017 | DIAMOND-HILL.COM 21 |
Diamond Hill Long-Short Fund |
We are grateful for your continued support and appreciate the opportunity to continue to earn your trust in 2018.

| 
|
Chris Bingaman, CFA
Portfolio Manager | Ric Dillon, CFA
Portfolio Manager |
22 DIAMOND HILL FUNDS | ANNUAL REPORT | DECEMBER 31, 2017 | DIAMOND-HILL.COM |
Diamond Hill Long-Short Fund |
AVERAGE ANNUAL TOTAL RETURNS AS OF DECEMBER 31, 2017
| Inception
Date | One
Year | Three
Years | Five
Years | Ten
Years | Expense
Ratio* |
PERFORMANCE AT NAV WITHOUT SALES CHARGES |
Class A Shares | 6/30/2000 | 5.65% | 4.63% | 8.59% | 4.24% | 1.95% |
Class C Shares | 2/13/2001 | 4.83 | 3.84 | 7.77 | 3.45 | 2.70 |
Class I Shares | 1/31/2005 | 5.99 | 4.93 | 8.89 | 4.55 | 1.66 |
Class Y Shares | 12/30/2011 | 6.07 | 5.05 | 9.02 | 4.49 | 1.54 |
BENCHMARK |
Russell 1000 Index | | 21.69 | 11.23 | 15.71 | 8.59 | — |
60% Russell 1000 Index/40% ICE BofAML U.S. T-Bill 0-3 Mo. Index | | 12.92 | 6.88 | 9.39 | 5.52 | — |
PERFORMANCE AT PUBLIC OFFERING PRICE INCLUDING SALES CHARGES** |
Class A Shares | 6/30/2000 | 0.37 | 2.85 | 7.47 | 3.70 | 1.95 |
Class C Shares | 2/13/2001 | 3.83 | 3.84 | 7.77 | 3.45 | 2.70 |
| * | Reflects the expense ratio as reported in the Prospectus dated February 28, 2018. |
| ** | The maximum sales charge for Class A shares on purchases and for Class C shares on certain redemptions are 5.00% and 1.00%, respectively. |
GROWTH OF $10,000
Comparison of the change in value of a $10,000 Investment in the Diamond Hill Long-Short Fund Class I(A), the Russell 1000 Index and the Blended Index (60% Russell 1000 Index and 40% ICE BofAML U.S. T-Bill 0-3 Month Index)
(A) | The growth of $10,000 chart represents the performance of Class I shares only, which will vary from the performance of Class A, Class C and Class Y shares based on the difference in loads and fees paid by shareholders in the different classes. |
| The performance of the above Fund does not reflect the deduction of taxes that a shareholder would pay on Fund distributions or the redemption of Fund shares. |
| The chart above represents a comparison of a hypothetical $10,000 investment and the reinvestment of dividends and capital gains in the indicated share class versus a similar investment in the Russell 1000 Index and the blended index. The Russell 1000 Index is a market capitalization-weighted index measuring performance of the largest 1,000 companies on a market capitalization basis, in the Russell 3000 Index. The Blended Index represents a 60% weighting of the Russell 1000 Index as described above and a 40% weighting of the ICE BofAML U.S. T-Bill 0-3 Month Index. The ICE BofAML U.S. T-Bill 0-3 Month Index tracks the performance of U.S. dollar denominated U.S. Treasury Bills publicly issued in the U.S. domestic market with a remaining term to final maturity of less than 3 months. Both indices are unmanaged, and do not reflect the deduction of fees associated with a mutual fund such as investment management and accounting fees. The Fund’s performance reflects the deduction of fees for these services. Investors cannot invest directly in an index although they can invest in the underlying securities. |
| Historical performance for Class Y shares prior to its inception is based on the performance of Class A shares. Class Y performance has been adjusted to reflect differences in sales charges and expenses between classes. |
| Past performance does not guarantee future results. The performance data quoted represents past performance and current returns may be lower or higher. The investment return and principal value will fluctuate so that an investor’s shares, when redeemed, may be worth more or less than the original cost. To obtain performance information current to the most recent month end, please visit www.diamond-hill.com. |
DIAMOND HILL FUNDS | ANNUAL REPORT | DECEMBER 31, 2017 | DIAMOND-HILL.COM 23 |
Diamond Hill Research Opportunities Fund |
2017 Portfolio Commentary
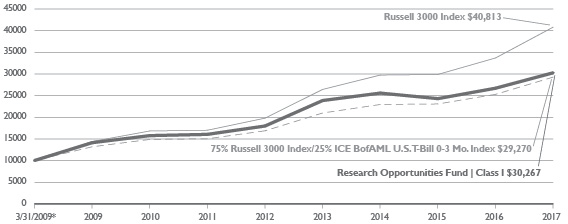
The Diamond Hill Research Opportunities Fund (Class I) increased 13.34% during 2017 compared to a 21.13% increase in our primary benchmark, the long-only Russell 3000 Index. At Diamond Hill, we have a long-term investment horizon and evaluate our performance over rolling five-year periods. At the end of 2017, our five-year annualized return was 10.99% versus 15.58% for the Russell 3000 Index. During 2016 we added a secondary benchmark, which reflected our long-term average net exposure. This benchmark is comprised of 75% Russell 3000 Index and 25% ICE Bank of America Merrill Lynch U.S. T-Bill 0-3 Month Index. The performance of this secondary benchmark was 15.74% and 11.65% for the trailing one-year and five-year periods, respectively.
Our five-year absolute results are adequate but we continue to be disappointed with our relative results. During 2017, the underperformance was largely attributable to our short book as our long portfolio roughly matched the return of the Russell 3000 and our average long exposure during the year was close to 100%. Net exposure increased throughout the year as we reduced and covered short positions where fundamental developments did not support our thesis. We ended the year with net exposure of 85%, compared to the Fund’s five-year average of 76%. Gross exposure declined to 122% compared to 132% at the end of 2016, primarily due to a reduction in short exposure.
The two largest contributors to absolute performance during 2017 came from the consumer discretionary sector: Red Rock Resorts and NVR. Casino operator Red Rock Resorts enjoyed strong revenue growth in Las Vegas despite disruptions from investments they are making in two of their properties near the Las Vegas Strip. These properties are well-positioned to benefit from the new professional sports facilities being built in the area and we believe investments in these properties are wise ahead of a likely improvement in demand. It is encouraging that revenue trends are strong despite temporary disruptions from these investments. Homebuilder NVR benefited from a strong housing market and reported solid order growth during the year along with improving margins.
Outside of the consumer sector, home infusion services provider BioScrip sharply rebounded during 2017 after being one of the Fund’s largest detractors in 2016. Investors became increasingly confident with the new management team during 2017, and the company’s liquidity position improved throughout the year. Further, the company addressed investor concerns regarding a potential deterioration in earnings associated with Bioscrip’s ability to retain their largest client, United Healthcare. Management revealed that the majority of its business with this client was unprofitable, and subsequently Bioscrip walked away from this contract.
The largest detractors from absolute return during the year were short positions in Arista Networks, Boeing, and Best Buy. Cloud networking company Arista generated revenue growth much stronger than we expected. We anticipated responses from competitors during 2017 to moderate Arista’s revenue growth, which did not materialize. We covered the position as fundamentals were not supporting our thesis. Aerospace and defense company Boeing was able to improve operating margins despite near-term revenue headwinds. The company also continued to exhibit strong free-cash-flow generation and allocated the majority of this free
24 DIAMOND HILL FUNDS | ANNUAL REPORT | DECEMBER 31, 2017 | DIAMOND-HILL.COM |
Diamond Hill Research Opportunities Fund |
cash flow towards share repurchases. We continue to view current free-cash-flow levels as unsustainable through a cycle, but fundamentals have exceeded our expectations and we have reduced the size of the position. Shares of consumer electronics retailer Best Buy increased due to strong sales and expectations that the company will benefit from tax reform. Near-term topline results have exceeded our expectations, but there is little visibility into sustainable long-term growth drivers and the consumer electronic business is highly cyclical. Best Buy remains a large short position in the Fund.
As of December 31, 2017, the Fund held 78 long and 31 short positions, with the top 10 positions representing 39% of net assets.
We want to thank shareholders for their support and look forward to working together in the years ahead.
Diamond Hill Research Analysts
DIAMOND HILL FUNDS | ANNUAL REPORT | DECEMBER 31, 2017 | DIAMOND-HILL.COM 25 |
Diamond Hill Research Opportunities Fund |
AVERAGE ANNUAL TOTAL RETURNS AS OF DECEMBER 31, 2017
| Inception
Date | One
Year | Three
Years | Five
Years | Since Inception* | Expense Ratio** |
PERFORMANCE AT NAV WITHOUT SALES CHARGES |
Class A Shares | 12/30/2011 | 12.98% | 5.47% | 10.69% | 13.18% | 1.80% |
Class C Shares | 12/30/2011 | 12.12 | 4.67 | 9.87 | 12.34 | 2.55 |
Class I Shares | 12/30/2011 | 13.34 | 5.77 | 10.99 | 13.49 | 1.51 |
Class Y Shares | 12/30/2011 | 13.47 | 5.89 | 11.14 | 13.64 | 1.39 |
BENCHMARK |
Russell 3000 Index | | 21.13 | 11.12 | 15.58 | 17.44 | — |
75% Russell 3000 Index/25% ICE BofAML U.S. T-Bill 0-3 Mo. Index | | 15.74 | 8.44 | 11.65 | 13.05 | — |
PERFORMANCE AT PUBLIC OFFERING PRICE INCLUDING SALES CHARGES** |
Class A Shares | 12/30/2011 | 7.33 | 3.67 | 9.56 | 12.52 | 1.80 |
Class C Shares | 12/30/2011 | 11.12 | 4.67 | 9.87 | 12.34 | 2.55 |
| ** | Reflects the expense ratio as reported in the Prospectus dated February 28, 2018. |
| *** | The maximum sales charge for Class A shares on purchases and for Class C shares on certain redemptions are 5.00% and 1.00%, respectively. |
GROWTH OF $10,000
Comparison of the change in value of a $10,000 Investment in the Diamond Hill Research Opportunities Fund Class I(A), the Russell 3000 Index and the Blended Index (75% Russell 3000 Index and 25% ICE BofAML U.S. T-Bill 0-3 Mo. Index).
(A) | The growth of $10,000 chart represents the performance of Class I shares only, which will vary from the performance of Class A, Class C and Class Y shares based on the difference in loads and fees paid by shareholders in the different classes. |
| The performance of the above Fund does not reflect the deduction of taxes that a shareholder would pay on Fund distributions or the redemption of Fund shares. |
| The chart above represents a comparison of a hypothetical $10,000 investment and the reinvestment of dividends and capital gains in the indicated share class versus a similar investment in the Russell 3000 Index (“Index”). The Index is a widely recognized market capitalization-weighted index measuring the performance of the 3,000 largest U.S. companies based on total market capitalization. The Blended Index represents a 75% weighting of the Russell 3000 Index and a 25% weighting of the ICE BofAML U.S. T-Bill 0-3 Month Index. The ICE BofAML U.S. T-Bill 0-3 Month Index is comprised of U.S. dollar denominated U.S. Treasury Bills with a term to maturity of less than 3 months. These indexes are unmanaged, and do not reflect the deduction of fees associated with a mutual fund such as investment management and accounting fees. The Fund’s performance reflects the deduction of fees for these services. Investors cannot invest directly in an index although they can invest in the underlying securities. |
* | The quoted performance for the Fund reflects the past performance of Diamond Hill Research Partners, L. P. (the “Research Partnership”), a private fund managed with full investment authority by the Fund’s Adviser for periods prior to the fund’s inception date. The Fund is managed in all material respects in a manner equivalent to the management of the predecessor unregistered fund. The Fund’s objectives, policies, guidelines and restrictions are in all material respects equivalent to the predecessor, and the Fund was created for reasons entirely unrelated to the establishment of a performance record. The assets of the Research Partnership were converted into assets of the Fund prior to commencement of operation of the Fund. The Fund’s inception date is December 30, 2011. The performance of the Research Partnership has been restated to reflect the net expenses and maximum applicable sales charge of the Fund for its initial years of investment operations. The Research Partnership was not registered under the Investment Company Act of 1940 and therefore was not subject to certain investment restrictions imposed by the 1940 Act. If the Research Partnership had been registered under the 1940 Act, its performance may have been adversely affected. Performance is measured from March 31, 2009, the inception of the Research Partnership and is not the performance of the Fund for the period prior to December 30, 2011. The Research Partnership’s past performance is not necessarily an indication of how the Fund will perform in the future either before or after taxes. |
| Past performance does not guarantee future results. The performance data quoted represents past performance and current returns may be lower or higher. The investment return and principal value will fluctuate so that an investor’s shares, when redeemed, may be worth more or less than the original cost. To obtain performance information current to the most recent month end, please visit www.diamond-hill.com. |
26 DIAMOND HILL FUNDS | ANNUAL REPORT | DECEMBER 31, 2017 | DIAMOND-HILL.COM |
Diamond Hill Financial Long-Short Fund |
2017 Portfolio Commentary
After a strong 2016, primarily from a post-election rally into year-end, the financial services sector was one of six Russell sectors with a return above 20% in 2017. The Diamond Hill Financial Long-Short Fund (Class I) generated a return of 11.90%. This lagged the Russell 3000 Financials Index, the Fund’s primary benchmark, which returned 19.95% in 2017. The Fund’s secondary blended benchmark (80% Russell 3000 Financials Index/20% ICE Bank of America Merrill Lynch U.S. T-Bill 0-3 Month Index), which we introduced in 2016, returned 15.92%. For the trailing five-year period, the Fund generated an annualized return of 13.66% versus 16.92% for the long-only benchmark and 13.51% for the blended secondary benchmark. The Fund has averaged 78.7% net exposure over the last five years.
As we wrote last year, 2016 was one of the more unusual years in recent memory for the financials sector. It included a sharp selloff to start the year, another selloff after the Brexit vote, the introduction of a new Global Industry Classification Standard sector for real estate, and ended the year with a sharp rally in the fourth quarter after the election.
2017 proved to be much less dramatic. The major regulatory reform many investors hoped for post-election remains elusive, macroeconomic growth is still muted, and the uncertainty caused by political gridlock continues to dampen demand for bank loans. The completion of corporate tax reform drove the performance of the sector, as the lower tax rate will boost earnings meaningfully for many financial companies. Continued action out of the Federal Reserve to boost interest rates, with the prospect of additional increases in 2018, also lifted many in the sector. Property and casualty (P&C) insurance companies and real estate investment trusts (REITs) were notable sector laggards. P&C companies continue to deal with the impact of several large loss events in the third quarter. REITs underperformed on the prospect of continued interest rate increases in 2018, no real benefit from tax reform, and slowing fundamentals in many sub-sectors.
Looking specifically at the Fund, shares of Fortress Investment Group, Citigroup, and SVB Financial Group were the largest positive contributors to absolute return for the year. Fortress was acquired by Softbank in an all-cash transaction. Citigroup continued to improve profitability, shed legacy assets, and return capital to shareholders. SVB, parent company of Silicon Valley Bank, is one of the best-positioned banks to benefit from increasing interest rates and lower corporate taxes.
The largest drags on the portfolio were short positions in Selective Insurance Group and First American Financial, and our long position in Popular. Selective continues to see price increases that outpace their loss-cost inflation. First American continued its strong fundamental performance and the residential real estate market remained strong, though long-term risks in the form of regulatory/pricing pressure and technological advances remain. Long-term Fund holding Popular, which we wrote about last year as a top contributor, sold off following Hurricane Maria in Puerto Rico. We believe the ultimate losses to the bank will be well-contained and, as the dominant financial institution on the island, Popular should benefit as the economy recovers.
DIAMOND HILL FUNDS | ANNUAL REPORT | DECEMBER 31, 2017 | DIAMOND-HILL.COM 27 |
Diamond Hill Financial Long-Short Fund |
As a reminder, we continue to believe shareholders in the Fund will benefit from a relatively concentrated portfolio as well as the ability to utilize short selling. We intend to use our short positions as a way to enhance the performance of the Fund over time, not simply as a “hedge” to mitigate our long exposure or volatility. Our short exposure will typically be much smaller than our long exposure; therefore, we will have fewer and generally smaller short positions.
Heading into 2018, the portfolio management structure of the Fund has evolved with Austin Hawley stepping down from the strategy, allowing him to focus on his roles as portfolio manager for Large Cap and All Cap Select. Krishna Mohanraj moved from assistant portfolio manager to co-portfolio manager, and research analysts Josh Barber and Tyler Ventura joined the Fund as co-portfolio managers. Both Josh and Tyler have been part of the financials sector team for years, and we are all excited about the new team-managed approach.
Over the last several years, the research team at Diamond Hill has expanded its coverage to include more international companies. As our financials sector team finds interesting investment ideas around the globe, we intend to use some of the best of those ideas in the Fund, investing up to 20% of Fund assets in international financial services companies. We expect this to be a gradual process but made our first investment in late 2017, investing in the shares of Credit Suisse Group. Under new management since the middle of 2015, company fundamentals have been improving and, mid-way through their restructuring plan, their return-on-equity targets appear realistic, increasing the potential for future capital return. While a small first step, we are excited about the increased opportunity set from which to source interesting investments for the Fund.
After facing headwinds of declining interest rates, ever-increasing regulation, and below-normal economic growth, we’re cautiously optimistic that these headwinds are shifting to tailwinds and will improve the revenue environment for the sector in the coming years.
We would like to thank our shareholders for your continued support of the Fund.

| 
|
Austin Hawley, CFA
Portfolio Manager | John Loesch, CFA
Portfolio Manager |
28 DIAMOND HILL FUNDS | ANNUAL REPORT | DECEMBER 31, 2017 | DIAMOND-HILL.COM |
Diamond Hill Financial Long-Short Fund |
AVERAGE ANNUAL TOTAL RETURNS AS OF DECEMBER 31, 2017
| Inception
Date | One
Year | Three
Years | Five
Years | Ten
Years | Expense
Ratio* |
PERFORMANCE AT NAV WITHOUT SALES CHARGES |
Class A Shares | 8/1/1997 | 11.58% | 8.10% | 13.35% | 5.10% | 1.86% |
Class C Shares | 6/3/1999 | 10.76 | 7.27 | 12.50 | 4.29 | 2.61 |
Class I Shares | 12/31/2006 | 11.90 | 8.41 | 13.66 | 5.42 | 1.57 |
BENCHMARK |
Russell 3000 Financials Index | | 19.95 | 12.52 | 16.92 | 5.12 | — |
80% Russell 3000 Financials Index/20% ICE BofAML U.S. T-Bill 0-3 Mo. Index | | 15.92 | 10.12 | 13.51 | 4.57 | — |
PERFORMANCE AT PUBLIC OFFERING PRICE INCLUDING SALES CHARGES** |
Class A Shares | 8/1/1997 | 6.02 | 6.27 | 12.18 | 4.56 | 1.86 |
Class C Shares | 6/3/1999 | 9.76 | 7.27 | 12.50 | 4.29 | 2.61 |
| * | Reflects the expense ratio as reported in the Prospectus dated February 28, 2018. |
| ** | The maximum sales charge for Class A shares on purchases and for Class C shares on certain redemptions are 5.00% and 1.00%, respectively. |
GROWTH OF $10,000
Comparison of the change in value of a $10,000 Investment in the Diamond Hill Financial Long-Short Fund Class I(A), Russell 3000 Financials Index and the Blended Index (80% Russell 3000 Financials Index and 20% ICE BofAML U.S. T-Bill 0-3 Mo. Index).
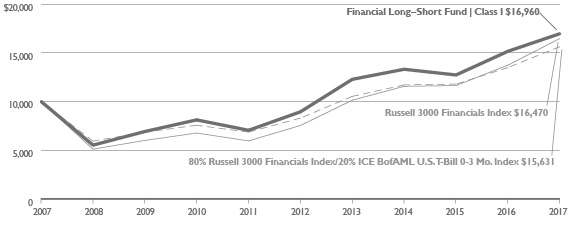
(A) | The growth of $10,000 chart represents the performance of Class I shares only, which will vary from the performance of Class A and Class C shares based on the difference in loads and fees paid by shareholders in the different classes. |
| The performance of the above Fund does not reflect the deduction of taxes that a shareholder would pay on Fund distributions or the redemption of Fund shares. |
| The chart above represents a comparison of a hypothetical $10,000 investment and the reinvestment of dividends and capital gains in the indicated share class versus a similar investment in the Russell 3000 Financials Index (“Index”). The Index consists of Russell 3000 companies involved in banking, mortgage finance, consumer finance, specialized finance, investment banking and brokerage, asset management and custody, corporate lending, insurance, financial investments and real estate, including REITS. The Index measures the performance of the largest 3,000 U.S. companies representing approximately 98% of the investable U.S. equity market. The Blended Index represents a 80% weighting of the Russell 3000 Financials Index and a 20% weighting of the ICE BofAML U.S. T-Bill 0-3 Month Index. The ICE BofAML U.S. T-Bill 0-3 Month Index is comprised of U.S. dollar denominated U.S. Treasury Bills with a term to maturity of less than 3 months. These indexes are unmanaged, and do not reflect the deduction of fees associated with a mutual fund such as investment management and accounting fees. The Fund’s performance reflects the deduction of fees for these services. Investors cannot invest directly in an index although they can invest in the underlying securities. |
| Past performance does not guarantee future results. The performance data quoted represents past performance and current returns may be lower or higher. The investment return and principal value will fluctuate so that an investor’s shares, when redeemed, may be worth more or less than the original cost. To obtain performance information current to the most recent month end, please visit www.diamond-hill.com. |
DIAMOND HILL FUNDS | ANNUAL REPORT | DECEMBER 31, 2017 | DIAMOND-HILL.COM 29 |
Diamond Hill Short Duration Total Return Fund |
2017 Portfolio Commentary
2017 was the Diamond Hill Short Duration Total Return Fund’s first full calendar year after launching in July 2016. While we did think short-term interest rates were likely to rise over the year given economic conditions and rhetoric from the Federal Open Market Committee, our focus is not on predicting interest rate movements. Rather, it is on finding undervalued securities we believe have compelling risk/return profiles. In this low rate environment, we think a fund that has a better yield than 30-year Treasury bonds and a duration similar to two- or three-year Treasury notes is an attractive option for investors looking to earn something more on their fixed income allocation. Also, for investors concerned that interest rates will continue to move higher, the Fund’s shorter duration and yield advantage should offer a cushion relative to longer duration fixed income funds.
In our experience, the structured product market is less transparent and efficient than the corporate bond market, resulting in better risk/reward opportunities. As the structured product market continues to evolve following the financial crisis, we continue to find opportunities in securitized mortgage, student, auto, and debt-consolidation loans from both online and traditional bricks-and-mortar lenders, to name just a few. Being active, long-time investors in this space, we are excited to see how the future of lending continues to evolve.
Diamond Hill’s team of more than 30 dedicated industry specialists continues to provide our portfolio management team with the insight and confidence necessary to make sound investment decisions. Additionally, we’ve started to add to our fixed income team with the addition of Charlie Minor, CFA as Structured Product Senior Associate. Charlie joined us from within Diamond Hill as we seek to retain and develop the firm’s exceptional talent. The fixed income team will likely continue to grow in 2018 as we dedicate more resources to our fixed income clients.
The yield on two-year Treasury notes rose more than 60 basis points over the course of 2017, but we remained confident that building a fund with a significant yield advantage over its benchmark while closely monitoring risk would generate value for our clients. The Fund finished the year with a return of 4.33% (Class I), exceeding the Bloomberg Barclays U.S. 1-3 Year Government/Credit Index return of 0.84% by 349 basis points. The Fund’s return advantage was driven by both its higher yield and spread tightening over the course of the year. The outlook for spreads in 2018 is more mixed and we would not be surprised by an uptick in volatility. That would be a welcomed opportunity.
As always, we appreciate the opportunity to serve our clients.

| 
|
Henry Song, CFA
Portfolio Manager | Mark Jackson, CFA
Portfolio Manager |
30 DIAMOND HILL FUNDS | ANNUAL REPORT | DECEMBER 31, 2017 | DIAMOND-HILL.COM |
Diamond Hill Short Duration Total Return Fund |
AVERAGE ANNUAL TOTAL RETURNS AS OF DECEMBER 31, 2017
| Inception
Date | One
Year | Since Inception | Expense
Ratio* |
PERFORMANCE AT NAV WITHOUT SALES CHARGES |
Class A Shares | 7/5/2016 | 3.97% | 3.47% | 0.81% |
Class I Shares | 7/5/2016 | 4.33 | 3.76 | 0.52 |
Class Y Shares | 7/5/2016 | 4.43 | 3.84 | 0.40 |
BENCHMARK |
Bloomberg Barclays U.S. 1-3 Yr. Government/Credit Index | 0.84 | 0.26 | — |
PERFORMANCE AT PUBLIC OFFERING PRICE INCLUDING SALES CHARGES** |
Class A Shares | 7/5/2016 | 1.64 | 1.90 | 0.81 |
| * | Reflects the expense ratio as reported in the Prospectus dated February 28, 2018. |
| ** | The maximum sales charge for Class A shares on purchases is 2.25%. |
GROWTH OF $10,000
Comparison of the change in value of a $10,000 Investment in the Diamond Hill Diamond Hill Short Duration Total Return Fund Class I(A) and Bloomberg Barclays U.S. 1-3 Yr. Government/Credit Index.
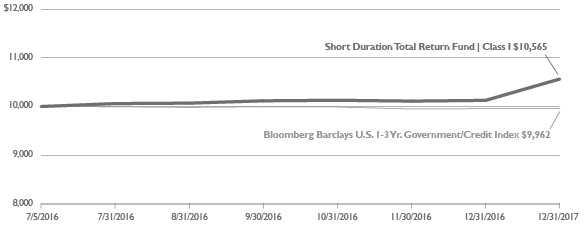
(A) | The growth of $10,000 chart represents the performance of Class I shares only, which will vary from the performance of Class A and Class Y shares based on the difference in loads and fees paid by shareholders in the different classes. |
| The performance of the above Fund does not reflect the deduction of taxes that a shareholder would pay on Fund distributions or the redemption of Fund shares. |
| The chart above represents a comparison of a hypothetical $10,000 investment and the reinvestment of dividends and capital gains in the indicated share class versus a similar investment in the Bloomberg Barclays U.S. 1-3 Yr. Government/Credit Index. The Bloomberg Barclays U.S. 1-3 Yr. Government/Credit Index tracks the performance of the U.S. dollar denominated investment grade and below investment grade corporate debt publically issued in the U.S. domestic market. All indices are unmanaged, and do not reflect the deduction of fees associated with a mutual fund such as investment management and accounting fees. The Fund’s performance reflects the deduction of fees for these services. Investors cannot invest directly in an index although they can invest in the underlying securities. |
| Past performance does not guarantee future results. The performance data quoted represents past performance and current returns may be lower or higher. The investment return and principal value will fluctuate so that an investor’s shares, when redeemed, may be worth more or less than the original cost. To obtain performance information current to the most recent month end, please visit www.diamond-hill.com. |
DIAMOND HILL FUNDS | ANNUAL REPORT | DECEMBER 31, 2017 | DIAMOND-HILL.COM 31 |
Diamond Hill Core Bond Fund |
2017 Portfolio Commentary
2017 was the Diamond Hill Core Bond Fund’s first full calendar year after launching in July 2016. While we don’t have much new to say compared to last year’s commentary, we believe that’s a good thing because it means we continue to invest using our time-tested philosophy and process. As a reminder, we’re not focused on market timing which we believe is too risky to justify its potential reward. Instead, we focus on a bottom-up security selection process that aims to identify undervalued opportunities in the investment grade fixed income markets while emphasizing diversification and quality. We believe this style deserves a place in an investor’s long-term portfolio allocation in an environment continually subject to uncertainty and heightened periods of volatility. We favor sectors of the mortgage-backed and asset-backed securities market that we believe have better-defined cash flows than the “to be announced” or TBA mortgages represented in the index. We don’t cheat down the credit spectrum with below investment grade purchases and avoid the use of derivatives and leverage. We want the portfolio to be transparent and understandable by our clients.
Diamond Hill’s team of more than 30 dedicated industry specialists continues to provide our portfolio management team with the insight and confidence necessary to make sound investment decisions. Additionally, we’ve started to add to our fixed income team with the addition of Charlie Minor, CFA as Structured Product Senior Associate. Charlie joined us from within Diamond Hill as we seek to retain and develop the firm’s exceptional talent. The fixed income team will likely continue to grow in 2018 as we dedicate more resources to our fixed income clients.
A strong commitment to our intrinsic value philosophy and bottom-up security selection process has again allowed us to accomplish our most important goal, delivering strong returns relative to the Fund’s benchmark. The Fund (Class I) generated a 4.17% return in 2017, comparing favorably to the 3.54% return of the Bloomberg Barclays U.S. Aggregate Index. 2018 will no doubt present a number of challenges and opportunities to navigate and we trust our approach to the markets will continue to serve us and our clients well.
We very much appreciate the opportunity to be the stewards of our clients’ capital.

| 
|
Henry Song, CFA
Portfolio Manager | Mark Jackson, CFA
Portfolio Manager |
32 DIAMOND HILL FUNDS | ANNUAL REPORT | DECEMBER 31, 2017 | DIAMOND-HILL.COM |
Diamond Hill Core Bond Fund |
AVERAGE ANNUAL TOTAL RETURNS AS OF DECEMBER 31, 2017
| Inception
Date | One
Year | Since Inception | Expense
Ratio* |
PERFORMANCE AT NAV WITHOUT SALES CHARGES |
Class A Shares | 7/5/2016 | 3.85% | 0.99% | 0.76% |
Class I Shares | 7/5/2016 | 4.17 | 1.29 | 0.47 |
Class Y Shares | 7/5/2016 | 4.22 | 1.35 | 0.35 |
BENCHMARK |
Bloomberg Barclays U.S. Aggregate Index | | 3.54 | 0.15 | — |
PERFORMANCE AT PUBLIC OFFERING PRICE INCLUDING SALES CHARGES** |
Class A Shares | 7/5/2016 | 0.24 | -1.38 | 0.76 |
| * | Reflects the expense ratio as reported in the Prospectus dated February 28, 2018. |
| ** | The maximum sales charge for Class A shares on purchases is 3.50%. |
GROWTH OF $10,000
Comparison of the change in value of a $10,000 Investment in the Diamond Hill Diamond Hill Core Bond Fund Class I(A) and Bloomberg Barclays U.S. Aggregate Index.
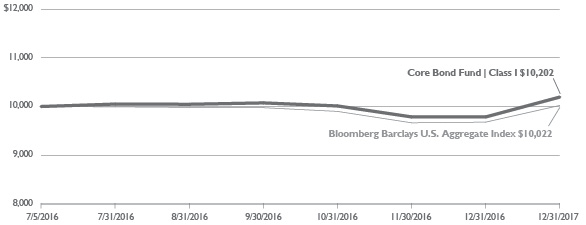
(A) | The growth of $10,000 chart represents the performance of Class I shares only, which will vary from the performance of Class A and Class Y shares based on the difference in loads and fees paid by shareholders in the different classes. |
| The performance of the above Fund does not reflect the deduction of taxes that a shareholder would pay on Fund distributions or the redemption of Fund shares. |
| The chart above represents a comparison of a hypothetical $10,000 investment and the reinvestment of dividends and capital gains in the indicated share class versus a similar investment in the Bloomberg Barclays U.S. Aggregate Index (“Index”). The Index is unmanaged, and does not reflect the deduction of fees associated with a mutual fund such as investment management and accounting fees. The Fund’s performance reflects the deduction of fees for these services. Investors cannot invest directly in an index although they can invest in the underlying securities. |
| Past performance does not guarantee future results. The performance data quoted represents past performance and current returns may be lower or higher. The investment return and principal value will fluctuate so that an investor’s shares, when redeemed, may be worth more or less than the original cost. To obtain performance information current to the most recent month end, please visit www.diamond-hill.com. |
DIAMOND HILL FUNDS | ANNUAL REPORT | DECEMBER 31, 2017 | DIAMOND-HILL.COM 33 |
Diamond Hill Corporate Credit Fund |
2017 Portfolio Commentary
The Diamond Hill Corporate Credit Fund (Class I) generated a 7.87% total return in 2017 compared to 6.66% for the ICE Bank of America Merrill Lynch U.S. Corporate & High Yield Index. For the trailing five years, the Fund generated an annualized total return of 5.78% compared to 3.94% for the Corporate & High Yield Index.
Unlike most corporate bond funds, the Diamond Hill Corporate Credit Fund is not managed against any index. Instead, the Fund is managed against absolute objectives within a range of (1) inflation plus 3% and (2) 7% nominal, each measured over rolling five-year periods. Our goal is to generate a yield and total return within that range while minimizing the risk of downside volatility over longer time periods. Although the Fund’s investable universe (and the Corporate & High Yield Index) includes both investment grade and high yield corporate bonds, since early 2010 the Fund has been largely focused on the high yield portion of the market to achieve these objectives. About 90% of the Fund was in high yield corporate bonds at the end of 2017.
The high yield portion of the U.S. corporate bond market, as represented by the ICE Bank of America Merrill Lynch U.S. High Yield Index, began the year with a yield to worst (YTW) of 6.17% and option-adjusted spread (OAS) of 422 basis points. After generating a 7.48% total return in 2017, the High Yield Index ended the year with a 5.84% YTW and OAS of 363 basis points.
With both investment grade fixed income and equities generating strong returns in 2017, it is not surprising that high yield also did well. High yield also benefited from a default rate that declined materially during the year to a level below half the historic average. Like most other major asset classes, volatility in the high yield market was muted during 2017. The most notable bout of volatility, which may have been imperceptible to non-specialists, lasted from October 24 to November 15, when the OAS of the High Yield Index widened about 60 basis points due primarily to weakness in the telecom and cable industries. As soon as the YTW hit 6% on November 15, the High Yield Index rebounded and more than half of the spread widening was reversed by the end of the year. From October 24 through year-end, the High Yield Index was just slightly negative at -14 basis points. The Fund performed well during this minor test, generating a total return of 66 basis points. It helped that we were positioned defensively entering that period and over 3% of the Fund was called (Bankrate 6.125% due 2018 and Synovus 7.875% due 2019), putting us in a strong position to take advantage of some opportunities including one particularly attractive new issue, Welltec 9.5% due 2022.
The high yield market is priced for continued low defaults and muted volatility. The Fund’s YTW is typically somewhere in the range of our absolute objectives, although it was well below the low end of the range on June 30, 2014 (the peak of that high yield market cycle) and well above the high end of the range on February 11, 2016 (the most recent bottom of the high yield market). At year-end, the Fund’s YTW was 5.10%. The Fund’s duration was 2.92, in the middle of the typical 2.0-3.5 range and well below the High Yield Index duration of 4.04 and the Corporate & High Yield Index duration of 6.75.
34 DIAMOND HILL FUNDS | ANNUAL REPORT | DECEMBER 31, 2017 | DIAMOND-HILL.COM |
Diamond Hill Corporate Credit Fund |
With a YTW towards the low end of the Fund’s objectives and a duration below 3, the Fund’s positioning reflects a high yield market that, like other asset classes, does not offer an abundance of values. Because we don’t manage against any index and we have a five-year time horizon, we have no incentive to chase an overvalued market. This advantage was very apparent in 2015 and we expect that it will serve us well when volatility comes back to the high yield market. In the meantime, we continue to work closely with the deep and talented Diamond Hill research team, and we have the conviction to concentrate in our best ideas even if they are low weightings in any high yield index. We are also selective participants in the high yield new-issue market, participating in approximately 5% of new issues in 2017. We never want to grow so large that we become reliant on the new-issue market to put the Fund’s capital to work, but we are always ready to make meaningful commitments if we like the price and the credit.
We believe that our unique and durable competitive advantages — we don’t manage against a benchmark, the deep and talented Diamond Hill research team, the flexibility to be nimble in the secondary market and selective in the new issue market, concentration in our best ideas, and patient shareholders who share our long-term time horizon — have allowed us to generate a yield and total return in the range of our objectives without undue risk.
We are patiently waiting for the next bout of volatility and illiquidity to present opportunities, whether on a company, industry, or market-wide basis. Our structural advantages have been designed to allow us to capitalize on these situations when they inevitably arise. We are deeply appreciative of our many long-term shareholders who understand this dynamic. Our partnership with you continues to be one of our most important advantages.

| 
|
Bill Zox, CFA
Portfolio Manager | John McClain, CFA
Portfolio Manager |
DIAMOND HILL FUNDS | ANNUAL REPORT | DECEMBER 31, 2017 | DIAMOND-HILL.COM 35 |
Diamond Hill Corporate Credit Fund |
AVERAGE ANNUAL TOTAL RETURNS AS OF DECEMBER 31, 2017
| Inception
Date | One
Year | Three
Years | Five
Years | Ten
Years | Expense
Ratio* |
PERFORMANCE AT NAV WITHOUT SALES CHARGES |
Class A Shares | 9/30/2002 | 7.56% | 6.80% | 5.51% | 6.76% | 0.92% |
Class C Shares | 9/30/2002 | 6.77 | 6.00 | 4.71 | 5.96 | 1.67 |
Class I Shares | 1/31/2005 | 7.87 | 7.10 | 5.78 | 7.07 | 0.63 |
Class Y Shares | 12/30/2011 | 7.89 | 7.19 | 5.91 | 7.00 | 0.51 |
BENCHMARK |
ICE BofAML U.S. Corporate & High Yield Index | | 6.66 | 4.34 | 3.94 | 6.02 | — |
Consumer Price Index - All Urban Consumers from the Bureau of Labor Statistics plus 3% annual risk premium | | 5.11 | 4.64 | 4.43 | 4.61 | — |
PERFORMANCE AT PUBLIC OFFERING PRICE INCLUDING SALES CHARGES** |
Class A Shares | 9/30/2002 | 3.82 | 5.53 | 4.75 | 6.38 | 0.92 |
Class C Shares | 9/30/2002 | 5.77 | 6.00 | 4.71 | 5.96 | 1.67 |
| * | Reflects the expense ratio as reported in the Prospectus dated February 28, 2018 |
| ** | The maximum sales charge for Class A shares on purchases and for Class C shares on certain redemptions are 3.50% and 1.00%, respectively. |
GROWTH OF $10,000
Comparison of the change in value of a $10,000 Investment in the Diamond Hill Corporate Credit Fund Class I(A), ICE BofAML U.S. Corporate & High Yield Index, and Consumer Price Index - All Urban Consumers from the Bureau of Labor Statistics plus 3% annual risk premium.
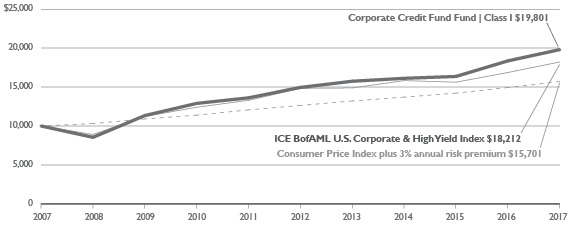
(A) | The growth of $10,000 chart represents the performance of Class I shares only, which will vary from the performance of Class A, Class C and Class Y shares based on the difference in loads and fees paid by shareholders in the different classes. |
| The performance of the above Fund does not reflect the deduction of taxes that a shareholder would pay on Fund distributions or the redemption of Fund shares. |
| The chart above represents a comparison of a hypothetical $10,000 investment and the reinvestment of dividends and capital gains in the indicated share class versus a similar investment in the ICE BofAML U.S. Corporate & High Yield Index and the Consumer Price Index — All Urban Consumers from the Bureau of Labor Statistics (CPI) plus 3% risk premium. The ICE BofAML U.S. Corporate & High Yield Index tracks the performance of the U.S. dollar denominated investment grade and below investment grade corporate debt publically issued in the U.S. domestic market. The CPI is an economic metric that measures prices for a basket of goods and services sold to urban consumers. The CPI is increased by a 3 percent risk premium to correspond with the Fund’s long-term goals of achieving returns above the rate of inflation. All indices are unmanaged, and do not reflect the deduction of fees associated with a mutual fund such as investment management and accounting fees. The Fund’s performance reflects the deduction of fees for these services. Investors cannot invest directly in an index although they can invest in the underlying securities. |
| Historical performance for Class Y shares prior to its inception is based on the performance of Class A shares. Class Y performance has been adjusted to reflect differences in sales charges and expenses between classes. |
| Past performance does not guarantee future results. The performance data quoted represents past performance and current returns may be lower or higher. The investment return and principal value will fluctuate so that an investor’s shares, when redeemed, may be worth more or less than the original cost. To obtain performance information current to the most recent month end, please visit www.diamond-hill.com. This material must be preceded or accompanied by a current prospectus. |
36 DIAMOND HILL FUNDS | ANNUAL REPORT | DECEMBER 31, 2017 | DIAMOND-HILL.COM |
Diamond Hill High Yield Fund |
2017 Portfolio Commentary
The Diamond Hill High Yield Fund (Class I) generated a 10.36% return in 2017 compared to a 7.48% return for the ICE Bank of America Merrill Lynch U.S. High Yield Index. Since its inception on December 4, 2014, the Fund generated an annualized return of 8.17% compared to 6.02% for the Index. While we are pleased with the Fund’s relative performance, it is important to note that the High Yield Index is not an investable alternative. Over a five-year time horizon, performance relative to peers will be the best metric to evaluate the Fund.
The High Yield Index began the year with a yield to worst (YTW) of 6.17% and option-adjusted spread (OAS) of 422 basis points. At the end of the year, the YTW was 5.84% and the OAS was 363 basis points.
With both investment grade fixed income and equities generating strong returns in 2017, it is not surprising that high yield also did well. High yield also benefited from a default rate that declined materially during the year to a level below half the historic average. Like most other major asset classes, volatility in the high yield market was muted during 2017. The most notable bout of volatility, which may have been imperceptible to non-specialists, lasted from October 24 to November 15, when the OAS of the High Yield Index widened about 60 basis points due primarily to weakness in the telecom and cable industries. As soon as the YTW hit 6% on November 15, the High Yield Index rebounded and more than half of the spread widening was reversed by the end of the year. From October 24 through year-end, the High Yield Index was just slightly negative at -14 basis points. The Fund performed well during this minor test, generating a total return of 89 basis points. It helped that we look very different than the market and that a close-to 3% position in Bankrate 6.125% due 2018 was called, putting us in a strong position to take advantage of some opportunities including one particularly attractive new issue, Welltec 9.5% due 2022.
The high yield market is priced for continued low defaults and muted volatility. Because we have a five-year time horizon, we have no incentive to chase an overvalued market. This advantage was very apparent in 2015 and we expect that it will serve us well when volatility comes back to the high yield market. In the meantime, we continue to work closely with the deep and talented Diamond Hill research team, and we have the conviction to concentrate in our best ideas even if they are low weightings in any high yield index. We are also selective participants in the high yield new-issue market, participating in approximately 5% of new issues in 2017. We never want to grow so large that we become reliant on the new-issue market to put the Fund’s capital to work, but we are always ready to make meaningful commitments if we like the price and the credit.
We believe that we have unique and durable competitive advantages: we have a deep and talented Diamond Hill research team; we have the flexibility to be nimble in the secondary market and selective in the new issue market; the Fund is concentrated in our best ideas; and we have patient shareholders who share our long-term time horizon. These advantages have allowed us to deliver good performance since inception and have positioned us well to achieve our primary goal of being in the top quartile of our peer group over rolling five-year periods.
DIAMOND HILL FUNDS | ANNUAL REPORT | DECEMBER 31, 2017 | DIAMOND-HILL.COM 37 |
Diamond Hill High Yield Fund |
We appreciate your ongoing support and look forward to continuing to work with you in the coming years.

| 
|
Bill Zox, CFA
Portfolio Manager | John McClain, CFA
Portfolio Manager |
38 DIAMOND HILL FUNDS | ANNUAL REPORT | DECEMBER 31, 2017 | DIAMOND-HILL.COM |
Diamond Hill High Yield Fund |
AVERAGE ANNUAL TOTAL RETURNS AS OF DECEMBER 31, 2017
| Inception
Date | One
Year | Three
Year | Since Inception | Expense
Ratio* |
PERFORMANCE AT NAV WITHOUT SALES CHARGES |
Class A Shares | 12/4/2014 | 9.96% | 7.91% | 7.83% | 0.96% |
Class I Shares | 12/4/2014 | 10.36 | 8.25 | 8.17 | 0.67 |
Class Y Shares | 12/4/2014 | 10.48 | 8.36 | 8.28 | 0.55 |
BENCHMARK |
ICE BofAML U.S. High Yield Index | | 7.48 | 6.39 | 6.02 | — |
PERFORMANCE AT PUBLIC OFFERING PRICE INCLUDING SALES CHARGES** |
Class A Shares | 12/4/2014 | 6.07 | 6.65 | 6.59 | 0.96 |
| * | Reflects the expense ratio as reported in the Prospectus dated February 28, 2018. |
| ** | The maximum sales charge for Class A shares on purchases is 3.50%. |
GROWTH OF $10,000
Comparison of the change in value of a $10,000 Investment in the Diamond Hill High Yield Fund Class I(A) and ICE BofAML U.S. High Yield Index.
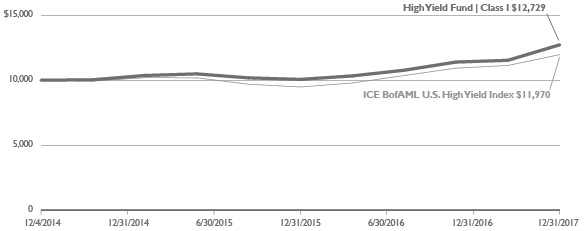
(A) | The growth of $10,000 chart represents the performance of Class I shares only, which will vary from the performance of Class A and Class Y shares based on the difference in loads and fees paid by shareholders in the different classes. |
| The performance of the above Fund does not reflect the deduction of taxes that a shareholder would pay on Fund distributions or the redemption of Fund shares. |
| The quoted performance for the Fund reflects the past performance of Diamond Hill High Yield Fund L.P. (the “High Yield Partnership”), a private fund managed with full investment authority by the fund’s Adviser. The Fund is managed in all material respects in a manner equivalent to the management of the predecessor unregistered fund. The assets of the High Yield Partnership were converted into assets of the fund prior to commencement of operation of the fund. The performance of the High Yield Partnership has been restated to reflect the net expenses and maximum applicable sales charge of the fund for its initial years of investment operations. The High Yield Partnership was not registered under the Investment Company Act of 1940 and therefore was not subject to certain investment restrictions imposed by the 1940 Act. If the High Yield Partnership had been registered under the 1940 Act, its performance may have been adversely affected. Performance is measured from December 4, 2014, the inception of the High Yield Partnership and is not the performance of the fund. The High Yield Partnership’s past performance is not necessarily an indication of how the fund will perform in the future either before or after taxes |
| The chart above represents a comparison of a hypothetical $10,000 investment and the reinvestment of dividends and capital gains in the indicated share class versus a similar investment in the ICE BofAML U.S. High Yield Index. (“Index”). The Index is unmanaged, and does not reflect the deduction of fees associated with a mutual fund such as investment management and accounting fees. The Fund’s performance reflects the deduction of fees for these services. Investors cannot invest directly in an index although they can invest in the underlying securities. |
| Past performance does not guarantee future results. The performance data quoted represents past performance and current returns may be lower or higher. The investment return and principal value will fluctuate so that an investor’s shares, when redeemed, may be worth more or less than the original cost. To obtain performance information current to the most recent month end, please visit www.diamond-hill.com. This material must be preceded or accompanied by a current prospectus. |
DIAMOND HILL FUNDS | ANNUAL REPORT | DECEMBER 31, 2017 | DIAMOND-HILL.COM 39 |
Diamond Hill Small Cap Fund
Schedule of Investments
December 31, 2017
| | | Shares | | | Fair
Value | |
| Common Stocks — 85.3% |
| Consumer Discretionary — 13.0% |
| Aaron's, Inc. | | | 550,082 | | | $ | 21,920,768 | |
| Callaway Golf Co. | | | 269,637 | | | | 3,756,043 | |
| Carter's, Inc. | | | 127,496 | | | | 14,979,505 | |
Horizon Global Corp. (a)(b) | | | 157,014 | | | | 2,201,336 | |
Live Nation Entertainment, Inc. (b) | | | 991,960 | | | | 42,227,737 | |
Red Rock Resorts, Inc., Class A (a) | | | 986,235 | | | | 33,275,569 | |
| Tenneco, Inc. | | | 491,950 | | | | 28,798,753 | |
| Vail Resorts, Inc. | | | 218,165 | | | | 46,353,518 | |
| | | | | | | | 193,513,229 | |
| | | | | | | | | |
| Consumer Staples — 4.9% |
B&G Foods, Inc. (a) | | | 702,270 | | | | 24,684,791 | |
Edgewell Personal Care Co. (a)(b) | | | 153,170 | | | | 9,096,766 | |
| Flowers Foods, Inc. | | | 927,465 | | | | 17,909,349 | |
Post Holdings, Inc. (b) | | | 262,200 | | | | 20,774,106 | |
| | | | | | | | 72,465,012 | |
| | | | | | | | | |
| Energy — 3.5% | | | | | | | | |
Carrizo Oil & Gas, Inc. (a)(b) | | | 141,776 | | | | 3,016,993 | |
| Cimarex Energy Co. | | | 323,410 | | | | 39,459,254 | |
Linn Energy, Inc. (b) | | | 123,773 | | | | 4,981,863 | |
| Noble Energy, Inc. | | | 146,965 | | | | 4,282,560 | |
| | | | | | | | 51,740,670 | |
| | | | | | | | | |
| Financials — 20.5% | | | | | | | | |
Alleghany Corp. (b) | | | 21,708 | | | | 12,939,922 | |
| Assured Guaranty Ltd. | | | 70,956 | | | | 2,403,280 | |
| BankUnited, Inc. | | | 924,040 | | | | 37,626,909 | |
| BOK Financial Corp. | | | 164,360 | | | | 15,173,715 | |
| Brown & Brown, Inc. | | | 617,590 | | | | 31,781,181 | |
Enstar Group Ltd. (b) | | | 138,377 | | | | 27,779,183 | |
| First Horizon National Corp. | | | 732,955 | | | | 14,651,771 | |
| First of Long Island Corp. (The) | | | 359,105 | | | | 10,234,493 | |
Nationstar Mortgage Holdings, Inc. (a)(b) | | | 1,378,000 | | | | 25,493,000 | |
| Navigators Group, Inc. (The) | | | 664,455 | | | | 32,358,959 | |
| Popular, Inc. | | | 758,660 | | | | 26,924,843 | |
| ProAssurance Corp. | | | 335,860 | | | | 19,194,399 | |
| Reinsurance Group of America, Inc. | | | 74,475 | | | | 11,612,887 | |
| State Bank Financial Corp. | | | 360,015 | | | | 10,742,848 | |
| Sterling Bancorp | | | 619,322 | | | | 15,235,321 | |
| Validus Holdings Ltd. | | | 249,900 | | | | 11,725,308 | |
| | | | | | | | 305,878,019 | |
| | | | | | | | | |
| Health Care — 3.4% | | | | | | | | |
BioScrip, Inc. (a)(b) | | | 3,406,085 | | | | 9,911,707 | |
Integer Holdings Corp. (b) | | | 128,225 | | | | 5,808,593 | |
LifePoint Health, Inc. (b) | | | 322,800 | | | | 16,075,440 | |
Natus Medical, Inc. (b) | | | 498,080 | | | | 19,026,656 | |
| | | | | | | | 50,822,396 | |
| | | | | | | | | |
| Industrials — 20.4% | | | | | | | | |
| Aircastle Ltd. | | | 1,302,467 | | | | 30,464,703 | |
| Alaska Air Group, Inc. | | | 269,335 | | | | 19,798,816 | |
Allegiant Travel Co. (a) | | | 101,938 | | | | 15,774,906 | |
Avis Budget Group, Inc. (a)(b) | | | 1,909,842 | | | | 83,803,867 | |
Colfax Corp. (b) | | | 282,415 | | | | 11,189,282 | |
| Hillenbrand, Inc. | | | 88,870 | | | | 3,972,489 | |
Hub Group, Inc., Class A (b) | | | 698,306 | | | | 33,448,857 | |
| Hyster-Yale Materials Handling, Inc. | | | 168,895 | | | | 14,383,098 | |
Kirby Corp. (b) | | | 213,585 | | | | 14,267,478 | |
SPX FLOW, Inc. (b) | | | 404,630 | | | | 19,240,157 | |
| Toro Co. (The) | | | 182,295 | | | | 11,891,103 | |
TriMas Corp. (b) | | | 262,160 | | | | 7,012,780 | |
| Trinity Industries, Inc. | | | 1,043,140 | | | | 39,076,024 | |
| | | | | | | | 304,323,560 | |
| | | | | | | | | |
| Information Technology — 9.2% |
Anixter International, Inc. (b) | | | 39,707 | | | | 3,017,732 | |
| Broadridge Financial Solutions, Inc. | | | 206,680 | | | | 18,721,074 | |
CommScope Holding Co., Inc. (b) | | | 711,100 | | | | 26,900,913 | |
| DST Systems, Inc. | | | 785,830 | | | | 48,776,468 | |
Fortinet, Inc. (b) | | | 303,761 | | | | 13,271,318 | |
Sanmina Corp. (b) | | | 297,032 | | | | 9,802,056 | |
| TiVo Corp. | | | 442,955 | | | | 6,910,098 | |
WNS Holdings Ltd. - ADR (b) | | | 256,418 | | | | 10,290,054 | |
| | | | | | | | 137,689,713 | |
40 DIAMOND HILL FUNDS | ANNUAL REPORT | DECEMBER 31, 2017 | DIAMOND-HILL.COM |
Diamond Hill Small Cap Fund
Schedule of Investments (Continued)
December 31, 2017
| | | Shares | | | Fair
Value | |
| Common Stocks — 85.3% continued |
| Real Estate — 7.5% | | | | | | |
| Colony NorthStar, Inc. REIT, Class A | | | 1,106,629 | | | $ | 12,626,637 | |
| CubeSmart REIT | | | 511,415 | | | | 14,790,122 | |
iStar, Inc. REIT (a)(b) | | | 3,092,060 | | | | 34,940,278 | |
| Jones Lang LaSalle, Inc. | | | 79,282 | | | | 11,807,468 | |
| Mid-America Apartment Communities, Inc. REIT | | | 116,331 | | | | 11,698,245 | |
Tanger Factory Outlet Centers, Inc. REIT (a) | | | 461,700 | | | | 12,239,667 | |
Winthrop Realty Trust REIT (a)(b)(c) | | | 1,975,475 | | | | 14,144,401 | |
| | | | | | | | 112,246,818 | |
| | | | | | | | | |
| Telecommunication Services — 0.7% |
Cincinnati Bell, Inc. (a)(b) | | | 484,184 | | | | 10,095,236 | |
| | | | | | | | | |
| Utilities — 2.2% | | | | | | | | |
Fortis, Inc. (a) | | | 218,061 | | | | 7,996,297 | |
| UGI Corp. | | | 529,472 | | | | 24,858,710 | |
| | | | | | | | 32,855,007 | |
| | | | | | | | | |
| Total Common Stocks | | | | | | $ | 1,271,629,660 | |
| | | | | | | | | |
| Registered Investment Companies — 26.6% |
Diamond Hill Short Duration Total Return Fund, Class Y(d) | | | 5,609,429 | | | | 56,711,326 | |
State Street Institutional Liquid Reserves Fund, Premier Class, 1.43%(e) | | | 158,385,132 | | | | 158,369,294 | |
State Street Navigator Securities Lending Portfolio I,1.49%(e) | | | 180,617,431 | | | | 180,617,431 | |
| | | | | | | | | |
| Total Registered Investment Companies | | | | | | $ | 395,698,051 | |
| | | | | | | | | |
| Total Investment Securities — 111.9% |
| (Cost $1,199,823,625) | | | | | | $ | 1,667,327,711 | |
| | | | | | | | | |
| Net Other Assets (Liabilities) — (11.9)% | | | | | | | (177,264,750 | ) |
| | | | | | | | | |
| Net Assets — 100.0% | | | | | | $ | 1,490,062,961 | |
(a) | All or a portion of the security is on loan. The total fair value of the securities on loan as of December 31, 2017 was $174,409,434. |
(b) | Non-income producing security. |
(c) | Restricted and illiquid security not registered under the Securities Act of 1933 and valued at fair value by the Fair Value Committee based on procedures approved by the Board of Trustees. This security was first acquired on March 17, 2011 with a total cost on December 31, 2017 of $20,011,748 and represents 0.9% of net assets. |
(e) | The rate shown is the effective interest rate as of December 31, 2017. |
ADR – American Depositary Receipt
REIT – Real Estate Investment Trust
See accompanying Notes to Financial Statements.
DIAMOND HILL FUNDS | ANNUAL REPORT | DECEMBER 31, 2017 | DIAMOND-HILL.COM 41 |
Diamond Hill Small-Mid Cap Fund
Schedule of Investments
December 31, 2017
| | | Shares | | | Fair
Value | |
| Common Stocks — 91.1% |
| Consumer Discretionary — 14.8% |
| Aaron's, Inc. | | | 1,099,304 | | | $ | 43,807,264 | |
| BorgWarner, Inc. | | | 1,443,520 | | | | 73,749,437 | |
| Goodyear Tire & Rubber Co. (The) | | | 763,090 | | | | 24,655,438 | |
Hanesbrands, Inc. (a) | | | 1,526,344 | | | | 31,915,853 | |
NVR, Inc. (b) | | | 18,235 | | | | 63,972,392 | |
Red Rock Resorts, Inc., Class A (a) | | | 1,984,092 | | | | 66,943,264 | |
| TEGNA, Inc. | | | 2,664,019 | | | | 37,509,388 | |
| Whirlpool Corp. | | | 180,205 | | | | 30,389,771 | |
| | | | | | | | 372,942,807 | |
| | | | | | | | | |
| Consumer Staples — 9.5% |
B&G Foods, Inc. (a) | | | 1,359,970 | | | | 47,802,946 | |
Coty, Inc., Class A (a) | | | 1,211,589 | | | | 24,098,505 | |
Edgewell Personal Care Co. (a)(b) | | | 372,736 | | | | 22,136,791 | |
Flowers Foods, Inc. (a) | | | 1,919,070 | | | | 37,057,242 | |
| Molson Coors Brewing Co., Class B | | | 400,178 | | | | 32,842,608 | |
Post Holdings, Inc. (b) | | | 764,858 | | | | 60,599,699 | |
TreeHouse Foods, Inc. (a)(b) | | | 269,975 | | | | 13,352,964 | |
| | | | | | | | 237,890,755 | |
| | | | | | | | | |
| Energy — 2.8% | | | | | | | | |
| Cimarex Energy Co. | | | 586,481 | | | | 71,556,547 | |
| | | | | | | | | |
| Financials — 25.3% | | | | | | | | |
| BankUnited, Inc. | | | 2,203,228 | | | | 89,715,444 | |
| BOK Financial Corp. | | | 561,929 | | | | 51,877,285 | |
Brighthouse Financial, Inc. (b) | | | 326,350 | | | | 19,137,164 | |
| Brown & Brown, Inc. | | | 706,605 | | | | 36,361,893 | |
Enstar Group Ltd. (b) | | | 78,920 | | | | 15,843,190 | |
| First Horizon National Corp. | | | 1,739,541 | | | | 34,773,425 | |
| First Republic Bank | | | 423,550 | | | | 36,696,372 | |
Nationstar Mortgage Holdings, Inc. (b) | | | 2,589,619 | | | | 47,907,951 | |
| Navigators Group, Inc. (The) | | | 437,474 | | | | 21,304,984 | |
| Popular, Inc. | | | 715,658 | | | | 25,398,702 | |
| Reinsurance Group of America, Inc. | | | 255,753 | | | | 39,879,565 | |
SVB Financial Group (b) | | | 157,643 | | | | 36,852,204 | |
| Validus Holdings Ltd. | | | 1,072,925 | | | | 50,341,641 | |
| Willis Towers Watson plc | | | 624,235 | | | | 94,065,972 | |
XL Group Ltd. (a) | | | 982,047 | | | | 34,528,773 | |
| | | | | | | | 634,684,565 | |
| | | | | | | | | |
| Health Care — 4.6% | | | | | | | | |
Boston Scientific Corp. (b) | | | 2,065,208 | | | | 51,196,506 | |
LifePoint Health, Inc. (b) | | | 910,939 | | | | 45,364,762 | |
Orthofix International NV (b) | | | 353,754 | | | | 19,350,344 | |
| | | | | | | | 115,911,612 | |
| | | | | | | | | |
| Industrials — 11.6% | | | | | | | | |
| Aircastle Ltd. | | | 742,035 | | | | 17,356,199 | |
Allegiant Travel Co. (a) | | | 213,756 | | | | 33,078,741 | |
Avis Budget Group, Inc. (a)(b) | | | 817,730 | | | | 35,881,992 | |
Colfax Corp. (b) | | | 919,496 | | | | 36,430,432 | |
Hub Group, Inc., Class A (b) | | | 1,364,577 | | | | 65,363,238 | |
Kirby Corp. (b) | | | 829,014 | | | | 55,378,135 | |
| Parker-Hannifin Corp. | | | 97,920 | | | | 19,542,874 | |
SPX FLOW, Inc. (b) | | | 621,051 | | | | 29,530,975 | |
| | | | | | | | 292,562,586 | |
| | | | | | | | | |
| Information Technology — 9.0% |
| Avnet, Inc. | | | 688,180 | | | | 27,265,692 | |
| Broadridge Financial Solutions, Inc. | | | 165,670 | | | | 15,006,389 | |
CommScope Holding Co., Inc. (b) | | | 893,533 | | | | 33,802,353 | |
| Juniper Networks, Inc. | | | 1,951,013 | | | | 55,603,871 | |
Keysight Technologies, Inc. (b) | | | 630,915 | | | | 26,246,064 | |
Sanmina Corp. (b) | | | 385,019 | | | | 12,705,627 | |
Vantiv, Inc., Class A (a)(b) | | | 740,525 | | | | 54,465,614 | |
| | | | | | | | 225,095,610 | |
| | | | | | | | | |
| Materials — 2.8% | | | | | | | | |
Axalta Coating Systems Ltd. (b) | | | 2,140,629 | | | | 69,270,754 | |
| | | | | | | | | |
| Real Estate — 8.2% | | | | | | | | |
| American Campus Communities, Inc. REIT | | | 960,595 | | | | 39,413,213 | |
| Colony NorthStar, Inc. REIT, Class A | | | 1,154,186 | | | | 13,169,262 | |
| CubeSmart REIT | | | 2,048,715 | | | | 59,248,838 | |
iStar, Inc. REIT (a)(b) | | | 2,125,926 | | | | 24,022,964 | |
| Jones Lang LaSalle, Inc. | | | 284,010 | | | | 42,297,609 | |
| Mid-America Apartment Communities, Inc. REIT | | | 279,799 | | | | 28,136,587 | |
| | | | | | | | 206,288,473 | |
42 DIAMOND HILL FUNDS | ANNUAL REPORT | DECEMBER 31, 2017 | DIAMOND-HILL.COM |
Diamond Hill Small-Mid Cap Fund
Schedule of Investments (Continued)
December 31, 2017
| | | Shares | | | Fair
Value | |
| Common Stocks — 91.1% continued |
| Utilities — 2.5% | | | | | | |
Fortis, Inc. (a) | | | 366,412 | | | $ | 13,436,328 | |
| UGI Corp. | | | 1,059,659 | | | | 49,750,990 | |
| | | | | | | | 63,187,318 | |
| | | | | | | | | |
| Total Common Stocks | | | | | | $ | 2,289,391,027 | |
| | | | | | | | | |
| Registered Investment Companies — 17.4% |
Diamond Hill Short Duration Total Return Fund, Class Y(c) | | | 4,675,613 | | | | 47,270,443 | |
State Street Institutional Liquid Reserves Fund, Premier Class, 1.43%(d) | | | 121,482,552 | | | | 121,470,404 | |
State Street Institutional US Government Money Market Fund, Premier Class, 1.20%(d) | | | 47,643,120 | | | | 47,643,120 | |
State Street Navigator Securities Lending Portfolio I, 1.49%(d) | | | 219,930,698 | | | | 219,930,698 | |
| | | | | | | | | |
| Total Registered Investment Companies | | | | | | $ | 436,314,665 | |
| | | | | | | | | |
| Total Investment Securities — 108.5% |
| (Cost $2,256,458,678) | | | | | | $ | 2,725,705,692 | |
| | | | | | | | | |
| Net Other Assets (Liabilities) — (8.5)% | | | | | | | (212,902,327 | ) |
| | | | | | | | | |
| Net Assets — 100.0% | | | | | | $ | 2,512,803,365 | |
(a) | All or a portion of the security is on loan. The total fair value of the securities on loan as of December 31, 2017 was $213,571,072. |
(b) | Non-income producing security. |
(d) | The rate shown is the effective interest rate as of December 31, 2017. |
NV – Naamloze Vennootschap
plc – Public Limited Company
REIT – Real Estate Investment Trust
See accompanying Notes to Financial Statements.
Diamond Hill Mid Cap Fund
Schedule of Investments
December 31, 2017
| | | Shares | | | Fair
Value | |
| Common Stocks — 90.3% |
| Consumer Discretionary — 16.9% |
| Aaron's, Inc. | | | 25,885 | | | $ | 1,031,517 | |
| BorgWarner, Inc. | | | 71,628 | | | | 3,659,475 | |
| Dollar General Corp. | | | 25,383 | | | | 2,360,873 | |
| Goodyear Tire & Rubber Co. (The) | | | 33,215 | | | | 1,073,177 | |
Hanesbrands, Inc. (a) | | | 59,338 | | | | 1,240,758 | |
NVR, Inc. (b) | | | 891 | | | | 3,125,824 | |
| Red Rock Resorts, Inc., Class A | | | 93,799 | | | | 3,164,778 | |
| TEGNA, Inc. | | | 58,166 | | | | 818,977 | |
| VF Corp. | | | 31,877 | | | | 2,358,898 | |
| Whirlpool Corp. | | | 10,753 | | | | 1,813,386 | |
| | | | | | | | 20,647,663 | |
| | | | | | | | | |
| Consumer Staples — 8.8% |
B&G Foods, Inc. (a) | | | 32,293 | | | | 1,135,099 | |
Coty, Inc., Class A (a) | | | 65,588 | | | | 1,304,545 | |
Edgewell Personal Care Co. (b) | | | 15,795 | | | | 938,065 | |
| Flowers Foods, Inc. | | | 71,932 | | | | 1,389,007 | |
| Molson Coors Brewing Co., Class B | | | 31,572 | | | | 2,591,114 | |
Post Holdings, Inc. (b) | | | 34,966 | | | | 2,770,356 | |
TreeHouse Foods, Inc. (a)(b) | | | 11,049 | | | | 546,484 | |
| | | | | | | | 10,674,670 | |
| | | | | | | | | |
| Energy — 2.9% | | | | | | | | |
| Cimarex Energy Co. | | | 28,535 | | | | 3,481,555 | |
| | | | | | | | | |
| Financials — 28.1% | | | | | | | | |
| BankUnited, Inc. | | | 107,690 | | | | 4,385,137 | |
| BOK Financial Corp. | | | 15,510 | | | | 1,431,883 | |
| Brown & Brown, Inc. | | | 13,231 | | | | 680,867 | |
| Discover Financial Services | | | 39,777 | | | | 3,059,647 | |
Enstar Group Ltd. (b) | | | 4,081 | | | | 819,261 | |
| First Horizon National Corp. | | | 38,204 | | | | 763,698 | |
| First Republic Bank | | | 17,149 | | | | 1,485,789 | |
| Franklin Resources, Inc. | | | 35,974 | | | | 1,558,753 | |
| Hartford Financial Services Group, Inc. (The) | | | 28,749 | | | | 1,617,994 | |
| Loews Corp. | | | 112,697 | | | | 5,638,231 | |
Nationstar Mortgage Holdings, Inc. (b) | | | 91,516 | | | | 1,693,046 | |
| Popular, Inc. | | | 27,355 | | | | 970,829 | |
DIAMOND HILL FUNDS | ANNUAL REPORT | DECEMBER 31, 2017 | DIAMOND-HILL.COM 43 |
Diamond Hill Mid Cap Fund
Schedule of Investments (Continued)
December 31, 2017
| | | Shares | | | Fair
Value | |
| Common Stocks — 90.3% continued |
| Financials — 28.1% continued |
| Reinsurance Group of America, Inc. | | | 6,563 | | | $ | 1,023,369 | |
SVB Financial Group (b) | | | 7,033 | | | | 1,644,104 | |
| Validus Holdings Ltd. | | | 51,672 | | | | 2,424,450 | |
| Willis Towers Watson plc | | | 24,109 | | | | 3,632,985 | |
| XL Group Ltd. | | | 42,533 | | | | 1,495,460 | |
| | | | | | | | 34,325,503 | |
| | | | | | | | | |
| Health Care — 4.0% | | | | | | | | |
Boston Scientific Corp. (b) | | | 106,747 | | | | 2,646,258 | |
LifePoint Health, Inc. (b) | | | 45,476 | | | | 2,264,705 | |
| | | | | | | | 4,910,963 | |
| | | | | | | | | |
| Industrials — 11.8% | | | | | | | | |
Avis Budget Group, Inc. (a)(b) | | | 36,336 | | | | 1,594,424 | |
Colfax Corp. (b) | | | 26,168 | | | | 1,036,776 | |
| Deere & Co. | | | 10,797 | | | | 1,689,839 | |
Fastenal Co. (a) | | | 33,656 | | | | 1,840,647 | |
Hub Group, Inc., Class A (b) | | | 35,670 | | | | 1,708,593 | |
Kirby Corp. (b) | | | 36,112 | | | | 2,412,282 | |
| Parker-Hannifin Corp. | | | 5,328 | | | | 1,063,362 | |
United Continental Holdings, Inc. (b) | | | 29,401 | | | | 1,981,627 | |
Verisk Analytics, Inc. (b) | | | 11,780 | | | | 1,130,880 | |
| | | | | | | | 14,458,430 | |
| | | | | | | | | |
| Information Technology — 7.2% |
| Avnet, Inc. | | | 32,273 | | | | 1,278,656 | |
CommScope Holding Co., Inc. (b) | | | 42,019 | | | | 1,589,579 | |
| Juniper Networks, Inc. | | | 91,609 | | | | 2,610,857 | |
Keysight Technologies, Inc. (b) | | | 24,785 | | | | 1,031,056 | |
Vantiv, Inc., Class A (a)(b) | | | 30,092 | | | | 2,213,267 | |
| | | | | | | | 8,723,415 | |
| | | | | | | | | |
| Materials — 2.9% | | | | | | | | |
Axalta Coating Systems Ltd. (b) | | | 108,170 | | | | 3,500,381 | |
| | | | | | | | | |
| Real Estate — 6.1% | | | | | | | | |
| American Campus Communities, Inc. REIT | | | 35,947 | | | | 1,474,905 | |
| CubeSmart REIT | | | 95,502 | | | | 2,761,918 | |
| Jones Lang LaSalle, Inc. | | | 14,328 | | | | 2,133,869 | |
| Mid-America Apartment Communities, Inc. REIT | | | 11,115 | | | | 1,117,724 | |
| | | | | | | | 7,488,416 | |
| | | | | | | | | |
| Utilities — 1.6% | | | | | | | | |
| UGI Corp. | | | 42,211 | | | | 1,981,806 | |
| | | | | | | | | |
| Total Common Stocks | | | | | | $ | 110,192,802 | |
| | | | | | | | | |
| Registered Investment Companies — 16.9% |
Diamond Hill Short Duration Total Return Fund, Class Y(c) | | | 214,034 | | | | 2,163,880 | |
State Street Institutional Liquid Reserves Fund, Premier Class, 1.43%(d) | | | 7,710,084 | | | | 7,709,313 | |
State Street Institutional US Government Money Market Fund, Premier Class, 1.20%(d) | | | 2,136,264 | | | | 2,136,264 | |
State Street Navigator Securities Lending Portfolio I, 1.49%(d) | | | 8,641,780 | | | | 8,641,780 | |
| | | | | | | | | |
| Total Registered Investment Companies | | | | | | $ | 20,651,237 | |
| | | | | | | | | |
| Total Investment Securities — 107.2% |
| (Cost $115,951,505) | | | | | | $ | 130,844,039 | |
| | | | | | | | | |
| Net Other Assets (Liabilities) — (7.2)% | | | | | | | (8,750,481 | ) |
| | | | | | | | | |
| Net Assets — 100.0% | | | | | | $ | 122,093,558 | |
(a) | All or a portion of the security is on loan. The total fair value of the securities on loan as of December 31, 2017 was $8,396,015. |
(b) | Non-income producing security. |
(d) | The rate shown is the effective interest rate as of December 31, 2017. |
plc – Public Limited Company
REIT – Real Estate Investment Trust
See accompanying Notes to Financial Statements.
44 DIAMOND HILL FUNDS | ANNUAL REPORT | DECEMBER 31, 2017 | DIAMOND-HILL.COM |
Diamond Hill Large Cap Fund
Schedule of Investments
December 31, 2017
| | | Shares | | | Fair
Value | |
| Common Stocks — 98.5% |
| Consumer Discretionary — 17.4% |
| BorgWarner, Inc. | | | 2,157,317 | | | $ | 110,217,325 | |
Charter Communications, Inc., Class A (a) | | | 299,650 | | | | 100,670,414 | |
| Comcast Corp., Class A | | | 3,031,545 | | | | 121,413,377 | |
| Ford Motor Co. | | | 8,394,679 | | | | 104,849,541 | |
| Goodyear Tire & Rubber Co. (The) | | | 2,416,741 | | | | 78,084,902 | |
| Hanesbrands, Inc. | | | 2,891,491 | | | | 60,461,077 | |
| TEGNA, Inc. | | | 2,170,362 | | | | 30,558,697 | |
| TJX Cos., Inc. (The) | | | 1,812,501 | | | | 138,583,826 | |
| Twenty-First Century Fox, Inc., Class B | | | 849,730 | | | | 28,992,788 | |
| VF Corp. | | | 1,577,325 | | | | 116,722,050 | |
| Walt Disney Co. (The) | | | 813,156 | | | | 87,422,402 | |
| Whirlpool Corp. | | | 241,804 | | | | 40,777,827 | |
| | | | | | | | 1,018,754,226 | |
| | | | | | | | | |
| Consumer Staples — 11.8% |
Coty, Inc., Class A (b) | | | 2,641,169 | | | | 52,532,851 | |
Kimberly-Clark Corp. (b) | | | 1,087,729 | | | | 131,245,381 | |
| Molson Coors Brewing Co., Class B | | | 869,966 | | | | 71,398,110 | |
| PepsiCo, Inc. | | | 1,039,343 | | | | 124,638,013 | |
| Philip Morris International, Inc. | | | 1,608,281 | | | | 169,914,888 | |
| Procter & Gamble Co. (The) | | | 1,509,467 | | | | 138,689,828 | |
| | | | | | | | 688,419,071 | |
| | | | | | | | | |
| Energy — 3.8% | | | | | | | | |
| Cimarex Energy Co. | | | 1,165,826 | | | | 142,242,430 | |
| Devon Energy Corp. | | | 1,967,008 | | | | 81,434,131 | |
| | | | | | | | 223,676,561 | |
| | | | | | | | | |
| Financials — 27.6% | | | | | | | | |
Berkshire Hathaway, Inc., Class B (a) | | | 367,494 | | | | 72,844,661 | |
Brighthouse Financial, Inc. (a) | | | 923,536 | | | | 54,156,151 | |
| Citigroup, Inc. | | | 3,199,162 | | | | 238,049,644 | |
| Discover Financial Services | | | 2,776,750 | | | | 213,587,610 | |
| First Republic Bank | | | 602,591 | | | | 52,208,484 | |
| Franklin Resources, Inc. | | | 1,351,443 | | | | 58,558,025 | |
| Hartford Financial Services Group, Inc. (The) | | | 1,747,372 | | | | 98,342,096 | |
| JPMorgan Chase & Co. | | | 1,950,910 | | | | 208,630,315 | |
| Loews Corp. | | | 1,785,748 | | | | 89,340,972 | |
| Marsh & McLennan Cos., Inc. | | | 1,198,987 | | | | 97,585,552 | |
| MetLife, Inc. | | | 2,746,551 | | | | 138,865,619 | |
| Morgan Stanley | | | 3,325,323 | | | | 174,479,698 | |
| PNC Financial Services Group, Inc. (The) | | | 818,153 | | | | 118,051,296 | |
| | | | | | | | 1,614,700,123 | |
| | | | | | | | | |
| Health Care — 13.7% | | | | | | | | |
| Abbott Laboratories | | | 4,257,443 | | | | 242,972,272 | |
| Aetna, Inc. | | | 819,603 | | | | 147,848,185 | |
| Medtronic plc | | | 1,605,626 | | | | 129,654,299 | |
| Pfizer, Inc. | | | 4,558,440 | | | | 165,106,697 | |
| Thermo Fisher Scientific, Inc. | | | 617,387 | | | | 117,229,444 | |
| | | | | | | | 802,810,897 | |
| | | | | | | | | |
| Industrials — 8.3% | | | | | | | | |
Fastenal Co. (b) | | | 130,413 | | | | 7,132,287 | |
| Honeywell International, Inc. | | | 463,355 | | | | 71,060,123 | |
| Parker-Hannifin Corp. | | | 621,401 | | | | 124,019,212 | |
United Continental Holdings, Inc. (a) | | | 175,664 | | | | 11,839,754 | |
| United Technologies Corp. | | | 1,561,149 | | | | 199,155,778 | |
Verisk Analytics, Inc. (a)(b) | | | 756,675 | | | | 72,640,800 | |
| | | | | | | | 485,847,954 | |
| | | | | | | | | |
| Information Technology — 12.1% |
Alphabet, Inc., Class A (a) | | | 172,659 | | | | 181,878,991 | |
| Apple, Inc. | | | 805,867 | | | | 136,376,872 | |
| Juniper Networks, Inc. | | | 3,846,721 | | | | 109,631,548 | |
| Microsoft Corp. | | | 2,179,683 | | | | 186,450,084 | |
Vantiv, Inc., Class A (a) | | | 1,252,798 | | | | 92,143,293 | |
| | | | | | | | 706,480,788 | |
| | | | | | | | | |
| Materials — 3.8% | | | | | | | | |
Axalta Coating Systems Ltd. (a)(b) | | | 2,320,007 | | | | 75,075,426 | |
| Eastman Chemical Co. | | | 631,139 | | | | 58,468,717 | |
| Praxair, Inc. | | | 558,456 | | | | 86,381,974 | |
| | | | | | | | 219,926,117 | |
| | | | | | | | | |
| Total Common Stocks | | | | | | $ | 5,760,615,737 | |
DIAMOND HILL FUNDS | ANNUAL REPORT | DECEMBER 31, 2017 | DIAMOND-HILL.COM 45 |
Diamond Hill Large Cap Fund
Schedule of Investments (Continued)
December 31, 2017
| | | Shares | | | Fair
Value | |
| Registered Investment Companies — 2.9% |
State Street Institutional Liquid Reserves Fund, Premier Class, 1.43%(c) | | | 82,532,192 | | | $ | 82,523,939 | |
State Street Navigator Securities Lending Portfolio I, 1.49%(c) | | | 86,832,070 | | | | 86,832,070 | |
| | | | | | | | | |
| Total Registered Investment Companies | | | | | | $ | 169,356,009 | |
| | | | | | | | | |
| Total Investment Securities — 101.4% |
| (Cost $4,389,010,555) | | | | | | $ | 5,929,971,746 | |
| | | | | | | | | |
| Net Other Assets (Liabilities) — (1.4)% | | | | | | | (83,529,631 | ) |
| | | | | | | | | |
| Net Assets — 100.0% | | | | | | $ | 5,846,442,115 | |
(a) | Non-income producing security. |
(b) | All or a portion of the security is on loan. The total fair value of the securities on loan as of December 31, 2017 was $84,647,687. |
(c) | The rate shown is the effective interest rate as of December 31, 2017. |
plc – Public Limited Company
See accompanying Notes to Financial Statements.
Diamond Hill All Cap Select Fund
Schedule of Investments
December 31, 2017
| | | Shares | | | Fair
Value | |
| Common Stocks — 95.9% |
| Consumer Discretionary — 19.0% |
| BorgWarner, Inc. | | | 88,549 | | | $ | 4,523,968 | |
| Dollar General Corp. | | | 39,147 | | | | 3,641,063 | |
| Ford Motor Co. | | | 362,668 | | | | 4,529,723 | |
Liberty Global plc, Class A (a) | | | 116,011 | | | | 4,157,834 | |
| Red Rock Resorts, Inc., Class A | | | 127,291 | | | | 4,294,798 | |
| TJX Cos., Inc. (The) | | | 53,487 | | | | 4,089,616 | |
| Twenty-First Century Fox, Inc., Class B | | | 171,496 | | | | 5,851,444 | |
| Vail Resorts, Inc. | | | 16,908 | | | | 3,592,443 | |
| | | | | | | | 34,680,889 | |
| | | | | | | | | |
| Consumer Staples — 10.3% |
| Molson Coors Brewing Co., Class B | | | 66,609 | | | | 5,466,601 | |
| PepsiCo, Inc. | | | 38,076 | | | | 4,566,074 | |
| Philip Morris International, Inc. | | | 48,021 | | | | 5,073,419 | |
Post Holdings, Inc. (a) | | | 45,442 | | | | 3,600,370 | |
| | | | | | | | 18,706,464 | |
| | | | | | | | | |
| Financials — 32.1% | | | | | | | | |
| BankUnited, Inc. | | | 180,416 | | | | 7,346,540 | |
Berkshire Hathaway, Inc., Class B (a) | | | 46,163 | | | | 9,150,430 | |
Brighthouse Financial, Inc. (a) | | | 45,941 | | | | 2,693,980 | |
| Credit Suisse Group AG - ADR | | | 229,909 | | | | 4,103,876 | |
| Discover Financial Services | | | 118,209 | | | | 9,092,636 | |
| First Republic Bank | | | 41,511 | | | | 3,596,513 | |
| Loews Corp. | | | 127,029 | | | | 6,355,261 | |
| MetLife, Inc. | | | 144,140 | | | | 7,287,718 | |
Nationstar Mortgage Holdings, Inc. (a)(b) | | | 215,541 | | | | 3,987,509 | |
| Validus Holdings Ltd. | | | 106,320 | | | | 4,988,534 | |
| | | | | | | | 58,602,997 | |
| | | | | | | | | |
| Health Care — 5.4% | | | | | | | | |
| Abbott Laboratories | | | 102,670 | | | | 5,859,377 | |
| Aetna, Inc. | | | 22,511 | | | | 4,060,759 | |
| | | | | | | | 9,920,136 | |
46 DIAMOND HILL FUNDS | ANNUAL REPORT | DECEMBER 31, 2017 | DIAMOND-HILL.COM |
Diamond Hill All Cap Select Fund
Schedule of Investments (Continued)
December 31, 2017
| | | Shares | | | Fair
Value | |
| Common Stocks — 95.9% continued |
| Industrials — 18.9% | | | | | | |
| Deere & Co. | | | 23,171 | | | $ | 3,626,493 | |
| Fastenal Co. | | | 52,344 | | | | 2,862,693 | |
Hub Group, Inc., Class A (a) | | | 92,060 | | | | 4,409,674 | |
| Johnson Controls International plc | | | 118,721 | | | | 4,524,457 | |
Kirby Corp. (a) | | | 52,883 | | | | 3,532,584 | |
United Continental Holdings, Inc. (a) | | | 115,043 | | | | 7,753,898 | |
| United Technologies Corp. | | | 28,365 | | | | 3,618,523 | |
Verisk Analytics, Inc. (a) | | | 42,622 | | | | 4,091,712 | |
| | | | | | | | 34,420,034 | |
| | | | | | | | | |
| Information Technology — 6.9% |
Alphabet, Inc., Class A (a) | | | 6,004 | | | | 6,324,614 | |
| Apple, Inc. | | | 21,397 | | | | 3,621,014 | |
Sanmina Corp. (a) | | | 80,474 | | | | 2,655,642 | |
| | | | | | | | 12,601,270 | |
| | | | | | | | | |
| Materials — 1.8% | | | | | | | | |
Axalta Coating Systems Ltd. (a) | | | 99,433 | | | | 3,217,652 | |
| | | | | | | | | |
| Real Estate — 1.5% | | | | | | | | |
| CubeSmart REIT | | | 93,649 | | | | 2,708,329 | |
| | | | | | | | | |
| Total Common Stocks | | | | | | $ | 174,857,771 | |
| | | | | | | | | |
| Registered Investment Companies — 5.6% |
Diamond Hill Short Duration Total Return Fund, Class Y(c) | | | 280,408 | | | $ | 2,834,923 | |
State Street Institutional US Government Money Market Fund, Premier Class, 1.20%(d) | | | 4,565,259 | | | | 4,565,259 | |
State Street Navigator Securities Lending Portfolio I, 1.49%(d) | | | 2,872,254 | | | | 2,872,254 | |
| | | | | | | | | |
| Total Registered Investment Companies | | | | | | $ | 10,272,436 | |
| | | | | | | | | |
| Total Investment Securities — 101.5% |
| (Cost $152,154,979) | | | | | | $ | 185,130,207 | |
| | | | | | | | | |
| Net Other Assets (Liabilities) — (1.5)% | | | | | | | (2,716,437 | ) |
| | | | | | | | | |
| Net Assets — 100.0% | | | | | | $ | 182,413,770 | |
(a) | Non-income producing security. |
(b) | All or a portion of the security is on loan. The total fair value of the securities on loan as of December 31, 2017 was $2,760,348. |
(d) | The rate shown is the effective interest rate as of December 31, 2017. |
ADR – American Depositary Receipt
plc – Public Limited Company
REIT – Real Estate Investment Trust
See accompanying Notes to Financial Statements.
DIAMOND HILL FUNDS | ANNUAL REPORT | DECEMBER 31, 2017 | DIAMOND-HILL.COM 47 |
Diamond Hill Long-Short Fund
Schedule of Investments
December 31, 2017
| | | Shares | | | Fair
Value | |
| Common Stocks — 83.6% |
| Consumer Discretionary — 15.5% |
BorgWarner, Inc. (a) | | | 1,552,835 | | | $ | 79,334,340 | |
| Comcast Corp., Class A | | | 2,547,940 | | | | 102,044,997 | |
Dollar General Corp. (a) | | | 621,335 | | | | 57,790,368 | |
Goodyear Tire & Rubber Co. (The) (a) | | | 1,593,475 | | | | 51,485,177 | |
Hanesbrands, Inc. (a) | | | 2,724,340 | | | | 56,965,949 | |
Starbucks Corp. (a) | | | 654,005 | | | | 37,559,507 | |
TEGNA, Inc. (a) | | | 2,155,608 | | | | 30,350,961 | |
TJX Cos., Inc. (The) (a) | | | 1,251,435 | | | | 95,684,720 | |
| Twenty-First Century Fox, Inc., Class B | | | 1,351,730 | | | | 46,121,028 | |
VF Corp. (a) | | | 859,280 | | | | 63,586,720 | |
Walt Disney Co. (The) (a) | | | 552,265 | | | | 59,374,010 | |
Whirlpool Corp. (a) | | | 359,605 | | | | 60,643,787 | |
| | | | | | | | 740,941,564 | |
| | | | | | | | | |
| Consumer Staples — 6.7% |
Coty, Inc., Class A (a) | | | 3,022,050 | | | | 60,108,575 | |
Kimberly-Clark Corp. (a) | | | 575,295 | | | | 69,415,095 | |
Molson Coors Brewing Co., Class B (a) | | | 1,233,105 | | | | 101,200,927 | |
Philip Morris International, Inc. (a) | | | 847,825 | | | | 89,572,711 | |
| | | | | | | | 320,297,308 | |
| | | | | | | | | |
| Energy — 2.5% | | | | | | | | |
Cimarex Energy Co. (a) | | | 963,614 | | | | 117,570,544 | |
| | | | | | | | | |
| Financials — 24.6% | | | | | | | | |
| BankUnited, Inc. | | | 2,955,050 | | | | 120,329,636 | |
Berkshire Hathaway, Inc., Class B (a)(b) | | | 460,360 | | | | 91,252,559 | |
Brighthouse Financial, Inc. (a)(b) | | | 599,956 | | | | 35,181,420 | |
Capital One Financial Corp. (a) | | | 453,450 | | | | 45,154,551 | |
Citigroup, Inc. (a) | | | 2,477,994 | | | | 184,387,534 | |
Discover Financial Services (a) | | | 1,632,955 | | | | 125,606,899 | |
First Republic Bank (a) | | | 744,265 | | | | 64,483,120 | |
Franklin Resources, Inc. (a) | | | 1,146,250 | | | | 49,667,013 | |
Hartford Financial Services Group, Inc. (The) (a) | | | 414,482 | | | | 23,327,047 | |
JPMorgan Chase & Co. (a) | | | 757,970 | | | | 81,057,312 | |
Loews Corp. (a) | | | 1,691,172 | | | | 84,609,335 | |
MetLife, Inc. (a) | | | 2,238,214 | | | | 113,164,100 | |
Morgan Stanley (a) | | | 908,350 | | | | 47,661,124 | |
Popular, Inc. (a) | | | 2,435,767 | | | | 86,445,371 | |
Wells Fargo & Co. (a) | | | 350,012 | | | | 21,235,228 | |
| | | | | | | | 1,173,562,249 | |
| | | | | | | | | |
| Health Care — 6.7% | | | | | | | | |
| Abbott Laboratories | | | 2,385,625 | | | | 136,147,619 | |
Medtronic plc (a) | | | 1,078,962 | | | | 87,126,182 | |
| Pfizer, Inc. | | | 2,604,750 | | | | 94,344,045 | |
| | | | | | | | 317,617,846 | |
| | | | | | | | | |
| Industrials — 12.1% | | | | | | | | |
Avis Budget Group, Inc. (a)(b) | | | 268,760 | | | | 11,793,189 | |
Colfax Corp. (a)(b) | | | 562,450 | | | | 22,284,269 | |
Deere & Co. (a) | | | 212,600 | | | | 33,274,026 | |
Fastenal Co. (a) | | | 710,499 | | | | 38,857,190 | |
Johnson Controls International plc (a) | | | 2,267,260 | | | | 86,405,279 | |
Kirby Corp. (a)(b) | | | 938,595 | | | | 62,698,146 | |
Parker-Hannifin Corp. (a) | | | 207,560 | | | | 41,424,825 | |
United Continental Holdings, Inc. (a)(b) | | | 2,436,025 | | | | 164,188,085 | |
United Technologies Corp. (a) | | | 909,055 | | | | 115,968,146 | |
| | | | | | | | 576,893,155 | |
| | | | | | | | | |
| Information Technology — 13.8% |
Alphabet, Inc., Class A (b) | | | 156,775 | | | | 165,146,785 | |
Apple, Inc. (a) | | | 754,936 | | | | 127,757,819 | |
Cognizant Technology Solutions Corp., Class A (a) | | | 1,124,340 | | | | 79,850,627 | |
Juniper Networks, Inc. (a) | | | 2,807,795 | | | | 80,022,158 | |
| Microsoft Corp. | | | 1,431,199 | | | | 122,424,762 | |
Vantiv, Inc., Class A (a)(b) | | | 1,126,005 | | | | 82,817,668 | |
| | | | | | | | 658,019,819 | |
| | | | | | | | | |
| Materials — 1.7% | | | | | | | | |
Axalta Coating Systems Ltd. (a)(b) | | | 2,505,180 | | | | 81,067,625 | |
| | | | | | | | | |
| Total Common Stocks | | | | | | $ | 3,985,970,110 | |
48 DIAMOND HILL FUNDS | ANNUAL REPORT | DECEMBER 31, 2017 | DIAMOND-HILL.COM |
Diamond Hill Long-Short Fund
Schedule of Investments Sold Short
December 31, 2017
| | | Shares | | | Fair
Value | |
| Registered Investment Companies — 42.5% |
Diamond Hill Short Duration Total Return Fund, Class Y(c) | | | 8,255,302 | | | $ | 83,461,099 | |
State Street Institutional Liquid Reserves Fund, Premier Class, 1.43%(d) | | | 670,500,234 | | | | 670,433,184 | |
State Street Navigator Securities Lending Portfolio I, 1.49%(d) | | | 1,272,963,558 | | | | 1,272,963,558 | |
| | | | | | | | | |
| Total Registered Investment Companies | | | | | | $ | 2,026,857,841 | |
| | | | | | | | | |
| Total Investment Securities — 126.1% |
| (Cost $4,832,863,785) | | | | | | $ | 6,012,827,951 | |
| | | | | | | | | |
| Segregated Cash With Custodian — 25.4% | | | | | | | 1,212,532,828 | |
| | | | | | | | | |
| Securities Sold Short — (24.6)% |
| (Proceeds $933,760,090) | | | | | | | (1,174,144,423 | ) |
| | | | | | | | | |
| Net Other Assets (Liabilities) — (26.9)% | | | | | | | (1,284,491,580 | ) |
| | | | | | | | | |
| Net Assets — 100.0% | | | | | | $ | 4,766,724,776 | |
(a) | All or a portion of the security is on loan. The total fair value of the securities on loan as of December 31, 2017 was $1,240,688,213. |
(b) | Non-income producing security. |
(d) | The rate shown is the effective interest rate as of December 31, 2017. |
NV – Naamloze Vennootschap
plc – Public Limited Company
See accompanying Notes to Financial Statements.
Diamond Hill Long-Short Fund
Schedule of Investments (Continued)
December 31, 2017
| | | Shares | | | Fair
Value | |
| Common Stocks — 24.4% |
| Consumer Discretionary — 9.6% |
| Best Buy Co., Inc. | | | 1,518,500 | | | $ | 103,971,695 | |
| Big Lots, Inc. | | | 566,355 | | | | 31,800,833 | |
| Children's Place, Inc. (The) | | | 383,902 | | | | 55,800,156 | |
| Grand Canyon Education, Inc. | | | 837,305 | | | | 74,963,917 | |
| Lithia Motors, Inc., Class A | | | 321,280 | | | | 36,494,195 | |
| McDonald's Corp. | | | 333,170 | | | | 57,345,220 | |
| Polaris Industries, Inc. | | | 347,520 | | | | 43,089,005 | |
| Wal-Mart Stores, Inc. | | | 537,422 | | | | 53,070,423 | |
| | | | | | | | 456,535,444 | |
| | | | | | | | | |
| Consumer Staples — 1.6% |
| Coca-Cola Co. (The) | | | 748,330 | | | | 34,333,380 | |
| Colgate-Palmolive Co. | | | 130,015 | | | | 9,809,632 | |
| Conagra Brands, Inc. | | | 639,615 | | | | 24,094,297 | |
| Lamb Weston Holdings, Inc. | | | 164,548 | | | | 9,288,735 | |
| | | | | | | | 77,526,044 | |
| | | | | | | | | |
| Energy — 1.5% | | | | | | | | |
| Core Laboratories NV | | | 275,640 | | | | 30,196,362 | |
| Helmerich & Payne, Inc. | | | 610,345 | | | | 39,452,701 | |
| | | | | | | | 69,649,063 | |
| | | | | | | | | |
| Financials — 3.7% | | | | | | | | |
| Bank of Hawaii Corp. | | | 669,406 | | | | 57,368,094 | |
| Cincinnati Financial Corp. | | | 875,840 | | | | 65,661,725 | |
| First American Financial Corp. | | | 381,475 | | | | 21,377,859 | |
| Selective Insurance Group, Inc. | | | 553,594 | | | | 32,495,968 | |
| | | | | | | | 176,903,646 | |
| | | | | | | | | |
| Health Care — 2.5% | | | | | | | | |
| AbbVie, Inc. | | | 182,100 | | | | 17,610,891 | |
| IDEXX Laboratories, Inc. | | | 43,865 | | | | 6,859,609 | |
| Merck & Co., Inc. | | | 799,465 | | | | 44,985,896 | |
| Varian Medical Systems, Inc. | | | 440,995 | | | | 49,016,594 | |
| | | | | | | | 118,472,990 | |
| | | | | | | | | |
| Industrials — 1.5% | | | | | | | | |
| Boeing Co. (The) | | | 80,900 | | | | 23,858,219 | |
| Cintas Corp. | | | 110,195 | | | | 17,171,687 | |
| W.W. Grainger, Inc. | | | 121,035 | | | | 28,594,519 | |
| | | | | | | | 69,624,425 | |
DIAMOND HILL FUNDS | ANNUAL REPORT | DECEMBER 31, 2017 | DIAMOND-HILL.COM 49 |
Diamond Hill Long-Short Fund
Schedule of Investments Sold Short (Continued)
December 31, 2017
| | | Shares | | | Fair
Value | |
| Common Stocks — 24.4% continued |
| Information Technology — 2.4% |
| Arista Networks, Inc. | | | 173,415 | | | $ | 40,853,106 | |
| Cree, Inc. | | | 869,330 | | | | 32,286,916 | |
| Stamps.com, Inc. | | | 142,309 | | | | 26,754,092 | |
| Western Union Co. (The) | | | 875,315 | | | | 16,639,738 | |
| | | | | | | | 116,533,852 | |
| | | | | | | | | |
| Utilities — 1.6% | | | | | | | | |
| Consolidated Edison, Inc. | | | 929,480 | | | | 78,959,326 | |
| | | | | | | | | |
| Total Common Stocks | | | | | | $ | 1,164,204,790 | |
| | | | | | | | | |
| Registered Investment Companies — 0.2% |
| Industrials — 0.2% | | | | | | | | |
| Industrial Select Sector SPDR Fund (The) | | | 131,355 | | | $ | 9,939,633 | |
| | | | | | | | | |
| Total Securities Sold Short — 24.6% |
| (Proceeds $933,760,090) | | | | | | $ | 1,174,144,423 | |
Percentages disclosed are based on total net assets of the Fund at December 31, 2017.
NV – Naamloze Vennootschap
SPDR – Standard & Poor's Depositary Receipt
See accompanying Notes to Financial Statements.
Diamond Hill Research
Opportunities Fund
Schedule of Investments
December 31, 2017
| | | Shares | | | Fair
Value | |
| Common Stocks — 102.3% |
| Consumer Discretionary — 23.1% |
| Aptiv plc | | | 3,150 | | | $ | 267,215 | |
| BorgWarner, Inc. | | | 5,200 | | | | 265,668 | |
Charter Communications, Inc., Class A (a)(b) | | | 3,572 | | | | 1,200,049 | |
Delphi Technologies plc (b) | | | 2,420 | | | | 126,977 | |
| Dollar General Corp. | | | 1,080 | | | | 100,451 | |
| Fiat Chrysler Automobiles NV | | | 37,550 | | | | 669,892 | |
Ford Motor Co. (a) | | | 14,500 | | | | 181,105 | |
Hanesbrands, Inc. (a) | | | 30,900 | | | | 646,119 | |
Liberty Global plc, Class A (b) | | | 27,325 | | | | 979,328 | |
NVR, Inc. (b) | | | 600 | | | | 2,104,932 | |
Red Rock Resorts, Inc., Class A (a) | | | 115,693 | | | | 3,903,482 | |
Starbucks Corp. (a) | | | 13,045 | | | | 749,174 | |
| TJX Cos., Inc. (The) | | | 1,626 | | | | 124,324 | |
Vail Resorts, Inc. (a) | | | 16,700 | | | | 3,548,249 | |
VF Corp. (a) | | | 14,679 | | | | 1,086,246 | |
| | | | | | | | 15,953,211 | |
| | | | | | | | | |
| Consumer Staples — 2.4% |
B&G Foods, Inc. (a) | | | 19,265 | | | | 677,165 | |
Post Holdings, Inc. (a)(b) | | | 10,000 | | | | 792,300 | |
TreeHouse Foods, Inc. (a)(b) | | | 4,600 | | | | 227,516 | |
| | | | | | | | 1,696,981 | |
| | | | | | | | | |
| Energy — 0.7% | | | | | | | | |
| Cimarex Energy Co. | | | 2,570 | | | | 313,566 | |
Linn Energy, Inc. (b) | | | 4,863 | | | | 195,736 | |
| | | | | | | | 509,302 | |
| | | | | | | | | |
| Financials — 19.4% | | | | | | | | |
Atlas Financial Holdings, Inc. (b) | | | 31,180 | | | | 640,749 | |
Bank of New York Mellon Corp. (The) (a) | | | 19,805 | | | | 1,066,697 | |
| BankUnited, Inc. | | | 21,000 | | | | 855,120 | |
Berkshire Hathaway, Inc., Class B (b) | | | 1,981 | | | | 392,674 | |
Brighthouse Financial, Inc. (b) | | | 12,966 | | | | 760,326 | |
| Credit Suisse Group (SW) | | | 53,460 | | | | 953,615 | |
50 DIAMOND HILL FUNDS | ANNUAL REPORT | DECEMBER 31, 2017 | DIAMOND-HILL.COM |
Diamond Hill Research Opportunities Fund
Schedule of Investments (Continued)
December 31, 2017
| | | Shares | | | Fair
Value | |
| Common Stocks — 102.3% continued |
| Financials — 19.4% continued |
| Discover Financial Services | | | 23,385 | | | $ | 1,798,774 | |
| Franklin Resources, Inc. | | | 14,810 | | | | 641,717 | |
| Julius Baer Group Ltd. (SW) | | | 16,075 | | | | 983,141 | |
| MetLife, Inc. | | | 23,368 | | | | 1,181,486 | |
Nationstar Mortgage Holdings, Inc. (b) | | | 126,337 | | | | 2,337,235 | |
| Popular, Inc. | | | 20,930 | | | | 742,806 | |
SVB Financial Group (a)(b) | | | 4,220 | | | | 986,509 | |
| | | | | | | | 13,340,849 | |
| | | | | | | | | |
| Health Care — 14.7% | | | | | | | | |
Acorda Therapeutics, Inc. (a)(b) | | | 18,702 | | | | 401,158 | |
| Aetna, Inc. | | | 3,365 | | | | 607,012 | |
Allergan plc (a) | | | 4,060 | | | | 664,135 | |
BioScrip, Inc. (a)(b) | | | 468,846 | | | | 1,364,342 | |
Endo International plc (a)(b) | | | 152,997 | | | | 1,185,727 | |
Express Scripts Holding Co. (a)(b) | | | 2,725 | | | | 203,394 | |
| Gilead Sciences, Inc. | | | 7,692 | | | | 551,055 | |
| GlaxoSmithKline plc - ADR | | | 68,514 | | | | 2,430,192 | |
| McKesson Corp. | | | 1,525 | | | | 237,824 | |
| Medtronic plc | | | 7,230 | | | | 583,823 | |
Mylan NV (a)(b) | | | 16,930 | | | | 716,308 | |
Thermo Fisher Scientific, Inc. (a) | | | 2,377 | | | | 451,345 | |
Valeant Pharmaceuticals International, Inc. (b) | | | 34,500 | | | | 716,910 | |
| | | | | | | | 10,113,225 | |
| | | | | | | | | |
| Industrials — 19.2% | | | | | | | | |
| Aircastle Ltd. | | | 17,800 | | | | 416,342 | |
Fastenal Co. (a) | | | 3,304 | | | | 180,696 | |
| Honeywell International, Inc. | | | 1,800 | | | | 276,048 | |
| Howden Joinery Group plc (GB) | | | 115,000 | | | | 723,858 | |
Hub Group, Inc., Class A (b) | | | 58,548 | | | | 2,804,449 | |
Johnson Controls International plc (a) | | | 8,111 | | | | 309,110 | |
Kirby Corp. (a)(b) | | | 11,000 | | | | 734,800 | |
Sensata Technologies Holding NV (a)(b) | | | 30,905 | | | | 1,579,555 | |
SPX FLOW, Inc. (b) | | | 4,536 | | | | 215,687 | |
United Continental Holdings, Inc. (b) | | | 48,800 | | | | 3,289,120 | |
| United Technologies Corp. | | | 2,800 | | | | 357,196 | |
Verisk Analytics, Inc. (a)(b) | | | 22,111 | | | | 2,122,656 | |
WESCO International, Inc. (b) | | | 2,880 | | | | 196,272 | |
| | | | | | | | 13,205,789 | |
| | | | | | | | | |
| Information Technology — 14.3% |
Alphabet, Inc., Class A (b) | | | 1,251 | | | | 1,317,803 | |
Avnet, Inc. (a) | | | 21,914 | | | | 868,233 | |
Baidu.com, Inc. - ADR (b) | | | 3,179 | | | | 744,554 | |
| Cognizant Technology Solutions Corp., Class A | | | 35,960 | | | | 2,553,879 | |
First Data Corp., Class A (b) | | | 29,760 | | | | 497,290 | |
| Juniper Networks, Inc. | | | 30,112 | | | | 858,192 | |
| Microsoft Corp. | | | 17,810 | | | | 1,523,467 | |
| Versum Materials, Inc. | | | 4,000 | | | | 151,400 | |
WNS Holdings Ltd. - ADR (b) | | | 32,915 | | | | 1,320,879 | |
| | | | | | | | 9,835,697 | |
| | | | | | | | | |
| Materials — 2.8% | | | | | | | | |
Axalta Coating Systems Ltd. (a)(b) | | | 52,879 | | | | 1,711,164 | |
| Fuchs Petrolub SE (GE) | | | 4,000 | | | | 193,346 | |
| | | | | | | | 1,904,510 | |
| | | | | | | | | |
| Real Estate — 3.3% | | | | | | | | |
| American Campus Communities, Inc. | | | 8,577 | | | | 351,914 | |
| CubeSmart REIT | | | 8,607 | | | | 248,914 | |
iStar, Inc. REIT (b) | | | 114,602 | | | | 1,295,003 | |
| Public Storage REIT | | | 956 | | | | 199,804 | |
| Tanger Factory Outlet Centers, Inc. REIT | | | 7,607 | | | | 201,662 | |
| | | | | | | | 2,297,297 | |
| | | | | | | | | |
| Telecommunication Services — 2.4% |
| BT Group plc - ADR | | | 43,784 | | | | 797,744 | |
Cincinnati Bell, Inc. (a)(b) | | | 40,601 | | | | 846,531 | |
| | | | | | | | 1,644,275 | |
| | | | | | | | | |
| Total Common Stocks | | | | | | $ | 70,501,136 | |
DIAMOND HILL FUNDS | ANNUAL REPORT | DECEMBER 31, 2017 | DIAMOND-HILL.COM 51 |
Diamond Hill Research Opportunities Fund
Schedule of Investments (Continued)
December 31, 2017
| | | Coupon | | | Maturity | | | Shares /
Par Value | | | Fair
Value | |
| Corporate Bonds — 1.0% |
| Energy — 1.0% |
Welltec A/S (c) | | | 9.500 | % | | | 12/01/22 | | | $ | 700,000 | | | $ | 703,500 | |
| Total Corporate Bonds | | | | | | | | | | | | | | $ | 703,500 | |
| | | Shares | | | Fair
Value | |
| Registered Investment Companies — 24.9% |
State Street Navigator Securities Lending Portfolio I, 1.49%(d) | | | 17,119,913 | | | $ | 17,119,913 | |
| | | | | | | | | |
| Total Investment Securities — 128.2% |
| (Cost $77,262,544) | | | | | | $ | 88,324,549 | |
| | | | | | | | | |
| Segregated Cash With Custodian — 18.2% | | | | | | | 12,555,367 | |
| | | | | | | | | |
| Securities Sold Short — (18.6)% |
| (Proceeds $9,842,266) | | | | | | | (12,817,135 | ) |
| | | | | | | | | |
| Net Other Assets (Liabilities) — (27.8)% | | | | | | | (19,177,700 | ) |
| | | | | | | | | |
| Net Assets — 100.0% | | | | | | $ | 68,885,081 | |
(a) | All or a portion of the security is on loan. The total fair value of the securities on loan as of December 31, 2017 was $16,654,844. |
(b) | Non-income producing security. |
(c) | Restricted securities not registered under the Securities Act of 1933. The total fair value of these securities as of December 31, 2017 was $703,500, representing 1.0% of net assets. |
(d) | The rate shown is the effective interest rate as of December 31, 2017. |
ADR – American Depositary Receipt
GB – British Security
GE – German Security
NV – Naamloze Vennootschap
plc – Public Limited Company
REIT – Real Estate Investment Trust
SE – Societas Europaea
SW – Swiss Security
See accompanying Notes to Financial Statements.
52 DIAMOND HILL FUNDS | ANNUAL REPORT | DECEMBER 31, 2017 | DIAMOND-HILL.COM |
Diamond Hill Research Opportunities Fund
Schedule of Investments Sold Short
December 31, 2017
| | | Shares | | | Fair
Value | |
| Common Stocks — 18.6% |
| Consumer Discretionary — 6.0% |
| Best Buy Co., Inc. | | | 15,765 | | | $ | 1,079,430 | |
| Big Lots, Inc. | | | 1,700 | | | | 95,455 | |
| Children's Place, Inc. (The) | | | 3,723 | | | | 541,138 | |
| Grand Canyon Education, Inc. | | | 9,976 | | | | 893,151 | |
| Lithia Motors, Inc., Class A | | | 3,138 | | | | 356,445 | |
| Polaris Industries, Inc. | | | 7,637 | | | | 946,912 | |
| Wal-Mart Stores, Inc. | | | 2,100 | | | | 207,375 | |
| | | | | | | | 4,119,906 | |
| | | | | | | | | |
| Energy — 0.9% | | | | | | | | |
| Core Laboratories NV | | | 1,385 | | | | 151,727 | |
| Helmerich & Payne, Inc. | | | 4,620 | | | | 298,637 | |
| RPC, Inc. | | | 7,125 | | | | 181,901 | |
| | | | | | | | 632,265 | |
| | | | | | | | | |
| Financials — 3.4% | | | | | | | | |
| Bank of Hawaii Corp. | | | 5,290 | | | | 453,353 | |
| Cincinnati Financial Corp. | | | 9,016 | | | | 675,930 | |
| First American Financial Corp. | | | 5,654 | | | | 316,850 | |
| Selective Insurance Group, Inc. | | | 5,153 | | | | 302,481 | |
| Westamerica Bancorp. | | | 10,498 | | | | 625,156 | |
| | | | | | | | 2,373,770 | |
| | | | | | | | | |
| Health Care — 2.4% | | | | | | | | |
| AbbVie, Inc. | | | 5,758 | | | | 556,856 | |
| Bioverativ, Inc. | | | 4,146 | | | | 223,552 | |
| Healthsouth Corp. | | | 3,785 | | | | 187,017 | |
| IDEXX Laboratories, Inc. | | | 550 | | | | 86,009 | |
| Merck & Co., Inc. | | | 5,651 | | | | 317,982 | |
| Varian Medical Systems, Inc. | | | 2,600 | | | | 288,990 | |
| | | | | | | | 1,660,406 | |
| | | | | | | | | |
| Industrials — 1.5% | | | | | | | | |
| Boeing Co. (The) | | | 1,915 | | | | 564,753 | |
| Cintas Corp. | | | 1,670 | | | | 260,236 | |
| W.W. Grainger, Inc. | | | 923 | | | | 218,059 | |
| | | | | | | | 1,043,048 | |
| | | | | | | | | |
| Information Technology — 3.2% |
| Cree, Inc. | | | 21,719 | | | | 806,644 | |
| NETGEAR, Inc. | | | 6,825 | | | | 400,969 | |
| Stamps.com, Inc. | | | 1,582 | | | | 297,416 | |
| Western Union Co. (The) | | | 37,764 | | | | 717,894 | |
| | | | | | | | 2,222,923 | |
| | | | | | | | | |
| Real Estate — 0.2% | | | | | | | | |
| EastGroup Properties, Inc. | | | 1,130 | | | | 99,869 | |
| | | | | | | | | |
| Telecommunication Services — 0.4% |
| Cogent Communications Holdings, Inc. | | | 6,090 | | | | 275,877 | |
| | | | | | | | | |
| Utilities — 0.6% | | | | | | | | |
| Consolidated Edison, Inc. | | | 4,580 | | | | 389,071 | |
| | | | | | | | | |
| Total Securities Sold Short — 18.6% |
| (Proceeds $9,842,266) | | | | | | $ | 12,817,135 | |
Percentages disclosed are based on total net assets of the Fund at December 31, 2017.
See accompanying Notes to Financial Statements.
DIAMOND HILL FUNDS | ANNUAL REPORT | DECEMBER 31, 2017 | DIAMOND-HILL.COM 53 |
Diamond Hill Financial Long-Short Fund
Schedule of Investments
December 31, 2017
| | | Shares | | | Fair
Value | |
| Common Stocks — 91.3% |
| Banks, Thrifts & Mortgage Finance — 34.1% |
| BankUnited, Inc. | | | 36,215 | | | $ | 1,474,675 | |
| BOK Financial Corp. | | | 6,155 | | | | 568,230 | |
| Bridge Bancorp, Inc. | | | 17,480 | | | | 611,800 | |
| Citigroup, Inc. | | | 17,975 | | | | 1,337,520 | |
First Horizon National Corp. (a) | | | 17,045 | | | | 340,730 | |
| First of Long Island Corp. (The) | | | 16,660 | | | | 474,810 | |
First Republic Bank (a) | | | 9,650 | | | | 836,076 | |
JPMorgan Chase & Co. (a) | | | 7,010 | | | | 749,649 | |
Nationstar Mortgage Holdings, Inc. (b) | | | 107,375 | | | | 1,986,437 | |
| Popular, Inc. | | | 24,685 | | | | 876,071 | |
| State Bank Financial Corp. | | | 16,755 | | | | 499,969 | |
Sterling Bancorp (a) | | | 27,393 | | | | 673,868 | |
SVB Financial Group (a)(b) | | | 6,365 | | | | 1,487,946 | |
| | | | | | | | 11,917,781 | |
| | | | | | | | | |
| Capital Markets — 10.4% |
Bank of New York Mellon Corp. (The) (a) | | | 14,320 | | | | 771,275 | |
| Credit Suisse Group AG - ADR | | | 53,110 | | | | 948,013 | |
Franklin Resources, Inc. (a) | | | 27,660 | | | | 1,198,508 | |
Morgan Stanley (a) | | | 13,685 | | | | 718,052 | |
| | | | | | | | 3,635,848 | |
| | | | | | | | | |
| Consumer Financial Services — 7.4% |
Capital One Financial Corp. (a) | | | 7,300 | | | | 726,934 | |
Discover Financial Services (a) | | | 24,115 | | | | 1,854,926 | |
| | | | | | | | 2,581,860 | |
| | | | | | | | | |
| Diversified Financial Services — 5.3% |
Berkshire Hathaway, Inc., Class B (a)(b) | | | 9,310 | | | | 1,845,428 | |
| | | | | | | | | |
| Insurance — 19.1% | | | | | | | | |
Atlas Financial Holdings, Inc. (b) | | | 36,490 | | | | 749,869 | |
Brighthouse Financial, Inc. (a)(b) | | | 11,115 | | | | 651,784 | |
Enstar Group Ltd. (a)(b) | | | 2,500 | | | | 501,875 | |
Hartford Financial Services Group, Inc. (The) (a) | | | 9,400 | | | | 529,032 | |
Loews Corp. (a) | | | 29,040 | | | | 1,452,871 | |
MetLife, Inc. (a) | | | 27,075 | | | | 1,368,912 | |
| Validus Holdings Ltd. | | | 22,215 | | | | 1,042,328 | |
Willis Towers Watson plc (a) | | | 2,633 | | | | 396,767 | |
| | | | | | | | 6,693,438 | |
| | | | | | | | | |
| IT Services — 1.2% | | | | | | | | |
Vantiv, Inc., Class A (a)(b) | | | 5,755 | | | | 423,280 | |
| | | | | | | | | |
| REITS & Real Estate Management — 13.8% |
| American Campus Communities, Inc. REIT | | | 15,305 | | | | 627,964 | |
Colony NorthStar, Inc. REIT, Class A (a) | | | 44,146 | | | | 503,706 | |
CubeSmart REIT (a) | | | 33,460 | | | | 967,663 | |
Essex Property Trust, Inc. REIT (a) | | | 650 | | | | 156,890 | |
iStar, Inc. REIT (a)(b) | | | 125,578 | | | | 1,419,031 | |
| Jones Lang LaSalle, Inc. | | | 1,653 | | | | 246,181 | |
Public Storage REIT (a) | | | 2,045 | | | | 427,405 | |
| Tanger Factory Outlet Centers, Inc. REIT | | | 18,050 | | | | 478,505 | |
| | | | | | | | 4,827,345 | |
| | | | | | | | | |
| Total Common Stocks | | | | | | $ | 31,924,980 | |
| | | | | | | | | |
| Registered Investment Companies — 33.3% |
State Street Institutional Liquid Reserves Fund, Premier Class, 1.43%(c) | | | 2,933,428 | | | | 2,933,135 | |
State Street Navigator Securities Lending Portfolio I, 1.49%(c) | | | 8,709,919 | | | | 8,709,919 | |
| | | | | | | | | |
| Total Registered Investment Companies | | | | | | $ | 11,643,054 | |
54 DIAMOND HILL FUNDS | ANNUAL REPORT | DECEMBER 31, 2017 | DIAMOND-HILL.COM |
Diamond Hill Financial
Long-Short Fund
Schedule of Investments (Continued)
December 31, 2017
| | | Shares | | Fair
Value | |
| Total Investment Securities — 124.6% |
| (Cost $38,410,841) | | | | $ | 43,568,034 | |
| | | | | | | |
| Segregated Cash With Custodian — 13.1% | | | | | 4,591,593 | |
| | | | | | | |
| Securities Sold Short — (12.8)% | | | | | | |
| (Proceeds $3,220,871) | | | | | (4,468,899 | ) |
| | | | | | | |
| Net Other Assets (Liabilities) — (24.9)% | | | | | (8,696,578 | ) |
| | | | | | | |
| Net Assets — 100.0% | | | | $ | 34,994,150 | |
(a) | All or a portion of the security is on loan. The total fair value of the securities on loan as of December 31, 2017 was $8,461,616. |
(b) | Non-income producing security. |
(c) | The rate shown is the effective interest rate as of December 31, 2017. |
ADR – American Depositary Receipt
plc – Public Limited Company
REIT – Real Estate Investment Trust
See accompanying Notes to Financial Statements.
Diamond Hill Financial
Long-Short Fund
Schedule of Investments Sold Short
December 31, 2017
| | | Shares | | | Fair
Value | |
| Common Stocks — 12.8% |
| Banks, Thrifts & Mortgage Finance — 4.3% |
| Bank of Hawaii Corp. | | | 6,225 | | | $ | 533,483 | |
| Washington Federal, Inc. | | | 6,330 | | | | 216,803 | |
| Westamerica Bancorp. | | | 12,895 | | | | 767,897 | |
| | | | | | | | 1,518,183 | |
| | | | | | | | | |
| Insurance — 7.0% | | | | | | | | |
| Cincinnati Financial Corp. | | | 9,960 | | | | 746,701 | |
| First American Financial Corp. | | | 6,860 | | | | 384,434 | |
| Hanover Insurance Group, Inc. (The) | | | 1,710 | | | | 184,817 | |
| Mercury General Corp. | | | 5,400 | | | | 288,576 | |
| Selective Insurance Group, Inc. | | | 14,420 | | | | 846,454 | |
| | | | | | | | 2,450,982 | |
| | | | | | | | | |
| IT Services — 1.0% | | | | | | | | |
| Western Union Co. (The) | | | 18,245 | | | | 346,837 | |
| | | | | | | | | |
| REITS & Real Estate Management — 0.5% |
| EastGroup Properties, Inc. | | | 1,730 | | | | 152,897 | |
| | | | | | | | | |
| Total Securities Sold Short — 12.8% |
| (Proceeds $3,220,871) | | | | | | $ | 4,468,899 | |
Percentages disclosed are based on total net assets of the Fund at December 31, 2017.
See accompanying Notes to Financial Statements.
DIAMOND HILL FUNDS | ANNUAL REPORT | DECEMBER 31, 2017 | DIAMOND-HILL.COM 55 |
Diamond Hill Short Duration Total Return Fund
Schedule of Investments
December 31, 2017
| | | Coupon | | | Maturity | | | Shares/ Par Value | | | Fair
Value | |
| Corporate Credit — 9.5% |
| Banking — 5.6% |
ABN AMRO Bank NV (a) | | | 2.100 | % | | | 01/18/19 | | | $ | 500,000 | | | $ | 499,346 | |
| Bank of America Corp. | | | 6.875 | % | | | 04/25/18 | | | | 140,000 | | | | 142,139 | |
| Bank of Montreal | | | 1.350 | % | | | 08/28/18 | | | | 425,000 | | | | 423,640 | |
| Bank of Nova Scotia | | | 1.650 | % | | | 06/14/19 | | | | 35,000 | | | | 34,723 | |
| Canadian Imperial Bank | | | 1.600 | % | | | 09/06/19 | | | | 425,000 | | | | 420,576 | |
| Capital One Financial Corp. | | | 2.500 | % | | | 05/12/20 | | | | 500,000 | | | | 499,343 | |
| Capital One North America | | | 1.850 | % | | | 09/13/19 | | | | 500,000 | | | | 495,126 | |
| Citigroup, Inc. | | | 2.350 | % | | | 08/02/21 | | | | 500,000 | | | | 494,498 | |
| Citigroup, Inc. | | | 2.900 | % | | | 12/08/21 | | | | 750,000 | | | | 754,852 | |
Danske Bank A/S (a) | | | 1.650 | % | | | 09/06/19 | | | | 500,000 | | | | 494,810 | |
DBS Group Holdings Ltd. (3MO LIBOR + 49) (a)(b) | | | 2.012 | % | | | 06/08/20 | | | | 1,500,000 | | | | 1,503,015 | |
Fifth Third Bank (3MO LIBOR + 59) (b) | | | 2.264 | % | | | 09/27/19 | | | | 500,000 | | | | 503,165 | |
| Goldman Sachs Group, Inc. | | | 2.300 | % | | | 12/13/19 | | | | 225,000 | | | | 224,828 | |
| Goldman Sachs Group, Inc. | | | 2.600 | % | | | 12/27/20 | | | | 1,000,000 | | | | 999,813 | |
Goldman Sachs Group, Inc. (3MO LIBOR + 111) (b) | | | 2.480 | % | | | 04/26/22 | | | | 450,000 | | | | 455,234 | |
Huntington National Bank (3MO LIBOR + 51) (b) | | | 2.046 | % | | | 03/10/20 | | | | 1,000,000 | | | | 1,004,666 | |
| JPMorgan Chase & Co. | | | 2.250 | % | | | 01/23/20 | | | | 50,000 | | | | 49,964 | |
| JPMorgan Chase & Co. | | | 2.550 | % | | | 10/29/20 | | | | 1,000,000 | | | | 1,002,869 | |
JPMorgan Chase & Co. (3MO LIBOR + 100) (b) | | | 2.359 | % | | | 01/15/23 | | | | 400,000 | | | | 405,382 | |
| Key Banc NA | | | 1.600 | % | | | 08/22/19 | | | | 750,000 | | | | 741,729 | |
| Mizuho Financial Group | | | 2.273 | % | | | 09/13/21 | | | | 500,000 | | | | 490,822 | |
| Morgan Stanley | | | 2.650 | % | | | 01/27/20 | | | | 486,000 | | | | 488,168 | |
Morgan Stanley (3MO LIBOR + 118) (b) | | | 2.542 | % | | | 01/20/22 | | | | 1,000,000 | | | | 1,016,542 | |
| National Australia Bank, New York | | | 2.250 | % | | | 01/10/20 | | | | 500,000 | | | | 499,475 | |
Nordea Bank AB (3MO LIBOR + 62) (a)(b) | | | 2.313 | % | | | 09/30/19 | | | | 250,000 | | | | 251,779 | |
| PNC Bank NA | | | 6.875 | % | | | 04/01/18 | | | | 1,000,000 | | | | 1,012,039 | |
| Popular, Inc. | | | 7.000 | % | | | 07/01/19 | | | | 100,000 | | | | 104,000 | |
| Rabobank Nederland NY | | | 2.250 | % | | | 01/14/20 | | | | 300,000 | | | | 299,680 | |
Royal Bank of Canada (c) | | | 1.500 | % | | | 07/29/19 | | | | 220,000 | | | | 217,464 | |
| Skandinaviska Enskilda Banken AB | | | 1.500 | % | | | 09/13/19 | | | | 500,000 | | | | 493,543 | |
Svenska Handelsbanken AB (c) | | | 1.500 | % | | | 09/06/19 | | | | 500,000 | | | | 494,023 | |
| Toronto-Dominion Bank | | | 1.450 | % | | | 09/06/18 | | | | 450,000 | | | | 448,380 | |
| Toronto-Dominion Bank | | | 1.450 | % | | | 08/13/19 | | | | 20,000 | | | | 19,765 | |
| Westpac Banking Corp. | | | 1.600 | % | | | 08/19/19 | | | | 425,000 | | | | 420,542 | �� |
| | | | | | | | | | | | | | | | 17,405,940 | |
| | | | | | | | | | | | | | | | | |
| Basic Industry — 0.1% |
E.I. du Pont de Nemours & Co. (c) | | | 2.200 | % | | | 05/01/20 | | | | 425,000 | | | | 424,599 | |
| | | | | | | | | | | | | | | | | |
| Capital Goods — 0.0% (d) |
NCI Building Systems, Inc. (a) | | | 8.250 | % | | | 01/15/23 | | | | 100,000 | | | | 106,000 | |
| | | | | | | | | | | | | | | | | |
| Communications — 0.3% |
| American Tower Corp. | | | 2.250 | % | | | 01/15/22 | | | | 250,000 | | | | 243,462 | |
Cogent Communications, Inc. (a) | | | 5.375 | % | | | 03/01/22 | | | | 25,000 | | | | 26,250 | |
| Crown Castle International Corp. | | | 2.250 | % | | | 09/01/21 | | | | 425,000 | | | | 417,786 | |
Deutsche Telekom International Finance (a) | | | 1.500 | % | | | 09/19/19 | | | | 200,000 | | | | 197,077 | |
| | | | | | | | | | | | | | | | 884,575 | |
| | | | | | | | | | | | | | | | | |
| Consumer Cyclical — 1.2% |
BMW U.S. Capital LLC (a) | | | 1.450 | % | | | 09/13/19 | | | | 225,000 | | | | 222,554 | |
CCM Merger, Inc. (a) | | | 6.000 | % | | | 03/15/22 | | | | 200,000 | | | | 205,250 | |
| Century Communities, Inc. | | | 6.875 | % | | | 05/15/22 | | | | 75,000 | | | | 78,750 | |
Cimpress NV (a) | | | 7.000 | % | | | 04/01/22 | | | | 300,000 | | | | 309,000 | |
56 DIAMOND HILL FUNDS | ANNUAL REPORT | DECEMBER 31, 2017 | DIAMOND-HILL.COM |
Diamond Hill Short Duration Total Return Fund
Schedule of Investments (Continued)
December 31, 2017
| | | Coupon | | | Maturity | | | Shares/ Par Value | | | Fair
Value | |
| Corporate Credit — 9.5% continued |
| Consumer Cyclical — 1.2% continued |
Daimler Finance NA LLC (a) | | | 1.750 | % | | | 10/30/19 | | | $ | 350,000 | | | $ | 345,740 | |
| Ford Motor Credit Co. LLC | | | 1.897 | % | | | 08/12/19 | | | | 500,000 | | | | 496,186 | |
Ford Motor Credit Co. LLC (c) | | | 2.681 | % | | | 01/09/20 | | | | 200,000 | | | | 200,472 | |
General Motors Financial Co. (c) | | | 2.350 | % | | | 10/04/19 | | | | 1,000,000 | | | | 996,950 | |
| General Motors Financial Co. | | | 3.200 | % | | | 07/06/21 | | | | 25,000 | | | | 25,242 | |
Nissan Motor Acceptance Corp. (a) | | | 1.550 | % | | | 09/13/19 | | | | 425,000 | | | | 419,654 | |
| Toyota Motor Credit Corp. | | | 1.950 | % | | | 04/17/20 | | | | 425,000 | | | | 423,263 | |
| | | | | | | | | | | | | | | | 3,723,061 | |
| | | | | | | | | | | | | | | | | |
| Consumer Non-Cyclical — 0.3% |
Amgen, Inc. (c) | | | 2.650 | % | | | 05/11/22 | | | | 860,000 | | | | 857,579 | |
Mondelēz International, Inc. (a)(c) | | | 1.625 | % | | | 10/28/19 | | | | 250,000 | | | | 246,364 | |
| | | | | | | | | | | | | | | | 1,103,943 | |
| | | | | | | | | | | | | | | | | |
| Electric — 0.3% | | | | | | | | | | | | | | | | |
| NextEra Energy, Inc. | | | 1.649 | % | | | 09/01/18 | | | | 215,000 | | | | 214,378 | |
| Sempra Energy | | | 1.625 | % | | | 10/07/19 | | | | 370,000 | | | | 365,349 | |
| Southern Power Co. | | | 1.950 | % | | | 12/15/19 | | | | 250,000 | | | | 247,915 | |
| | | | | | | | | | | | | | | | 827,642 | |
| | | | | | | | | | | | | | | | | |
| Energy — 0.2% | | | | | | | | | | | | | | | | |
| Energen Corp. | | | 4.625 | % | | | 09/01/21 | | | | 125,000 | | | | 126,563 | |
Sinopec Group Overseas Development Ltd. (a) | | | 1.750 | % | | | 09/29/19 | | | | 500,000 | | | | 491,898 | |
Welltec A/S (a) | | | 9.500 | % | | | 12/01/22 | | | | 200,000 | | | | 201,000 | |
| | | | | | | | | | | | | | | | 819,461 | |
| | | | | | | | | | | | | | | | | |
| Finance Companies — 0.5% |
Alliance Data Systems Corp. (a) | | | 6.375 | % | | | 04/01/20 | | | | 200,000 | | | | 201,490 | |
| American Express Credit Corp. | | | 1.700 | % | | | 10/30/19 | | | | 900,000 | | | | 890,608 | |
IBCIL Finance Co. Ltd. (a) | | | 2.125 | % | | | 09/29/19 | | | | 200,000 | | | | 196,807 | |
| Nationstar Mortgage/Capital Corp. | | | 9.625 | % | | | 05/01/19 | | | | 123,000 | | | | 126,536 | |
| Nationstar Mortgage/Capital Corp. | | | 6.500 | % | | | 06/01/22 | | | | 100,000 | | | | 101,000 | |
| | | | | | | | | | | | | | | | 1,516,441 | |
| Insurance — 0.8% | | | | | | | | | | | | | | | | |
Jackson National Life Global Funding (a) | | | 2.100 | % | | | 10/25/21 | | | | 200,000 | | | | 196,211 | |
Met Life Global Funding I (3MO LIBOR + 40) (a)(b) | | | 1.948 | % | | | 06/12/20 | | | | 1,000,000 | | | | 1,004,103 | |
New York Life Global Funding (a) | | | 1.500 | % | | | 10/24/19 | | | | 500,000 | | | | 493,323 | |
Pricoa Global Funding I (a) | | | 1.450 | % | | | 09/13/19 | | | | 350,000 | | | | 344,538 | |
Principal Life Global Funding II (a) | | | 2.375 | % | | | 11/21/21 | | | | 400,000 | | | | 396,991 | |
| | | | | | | | | | | | | | | | 2,435,166 | |
| | | | | | | | | | | | | | | | | |
| REITS — 0.1% | | | | | | | | | | | | | | | | |
Crescent Communities, Inc. (a) | | | 8.875 | % | | | 10/15/21 | | | | 190,000 | | | | 201,400 | |
| | | | | | | | | | | | | | | | | |
| Transportation — 0.1% |
| Continental Airlines Pass-Through Trust, Series 2012-1, Class B | | | 6.250 | % | | | 10/11/21 | | | | 95,185 | | | | 99,773 | |
| United Airlines Pass-Through Trust, Series 2007-1, Class A | | | 6.636 | % | | | 07/02/22 | | | | 140,786 | | | | 152,020 | |
| United Airlines Pass-Through Trust, Series 2013-1, Class B | | | 5.375 | % | | | 02/15/23 | | | | 65,274 | | | | 68,375 | |
| | | | | | | | | | | | | | | | 320,168 | |
| | | | | | | | | | | | | | | | | |
| Total Corporate Credit | | | | | | | | | | | | | | $ | 29,768,396 | |
| | | | | | | | | | | | | | | | | |
| Securitized — 84.7% |
| ABS-Other — 15.7% |
Access Point Financial, Series 2017-A, Class C (a) | | | 5.820 | % | | | 04/15/29 | | | | 4,750,000 | | | | 4,718,885 | |
Access Point Financial, Series 2017-A, Class D (a) | | | 6.000 | % | | | 04/15/29 | | | | 5,000,000 | | | | 4,723,724 | |
Gold Key Resorts LLC, Series 2014-A, Class A (a) | | | 3.220 | % | | | 03/17/31 | | | | 307,128 | | | | 305,860 | |
Hero Funding Trust, Series 2016-3B, Class B (a) | | | 5.240 | % | | | 09/20/42 | | | | 664,150 | | | | 672,856 | |
DIAMOND HILL FUNDS | ANNUAL REPORT | DECEMBER 31, 2017 | DIAMOND-HILL.COM 57 |
Diamond Hill Short Duration Total Return Fund
Schedule of Investments (Continued)
December 31, 2017
| | | Coupon | | | Maturity | | | Shares/ Par Value | | | Fair
Value | |
| Securitized — 84.7% continued |
| ABS-Other — 15.7% continued |
Hero Funding Trust, Series 2016-1R, Class A1 (a) | | | 4.500 | % | | | 09/21/42 | | | $ | 1,380,549 | | | $ | 1,373,646 | |
Hero Funding Trust, Series 2016-4B, Class B (a) | | | 4.990 | % | | | 09/20/47 | | | | 1,704,726 | | | | 1,706,889 | |
MarketPlace Loan Trust, Series 2016-BS1, Class A (a) | | | 4.500 | % | | | 01/15/21 | | | | 945,612 | | | | 945,307 | |
Mosaic Solar Loans LLC, Series 2017-2A, Class A (a) | | | 3.820 | % | | | 09/20/42 | | | | 1,442,294 | | | | 1,447,599 | |
Mosaic Solar Loans LLC, Series 2017-2A, Class B (a) | | | 4.770 | % | | | 09/20/42 | | | | 1,000,000 | | | | 1,008,973 | |
Nationstar HECM Loan Trust, Series 2016-3A, Class A (a) | | | 2.012 | % | | | 08/25/26 | | | | 420,538 | | | | 420,420 | |
Nationstar HECM Loan Trust, Series 2016-3A, Class M1 (a) | | | 3.147 | % | | | 08/25/26 | | | | 2,230,000 | | | | 2,230,424 | |
Nationstar HECM Loan Trust, Series 2016-3A, Class M2 (a) | | | 5.682 | % | | | 08/25/26 | | | | 350,000 | | | | 351,418 | |
New Residential Advance Receivables Trust, Series 2016-T2, Class DT2 (a) | | | 4.005 | % | | | 10/15/49 | | | | 1,354,000 | | | | 1,343,975 | |
New Residential Advance Receivables Trust, Series 2016-T2, Class ET2 (a) | | | 5.573 | % | | | 10/15/49 | | | | 1,000,000 | | | | 1,000,054 | |
New Residential Advance Receivables Trust, Series 2016-T4, Class ET4 (a) | | | 6.250 | % | | | 12/15/50 | | | | 2,500,000 | | | | 2,499,390 | |
New Residential Advance Receivables Trust, Series 2017-T1, Class ET1 (a) | | | 5.815 | % | | | 02/15/51 | | | | 2,845,000 | | | | 2,830,374 | |
Ocwen Master Advance Receivables Trust, Series 2016-T1, Class AT1 (a) | | | 2.520 | % | | | 08/17/48 | | | | 2,000,000 | | | | 1,999,595 | |
Ocwen Master Advance Receivables Trust, Series 2016-T1, Class DT1 (a) | | | 4.246 | % | | | 08/17/48 | | | | 1,900,000 | | | | 1,915,266 | |
Ocwen Master Advance Receivables Trust, Series 2017-T1, Class DT1 (a) | | | 3.535 | % | | | 09/15/48 | | | | 3,150,000 | | | | 3,149,639 | |
Ocwen Master Advance Receivables Trust, Series 2016-T2, Class DT2 (a) | | | 4.445 | % | | | 08/16/49 | | | | 1,000,000 | | | | 1,001,484 | |
OnDeck Asset Securitization Trust, Series 2016-1A, Class A (a) | | | 4.210 | % | | | 05/17/20 | | | | 4,662,000 | | | | 4,680,304 | |
PNMAC GMSR Issuer Trust, Series 2017-GT2, Class A (1MO LIBOR + 400) (a)(b) | | | 5.552 | % | | | 08/25/23 | | | | 1,500,000 | | | | 1,502,766 | |
PNMAC GMSR Issuer Trust, Series 2017-GT1, Class A (1MO LIBOR + 475) (a)(b) | | | 6.302 | % | | | 02/25/50 | | | | 2,000,000 | | | | 2,050,374 | |
Renew Financial LLC, Series 2017-1A, Class B (a) | | | 5.750 | % | | | 09/20/52 | | | | 1,684,620 | | | | 1,715,021 | |
58 DIAMOND HILL FUNDS | ANNUAL REPORT | DECEMBER 31, 2017 | DIAMOND-HILL.COM |
Diamond Hill Short Duration Total Return Fund
Schedule of Investments (Continued)
December 31, 2017
| | | Coupon | | | Maturity | | | Shares/ Par Value | | | Fair
Value | |
| Securitized — 84.7% continued |
| ABS-Other — 15.7% continued |
SPS Servicer Advance Receivables Trust, Series 2016-T2, Class CT2 (a) | | | 3.590 | % | | | 11/15/49 | | | $ | 650,000 | | | $ | 636,905 | |
TES LLC, Series 2017-1A, Class B (a) | | | 7.740 | % | | | 10/20/47 | | | | 2,000,000 | | | | 2,020,000 | |
Westgate Resorts, Series 2016-1A, Class A (a) | | | 3.500 | % | | | 12/20/28 | | | | 757,628 | | | | 761,816 | |
| | | | | | | | | | | | | | | | 49,012,964 | |
| | | | | | | | | | | | | | | | | |
| Agency CMBS — 0.3% |
FNMA, Pool FN AE0834 (b) | | | 3.977 | % | | | 01/01/21 | | | | 234,733 | | | | 244,219 | |
| FNMA, Pool FN 464279 | | | 4.300 | % | | | 07/01/21 | | | | 761,052 | | | | 776,225 | |
| | | | | | | | | | | | | | | | 1,020,444 | |
| | | | | | | | | | | | | | | | | |
| Agency MBS CMO — 2.1% |
| FHLMC, Series 3994, Class EI | | | 3.000 | % | | | 02/15/22 | | | | 2,610,428 | | | | 102,935 | |
| FHLMC, Series 3874, Class KI | | | 4.500 | % | | | 08/15/25 | | | | 2,032,928 | | | | 116,065 | |
FHLMC, Series 3946, Class SB (1MO LIBOR + 675) (b) | | | 5.272 | % | | | 10/15/26 | | | | 519,094 | | | | 59,380 | |
| FHLMC, Series 2814, Class PH | | | 6.000 | % | | | 06/15/34 | | | | 350,853 | | | | 392,545 | |
| FNMA, Series 1994-4, Class ZC | | | 6.500 | % | | | 01/25/24 | | | | 60,370 | | | | 65,594 | |
| FNMA, Series 2011-75, Class MI | | | 3.500 | % | | | 08/25/26 | | | | 1,000,994 | | | | 93,549 | |
| FNMA, Series 2012-3, Class EA | | | 3.500 | % | | | 10/25/29 | | | | 247,618 | | | | 251,944 | |
| FNMA, Series 2002-86, Class PG | | | 6.000 | % | | | 12/25/32 | | | | 368,524 | | | | 412,702 | |
| FNMA, Series 348, Class 11 | | | 6.000 | % | | | 01/25/34 | | | | 1,312,946 | | | | 290,948 | |
| FNMA, Series 2003-131, Class CH | | | 5.500 | % | | | 01/25/34 | | | | 124,141 | | | | 138,138 | |
| FNMA, Series 2006-9, Class KZ | | | 6.000 | % | | | 03/25/36 | | | | 314,784 | | | | 353,273 | |
| FNMA, Series 2007-B1, Class ZA | | | 5.500 | % | | | 04/25/37 | | | | 147,801 | | | | 162,410 | |
| FNMA, Series 2007-39, Class NB | | | 4.250 | % | | | 05/25/37 | | | | 436,088 | | | | 463,067 | |
| FNMA, Series 2011-46, Class MB | | | 4.000 | % | | | 06/25/37 | | | | 172,711 | | | | 173,475 | |
FNMA, Series 2010-44, Class CS (1MO LIBOR + 655) (b) | | | 4.997 | % | | | 05/25/40 | | | | 1,460,198 | | | | 180,618 | |
| FNMA, Series 2011-14, Class PI | | | 5.000 | % | | | 06/25/40 | | | | 955,719 | | | | 93,049 | |
| FNMA, Series 2010-71, Class HJ | | | 5.500 | % | | | 07/25/40 | | | | 873,264 | | | | 966,096 | |
| FNMA, Series 2014-45, Class IO | | | 4.000 | % | | | 08/25/44 | | | | 1,848,133 | | | | 324,922 | |
| GNMA, Series 2011-18, Class NA | | | 4.000 | % | | | 05/20/39 | | | | 44,737 | | | | 45,326 | |
GNMA, Series BC-H066, Class DI (b) | | | 3.090 | % | | | 05/31/64 | | | | 33,946,860 | | | | 1,174,103 | |
GNMA, Series 2016-H11, Class FD (12MO LIBOR + 40) (b) | | | 2.201 | % | | | 05/20/66 | | | | 136,464 | | | | 137,702 | |
| GNMA, Series 2017-H22, Class ID | | | 3.224 | % | | | 11/20/67 | | | | 11,765,916 | | | | 330,156 | |
| Vendee Mortgage Trust, Series 1995-3, Class 1Z | | | 7.250 | % | | | 09/15/25 | | | | 157,776 | | | | 176,249 | |
| | | | | | | | | | | | | | | | 6,504,246 | |
| | | | | | | | | | | | | | | | | |
| Agency MBS Passthrough — 0.4% |
| FHLMC, Pool FG G60257 | | | 5.500 | % | | | 06/01/41 | | | | 1,194,324 | | | | 1,318,941 | |
| FNMA, Pool FN 725146 | | | 6.500 | % | | | 07/01/19 | | | | 32,185 | | | | 32,608 | |
| | | | | | | | | | | | | | | | 1,351,549 | |
| | | | | | | | | | | | | | | | | |
| Auto Loan — 24.0% |
American Credit Acceptance Receivables Trust, Series 2014-4, Class C (a) | | | 4.250 | % | | | 10/12/20 | | | | 629,864 | | | | 632,330 | |
DIAMOND HILL FUNDS | ANNUAL REPORT | DECEMBER 31, 2017 | DIAMOND-HILL.COM 59 |
Diamond Hill Short Duration Total Return Fund
Schedule of Investments (Continued)
December 31, 2017
| | | Coupon | | | Maturity | | | Shares/ Par Value | | | Fair
Value | |
| Securitized — 84.7% continued |
| Auto Loan — 24.0% continued |
American Credit Acceptance Receivables Trust, Series 2015-2, Class B (a) | | | 2.970 | % | | | 05/12/21 | | | $ | 370,943 | | | $ | 371,471 | |
American Credit Acceptance Receivables Trust, Series 2016-3, Class C (a) | | | 4.260 | % | | | 08/12/22 | | | | 246,000 | | | | 248,401 | |
Bank of the West Auto Trust, Series 2017-1, Class D (a) | | | 3.210 | % | | | 04/15/25 | | | | 2,600,000 | | | | 2,575,641 | |
California Republic Auto Receivables Trust, Series 2015-4, Class C (a) | | | 4.230 | % | | | 09/15/22 | | | | 85,000 | | | | 85,744 | |
CarFinance Capital LLC, Series 2014-2A, Class A (a) | | | 1.440 | % | | | 11/16/20 | | | | 65,576 | | | | 65,519 | |
| CarMax Auto Owner Trust, Series 2017-3, Class D | | | 3.460 | % | | | 10/16/23 | | | | 2,000,000 | | | | 1,998,067 | |
CIG Auto Receivables Trust, Series 2017-1A, Class C (a) | | | 5.330 | % | | | 12/16/24 | | | | 1,600,000 | | | | 1,593,329 | |
CPS Auto Trust, Series 2013-D, Class D (a) | | | 5.540 | % | | | 11/15/19 | | | | 1,900,000 | | | | 1,934,319 | |
CPS Auto Trust, Series 2016-C, Class A (a) | | | 1.620 | % | | | 01/15/20 | | | | 27,789 | | | | 27,752 | |
CPS Auto Trust, Series 2016-C, Class C (a) | | | 3.270 | % | | | 06/15/22 | | | | 100,000 | | | | 100,241 | |
CPS Auto Trust, Series 2017-C, Class D (a) | | | 3.790 | % | | | 06/15/23 | | | | 3,000,000 | | | | 2,994,815 | |
CPS Auto Trust, Series 2017-D, Class D (a) | | | 3.730 | % | | | 09/15/23 | | | | 3,400,000 | | | | 3,374,635 | |
CPS Auto Trust, Series 2017-A, Class E (a) | | | 7.070 | % | | | 04/15/24 | | | | 4,250,000 | | | | 4,491,011 | |
Drive Auto Receivables Trust, Series 2015-BA, Class C (a) | | | 2.760 | % | | | 07/15/21 | | | | 204,264 | | | | 204,927 | |
Drive Auto Receivables Trust, Series 2017-3, Class D (a) | | | 3.530 | % | | | 12/15/23 | | | | 4,900,000 | | | | 4,914,168 | |
DT Auto Owner Trust, Series 2016-1A, Class B (a) | | | 2.790 | % | | | 05/15/20 | | | | 65,371 | | | | 65,391 | |
Exeter Automobile Receivables Trust, Series 2014-3A, Class B (a) | | | 2.770 | % | | | 11/15/19 | | | | 128,265 | | | | 128,325 | |
Exeter Automobile Receivables Trust, Series 2017-3A, Class C (a) | | | 3.680 | % | | | 07/17/23 | | | | 2,850,000 | | | | 2,847,424 | |
Exeter Automobile Receivables Trust, Series 2017-2A, Class D (a) | | | 6.390 | % | | | 02/15/24 | | | | 1,000,000 | | | | 1,039,172 | |
First Investors Auto Owner Trust, Series 2017-2A, Class E (a) | | | 5.480 | % | | | 10/15/24 | | | | 1,250,000 | | | | 1,269,983 | |
Flagship Credit Auto Trust, Series 2014-1, Class E (a) | | | 5.710 | % | | | 08/16/21 | | | | 1,000,000 | | | | 1,020,709 | |
Flagship Credit Auto Trust, Series 2017-3, Class D (a) | | | 3.730 | % | | | 09/15/23 | | | | 4,850,000 | | | | 4,850,856 | |
FourSight Capital Automobile Receivables Trust, Series 2017-1, Class D (a) | | | 5.280 | % | | | 08/15/24 | | | | 1,700,000 | | | | 1,686,865 | |
GLS Auto Receivables Trust, Series 2015-1A, Class A (a) | | | 2.250 | % | | | 12/15/20 | | | | 76,314 | | | | 76,272 | |
60 DIAMOND HILL FUNDS | ANNUAL REPORT | DECEMBER 31, 2017 | DIAMOND-HILL.COM |
Diamond Hill Short Duration Total Return Fund
Schedule of Investments (Continued)
December 31, 2017
| | | Coupon | | | Maturity | | | Shares/ Par Value | | | Fair
Value | |
| Securitized — 84.7% continued |
| Auto Loan — 24.0% continued |
GLS Auto Receivables Trust, Series 2016-1A, Class C (a) | | | 6.900 | % | | | 10/15/21 | | | $ | 1,900,000 | | | $ | 2,007,367 | |
| GM Financial Automobile Leasing Trust, Series 2016-3, Class C | | | 2.380 | % | | | 05/20/20 | | | | 1,000,000 | | | | 992,675 | |
| GM Financial Automobile Leasing Trust, Series 2017-3, Class C | | | 2.730 | % | | | 09/20/21 | | | | 1,900,000 | | | | 1,880,944 | |
GMF Floorplan Owner Revolving Trust, Series 2017-2, Class A2 (1MO LIBOR + 43) (a)(b) | | | 1.907 | % | | | 07/15/22 | | | | 5,000,000 | | | | 5,017,547 | |
GO Financial Auto Securitization Trust, Series 2015-2, Class B (a) | | | 4.800 | % | | | 08/17/20 | | | | 346,438 | | | | 348,310 | |
Hertz Fleet Lease Funding LP, Series 2017-1, Class E (a) | | | 5.800 | % | | | 04/10/31 | | | | 900,000 | | | | 891,096 | |
Honor Automobile Trust Securitization, Series 2016-1A, Class A (a) | | | 2.940 | % | | | 11/15/19 | | | | 473,764 | | | | 475,123 | |
Honor Automobile Trust Securitization, Series 2016-1A, Class C (a) | | | 8.050 | % | | | 11/15/22 | | | | 900,000 | | | | 923,006 | |
Navistar Financial Dealer Master Trust, Series 2016-1, Class B (1MO LIBOR + 175) (a)(b) | | | 3.302 | % | | | 09/27/21 | | | | 1,040,000 | | | | 1,045,865 | |
Navistar Financial Dealer Master Trust, Series 2016-1, Class D (1MO LIBOR + 330) (a)(b) | | | 4.852 | % | | | 09/27/21 | | | | 570,000 | | | | 570,808 | |
Nextgear Floorplan Master Owner Trust, Series 2017-2A, Class A1 (1MO LIBOR + 68) (a)(b) | | | 2.157 | % | | | 10/17/22 | | | | 2,500,000 | | | | 2,504,456 | |
| Nissan Auto Lease Trust, Series 2017-B, Class A4 | | | 2.170 | % | | | 12/15/21 | | | | 1,000,000 | | | | 995,934 | |
OneMain Direct Auto Receivables Trust, Series 2017-2A, Class Class E (a) | | | 4.740 | % | | | 11/14/25 | | | | 2,000,000 | | | | 1,995,104 | |
OSCAR US Funding Trust, Series 2017-2A, Class A2B (1MO LIBOR + 65) (a)(b) | | | 2.081 | % | | | 11/10/20 | | | | 1,000,000 | | | | 1,000,151 | |
Prestige Auto Receivables Trust, Series 2015-1, Class D (a) | | | 3.050 | % | | | 04/15/21 | | | | 100,000 | | | | 100,019 | |
Prestige Auto Receivables Trust, Series 2017-1A, Class D (a) | | | 3.610 | % | | | 10/16/23 | | | | 3,600,000 | | | | 3,585,722 | |
Santander Retail Auto Lease Trust, Series 2017-A, Class A4 (a) | | | 2.370 | % | | | 01/20/22 | | | | 1,900,000 | | | | 1,891,591 | |
Santander Retail Auto Lease Trust, Series 2017-A, Class C (a) | | | 2.960 | % | | | 11/21/22 | | | | 1,650,000 | | | | 1,648,611 | |
Securitized Term Auto Receivables Trust, Series 2017-2A, Class A4 (a) | | | 2.289 | % | | | 03/25/22 | | | | 4,000,000 | | | | 3,966,231 | |
United Auto Credit Securitization Trust, Series 2016-2, Class D (a) | | | 3.580 | % | | | 12/10/21 | | | | 500,000 | | | | 497,933 | |
United Auto Credit Securitization Trust, Series 2017-1, Class E (a) | | | 5.090 | % | | | 03/10/23 | | | | 2,350,000 | | | | 2,332,810 | |
DIAMOND HILL FUNDS | ANNUAL REPORT | DECEMBER 31, 2017 | DIAMOND-HILL.COM 61 |
Diamond Hill Short Duration Total Return Fund
Schedule of Investments (Continued)
December 31, 2017
| | | Coupon | | | Maturity | | | Shares/ Par Value | | | Fair
Value | |
| Securitized — 84.7% continued |
| Auto Loan — 24.0% continued |
Veros Auto Receivables Trust, Series 2017-1, Class A (a) | | | 2.840 | % | | | 04/17/23 | | | $ | 1,745,555 | | | $ | 1,742,197 | |
| | | | | | | | | | | | | | | | 75,010,867 | |
| | | | | | | | | | | | | | | | | |
| Consumer — 20.7% |
AMPLIT Trust, Series 2015-A, Class B (a) | | | 6.750 | % | | | 09/15/21 | | | | 482,043 | | | | 484,523 | |
Arcadia Receivables Credit Trust, Series 2017-1, Class A (a) | | | 3.250 | % | | | 06/15/23 | | | | 991,202 | | | | 994,344 | |
Arcadia Receivables Credit Trust, Series 2017-1, Class B (a) | | | 5.500 | % | | | 06/15/23 | | | | 3,900,000 | | | | 3,970,368 | |
Avant Loans Funding Trust, Series 2017-B, Class B (a) | | | 3.380 | % | | | 04/15/21 | | | | 3,750,000 | | | | 3,755,320 | |
Avant Loans Funding Trust, Series 2015-A, Class B (a) | | | 6.000 | % | | | 08/16/21 | | | | 193,567 | | | | 193,907 | |
Avant Loans Funding Trust, Series 2015-A, Class C (a) | | | 7.750 | % | | | 08/16/21 | | | | 609,644 | | | | 618,974 | |
Citi Held for Asset Issuance, Series 2015-PM2, Class B (a) | | | 4.000 | % | | | 03/15/22 | | | | 949,168 | | | | 950,927 | |
Citi Held for Asset Issuance, Series 2016-MF1, Class C (a) | | | 10.390 | % | | | 08/15/22 | | | | 225,000 | | | | 239,985 | |
Consumer Installment Loan Trust, Series 2016-LD1, Class A (a) | | | 3.960 | % | | | 07/15/22 | | | | 662,005 | | | | 663,588 | |
Consumer Loan Underlying Bond Credit Trust, Series 2017-P1, Class A (a) | | | 2.420 | % | | | 09/15/23 | | | | 1,639,386 | | | | 1,638,540 | |
Consumer Loan Underlying Bond Credit Trust, Series 2017-P1, Class B (a) | | | 3.560 | % | | | 09/15/23 | | | | 3,000,000 | | | | 3,006,959 | |
Consumer Loan Underlying Bond Credit Trust, Series 17-NP2, Class B (a)(b) | | | 3.500 | % | | | 01/16/24 | | | | 800,000 | | | | 799,926 | |
Consumer Loan Underlying Bond Credit Trust, Series 17-NP2, Class C (a)(b) | | | 4.870 | % | | | 01/16/24 | | | | 2,000,000 | | | | 1,999,722 | |
LendingClub Issuance Trust, Series 2016-NP1, Class B (a) | | | 6.500 | % | | | 06/15/22 | | | | 835,000 | | | | 851,644 | |
Lendmark Funding Trust, Series 2017-1A, Class B (a) | | | 3.770 | % | | | 01/22/24 | | | | 400,000 | | | | 401,915 | |
Lendmark Funding Trust, Series 2017-1A, Class C (a) | | | 5.410 | % | | | 01/22/24 | | | | 2,300,000 | | | | 2,361,955 | |
Lendmark Funding Trust, Series 2016-2A, Class C (a) | | | 6.640 | % | | | 04/21/25 | | | | 2,900,000 | | | | 2,975,224 | |
Mariner Finance Issuance Trust, Series 2017-AA, Class B (a) | | | 4.740 | % | | | 02/20/29 | | | | 400,000 | | | | 405,927 | |
Mariner Finance Issuance Trust, Series 2017-AA, Class C (a) | | | 6.730 | % | | | 02/20/29 | | | | 1,750,000 | | | | 1,791,149 | |
Mariner Finance Issuance Trust, Series 2017-BA, Class C (a) | | | 4.570 | % | | | 12/20/29 | | | | 10,150,000 | | | | 10,123,629 | |
MarketPlace Loan Trust, Series 2015-AV2, Class A (a) | | | 4.000 | % | | | 10/15/21 | | | | 284,598 | | | | 285,123 | |
MarketPlace Loan Trust, Series 2015-AV2, Class B (a) | | | 5.750 | % | | | 10/15/21 | | | | 482,279 | | | | 486,628 | |
MarketPlace Loan Trust, Series 2015-AV2, Class C (a) | | | 7.500 | % | | | 10/15/21 | | | | 2,073,802 | | | | 2,123,892 | |
62 DIAMOND HILL FUNDS | ANNUAL REPORT | DECEMBER 31, 2017 | DIAMOND-HILL.COM |
Diamond Hill Short Duration Total Return Fund
Schedule of Investments (Continued)
December 31, 2017
| | | Coupon | | | Maturity | | | Shares/ Par Value | | | Fair
Value | |
| Securitized — 84.7% continued |
| Consumer — 20.7% continued |
Marlette Funding Trust, Series 2016-1A, Class A (a) | | | 3.060 | % | | | 01/17/23 | | | $ | 44,132 | | | $ | 44,214 | |
Marlette Funding Trust, Series 2016-1A, Class B (a) | | | 4.780 | % | | | 01/17/23 | | | | 100,000 | | | | 101,696 | |
Marlette Funding Trust, Series 2017-1A, Class B (a) | | | 4.114 | % | | | 03/15/24 | | | | 3,100,000 | | | | 3,146,979 | |
Marlette Funding Trust, Series 2017-2A, Class B (a) | | | 3.190 | % | | | 07/15/24 | | | | 1,400,000 | | | | 1,403,207 | |
Murray Hill MarketPlace Trust, Series 2016-LC1, Class B (a) | | | 6.150 | % | | | 11/25/22 | | | | 1,250,000 | | | | 1,269,081 | |
OneMain Financial Issuance Trust, Series 2014-2A, Class B (a) | | | 3.020 | % | | | 09/18/24 | | | | 840,000 | | | | 840,375 | |
Oportun Funding IV LLC, Series 2016-C, Class B (a) | | | 4.850 | % | | | 11/08/21 | | | | 1,500,000 | | | | 1,513,274 | |
Oportun Funding VI LLC, Series 2017-A, Class B (a) | | | 3.970 | % | | | 06/08/23 | | | | 2,500,000 | | | | 2,463,169 | |
Oportun Funding VII LLC, Series 2017-B, Class B (a) | | | 4.260 | % | | | 10/10/23 | | | | 2,500,000 | | | | 2,483,493 | |
Prosper Marketplace Issuance Trust, Series 2017-2A, Class B (a) | | | 3.480 | % | | | 09/15/23 | | | | 2,150,000 | | | | 2,154,811 | |
Springfield Funding Trust, Series 2015-AA, Class B (a) | | | 3.620 | % | | | 11/15/24 | | | | 135,000 | | | | 135,446 | |
Upstart Securitization Trust, Series 2017-1, Class B (a) | | | 3.802 | % | | | 06/20/24 | | | | 3,350,000 | | | | 3,351,003 | |
Upstart Securitization Trust, Series 2017-1, Class C (a) | | | 6.350 | % | | | 06/20/24 | | | $ | 2,850,000 | | | $ | 2,900,383 | |
Upstart Securitization Trust, Series 2017-2, Class C (a) | | | 5.590 | % | | | 03/20/25 | | | | 1,750,000 | | | | 1,751,731 | |
| | | | | | | | | | | | | | | | 64,683,031 | |
| | | | | | | | | | | | | | | | | |
| Equipment — 3.8% |
Ascentium Equipment Receivables Trust, Series 2016-2A, Class E (a) | | | 6.790 | % | | | 10/10/24 | | | | 900,000 | | | | 935,430 | |
Axis Equipment Finance Receivables Trust, Series 2015-1A, Class A2 (a) | | | 1.900 | % | | | 03/20/20 | | | | 74,241 | | | | 74,163 | |
Axis Equipment Finance Receivables Trust, Series 2016-1A, Class A (a) | | | 2.210 | % | | | 11/20/21 | | | | 877,123 | | | | 875,056 | |
BCC Funding Corp., Series 2015-1, Class A2 (a) | | | 2.224 | % | | | 10/20/20 | | | | 122,994 | | | | 122,804 | |
BCC Funding Corp., Series 2016-1, Class A2 (a) | | | 2.200 | % | | | 12/20/21 | | | | 218,915 | | | | 218,406 | |
BCC Funding Corp., Series 2016-1, Class B (a) | | | 2.730 | % | | | 04/20/22 | | | | 1,250,000 | | | | 1,234,187 | |
BCC Funding Corp., Series 2016-1, Class E (a) | | | 6.000 | % | | | 11/21/22 | | | | 1,000,000 | | | | 966,249 | |
California Funding II Ltd., Series 2013-1A, Class A (a) | | | 3.350 | % | | | 03/27/28 | | | | 997,500 | | | | 981,279 | |
Global SC Finance SRL, Series 2014-1A, Class A2 (a) | | | 3.090 | % | | | 07/17/29 | | | | 1,306,792 | | | | 1,290,503 | |
DIAMOND HILL FUNDS | ANNUAL REPORT | DECEMBER 31, 2017 | DIAMOND-HILL.COM 63 |
Diamond Hill Short Duration Total Return Fund
Schedule of Investments (Continued)
December 31, 2017
| | | Coupon | | | Maturity | | | Shares/ Par Value | | | Fair
Value | |
| Securitized — 84.7% continued |
| Equipment — 3.8% continued |
LEAF II Receivables Funding LLC, Series 2017-1, Class E1 (a) | | | 4.470 | % | | | 07/15/22 | | | $ | 1,650,000 | | | $ | 1,657,466 | |
LEAF II Receivables Funding LLC, Series 2017-1, Class E2 (a) | | | 5.990 | % | | | 09/15/24 | | | | 2,278,000 | | | | 2,292,457 | |
SCF Equipment Trust LLC, Series 2017-1A, Class A (a) | | | 3.770 | % | | | 01/20/23 | | | | 1,108,662 | | | | 1,105,832 | |
| | | | | | | | | | | | | | | | 11,753,832 | |
| | | | | | | | | | | | | | | | | |
| Non Agency CMBS — 15.7% |
A10 Securitization, Series 2017-1A, Class C (a) | | | 4.050 | % | | | 03/15/36 | | | | 5,750,000 | | | | 5,723,350 | |
A10 Securitization, Series 2017-1A, Class D (a) | | | 4.700 | % | | | 03/15/36 | | | | 3,250,000 | | | | 3,230,124 | |
AMSR Trust, Series 2016-SFR1, Class A (1MO LIBOR + 140) (a)(b) | | | 2.890 | % | | | 11/17/33 | | | | 3,500,000 | | | | 3,521,380 | |
AMSR Trust, Series 2016-SFR1, Class C (1MO LIBOR + 225) (a)(b) | | | 3.740 | % | | | 11/17/33 | | | | 1,000,000 | | | | 1,012,745 | |
B2R Mortgage Trust, Series 2015-2, Class A (a) | | | 3.336 | % | | | 11/15/48 | | | | 273,193 | | | | 275,933 | |
Bancorp Commercial Mortgage Trust (The), Series 2017-CRE2, Class C (1MO LIBOR + 235) (a)(b) | | | 3.827 | % | | | 08/15/32 | | | | 4,750,000 | | | | 4,759,267 | |
Bancorp Commercial Mortgage Trust (The), Series 2016-CRE1, Class D (1MO LIBOR + 603.665) (a)(b) | | | 7.513 | % | | | 11/15/33 | | | | 3,900,000 | | | | 3,912,909 | |
Commercial Mortgage Trust, Series 2014-TWC, Class B (1MO LIBOR + 160) (a)(b) | | | 2.937 | % | | | 02/13/32 | | | | 1,340,000 | | | | 1,345,172 | |
Commercial Mortgage Trust, Series 2014-TWC, Class D (1MO LIBOR + 225) (a)(b) | | | 3.681 | % | | | 02/13/32 | | | | 1,300,000 | | | | 1,305,046 | |
Cosmopolitan Hotel Trust, Series 2017-CSMO, Class D (a)(b) | | | 3.629 | % | | | 11/15/34 | | | | 4,900,000 | | | | 4,909,160 | |
FirstKey Lending Trust, Series 2015-SFR1, Class A (a) | | | 2.553 | % | | | 03/09/47 | | | | 532,843 | | | | 529,918 | |
Fort CRE LLC, Series 2016-1A, Class E (1MO LIBOR + 800) (a)(b) | | | 9.552 | % | | | 05/21/36 | | | | 4,750,000 | | | | 4,822,905 | |
FREMF Mortgage Trust, Series 2012-K21, Class C (a)(b) | | | 3.937 | % | | | 07/25/22 | | | | 610,000 | | | | 613,023 | |
FREMF Mortgage Trust, Series 2012-K23, Class C (a)(b) | | | 3.781 | % | | | 10/25/45 | | | | 400,000 | | | | 396,454 | |
Prime Finance Partners III, Series 2015-2, Class A (1MO LIBOR + 145) (a)(b) | | | 2.927 | % | | | 07/14/34 | | | | 611,181 | | | | 612,048 | |
Prime Finance Partners III, Series 2017-3, Class C (1MO LIBOR + 250) (a)(b) | | | 3.931 | % | | | 01/14/35 | | | | 775,000 | | | | 778,460 | |
Prime Finance Partners III, Series 2017-3, Class D (1MO LIBOR + 350) (a)(b) | | | 4.931 | % | | | 01/14/35 | | | | 500,000 | | | | 503,561 | |
Progress Residential Trust, Series 2015-SFR2, Class A (a) | | | 2.740 | % | | | 06/12/32 | | | | 1,846,078 | | | | 1,841,560 | |
64 DIAMOND HILL FUNDS | ANNUAL REPORT | DECEMBER 31, 2017 | DIAMOND-HILL.COM |
Diamond Hill Short Duration Total Return Fund
Schedule of Investments (Continued)
December 31, 2017
| | | Coupon | | | Maturity | | | Shares/ Par Value | | | Fair
Value | |
| Securitized — 84.7% continued |
| Non Agency CMBS — 15.7% continued |
Progress Residential Trust, Series 2015-SFR3, Class A (a) | | | 3.067 | % | | | 11/12/32 | | | $ | 99,040 | | | $ | 99,562 | |
Progress Residential Trust, Series 2015-SFR3, Class D (a) | | | 4.673 | % | | | 11/12/32 | | | | 135,000 | | | | 138,820 | |
RAIT Trust, Series 2016-FL6, Class B (1MO LIBOR + 265) (a)(b) | | | 4.109 | % | | | 11/13/31 | | | | 1,400,000 | | | | 1,403,380 | |
ReadyCap Commercial Mortgage Trust, Series 2017-FL1, Class D (1MO LIBOR + 385) (a)(b) | | | 5.402 | % | | | 05/25/34 | | | | 1,750,000 | | | | 1,754,475 | |
Resource Capital Corp. Ltd, Series 2017-CRE5, Class B (1MO LIBOR + 200) (a)(b) | | | 3.477 | % | | | 07/15/34 | | | | 1,900,000 | | | | 1,899,995 | |
Starwood Waypoint Homes Trust, Series 2017-1, Class B (1MO LIBOR + 117) (a)(b) | | | 2.660 | % | | | 01/17/35 | | | | 3,900,000 | | | | 3,894,493 | |
| | | | | | | | | | | | | | | | 49,283,740 | |
| | | | | | | | | | | | | | | | | |
| Non Agency MBS CMO — 1.2% |
CAM Mortgage Trust, Series 2016-2, Class A2 (a) | | | 5.000 | % | | | 06/15/57 | | | | 400,000 | | | | 399,454 | |
Citigroup Mortgage Loan Trust, Inc., Series 2004-UST1, Class A3 (b) | | | 3.292 | % | | | 08/25/34 | | | | 21,426 | | | | 21,662 | |
COLT Funding LLC, Series 2016-2, Class M1 (a) | | | 5.500 | % | | | 09/25/46 | | | | 750,000 | | | | 759,375 | |
First Horizon Mortgage Pass-Through Trust, Series 2005-AR1, Class 2A2 (b) | | | 3.158 | % | | | 04/25/35 | | | | 289,406 | | | | 294,878 | |
MLCC Mortgage Investors, Inc., Series 2004-C, Class B1 (1MO LIBOR + 73.5) (b) | | | 2.062 | % | | | 07/25/29 | | | | 1,060,017 | | | | 976,375 | |
Pretium Mortgage Credit Partners, Series 2016-NPL6, Class A1 (a) | | | 3.500 | % | | | 10/27/31 | | | | 693,051 | | | | 693,750 | |
RiverView HECM Trust, Series 2007-1, Class A (12MO LIBOR + 50) (a)(b) | | | 1.810 | % | | | 05/25/47 | | | | 146,408 | | | | 123,623 | |
Sequoia Mortgage Trust, Series 2003-1, Class 1A (1MO LIBOR + 76) (b) | | | 2.261 | % | | | 04/20/33 | | | | 218,131 | | | | 208,368 | |
Wells Fargo Mortgage Backed Securities, Series 2003-H, Class A1 (b) | | | 3.591 | % | | | 09/25/33 | | | | 297,556 | | | | 302,912 | |
| | | | | | | | | | | | | | | | 3,780,397 | |
| | | | | | | | | | | | | | | | | |
| Student Loan — 0.8% |
College Ave Student Loans, Series 2017-A, Class B (a) | | | 4.500 | % | | | 11/26/46 | | | | 660,000 | | | | 660,350 | |
| Commonbond Student Loan Trust, Series 2017-BGS, Class C | | | 4.440 | % | | | 09/25/42 | | | | 1,000,000 | | | | 997,108 | |
Earnest Student Loan Program LLC, Series 2016-C, Class A2 (a) | | | 2.680 | % | | | 07/25/35 | | | | 551,617 | | | | 549,420 | |
| Earnest Student Loan Program LLC, Series 2016-D, Class R | | | 0.000 | % | | | 01/25/41 | | | | 5,000 | | | | 420,500 | |
| | | | | | | | | | | | | | | | 2,627,378 | |
| | | | | | | | | | | | | | | | | |
| Total Securitized | | | | | | | | | | | | | | $ | 265,028,448 | |
| | | | | | | | | | | | | | | | | |
| Treasury — 4.1% |
| U.S. Treasury Notes | | | 1.500 | % | | | 08/31/18 | | | | 6,000,000 | | | | 5,992,420 | |
U.S. Treasury Notes (c) | | | 1.000 | % | | | 09/15/18 | | | | 2,000,000 | | | | 1,990,292 | |
| U.S. Treasury Notes | | | 1.250 | % | | | 12/31/18 | | | | 5,000,000 | | | | 4,972,092 | |
| | | | | | | | | | | | | | | | | |
| Total Treasury | | | | | | | | | | | | | | $ | 12,954,804 | |
DIAMOND HILL FUNDS | ANNUAL REPORT | DECEMBER 31, 2017 | DIAMOND-HILL.COM 65 |
Diamond Hill Short Duration Total Return Fund
Schedule of Investments (Continued)
December 31, 2017
| | | Shares | | | Fair
Value | |
| Registered Investment Companies — 2.7% |
State Street Institutional Liquid Reserves Fund, Premier Class, 1.43%(e) | | | 3,273,200 | | | $ | 3,272,873 | |
State Street Navigator Securities Lending Portfolio I, 1.49%(e) | | | 5,135,620 | | | | 5,135,620 | |
| | | | | | | | | |
| Total Registered Investment Companies | | | | | | $ | 8,408,493 | |
| | | | | | | | | |
| Total Investment Securities — 101.0% |
| (Cost $315,533,432) | | | | | | $ | 316,160,141 | |
| | | | | | | | | |
| Net Other Assets (Liabilities) — (1.0)% | | | | | | | (3,222,836 | ) |
| | | | | | | | | |
| Net Assets — 100.0% | | | | | | $ | 312,937,305 | |
(a) | Restricted securities not registered under the Securities Act of 1933. The total fair value of these securities as of December 31, 2017 was $255,617,386, representing 81.7% of net assets. |
(b) | Variable rate security. The rate shown is the effective interest rate as of December 31, 2017. The benchmark on which the rate is calculated is shown parenthetically; otherwise, the rate fluctuations may be based on index changes, prepayment of underlying positions and/or other variables. |
(c) | All or a portion of the security is on loan. The total fair value of the securities on loan as of December 31, 2017 was $5,033,679. |
(d) | Percentage rounds to less than 0.1% |
(e) | The rate shown is the effective interest rate as of December 31, 2017. |
AB – Aktiebolag
A/S – Aktieselskab
LIBOR – London Interbank Offered Rate
NA – National Association
NV – Naamloze Vennootschap
REIT – Real Estate Investment Trust
See accompanying Notes to Financial Statements.
66 DIAMOND HILL FUNDS | ANNUAL REPORT | DECEMBER 31, 2017 | DIAMOND-HILL.COM |
Diamond Hill Core Bond Fund
Schedule of Investments
December 31, 2017
| | | Coupon | | | Maturity | | | Shares/ Par Value | | | Fair
Value | |
| Corporate Credit — 19.2% |
| Banking — 6.2% |
| Bank of America Corp. | | | 2.881 | % | | | 04/24/23 | | | $ | 100,000 | | | $ | 100,135 | |
Bank of America Corp. (a) | | | 3.823 | % | | | 01/20/28 | | | | 100,000 | | | | 103,408 | |
| Bank of Montreal | | | 1.350 | % | | | 08/28/18 | | | | 75,000 | | | | 74,760 | |
Bank of New York Mellon Corp. (The) (b) | | | 3.000 | % | | | 10/30/28 | | | | 100,000 | | | | 97,178 | |
Bank of Nova Scotia (b) | | | 1.650 | % | | | 06/14/19 | | | | 65,000 | | | | 64,485 | |
| Canadian Imperial Bank | | | 1.600 | % | | | 09/06/19 | | | | 75,000 | | | | 74,219 | |
Capital One Financial Corp. (b) | | | 3.750 | % | | | 07/28/26 | | | | 100,000 | | | | 99,553 | |
| Citigroup, Inc. | | | 3.300 | % | | | 04/27/25 | | | | 100,000 | | | | 100,908 | |
Citigroup, Inc. (b) | | | 4.125 | % | | | 07/25/28 | | | | 150,000 | | | | 154,550 | |
| Discover Financial Services, Inc. | | | 4.100 | % | | | 02/09/27 | | | | 100,000 | | | | 102,405 | |
| Goldman Sachs Group, Inc. | | | 2.300 | % | | | 12/13/19 | | | | 25,000 | | | | 24,981 | |
Goldman Sachs Group, Inc. (3MO LIBOR + 111) (a) | | | 2.480 | % | | | 04/26/22 | | | | 50,000 | | | | 50,582 | |
| Goldman Sachs Group, Inc. | | | 3.500 | % | | | 01/23/25 | | | | 80,000 | | | | 81,249 | |
| Goldman Sachs Group, Inc. | | | 3.500 | % | | | 11/16/26 | | | | 100,000 | | | | 100,560 | |
| Huntington Bancshares, Inc. | | | 2.300 | % | | | 01/14/22 | | | | 100,000 | | | | 98,378 | |
| JPMorgan Chase & Co. | | | 2.250 | % | | | 01/23/20 | | | | 100,000 | | | | 99,928 | |
JPMorgan Chase & Co. (3MO LIBOR + 100) (a) | | | 2.359 | % | | | 01/15/23 | | | | 100,000 | | | | 101,346 | |
JPMorgan Chase & Co. (T 2 11/26 + 127) (a) | | | 3.782 | % | | | 02/01/28 | | | | 100,000 | | | | 103,596 | |
| Key Bank NA | | | 2.500 | % | | | 11/22/21 | | | | 250,000 | | | | 248,659 | |
| Morgan Stanley | | | 3.700 | % | | | 10/23/24 | | | | 100,000 | | | | 103,310 | |
| Morgan Stanley | | | 3.125 | % | | | 07/27/26 | | | | 100,000 | | | | 98,606 | |
| Morgan Stanley | | | 3.625 | % | | | 01/20/27 | | | | 100,000 | | | | 102,317 | |
| Regions Financial Corp. | | | 2.750 | % | | | 08/14/22 | | | | 250,000 | | | | 249,181 | |
Royal Bank of Canada (b) | | | 1.500 | % | | | 07/29/19 | | | | 30,000 | | | | 29,654 | |
Toronto-Dominion Bank (b) | | | 1.450 | % | | | 09/06/18 | | | | 50,000 | | | | 49,820 | �� |
Toronto-Dominion Bank (b) | | | 1.450 | % | | | 08/13/19 | | | | 30,000 | | | | 29,648 | |
Wells Fargo & Co. (b) | | | 3.550 | % | | | 09/29/25 | | | | 100,000 | | | | 102,621 | |
| Westpac Banking Corp. | | | 1.600 | % | | | 08/19/19 | | | | 75,000 | | | | 74,213 | |
| | | | | | | | | | | | | | | | 2,720,250 | |
| | | | | | | | | | | | | | | | | |
| Basic Industry — 0.2% |
E.I. du Pont de Nemours & Co. (b) | | | 2.200 | % | | | 05/01/20 | | | | 75,000 | | | | 74,929 | |
| | | | | | | | | | | | | | | | | |
| Brokerage Asset Managers Exchanges — 0.2% |
| CBOE Holdings, Inc. | | | 3.650 | % | | | 01/12/27 | | | | 100,000 | | | | 102,969 | |
| | | | | | | | | | | | | | | | | |
| Capital Goods — 0.6% |
| General Electric Capital Corp. | | | 6.750 | % | | | 03/15/32 | | | | 100,000 | | | | 136,938 | |
| L-3 Communications Corp. | | | 3.850 | % | | | 12/15/26 | | | | 50,000 | | | | 51,401 | |
| Lennox International, Inc. | | | 3.000 | % | | | 11/15/23 | | | | 100,000 | | | | 98,727 | |
| | | | | | | | | | | | | | | | 287,066 | |
| | | | | | | | | | | | | | | | | |
| Communications — 2.2% |
| American Tower Corp. | | | 2.250 | % | | | 01/15/22 | | | | 50,000 | | | | 48,692 | |
| AT&T, Inc. | | | 3.200 | % | | | 03/01/22 | | | | 50,000 | | | | 50,534 | |
| AT&T, Inc. | | | 4.500 | % | | | 05/15/35 | | | | 100,000 | | | | 99,341 | |
AT&T, Inc. (b) | | | 4.900 | % | | | 08/14/37 | | | | 150,000 | | | | 152,097 | |
| Charter Communications Operating LLC | | | 6.834 | % | | | 10/23/55 | | | | 150,000 | | | | 180,274 | |
| Comcast Corp. | | | 3.969 | % | | | 11/01/47 | | | | 144,000 | | | | 148,618 | |
| Crown Castle International Corp. | | | 2.250 | % | | | 09/01/21 | | | | 75,000 | | | | 73,727 | |
| Time Warner, Inc. | | | 3.800 | % | | | 02/15/27 | | | | 100,000 | | | | 99,877 | |
Verizon Communications, Inc. (b) | | | 4.125 | % | | | 03/16/27 | | | | 100,000 | | | | 104,242 | |
| | | | | | | | | | | | | | | | 957,402 | |
| | | | | | | | | | | | | | | | | |
| Consumer Cyclical — 1.7% |
BMW U.S. Capital LLC (c) | | | 1.450 | % | | | 09/13/19 | | | | 25,000 | | | | 24,728 | |
Daimler Finance NA LLC (c) | | | 1.750 | % | | | 10/30/19 | | | | 150,000 | | | | 148,174 | |
| Ford Motor Co. | | | 4.346 | % | | | 12/08/26 | | | | 100,000 | | | | 104,231 | |
Ford Motor Co. (b) | | | 7.450 | % | | | 07/16/31 | | | | 75,000 | | | | 98,008 | |
| General Motors Financial Co. | | | 3.200 | % | | | 07/06/21 | | | | 35,000 | | | | 35,338 | |
| General Motors Financial Co. | | | 4.000 | % | | | 10/06/26 | | | | 100,000 | | | | 101,677 | |
Home Depot, Inc. (The) (b) | | | 3.500 | % | | | 09/15/56 | | | | 100,000 | | | | 96,087 | |
DIAMOND HILL FUNDS | ANNUAL REPORT | DECEMBER 31, 2017 | DIAMOND-HILL.COM 67 |
Diamond Hill Core Bond Fund
Schedule of Investments (Continued)
December 31, 2017
| | | Coupon | | | Maturity | | | Shares/ Par Value | | | Fair
Value | |
| Corporate Credit — 19.2% continued |
| Consumer Cyclical — 1.7% continued |
Nissan Motor Acceptance Corp. (c) | | | 1.550 | % | | | 09/13/19 | | | $ | 75,000 | | | $ | 74,057 | |
| Toyota Motor Credit Corp. | | | 1.950 | % | | | 04/17/20 | | | | 75,000 | | | | 74,694 | |
| | | | | | | | | | | | | | | | 756,994 | |
| | | | | | | | | | | | | | | | | |
| Consumer Non-Cyclical — 1.5% |
| Abbott Laboratories | | | 4.750 | % | | | 11/30/36 | | | | 100,000 | | | | 112,281 | |
| Actavis Funding SCS | | | 4.550 | % | | | 03/15/35 | | | | 100,000 | | | | 105,747 | |
| Amgen, Inc. | | | 2.650 | % | | | 05/11/22 | | | | 140,000 | | | | 139,606 | |
| Anheuser-Busch InBev SA/NV | | | 4.700 | % | | | 02/01/36 | | | | 100,000 | | | | 112,145 | |
Kroger Co. (The) (b) | | | 2.650 | % | | | 10/15/26 | | | | 100,000 | | | | 93,068 | |
| Thermo Fisher Scientific, Inc. | | | 2.950 | % | | | 09/19/26 | | | | 100,000 | | | | 97,144 | |
| | | | | | | | | | | | | | | | 659,991 | |
| | | | | | | | | | | | | | | | | |
| Electric — 1.3% | | | | | | | | | | | | | | | | |
| CMS Energy Corp. | | | 2.950 | % | | | 02/15/27 | | | | 100,000 | | | | 96,483 | |
| DTE Energy Co. | | | 2.850 | % | | | 10/01/26 | | | | 100,000 | | | | 95,992 | |
| Entergy Corp. | | | 2.950 | % | | | 09/01/26 | | | | 50,000 | | | | 48,634 | |
| NextEra Energy, Inc. | | | 1.649 | % | | | 09/01/18 | | | | 35,000 | | | | 34,899 | |
| Public Service Electric & Gas Co. | | | 2.250 | % | | | 09/15/26 | | | | 100,000 | | | | 94,037 | |
| Sempra Energy | | | 1.625 | % | | | 10/07/19 | | | | 30,000 | | | | 29,623 | |
| Southern Power Co. | | | 1.950 | % | | | 12/15/19 | | | | 55,000 | | | | 54,541 | |
| Southwestern Electric Power Co. | | | 2.750 | % | | | 10/01/26 | | | | 100,000 | | | | 96,281 | |
| | | | | | | | | | | | | | | | 550,490 | |
| | | | | | | | | | | | | | | | | |
| Energy — 0.9% | | | | | | | | | | | | | | | | |
| Cimarex Energy Co. | | | 3.900 | % | | | 05/15/27 | | | | 100,000 | | | | 102,223 | |
| Phillips 66 Partners LP | | | 3.550 | % | | | 10/01/26 | | | | 100,000 | | | | 99,085 | |
Shell International Finance BV (b) | | | 6.375 | % | | | 12/15/38 | | | | 73,000 | | | | 101,697 | |
| Valero Energy Corp. | | | 3.400 | % | | | 09/15/26 | | | | 100,000 | | | | 100,380 | |
| | | | | | | | | | | | | | | | 403,385 | |
| | | | | | | | | | | | | | | | | |
| Finance Companies — 0.2% |
| American Express Credit Corp. | | | 1.700 | % | | | 10/30/19 | | | | 100,000 | | | | 98,956 | |
| | | | | | | | | | | | | | | | | |
| Insurance — 1.6% |
Jackson National Life Global Funding (c) | | | 2.100 | % | | | 10/25/21 | | | | 50,000 | | | | 49,053 | |
Lincoln National Corp. (b) | | | 3.625 | % | | | 12/12/26 | | | | 100,000 | | | | 102,018 | |
Met Life Global Funding I (c) | | | 1.350 | % | | | 09/14/18 | | | | 150,000 | | | | 149,423 | |
New York Life Global Funding (c) | | | 2.350 | % | | | 07/14/26 | | | | 50,000 | | | | 47,709 | |
New York Life Global Holdings (c) | | | 2.900 | % | | | 01/17/24 | | | | 100,000 | | | | 100,420 | |
Pricoa Global Funding I (c) | | | 1.450 | % | | | 09/13/19 | | | | 150,000 | | | | 147,659 | |
Principal Life Global Funding II (c) | | | 2.375 | % | | | 11/21/21 | | | | 100,000 | | | | 99,248 | |
| | | | | | | | | | | | | | | | 695,530 | |
| | | | | | | | | | | | | | | | | |
| REITS — 1.6% | | | | | | | | | | | | | | | | |
| Alexandria Real Estate Equities, Inc. | | | 3.950 | % | | | 01/15/28 | | | | 100,000 | | | | 102,080 | |
| American Campus Communities, Inc. | | | 3.625 | % | | | 11/15/27 | | | | 100,000 | | | | 98,872 | |
| Boston Properties LP | | | 2.750 | % | | | 10/01/26 | | | | 50,000 | | | | 47,155 | |
| CubeSmart LP | | | 3.125 | % | | | 09/01/26 | | | | 50,000 | | | | 47,652 | |
| ERP Operating LP | | | 2.850 | % | | | 11/01/26 | | | | 100,000 | | | | 96,981 | |
| Life Storage LP | | | 3.875 | % | | | 12/15/27 | | | | 100,000 | | | | 99,602 | |
| Realty Income Corp. | | | 3.000 | % | | | 01/15/27 | | | | 100,000 | | | | 95,663 | |
| Spirit Realty LP | | | 4.450 | % | | | 09/15/26 | | | | 100,000 | | | | 99,549 | |
| | | | | | | | | | | | | | | | 687,554 | |
| | | | | | | | | | | | | | | | | |
| Technology — 0.2% |
| Apple, Inc. | | | 3.000 | % | | | 06/20/27 | | | | 100,000 | | | | 99,531 | |
| | | | | | | | | | | | | | | | | |
| Transportation — 0.8% |
| Continental Airlines Pass-Through Trust, Series 2012-1, Class B | | | 6.250 | % | | | 10/11/21 | | | | 40,793 | | | | 42,760 | |
| CSX Corp. | | | 4.250 | % | | | 11/01/66 | | | | 100,000 | | | | 99,805 | |
| Southwest Airlines Co. | | | 3.000 | % | | | 11/15/26 | | | | 100,000 | | | | 97,049 | |
| U.S. Airways Pass-Through Trust, Series 2011-1, Class A | | | 7.125 | % | | | 04/22/25 | | | | 46,855 | | | | 53,779 | |
| United Airlines Pass-Through Trust, Series 2007-1, Class A | | | 6.636 | % | | | 07/02/22 | | | | 38,396 | | | | 41,460 | |
| | | | | | | | | | | | | | | | 334,853 | |
| | | | | | | | | | | | | | | | | |
| Total Corporate Credit | | | | | | | | | | | | | | $ | 8,429,900 | |
68 DIAMOND HILL FUNDS | ANNUAL REPORT | DECEMBER 31, 2017 | DIAMOND-HILL.COM |
Diamond Hill Core Bond Fund
Schedule of Investments (Continued)
December 31, 2017
| | | Coupon | | | Maturity | | | Shares/ Par Value | | | Fair
Value | |
| Government Related — 1.5% |
| Government Guaranteed — 1.1% |
| Tunisian Republic | | | 1.416 | % | | | 08/05/21 | | | $ | 500,000 | | | $ | 483,450 | |
| | | | | | | | | | | | | | | | | |
| Government Owned, No Guarantee — 0.4% |
| Tennessee Valley Authority | | | 4.625 | % | | | 09/15/60 | | | | 125,000 | | | | 157,391 | |
| | | | | | | | | | | | | | | | | |
Total Government Related | | | | | | | | | | | | | | $ | 640,841 | |
| | | | | | | | | | | | | | | | | |
| Securitized — 54.7% |
| ABS-Other — 5.4% |
Gold Key Resorts LLC, Series 2014-A, Class A (c) | | | 3.220 | % | | | 03/17/31 | | | | 40,950 | | | | 40,781 | |
GoodGreen Trust, Series 2017-1A, Class A (c) | | | 3.740 | % | | | 10/15/52 | | | | 143,927 | | | | 142,876 | |
Hero Funding Trust, Series 2016-3A, Class A1 (c) | | | 3.080 | % | | | 09/20/42 | | | | 125,991 | | | | 124,321 | |
Hero Funding Trust, Series 2016-3B, Class B (c) | | | 5.240 | % | | | 09/20/42 | | | | 73,794 | | | | 74,762 | |
Hero Funding Trust, Series 2016-1R, Class A1 (c) | | | 4.500 | % | | | 09/21/42 | | | | 72,660 | | | | 72,297 | |
Hero Funding Trust, Series 2016-4A, Class A1 (c) | | | 3.570 | % | | | 09/20/47 | | | | 171,424 | | | | 174,178 | |
Hero Funding Trust, Series 2016-4B, Class B (c) | | | 4.990 | % | | | 09/20/47 | | | | 89,722 | | | | 89,836 | |
Hero Funding Trust, Series 2017-3A, Class A1 (a)(c) | | | 0.000 | % | | | 09/20/48 | | | | 149,165 | | | | 148,735 | |
Mosaic Solar Loans LLC, Series 2017-2A, Class B (c) | | | 4.770 | % | | | 09/20/42 | | | | 100,000 | | | | 100,897 | |
Nationstar HECM Loan Trust, Series 2016-3A, Class A (c) | | | 2.012 | % | | | 08/25/26 | | | | 136,254 | | | | 136,216 | |
Nationstar HECM Loan Trust, Series 2016-3A, Class M1 (c) | | | 3.147 | % | | | 08/25/26 | | | | 200,000 | | | | 200,038 | |
New Residential Advance Receivables Trust, Series 2016-T4, Class DT4 (c) | | | 4.386 | % | | | 12/15/50 | | | | 200,000 | | | | 199,621 | |
Ocwen Master Advance Receivables Trust, Series 2016-T1, Class AT1 (c) | | | 2.520 | % | | | 08/17/48 | | | | 100,000 | | | | 99,980 | |
Ocwen Master Advance Receivables Trust, Series 2016-T1, Class DT1 (c) | | | 4.246 | % | | | 08/17/48 | | | | 100,000 | | | | 100,803 | |
Ocwen Master Advance Receivables Trust, Series 2017-T1, Class DT1 (c) | | | 3.535 | % | | | 09/15/48 | | | | 100,000 | | | | 99,989 | |
OnDeck Asset Securitization Trust, Series 2016-1A, Class A (c) | | | 4.210 | % | | | 05/17/20 | | | | 150,000 | | | | 150,589 | |
Renew Financial LLC, Series 2017-1A, Class B (c) | | | 5.750 | % | | | 09/20/52 | | | | 93,851 | | | | 95,544 | |
SPS Servicer Advance Receivables Trust, Series 2016-T2, Class CT2 (c) | | | 3.590 | % | | | 11/15/49 | | | | 100,000 | | | | 97,985 | |
TES LLC, Series 2017-1A, Class A (c) | | | 4.330 | % | | | 10/20/47 | | | | 200,000 | | | | 201,196 | |
| | | | | | | | | | | | | | | | 2,350,644 | |
| | | | | | | | | | | | | | | | | |
| Agency CMBS — 4.7% |
FNMA, Pool FN AE0834 (a) | | | 3.977 | % | | | 01/01/21 | | | | 58,683 | | | | 61,055 | |
| FNMA, Series 2015-M3, Class A2 | | | 2.722 | % | | | 10/25/24 | | | | 200,000 | | | | 199,866 | |
| FNMA, Pool FN AM8674 | | | 2.810 | % | | | 04/01/25 | | | | 600,000 | | | | 604,476 | |
| FNMA, Pool FN AN0262 | | | 2.810 | % | | | 11/01/25 | | | | 483,485 | | | | 487,112 | |
DIAMOND HILL FUNDS | ANNUAL REPORT | DECEMBER 31, 2017 | DIAMOND-HILL.COM 69 |
Diamond Hill Core Bond Fund
Schedule of Investments (Continued)
December 31, 2017
| | | Coupon | | | Maturity | | | Shares/ Par Value | | | Fair
Value | |
| Securitized — 54.7% continued |
| Agency CMBS — 4.7% continued |
FNMA, Pool FN AN2213 (a) | | | 2.810 | % | | | 07/01/26 | | | $ | 700,000 | | | $ | 700,073 | |
| | | | | | | | | | | | | | | | 2,052,582 | |
| | | | | | | | | | | | | | | | | |
| Agency MBS CMO — 18.5% |
| FHLMC, Series 3994, Class EI | | | 3.000 | % | | | 02/15/22 | | | | 966,536 | | | | 38,113 | |
| FHLMC, Series 3874, Class KI | | | 4.500 | % | | | 08/15/25 | | | | 548,568 | | | | 31,319 | |
| FHLMC, Series 2646, Class ZH | | | 5.000 | % | | | 07/15/33 | | | | 102,653 | | | | 107,937 | |
| FHLMC, Series 2814, Class PH | | | 6.000 | % | | | 06/15/34 | | | | 70,171 | | | | 78,509 | |
| FHLMC, Series 3102, Class TA | | | 7.500 | % | | | 01/15/36 | | | | 297,237 | | | | 340,023 | |
| FHLMC, Series 3607, Class AO | | | 0.000 | % | | | 04/15/36 | | | | 209,727 | | | | 181,727 | |
| FHLMC, Series 3199, Class OC | | | 0.000 | % | | | 08/15/36 | | | | 158,094 | | | | 140,954 | |
| FHLMC, Series 3318, Class AO | | | 0.000 | % | | | 05/15/37 | | | | 13,987 | | | | 12,804 | |
| FHLMC, Series 379, Class 1 | | | 0.000 | % | | | 05/25/37 | | | | 125,081 | | | | 109,104 | |
| FHLMC, Series 3607, Class OP | | | 0.000 | % | | | 07/15/37 | | | | 156,015 | | | | 136,042 | |
FHLMC, Series 3594, Class SP (a) | | | 3.323 | % | | | 12/15/37 | | | | 49,722 | | | | 51,584 | |
| FHLMC, Series 3605, Class PB | | | 4.500 | % | | | 11/15/39 | | | | 100,000 | | | | 107,765 | |
| FHLMC, Series 3617, Class PC | | | 4.500 | % | | | 12/15/39 | | | | 109,000 | | | | 118,143 | |
| FNMA, Series 1994-4, Class ZC | | | 6.500 | % | | | 01/25/24 | | | | 64,092 | | | | 69,639 | |
| FNMA, Series 2012-17, Class BC | | | 3.500 | % | | | 03/25/27 | | | | 1,000,000 | | | | 1,028,884 | |
| FNMA, Series 2002-86, Class PG | | | 6.000 | % | | | 12/25/32 | | | | 136,571 | | | | 152,942 | |
| FNMA, Series 348, Class 11 | | | 6.000 | % | | | 01/25/34 | | | | 187,338 | | | | 41,514 | |
| FNMA, Series 2004-17, Class BA | | | 6.000 | % | | | 04/25/34 | | | | 204,117 | | | | 249,685 | |
FNMA, Series 2005-45, Class PQ (1MO LIBOR + 550) (a) | | | 3.947 | % | | | 10/25/34 | | | | 639,816 | | | | 58,447 | |
| FNMA, Series 390, Class 32 | | | 6.500 | % | | | 12/25/34 | | | | 275,442 | | | | 59,458 | |
| FNMA, Series 2005-3, Class CG | | | 5.500 | % | | | 02/25/35 | | | | 211,000 | | | | 237,002 | |
| FNMA, Series 2005-68, Class PG | | | 5.500 | % | | | 08/25/35 | | | | 83,469 | | | | 91,088 | |
| FNMA, Series 2009-19, Class TD | | | 5.000 | % | | | 08/25/36 | | | | 103,071 | | | | 112,408 | |
| FNMA, Series 2007-39, Class NB | | | 4.250 | % | | | 05/25/37 | | | | 216,082 | | | | 229,450 | |
| FNMA, Series 2009-103, Class MB | | | 4.000 | % | | | 12/25/39 | | | | 161,002 | | | | 171,587 | |
| FNMA, Series 2010-2, Class LC | | | 5.000 | % | | | 02/25/40 | | | | 200,000 | | | | 225,129 | |
FNMA, Series 2010-44, Class CS (1MO LIBOR + 655) (a) | | | 4.997 | % | | | 05/25/40 | | | | 208,600 | | | | 25,803 | |
| FNMA, Series 2011-14, Class PI | | | 5.000 | % | | | 06/25/40 | | | | 333,535 | | | | 32,473 | |
| FNMA, Series 2010-71, Class HJ | | | 5.500 | % | | | 07/25/40 | | | | 74,426 | | | | 82,338 | |
| FNMA, Series 2011-14, Class PB | | | 5.000 | % | | | 03/25/41 | | | | 570,000 | | | | 641,734 | |
| FNMA, Series 2011-57, Class PD | | | 4.000 | % | | | 07/25/41 | | | | 321,407 | | | | 344,582 | |
| FNMA, Series 411, Class A3 | | | 3.000 | % | | | 08/25/42 | | | | 111,542 | | | | 111,536 | |
| FNMA, Series 2013-35, Class LP | | | 3.000 | % | | | 01/25/43 | | | | 176,000 | | | | 174,973 | |
| FNMA, Series 2013-35, Class CV | | | 3.000 | % | | | 02/25/43 | | | | 350,000 | | | | 349,745 | |
| FNMA, Series 2013-104, Class CY | | | 5.000 | % | | | 10/25/43 | | | | 100,000 | | | | 113,428 | |
| GNMA, Series 2004-49, Class MZ | | | 6.000 | % | | | 06/20/34 | | | | 293,882 | | | | 347,422 | |
| GNMA, Series 2005-13, Class BG | | | 5.000 | % | | | 02/20/35 | | | | 170,000 | | | | 189,441 | |
| GNMA, Series 2015-123, Class VB | | | 3.500 | % | | | 09/20/35 | | | | 100,000 | | | | 103,139 | |
GNMA, Series 2008-40, Class SA (1MO LIBOR + 640) (a) | | | 4.909 | % | | | 05/16/38 | | | | 109,437 | | | | 17,085 | |
| GNMA, Series 2009-2, Class PA | | | 5.000 | % | | | 12/20/38 | | | | 129,742 | | | | 137,237 | |
70 DIAMOND HILL FUNDS | ANNUAL REPORT | DECEMBER 31, 2017 | DIAMOND-HILL.COM |
Diamond Hill Core Bond Fund
Schedule of Investments (Continued)
December 31, 2017
| | | Coupon | | | Maturity | | | Shares/ Par Value | | | Fair
Value | |
| Securitized — 54.7% continued |
| Agency MBS CMO — 18.5% continued |
| GNMA, Series 2010-105, Class B | | | 5.000 | % | | | 08/20/40 | | | $ | 300,000 | | | $ | 327,892 | |
| GNMA, Series 2011-93, Class WB | | | 4.000 | % | | | 03/20/41 | | | | 48,782 | | | | 48,812 | |
GNMA, Series 2013-37, Class F (1MO LIBOR + 27) (a) | | | 1.771 | % | | | 03/20/43 | | | | 78,594 | | | | 77,927 | |
| GNMA, Series 2015-179, Class ZB | | | 2.500 | % | | | 02/20/45 | | | | 51,820 | | | | 43,355 | |
GNMA, Series BC-H066, Class DI (a) | | | 3.090 | % | | | 05/31/64 | | | | 1,541,680 | | | | 53,321 | |
GNMA, Series 2014-H14, Class FA (1MO LIBOR + 50) (a) | | | 1.733 | % | | | 07/20/64 | | | | 169,102 | | | | 169,159 | |
GNMA, Series 2014-H15, Class FA (1MO LIBOR + 50) (a) | | | 1.743 | % | | | 07/20/64 | | | | 114,434 | | | | 114,488 | |
GNMA, Series 2016-H11, Class FD (12MO LIBOR + 40) (a) | | | 2.201 | % | | | 05/20/66 | | | | 310,228 | | | | 313,043 | |
| GNMA, Series 2017-H22, Class ID | | | 3.224 | % | | | 11/20/67 | | | | 1,420,727 | | | | 39,866 | |
| Vendee Mortgage Trust, Series 1995-3, Class 1Z | | | 7.250 | % | | | 09/15/25 | | | | 78,888 | | | | 88,124 | |
| | | | | | | | | | | | | | | | 8,128,180 | |
| | | | | | | | | | | | | | | | | |
| Agency MBS Passthrough — 1.9% |
| FHLMC, Pool FG G06085 | | | 6.500 | % | | | 09/01/38 | | | | 148,692 | | | | 164,701 | |
| FNMA, Pool FN AT7120 | | | 3.500 | % | | | 06/01/33 | | | | 308,381 | | | | 318,567 | |
| FNMA, Pool FN AS4073 | | | 4.000 | % | | | 12/01/44 | | | | 330,305 | | | | 349,498 | |
| | | | | | | | | | | | | | | | 832,766 | |
| | | | | | | | | | | | | | | | | |
| Auto Loan — 6.1% |
Bank of the West Auto Trust, Series 2017-1, Class D (c) | | | 3.210 | % | | | 04/15/25 | | | | 100,000 | | | | 99,063 | |
California Republic Auto Receivables Trust, Series 2015-4, Class C (c) | | | 4.230 | % | | | 09/15/22 | | | | 100,000 | | | | 100,876 | |
CarFinance Capital LLC, Series 2014-2A, Class A (c) | | | 1.440 | % | | | 11/16/20 | | | | 24,037 | | | | 24,016 | |
| CarMax Auto Owner Trust, Series 2017-3, Class D | | | 3.460 | % | | | 10/16/23 | | | | 250,000 | | | | 249,758 | |
CPS Auto Trust, Series 2015-B, Class A (c) | | | 1.650 | % | | | 11/15/19 | | | | 14,198 | | | | 14,189 | |
CPS Auto Trust, Series 2016-C, Class A (c) | | | 1.620 | % | | | 01/15/20 | | | | 27,789 | | | | 27,752 | |
CPS Auto Trust, Series 2016-C, Class C (c) | | | 3.270 | % | | | 06/15/22 | | | | 100,000 | | | | 100,241 | |
CPS Auto Trust, Series 2017-D, Class D (c) | | | 3.730 | % | | | 09/15/23 | | | | 100,000 | | | | 99,254 | |
Drive Auto Receivables Trust, Series 2017-3, Class D (c) | | | 3.530 | % | | | 12/15/23 | | | | 100,000 | | | | 100,289 | |
Exeter Automobile Receivables Trust, Series 2017-3A, Class C (c) | | | 3.680 | % | | | 07/17/23 | | | | 150,000 | | | | 149,864 | |
Flagship Credit Auto Trust, Series 2017-3, Class D (c) | | | 3.730 | % | | | 09/15/23 | | | | 150,000 | | | | 150,026 | |
FourSight Capital Automobile Receivables Trust, Series 2017-1, Class D (c) | | | 5.280 | % | | | 08/15/24 | | | | 100,000 | | | | 99,227 | |
GLS Auto Receivables Trust, Series 2016-1A, Class C (c) | | | 6.900 | % | | | 10/15/21 | | | | 100,000 | | | | 105,651 | |
| GM Financial Automobile Leasing Trust, Series 2017-3, Class C | | | 2.730 | % | | | 09/20/21 | | | | 100,000 | | | | 98,997 | |
Hertz Fleet Lease Funding LP, Series 2017-1, Class E (c) | | | 5.800 | % | | | 04/10/31 | | | | 100,000 | | | | 99,011 | |
DIAMOND HILL FUNDS | ANNUAL REPORT | DECEMBER 31, 2017 | DIAMOND-HILL.COM 71 |
Diamond Hill Core Bond Fund
Schedule of Investments (Continued)
December 31, 2017
| | | Coupon | | | Maturity | | | Shares/ Par Value | | | Fair
Value | |
| Securitized — 54.7% continued |
| Auto Loan — 6.1% continued |
Honor Automobile Trust Securitization, Series 2016-1A, Class A (c) | | | 2.940 | % | | | 11/15/19 | | | $ | 37,013 | | | $ | 37,119 | |
Navistar Financial Dealer Master Trust, Series 2016-1, Class B (1MO LIBOR + 175) (a)(c) | | | 3.302 | % | | | 09/27/21 | | | | 150,000 | | | | 150,846 | |
OSCAR US Funding Trust, Series 2017-2A, Class A2B (1MO LIBOR + 65) (a)(c) | | | 2.081 | % | | | 11/10/20 | | | | 200,000 | | | | 200,030 | |
OSCAR US Funding Trust, Series 2014-1A, Class A4 (c) | | | 2.550 | % | | | 12/15/21 | | | | 340,000 | | | | 339,585 | |
Prestige Auto Receivables Trust, Series 2015-1, Class D (c) | | | 3.050 | % | | | 04/15/21 | | | | 100,000 | | | | 100,019 | |
Prestige Auto Receivables Trust, Series 2017-1A, Class D (c) | | | 3.610 | % | | | 10/16/23 | | | | 150,000 | | | | 149,405 | |
Santander Retail Auto Lease Trust, Series 2017-A, Class A4 (c) | | | 2.370 | % | | | 01/20/22 | | | | 100,000 | | | | 99,557 | |
Santander Retail Auto Lease Trust, Series 2017-A, Class C (c) | | | 2.960 | % | | | 11/21/22 | | | | 100,000 | | | | 99,916 | |
| | | | | | | | | | | | | | | | 2,694,691 | |
| | | | | | | | | | | | | | | | | |
| Consumer — 4.6% |
Arcadia Receivables Credit Trust, Series 2017-1, Class A (c) | | | 3.250 | % | | | 06/15/23 | | | | 41,300 | | | | 41,431 | |
Citi Held for Asset Issuance, Series 2015-PM2, Class B (c) | | | 4.000 | % | | | 03/15/22 | | | | 24,338 | | | | 24,383 | |
Consumer Loan Underlying Bond Credit Trust, Series 2017-P1, Class A (c) | | | 2.420 | % | | | 09/15/23 | | | | 86,283 | | | | 86,239 | |
Consumer Loan Underlying Bond Credit Trust, Series 17-NP2, Class B (a)(c) | | | 3.500 | % | | | 01/16/24 | | | | 200,000 | | | | 199,982 | |
LendingClub Issuance Trust, Series 2016-NP1, Class B (c) | | | 6.500 | % | | | 06/15/22 | | | | 250,000 | | | | 254,983 | |
Lendmark Funding Trust, Series 2017-1A, Class B (c) | | | 3.770 | % | | | 01/22/24 | | | | 100,000 | | | | 100,479 | |
Lendmark Funding Trust, Series 2017-1A, Class C (c) | | | 5.410 | % | | | 01/22/24 | | | | 150,000 | | | | 154,041 | |
Lendmark Funding Trust, Series 2016-2A, Class C (c) | | | 6.640 | % | | | 04/21/25 | | | | 100,000 | | | | 102,594 | |
Mariner Finance Issuance Trust, Series 2017-AA, Class B (c) | | | 4.740 | % | | | 02/20/29 | | | | 100,000 | | | | 101,482 | |
Mariner Finance Issuance Trust, Series 2017-BA, Class C (c) | | | 4.570 | % | | | 12/20/29 | | | | 250,000 | | | | 249,350 | |
MarketPlace Loan Trust, Series 2015-AV2, Class A (c) | | | 4.000 | % | | | 10/15/21 | | | | 16,419 | | | | 16,449 | |
MarketPlace Loan Trust, Series 2015-AV2, Class C (c) | | | 7.500 | % | | | 10/15/21 | | | | 112,853 | | | | 115,579 | |
Marlette Funding Trust, Series 2016-1A, Class A (c) | | | 3.060 | % | | | 01/17/23 | | | | 42,030 | | | | 42,108 | |
Marlette Funding Trust, Series 2017-1A, Class B (c) | | | 4.114 | % | | | 03/15/24 | | | | 150,000 | | | | 152,273 | |
Marlette Funding Trust, Series 2017-2A, Class B (c) | | | 3.190 | % | | | 07/15/24 | | | | 100,000 | | | | 100,229 | |
72 DIAMOND HILL FUNDS | ANNUAL REPORT | DECEMBER 31, 2017 | DIAMOND-HILL.COM |
Diamond Hill Core Bond Fund
Schedule of Investments (Continued)
December 31, 2017
| | | Coupon | | | Maturity | | | Shares/ Par Value | | | Fair
Value | |
| Securitized — 54.7% continued |
| Consumer — 4.6% continued |
Prosper Marketplace Issuance Trust, Series 2017-2A, Class B (c) | | | 3.480 | % | | | 09/15/23 | | | $ | 100,000 | | | $ | 100,224 | |
Upstart Securitization Trust, Series 2017-1, Class B (c) | | | 3.802 | % | | | 06/20/24 | | | | 150,000 | | | | 150,045 | |
| | | | | | | | | | | | | | | | 1,991,871 | |
| | | | | | | | | | | | | | | | | |
| Equipment — 0.9% |
Axis Equipment Finance Receivables Trust, Series 2016-1A, Class A (c) | | | 2.210 | % | | | 11/20/21 | | | | 52,617 | | | | 52,493 | |
BCC Funding Corp., Series 2015-1, Class A2 (c) | | | 2.224 | % | | | 10/20/20 | | | | 47,119 | | | | 47,047 | |
California Funding II Ltd., Series 2013-1A, Class A (c) | | | 3.350 | % | | | 03/27/28 | | | | 52,500 | | | | 51,646 | |
Global SC Finance SRL, Series 2014-1A, Class A2 (c) | | | 3.090 | % | | | 07/17/29 | | | | 65,833 | | | | 65,013 | |
LEAF II Receivables Funding LLC, Series 2017-1, Class E1 (c) | | | 4.470 | % | | | 07/15/22 | | | | 100,000 | | | | 100,452 | |
SCF Equipment Trust LLC, Series 2017-1A, Class A (c) | | | 3.770 | % | | | 01/20/23 | | | | 79,190 | | | | 78,988 | |
| | | | | | | | | | | | | | | | 395,639 | |
| | | | | | | | | | | | | | | | | |
| Non Agency CMBS — 9.4% |
A10 Securitization, Series 2017-1A, Class C (c) | | | 4.050 | % | | | 03/15/36 | | | | 250,000 | | | | 248,841 | |
A10 Securitization, Series 2017-1A, Class D (c) | | | 4.700 | % | | | 03/15/36 | | | | 250,000 | | | | 248,471 | |
American Homes 4 Rent, Series 2014-SFR2, Class D (c) | | | 3.678 | % | | | 12/17/36 | | | | 141,899 | | | | 146,898 | |
American Homes 4 Rent, Series 2015-SFR1, Class A (c) | | | 3.467 | % | | | 04/17/52 | | | | 122,720 | | | | 125,583 | |
AMSR Trust, Series 2016-SFR1, Class A (1MO LIBOR + 140) (a)(c) | | | 2.890 | % | | | 11/17/33 | | | | 100,000 | | | | 100,611 | |
B2R Mortgage Trust, Series 2015-2, Class A (c) | | | 3.336 | % | | | 11/15/48 | | | | 91,369 | | | | 92,285 | |
Bancorp Commercial Mortgage Trust (The), Series 2017-CRE2, Class C (1MO LIBOR + 235) (a)(c) | | | 3.827 | % | | | 08/15/32 | | | | 250,000 | | | | 250,488 | |
Bancorp Commercial Mortgage Trust (The), Series 2016-CRE1, Class D (1MO LIBOR + 603.665) (a)(c) | | | 7.513 | % | | | 11/15/33 | | | | 100,000 | | | | 100,331 | |
Barclays Commercial Mortgage Securities, Series 2016-ETC, Class A (c) | | | 2.937 | % | | | 08/14/36 | | | | 100,000 | | | | 97,845 | |
Colony American Finance Ltd., Series 2016-1, Class A (c) | | | 2.544 | % | | | 06/15/48 | | | | 163,602 | | | | 162,132 | |
Colony American Finance Ltd., Series 2016-2, Class B (c) | | | 3.141 | % | | | 11/15/48 | | | | 150,000 | | | | 147,225 | |
Commercial Mortgage Trust, Series 2014-TWC, Class B (1MO LIBOR + 160) (a)(c) | | | 2.937 | % | | | 02/13/32 | | | | 100,000 | | | | 100,386 | |
Cosmopolitan Hotel Trust, Series 2017-CSMO, Class D (a)(c) | | | 3.629 | % | | | 11/15/34 | | | | 100,000 | | | | 100,187 | |
FCRE LLC, Series 2016-1A, Class D (1MO LIBOR + 585) (a)(c) | | | 7.402 | % | | | 05/21/36 | | | | 100,000 | | | | 100,481 | |
DIAMOND HILL FUNDS | ANNUAL REPORT | DECEMBER 31, 2017 | DIAMOND-HILL.COM 73 |
Diamond Hill Core Bond Fund
Schedule of Investments (Continued)
December 31, 2017
| | | Coupon | | | Maturity | | | Shares/ Par Value | | | Fair
Value | |
| Securitized — 54.7% continued |
| Non Agency CMBS — 9.4% continued |
FirstKey Lending Trust, Series 2015-SFR1, Class A (c) | | | 2.553 | % | | | 03/09/47 | | | $ | 89,554 | | | $ | 89,062 | |
FREMF Mortgage Trust, Series 2012-K21, Class C (a)(c) | | | 3.937 | % | | | 07/25/22 | | | | 450,000 | | | | 452,230 | |
| FREMF Mortgage Trust, Series 2016-K723, Class B | | | 3.582 | % | | | 11/25/23 | | | | 150,000 | | | | 150,331 | |
FREMF Mortgage Trust, Series 2012-K23, Class C (a)(c) | | | 3.781 | % | | | 10/25/45 | | | | 90,000 | | | | 89,202 | |
Prime Finance Partners III, Series 2015-2, Class A (1MO LIBOR + 145) (a)(c) | | | 2.927 | % | | | 07/14/34 | | | | 43,305 | | | | 43,367 | |
Prime Finance Partners III, Series 2017-3, Class C (1MO LIBOR + 250) (a)(c) | | | 3.931 | % | | | 01/14/35 | | | | 100,000 | | | | 100,446 | |
Progress Residential Trust, Series 2015-SFR2, Class A (c) | | | 2.740 | % | | | 06/12/32 | | | | 227,558 | | | | 227,001 | |
Progress Residential Trust, Series 2015-SFR3, Class A (c) | | | 3.067 | % | | | 11/12/32 | | | | 212,936 | | | | 214,059 | |
Progress Residential Trust, Series 2015-SFR3, Class D (c) | | | 4.673 | % | | | 11/12/32 | | | | 100,000 | | | | 102,829 | |
RAIT Trust, Series 2016-FL6, Class B (1MO LIBOR + 265) (a)(c) | | | 4.109 | % | | | 11/13/31 | | | | 100,000 | | | | 100,241 | |
ReadyCap Commercial Mortgage Trust, Series 2017-FL1, Class D (1MO LIBOR + 385) (a)(c) | | | 5.402 | % | | | 05/25/34 | | | | 250,000 | | | | 250,639 | |
Resource Capital Corp. Ltd, Series 2017-CRE5, Class B (1MO LIBOR + 200) (a)(c) | | | 3.477 | % | | | 07/15/34 | | | | 100,000 | | | | 100,000 | |
Starwood Waypoint Homes Trust, Series 2017-1, Class B (1MO LIBOR + 117) (a)(c) | | | 2.660 | % | | | 01/17/35 | | | | 100,000 | | | | 99,859 | |
Tricon American Homes, Series 2016-SFR1, Class C (c) | | | 3.487 | % | | | 11/17/33 | | | | 100,000 | | | | 99,847 | |
| | | | | | | | | | | | | | | | 4,140,877 | |
| | | | | | | | | | | | | | | | | |
| Non Agency MBS CMO — 0.5% |
Pretium Mortgage Credit Partners, Series 2016-NPL6, Class A1 (c) | | | 3.500 | % | | | 10/27/31 | | | | 77,006 | | | | 77,083 | |
Structured Asset Securities Corp., Series 2003-37A, Class 2A (a) | | | 3.315 | % | | | 12/25/33 | | | | 19,272 | | | | 19,326 | |
WaMu Mortgage Pass-Through Certificate, Series 2003-AR11, Class A6 (a) | | | 3.336 | % | | | 10/25/33 | | | | 26,873 | | | | 27,152 | |
Wells Fargo Mortgage Backed Securities, Series 2003-H, Class A1 (a) | | | 3.591 | % | | | 09/25/33 | | | | 75,491 | | | | 76,850 | |
| | | | | | | | | | | | | | | | 200,411 | |
| | | | | | | | | | | | | | | | | |
| Student Loan — 2.7% |
College Ave Student Loans, Series 2017-A, Class B (c) | | | 4.500 | % | | | 11/26/46 | | | | 100,000 | | | | 100,053 | |
Earnest Student Loan Program LLC, Series 2016-C, Class A2 (c) | | | 2.680 | % | | | 07/25/35 | | | | 141,845 | | | | 141,279 | |
Social Professional Loan Program, Series 2015-B, Class A2 (c) | | | 2.510 | % | | | 09/27/32 | | | | 146,074 | | | | 145,176 | |
Social Professional Loan Program, Series 2016-C, Class A2B (c) | | | 2.360 | % | | | 12/27/32 | | | | 260,000 | | | | 256,687 | |
74 DIAMOND HILL FUNDS | ANNUAL REPORT | DECEMBER 31, 2017 | DIAMOND-HILL.COM |
Diamond Hill Core Bond Fund
Schedule of Investments (Continued)
December 31, 2017
| | | Coupon | | | Maturity | | | Shares/ Par Value | | | Fair
Value | |
| Securitized — 54.7% continued |
| Student Loan — 2.7% continued |
Social Professional Loan Program, Series 2017-B, Class CFX (c) | | | 4.440 | % | | | 05/25/40 | | | $ | 150,000 | | | $ | 150,854 | |
Social Professional Loan Program, Series 2017-E, Class C (c) | | | 4.160 | % | | | 11/26/40 | | | | 200,000 | | | | 200,405 | |
Social Professional Loan Program, Series 2016-E, Class C (c) | | | 4.430 | % | | | 10/25/41 | | | | 200,000 | | | | 199,053 | |
| | | | | | | | | | | | | | | | 1,193,507 | |
| | | | | | | | | | | | | | | | | |
| Total Securitized | | | | | | | | | | | | | | $ | 23,981,168 | |
| | | | | | | | | | | | | | | | | |
| Treasury — 18.8% |
U.S. Treasury Notes(b) | | | 0.750 | % | | | 03/31/18 | | | | 200,000 | | | | 199,690 | |
| U.S. Treasury Notes | | | 1.125 | % | | | 01/15/19 | | | | 150,000 | | | | 148,905 | |
| U.S. Treasury STRIPS | | | 0.000 | % | | | 08/15/19 | | | | 200,000 | | | | 193,915 | |
| U.S. Treasury Notes | | | 1.375 | % | | | 04/30/21 | | | | 300,000 | | | | 293,487 | |
| U.S. Treasury Notes | | | 1.625 | % | | | 11/15/22 | | | | 1,000,000 | | | | 974,400 | |
U.S. Treasury Notes(b) | | | 2.000 | % | | | 11/30/22 | | | | 1,000,000 | | | | 990,757 | |
| U.S. Treasury Bonds | | | 1.500 | % | | | 03/31/23 | | | | 500,000 | | | | 481,953 | |
U.S. Treasury Notes(b) | | | 1.625 | % | | | 04/30/23 | | | | 100,000 | | | | 96,933 | |
| U.S. Treasury Notes | | | 2.500 | % | | | 05/15/24 | | | | 250,000 | | | | 252,766 | |
| U.S. Treasury Notes | | | 2.250 | % | | | 11/15/24 | | | | 250,000 | | | | 248,651 | |
| U.S. Treasury STRIPS | | | 0.000 | % | | | 02/15/25 | | | | 200,000 | | | | 168,128 | |
| U.S. Treasury Notes | | | 2.000 | % | | | 08/15/25 | | | | 950,000 | | | | 925,895 | |
| U.S. Treasury Notes | | | 2.250 | % | | | 11/15/25 | | | | 100,000 | | | | 99,095 | |
U.S. Treasury Notes(b) | | | 1.625 | % | | | 02/15/26 | | | | 525,000 | | | | 495,658 | |
| U.S. Treasury STRIPS | | | 0.000 | % | | | 05/15/28 | | | | 1,000,000 | | | | 769,912 | |
U.S. Treasury STRIPS(b) | | | 0.000 | % | | | 11/15/31 | | | | 250,000 | | | | 173,694 | |
| U.S. Treasury STRIPS | | | 0.000 | % | | | 02/15/33 | | | | 500,000 | | | | 335,648 | |
U.S. Treasury Bonds(b) | | | 4.250 | % | | | 05/15/39 | | | | 100,000 | | | | 126,284 | |
| U.S. Treasury Bonds | | | 3.875 | % | | | 08/15/40 | | | | 300,000 | | | | 361,116 | |
| U.S. Treasury Notes | | | 4.250 | % | | | 11/15/40 | | | | 100,000 | | | | 126,882 | |
| U.S. Treasury STRIPS | | | 0.000 | % | | | 08/15/41 | | | | 150,000 | | | | 77,694 | |
| U.S. Treasury Bonds | | | 2.750 | % | | | 11/15/42 | | | | 675,000 | | | | 678,550 | |
| | | | | | | | | | | | | | | | | |
| Total Treasury | | | | | | | | | | | | | | $ | 8,220,013 | |
| | | Shares | | | Fair
Value | |
| Registered Investment Companies — 13.1% |
State Street Institutional Liquid Reserves Fund, Premier Class, 1.43%(d) | | | 2,379,905 | | | $ | 2,379,667 | |
State Street Navigator Securities Lending Portfolio I, 1.49%(d) | | | 3,373,430 | | | | 3,373,430 | |
| | | | | | | | | |
| Total Registered Investment Companies | | | | | | $ | 5,753,097 | |
| | | | | | | | | |
| Total Investment Securities — 107.3% |
| (Cost $47,527,436) | | | | | | $ | 47,025,019 | |
| | | | | | | | | |
| Net Other Assets (Liabilities) — (7.3)% | | | | | | | (3,201,550 | ) |
| | | | | | | | | |
| Net Assets — 100.0% | | | | | | $ | 43,823,469 | |
(a) | Variable rate security. The rate shown is the effective interest rate as of December 31, 2017. The benchmark on which the rate is calculated is shown parenthetically; otherwise, the rate fluctuations may be based on index changes, prepayment of underlying positions and/or other variables. |
(b) | All or a portion of the security is on loan. The total fair value of the securities on loan as of December 31, 2017 was $3,309,210. |
(c) | Restricted securities not registered under the Securities Act of 1933. The total fair value of these securities as of December 31, 2017 was $13,185,697, representing 30.1% of net assets. |
(d) | The rate shown is the effective interest rate as of December 31, 2017. |
BV – Besloten Vennootschap
LIBOR – London Interbank Offered Rate
NA – National Association
NV – Naamloze Vennootschap
REIT – Real Estate Investment Trust
SA – Societe Anonyme
SCS – Sociedad en Comandita Simple
See accompanying Notes to Financial Statements.
DIAMOND HILL FUNDS | ANNUAL REPORT | DECEMBER 31, 2017 | DIAMOND-HILL.COM 75 |
Diamond Hill Corporate Credit Fund
Schedule of Investments
December 31, 2017
| | | Coupon | | | Maturity | | | Shares/ Par Value | | | Fair
Value | |
| Collateralized Debt Obligations — 0.2% |
| Alesco Preferred Funding Ltd. IV, Class PNN * | | | | | | | 03/23/35 | | | $ | 621,631 | | | $ | 234,877 | |
| Alesco Preferred Funding Ltd., Class PPNE * | | | | | | | 03/23/35 | | | | 336,608 | | | | 121,233 | |
| Fort Sheridan ABS CDO Ltd., Series 05-1A, Class PPN2 * | | | | | | | 11/05/41 | | | | 611,948 | | | | 274,079 | |
| Taberna Preferred Funding Ltd., Class PPN2 * | | | | | | | 07/05/35 | | | | 1,175,564 | | | | 443,623 | |
| | | | | | | | | | | | | | | | | |
| Total Collateralized Debt Obligations | | | | | | | | | | | | | | $ | 1,073,812 | |
| | | | | | | | | | | | | | | | | |
| Corporate Bonds — 87.0% |
| Banking — 6.4% |
| Popular, Inc. | | | 7.000 | % | | | 07/01/19 | | | | 39,920,000 | | | | 41,516,800 | |
| | | | | | | | | | | | | | | | | |
| Basic Industry — 10.7% |
| Beacon Roofing Supply, Inc. | | | 6.375 | % | | | 10/01/23 | | | | 880,000 | | | | 936,100 | |
| Century Communities, Inc. | | | 6.875 | % | | | 05/15/22 | | | | 23,374,000 | | | | 24,542,699 | |
| Century Communities, Inc. | | | 5.875 | % | | | 07/15/25 | | | | 9,720,000 | | | | 9,768,600 | |
GCP Applied Technologies, Inc. (a)(b) | | | 9.500 | % | | | 02/01/23 | | | | 1,232,000 | | | | 1,367,520 | |
| Mueller Industries, Inc. | | | 6.000 | % | | | 03/01/27 | | | | 10,410,000 | | | | 10,644,225 | |
NCI Building Systems, Inc. (a) | | | 8.250 | % | | | 01/15/23 | | | | 18,526,000 | | | | 19,637,560 | |
| Summit Materials LLC | | | 8.500 | % | | | 04/15/22 | | | | 2,520,000 | | | | 2,790,900 | |
| | | | | | | | | | | | | | | | 69,687,604 | |
| | | | | | | | | | | | | | | | | |
| Consumer Goods — 3.4% |
Clearwater Seafoods, Inc. (a) | | | 6.875 | % | | | 05/01/25 | | | | 900,000 | | | | 904,500 | |
Cooke Omega Investments, Inc./Alpha VesselCo Holdings, Inc. (a) | | | 8.500 | % | | | 12/15/22 | | | | 3,400,000 | | | | 3,374,500 | |
KAR Auction Services, Inc. (a)(b) | | | 5.125 | % | | | 06/01/25 | | | | 2,645,000 | | | | 2,711,125 | |
| Mattel, Inc. | | | 6.750 | % | | | 12/31/25 | | | | 4,050,000 | | | | 4,104,473 | |
Pilgrim's Pride Corp. (a) | | | 5.875 | % | | | 09/30/27 | | | | 6,394,000 | | | | 6,585,820 | |
Treehouse Foods, Inc. (a)(b) | | | 6.000 | % | | | 02/15/24 | | | | 4,090,000 | | | | 4,253,600 | |
| | | | | | | | | | | | | | | | 21,934,018 | |
| | | | | | | | | | | | | | | | | |
| Energy — 6.0% |
Diamondback Energy, Inc. (b) | | | 4.750 | % | | | 11/01/24 | | | | 3,663,000 | | | | 3,676,736 | |
| Diamondback Energy, Inc. | | | 5.375 | % | | | 05/31/25 | | | | 1,968,000 | | | | 2,024,580 | |
| Energen Corp. | | | 4.625 | % | | | 09/01/21 | | | | 3,096,000 | | | | 3,134,700 | |
| Energen Corp. | | | 7.125 | % | | | 02/15/28 | | | | 14,766,000 | | | | 15,651,960 | |
Welltec A/S (b) | | | 9.500 | % | | | 12/01/22 | | | | 14,625,000 | | | | 14,698,125 | |
| | | | | | | | | | | | | | | | 39,186,101 | |
| | | | | | | | | | | | | | | | | |
| Financial Services — 19.2% |
Alliance Data Systems Corp. (a) | | | 6.375 | % | | | 04/01/20 | | | | 9,182,000 | | | | 9,250,406 | |
Alliance Data Systems Corp. (a)(b) | | | 5.375 | % | | | 08/01/22 | | | | 30,667,000 | | | | 30,897,002 | |
| Credit Acceptance Corp. | | | 7.375 | % | | | 03/15/23 | | | | 5,226,000 | | | | 5,474,235 | |
Freedom Mortgage Corp. (a)(b) | | | 8.125 | % | | | 11/15/24 | | | | 6,850,000 | | | | 6,978,438 | |
| Nationstar Mortgage/Capital Corp. | | | 6.500 | % | | | 08/01/18 | | | | 3,001,000 | | | | 3,006,102 | |
| Nationstar Mortgage/Capital Corp. | | | 9.625 | % | | | 05/01/19 | | | | 20,504,000 | | | | 21,093,489 | |
| Nationstar Mortgage/Capital Corp. | | | 7.875 | % | | | 10/01/20 | | | | 15,911,000 | | | | 16,249,109 | |
| Nationstar Mortgage/Capital Corp. | | | 6.500 | % | | | 06/01/22 | | | | 5,351,000 | | | | 5,404,510 | |
Provident Funding Associates LP (a) | | | 6.375 | % | | | 06/15/25 | | | | 4,325,000 | | | | 4,541,250 | |
Quicken Loans, Inc. (a) | | | 5.750 | % | | | 05/01/25 | | | | 5,733,000 | | | | 5,933,712 | |
USIS Merger Sub, Inc. (a)(b) | | | 6.875 | % | | | 05/01/25 | | | | 11,211,000 | | | | 11,323,110 | |
Vantiv, Inc. (a) | | | 4.375 | % | | | 11/15/25 | | | | 5,000,000 | | | | 5,063,400 | |
| | | | | | | | | | | | | | | | 125,214,763 | |
| | | | | | | | | | | | | | | | | |
| Health Care — 3.1% |
| Davita Healthcare Partners, Inc. | | | 5.125 | % | | | 07/15/24 | | | | 4,169,000 | | | | 4,210,690 | |
Greatbatch Ltd. (a) | | | 9.125 | % | | | 11/01/23 | | | | 3,344,000 | | | | 3,628,240 | |
| HCA Holdings, Inc. | | | 7.750 | % | | | 07/15/36 | | | | 2,953,000 | | | | 3,336,890 | |
| Kindred Healthcare, Inc. | | | 8.750 | % | | | 01/15/23 | | | | 8,816,000 | | | | 9,344,960 | |
| | | | | | | | | | | | | | | | 20,520,780 | |
76 DIAMOND HILL FUNDS | ANNUAL REPORT | DECEMBER 31, 2017 | DIAMOND-HILL.COM |
Diamond Hill Corporate Credit Fund
Schedule of Investments (Continued)
December 31, 2017
| | | Coupon | | | Maturity | | | Shares/ Par Value | | | Fair
Value | |
| Corporate Bonds — 87.0% continued |
| Insurance — 2.2% |
Hub International Ltd. (a) | | | 7.875 | % | | | 10/01/21 | | | $ | 2,965,000 | | | $ | 3,087,306 | |
KIRS Midco 3 plc (a)(b) | | | 8.625 | % | | | 07/15/23 | | | | 4,670,000 | | | | 4,833,450 | |
| MGIC Investment Corp. | | | 5.750 | % | | | 08/15/23 | | | | 5,948,000 | | | | 6,505,625 | |
| | | | | | | | | | | | | | | | 14,426,381 | |
| | | | | | | | | | | | | | | | | |
| Leisure — 3.4% |
CCM Merger, Inc. (a) | | | 6.000 | % | | | 03/15/22 | | | | 6,576,000 | | | | 6,748,620 | |
Golden Nugget, Inc. (a)(b) | | | 6.750 | % | | | 10/15/24 | | | | 5,735,000 | | | | 5,835,363 | |
Rivers Pittsburgh Borrower LP (a) | | | 6.125 | % | | | 08/15/21 | | | | 8,719,000 | | | | 8,653,607 | |
Station Casinos LLC (a)(b) | | | 5.000 | % | | | 10/01/25 | | | | 720,000 | | | | 723,600 | |
| | | | | | | | | | | | | | | | 21,961,190 | |
| | | | | | | | | | | | | | | | | |
| Media — 8.7% |
Altice SA (a)(b) | | | 7.750 | % | | | 05/15/22 | | | | 8,210,000 | | | | 8,045,800 | |
Altice SA (a)(b) | | | 8.125 | % | | | 01/15/24 | | | | 800,000 | | | | 836,000 | |
Cimpress NV (a) | | | 7.000 | % | | | 04/01/22 | | | | 29,814,000 | | | | 30,708,419 | |
CSC Holdings LLC (a) | | | 10.125 | % | | | 01/15/23 | | | | 977,000 | | | | 1,100,346 | |
Liberty Interactive LLC (b) | | | 8.250 | % | | | 02/01/30 | | | | 7,557,000 | | | | 8,199,345 | |
Radio One, Inc. (a) | | | 7.375 | % | | | 04/15/22 | | | | 7,675,000 | | | | 7,655,813 | |
| | | | | | | | | | | | | | | | 56,545,723 | |
| | | | | | | | | | | | | | | | | |
| Real Estate — 4.1% |
Crescent Communities, Inc. (a) | | | 8.875 | % | | | 10/15/21 | | | | 10,456,000 | | | | 11,083,360 | |
| iStar Financial, Inc. | | | 5.000 | % | | | 07/01/19 | | | | 2,350,000 | | | | 2,361,750 | |
iStar Financial, Inc. (b) | | | 4.625 | % | | | 09/15/20 | | | | 7,650,000 | | | | 7,764,750 | |
Kennedy Wilson, Inc. (b) | | | 5.875 | % | | | 04/01/24 | | | | 5,717,000 | | | | 5,902,803 | |
| | | | | | | | | | | | | | | | 27,112,663 | |
| | | | | | | | | | | | | | | | | |
| Retail — 6.4% |
Arch Merger Sub, Inc. (a)(b) | | | 8.500 | % | | | 09/15/25 | | | | 18,465,000 | | | | 17,080,124 | |
FirstCash, Inc. (b) | | | 5.375 | % | | | 06/01/24 | | | | 225,000 | | | | 234,563 | |
L Brands, Inc. (b) | | | 6.875 | % | | | 11/01/35 | | | | 4,986,000 | | | | 5,035,860 | |
L Brands, Inc. (b) | | | 6.750 | % | | | 07/01/36 | | | | 900,000 | | | | 900,000 | |
Nathan's Famous, Inc. (a) | | | 6.625 | % | | | 11/01/25 | | | | 7,445,000 | | | | 7,724,188 | |
Signet UK Finance plc (b) | | | 4.700 | % | | | 06/15/24 | | | | 9,045,000 | | | | 8,904,074 | |
Tesco plc (a)(b) | | | 6.150 | % | | | 11/15/37 | | | | 2,085,000 | | | | 2,269,489 | |
| | | | | | | | | | | | | | | | 42,148,298 | |
| | | | | | | | | | | | | | | | | |
| Services — 2.4% |
Diebold, Inc. (b) | | | 8.500 | % | | | 04/15/24 | | | | 12,456,000 | | | | 13,234,500 | |
Laureate Education, Inc. (a) | | | 8.250 | % | | | 05/01/25 | | | | 1,349,000 | | | | 1,429,940 | |
Ritchie Bros. Auctioneers, Inc. (a)(b) | | | 5.375 | % | | | 01/15/25 | | | | 1,245,000 | | | | 1,285,463 | |
| | | | | | | | | | | | | | | | 15,949,903 | |
| | | | | | | | | | | | | | | | | |
| Technology & Electronics — 3.4% |
Conduent, Inc. (a)(b) | | | 10.500 | % | | | 12/15/24 | | | | 18,645,000 | | | | 21,884,569 | |
| Match Group, Inc. | | | 6.375 | % | | | 06/01/24 | | | | 101,000 | | | | 109,459 | |
| | | | | | | | | | | | | | | | 21,994,028 | |
| | | | | | | | | | | | | | | | | |
| Telecommunications — 7.5% |
CB Escrow Corp. (a)(b) | | | 8.000 | % | | | 10/15/25 | | | | 6,380,000 | | | | 6,475,700 | |
Cincinnati Bell, Inc. (a)(b) | | | 7.000 | % | | | 07/15/24 | | | | 13,016,000 | | | | 12,918,380 | |
Cogent Communications, Inc. (a) | | | 5.625 | % | | | 04/15/21 | | | | 19,080,000 | | | | 19,270,800 | |
Cogent Communications, Inc. (a) | | | 5.375 | % | | | 03/01/22 | | | | 1,007,000 | | | | 1,057,350 | |
Frontier Communications, Inc. (b) | | | 9.250 | % | | | 07/01/21 | | | | 11,503,000 | | | | 9,058,613 | |
| | | | | | | | | | | | | | | | 48,780,843 | |
| | | | | | | | | | | | | | | | | |
| Transportation — 0.1% |
| Mobile Mini, Inc. | | | 5.875 | % | | | 07/01/24 | | | | 495,000 | | | | 519,750 | |
United Continental Holdings, Inc. (b) | | | 4.250 | % | | | 10/01/22 | | | | 250,000 | | | | 250,625 | |
| | | | | | | | | | | | | | | | 770,375 | |
| | | | | | | | | | | | | | | | | |
| Total Corporate Bonds | | | | | | | | | | | | | | $ | 567,749,470 | |
DIAMOND HILL FUNDS | ANNUAL REPORT | DECEMBER 31, 2017 | DIAMOND-HILL.COM 77 |
Diamond Hill Corporate Credit Fund
Schedule of Investments (Continued)
December 31, 2017
| | | Shares | | | Fair
Value | |
| Registered Investment Companies — 23.5% |
Diamond Hill Short Duration Total Return Fund, Class Y(c) | | | 2,578,819 | | | $ | 26,071,860 | |
State Street Institutional Liquid Reserves Fund, Premier Class, 1.43%(d) | | | 44,265,488 | | | | 44,261,061 | |
State Street Navigator Securities Lending Portfolio I, 1.49%(d) | | | 83,038,990 | | | | 83,038,990 | |
| | | | | | | | | |
| Total Registered Investment Companies | | | | | | $ | 153,371,911 | |
| | | | | | | | | |
| Total Investment Securities — 110.7% | | | | | | | | |
| (Cost $717,410,498) | | | | | | $ | 722,195,193 | |
| | | | | | | | | |
| Net Other Assets (Liabilities) — (10.7)% | | | | | | | (69,823,576 | ) |
| | | | | | | | | |
| Net Assets — 100.0% | | | | | | $ | 652,371,617 | |
(a) | Restricted securities not registered under the Securities Act of 1933. The total fair value of these securities as of December 31, 2017 was $297,157,870, representing 45.6% of net assets. |
(b) | All or a portion of the security is on loan. The total fair value of the securities on loan as of December 31, 2017 was $81,361,198. |
(d) | The rate shown is the effective interest rate as of December 31, 2017. |
* | Restricted and illiquid securities not registered under the securities act of 1933 and values at fair value by the Fair Value Committee based on procedures approved by the Board of Trustees are as follows: |
| | | Acquisition Date | | Current
Cost | | | Fair
Value | | | Value as
a % of
Net Assets | |
| Alesco Preferred Funding Ltd. IV, Class PNN | | December-04 | | $ | 621,631 | | | $ | 234,877 | | | | 0.04 | % |
| Alesco Preferred Funding Ltd., Class PPNE | | March-05 | | | 336,608 | | | | 121,233 | | | | 0.02 | % |
| Fort Sheridan ABS CDO Ltd., Series 05-1A, Class PPN2 | | March-05 | | | 514,809 | | | | 274,079 | | | | 0.04 | % |
| Taberna Preferred Funding Ltd., Class PPN2 | | March-05 | | | 1,043,816 | | | | 443,623 | | | | 0.07 | % |
| | | | | $ | 2,516,864 | | | $ | 1,073,812 | | | | 0.17 | % |
A/S – Aktieselskab
NV – Naamloze Vennootschap
plc – Public Limited Company
SA – Societe Anonyme
See accompanying Notes to Financial Statements.
78 DIAMOND HILL FUNDS | ANNUAL REPORT | DECEMBER 31, 2017 | DIAMOND-HILL.COM |
Diamond Hill High Yield Fund
Schedule of Investments
December 31, 2017
| | | Coupon | | | Maturity | | | Shares/ Par Value | | | Fair
Value | |
| Corporate Bonds — 94.8% |
| ABS-Other — 0.8% |
Access Point Financial, Series 2017-A (a) | | | 5.820 | % | | | 04/15/29 | | | $ | 250,000 | | | $ | 248,362 | |
| | | | | | | | | | | | | | | | | |
| Auto Loan — 2.4% |
CIG Auto Receivables Trust, Series 2017-1A (a) | | | 5.330 | % | | | 12/16/24 | | | | 400,000 | | | | 398,332 | |
CPS Auto Trust, Series 2017-A (a) | | | 7.070 | % | | | 04/15/24 | | | | 250,000 | | | | 264,177 | |
Honor Automobile Trust Securitization, Series 2016-1A (a) | | | 8.050 | % | | | 11/15/22 | | | | 100,000 | | | | 102,556 | |
| | | | | | | | | | | | | | | | 765,065 | |
| | | | | | | | | | | | | | | | | |
| Banking — 6.1% | | | | | | | | | | | | | | | | |
| Popular, Inc. | | | 7.000 | % | | | 07/01/19 | | | | 1,820,000 | | | | 1,892,800 | |
| | | | | | | | | | | | | | | | | |
| Basic Industry — 7.3% |
| Century Communities, Inc. | | | 6.875 | % | | | 05/15/22 | | | | 100,000 | | | | 105,000 | |
| Century Communities, Inc. | | | 5.875 | % | | | 07/15/25 | | | | 750,000 | | | | 753,750 | |
| Mueller Industries, Inc. | | | 6.000 | % | | | 03/01/27 | | | | 700,000 | | | | 715,750 | |
NCI Building Systems, Inc. (a) | | | 8.250 | % | | | 01/15/23 | | | | 650,000 | | | | 689,000 | |
| | | | | | | | | | | | | | | | 2,263,500 | |
| | | | | | | | | | | | | | | | | |
| Consumer — 1.9% |
Arcadia Receivables Credit Trust, Series 2017-1 (a) | | | 5.500 | % | | | 06/15/23 | | | | 223,000 | | | | 227,024 | |
Avant Loans Funding Trust, Series 2015-A (a) | | | 7.750 | % | | | 08/16/21 | | | | 203,215 | | | | 206,325 | |
Upstart Securitization Trust, Series 2017-1 (a) | | | 6.350 | % | | | 06/20/24 | | | | 150,000 | | | | 152,652 | |
| | | | | | | | | | | | | | | | 586,001 | |
| | | | | | | | | | | | | | | | | |
| Consumer Goods — 5.4% |
Clearwater Seafoods, Inc. (a) | | | 6.875 | % | | | 05/01/25 | | | | 100,000 | | | | 100,500 | |
Cooke Omega Investments, Inc./Alpha VesselCo Holdings, Inc. (a) | | | 8.500 | % | | | 12/15/22 | | | | 325,000 | | | | 322,562 | |
DS Services of America, Inc. (a) | | | 10.000 | % | | | 09/01/21 | | | | 14,000 | | | | 14,700 | |
KAR Auction Services, Inc. (a)(b) | | | 5.125 | % | | | 06/01/25 | | | | 150,000 | | | | 153,750 | |
| Mattel, Inc. | | | 6.750 | % | | | 12/31/25 | | | | 300,000 | | | | 304,035 | |
Pilgrim's Pride Corp. (a) | | | 5.875 | % | | | 09/30/27 | | | | 525,000 | | | | 540,750 | |
Treehouse Foods, Inc. (a) | | | 6.000 | % | | | 02/15/24 | | | | 225,000 | | | | 234,000 | |
| | | | | | | | | | | | | | | | 1,670,297 | |
| | | | | | | | | | | | | | | | | |
| Energy — 13.9% |
| Diamondback Energy, Inc. | | | 5.375 | % | | | 05/31/25 | | | | 600,000 | | | | 617,250 | |
| Energen Corp. | | | 7.125 | % | | | 02/15/28 | | | | 2,525,000 | | | | 2,676,500 | |
Welltec A/S (a) | | | 9.500 | % | | | 12/01/22 | | | | 1,025,000 | | | | 1,030,125 | |
| | | | | | | | | | | | | | | | 4,323,875 | |
| | | | | | | | | | | | | | | | | |
| Equipment — 0.8% |
Ascentium Equipment Receivables Trust, Series 2016-2A (a) | | | 6.790 | % | | | 10/10/24 | | | | 100,000 | | | | 103,937 | |
LEAF II Receivables Funding LLC, Series 2017-1 (a) | | | 5.990 | % | | | 09/15/24 | | | | 150,000 | | | | 150,952 | |
| | | | | | | | | | | | | | | | 254,889 | |
| | | | | | | | | | | | | | | | | |
| Financial Services — 18.0% |
Alliance Data Systems Corp. (a) | | | 6.375 | % | | | 04/01/20 | | | | 300,000 | | | | 302,235 | |
Alliance Data Systems Corp. (a) | | | 5.375 | % | | | 08/01/22 | | | | 1,050,000 | | | | 1,057,875 | |
| Credit Acceptance Corp. | | | 7.375 | % | | | 03/15/23 | | | | 400,000 | | | | 419,000 | |
Freedom Mortgage Corp. (a) | | | 8.125 | % | | | 11/15/24 | | | | 500,000 | | | | 509,375 | |
| Nationstar Mortgage/Capital Corp. | | | 6.500 | % | | | 08/01/18 | | | | 202,000 | | | | 202,343 | |
| Nationstar Mortgage/Capital Corp. | | | 9.625 | % | | | 05/01/19 | | | | 768,000 | | | | 790,080 | |
| Nationstar Mortgage/Capital Corp. | | | 7.875 | % | | | 10/01/20 | | | | 475,000 | | | | 485,094 | |
| Nationstar Mortgage/Capital Corp. | | | 6.500 | % | | | 06/01/22 | | | | 750,000 | | | | 757,500 | |
Provident Funding Associates LP (a) | | | 6.375 | % | | | 06/15/25 | | | | 250,000 | | | | 262,500 | |
Quicken Loans, Inc. (a) | | | 5.750 | % | | | 05/01/25 | | | | 200,000 | | | | 207,002 | |
DIAMOND HILL FUNDS | ANNUAL REPORT | DECEMBER 31, 2017 | DIAMOND-HILL.COM 79 |
Diamond Hill High Yield Fund
Schedule of Investments (Continued)
December 31, 2017
| | | Coupon | | | Maturity | | | Shares/ Par Value | | | Fair
Value | |
| Corporate Bonds — 94.8% continued |
| Financial Services — 18.0% continued |
USIS Merger Sub, Inc. (a)(b) | | | 6.875 | % | | | 05/01/25 | | | $ | 600,000 | | | $ | 606,000 | |
| | | | | | | | | | | | | | | | 5,599,004 | |
| | | | | | | | | | | | | | | | | |
| Health Care — 5.1% |
Davita Healthcare Partners, Inc. (b) | | | 5.125 | % | | | 07/15/24 | | | | 175,000 | | | | 176,750 | |
Greatbatch Ltd. (a) | | | 9.125 | % | | | 11/01/23 | | | | 250,000 | | | | 271,250 | |
| HCA Holdings, Inc. | | | 7.750 | % | | | 07/15/36 | | | | 575,000 | | | | 649,750 | |
| Kindred Healthcare, Inc. | | | 8.750 | % | | | 01/15/23 | | | | 475,000 | | | | 503,500 | |
| | | | | | | | | | | | | | | | 1,601,250 | |
| | | | | | | | | | | | | | | | | |
| Insurance — 0.9% |
Hub International Ltd. (a) | | | 7.875 | % | | | 10/01/21 | | | | 275,000 | | | | 286,344 | |
| | | | | | | | | | | | | | | | | |
| Leisure — 3.1% | | | | | | | | | | | | | | | | |
CCM Merger, Inc. (a) | | | 6.000 | % | | | 03/15/22 | | | | 100,000 | | | | 102,625 | |
Golden Nugget, Inc. (a) | | | 6.750 | % | | | 10/15/24 | | | | 400,000 | | | | 407,000 | |
Rivers Pittsburgh Borrower LP (a) | | | 6.125 | % | | | 08/15/21 | | | | 400,000 | | | | 397,000 | |
Station Casinos LLC (a) | | | 5.000 | % | | | 10/01/25 | | | | 50,000 | | | | 50,250 | |
| | | | | | | | | | | | | | | | 956,875 | |
| | | | | | | | | | | | | | | | | |
| Media — 7.6% | | | | | | | | | | | | | | | | |
Altice SA (a)(b) | | | 7.750 | % | | | 05/15/22 | | | | 225,000 | | | | 220,500 | |
Altice SA (a)(b) | | | 8.125 | % | | | 01/15/24 | | | | 200,000 | | | | 209,000 | |
Cimpress NV (a) | | | 7.000 | % | | | 04/01/22 | | | | 1,275,000 | | | | 1,313,250 | |
Liberty Interactive LLC (b) | | | 8.250 | % | | | 02/01/30 | | | | 250,000 | | | | 271,250 | |
Radio One, Inc. (a) | | | 7.375 | % | | | 04/15/22 | | | | 350,000 | | | | 349,125 | |
| | | | | | | | | | | | | | | | 2,363,125 | |
| | | | | | | | | | | | | | | | | |
| Non Agency CMBS — 0.8% |
Fort CRE LLC, Series 2016-1A (1MO LIBOR + 800) (a)(c) | | | 9.213 | % | | | 05/21/36 | | | | 250,000 | | | | 253,837 | |
| | | | | | | | | | | | | | | | | |
| Non Agency MBS CMO — 0.3% |
CAM Mortgage Trust, Series 2016-2 (a) | | | 5.000 | % | | | 06/15/57 | | | | 100,000 | | | | 99,863 | |
| | | | | | | | | | | | | | | | | |
| Real Estate — 2.6% |
Crescent Communities, Inc. (a) | | | 8.875 | % | | | 10/15/21 | | | | 594,000 | | | | 629,640 | |
| Kennedy Wilson, Inc. | | | 5.875 | % | | | 04/01/24 | | | | 175,000 | | | | 180,687 | |
| | | | | | | | | | | | | | | | 810,327 | |
| | | | | | | | | | | | | | | | | |
| Retail — 6.9% | | | | | | | | | | | | | | | | |
Arch Merger Sub, Inc. (a) | | | 8.500 | % | | | 09/15/25 | | | | 1,100,000 | | | | 1,017,500 | |
FirstCash, Inc. (b) | | | 5.375 | % | | | 06/01/24 | | | | 25,000 | | | | 26,063 | |
L Brands, Inc. (b) | | | 6.875 | % | | | 11/01/35 | | | | 200,000 | | | | 202,000 | |
| L Brands, Inc. | | | 6.750 | % | | | 07/01/36 | | | | 75,000 | | | | 75,000 | |
Nathan's Famous, Inc. (a) | | | 6.625 | % | | | 11/01/25 | | | | 400,000 | | | | 415,000 | |
| Rite Aid Corp. | | | 9.250 | % | | | 03/15/20 | | | | 250,000 | | | | 253,700 | |
Signet UK Finance plc (b) | | | 4.700 | % | | | 06/15/24 | | | | 150,000 | | | | 147,663 | |
| | | | | | | | | | | | | | | | 2,136,926 | |
| | | | | | | | | | | | | | | | | |
| Services — 1.9% | | | | | | | | | | | | | | | | |
| Diebold, Inc. | | | 8.500 | % | | | 04/15/24 | | | | 475,000 | | | | 504,688 | |
Laureate Education, Inc. (a) | | | 8.250 | % | | | 05/01/25 | | | | 75,000 | | | | 79,500 | |
| | | | | | | | | | | | | | | | 584,188 | |
| | | | | | | | | | | | | | | | | |
| Technology & Electronics — 2.5% |
Conduent, Inc. (a)(b) | | | 10.500 | % | | | 12/15/24 | | | | 675,000 | | | | 792,281 | |
| | | | | | | | | | | | | | | | | |
| Telecommunications — 5.5% |
CB Escrow Corp. (a)(b) | | | 8.000 | % | | | 10/15/25 | | | | 710,000 | | | | 720,650 | |
Cogent Communications, Inc. (a) | | | 5.625 | % | | | 04/15/21 | | | | 350,000 | | | | 353,500 | |
Frontier Communications, Inc. (b) | | | 9.250 | % | | | 07/01/21 | | | | 800,000 | | | | 630,000 | |
| | | | | | | | | | | | | | | | 1,704,150 | |
| | | | | | | | | | | | | | | | | |
| Transportation — 1.0% |
| Continental Airlines Pass-Through Trust, Series 2012-1 | | | 6.250 | % | | | 10/11/21 | | | | 42,969 | | | | 45,040 | |
| Continental Airlines Pass-Through Trust, Series 2012-2 | | | 5.500 | % | | | 04/29/22 | | | | 133,423 | | | | 139,254 | |
| Mobile Mini, Inc. | | | 5.875 | % | | | 07/01/24 | | | | 25,000 | | | | 26,250 | |
| U.S. Airways Pass-Through Trust, Series 2012-2 | | | 6.750 | % | | | 12/03/22 | | | | 85,754 | | | | 93,138 | |
| | | | | | | | | | | | | | | | 303,682 | |
| | | | | | | | | | | | | | | | | |
| Total Corporate Bonds | | | | | | | | | | | | | | $ | 29,496,641 | |
80 DIAMOND HILL FUNDS | ANNUAL REPORT | DECEMBER 31, 2017 | DIAMOND-HILL.COM |
Diamond Hill High Yield Fund
Schedule of Investments (Continued)
December 31, 2017
| | | Shares | | | Fair
Value | |
| Registered Investment Companies — 13.8% |
State Street Institutional Liquid Reserves Fund, Premier Class, 1.43%(d) | | | 1,053,841 | | | $ | 1,053,736 | |
State Street Navigator Securities Lending Portfolio I, 1.49%(d) | | | 3,249,893 | | | | 3,249,893 | |
| | | | | | | | | |
| Total Registered Investment Companies | | | | | | $ | 4,303,629 | |
| | | | | | | | | |
| Total Investment Securities — 108.6% | | | | | | | | |
| (Cost $33,194,202) | | | | | | $ | 33,800,270 | |
| | | | | | | | | |
| Net Other Assets (Liabilities) — (8.6)% | | | | | | | (2,696,601 | ) |
| | | | | | | | | |
| Net Assets — 100.0% | | | | | | $ | 31,103,669 | |
(a) | Restricted securities not registered under the Securities Act of 1933. The total fair value of these securities as of December 31, 2017 was $15,852,806, representing 51.0% of net assets. |
(b) | All or a portion of the security is on loan. The total fair value of the securities on loan as of December 31, 2017 was $3,183,679. |
(c) | Variable rate security. The rate shown is the effective interest rate as of December 31, 2017. The benchmark on which the rate is calculated is shown parenthetically. |
(d) | The rate shown is the effective interest rate as of December 31, 2017. |
A/S – Aktieselskab
LIBOR – London Interbank Offered Rate
NV – Naamloze Vennootschap
plc – Public Limited Company
SA – Societe Anonyme
See accompanying Notes to Financial Statements.
DIAMOND HILL FUNDS | ANNUAL REPORT | DECEMBER 31, 2017 | DIAMOND-HILL.COM 81 |
Diamond Hill Funds
Tabular Presentation of Schedules of Investments
December 31, 2017 (Unaudited)
Diamond Hill Small Cap Fund |
Sector Allocation | % of
Net Assets |
Financials | 20.5% |
Industrials | 20.4% |
Consumer Discretionary | 13.0% |
Information Technology | 9.2% |
Real Estate | 7.5% |
Consumer Staples | 4.9% |
Energy | 3.5% |
Health Care | 3.4% |
Utilities | 2.2% |
Telecommunication Services | 0.7% |
Registered Investment Companies | 26.6% |
Other | |
Net Other Assets (Liabilities) | -11.9% |
| | 100.0% |
| | |
Russell 2000 Index
Sector Allocation | % of
Index |
Financials | 17.8% |
Industrials | 15.2% |
Consumer Discretionary | 12.5% |
Information Technology | 16.6% |
Real Estate | 6.7% |
Consumer Staples | 2.8% |
Energy | 4.0% |
Health Care | 15.5% |
Utilities | 3.5% |
Telecommunication Services | 0.8% |
Materials | 4.6% |
| | 100.0% |
| | |
Diamond Hill Small-Mid Cap Fund |
Sector Allocation | % of
Net Assets |
Financials | 25.3% |
Consumer Discretionary | 14.8% |
Industrials | 11.6% |
Consumer Staples | 9.5% |
Information Technology | 9.0% |
Real Estate | 8.2% |
Health Care | 4.6% |
Energy | 2.8% |
Materials | 2.8% |
Utilities | 2.5% |
Registered Investment Companies | 17.4% |
Other | |
Net Other Assets (Liabilities) | -8.5% |
| | 100.0% |
| | |
Russell 2500 Index
Sector Allocation | % of
Index |
Financials | 16.2% |
Consumer Discretionary | 12.7% |
Industrials | 16.4% |
Consumer Staples | 2.9% |
Information Technology | 16.4% |
Real Estate | 9.2% |
Health Care | 11.4% |
Energy | 4.5% |
Materials | 6.1% |
Utilities | 3.7% |
Telecommunication Services | 0.5% |
| | 100.0% |
| | |
82 DIAMOND HILL FUNDS | ANNUAL REPORT | DECEMBER 31, 2017 | DIAMOND-HILL.COM |
Diamond Hill Funds
Tabular Presentation of Schedules of Investments (Continued)
December 31, 2017 (Unaudited)
Diamond Hill Mid Cap Fund |
Sector Allocation | % of
Net Assets |
Financials | 28.1% |
Consumer Discretionary | 16.9% |
Industrials | 11.8% |
Consumer Staples | 8.8% |
Information Technology | 7.2% |
Real Estate | 6.1% |
Health Care | 4.0% |
Materials | 2.9% |
Energy | 2.9% |
Utilities | 1.6% |
Registered Investment Companies | 16.9% |
Other | |
Net Other Assets (Liabilities) | -7.2% |
| | 100.0% |
| | |
Russell Midcap Index
Sector Allocation | % of
Index |
Financials | 14.6% |
Consumer Discretionary | 14.4% |
Industrials | 14.3% |
Consumer Staples | 4.1% |
Information Technology | 15.8% |
Real Estate | 9.4% |
Health Care | 9.4% |
Materials | 6.0% |
Energy | 5.8% |
Utilities | 5.8% |
Telecommunication Services | 0.4% |
| | 100.0% |
| | |
Diamond Hill Large Cap Fund |
Sector Allocation | % of
Net Assets |
Financials | 27.6% |
Consumer Discretionary | 17.4% |
Health Care | 13.7% |
Information Technology | 12.1% |
Consumer Staples | 11.8% |
Industrials | 8.3% |
Energy | 3.8% |
Materials | 3.8% |
Registered Investment Companies | 2.9% |
Other | |
Net Other Assets (Liabilities) | -1.4% |
| | 100.0% |
| | |
Russell 1000 Index
Sector Allocation | % of
Index |
Financials | 14.9% |
Consumer Discretionary | 13.1% |
Health Care | 13.2% |
Information Technology | 23.4% |
Consumer Staples | 7.1% |
Industrials | 10.5% |
Energy | 5.9% |
Materials | 3.4% |
Real Estate | 3.6% |
Utilities | 2.9% |
Telecommunication Services | 2.0% |
| | 100.0% |
| | |
DIAMOND HILL FUNDS | ANNUAL REPORT | DECEMBER 31, 2017 | DIAMOND-HILL.COM 83 |
Diamond Hill Funds
Tabular Presentation of Schedules of Investments (Continued)
December 31, 2017 (Unaudited)
Diamond Hill All Cap Select Fund |
Sector Allocation | % of
Net Assets |
Financials | 32.1% |
Consumer Discretionary | 19.0% |
Industrials | 18.9% |
Consumer Staples | 10.3% |
Information Technology | 6.9% |
Health Care | 5.4% |
Materials | 1.8% |
Real Estate | 1.5% |
Registered Investment Companies | 5.6% |
Other | |
Net Other Assets (Liabilities) | -1.5% |
| | 100.0% |
| | |
Russell 3000 Index
Sector Allocation | % of
Index |
Financials | 15.1% |
Consumer Discretionary | 13.0% |
Industrials | 10.9% |
Consumer Staples | 6.8% |
Information Technology | 22.9% |
Health Care | 13.3% |
Materials | 3.5% |
Real Estate | 3.8% |
Energy | 5.8% |
Utilities | 3.0% |
Telecommunication Services | 1.9% |
| | 100.0% |
| | |
Diamond Hill Long-Short Fund |
Long Portfolio
Sector Allocation | % of
Net Assets |
Financials | 24.6% |
Consumer Discretionary | 15.5% |
Information Technology | 13.8% |
Industrials | 12.1% |
Consumer Staples | 6.7% |
Health Care | 6.7% |
Energy | 2.5% |
Materials | 1.7% |
Registered Investment Companies | 42.5% |
| | |
Short Portfolio
Sector Allocation | % of
Net Assets |
Consumer Discretionary | -9.6% |
Financials | -3.7% |
Health Care | -2.5% |
Information Technology | -2.4% |
Utilities | -1.6% |
Consumer Staples | -1.6% |
Energy | -1.5% |
Industrials | -1.5% |
Cash and Cash Equivalents | -0.2% |
Other | |
Segregated Cash With Custodian | 25.4% |
Net Other Assets (Liabilities) | -26.9% |
| | 100.0% |
| | |
Russell 1000 Index
Sector Allocation | % of
Index |
Financials | 14.9% |
Consumer Discretionary | 13.1% |
Information Technology | 23.4% |
Industrials | 10.5% |
Consumer Staples | 7.1% |
Health Care | 13.2% |
Energy | 5.9% |
Materials | 3.4% |
Real Estate | 3.6% |
Utilities | 2.9% |
Telecommunication Services | 2.0% |
| | 100.0% |
| | |
84 DIAMOND HILL FUNDS | ANNUAL REPORT | DECEMBER 31, 2017 | DIAMOND-HILL.COM |
Diamond Hill Funds
Tabular Presentation of Schedules of Investments (Continued)
December 31, 2017 (Unaudited)
Diamond Hill Research Opportunities Fund |
Long Portfolio
Sector Allocation | % of
Net Assets |
Consumer Discretionary | 23.1% |
Financials | 19.4% |
Industrials | 19.2% |
Health Care | 14.7% |
Information Technology | 14.3% |
Real Estate | 3.3% |
Materials | 2.8% |
Consumer Staples | 2.4% |
Telecommunication Services | 2.4% |
Energy | 1.7% |
Registered Investment Companies | 24.9% |
| | |
Short Portfolio
Sector Allocation | % of
Net Assets |
Consumer Discretionary | -6.0% |
Financials | -3.4% |
Information Technology | -3.2% |
Health Care | -2.4% |
Industrials | -1.5% |
Energy | -0.9% |
Utilities | -0.6% |
Telecommunication Services | -0.4% |
Real Estate | -0.2% |
Other | |
Segregated Cash With Custodian | 18.2% |
Net Other Assets (Liabilities) | -27.8% |
| | 100.0% |
| | |
Russell 3000 Index
Sector Allocation | % of
Index |
Consumer Discretionary | 13.0% |
Financials | 15.1% |
Industrials | 10.9% |
Health Care | 13.3% |
Information Technology | 22.9% |
Real Estate | 3.8% |
Materials | 3.5% |
Consumer Staples | 6.8% |
Telecommunication Services | 1.9% |
Energy | 5.8% |
Utilities | 3.0% |
| | 100.0% |
| | |
Diamond Hill Financial Long-Short Fund |
Long Portfolio
Sector Allocation | % of
Net Assets |
Banks, Thrifts & Mortgage Finance | 34.1% |
Insurance | 19.1% |
REITs & Real Estate Management | 13.8% |
Capital Markets | 10.4% |
Consumer Financial Services | 7.4% |
Diversified Financial Services | 5.3% |
IT Services | 1.2% |
Registered Investment Companies | 33.3% |
| | |
Short Portfolio
Sector Allocation | % of
Net Assets |
Insurance | -7.0% |
Banks, Thrifts & Mortgage Finance | -4.3% |
IT Services | -1.0% |
REITs & Real Estate Management | -0.5% |
Other | |
Segregated Cash With Custodian | 13.1% |
Net Other Assets (Liabilities) | -24.9% |
| | 100.0% |
| | |
Russell 3000 Financials Index
Sector Allocation | % of
Index |
Banks, Thrifts & Mortgage Finance | 32.3% |
Insurance | 13.2% |
REITs & Real Estate Management | 19.0% |
Capital Markets | 13.7% |
Consumer Financial Services | 3.7% |
Diversified Financial Services | 6.8% |
IT Services | 11.3% |
| | 100.0% |
| | |
DIAMOND HILL FUNDS | ANNUAL REPORT | DECEMBER 31, 2017 | DIAMOND-HILL.COM 85 |
Diamond Hill Funds
Tabular Presentation of Schedules of Investments (Continued)
December 31, 2017 (Unaudited)
Diamond Hill Short Duration
Total Return Fund |
Sector Allocation | % of
Net Assets |
Securitized | 84.7% |
Corporate Credit | 9.5% |
Treasury | 4.1% |
Registered Investment Companies | 2.7% |
Other | |
Net Other Assets (Liabilities) | -1.0% |
| | 100.0% |
| | |
Bloomberg Barclays U.S.
1-3 Yr. Gov./Credit Index
Sector Allocation | % of
Index |
Treasury | 62.5% |
Corporate Credit | 24.3% |
Non-Corporate Credit | 8.0% |
Agency | 5.2% |
| | 100.0% |
| | |
Diamond Hill Core Bond Fund |
Sector Allocation | % of
Net Assets |
Securitized | 54.7% |
Corporate Credit | 19.2% |
Treasury | 18.8% |
Government Related | 1.5% |
Registered Investment Companies | 13.1% |
Other | |
Net Other Assets (Liabilities) | -7.3% |
| | 100.0% |
| | |
Bloomberg Barclays U.S. Aggregate Index
Sector Allocation | % of
Index |
Treasury | 37.0% |
Agency RMBS/CMBS | 28.8% |
Corporate Credit | 25.7% |
Non-Corporate Credit | 5.2% |
Agency | 1.7% |
Non-Agency RMBS/CMBS | 1.1% |
Asset-Backed Securities | 0.5% |
| | 100.0% |
| | |
86 DIAMOND HILL FUNDS | ANNUAL REPORT | DECEMBER 31, 2017 | DIAMOND-HILL.COM |
Diamond Hill Funds
Tabular Presentation of Schedules of Investments (Continued)
December 31, 2017 (Unaudited)
Diamond Hill Corporate Credit Fund |
Sector Allocation | % of
Net Assets |
Financial Services | 19.2% |
Basic Industry | 10.7% |
Media | 8.7% |
Telecommunications | 7.5% |
Retail | 6.4% |
Banking | 6.4% |
Energy | 6.0% |
Real Estate | 4.1% |
Technology & Electronics | 3.4% |
Leisure | 3.4% |
Consumer Goods | 3.4% |
Health Care | 3.1% |
Services | 2.4% |
Insurance | 2.2% |
Transportation | 0.1% |
Registered Investment Companies | 23.5% |
Other | |
Collateralized Debt Obligations | 0.2% |
Net Other Assets (Liabilities) | -10.7% |
| | 100.0% |
| | |
ICE BofAML U.S. Corporate &
High Yield Index
Sector Allocation | % of
Index |
Financial Services | 2.5% |
Basic Industry | 5.6% |
Media | 4.7% |
Telecommunications | 5.4% |
Retail | 3.7% |
Banking | 19.2% |
Energy | 11.9% |
Real Estate | 2.1% |
Technology & Electronics | 7.5% |
Leisure | 0.9% |
Consumer Goods | 5.7% |
Health Care | 8.8% |
Services | 1.8% |
Insurance | 3.7% |
Transportation | 2.0% |
Utilities | 7.0% |
Capital Goods | 4.9% |
Automotive | 2.6% |
| | 100.0% |
| | |
Diamond Hill High Yield Fund |
Sector Allocation | % of
Net Assets |
Financial Services | 18.0% |
Energy | 13.9% |
Media | 7.6% |
Basic Industry | 7.3% |
Retail | 6.9% |
Banking | 6.1% |
Telecommunications | 5.5% |
Consumer Goods | 5.4% |
Health Care | 5.1% |
Leisure | 3.1% |
Real Estate | 2.6% |
Technology & Electronics | 2.5% |
Auto Loan | 2.4% |
Consumer | 1.9% |
Services | 1.9% |
Transportation | 1.0% |
Insurance | 0.9% |
Equipment | 0.8% |
Non Agency CMBS | 0.8% |
ABS - Other | 0.8% |
Non Agency MBS CMO | 0.3% |
Registered Investment Companies | 13.8% |
Other | |
Net Other Assets (Liabilities) | -8.6% |
| | 100.0% |
| | |
ICE BofAML U.S. High Yield Index Sector Allocation | % of
Index |
Financial Services | 3.9% |
Energy | 14.3% |
Media | 11.4% |
Basic Industry | 12.2% |
Retail | 4.8% |
Banking | 3.3% |
Telecommunications | 9.1% |
Consumer Goods | 2.8% |
Health Care | 10.2% |
Leisure | 4.2% |
Real Estate | 0.8% |
Technology & Electronics | 5.9% |
Services | 5.4% |
Transportation | 0.9% |
Insurance | 1.0% |
Capital Goods | 5.2% |
Utilities | 2.5% |
Automotive | 2.1% |
| | 100.0% |
| | |
DIAMOND HILL FUNDS | ANNUAL REPORT | DECEMBER 31, 2017 | DIAMOND-HILL.COM 87 |
Diamond Hill Funds
Statements of Assets & Liabilities
December 31, 2017
| | | Small Cap
Fund | | | Small-Mid
Cap
Fund | | | Mid Cap
Fund | |
| Assets | | | | | | | | | |
| Investment in unaffiliated securities, at cost | | $ | 1,143,298,460 | | | $ | 2,209,326,737 | | | $ | 113,789,708 | |
| Investment in affiliated securities, at cost | | | 56,525,165 | | | | 47,131,941 | | | | 2,161,797 | |
| Investment securities, at fair value — including $174,409,434, $213,571,072, $8,396,015, $84,647,687, $2,760,348, $1,240,688,213, $16,654,844, $8,461,616, $5,033,679 and $3,309,210 of securities loaned | | $ | 1,610,616,385 | | | $ | 2,678,435,249 | | | $ | 128,680,159 | |
| Investment in affiliated securities, at fair value | | | 56,711,326 | | | | 47,270,443 | | | | 2,163,880 | |
| Cash | | | — | | | | — | | | | — | |
| Cash deposits with custodian for securities sold short | | | — | | | | — | | | | — | |
| Receivable for fund shares issued | | | 1,001,075 | | | | 2,222,251 | | | | 186,168 | |
| Receivable for dividends and interest | | | 3,461,768 | | | | 3,294,063 | | | | 125,994 | |
| Receivable for investments sold | | | 1,956,696 | | | | 5,492,461 | | | | 17,956 | |
| Prepaid expenses and other assets | | | 15,985 | | | | 12,828 | | | | 642 | |
| Total Assets | | | 1,673,763,235 | | | | 2,736,727,295 | | | | 131,174,799 | |
| | | | | | | | | | | | | |
| Liabilities | | | | | | | | | | | | |
| Securities sold short, at fair value (proceeds $—, $—, $—, $—, $—, $933,760,090, $9,842,266, $3,220,871, $— and $—) | | | — | | | | — | | | | — | |
| Payable for securities purchased | | | 406,115 | | | | 84,583 | | | | 253,577 | |
| Payable for expenses and fees on securities sold short | | | — | | | | — | | | | — | |
| Payable for fund shares redeemed | | | 1,311,296 | | | | 1,925,695 | | | | 101,885 | |
| Payable for return of collateral received | | | 180,617,431 | | | | 219,930,698 | | | | 8,641,780 | |
| Payable to Investment Adviser | | | 1,019,621 | | | | 1,601,680 | | | | 61,708 | |
| Payable to Administrator | | | 228,897 | | | | 299,898 | | | | 16,816 | |
| Accrued distribution and service fees | | | 116,914 | | | | 81,376 | | | | 5,475 | |
| Payable to accountant and custodian | | | — | | | | — | | | | — | |
| Total Liabilities | | | 183,700,274 | | | | 223,923,930 | | | | 9,081,241 | |
| | | | | | | | | | | | | |
| Net Assets | | $ | 1,490,062,961 | | | $ | 2,512,803,365 | | | $ | 122,093,558 | |
| | | | | | | | | | | | | |
| Components of Net Assets | | | | | | | | | | | | |
| Paid-in capital | | $ | 1,007,887,746 | | | $ | 2,056,569,883 | | | $ | 107,750,444 | |
| Accumulated net investment income (loss) | | | (7,912,455 | ) | | | (2,843,931 | ) | | | — | |
| Accumulated net realized gains (losses) from investment transactions | | | 22,583,584 | | | | (10,169,601 | ) | | | (549,420 | ) |
| Net unrealized appreciation (depreciation) on investments | | | 467,504,086 | | | | 469,247,014 | | | | 14,892,534 | |
| Net Assets | | $ | 1,490,062,961 | | | $ | 2,512,803,365 | | | $ | 122,093,558 | |
| Net Assets | | | | | | | | | | | | |
| Class A Shares | | $ | 357,511,668 | | | $ | 229,411,283 | | | $ | 25,852,527 | |
| Class C Shares | | $ | 46,868,024 | | | $ | 37,472,453 | | | $ | — | |
| Class I Shares | | $ | 877,912,912 | | | $ | 1,114,336,693 | | | $ | 63,297,948 | |
| Class Y Shares | | $ | 207,770,357 | | | $ | 1,131,582,936 | | | $ | 32,943,083 | |
| Shares of beneficial interest outstanding (unlimited number of shares authorized, no par value) | | | | | | | | | | | | |
| Class A Shares | | | 10,035,575 | | | | 10,315,747 | | | | 1,893,157 | |
| Class C Shares | | | 1,512,920 | | | | 1,837,650 | | | | — | |
| Class I Shares | | | 24,282,737 | | | | 49,639,937 | | | | 4,620,940 | |
| Class Y Shares | | | 5,744,347 | | | | 50,307,806 | | | | 2,398,992 | |
| Net Asset Value, offering (except Class A Shares) and redemption price per share: | | | | | | | | | | | | |
| Class A Shares | | $ | 35.62 | | | $ | 22.24 | | | $ | 13.66 | |
Class C Shares(A) | | $ | 30.98 | | | $ | 20.39 | | | $ | — | |
| Class I Shares | | $ | 36.15 | | | $ | 22.45 | | | $ | 13.70 | |
| Class Y Shares | | $ | 36.17 | | | $ | 22.49 | | | $ | 13.73 | |
| Maximum Offering Price | | | | | | | | | | | | |
| Maximum sales charge — Class A Shares | | | 5.00 | % | | | 5.00 | % | | | 5.00 | % |
| (100%/(100%-maximum sales charge) of net asset value adjusted to the nearest cent) per share — Class A Shares | | $ | 37.49 | | | $ | 23.41 | | | $ | 14.38 | |
(A) | Redemption price per share varies based on the holding period. |
See accompanying Notes to Financial Statements.
88 DIAMOND HILL FUNDS | ANNUAL REPORT | DECEMBER 31, 2017 | DIAMOND-HILL.COM |
Large Cap
Fund | | | All Cap
Select
Fund | | | Long-Short
Fund | | | Research
Opportunities
Fund | | | Financial
Long-Short
Fund | | | Short Duration Total Return Fund | | | Core Bond Fund | |
| | | | | | | | | | | | | | | | | | | | |
| $ | 4,389,010,555 | | | $ | 149,330,723 | | | $ | 4,749,676,292 | | | $ | 77,262,544 | | | $ | 38,410,841 | | | $ | 315,533,432 | | | $ | 47,527,436 | |
| | — | | | | 2,824,256 | | | | 83,187,493 | | | | — | | | | — | | | | — | | | | — | |
| $ | 5,929,971,746 | | | $ | 182,295,284 | | | $ | 5,929,366,852 | | | $ | 88,324,549 | | | $ | 43,568,034 | | | $ | 316,160,141 | | | $ | 47,025,019 | |
| | — | | | | 2,834,923 | | | | 83,461,099 | | | | — | | | | — | | | | — | | | | — | |
| | — | | | | — | | | | — | | | | 18,389 | | | | — | | | | 7,277 | | | | — | |
| | — | | | | — | | | | 1,212,532,828 | | | | 12,555,367 | | | | 4,591,593 | | | | — | | | | — | |
| | 11,526,251 | | | | 125,080 | | | | 6,497,729 | | | | 76,886 | | | | 59,926 | | | | 1,030,387 | | | | 975 | |
| | 6,562,043 | | | | 167,887 | | | | 5,890,053 | | | | 102,334 | | | | 51,180 | | | | 1,000,064 | | | | 186,996 | |
| | 9,870,087 | | | | — | | | | 4,671,017 | | | | 2,550,888 | | | | 8,504 | | | | — | | | | — | |
| | — | | | | 931 | | | | 22,913 | | | | 48 | | | | — | | | | — | | | | — | |
| | 5,957,930,127 | | | | 185,424,105 | | | | 7,242,442,491 | | | | 103,628,461 | | | | 48,279,237 | | | | 318,197,869 | | | | 47,212,990 | |
| | | | | | | | | | | | | | | | | | | | | | | | | | | |
| | | | | | | | | | | | | | | | | | | | | | | | | | | |
| | — | | | | — | | | | 1,174,144,423 | | | | 12,817,135 | | | | 4,468,899 | | | | — | | | | — | |
| | 10,767,967 | | | | 1,217 | | | | 19,075,189 | | | | 4,723,745 | | | | — | | | | — | | | | — | |
| | — | | | | — | | | | 1,316,939 | | | | 10,964 | | | | 4,980 | | | �� | — | | | | — | |
| | 10,158,503 | | | | 46 | | | | 3,654,491 | | | | 3,327 | | | | 63,805 | | | | — | | | | — | |
| | 86,832,070 | | | | 2,872,254 | | | | 1,272,963,558 | | | | 17,119,913 | | | | 8,709,919 | | | | 5,135,620 | | | | 3,373,430 | |
| | 2,467,618 | | | | 99,755 | | | | 3,648,437 | | | | 53,663 | | | | 28,058 | | | | 91,920 | | | | 11,139 | |
| | 879,241 | | | | 24,864 | | | | 727,408 | | | | 9,496 | | | | 5,791 | | | | 28,681 | | | | 4,222 | |
| | 382,220 | | | | 12,199 | | | | 174,600 | | | | 5,137 | | | | 3,635 | | | | 4,343 | | | | 730 | |
| | 393 | | | | — | | | | 12,670 | | | | — | | | | — | | | | — | | | | — | |
| | 111,488,012 | | | | 3,010,335 | | | | 2,475,717,715 | | | | 34,743,380 | | | | 13,285,087 | | | | 5,260,564 | | | | 3,389,521 | |
| | | | | | | | | | | | | | | | | | | | | | | | | | | |
| $ | 5,846,442,115 | | | $ | 182,413,770 | | | $ | 4,766,724,776 | | | $ | 68,885,081 | | | $ | 34,994,150 | | | $ | 312,937,305 | | | $ | 43,823,469 | |
| | | | | | | | | | | | | | | | | | | | | | | | | | | |
| | | | | | | | | | | | | | | | | | | | | | | | | | | |
| $ | 4,300,430,798 | | | $ | 148,988,926 | | | $ | 3,847,605,698 | | | $ | 60,821,413 | | | $ | 31,025,902 | | | $ | 311,929,214 | | | $ | 44,346,184 | |
| | 351,642 | | | | 608,298 | | | | — | | | | (113,398 | ) | | | 3,567 | | | | 77,599 | | | | 3,751 | |
| | 4,698,484 | | | | (158,682 | ) | | | (20,460,755 | ) | | | 89,930 | | | | 55,516 | | | | 303,783 | | | | (24,049 | ) |
| | 1,540,961,191 | | | | 32,975,228 | | | | 939,579,833 | | | | 8,087,136 | | | | 3,909,165 | | | | 626,709 | | | | (502,417 | ) |
| $ | 5,846,442,115 | | | $ | 182,413,770 | | | $ | 4,766,724,776 | | | $ | 68,885,081 | | | $ | 34,994,150 | | | $ | 312,937,305 | | | $ | 43,823,469 | |
| | | | | | | | | | | | | | | | | | | | | | | | | | | |
| $ | 1,346,868,870 | | | $ | 13,480,438 | | | $ | 358,394,529 | | | $ | 10,533,087 | | | $ | 9,242,839 | | | $ | 20,510,586 | | | $ | 3,479,649 | |
| $ | 115,257,254 | | | $ | 11,072,086 | | | $ | 115,008,561 | | | $ | 2,809,782 | | | $ | 1,915,530 | | | $ | — | | | $ | — | |
| $ | 3,538,858,544 | | | $ | 136,233,011 | | | $ | 4,032,586,224 | | | $ | 35,020,820 | | | $ | 23,835,781 | | | $ | 61,136,329 | | | $ | 9,604,251 | |
| $ | 845,457,447 | | | $ | 21,628,235 | | | $ | 260,735,462 | | | $ | 20,521,392 | | | $ | — | | | $ | 231,290,390 | | | $ | 30,739,569 | |
| | | | | | | | | | | | | | | | | | | | | | | | | | | |
| | 50,913,847 | | | | 842,249 | | | | 13,911,925 | | | | 447,134 | | | | 374,683 | | | | 2,029,638 | | | | 353,371 | |
| | 4,596,784 | | | | 732,912 | | | | 4,991,054 | | | | 125,410 | | | | 84,967 | | | | — | | | | — | |
| | 132,950,216 | | | | 8,458,452 | | | | 152,824,375 | | | | 1,469,806 | | | | 963,318 | | | | 6,047,835 | | | | 975,349 | |
| | 31,736,178 | | | | 1,340,447 | | | | 9,841,511 | | | | 859,530 | | | | — | | | | 22,872,647 | | | | 3,120,135 | |
| | | | | | | | | | | | | | | | | | | | | | | | | | | |
| $ | 26.45 | | | $ | 16.01 | | | $ | 25.76 | | | $ | 23.56 | | | $ | 24.67 | | | $ | 10.11 | | | $ | 9.85 | |
| $ | 25.07 | | | $ | 15.11 | | | $ | 23.04 | | | $ | 22.40 | | | $ | 22.54 | | | $ | — | | | $ | — | |
| $ | 26.62 | | | $ | 16.11 | | | $ | 26.39 | | | $ | 23.83 | | | $ | 24.74 | | | $ | 10.11 | | | $ | 9.85 | |
| $ | 26.64 | | | $ | 16.14 | | | $ | 26.49 | | | $ | 23.88 | | | $ | — | | | $ | 10.11 | | | $ | 9.85 | |
| | | | | | | | | | | | | | | | | | | | | | | | | | | |
| | 5.00 | % | | | 5.00 | % | | | 5.00 | % | | | 5.00 | % | | | 5.00 | % | | | 2.25 | % | | | 3.50 | % |
| $ | 27.84 | | | $ | 16.85 | | | $ | 27.12 | | | $ | 24.80 | | | $ | 25.97 | | | $ | 10.34 | | | $ | 10.21 | |
DIAMOND HILL FUNDS | ANNUAL REPORT | DECEMBER 31, 2017 | DIAMOND-HILL.COM 89 |
Diamond Hill Funds
Statements of Assets & Liabilities (Continued)
December 31, 2017
| | | Corporate Credit Fund | | | High Yield Fund | |
| Assets | | | | | | |
| Investment in unaffiliated securities, at cost | | $ | 691,466,793 | | | $ | 33,194,202 | |
| Investment in affiliated securities, at cost | | | 25,943,705 | | | | — | |
| Investment securities, at fair value — including $81,361,198 and $3,183,679 of securities loaned | | $ | 696,123,333 | | | $ | 33,800,270 | |
| Investment in affiliated securities, at fair value | | | 26,071,860 | | | | — | |
| Receivable for fund shares issued | | | 2,453,565 | | | | 891 | |
| Receivable for dividends and interest | | | 11,364,658 | | | | 568,878 | |
| Prepaid expenses and other assets | | | 7,687 | | | | — | |
| Total Assets | | | 736,021,103 | | | | 34,370,039 | |
| | | | | | | | | |
| Liabilities | | | | | | | | |
| Payable for fund shares redeemed | | | 225,616 | | | | 178 | |
| Payable for return of collateral received | | | 83,038,990 | | | | 3,249,893 | |
| Payable to Investment Adviser | | | 247,707 | | | | 12,920 | |
| Payable to Administrator | | | 100,798 | | | | 3,314 | |
| Accrued distribution and service fees | | | 36,375 | | | | 65 | |
| Total Liabilities | | | 83,649,486 | | | | 3,266,370 | |
| | | | | | | | | |
| Net Assets | | $ | 652,371,617 | | | $ | 31,103,669 | |
| | | | | | | | | |
| Components of Net Assets | | | | | | | | |
| Paid-in capital | | $ | 647,910,392 | | | $ | 30,473,486 | |
| Accumulated net investment income | | | (36,540 | ) | | | 3,955 | |
| Accumulated net realized gains (losses) from investment transactions | | | (286,930 | ) | | | 20,160 | |
| Net unrealized appreciation on investments | | | 4,784,695 | | | | 606,068 | |
| Net Assets | | $ | 652,371,617 | | | $ | 31,103,669 | |
| Net Assets | | | | | | | | |
| Class A Shares | | $ | 64,203,573 | | | $ | 295,833 | |
| Class C Shares | | $ | 26,655,952 | | | $ | — | |
| Class I Shares | | $ | 536,203,125 | | | $ | 14,185,252 | |
| Class Y Shares | | $ | 25,308,967 | | | $ | 16,622,584 | |
| Shares of beneficial interest outstanding (unlimited number of shares authorized, no par value) | | | | | | | | |
| Class A Shares | | | 5,674,142 | | | | 27,456 | |
| Class C Shares | | | 2,364,029 | | | | — | |
| Class I Shares | | | 47,541,030 | | | | 1,316,050 | |
| Class Y Shares | | | 2,245,132 | | | | 1,542,648 | |
| Net Asset Value, offering (except Class A Shares) and redemption price per share: | | | | | | | | |
| Class A Shares | | $ | 11.32 | | | $ | 10.77 | |
Class C Shares(A) | | $ | 11.28 | | | $ | — | |
| Class I Shares | | $ | 11.28 | | | $ | 10.78 | |
| Class Y Shares | | $ | 11.27 | | | $ | 10.78 | |
| Maximum Offering Price | | | | | | | | |
| Maximum sales charge — Class A Shares | | | 3.50 | % | | | 3.50 | % |
| (100%/(100%-maximum sales charge) of net asset value adjusted to the nearest cent) per share — Class A Shares | | $ | 11.73 | | | $ | 11.16 | |
(A) | Redemption price per share varies based on the holding period. |
See accompanying Notes to Financial Statements.
90 DIAMOND HILL FUNDS | ANNUAL REPORT | DECEMBER 31, 2017 | DIAMOND-HILL.COM |
Diamond Hill Funds
Statements of Operations
For the year ended December 31, 2017
| | | Small Cap
Fund | | | Small-Mid
Cap
Fund | | | Mid Cap
Fund | | | Large Cap
Fund | | | All Cap
Select
Fund | |
| Investment Income | | | | | | | | | | | | | | | |
| Dividends | | $ | 19,972,846 | | | $ | 30,457,408 | | | $ | 1,265,922 | | | $ | 94,962,078 | | | $ | 1,949,616 | |
| Income distributions from affiliated investments | | | 2,059,800 | | | | 1,504,649 | | | | 51,372 | | | | — | | | | 95,138 | |
| Securities lending income | | | 435,515 | | | | 720,602 | | | | 30,155 | | | | 296,400 | | | | 10,682 | |
| Foreign taxes withheld | | | (109,824 | ) | | | (125,498 | ) | | | (2,358 | ) | | | — | | | | — | |
| Total Investment Income | | | 22,358,337 | | | | 32,557,161 | | | | 1,345,091 | | | | 95,258,478 | | | | 2,055,436 | |
| | | | | | | | | | | | | | | | | | | | | |
| Expenses | | | | | | | | | | | | | | | | | | | | |
| Investment advisory fees | | | 12,930,599 | | | | 18,239,040 | | | | 597,682 | | | | 24,669,522 | | | | 1,039,154 | |
| Administration fees | | | 2,981,966 | | | | 3,548,924 | | | | 164,119 | | | | 8,983,576 | | | | 266,514 | |
| Distribution fees — Class A | | | 982,049 | | | | 635,785 | | | | 54,329 | | | | 3,155,222 | | | | 35,049 | |
| Distribution and service fees — Class C | | | 494,479 | | | | 405,180 | | | | — | | | | 1,060,125 | | | | 113,623 | |
| Other fees | | | 2,617 | | | | 7,690 | | | | 2,019 | | | | 10,770 | | | | 1,973 | |
| Total Expenses | | | 17,391,710 | | | | 22,836,619 | | | | 818,149 | | | | 37,879,215 | | | | 1,456,313 | |
| Advisory fees waived by Advisor | | | (211,925 | ) | | | (153,298 | ) | | | (5,090 | ) | | | — | | | | (9,733 | ) |
| Net Expenses | | | 17,179,785 | | | | 22,683,321 | | | | 813,059 | | | | 37,879,215 | | | | 1,446,580 | |
| | | | | | | | | | | | | | | | | | | | | |
| Net Investment Income | | | 5,178,552 | | | | 9,873,840 | | | | 532,032 | | | | 57,379,263 | | | | 608,856 | |
| | | | | | | | | | | | | | | | | | | | | |
| Realized and Unrealized Gains on Investments | | | | | | | | | | | | | | | | | | | | |
| Net realized gains on security sales | | | 147,218,437 | | | | 66,260,357 | | | | 977,014 | | | | 216,008,773 | | | | 16,146,928 | |
| Net realized gains on sales from affiliated investments | | | 65,225 | | | | — | | | | — | | | | — | | | | — | |
| Net change in unrealized appreciation (depreciation) on unaffiliated investments | | | 5,711,218 | | | | 125,297,244 | | | | 8,128,086 | | | | 635,590,500 | | | | 10,843,115 | |
| Net change in unrealized appreciation (depreciation) on affiliated investments | | | 471,096 | | | | 317,124 | | | | 5,085 | | | | — | | | | 21,660 | |
| Net Realized and Unrealized Gains on Investments | | | 153,465,976 | | | | 191,874,725 | | | | 9,110,185 | | | | 851,599,273 | | | | 27,011,703 | |
| | | | | | | | | | | | | | | | | | | | | |
| Change in Net Assets from Operations | | $ | 158,644,528 | | | $ | 201,748,565 | | | $ | 9,642,217 | | | $ | 908,978,536 | | | $ | 27,620,559 | |
See accompanying Notes to Financial Statements.
DIAMOND HILL FUNDS | ANNUAL REPORT | DECEMBER 31, 2017 | DIAMOND-HILL.COM 91 |
Diamond Hill Funds
Statements of Operations
For the year ended December 31, 2017
| | | Long-Short
Fund | | | Research
Opportunities
Fund | | | Financial
Long-Short
Fund | | | Short Duration Total Return Fund | | | Core Bond Fund | |
| Investment Income | | | | | | | | | | | | | | | |
| Dividends | | $ | 72,585,869 | | | $ | 690,686 | | | $ | 538,702 | | | $ | 108,813 | | | $ | 20,093 | |
| Income distributions from affiliated investments | | | 2,578,136 | | | | — | | | | — | | | | — | | | | — | |
| Interest | | | 5,070,546 | | | | 81,474 | | | | 21,485 | | | | 9,953,498 | | | | 1,189,942 | |
| Securities lending income | | | 1,223,819 | | | | 22,312 | | | | 12,589 | | | | 11,789 | | | | 5,782 | |
| Foreign taxes withheld | | | (206,949 | ) | | | (5,206 | ) | | | (2,231 | ) | | | — | | | | — | |
| Total Investment Income | | | 81,251,421 | | | | 789,266 | | | | 570,545 | | | | 10,074,100 | | | | 1,215,817 | |
| | | | | | | | | | | | | | | | | | | | | |
| Expenses | | | | | | | | | | | | | | | | | | | | |
| Investment advisory fees | | | 42,220,255 | | | | 573,200 | | | | 310,832 | | | | 932,455 | | | | 126,451 | |
| Administration fees | | | 8,652,096 | | | | 100,458 | | | | 65,680 | | | | 269,872 | | | | 48,740 | |
| Distribution fees — Class A | | | 1,014,381 | | | | 21,200 | | | | 22,630 | | | | 19,645 | | | | 7,185 | |
| Distribution and service fees — Class C | | | 1,288,072 | | | | 28,136 | | | | 18,379 | | | | — | | | | — | |
| Other fees | | | — | | | | 10,524 | | | | 1,870 | | | | 2,226 | | | | 1,587 | |
| Expenses and fees on securities sold short | | | 26,730,640 | | | | 238,320 | | | | 147,578 | | | | — | | | | — | |
| Total Expenses | | | 79,905,444 | | | | 971,838 | | | | 566,969 | | | | 1,224,198 | | | | 183,963 | |
| Advisory fees waived by Advisor | | | (260,623 | ) | | | — | | | | — | | | | — | | | | — | |
| Net Expenses | | | 79,644,821 | | | | 971,838 | | | | 566,969 | | | | 1,224,198 | | | | 183,963 | |
| | | | | | | | | | | | | | | | | | | | | |
| Net Investment Income (Loss) | | | 1,606,600 | | | | (182,572 | ) | | | 3,576 | | | | 8,849,902 | | | | 1,031,854 | |
| | | | | | | | | | | | | | | | | | | | | |
| Realized and Unrealized Gains (Losses) on Investments | | | | | | | | | | | | | | | | | | | | |
| Net realized gains (losses) on security sales | | | (247,239,323 | ) | | | 5,954,064 | | | | 3,007,004 | | | | 1,174,769 | | | | 59,298 | |
| Net realized gains (losses) on closed short positions | | | 308,978,428 | | | | (2,872,262 | ) | | | (82,821 | ) | | | — | | | | — | |
| Net realized losses on foreign currency transactions | | | — | | | | (2,626 | ) | | | — | | | | — | | | | — | |
| Net change in unrealized appreciation (depreciation) on unaffiliated investments and foreign currency translations | | | 200,409,275 | | | | 4,490,196 | | | | 681,514 | | | | 1,207,100 | | | | 609,589 | |
| Net change in unrealized appreciation (depreciation) on affiliated investments | | | 507,017 | | | | — | | | | — | | | | — | | | | — | |
| Net Realized and Unrealized Gains on Investments | | | 262,655,397 | | | | 7,569,372 | | | | 3,605,697 | | | | 2,381,869 | | | | 668,887 | |
| | | | | | | | | | | | | | | | | | | | | |
| Change in Net Assets from Operations | | $ | 264,261,997 | | | $ | 7,386,800 | | | $ | 3,609,273 | | | $ | 11,231,771 | | | $ | 1,700,741 | |
See accompanying Notes to Financial Statements.
92 DIAMOND HILL FUNDS | ANNUAL REPORT | DECEMBER 31, 2017 | DIAMOND-HILL.COM |
Diamond Hill Funds
Statements of Operations
For the year ended December 31, 2017
| | | Corporate Credit Fund | | | High Yield Fund | |
| Investment Income | | | | | | |
| Dividends | | $ | 595,824 | | | $ | 15,923 | |
| Income distributions from affiliated investments | | | 759,822 | | | | — | |
| Interest | | | 35,118,650 | | | | 2,012,072 | |
| Securities Lending Income | | | 214,656 | | | | 15,623 | |
| Total Investment Income | | | 36,688,952 | | | | 2,043,618 | |
| | | | | | | | | |
| Expenses | | | | | | | | |
| Investment advisory fees | | | 2,746,222 | | | | 148,144 | |
| Administration fees | | | 1,151,809 | | | | 42,021 | |
| Distribution fees — Class A | | | 194,707 | | | | 662 | |
| Distribution and service fees — Class C | | | 281,186 | | | | — | |
| Other fees | | | 2,982 | | | | 1,858 | |
| Total Expenses | | | 4,376,906 | | | | 192,685 | |
| Advisory fees waived by Advisor | | | (76,801 | ) | | | — | |
| Net Expenses | | | 4,300,105 | | | | 192,685 | |
| | | | | | | | | |
| Net Investment Income | | | 32,388,847 | | | | 1,850,933 | |
| | | | | | | | | |
| Realized and Unrealized Gains on Investments | | | | | | | | |
| Net realized gains on security sales | | | 3,594,371 | | | | 886,142 | |
| Net change in unrealized appreciation (depreciation) on unaffiliated investments and foreign currency translations | | | 8,542,297 | | | | 223,959 | |
| Net change in unrealized appreciation (depreciation) on affiliated investments | | | 135,054 | | | | — | |
| Net Realized and Unrealized Gains on Investments | | | 12,271,722 | | | | 1,110,101 | |
| | | | | | | | | |
| Change in Net Assets from Operations | | $ | 44,660,569 | | | $ | 2,961,034 | |
See accompanying Notes to Financial Statements.
DIAMOND HILL FUNDS | ANNUAL REPORT | DECEMBER 31, 2017 | DIAMOND-HILL.COM 93 |
Diamond Hill Funds
Statements of Changes in Net Assets
| | | Small Cap Fund | | | Small-Mid Cap Fund | |
| | | For the year ended
December 31,
2017 | | | For the year ended
December 31,
2016 | | | For the year ended
December 31,
2017 | | | For the year ended
December 31,
2016 | |
| From Operations | | | | | | | | | | | | |
| Net investment income | | $ | 5,178,552 | | | $ | 3,592,807 | | | $ | 9,873,840 | | | $ | 6,968,028 | |
| Net realized gains (losses) on security sales | | | 147,218,437 | | | | (8,065,426 | ) | | | 66,260,357 | | | | 31,870,243 | |
| Net realized gains on sales from affiliated investments | | | 65,225 | | | | — | | | | — | | | | — | |
| Net change in unrealized appreciation (depreciation) on investments | | | 6,182,314 | | | | 242,943,587 | | | | 125,614,368 | | | | 297,959,119 | |
| Change in Net Assets from Operations | | | 158,644,528 | | | | 238,470,968 | | | | 201,748,565 | | | | 336,797,390 | |
| | | | | | | | | | | | | | | | | |
| Distributions to Shareholders | | | | | | | | | | | | | | | | |
| From net investment income: | | | | | | | | | | | | | | | | |
| Class A | | | (1,321,528 | ) | | | — | | | | (303,334 | ) | | | (161,619 | ) |
| Class I | | | (5,991,674 | ) | | | (2,294,721 | ) | | | (5,389,337 | ) | | | (3,246,570 | ) |
| Class Y | | | (1,640,786 | ) | | | (641,703 | ) | | | (6,497,241 | ) | | | (3,756,813 | ) |
| From net realized gains on investments | | | | | | | | | | | | | | | | |
| Class A | | | (21,620,193 | ) | | | (10,925,906 | ) | | | (6,718,003 | ) | | | (4,780,960 | ) |
| Class C | | | (3,195,681 | ) | | | (1,526,538 | ) | | | (1,205,479 | ) | | | (769,671 | ) |
| Class I | | | (51,638,884 | ) | | | (26,235,567 | ) | | | (32,256,093 | ) | | | (16,486,738 | ) |
| Class Y | | | (12,317,380 | ) | | | (5,327,247 | ) | | | (32,514,902 | ) | | | (15,751,165 | ) |
| Change in Net Assets from Distributions to Shareholders | | | (97,726,126 | ) | | | (46,951,682 | ) | | | (84,884,389 | ) | | | (44,953,536 | ) |
| Change in net assets from capital transactions | | | (360,698,751 | ) | | | (56,335,642 | ) | | | 87,305,574 | | | | 718,023,706 | |
| | | | | | | | | | | | | | | | | |
| Total Change in Net Assets | | | (299,780,349 | ) | | | 135,183,644 | | | | 204,169,750 | | | | 1,009,867,560 | |
| | | | | | | | | | | | | | | | | |
| Net Assets: | | | | | | | | | | | | | | | | |
| Beginning of year | | | 1,789,843,310 | | | | 1,654,659,666 | | | | 2,308,633,615 | | | | 1,298,766,055 | |
| End of year | | $ | 1,490,062,961 | | | $ | 1,789,843,310 | | | $ | 2,512,803,365 | | | $ | 2,308,633,615 | |
| Accumulated Net Investment Income (Loss) | | $ | (7,912,455 | ) | | $ | (3,233,090 | ) | | $ | (2,843,931 | ) | | $ | (1,021,312 | ) |
See accompanying Notes to Financial Statements.
94 DIAMOND HILL FUNDS | ANNUAL REPORT | DECEMBER 31, 2017 | DIAMOND-HILL.COM |
Diamond Hill Funds
Statements of Changes in Net Assets
| | | Small Cap Fund | | | Small-Mid Cap Fund | |
| | | For the year ended
December 31,
2017 | | | For the year ended
December 31,
2016 | | | For the year ended
December 31,
2017 | | | For the year ended
December 31,
2016 | |
| Capital Transactions | | | | | | | | | | | | |
| Class A | | | | | | | | | | | | |
| Proceeds from shares sold | | $ | 43,255,689 | | | $ | 82,726,159 | | | $ | 36,452,472 | | | $ | 137,436,730 | |
| Reinvested distributions | | | 19,872,410 | | | | 9,626,149 | | | | 6,829,088 | | | | 4,814,331 | |
| Payments for shares redeemed | | | (160,780,052 | ) | | | (194,313,737 | ) | | | (116,201,345 | ) | | | (54,770,817 | ) |
| Change in Net Assets from Class A Share Transactions | | | (97,651,953 | ) | | | (101,961,429 | ) | | | (72,919,785 | ) | | | 87,480,244 | |
| Class C | | | | | | | | | | | | | | | | |
| Proceeds from shares sold | | | 1,046,500 | | | | 3,070,068 | | | | 3,119,654 | | | | 11,927,045 | |
| Reinvested distributions | | | 3,046,615 | | | | 1,437,120 | | | | 1,083,083 | | | | 685,334 | |
| Payments for shares redeemed | | | (13,140,561 | ) | | | (12,977,068 | ) | | | (11,302,980 | ) | | | (8,368,229 | ) |
| Change in Net Assets from Class C Share Transactions | | | (9,047,446 | ) | | | (8,469,880 | ) | | | (7,100,243 | ) | | | 4,244,150 | |
| Class I | | | | | | | | | | | | | | | | |
| Proceeds from shares sold | | | 207,519,695 | | | | 305,649,831 | | | | 251,743,493 | | | | 493,904,960 | |
| Reinvested distributions | | | 53,175,469 | | | | 25,565,584 | | | | 32,592,789 | | | | 17,836,161 | |
| Payments for shares redeemed | | | (492,010,322 | ) | | | (250,813,602 | ) | | | (236,950,259 | ) | | | (126,982,487 | ) |
| Change in Net Assets from Class I Share Transactions | | | (231,315,158 | ) | | | 80,401,813 | | | | 47,386,023 | | | | 384,758,634 | |
| Class Y | | | | | | | | | | | | | | | | |
| Proceeds from shares sold | | | 65,381,792 | | | | 38,612,554 | | | | 269,513,443 | | | | 352,897,660 | |
| Reinvested distributions | | | 13,923,088 | | | | 5,947,579 | | | | 38,051,626 | | | | 18,948,994 | |
| Payments for shares redeemed | | | (101,989,074 | ) | | | (70,866,279 | ) | | | (187,625,490 | ) | | | (130,305,976 | ) |
| Change in Net Assets from Class Y Share Transactions | | | (22,684,194 | ) | | | (26,306,146 | ) | | | 119,939,579 | | | | 241,540,678 | |
| Change in net assets from capital transactions: | | $ | (360,698,751 | ) | | $ | (56,335,642 | ) | | $ | 87,305,574 | | | $ | 718,023,706 | |
| Share Transactions: | | | | | | | | | | | | | | | | |
| Class A | | | | | | | | | | | | | | | | |
| Issued | | | 1,231,341 | | | | 2,657,309 | | | | 1,664,263 | | | | 7,708,176 | |
| Reinvested | | | 566,117 | | | | 279,180 | | | | 311,412 | | | | 226,878 | |
| Redeemed | | | (4,546,243 | ) | | | (6,105,481 | ) | | | (5,285,514 | ) | | | (2,844,030 | ) |
| Change in shares outstanding | | | (2,748,785 | ) | | | (3,168,992 | ) | | | (3,309,839 | ) | | | 5,091,024 | |
| Class C | | | | | | | | | | | | | | | | |
| Issued | | | 33,943 | | | | 111,230 | | | | 155,374 | | | | 684,485 | |
| Reinvested | | | 100,251 | | | | 47,289 | | | | 53,965 | | | | 34,931 | |
| Redeemed | | | (425,207 | ) | | | (458,259 | ) | | | (559,494 | ) | | | (463,491 | ) |
| Change in shares outstanding | | | (291,013 | ) | | | (299,740 | ) | | | (350,155 | ) | | | 255,925 | |
| Class I | | | | | | | | | | | | | | | | |
| Issued | | | 5,796,796 | | | | 9,588,524 | | | | 11,400,492 | | | | 25,767,686 | |
| Reinvested | | | 1,487,039 | | | | 729,929 | | | | 1,465,206 | | | | 830,989 | |
| Redeemed | | | (13,791,406 | ) | | | (7,733,812 | ) | | | (10,707,040 | ) | | | (6,573,142 | ) |
| Change in shares outstanding | | | (6,507,571 | ) | | | 2,584,641 | | | | 2,158,658 | | | | 20,025,533 | |
| Class Y | | | | | | | | | | | | | | | | |
| Issued | | | 1,822,073 | | | | 1,195,701 | | | | 12,148,534 | | | | 18,030,889 | |
| Reinvested | | | 388,760 | | | | 169,596 | | | | 1,705,402 | | | | 880,672 | |
| Redeemed | | | (2,824,566 | ) | | | (2,090,065 | ) | | | (8,434,929 | ) | | | (6,655,846 | ) |
| Change in shares outstanding | | | (613,733 | ) | | | (724,768 | ) | | | 5,419,007 | | | | 12,255,715 | |
| Change in total shares outstanding | | | (10,161,102 | ) | | | (1,608,859 | ) | | | 3,917,671 | | | | 37,628,197 | |
See accompanying Notes to Financial Statements.
DIAMOND HILL FUNDS | ANNUAL REPORT | DECEMBER 31, 2017 | DIAMOND-HILL.COM 95 |
Diamond Hill Funds
Statements of Changes in Net Assets
| | | Mid Cap Fund | | | Large Cap Fund | |
| | | For the year ended
December 31,
2017 | | | For the year ended
December 31,
2016 | | | For the year ended
December 31,
2017 | | | For the year ended
December 31,
2016 | |
| From Operations | | | | | | | | | | | | |
| Net investment income | | $ | 532,032 | | | $ | 212,456 | | | $ | 57,379,263 | | | $ | 48,653,773 | |
| Net realized gains on security sales | | | 977,014 | | | | 449,461 | | | | 216,008,773 | | | | 212,473,672 | |
| Net change in unrealized appreciation (depreciation) on investments | | | 8,133,171 | | | | 5,916,156 | | | | 635,590,500 | | | | 264,890,441 | |
| Change in Net Assets from Operations | | | 9,642,217 | | | | 6,578,073 | | | | 908,978,536 | | | | 526,017,886 | |
| | | | | | | | | | | | | | | | | |
| Distributions to Shareholders | | | | | | | | | | | | | | | | |
| From net investment income: | | | | | | | | | | | | | | | | |
| Class A | | | (57,610 | ) | | | (10,415 | ) | | | (10,246,592 | ) | | | (12,062,582 | ) |
| Class C | | | — | | | | — | | | | (182,822 | ) | | | (429,502 | ) |
| Class I | | | (304,384 | ) | | | (111,394 | ) | | | (37,412,120 | ) | | | (28,190,303 | ) |
| Class Y | | | (179,996 | ) | | | (98,452 | ) | | | (9,474,688 | ) | | | (9,297,263 | ) |
| From net realized gains on investments | | | | | | | | | | | | | | | | |
| Class A | | | (323,672 | ) | | | (35,783 | ) | | | (48,625,612 | ) | | | (58,242,648 | ) |
| Class C | | | — | | | | — | | | | (4,361,901 | ) | | | (5,004,267 | ) |
| Class I | | | (776,190 | ) | | | (120,917 | ) | | | (126,753,506 | ) | | | (106,332,727 | ) |
| Class Y | | | (409,536 | ) | | | (109,823 | ) | | | (29,965,617 | ) | | | (32,620,990 | ) |
| Change in Net Assets from Distributions to Shareholders | | | (2,051,388 | ) | | | (486,784 | ) | | | (267,022,858 | ) | | | (252,180,282 | ) |
| Change in net assets from capital transactions | | | 55,685,995 | | | | 34,151,971 | | | | 1,126,764,825 | | | | 363,471,164 | |
| | | | | | | | | | | | | | | | | |
| Total Change in Net Assets | | | 63,276,824 | | | | 40,243,260 | | | | 1,768,720,503 | | | | 637,308,768 | |
| | | | | | | | | | | | | | | | | |
| Net Assets: | | | | | | | | | | | | | | | | |
| Beginning of year | | | 58,816,734 | | | | 18,573,474 | | | | 4,077,721,612 | | | | 3,440,412,844 | |
| End of year | | $ | 122,093,558 | | | $ | 58,816,734 | | | $ | 5,846,442,115 | | | $ | 4,077,721,612 | |
| Accumulated Net Investment Income | | $ | — | | | $ | 1,905 | | | $ | 351,642 | | | $ | 3,182 | |
See accompanying Notes to Financial Statements.
96 DIAMOND HILL FUNDS | ANNUAL REPORT | DECEMBER 31, 2017 | DIAMOND-HILL.COM |
Diamond Hill Funds
Statements of Changes in Net Assets
| | | Mid Cap Fund | | | Large Cap Fund | |
| | | For the year ended
December 31,
2017 | | | For the year ended
December 31,
2016 | | | For the year ended
December 31,
2017 | | | For the year ended
December 31,
2016 | |
| Capital Transactions | | | | | | | | | | | | |
| Class A | | | | | | | | | | | | |
| Proceeds from shares sold | | $ | 22,041,226 | | | $ | 4,617,678 | | | $ | 219,577,307 | | | $ | 141,843,093 | |
| Reinvested distributions | | | 368,762 | | | | 46,198 | | | | 58,105,716 | | | | 68,923,795 | |
| Payments for shares redeemed | | | (5,300,997 | ) | | | (1,353,700 | ) | | | (259,447,690 | ) | | | (253,327,738 | ) |
| Change in Net Assets from Class A Share Transactions | | | 17,108,991 | | | | 3,310,176 | | | | 18,235,333 | | | | (42,560,850 | ) |
| Class C | | | | | | | | | | | | | | | | |
| Proceeds from shares sold | | | — | | | | — | | | | 23,933,486 | | | | 16,913,035 | |
| Reinvested distributions | | | — | | | | — | | | | 4,291,336 | | | | 5,175,794 | |
| Payments for shares redeemed | | | — | | | | (78,724 | ) | | | (22,789,348 | ) | | | (16,772,131 | ) |
| Change in Net Assets from Class C Share Transactions | | | — | | | | (78,724 | ) | | | 5,435,474 | | | | 5,316,698 | |
| Class I | | | | | | | | | | | | | | | | |
| Proceeds from shares sold | | | 38,211,310 | | | | 23,333,994 | | | | 1,503,237,486 | | | | 637,477,723 | |
| Reinvested distributions | | | 996,637 | | | | 203,333 | | | | 130,980,753 | | | | 118,085,012 | |
| Payments for shares redeemed | | | (7,795,801 | ) | | | (1,279,590 | ) | | | (608,117,842 | ) | | | (555,292,097 | ) |
| Change in Net Assets from Class I Share Transactions | | | 31,412,146 | | | | 22,257,737 | | | | 1,026,100,397 | | | | 200,270,638 | |
| Class Y | | | | | | | | | | | | | | | | |
| Proceeds from shares sold | | | 7,439,870 | | | | 9,057,474 | | | | 216,754,188 | | | | 265,700,272 | |
| Reinvested distributions | | | 242,018 | | | | 44,343 | | | | 38,139,331 | | | | 40,721,952 | |
| Payments for shares redeemed | | | (517,030 | ) | | | (439,035 | ) | | | (177,899,898 | ) | | | (105,977,546 | ) |
| Change in Net Assets from Class Y Share Transactions | | | 7,164,858 | | | | 8,662,782 | | | | 76,993,621 | | | | 200,444,678 | |
| Change in net assets from capital transactions: | | $ | 55,685,995 | | | $ | 34,151,971 | | | $ | 1,126,764,825 | | | $ | 363,471,164 | |
| Share Transactions: | | | | | | | | | | | | | | | | |
| Class A | | | | | | | | | | | | | | | | |
| Issued | | | 1,684,618 | | | | 413,781 | | | | 8,823,702 | | | | 6,452,067 | |
| Reinvested | | | 27,333 | | | | 3,658 | | | | 2,203,772 | | | | 2,933,532 | |
| Redeemed | | | (406,802 | ) | | | (117,091 | ) | | | (10,349,496 | ) | | | (11,485,212 | ) |
| Change in shares outstanding | | | 1,305,149 | | | | 300,348 | | | | 677,978 | | | | (2,099,613 | ) |
| Class C | | | | | | | | | | | | | | | | |
| Issued | | | — | | | | — | | | | 1,002,019 | | | | 801,500 | |
| Reinvested | | | — | | | | — | | | | 172,860 | | | | 232,338 | |
| Redeemed | | | — | | | | (7,311 | ) | | | (949,750 | ) | | | (788,954 | ) |
| Change in shares outstanding | | | — | | | | (7,311 | ) | | | 225,129 | | | | 244,884 | |
| Class I | | | | | | | | | | | | | | | | |
| Issued | | | 2,913,937 | | | | 2,000,164 | | | | 59,051,534 | | | | 28,962,246 | |
| Reinvested | | | 73,297 | | | | 16,048 | | | | 4,923,533 | | | | 4,990,123 | |
| Redeemed | | | (586,851 | ) | | | (106,440 | ) | | | (23,981,084 | ) | | | (24,655,187 | ) |
| Change in shares outstanding | | | 2,400,383 | | | | 1,909,772 | | | | 39,993,983 | | | | 9,297,182 | |
| Class Y | | | | | | | | | | | | | | | | |
| Issued | | | 571,830 | | | | 762,252 | | | | 8,566,956 | | | | 11,753,419 | |
| Reinvested | | | 17,739 | | | | 3,491 | | | | 1,431,646 | | | | 1,719,340 | |
| Redeemed | | | (39,081 | ) | | | (40,385 | ) | | | (6,991,868 | ) | | | (4,712,526 | ) |
| Change in shares outstanding | | | 550,488 | | | | 725,358 | | | | 3,006,734 | | | | 8,760,233 | |
| Change in total shares outstanding | | | 4,256,020 | | | | 2,928,167 | | | | 43,903,824 | | | | 16,202,686 | |
See accompanying Notes to Financial Statements.
DIAMOND HILL FUNDS | ANNUAL REPORT | DECEMBER 31, 2017 | DIAMOND-HILL.COM 97 |
Diamond Hill Funds
Statements of Changes in Net Assets
| | | All Cap Select Fund | | | Long-Short Fund | |
| | | For the year ended
December 31,
2017 | | | For the year ended
December 31,
2016 | | | For the year ended
December 31,
2017 | | | For the year ended
December 31,
2016 | |
| From Operations | | | | | | | | | | | | |
| Net investment income (loss) | | $ | 608,856 | | | $ | 156,022 | | | $ | 1,606,600 | | | $ | (6,432,934 | ) |
| Net realized gains (losses) on security sales | | | 16,146,928 | | | | (8,063,135 | ) | | | (247,239,323 | ) | | | 246,421,475 | |
| Net realized gains (losses) on closed short positions | | | — | | | | — | | | | 308,978,428 | | | | (38,448,173 | ) |
| Net change in unrealized appreciation (depreciation) on investments | | | 10,864,775 | | | | 20,640,227 | | | | 200,916,292 | | | | 224,056,947 | |
| Change in Net Assets from Operations | | | 27,620,559 | | | | 12,733,114 | | | | 264,261,997 | | | | 425,597,315 | |
| | | | | | | | | | | | | | | | | |
| Distributions to Shareholders | | | | | | | | | | | | | | | | |
| From net investment income: | | | | | | | | | | | | | | | | |
| Class A | | | — | | | | — | | | | — | | | | (10 | ) |
| Class I | | | (123,325 | ) | | | (92,446 | ) | | | (1,069,047 | ) | | | — | |
| Class Y | | | (33,195 | ) | | | (38,022 | ) | | | (316,452 | ) | | | — | |
| From net realized gains on investments | | | | | | | | | | | | | | | | |
| Class A | | | — | | | | (190,538 | ) | | | (7,598,222 | ) | | | (15,593,899 | ) |
| Class C | | | — | | | | (162,678 | ) | | | (2,720,287 | ) | | | (5,373,676 | ) |
| Class I | | | — | | | | (1,160,985 | ) | | | (83,447,184 | ) | | | (116,909,432 | ) |
| Class Y | | | — | | | | (228,777 | ) | | | (5,492,843 | ) | | | (7,433,997 | ) |
| Change in Net Assets from Distributions to Shareholders | | | (156,520 | ) | | | (1,873,446 | ) | | | (100,644,035 | ) | | | (145,311,014 | ) |
| Change in net assets from capital transactions | | | 16,068,901 | | | | (22,750,290 | ) | | | 180,260,316 | | | | (270,142,790 | ) |
| | | | | | | | | | | | | | | | | |
| Total Change in Net Assets | | | 43,532,940 | | | | (11,890,622 | ) | | | 343,878,278 | | | | 10,143,511 | |
| | | | | | | | | | | | | | | | | |
| Net Assets: | | | | | | | | | | | | | | | | |
| Beginning of year | | | 138,880,830 | | | | 150,771,452 | | | | 4,422,846,498 | | | | 4,412,702,987 | |
| End of year | | $ | 182,413,770 | | | $ | 138,880,830 | | | $ | 4,766,724,776 | | | $ | 4,422,846,498 | |
| Accumulated Net Investment Income | | $ | 608,298 | | | $ | 155,962 | | | $ | — | | | $ | — | |
See accompanying Notes to Financial Statements.
98 DIAMOND HILL FUNDS | ANNUAL REPORT | DECEMBER 31, 2017 | DIAMOND-HILL.COM |
Diamond Hill Funds
Statements of Changes in Net Assets
| | | All Cap Select Fund | | | Long-Short Fund | |
| | | For the year ended
December 31,
2017 | | | For the year ended
December 31,
2016 | | | For the year ended
December 31,
2017 | | | For the year ended
December 31,
2016 | |
| Capital Transactions | | | | | | | | | | | | |
| Class A | | | | | | | | | | | | |
| Proceeds from shares sold | | $ | 1,503,266 | | | $ | 3,872,392 | | | $ | 56,139,940 | | | $ | 54,997,688 | |
| Reinvested distributions | | | — | | | | 178,187 | | | | 6,833,236 | | | | 14,062,511 | |
| Payments for shares redeemed | | | (5,473,374 | ) | | | (32,508,715 | ) | | | (179,295,930 | ) | | | (206,653,955 | ) |
| Change in Net Assets from Class A Share Transactions | | | (3,970,108 | ) | | | (28,458,136 | ) | | | (116,322,754 | ) | | | (137,593,756 | ) |
| Class C | | | | | | | | | | | | | | | | |
| Proceeds from shares sold | | | 678,560 | | | | 1,275,335 | | | | 4,471,994 | | | | 5,072,700 | |
| Reinvested distributions | | | — | | | | 129,734 | | | | 2,436,942 | | | | 4,579,503 | |
| Payments for shares redeemed | | | (3,815,356 | ) | | | (4,866,592 | ) | | | (40,715,362 | ) | | | (42,002,803 | ) |
| Change in Net Assets from Class C Share Transactions | | | (3,136,796 | ) | | | (3,461,523 | ) | | | (33,806,426 | ) | | | (32,350,600 | ) |
| Class I | | | | | | | | | | | | | | | | |
| Proceeds from shares sold | | | 42,578,943 | | | | 47,461,808 | | | | 1,161,341,128 | | | | 1,015,927,229 | |
| Reinvested distributions | | | 119,642 | | | | 1,214,313 | | | | 68,586,680 | | | | 89,893,554 | |
| Payments for shares redeemed | | | (19,015,397 | ) | | | (45,514,745 | ) | | | (924,213,793 | ) | | | (1,126,573,761 | ) |
| Change in Net Assets from Class I Share Transactions | | | 23,683,188 | | | | 3,161,376 | | | | 305,714,015 | | | | (20,752,978 | ) |
| Class Y | | | | | | | | | | | | | | | | |
| Proceeds from shares sold | | | 2,447,592 | | | | 10,322,075 | | | | 84,275,911 | | | | 39,268,624 | |
| Reinvested distributions | | | 28,884 | | | | 261,984 | | | | 2,989,663 | | | | 3,706,643 | |
| Payments for shares redeemed | | | (2,983,859 | ) | | | (4,576,066 | ) | | | (62,590,093 | ) | | | (122,420,723 | ) |
| Change in Net Assets from Class Y Share Transactions | | | (507,383 | ) | | | 6,007,993 | | | | 24,675,481 | | | | (79,445,456 | ) |
| Change in net assets from capital transactions: | | $ | 16,068,901 | | | $ | (22,750,290 | ) | | $ | 180,260,316 | | | $ | (270,142,790 | ) |
| Share Transactions: | | | | | | | | | | | | | | | | |
| Class A | | | | | | | | | | | | | | | | |
| Issued | | | 105,675 | | | | 331,520 | | | | 2,193,777 | | | | 2,327,321 | |
| Reinvested | | | — | | | | 13,297 | | | | 267,341 | | | | 561,377 | |
| Redeemed | | | (384,577 | ) | | | (2,754,485 | ) | | | (7,017,787 | ) | | | (8,785,523 | ) |
| Change in shares outstanding | | | (278,902 | ) | | | (2,409,668 | ) | | | (4,556,669 | ) | | | (5,896,825 | ) |
| Class C | | | | | | | | | | | | | | | | |
| Issued | | | 50,614 | | | | 110,096 | | | | 194,601 | | | | 238,048 | |
| Reinvested | | | — | | | | 10,175 | | | | 106,556 | | | | 202,275 | |
| Redeemed | | | (284,375 | ) | | | (421,158 | ) | | | (1,766,507 | ) | | | (1,944,220 | ) |
| Change in shares outstanding | | | (233,761 | ) | | | (300,887 | ) | | | (1,465,350 | ) | | | (1,503,897 | ) |
| Class I | | | | | | | | | | | | | | | | |
| Issued | | | 2,826,911 | | | | 4,078,226 | | | | 44,372,451 | | | | 42,181,173 | |
| Reinvested | | | 7,399 | | | | 90,159 | | | | 2,619,467 | | | | 3,515,585 | |
| Redeemed | | | (1,329,505 | ) | | | (3,786,713 | ) | | | (35,305,935 | ) | | | (46,897,707 | ) |
| Change in shares outstanding | | | 1,504,805 | | | | 381,672 | | | | 11,685,983 | | | | (1,200,949 | ) |
| Class Y | | | | | | | | | | | | | | | | |
| Issued | | | 169,956 | | | | 869,935 | | | | 3,200,554 | | | | 1,602,705 | |
| Reinvested | | | 1,783 | | | | 19,413 | | | | 113,593 | | | | 144,396 | |
| Redeemed | | | (206,442 | ) | | | (376,896 | ) | | | (2,389,929 | ) | | | (5,037,950 | ) |
| Change in shares outstanding | | | (34,703 | ) | | | 512,452 | | | | 924,218 | | | | (3,290,849 | ) |
| Change in total shares outstanding | | | 957,439 | | | | (1,816,431 | ) | | | 6,568,182 | | | | (11,892,520 | ) |
See accompanying Notes to Financial Statements.
DIAMOND HILL FUNDS | ANNUAL REPORT | DECEMBER 31, 2017 | DIAMOND-HILL.COM 99 |
Diamond Hill Funds
Statements of Changes in Net Assets
| | | Research Opportunities Fund | | | Financial Long-Short Fund | |
| | | For the year ended
December 31,
2017 | | | For the year ended
December 31,
2016 | | | For the year ended
December 31,
2017 | | | For the year ended
December 31,
2016 | |
| From Operations | | | | | | | | | | | | |
| Net investment income (loss) | | $ | (182,572 | ) | | $ | (1,003 | ) | | $ | 3,576 | | | $ | 91,341 | |
| Net realized gains on security sales | | | 5,954,064 | | | | 1,719,569 | | | | 3,007,004 | | | | 2,938,910 | |
| Net realized losses on closed short positions | | | (2,872,262 | ) | | | (724,217 | ) | | | (82,821 | ) | | | (42,723 | ) |
| Net realized losses on foreign currency transactions | | | (2,626 | ) | | | (301 | ) | | | — | | | | — | |
| Net change in unrealized appreciation (depreciation) on investments and foreign currency translations | | | 4,490,196 | | | | 3,123,154 | | | | 681,514 | | | | 2,686,576 | |
| Change in Net Assets from Operations | | | 7,386,800 | | | | 4,117,202 | | | | 3,609,273 | | | | 5,674,104 | |
| | | | | | | | | | | | | | | | | |
| Distributions to Shareholders | | | | | | | | | | | | | | | | |
| From net investment income: | | | | | | | | | | | | | | | | |
| Class A | | | — | | | | — | | | | — | | | | — | |
| Class I | | | — | | | | — | | | | — | | | | — | |
| Class Y | | | — | | | | — | | | | (34,066 | ) | | | — | |
| From net realized gains on investments | | | | | | | | | | | | | | | | |
| Class A | | | (403,031 | ) | | | (30,845 | ) | | | — | | | | — | |
| Class C | | | (79,709 | ) | | | (23,939 | ) | | | — | | | | — | |
| Class I | | | (938,790 | ) | | | (200,584 | ) | | | — | | | | — | |
| Class Y | | | (414,461 | ) | | | (123,757 | ) | | | — | | | | — | |
| Change in Net Assets from Distributions to Shareholders | | | (1,835,991 | ) | | | (379,125 | ) | | | (34,066 | ) | | | — | |
| Change in net assets from capital transactions | | | 11,842,542 | | | | (7,451,444 | ) | | | (973,610 | ) | | | (698,018 | ) |
| | | | | | | | | | | | | | | | | |
| Total Change in Net Assets | | | 17,393,351 | | | | (3,713,367 | ) | | | 2,601,597 | | | | 4,976,086 | |
| | | | | | | | | | | | | | | | | |
| Net Assets: | | | | | | | | | | | | | | | | |
| Beginning of year | | | 51,491,730 | | | | 55,205,097 | | | | 32,392,553 | | | | 27,416,467 | |
| End of year | | $ | 68,885,081 | | | $ | 51,491,730 | | | $ | 34,994,150 | | | $ | 32,392,553 | |
| Accumulated Net Investment Income (Loss) | | $ | (113,398 | ) | | $ | 13,522 | | | $ | 3,567 | | | $ | 172,032 | |
See accompanying Notes to Financial Statements.
100 DIAMOND HILL FUNDS | ANNUAL REPORT | DECEMBER 31, 2017 | DIAMOND-HILL.COM |
Diamond Hill Funds
Statements of Changes in Net Assets
| | | Research Opportunities Fund | | | Financial Long-Short Fund | |
| | | For the year ended
December 31,
2017 | | | For the year ended
December 31,
2016 | | | For the year ended
December 31,
2017 | | | For the year ended
December 31,
2016 | |
| Capital Transactions | | | | | | | | | | | | |
| Class A | | | | | | | | | | | | |
| Proceeds from shares sold | | $ | 11,940,060 | | | $ | 1,486,960 | | | $ | 1,669,624 | | | $ | 735,530 | |
| Reinvested distributions | | | 394,023 | | | | 30,298 | | | | — | | | | — | |
| Payments for shares redeemed | | | (6,683,375 | ) | | | (6,134,350 | ) | | | (3,548,598 | ) | | | (3,083,093 | ) |
| Change in Net Assets from Class A Share Transactions | | | 5,650,708 | | | | (4,617,092 | ) | | | (1,878,974 | ) | | | (2,347,563 | ) |
| Class C | | | | | | | | | | | | | | | | |
| Proceeds from shares sold | | | 1,211,811 | | | | 337,050 | | | | 170,318 | | | | 26,637 | |
| Reinvested distributions | | | 74,816 | | | | 22,545 | | | | — | | | | — | |
| Payments for shares redeemed | | | (1,706,468 | ) | | | (2,675,528 | ) | | | (159,088 | ) | | | (416,121 | ) |
| Change in Net Assets from Class C Share Transactions | | | (419,841 | ) | | | (2,315,933 | ) | | | 11,230 | | | | (389,484 | ) |
| Class I | | | | | | | | | | | | | | | | |
| Proceeds from shares sold | | | 12,580,946 | | | | 9,265,199 | | | | 3,366,779 | | | | 6,274,914 | |
| Reinvested distributions | | | 923,625 | | | | 199,412 | | | | 33,376 | | | | — | |
| Payments for shares redeemed | | | (9,043,871 | ) | | | (10,164,233 | ) | | | (2,506,021 | ) | | | (4,235,885 | ) |
| Change in Net Assets from Class I Share Transactions | | | 4,460,700 | | | | (699,622 | ) | | | 894,134 | | | | 2,039,029 | |
| Class Y | | | | | | | | | | | | | | | | |
| Proceeds from shares sold | | | 5,653,805 | | | | 3,053,268 | | | | — | | | | — | |
| Reinvested distributions | | | 129,874 | | | | 43,120 | | | | — | | | | — | |
| Payments for shares redeemed | | | (3,632,704 | ) | | | (2,915,185 | ) | | | — | | | | — | |
| Change in Net Assets from Class Y Share Transactions | | | 2,150,975 | | | | 181,203 | | | | — | | | | — | |
| Change in net assets from capital transactions: | | $ | 11,842,542 | | | $ | (7,451,444 | ) | | $ | (973,610 | ) | | $ | (698,018 | ) |
| Share Transactions: | | | | | | | | | | | | | | | | |
| Class A | | | | | | | | | | | | | | | | |
| Issued | | | 524,342 | | | | 74,189 | | | | 72,547 | | | | 38,076 | |
| Reinvested | | | 17,013 | | | | 1,413 | | | �� | — | | | | — | |
| Redeemed | | | (288,383 | ) | | | (319,805 | ) | | | (157,516 | ) | | | (156,225 | ) |
| Change in shares outstanding | | | 252,972 | | | | (244,203 | ) | | | (84,969 | ) | | | (118,149 | ) |
| Class C | | | | | | | | | | | | | | | | |
| Issued | | | 56,134 | | | | 17,469 | | | | 8,111 | | | | 1,459 | |
| Reinvested | | | 3,396 | | | | 1,095 | | | | — | | | | — | |
| Redeemed | | | (79,274 | ) | | | (140,871 | ) | | | (7,334 | ) | | | (24,053 | ) |
| Change in shares outstanding | | | (19,744 | ) | | | (122,307 | ) | | | 777 | | | | (22,594 | ) |
| Class I | | | | | | | | | | | | | | | | |
| Issued | | | 549,585 | | | | 465,598 | | | | 143,684 | | | | 363,822 | |
| Reinvested | | | 39,437 | | | | 9,224 | | | | 1,342 | | | | — | |
| Redeemed | | | (395,655 | ) | | | (520,536 | ) | | | (108,534 | ) | | | (233,586 | ) |
| Change in shares outstanding | | | 193,367 | | | | (45,714 | ) | | | 36,492 | | | | 130,236 | |
| Class Y | | | | | | | | | | | | | | | | |
| Issued | | | 236,990 | | | | 146,533 | | | | — | | | | — | |
| Reinvested | | | 5,534 | | | | 1,993 | | | | — | | | | — | |
| Redeemed | | | (157,561 | ) | | | (145,874 | ) | | | — | | | | — | |
| Change in shares outstanding | | | 84,963 | | | | 2,652 | | | | — | | | | — | |
| Change in total shares outstanding | | | 511,558 | | | | (409,572 | ) | | | (47,700 | ) | | | (10,507 | ) |
See accompanying Notes to Financial Statements.
DIAMOND HILL FUNDS | ANNUAL REPORT | DECEMBER 31, 2017 | DIAMOND-HILL.COM 101 |
Diamond Hill Funds
Statements of Changes in Net Assets
| | | Short Duration
Total Return Fund | | | Core Bond Fund | |
| | | For the year ended
December 31,
2017 | | | For the period July 5, 2016 through December 31, 2016(A) | | | For the year ended
December 31,
2017 | | | For the period July 5, 2016 through December 31, 2016(A) | |
| From Operations | | | | | | | | | | | | |
| Net investment income | | $ | 8,849,902 | | | $ | 1,566,326 | | | $ | 1,031,854 | | | $ | 277,147 | |
| Net realized gains (losses) on security sales | | | 1,174,769 | | | | 40,209 | | | | 59,298 | | | | (2,090 | ) |
| Net change in unrealized appreciation (depreciation) on investments | | | 1,207,100 | | | | (580,391 | ) | | | 609,589 | | | | (1,112,006 | ) |
| Change in Net Assets from Operations | | | 11,231,771 | | | | 1,026,144 | | | | 1,700,741 | | | | (836,949 | ) |
| | | | | | | | | | | | | | | | | |
| Distributions to Shareholders | | | | | | | | | | | | | | | | |
| From net investment income: | | | | | | | | | | | | | | | | |
| Class A | | | (256,909 | ) | | | (1,189 | ) | | | (65,632 | ) | | | (7,061 | ) |
| Class I | | | (1,239,565 | ) | | | (65,023 | ) | | | (232,212 | ) | | | (31,299 | ) |
| Class Y | | | (7,682,908 | ) | | | (1,613,933 | ) | | | (786,931 | ) | | | (263,372 | ) |
| From net realized gains on investments | | | | | | | | | | | | | | | | |
| Class A | | | (25,838 | ) | | | — | | | | — | | | | — | |
| Class I | | | (75,188 | ) | | | — | | | | — | | | | — | |
| Class Y | | | (289,271 | ) | | | — | | | | — | | | | — | |
| Change in Net Assets from Distributions to Shareholders | | | (9,569,679 | ) | | | (1,680,145 | ) | | | (1,084,775 | ) | | | (301,732 | ) |
| Change in net assets from capital transactions | | | 113,818,751 | | | | 198,110,463 | | | | 3,523,989 | | | | 40,822,195 | |
| | | | | | | | | | | | | | | | | |
| Total Change in Net Assets | | | 115,480,843 | | | | 197,456,462 | | | | 4,139,955 | | | | 39,683,514 | |
| | | | | | | | | | | | | | | | | |
| Net Assets: | | | | | | | | | | | | | | | | |
| Beginning of period | | | 197,456,462 | | | | — | | | | 39,683,514 | | | | — | |
| End of period | | $ | 312,937,305 | | | $ | 197,456,462 | | | $ | 43,823,469 | | | $ | 39,683,514 | |
| Accumulated Net Investment Income | | $ | 77,599 | | | $ | 38,511 | | | $ | 3,751 | | | $ | 4,784 | |
(A) | Inception date of the Fund is July 5, 2016. |
See accompanying Notes to Financial Statements.
102 DIAMOND HILL FUNDS | ANNUAL REPORT | DECEMBER 31, 2017 | DIAMOND-HILL.COM |
Diamond Hill Funds
Statements of Changes in Net Assets
| | | Short Duration
Total Return Fund | | | Core Bond Fund | |
| | | For the year ended
December 31,
2017 | | | For the period July 5, 2016 through December 31, 2016(A) | | | For the year ended
December 31,
2017 | | | For the period July 5, 2016 through December 31, 2016(A) | |
| Capital Transactions | | | | | | | | | | | | |
| Class A | | | | | | | | | | | | |
| Proceeds from shares sold | | $ | 20,314,417 | | | $ | 228,084 | | | $ | 1,517,609 | | | $ | 2,216,556 | |
| Reinvested distributions | | | 279,855 | | | | 1,189 | | | | 65,510 | | | | 7,061 | |
| Payments for shares redeemed | | | (229,746 | ) | | | (5,926 | ) | | | (320,470 | ) | | | (11,897 | ) |
| Change in Net Assets from Class A Share Transactions | | | 20,364,526 | | | | 223,347 | | | | 1,262,649 | | | | 2,211,720 | |
| Class I | | | | | | | | | | | | | | | | |
| Proceeds from shares sold | | | 57,643,231 | | | | 14,718,632 | | | | 1,676,150 | | | | 8,234,987 | |
| Reinvested distributions | | | 1,130,737 | | | | 41,870 | | | | 230,965 | | | | 31,219 | |
| Payments for shares redeemed | | | (12,402,283 | ) | | | (11,054 | ) | | | (458,620 | ) | | | (93,888 | ) |
| Change in Net Assets from Class I Share Transactions | | | 46,371,685 | | | | 14,749,448 | | | | 1,448,495 | | | | 8,172,318 | |
| Class Y | | | | | | | | | | | | | | | | |
| Proceeds from shares sold | | | 85,196,939 | | | | 194,969,190 | | | | 99,000 | | | | 30,174,797 | |
| Reinvested distributions | | | 7,972,179 | | | | 1,613,934 | | | | 786,931 | | | | 263,372 | |
| Payments for shares redeemed | | | (46,086,578 | ) | | | (13,445,456 | ) | | | (73,086 | ) | | | (12 | ) |
| Change in Net Assets from Class Y Share Transactions | | | 47,082,540 | | | | 183,137,668 | | | | 812,845 | | | | 30,438,157 | |
| Change in net assets from capital transactions: | | $ | 113,818,751 | | | $ | 198,110,463 | | | $ | 3,523,989 | | | $ | 40,822,195 | |
| Share Transactions: | | | | | | | | | | | | | | | | |
| Class A | | | | | | | | | | | | | | | | |
| Issued | | | 2,002,547 | | | | 22,616 | | | | 154,214 | | | | 225,529 | |
| Reinvested | | | 27,636 | | | | 118 | | | | 6,658 | | | | 727 | |
| Redeemed | | | (22,690 | ) | | | (589 | ) | | | (32,531 | ) | | | (1,226 | ) |
| Change in shares outstanding | | | 2,007,493 | | | | 22,145 | | | | 128,341 | | | | 225,030 | |
| Class I | | | | | | | | | | | | | | | | |
| Issued | | | 5,695,476 | | | | 1,462,998 | | | | 170,393 | | | | 834,521 | |
| Reinvested | | | 111,778 | | | | 4,167 | | | | 23,482 | | | | 3,203 | |
| Redeemed | | | (1,225,484 | ) | | | (1,100 | ) | | | (46,582 | ) | | | (9,668 | ) |
| Change in shares outstanding | | | 4,581,770 | | | | 1,466,065 | | | | 147,293 | | | | 828,056 | |
| Class Y | | | | | | | | | | | | | | | | |
| Issued | | | 8,442,227 | | | | 19,367,392 | | | | 10,082 | | | | 3,010,931 | |
| Reinvested | | | 788,597 | | | | 160,459 | | | | 80,012 | | | | 26,622 | |
| Redeemed | | | (4,549,405 | ) | | | (1,336,623 | ) | | | (7,511 | ) | | | (1 | ) |
| Change in shares outstanding | | | 4,681,419 | | | | 18,191,228 | | | | 82,583 | | | | 3,037,552 | |
| Change in total shares outstanding | | | 11,270,682 | | | | 19,679,438 | | | | 358,217 | | | | 4,090,638 | |
(A) | Inception date of the Fund is July 5, 2016. |
See accompanying Notes to Financial Statements.
DIAMOND HILL FUNDS | ANNUAL REPORT | DECEMBER 31, 2017 | DIAMOND-HILL.COM 103 |
Diamond Hill Funds
Statements of Changes in Net Assets
| | | Corporate Credit Fund | | | High Yield Fund | |
| | | For the year ended
December 31,
2017 | | | For the year ended
December 31,
2016 | | | For the year ended
December 31,
2017 | | | For the period January 4, 2016 (commencement of operations) to
December 31, 2016 | |
| From Operations | | | | | | | | | | | | |
| Net investment income | | $ | 32,388,847 | | | $ | 25,250,580 | | | $ | 1,850,933 | | | $ | 1,629,135 | |
| Net realized gains on security sales | | | 3,594,371 | | | | 9,834,572 | | | | 886,142 | | | | 670,845 | |
| Net change in unrealized appreciation (depreciation) on investments | | | 8,677,351 | | | | 13,026,361 | | | | 223,959 | | | | 1,137,651 | |
| Change in Net Assets from Operations | | | 44,660,569 | | | | 48,111,513 | | | | 2,961,034 | | | | 3,437,631 | |
| | | | | | | | | | | | | | | | | |
| Distributions to Shareholders | | | | | | | | | | | | | | | | |
| From net investment income: | | | | | | | | | | | | | | | | |
| Class A | | | (3,965,873 | ) | | | (3,244,981 | ) | | | (16,068 | ) | | | (7,838 | ) |
| Class C | | | (1,225,096 | ) | | | (1,398,487 | ) | | | — | | | | — | |
| Class I | | | (26,272,760 | ) | | | (19,773,115 | ) | | | (1,022,957 | ) | | | (1,111,827 | ) |
| Class Y | | | (1,310,086 | ) | | | (1,059,453 | ) | | | (825,889 | ) | | | (499,109 | ) |
| From net realized gains on investments | | | | | | | | | | | | | | | | |
| Class A | | | (295,389 | ) | | | (40,897 | ) | | | (7,547 | ) | | | (3,755 | ) |
| Class C | | | (123,938 | ) | | | (17,233 | ) | | | — | | | | — | |
| Class I | | | (2,442,011 | ) | | | (237,746 | ) | | | (338,862 | ) | | | (495,683 | ) |
| Class Y | | | (116,600 | ) | | | (12,378 | ) | | | (367,223 | ) | | | (166,026 | ) |
| Change in Net Assets from Distributions to Shareholders | | | (35,751,753 | ) | | | (25,784,290 | ) | | | (2,578,546 | ) | | | (2,284,238 | ) |
| Change in net assets from capital transactions | | | 110,005,158 | | | | 177,592,644 | | | | (1,204,552 | ) | | | 20,629,308 | |
| | | | | | | | | | | | | | | | | |
| Total Change in Net Assets | | | 118,913,974 | | | | 199,919,867 | | | | (822,064 | ) | | | 21,782,701 | |
| | | | | | | | | | | | | | | | | |
| Net Assets: | | | | | | | | | | | | | | | | |
| Beginning of period | | | 533,457,643 | | | | 333,537,776 | | | | 31,925,733 | | | | 10,143,032 | |
| End of period | | $ | 652,371,617 | | | $ | 533,457,643 | | | $ | 31,103,669 | | | $ | 31,925,733 | |
| Accumulated Net Investment Income (Loss) | | $ | (36,540 | ) | | $ | 443,167 | | | $ | 3,955 | | | $ | 14,788 | |
See accompanying Notes to Financial Statements.
104 DIAMOND HILL FUNDS | ANNUAL REPORT | DECEMBER 31, 2017 | DIAMOND-HILL.COM |
Diamond Hill Funds
Statements of Changes in Net Assets
| | | Corporate Credit Fund | | | High Yield Fund | |
| | | For the year ended
December 31,
2017 | | | For the year ended
December 31,
2016 | | | For the year ended
December 31,
2017 | | | For the period January 4, 2016 (commencement of operations) to
December 31, 2016 | |
| Capital Transactions | | | | | | | | | | | | |
| Class A | | | | | | | | | | | | |
| Proceeds from shares sold | | $ | 32,379,322 | | | $ | 51,156,932 | | | $ | 230,678 | | | $ | 93,130 | |
| Reinvested distributions | | | 3,803,643 | | | | 2,805,818 | | | | 23,615 | | | | 11,593 | |
| Payments for shares redeemed | | | (44,425,321 | ) | | | (30,218,241 | ) | | | (143,666 | ) | | | (679 | ) |
| Change in Net Assets from Class A Share Transactions | | | (8,242,356 | ) | | | 23,744,509 | | | | 110,627 | | | | 104,044 | |
| Class C | | | | | | | | | | | | | | | | |
| Proceeds from shares sold | | | 3,493,037 | | | | 9,360,762 | | | | — | | | | — | |
| Reinvested distributions | | | 1,041,427 | | | | 982,602 | | | | — | | | | — | |
| Payments for shares redeemed | | | (7,987,804 | ) | | | (5,849,646 | ) | | | — | | | | — | |
| Change in Net Assets from Class C Share Transactions | | | (3,453,340 | ) | | | 4,493,718 | | | | — | | | | — | |
| Class I | | | | | | | | | | | | | | | | |
| Proceeds from shares sold | | | 183,507,810 | | | | 201,939,975 | | | | 7,800,470 | | | | 22,955,792 | |
| Reinvested distributions | | | 25,054,913 | | | | 18,301,131 | | | | 1,346,604 | | | | 1,579,468 | |
| Payments for shares redeemed | | | (90,498,834 | ) | | | (73,212,519 | ) | | | (19,346,390 | ) | | | (1,541,848 | ) |
| Change in Net Assets from Class I Share Transactions | | | 118,063,889 | | | | 147,028,587 | | | | (10,199,316 | ) | | | 22,993,412 | |
| Class Y | | | | | | | | | | | | | | | | |
| Proceeds from shares sold | | | 4,844,305 | | | | 7,771,293 | | | | 7,977,563 | | | | 4,147,891 | |
| Reinvested distributions | | | 1,089,270 | | | | 1,040,561 | | | | 1,193,112 | | | | 665,135 | |
| Payments for shares redeemed | | | (2,296,610 | ) | | | (6,486,024 | ) | | | (286,538 | ) | | | (7,281,174 | ) |
| Change in Net Assets from Class Y Share Transactions | | | 3,636,965 | | | | 2,325,830 | | | | 8,884,137 | | | | (2,468,148 | ) |
| Change in net assets from capital transactions: | | $ | 110,005,158 | | | $ | 177,592,644 | | | $ | (1,204,552 | ) | | $ | 20,629,308 | |
| Share Transactions: | | | | | | | | | | | | | | | | |
| Class A | | | | | | | | | | | | | | | | |
| Issued | | | 2,862,161 | | | | 4,684,422 | | | | 21,029 | | | | 8,818 | |
| Reinvested | | | 335,528 | | | | 257,278 | | | | 2,167 | | | | 1,086 | |
| Redeemed | | | (3,910,089 | ) | | | (2,766,235 | ) | | | (13,081 | ) | | | (63 | ) |
| Change in shares outstanding | | | (712,400 | ) | | | 2,175,465 | | | | 10,115 | | | | 9,841 | |
| Class C | | | | | | | | | | | | | | | | |
| Issued | | | 309,224 | | | | 865,290 | | | | — | | | | — | |
| Reinvested | | | 92,184 | | | | 90,396 | | | | — | | | | — | |
| Redeemed | | | (706,615 | ) | | | (536,288 | ) | | | — | | | | — | |
| Change in shares outstanding | | | (305,207 | ) | | | 419,398 | | | | — | | | | — | |
| Class I | | | | | | | | | | | | | | | | |
| Issued | | | 16,221,834 | | | | 18,609,874 | | | | 714,928 | | | | 2,226,794 | |
| Reinvested | | | 2,217,197 | | | | 1,682,202 | | | | 123,748 | | | | 148,080 | |
| Redeemed | | | (7,995,095 | ) | | | (6,767,554 | ) | | | (1,774,253 | ) | | | (143,247 | ) |
| Change in shares outstanding | | | 10,443,936 | | | | 13,524,522 | | | | (935,577 | ) | | | 2,231,627 | |
| Class Y | | | | | | | | | | | | | | | | |
| Issued | | | 429,260 | | | | 713,232 | | | | 731,551 | | | | 406,183 | |
| Reinvested | | | 96,447 | | | | 96,163 | | | | 109,430 | | | | 63,324 | |
| Redeemed | | | (202,630 | ) | | | (603,088 | ) | | | (25,972 | ) | | | (714,368 | ) |
| Change in shares outstanding | | | 323,077 | | | | 206,307 | | | | 815,009 | | | | (244,861 | ) |
| Change in total shares outstanding | | | 9,749,406 | | | | 16,325,692 | | | | (110,453 | ) | | | 1,996,607 | |
See accompanying Notes to Financial Statements.
DIAMOND HILL FUNDS | ANNUAL REPORT | DECEMBER 31, 2017 | DIAMOND-HILL.COM 105 |
Small Cap Fund
Financial Highlights
Selected data for a share outstanding throughout the periods indicated
| Small Cap Fund | | Net asset
value
beginning
of period | | | Net
investment
income
(loss)(A) | | | Net
realized
and
unrealized
gains
(losses) on
investments | | | Total from investment operations | | | Dividends
from net
investment
income | |
| Class A | | | | | | | | | | | | | | | |
| For the year ended December 31, 2017 | | $ | 34.39 | | | | 0.06 | | | | 3.55 | | | | 3.61 | | | | (0.13 | ) |
| For the year ended December 31, 2016 | | $ | 30.89 | | | | 0.00 | (E) | | | 4.36 | | | | 4.36 | | | | — | |
| For the year ended December 31, 2015 | | $ | 32.61 | | | | (0.05 | ) | | | (1.17 | ) | | | (1.22 | ) | | | (0.09 | ) |
| For the year ended December 31, 2014 | | $ | 32.72 | | | | (0.11 | ) | | | 1.57 | | | | 1.46 | | | | — | |
| For the year ended December 31, 2013 | | $ | 24.95 | | | | 0.00 | (E) | | | 9.86 | | | | 9.86 | | | | (0.03 | ) |
| | | | | | | | | | | | | | | | | | | | | |
| Class C | | | | | | | | | | | | | | | | | | | | |
| For the year ended December 31, 2017 | | $ | 30.30 | | | | (0.19 | ) | | | 3.12 | | | | 2.93 | | | | — | |
| For the year ended December 31, 2016 | | $ | 27.51 | | | | (0.23 | ) | | | 3.88 | | | | 3.65 | | | | — | |
| For the year ended December 31, 2015 | | $ | 29.23 | | | | (0.25 | ) | | | (1.06 | ) | | | (1.31 | ) | | | — | |
| For the year ended December 31, 2014 | | $ | 29.70 | | | | (0.33 | ) | | | 1.43 | | | | 1.10 | | | | — | |
| For the year ended December 31, 2013 | | $ | 22.94 | | | | (0.21 | ) | | | 9.03 | | | | 8.82 | | | | — | |
| | | | | | | | | | | | | | | | | | | | | |
| Class I | | | | | | | | | | | | | | | | | | | | |
| For the year ended December 31, 2017 | | $ | 34.87 | | | | 0.17 | | | | 3.61 | | | | 3.78 | | | | (0.25 | ) |
| For the year ended December 31, 2016 | | $ | 31.28 | | | | 0.10 | | | | 4.42 | | | | 4.52 | | | | (0.07 | ) |
| For the year ended December 31, 2015 | | $ | 33.04 | | | | 0.05 | | | | (1.20 | ) | | | (1.15 | ) | | | (0.20 | ) |
| For the year ended December 31, 2014 | | $ | 33.10 | | | | (0.02 | ) | | | 1.59 | | | | 1.57 | | | | (0.06 | ) |
| For the year ended December 31, 2013 | | $ | 25.21 | | | | 0.07 | | | | 9.98 | | | | 10.05 | | | | (0.10 | ) |
| | | | | | | | | | | | | | | | | | | | | |
| Class Y | | | | | | | | | | | | | | | | | | | | |
| For the year ended December 31, 2017 | | $ | 34.89 | | | | 0.20 | | | | 3.62 | | | | 3.82 | | | | (0.29 | ) |
| For the year ended December 31, 2016 | | $ | 31.29 | | | | 0.13 | | | | 4.43 | | | | 4.56 | | | | (0.10 | ) |
| For the year ended December 31, 2015 | | $ | 33.05 | | | | 0.12 | | | | (1.23 | ) | | | (1.11 | ) | | | (0.24 | ) |
| For the year ended December 31, 2014 | | $ | 33.09 | | | | 0.03 | | | | 1.60 | | | | 1.63 | | | | (0.10 | ) |
| For the year ended December 31, 2013 | | $ | 25.20 | | | | 0.12 | | | | 9.97 | | | | 10.09 | | | | (0.14 | ) |
(A) | Net investment income (loss) per share has been calculated using the average daily shares outstanding during the period. |
(B) | Total returns shown exclude the effect of applicable sales charges. |
(C) | The Fund's adviser has contractually agreed to waive fees in the pro-rata amount of the management fee charged by the underlying Diamond Hill Fund on each Fund's investment in such other Diamond Hill Fund. If such fee waiver had not occurred, the ratios would have been as indicated. |
See accompanying Notes to Financial Statements.
106 DIAMOND HILL FUNDS | ANNUAL REPORT | DECEMBER 31, 2017 | DIAMOND-HILL.COM |
Distributions from net
realized
gains | | | Total
distributions | | | Net asset
value
end of
period | | | Total
return(B) | | | Net assets at end
of period
(000’s) | | | Ratio
of total net
expenses
to average
net assets | | | Ratio
of total gross
expenses
to average
net assets(C) | | | Ratio
of net
investment
income
(loss) to
average
net assets | | | Portfolio
turnover
rate(D) | |
| | | | | | | | | | | | | | | | | | | | | | | | | | |
| | (2.25 | ) | | | (2.38 | ) | | $ | 35.62 | | | | 10.62 | % | | $ | 357,512 | | | | 1.27 | % | | | 1.28 | % | | | 0.11 | % | | | 7 | % |
| | (0.86 | ) | | | (0.86 | ) | | $ | 34.39 | | | | 14.10 | % | | $ | 439,681 | | | | 1.29 | % | | | 1.29 | % | | | 0.00 | %(F) | | | 15 | % |
| | (0.41 | ) | | | (0.50 | ) | | $ | 30.89 | | | | (3.73 | )% | | $ | 492,810 | | | | 1.29 | % | | | 1.29 | % | | | (0.15 | )% | | | 17 | % |
| | (1.57 | ) | | | (1.57 | ) | | $ | 32.61 | | | | 4.60 | % | | $ | 571,941 | | | | 1.30 | % | | | 1.30 | % | | | (0.34 | )% | | | 16 | % |
| | (2.06 | ) | | | (2.09 | ) | | $ | 32.72 | | | | 39.70 | % | | $ | 571,167 | | | | 1.31 | % | | | 1.31 | % | | | (0.01 | )% | | | 43 | % |
| | | | | | | | | | | | | | | | | | | | | | | | | | | | | | | | | | | |
| | | | | | | | | | | | | | | | | | | | | | | | | | | | | | | | | | | |
| | (2.25 | ) | | | (2.25 | ) | | $ | 30.98 | | | | 9.80 | % | | $ | 46,868 | | | | 2.02 | % | | | 2.03 | % | | | (0.67 | )% | | | 7 | % |
| | (0.86 | ) | | | (0.86 | ) | | $ | 30.30 | | | | 13.25 | % | | $ | 54,664 | | | | 2.04 | % | | | 2.04 | % | | | (0.75 | )% | | | 15 | % |
| | (0.41 | ) | | | (0.41 | ) | | $ | 27.51 | | | | (4.47 | )% | | $ | 57,875 | | | | 2.04 | % | | | 2.04 | % | | | (0.87 | )% | | | 17 | % |
| | (1.57 | ) | | | (1.57 | ) | | $ | 29.23 | | | | 3.86 | % | | $ | 51,794 | | | | 2.05 | % | | | 2.05 | % | | | (1.07 | )% | | | 16 | % |
| | (2.06 | ) | | | (2.06 | ) | | $ | 29.70 | | | | 38.64 | % | | $ | 46,476 | | | | 2.06 | % | | | 2.06 | % | | | (0.76 | )% | | | 43 | % |
| | | | | | | | | | | | | | | | | | | | | | | | | | | | | | | | | | | |
| | | | | | | | | | | | | | | | | | | | | | | | | | | | | | | | | | | |
| | (2.25 | ) | | | (2.50 | ) | | $ | 36.15 | | | | 10.95 | % | | $ | 877,913 | | | | 0.97 | % | | | 0.98 | % | | | 0.41 | % | | | 7 | % |
| | (0.86 | ) | | | (0.93 | ) | | $ | 34.87 | | | | 14.45 | % | | $ | 1,073,671 | | | | 0.99 | % | | | 0.99 | % | | | 0.32 | % | | | 15 | % |
| | (0.41 | ) | | | (0.61 | ) | | $ | 31.28 | | | | (3.47 | )% | | $ | 882,350 | | | | 1.02 | % | | | 1.02 | % | | | 0.16 | % | | | 17 | % |
| | (1.57 | ) | | | (1.63 | ) | | $ | 33.04 | | | | 4.86 | % | | $ | 659,199 | | | | 1.05 | % | | | 1.05 | % | | | (0.06 | )% | | | 16 | % |
| | (2.06 | ) | | | (2.16 | ) | | $ | 33.10 | | | | 40.08 | % | | $ | 550,844 | | | | 1.06 | % | | | 1.06 | % | | | 0.22 | % | | | 43 | % |
| | | | | | | | | | | | | | | | | | | | | | | | | | | | | | | | | | | |
| | | | | | | | | | | | | | | | | | | | | | | | | | | | | | | | | | | |
| | (2.25 | ) | | | (2.54 | ) | | $ | 36.17 | | | | 11.06 | % | | $ | 207,770 | | | | 0.87 | % | | | 0.88 | % | | | 0.53 | % | | | 7 | % |
| | (0.86 | ) | | | (0.96 | ) | | $ | 34.89 | | | | 14.57 | % | | $ | 221,827 | | | | 0.89 | % | | | 0.89 | % | | | 0.40 | % | | | 15 | % |
| | (0.41 | ) | | | (0.65 | ) | | $ | 31.29 | | | | (3.36 | )% | | $ | 221,624 | | | | 0.90 | % | | | 0.90 | % | | | 0.37 | % | | | 17 | % |
| | (1.57 | ) | | | (1.67 | ) | | $ | 33.05 | | | | 5.06 | % | | $ | 157,665 | | | | 0.90 | % | | | 0.90 | % | | | 0.10 | % | | | 16 | % |
| | (2.06 | ) | | | (2.20 | ) | | $ | 33.09 | | | | 40.25 | % | | $ | 101,026 | | | | 0.91 | % | | | 0.91 | % | | | 0.40 | % | | | 43 | % |
(D) | Portfolio turnover rate is calculated on the basis of the Fund as a whole without distinguishing between classes of shares issued. |
(E) | Amount is less than $0.005. |
(F) | Amount is less than 0.005%. |
See accompanying Notes to Financial Statements.
DIAMOND HILL FUNDS | ANNUAL REPORT | DECEMBER 31, 2017 | DIAMOND-HILL.COM 107 |
Small-Mid Cap Fund
Financial Highlights
Selected data for a share outstanding throughout the periods indicated
| Small-Mid Cap Fund | | Net asset
value
beginning
of period | | | Net
investment
income
(loss)(A) | | | Net
realized
and
unrealized
gains
(losses) on
investments | | | Total from investment operations | | | Dividends
from net
investment
income | |
| Class A | | | | | | | | | | | | | | | |
| For the year ended December 31, 2017 | | $ | 21.18 | | | | 0.03 | | | | 1.73 | | | | 1.76 | | | | (0.03 | ) |
| For the year ended December 31, 2016 | | $ | 18.29 | | | | 0.01 | | | | 3.25 | | | | 3.26 | | | | (0.01 | ) |
| For the year ended December 31, 2015 | | $ | 18.33 | | | | 0.01 | | | | 0.17 | | | | 0.18 | | | | (0.03 | ) |
| For the year ended December 31, 2014 | | $ | 17.73 | | | | 0.03 | | | | 1.23 | | | | 1.26 | | | | (0.02 | ) |
| For the year ended December 31, 2013 | | $ | 13.13 | | | | 0.04 | | | | 5.35 | | | | 5.39 | | | | (0.03 | ) |
| | | | | | | | | | | | | | | | | | | | | |
| Class C | | | | | | | | | | | | | | | | | | | | |
| For the year ended December 31, 2017 | | $ | 19.60 | | | | (0.13 | ) | | | 1.59 | | | | 1.46 | | | | — | |
| For the year ended December 31, 2016 | | $ | 17.06 | | | | (0.12 | ) | | | 3.02 | | | | 2.90 | | | | — | |
| For the year ended December 31, 2015 | | $ | 17.21 | | | | (0.12 | ) | | | 0.16 | | | | 0.04 | | | | — | |
| For the year ended December 31, 2014 | | $ | 16.80 | | | | (0.10 | ) | | | 1.15 | | | | 1.05 | | | | — | |
| For the year ended December 31, 2013 | | $ | 12.54 | | | | (0.07 | ) | | | 5.09 | | | | 5.02 | | | | — | |
| | | | | | | | | | | | | | | | | | | | | |
| Class I | | | | | | | | | | | | | | | | | | | | |
| For the year ended December 31, 2017 | | $ | 21.39 | | | | 0.10 | | | | 1.74 | | | | 1.84 | | | | (0.11 | ) |
| For the year ended December 31, 2016 | | $ | 18.46 | | | | 0.07 | | | | 3.29 | | | | 3.36 | | | | (0.07 | ) |
| For the year ended December 31, 2015 | | $ | 18.47 | | | | 0.07 | | | | 0.17 | | | | 0.24 | | | | (0.06 | ) |
| For the year ended December 31, 2014 | | $ | 17.87 | | | | 0.08 | | | | 1.22 | | | | 1.30 | | | | (0.06 | ) |
| For the year ended December 31, 2013 | | $ | 13.21 | | | | 0.09 | | | | 5.38 | | | | 5.47 | | | | (0.05 | ) |
| | | | | | | | | | | | | | | | | | | | | |
| Class Y | | | | | | | | | | | | | | | | | | | | |
| For the year ended December 31, 2017 | | $ | 21.42 | | | | 0.12 | | | | 1.75 | | | | 1.87 | | | | (0.13 | ) |
| For the year ended December 31, 2016 | | $ | 18.48 | | | | 0.09 | | | | 3.29 | | | | 3.38 | | | | (0.08 | ) |
| For the year ended December 31, 2015 | | $ | 18.49 | | | | 0.09 | | | | 0.17 | | | | 0.26 | | | | (0.08 | ) |
| For the year ended December 31, 2014 | | $ | 17.87 | | | | 0.11 | | | | 1.23 | | | | 1.34 | | | | (0.08 | ) |
| For the year ended December 31, 2013 | | $ | 13.20 | | | | 0.12 | | | | 5.38 | | | | 5.50 | | | | (0.07 | ) |
(A) | Net investment income (loss) per share has been calculated using the average daily shares outstanding during the period. |
(B) | Total returns shown exclude the effect of applicable sales charges. |
(C) | The Fund's adviser has contractually agreed to waive fees in the pro-rata amount of the management fee charged by the underlying Diamond Hill Fund on each Fund's investment in such other Diamond Hill Fund. If such fee waiver had not occurred, the ratios would have been as indicated. |
See accompanying Notes to Financial Statements.
108 DIAMOND HILL FUNDS | ANNUAL REPORT | DECEMBER 31, 2017 | DIAMOND-HILL.COM |
Distributions from net
realized
gains | | | Total
distributions | | | Net asset
value
end of
period | | | Total
return(B) | | | Net assets at end
of period
(000’s) | | | Ratio
of total net
expenses
to average
net assets | | | Ratio
of total gross
expenses
to average
net assets(C) | | | Ratio
of net
investment
income
(loss) to
average
net assets | | | Portfolio
turnover
rate(D) | |
| | | | | | | | | | | | | | | | | | | | | | | | | | |
| | (0.67 | ) | | | (0.70 | ) | | $ | 22.24 | | | | 8.35 | % | | $ | 229,411 | | | | 1.22 | % | | | 1.23 | % | | | 0.09 | % | | | 15 | % |
| | (0.36 | ) | | | (0.37 | ) | | $ | 21.18 | | | | 17.81 | % | | $ | 288,634 | | | | 1.24 | % | | | 1.24 | % | | | 0.12 | % | | | 17 | % |
| | (0.19 | ) | | | (0.22 | ) | | $ | 18.29 | | | | 0.98 | % | | $ | 156,122 | | | | 1.24 | % | | | 1.24 | % | | | 0.06 | % | | | 21 | % |
| | (0.64 | ) | | | (0.66 | ) | | $ | 18.33 | | | | 7.17 | % | | $ | 100,820 | | | | 1.25 | % | | | 1.25 | % | | | 0.18 | % | | | 27 | % |
| | (0.76 | ) | | | (0.79 | ) | | $ | 17.73 | | | | 41.25 | % | | $ | 61,563 | | | | 1.26 | % | | | 1.26 | % | | | 0.27 | % | | | 35 | % |
| | | | | | | | | | | | | | | | | | | | | | | | | | | | | | | | | | | |
| | | | | | | | | | | | | | | | | | | | | | | | | | | | | | | | | | | |
| | (0.67 | ) | | | (0.67 | ) | | $ | 20.39 | | | | 7.49 | % | | $ | 37,472 | | | | 1.97 | % | | | 1.98 | % | | | (0.66 | )% | | | 15 | % |
| | (0.36 | ) | | | (0.36 | ) | | $ | 19.60 | | | | 16.98 | % | | $ | 42,875 | | | | 1.99 | % | | | 1.99 | % | | | (0.65 | )% | | | 17 | % |
| | (0.19 | ) | | | (0.19 | ) | | $ | 17.06 | | | | 0.24 | % | | $ | 32,963 | | | | 1.99 | % | | | 1.99 | % | | | (0.69 | )% | | | 21 | % |
| | (0.64 | ) | | | (0.64 | ) | | $ | 17.21 | | | | 6.33 | % | | $ | 25,276 | | | | 2.00 | % | | | 2.00 | % | | | (0.59 | )% | | | 27 | % |
| | (0.76 | ) | | | (0.76 | ) | | $ | 16.80 | | | | 40.21 | % | | $ | 19,184 | | | | 2.01 | % | | | 2.01 | % | | | (0.45 | )% | | | 35 | % |
| | | | | | | | | | | | | | | | | | | | | | | | | | | | | | | | | | | |
| | | | | | | | | | | | | | | | | | | | | | | | | | | | | | | | | | | |
| | (0.67 | ) | | | (0.78 | ) | | $ | 22.45 | | | | 8.63 | % | | $ | 1,114,337 | | | | 0.92 | % | | | 0.93 | % | | | 0.41 | % | | | 15 | % |
| | (0.36 | ) | | | (0.43 | ) | | $ | 21.39 | | | | 18.18 | % | | $ | 1,015,403 | | | | 0.94 | % | | | 0.94 | % | | | 0.41 | % | | | 17 | % |
| | (0.19 | ) | | | (0.25 | ) | | $ | 18.46 | | | | 1.32 | % | | $ | 506,730 | | | | 0.97 | % | | | 0.97 | % | | | 0.35 | % | | | 21 | % |
| | (0.64 | ) | | | (0.70 | ) | | $ | 18.47 | | | | 7.36 | % | | $ | 264,824 | | | | 1.00 | % | | | 1.00 | % | | | 0.42 | % | | | 27 | % |
| | (0.76 | ) | | | (0.81 | ) | | $ | 17.87 | | | | 41.64 | % | | $ | 148,927 | | | | 1.01 | % | | | 1.01 | % | | | 0.54 | % | | | 35 | % |
| | | | | | | | | | | | | | | | | | | | | | | | | | | | | | | | | | | |
| | | | | | | | | | | | | | | | | | | | | | | | | | | | | | | | | | | |
| | (0.67 | ) | | | (0.80 | ) | | $ | 22.49 | | | | 8.77 | % | | $ | 1,131,583 | | | | 0.82 | % | | | 0.83 | % | | | 0.51 | % | | | 15 | % |
| | (0.36 | ) | | | (0.44 | ) | | $ | 21.42 | | | | 18.29 | % | | $ | 961,721 | | | | 0.84 | % | | | 0.84 | % | | | 0.49 | % | | | 17 | % |
| | (0.19 | ) | | | (0.27 | ) | | $ | 18.48 | | | | 1.41 | % | | $ | 602,951 | | | | 0.85 | % | | | 0.85 | % | | | 0.48 | % | | | 21 | % |
| | (0.64 | ) | | | (0.72 | ) | | $ | 18.49 | | | | 7.60 | % | | $ | 300,815 | | | | 0.85 | % | | | 0.85 | % | | | 0.62 | % | | | 27 | % |
| | (0.76 | ) | | | (0.83 | ) | | $ | 17.87 | | | | 41.88 | % | | $ | 106,068 | | | | 0.86 | % | | | 0.86 | % | | | 0.73 | % | �� | | 35 | % |
(D) | Portfolio turnover rate is calculated on the basis of the Fund as a whole without distinguishing between classes of shares issued. |
See accompanying Notes to Financial Statements.
DIAMOND HILL FUNDS | ANNUAL REPORT | DECEMBER 31, 2017 | DIAMOND-HILL.COM 109 |
Mid Cap Fund
Financial Highlights
Selected data for a share outstanding throughout the periods indicated
Mid Cap Fund(A) | | Net asset
value
beginning
of period | | | Net
investment
income
(loss)(B) | | | Net
realized
and
unrealized
gains
(losses) on
investments | | | Total from investment operations | | | Dividends
from net
investment
income | |
| Class A | | | | | | | | | | | | | | | |
| For the year ended December 31, 2017 | | $ | 12.59 | | | | 0.04 | | | | 1.23 | | | | 1.27 | | | | (0.03 | ) |
| For the year ended December 31, 2016 | | $ | 10.71 | | | | 0.03 | | | | 1.93 | | | | 1.96 | | | | (0.02 | ) |
| For the year ended December 31, 2015 | | $ | 10.70 | | | | 0.04 | | | | 0.01 | | | | 0.05 | | | | (0.04 | ) |
| For the year ended December 31, 2014 | | $ | 10.00 | | | | 0.06 | | | | 0.70 | | | | 0.76 | | | | (0.06 | ) |
| | | | | | | | | | | | | | | | | | | | | |
| Class I | | | | | | | | | | | | | | | | | | | | |
| For the year ended December 31, 2017 | | $ | 12.62 | | | | 0.08 | | | | 1.24 | | | | 1.32 | | | | (0.07 | ) |
| For the year ended December 31, 2016 | | $ | 10.74 | | | | 0.07 | | | | 1.92 | | | | 1.99 | | | | (0.05 | ) |
| For the year ended December 31, 2015 | | $ | 10.72 | | | | 0.07 | | | | 0.01 | | | | 0.08 | | | | (0.06 | ) |
| For the year ended December 31, 2014 | | $ | 10.00 | | | | 0.09 | | | | 0.70 | | | | 0.79 | | | | (0.07 | ) |
| | | | | | | | | | | | | | | | | | | | | |
| Class Y | | | | | | | | | | | | | | | | | | | | |
| For the year ended December 31, 2017 | | $ | 12.65 | | | | 0.09 | | | | 1.24 | | | | 1.33 | | | | (0.08 | ) |
| For the year ended December 31, 2016 | | $ | 10.75 | | | | 0.08 | | | | 1.94 | | | | 2.02 | | | | (0.06 | ) |
| For the year ended December 31, 2015 | | $ | 10.73 | | | | 0.08 | | | | 0.01 | | | | 0.09 | | | | (0.07 | ) |
| For the year ended December 31, 2014 | | $ | 10.00 | | | | 0.09 | | | | 0.71 | | | | 0.80 | | | | (0.07 | ) |
(A) | Inception date of the Fund is December 31, 2013. Fund commenced public offering on January 2, 2014. |
(B) | Net investment income (loss) per share has been calculated using the average daily shares outstanding during the period. |
(C) | Total returns shown exclude the effect of applicable sales charges. |
See accompanying Notes to Financial Statements.
110 DIAMOND HILL FUNDS | ANNUAL REPORT | DECEMBER 31, 2017 | DIAMOND-HILL.COM |
Distributions from net
realized
gains | | | Total
distributions | | | Net asset
value
end of
period | | | Total
return(C) | | | Net assets at end
of period
(000’s) | | | Ratio
of total net
expenses
to average
net assets | | | Ratio
of total gross
expenses
to average
net assets(D) | | | Ratio
of net
investment
income
(loss) to
average
net assets | | | Portfolio
turnover
rate(E) | |
| | | | | | | | | | | | | | | | | | | | | | | | | | |
| | (0.17 | ) | | | (0.20 | ) | | $ | 13.66 | | | | 10.13 | % | | $ | 25,853 | | | | 1.07 | % | | | 1.08 | % | | | 0.28 | % | | | 11 | % |
| | (0.06 | ) | | | (0.08 | ) | | $ | 12.59 | | | | 18.29 | % | | $ | 7,403 | | | | 1.14 | % | | | 1.14 | % | | | 0.31 | % | | | 17 | % |
| | — | | | | (0.04 | ) | | $ | 10.71 | | | | 0.44 | % | | $ | 3,082 | | | | 1.14 | % | | | 1.14 | % | | | 0.35 | % | | | 29 | % |
| | — | | | | (0.06 | ) | | $ | 10.70 | | | | 7.57 | % | | $ | 2,120 | | | | 1.15 | % | | | 1.15 | % | | | 0.59 | % | | | 28 | % |
| | | | | | | | | | | | | | | | | | | | | | | | | | | | | | | | | | | |
| | | | | | | | | | | | | | | | | | | | | | | | | | | | | | | | | | | |
| | (0.17 | ) | | | (0.24 | ) | | $ | 13.70 | | | | 10.47 | % | | $ | 63,298 | | | | 0.77 | % | | | 0.79 | % | | | 0.57 | % | | | 11 | % |
| | (0.06 | ) | | | (0.11 | ) | | $ | 12.62 | | | | 18.56 | % | | $ | 28,031 | | | | 0.85 | % | | | 0.85 | % | | | 0.67 | % | | | 17 | % |
| | — | | | | (0.06 | ) | | $ | 10.74 | | | | 0.74 | % | | $ | 3,337 | | | | 0.87 | % | | | 0.87 | % | | | 0.61 | % | | | 29 | % |
| | — | | | | (0.07 | ) | | $ | 10.72 | | | | 7.91 | % | | $ | 2,743 | | | | 0.90 | % | | | 0.90 | % | | | 0.87 | % | | | 28 | % |
| | | | | | | | | | | | | | | | | | | | | | | | | | | | | | | | | | | |
| | | | | | | | | | | | | | | | | | | | | | | | | | | | | | | | | | | |
| | (0.17 | ) | | | (0.25 | ) | | $ | 13.73 | | | | 10.51 | % | | $ | 32,943 | | | | 0.67 | % | | | 0.68 | % | | | 0.65 | % | | | 11 | % |
| | (0.06 | ) | | | (0.12 | ) | | $ | 12.65 | | | | 18.76 | % | | $ | 23,383 | | | | 0.75 | % | | | 0.75 | % | | | 0.71 | % | | | 17 | % |
| | — | | | | (0.07 | ) | | $ | 10.75 | | | | 0.84 | % | | $ | 12,077 | | | | 0.75 | % | | | 0.75 | % | | | 0.72 | % | | | 29 | % |
| | — | | | | (0.07 | ) | | $ | 10.73 | | | | 8.02 | % | | $ | 11,419 | | | | 0.75 | % | | | 0.75 | % | | | 0.87 | % | | | 28 | % |
(D) | The Fund's adviser has contractually agreed to waive fees in the pro-rata amount of the management fee charged by the underlying Diamond Hill Fund on each Fund's investment in such other Diamond Hill Fund. If such fee waiver had not occurred, the ratios would have been as indicated. |
(E) | Portfolio turnover rate is calculated on the basis of the Fund as a whole without distinguishing between classes of shares issued. |
See accompanying Notes to Financial Statements.
DIAMOND HILL FUNDS | ANNUAL REPORT | DECEMBER 31, 2017 | DIAMOND-HILL.COM 111 |
Large Cap Fund
Financial Highlights
Selected data for a share outstanding throughout the periods indicated
| Large Cap Fund | | Net asset
value
beginning
of period | | | Net
investment
income(A) | | | Net
realized
and
unrealized
gains
(losses) on
investments | | | Total from investment operations | | | Dividends
from net
investment
income | |
| Class A | | | | | | | | | | | | | | | |
| For the year ended December 31, 2017 | | $ | 23.06 | | | | 0.24 | | | | 4.35 | | | | 4.59 | | | | (0.20 | ) |
| For the year ended December 31, 2016 | | $ | 21.44 | | | | 0.25 | | | | 2.82 | | | | 3.07 | | | | (0.24 | ) |
| For the year ended December 31, 2015 | | $ | 22.71 | | | | 0.19 | | | | (0.43 | ) | | | (0.24 | ) | | | (0.18 | ) |
| For the year ended December 31, 2014 | | $ | 21.49 | | | | 0.21 | | | | 2.01 | | | | 2.22 | | | | (0.19 | ) |
| For the year ended December 31, 2013 | | $ | 16.54 | | | | 0.18 | | | | 5.79 | | | | 5.97 | | | | (0.16 | ) |
| | | | | | | | | | | | | | | | | | | | | |
| Class C | | | | | | | | | | | | | | | | | | | | |
| For the year ended December 31, 2017 | | $ | 21.94 | | | | 0.05 | | | | 4.12 | | | | 4.17 | | | | (0.04 | ) |
| For the year ended December 31, 2016 | | $ | 20.49 | | | | 0.08 | | | | 2.68 | | | | 2.76 | | | | (0.10 | ) |
| For the year ended December 31, 2015 | | $ | 21.77 | | | | 0.02 | | | | (0.41 | ) | | | (0.39 | ) | | | (0.04 | ) |
| For the year ended December 31, 2014 | | $ | 20.68 | | | | 0.04 | | | | 1.93 | | | | 1.97 | | | | (0.07 | ) |
| For the year ended December 31, 2013 | | $ | 15.98 | | | | 0.03 | | | | 5.58 | | | | 5.61 | | | | (0.05 | ) |
| | | | | | | | | | | | | | | | | | | | | |
| Class I | | | | | | | | | | | | | | | | | | | | |
| For the year ended December 31, 2017 | | $ | 23.20 | | | | 0.32 | | | | 4.38 | | | | 4.70 | | | | (0.28 | ) |
| For the year ended December 31, 2016 | | $ | 21.55 | | | | 0.31 | | | | 2.86 | | | | 3.17 | | | | (0.31 | ) |
| For the year ended December 31, 2015 | | $ | 22.83 | | | | 0.25 | | | | (0.44 | ) | | | (0.19 | ) | | | (0.24 | ) |
| For the year ended December 31, 2014 | | $ | 21.58 | | | | 0.27 | | | | 2.03 | | | | 2.30 | | | | (0.24 | ) |
| For the year ended December 31, 2013 | | $ | 16.61 | | | | 0.24 | | | | 5.80 | | | | 6.04 | | | | (0.21 | ) |
| | | | | | | | | | | | | | | | | | | | | |
| Class Y | | | | | | | | | | | | | | | | | | | | |
| For the year ended December 31, 2017 | | $ | 23.21 | | | | 0.35 | | | | 4.38 | | | | 4.73 | | | | (0.30 | ) |
| For the year ended December 31, 2016 | | $ | 21.56 | | | | 0.34 | | | | 2.85 | | | | 3.19 | | | | (0.33 | ) |
| For the year ended December 31, 2015 | | $ | 22.84 | | | | 0.28 | | | | (0.44 | ) | | | (0.16 | ) | | | (0.27 | ) |
| For the year ended December 31, 2014 | | $ | 21.59 | | | | 0.31 | | | | 2.02 | | | | 2.33 | | | | (0.27 | ) |
| For the year ended December 31, 2013 | | $ | 16.60 | | | | 0.26 | | | | 5.83 | | | | 6.09 | | | | (0.24 | ) |
(A) | Net investment income per share has been calculated using the average daily shares outstanding during the period. |
(B) | Total returns shown exclude the effect of applicable sales charges. |
See accompanying Notes to Financial Statements.
112 DIAMOND HILL FUNDS | ANNUAL REPORT | DECEMBER 31, 2017 | DIAMOND-HILL.COM |
Distributions from net
realized
gains | | | Total
distributions | | | Net asset
value
end of
period | | | Total
return(B) | | | Net assets at end
of period
(000’s) | | | Ratio
of total
expenses
to average
net assets | | | Ratio
of net
investment
income to
average
net assets | | | Portfolio
turnover
rate(C) | |
| | | | | | | | | | | | | | | | | | | | | | | |
| | (1.00 | ) | | | (1.20 | ) | | $ | 26.45 | | | | 19.95 | % | | $ | 1,346,869 | | | | 0.98 | % | | | 0.96 | % | | | 18 | % |
| | (1.21 | ) | | | (1.45 | ) | | $ | 23.06 | | | | 14.26 | % | | $ | 1,158,652 | | | | 0.99 | % | | | 1.12 | % | | | 23 | % |
| | (0.85 | ) | | | (1.03 | ) | | $ | 21.44 | | | | (1.10 | )% | | $ | 1,122,165 | | | | 1.04 | % | | | 0.85 | % | | | 20 | % |
| | (0.81 | ) | | | (1.00 | ) | | $ | 22.71 | | | | 10.42 | % | | $ | 1,182,155 | | | | 1.05 | % | | | 0.94 | % | | | 24 | % |
| | (0.86 | ) | | | (1.02 | ) | | $ | 21.49 | | | | 36.33 | % | | $ | 878,903 | | | | 1.06 | % | | | 0.92 | % | | | 21 | % |
| | | | | | | | | | | | | | | | | | | | | | | | | | | | | | | |
| | | | | | | | | | | | | | | | | | | | | | | | | | | | | | | |
| | (1.00 | ) | | | (1.04 | ) | | $ | 25.07 | | | | 19.04 | % | | $ | 115,257 | | | | 1.73 | % | | | 0.21 | % | | | 18 | % |
| | (1.21 | ) | | | (1.31 | ) | | $ | 21.94 | | | | 13.40 | % | | $ | 95,923 | | | | 1.74 | % | | | 0.37 | % | | | 23 | % |
| | (0.85 | ) | | | (0.89 | ) | | $ | 20.49 | | | | (1.83 | )% | | $ | 84,550 | | | | 1.79 | % | | | 0.10 | % | | | 20 | % |
| | (0.81 | ) | | | (0.88 | ) | | $ | 21.77 | | | | 9.60 | % | | $ | 83,781 | | | | 1.80 | % | | | 0.19 | % | | | 24 | % |
| | (0.86 | ) | | | (0.91 | ) | | $ | 20.68 | | | | 35.33 | % | | $ | 53,241 | | | | 1.81 | % | | | 0.18 | % | | | 21 | % |
| | | | | | | | | | | | | | | | | | | | | | | | | | | | | | | |
| | | | | | | | | | | | | | | | | | | | | | | | | | | | | | | |
| | (1.00 | ) | | | (1.28 | ) | | $ | 26.62 | | | | 20.30 | % | | $ | 3,538,859 | | | | 0.68 | % | | | 1.25 | % | | | 18 | % |
| | (1.21 | ) | | | (1.52 | ) | | $ | 23.20 | | | | 14.63 | % | | $ | 2,156,390 | | | | 0.70 | % | | | 1.41 | % | | | 23 | % |
| | (0.85 | ) | | | (1.09 | ) | | $ | 21.55 | | | | (0.85 | )% | | $ | 1,803,130 | | | | 0.77 | % | | | 1.11 | % | | | 20 | % |
| | (0.81 | ) | | | (1.05 | ) | | $ | 22.83 | | | | 10.74 | % | | $ | 1,606,797 | | | | 0.80 | % | | | 1.20 | % | | | 24 | % |
| | (0.86 | ) | | | (1.07 | ) | | $ | 21.58 | | | | 36.60 | % | | $ | 1,295,477 | | | | 0.81 | % | | | 1.18 | % | | | 21 | % |
| | | | | | | | | | | | | | | | | | | | | | | | | | | | | | | |
| | | | | | | | | | | | | | | | | | | | | | | | | | | | | | | |
| | (1.00 | ) | | | (1.30 | ) | | $ | 26.64 | | | | 20.42 | % | | $ | 845,457 | | | | 0.58 | % | | | 1.36 | % | | | 18 | % |
| | (1.21 | ) | | | (1.54 | ) | | $ | 23.21 | | | | 14.74 | % | | $ | 666,756 | | | | 0.60 | % | | | 1.49 | % | | | 23 | % |
| | (0.85 | ) | | | (1.12 | ) | | $ | 21.56 | | | | (0.74 | )% | | $ | 430,568 | | | | 0.65 | % | | | 1.23 | % | | | 20 | % |
| | (0.81 | ) | | | (1.08 | ) | | $ | 22.84 | | | | 10.89 | % | | $ | 373,711 | | | | 0.65 | % | | | 1.36 | % | | | 24 | % |
| | (0.86 | ) | | | (1.10 | ) | | $ | 21.59 | | | | 36.87 | % | | $ | 302,458 | | | | 0.66 | % | | | 1.32 | % | | | 21 | % |
(C) | Portfolio turnover rate is calculated on the basis of the Fund as a whole without distinguishing between classes of shares issued. |
See accompanying Notes to Financial Statements.
DIAMOND HILL FUNDS | ANNUAL REPORT | DECEMBER 31, 2017 | DIAMOND-HILL.COM 113 |
All Cap Select Fund
Financial Highlights
Selected data for a share outstanding throughout the periods indicated
| All Cap Select Fund | | Net asset
value
beginning
of period | | | Net
investment
income
(loss)(A) | | | Net
realized
and
unrealized
gains
(losses) on
investments | | | Total from investment operations | | | Dividends
from net
investment
income | |
| Class A | | | | | | | | | | | | | | | |
| For the year ended December 31, 2017 | | $ | 13.35 | | | | 0.03 | | | | 2.63 | | | | 2.66 | | | | — | |
| For the year ended December 31, 2016 | | $ | 12.36 | | | | (0.01 | ) | | | 1.17 | | | | 1.16 | | | | — | |
| For the year ended December 31, 2015 | | $ | 12.96 | | | | 0.00 | (E) | | | (0.19 | ) | | | (0.19 | ) | | | — | |
| For the year ended December 31, 2014 | | $ | 13.00 | | | | 0.05 | | | | 1.38 | | | | 1.43 | | | | (0.05 | ) |
| For the year ended December 31, 2013 | | $ | 10.45 | | | | 0.05 | | | | 4.48 | | | | 4.53 | | | | (0.09 | ) |
| | | | | | | | | | | | | | | | | | | | | |
| Class C | | | | | | | | | | | | | | | | | | | | |
| For the year ended December 31, 2017 | | $ | 12.69 | | | | (0.07 | ) | | | 2.49 | | | | 2.42 | | | | — | |
| For the year ended December 31, 2016 | | $ | 11.85 | | | | (0.09 | ) | | | 1.10 | | | | 1.01 | | | | — | |
| For the year ended December 31, 2015 | | $ | 12.54 | | | | (0.10 | ) | | | (0.18 | ) | | | (0.28 | ) | | | — | |
| For the year ended December 31, 2014 | | $ | 12.67 | | | | (0.05 | ) | | | 1.34 | | | | 1.29 | | | | — | |
| For the year ended December 31, 2013 | | $ | 10.25 | | | | (0.04 | ) | | | 4.38 | | | | 4.34 | | | | (0.03 | ) |
| | | | | | | | | | | | | | | | | | | | | |
| Class I | | | | | | | | | | | | | | | | | | | | |
| For the year ended December 31, 2017 | | $ | 13.40 | | | | 0.07 | | | | 2.65 | | | | 2.72 | | | | (0.01 | ) |
| For the year ended December 31, 2016 | | $ | 12.39 | | | | 0.03 | | | | 1.16 | | | | 1.19 | | | | (0.01 | ) |
| For the year ended December 31, 2015 | | $ | 12.95 | | | | 0.03 | | | | (0.18 | ) | | | (0.15 | ) | | | — | |
| For the year ended December 31, 2014 | | $ | 12.97 | | | | 0.09 | | | | 1.38 | | | | 1.47 | | | | (0.07 | ) |
| For the year ended December 31, 2013 | | $ | 10.43 | | | | 0.09 | | | | 4.46 | | | | 4.55 | | | | (0.12 | ) |
| | | | | | | | | | | | | | | | | | | | | |
| Class Y | | | | | | | | | | | | | | | | | | | | |
| For the year ended December 31, 2017 | | $ | 13.42 | | | | 0.09 | | | | 2.65 | | | | 2.74 | | | | (0.02 | ) |
| For the year ended December 31, 2016 | | $ | 12.41 | | | | 0.04 | | | | 1.17 | | | | 1.21 | | | | (0.03 | ) |
| For the year ended December 31, 2015 | | $ | 12.96 | | | | 0.05 | | | | (0.19 | ) | | | (0.14 | ) | | | — | |
| For the year ended December 31, 2014 | | $ | 12.99 | | | | 0.10 | | | | 1.39 | | | | 1.49 | | | | (0.10 | ) |
| For the year ended December 31, 2013 | | $ | 10.43 | | | | 0.11 | | | | 4.48 | | | | 4.59 | | | | (0.14 | ) |
(A) | Net investment income (loss) per share has been calculated using the average daily shares outstanding during the period. |
(B) | Total returns shown exclude the effect of applicable sales charges. |
(C) | The Fund's adviser has contractually agreed to waive fees in the pro-rata amount of the management fee charged by the underlying Diamond Hill Fund on each Fund's investment in such other Diamond Hill Fund. If such fee waiver had not occurred, the ratios would have been as indicated. |
See accompanying Notes to Financial Statements.
114 DIAMOND HILL FUNDS | ANNUAL REPORT | DECEMBER 31, 2017 | DIAMOND-HILL.COM |
Distributions from net
realized
gains | | | Total
distributions | | | Net asset
value
end of
period | | | Total
return(B) | | | Net assets at end
of period
(000’s) | | | Ratio
of total net
expenses
to average
net assets | | | Ratio
of total gross
expenses
to average
net assets(C) | | | Ratio
of net
investment
income
(loss) to
average
net assets | | | Portfolio
turnover
rate(D) | |
| | | | | | | | | | | | | | | | | | | | | | | | | | |
| | — | | | | — | | | $ | 16.01 | | | | 19.93 | % | | $ | 13,480 | | | | 1.17 | % | | | 1.18 | % | | | 0.21 | % | | | 52 | % |
| | (0.17 | ) | | | (0.17 | ) | | $ | 13.35 | | | | 9.37 | % | | $ | 14,963 | | | | 1.19 | % | | | 1.19 | % | | | (0.09 | )% | | | 70 | % |
| | (0.41 | ) | | | (0.41 | ) | | $ | 12.36 | | | | (1.44 | )% | | $ | 43,638 | | | | 1.19 | % | | | 1.19 | % | | | (0.01 | )% | | | 89 | % |
| | (1.42 | ) | | | (1.47 | ) | | $ | 12.96 | | | | 11.30 | % | | $ | 12,963 | | | | 1.20 | % | | | 1.20 | % | | | 0.36 | % | | | 53 | % |
| | (1.89 | ) | | | (1.98 | ) | | $ | 13.00 | | | | 44.04 | % | | $ | 8,905 | | | | 1.22 | % | | | 1.22 | % | | | 0.42 | % | | | 70 | % |
| | | | | | | | | | | | | | | | | | | | | | | | | | | | | | | | | | | |
| | | | | | | | | | | | | | | | | | | | | | | | | | | | | | | | | | | |
| | — | | | | — | | | $ | 15.11 | | | | 19.07 | % | | $ | 11,072 | | | | 1.92 | % | | | 1.93 | % | | | (0.54 | )% | | | 52 | % |
| | (0.17 | ) | | | (0.17 | ) | | $ | 12.69 | | | | 8.51 | % | | $ | 12,269 | | | | 1.94 | % | | | 1.94 | % | | | (0.81 | )% | | | 70 | % |
| | (0.41 | ) | | | (0.41 | ) | | $ | 11.85 | | | | (2.21 | )% | | $ | 15,022 | | | | 1.94 | % | | | 1.94 | % | | | (0.78 | )% | | | 89 | % |
| | (1.42 | ) | | | (1.42 | ) | | $ | 12.54 | | | | 10.46 | % | | $ | 8,265 | | | | 1.95 | % | | | 1.95 | % | | | (0.39 | )% | | | 53 | % |
| | (1.89 | ) | | | (1.92 | ) | | $ | 12.67 | | | | 43.08 | % | | $ | 5,533 | | | | 1.97 | % | | | 1.97 | % | | | (0.35 | )% | | | 70 | % |
| | | | | | | | | | | | | | | | | | | | | | | | | | | | | | | | | | | |
| | | | | | | | | | | | | | | | | | | | | | | | | | | | | | | | | | | |
| | — | | | | (0.01 | ) | | $ | 16.11 | | | | 20.33 | % | | $ | 136,233 | | | | 0.87 | % | | | 0.88 | % | | | 0.52 | % | | | 52 | % |
| | (0.17 | ) | | | (0.18 | ) | | $ | 13.40 | | | | 9.62 | % | | $ | 93,192 | | | | 0.90 | % | | | 0.90 | % | | | 0.24 | % | | | 70 | % |
| | (0.41 | ) | | | (0.41 | ) | | $ | 12.39 | | | | (1.14 | )% | | $ | 81,408 | | | | 0.92 | % | | | 0.92 | % | | | 0.25 | % | | | 89 | % |
| | (1.42 | ) | | | (1.49 | ) | | $ | 12.95 | | | | 11.57 | % | | $ | 31,999 | | | | 0.95 | % | | | 0.95 | % | | | 0.64 | % | | | 53 | % |
| | (1.89 | ) | | | (2.01 | ) | | $ | 12.97 | | | | 44.35 | % | | $ | 46,787 | | | | 0.97 | % | | | 0.97 | % | | | 0.66 | % | | | 70 | % |
| | | | | | | | | | | | | | | | | | | | | | | | | | | | | | | | | | | |
| | | | | | | | | | | | | | | | | | | | | | | | | | | | | | | | | | | |
| | — | | | | (0.02 | ) | | $ | 16.14 | | | | 20.45 | % | | $ | 21,628 | | | | 0.77 | % | | | 0.78 | % | | | 0.61 | % | | | 52 | % |
| | (0.17 | ) | | | (0.20 | ) | | $ | 13.42 | | | | 9.72 | % | | $ | 18,456 | | | | 0.80 | % | | | 0.80 | % | | | 0.36 | % | | | 70 | % |
| | (0.41 | ) | | | (0.41 | ) | | $ | 12.41 | | | | (1.06 | )% | | $ | 10,703 | | | | 0.80 | % | | | 0.80 | % | | | 0.35 | % | | | 89 | % |
| | (1.42 | ) | | | (1.52 | ) | | $ | 12.96 | | | | 11.74 | % | | $ | 8,746 | | | | 0.80 | % | | | 0.80 | % | | | 0.76 | % | | | 53 | % |
| | (1.89 | ) | | | (2.03 | ) | | $ | 12.99 | | | | 44.70 | % | | $ | 6,534 | | | | 0.82 | % | | | 0.82 | % | | | 0.82 | % | | | 70 | % |
(D) | Portfolio turnover rate is calculated on the basis of the Fund as a whole without distinguishing between classes of shares issued. |
(E) | Amount is less than $0.005. |
See accompanying Notes to Financial Statements.
DIAMOND HILL FUNDS | ANNUAL REPORT | DECEMBER 31, 2017 | DIAMOND-HILL.COM 115 |
Long-Short Fund
Financial Highlights
Selected data for a share outstanding throughout the periods indicated
| Long-Short Fund | | Net asset
value
beginning
of period | | | Net
investment
income
(loss)(A) | | | Net
realized
and
unrealized
gains
(losses) on
investments | | | Total from investment operations | | | Dividends
from net
investment
income | |
| Class A | | | | | | | | | | | | | | | |
| For the year ended December 31, 2017 | | $ | 24.91 | | | | (0.05 | ) | | | 1.45 | | | | 1.40 | | | | — | |
| For the year ended December 31, 2016 | | $ | 23.36 | | | | (0.09 | ) | | | 2.49 | | | | 2.40 | | | | — | |
| For the year ended December 31, 2015 | | $ | 23.87 | | | | (0.11 | ) | | | (0.29 | ) | | | (0.40 | ) | | | — | |
| For the year ended December 31, 2014 | | $ | 22.26 | | | | (0.08 | ) | | | 1.69 | | | | 1.61 | | | | — | |
| For the year ended December 31, 2013 | | $ | 18.15 | | | | (0.05 | ) | | | 4.21 | | | | 4.16 | | | | (0.05 | ) |
| | | | | | | | | | | | | | | | | | | | | |
| Class C | | | | | | | | | | | | | | | | | | | | |
| For the year ended December 31, 2017 | | $ | 22.51 | | | | (0.22 | ) | | | 1.30 | | | | 1.08 | | | | — | |
| For the year ended December 31, 2016 | | $ | 21.34 | | | | (0.24 | ) | | | 2.26 | | | | 2.02 | | | | — | |
| For the year ended December 31, 2015 | | $ | 21.98 | | | | (0.27 | ) | | | (0.26 | ) | | | (0.53 | ) | | | — | |
| For the year ended December 31, 2014 | | $ | 20.65 | | | | (0.23 | ) | | | 1.56 | | | | 1.33 | | | | — | |
| For the year ended December 31, 2013 | | $ | 16.93 | | | | (0.19 | ) | | | 3.91 | | | | 3.72 | | | | — | |
| | | | | | | | | | | | | | | | | | | | | |
| Class I | | | | | | | | | | | | | | | | | | | | |
| For the year ended December 31, 2017 | | $ | 25.43 | | | | 0.02 | | | | 1.50 | | | | 1.52 | | | | (0.01 | ) |
| For the year ended December 31, 2016 | | $ | 23.77 | | | | (0.02 | ) | | | 2.53 | | | | 2.51 | | | | — | |
| For the year ended December 31, 2015 | | $ | 24.22 | | | | (0.05 | ) | | | (0.29 | ) | | | (0.34 | ) | | | — | |
| For the year ended December 31, 2014 | | $ | 22.52 | | | | (0.02 | ) | | | 1.72 | | | | 1.70 | | | | — | |
| For the year ended December 31, 2013 | | $ | 18.35 | | | | 0.00 | (G) | | | 4.26 | | | | 4.26 | | | | (0.09 | ) |
| | | | | | | | | | | | | | | | | | | | | |
| Class Y | | | | | | | | | | | | | | | | | | | | |
| For the year ended December 31, 2017 | | $ | 25.53 | | | | 0.05 | | | | 1.49 | | | | 1.54 | | | | (0.03 | ) |
| For the year ended December 31, 2016 | | $ | 23.83 | | | | 0.01 | | | | 2.54 | | | | 2.55 | | | | — | |
| For the year ended December 31, 2015 | | $ | 24.25 | | | | (0.02 | ) | | | (0.29 | ) | | | (0.31 | ) | | | — | |
| For the year ended December 31, 2014 | | $ | 22.52 | | | | 0.01 | | | | 1.72 | | | | 1.73 | | | | — | |
| For the year ended December 31, 2013 | | $ | 18.35 | | | | 0.04 | | | | 4.25 | | | | 4.29 | | | | (0.12 | ) |
(A) | Net investment income (loss) per share has been calculated using the average daily shares outstanding during the period. |
(B) | Total returns shown exclude the effect of applicable sales charges. |
(C) | This fund invests in short positions and as such incurs certain expenses and fees. If such expenses and fees had not occurred, the ratios of total expenses to average net assets would have been 1.37% for Class A, 2.12% for Class C, 1.07% for Class I and 0.97% for Class Y. |
See accompanying Notes to Financial Statements.
116 DIAMOND HILL FUNDS | ANNUAL REPORT | DECEMBER 31, 2017 | DIAMOND-HILL.COM |
Distributions from net
realized
gains | | | Total
distributions | | | Net asset
value
end of
period | | | Total
return(B) | | | Net assets at end
of period
(000’s) | | | Ratio
of total net
expenses
to average
net assets(C) | | | Ratio
of total gross
expenses
to average
net assets(D) | | | Ratio
of net
investment
income
(loss) to
average
net assets | | | Portfolio
turnover
rate(E) | |
| | | | | | | | | | | | | | | | | | | | | | | | | | |
| | (0.55 | ) | | | (0.55 | ) | | $ | 25.76 | | | | 5.65 | % | | $ | 358,395 | | | | 1.95 | % | | | 1.96 | % | | | (0.22 | )% | | | 43 | %(F) |
| | (0.85 | ) | | | (0.85 | ) | | $ | 24.91 | | | | 10.26 | % | | $ | 460,104 | | | | 2.06 | % | | | 2.06 | % | | | (0.20 | )% | | | 45 | % |
| | (0.11 | ) | | | (0.11 | ) | | $ | 23.36 | | | | (1.67 | )% | | $ | 569,218 | | | | 1.89 | % | | | 1.89 | % | | | (0.47 | )% | | | 81 | % |
| | — | | | | — | | | $ | 23.87 | | | | 7.23 | % | | $ | 703,572 | | | | 1.83 | % | | | 1.83 | % | | | (0.33 | )% | | | 60 | % |
| | — | | | | (0.05 | ) | | $ | 22.26 | | | | 22.92 | % | | $ | 858,112 | | | | 1.83 | % | | | 1.83 | % | | | (0.25 | )% | | | 30 | % |
| | | | | | | | | | | | | | | | | | | | | | | | | | | | | | | | | | | |
| | | | | | | | | | | | | | | | | | | | | | | | | | | | | | | | | | | |
| | (0.55 | ) | | | (0.55 | ) | | $ | 23.04 | | | | 4.83 | % | | $ | 115,009 | | | | 2.70 | % | | | 2.71 | % | | | (0.97 | )% | | | 43 | %(F) |
| | (0.85 | ) | | | (0.85 | ) | | $ | 22.51 | | | | 9.45 | % | | $ | 145,313 | | | | 2.81 | % | | | 2.81 | % | | | (1.13 | )% | | | 45 | % |
| | (0.11 | ) | | | (0.11 | ) | | $ | 21.34 | | | | (2.40 | )% | | $ | 169,861 | | | | 2.64 | % | | | 2.64 | % | | | (1.22 | )% | | | 81 | % |
| | — | | | | — | | | $ | 21.98 | | | | 6.44 | % | | $ | 170,278 | | | | 2.58 | % | | | 2.58 | % | | | (1.09 | )% | | | 60 | % |
| | — | | | | — | | | $ | 20.65 | | | | 21.97 | % | | $ | 130,388 | | | | 2.58 | % | | | 2.58 | % | | | (0.99 | )% | | | 30 | % |
| | | | | | | | | | | | | | | | | | | | | | | | | | | | | | | | | | | |
| | | | | | | | | | | | | | | | | | | | | | | | | | | | | | | | | | | |
| | (0.55 | ) | | | (0.56 | ) | | $ | 26.39 | | | | 5.99 | % | | $ | 4,032,586 | | | | 1.65 | % | | | 1.66 | % | | | 0.09 | % | | | 43 | %(F) |
| | (0.85 | ) | | | (0.85 | ) | | $ | 25.43 | | | | 10.55 | % | | $ | 3,589,749 | | | | 1.76 | % | | | 1.76 | % | | | (0.09 | )% | | | 45 | % |
| | (0.11 | ) | | | (0.11 | ) | | $ | 23.77 | | | | (1.40 | )% | | $ | 3,382,697 | | | | 1.62 | % | | | 1.62 | % | | | (0.21 | )% | | | 81 | % |
| | — | | | | — | | | $ | 24.22 | | | | 7.55 | % | | $ | 2,817,671 | | | | 1.58 | % | | | 1.58 | % | | | (0.09 | )% | | | 60 | % |
| | — | | | | (0.09 | ) | | $ | 22.52 | | | | 23.19 | % | | $ | 1,859,054 | | | | 1.58 | % | | | 1.58 | % | | | 0.00 | %(H) | | | 30 | % |
| | | | | | | | | | | | | | | | | | | | | | | | | | | | | | | | | | | |
| | | | | | | | | | | | | | | | | | | | | | | | | | | | | | | | | | | |
| | (0.55 | ) | | | (0.58 | ) | | $ | 26.49 | | | | 6.07 | % | | $ | 260,735 | | | | 1.55 | % | | | 1.56 | % | | | 0.19 | % | | | 43 | %(F) |
| | (0.85 | ) | | | (0.85 | ) | | $ | 25.53 | | | | 10.69 | % | | $ | 227,680 | | | | 1.67 | % | | | 1.67 | % | | | 0.02 | % | | | 45 | % |
| | (0.11 | ) | | | (0.11 | ) | | $ | 23.83 | | | | (1.27 | )% | | $ | 290,928 | | | | 1.50 | % | | | 1.50 | % | | | (0.08 | )% | | | 81 | % |
| | — | | | | — | | | $ | 24.25 | | | | 7.68 | % | | $ | 280,595 | | | | 1.43 | % | | | 1.43 | % | | | 0.06 | % | | | 60 | % |
| | — | | | | (0.12 | ) | | $ | 22.52 | | | | 23.39 | % | | $ | 168,835 | | | | 1.43 | % | | | 1.43 | % | | | 0.18 | % | | | 30 | % |
(D) | The Fund's adviser has contractually agreed to waive fees in the pro-rata amount of the management fee charged by the underlying Diamond Hill Fund on each Fund's investment in such other Diamond Hill Fund. If such fee waiver had not occurred, the ratios would have been as indicated. |
(E) | Portfolio turnover rate is calculated on the basis of the Fund as a whole without distinguishing between classes of shares issued. |
(F) | The portfolio turnover rate for 2017 would have been 32% if the absolute value of the securities sold short liability was included in the denominator of the calculation. |
(G) | Amount is less than $0.005. |
(H) | Amount is less than 0.005%. |
See accompanying Notes to Financial Statements.
DIAMOND HILL FUNDS | ANNUAL REPORT | DECEMBER 31, 2017 | DIAMOND-HILL.COM 117 |
Research Opportunities Fund
Financial Highlights
Selected data for a share outstanding throughout the periods indicated
| Research Opportunities Fund | | Net asset
value
beginning
of period | | | Net
investment
income
(loss)(A) | | | Net
realized
and
unrealized
gains
(losses) on
investments | | | Total from investment operations | | | Dividends
from net
investment
income | |
| Class A | | | | | | | | | | | | | | | |
| For the year ended December 31, 2017 | | $ | 21.44 | | | | (0.12 | ) | | | 2.89 | | | | 2.77 | | | | — | |
| For the year ended December 31, 2016 | | $ | 19.70 | | | | (0.04 | ) | | | 1.94 | | | | 1.90 | | | | — | |
| For the year ended December 31, 2015 | | $ | 22.52 | | | | (0.06 | ) | | | (1.14 | ) | | | (1.20 | ) | | | — | |
| For the year ended December 31, 2014 | | $ | 22.82 | | | | (0.07 | ) | | | 1.62 | | | | 1.55 | | | | (0.02 | ) |
| For the year ended December 31, 2013 | | $ | 18.34 | | | | (0.10 | ) | | | 6.01 | | | | 5.91 | | | | — | |
| | | | | | | | | | | | | | | | | | | | | |
| Class C | | | | | | | | | | | | | | | | | | | | |
| For the year ended December 31, 2017 | | $ | 20.57 | | | | (0.28 | ) | | | 2.76 | | | | 2.48 | | | | — | |
| For the year ended December 31, 2016 | | $ | 19.06 | | | | (0.19 | ) | | | 1.86 | | | | 1.67 | | | | — | |
| For the year ended December 31, 2015 | | $ | 22.00 | | | | (0.21 | ) | | | (1.11 | ) | | | (1.32 | ) | | | — | |
| For the year ended December 31, 2014 | | $ | 22.49 | | | | (0.24 | ) | | | 1.58 | | | | 1.34 | | | | — | |
| For the year ended December 31, 2013 | | $ | 18.22 | | | | (0.26 | ) | | | 5.96 | | | | 5.70 | | | | — | |
| | | | | | | | | | | | | | | | | | | | | |
| Class I | | | | | | | | | | | | | | | | | | | | |
| For the year ended December 31, 2017 | | $ | 21.61 | | | | (0.06 | ) | | | 2.93 | | | | 2.87 | | | | — | |
| For the year ended December 31, 2016 | | $ | 19.81 | | | | 0.02 | | | | 1.94 | | | | 1.96 | | | | — | |
| For the year ended December 31, 2015 | | $ | 22.61 | | | | (0.01 | ) | | | (1.13 | ) | | | (1.14 | ) | | | (0.04 | ) |
| For the year ended December 31, 2014 | | $ | 22.90 | | | | (0.01 | ) | | | 1.62 | | | | 1.61 | | | | (0.07 | ) |
| For the year ended December 31, 2013 | | $ | 18.36 | | | | (0.04 | ) | | | 6.01 | | | | 5.97 | | | | (0.00 | )(F) |
| | | | | | | | | | | | | | | | | | | | | |
| Class Y | | | | | | | | | | | | | | | | | | | | |
| For the year ended December 31, 2017 | | $ | 21.63 | | | | (0.03 | ) | | | 2.93 | | | | 2.90 | | | | — | |
| For the year ended December 31, 2016 | | $ | 19.80 | | | | 0.04 | | | | 1.95 | | | | 1.99 | | | | — | |
| For the year ended December 31, 2015 | | $ | 22.64 | | | | 0.02 | | | | (1.14 | ) | | | (1.12 | ) | | | (0.10 | ) |
| For the year ended December 31, 2014 | | $ | 22.92 | | | | 0.03 | | | | 1.62 | | | | 1.65 | | | | (0.10 | ) |
| For the year ended December 31, 2013 | | $ | 18.36 | | | | 0.00 | (F) | | | 6.02 | | | | 6.02 | | | | (0.03 | ) |
(A) | Net investment income (loss) per share has been calculated using the average daily shares outstanding during the period. |
(B) | Total returns shown exclude the effect of applicable sales charges. |
(C) | This fund invests in short positions and as such incurs certain expenses and fees. If such expenses and fees had not occurred, the ratios of total expenses to average net assets would have been 1.44% for Class A, 2.19% for Class C, 1.14% for Class I and 1.04% for Class Y. |
See accompanying Notes to Financial Statements.
118 DIAMOND HILL FUNDS | ANNUAL REPORT | DECEMBER 31, 2017 | DIAMOND-HILL.COM |
Distributions from net
realized
gains | | | Total
distributions | | | Net asset
value
end of
period | | | Total
return(B) | | | Net assets at end
of period
(000’s) | | | Ratio
of total
expenses
to average
net assets(C) | | | Ratio
of net
investment
income
(loss) to
average
net assets | | | Portfolio
turnover
rate(D) | |
| | | | | | | | | | | | | | | | | | | | | | | |
| | (0.65 | ) | | | (0.65 | ) | | $ | 23.56 | | | | 12.98 | % | | $ | 10,533 | | | | 1.84 | % | | | (0.52 | )% | | | 83 | %(E) |
| | (0.16 | ) | | | (0.16 | ) | | $ | 21.44 | | | | 9.64 | % | | $ | 4,162 | | | | 2.10 | % | | | (0.16 | )% | | | 67 | % |
| | (1.62 | ) | | | (1.62 | ) | | $ | 19.70 | | | | (5.29 | )% | | $ | 8,637 | | | | 1.83 | % | | | (0.27 | )% | | | 147 | % |
| | (1.83 | ) | | | (1.85 | ) | | $ | 22.52 | | | | 6.96 | % | | $ | 9,492 | | | | 1.74 | % | | | (0.29 | )% | | | 57 | % |
| | (1.43 | ) | | | (1.43 | ) | | $ | 22.82 | | | | 32.43 | % | | $ | 6,836 | | | | 1.77 | % | | | (0.45 | )% | | | 72 | % |
| | | | | | | | | | | | | | | | | | | | | | | | | | | | | | | |
| | | | | | | | | | | | | | | | | | | | | | | | | | | | | | | |
| | (0.65 | ) | | | (0.65 | ) | | $ | 22.40 | | | | 12.12 | % | | $ | 2,810 | | | | 2.59 | % | | | (1.31 | )% | | | 83 | %(E) |
| | (0.16 | ) | | | (0.16 | ) | | $ | 20.57 | | | | 8.76 | % | | $ | 2,986 | | | | 2.85 | % | | | (0.93 | )% | | | 67 | % |
| | (1.62 | ) | | | (1.62 | ) | | $ | 19.06 | | | | (5.96 | )% | | $ | 5,097 | | | | 2.58 | % | | | (0.96 | )% | | | 147 | % |
| | (1.83 | ) | | | (1.83 | ) | | $ | 22.00 | | | | 6.17 | % | | $ | 668 | | | | 2.49 | % | | | (1.03 | )% | | | 57 | % |
| | (1.43 | ) | | | (1.43 | ) | | $ | 22.49 | | | | 31.48 | % | | $ | 494 | | | | 2.52 | % | | | (1.19 | )% | | | 72 | % |
| | | | | | | | | | | | | | | | | | | | | | | | | | | | | | | |
| | | | | | | | | | | | | | | | | | | | | | | | | | | | | | | |
| | (0.65 | ) | | | (0.65 | ) | | $ | 23.83 | | | | 13.34 | % | | $ | 35,021 | | | | 1.54 | % | | | (0.23 | )% | | | 83 | %(E) |
| | (0.16 | ) | | | (0.16 | ) | | $ | 21.61 | | | | 9.89 | % | | $ | 27,588 | | | | 1.80 | % | | | 0.05 | % | | | 67 | % |
| | (1.62 | ) | | | (1.66 | ) | | $ | 19.81 | | | | (5.00 | )% | | $ | 26,186 | | | | 1.57 | % | | | (0.03 | )% | | | 147 | % |
| | (1.83 | ) | | | (1.90 | ) | | $ | 22.61 | | | | 7.21 | % | | $ | 49,920 | | | | 1.49 | % | | | (0.05 | )% | | | 57 | % |
| | (1.43 | ) | | | (1.43 | ) | | $ | 22.90 | | | | 32.76 | % | | $ | 43,018 | | | | 1.52 | % | | | (0.17 | )% | | | 72 | % |
| | | | | | | | | | | | | | | | | | | | | | | | | | | | | | | |
| | | | | | | | | | | | | | | | | | | | | | | | | | | | | | | |
| | (0.65 | ) | | | (0.65 | ) | | $ | 23.88 | | | | 13.47 | % | | $ | 20,521 | | | | 1.44 | % | | | (0.14 | )% | | | 83 | %(E) |
| | (0.16 | ) | | | (0.16 | ) | | $ | 21.63 | | | | 10.05 | % | | $ | 16,755 | | | | 1.70 | % | | | 0.19 | % | | | 67 | % |
| | (1.62 | ) | | | (1.72 | ) | | $ | 19.80 | | | | (4.91 | )% | | $ | 15,285 | | | | 1.44 | % | | | 0.10 | % | | | 147 | % |
| | (1.83 | ) | | | (1.93 | ) | | $ | 22.64 | | | | 7.37 | % | | $ | 17,307 | | | | 1.34 | % | | | 0.11 | % | | | 57 | % |
| | (1.43 | ) | | | (1.46 | ) | | $ | 22.92 | | | | 32.99 | % | | $ | 15,468 | | | | 1.37 | % | | | 0.02 | % | | | 72 | % |
(D) | Portfolio turnover rate is calculated on the basis of the Fund as a whole without distinguishing between classes of shares issued. |
(E) | The portfolio turnover rate for 2017 would have been 68% if the absolute value of the securities sold short liability was included in the denominator of the calculation. |
(F) | Amount is less than $0.005. |
See accompanying Notes to Financial Statements.
DIAMOND HILL FUNDS | ANNUAL REPORT | DECEMBER 31, 2017 | DIAMOND-HILL.COM 119 |
Financial Long-Short Fund
Financial Highlights
Selected data for a share outstanding throughout the periods indicated
| Financial Long-Short Fund | | Net asset
value
beginning
of period | | | Net
investment
income
(loss)(A) | | | Net
realized
and
unrealized
gains
(losses) on
investments | | | Total from investment operations | | | Dividends
from net
investment
income | |
| Class A | | | | | | | | | | | | | | | |
| For the year ended December 31, 2017 | | $ | 22.11 | | | | (0.03 | ) | | | 2.59 | | | | 2.56 | | | | — | |
| For the year ended December 31, 2016 | | $ | 18.62 | | | | 0.03 | | | | 3.46 | | | | 3.49 | | | | — | |
| For the year ended December 31, 2015 | | $ | 19.61 | | | | 0.00 | (F) | | | (0.92 | ) | | | (0.92 | ) | | | (0.07 | ) |
| For the year ended December 31, 2014 | | $ | 18.13 | | | | (0.02 | ) | | | 1.50 | | | | 1.48 | | | | — | |
| For the year ended December 31, 2013 | | $ | 13.24 | | | | (0.05 | ) | | | 4.94 | | | | 4.89 | | | | — | |
| | | | | | | | | | | | | | | | | | | | | |
| Class C | | | | | | | | | | | | | | | | | | | | |
| For the year ended December 31, 2017 | | $ | 20.35 | | | | (0.19 | ) | | | 2.38 | | | | 2.19 | | | | — | |
| For the year ended December 31, 2016 | | $ | 17.28 | | | | (0.10 | ) | | | 3.17 | | | | 3.07 | | | | — | |
| For the year ended December 31, 2015 | | $ | 18.26 | | | | (0.13 | ) | | | (0.85 | ) | | | (0.98 | ) | | | — | |
| For the year ended December 31, 2014 | | $ | 17.00 | | | | (0.15 | ) | | | 1.41 | | | | 1.26 | | | | — | |
| For the year ended December 31, 2013 | | $ | 12.51 | | | | (0.17 | ) | | | 4.66 | | | | 4.49 | | | | — | |
| | | | | | | | | | | | | | | | | | | | | |
| Class I | | | | | | | | | | | | | | | | | | | | |
| For the year ended December 31, 2017 | | $ | 22.14 | | | | 0.04 | | | | 2.60 | | | | 2.64 | | | | (0.04 | ) |
| For the year ended December 31, 2016 | | $ | 18.59 | | | | 0.09 | | | | 3.46 | | | | 3.55 | | | | — | |
| For the year ended December 31, 2015 | | $ | 19.57 | | | | 0.05 | | | | (0.91 | ) | | | (0.86 | ) | | | (0.12 | ) |
| For the year ended December 31, 2014 | | $ | 18.10 | | | | 0.02 | | | | 1.50 | | | | 1.52 | | | | (0.05 | ) |
| For the year ended December 31, 2013 | | $ | 13.18 | | | | (0.02 | ) | | | 4.94 | | | | 4.92 | | | | — | |
(A) | Net investment income (loss) per share has been calculated using the average daily shares outstanding during the period. |
(B) | Total returns shown exclude the effect of applicable sales charges. |
(C) | This fund invests in short positions and as such incurs certain expenses and fees. If such expenses and fees had not occurred, the ratios of total expenses to average net assets would have been 1.44% for Class A, 2.19% for Class C and 1.14% for Class Y. |
See accompanying Notes to Financial Statements.
120 DIAMOND HILL FUNDS | ANNUAL REPORT | DECEMBER 31, 2017 | DIAMOND-HILL.COM |
Distributions from net
realized
gains | | | Total
distributions | | | Net asset
value
end of
period | | | Total
return(B) | | | Net assets at end
of period
(000’s) | | | Ratio
of total
expenses
to average
net assets(C) | | | Ratio
of net
investment
income
(loss) to
average
net assets | | | Portfolio
turnover
rate(D) | |
| | | | | | | | | | | | | | | | | | | | | | | |
| | — | | | | — | | | $ | 24.67 | | | | 11.58 | % | | $ | 9,243 | | | | 1.89 | % | | | (0.16 | )% | | | 27 | %(E) |
| | — | | | | — | | | $ | 22.11 | | | | 18.74 | % | | $ | 10,161 | | | | 2.00 | % | | | 0.19 | % | | | 34 | % |
| | — | | | | (0.07 | ) | | $ | 18.62 | | | | (4.67 | )% | | $ | 10,760 | | | | 1.85 | % | | | 0.02 | % | | | 63 | % |
| | — | | | | — | | | $ | 19.61 | | | | 8.16 | % | | $ | 12,043 | | | | 1.74 | % | | | (0.10 | )% | | | 51 | % |
| | — | | | | — | | | $ | 18.13 | | | | 36.93 | % | | $ | 17,852 | | | | 1.70 | % | | | (0.31 | )% | | | 66 | % |
| | | | | | | | | | | | | | | | | | | | | | | | | | | | | | | |
| | | | | | | | | | | | | | | | | | | | | | | | | | | | | | | |
| | — | | | | — | | | $ | 22.54 | | | | 10.76 | % | | $ | 1,916 | | | | 2.64 | % | | | (0.90 | )% | | | 27 | %(E) |
| | — | | | | — | | | $ | 20.35 | | | | 17.77 | % | | $ | 1,714 | | | | 2.75 | % | | | (0.56 | )% | | | 34 | % |
| | — | | | | — | | | $ | 17.28 | | | | (5.37 | )% | | $ | 1,845 | | | | 2.60 | % | | | (0.75 | )% | | | 63 | % |
| | — | | | | — | | | $ | 18.26 | | | | 7.41 | % | | $ | 2,233 | | | | 2.49 | % | | | (0.86 | )% | | | 51 | % |
| | — | | | | — | | | $ | 17.00 | | | | 35.89 | % | | $ | 2,958 | | | | 2.45 | % | | | (1.06 | )% | | | 66 | % |
| | | | | | | | | | | | | | | | | | | | | | | | | | | | | | | |
| | | | | | | | | | | | | | | | | | | | | | | | | | | | | | | |
| | — | | | | (0.04 | ) | | $ | 24.74 | | | | 11.90 | % | | $ | 23,836 | | | | 1.59 | % | | | 0.16 | % | | | 27 | %(E) |
| | — | | | | — | | | $ | 22.14 | | | | 19.10 | % | | $ | 20,518 | | | | 1.71 | % | | | 0.50 | % | | | 34 | % |
| | — | | | | (0.12 | ) | | $ | 18.59 | | | | (4.40 | )% | | $ | 14,812 | | | | 1.58 | % | | | 0.24 | % | | | 63 | % |
| | — | | | | (0.05 | ) | | $ | 19.57 | | | | 8.42 | % | | $ | 15,310 | | | | 1.49 | % | | | 0.12 | % | | | 51 | % |
| | — | | | | — | | | $ | 18.10 | | | | 37.33 | % | | $ | 10,817 | | | | 1.45 | % | | | (0.12 | )% | | | 66 | % |
(D) | Portfolio turnover rate is calculated on the basis of the Fund as a whole without distinguishing between classes of shares issued. |
(E) | The portfolio turnover rate for 2017 would have been 23% if the absolute value of the securities sold short liability was included in the denominator of the calculation. |
(F) | Amount is less than $0.005. |
See accompanying Notes to Financial Statements.
DIAMOND HILL FUNDS | ANNUAL REPORT | DECEMBER 31, 2017 | DIAMOND-HILL.COM 121 |
Short Duration Total Return Fund
Financial Highlights
Selected data for a share outstanding throughout the period indicated
Short Duration Total Return Fund(A) | | Net asset
value
beginning
of period | | | Net
investment
income(B) | | | Net
realized
and
unrealized
gains on
investments | | | Total from investment operations | | | Dividends
from net
investment
income | |
| Class A | | | | | | | | | | | | | | | |
| For the year ended December 31, 2017 | | $ | 10.04 | | | | 0.30 | | | | 0.09 | | | | 0.39 | | | | (0.31 | ) |
| For the period ended December 31, 2016 | | $ | 10.00 | | | | 0.09 | | | | 0.03 | | | | 0.12 | | | | (0.08 | ) |
| | | | | | | | | | | | | | | | | | | | | |
| Class I | | | | | | | | | | | | | | | | | | | | |
| For the year ended December 31, 2017 | | $ | 10.03 | | | | 0.33 | | | | 0.10 | | | | 0.43 | | | | (0.34 | ) |
| For the period ended December 31, 2016 | | $ | 10.00 | | | | 0.10 | | | | 0.03 | | | | 0.13 | | | | (0.10 | ) |
| | | | | | | | | | | | | | | | | | | | | |
| Class Y | | | | | | | | | | | | | | | | | | | | |
| For the year ended December 31, 2017 | | $ | 10.03 | | | | 0.34 | | | | 0.10 | | | | 0.44 | | | | (0.35 | ) |
| For the period ended December 31, 2016 | | $ | 10.00 | | | | 0.11 | | | | 0.02 | | | | 0.13 | | | | (0.10 | ) |
(A) | Inception date of the Fund is July 5, 2016. The Fund commenced operations on July 5, 2016. |
(B) | Net investment income per share has been calculated using the average daily shares outstanding during the period. |
See accompanying Notes to Financial Statements.
122 DIAMOND HILL FUNDS | ANNUAL REPORT | DECEMBER 31, 2017 | DIAMOND-HILL.COM |
Distributions from net
realized
gains | | | Total
distributions | | | Net asset
value
end of
period | | | Total
return(C) | | | Net assets at end
of period
(000’s) | | | Ratio
of total
expenses
to average
net assets | | | Ratio
of net
investment
income to
average
net assets | | | Portfolio
turnover
rate(D) | |
| | | | | | | | | | | | | | | | | | | | | | | |
| | (0.01 | ) | | | (0.32 | ) | | $ | 10.11 | | | | 3.97 | % | | $ | 20,511 | | | | 0.83 | % | | | 3.03 | % | | | 82 | % |
| | — | | | | (0.08 | ) | | $ | 10.04 | | | | 1.19 | % | | $ | 222 | | | | 0.83 | % | | | 1.12 | % | | | 19 | % |
| | | | | | | | | | | | | | | | | | | | | | | | | | | | | | | |
| | | | | | | | | | | | | | | | | | | | | | | | | | | | | | | |
| | (0.01 | ) | | | (0.35 | ) | | $ | 10.11 | | | | 4.33 | % | | $ | 61,136 | | | | 0.53 | % | | | 3.29 | % | | | 82 | % |
| | — | | | | (0.10 | ) | | $ | 10.03 | | | | 1.26 | % | | $ | 14,707 | | | | 0.53 | % | | | 1.32 | % | | | 19 | % |
| | | | | | | | | | | | | | | | | | | | | | | | | | | | | | | |
| | | | | | | | | | | | | | | | | | | | | | | | | | | | | | | |
| | (0.01 | ) | | | (0.36 | ) | | $ | 10.11 | | | | 4.43 | % | | $ | 231,290 | | | | 0.43 | % | | | 3.33 | % | | | 82 | % |
| | — | | | | (0.10 | ) | | $ | 10.03 | | | | 1.29 | % | | $ | 182,527 | | | | 0.44 | % | | | 1.25 | % | | | 19 | % |
(C) | Total returns shown exclude the effect of applicable sales charges. |
(D) | Portfolio turnover rate is calculated on the basis of the Fund as a whole without distinguishing between classes of shares issued. |
See accompanying Notes to Financial Statements.
DIAMOND HILL FUNDS | ANNUAL REPORT | DECEMBER 31, 2017 | DIAMOND-HILL.COM 123 |
Core Bond Fund
Financial Highlights
Selected data for a share outstanding throughout the period indicated
Core Bond Fund(A) | | Net asset
value
beginning
of period | | | Net
investment
income(B) | | | Net
realized
and
unrealized
gains
(losses) on
investments | | | Total from investment operations | | | Dividends
from net
investment
income | |
| Class A | | | | | | | | | | | | | | | |
| For the year ended December 31, 2017 | | $ | 9.70 | | | | 0.21 | | | | 0.16 | | | | 0.37 | | | | (0.22 | ) |
| For the period ended December 31, 2016 | | $ | 10.00 | | | | 0.07 | | | | (0.28 | ) | | | (0.21 | ) | | | (0.09 | ) |
| | | | | | | | | | | | | | | | | | | | | |
| Class I | | | | | | | | | | | | | | | | | | | | |
| For the year ended December 31, 2017 | | $ | 9.70 | | | | 0.24 | | | | 0.16 | | | | 0.40 | | | | (0.25 | ) |
| For the period ended December 31, 2016 | | $ | 10.00 | | | | 0.09 | | | | (0.30 | ) | | | (0.21 | ) | | | (0.09 | ) |
| | | | | | | | | | | | | | | | | | | | | |
| Class Y | | | | | | | | | | | | | | | | | | | | |
| For the year ended December 31, 2017 | | $ | 9.70 | | | | 0.25 | | | | 0.16 | | | | 0.41 | | | | (0.26 | ) |
| For the period ended December 31, 2016 | | $ | 10.00 | | | | 0.09 | | | | (0.30 | ) | | | (0.21 | ) | | | (0.09 | ) |
(A) | Inception date of the Fund is July 5, 2016. The Fund commenced operations on July 5, 2016. |
(B) | Net investment income per share has been calculated using the average daily shares outstanding during the period. |
See accompanying Notes to Financial Statements.
124 DIAMOND HILL FUNDS | ANNUAL REPORT | DECEMBER 31, 2017 | DIAMOND-HILL.COM |
Distributions from net
realized
gains | | | Total
distributions | | | Net asset
value
end of
period | | | Total
return(C) | | | Net assets at end
of period
(000’s) | | | Ratio
of total
expenses
to average
net assets | | | Ratio
of net
investment
income to
average
net assets | | | Portfolio
turnover
rate(D) | |
| | | | | | | | | | | | | | | | | | | | | | | |
| | — | | | | (0.22 | ) | | $ | 9.85 | | | | 3.85 | % | | $ | 3,480 | | | | 0.78 | % | | | 2.10 | % | | | 35 | % |
| | — | | | | (0.09 | ) | | $ | 9.70 | | | | (2.28 | )% | | $ | 2,183 | | | | 0.78 | % | | | 0.87 | % | | | 8 | % |
| | | | | | | | | | | | | | | | | | | | | | | | | | | | | | | |
| | | | | | | | | | | | | | | | | | | | | | | | | | | | | | | |
| | — | | | | (0.25 | ) | | $ | 9.85 | | | | 4.17 | % | | $ | 9,604 | | | | 0.48 | % | | | 2.40 | % | | | 35 | % |
| | — | | | | (0.09 | ) | | $ | 9.70 | | | | (2.14 | )% | | $ | 8,033 | | | | 0.49 | % | | | 1.02 | % | | | 8 | % |
| | | | | | | | | | | | | | | | | | | | | | | | | | | | | | | |
| | | | | | | | | | | | | | | | | | | | | | | | | | | | | | | |
| | — | | | | (0.26 | ) | | $ | 9.85 | | | | 4.22 | % | | $ | 30,740 | | | | 0.38 | % | | | 2.49 | % | | | 35 | % |
| | — | | | | (0.09 | ) | | $ | 9.70 | | | | (2.11 | )% | | $ | 29,468 | | | | 0.39 | % | | | 1.00 | % | | | 8 | % |
(C) | Total returns shown exclude the effect of applicable sales charges. |
(D) | Portfolio turnover rate is calculated on the basis of the Fund as a whole without distinguishing between classes of shares issued. |
See accompanying Notes to Financial Statements.
DIAMOND HILL FUNDS | ANNUAL REPORT | DECEMBER 31, 2017 | DIAMOND-HILL.COM 125 |
Corporate Credit Fund
Financial Highlights
Selected data for a share outstanding throughout the periods indicated
| Corporate Credit Fund | | Net asset
value
beginning
of period | | | Net
investment
income(A) | | | Net
realized
and
unrealized
gains
(losses) on
investments | | | Total from investment operations | | | Dividends
from net
investment
income | |
| Class A | | | | | | | | | | | | | | | |
| For the year ended December 31, 2017 | | $ | 11.13 | | | | 0.58 | | | | 0.24 | | | | 0.82 | | | | (0.58 | ) |
| For the year ended December 31, 2016 | | $ | 10.53 | | | | 0.63 | | | | 0.60 | | | | 1.23 | | | | (0.62 | ) |
| For the year ended December 31, 2015 | | $ | 10.94 | | | | 0.58 | | | | (0.44 | ) | | | 0.14 | | | | (0.55 | ) |
| For the year ended December 31, 2014 | | $ | 11.19 | | | | 0.51 | | | | (0.28 | ) | | | 0.23 | | | | (0.48 | ) |
| For the year ended December 31, 2013 | | $ | 11.18 | | | | 0.56 | | | | 0.00 | (E) | | | 0.56 | | | | (0.55 | ) |
| | | | | | | | | | | | | | | | | | | | | |
| Class C | | | | | | | | | | | | | | | | | | | | |
| For the year ended December 31, 2017 | | $ | 11.09 | | | | 0.49 | | | | 0.25 | | | | 0.74 | | | | (0.50 | ) |
| For the year ended December 31, 2016 | | $ | 10.51 | | | | 0.54 | | | | 0.60 | | | | 1.14 | | | | (0.55 | ) |
| For the year ended December 31, 2015 | | $ | 10.92 | | | | 0.49 | | | | (0.43 | ) | | | 0.06 | | | | (0.47 | ) |
| For the year ended December 31, 2014 | | $ | 11.17 | | | | 0.42 | | | | (0.27 | ) | | | 0.15 | | | | (0.40 | ) |
| For the year ended December 31, 2013 | | $ | 11.17 | | | | 0.47 | | | | 0.00 | (E) | | | 0.47 | | | | (0.47 | ) |
| | | | | | | | | | | | | | | | | | | | | |
| Class I | | | | | | | | | | | | | | | | | | | | |
| For the year ended December 31, 2017 | | $ | 11.09 | | | | 0.61 | | | | 0.24 | | | | 0.85 | | | | (0.61 | ) |
| For the year ended December 31, 2016 | | $ | 10.50 | | | | 0.66 | | | | 0.59 | | | | 1.25 | | | | (0.65 | ) |
| For the year ended December 31, 2015 | | $ | 10.91 | | | | 0.60 | | | | (0.43 | ) | | | 0.17 | | | | (0.58 | ) |
| For the year ended December 31, 2014 | | $ | 11.16 | | | | 0.54 | | | | (0.27 | ) | | | 0.27 | | | | (0.52 | ) |
| For the year ended December 31, 2013 | | $ | 11.16 | | | | 0.58 | | | | 0.00 | (E) | | | 0.58 | | | | (0.58 | ) |
| | | | | | | | | | | | | | | | | | | | | |
| Class Y | | | | | | | | | | | | | | | | | | | | |
| For the year ended December 31, 2017 | | $ | 11.09 | | | | 0.62 | | | | 0.24 | | | | 0.86 | | | | (0.63 | ) |
| For the year ended December 31, 2016 | | $ | 10.50 | | | | 0.67 | | | | 0.59 | | | | 1.26 | | | | (0.66 | ) |
| For the year ended December 31, 2015 | | $ | 10.91 | | | | 0.62 | | | | (0.44 | ) | | | 0.18 | | | | (0.59 | ) |
| For the year ended December 31, 2014 | | $ | 11.16 | | | | 0.55 | | | | (0.27 | ) | | | 0.28 | | | | (0.53 | ) |
| For the year ended December 31, 2013 | | $ | 11.15 | | | | 0.60 | | | | 0.00 | (E) | | | 0.60 | | | | (0.59 | ) |
(A) | Net investment income per share has been calculated using the average daily shares outstanding during the period. |
(B) | Total returns shown exclude the effect of applicable sales charges. |
(C) | The Fund's adviser has contractually agreed to waive fees in the pro-rata amount of the management fee charged by the underlying Diamond Hill Fund on each Fund's investment in such other Diamond Hill Fund. If such fee waiver had not occurred, the ratios would have been as indicated. |
See accompanying Notes to Financial Statements.
126 DIAMOND HILL FUNDS | ANNUAL REPORT | DECEMBER 31, 2017 | DIAMOND-HILL.COM |
Distributions from net
realized
gains | | | Total
distributions | | | Net asset
value
end of
period | | | Total
return(B) | | | Net assets at end
of period
(000’s) | | | Ratio
of total net
expenses
to average
net assets | | | Ratio
of total gross
expenses
to average
net assets(C) | | | Ratio
of net
investment
income to
average
net assets | | | Portfolio
turnover
rate(D) | |
| | | | | | | | | | | | | | | | | | | | | | | | | | |
| | (0.05 | ) | | | (0.63 | ) | | $ | 11.32 | | | | 7.56 | % | | $ | 64,204 | | | | 0.92 | % | | | 0.93 | % | | | 5.07 | % | | | 83 | % |
| | (0.01 | ) | | | (0.63 | ) | | $ | 11.13 | | | | 11.94 | % | | $ | 71,075 | | | | 0.93 | % | | | 0.93 | % | | | 5.72 | % | | | 119 | % |
| | — | | | | (0.55 | ) | | $ | 10.53 | | | | 1.19 | % | | $ | 44,354 | | | | 0.95 | % | | | 0.95 | % | | | 5.24 | % | | | 48 | % |
| | — | | | | (0.48 | ) | | $ | 10.94 | | | | 2.10 | % | | $ | 31,282 | | | | 1.00 | % | | | 1.00 | % | | | 4.52 | % | | | 56 | % |
| | — | | | | (0.55 | ) | | $ | 11.19 | | | | 5.13 | % | | $ | 39,801 | | | | 1.02 | % | | | 1.02 | % | | | 5.00 | % | | | 60 | % |
| | | | | | | | | | | | | | | | | | | | | | | | | | | | | | | | | | | |
| | | | | | | | | | | | | | | | | | | | | | | | | | | | | | | | | | | |
| | (0.05 | ) | | | (0.55 | ) | | $ | 11.28 | | | | 6.77 | % | | $ | 26,656 | | | | 1.67 | % | | | 1.68 | % | | | 4.33 | % | | | 83 | % |
| | (0.01 | ) | | | (0.56 | ) | | $ | 11.09 | | | | 11.06 | % | | $ | 29,607 | | | | 1.68 | % | | | 1.68 | % | | | 4.98 | % | | | 119 | % |
| | — | | | | (0.47 | ) | | $ | 10.51 | | | | 0.44 | % | | $ | 23,649 | | | | 1.70 | % | | | 1.70 | % | | | 4.47 | % | | | 48 | % |
| | — | | | | (0.40 | ) | | $ | 10.92 | | | | 1.37 | % | | $ | 24,088 | | | | 1.75 | % | | | 1.75 | % | | | 3.80 | % | | | 56 | % |
| | — | | | | (0.47 | ) | | $ | 11.17 | | | | 4.26 | % | | $ | 26,126 | | | | 1.77 | % | | | 1.77 | % | | | 4.25 | % | | | 60 | % |
| | | | | | | | | | | | | | | | | | | | | | | | | | | | | | | | | | | |
| | | | | | | | | | | | | | | | | | | | | | | | | | | | | | | | | | | |
| | (0.05 | ) | | | (0.66 | ) | | $ | 11.28 | | | | 7.87 | % | | $ | 536,203 | | | | 0.62 | % | | | 0.63 | % | | | 5.39 | % | | | 83 | % |
| | (0.01 | ) | | | (0.66 | ) | | $ | 11.09 | | | | 12.21 | % | | $ | 411,465 | | | | 0.64 | % | | | 0.64 | % | | | 6.00 | % | | | 119 | % |
| | — | | | | (0.58 | ) | | $ | 10.50 | | | | 1.49 | % | | $ | 247,522 | | | | 0.75 | % | | | 0.75 | % | | | 5.51 | % | | | 48 | % |
| | — | | | | (0.52 | ) | | $ | 10.91 | | | | 2.38 | % | | $ | 148,737 | | | | 0.77 | % | | | 0.77 | % | | | 4.82 | % | | | 56 | % |
| | — | | | | (0.58 | ) | | $ | 11.16 | | | | 5.30 | % | | $ | 117,009 | | | | 0.77 | % | | | 0.77 | % | | | 5.24 | % | | | 60 | % |
| | | | | | | | | | | | | | �� | | | | | | | | | | | | | | | | | | | | | |
| | | | | | | | | | | | | | | | | | | | | | | | | | | | | | | | | | | |
| | (0.05 | ) | | | (0.68 | ) | | $ | 11.27 | | | | 7.89 | % | | $ | 25,309 | | | | 0.52 | % | | | 0.53 | % | | | 5.49 | % | | | 83 | % |
| | (0.01 | ) | | | (0.67 | ) | | $ | 11.09 | | | | 12.34 | % | | $ | 21,310 | | | | 0.54 | % | | | 0.54 | % | | | 6.33 | % | | | 119 | % |
| | — | | | | (0.59 | ) | | $ | 10.50 | | | | 1.60 | % | | $ | 18,013 | | | | 0.56 | % | | | 0.56 | % | | | 5.62 | % | | | 48 | % |
| | — | | | | (0.53 | ) | | $ | 10.91 | | | | 2.54 | % | | $ | 15,831 | | | | 0.60 | % | | | 0.60 | % | | | 4.96 | % | | | 56 | % |
| | — | | | | (0.59 | ) | | $ | 11.16 | | | | 5.55 | % | | $ | 3,927 | | | | 0.62 | % | | | 0.62 | % | | | 5.35 | % | | | 60 | % |
(D) | Portfolio turnover rate is calculated on the basis of the Fund as a whole without distinguishing between classes of shares issued. |
(E) | Amount is less than $0.005. |
See accompanying Notes to Financial Statements.
DIAMOND HILL FUNDS | ANNUAL REPORT | DECEMBER 31, 2017 | DIAMOND-HILL.COM 127 |
High Yield Fund
Financial Highlights
Selected data for a share outstanding throughout the periods indicated
High Yield Fund(A) | | Net asset
value
beginning
of period | | | Net
investment
income(B) | | | Net
realized
and
unrealized
gains
(losses) on
investments | | | Total from investment operations | | | Dividends
from net
investment
income | |
| Class A | | | | | | | | | | | | | | | |
| For the year ended December 31, 2017 | | $ | 10.65 | | | | 0.65 | | | | 0.38 | | | | 1.03 | | | | (0.65 | ) |
| For the year ended December 31, 2016 | | $ | 10.14 | | | | 0.70 | | | | 0.71 | | | | 1.41 | | | | (0.66 | ) |
| | | | | | | | | | | | | | | | | | | | | |
| Class I | | | | | | | | | | | | | | | | | | | | |
| For the year ended December 31, 2017 | | $ | 10.65 | | | | 0.68 | | | | 0.39 | | | | 1.07 | | | | (0.68 | ) |
| For the year ended December 31, 2016 | | $ | 10.14 | | | | 0.73 | | | | 0.71 | | | | 1.44 | | | | (0.69 | ) |
| | | | | | | | | | | | | | | | | | | | | |
| Class Y | | | | | | | | | | | | | | | | | | | | |
| For the year ended December 31, 2017 | | $ | 10.65 | | | | 0.69 | | | | 0.40 | | | | 1.09 | | | | (0.70 | ) |
| For the year ended December 31, 2016 | | $ | 10.14 | | | | 0.74 | | | | 0.71 | | | | 1.45 | | | | (0.70 | ) |
(A) | Inception date of the Fund is December 31, 2015. The Fund commenced public offering and operations on January 4, 2016. |
(B) | Net investment income per share has been calculated using the average daily shares outstanding during the period. |
See accompanying Notes to Financial Statements.
128 DIAMOND HILL FUNDS | ANNUAL REPORT | DECEMBER 31, 2017 | DIAMOND-HILL.COM |
Distributions from net
realized
gains | | | Total
distributions | | | Net asset
value
end of
period | | | Total
return(C) | | | Net assets at end
of period
(000’s) | | | Ratio
of total
expenses
to average
net assets | | | Ratio
of net
investment
income to
average
net assets | | | Portfolio
turnover
rate(D) | |
| | | | | | | | | | | | | | | | | | | | | | | |
| | (0.26 | ) | | | (0.91 | ) | | $ | 10.77 | | | | 9.96 | % | | $ | 296 | | | | 0.99 | % | | | 5.89 | % | | | 137 | % |
| | (0.24 | ) | | | (0.90 | ) | | $ | 10.65 | | | | 14.29 | % | | $ | 185 | | | | 0.99 | % | | | 6.51 | % | | | 123 | % |
| | | | | | | | | | | | | | | | | | | | | | | | | | | | | | | |
| | | | | | | | | | | | | | | | | | | | | | | | | | | | | | | |
| | (0.26 | ) | | | (0.94 | ) | | $ | 10.78 | | | | 10.36 | % | | $ | 14,185 | | | | 0.69 | % | | | 6.23 | % | | | 137 | % |
| | (0.24 | ) | | | (0.93 | ) | | $ | 10.65 | | | | 14.62 | % | | $ | 23,989 | | | | 0.70 | % | | | 6.80 | % | | | 123 | % |
| | | | | | | | | | | | | | | | | | | | | | | | | | | | | | | |
| | | | | | | | | | | | | | | | | | | | | | | | | | | | | | | |
| | (0.26 | ) | | | (0.96 | ) | | $ | 10.78 | | | | 10.48 | % | | $ | 16,623 | | | | 0.59 | % | | | 6.28 | % | | | 137 | % |
| | (0.24 | ) | | | (0.94 | ) | | $ | 10.65 | | | | 14.73 | % | | $ | 7,752 | | | | 0.60 | % | | | 7.07 | % | | | 123 | % |
(C) | Total returns shown exclude the effect of applicable sales charges. |
(D) | Portfolio turnover rate is calculated on the basis of the Fund as a whole without distinguishing between classes of shares issued. |
See accompanying Notes to Financial Statements.
DIAMOND HILL FUNDS | ANNUAL REPORT | DECEMBER 31, 2017 | DIAMOND-HILL.COM 129 |
Diamond Hill Funds
Notes to Financial Statements
December 31, 2017
Organization
The Diamond Hill Small Cap Fund (“Small Cap Fund”), Diamond Hill Small-Mid Cap Fund (“Small-Mid Cap Fund”), Diamond Hill Mid Cap Fund (“Mid Cap Fund”), Diamond Hill Large Cap Fund (“Large Cap Fund”), Diamond Hill All Cap Select Fund (“All Cap Select Fund”) (formerly Diamond Hill Select Fund), Diamond Hill Long-Short Fund (“Long-Short Fund”), Diamond Hill Research Opportunities Fund (“Research Opportunities Fund”), Diamond Hill Financial Long-Short Fund (“Financial Long-Short Fund”), Diamond Hill Short Duration Total Return Fund (“Short Duration Fund”), Diamond Hill Core Bond Fund (“Core Bond Fund”), Diamond Hill Corporate Credit Fund (“Corporate Credit Fund”) and Diamond Hill High Yield Fund (“High Yield Fund”) are each a diversified series of the Diamond Hill Funds (the “Trust”) (each a “Fund” and collectively the “Funds”). The Trust is registered under the Investment Company Act of 1940, as amended (the “1940 Act”), as an open-end management company. As an investment company, as defined in Financial Accounting Standards Board (“FASB”) Accounting Standards Update 2013-08, each Fund follows accounting and reporting guidance under FASB Accounting Standards Codification Topic 946, “Financial Services – Investment Companies.”
With the exception of the Mid Cap Fund, Financial Long-Short Fund, Short Duration Fund, Core Bond Fund and High Yield Fund, the Funds offer four classes of shares: Class A, Class C, Class I and Class Y. The Mid Cap Fund, Short Duration Fund, Core Bond Fund and High Yield Fund offer three classes of shares: Class A, Class I and Class Y. The Financial Long-Short Fund offers three classes of shares: Class A, Class C and Class I. Each class of shares for each Fund has identical rights and privileges except with respect to distribution (12b-1) and service fees, voting rights on matters affecting a single class of shares, exchange privileges of each class of shares and sales charges. With the exception of the Short Duration Fund, Core Bond Fund, Corporate Credit Fund and High Yield Fund, Class A has a maximum sales charge on purchases of 5.00% as a percentage of the original purchase price. The Short Duration Fund has a maximum sales charge on purchases of 2.25% and the Core Bond Fund, Corporate Credit Fund and High Yield Fund have a maximum sales charge on purchases of 3.50% as a percentage of the original purchase price. Class C has a contingent deferred sales charge of 1.00% for shares redeemed within one year of the purchase date.
Significant Accounting Policies
The following is a summary of the Funds’ significant accounting policies:
Estimates — The preparation of financial statements in conformity with U.S. generally accepted accounting principles (“GAAP”) requires management to make estimates and assumptions that affect the reported amounts of assets and liabilities and disclosure of contingent assets and liabilities at the date of the financial statements and the reported amounts of income and expenses during the reporting period. Actual results could differ from those estimates.
130 DIAMOND HILL FUNDS | ANNUAL REPORT | DECEMBER 31, 2017 | DIAMOND-HILL.COM |
Diamond Hill Funds
Notes to Financial Statements (Continued)
December 31, 2017
Security valuation — The Funds record their investments at fair value. Fair value is defined as the price that would be received to sell an asset or paid to transfer a liability in an orderly transaction between market participants at the measurement date. The valuation techniques used by the Funds maximize the use of observable inputs and minimize the use of unobservable inputs in determining fair value. These inputs are summarized in the three broad levels listed below:
● | Level 1 — quoted prices in active markets for identical securities |
● | Level 2 — other significant observable inputs (including quoted prices for similar securities, interest rates, prepayment speeds, credit risk, etc.) |
● | Level 3 — significant unobservable inputs (including the Funds’ own assumptions in determining the fair value of investments) |
Listed securities for which market quotations are readily available are valued at the closing prices as determined by the primary exchange where the securities are traded. Unlisted securities or listed securities for which the latest sales prices are not readily available are valued at the closing bid (long positions) or ask (short positions) price in the principal market where such securities are normally traded. Investments in other open-end investment companies are valued at their reported net asset value. In each of these types of situations, valuations are typically categorized as Level 1 in the fair value hierarchy.
Debt securities are valued on the basis of valuations provided by dealers or by an independent pricing service that determines valuations based upon market transactions for normal, institutional-size trading units of similar securities. Short-term debt investments of sufficient credit quality maturing in less than 61 days may be valued at amortized cost, if amortized cost is determined to approximate fair value. In each of these situations, valuations are typically categorized as Level 2 in the fair value hierarchy.
Securities for which market quotations are not readily available (e.g., an approved pricing service does not provide a price, a price becomes stale, or an event occurs that materially affects the furnished price) are valued by the Fair Value Committee. In these cases, the Fair Value Committee, established and appointed by the Board of Trustees, determines in good faith, subject to Trust procedures, the fair value of portfolio securities held by a Fund (“good faith fair valuation”). When a good faith fair valuation of a security is required, consideration is generally given to a number of factors, including, but not limited to the following: dealer quotes, published analyses by dealers or analysts of the situation at issue, transactions implicitly valuing the security (such as a merger, tender offer, etc.), the value of other securities or contracts which derive their value from the security at issue, and the implications (whether negative or positive) of the circumstances which have caused trading in the security to halt. Depending on the source and relative significance of the valuation inputs in these instances, the valuations for these securities may be classified as Level 2 or Level 3 in the fair value hierarchy.
In accordance with procedures adopted by the Trust's Board of Trustees, fair value pricing may be used if events materially affecting the value of foreign equity securities occur between the time the exchange on which they are traded closes and the time the Funds’ net asset values are
DIAMOND HILL FUNDS | ANNUAL REPORT | DECEMBER 31, 2017 | DIAMOND-HILL.COM 131 |
Diamond Hill Funds
Notes to Financial Statements (Continued)
December 31, 2017
calculated. The Funds use a systematic valuation model, provided daily by an independent third party to fair value their international equity securities. These valuations are considered as Level 2 in the fair value hierarchy. As of December 31, 2017, four international securities held in the Research Opportunities Fund were fair valued using this systematic valuation model. These securities had a total fair value of $2,853,960, representing 4.1% of net assets of the Fund.
As of December 31, 2017, the Small Cap Fund and Corporate Credit Fund had approximately 0.9% and 0.2%, respectively, of their net assets valued using estimates provided by the Fair Value Committee.
Changes in valuation techniques may result in transfers in or out of an assigned level within the disclosure hierarchy. The Trust determines transfers between fair value hierarchy levels at the reporting period end. There were no transfers between Levels 1 and 2 as of December 31, 2017 based on input levels assigned at December 31, 2016.
The inputs or methodology used for valuing securities are not necessarily an indication of the risk associated with investing in those securities. For example, short-term debt securities of sufficient credit quality maturing in less than 61 days may be valued using amortized cost in accordance with rules under the 1940 Act. Generally, amortized cost approximates the current fair value of a security, but since the value is not obtained from a quoted price in an active market, such securities are reflected as Level 2. The following is a summary of the inputs used to value the Funds’ investments as of December 31, 2017:
| | | Level 1 - Quoted Prices | | | Level 2 - Other Significant Observable Inputs | | | Level 3 - Significant Unobservable Inputs | | | Total | |
| Investments in Securities (Assets) | | | | | | | | | |
| Small Cap Fund | | | | | | | | | | | | |
| Common Stocks* | | $ | 1,257,485,259 | | | $ | — | | | $ | 14,144,401 | | | $ | 1,271,629,660 | |
| Registered Investment Companies | | | 395,698,051 | | | | — | | | | — | | | | 395,698,051 | |
| Total | | $ | 1,653,183,310 | | | $ | — | | | $ | 14,144,401 | | | $ | 1,667,327,711 | |
| Small-Mid Cap Fund | | | | | | | | | | | | | | | | |
| Common Stocks* | | $ | 2,289,391,027 | | | $ | — | | | $ | — | | | $ | 2,289,391,027 | |
| Registered Investment Companies | | | 436,314,665 | | | | — | | | | — | | | | 436,314,665 | |
| Total | | $ | 2,725,705,692 | | | $ | — | | | $ | — | | | $ | 2,725,705,692 | |
| Mid Cap Fund | | | | | | | | | | | | | | | | |
| Common Stocks* | | $ | 110,192,802 | | | $ | — | | | $ | — | | | $ | 110,192,802 | |
| Registered Investment Companies | | | 20,651,237 | | | | — | | | | — | | | | 20,651,237 | |
| Total | | $ | 130,844,039 | | | $ | — | | | $ | — | | | $ | 130,844,039 | |
| Large Cap Fund | | | | | | | | | | | | | | | | |
| Common Stocks* | | $ | 5,760,615,737 | | | $ | — | | | $ | — | | | $ | 5,760,615,737 | |
| Registered Investment Companies | | | 169,356,009 | | | | — | | | | — | | | | 169,356,009 | |
| Total | | $ | 5,929,971,746 | | | $ | — | | | $ | — | | | $ | 5,929,971,746 | |
132 DIAMOND HILL FUNDS | ANNUAL REPORT | DECEMBER 31, 2017 | DIAMOND-HILL.COM |
Diamond Hill Funds
Notes to Financial Statements (Continued)
December 31, 2017
| | | Level 1 - Quoted Prices | | | Level 2 - Other Significant Observable Inputs | | | Level 3 - Significant Unobservable Inputs | | | Total | |
| All Cap Select Fund | | | | | | | | | | | | |
| Common Stocks* | | $ | 174,857,771 | | | $ | — | | | $ | — | | | $ | 174,857,771 | |
| Registered Investment Companies | | | 10,272,436 | | | | — | | | | — | | | | 10,272,436 | |
| Total | | $ | 185,130,207 | | | $ | — | | | $ | — | | | $ | 185,130,207 | |
| Long-Short Fund | | | | | | | | | | | | | | | | |
| Common Stocks* | | $ | 3,985,970,110 | | | $ | — | | | $ | — | | | $ | 3,985,970,110 | |
| Registered Investment Companies | | | 2,026,857,841 | | | | — | | | | — | | | | 2,026,857,841 | |
| Total | | $ | 6,012,827,951 | | | $ | — | | | $ | — | | | $ | 6,012,827,951 | |
| Research Opportunities Fund | | | | | | | | | | | | | | | | |
| Common Stocks* | | $ | 67,647,176 | | | $ | 2,853,960 | | | $ | — | | | $ | 70,501,136 | |
| Corporate Bonds* | | | — | | | | 703,500 | | | | — | | | | 703,500 | |
| Registered Investment Companies | | | 17,119,913 | | | | — | | | | — | | | | 17,119,913 | |
| Total | | $ | 84,767,089 | | | $ | 3,557,460 | | | $ | — | | | $ | 88,324,549 | |
| Financial Long-Short Fund | | | | | | | | | | | | | | | | |
| Common Stocks* | | $ | 31,924,980 | | | $ | — | | | $ | — | | | $ | 31,924,980 | |
| Registered Investment Companies | | | 11,643,054 | | | | — | | | | — | | | | 11,643,054 | |
| Total | | $ | 43,568,034 | | | $ | — | | | $ | — | | | $ | 43,568,034 | |
| Short Duration Total Return Fund | | | | | | | | | | | | | | | | |
| Corporate Credit* | | $ | — | | | $ | 29,768,396 | | | $ | — | | | $ | 29,768,396 | |
| Securitized* | | | — | | | | 265,028,448 | | | | — | | | | 265,028,448 | |
| Treasury | | | — | | | | 12,954,804 | | | | — | | | | 12,954,804 | |
| Registered Investment Companies | | | 8,408,493 | | | | — | | | | — | | | | 8,408,493 | |
| Total | | $ | 8,408,493 | | | $ | 307,751,648 | | | $ | — | | | $ | 316,160,141 | |
| Core Bond Fund | | | | | | | | | | | | | | | | |
| Corporate Credit* | | $ | — | | | $ | 8,429,900 | | | $ | — | | | $ | 8,429,900 | |
| Government Related* | | | — | | | | 640,841 | | | | — | | | | 640,841 | |
| Securitized* | | | — | | | | 23,981,168 | | | | — | | | | 23,981,168 | |
| Treasury | | | — | | | | 8,220,013 | | | | — | | | | 8,220,013 | |
| Registered Investment Companies | | | 5,753,097 | | | | — | | | | — | | | | 5,753,097 | |
| Total | | $ | 5,753,097 | | | $ | 41,271,922 | | | $ | — | | | $ | 47,025,019 | |
| Corporate Credit Fund | | | | | | | | | | | | | | | | |
| Collateralized Debt Obligations | | $ | — | | | $ | 1,073,812 | | | $ | — | | | $ | 1,073,812 | |
| Corporate Bonds* | | | — | | | | 567,749,470 | | | | — | | | | 567,749,470 | |
| Registered Investment Companies | | | 153,371,911 | | | | — | | | | — | | | | 153,371,911 | |
| Total | | $ | 153,371,911 | | | $ | 568,823,282 | | | $ | — | | | $ | 722,195,193 | |
| High Yield Fund | | | | | | | | | | | | | | | | |
| Corporate Bonds* | | $ | — | | | $ | 29,496,641 | | | $ | — | | | $ | 29,496,641 | |
| Registered Investment Companies | | | 4,303,629 | | | | — | | | | — | | | | 4,303,629 | |
| Total | | $ | 4,303,629 | | | $ | 29,496,641 | | | $ | — | | | $ | 33,800,270 | |
DIAMOND HILL FUNDS | ANNUAL REPORT | DECEMBER 31, 2017 | DIAMOND-HILL.COM 133 |
Diamond Hill Funds
Notes to Financial Statements (Continued)
December 31, 2017
| | | Level 1 - Quoted Prices | | | Level 2 - Other Significant Observable Inputs | | | Level 3 - Significant Unobservable Inputs | | | Total | |
| Investments in Securities Sold Short: (Liabilities) | | | | | | | | | |
| Long-Short Fund | | | | | | | | | | | | |
| Common Stocks* | | $ | (1,164,204,790 | ) | | $ | — | | | $ | — | | | $ | (1,164,204,790 | ) |
| Registered Investment Companies | | | (9,939,633 | ) | | | — | | | | — | | | | (9,939,633 | ) |
| Total | | $ | (1,174,144,423 | ) | | $ | — | | | $ | — | | | $ | (1,174,144,423 | ) |
| Research Opportunities Fund | | | | | | | | | | | | | | | | |
| Common Stocks* | | $ | (12,817,135 | ) | | $ | — | | | $ | — | | | $ | (12,817,135 | ) |
| Financial Long-Short Fund | | | | | | | | | | | | | | | | |
| Common Stocks* | | $ | (4,468,899 | ) | | $ | — | | | $ | — | | | $ | (4,468,899 | ) |
* | See Schedule of Investments and Schedule of Investments Sold Short for industry classification. |
The following table presents the Small Cap Fund's assets measured at fair value on a recurring basis using significant unobservable inputs (Level 3) for the year ended December 31, 2017.
| | | Common Stocks | |
| Value, December 31, 2016 | | $ | 16,040,857 | |
| Purchases | | | — | |
| Sales | | | — | |
| Net realized gains | | | — | |
| Net change in unrealized appreciation (depreciation) | | | (1,896,456 | ) |
| Value, December 31, 2017 | | $ | 14,144,401 | |
There were no transfers in and out of Level 3 as of December 31, 2017.
The following table summarizes the valuation techniques used and unobservable inputs approved and monitored by the Board of Trustees to determine the fair value of Small Cap Fund’s Level 3 common stocks as of December 31, 2017:
| | Fair Value | Valuation
Technique | Unobservable
Input | Range | Impact to
Valuation From a Decrease in Input |
Common Stocks | $ 14,144,401 | Net present value calculation of net asset value of the liquidating trust | Value of assets and liabilities in liquidating trust | $7.48 per share | Decrease in Valuation |
| | | | Discount rate | 9% | Increase in valuation |
This security is presently part of a liquidating trust. The Fair Value Committee’s valuation method for this security is based on calculating a share price based on the net asset value by reviewing the latest available public information on assets and liabilities held in the liquidating trust. Once the
134 DIAMOND HILL FUNDS | ANNUAL REPORT | DECEMBER 31, 2017 | DIAMOND-HILL.COM |
Diamond Hill Funds
Notes to Financial Statements (Continued)
December 31, 2017
net asset value is calculated, the Fair Value Committee applies an appropriate market discount rate used to calculate the net present value of the expected cash flows that will potentially be received by the Fund.
Short sales — The Long-Short Fund, Research Opportunities Fund, Financial Long-Short Fund and Corporate Credit Fund are permitted to make short sales of securities. Short sales are effective when it is believed that the price of a particular security will decline, and involves the sale of a security that the Fund does not own in hope of purchasing the same security at a later date at a lower price. To make delivery to the buyer, a Fund must borrow the security, and the Fund is obligated to return the security to the lender, which is accomplished by a later purchase of the security by the Fund. Cash received from short sales is maintained by the custodian and is used as collateral. It is included as “Cash deposits with custodian for securities sold short” on the Statements of Assets & Liabilities and “Segregated Cash With Custodian” on the Schedules of Investments.
A Fund will incur a loss as a result of a short sale if the price of the security increases between the date of the short sale and the date on which the Fund purchases the security to replace the borrowed security. The use of short sales may cause a Fund to have higher expenses (especially dividend expenses) than those of other equity mutual funds. Short sales are speculative transactions and involve special risks, including greater reliance on the ability of the Funds’ investment adviser, Diamond Hill Capital Management, Inc. (“DHCM”), to accurately anticipate the future value of a security.
Securities lending — Under the terms of the securities lending agreement with State Street Bank and Trust Company (“State Street”), State Street is authorized to loan securities on behalf of the Funds to approved borrowers. The contractual maturity of securities lending transactions are on an overnight and continuous basis. In exchange, the Funds receive cash collateral in the amount of at least 100% of the value of the securities loaned. Any collateral shortfalls due to changes in security market prices are adjusted the next business day. The cash collateral is invested in short-term instruments as noted in each Fund’s Schedule of Investments. Although risk is mitigated by the collateral, the Funds could experience a delay in recovering their securities and possible loss of income or value if the borrower fails to return them. The agreement indemnifies the Funds from losses incurred in the event of a borrower’s material default of the terms and conditions of the borrower agreement. The agreement provides that after predetermined rebates to borrowers, the Funds each retain a portion of their respective net securities lending income and pay State Street the remaining portion.
DIAMOND HILL FUNDS | ANNUAL REPORT | DECEMBER 31, 2017 | DIAMOND-HILL.COM 135 |
Diamond Hill Funds
Notes to Financial Statements (Continued)
December 31, 2017
As of December 31, 2017, the fair value of securities loaned and the collateral held were as follows:
| | Fair Value of Securities Loaned | Fair Value of Collateral Received |
Small Cap Fund | $ 174,409,434 | $ 180,617,431 |
Small-Mid Cap Fund | 213,571,072 | 219,930,698 |
Mid Cap Fund | 8,396,015 | 8,641,780 |
Large Cap Fund | 84,647,687 | 86,832,070 |
All Cap Select Fund | 2,760,348 | 2,872,254 |
Long-Short Fund | 1,240,688,213 | 1,272,963,558 |
Research Opportunities Fund | 16,654,844 | 17,119,913 |
Financial Long-Short Fund | 8,461,616 | 8,709,919 |
Short Duration Total Return Fund | 5,033,679 | 5,135,620 |
Core Bond Fund | 3,309,210 | 3,373,430 |
Corporate Credit Fund | 81,361,198 | 83,038,990 |
High Yield Fund | 3,183,679 | 3,249,893 |
Security transactions — Throughout the reporting period, investment transactions are generally recorded on trade date but no later than the first business day following trade date. For financial reporting purposes, investments are recorded on trade date. The specific identification method is used for determining realized gains or losses for financial statements and income tax purposes. Dividend income is recognized on the ex-dividend date and interest income is recognized on an accrual basis. Discounts and premiums on securities purchased are amortized using the daily effective yield method. The Funds record distributions received from investments in real estate investment trusts (also known as “REITs”) in excess of income from underlying investments as a reduction of cost of investments and/or realized gain. Such amounts are based on estimates if actual amounts are not available and actual amounts of income, realized gain and return of capital may differ from the estimated amounts. The Funds adjust the estimated amounts once the issuers provide information about the actual composition of the distributions.
Share valuation — The net asset value per share of each class of shares of each Fund is calculated daily by dividing the total value of a Fund’s assets attributable to that class, less liabilities attributable to that class, by the number of shares of that class outstanding.
Federal income taxes — The Funds may be subject to taxes imposed by countries in which it invests. Such taxes are generally based on income and/or capital gains earned or repatriated. Taxes are accrued and applied to net investment income, net realized gains and unrealized appreciation as such income and/or gains are earned.
Each Fund has complied and intends to continue to comply with the requirements of the Internal Revenue Code that are applicable to regulated investment companies and to distribute substantially all of its taxable net investment income and any net realized capital gains to its shareholders.
136 DIAMOND HILL FUNDS | ANNUAL REPORT | DECEMBER 31, 2017 | DIAMOND-HILL.COM |
Diamond Hill Funds
Notes to Financial Statements (Continued)
December 31, 2017
The Funds recognize tax benefits or expenses of uncertain tax positions only when the position is “more likely than not” to be sustained assuming examination by tax authorities. Management of the Funds has reviewed tax positions taken in tax years that remain subject to examination by all major tax jurisdictions, including federal (i.e., the previous three tax year ends and the interim tax period since then, as applicable) and has concluded that no provision for unrecognized tax benefits or expenses is required in these financial statements and does not expect this to change over the next twelve months. The Funds recognize interest and penalties, if any, related to unrecognized tax benefits as income tax expense in the Statement of Operations. During the year, the Funds did not incur any interest or penalties.
Distributions to shareholders — Dividends from net investment income are declared and paid monthly for the Short Duration Fund, Core Bond Fund, Corporate Credit Fund and High Yield Fund. Dividends from net investment income are declared and paid on an annual basis for the Small Cap Fund, Small-Mid Cap Fund, Mid Cap Fund, Large Cap Fund, All Cap Select Fund, Long-Short Fund, Research Opportunities Fund and Financial Long-Short Fund. Dividends are declared separately for each class. No class has preferential dividend rights; differences in per share rates are due to differences in the expenses of each class. Net realized capital gains, if any, are distributed at least annually. Distributions from net investment income and from net capital gains are determined in accordance with U.S. income tax regulations, which may differ from GAAP. These differences are primarily due to differing treatments for paydown gains and losses on mortgage-backed securities, expiring capital loss carry-forwards and deferrals of certain losses. Permanent book and tax basis differences are reclassified among the components of net assets. Certain Funds may utilize earnings and profits distributed to shareholders on redemption of shares as part of the dividends paid deduction for income tax purposes.
Allocations — Investment income earned, realized capital gains and losses, and unrealized appreciation and depreciation are allocated daily to each class of shares of a Fund based upon its proportionate share of total net assets of the Fund. Class specific expenses are charged directly to the class incurring the expense. Common expenses, which are not attributable to a specific class, are allocated daily to each class of shares based upon its proportionate share of total net assets of the Fund. Expenses not directly billed to a Fund are allocated proportionally among all Funds daily in relation to net assets of each Fund or another reasonable measure.
Foreign securities risk — Investing in non-U.S. securities may entail risk due to foreign economic and political developments; this risk may be higher when investing in emerging markets. Changes in currency exchange rates and differences in accounting and taxation policies outside the U.S. can raise or lower returns.
Foreign currency translation — The books and records of the Funds are maintained in U.S. dollars. Investment securities and other assets and liabilities denominated in a foreign currency are translated into U.S. dollars on the date of valuation. The Funds do not isolate that portion of realized or unrealized gains and losses resulting from changes in the foreign exchange rate from fluctuations arising from changes in the market prices of the securities. These gains and losses are included in net realized and unrealized gains and losses on investments in the Statements
DIAMOND HILL FUNDS | ANNUAL REPORT | DECEMBER 31, 2017 | DIAMOND-HILL.COM 137 |
Diamond Hill Funds
Notes to Financial Statements (Continued)
December 31, 2017
of Operations. Net realized and unrealized gains and losses on foreign currency transactions represent net foreign exchange gains or losses from foreign currency exchange contracts, disposition of foreign currencies, currency gains or losses realized between trade and settlement dates on securities transactions and the difference between the amount of the investment income and foreign withholding taxes recorded on the Funds’ books and the U.S. dollar equivalent amounts actually received or paid.
Investment Transactions
For the year ended December 31, 2017, purchases and sales (including maturities) of investment securities (excluding short-term securities and U.S. government obligations) were as follows:
| | | Purchases | | | Sales | |
| Small Cap Fund | | $ | 101,976,224 | | | $ | 516,037,602 | |
| Small-Mid Cap Fund | | | 385,067,170 | | | | 345,476,798 | |
| Mid Cap Fund | | | 59,937,495 | | | | 9,699,652 | |
| Large Cap Fund | | | 1,743,926,960 | | | | 880,235,920 | |
| All Cap Select Fund | | | 93,272,105 | | | | 75,073,528 | |
| Long-Short Fund | | | 2,151,617,950 | | | | 1,955,119,339 | |
| Research Opportunities Fund | | | 55,623,034 | | | | 45,181,059 | |
| Financial Long-Short Fund | | | 9,677,097 | | | | 10,912,831 | |
| Short Duration Total Return Fund | | | 328,049,792 | | | | 206,454,461 | |
| Core Bond Fund | | | 18,011,001 | | | | 13,932,897 | |
| Corporate Credit Fund | | | 523,920,693 | | | | 449,882,112 | |
| High Yield Fund | | | 38,271,146 | | | | 40,365,493 | |
The Funds pay commissions on the purchase and sale of investment securities. The commissions are treated as transaction costs and, therefore, are included as part of the cost of purchases or net proceeds on the sale of investment securities and are not included in the presentation of Fund expenses on the Statements of Operations. The Funds paid the following commissions during the year ended December 31, 2017:
| | | Total Commissions | | | Commissions as a % of Average
Net Assets | |
| Small Cap Fund | | $ | 243,418 | | | | 0.02 | % |
| Small-Mid Cap Fund | | | 249,368 | | | | 0.01 | % |
| Mid Cap Fund | | | 27,926 | | | | 0.03 | % |
| Large Cap Fund | | | 740,594 | | | | 0.01 | % |
| All Cap Select Fund | | | 55,517 | | | | 0.04 | % |
| Long-Short Fund | | | 1,300,084 | | | | 0.03 | % |
| Research Opportunities Fund | | | 46,571 | | | | 0.08 | % |
| Financial Long-Short Fund | | | 10,955 | | | | 0.03 | % |
138 DIAMOND HILL FUNDS | ANNUAL REPORT | DECEMBER 31, 2017 | DIAMOND-HILL.COM |
Diamond Hill Funds
Notes to Financial Statements (Continued)
December 31, 2017
Investment Advisory Fees and Other Transactions with Affiliates
As of December 31, 2017, the Small Cap Fund, Small-Mid Cap Fund, Mid Cap Fund, Large Cap Fund, All Cap Select Fund, Long-Short Fund, Research Opportunities Fund, Financial Long-Short Fund, Short Duration Total Return, Core Bond Fund, Corporate Credit Fund and High Yield Fund each receive investment management and advisory services from DHCM under management agreements that provide for fees to be paid monthly at an annual rate of 0.80%, 0.75%, 0.60%, 0.50%, 0.70%, 0.90%, 0.95%, 0.95%, 0.35%, 0.30%, 0.45% and 0.50%, respectively, of the Fund’s average daily net assets. The management agreements are subject to annual approval by the Board of Trustees. In addition, each Fund has entered into an administrative services agreement whereby DHCM is paid a fee monthly at an annual rate of 0.23% for Class A Shares and Class C Shares, 0.18% for Class I Shares and 0.08% for Class Y shares of each class’ average daily net assets. Prior to June 1, 2017, the fees paid by Class A shares, Class C shares, Class I shares and Class Y shares under the administrative services agreement were 0.24%, 0.24%, 0.19% and 0.09%, respectively, of each class’ average daily net assets. These administrative fees are used to pay most of the Funds’ operating expenses except advisory fees, distribution fees, custody fees, brokerage fees, taxes, interest and dividend expense on securities sold short and extraordinary expenses.
Pursuant to Rule 12b-1 under the 1940 Act, the Trust has adopted a distribution plan on behalf of each Fund’s Class A and Class C Shares (the “Plan”). Under the Plan, Class A shares pay a distribution fee monthly at an annual rate of 0.25% of Class A average daily net assets. Class C shares pay distribution and shareholder-servicing fees monthly at an annual rate of 0.75% and 0.25%, respectively, of Class C’s average daily net assets. Class I and Class Y shares are not subject to any distribution or shareholder-servicing fees. The Trust has entered into a Distribution Agreement on behalf of the Funds with Foreside Financial Services, LLC (formerly BHIL Distributors, LLC) (“Distributor”). Pursuant to the Distribution Agreement, the Distributor acts as principal underwriter of each Fund’s shares.
During the year ended December 31, 2017, the Distributor retained the following amounts in sales commissions from the sales of Class A shares of the Funds as follows:
| Small Cap Fund | | $ | 2,703 | |
| Small-Mid Cap Fund | | | 5,590 | |
| Mid Cap Fund | | | 2,699 | |
| Large Cap Fund | | | 40,369 | |
| All Cap Select Fund | | | 984 | |
| Long-Short Fund | | | 17,897 | |
| Research Opportunities Fund | | | 6,171 | |
| Financial Long-Short Fund | | | 5,149 | |
| Short Duration Total Return Fund | | | 2,511 | |
| Corporate Credit Fund | | | 6,752 | |
DIAMOND HILL FUNDS | ANNUAL REPORT | DECEMBER 31, 2017 | DIAMOND-HILL.COM 139 |
Diamond Hill Funds
Notes to Financial Statements (Continued)
December 31, 2017
DHCM, as the financing agent for Class C shares, received contingent deferred sales charges relating to the redemptions of Class C shares of the Funds during the year ended December 31, 2017 as follows:
| Small Cap Fund | | $ | 569 | |
| Small-Mid Cap Fund | | | 2,368 | |
| Large Cap Fund | | | 1,969 | |
| All Cap Select Fund | | | 430 | |
| Long-Short Fund | | | 237 | |
| Research Opportunities Fund | | | 80 | |
| Corporate Credit Fund | | | 210 | |
The Funds may invest in one or more Diamond Hill Funds. The Fund's adviser has contractually agreed to waive fees in the pro-rata amount of the management fee charged by the underlying Diamond Hill Fund on each Fund’s investment in such other Diamond Hill Funds. This fee waiver is accrued daily and settled monthly. During the year ended December 31, 2017, the Funds reduced investment advisory fees as follows:
| Small Cap Fund | | $ | 211,925 | |
| Small-Mid Cap Fund | | | 153,298 | |
| Mid Cap Fund | | | 5,090 | |
| All Cap Select Fund | | | 9,733 | |
| Long-Short Fund | | | 260,623 | |
| Corporate Credit Fund | | | 76,801 | |
The Small Cap Fund, Small-Mid Cap Fund, Mid Cap Fund, All Cap Select Fund, Long-Short Fund and Corporate Credit Fund each own Class Y shares of the Short Duration Total Return Fund, thereby making the Short Duration Total Return Fund an affiliated company as defined by the 1940 Act.
140 DIAMOND HILL FUNDS | ANNUAL REPORT | DECEMBER 31, 2017 | DIAMOND-HILL.COM |
Diamond Hill Funds
Notes to Financial Statements (Continued)
December 31, 2017
Information regarding the Funds’ holdings in the Short Duration Total Return Fund during the year ended December 31, 2017 is as follows:
| Affiliated Fund | | Small Cap Fund | | | Small-Mid Cap Fund | | | Mid Cap Fund | | | All Cap
Select Fund | | | Long-Short Fund | | | Corporate Credit Fund | |
| Short Duration Total Return Fund | | | | | | | | | | | | | | | | | | |
Value,
December 31, 2016 | | $ | 62,169,715 | | | $ | 40,389,081 | | | $ | 804,696 | | | $ | 2,714,551 | | | $ | 60,270,734 | | | $ | 15,644,118 | |
| Purchases | | | 2,131,290 | | | | 6,564,238 | | | | 1,354,099 | | | | 98,712 | | | | 22,683,348 | | | | 10,292,688 | |
| Sales | | | (8,126,000 | ) | | | — | | | | — | | | | — | | | | — | | | | — | |
| Realized Gains | | | 65,225 | | | | — | | | | — | | | | — | | | | — | | | | — | |
| Change in Unrealized Appreciation/Depreciation | | | 471,096 | | | | 317,124 | | | | 5,085 | | | | 21,660 | | | | 507,017 | | | | 135,054 | |
Value,
December 31, 2017 | | $ | 56,711,326 | | | $ | 47,270,443 | | | $ | 2,163,880 | | | $ | 2,834,923 | | | $ | 83,461,099 | | | $ | 26,071,860 | |
| Income Distributions | | $ | 2,059,800 | | | $ | 1,504,649 | | | $ | 51,372 | | | $ | 95,138 | | | $ | 2,578,136 | | | $ | 759,822 | |
During the year ended December 31, 2017, the High Yield Fund sold securities to the Corporate Credit Fund and proceeds totaled $929,215. The High Yield Fund realized gains totaling $14,148 due to the sale of these securities. The Research Opportunities Fund sold securities to the Corporate Credit Fund and High Yield Fund and proceeds totaled $861,496 and $108,494, respectively. The Research Opportunities Fund realized gains totaling $116,393. These transactions, which were effected at the then current market prices as provided by an independent pricing service used by the Trust, complied with Rule 17a-7 under the 1940 Act.
Certain Officers of the Trust are affiliated with DHCM or the Distributor. Such Officers receive no compensation from the Funds for serving in their respective roles.
Trustee Fees
The Independent Trustees are compensated for their services to the Funds by DHCM as part of the administration services agreement. Each Trustee receives an annual retainer of $50,000, an in person meeting fee of $8,000 and a July telephonic meeting fee of $2,000 from DHCM. The Independent Chairperson of the Board also receives an additional $2,500 for each in person meeting. The Audit and Nominating Committee Chairpersons receive an additional $1,500 per Committee meeting. Collectively, the Independent Trustees were paid $350,500 in fees during the year ended December 31, 2017. In addition, DHCM reimburses Trustees for out-of-pocket expenses incurred in conjunction with attendance of meetings.
Commitments and Contingencies
The Funds indemnify the Trust’s Officers and Trustees for certain liabilities that might arise from their performance of their duties to the Funds. Additionally, in the normal course of business, the Funds enter into contracts that contain a variety of representations and warranties and which
DIAMOND HILL FUNDS | ANNUAL REPORT | DECEMBER 31, 2017 | DIAMOND-HILL.COM 141 |
Diamond Hill Funds
Notes to Financial Statements (Continued)
December 31, 2017
provide general indemnifications. The Funds’ maximum exposure under these arrangements is unknown, as this would involve future claims that may be made against the Funds that have not yet occurred. However, based on experience, the Funds expect the risk of loss to be remote.
Federal Tax Information
The amount and character of income and capital gain distributions paid by the Funds are determined in accordance with Federal income tax regulations, which may differ from GAAP. The tax character of distributions paid to shareholders may differ from the character of distributions shown on the Statements of Changes in Net Assets, as certain items such as short-term capital gains are treated as ordinary income for tax purposes.
The tax character of distributions paid during the years ended December 31, 2017 and 2016 was as follows:
| | | Small Cap Fund | | | Small-Mid Cap Fund | | | Mid Cap Fund | |
| | | 2017 | | | 2016 | | | 2017 | | | 2016 | | | 2017 | | | 2016 | |
| Distributions paid from: | | | | | | | | | | | | | | | | | | |
| Ordinary income | | $ | 8,953,988 | | | $ | 3,063,459 | | | $ | 19,398,370 | | | $ | 7,165,001 | | | $ | 748,623 | | | $ | 220,262 | |
| Long-term capital gains | | | 88,772,138 | | | | 43,888,223 | | | | 65,486,019 | | | | 37,788,535 | | | | 1,302,765 | | | | 266,522 | |
| Total distributions | | $ | 97,726,126 | | | $ | 46,951,682 | | | $ | 84,884,389 | | | $ | 44,953,536 | | | $ | 2,051,388 | | | $ | 486,784 | |
| | | Large Cap Fund | | | All Cap Select Fund | | | Long-Short Fund | |
| | | 2017 | | | 2016 | | | 2017 | | | 2016 | | | 2017 | | | 2016 | |
| Distributions paid from: | | | | | | | | | | | | | | | | | | |
| Ordinary income | | $ | 66,986,238 | | | $ | 56,077,970 | | | $ | 156,520 | | | $ | 666,708 | | | $ | 1,671,913 | | | $ | — | |
| Long-term capital gains | | | 200,036,620 | | | | 196,102,312 | | | | — | | | | 1,206,738 | | | | 98,972,122 | | | | 145,311,014 | |
| Total distributions | | $ | 267,022,858 | | | $ | 252,180,282 | | | $ | 156,520 | | | $ | 1,873,446 | | | $ | 100,644,035 | | | $ | 145,311,014 | |
| | | Research Opportunities Fund | | | Financial Long-Short Fund | | | Short Duration Total Return Fund | |
| | | 2017 | | | 2016 | | | 2017 | | | 2016 | | | 2017 | | | 2016 | |
| Distributions paid from: | | | | | | | | | | | | | | | | | | |
| Ordinary income | | $ | — | | | $ | — | | | $ | 34,066 | | | $ | — | | | $ | 9,569,679 | | | $ | 1,680,145 | |
| Long-term capital gains | | | 1,835,991 | | | | 379,125 | | | | — | | | | — | | | | — | �� | | | — | |
| Total distributions | | $ | 1,835,991 | | | $ | 379,125 | | | $ | 34,066 | | | $ | — | | | $ | 9,569,679 | | | $ | 1,680,145 | |
| | | Core Bond Fund | | | Corporate Credit Fund | | | High Yield Fund | |
| | | 2017 | | | 2016 | | | 2017 | | | 2016 | | | 2017 | | | 2016 | |
| Distributions paid from: | | | | | | | | | | | | | | | | | | |
| Ordinary income | | $ | 1,084,775 | | | $ | 301,732 | | | $ | 35,751,753 | | | $ | 25,784,290 | | | $ | 2,578,546 | | | $ | 2,284,238 | |
| Long-term capital gains | | | — | | | | — | | | | — | | | | — | | | | — | | | | — | |
| Total distributions | | $ | 1,084,775 | | | $ | 301,732 | | | $ | 35,751,753 | | | $ | 25,784,290 | | | $ | 2,578,546 | | | $ | 2,284,238 | |
142 DIAMOND HILL FUNDS | ANNUAL REPORT | DECEMBER 31, 2017 | DIAMOND-HILL.COM |
Diamond Hill Funds
Notes to Financial Statements (Continued)
December 31, 2017
The following information is computed on a tax basis for each item as of December 31, 2017:
| | | Small Cap Fund | | | Small-Mid Cap Fund | | | Mid Cap
Fund | | | Large Cap Fund | |
| Net unrealized appreciation (depreciation) on portfolio investments | | $ | 458,989,562 | | | $ | 464,623,111 | | | $ | 14,825,987 | | | $ | 1,540,412,000 | |
| Undistributed ordinary income | | | 304,419 | | | | — | | | | — | | | | 351,642 | |
| Undistributed capital gains | | | 22,881,234 | | | | — | | | | — | | | | 5,247,675 | |
| Post October capital losses | | | — | | | | (8,389,629 | ) | | | (482,873 | ) | | | — | |
| Accumulated capital and other losses | | | — | | | | — | | | | — | | | | — | |
| Accumulated earnings | | $ | 482,175,215 | | | $ | 456,233,482 | | | $ | 14,343,114 | | | $ | 1,546,011,317 | |
| | | All Cap Select
Fund | | | Long-Short Fund | | | Research Opportunities Fund | | | Financial Long-Short Fund | |
| Net unrealized appreciation (depreciation) on portfolio investments | | $ | 30,845,023 | | | $ | 926,658,433 | | | $ | 7,128,336 | | | $ | 3,888,583 | |
| Undistributed ordinary income | | | 608,298 | | | | — | | | | — | | | | 3,567 | |
| Undistributed capital gains | | | 1,971,523 | | | | — | | | | 935,332 | | | | 76,098 | |
| Post October capital losses | | | — | | | | (7,539,355 | ) | | | — | | | | — | |
| Accumulated capital and other losses | | | — | | | | — | | | | — | | | | — | |
| Accumulated earnings | | $ | 33,424,844 | | | $ | 919,119,078 | | | $ | 8,063,668 | | | $ | 3,968,248 | |
| | | Short Duration Total Return Fund | | | Core
Bond Fund | | | Corporate Credit Fund | | | High Yield Fund | |
| Net unrealized appreciation (depreciation) on portfolio investments | | $ | 626,709 | | | $ | (502,417 | ) | | $ | 4,696,421 | | | $ | 604,856 | |
| Undistributed ordinary income | | | 381,382 | | | | 3,751 | | | | — | | | | 25,327 | |
| Undistributed capital gains | | | — | | | | — | | | | — | | | | — | |
| Post October capital losses | | | — | | | | — | | | | (235,196 | ) | | | — | |
| Accumulated capital and other losses | | | — | | | | (24,049 | ) | | | — | | | | — | |
| Accumulated earnings (deficit) | | $ | 1,008,091 | | | $ | (522,715 | ) | | $ | 4,461,225 | | | $ | 630,183 | |
Post October capital losses listed above incurred after October 31, 2017 and within the taxable year, are deemed to arise on the first day of the Funds’ next taxable year.
DIAMOND HILL FUNDS | ANNUAL REPORT | DECEMBER 31, 2017 | DIAMOND-HILL.COM 143 |
Diamond Hill Funds
Notes to Financial Statements (Continued)
December 31, 2017
As of December 31, 2017, the Funds’ federal tax cost of portfolio investments and net unrealized appreciation (depreciation) on portfolio investments were as follows:
| | | Small Cap Fund | | | Small-Mid Cap Fund | | | Mid Cap
Fund | | | Large Cap Fund | |
| Tax cost of portfolio investments | | $ | 1,208,338,149 | | | $ | 2,261,082,581 | | | $ | 116,018,052 | | | $ | 4,389,559,746 | |
| Gross unrealized appreciation | | | 498,041,206 | | | | 533,640,678 | | | | 17,734,778 | | | | 1,607,934,668 | |
| Gross unrealized depreciation | | | (39,051,644 | ) | | | (69,017,567 | ) | | | (2,908,791 | ) | | | (67,522,668 | ) |
| Net unrealized appreciation (depreciation) on portfolio investments | | $ | 458,989,562 | | | $ | 464,623,111 | | | $ | 14,825,987 | | | $ | 1,540,412,000 | |
| | | All Cap Select
Fund | | | Long-Short Fund | | | Research Opportunities Fund | | | Financial Long-Short Fund | |
| Tax cost of portfolio investments | | $ | 154,285,184 | | | $ | 3,912,025,095 | | | $ | 68,379,078 | | | $ | 35,210,552 | |
| Gross unrealized appreciation | | | 32,401,335 | | | | 1,211,966,624 | | | | 13,524,377 | | | | 6,443,778 | |
| Gross unrealized depreciation | | | (1,556,312 | ) | | | (285,308,191 | ) | | | (6,396,041 | ) | | | (2,555,195 | ) |
| Net unrealized appreciation (depreciation) on portfolio investments | | $ | 30,845,023 | | | $ | 926,658,433 | | | $ | 7,128,336 | | | $ | 3,888,583 | |
| | | Short Duration Total Return Fund | | | Core
Bond Fund | | | Corporate Credit Fund | | | High Yield Fund | |
| Tax cost of portfolio investments | | $ | 315,533,432 | | | $ | 47,527,436 | | | $ | 717,498,772 | | | $ | 33,195,414 | |
| Gross unrealized appreciation | | | 1,552,567 | | | | 207,811 | | | | 10,384,762 | | | | 755,010 | |
| Gross unrealized depreciation | | | (925,858 | ) | | | (710,228 | ) | | | (5,688,341 | ) | | | (150,154 | ) |
| Net unrealized appreciation (depreciation) on portfolio investments | | $ | 626,709 | | | $ | (502,417 | ) | | $ | 4,696,421 | | | $ | 604,856 | |
The difference between book basis and tax basis net unrealized appreciation (depreciation) is attributable primarily to the tax deferral of losses on wash sales.
As of the latest tax year ended December 31, 2017, the following Funds have capital loss carry forwards (“CLCFs”) as summarized in the tables below.
CLCFs not subject to expiration:
| | | Core Bond Fund | |
| No expiration - short-term | | | 17,670 | |
| No expiration - long-term | | | 6,379 | |
| | | $ | 24,049 | |
As of the latest tax year ended December 31, 2017, the All Cap Select Fund, Financial Long Short Fund, Core Bond Fund and Corporate Credit Fund utilized $12,428,881, $2,905,819, $7,410 and $387,388, respectively, of CLCFs.
144 DIAMOND HILL FUNDS | ANNUAL REPORT | DECEMBER 31, 2017 | DIAMOND-HILL.COM |
Diamond Hill Funds
Notes to Financial Statements (Continued)
December 31, 2017
The tax character of current year distributions paid and the tax basis of the current components of accumulated earnings (deficit) and any net CLCFs will be determined at the end of the current tax year.
Reclassification of capital accounts – Reclassifications result primarily from the difference in the tax treatment of net investment loss, distributions in excess of net investment income, utilization of earnings and profits on shareholder redemptions, investment in REITS and publicly traded partnerships. The following reclassifications have no impact on the net assets or net asset value per share of the Funds and are designed to present the Fund’s capital accounts on a tax basis:
| | | Paid-In Capital | | | Undistributed Net Investment Income (Loss) | | | Accumulated Net Realized Gains (Losses) | |
| Small Cap Fund | | $ | 13,366,326 | | | $ | (903,929 | ) | | $ | (12,462,397 | ) |
| Small-Mid Cap Fund | | | 7,414,174 | | | | 493,453 | | | | (7,907,627 | ) |
| Mid Cap Fund | | | 129,179 | | | | 8,053 | | | | (137,232 | ) |
| Large Cap Fund | | | 25,087,686 | | | | 285,419 | | | | (25,373,105 | ) |
| All Cap Select Fund | | | 13,888 | | | | — | | | | (13,888 | ) |
| Long-Short Fund | | | 16,482,906 | | | | (221,101 | ) | | | (16,261,805 | ) |
| Research Opportunities Fund | | | 118,021 | | | | 55,652 | | | | (173,673 | ) |
| Financial Long-Short Fund | | | — | | | | (137,975 | ) | | | 137,975 | |
| Short Duration Total Return Fund | | | — | | | | 368,568 | | | | (368,568 | ) |
| Core Bond Fund | | | — | | | | 51,888 | | | | (51,888 | ) |
| Corporate Credit Fund | | | (79,889 | ) | | | (94,739 | ) | | | 174,628 | |
| High Yield Fund | | | 150,156 | | | | 3,148 | | | | (153,304 | ) |
Line of Credit
The Small Cap Fund, Small-Mid Cap Fund, Mid Cap Fund, Large Cap Fund, All Cap Select Fund, Long-Short Fund, Research Opportunities Fund, Financial Long-Short Fund, Short Duration Total Return, Core Bond Fund, Corporate Credit Fund and High Yield Fund each has an unsecured line of credit up to 20.0%, 20.0%, 20.0%, 33.3%, 25.0%, 15.0%, 15.0%, 10.0%, 20.0%, 20.0%, 15.0% and 15.0%, respectively, of its net assets, with a total maximum of $40,000,000.
Borrowings under the agreement bear interest at the prime rate as announced by the lending bank. The line of credit is available until June 6, 2018, unless extended, when any advances are to be repaid. During the year ended December 31, 2017, no amounts were drawn from the available lines.
In-Kind Subscription Transactions
For the year ended December 31, 2017, the Small Cap Fund and Large Cap Fund received securities in lieu of cash for two shareholder purchases. The value of the purchases were as follows:
| Fund | | | Date | | | Subscription | | | Securities | | | Cash | | | Shares Received | |
Large Cap Fund | | | | 09/08/17 | | | $ | 10,046,249 | | | $ | 9,948,788 | | | $ | 97,461 | | | | 393,354 | |
Small Cap Fund | | | | 11/01/17 | | | | 2,618,946 | | | | 2,132,623 | | | | 486,323 | | | | 69,783 | |
DIAMOND HILL FUNDS | ANNUAL REPORT | DECEMBER 31, 2017 | DIAMOND-HILL.COM 145 |
Diamond Hill Funds
Notes to Financial Statements (Continued)
December 31, 2017
Subsequent Events
The Funds evaluated events from December 31, 2017 through the date that these financial statements were issued. There were no subsequent events to report that would have a material impact on the Funds’ financial statements, other than disclosed below:
On January 2, 2018, the Diamond Hill Global Fund commenced public offering and investment operations. The investment objective of the Diamond Hill Global Fund is to provide long-term capital appreciation. The Diamond Hill Global Fund is co-managed by Grady Burkett and Richard Snowdon.
Effective February 28, 2018, the administration fee decreased for Class A shares from 0.23% to 0.21%, for Class C shares from 0.23% to 0.21%, for Class I shares from 0.18% to 0.17% and for Class Y shares from 0.08% to 0.05%.
146 DIAMOND HILL FUNDS | ANNUAL REPORT | DECEMBER 31, 2017 | DIAMOND-HILL.COM |
Report of Independent Registered Public Accounting Firm
To the Shareholders and the Board of Trustees of Diamond Hill Funds
Opinion on the Financial Statements
We have audited the accompanying statements of assets and liabilities of Diamond Hill Funds (the “Trust”) (comprising of Diamond Hill Small Cap Fund, Diamond Hill Small-Mid Cap Fund, Diamond Hill Mid Cap Fund, Diamond Hill Large Cap Fund, Diamond Hill All Cap Select Fund (formerly, Diamond Hill Select Fund), Diamond Hill Long-Short Fund, Diamond Hill Research Opportunities Fund, Diamond Hill Financial Long-Short Fund, Diamond Hill Short Duration Total Return Fund, Diamond Hill Core Bond Fund, Diamond Hill Corporate Credit Fund and Diamond Hill High Yield Fund) (collectively referred to as the “Funds”), including the schedules of investments, as of December 31, 2017, and the related statements of operations, and changes in net assets, and the financial highlights for each of the periods indicated in the table below and the related notes (collectively referred to as the “financial statements”). In our opinion, the financial statements present fairly, in all material respects, the financial position of the each of the Funds comprising Diamond Hill Funds at December 31, 2017, the results of their operations, changes in net assets and financial highlights for each of the periods indicated in the table below, in conformity with U.S. generally accepted accounting principles.
Diamond Hill Funds | Statement of operations | Statement of changes in net assets | Financial highlights |
Diamond Hill Small Cap Fund Diamond Hill Small-Mid Cap Fund Diamond Hill Mid Cap Fund Diamond Hill Large Cap Fund Diamond Hill All Cap Select Fund Diamond Hill Long-Short Fund Diamond Hill Research Opportunities Fund Diamond Hill Financial Long-Short Fund Diamond Hill Corporate Credit Fund | For the year ended December 31, 2017 | For each of the two years in the period ended December 31, 2017 | For each of the five years in the period ended December 31, 2017 |
Diamond Hill High Yield Fund | For the year ended December 31, 2017 | For the year ended December 31, 2017 and the period from January 4, 2016 (commencement of operations) through December 31, 2016 |
Diamond Hill Short Duration Total Return Fund Diamond Hill Core Bond Fund | For the year ended December 31, 2017 | For the year ended December 31, 2017 and the period from July 5, 2016 (commencement of operations) through December 31, 2016 |
Basis for Opinion
These financial statements are the responsibility of the Trust’s management. Our responsibility is to express an opinion on each of the Funds’ financial statements based on our audits. We are a public accounting firm registered with the Public Company Accounting Oversight Board (United States) (“PCAOB”) and are required to be independent with respect to the Trust in accordance with the U.S. federal securities laws and the applicable rules and regulations of the Securities and Exchange Commission and the PCAOB.
DIAMOND HILL FUNDS | ANNUAL REPORT | DECEMBER 31, 2017 | DIAMOND-HILL.COM 147 |
Report of Independent Registered Public Accounting Firm (Continued)
We conducted our audits in accordance with the standards of the PCAOB. Those standards require that we plan and perform the audit to obtain reasonable assurance about whether the financial statements are free of material misstatement, whether due to error or fraud. The Trust is not required to have, nor were we engaged to perform, an audit of the Trust’s internal control over financial reporting. As part of our audits we are required to obtain an understanding of internal control over financial reporting but not for the purpose of expressing an opinion on the effectiveness of the Trust’s internal control over financial reporting. Accordingly, we express no such opinion.
Our audits included performing procedures to assess the risks of material misstatement of the financial statements, whether due to error or fraud, and performing procedures that respond to those risks. Such procedures included examining, on a test basis, evidence regarding the amounts and disclosures in the financial statements. Our procedures included confirmation of securities owned as of December 31, 2017, by correspondence with the custodians and brokers or by other appropriate auditing procedures where replies from brokers were not received. Our audits also included evaluating the accounting principles used and significant estimates made by management, as well as evaluating the overall presentation of the financial statements. We believe that our audits provide a reasonable basis for our opinion.

We have served as the Trust’s auditor since 2003.
Cincinnati, Ohio
February 16, 2018
148 DIAMOND HILL FUNDS | ANNUAL REPORT | DECEMBER 31, 2017 | DIAMOND-HILL.COM |
Diamond Hill Funds
Other Items
December 31, 2017 (Unaudited)
Proxy Voting
The investment adviser is responsible for exercising the voting rights associated with the securities purchased and held by the Funds. A description of the policies and procedures that the adviser uses in fulfilling this responsibility and information regarding how those proxies were voted during the twelve-month period ended June 30 are available without charge upon request by calling toll free 1-888-226-5595 or on the Securities and Exchange Commission’s (“Commission”) website at www.sec.gov.
Portfolio Disclosure
The Trust files a complete listing of portfolio holdings for each Fund as of the end of the first and third quarters of each fiscal year on Form N-Q and each second and fourth quarters of each fiscal year on Form N-CSR. The complete listing (i) is available on the Commission’s website; (ii) may be reviewed and copied at the Commission’s Public Reference Room in Washington, DC; and (iii) will be made available to shareholders upon request by calling 1-888-226-5595. Information on the operation of the Public Reference Room may be obtained by calling 1-800-SEC-0330. Monthly portfolio holdings are also available on www.diamond-hill.com.
Dividends Received Deduction
For corporate shareholders, the following percentages of ordinary dividends paid during the year ended December 31, 2017 qualify for the corporate dividends received deduction:
Small Cap Fund | 100.00% |
Small-Mid Cap Fund | 100.00% |
Mid Cap Fund | 100.00% |
Large Cap Fund | 100.00% |
All Cap Select Fund | 100.00% |
Long-Short Fund | 100.00% |
Financial Long-Short Fund | 100.00% |
Short Duration Total Return Fund | 0.00% |
Core Bond Fund | 0.00% |
Corporate Credit Fund | 0.00% |
High Yield Fund | 0.00% |
Qualified Dividend Income
The Funds have designated the maximum amount allowable of their net taxable income as qualified dividend income as provided in the Jobs and Growth Tax Relief Reconciliation Act of 2003. This amount was reflected on form 1099-DIV for the calendar year 2017.
DIAMOND HILL FUNDS | ANNUAL REPORT | DECEMBER 31, 2017 | DIAMOND-HILL.COM 149 |
Diamond Hill Funds
Other Items
December 31, 2017 (Unaudited) (Continued)
Capital Gain Distribution
For the year ended December 31, 2017, the following Funds designated long-term capital gain distributions:
| | Small Cap Fund | | | $ | 88,772,138 | |
| | Small-Mid Cap Fund | | | | 65,486,019 | |
| | Mid Cap Fund | | | | 1,302,765 | |
| | Large Cap Fund | | | | 200,036,619 | |
| | Long-Short Fund | | | | 98,972,122 | |
| | Research Opportunities Fund | | | | 1,835,991 | |
Trustee Approval of Investment Advisory Agreement
Renewal of Management Agreement for All Funds
The Trustees of Diamond Hill Funds (the “Trust”) considered a broad range of information specifically requested and relating to its consideration of the continuance of the investment advisory agreement at regularly scheduled meetings on July 19, 2017, and August 17, 2017. By a unanimous vote, the Trustees approved the Amended and Restated Investment Management Agreement (“Management Agreement”) between the Trust and Diamond Hill Capital Management, Inc. (the “Adviser”), for each series of the Trust (each separately, a “Fund”). The following disclosure encompasses the discussion at the August 17, 2017, meeting. The Trustees discussed the following factors, on a Fund-by-Fund basis, in connection with the Trust’s Management Agreement:
a) | Nature, Extent and Quality of Services. The Trustees considered the nature, extent and quality of the services provided by the Adviser under the Management Agreement, including a review of the services provided thereunder, the fee rates, fees paid, and expenses assumed. They also considered the Adviser’s overall reputation, integrity and mission to serve its clients through a disciplined intrinsic-value-based approach to investment that aligns the Adviser’s interests with those of its clients. The Trustees noted the qualifications of the investment staff and other key personnel of the Adviser and that the Adviser continues to invest significant resources in human capital and attract and retain top talent. The Trustees also reviewed the Adviser’s succession plan for key investment and management staff. In addition, the Trustees reviewed information related to the compensation structure for portfolio managers and other key investment personnel. |
| In evaluating the performance of each Fund, the Trustees reviewed each Fund’s absolute performance, performance relative to its passive benchmark, and performance relative to its peer group and Morningstar category ranking as of June 30, 2017. |
b) | Reasonableness of Investment Advisory Fees. The Trustees noted that the contractual fee rates under the Management Agreement were below both the average and median rates of each Fund’s Morningstar category. |
150 DIAMOND HILL FUNDS | ANNUAL REPORT | DECEMBER 31, 2017 | DIAMOND-HILL.COM |
Diamond Hill Funds
Other Items
December 31, 2017 (Unaudited) (Continued)
c) | Reasonableness of Total Expenses. The Trustees noted that the total expenses for all share classes of the Funds were at or below the median total expenses of comparable funds within each Fund’s respective Morningstar category, with the exception of the Short Duration Total Return Fund’s total expenses which were in line with the average and median for the Short-Term Bond category. |
d) | Reasonableness of Investment Advisory Fees as Compared to Fees Charged to Other Clients. The Trustees reviewed the fees paid by each of the Adviser’s other clients, as well as a summary of the differences in services provided and how these differences affect fees, including the difference between acting as an adviser versus a sub-adviser. With limited exceptions, investment advisory fees charged by the Adviser to the Funds were comparable to the investment advisory fees the Adviser charges to its other similarly managed accounts (i.e., private partnerships and separately managed accounts). |
e) | Profitability. The Trustees considered the reasonableness of each Fund’s profitability to the Adviser and the Adviser’s methodology for calculating its profitability. The Trustees concluded that the Adviser’s pre-tax profit margin under the Management Agreement represented a fair and entrepreneurial profit for managing the Funds. The Trustees noted that the Adviser is also the administrator to the Funds (under the Administration Agreement”) and the Trustees reviewed a separate profitability analysis relating to the administrative services provided to the Funds. The Trustees concluded that the administration margin under the Administration Agreement represented a fair and entrepreneurial profit for managing the Funds. |
f) | Economies of Scale. The Trustees reviewed the potential extent to which economies of scale would be realized as each Fund grows and whether fee levels reflect these economies of scale for the benefit of Fund shareholders. They noted that while many advisory firms reduce fees as assets under management increase with predetermined break points, the Adviser has adopted a different strategy. The Trustees considered that rather than instituting break points, the Adviser has targeted its advisory fees to correspond to its mission to add value, meaning that rather than charging a lower fee on assets above a certain level, the Adviser prefers to close a strategy to new investors so that it can efficiently manage the Fund’s assets and attempt to fulfill its responsibility to add value to existing investors. The Trustees noted that three of the Funds are currently closed to most new investors. The Trustees also noted that the Adviser has a history of voluntarily reducing its fees under the Administration Agreement when asset growth allows for the sharing of economies of scale, with the most recent reduction taking place on June 1, 2017. |
g) | Ancillary Benefits. The Trustees considered ancillary benefits received by the Adviser as a result of its relationship with the Funds, including the ability to negotiate favorable commissions rates and have access to research that benefits all of the Adviser’s clients, the ability to serve as sub-adviser to other mutual funds, and the ability to launch an exchange-traded fund. The Trustees noted that the Adviser is the administrator to the Funds (under the Administration Agreement) and is expected to earn fees from the Funds for providing administrative services. The fees were shown separately in the profitability analysis presented |
DIAMOND HILL FUNDS | ANNUAL REPORT | DECEMBER 31, 2017 | DIAMOND-HILL.COM 151 |
Diamond Hill Funds
Other Items
December 31, 2017 (Unaudited) (Continued)
to the Trustees. The Trustees also considered revenue and expenses of the Administrator for providing financing arrangements related to the payment of commissions to financial intermediaries for the sale of Class C Shares of the Funds.
In their deliberations, there was a comprehensive consideration of each of the factors above in connection with each Fund, and the Trustees, all of whom qualify as Independent Trustees under the 1940 Act, concluded the compensation to be received by the Adviser from each Fund was fair and reasonable and the continuance of the Management Agreement for all of the Funds was in the best interests of each Fund and its shareholders.
152 DIAMOND HILL FUNDS | ANNUAL REPORT | DECEMBER 31, 2017 | DIAMOND-HILL.COM |
Diamond Hill Funds
Schedule of Shareholder Expenses
Hypothetical Example of a $1,000 Investment at Beginning of Period
(Unaudited)
As a Fund shareholder, you may incur two types of costs: (1) transaction costs, including wire redemption fees and sales charges (loads) as applicable; and (2) ongoing costs, including management fees; distribution and service (12b-1) fees; and other Fund expenses. These examples are intended to help you understand your ongoing costs (in dollars) of investing in a Fund and to compare these costs with the ongoing costs of investing in other mutual funds. Please note that the expenses shown in the tables are meant to highlight your ongoing costs only and do not reflect any transactional costs or other fees that may apply, such as sales charges and fees for low balance accounts. Therefore, the examples are useful in comparing ongoing costs only and will not help you determine the relative total cost of owning different funds. In addition, if these transactional costs and other fees were included, your costs would have been higher.
These examples are based on an investment of $1,000 invested at July 1, 2017 and held for the entire period from July 1, 2017 through December 31, 2017.
The Actual Expense example below provides information about actual account values and actual expenses. You may use this information, together with the amount you invested, to estimate the expenses that you paid over the period. Simply divide your account value by $1,000 (for example, an $8,600 account value divided by $1,000 = 8.6), then multiply the result by the number in the table under the heading entitled “Expenses paid during the period” to estimate the expenses you paid on your account during this period.
The Hypothetical Expense example below provides information about hypothetical account values and hypothetical expenses based on each Fund’s actual expense ratio and an assumed rate of return of 5% per year before expenses, which is not each Fund’s actual return. The hypothetical account values and expenses may not be used to estimate the actual ending account balance or expenses you paid for the period. You may use this information to compare the ongoing costs of investing in this Fund and other funds. To do so, compare this 5% hypothetical example with the 5% hypothetical examples that appear in the shareholder reports of the other funds.
| | Account value
at the beginning
of the period ($) | Account value
at the end
of the period ($) | Expenses paid
during
the period ($)* | Funds annualized expense ratio (%) |
| Actual | Hypothetical | Actual | Hypothetical | Actual | Hypothetical | Actual |
Small Cap Fund | | | | | | | |
Class A | 1,000.00 | 1,000.00 | 1,016.90 | 1,018.82 | 6.44 | 6.45 | 1.27% |
Class C | 1,000.00 | 1,000.00 | 1,012.90 | 1,015.04 | 10.23 | 10.25 | 2.02% |
Class I | 1,000.00 | 1,000.00 | 1,018.10 | 1,020.33 | 4.92 | 4.93 | 0.97% |
Class Y | 1,000.00 | 1,000.00 | 1,018.60 | 1,020.83 | 4.41 | 4.42 | 0.87% |
Small-Mid Cap Fund | | | | | | |
Class A | 1,000.00 | 1,000.00 | 1,034.50 | 1,019.04 | 6.27 | 6.23 | 1.22% |
Class C | 1,000.00 | 1,000.00 | 1,030.10 | 1,015.26 | 10.10 | 10.03 | 1.97% |
Class I | 1,000.00 | 1,000.00 | 1,035.50 | 1,020.55 | 4.74 | 4.70 | 0.92% |
Class Y | 1,000.00 | 1,000.00 | 1,036.40 | 1,021.06 | 4.23 | 4.19 | 0.82% |
DIAMOND HILL FUNDS | ANNUAL REPORT | DECEMBER 31, 2017 | DIAMOND-HILL.COM 153 |
Diamond Hill Funds
Schedule of Shareholder Expenses
Hypothetical Example of a $1,000 Investment at Beginning of Period
(Unaudited) (Continued)
| | Account value
at the beginning
of the period ($) | Account value
at the end
of the period ($) | Expenses paid
during
the period ($)* | Funds annualized expense ratio (%) |
| Actual | Hypothetical | Actual | Hypothetical | Actual | Hypothetical | Actual |
Mid Cap Fund | | | | | | |
Class A | 1,000.00 | 1,000.00 | 1,038.90 | 1,019.79 | 5.52 | 5.47 | 1.07% |
Class I | 1,000.00 | 1,000.00 | 1,041.20 | 1,021.30 | 3.98 | 3.94 | 0.77% |
Class Y | 1,000.00 | 1,000.00 | 1,041.10 | 1,021.81 | 3.47 | 3.44 | 0.67% |
Large Cap Fund | | | | | | | |
Class A | 1,000.00 | 1,000.00 | 1,094.10 | 1,020.27 | 5.17 | 4.99 | 0.98% |
Class C | 1,000.00 | 1,000.00 | 1,089.80 | 1,016.49 | 9.11 | 8.79 | 1.73% |
Class I | 1,000.00 | 1,000.00 | 1,095.30 | 1,021.78 | 3.59 | 3.46 | 0.68% |
Class Y | 1,000.00 | 1,000.00 | 1,096.10 | 1,022.28 | 3.06 | 2.95 | 0.58% |
All Cap Select Fund | | | | | |
Class A | 1,000.00 | 1,000.00 | 1,062.90 | 1,019.29 | 6.10 | 5.97 | 1.17% |
Class C | 1,000.00 | 1,000.00 | 1,059.10 | 1,015.51 | 9.98 | 9.77 | 1.92% |
Class I | 1,000.00 | 1,000.00 | 1,064.90 | 1,020.80 | 4.54 | 4.45 | 0.87% |
Class Y | 1,000.00 | 1,000.00 | 1,064.80 | 1,021.31 | 4.02 | 3.94 | 0.77% |
Long-Short Fund | | | | | | |
Class A | 1,000.00 | 1,000.00 | 1,034.10 | 1,015.56 | 9.81 | 9.73 | 1.91% |
Class C | 1,000.00 | 1,000.00 | 1,030.20 | 1,011.77 | 13.64 | 13.51 | 2.66% |
Class I | 1,000.00 | 1,000.00 | 1,035.80 | 1,017.07 | 8.28 | 8.21 | 1.61% |
Class Y | 1,000.00 | 1,000.00 | 1,036.00 | 1,017.57 | 7.77 | 7.70 | 1.51% |
Research Opportunities Fund | | | | | |
Class A | 1,000.00 | 1,000.00 | 1,079.30 | 1,015.91 | 9.66 | 9.36 | 1.84% |
Class C | 1,000.00 | 1,000.00 | 1,075.80 | 1,012.13 | 13.57 | 13.16 | 2.59% |
Class I | 1,000.00 | 1,000.00 | 1,081.40 | 1,017.42 | 8.10 | 7.85 | 1.54% |
Class Y | 1,000.00 | 1,000.00 | 1,081.80 | 1,017.93 | 7.57 | 7.34 | 1.44% |
Financial Long-Short Fund | | | | | | |
Class A | 1,000.00 | 1,000.00 | 1,047.90 | 1,016.13 | 9.29 | 9.14 | 1.80% |
Class C | 1,000.00 | 1,000.00 | 1,044.20 | 1,012.35 | 13.14 | 12.93 | 2.55% |
Class I | 1,000.00 | 1,000.00 | 1,049.20 | 1,017.65 | 7.75 | 7.63 | 1.50% |
Short Duration Total Return Fund | | | | | |
Class A | 1,000.00 | 1,000.00 | 1,022.20 | 1,021.04 | 4.21 | 4.21 | 0.83% |
Class I | 1,000.00 | 1,000.00 | 1,024.20 | 1,022.54 | 2.70 | 2.70 | 0.53% |
Class Y | 1,000.00 | 1,000.00 | 1,025.80 | 1,023.04 | 2.20 | 2.19 | 0.43% |
Core Bond Fund | | | | | | |
Class A | 1,000.00 | 1,000.00 | 1,026.70 | 1,021.26 | 4.00 | 3.99 | 0.78% |
Class I | 1,000.00 | 1,000.00 | 1,029.10 | 1,022.77 | 2.47 | 2.46 | 0.48% |
Class Y | 1,000.00 | 1,000.00 | 1,029.50 | 1,023.28 | 1.96 | 1.95 | 0.38% |
Corporate Credit Fund | | | | | | |
Class A | 1,000.00 | 1,000.00 | 1,049.40 | 1,020.58 | 4.74 | 4.67 | 0.92% |
Class C | 1,000.00 | 1,000.00 | 1,045.70 | 1,016.80 | 8.59 | 8.47 | 1.67% |
Class I | 1,000.00 | 1,000.00 | 1,051.10 | 1,022.10 | 3.19 | 3.14 | 0.62% |
Class Y | 1,000.00 | 1,000.00 | 1,050.70 | 1,022.60 | 2.67 | 2.63 | 0.52% |
154 DIAMOND HILL FUNDS | ANNUAL REPORT | DECEMBER 31, 2017 | DIAMOND-HILL.COM |
Diamond Hill Funds
Schedule of Shareholder Expenses
Hypothetical Example of a $1,000 Investment at Beginning of Period
(Unaudited) (Continued)
| | Account value
at the beginning
of the period ($) | Account value
at the end
of the period ($) | Expenses paid
during
the period ($)* | Funds annualized expense ratio (%) |
| Actual | Hypothetical | Actual | Hypothetical | Actual | Hypothetical | Actual |
High Yield Fund | | | | | | | |
Class A | 1,000.00 | 1,000.00 | 1,066.80 | 1,020.25 | 5.12 | 5.01 | 0.98% |
Class I | 1,000.00 | 1,000.00 | 1,068.20 | 1,021.76 | 3.56 | 3.48 | 0.68% |
Class Y | 1,000.00 | 1,000.00 | 1,068.70 | 1,022.26 | 3.04 | 2.98 | 0.58% |
* | Expenses are equal to the Fund’s annualized expense ratio, multiplied by the average account value over the period, multiplied by the number of days in the most recent fiscal half-year divided by the number of days in the fiscal year (to reflect the one-half year period). |
You can find more information about the Fund’s expenses, including annual expense ratios for historical periods in the Financial Highlights section of this report. For additional information on operating expenses and other shareholder costs, please refer to the Fund’s prospectus. The prospectus presents hypothetical shareholder costs over various time periods based upon a $10,000 investment and a return of 5% a year. The standardized example, which appears in all mutual fund prospectuses, may be useful to you in comparing the costs of investing in different funds.
DIAMOND HILL FUNDS | ANNUAL REPORT | DECEMBER 31, 2017 | DIAMOND-HILL.COM 155 |
Diamond Hill Funds
Management of the Trust (unaudited)
Listed in the charts below is basic information regarding the Trustees and Officers of the Trust.
INDEPENDENT TRUSTEES:
Name/Address/1
Age | Position(s)
Held with
Trust | Term of
Office2
and
Length
of Time
Served | Principal Occupation(s)
At Least The Last 5 Years | Number of
Portfolios
in Fund
Complex
Overseen
by Trustee | Other
Directorships Held by
Trustee |
Tamara L. Fagely
Year of Birth: 1958 | Trustee | Since November 2014 | Retired, January 2014 to present; Chief Operations Officer, Hartford Funds, 2012 to 2013; Chief Financial Officer, Hartford Funds, 2010 to 2012; Treasurer, Hartford Funds, 2001 to 2012. | 13 | Allianz Variable Insurance Products Trust and Allianz Variable Insurance Products Fund of Funds Trust, December 2017 to present |
Elizabeth P. Kessler
Year of Birth: 1968 | Trustee | Since November 2005 | Partner in Charge, Columbus Ohio Office, Jones Day, January 2009 to present. | 13 | None |
D’Ray Moore Rice
Year of Birth: 1959 | Chairman Trustee | Since February 2014 Since August 2007 | Retired, Community Volunteer, November 2001 to present. Independent Trustee of Advisors Investment Trust, July 2011 to present. | 13 | Advisors Investment Trust, July 2011 to present |
Peter E. Sundman Year of Birth: 1959 | Trustee | Since November 2012 | Retired 2012 to present. | 13 | None |
156 DIAMOND HILL FUNDS | ANNUAL REPORT | DECEMBER 31, 2017 | DIAMOND-HILL.COM |
Diamond Hill Funds
PRINCIPAL OFFICERS:
Name/Address/1
Age | Position(s)
Held with Trust | Term of Office and
Length of Time Served2 | Principal Occupation(s)
At Least The Last 5 Years |
Thomas E. Line Year of Birth: 1967 | Chief Executive Officer | Since November 2014 | Chief Financial Officer and Treasurer of Diamond Hill Investment Group, Inc., from January 2015 to present. Managing Director – Finance of Diamond Hill Investment Group, Inc., April 2014 to January 2015; Chief Operating Officer of Lancaster Pollard & Company, January 2012 to April 2014; Managing Director and Chief Financial Officer of Red Capital Group, October 2005 to January 2012. |
Gary R. Young Year of Birth: 1969 | President | Since November 2014 | Secretary of the Trust, May 2004 to November 2014; Chief Administrative Officer of the Trust, October 2010 to November 2014; Managing Director — Administration of Diamond Hill Capital Management, Inc., January 2015 to present; Chief Compliance Officer of Diamond Hill Capital Management Inc., October 2010 to present; Controller of Diamond Hill Investment Group, Inc., April 2004 to March 2015. |
Karen R. Colvin Year of Birth: 1966 | Vice President Secretary | Since November 2011 Since November 2014 | Director-Fund Administration & Sales Support, Diamond Hill Capital Management, Inc., June 2009 to present. |
Maureen K. Goldenberg Year of Birth: 1968 | Chief Compliance Officer | Since October 2017 | Director-Compliance, Diamond Hill Capital Management, Inc., September 2017 to present; Chief Compliance Officer, Rockbridge Capital LLC, 2016 to 2017; Partner/Chief Compliance Officer North America Investments & Canada, Mercer Investments, Inc., 2015 to 2016; Vice President and Chief Compliance Officer, Fund Evaluation Group, LLC, 2011 to 2015. |
Julie A. Roach Year of Birth: 1971 | Treasurer | Since October 2017 | Director-Fund Administration, Diamond Hill Capital Management, Inc., September 2017 to present; Assistant Treasurer - Head of Valuation Oversight, J.P. Morgan Asset Management, February 2012 to 2017. |
1 | The address of each Trustee and Officer is 325 John H. McConnell Boulevard — Suite 200, Columbus, Ohio 43215. |
2 | Each Trustee is elected to serve in accordance with the Declaration of Trust and Bylaws of the Trust until their resignation, removal or retirement. Trustees have a 15-year term limit. Each Officer is elected by the Trustees for a 1-year term to serve the Trust or until their resignation, removal or retirement. |
The Statement of Additional Information contains additional information about the Trustees and is available without charge on www.diamond-hill.com or by calling 1-888-226-5595.
DIAMOND HILL FUNDS | ANNUAL REPORT | DECEMBER 31, 2017 | DIAMOND-HILL.COM 157 |

INVESTMENT ADVISER: DIAMOND HILL CAPITAL MANAGEMENT, INC.
DISTRIBUTOR: FORESIDE FINANCIAL SERVICES, LLC (MEMBER FINRA)
DIAMOND-HILL.COM | 855.255.8955 | 325 JOHN H. MCCONNELL BLVD | SUITE 200 | COLUMBUS, OHIO | 43215
DH-AR123117
(a) The registrant has adopted a code of ethics that applies to the registrant’s principal executive officer, principal financial officer, principal accounting officer or controller, or persons performing similar functions. This code of ethics is included as an Exhibit.
(b) During the period covered by the report, with respect to the registrant’s code of ethics that applies to its principal executive officer, principal financial officer, principal accounting officer or controller, or persons performing similar functions; there have been no amendments to, nor any waivers granted from, a provision that relates to any element of the code of ethics definition enumerated in paragraph (b) of this Item 2.
| Item 3. | Audit Committee Financial Expert. |
3(a)(1) The registrant’s board of directors has determined that the registrant has at least one audit committee financial expert serving on its audit committee.
3(a)(2) The audit committee financial expert is Ms. Tamara L. Fagely, who is “independent” for purposes of this Item 3 of Form N-CSR.
| Item 4. | Principal Accountant Fees and Services. |
(a) Audit Fees. Audit fees totaled $218,500 and $217,500 in fiscal 2017 and 2016, respectively. 2017 and 2016 fees include fees associated with the annual audit and filings of the registrant’s Form N-1A and Form N-SAR.
(b) Audit-Related Fees. There were no audit-related fees in fiscal 2017 and 2016.
(c) Tax Fees. Fees for tax compliance services totaled $67,570 and $65,600 in fiscal 2017 and 2017, respectively.
(d) All Other Fees. There were no other fees in fiscal 2017 and 2016.
(e)(1) Audit Committee Pre-Approval Policies. The Audit Committee’s pre-approval policies describe the types of audit, audit-related, tax and other services that may receive the general pre-approval of the Audit Committee. The pre-approval policies provide that annual audit service fees, tax services not specifically granted pre-approval, services exceeding pre-approved cost levels and other services that have not received general pre-approval will be subject to specific pre-approval by the Audit Committee. The pre-approval policies further provide that the Committee may grant general pre-approval to other audit services (statutory audits and services associated with SEC registration statements, periodic reports and other documents filed with the SEC or other documents issued in connection with securities offerings), audit-related services (accounting consultations related to accounting, financial reporting or disclosure matters not classified as “audit services,” assistance with understanding and implementing new accounting and financial reporting guidance from rulemaking authorities, agreed-upon or expanded audit procedures related to accounting and/or billing records required to respond to or comply with financial, accounting or regulatory reporting matters and assistance with internal control reporting requirements under Form N-SAR and Form N-CSR), tax services that have historically been provided by the auditor that the Committee believes would not impair the independence of the auditor and are consistent with the SEC’s rules on auditor independence and permissible non-audit services classified as “all other services” that are routine and recurring services.
(e)(2) All of the services described in paragraphs (b) through (d) of Item 4 were approved by the Audit Committee.
(f) During audit of registrant’s financial statements for the most recent fiscal year, less than 50 percent of the hours expended on the principal accountant’s engagement were attributed to work performed by persons other than the principal accountant’s full-time, permanent employees.
(g) The aggregate non-audit fees for services to the registrant, its investment adviser and any entity controlling, controlled by, or under common control with the adviser that provides ongoing services to the registrant were $91,370 and $88,700 in 2017 and 2016, respectively.
(h) The registrant's audit committee of the board of trustees has considered whether the provision of non-audit services that were rendered to the registrant's investment adviser (not including any sub-adviser whose role is primarily portfolio management and is subcontracted with or overseen by another investment adviser), and any entity controlling, controlled by, or under common control with the investment adviser that provides ongoing services to the registrant that were not pre-approved pursuant to paragraph (c)(7)(ii) of Rule 2-01 of Regulation S-X is compatible with maintaining the principal accountant's independence.
| Item 5. | Audit Committee of Listed Registrants. |
Not applicable.
| Item 6. | Schedule of Investments. |
(a) The Schedule of Investments is included in the Annual Report to Shareholders filed under Item 1 of this Form.
(b) Not applicable.
| Item 7. | Disclosure of Proxy Voting Policies and Procedures for Closed-End Management Investment Companies. |
Not applicable.
| Item 8. | Portfolio Managers of Closed-End Management Investment Companies. |
Not applicable.
| Item 9. | Purchases of Equity Securities by Closed-End Management Investment Company and Affiliated Purchasers. |
Not applicable.
| Item 10. | Submission of Matters to a Vote of Security Holders. |
Not applicable.
Item 11. Controls and Procedures.
(a)The registrant’s principal executive officer and principal financial officer have concluded, based on their evaluation of the registrant's disclosure controls and procedures as conducted within 90 days of the filing date of this report, that these disclosure controls and procedures are adequately designed and are operating effectively to ensure that information required to be disclosed by the registrant on Form N-CSR is recorded, processed, summarized and reported within the time periods specified in the Securities and Exchange Commission's rules and forms.
(b)There were no changes in the registrant’s internal control over financial reporting (as defined in Rule 30a-3(d) under the Act (17 CFR 270.30a-3(d))) that occurred during the second fiscal quarter of the period covered by this report that have materially affected or are reasonably likely to materially affected, the registrant’s internal control over financial reporting.
Item 12. Disclosure of Securities Lending Activities for Closed-End Management Investment Companies.
Not applicable.
Item 13. Exhibits.
| (a)(1) | | Code of Ethics for Senior Financial Officers is filed herewith. |
| | | |
| (a)(2) | | Certifications required by Item 12(a) of Form N-CSR are filed herewith. |
| | | |
| (a)(3) | | Not applicable. |
| | | |
| (b) | | Certification required by Item 12(b) of Form N-CSR is furnished herewith. |
SIGNATURES
Pursuant to the requirements of the Securities Exchange Act of 1934 and the Investment Company Act of 1940, the registrant has duly caused this report to be signed on its behalf by the undersigned, thereunto duly authorized.
| Registrant | Diamond Hill Funds | |
| | | |
| By (Signature and Title) | /s/ Thomas E. Line | |
| Thomas E. Line, Chief Executive Officer | |
| | | |
| Date: February 26, 2018 | | |
Pursuant to the requirements of the Securities Exchange Act of 1934 and the Investment Company Act of 1940, this report has been signed below by the following persons on behalf of the registrant and in the capacities and on the dates indicated.
| By (Signature and Title) | /s/ Thomas E. Line | |
| Thomas E. Line, Chief Executive Officer | |
| | | |
| Date: February 26, 2018 | | |
| | | |
| By (Signature and Title) | /s/ Julie A. Roach | |
| Julie A. Roach, Principal Financial Officer | |
| | | |
| Date: February 26, 2018 | | |