UNITED STATES
SECURITIES AND EXCHANGE COMMISSION
Washington, D.C. 20549
FORM N-CSR
CERTIFIED SHAREHOLDER REPORT OF REGISTERED
MANAGEMENT INVESTMENT COMPANIES
Investment Company Act file number: 811-08061
Diamond Hill Funds
(Exact name of registrant as specified in charter)
325 John H. McConnell Boulevard, Suite 200, Columbus, Ohio 43215
(Address of principal executive offices) (Zip code)
Thomas E. Line, 325 John H. McConnell Boulevard, Suite 200, Columbus, Ohio 43215
(Name and address of agent for service)
Registrant’s telephone number, including area code: 614-255-3333
Date of fiscal year end: December 31
Date of reporting period: December 31, 2014
Item 1. Reports to Stockholders.

Annual Report
December 31, 2014
| | |
| Small Cap Fund | | Long-Short Fund |
| Small-Mid Cap Fund | | Research Opportunities Fund |
| Mid Cap Fund | | Financial Long-Short Fund |
| Large Cap Fund | | Strategic Income Fund |
| Select Fund | | |
This material must be preceded or accompanied by a current prospectus.
Not FDIC Insured. May Lose Value. No Bank Guarantee.

Table of Contents
Cautionary Statement: At Diamond Hill, we pledge that, “we will communicate with our clients about our investment performance in a manner that will allow them to properly assess whether we are deserving of their trust.” Our views and opinions regarding the investment prospects of our portfolio holdings and Funds are “forward looking statements” which may or may not be accurate over the long term. While we believe we have a reasonable basis for our opinions, actual results may differ materially from those we anticipate. Information provided in this report should not be considered a recommendation to purchase or sell any particular security.
You can identify forward looking statements by words like “believe,” “expect,” “anticipate,” or similar expressions when discussing prospects for particular portfolio holdings and/or one of the Funds. We cannot assure future results. You should not place undue reliance on forward-looking statements, which speak only as of the date of this report. We disclaim any obligation to update or alter any forward-looking statements, whether as a result of new information, future events, or otherwise.
This material is not authorized for distribution to prospective investors unless preceded or accompanied by a Prospectus. Investors should consider the investment objectives, risks, charges, and expenses of the Diamond Hill Funds carefully before investing. The prospectus or summary prospectus contain this and other important information about the Fund(s) and are available at diamond-hill.com or by calling 888.226.5595. Please read the prospectus or summary prospectus carefully before investing. The Diamond Hill Funds are distributed by BHIL Distributors, Inc. (Member FINRA), an affiliated company. Diamond Hill Capital Management, Inc., a registered investment adviser, serves as Investment Adviser to the Diamond Hill Funds and is paid a fee for its services. Diamond Hill Funds are not FDIC insured, may lose value, and have no bank guarantee.
Letter to Shareholders
Dear Fellow Shareholders:
We are pleased to provide you with this year-end update for the Diamond Hill Funds. All of our Funds posted positive absolute returns in 2014; however, on a relative basis, most trailed their respective benchmark returns. 2014 was a difficult year for active managers in large part due to lower volatility and lower dispersion. Volatility provides opportunities for active managers to identify mispricings in the market and take advantage of those mispricings. When volatility is low, there are fewer opportunities. Similarly, when dispersion is low, the spread between winners and losers is narrow, making it more difficult to stand out from the crowd. More importantly, as of December 31, 2014, the since inception returns for nearly all of our Funds exceeded their respective benchmark returns. The exceptions were the Diamond Hill Research Opportunities Fund and the Diamond Hill Mid Cap Fund. The Mid Cap Fund has been in existence for less than five years, which is the minimum time period that we use to evaluate our results, and the Research Opportunities Fund completed its first five-year period of existence at March 31, 2014.
2014 Financial Markets
Driven by an expanding economy, growing corporate profits, and persistently low interest rates, the broad U.S. equity market posted its sixth consecutive annual gain in 2014. The S&P 500 Index finished the year with a 13.7% total return (including dividends), and the Federal Reserve signaled its belief in the economy’s ability to grow without assistance by concluding its bond purchasing program known as Quantitative Easing, or QE, in October 2014. Although investors expect the Fed to raise interest rates sometime in 2015, its overall monetary policy remains accommodative, encouraging equity investors.
In the U.S., unemployment fell as a result of the best hiring stretch since the late 1990s. The U.S. consumer benefitted from a steep decline in gasoline prices to the lowest levels in five years. The sharp decline in the price of oil over the past few months is likely to improve household budgets. Globally, central banks remained extraordinarily accommodative in an attempt to provide a backdrop for increased economic growth. Europe, which has been a clear economic laggard over the past few years, was still only showing modest signs of improvement. Meanwhile, China and India continued to grow at healthy mid-single digit rates, but many other emerging economies around the world are seeing decelerating growth rates. The U.S. dollar ended the year strong relative to other currencies as investors were confident that stronger economic growth in the U.S. will lead the Fed to raise rates in 2015 for the first time since before the financial crisis.
Outlook
Despite the end of the Federal Reserve’s Quantitative Easing, we continue to believe the Fed is likely to maintain a very accommodative overall monetary stance well into next year as the domestic economy is lacking signs of robust growth, while inflation expectations have again turned lower. The recent strength of the U.S. dollar is now playing a key role in these
| | | | | | | | | | | | | | | | |
| DIAMOND HILL FUNDS | | | | | ANNUAL REPORT | | | | | DECEMBER 31, 2014 | | | | | DIAMOND-HILL.COM | | | 1 | |
Letter to Shareholders
developments as its relative appreciation has created a new headwind for growth while also pushing down commodity prices. The modest deleveraging of the U.S. household sector over the past few years continues to be a positive story. These lower debt levels combined with very low interest rates have allowed consumer debt-service burdens to improve to very low levels by historical standards. This healthy debt service picture remains very much tied to historically low interest/mortgage rates, and any sharp, meaningful increase in those rates is likely to present an important headwind for growth.
Although the U.S. economy appears to be healing at a steady pace and set to maintain its 2% - 3% growth heading into next year, we continue to expect positive but below average equity market returns over the next five years. Our conclusion is primarily based on above average price/earnings multiples applied to already very strong corporate profit margins, which in combination, likely tempers prospective returns. This outlook also seems consistent with the current interest rate environment. We believe that we can achieve better than market returns over the next five years through active portfolio management and stock selection independent of benchmark weights.
Diamond Hill Capital Management, Inc.
| | |
 | |  |
| |
Chris Welch, CFA Co-Chief Investment Officer | | Austin Hawley, CFA Co-Chief Investment Officer |
The views expressed are those of the portfolio managers as of December 31, 2014, are subject to change, and may differ from the views of other portfolio managers or the firm as a whole. These opinions are not intended to be a forecast of future events, a guarantee of future results, or investment advice. All data referenced are from sources deemed to be reliable but cannot be guaranteed. Securities and sectors referenced should not be construed as a solicitation or recommendation or be used as the sole basis for any investment decision.
The S&P 500 Index is a market capitalization-weighted index of 500 widely held stocks often used as a proxy for the stock market. Standard and Poor’s selects the companies for the index to widely represent the stock market based on market size, liquidity, and industry group representation. Indexes are unmanaged, do not incur fees, and cannot be invested in directly.
| | | | | | | | | | | | | | |
| 2 | | DIAMOND HILL FUNDS | | | | | ANNUAL REPORT | | | | | DECEMBER 31, 2014 | | | | | DIAMOND-HILL.COM |
Our Mission
At Diamond Hill, we serve our clients by providing investment strategies that deliver lasting value through a shared commitment to our intrinsic value-based investment philosophy, long-term perspective, disciplined approach and alignment with our clients’ interests.
VALUE
We believe market price and intrinsic value are independent in the short-term but tend to converge over time.
LONG-TERM
We maintain a long-term focus both in investment analysis and management of our business.
DISCIPLINE
We invest with discipline to increase potential return and protect capital.
PARTNERSHIP
We align our interests with those of our clients through significant personal investment in our strategies.
| | | | | | | | | | | | | | | | |
| DIAMOND HILL FUNDS | | | | | ANNUAL REPORT | | | | | DECEMBER 31, 2014 | | | | | DIAMOND-HILL.COM | | | 3 | |
Fundamental Principles
The Importance of Valuation
We believe that a company’s intrinsic value is independent of its stock price and that intrinsic value can be reasonably estimated using a discounted cash flow methodology. Our entire investment team shares the same investment philosophy, which drives our investment process.
We focus on the fundamentals of intrinsic value, which are far less volatile than market price, and our actions are ultimately dictated by the price to intrinsic value relationship.
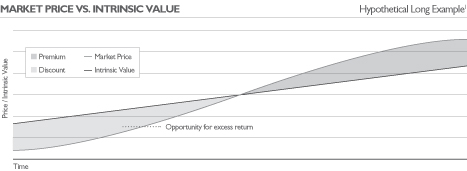
| | There is no guarantee that a discount to intrinsic value will be achieved or that market price and/or intrinsic value will increase over time. |
| 1 | The inverse is true for short position |
| | | | | | | | | | | | | | |
| 4 | | DIAMOND HILL FUNDS | | | | | ANNUAL REPORT | | | | | DECEMBER 31, 2014 | | | | | DIAMOND-HILL.COM |
Fundamental Principles
Equity Investment Principles
Valuation
| Ÿ | | We believe that every share of stock has an intrinsic value that is independent of its current market price, and at any point in time, the market price may be higher or lower than intrinsic value. |
| Ÿ | | Over short periods of time, the market price is heavily influenced by the emotions of market participants, which are far more difficult to predict than intrinsic value. While market prices may experience extreme fluctuations on a particular day, we believe intrinsic value is far less volatile. |
| Ÿ | | Over sufficiently long periods of time, five years or longer, the market price tends to converge with intrinsic value. |
Intrinsic Value Estimate
| Ÿ | | We believe that we can determine a reasonable approximation of intrinsic value if we are confident in projecting the future cash flows of a business and use an appropriate discount rate. |
Suitable Investments
| Ÿ | | We only invest when the market price is lower than our conservative assessment of per share intrinsic value (or at a premium for short positions). |
| Ÿ | | We concentrate our investments in businesses whose per share intrinsic value is likely to increase. We invest in businesses that possess a competitive advantage, conservative balance sheet, and outstanding managers and employees. For short positions, the inverse is often true, and a growing intrinsic value is a detriment to the performance of the position. |
Risk & Return
| Ÿ | | We intend to achieve our return from both the closing of the gap between our purchase price and intrinsic value and the increase in per share intrinsic value. For short positions, an increasing intrinsic value may shorten the holding period. |
| Ÿ | | We define risk as the permanent loss of capital rather than price volatility. We manage risk by investing in companies selling at a discount (premium for short positions) to our estimate of intrinsic value. |
| | | | | | | | | | | | | | | | |
| DIAMOND HILL FUNDS | | | | | ANNUAL REPORT | | | | | DECEMBER 31, 2014 | | | | | DIAMOND-HILL.COM | | | 5 | |
Fundamental Principles
Fixed Income Investment Principles
Business Analysis
| Ÿ | | We believe we can leverage our research team’s industry analysis of the fundamental economic drivers of the business to identify attractive corporate bonds and other senior corporate securities. |
| Ÿ | | We evaluate the quality of a firm’s management and their treatment of bondholders and stockholders. We believe managements that focus on growth, without regard to return on invested capital or long-term cost of capital, are more likely to destroy value for bondholders and stockholders. In contrast, managements that understand the competitive dynamics of their business and prudent capital allocation often produce value for both bondholders and stockholders. |
Valuation
| Ÿ | | We focus on the intrinsic value of the business in relation to the amount of debt in the capital structure. We also evaluate the sources and uses of cash for the business. |
| Ÿ | | The liquidity and expected volatility of a corporate bond are also important factors in valuation. Because of our long-term time horizon, we will invest in less liquid or more volatile securities; however, we require a higher yield as compensation. |
Suitable Investments
| Ÿ | | We generally invest in corporate bonds of companies with improving competitive positions and return on invested capital. |
| Ÿ | | Our core competency is the evaluation of credit risk. We typically favor lower duration, shorter maturity corporate bonds. We focus almost entirely on the secondary market for corporate bonds rather than the primary (new issue) market. We primarily invest in investment grade and below-investment grade (high yield) corporate bonds, including a significant allocation to defensive high yield corporate bonds (due to low duration and higher credit quality). |
Risk & Return
| Ÿ | | We define risk as the permanent loss of capital. We seek to avoid a permanent loss of capital and to earn a sufficient return on capital to grow our purchasing power. |
| Ÿ | | We expect to achieve our return objective by investing in corporate bonds when we believe the market price discounts a greater risk of default or a greater loss upon default than is warranted. An additional source of return exists when the market price provides attractive compensation for short-term illiquidity or volatility, both of which are of less concern to a long-term investor. |
| Ÿ | | We focus on credit risk, interest rate risk, liquidity risk, call risk, reinvestment risk, and other risks when evaluating corporate bonds. |
| | | | | | | | | | | | | | |
| 6 | | DIAMOND HILL FUNDS | | | | | ANNUAL REPORT | | | | | DECEMBER 31, 2014 | | | | | DIAMOND-HILL.COM |
Diamond Hill Small Cap Fund
2014 Portfolio Commentary
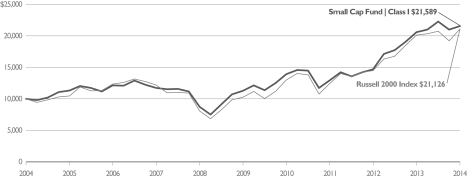
The Diamond Hill Small Cap Fund returned 4.86% (Class I) in 2014 compared to a 4.89% return for the Russell 2000 Index. In 2014, the small cap market’s best performing sectors were healthcare, utilities, and consumer staples. These sectors tend to be seen as relatively defensive and associated with “safe havens.” Utilities, in particular, also tend to do well when interest rates fall as many view regulated utilities as the most bond-like of equity investments. Government interest rates declined during the year, with the 10-year Treasury finishing below 2.2%, down from levels around 3% at the beginning of the year. Energy was by far the worst performing sector in 2014, as crude oil prices declined nearly 50%. The Fund’s underperformance can largely be attributed to having a larger allocation to energy stocks and a smaller allocation to healthcare stocks than the Index. In addition, while stock selection was generally good, the consumer staples sector was an exception.
The Fund’s financial holdings were the largest contributors in 2014. The Fund averaged roughly 27% of net assets invested in this sector, with nearly half of that amount in insurance companies. Banks and real estate investment trusts (REITs) each comprised about a fifth of the financial sector holdings. Winthrop Realty Trust, Inc. announced a liquidation plan to sell all its assets and distribute the proceeds to shareholders within a two-year period. Thus far, asset sales have come in a bit above the mid-point of ranges that the company has used in its internal estimate of net asset value. In total, these developments led to a 65% total return for the stock in the year. Insurance or reinsurance companies including HCC Insurance Holdings, Inc., Navigators Group, Inc., Alleghany Corp., Enstar Group Ltd., American Equity Investment Life Holding Co., and Reinsurance Group of America all experienced total returns between 10% and 18.5%. The largest detractors within financials were First Niagara Financial Group, Inc. and Nationstar Mortgage Holdings, Inc. Nationstar is a non-bank mortgage servicer whose primary competitor, Ocwen Financial Corp., has encountered great regulatory scrutiny. We believe Nationstar may ultimately benefit from Ocwen’s problems, while thus far the market is skeptical.
Industrials were the second largest contributor to Fund performance during the year. Avis Budget Group, Inc. was the Fund’s largest holding at year-end and produced a 64% total return for the year. While fleet costs face some headwinds on lower residual values, there are signs that this will be more than offset by positive pricing action within the industry in 2015. Alaska Air Group, Inc. has benefitted from favorable fundamentals for airlines, bolstered further by falling jet fuel prices. Aircastle Ltd., an aircraft lessor, and Corrections Corp of America also appreciated more than 20% for the year. Hyster-Yale Materials Handling, Inc., Brink’s Co., TriMas Corp., and Kennametal, Inc. all declined for the year on lower earnings than the previous year. Finally, Trinity Industries, Inc. soared during the first part of the year on continued strong fundamentals in railcar manufacturing and leasing. However, as the price of oil fell in the second half of the year, concerns about the future orders for tank cars to transport oil and a product liability lawsuit concerning the company’s highway guardrail product weighed heavily on the stock, leading to only a marginally positive return.
| | | | | | | | | | | | | | | | |
| DIAMOND HILL FUNDS | | | | | ANNUAL REPORT | | | | | DECEMBER 31, 2014 | | | | | DIAMOND-HILL.COM | | | 7 | |
Diamond Hill Small Cap Fund
In energy, crude oil prices declined about 46% for the year. Natural gas prices also declined in the U.S., closing at $2.88/mcf, down from the $4.23/mcf close in 2013. Oil supply continued to grow from U.S. shales and higher production from Libya and Iraq following previous declines tied to unrest in those countries. Demand growth weakened with slower growth in China and some European economies experiencing contraction. Developed economies also continue to make efficiency gains. The result has been an oversupplied market that in previous times was balanced by OPEC, but Saudi Arabia expressed its comfort with allowing market forces to balance supply and demand and the lower oil prices that has ushered in. The fundamentals of individual companies were generally within our expectations, but the estimated intrinsic values have all been diminished by lower commodity price curves.
Historically, the Fund generally has had far less invested in health care than the Russell 2000 Index. This continues to be the case, and while stock selection was good, including Natus Medical, Inc., Lifepoint Hospitals, Inc., and health insurer Universal American Financial Corp., the lower overall exposure meant a lesser contribution from this sector than the Index. Utility holdings, UGI Corp., Cleco Corp., and ITC Holdings Corp. performed well but totaled only about 3% of the Fund. Cleco has announced a deal to be acquired with the expected close to come in 2015.
Our consumer staples companies performed relatively poorly for the year. The largest positive contributor to the Fund in this area was Energizer Holdings, Inc. Flowers Foods, Inc. and B&G Foods, Inc. both had mediocre years fundamentally but have been well run companies and successful investments over longer periods. We anticipate better business results from both in the future.
Thank you for your continued interest in the Fund as we move into 2015.
| | |

| | |
| |
Tom Schindler, CFA Portfolio Manager | | |
| | | | | | | | | | | | | | |
| 8 | | DIAMOND HILL FUNDS | | | | | ANNUAL REPORT | | | | | DECEMBER 31, 2014 | | | | | DIAMOND-HILL.COM |
Diamond Hill Small Cap Fund
AVERAGE ANNUAL TOTAL RETURNS AS OF DECEMBER 31, 2014
| | | | | | | | | | | | | | | | | | | | | | | | |
| | | Inception Date | | | One
Year | | | Three
Years | | | Five
Years | | | Ten
Years | | | Expense
Ratio* | |
| PERFORMANCE AT NAV WITHOUT SALES CHARGES | | | | | | | | | | | | | | | | | | | | | |
| Class A Shares | | | 12/29/2000 | | | | 4.60 | % | | | 18.15 | % | | | 13.50 | % | | | 7.65 | % | | | 1.32 | % |
| Class C Shares | | | 2/20/2001 | | | | 3.86 | | | | 17.28 | | | | 12.65 | | | | 6.84 | | | | 2.07 | |
| Class I Shares | | | 4/29/2005 | | | | 4.86 | | | | 18.46 | | | | 13.81 | | | | 8.00 | | | | 1.07 | |
| Class Y Shares | | | 12/30/2011 | | | | 5.06 | | | | 18.64 | | | | 13.78 | | | | 7.78 | | | | 0.93 | |
| BENCHMARK | | | | | | | | | | | | | | | | | | | | | | | | |
| Russell 2000 Index | | | | | | | 4.89 | | | | 19.21 | | | | 15.55 | | | | 7.77 | | | | — | |
| PERFORMANCE AT POP INCLUDES SALES CHARGES** | | | | | | | | | | | | | | | | | | | | | |
| Class A Shares | | | 12/29/2000 | | | | -0.62 | | | | 16.16 | | | | 12.34 | | | | 7.09 | | | | 1.32 | |
| Class C Shares | | | 2/20/2001 | | | | 2.87 | | | | 17.28 | | | | 12.65 | | | | 6.84 | | | | 2.07 | |
| * | Reflects the expense ratio as reported in the Prospectus dated February 28, 2015. |
| ** | The maximum sales charge for Class A shares on purchases and Class C shares on certain redemptions are 5.00% and 1.00% respectively. |
GROWTH OF $10,000
Comparison of the change in value of a $10,000 Investment in the Diamond Hill Small Cap Fund Class I(A) and the Russell 2000 Index.
| (A) | The growth of $10,000 chart represents the performance of Class I shares only, which will vary from the performance of Class A, Class C and Class Y shares based on the difference in loads and fees paid by shareholders in the different classes. |
| | The chart above represents a comparison of a hypothetical $10,000 investment and the reinvestment of dividends and capital gains in the indicated share class versus a similar investment in the Russell 2000 Index (“Index”). The Index is a market capitalization-weighted index measuring performance of the smallest 2,000 companies, on a market capitalization basis, in the Russell 3000 Index. The Index is unmanaged, and does not reflect the deduction of fees associated with a mutual fund such as investment management and accounting fees. The Fund’s performance reflects the deduction of fees for these services. Investors cannot invest directly in an index although they can invest in the underlying securities. |
| | Historical performance for Class I and Class Y shares prior to their inception is based on the performance of Class A shares. Class I and Class Y performance has been adjusted to reflect differences in sales charges. |
| | Past performance does not guarantee future results. The performance data quoted represents past performance and current returns may be lower or higher. The investment return and principal value will fluctuate so that an investor’s shares, when redeemed, may be worth more or less than the original cost. To obtain performance information current to the most recent month end, please visit www.diamond-hill.com. |
| | | | | | | | | | | | | | | | |
| DIAMOND HILL FUNDS | | | | | ANNUAL REPORT | | | | | DECEMBER 31, 2014 | | | | | DIAMOND-HILL.COM | | | 9 | |
Diamond Hill Small-Mid Cap Fund
2014 Portfolio Commentary
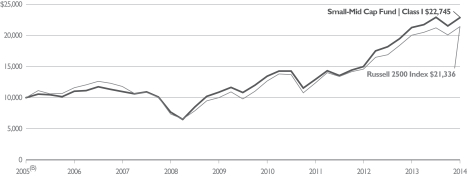
The Diamond Hill Small-Mid Cap Fund gained 7.36% (Class I) in 2014 compared to a 7.07% increase in the benchmark Russell 2500 Index. For the five-year period ended December 31, 2014, the Fund’s return was 15.87% annually while the Russell 2500 Index returned 16.36% over the same period. In the nine years since inception, the Fund’s annual return of 9.56% outpaced the 8.78% benchmark return. The 2014 performance was driven by favorable stock selection in the consumer discretionary sector offset by unfavorable stock selection in financials.
The large market capitalization segment of the stock market delivered significantly better results in 2014 than smaller size stocks. The Russell 1000 Index (large cap domestic stocks) rose 13.24% during the year, while the Russell 2500 Index, which is widely used to measure the performance of small to mid-cap domestic stocks, gained just 7.07%. We were well-positioned for that trend, as the weighted market capitalization of stocks in the Diamond Hill Small-Mid Cap Fund was well above that of the benchmark throughout the year.
Our returns this year benefited from stock selection in the consumer discretionary sector. Longer-term holdings Whirlpool Corp., Staples, Inc., and Jarden Corp. all gained more than 15% for the year, while new purchases Gannett Co., Inc. and Goodyear Tire & Rubber Co. achieved the same feat during the period we owned them. While declining energy prices and the slow but steady improvement in the U.S. labor market helped boost consumer spending, our investments all had company-specific drivers that assisted in generating the favorable returns.
The energy sector was a negative contributor to return, but surprisingly it had less of a negative impact on the Small-Mid Cap Fund portfolio return than it did for the benchmark Russell 2500 Index, despite our overweight relative to the benchmark in energy stocks. The reason for that was our very favorable stock selection in the sector. In particular, Cimarex Energy Co., our largest energy position, generated a slightly positive total return for the full year, compared to a greater than 30% decline for the energy sector of the benchmark. Cimarex has strong assets in the Permian Basin of west Texas, and the company’s excellent management team has effectively used the new hydraulic fracturing and horizontal drilling technologies to increase production and reduce costs. Cimarex has also maintained very little leverage on its balance sheet. These characteristics leave us comfortable holding a large position in Cimarex stock even in the face of the significant decline in the price of oil.
The biggest negative contributor to return relative to the benchmark was unfavorable stock selection in the financials sector. The primary reason for this was our sparse investment in Real Estate Investment Trust (REIT) stocks. REITs in general benefited significantly from the decline in long-term interest rates, as they are used by many investors as a way to increase a portfolio’s income generation. We own a couple of REITs, but we own them due to our belief that the companies are valued at a discount to our estimates of the firms’ intrinsic values, rather than as a way to increase exposure to higher-yielding stocks. We
| | | | | | | | | | | | | | |
| 10 | | DIAMOND HILL FUNDS | | | | | ANNUAL REPORT | | | | | DECEMBER 31, 2014 | | | | | DIAMOND-HILL.COM |
Diamond Hill Small-Mid Cap Fund
continue to find numerous attractive opportunities in the financials sector, and at year-end, it was our largest sector weight at nearly 30% of the portfolio.
Another area that was challenging during 2014 was stocks in the food industry. While some food stocks benefited from consolidation, we did not participate in that trend, and our investments faced deep challenges in revenue growth and profitability. We sold ConAgra Foods, Inc. during the year as we lost confidence in the company’s outlook, but we maintained investments in our other food stocks.
I’d like to once again recognize our excellent research team of 16 equity research analysts and 9 research associates who work hard to generate ideas and deliver strong returns to clients. They are the force behind the favorable returns we’ve been able to generate on your behalf over the past nine years.
Our outlook remains little changed from last year. Small- and mid-cap stock valuations are above historical averages, and it remains challenging to find many new ideas. Given the concentration of our portfolios, however, we remain confident in our ability to find 60 or so attractive investment ideas for the portfolio. The most important aspects of our approach remain our insistence on an attractive discount to intrinsic value with any investment we make and our strict focus on a long-term investment time horizon.
We appreciate your ongoing support and look forward to continuing to work with you in the coming years.
|
.. |
|
Chris Welch, CFA Portfolio Manager |
| | | | | | | | | | | | | | | | |
| DIAMOND HILL FUNDS | | | | | ANNUAL REPORT | | | | | DECEMBER 31, 2014 | | | | | DIAMOND-HILL.COM | | | 11 | |
Diamond Hill Small-Mid Cap Fund
AVERAGE ANNUAL TOTAL RETURNS AS OF DECEMBER 31, 2014
| | | | | | | | | | | | | | | | | | | | | | | | |
| | | Inception Date | | | One
Year | | | Three
Years | | | Five
Years | | | Since Inception
(12/30/05) | | | Expense
Ratio* | |
| PERFORMANCE AT NAV WITHOUT SALES CHARGES | | | | | | | | | | | | | | | | | |
| Class A Shares | | | 12/30/2005 | | | | 7.17 | % | | | 20.45 | % | | | 15.55 | % | | | 9.20 | % | | | 1.25 | % |
| Class C Shares | | | 12/30/2005 | | | | 6.33 | | | | 19.54 | | | | 14.69 | | | | 8.41 | | | | 2.00 | |
| Class I Shares | | | 12/30/2005 | | | | 7.36 | | | | 20.74 | | | | 15.87 | | | | 9.56 | | | | 1.00 | |
| Class Y Shares | | | 12/30/2011 | | | | 7.60 | | | | 20.93 | | | | 15.83 | | | | 9.35 | | | | 0.86 | |
| BENCHMARK | | | | | | | | | | | | | | | | | |
| Russell 2500 Index | | | | | | | 7.07 | | | | 19.97 | | | | 16.36 | | | | 8.78 | | | | — | |
| PERFORMANCE AT POP INCLUDES SALES CHARGES** | | | | | | | | | | | | | | | | | |
| Class A Shares | | | 12/30/2005 | | | | 1.83 | | | | 18.39 | | | | 14.36 | | | | 8.58 | | | | 1.25 | |
| Class C Shares | | | 12/30/2005 | | | | 5.33 | | | | 19.54 | | | | 14.69 | | | | 8.41 | | | | 2.00 | |
| * | Reflects the expense ratio as reported in the Prospectus dated February 28, 2015. |
| ** | The maximum sales charge for Class A shares on purchases and Class C shares on certain redemptions are 5.00% and 1.00% respectively. |
GROWTH OF $10,000
Comparison of the change in value of a $10,000 Investment in the Diamond Hill Small-Mid Cap Fund Class I(A) and the Russell 2500 Index.
| (A) | The growth of $10,000 chart represents the performance of Class I shares only, which will vary from the performance of Class A, Class C and Class Y shares based on the difference in loads and fees paid by shareholders in the different classes. |
| (B) | Class I shares commenced operations on December 30, 2005. |
| | The chart above represents a comparison of a hypothetical $10,000 investment and the reinvestment of dividends and capital gains in the indicated share class versus a similar investment in the Russell 2500 Index (“Index”). The Index is a market capitalization-weighted index measuring performance of the smallest 2,500 companies, on a market capitalization basis, in the Russell 3000 Index. The Index is unmanaged, and does not reflect the deduction of fees associated with a mutual fund such as investment management and accounting fees. The Fund’s performance reflects the deduction of fees for these services. Investors cannot invest directly in an index although they can invest in the underlying securities. |
| | Historical performance for Class Y shares prior to its inception is based on the performance of Class A shares. Class Y performance has been adjusted to reflect differences in sales charges. |
| | Past performance does not guarantee future results. The performance data quoted represents past performance and current returns may be lower or higher. The investment return and principal value will fluctuate so that an investor’s shares, when redeemed, may be worth more or less than the original cost. To obtain performance information current to the most recent month end, please visit www.diamond-hill.com. |
| | | | | | | | | | | | | | |
| 12 | | DIAMOND HILL FUNDS | | | | | ANNUAL REPORT | | | | | DECEMBER 31, 2014 | | | | | DIAMOND-HILL.COM |
Diamond Hill Mid Cap Fund
2014 Portfolio Commentary
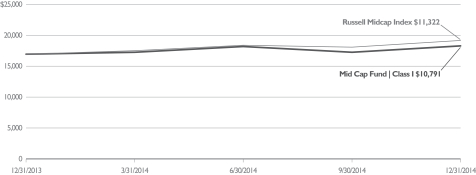
The Diamond Hill Mid Cap Fund gained 7.91% (Class I) in 2014. While this figure represents an adequate absolute return for investing in mid cap equities in this low interest rate environment, it trailed the 13.22% return of the Russell Mid Cap Index. At Diamond Hill, we constantly emphasize that we believe the most appropriate time frame over which to measure our performance is five years. However, we recognize that, by definition, to achieve above-average long-term returns, we must have a subset of above-average returns over shorter time horizons, despite our long-term focus. As such, we are disappointed in our 2014 results relative to the benchmark but continue to work toward delivering strong results over a five-year horizon.
The large market capitalization segment of the stock market delivered significantly better results in 2014 than smaller size stocks. The Russell 1000 Index (large cap domestic stocks) rose 13.24% during the year, while the Russell 2000 Index, which is widely used to measure the performance of small cap domestic stocks, gained just 4.89%. We were poorly positioned for that trend, as the weighted market capitalization of stocks in the Diamond Hill Mid Cap Fund fell below that of the benchmark throughout the year.
Our returns this year benefited from stock selection in the consumer discretionary sector. We owned numerous stocks in the sector which returned more than 20% for us during the year, including Ross Stores, Inc., Whirlpool Corp., Staples, Inc., Gannett Co., Inc., and V.F. Corp. While declining energy prices and the slow but steady improvement in the U.S. labor market helped boost consumer spending, our investments all had company-specific drivers that assisted in generating the favorable returns. These gains were partially offset by losses in Mattel, Inc., which struggled with weak sales in its Barbie division as well as other areas. Toy companies face increasing competition from digital entertainment for children, but Mattel’s history of innovation and prudent management suggest it will be able to retain a valuable role in the industry.
The energy sector was a negative contributor to return, but our favorable stock selection partially offset that decline. We were overweight energy stocks relative to the benchmark throughout the year, and we made only modest changes to the portfolio as oil prices declined during the 2014 fourth quarter. Cimarex Energy Co., our largest energy position, generated a slightly positive total return for the full year, compared to a negative 25% return for the energy sector of the benchmark. Cimarex has strong assets in the Permian Basin of west Texas, and the company’s excellent management team has effectively used the new hydraulic fracturing and horizontal drilling technologies to increase production and reduce costs. Cimarex has also maintained very little leverage on its balance sheet. These characteristics leave us comfortable holding a large position in Cimarex stock even in the face of the significant decline in the price of oil.
The biggest negative contributor to return relative to the benchmark was unfavorable stock selection in the financials sector. The primary reason for this was our sparse investment in Real Estate Investment Trust (REIT) stocks. REITs in general benefited significantly from
| | | | | | | | | | | | | | | | |
| DIAMOND HILL FUNDS | | | | | ANNUAL REPORT | | | | | DECEMBER 31, 2014 | | | | | DIAMOND-HILL.COM | | | 13 | |
Diamond Hill Mid Cap Fund
the decline in long-term interest rates, as they are used by many investors as a way to increase a portfolio’s income generation. We continue to find numerous attractive opportunities in the financials sector, and at year end, it was our largest sector weight at nearly 30% of the portfolio.
Another area that was challenging during 2014 was stocks in the food industry. While some food stocks benefited from consolidation, we did not participate in that trend, and our investments faced deep challenges in revenue growth and profitability. We sold ConAgra Foods, Inc. during the year as we lost confidence in the company’s outlook, but we maintained investments in our other food stocks.
I’d like to recognize our excellent research team of 16 equity research analysts and 9 research associates who work hard to generate ideas and deliver strong returns to clients. The team has a great deal of experience, and it has also benefited from a significant amount of stability over time.
Mid-cap stock valuations are above historical averages, and it is somewhat challenging to find many new ideas. Given the concentration of our portfolio, however, we remain confident in our ability to find 50 or so attractive investment ideas for the portfolio. The most important aspects of our approach are our insistence on an attractive discount to intrinsic value with any investment we make and our strict focus on a long-term investment time horizon.
We appreciate your support and look forward to continuing to work with you in the coming years.
|
.. |
|
Chris Welch, CFA Portfolio Manager |
| | | | | | | | | | | | | | |
| 14 | | DIAMOND HILL FUNDS | | | | | ANNUAL REPORT | | | | | DECEMBER 31, 2014 | | | | | DIAMOND-HILL.COM |
Diamond Hill Mid Cap Fund
AVERAGE ANNUAL TOTAL RETURNS AS OF DECEMBER 31, 2014
| | | | | | | | | | | | | | | | |
| | | Inception Date | | | One
Year | | | Since
Inception | | | Expense
Ratio* | |
| PERFORMANCE AT NAV WITHOUT SALES CHARGES | | | | | | | | | |
| Class A Shares | | | 12/31/2013 | | | | 7.57 | % | | | 7.57 | % | | | 1.15 | % |
| Class C Shares | | | 12/31/2013 | | | | 6.80 | | | | 6.80 | | | | 1.90 | |
| Class I Shares | | | 12/31/2013 | | | | 7.91 | | | | 7.91 | | | | 0.90 | |
| Class Y Shares | | | 12/31/2013 | | | | 8.02 | | | | 8.02 | | | | 0.76 | |
| BENCHMARK | | | | | | | | | |
| Russell Midcap Index | | | | | | | 13.22 | | | | 13.22 | | | | — | |
| PERFORMANCE AT POP INCLUDES SALES CHARGES** | | | | | | | | | |
| Class A Shares | | | 12/31/2013 | | | | 2.16 | | | | 2.16 | | | | 1.15 | |
| Class C Shares | | | 12/31/2013 | | | | 5.80 | | | | 5.80 | | | | 1.90 | |
| * | Reflects the expense ratio as reported in the Prospectus dated February 28, 2015. |
| ** | The maximum sales charge for Class A shares on purchases and Class C shares on certain redemptions are 5.00% and 1.00% respectively. |
GROWTH OF $10,000
Comparison of the change in value of a $10,000 Investment in the Diamond Hill Mid Cap Fund Class I(A) and the Russell Midcap Index.
| (A) | The growth of $10,000 chart represents the performance of Class I shares only, which will vary from the performance of Class A, Class C and Class Y shares based on the difference in loads and fees paid by shareholders in the different classes. |
| | The performance of the above Fund does not reflect the deduction of taxes that a shareholder would pay on Fund distributions or the redemption of Fund shares. |
| | The chart above represents a comparison of a hypothetical $10,000 investment and the reinvestment of dividends and capital gains in the indicated share class versus a similar investment in the Russell Midcap Index (“Index”). The Index is a market capitalization-weighted index measuring performance of the largest 1,000 companies, on a market capitalization basis, in the Russell 3000 Index. The Index is unmanaged, and does not reflect the deduction of fees associated with a mutual fund such as investment management and accounting fees. The Fund’s performance reflects the deduction of fees for these services. Investors cannot invest directly in an index although they can invest in the underlying securities. |
| | Past performance does not guarantee future results. The performance data quoted represents past performance and current returns may be lower or higher. The investment return and principal value will fluctuate so that an investor’s shares, when redeemed, may be worth more or less than the original cost. To obtain performance information current to the most recent month end, please visit www.diamond-hill.com. |
| | | | | | | | | | | | | | | | |
| DIAMOND HILL FUNDS | | | | | ANNUAL REPORT | | | | | DECEMBER 31, 2014 | | | | | DIAMOND-HILL.COM | | | 15 | |
Diamond Hill Large Cap Fund
2014 Portfolio Commentary
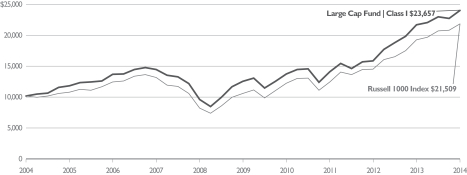
The Diamond Hill Large Cap Fund returned 10.74% (Class I) in 2014 compared to 13.24% for the Russell 1000 Index. I was disappointed the Fund lagged the Russell 1000 Index but pleased that 2014 was another strong year in the equity markets. The continued strong returns following the 2008-2009 bear market led to new record highs in the large cap indices for 2014. The best performing sectors of the market were the interest sensitive utilities and the health care sectors.
The health care sector was the top performing sector for the Fund as well as the Index in 2014, but our holdings lagged the performance of the health care sector in the Index. Medtronic, Inc., Abbott Laboratories, and Express Scripts Holding, Inc. all returned in excess of 20%. Medtronic announced the planned acquisition of Covidien PLC in the second quarter of the year. Top line growth for Medtronic has been challenged in recent years, but we believe this acquisition should help drive growth for the entire company and improve the shares’ valuation. Medtronic’s 28% return was the largest for any health care holding in the portfolio. Abbott Laboratories has continued to adjust its business portfolio to improve the long-term growth of the company. The improved performance of Abbott reflects its superior growth portfolio. Express Scripts has continued the integration of the Medco acquisition of a couple years ago, which has led to improving margins in its core pharmaceutical benefit management business. Stryker Corp. is a surgical products company with an outstanding long-term record. The shares were added to the portfolio at attractive prices during the autumn market sell-off. This holding returned more than 15% in the brief time it has been held.
The consumer discretionary sector was the best performing sector of the portfolio relative to the Index. Several holdings, including Whirlpool Corp., Walt Disney Co., and V.F. Corp., returned in excess of 20% in 2014. Whirlpool continued to benefit from improving margins driven by strong end-market growth and the integration of previous acquisitions. Walt Disney continued to benefit from its strong positioning in the broadcasting and entertainment industries. Disney’s unique competitive position has allowed the company to grow earnings in a variety of economic environments. V.F. Corp. is a very well managed consumer branded apparel company, and the company continued to take market share as its products are highly valued by consumers. This has driven consistent strong revenue and earnings growth, leading to the strong performance of the shares.
Energy was a controversial sector in 2014 as the strong performance in the first half of the year was overshadowed by the severe decline in oil prices in the fourth quarter. EOG Resources, Inc. and Cimarex Energy Co. provided small positive returns during the year, but the returns were down meaningfully from the large gains earlier in the year. One of the largest disappointments in the portfolio was Noble Energy, Inc. which was down approximately 37%. We eliminated the shares from the portfolio as we believe a more challenging energy market could prove especially difficult for Noble. Overall, our energy holdings outperformed the energy sector of the market, which was the worst performing sector of 2014.
| | | | | | | | | | | | | | |
| 16 | | DIAMOND HILL FUNDS | | | | | ANNUAL REPORT | | | | | DECEMBER 31, 2014 | | | | | DIAMOND-HILL.COM |
Diamond Hill Large Cap Fund
The financial sector was by far the largest sector concentration in the portfolio. Large bank holding companies such as Morgan Stanley, PNC Financial Services Group, Inc., and Wells Fargo & Co. returned in excess of 20% for the year. PNC and Wells Fargo were helped by improvements in loan demand which drove better earnings. Morgan Stanley benefited from a strong asset management environment as well as improved investment banking activity. Prudential Financial, Inc., a large life insurance company, was disappointing. Low interest rates threatened to slow earnings growth and caused investors to remain cautious toward the life insurance industry in general. Capital One Financial Corp. was a new financial services holding in the portfolio. We believe the company will benefit from improved consumer loan demand as well as stable asset quality. The shares remain inexpensive due to investor concerns regarding the potential for deteriorating loan quality. While asset quality has been unusually good, there is no indication of a meaningful deterioration in consumer lending.
The technology sector was the source of biggest disappointment in 2014. IBM, a large portfolio holding, declined approximately 12%. I am particularly concerned with the negative growth IBM has recently experienced in its software business. This is a concern we will monitor closely, but the shares remain very inexpensive so there could be meaningful opportunity if the business experiences a cyclical recovery. The key for IBM will be a return to positive top line growth once the company has completed the divestitures of its hardware businesses.
Several new names were added to the portfolio in 2014. Shares of Goodyear Tire & Rubber Co., Gannett Co., Inc., MetLife, Inc., Twenty-First Century Fox, Inc., and Eastman Chemical Co. were all purchased during the year to take advantage of attractive investment opportunities. All were positive contributors to performance.
As 2014 draws to a close, I am disappointed the Fund did not keep pace with the Russell 1000 Index. For the most part, the companies in the portfolio met our expectations. However, there was an absence of large gainers in the portfolio, which has often driven performance in past years. We will continue to focus on long-term opportunities in our search for new investments, and I look forward to the continued challenge of managing the portfolio. This concludes my 12th year of managing the Diamond Hill Large Cap Fund, and I remain grateful for the opportunity. Thank you for your continued support.
| | |

| | |
| |
Chuck Bath, CFA Portfolio Manager | | |
| | | | | | | | | | | | | | | | |
| DIAMOND HILL FUNDS | | | | | ANNUAL REPORT | | | | | DECEMBER 31, 2014 | | | | | DIAMOND-HILL.COM | | | 17 | |
Diamond Hill Large Cap Fund
AVERAGE ANNUAL TOTAL RETURNS AS OF DECEMBER 31, 2014
| | | | | | | | | | | | | | | | | | | | | | | | |
| | | Inception Date | | | One
Year | | | Three
Years | | | Five
Years | | | Ten
Years | | | Expense
Ratio* | |
| PERFORMANCE AT NAV WITHOUT SALES CHARGES | | | | | | | | | | | | | | | | | |
| Class A Shares | | | 6/29/2001 | | | | 10.42 | % | | | 19.12 | % | | | 13.59 | % | | | 8.63 | % | | | 1.04 | % |
| Class C Shares | | | 9/25/2001 | | | | 9.60 | | | | 18.26 | | | | 12.74 | | | | 7.81 | | | | 1.79 | |
| Class I Shares | | | 1/31/2005 | | | | 10.74 | | | | 19.43 | | | | 13.91 | | | | 8.99 | | | | 0.79 | |
| Class Y Shares | | | 12/30/2011 | | | | 10.89 | | | | 19.63 | | | | 13.88 | | | | 8.77 | | | | 0.65 | |
| BENCHMARK | | | | | | | | | | | | | | | | | | | | | | | | |
| Russell 1000 Index | | | | | | | 13.24 | | | | 20.62 | | | | 15.64 | | | | 7.96 | | | | — | |
| PERFORMANCE AT POP INCLUDES SALES CHARGES** | | | | | | | | | | | | | | | | | |
| Class A Shares | | | 6/29/2001 | | | | 4.91 | | | | 17.10 | | | | 12.42 | | | | 8.07 | | | | 1.04 | |
| Class C Shares | | | 9/25/2001 | | | | 8.60 | | | | 18.26 | | | | 12.74 | | | | 7.81 | | | | 1.79 | |
| * | Reflects the expense ratio as reported in the Prospectus dated February 28, 2015. |
| ** | The maximum sales charge for Class A shares on purchases and Class C shares on certain redemptions are 5.00% and 1.00% respectively. |
GROWTH OF $10,000
Comparison of the change in value of a $10,000 Investment in the Diamond Hill Large Cap Fund Class I(A) and the Russell 1000 Index.
| (A) | The growth of $10,000 chart represents the performance of Class I shares only, which will vary from the performance of Class A, Class C and Class Y shares based on the difference in loads and fees paid by shareholders in the different classes. |
| | The chart above represents a comparison of a hypothetical $10,000 investment and the reinvestment of dividends and capital gains in the indicated share class versus a similar investment in the Russell 1000 Index (“Index”). The Index is a market capitalization-weighted index measuring performance of the largest 1,000 companies, on a market capitalization basis, in the Russell 3000 Index. The Index is unmanaged, and does not reflect the deduction of fees associated with a mutual fund such as investment management and accounting fees. The Fund’s performance reflects the deduction of fees for these services. Investors cannot invest directly in an index although they can invest in the underlying securities. |
| | Historical performance for Class I and Class Y shares prior to their inception is based on the performance of Class A shares. Class I and Class Y performance has been adjusted to reflect differences in sales charges. |
| | Past performance does not guarantee future results. The performance data quoted represents past performance and current returns may be lower or higher. The investment return and principal value will fluctuate so that an investor’s shares, when redeemed, may be worth more or less than the original cost. To obtain performance information current to the most recent month end, please visit www.diamond-hill.com. |
| | | | | | | | | | | | | | |
| 18 | | DIAMOND HILL FUNDS | | | | | ANNUAL REPORT | | | | | DECEMBER 31, 2014 | | | | | DIAMOND-HILL.COM |
Diamond Hill Select Fund
2014 Portfolio Commentary
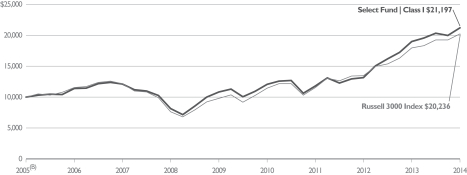
The Diamond Hill Select Fund gained 11.57% (Class I) in 2014 compared to our benchmark, the Russell 3000 Index, which returned 12.56%.
Underperformance relative to the benchmark was primarily driven by stock selection in financials, health care, and information technology. This was somewhat offset by favorable stock selection in the consumer discretionary and energy sectors.
Our largest sector weighting continued to be in financials. Whereas this sector was a source of significant outperformance for the fund in 2013, financials detracted somewhat from relative performance in 2014. The best performing financial holding was Popular, Inc., the Puerto Rican bank which gained regulatory approval in 2014 to repay Troubled Asset Relief Program (TARP). The worst performing financial holding was Fortress Investment Group LLC which we exited in the first quarter of 2014 due to concerns over the quality of earnings and the valuation multiple that those earnings might receive.
The health care sector remains a large weight in the Fund. Within health care, Teva Pharmaceutical Industries, Ltd. was the best performer, returning 47% over the course of the year in response to signs that the company is making good progress on both its cost reduction plan and in protecting the valuable Copaxone franchise. The worst health care performer was GlaxoSmithlKline PLC, which we exited after signs that its very profitable respiratory franchise was coming under pricing pressure from a consolidating payer base. Valeant Pharmaceuticals International, Inc. was a new health care position. Valeant’s management team has assembled an impressive collection of assets in the most attractive segments of health care while exhibiting great discipline in the prices paid and in harvesting anticipated acquisition synergies.
Information technology continues to be a significant weight in the portfolio, and three of our top performers came from this sector. Apple, Inc. benefited from improved capital allocation, successful uptake of the iPhone in China, and robust sales of larger iPhone form factors. Cisco Systems, Inc. shares rose on the stabilization of switching margins and the realization that reported revenue weakness would be short lived. Microsoft Corp. benefited from continued strength in enterprise software, strong conversion to the Office 365 subscription model, and stabilization in PC volumes. IBM, however, has been a disappointment, reporting weak 2014 third quarter earnings and backing away from a long-stated 2015 earnings goal.
We added two new holdings in the consumer discretionary sector, Whirlpool Corp. and Twenty-First Century Fox, Inc. Whirlpool replaced Aaron’s, Inc. in the portfolio after we became concerned that the lower-end consumer was not participating in the economic recovery. This was a fortuitous change to the portfolio, as Whirlpool became our best performer for the year, returning 48% from the time it was purchased in January. The shares benefited from investors’ recognition of strong cyclical tailwinds and associated operating leverage in North America, further penetration in places such as Latin America, Asia and India, and significant margin expansion opportunities in Europe owing to scale synergies yet to be realized from the Indesit acquisition.
| | | | | | | | | | | | | | | | |
| DIAMOND HILL FUNDS | | | | | ANNUAL REPORT | | | | | DECEMBER 31, 2014 | | | | | DIAMOND-HILL.COM | | | 19 | |
Diamond Hill Select Fund
By early 2014, we had repositioned our energy holdings by trimming overall exposure and focusing our investments in Cimarex Energy Co. and EOG Resources, Inc., both major disruptors in the domestic shale boom with conservative balance sheets. Despite performing well through mid-year, these two holdings finished the year flat to slightly negative, respectively, after a precipitous decline in oil prices caused by the confluence of faltering world demand in the face of steady domestic shale production growth, mitigation of certain OPEC supply disruptions, and Saudi Arabia signaling an unwillingness to continue balancing the market. When factoring in the new forward curve for oil, and the lower cash flows and ability to reinvest implied by the forward curve for the next 12 to 24 months, our estimate of intrinsic value for EOG fell to a point that we found other opportunities, outside of energy, more attractive, and we exited the position. We continue to hold Cimarex due to its very attractive asset base and opportunities to capture further drilling and production efficiencies.
All portfolio decisions are made from a bottom up perspective, evaluating individual holdings against the opportunities presented by others; however, it is still interesting to pause periodically to observe, from the top down, how the portfolio has evolved. During 2014, concentration increased as the total number of holdings decreased roughly 10% (from 35 to 32). On a net basis, we added one mega cap position and one small cap position, while eliminating five positions from within the $5 billion to $50 billion market capitalization range. In terms of sector weights, consumer discretionary, and to a lesser extent, financials both increased and were funded by reductions in energy and industrials.
As the market price of individual holdings approach our estimates of intrinsic value, we continue to find attractive replacements. In fact, three of the holdings added in 2014 (Valeant, Whirlpool, and Twenty-First Century Fox) are compelling enough that we have made them top five holdings.
We appreciate your support and look forward to 2015.
| | |
| | 
|
| |
Austin Hawley, CFA Portfolio Manager | | Rick Snowdon, CFA Portfolio Manager |
| | | | | | | | | | | | | | |
| 20 | | DIAMOND HILL FUNDS | | | | | ANNUAL REPORT | | | | | DECEMBER 31, 2014 | | | | | DIAMOND-HILL.COM |
Diamond Hill Select Fund
AVERAGE ANNUAL TOTAL RETURNS AS OF DECEMBER 31, 2014
| | | | | | | | | | | | | | | | | | | | | | | | |
| | | Inception Date | | | One
Year | | | Three
Years | | | Five
Years | | | Since
Inception | | | Expense
Ratio* | |
| PERFORMANCE AT NAV WITHOUT SALES CHARGES | | | | | | | | | | | | | | | | | | | | | |
| Class A Shares | | | 12/30/2005 | | | | 11.30 | % | | | 21.28 | % | | | 14.02 | % | | | 8.36 | % | | | 1.19 | % |
| Class C Shares | | | 12/30/2005 | | | | 10.46 | | | | 20.40 | | | | 13.17 | | | | 7.58 | | | | 1.94 | |
| Class I Shares | | | 12/30/2005 | | | | 11.57 | | | | 21.56 | | | | 14.32 | | | | 8.71 | | | | 0.94 | |
| Class Y Shares | | | 12/30/2011 | | | | 11.74 | | | | 21.78 | | | | 14.30 | | | | 8.51 | | | | 0.80 | |
| BENCHMARK | | | | | | | | | | | | | | | | | | | | | | | | |
| Russell 3000 Index | | | | | | | 12.56 | | | | 20.51 | | | | 15.63 | | | | 8.15 | | | | — | |
| PERFORMANCE AT POP INCLUDES SALES CHARGES** | | | | | | | | | | | | | | | | | | | | | |
| Class A Shares | | | 12/30/2005 | | | | 5.77 | | | | 19.23 | | | | 12.87 | | | | 7.74 | | | | 1.19 | |
| Class C Shares | | | 12/30/2005 | | | | 9.47 | | | | 20.40 | | | | 13.17 | | | | 7.58 | | | | 1.94 | |
| * | Reflects the expense ratio as reported in the Prospectus dated February 28, 2015. |
| ** | The maximum sales charge for Class A shares on purchases and Class C shares on certain redemptions are 5.00% and 1.00% respectively. |
GROWTH OF $10,000
Comparison of the change in value of a $10,000 Investment in the Diamond Hill Select Fund Class I(A) and the Russell 3000 Index.
| (A) | The growth of $10,000 chart represents the performance of Class I shares only, which will vary from the performance of Class A, Class C and Class Y shares based on the difference in loads and fees paid by shareholders in the different classes. |
| (B) | Class I shares commenced operations on December 30, 2005. |
| | The chart above represents a comparison of a hypothetical $10,000 investment and the reinvestment of dividends and capital gains in the indicated share class versus a similar investment in the Russell 3000 Index (“Index”). The Index is a widely recognized market capitalization-weighted index measuring the performance of the 3,000 largest U.S. companies based on total market capitalization. The Index is unmanaged, and does not reflect the deduction of fees associated with a mutual fund such as investment management and accounting fees. The Fund’s performance reflects the deduction of fees for these services. Investors cannot invest directly in an index although they can invest in the underlying securities. |
| | Historical performance for Class Y shares prior to its inception is based on the performance of Class A shares. Class Y performance has been adjusted to reflect differences in sales charges. |
| | Past performance does not guarantee future results. The performance data quoted represents past performance and current returns may be lower or higher. The investment return and principal value will fluctuate so that an investor’s shares, when redeemed, may be worth more or less than the original cost. To obtain performance information current to the most recent month end, please visit www.diamond-hill.com. |
| | | | | | | | | | | | | | | | |
| DIAMOND HILL FUNDS | | | | | ANNUAL REPORT | | | | | DECEMBER 31, 2014 | | | | | DIAMOND-HILL.COM | | | 21 | |
Diamond Hill Long-Short Fund
2014 Portfolio Commentary
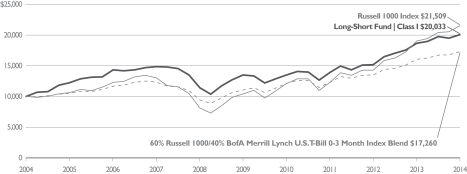
The Diamond Hill Long-Short Fund returned 7.55% (Class I) in 2014 compared to 13.24% for the long-only Russell 1000 Index and a 7.86% return for the blended benchmark (60% Russell 1000 Index/40% BofA Merrill Lynch U.S. T-Bill 0-3 Month Index). While the portfolio lagged the long-only Russell 1000 Index, we were more disappointed that the Fund slightly lagged the blended benchmark, which takes into account the portfolio’s 60% net long bias. It is very difficult for a long/short strategy to keep pace with a strong equity market like 2014. However, we strive to outperform the blended benchmark in all market environments. The source of disappointment was mostly in the long portfolio, which meaningfully lagged the long-only indexes. While the short portfolio was up, the increase was meaningfully less than the market’s appreciation. We were encouraged that our long portfolio outperformed our short portfolio; however, it was not enough to allow us to outperform the blended benchmark.
During 2014, the bias for the portfolio was to remain slightly longer than our blended benchmark with the net long exposure between 60% and 65% during most of the year. This reflected our generally positive view on the market throughout the year. At year-end, the net long exposure was slightly in excess of 61%.
The consumer staples and consumer discretionary sectors provided the biggest positive contribution to return in the long portfolio. Kimberly-Clark Corp. was the biggest gainer in the consumer staples sector, producing solid earnings in 2014 as competitive pressures eased and market share improved. Procter & Gamble Co., Kimberly-Clark’s biggest competitor, was up in excess of 15%. Restructuring initiatives combined with a stable competitive environment allowed earnings growth to improve. Whirlpool Corp. showed the biggest gain in the consumer discretionary sector. Whirlpool returned in excess of 33% as strong margin improvements and a stable housing recovery allowed the company to deliver continued profitability growth. Walt Disney Co. returned in excess of 24%. Continued strong park attendance combined with the success of Disney’s broadcasting and entertainment businesses demonstrated the strength of this unique consumer franchise.
Technology was also a strong sector in the long portfolio. Apple, Inc. has been a very successful investment since we added it to the portfolio in 2013. New product successes, particularly the recently introduced new smart phone, helped to drive revenue and profit growth. Profit growth, combined with the shares’ inexpensive valuation, continues to make this an attractive investment even after the 40% total return for Apple shares in 2014. Cisco Systems, Inc. and Microsoft Corp. both returned in excess of 27%. These companies are large, dominant technology companies with good balance sheets, but the success of these investments was driven by the inexpensive valuation of the shares. Both continue to remain attractive and were still held in the portfolio at year-end.
The biggest disappointment in the long portfolio was in the health care sector. While our returns in this sector were strong, they lagged the overall market returns earned in the sector, which was the strongest market sector in 2014. Medtronic, Inc. and Abbott Laboratories both returned in excess of 20%. Medtronic announced the planned acquisition
| | | | | | | | | | | | | | |
| 22 | | DIAMOND HILL FUNDS | | | | | ANNUAL REPORT | | | | | DECEMBER 31, 2014 | | | | | DIAMOND-HILL.COM |
Diamond Hill Long-Short Fund
of Covidien PLC in the 2014 second quarter. Top line growth for Medtronic has been challenged in recent years, but we believe this acquisition should help drive growth for the entire company and improve the shares’ valuation. Abbott Laboratories continued to adjust its business portfolio to improve the long-term performance of the company. The performance of the shares reflected the improved outlook for Abbott Laboratories. The biggest disappointment was Quest Diagnostics, Inc., a name we eliminated from the portfolio during the year. Continued anemic revenue growth reflected its weak competitive position.
Energy was a controversial sector as strong performance in the first half of 2014 was overshadowed by the severe decline in oil prices in the fourth quarter. EOG Resources, Inc. and Cimarex Energy Co. provided small positive returns for the year, but the overall return for our holdings in the sector was slightly negative. However, this slight negative performance was better than the performance of the energy sector in the overall market. One of the largest disappointments in the portfolio was Noble Energy, Inc., which was down more than 37%. We eliminated the shares from the portfolio due to concerns surrounding the challenging energy market, but as we entered 2015, the portfolio maintained most of its long energy holdings.
The short portfolio detracted from performance in 2014. This was not surprising in a year of strong equity markets. However, while our short portfolio appreciated, it was up meaningfully less than our long portfolio or the market as a whole. Several of our short positions were down, helping the portfolio return. Financial short positions such as BancorpSouth, Inc., Rouse Properties, Inc., and Principal Financial Group, Inc. were all down in excess of 10%. Technology company Ubiquiti Networks, Inc. was the biggest gainer in the short portfolio as the shares declined in excess of 30%. Other successful short positions included Advent Software, Inc., Intrepid Potash, Inc., Navistar International Corp., and Kansas City Southern. In several cases, we covered these short positions as the shares achieved our price objective. The biggest disappointment in the short portfolio was Celgene Corp., which returned in excess of 30%. As of year-end, this short position remained in the portfolio.
We introduced shorting to this Fund more than a decade ago to provide clients with a long/short strategy to meet the needs of their investment portfolios. We have been gratified by the growing acceptance of long/short strategies in general and the Diamond Hill Long-Short Fund in particular. We are grateful for your continued support and appreciate the opportunity to continue to earn your trust in 2015.
| | | | |

| |  | |
|
| | |
Ric Dillon, CFA Portfolio Manager | | Chris Bingaman, CFA Portfolio Manager | | Chuck Bath, CFA Portfolio Manager |
| | | | | | | | | | | | | | | | |
| DIAMOND HILL FUNDS | | | | | ANNUAL REPORT | | | | | DECEMBER 31, 2014 | | | | | DIAMOND-HILL.COM | | | 23 | |
Diamond Hill Long-Short Fund
AVERAGE ANNUAL TOTAL RETURNS AS OF DECEMBER 31, 2014
| | | | | | | | | | | | | | | | | | | | | | | | |
| | | Inception Date | | | One Year | | | Three Years | | | Five Years | | | Ten Years | | | Expense Ratio* | |
| PERFORMANCE AT NAV WITHOUT SALES CHARGES | | | | | | | | | | | | | | | | | | | | | |
| Class A Shares | | | 6/30/2000 | | | | 7.23 | % | | | 12.65 | % | | | 7.98 | % | | | 6.83 | % | | | 1.84 | % |
| Class C Shares | | | 2/13/2001 | | | | 6.44 | | | | 11.82 | | | | 7.18 | | | | 6.03 | | | | 2.59 | |
| Class I Shares | | | 1/31/2005 | | | | 7.55 | | | | 12.95 | | | | 8.29 | | | | 7.19 | | | | 1.59 | |
| Class Y Shares | | | 12/30/2011 | | | | 7.68 | | | | 13.12 | | | | 8.25 | | | | 6.96 | | | | 1.45 | |
| BENCHMARK | | | | | | | | | | | | | | | | | | | | | | | | |
| Russell 1000 Index | | | | | | | 13.24 | | | | 20.62 | | | | 15.64 | | | | 7.96 | | | | — | |
60% Russell 1000 Index/40%
BofA Merrill Lynch U.S. T-Bill 0-3 Month Index | | | | | | | 7.86 | | | | 12.08 | | | | 9.39 | | | | 5.61 | | | | — | |
| PERFORMANCE AT POP INCLUDES SALES CHARGES** | | | | | | | | | | | | | | | | | | | | | |
| Class A Shares | | | 6/30/2000 | | | | 1.88 | | | | 10.74 | | | | 6.88 | | | | 6.28 | | | | 1.84 | |
| Class C Shares | | | 2/13/2001 | | | | 5.44 | | | | 11.82 | | | | 7.18 | | | | 6.03 | | | | 2.59 | |
| * | Reflects the expense ratio as reported in the Prospectus dated February 28, 2015. |
| ** | The maximum sales charge for Class A shares on purchases and Class C shares on certain redemptions are 5.00% and 1.00% respectively. |
GROWTH OF $10,000
Comparison of the change in value of a $10,000 Investment in the Diamond Hill Long-Short Fund Class I(A), the Russell 1000 Index and the Blended Index (60% Russell 1000 Index and 40% BofA Merrill Lynch U.S. T-Bill 0-3 Month Index)
| (A) | The growth of $10,000 chart represents the performance of Class I shares only, which will vary from the performance of Class A, Class C and Class Y shares based on the difference in loads and fees paid by shareholders in the different classes. |
| | The chart above represents a comparison of a hypothetical $10,000 investment and the reinvestment of dividends and capital gains in the indicated share class versus a similar investment in the Russell 1000 Index and the blended index. The Russell 1000 Index is a market capitalization-weighted index measuring performance of the largest 1,000 companies on a market capitalization basis, in the Russell 3000 Index. The blended index represents a 60% weighting of the Russell 1000 Index as described above and a 40% weighting of the BofA Merrill Lynch U.S. T-Bill 0-3 Month Index. The BofA Merrill Lynch U.S. T-Bill 0-3 Month Index tracks the performance of U.S. dollar denominated U.S. Treasury Bills publicly issued in the U.S. domestic market with a remaining term to final maturity of less than 3 months. Both indices are unmanaged, and do not reflect the deduction of fees associated with a mutual fund such as investment management and accounting fees. The Fund’s performance reflects the deduction of fees for these services. Investors cannot invest directly in an index although they can invest in the underlying securities. |
| | Historical performance for Class I and Class Y shares prior to their inception is based on the performance of Class A shares. Class I and Class Y performance has been adjusted to reflect differences in sales charges. |
| | Past performance does not guarantee future results. The performance data quoted represents past performance and current returns may be lower or higher. The investment return and principal value will fluctuate so that an investor’s shares, when redeemed, may be worth more or less than the original cost. To obtain performance information current to the most recent month end, please visit www.diamond-hill.com. |
| | | | | | | | | | | | | | |
| 24 | | DIAMOND HILL FUNDS | | | | | ANNUAL REPORT | | | | | DECEMBER 31, 2014 | | | | | DIAMOND-HILL.COM |
Diamond Hill Research Opportunities Fund
2014 Portfolio Commentary
The Diamond Hill Research Opportunities Fund increased 7.21% (Class I) during 2014 compared to a 12.56% increase in the long-only benchmark Russell 3000 Index. At Diamond Hill, we have a long-term investment horizon and therefore evaluate our performance over rolling five-year periods. At the end of 2014, our five-year compound annual return was 12.62% versus 15.63% for the Russell 3000 Index. While pleased with the absolute return of the Fund, we are disappointed with our relative results. Another year of strong broad equity market returns made it difficult to keep pace with our long-only benchmark. In addition to negative contributions from the short portfolio, our willingness to hold cash in the absence of sufficiently attractive opportunities partially offset the strong performance of our long positions. We continue to believe our disciplined approach to capital allocation will deliver satisfactory absolute and relative results over most rolling five-year periods.
During 2014, the long portfolio contributed to the Fund’s return with an average long exposure of 85%, while the positions in the short portfolio detracted modestly with average short exposure of (11)%. The largest contributors to performance were long investments in Microsoft Corp., Whirlpool Corp., Winthrop Realty Trust, Inc., and Popular, Inc.
Microsoft made several favorable moves in 2014. Following the appointment of Satya Nadella to the CEO role in February, Microsoft shifted from a Windows-centric view of the world to an emphasis on the usage of Microsoft products and services regardless of the user’s operating system. Enterprise business was strong throughout the year, and the company began to regain momentum in its Consumer business as consumers increasingly embraced the subscription-based Office 365. Additionally, Microsoft took measures to control costs in both its phone and online search businesses. We have been pleased by the shifts at Microsoft under Nadella, and we continue to view Microsoft shares as priced below their intrinsic value.
Whirlpool’s fundamentals benefited from a continuation of the domestic appliance recovery in 2014. The company also completed two significant acquisitions, the largest being Indesit which more than doubles the size of the company’s European business. The second was a majority stake in Hefei Sanyo, offering a platform to grow the company’s Chinese business. With domestic demand remaining strong and profitable opportunities internationally, Whirlpool’s future looks promising, and the company’s goal of doubling earnings per share by 2018 seems very attainable.
Winthrop Realty Trust adopted a plan of liquidation after a prolonged disconnect between the stock price and management’s estimate of net asset value. Under the plan, management will liquidate the assets of the company in the most efficient way possible and pay out the proceeds to shareholders. Winthrop has been a long-term holding of the Fund, and the quality and track record of its management team were two driving forces behind our investment. The liquidation plan demonstrates management’s willingness to act like owners and in the best interest of shareholders, even if it means liquidating themselves out of a job. That is rare in today’s business climate.
| | | | | | | | | | | | | | | | |
| DIAMOND HILL FUNDS | | | | | ANNUAL REPORT | | | | | DECEMBER 31, 2014 | | | | | DIAMOND-HILL.COM | | | 25 | |
Diamond Hill Research Opportunities Fund
Our long-term holding in Puerto Rico-based bank Popular, Inc. appreciated as the company executed additional key steps in its recovery from the financial crisis, including continuing the cleanup of problem credits, simplifying operations by divesting some of its North American operations, and exiting the U.S. Treasury’s crisis era government funding program without issuing new common equity. Though the economy in Puerto Rico remains sluggish, the valuation on Popular’s shares remains undemanding, and we are hopeful that the company will announce meaningful capital return in 2015.
Long positions in International Business Machines Corp. (IBM), Tesco PLC, and Kennametal, Inc. were the largest detractors from performance during 2014.
IBM had a difficult 2014 as the company struggled to grow its revenue base. Along with a disappointing third quarter earnings report, management acknowledged that the company will fail to achieve the $20 per share in calendar-year 2015 (non-GAAP) operating earnings that was the cornerstone of its much-publicized 2015 Roadmap. While we have been dissatisfied with the company’s short-term execution, we continue to believe that IBM possesses a set of businesses that are both fundamentally attractive and resilient, and the stock currently trades at a meaningful discount to our estimate of intrinsic value.
Tesco’s key challenge in 2014 was the rise of discount grocers who offer a simple range and value pricing, while accounting misstatements and a change in management added complexity to meeting this challenge. Despite these challenges, we remain confident in the intrinsic value of Tesco, given the company’s market leading position and high quality asset base.
Kennametal, Inc. was able to generate positive revenue growth in fiscal 2014 despite continued weakness in its Infrastructure segment (largely due to mining and road construction exposure). However, in anticipation of even better sales management, the company expanded costs, thus forfeiting any leverage to the bottom line from increased sales. By the end of the year, it became apparent that not only were sales not going to grow as quickly as anticipated, but also would actually renew their deterioration largely due to weakness in Europe and softening sales to the energy sector. This, coupled with a more leveraged balance sheet from the acquisition of Allegheny Technologies’ tungsten material business earlier in Kennametal’s fiscal year, weighed heavily on the stock price.
As of December 31, 2014, the Fund held 60 long and 19 short positions with the top ten positions representing 38% of net assets.
We want to thank shareholders for their support, and we look forward to working with you in the years ahead.
Diamond Hill Research Analysts
| | | | | | | | | | | | | | |
| 26 | | DIAMOND HILL FUNDS | | | | | ANNUAL REPORT | | | | | DECEMBER 31, 2014 | | | | | DIAMOND-HILL.COM |
Diamond Hill Research Opportunities Fund
AVERAGE ANNUAL TOTAL RETURNS AS OF DECEMBER 31, 2014
| | | | | | | | | | | | | | | | | | | | | | | | |
| | | Inception Date | | | One
Year | | | Three
Years | | | Five
Years | | | Since
Inception* | | | Expense
Ratio** | |
| PERFORMANCE AT NAV WITHOUT SALES CHARGES | | | | | | | | | | | | | | | | | | | | | |
| Class A Shares | | | 12/30/2011 | | | | 6.96 | % | | | 16.53 | % | | | 12.33 | % | | | 17.43 | % | | | 1.75 | % |
| Class C Shares | | | 12/30/2011 | | | | 6.17 | | | | 15.69 | | | | 11.51 | | | | 16.56 | | | | 2.50 | |
| Class I Shares | | | 12/30/2011 | | | | 7.21 | | | | 16.83 | | | | 12.62 | | | | 17.73 | | | | 1.50 | |
| Class Y Shares | | | 12/30/2011 | | | | 7.37 | | | | 17.00 | | | | 12.79 | | | | 17.90 | | | | 1.36 | |
| BENCHMARK | | | | | | | | | | | | | | | | | | | | | |
| Russell 3000 Index | | | | | | | 12.56 | | | | 20.51 | | | | 15.63 | | | | 20.87 | | | | — | |
| PERFORMANCE AT POP INCLUDES SALES CHARGES*** | | | | | | | | | | | | | | | | | | | | | |
| Class A Shares | | | 12/30/2011 | | | | 1.62 | | | | 14.57 | | | | 11.19 | | | | 16.38 | | | | 1.75 | |
| Class C Shares | | | 12/30/2011 | | | | 5.19 | | | | 15.69 | | | | 11.51 | | | | 16.56 | | | | 2.50 | |
| ** | Reflects the expense ratio as reported in the Prospectus dated February 28, 2015. |
| *** | The maximum sales charge for Class A shares on purchases and Class C shares on certain redemptions are 5.00% and 1.00% respectively. |
GROWTH OF $10,000
Comparison of the change in value of a $10,000 Investment in the Diamond Hill Research Opportunities Fund Class I(A) and the Russell 3000 Index.
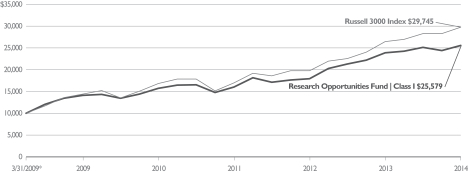
| (A) | The growth of $10,000 chart represents the performance of Class I shares only, which will vary from the performance of Class A, Class C and Class Y shares based on the difference in loads and fees paid by shareholders in the different classes. |
| | The chart above represents a comparison of a hypothetical $10,000 investment and the reinvestment of dividends and capital gains in the indicated share class versus a similar investment in the Russell 3000 Index (“Index”). The Index is a widely recognized market capitalization-weighted index measuring the performance of the 3,000 largest U.S. companies based on total market capitalization. The Index is unmanaged, and does not reflect the deduction of fees associated with a mutual fund such as investment management and accounting fees. The Fund’s performance reflects the deduction of fees for these services. Investors cannot invest directly in an index although they can invest in the underlying securities. |
| * | The quoted performance for the Fund reflects the past performance of Diamond Hill Research Partners, L.P., a private fund managed with full investment authority by the Fund’s Adviser. The Fund is managed in all material respects in a manner equivalent to the management of the predecessor unregistered fund. The Fund’s objectives, policies, guidelines and restrictions are in all material respects equivalent to the predecessor, and the Fund was created for reasons entirely unrelated to the establishment of a performance record. The assets of the Research Partnership were converted into assets of the Fund prior to commencement of operation of the Fund. The Fund’s inception date is December 30, 2011. The performance of the Research Partnership has been restated to reflect the net expenses and maximum applicable sales charge of the Fund for its initial years of investment operations. The Research Partnership was not registered under the Investment Company Act of 1940 and therefore was not subject to certain investment restrictions imposed by the 1940 Act. If the Research Partnership had been registered under the 1940 Act, its performance may have been adversely affected. Performance is measured from March 31, 2009, the inception of the Research Partnership and is not the performance of the Fund for the period prior to December 30, 2011. The Research Partnership’s past performance is not necessarily an indication of how the Fund will perform in the future either before or after taxes. |
| | Past performance does not guarantee future results. The performance data quoted represents past performance and current returns may be lower or higher. The investment return and principal value will fluctuate so that an investor’s shares, when redeemed, may be worth more or less than the original cost. To obtain performance information current to the most recent month end, please visit www.diamond-hill.com. |
| | | | | | | | | | | | | | | | |
| DIAMOND HILL FUNDS | | | | | ANNUAL REPORT | | | | | DECEMBER 31, 2014 | | | | | DIAMOND-HILL.COM | | | 27 | |
Diamond Hill Financial Long-Short Fund
2014 Portfolio Commentary
The U.S. equity markets enjoyed another healthy year in 2014 as the Russell 3000 Index posted a 12.56% total return. In comparison, financial services companies outperformed the broader market, while the Fund trailed both the overall Index and sector benchmark returns. The Diamond Hill Financial Long-Short Fund generated a total return of 8.42% (Class I) primarily driven by a clear long bias throughout the year. The S&P Composite 1500 Financials Index produced a 14.89% total return and outperformed the broader U.S. equity indices for the third consecutive year. For the trailing five-year period, the Fund generated a total return of 13.98% annually while the benchmark increased 13.53% annually.
After another reasonably strong performance year, we continue to expect U.S. equity market returns to be below historical averages over the next five years. We also continue to believe the financial sector is likely to perform a bit better than the overall equity market over that time period. We believe the primary industries within the sector are clearly well positioned for reasonable rates of growth going forward, which should mean modestly rising earnings along with increased return of excess capital to shareholders. More specifically, we believe that much improved balance sheet capacity, as well increased loan growth and stabilizing net interest margins, should allow for modestly improving earnings for the banking industry. Meanwhile, within the insurance industry, many important areas continue to produce healthy returns on strong capital levels; however, over the past 12-18 months we sold a significant portion of our investments in the property casualty area as the pricing environment became less favorable. On the other hand, we continued to find opportunity in the life companies as investors seemed to be overly pessimistic about the outlooks for some of the key players. Finally, the overall macro-economic environment looks to be a tailwind for the sector, as activity appears set to modestly improve from already healthy levels. We believe the recent sharp decline in energy prices along with an improving job market and increased confidence among both consumers and small businesses should bode well for the new year.
As mentioned above, our long bias throughout the year, combined with solid security selection in the long portfolio, helped the Fund generate acceptable returns for the year. The relative underperformance during the year was largely due to the very strong performance of real estate investment trusts (REITs). REITs were the standout group within the sector as bond prices rallied, and the market rewarded the most ‘bond-like’ areas of the equity markets. While we have occasionally owned REITs in the portfolio, these types of companies have never constituted a meaningful portion of the Fund as we have typically identified other opportunities in which we expected to generate superior long-term returns.
Turning to stock specific drivers during the year; within the long portfolio, meaningful contributors to performance were specialty REIT Winthrop Realty Trust, which announced its intention to liquidate, and Puerto Rican banking company Popular, Inc., which was finally allowed to repay its crises-era government funding. Additionally, brokerage and
| | | | | | | | | | | | | | |
| 28 | | DIAMOND HILL FUNDS | | | | | ANNUAL REPORT | | | | | DECEMBER 31, 2014 | | | | | DIAMOND-HILL.COM |
Diamond Hill Financial Long-Short Fund
securities firm Morgan Stanley, as well as super regional banks Wells Fargo & Co. and PNC Financial Services Group, Inc., provided significant positive total returns to the Fund. On the short side, we continued to have modest exposure, and our stock selection was much better during 2014. As a result, the short portfolio ended up being only a very modest detractor from the portfolio’s overall return.
As a reminder, we continue to believe shareholders in the Fund will benefit from a relatively concentrated portfolio as well as the ability to utilize short selling. We intend to use our short positions as a way to enhance the performance of the Fund over time, not simply as a “hedge” to mitigate our long exposure or volatility. Our short exposure will typically be much smaller than our long exposure, and therefore, we will have fewer and generally smaller positions. Finally, we continually strive to maintain our disciplined process of evaluating both the fundamentals and valuations of our current and prospective investments.
We would like to thank our shareholders for your continued support of the Fund.
| | |
| | |
| |
Chris Bingaman, CFA Portfolio Manager | | |
| | | | | | | | | | | | | | | | |
| DIAMOND HILL FUNDS | | | | | ANNUAL REPORT | | | | | DECEMBER 31, 2014 | | | | | DIAMOND-HILL.COM | | | 29 | |
Diamond Hill Financial Long-Short Fund
AVERAGE ANNUAL TOTAL RETURNS AS OF DECEMBER 31, 2014
| | | | | | | | | | | | | | | | | | | | | | | | |
| | | Inception Date | | | One
Year | | | Three
Years | | | Five
Years | | | Ten
Years | | | Expense
Ratio* | |
| PERFORMANCE AT NAV WITHOUT SALES CHARGES | | | | | | | | | | | | | | | | | |
| Class A Shares | | | 8/1/1997 | | | | 8.16 | % | | | 23.32 | % | | | 13.66 | % | | | 2.33 | % | | | 1.75 | % |
| Class C Shares | | | 6/3/1999 | | | | 7.41 | | | | 22.39 | | | | 12.82 | | | | 1.55 | | | | 2.50 | |
| Class I Shares | | | 12/31/2006 | | | | 8.42 | | | | 23.64 | | | | 13.98 | | | | 2.62 | | | | 1.50 | |
| BENCHMARK | | | | | | | | | | | | | | | | | |
| S&P Composite 1500 Financials Index** | | | | | | | 14.89 | | | | 25.11 | | | | 13.53 | | | | 0.73 | | | | — | |
| Russell 3000 Financials Index | | | | | | | 14.06 | | | | 24.75 | | | | 14.00 | | | | 2.10 | | | | — | |
| PERFORMANCE AT POP INCLUDES SALES CHARGES*** | | | | | | | | | | | | | | | | | |
| Class A Shares | | | 8/1/1997 | | | | 2.78 | | | | 21.24 | | | | 12.50 | | | | 1.81 | | | | 1.75 | |
| Class C Shares | | | 6/3/1999 | | | | 6.41 | | | | 22.39 | | | | 12.82 | | | | 1.55 | | | | 2.50 | |
| * | Reflects the expense ratio as reported in the Prospectus dated February 28, 2015. |
| ** | Effective December 31, 2014, the Fund’s benchmark changed from the S&P 1500 Financials Composite Index to the Russell 3000 Financials Index, which is a more representative universe of the securities held in the fund. |
| *** | The maximum sales charge for Class A shares on purchases and Class C shares on certain redemptions are 5.00% and 1.00% respectively. |
GROWTH OF $10,000
Comparison of the change in value of a $10,000 Investment in the Diamond Hill Financial Long-Short Fund Class I(A), Russell 3000 Financials Index and the S&P Composite 1500 Financials Index.
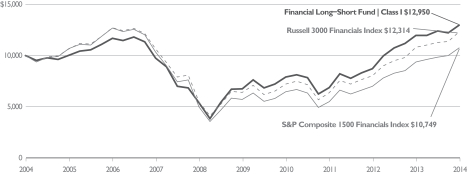
| (A) | The growth of $10,000 chart represents the performance of Class I shares only, which will vary from the performance of Class A and Class C shares based on the difference in loads and fees paid by shareholders in the different classes. |
| | The chart above represents a comparison of a hypothetical $10,000 investment and the reinvestment of dividends and capital gains in the indicated share class versus a similar investment in the Russell 3000 Financials Index and the S&P Composite 1500 Financials Index. The Russell 3000 Financials Index consists of Russell 3000 companies involved in banking, mortgage finance, consumer finance, specialized finance, investment banking and brokerage, asset management and custody, corporate lending, insurance, financial investments and real estate, including REITS. The Russell 3000 Index measures the performance of the largest 3,000 U.S. companies representing approximately 98% of the investable U.S. equity market. The S&P Composite 1500 Financials Index is a market capitalized-weighted index which is comprised of the companies that represent the Financial Services Sector weighting within the S&P Composite 1500 Financials Index. The indices are unmanaged, and do not reflect the deduction of fees associated with a mutual fund such as investment management and accounting fees. The Fund’s performance reflects the deduction of fees for these services. Investors cannot invest directly in an index although they can invest in the underlying securities. |
| | Historical performance for Class I shares prior to its inception is based on the performance of Class A shares. Class I performance has been adjusted to reflect differences in sales charges. |
| | Past performance does not guarantee future results. The performance data quoted represents past performance and current returns may be lower or higher. The investment return and principal value will fluctuate so that an investor’s shares, when redeemed, may be worth more or less than the original cost. To obtain performance information current to the most recent month end, please visit www.diamond-hill.com. |
| | | | | | | | | | | | | | |
| 30 | | DIAMOND HILL FUNDS | | | | | ANNUAL REPORT | | | | | DECEMBER 31, 2014 | | | | | DIAMOND-HILL.COM |
Diamond Hill Strategic Income Fund
2014 Portfolio Commentary
The Diamond Hill Strategic Income Fund generated a 2.38% total return (Class I) in 2014 compared to 6.43% for the Bank of America Merrill Lynch U.S. Corporate & High Yield Index (the “Corporate & High Yield Index”). For the trailing five-year period, the Fund generated a total return of 7.29% per year compared to 7.07% for the Index.
It bears repeating that the Fund is not managed against the Corporate & High Yield Index or any other index. Instead, we are focused on our absolute return objectives of (1) inflation plus 3% and (2) 7%, each measured over rolling 5-year periods. Our goal is to achieve these absolute objectives while minimizing the risk of a permanent impairment of capital. While we trailed the Corporate & High Yield Index by 405 bps during 2014, it is important to note the significant differences between the Fund and the Corporate & High Yield Index. At year-end, the Fund held 92% in high yield and 3% in investment grade corporate bonds compared to 21% and 79% for the Corporate & High Yield Index. The Fund’s duration was 2.71 compared to 6.45 for the Corporate & High Yield Index.
The 10-Year U.S. Treasury yield declined an additional 85 basis points during the year to 2.17%. This yield does not reflect accelerating nominal GDP growth in the U.S., the end of Federal Reserve asset purchases, and market expectations for increases in the Fed Funds rate. However, certain global developed economies are mired in low to no growth resulting in German 10-year yields at 0.54% and Japanese 10-year yields at 0.32%. Peripheral countries such as Spain at 1.61% and Italy at 1.89% also provide less yield. We continue to favor credit risk over interest rate risk.
In last year’s annual report we wrote the following:
“…we are somewhat more cautious on credit risk as the option adjusted spread of the Bank of America Merrill Lynch U.S. High Yield Index narrowed from 534 basis points to 400 basis points during 2013. Assuming a 4% default rate (the historic average) and assuming a loss on default of 60%, the high yield spread would only need to be 240 basis points to compensate an investor for default losses. However, the high yield spread also compensates the investor for illiquidity, volatility, and other factors. Based on our assumption for default losses, this additional compensation is 160 basis points compared to what we think of as a normalized level of 300 basis points. As a result, high yield credit spreads are either discounting well below average default rates — less than 2% (as has been the experience in recent years) — for an extended period or continued liquidity and low volatility for an extended period. While a continuation of these favorable credit trends is a distinct possibility, we believe that it is prudent to be prepared for more illiquidity and volatility at a minimum.”
After entering 2014 at 400 basis points, the option-adjusted spread of the Bank of America Merrill Lynch High Yield Index (the “High Yield Index”) narrowed to 353 basis points at the end of the second quarter but finished the year at 504 basis points. Due in part to our absolute orientation, the Fund outperformed the High Yield Index during the last half of
| | | | | | | | | | | | | | | | |
| DIAMOND HILL FUNDS | | | | | ANNUAL REPORT | | | | | DECEMBER 31, 2014 | | | | | DIAMOND-HILL.COM | | | 31 | |
Diamond Hill Strategic Income Fund
2014 by 252 basis points, with the Fund down 0.45% compared to down 2.97% for the High Yield Index.
Energy has been the largest sector weighting in the High Yield Index at about 15% at the end of the 2014 second quarter declining to 13% by the end of the year. In contrast, the Fund’s energy weighting was less than 7% at mid-year increasing to just over 8.5% by year-end as we found some opportunities during the sell-off. Energy is now priced for markedly higher defaults over the next twelve months, while the rest of the High Yield Index is priced for 3% defaults. Market fundamentals remain strong, and we do not anticipate defaults at those levels. As a result, with the option adjusted spread back to 504 basis points, we are even more favorable on credit risk coming into 2015.
While the Fund’s 2014 total return of 2.38% was below our long run objectives, we are pleased to have generated a total return above inflation over a twelve-month period in which our yield-to-worst increased 194 basis points from 3.49% to 5.43%. Further, the Fund has achieved its longer term objectives over the prior five years, and we took many steps in the second half of the year to better position us to achieve those objectives over the next five years
John McClain, CFA will join me as Portfolio Manager of the Fund effective February 28, 2015. Since John joined Diamond Hill on June 30, 2014, he has been working closely with me and the entire Diamond Hill research and portfolio management teams and has made a significant contribution to the Fund.
| | |

| | |
| |
Bill Zox, CFA Portfolio Manager | | |
| | | | | | | | | | | | | | |
| 32 | | DIAMOND HILL FUNDS | | | | | ANNUAL REPORT | | | | | DECEMBER 31, 2014 | | | | | DIAMOND-HILL.COM |
Diamond Hill Strategic Income Fund
AVERAGE ANNUAL TOTAL RETURNS AS OF DECEMBER 31, 2014
| | | | | | | | | | | | | | | | | | | | | | | | |
| | | Inception Date | | | One
Year | | | Three
Years | | | Five
Years | | | Ten
Years | | | Expense
Ratio* | |
| PERFORMANCE AT NAV WITHOUT SALES CHARGES | | | | | | | | | | | | | | | | | |
| Class A Shares | | | 9/30/2002 | | | | 2.10 | % | | | 5.55 | % | | | 6.99 | % | | | 5.43 | % | | | 0.94 | % |
| Class C Shares | | | 9/30/2002 | | | | 1.37 | | | | 4.75 | | | | 6.18 | | | | 4.64 | | | | 1.69 | |
| Class I Shares | | | 1/31/2005 | | | | 2.38 | | | | 5.80 | | | | 7.29 | | | | 5.78 | | | | 0.69 | |
| Class Y Shares | | | 12/30/2011 | | | | 2.54 | | | | 5.95 | | | | 7.24 | | | | 5.55 | | | | 0.55 | |
| BENCHMARK | | | | | | | | | | | | | | | | | |
BofA Merrill Lynch U.S.
Corporate & High Yield Index | | | | | | | 6.43 | | | | 5.95 | | | | 7.07 | | | | 5.96 | | | | — | |
Consumer Price Index - All Urban Consumers from the Bureau of
Labor Statistics plus 3% annual risk premium | | | | | | | 3.76 | | | | 4.33 | | | | 4.69 | | | | 5.12 | | | | — | |
| PERFORMANCE AT POP INCLUDES SALES CHARGES** | | | | | | | | | | | | | | | | | |
| Class A Shares | | | 9/30/2002 | | | | -1.51 | | | | 4.31 | | | | 6.23 | | | | 5.06 | | | | 0.94 | |
| Class C Shares | | | 9/30/2002 | | | | 0.39 | | | | 4.75 | | | | 6.18 | | | | 4.64 | | | | 1.69 | |
| * | Reflects the expense ratio as reported in the Prospectus dated February 28, 2015. |
| ** | The maximum sales charge for Class A shares on purchases and Class C shares on certain redemptions are 3.50% and 1.00% respectively. |
GROWTH OF $10,000
Comparison of the change in value of a $10,000 Investment in the Diamond Hill Strategic Income Fund Class I(A), BofA Merrill Lynch U.S. Corporate & High Yield Index, and Consumer Price Index - All Urban Consumers from the Bureau of Labor Statistics plus 3% annual risk premium.
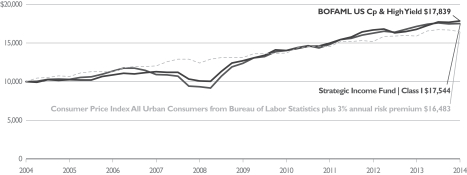
| (A) | The growth of $10,000 chart represents the performance of Class I shares only, which will vary from the performance of Class A, Class C and Class Y shares based on the difference in loads and fees paid by shareholders in the different classes. |
| | The chart above represents a comparison of a hypothetical $10,000 investment and the reinvestment of dividends and capital gains in the indicated share class versus a similar investment in the BofA Merrill Lynch U.S. Corporate & High Yield Index and the Consumer Price Index — All Urban Consumers from the Bureau of Labor Statistics (CPI). The BofA Merrill Lynch U.S. Corporate & High Yield Index tracks the performance of the U.S. dollar denominated investment grade and below investment grade corporate debt publically issued in the U.S. domestic market. The CPI is an economic metric that measures prices for a basket of goods and services sold to urban consumers. The CPI is increased by a 3 percent risk premium to correspond with the Fund’s long-term goals of achieving returns above the rate of inflation. All indices are unmanaged, and do not reflect the deduction of fees associated with a mutual fund such as investment management and accounting fees. The Fund’s performance reflects the deduction of fees for these services. Investors cannot invest directly in an index although they can invest in the underlying securities. |
| | Historical performance for Class I and Class Y shares prior to their inception is based on the performance of Class A shares. Class I and Class Y performance has been adjusted to reflect differences in sales charges. |
| | Past performance does not guarantee future results. The performance data quoted represents past performance and current returns may be lower or higher. The investment return and principal value will fluctuate so that an investor’s shares, when redeemed, may be worth more or less than the original cost. To obtain performance information current to the most recent month end, please visit www.diamond-hill.com. |
| | | | | | | | | | | | | | | | |
| DIAMOND HILL FUNDS | | | | | ANNUAL REPORT | | | | | DECEMBER 31, 2014 | | | | | DIAMOND-HILL.COM | | | 33 | |
Diamond Hill Small Cap Fund
Schedule of Investments
December 31, 2014
| | | | | | | | |
| | | Shares | | | Fair
Value | |
|
| Common Stocks — 80.4% | |
| Consumer Discretionary — 9.7% | |
Aaron’s, Inc. | | | 471,635 | | | $ | 14,417,882 | |
Callaway Golf Co.^ | | | 375,583 | | | | 2,891,989 | |
Carter’s, Inc. | | | 96,830 | | | | 8,454,227 | |
Global Sources Ltd.*^ | | | 749,948 | | | | 4,769,669 | |
Hillenbrand, Inc. | | | 372,900 | | | | 12,865,050 | |
Live Nation Entertainment, Inc.* | | | 855,915 | | | | 22,347,941 | |
Steiner Leisure Ltd.* | | | 729,752 | | | | 33,721,840 | |
Tenneco, Inc.* | | | 386,305 | | | | 21,868,726 | |
Vail Resorts, Inc. | | | 198,385 | | | | 18,078,825 | |
| | | | | | | | 139,416,149 | |
|
| Consumer Staples — 4.8% | |
B&G Foods, Inc.^ | | | 630,640 | | | | 18,856,136 | |
Energizer Holdings, Inc. | | | 129,105 | | | | 16,597,739 | |
Flowers Foods, Inc. | | | 1,090,759 | | | | 20,931,665 | |
Post Holdings, Inc.*^ | | | 294,100 | | | | 12,319,849 | |
| | | | | | | | 68,705,389 | |
|
| Energy — 6.5% | |
Carrizo Oil & Gas, Inc.* | | | 250,821 | | | | 10,434,154 | |
Cimarex Energy Co. | | | 284,130 | | | | 30,117,779 | |
Contango Oil & Gas Co.* | | | 322,862 | | | | 9,440,485 | |
Denbury Resources, Inc. ^ | | | 638,515 | | | | 5,191,127 | |
Rosetta Resources, Inc.*^ | | | 909,285 | | | | 20,286,148 | |
Southwestern Energy Co.* | | | 177,485 | | | | 4,843,566 | |
Whiting Petroleum Corp.* | | | 402,150 | | | | 13,270,950 | |
| | | | | | | | 93,584,209 | |
|
| Financials — 28.6% | |
Alleghany Corp.* | | | 36,757 | | | | 17,036,870 | |
American Equity Investment Life Holding Co. | | | 613,520 | | | | 17,908,649 | |
Assured Guaranty Ltd. | | | 379,152 | | | | 9,854,160 | |
Brown & Brown, Inc. | | | 875,680 | | | | 28,818,629 | |
Endurance Specialty Holdings Ltd. | | | 321,160 | | | | 19,218,214 | |
Enstar Group Ltd.*^ | | | 154,852 | | | | 23,675,322 | |
First Horizon National Corp.^ | | | 791,280 | | | | 10,745,582 | |
First Niagara Financial Group, Inc. | | | 658,720 | | | | 5,553,010 | |
First of Long Island Corp., The^ | | | 256,468 | | | | 7,275,997 | |
Fortress Investment Group LLC, Class A | | | 2,277,715 | | | | 18,267,274 | |
Greenlight Capital Re Ltd., Class A *^ | | | 531,000 | | | | 17,337,150 | |
| | | | | | | | |
| | | Shares | | | Fair
Value | |
|
| Financials — 28.6% continued | |
HCC Insurance Holdings, Inc. | | | 750,230 | | | $ | 40,152,310 | |
Infinity Property & Casualty Corp. | | | 89,440 | | | | 6,910,134 | |
iStar Financial, Inc. REIT*^ | | | 2,854,750 | | | | 38,967,337 | |
Mid-America Apartment Communities, Inc. REIT | | | 224,204 | | | | 16,743,555 | |
National Penn Bancshares, Inc. | | | 856,140 | | | | 9,010,874 | |
Nationstar Mortgage Holdings, Inc.*^ | | | 199,105 | | | | 5,612,770 | |
Navigators Group, Inc.*^ | | | 550,828 | | | | 40,397,727 | |
Popular, Inc.* | | | 1,045,703 | | | | 35,606,187 | |
Reinsurance Group of America | | | 127,270 | | | | 11,151,397 | |
State Bank Financial Corp. | | | 342,875 | | | | 6,850,643 | |
Sterling Bancorp | | | 775,960 | | | | 11,158,304 | |
Winthrop Realty Trust REIT | | | 884,650 | | | | 13,791,694 | |
| | | | | | | | 412,043,789 | |
|
| Health Care — 6.9% | |
Alere, Inc.* | | | 861,565 | | | | 32,739,470 | |
Greatbatch, Inc.* | | | 374,260 | | | | 18,451,018 | |
LifePoint Hospitals, Inc.* | | | 75,750 | | | | 5,447,183 | |
Natus Medical, Inc.* | | | 847,635 | | | | 30,548,765 | |
Universal American Financial Corp.* | | | 1,326,486 | | | | 12,309,790 | |
| | | | | | | | 99,496,226 | |
|
| Industrials — 16.2% | |
AAR Corp. | | | 396,792 | | | | 11,022,882 | |
Aircastle Ltd.^ | | | 1,097,365 | | | | 23,450,690 | |
Alaska Air Group, Inc. | | | 238,560 | | | | 14,256,346 | |
Avis Budget Group, Inc.* | | | 844,625 | | | | 56,023,974 | |
Brink’s Co., The | | | 364,190 | | | | 8,889,878 | |
Corrections Corp. of America^ | | | 641,908 | | | | 23,326,937 | |
Hub Group, Inc., Class A* | | | 667,070 | | | | 25,402,026 | |
Hyster-Yale Materials Handling, Inc.^ | | | 111,100 | | | | 8,132,520 | |
Kennametal, Inc.^ | | | 389,230 | | | | 13,930,541 | |
Toro Co., The | | | 188,380 | | | | 12,020,528 | |
TriMas Corp. * | | | 427,850 | | | | 13,387,427 | |
Trinity Industries, Inc.^ | | | 825,750 | | | | 23,129,257 | |
| | | | | | | | 232,973,006 | |
| | | | | | | | | | | | | | |
| 34 | | DIAMOND HILL FUNDS | | | | | ANNUAL REPORT | | | | | DECEMBER 31, 2014 | | | | | DIAMOND-HILL.COM |
Diamond Hill Small Cap Fund
Schedule of Investments (Continued)
December 31, 2014
Diamond Hill Small-Mid Cap Fund
Schedule of Investments
December 31, 2014
| | | | | | | | |
| | | Shares | | | Fair
Value | |
|
| Common Stocks — 80.4% continued | |
| Information Technology — 4.6% | |
Broadridge Financial Solutions, Inc. | | | 534,710 | | | $ | 24,692,908 | |
CSG Systems International, Inc.^ | | | 209,772 | | | | 5,258,984 | |
DST Systems, Inc. | | | 366,090 | | | | 34,467,373 | |
Rovi Corp.* | | | 85,985 | | | | 1,942,401 | |
| | | | | | | | 66,361,666 | |
|
| Utilities — 3.1% | |
Cleco Corp. | | | 205,390 | | | | 11,201,970 | |
ITC Holdings Corp. | | | 265,083 | | | | 10,717,306 | |
UGI Corp. | | | 603,930 | | | | 22,937,262 | |
| | | | | | | | 44,856,538 | |
| |
| Total Common Stocks | | | $ | 1,157,436,972 | |
|
| Registered Investment Companies — 24.6% | |
State Street Institutional Liquid Reserves Fund, Premier Class, 0.07%S | | | 285,434,439 | | | $ | 285,434,439 | |
State Street Navigator Securities Lending Prime Portfolio, 0.18%†S | | | 69,360,828 | | | | 69,360,828 | |
| |
| Total Registered Investment Companies | | | $ | 354,795,267 | |
|
| Total Investment Securities — 105.0% | |
(Cost $1,169,081,658)** | | | $ | 1,512,232,239 | |
| |
Net Other Assets
(Liabilities) — (5.0)% | | | | (71,633,091 | ) |
| |
| Net Assets — 100.0% | | | $ | 1,440,599,148 | |
| ^ | All or a portion of the security is on loan. The total fair value of the securities on loan as of December 31, 2014 was $67,146,296. |
| * | Non-income producing security. |
| † | This security, which was purchased using cash collateral received from securities on loan, represents collateral for securities loaned as of December 31, 2014. |
| S | Rate represents the daily yield on December 31, 2014. |
| ** | Represents cost for financial reporting purposes. |
REIT – Real Estate Investment Trust
See accompanying Notes to Financial Statements
| | | | | | | | |
| | | Shares | | | Fair
Value | |
|
| Common Stocks — 91.2% | |
| Consumer Discretionary — 15.2% | |
Aaron’s, Inc. | | | 410,740 | | | $ | 12,556,322 | |
Gannett Co., Inc. | | | 367,260 | | | | 11,726,612 | |
Goodyear Tire & Rubber Co., The | | | 515,907 | | | | 14,739,463 | |
Jarden Corp.* | | | 351,935 | | | | 16,850,648 | |
Staples, Inc.^ | | | 1,150,245 | | | | 20,842,439 | |
Steiner Leisure Ltd.* | | | 320,858 | | | | 14,826,848 | |
Whirlpool Corp. | | | 69,170 | | | | 13,400,996 | |
| | | | | | | | 104,943,328 | |
|
| Consumer Staples — 10.5% | |
B&G Foods, Inc.^ | | | 428,373 | | | | 12,808,353 | |
Coty, Inc.^ | | | 245,750 | | | | 5,077,195 | |
Energizer Holdings, Inc. | | | 83,105 | | | | 10,683,979 | |
Flowers Foods, Inc.^ | | | 799,698 | | | | 15,346,204 | |
Molson Coors Brewing Co., Class B | | | 221,330 | | | | 16,493,512 | |
Post Holdings, Inc.*^ | | | 299,947 | | | | 12,564,780 | |
| | | | | | | | 72,974,023 | |
|
| Energy — 6.6% | |
Cimarex Energy Co. | | | 223,805 | | | | 23,723,329 | |
Contango Oil & Gas Co.* | | | 85,104 | | | | 2,488,441 | |
Energen Corp. | | | 62,708 | | | | 3,998,262 | |
Noble Energy, Inc. | | | 100,130 | | | | 4,749,166 | |
Southwestern Energy Co.* | | | 181,650 | | | | 4,957,229 | |
Whiting Petroleum Corp.* | | | 183,930 | | | | 6,069,690 | |
| | | | | | | | 45,986,117 | |
|
| Financials — 28.6% | |
American Equity Investment Life Holding Co. | | | 176,590 | | | | 5,154,662 | |
BOK Financial Corp. | | | 92,230 | | | | 5,537,489 | |
Brown & Brown, Inc. | | | 612,860 | | | | 20,169,223 | |
Endurance Specialty Holdings Ltd. | | | 265,685 | | | | 15,898,590 | |
Enstar Group Ltd.* | | | 23,180 | | | | 3,543,990 | |
First Horizon National Corp.^ | | | 945,830 | | | | 12,844,371 | |
First Republic Bank | | | 240,955 | | | | 12,558,575 | |
Greenlight Capital Re Ltd., Class A* | | | 173,704 | | | | 5,671,436 | |
HCC Insurance Holdings, Inc. | | | 173,235 | | | | 9,271,537 | |
Infinity Property & Casualty Corp. | | | 58,160 | | | | 4,493,442 | |
iStar Financial, Inc. REIT*^ | | | 895,200 | | | | 12,219,480 | |
| | | | | | | | | | | | | | | | |
| DIAMOND HILL FUNDS | | | | | ANNUAL REPORT | | | | | DECEMBER 31, 2014 | | | | | DIAMOND-HILL.COM | | | 35 | |
Diamond Hill Small-Mid Cap Fund
Schedule of Investments (Continued)
December 31, 2014
| | | | | | | | |
| | | Shares | | | Fair
Value | |
|
| Common Stocks — 91.2% continued | |
| Financials — 28.6% continued | |
Mid-America Apartment Communities, Inc. REIT | | | 109,090 | | | $ | 8,146,841 | |
National Penn Bancshares, Inc. | | | 572,575 | | | | 6,026,352 | |
Nationstar Mortgage Holdings, Inc.*^ | | | 201,855 | | | | 5,690,292 | |
Navigators Group, Inc.* | | | 116,195 | | | | 8,521,741 | |
Popular, Inc.* | | | 376,092 | | | | 12,805,933 | |
Reinsurance Group of America | | | 63,225 | | | | 5,539,775 | |
Willis Group Holdings plc | | | 810,810 | | | | 36,332,397 | |
XL Group plc | | | 198,090 | | | | 6,808,353 | |
| | | | | | | | 197,234,479 | |
|
| Health Care — 10.7% | |
Boston Scientific Corp.* | | | 1,573,200 | | | | 20,844,900 | |
CareFusion Corp.* | | | 137,750 | | | | 8,174,085 | |
Catamaran Corp.* | | | 257,405 | | | | 13,320,709 | |
LifePoint Hospitals, Inc.* | | | 189,135 | | | | 13,600,697 | |
Orthofix International NV* | | | 308,632 | | | | 9,277,478 | |
Universal American Financial Corp.* | | | 928,935 | | | | 8,620,517 | |
| | | | | | | | 73,838,386 | |
|
| Industrials — 10.3% | |
Aircastle Ltd. | | | 285,135 | | | | 6,093,335 | |
Brink’s Co., The | | | 198,180 | | | | 4,837,574 | |
Corrections Corp. of America | | | 269,906 | | | | 9,808,384 | |
Dover Corp. | | | 201,558 | | | | 14,455,739 | |
Hub Group, Inc., Class A* | | | 589,455 | | | | 22,446,446 | |
Kennametal, Inc.^ | | | 213,335 | | | | 7,635,260 | |
Knowles Corp.*^ | | | 49,536 | | | | 1,166,573 | |
Parker Hannifin Corp. | | | 35,010 | | | | 4,514,540 | |
| | | | | | | | 70,957,851 | |
|
| Information Technology — 6.2% | |
Broadridge Financial | | | | | | | | |
Solutions, Inc. | | | 112,710 | | | | 5,204,948 | |
Juniper Networks, Inc. | | | 846,885 | | | | 18,902,473 | |
Linear Technology Corp. | | | 165,385 | | | | 7,541,556 | |
Vantiv, Inc., Class A* | | | 339,225 | | | | 11,506,512 | |
| | | | | | | | 43,155,489 | |
| | | | | | | | |
| | | Shares | | | Fair
Value | |
|
| Utilities — 3.1% | |
Cleco Corp. | | | 40,780 | | | $ | 2,224,141 | |
ITC Holdings Corp. | | | 168,210 | | | | 6,800,731 | |
UGI Corp. | | | 332,820 | | | | 12,640,503 | |
| | | | | | | | 21,665,375 | |
| |
| Total Common Stocks | | | $ | 630,755,048 | |
|
| Registered Investment Companies — 13.6% | |
State Street Institutional Liquid Reserves Fund, Premier Class, 0.07%S | | | 71,446,965 | | | $ | 71,446,965 | |
State Street Navigator Securities Lending Prime Portfolio, 0.18%†S | | | 22,736,122 | | | | 22,736,122 | |
| |
| Total Registered Investment Companies | | | $ | 94,183,087 | |
|
| Total Investment Securities — 104.8% | |
(Cost $650,711,127)** | | | | | | $ | 724,938,135 | |
| |
Net Other Assets
(Liabilities) — (4.8)% | | | | (33,203,760 | ) |
| |
| Net Assets — 100.0% | | | $ | 691,734,375 | |
| ^ | All or a portion of the security is on loan. The total fair value of the securities on loan as of December 31, 2014 was $21,935,974. |
| * | Non-income producing security. |
| † | This security, which was purchased using cash collateral received from securities on loan, represents collateral for securities loaned as of December 31, 2014. |
| S | Rate represents the daily yield on December 31, 2014. |
| ** | Represents cost for financial reporting purposes. |
REIT – Real Estate Investment Trust
See accompanying Notes to Financial Statements
| | | | | | | | | | | | | | |
| 36 | | DIAMOND HILL FUNDS | | | | | ANNUAL REPORT | | | | | DECEMBER 31, 2014 | | | | | DIAMOND-HILL.COM |
Diamond Hill Mid Cap Fund
Schedule of Investments
December 31, 2014
| | | | | | | | |
| | | Shares | | | Fair
Value | |
|
| Common Stocks — 93.5% | |
| Consumer Discretionary — 16.0% | |
Aaron’s, Inc. | | | 9,459 | | | $ | 289,162 | |
Dollar General Corp.* | | | 2,368 | | | | 167,418 | |
Gannett Co., Inc.^ | | | 8,435 | | | | 269,330 | |
Goodyear Tire & Rubber Co., The | | | 12,025 | | | | 343,554 | |
Jarden Corp.*^ | | | 8,148 | | | | 390,126 | |
Mattel, Inc.^ | | | 4,640 | | | | 143,585 | |
Staples, Inc.^ | | | 22,035 | | | | 399,274 | |
VF Corp.^ | | | 2,575 | | | | 192,868 | |
Whirlpool Corp. | | | 2,116 | | | | 409,953 | |
| | | | | | | | 2,605,270 | |
|
| Consumer Staples — 12.1% | |
B&G Foods, Inc.^ | | | 9,885 | | | | 295,562 | |
Coty, Inc.^ | | | 7,450 | | | | 153,917 | |
Energizer Holdings, Inc. | | | 1,910 | | | | 245,550 | |
Flowers Foods, Inc.^ | | | 19,266 | | | | 369,714 | |
Molson Coors Brewing Co., Class B^ | | | 5,077 | | | | 378,338 | |
Post Holdings, Inc.*^ | | | 6,445 | | | | 269,981 | |
Sysco Corp. | | | 6,390 | | | | 253,619 | |
| | | | | | | | 1,966,681 | |
| | |
| Energy — 7.2% | | | | | | | | |
Cimarex Energy Co.^ | | | 5,448 | | | | 577,488 | |
Energen Corp.^ | | | 1,275 | | | | 81,294 | |
Noble Energy, Inc. | | | 5,646 | | | | 267,790 | |
Southwestern Energy Co.*^ | | | 4,053 | | | | 110,606 | |
Whiting Petroleum Corp.*^ | | | 4,284 | | | | 141,372 | |
| | | | | | | | 1,178,550 | |
| | |
| Financials — 29.4% | | | | | | | | |
Alleghany Corp.*^ | | | 258 | | | | 119,583 | |
American Equity Investment Life Holding Co. | | | 4,203 | | | | 122,686 | |
BOK Financial Corp. | | | 2,090 | | | | 125,484 | |
Brown & Brown, Inc.^ | | | 14,105 | | | | 464,195 | |
Endurance Specialty Holdings Ltd.^ | | | 7,300 | | | | 436,832 | |
Enstar Group Ltd.*^ | | | 1,045 | | | | 159,770 | |
First Horizon National Corp.^ | | | 22,245 | | | | 302,086 | |
First Republic Bank^ | | | 5,665 | | | | 295,260 | |
HCC Insurance Holdings, Inc. | | | 5,310 | | | | 284,191 | |
Mid-America Apartment Communities, Inc. REIT^ | | | 3,026 | | | | 225,982 | |
National Penn Bancshares, Inc.^ | | | 15,733 | | | | 165,590 | |
Nationstar Mortgage Holdings, Inc.*^ | | | 5,781 | | | | 162,966 | |
| | | | | | | | |
| | | Shares | | | Fair
Value | |
|
| Financials — 29.4% continued | |
Popular, Inc.* | | | 8,691 | | | $ | 295,929 | |
Progressive Corp.^ | | | 6,432 | | | | 173,600 | |
Reinsurance Group of America | | | 1,329 | | | | 116,447 | |
SunTrust Banks, Inc. | | | 6,432 | | | | 269,501 | |
Willis Group Holdings plc^ | | | 19,362 | | | | 867,610 | |
XL Group plc^ | | | 5,521 | | | | 189,757 | |
| | | | | | | | 4,777,469 | |
| | |
| Health Care — 9.6% | | | | | | | | |
Boston Scientific Corp.* | | | 51,853 | | | | 687,052 | |
CareFusion Corp.* | | | 4,341 | | | | 257,595 | |
Catamaran Corp.* | | | 5,805 | | | | 300,409 | |
LifePoint Hospitals, Inc.*^ | | | 4,375 | | | | 314,606 | |
| | | | | | | | 1,559,662 | |
| | |
| Industrials — 9.3% | | | | | | | | |
Corrections Corp. of America^ | | | 7,777 | | | | 282,616 | |
Dover Corp.^ | | | 5,530 | | | | 396,613 | |
Hub Group, Inc., Class A*^ | | | 9,080 | | | | 345,766 | |
Kennametal, Inc.^ | | | 4,961 | | | | 177,554 | |
Parker Hannifin Corp.^ | | | 2,471 | | | | 318,635 | |
| | | | | | | | 1,521,184 | |
|
| Information Technology — 6.2% | |
Broadridge Financial Solutions, Inc. | | | 2,875 | | | | 132,768 | |
Juniper Networks, Inc.^ | | | 19,816 | | | | 442,293 | |
Linear Technology Corp.^ | | | 3,905 | | | | 178,068 | |
Vantiv, Inc., Class A*^ | | | 7,670 | | | | 260,166 | |
| | | | | | | | 1,013,295 | |
| | |
| Materials — 0.7% | | | | | | | | |
Eastman Chemical Co. | | | 1,535 | | | | 116,445 | |
| | |
| Utilities — 3.0% | | | | | | | | |
Cleco Corp. | | | 1,123 | | | | 61,248 | |
ITC Holdings Corp. | | | 4,094 | | | | 165,521 | |
UGI Corp.^ | | | 7,109 | | | | 270,000 | |
| | | | | | | | 496,769 | |
| | |
| Total Common Stocks | | | | | | $ | 15,235,325 | |
| | | | | | | | | | | | | | | | |
| DIAMOND HILL FUNDS | | | | | ANNUAL REPORT | | | | | DECEMBER 31, 2014 | | | | | DIAMOND-HILL.COM | | | 37 | |
Diamond Hill Mid Cap Fund
Schedule of Investments (Continued)
December 31, 2014
Diamond Hill Large Cap Fund
Schedule of Investments
December 31, 2014
| | | | | | | | |
| | | Shares | | | Fair
Value | |
|
| Registered Investment Companies — 35.3% | |
State Street Institutional Liquid Reserves Fund,
Premier Class, 0.07%S | | | 1,077,493 | | | $ | 1,077,493 | |
State Street Navigator Securities Lending Prime Portfolio,
0.18%†S | | | 4,681,977 | | | | 4,681,977 | |
| |
| Total Registered Investment Companies | | | $ | 5,759,470 | |
|
| Total Investment Securities — 128.8% | |
(Cost $20,098,034)** | | | | | | $ | 20,994,795 | |
| |
Net Other Assets
(Liabilities) — (28.8)% | | | | (4,691,345 | ) |
| |
| Net Assets — 100.0% | | | $ | 16,303,450 | |
| ^ | All or a portion of the security is on loan. The total fair value of the securities on loan as of December 31, 2014 was $4,526,893. |
| * | Non-income producing security. |
| † | This security, which was purchased using cash collateral received from securities on loan, represents collateral for securities loaned as of December 31, 2014. |
| S | Rate represents the daily yield on December 31, 2014. |
| ** | Represents cost for financial reporting purposes. |
REIT – Real Estate Investment Trust
See accompanying Notes to Financial Statements
| | | | | | | | |
| | | Shares | | | Fair
Value | |
|
| Common Stocks — 98.8% | |
| Consumer Discretionary — 15.2% | |
Comcast Corp., Class A | | | 1,158,555 | | | $ | 67,207,775 | |
Gannett Co., Inc.^ | | | 1,309,405 | | | | 41,809,302 | |
Goodyear Tire & Rubber Co., The | | | 1,465,655 | | | | 41,873,763 | |
McDonald’s Corp. | | | 285,264 | | | | 26,729,237 | |
TJX Cos., Inc., The | | | 1,103,865 | | | | 75,703,062 | |
Twenty-First Century Fox, Inc. | | | 1,432,935 | | | | 52,860,972 | |
VF Corp. | | | 897,020 | | | | 67,186,798 | |
Walt Disney Co., The | | | 707,200 | | | | 66,611,168 | |
Whirlpool Corp. | | | 280,875 | | | | 54,416,723 | |
| | | | | | | | 494,398,800 | |
|
| Consumer Staples — 8.7% | |
Kimberly-Clark Corp. | | | 624,380 | | | | 72,140,865 | |
Philip Morris International | | | 604,275 | | | | 49,218,199 | |
Procter & Gamble Co., The | | | 1,221,387 | | | | 111,256,142 | |
Sysco Corp. | | | 1,234,034 | | | | 48,978,809 | |
| | | | | | | | 281,594,015 | |
|
| Energy — 8.7% | |
Cimarex Energy Co. | | | 580,610 | | | | 61,544,660 | |
Devon Energy Corp. | | | 1,579,442 | | | | 96,677,645 | |
EOG Resources, Inc. | | | 800,846 | | | | 73,733,891 | |
Occidental Petroleum Corp. | | | 610,805 | | | | 49,236,991 | |
| | | | | | | | 281,193,187 | |
|
| Financials — 27.3% | |
American International Group, Inc. | | | 1,781,345 | | | | 99,773,134 | |
Capital One Financial Corp. | | | 804,930 | | | | 66,446,972 | |
Citigroup, Inc. | | | 1,844,835 | | | | 99,824,022 | |
Franklin Resources, Inc. | | | 881,085 | | | | 48,785,676 | |
JPMorgan Chase & Co. | | | 1,606,903 | | | | 100,559,990 | |
Marsh & McLennan Cos., Inc. | | | 1,261,130 | | | | 72,187,081 | |
MetLife, Inc. | | | 759,770 | | | | 41,095,959 | |
Morgan Stanley | | | 2,626,490 | | | | 101,907,812 | |
PNC Financial Services Group, Inc. | | | 810,535 | | | | 73,945,108 | |
Progressive Corp. | | | 2,482,065 | | | | 66,990,934 | |
Prudential Financial, Inc. | | | 913,529 | | | | 82,637,833 | |
Wells Fargo & Co. | | | 577,765 | | | | 31,673,077 | |
| | | | | | | | 885,827,598 | |
| | | | | | | | | | | | | | |
| 38 | | DIAMOND HILL FUNDS | | | | | ANNUAL REPORT | | | | | DECEMBER 31, 2014 | | | | | DIAMOND-HILL.COM |
Diamond Hill Large Cap Fund
Schedule of Investments (Continued)
December 31, 2014
| | | | | | | | |
| | | Shares | | | Fair
Value | |
|
| Common Stocks — 98.8% continued | |
| Health Care — 16.0% | |
Abbott Laboratories | | | 2,353,027 | | | $ | 105,933,275 | |
Baxter International, Inc. | | | 581,277 | | | | 42,601,791 | |
Boston Scientific Corp.* | | | 5,166,675 | | | | 68,458,444 | |
Express Scripts Holding Co.* | | | 692,850 | | | | 58,663,610 | |
Medtronic, Inc. | | | 1,315,627 | | | | 94,988,269 | |
Pfizer, Inc. | | | 3,420,967 | | | | 106,563,122 | |
Stryker Corp. | | | 435,405 | | | | 41,071,754 | |
| | | | | | | | 518,280,265 | |
|
| Industrials — 9.5% | |
3M Co. | | | 133,427 | | | | 21,924,725 | |
Dover Corp.^ | | | 764,408 | | | | 54,823,342 | |
Illinois Tool Works, Inc. | | | 585,769 | | | | 55,472,324 | |
Parker Hannifin Corp.^ | | | 511,899 | | | | 66,009,376 | |
United Technologies Corp. | | | 971,192 | | | | 111,687,080 | |
| | | | | | | | 309,916,847 | |
|
| Information Technology — 11.4% | |
Apple Computer, Inc. | | | 625,072 | | | | 68,995,447 | |
Cisco Systems, Inc. | | | 2,069,263 | | | | 57,556,551 | |
International Business Machines Corp. | | | 330,150 | | | | 52,969,266 | |
Juniper Networks, Inc.^ | | | 1,466,035 | | | | 32,721,901 | |
Linear Technology Corp.^ | | | 722,445 | | | | 32,943,492 | |
Microsoft Corp. | | | 1,793,265 | | | | 83,297,159 | |
Vantiv, Inc., Class A*^ | | | 1,192,680 | | | | 40,455,706 | |
| | | | | | | | 368,939,522 | |
|
| Materials — 2.0% | |
Eastman Chemical Co. | | | 437,120 | | | | 33,159,923 | |
Praxair, Inc. | | | 253,782 | | | | 32,879,996 | |
| | | | | | | | 66,039,919 | |
| |
| Total Common Stocks | | | $ | 3,206,190,153 | |
| | | | | | | | |
| | | Shares | | | Fair
Value | |
|
| Registered Investment Companies — 3.1% | |
State Street Institutional Liquid Reserves Fund, Premier Class, 0.07%S | | | 84,304,730 | | | $ | 84,304,730 | |
State Street Navigator Securities Lending Prime Portfolio, 0.18%†S | | | 17,810,416 | | | | 17,810,416 | |
| |
| Total Registered Investment Companies | | | $ | 102,115,146 | |
|
| Total Investment Securities — 101.9% | |
(Cost $2,448,515,440)** | | | $ | 3,308,305,299 | |
| |
Net Other Assets
(Liabilities) — (1.9)% | | | | (61,860,803 | ) |
| |
| Net Assets — 100.0% | | | $ | 3,246,444,496 | |
| ^ | All or a portion of the security is on loan. The total fair value of the securities on loan as of December 31, 2014 was $17,078,134. |
| * | Non-income producing security. |
| † | This security, which was purchased using cash collateral received from securities on loan, represents collateral for securities loaned as of December 31, 2014. |
| S | Rate represents the daily yield on December 31, 2014. |
| ** | Represents cost for financial reporting purposes. |
See accompanying Notes to Financial Statements
| | | | | | | | | | | | | | | | |
| DIAMOND HILL FUNDS | | | | | ANNUAL REPORT | | | | | DECEMBER 31, 2014 | | | | | DIAMOND-HILL.COM | | | 39 | |
Diamond Hill Select Fund
Schedule of Investments
December 31, 2014
| | | | | | | | |
| | | Shares | | | Fair Value | |
|
| Common Stocks — 96.2% | |
| Consumer Discretionary — 16.9% | |
Jarden Corp.*^ | | | 47,244 | | | $ | 2,262,043 | |
TJX Cos., Inc., The | | | 18,117 | | | | 1,242,464 | |
Twenty-First Century Fox, Inc. | | | 77,218 | | | | 2,848,572 | |
VF Corp.^ | | | 17,108 | | | | 1,281,389 | |
Whirlpool Corp.^ | | | 14,727 | | | | 2,853,209 | |
| | | | | | | | 10,487,677 | |
|
| Consumer Staples — 4.9% | |
Philip Morris International^ | | | 16,552 | | | | 1,348,160 | |
Post Holdings, Inc.*^ | | | 39,841 | | | | 1,668,940 | |
| | | | | | | | 3,017,100 | |
|
| Energy — 3.8% | |
Cimarex Energy Co. | | | 22,378 | | | | 2,372,068 | |
|
| Financials — 28.8% | |
American International Group, Inc. | | | 30,604 | | | | 1,714,130 | |
Brown & Brown, Inc.^ | | | 44,986 | | | | 1,480,489 | |
Citigroup, Inc.^ | | | 19,968 | | | | 1,080,468 | |
Endurance Specialty Holdings Ltd.^ | | | 33,768 | | | | 2,020,677 | |
Franklin Resources, Inc.^ | | | 30,157 | | | | 1,669,793 | |
iStar Financial, Inc. REIT*^ | | | 108,282 | | | | 1,478,049 | |
MetLife, Inc. | | | 23,182 | | | | 1,253,914 | |
Navigators Group, Inc.*^ | | | 21,093 | | | | 1,546,961 | |
Popular, Inc.* | | | 58,567 | | | | 1,994,207 | |
Willis Group Holdings plc^ | | | 78,893 | | | | 3,535,195 | |
| | | | | | | | 17,773,883 | |
|
| Health Care — 15.5% | |
Alere, Inc.*^ | | | 30,625 | | | | 1,163,750 | |
Boston Scientific Corp.* | | | 194,599 | | | | 2,578,437 | |
Pfizer, Inc. | | | 34,593 | | | | 1,077,572 | |
Teva Pharmaceutical Industries Ltd. SP ADR | | | 32,416 | | | | 1,864,244 | |
Valeant Pharmaceuticals International, Inc.* | | | 20,572 | | | | 2,944,059 | |
| | | | | | | | 9,628,062 | |
|
| Industrials — 10.1% | |
Hub Group, Inc., Class A*^ | | | 70,061 | | | | 2,667,923 | |
Parker Hannifin Corp.^ | | | 9,281 | | | | 1,196,785 | |
United Technologies Corp. | | | 20,858 | | | | 2,398,670 | |
| | | | | | | | 6,263,378 | |
| | | | | | | | |
| | | Shares | | | Fair Value | |
|
| Information Technology — 16.2% | |
Apple Computer, Inc. | | | 15,404 | | | $ | 1,700,294 | |
Cisco Systems, Inc.^ | | | 72,030 | | | | 2,003,514 | |
International Business Machines Corp. | | | 10,807 | | | | 1,733,875 | |
Juniper Networks, Inc.^ | | | 87,711 | | | | 1,957,710 | |
Microsoft Corp. | | | 30,601 | | | | 1,421,416 | |
Vantiv, Inc., Class A*^ | | | 36,718 | | | | 1,245,475 | |
| | | | | | | | 10,062,284 | |
| |
| Total Common Stocks | | | $ | 59,604,452 | |
|
| Registered Investment Companies — 15.3% | |
State Street Institutional Liquid Reserves Fund, Premier Class, 0.07%S | | | 2,347,159 | | | $ | 2,347,159 | |
State Street Navigator Securities Lending Prime Portfolio, 0.18%†S | | | 7,141,045 | | | | 7,141,045 | |
| |
| Total Registered Investment Companies | | | $ | 9,488,204 | |
|
| Total Investment Securities — 111.5% | |
(Cost $57,997,407)** | | | $ | 69,092,656 | |
| |
Net Other Assets
(Liabilities) — (11.5)% | | | | (7,119,687 | ) |
| | |
| Net Assets — 100.0% | | | | | | $ | 61,972,969 | |
| * | Non-income producing security. |
| ^ | All or a portion of the security is on loan. The total fair value of the securities on loan as of December 31, 2014 was $6,913,173. |
| † | This security, which was purchased using cash collateral received from securities on loan, represents collateral for securities loaned as of December 31, 2014. |
| S | Rate represents the daily yield on December 31, 2014. |
| ** | Represents cost for financial reporting purposes. |
ADR – American Depositary Receipt
REIT – Real Estate Investment Trust
See accompanying Notes to Financial Statements
| | | | | | | | | | | | | | |
| 40 | | DIAMOND HILL FUNDS | | | | | ANNUAL REPORT | | | | | DECEMBER 31, 2014 | | | | | DIAMOND-HILL.COM |
Diamond Hill Long-Short Fund
Schedule of Investments
December 31, 2014
| | | | | | | | |
| | | Shares | | | Fair Value | |
|
| Common Stocks — 80.9% | |
| Consumer Discretionary — 15.0% | |
Comcast Corp., Class A | | | 1,082,305 | | | $ | 62,784,513 | |
Gannett Co., Inc.^ | | | 1,749,060 | | | | 55,847,486 | |
Goodyear Tire & Rubber Co., The | | | 2,308,085 | | | | 65,941,988 | |
Jarden Corp.* | | | 1,384,920 | | | | 66,309,970 | |
TJX Cos., Inc., The | | | 861,625 | | | | 59,090,243 | |
Twenty-First Century Fox, Inc. | | | 1,775,665 | | | | 65,504,282 | |
VF Corp. | | | 814,920 | | | | 61,037,508 | |
Walt Disney Co., The | | | 810,326 | | | | 76,324,606 | |
Whirlpool Corp. | | | 435,655 | | | | 84,403,799 | |
| | | | | | | | 597,244,395 | |
|
| Consumer Staples — 5.5% | |
Kimberly-Clark Corp. | | | 659,090 | | | | 76,151,259 | |
Procter & Gamble Co., The | | | 948,055 | | | | 86,358,330 | |
Sysco Corp. | | | 1,400,672 | | | | 55,592,671 | |
| | | | | | | | 218,102,260 | |
|
| Energy — 7.9% | |
Cimarex Energy Co. | | | 854,389 | | | | 90,565,234 | |
Devon Energy Corp. | | | 1,438,133 | | | | 88,028,121 | |
EOG Resources, Inc. | | | 1,015,867 | | | | 93,530,875 | |
Occidental Petroleum Corp. | | | 528,608 | | | | 42,611,091 | |
| | | | | | | | 314,735,321 | |
|
| Financials — 25.5% | |
American International | | | | | | | | |
Group, Inc. | | | 2,033,820 | | | | 113,914,258 | |
Brown & Brown, Inc.^ | | | 1,920,515 | | | | 63,204,149 | |
Capital One Financial Corp. | | | 852,500 | | | | 70,373,875 | |
Citigroup, Inc. | | | 2,245,599 | | | | 121,509,362 | |
Franklin Resources, Inc. | | | 1,525,035 | | | | 84,441,188 | |
JPMorgan Chase & Co. | | | 1,018,505 | | | | 63,738,043 | |
MetLife, Inc. | | | 1,160,580 | | | | 62,775,772 | |
Morgan Stanley | | | 1,278,935 | | | | 49,622,678 | |
PNC Financial Services | | | | | | | | |
Group, Inc. | | | 571,530 | | | | 52,140,682 | |
Popular, Inc.*^ | | | 2,987,477 | | | | 101,723,592 | |
Progressive Corp. | | | 1,405,305 | | | | 37,929,182 | |
Prudential Financial, Inc. | | | 541,468 | | | | 48,981,195 | |
Wells Fargo & Co. | | | 681,060 | | | | 37,335,709 | |
Willis Group Holdings plc | | | 2,308,940 | | | | 103,463,601 | |
| | | | | | | | 1,011,153,286 | |
| | | | | | | | |
| | | Shares | | | Fair Value | |
|
| Health Care — 9.7% | |
Abbott Laboratories | | | 2,235,115 | | | $ | 100,624,877 | |
Alere, Inc.* | | | 1,256,895 | | | | 47,762,010 | |
Baxter International, Inc. | | | 505,971 | | | | 37,082,615 | |
Boston Scientific Corp.* | | | 5,971,738 | | | | 79,125,529 | |
Medtronic, Inc.^ | | | 569,272 | | | | 41,101,438 | |
Pfizer, Inc. | | | 2,611,005 | | | | 81,332,806 | |
| | | | | | | | 387,029,275 | |
|
| Industrials — 7.6% | |
3M Co. | | | 38,178 | | | | 6,273,409 | |
Dover Corp.^ | | | 761,215 | | | | 54,594,340 | |
Illinois Tool Works, Inc. | | | 640,225 | | | | 60,629,308 | |
Parker Hannifin Corp. | | | 632,010 | | | | 81,497,689 | |
United Technologies Corp. | | | 859,335 | | | | 98,823,525 | |
| | | | | | | | 301,818,271 | |
|
| Information Technology — 9.7% | |
Apple Computer, Inc. | | | 636,246 | | | | 70,228,833 | |
Cisco Systems, Inc. | | | 2,440,670 | | | | 67,887,236 | |
International Business | | | | | | | | |
Machines Corp. | | | 388,475 | | | | 62,326,929 | |
Juniper Networks, Inc.^ | | | 2,586,140 | | | | 57,722,645 | |
Microsoft Corp. | | | 1,272,954 | | | | 59,128,713 | |
Vantiv, Inc., Class A*^ | | | 1,996,850 | | | | 67,733,152 | |
| | | | | | | | 385,027,508 | |
| |
| Total Common Stocks | | | $ | 3,215,110,316 | |
|
| Registered Investment Companies — 16.6% | |
State Street Institutional Liquid Reserves Fund, Premier Class,
0.07%S | | | 627,455,362 | | | $ | 627,455,362 | |
State Street Navigator Securities Lending Prime Portfolio,
0.18%†S | | | 30,570,119 | | | | 30,570,119 | |
| |
| Total Registered Investment Companies | | | $ | 658,025,481 | |
|
| Total Investment Securities — 97.5% | |
Cost ($2,970,910,890)** | | | $ | 3,873,135,797 | |
| | | | | | | | | | | | | | | | |
| DIAMOND HILL FUNDS | | | | | ANNUAL REPORT | | | | | DECEMBER 31, 2014 | | | | | DIAMOND-HILL.COM | | | 41 | |
Diamond Hill Long-Short Fund
Schedule of Investments (Continued)
December 31, 2014
Diamond Hill Long-Short Fund
Schedule of Investments Sold Short
December 31, 2014
| | | | | | |
| | | Shares | | Fair Value | |
| |
| Segregated Cash With Custodian*** — 23.0% | | $ | 914,309,046 | |
|
| Securities Sold Short — (19.9)% | |
(Proceeds $597,251,941) | | | (789,836,393 | ) |
| |
Net Other Assets
(Liabilities) — (0.6)% | | | (25,493,349 | ) |
| |
| Net Assets — 100.0% | | $ | 3,972,115,101 | |
| ^ | All or a portion of the security is on loan. The total fair value of the securities on loan as of December 31, 2014 was $29,554,942. |
| * | Non-income producing security. |
| † | This security, which was purchased using cash collateral received from securities on loan, represents collateral for securities loaned as of December 31, 2014. |
| S | Rate represents the daily yield on December 31, 2014. |
| ** | Represents cost for financial reporting purposes. |
| *** | Segregated cash with the custodian represents collateral for securities sold short. |
See accompanying Notes to Financial Statements
| | | | | | | | |
| | | Shares | | | Fair Value | |
|
| Common Stocks — 19.9% | |
| Consumer Discretionary — 7.2% | |
Brunswick Corp. | | | 1,748,085 | | | $ | 89,606,837 | |
Gap, Inc., The | | | 310,570 | | | | 13,078,103 | |
Grand Canyon Education, Inc.* | | | 405,595 | | | | 18,925,063 | |
Life Time Fitness, Inc.* | | | 611,689 | | | | 34,633,832 | |
Macy’s, Inc. | | | 1,075,160 | | | | 70,691,770 | |
New York Times Co., The, Class A | | | 1,214,465 | | | | 16,055,227 | |
Sonic Corp. | | | 424,345 | | | | 11,554,914 | |
Tractor Supply Co. | | | 378,238 | | | | 29,812,719 | |
| | | | | | | | 284,358,465 | |
|
| Consumer Staples — 1.7% | |
Campbell Soup Co. | | | 361,820 | | | | 15,920,080 | |
Colgate-Palmolive Co. | | | 502,860 | | | | 34,792,883 | |
Kellogg Co. | | | 252,630 | | | | 16,532,107 | |
| | | | | | | | 67,245,070 | |
|
| Financials — 3.6% | |
Cincinnati Financial Corp. | | | 660,930 | | | | 34,256,002 | |
First American Financial Corp. | | | 1,175,220 | | | | 39,839,958 | |
Hanover Insurance Group, Inc. | | | 544,860 | | | | 38,859,415 | |
Moody’s Corp. | | | 114,325 | | | | 10,953,478 | |
RenaissanceRe Holdings Ltd. | | | 184,310 | | | | 17,918,618 | |
| | | | | | | | 141,827,471 | |
|
| Health Care — 2.1% | |
Celgene Corp.* | | | 196,195 | | | | 21,946,373 | |
Healthcare Services Group | | | 418,510 | | | | 12,944,514 | |
Hospira, Inc.* | | | 191,575 | | | | 11,733,969 | |
IDEXX Laboratories, Inc.* | | | 104,550 | | | | 15,501,629 | |
Intuitive Surgical, Inc.* | | | 37,680 | | | | 19,930,459 | |
| | | | | | | | 82,056,944 | |
|
| Industrials — 3.1% | |
Boeing Co., The | | | 748,245 | | | | 97,256,886 | |
Kansas City Southern Industries, Inc. | | | 240,095 | | | | 29,298,793 | |
| | | | | | | | 126,555,679 | |
|
| Information Technology — 1.2% | |
Advent Software, Inc. | | | 1,072,830 | | | | 32,871,511 | |
LogMeIn, Inc.* | | | 300,945 | | | | 14,848,626 | |
| | | | | | | | 47,720,137 | |
| | | | | | | | | | | | | | |
| 42 | | DIAMOND HILL FUNDS | | | | | ANNUAL REPORT | | | | | DECEMBER 31, 2014 | | | | | DIAMOND-HILL.COM |
Diamond Hill Long-Short Fund
Schedule of Investments Sold Short (Continued)
December 31, 2014
Diamond Hill Research Opportunities Fund
Schedule of Investments
December 31, 2014
| | | | | | | | |
| | | Shares | | | Fair Value | |
|
| Common Stocks — 19.9% continued | |
| Telecommunication Services — 1.0% | |
AT&T, Inc. | | | 598,235 | | | $ | 20,094,713 | |
Level 3 Communications, Inc.* | | | 404,575 | | | | 19,977,914 | |
| | | | | | | | 40,072,627 | |
|
| Total Securities Sold Short — 19.9% | |
(Proceeds $597,251,941) | | | | | | $ | 789,836,393 | |
| * | Non-dividend expense producing security. |
Percentages disclosed are based on total net assets of the Fund at December 31, 2014.
See accompanying Notes to Financial Statements
| | | | | | | | |
| | | Shares | | | Fair
Value | |
|
| Common Stocks — 94.1% | |
| Consumer Discretionary — 16.4% | |
Comcast Corp., Class A | | | 10,735 | | | $ | 622,737 | |
Dolphin Capital Investors Ltd. (GB)* | | | 718,463 | | | | 310,274 | |
Gannett Co., Inc.^ | | | 12,390 | | | | 395,613 | |
Goodyear Tire & Rubber Co., The^ | | | 28,000 | | | | 799,960 | |
Groupon, Inc.*^ | | | 61,230 | | | | 505,760 | |
Hermes International (FR) | | | 2 | | | | 712 | |
Jarden Corp.* | | | 14,000 | | | | 670,320 | |
Liberty Global plc, Class A* | | | 16,675 | | | | 837,168 | |
LVMH Moet Hennessy Louis Vuitton SA (FR) | | | 2,300 | | | | 364,281 | |
Mattel, Inc.^ | | | 11,400 | | | | 352,773 | |
Steiner Leisure Ltd.* | | | 15,531 | | | | 717,688 | |
TJX Cos., Inc., The | | | 8,056 | | | | 552,480 | |
Twenty-First Century Fox, Inc.^ | | | 68,295 | | | | 2,519,403 | |
Vail Resorts, Inc.^ | | | 9,300 | | | | 847,509 | |
VF Corp.^ | | | 9,200 | | | | 689,080 | |
Whirlpool Corp.^ | | | 13,000 | | | | 2,518,620 | |
| | | | | | | | 12,704,378 | |
|
| Consumer Staples — 6.7% | |
B&G Foods, Inc.^ | | | 50,165 | | | | 1,499,934 | |
Coty, Inc.^ | | | 25,500 | | | | 526,830 | |
Philip Morris International | | | 5,000 | | | | 407,250 | |
Post Holdings, Inc.*^ | | | 45,298 | | | | 1,897,533 | |
Tesco plc ADR | | | 100,130 | | | | 870,630 | |
| | | | | | | | 5,202,177 | |
|
| Energy — 4.2% | |
Cimarex Energy Co.^ | | | 24,146 | | | | 2,559,476 | |
Southwestern Energy Co.*^ | | | 24,085 | | | | 657,280 | |
| | | | | | | | 3,216,756 | |
|
| Financials — 21.6% | |
American International Group, Inc. | | | 18,910 | | | | 1,059,149 | |
Ashmore Group plc (GB)^ | | | 121,505 | | | | 526,128 | |
Brown & Brown, Inc.^ | | | 37,850 | | | | 1,245,644 | |
Endurance Specialty Holdings Ltd.^ | | | 13,930 | | | | 833,572 | |
Fortress Investment Group | | | | | | | | |
LLC, Class A | | | 246,286 | | | | 1,975,213 | |
Franklin Resources, Inc.^ | | | 13,945 | | | | 772,135 | |
iStar Financial, Inc. REIT*^ | | | 110,000 | | | | 1,501,500 | |
MetLife, Inc. | | | 11,505 | | | | 622,305 | |
Nationstar Mortgage Holdings, Inc.*^ | | | 25,000 | | | | 704,750 | |
| | | | | | | | | | | | | | | | |
| DIAMOND HILL FUNDS | | | | | ANNUAL REPORT | | | | | DECEMBER 31, 2014 | | | | | DIAMOND-HILL.COM | | | 43 | |
Diamond Hill Research Opportunities Fund
Schedule of Investments (Continued)
December 31, 2014
| | | | | | | | |
| | | Shares | | | Fair Value | |
|
| Common Stocks — 94.1% continued | |
| Financials — 21.6% continued | |
Navigators Group, Inc.* | | | 22,115 | | | $ | 1,621,914 | |
Popular, Inc.* | | | 62,955 | | | | 2,143,618 | |
Scor SA (FR) | | | 9,985 | | | | 302,513 | |
Willis Group Holdings plc^ | | | 71,090 | | | | 3,185,543 | |
Winthrop Realty Trust REIT^ | | | 13,500 | | | | 210,465 | |
| | | | | | | | 16,704,449 | |
|
| Health Care — 15.6% | |
Actavis plc*^ | | | 2,900 | | | | 746,490 | |
Alere, Inc.*^ | | | 40,127 | | | | 1,524,826 | |
Boston Scientific Corp.*^ | | | 119,999 | | | | 1,589,986 | |
Catamaran Corp.* | | | 21,225 | | | | 1,098,394 | |
Express Scripts Holding Co.*^ | | | 20,200 | | | | 1,710,333 | |
GlaxoSmithKline plc ADR^ | | | 14,902 | | | | 636,911 | |
LifePoint Hospitals, Inc.*^ | | | 11,290 | | | | 811,864 | |
Orthofix International NV*^ | | | 18,032 | | | | 542,042 | |
Stryker Corp.^ | | | 6,530 | | | | 615,975 | |
Teva Pharmaceutical Industries Ltd. SP ADR | | | 8,600 | | | | 494,586 | |
Universal American Financial Corp.* | | | 78,560 | | | | 729,037 | |
Valeant Pharmaceuticals International, Inc.* | | | 11,150 | | | | 1,595,677 | |
| | | | | | | | 12,096,121 | |
|
| Industrials — 11.9% | |
Aircastle Ltd.^ | | | 75,000 | | | | 1,602,750 | |
Hub Group, Inc., Class A*^ | | | 103,845 | | | | 3,954,419 | |
Kennametal, Inc.^ | | | 27,200 | | | | 973,488 | |
Parker Hannifin Corp.^ | | | 10,575 | | | | 1,363,646 | |
United Technologies Corp. | | | 11,400 | | | | 1,311,000 | |
| | | | | | | | 9,205,303 | |
|
| Information Technology — 17.7% | |
Apple Computer, Inc. | | | 4,400 | | | | 485,672 | |
Cisco Systems, Inc.^ | | | 48,789 | | | | 1,357,066 | |
International Business Machines Corp.^ | | | 24,157 | | | | 3,875,749 | |
Juniper Networks, Inc.^ | | | 153,490 | | | | 3,425,896 | |
Linear Technology Corp.^ | | | 19,083 | | | | 870,185 | |
Microsoft Corp. | | | 72,355 | | | | 3,360,890 | |
Rovi Corp.*^ | | | 13,605 | | | | 307,337 | |
| | | | | | | | 13,682,795 | |
| |
| Total Common Stocks | | | $ | 72,811,979 | |
| | | | | | | | |
| | | Shares | | | Fair Value | |
|
| Registered Investment Companies — 31.6% | |
State Street Institutional Liquid Reserves Fund, Premier Class, 0.07%S | | | 2,573,912 | | | $ | 2,573,912 | |
State Street Navigator Securities Lending Prime Portfolio, 0.18%†S | | | 21,897,592 | | | | 21,897,592 | |
| |
| Total Registered Investment Companies | | | $ | 24,471,504 | |
|
| Total Investment Securities — 125.7% | |
Cost ($86,562,719)** | | | $ | 97,283,483 | |
| |
Segregated Cash
With Custodian*** — 15.0% | | | | 11,593,521 | |
| |
| Securities Sold Short — (13.0)% | | | | | |
(Proceeds $8,799,623) | | | | (10,031,515 | ) |
| |
Net Other Assets
(Liabilities) — (27.7)% | | | | (21,459,157 | ) |
| | |
| Net Assets — 100.0% | | | | | | $ | 77,386,332 | |
| * | Non-income producing security. |
| ^ | All or a portion of the security is on loan. The total fair value of the securities on loan as of December 31, 2014 was $21,186,745. |
| † | This security, which was purchased using cash collateral received from securities on loan, represents collateral for securities loaned as of December 31, 2014. |
| S | Rate represents the daily yield on December 31, 2014. |
| ** | Represents cost for financial reporting purposes. |
| *** | Segregated cash with the custodian represents collateral for securities sold short. |
GB – British Security
FR – French Security
REIT – Real Estate Investment Trust
ADR – American Depositary Receipt
See accompanying Notes to Financial Statements
| | | | | | | | | | | | | | |
| 44 | | DIAMOND HILL FUNDS | | | | | ANNUAL REPORT | | | | | DECEMBER 31, 2014 | | | | | DIAMOND-HILL.COM |
Diamond Hill Research Opportunities Fund
Schedule of Investments Sold Short
December 31, 2014
Diamond Hill Financial Long-Short Fund
Schedule of Investments
December 31, 2014
| | | | | | | | |
| | | Shares | | | Fair Value | |
|
| Common Stocks — 13.0% | |
| Consumer Discretionary — 2.4% | |
Brunswick Corp. | | | 900 | | | $ | 46,134 | |
Gap, Inc., The | | | 3,865 | | | | 162,755 | |
Grand Canyon Education, Inc.* | | | 4,238 | | | | 197,745 | |
Life Time Fitness, Inc.* | | | 5,391 | | | | 305,238 | |
Macy’s, Inc. | | | 10,256 | | | | 674,332 | |
Sonic Corp. | | | 15,000 | | | | 408,450 | |
| | | | | | | | 1,794,654 | |
| | |
| Financials — 4.4% | | | | | | | | |
Cincinnati Financial Corp. | | | 9,895 | | | | 512,858 | |
First American Financial Corp. | | | 31,770 | | | | 1,077,003 | |
Hanover Insurance Group, Inc. | | | 18,135 | | | | 1,293,388 | |
RenaissanceRe Holdings Ltd. | | | 5,225 | | | | 507,975 | |
| | | | | | | | 3,391,224 | |
| | |
| Health Care — 1.8% | | | | | | | | |
Celgene Corp.* | | | 3,596 | | | | 402,249 | |
Healthcare Services Group | | | 4,500 | | | | 139,185 | |
Hospira, Inc.* | | | 4,250 | | | | 260,313 | |
IDEXX Laboratories, Inc.* | | | 3,090 | | | | 458,154 | |
Intuitive Surgical, Inc.* | | | 350 | | | | 185,129 | |
| | | | | | | | 1,445,030 | |
| | |
| Industrials — 1.1% | | | | | | | | |
Boeing Co., The | | | 3,900 | | | | 506,922 | |
Kansas City Southern Industries, Inc. | | | 2,600 | | | | 317,278 | |
| | | | | | | | 824,200 | |
|
| Information Technology — 3.3% | |
Advent Software, Inc. | | | 25,004 | | | | 766,123 | |
LogMeIn, Inc.* | | | 36,690 | | | | 1,810,284 | |
| | | | | | | | 2,576,407 | |
|
| Total Securities Sold Short — 13.0% | |
(Proceeds $8,799,623) | | | $ | 10,031,515 | |
| * | Non-dividend expense producing security. |
Percentages disclosed are based on total net assets of the Fund at December 31, 2014.
See accompanying Notes to Financial Statements
| | | | | | | | |
| | | Shares | | | Fair Value | |
|
| Common Stocks — 87.9% | |
| Banks — 35.4% | |
Bank of Marin Bancorp^ | | | 7,395 | | | $ | 388,903 | |
BOK Financial Corp. | | | 8,315 | | | | 499,233 | |
Bridge Bancorp, Inc.^ | | | 6,510 | | | | 174,143 | |
Capital City Bank Group, Inc.^ | | | 14,045 | | | | 218,259 | |
Citigroup, Inc.^ | | | 34,060 | | | | 1,842,987 | |
First Horizon National Corp.^ | | | 47,575 | | | | 646,069 | |
First of Long Island Corp., The^ | | | 20,008 | | | | 567,627 | |
First Republic Bank^ | | | 8,010 | | | | 417,481 | |
JPMorgan Chase & Co. | | | 15,435 | | | | 965,922 | |
National Penn Bancshares, Inc.^ | | | 35,690 | | | | 375,637 | |
PNC Financial Services Group, Inc.^ | | | 7,999 | | | | 729,749 | |
Popular, Inc.* | | | 57,260 | | | | 1,949,700 | |
State Bank Financial Corp.^ | | | 20,905 | | | | 417,682 | |
Sterling Bancorp | | | 17,268 | | | | 248,314 | |
SunTrust Banks, Inc.^ | | | 12,882 | | | | 539,756 | |
Wells Fargo & Co.^ | | | 8,571 | | | | 469,862 | |
| | | | | | | | 10,451,324 | |
|
| Capital Markets — 11.7% | |
Fortress Investment Group LLC, Class A | | | 185,670 | | | | 1,489,073 | |
Franklin Resources, Inc.^ | | | 22,210 | | | | 1,229,768 | |
Morgan Stanley^ | | | 19,035 | | | | 738,558 | |
| | | | | | | | 3,457,399 | |
|
| Financial Services — 4.2% | |
Capital One Financial Corp. | | | 8,920 | | | | 736,345 | |
Nationstar Mortgage Holdings, Inc.*^ | | | 17,340 | | | | 488,815 | |
| | | | | | | | 1,225,160 | |
|
| Insurance — 28.9% | |
American International Group, Inc. | | | 32,240 | | | | 1,805,763 | |
Brown & Brown, Inc.^ | | | 29,615 | | | | 974,630 | |
Endurance Specialty Holdings Ltd.^ | | | 10,085 | | | | 603,486 | |
Enstar Group Ltd.*^ | | | 2,850 | | | | 435,737 | |
HCC Insurance Holdings, Inc. | | | 2,730 | | | | 146,110 | |
Infinity Property & Casualty Corp. | | | 2,205 | | | | 170,358 | |
MetLife, Inc. | | | 17,640 | | | | 954,148 | |
Navigators Group, Inc.* | | | 10,355 | | | | 759,436 | |
Progressive Corp.^ | | | 12,790 | | | | 345,202 | |
Prudential Financial, Inc.^ | | | 7,900 | | | | 714,634 | |
Willis Group Holdings plc^ | | | 36,910 | | | | 1,653,937 | |
| | | | | | | | 8,563,441 | |
| | | | | | | | | | | | | | | | |
| DIAMOND HILL FUNDS | | | | | ANNUAL REPORT | | | | | DECEMBER 31, 2014 | | | | | DIAMOND-HILL.COM | | | 45 | |
Diamond Hill Financial Long-Short Fund
Schedule of Investments (Continued)
December 31, 2014
Diamond Hill Financial Long-Short Fund
Schedule of Investments Sold Short
December 31, 2014
| | | | | | | | |
| | | Shares | | | Fair Value | |
|
| Common Stocks — 87.9% continued | |
| Other — 3.0% | | | | | | | | |
Vantiv, Inc., Class A*^ | | | 26,455 | | | $ | 897,354 | |
|
| REITs & Real Estate Management — 4.7% | |
iStar Financial, Inc. REIT*^ | | | 102,428 | | | | 1,398,142 | |
| |
| Total Common Stocks | | | $ | 25,992,820 | |
|
| Registered Investment Companies — 39.5% | |
State Street Institutional Liquid Reserves Fund, Premier Class, 0.07%S | | | 3,181,993 | | | $ | 3,181,993 | |
State Street Navigator Securities Lending Prime Portfolio, 0.18%†S | | | 8,517,762 | | | | 8,517,762 | |
| |
| Total Registered Investment Companies | | | $ | 11,699,755 | |
|
| Total Investment Securities — 127.4% | |
(Cost $31,947,729)** | | | $ | 37,692,575 | |
| |
| Segregated Cash With Custodian*** — 9.3% | | | | 2,748,169 | |
|
| Securities Sold Short — (8.0)% | |
(Proceeds $2,034,775) | | | | (2,363,411 | ) |
| |
Net Other Assets
(Liabilities) — (28.7)% | | | | (8,490,995 | ) |
| |
| Net Assets — 100.0% | | | $ | 29,586,338 | |
| ^ | All or a portion of the security is on loan. The total fair value of the securities on loan as of December 31, 2014 was $8,234,881. |
| * | Non-income producing security. |
| † | This security, which was purchased using cash collateral received from securities on loan, represents collateral for securities loaned as of December 31, 2014. |
| S | Rate represents the daily yield on December 31, 2014. |
| ** | Represents cost for financial reporting purposes. |
| *** | Segregated cash with the custodian represents collateral for securities sold short. |
REIT – Real Estate Investment Trust
See accompanying Notes to Financial Statements
| | | | | | | | |
| | | Shares | | | Fair Value | |
|
| Common Stocks — 8.0% | |
| Financial Services — 0.8% | |
Moody’s Corp. | | | 2,415 | | | $ | 231,381 | |
|
| Insurance — 7.2% | |
Cincinnati Financial Corp. | | | 10,285 | | | | 533,072 | |
First American Financial Corp. | | | 19,905 | | | | 674,779 | |
Hanover Insurance Group, Inc. | | | 9,155 | | | | 652,935 | |
RenaissanceRe Holdings Ltd. | | | 2,790 | | | | 271,244 | |
| | | | | | | | 2,132,030 | |
|
| Total Securities Sold Short — 8.0% | |
(Proceeds $2,034,775) | | | $ | 2,363,411 | |
Percentages disclosed are based on total net assets of the Fund at December 31, 2014.
See accompanying Notes to Financial Statements
| | | | | | | | | | | | | | |
| 46 | | DIAMOND HILL FUNDS | | | | | ANNUAL REPORT | | | | | DECEMBER 31, 2014 | | | | | DIAMOND-HILL.COM |
Diamond Hill Strategic Income Fund
Schedule of Investments
December 31, 2014
| | | | | | | | |
| | | Shares/ Par Value | | | Fair Value | |
|
| Collateralized Debt Obligations — 0.4% | |
Alesco Preferred Funding Ltd., Class PPNE,
3/23/35#* | | $ | 336,608 | | | $ | 105,641 | |
Alesco Preferred Funding VI, Class PNN,
3/23/35#* | | | 621,631 | | | | 204,672 | |
Fort Sheridan ABS CDO Ltd., Class PPN2,
11/5/41#* | | | 611,948 | | | | 239,455 | |
Taberna Preferred Funding Ltd., Class PPN2, 7/5/35#* | | | 1,175,564 | | | | 386,573 | |
| |
| Total Collateralized Debt Obligations | | | $ | 936,341 | |
|
| Corporate Bonds — 95.3% | |
| Consumer Discretionary — 24.0% | |
Academy Ltd.,
9.25%, 8/1/19^†† | | $ | 1,875,000 | | | | 1,968,750 | |
Avis Budget Car/Finance,
4.88%, 11/15/17^ | | | 5,304,000 | | | | 5,463,120 | |
Bankrate, Inc.,
6.13%, 8/15/18^†† | | | 2,450,000 | | | | 2,278,500 | |
CCM Merger, Inc.,
9.13%, 5/1/19†† | | | 3,608,000 | | | | 3,788,400 | |
Goodyear Tire & Rubber Co., The,
8.25%, 8/15/20^ | | | 2,900,000 | | | | 3,074,000 | |
Goodyear Tire & Rubber Co., The,
8.75%, 8/15/20^ | | | 1,657,000 | | | | 1,917,978 | |
Jarden Corp.,
6.13%, 11/15/22^ | | | 1,614,000 | | | | 1,686,630 | |
Laureate Education, Inc.,
9.25%, 9/1/19^†† | | | 2,000,000 | | | | 2,060,000 | |
Live Nation Entertainment,
7.00%, 9/1/20†† | | | 5,254,000 | | | | 5,542,970 | |
McGraw-Hill Global Education Holdings LLC,
9.75%, 4/1/21 | | | 900,000 | | | | 994,500 | |
MHGE Parent LLC/Finance,
8.50%, 8/1/19^†† | | | 6,000,000 | | | | 5,850,000 | |
Radio One, Inc., 9.25%, 2/15/20^†† | | | 3,000,000 | | | | 2,610,000 | |
Rivers Pittsburgh Borrower LP/Finance,
9.50%, 6/15/19†† | | | 4,239,000 | | | | 4,493,340 | |
| | | | | | | | |
| | | Shares/ Par Value | | | Fair Value | |
|
| Consumer Discretionary — 24.0% continued | |
Summit Materials LLC/Finance,
10.50%, 1/31/20 | | $ | 3,468,000 | | | $ | 3,849,480 | |
Tenneco, Inc.,
6.88%, 12/15/20 | | | 4,186,000 | | | | 4,426,695 | |
Townsquare Radio LLC, Inc.,
9.00%, 4/1/19†† | | | 400,000 | | | | 426,000 | |
Vail Resorts, Inc.,
6.50%, 5/1/19 | | | 2,023,000 | | | | 2,093,805 | |
| | | | | | | | 52,524,168 | |
|
| Consumer Staples — 2.3% | |
Post Holdings, Inc.,
7.38%, 2/15/22^ | | | 5,095,000 | | | | 5,095,000 | |
|
| Energy — 8.8% | |
Carrizo Oil & Gas, Inc.,
7.50%, 9/15/20^ | | | 3,730,000 | | | | 3,580,800 | |
Carrizo Oil & Gas, Inc.,
8.63%, 10/15/18^ | | | 4,150,000 | | | | 4,150,000 | |
Cimarex Energy Co.,
5.88%, 5/1/22^ | | | 2,025,000 | | | | 2,106,000 | |
Diamondback Energy, Inc.,
7.63%, 10/1/21 | | | 4,796,000 | | | | 4,682,095 | |
Laredo Petroleum, Inc.,
9.50%, 2/15/19 | | | 2,310,000 | | | | 2,298,450 | |
McDermott International, Inc.,
8.00%, 5/1/21^†† | | | 3,514,000 | | | | 2,459,800 | |
| | | | | | | | 19,277,145 | |
|
| Financials — 18.7% | |
CNA Financial Corp.,
6.50%, 8/15/16^ | | | 2,165,000 | | | | 2,342,314 | |
First Horizon National Corp.,
5.38%, 12/15/15 | | | 3,000,000 | | | | 3,106,356 | |
First Tennessee Bank NA,
5.05%, 1/15/15 | | | 1,150,000 | | | | 1,151,479 | |
iStar Financial, Inc.,
4.88%, 7/1/18^ | | | 4,725,000 | | | | 4,642,312 | |
iStar Financial, Inc., Series
B, 9.00%, 6/1/17 | | | 3,605,000 | | | | 3,938,463 | |
MGIC Investment Corp.,
5.38%, 11/1/15 | | | 2,105,000 | | | | 2,162,888 | |
Nationstar Mortgage/Capital Corp.,
6.50%, 8/1/18^ | | | 6,540,000 | | | | 6,229,350 | |
Popular, Inc.,
7.00%, 7/1/19^ | | | 6,500,000 | | | | 6,499,999 | |
| | | | | | | | | | | | | | | | |
| DIAMOND HILL FUNDS | | | | | ANNUAL REPORT | | | | | DECEMBER 31, 2014 | | | | | DIAMOND-HILL.COM | | | 47 | |
Diamond Hill Strategic Income Fund
Schedule of Investments (Continued)
December 31, 2014
| | | | | | | | |
| | | Shares/ Par Value | | | Fair Value | |
| | | | | | | | |
|
| Corporate Bonds — 95.3% continued | |
| Financials — 18.7% continued | |
Radian Group, Inc.,
9.00%, 6/15/17 | | $ | 4,840,000 | | | $ | 5,469,200 | |
Synovus Financial Corp.,
7.88%, 2/15/19^ | | | 1,775,000 | | | | 1,974,688 | |
Synovus Financial Corp.,
5.13%, 6/15/17^ | | | 3,350,000 | | | | 3,400,249 | |
| | | | | | | | 40,917,298 | |
|
| Health Care — 10.2% | |
Alere, Inc., 6.50%, 6/15/20 | | | 4,390,000 | | | | 4,411,950 | |
Biomet, Inc.,
6.50%, 10/1/20^ | | | 5,792,000 | | | | 6,110,560 | |
HealthSouth Corp.,
7.75%, 9/15/22^ | | | 2,472,000 | | | | 2,620,320 | |
Kindred Escrow Corp. II,
8.75%, 1/15/23^ | | | 4,800,000 | | | | 5,166,000 | |
Valeant Pharmaceuticals International,
6.38%, 10/15/20†† | | | 4,000,000 | | | | 4,180,000 | |
| | | | | | | | 22,488,830 | |
|
| Industrials — 11.0% | |
American Airlines, Inc., Class B, Series 2013-1,
5.63%, 1/15/21†† | | | 2,826,762 | | | | 2,883,297 | |
BlueLine Rental LLC,
7.00%, 2/1/19†† | | | 3,840,000 | | | | 3,936,000 | |
United Airlines, Inc., Class B, Series 2013-1B,
5.38%, 2/15/23 | | | 4,000,000 | | | | 4,030,000 | |
United Airlines, Inc., Class A, Series 2007-1,
6.64%, 7/2/22 | | | 3,858,869 | | | | 4,167,579 | |
United Rentals North America,
7.38%, 5/15/20^ | | | 6,733,000 | | | | 7,271,640 | |
US Airways Group, Inc., 6.13%, 6/1/18^ | | | 1,920,000 | | | | 2,001,600 | |
| | | | | | | | 24,290,116 | |
|
| Information Technology — 5.4% | |
Activision Blizzard, Inc.,
5.63%, 9/15/21^†† | | | 2,000,000 | | | | 2,100,000 | |
Epicor Software Corp.,
8.63%, 5/1/19^ | | | 2,285,000 | | | | 2,399,250 | |
Lawson Software, Inc.,
9.38%, 4/1/19 | | | 2,665,000 | | | | 2,851,550 | |
Lawson Software, Inc.,
11.50%, 7/15/18^ | | | 2,260,000 | | | | 2,463,400 | |
| | | | | | | | |
| | | Shares/ Par Value | | | Fair Value | |
| | | | | | | | |
|
| Information Technology — 5.4% continued | |
Zayo Group LLC/Capital,
8.13%, 1/1/20^ | | $ | 1,914,000 | | | $ | 2,028,840 | |
| | | | | | | | 11,843,040 | |
|
| Materials — 6.5% | |
Cemex Finance LLC,
9.38%, 10/12/22†† | | | 4,625,000 | | | | 5,156,875 | |
Mobile Mini, Inc.,
7.88%, 12/1/20 | | | 2,105,000 | | | | 2,189,200 | |
Owens-Illinois, Inc.,
7.80%, 5/15/18^ | | | 6,321,000 | | | | 7,047,915 | |
| | | | | | | | 14,393,990 | |
|
| Telecommunication Services — 6.5% | |
Cincinnati Bell, Inc.,
8.38%, 10/15/20 | | | 2,220,000 | | | | 2,331,000 | |
Cogent Communications Finance, Inc.,
5.63%, 4/15/21†† | | | 4,750,000 | | | | 4,655,000 | |
Level 3 Financing, Inc.,
8.13%, 7/1/19 | | | 6,957,000 | | | | 7,391,811 | |
| | | | | | | | 14,377,811 | |
|
| Utilities — 1.9% | |
Source Gas LLC,
5.90%, 4/1/17†† | | | 4,000,000 | | | | 4,288,744 | |
| |
| Total Corporate Bonds | | | $ | 209,496,142 | |
|
| Registered Investment Companies — 17.5% | |
State Street Institutional Liquid Reserves Fund, Premier Class, 0.07%S | | | 5,579,764 | | | $ | 5,579,764 | |
State Street Navigator Securities Lending Prime Portfolio, 0.18%†S | | | 32,929,263 | | | | 32,929,263 | |
| |
| Total Registered Investment Companies | | | $ | 38,509,027 | |
|
| Total Investment Securities 113.2% | |
(Cost $253,245,940)** | | | | | | $ | 248,941,510 | |
| |
| Net Other Assets (Liabilities) — (13.2)% | | | | (29,002,842 | ) |
| |
| Net Assets — 100.0% | | | $ | 219,938,668 | |
| | | | | | | | | | | | | | |
| 48 | | DIAMOND HILL FUNDS | | | | | ANNUAL REPORT | | | | | DECEMBER 31, 2014 | | | | | DIAMOND-HILL.COM |
Diamond Hill Strategic Income Fund
Schedule of Investments (Continued)
December 31, 2014
| * | Non-income producing security. |
| ** | Represents cost for financial reporting purposes. |
| †† | Restricted securities not registered under the Securities Act of 1933 and deemed liquid based on procedures approved by the Board of Trustees are as follows: |
| | | | | | | | | | | | | | | | |
| | | Acquisition Date | | | Current Cost | | | Fair
Value | | | Value
as a % of
Net Assets | |
Academy Ltd. | | | September-14 | | | $ | 2,001,563 | | | $ | 1,968,750 | | | | 0.9% | |
Activision Blizzard, Inc. | | | August-14 | | | | 2,100,000 | | | | 2,100,000 | | | | 1.0% | |
American Airlines, Inc., Class B, Series 2013-1 | | | October-14 | | | | 2,890,364 | | | | 2,883,297 | | | | 1.3% | |
Bankrate, Inc. | | | September-14 | | | | 2,419,438 | | | | 2,278,500 | | | | 1.0% | |
BlueLine Rental LLC | | | July-14 | | | | 4,036,850 | | | | 3,936,000 | | | | 1.8% | |
CCM Merger, Inc. | | | September-14 | | | | 3,827,509 | | | | 3,788,400 | | | | 1.7% | |
Cemex Finance LLC | | | September-14 | | | | 5,199,375 | | | | 5,156,875 | | | | 2.3% | |
Cogent Communications Finance, Inc. | | | April-14 | | | | 4,763,750 | | | | 4,655,000 | | | | 2.1% | |
Laureate Education, Inc. | | | August-14 | | | | 2,065,000 | | | | 2,060,000 | | | | 0.9% | |
Live Nation Entertainment | | | February-14 | | | | 5,760,946 | | | | 5,542,970 | | | | 2.5% | |
McDermott International, Inc. | | | July-14 | | | | 3,541,114 | | | | 2,459,800 | | | | 1.1% | |
MHGE Parent LLC/Finance | | | July-14 | | | | 5,914,999 | | | | 5,850,000 | | | | 2.7% | |
Radio One, Inc. | | | July-14 | | | | 3,257,500 | | | | 2,610,000 | | | | 1.2% | |
Rivers Pittsburgh Borrower LP/Finance | | | November-14 | | | | 4,546,327 | | | | 4,493,340 | | | | 2.1% | |
Source Gas LLC | | | March-10 | | | | 3,840,000 | | | | 4,288,744 | | | | 2.0% | |
Townsquare Radio LLC, Inc. | | | December-14 | | | | 430,500 | | | | 426,000 | | | | 0.2% | |
Valeant Pharmaceuticals International | | | April-14 | | | | 4,340,000 | | | | 4,180,000 | | | | 1.9% | |
| | | | | | | | | | | | | | | | |
| | | | | | $ | 60,935,235 | | | $ | 58,677,676 | | | | 26.7% | |
| | | | | | | | | | | | | | | | |
| # | Restricted and illiquid securities not registered under the Securities Act of 1933 and valued at fair value by the Fair Value Committee based on procedures approved by the Board of Trustees are as follows: |
| | | | | | | | | | | | | | | | |
| | | Acquisition Date | | | Current Cost | | | Fair
Value | | | Value
as a % of
Net Assets | |
Alesco Preferred Funding Ltd., Series 6A, Class PPNE | | | March-05 | | | $ | 336,608 | | | $ | 105,641 | | | | 0.0% | |
Alesco Preferred Funding VI, Class PNN | | | December-04 | | | | 621,631 | | | | 204,672 | | | | 0.1% | |
Fort Sheridan ABS CDO Ltd., Series 2005-1A, Class PPN2 | | | March-05 | | | | 509,448 | | | | 239,455 | | | | 0.1% | |
Taberna Preferred Funding Ltd., Series 2005-1A, Class PPN2 | | | March-05 | | | | 1,035,359 | | | | 386,573 | | | | 0.2% | |
| | | | | | | | | | | | | | | | |
| | | | | | $ | 2,503,046 | | | $ | 936,341 | | | | 0.4% | |
| | | | | | | | | | | | | | | | |
| ^ | All or a portion of the security is on loan. The total fair value of the securities on loan as of December 31, 2014 was $31,605,984. |
| † | This security, which was purchased using cash collateral received from securities on loan, represents collateral for securities loaned as of December 31, 2014. |
| S | Rate represents the daily yield on December 31, 2014. |
See accompanying Notes to Financial Statements
| | | | | | | | | | | | | | | | |
| DIAMOND HILL FUNDS | | | | | ANNUAL REPORT | | | | | DECEMBER 31, 2014 | | | | | DIAMOND-HILL.COM | | | 49 | |
Diamond Hill Funds
Tabular Presentation of Schedules of Investments December 31, 2014
| | | | |
Diamond Hill Small Cap Fund | |
Small Cap Fund
Sector Allocation | | % of
Net Assets | |
Financials | | | 28.6% | |
Industrials | | | 16.2% | |
Consumer Discretionary | | | 9.7% | |
Health Care | | | 6.9% | |
Energy | | | 6.5% | |
Consumer Staples | | | 4.8% | |
Information Technology | | | 4.6% | |
Utilities | | | 3.1% | |
Cash and Cash Equivalents | | | 24.6% | |
Other | | | | |
Net Other Assets (Liabilities) | | | -5.0% | |
| | | | | |
| | | | 100% | |
| | | | | |
Russell 2000 Index Sector Allocation | | % of
Index | |
Financials | | | 24.3% | |
Industrials | | | 14.3% | |
Consumer Discretionary | | | 13.6% | |
Health Care | | | 14.9% | |
Energy | | | 2.8% | |
Consumer Staples | | | 3.3% | |
Information Technology | | | 17.3% | |
Utilities | | | 3.7% | |
Materials | | | 4.8% | |
Telecom | | | 0.9% | |
Other | | | 0.1% | |
| | | | | |
| | | | 100% | |
| | | | | |
| | | | | |
| | | | |
Diamond Hill Small-Mid Cap Fund | |
Small-Mid Cap Fund
Sector Allocation | | % of
Net Assets | |
Financials | | | 28.6% | |
Consumer Discretionary | | | 15.2% | |
Health Care | | | 10.7% | |
Consumer Staples | | | 10.5% | |
Industrials | | | 10.3% | |
Energy | | | 6.6% | |
Information Technology | | | 6.2% | |
Utilities | | | 3.1% | |
Cash and Cash Equivalents | | | 13.6% | |
Other | | | | |
Net Other Assets (Liabilities) | | | -4.8% | |
| | | | | |
| | | | 100% | |
| | | | | |
Russell 2500 Index Sector Allocation | | % of
Index | |
Financials | | | 23.7% | |
Consumer Discretionary | | | 14.9% | |
Health Care | | | 12.6% | |
Consumer Staples | | | 2.9% | |
Industrials | | | 15.6% | |
Energy | | | 3.2% | |
Information Technology | | | 14.7% | |
Utilities | | | 4.9% | |
Materials | | | 6.7% | |
Telecom | | | 0.8% | |
| | | | | |
| | | | 100% | |
| | | | | |
| | | | | |
| | | | | | | | | | | | | | |
| 50 | | DIAMOND HILL FUNDS | | | | | ANNUAL REPORT | | | | | DECEMBER 31, 2014 | | | | | DIAMOND-HILL.COM |
Diamond Hill Funds
Tabular Presentation of Schedules of Investments (Continued) December 31, 2014
| | | | |
Diamond Hill Mid Cap Fund | |
Mid Cap Fund
Sector Allocation | | % of
Net Assets | |
Financials | | | 29.4% | |
Consumer Discretionary | | | 16.0% | |
Consumer Staples | | | 12.1% | |
Health Care | | | 9.6% | |
Industrials | | | 9.3% | |
Energy | | | 7.2% | |
Information Technology | | | 6.2% | |
Utilities | | | 3.0% | |
Materials | | | 0.7% | |
Cash and Cash Equivalents | | | 35.3% | |
Other | | | | |
Net Other Assets (Liabilities) | | | -28.8% | |
| | | | | |
| | | | 100% | |
| | | | | |
Russell Midcap Index
Sector Allocation | | % of
Index | |
Financials | | | 20.7% | |
Consumer Discretionary | | | 17.4% | |
Consumer Staples | | | 5.8% | |
Heath Care | | | 11.6% | |
Industrials | | | 12.7% | |
Energy | | | 3.9% | |
Information Technology | | | 14.3% | |
Utilities | | | 6.6% | |
Materials | | | 5.9% | |
Telecom | | | 1.1% | |
| | | | | |
| | | | 100% | |
| | | | | |
| | | | | |
| | | | |
Diamond Hill Large Cap Fund | |
Large Cap Fund
Sector Allocation | | % of
Net Assets | |
Financials | | | 27.3% | |
Health Care | | | 16.0% | |
Consumer Discretionary | | | 15.2% | |
Information Technology | | | 11.4% | |
Industrials | | | 9.5% | |
Consumer Staples | | | 8.7% | |
Energy | | | 8.7% | |
Materials | | | 2.0% | |
Cash and Cash Equivalents | | | 3.1% | |
Other | | | | |
Net Other Assets (Liabilities) | | | -1.9% | |
| | | | | |
| | | | 100% | |
| | | | | |
Russell 1000 Index Sector Allocation | | % of
Index | |
Financials | | | 17.4% | |
Health Care | | | 13.9% | |
Consumer Discretionary | | | 13.3% | |
Information Technology | | | 18.9% | |
Industrials | | | 11.2% | |
Consumer Staples | | | 8.3% | |
Energy | | | 7.7% | |
Materials | | | 3.6% | |
Utilities | | | 3.4% | |
Telecom | | | 2.3% | |
| | | | | |
| | | | 100% | |
| | | | | |
| | | | | |
| | | | | | | | | | | | | | | | |
| DIAMOND HILL FUNDS | | | | | ANNUAL REPORT | | | | | DECEMBER 31, 2014 | | | | | DIAMOND-HILL.COM | | | 51 | |
Diamond Hill Funds
Tabular Presentation of Schedules of Investments (Continued) December 31, 2014
| | | | |
Diamond Hill Select Fund | |
Select Fund
Sector Allocation | | % of
Net Assets | |
Financials | | | 28.8% | |
Consumer Discretionary | | | 16.9% | |
Information Technology | | | 16.2% | |
Health Care | | | 15.5% | |
Industrials | | | 10.1% | |
Consumer Staples | | | 4.9% | |
Energy | | | 3.8% | |
Cash and Cash Equivalents | | | 15.3% | |
Net Other Assets (Liabilities) | | | -11.5% | |
| | | | | |
| | | | 100% | |
| | | | | |
| | |
Russell 3000 Index
Sector Allocation | | % of
Index | |
Financials | | | 17.9% | |
Consumer Discretionary | | | 13.3% | |
Information Technology | | | 18.9% | |
Health Care | | | 14.0% | |
Industrials | | | 11.4.% | |
Consumer Staples | | | 8.0% | |
Energy | | | 7.3% | |
Materials | | | 3.7% | |
Utilities | | | 3.4% | |
Telecom | | | 2.1% | |
| | | | | |
| | | | 100% | |
| | | | | |
| | | | | |
| | | | |
Diamond Hill Long-Short Fund | |
Long Portfolio
Sector Allocation | | % of
Net Assets | |
Financials | | | 25.5% | |
Consumer Discretionary | | | 15.0% | |
Health Care | | | 9.7% | |
Information Technology | | | 9.7% | |
Energy | | | 7.9% | |
Industrials | | | 7.6% | |
Consumer Staples | | | 5.5% | |
Cash and Cash Equivalents | | | 16.6% | |
| | |
Short Portfolio Sector Allocation | | % of
Net Assets | |
Telecommunication Services | | | -1.0% | |
Information Technology | | | -1.2% | |
Consumer Staples | | | -1.7% | |
Health Care | | | -2.1% | |
Industrials | | | -3.1% | |
Financials | | | -3.6% | |
Consumer Discretionary | | | -7.2% | |
Other | | | | |
Segregated Cash With Brokers | | | 23.0% | |
Net Other Assets (Liabilities) | | | -0.6% | |
| | | | | |
| | | | 100% | |
| | | | | |
Russell 1000 Index
Sector Allocation | | % of
Index | |
Financials | | | 17.4% | |
Consumer Discretionary | | | 13.3% | |
Health Care | | | 13.9% | |
Information Technology | | | 18.9% | |
Energy | | | 7.7% | |
Industrials | | | 11.2% | |
Consumer Staples 8.3% | | | 8.3% | |
Telecom | | | 2.3% | |
Materials | | | 3.6% | |
Utilities | | | 3.4% | |
| | | | | |
| | | | 100% | |
| | | | | |
| | | | | |
| | | | | | | | | | | | | | |
| 52 | | DIAMOND HILL FUNDS | | | | | ANNUAL REPORT | | | | | DECEMBER 31, 2014 | | | | | DIAMOND-HILL.COM |
Diamond Hill Funds
Tabular Presentation of Schedules of Investments (Continued) December 31, 2014
| | | | |
Diamond Hill Research Opportunities Fund | |
Long Portfolio
Sector Allocation | | % of
Net Assets | |
Financials | | | 21.6% | |
Information Technology | | | 17.7% | |
Consumer Discretionary | | | 16.4% | |
Health Care | | | 15.6% | |
Industrials | | | 11.9% | |
Consumer Staples | | | 6.7% | |
Energy | | | 4.2% | |
Cash and Cash Equivalents | | | 31.6% | |
| | |
Short Portfolio
Sector Allocation | | % of
Net Assets | |
Industrials | | | -1.1% | |
Health Care | | | -1.8% | |
Consumer Discretionary | | | -2.4% | |
Information Technology | | | -3.3% | |
Financials | | | -4.4% | |
Other | | | | |
Segregated Cash With Brokers | | | 15.0% | |
Net Other Assets (Liabilities) | | | -27.7% | |
| | | | | |
| | | | 100% | |
| | | | | |
Russell 3000 Index
Sector Allocation | | % of
Index | |
Financials | | | 17.9% | |
Information Technology | | | 18.9% | |
Consumer Discretionary | | | 13.3% | |
Health Care | | | 14.0% | |
Industrials | | | 11.4.% | |
Consumer Staples | | | 8.0% | |
Energy | | | 7.3% | |
Materials | | | 3.7% | |
Utilities | | | 3.4% | |
Telecom | | | 2.1% | |
| | | | | |
| | | | 100% | |
| | | | | |
| | | | | |
| | | | |
Diamond Hill Financial Long-Short Fund | |
Long Portfolio
Sector Allocation | | % of
Net Assets | |
Banks | | | 35.4% | |
Insurance | | | 28.9% | |
Capital Markets | | | 11.7% | |
REITs & Real Estate Management | | | 4.7% | |
Financial Services | | | 4.2% | |
Other | | | 3.0% | |
Cash and Cash Equivalents | | | 39.5% | |
| | | | | |
| | |
Short Portfolio
Sector Allocation | | % of
Net Assets | |
Financial Services | | | -0.8% | |
Insurance | | | -7.2% | |
Other | | | | |
Segregated Cash With Brokers | | | 9.3% | |
Net Other Assets (Liabilities) | | | -28.7% | |
| | | | | |
| | | | 100% | |
| | | | | |
| | |
S&P Composite 1500
Financials Index
Sector Allocation | | % of
Index | |
Banks | | | 34.7% | |
Insurance | | | 16.9% | |
Capital Markets | | | 12.9% | |
REITs & Real Estate Management | | | 18.8% | |
Financial Services | | | 11.7% | |
Consumer Financial Services | | | 5.0% | |
| | | | | |
| | | | 100% | |
| | | | | |
| | | | | |
| | | | |
Diamond Hill Strategic Income Fund | |
Strategic Income Fund
Sector Allocation | | % of
Net Assets | |
Consumer Discretionary | | | 24.0% | |
Financials | | | 18.7% | |
Industrials | | | 11.0% | |
Health Care | | | 10.2% | |
Energy | | | 8.8% | |
Materials | | | 6.5% | |
Telecommunication Services | | | 6.5% | |
Information Technology | | | 5.4% | |
Consumer Staples | | | 2.3% | |
Utilities | | | 1.9% | |
Other | | | 0.4% | |
Cash and Cash Equivalents | | | 17.5% | |
Net Other Assets (Liabilities) | | | -13.2% | |
| | | | | |
| | | | 100% | |
| | | | | |
| | | | | |
| | | | | | | | | | | | | | | | |
| DIAMOND HILL FUNDS | | | | | ANNUAL REPORT | | | | | DECEMBER 31, 2014 | | | | | DIAMOND-HILL.COM | | | 53 | |
Diamond Hill Funds
Statements of Assets & Liabilities
December 31, 2014
| | | | | | | | |
| | | Small Cap Fund | | | Small-Mid Cap Fund | |
Assets | | | | | | | | |
Total investment securities, at cost | | $ | 1,169,081,658 | | | $ | 650,711,127 | |
Investment securities, at fair value — including $67,146,296, $21,935,974, $4,526,893, $17,078,134, $6,913,173, $29,554,942, $21,186,745, $8,234,881 and $31,605,984 of securities loaned | | $ | 1,512,232,239 | | | $ | 724,938,135 | |
Cash | | | — | | | | 29,691 | |
Foreign currency | | | — | | | | — | |
Cash deposits with custodian for securities sold short | | | — | | | | — | |
Receivable for fund shares issued | | | 2,279,801 | | | | 15,906,301 | |
Receivable for dividends and interest | | | 3,259,172 | | | | 941,978 | |
Receivable for investments sold | | | — | | | | 1,638,140 | |
Prepaid expenses and other assets | | | — | | | | — | |
Total Assets | | | 1,517,771,212 | | | | 743,454,245 | |
| | |
Liabilities | | | | | | | | |
Securities sold short, at fair value (proceeds $—, $—, $—, $—, $—, $597,251,941, $8,799,623, $2,034,775 and $—) | | | — | | | | — | |
Payable for securities purchased | | | — | | �� | | 27,760,114 | |
Payable for expenses and fees on securities sold short | | | — | | | | — | |
Payable for fund shares redeemed | | | 6,389,772 | | | | 663,101 | |
Payable for return of collateral received | | | 69,361,116 | | | | 22,736,122 | |
Payable to Investment Adviser | | | 968,355 | | | | 414,557 | |
Payable to Administrator | | | 288,336 | | | | 103,734 | |
Accrued distribution and service fees | | | 164,485 | | | | 42,242 | |
Total Liabilities | | | 77,172,064 | | | | 51,719,870 | |
| | |
Net Assets | | $ | 1,440,599,148 | | | $ | 691,734,375 | |
| | |
Components of Net Assets | | | | | | | | |
Paid-in capital | | $ | 1,098,049,313 | | | $ | 616,481,496 | |
Accumulated net investment income (loss) | | | (3,855,916 | ) | | | (889,291 | ) |
Accumulated net realized gains (losses) from investment transactions | | | 3,255,170 | | | | 1,915,162 | |
Net unrealized appreciation (depreciation) on investments | | | 343,150,581 | | | | 74,227,008 | |
Net Assets | | $ | 1,440,599,148 | | | $ | 691,734,375 | |
| | |
Net Assets | | | | | | | | |
Class A Shares | | $ | 571,941,430 | | | $ | 100,819,635 | |
Class C Shares | | $ | 51,793,871 | | | $ | 25,275,963 | |
Class I Shares | | $ | 659,198,922 | | | $ | 264,823,707 | |
Class Y Shares | | $ | 157,664,925 | | | $ | 300,815,070 | |
| | |
Shares of beneficial interest outstanding (unlimited number of shares authorized, no par value) | | | | | | | | |
Class A Shares | | | 17,536,969 | | | | 5,501,272 | |
Class C Shares | | | 1,772,239 | | | | 1,468,775 | |
Class I Shares | | | 19,948,885 | | | | 14,336,386 | |
Class Y Shares | | | 4,770,640 | | | | 16,271,839 | |
| | |
Net Asset Value, offering (except Class A Shares) and redemption price per share: | | | | | | | | |
Class A Shares | | $ | 32.61 | | | $ | 18.33 | |
Class C Shares(A) | | $ | 29.23 | | | $ | 17.21 | |
Class I Shares | | $ | 33.04 | | | $ | 18.47 | |
Class Y Shares | | $ | 33.05 | | | $ | 18.49 | |
| | |
Maximum Offering Price | | | | | | | | |
Maximum sales charge — Class A Shares | | | 5.00% | | | | 5.00% | |
(100%/(100%-maximum sales charge) of net asset value adjusted to the nearest cent) per share — Class A Shares | | $ | 34.33 | | | $ | 19.29 | |
| (A) | Redemption price per share varies based on the holding period. |
See accompanying Notes to Financial Statements.
| | | | | | | | | | | | | | |
| 54 | | DIAMOND HILL FUNDS | | | | | ANNUAL REPORT | | | | | DECEMBER 31, 2014 | | | | | DIAMOND-HILL.COM |
| | | | | | | | | | | | | | | | | | | | | | | | | | | | |
| | | Mid Cap Fund | | | Large Cap Fund | | | Select Fund | | | Long-Short Fund | | | Research Opportunities Fund | | | Financial Long-Short Fund | | | Strategic Income Fund | |
| | | | | | | | | | | | | | | | | | | | | | | | | | | | |
| | | $ | 20,098,034 | | | $ | 2,448,515,440 | | | $ | 57,997,407 | | | $ | 2,970,910,890 | | | $ | 86,562,719 | | | $ | 31,947,729 | | | $ | 253,245,940 | |
| | | | | | | | | | | | | | | | | | | | | | | | | | | | |
| | $ | 20,994,795 | | | $ | 3,308,305,299 | | | $ | 69,092,656 | | | $ | 3,873,135,797 | | | $ | 97,283,483 | | | $ | 37,692,575 | | | $ | 248,941,510 | |
| | | 873 | | | | — | | | | — | | | | — | | | | — | | | | — | | | | — | |
| | | — | | | | — | | | | — | | | | — | | | | 545 | | | | — | | | | — | |
| | | — | | | | — | | | | — | | | | 914,309,046 | | | | 11,593,521 | | | | 2,748,169 | | | | — | |
| | | — | | | | 2,157,377 | | | | 77,466 | | | | 9,789,404 | | | | 432,417 | | | | 36,726 | | | | 176,523 | |
| | | 26,112 | | | | 4,751,499 | | | | 75,136 | | | | 5,116,692 | | | | 110,790 | | | | 31,321 | | | | 4,068,840 | |
| | | 41,253 | | | | — | | | | — | | | | — | | | | — | | | | — | | | | — | |
| | | | — | | | | — | | | | — | | | | — | | | | 328 | | | | 71 | | | | — | |
| | | | 21,063,033 | | | | 3,315,214,175 | | | | 69,245,258 | | | | 4,802,350,939 | | | | 109,421,084 | | | | 40,508,862 | | | | 253,186,873 | |
| | | | | | | |
| | | | | | | | | | | | | | | | | | | | | | | | | | | | |
| | | | | | | |
| | | — | | | | — | | | | — | | | | 789,836,393 | | | | 10,031,515 | | | | 2,363,411 | | | | — | |
| | | 66,201 | | | | — | | | | — | | | | — | | | | 709 | | | | — | | | | — | |
| | | — | | | | — | | | | — | | | | 930,863 | | | | 12,677 | | | | 4,782 | | | | — | |
| | | 236 | | | | 48,603,143 | | | | 62,842 | | | | 4,805,000 | | | | 11,369 | | | | 1,095 | | | | 150,099 | |
| | | 4,681,977 | | | | 17,812,411 | | | | 7,141,083 | | | | 30,570,119 | | | | 21,897,592 | | | | 8,517,762 | | | | 32,929,385 | |
| | | 8,740 | | | | 1,454,250 | | | | 43,944 | | | | 2,979,038 | | | | 64,532 | | | | 24,804 | | | | 95,242 | |
| | | 1,975 | | | | 616,152 | | | | 14,708 | | | | 825,279 | | | | 13,881 | | | | 6,201 | | | | 46,257 | |
| | | | 454 | | | | 283,723 | | | | 9,712 | | | | 289,146 | | | | 2,477 | | | | 4,469 | | | | 27,222 | |
| | | | 4,759,583 | | | | 68,769,679 | | | | 7,272,289 | | | | 830,235,838 | | | | 32,034,752 | | | | 10,922,524 | | | | 33,248,205 | |
| | | | | | | |
| | | $ | 16,303,450 | | | $ | 3,246,444,496 | | | $ | 61,972,969 | | | $ | 3,972,115,101 | | | $ | 77,386,332 | | | $ | 29,586,338 | | | $ | 219,938,668 | |
| | | | | | | |
| | | | | | | | | | | | | | | | | | | | | | | | | | | | |
| | $ | 15,469,409 | | | $ | 2,349,707,064 | | | $ | 50,213,267 | | | $ | 3,382,751,480 | | | $ | 67,314,324 | | | $ | 33,398,770 | | | $ | 235,065,857 | |
| | | — | | | | — | | | | 341,863 | | | | — | | | | (387,819 | ) | | | (72,197 | ) | | | 651,679 | |
| | | (62,720 | ) | | | 36,947,573 | | | | 322,590 | | | | (120,276,834 | ) | | | 971,578 | | | | (9,156,445 | ) | | | (11,474,438 | ) |
| | | | 896,761 | | | | 859,789,859 | | | | 11,095,249 | | | | 709,640,455 | | | | 9,488,249 | | | | 5,416,210 | | | | (4,304,430 | ) |
| | | $ | 16,303,450 | | | $ | 3,246,444,496 | | | $ | 61,972,969 | | | $ | 3,972,115,101 | | | $ | 77,386,332 | | | $ | 29,586,338 | | | $ | 219,938,668 | |
| | | | | | | | | | | | | | | | | | | | | | | | | | | | |
| | | | | | | |
| | $ | 2,119,874 | | | $ | 1,182,155,100 | | | $ | 12,963,389 | | | $ | 703,571,545 | | | $ | 9,491,881 | | | $ | 12,042,610 | | | $ | 31,281,764 | |
| | $ | 21,584 | | | $ | 83,781,211 | | | $ | 8,264,708 | | | $ | 170,278,148 | | | $ | 668,103 | | | $ | 2,233,394 | | | $ | 24,087,954 | |
| | $ | 2,743,352 | | | $ | 1,606,796,998 | | | $ | 31,999,314 | | | $ | 2,817,670,513 | | | $ | 49,919,575 | | | $ | 15,310,334 | | | $ | 148,737,487 | |
| | $ | 11,418,640 | | | $ | 373,711,187 | | | $ | 8,745,558 | | | $ | 280,594,895 | | | $ | 17,306,773 | | | $ | — | | | $ | 15,831,463 | |
| | | | | | | |
| | | | | | | | | | | | | | | | | | | | | | | | | | | | |
| | | 198,134 | | | | 52,045,494 | | | | 1,000,372 | | | | 29,473,398 | | | | 421,521 | | | | 614,110 | | | | 2,859,120 | |
| | | 2,021 | | | | 3,848,416 | | | | 659,239 | | | | 7,747,630 | | | | 30,373 | | | | 122,313 | | | | 2,205,891 | |
| | | 255,971 | | | | 70,378,892 | | | | 2,470,527 | | | | 116,351,190 | | | | 2,208,244 | | | | 782,151 | | | | 13,629,958 | |
| | | 1,064,264 | | | | 16,364,991 | | | | 674,971 | | | | 11,569,305 | | | | 764,535 | | | | — | | | | 1,451,223 | |
| | | | | | | |
| | | | | | | | | | | | | | | | | | | | | | | | | | | | |
| | $ | 10.70 | | | $ | 22.71 | | | $ | 12.96 | | | $ | 23.87 | | | $ | 22.52 | | | $ | 19.61 | | | $ | 10.94 | |
| | $ | 10.68 | | | $ | 21.77 | | | $ | 12.54 | | | $ | 21.98 | | | $ | 22.00 | | | $ | 18.26 | | | $ | 10.92 | |
| | $ | 10.72 | | | $ | 22.83 | | | $ | 12.95 | | | $ | 24.22 | | | $ | 22.61 | | | $ | 19.57 | | | $ | 10.91 | |
| | $ | 10.73 | | | $ | 22.84 | | | $ | 12.96 | | | $ | 24.25 | | | $ | 22.64 | | | $ | — | | | $ | 10.91 | |
| | | | | | | |
| | | | | | | | | | | | | | | | | | | | | | | | | | | | |
| | | 5.00% | | | | 5.00% | | | | 5.00% | | | | 5.00% | | | | 5.00% | | | | 5.00% | | | | 3.50% | |
| | | | | | | |
| | $ | 11.26 | | | $ | 23.91 | | | $ | 13.64 | | | $ | 25.13 | | | $ | 23.71 | | | $ | 20.64 | | | $ | 11.34 | |
| | | | | | | | | | | | | | | | |
| DIAMOND HILL FUNDS | | | | | ANNUAL REPORT | | | | | DECEMBER 31, 2014 | | | | | DIAMOND-HILL.COM | | | 55 | |
Diamond Hill Funds
Statements of Operations
For the year ended December 31, 2014
| | | | | | | | | | | | | | | | |
| | | Small Cap Fund | | | Small-Mid Cap Fund | | | Mid Cap Fund | | | Large Cap Fund | |
Investment Income | | | | | | | | | | | | | | | | |
Dividends | | $ | 12,669,637 | | | $ | 6,626,085 | | | $ | 198,077 | | | $ | 57,918,698 | |
Securities lending income | | | 649,996 | | | | 351,273 | | | | 8,627 | | | | 86,844 | |
Total Investment Income | | | 13,319,633 | | | | 6,977,358 | | | | 206,704 | | | | 58,005,542 | |
| | | | |
Expenses | | | | | | | | | | | | | | | | |
Investment advisory fees | | | 10,863,859 | | | | 3,628,578 | | | | 81,901 | | | | 15,944,968 | |
Administration fees | | | 3,180,285 | | | | 946,621 | | | | 15,752 | | | | 6,756,700 | |
Distribution fees — Class A | | | 1,455,230 | | | | 217,855 | | | | 2,461 | | | | 2,602,519 | |
Distribution and service fees — Class C | | | 488,594 | | | | 219,919 | | | | 198 | | | | 696,622 | |
Other fees | | | 18,406 | | | | 5,644 | | | | 147 | | | | 38,159 | |
Total Expenses | | | 16,006,374 | | | | 5,018,617 | | | | 100,459 | | | | 26,038,968 | |
| | | | |
Net Investment Income (Loss) | | | (2,686,741 | ) | | | 1,958,741 | | | | 106,245 | | | | 31,966,574 | |
| | | | |
Realized and Unrealized Gains (Losses) on Investments | | | | | | | | | | | | | | | | |
Net realized gains (losses) on security sales | | | 72,678,332 | | | | 21,328,991 | | | | (62,720 | ) | | | 125,582,411 | |
Net change in unrealized appreciation (depreciation) on investments | | | (7,550,813 | ) | | | 10,996,880 | | | | 896,761 | | | | 142,741,561 | |
Net Realized and Unrealized Gains (Losses) on Investments | | | 65,127,519 | | | | 32,325,871 | | | | 834,041 | | | | 268,323,972 | |
| | | | |
Change in Net Assets from Operations | | $ | 62,440,778 | | | $ | 34,284,612 | | | $ | 940,286 | | | $ | 300,290,546 | |
See accompanying Notes to Financial Statements.
| | | | | | | | | | | | | | |
| 56 | | DIAMOND HILL FUNDS | | | | | ANNUAL REPORT | | | | | DECEMBER 31, 2014 | | | | | DIAMOND-HILL.COM |
Diamond Hill Funds
Statements of Operations
For the year ended December 31, 2014
| | | | | | | | | | | | | | | | | | | | |
| | | Select Fund | | | Long-Short Fund | | | Research Opportunities Fund | | | Financial Long-Short Fund | | | Strategic Income Fund | |
Investment Income | | | | | | | | | | | | | | | | | | | | |
Dividends | | $ | 1,115,628 | | | $ | 51,888,602 | | | $ | 1,016,949 | | | $ | 415,839 | | | $ | 6,943 | |
Interest | | | — | | | | — | | | | — | | | | — | | | | 11,925,095 | |
Securities lending income | | | 12,954 | | | | 80,274 | | | | 51,935 | | | | 31,640 | | | | 47,828 | |
Foreign taxes withheld | | | — | | | | — | | | | (24,244 | ) | | | — | | | | — | |
Total Investment Income | | | 1,128,582 | | | | 51,968,876 | | | | 1,044,640 | | | | 447,479 | | | | 11,979,866 | |
| | | | | |
Expenses | | | | | | | | | | | | | | | | | | | | |
Investment advisory fees | | | 500,892 | | | | 31,405,199 | | | | 724,223 | | | | 275,768 | | | | 1,076,954 | |
Administration fees | | | 166,465 | | | | 8,380,597 | | | | 155,831 | | | | 68,942 | | | | 517,134 | |
Distribution fees — Class A | | | 29,216 | | | | 1,928,124 | | | | 21,713 | | | | 31,482 | | | | 99,054 | |
Distribution and service fees — Class C | | | 72,821 | | | | 1,486,966 | | | | 5,652 | | | | 22,957 | | | | 259,547 | |
Other fees | | | 1,059 | | | | 45,195 | | | | 1,320 | | | | 469 | | | | 3,494 | |
Expenses and fees on securities sold short | | | — | | | | 14,907,488 | | | | 171,109 | | | | 65,048 | | | | — | |
Total Expenses | | | 770,453 | | | | 58,153,569 | | | | 1,079,848 | | | | 464,666 | | | | 1,956,183 | |
| | | | | |
Net Investment Income (Loss) | | | 358,129 | | | | (6,184,693 | ) | | | (35,208 | ) | | | (17,187 | ) | | | 10,023,683 | |
| | | | | |
Realized and Unrealized Gains (Losses) on Investments | | | | | | | | | | | | | | | | | | | | |
Net realized gains (losses) on security sales | | | 13,569,740 | | | | 228,188,910 | | | | 5,537,934 | | | | 2,334,465 | | | | 2,971,392 | |
Net realized gains (losses) on closed short positions | | | — | | | | (23,364,376 | ) | | | (208,743 | ) | | | (512,591 | ) | | | — | |
Net realized gains (losses) on foreign currency transactions | | | — | | | | — | | | | (3,118 | ) | | | — | | | | — | |
Net change in unrealized appreciation (depreciation) on investments and foreign currency translations | | | (5,538,997 | ) | | | 42,862,088 | | | | (235,699 | ) | | | 318,785 | | | | (8,718,179 | ) |
Net Realized and Unrealized Gains (Losses) on Investments | | | 8,030,743 | | | | 247,686,622 | | | | 5,090,374 | | | | 2,140,659 | | | | (5,746,787 | ) |
| | | | | |
Change in Net Assets from Operations | | $ | 8,388,872 | | | $ | 241,501,929 | | | $ | 5,055,166 | | | $ | 2,123,472 | | | $ | 4,276,896 | |
See accompanying Notes to Financial Statements.
| | | | | | | | | | | | | | | | |
| DIAMOND HILL FUNDS | | | | | ANNUAL REPORT | | | | | DECEMBER 31, 2014 | | | | | DIAMOND-HILL.COM | | | 57 | |
Diamond Hill Funds
Statements of Changes in Net Assets
| | | | | | | | | | | | | | | | | | |
| | | Small Cap Fund | | | | | Small-Mid Cap Fund | |
| | | For the year
ended
December 31,
2014 | | | For the year
ended
December 31,
2013 | | | | | For the year
ended
December 31,
2014 | | | For the year
ended
December 31,
2013 | |
From Operations | | | | | | | | | | | | | | | | | | |
Net investment income (loss) | | $ | (2,686,741 | ) | | $ | 879,674 | | | | | $ | 1,958,741 | | | $ | 1,062,307 | |
Net realized gains (losses) on security sales | | | 72,678,332 | | | | 95,774,634 | | | | | | 21,328,991 | | | | 20,192,524 | |
Net change in unrealized appreciation (depreciation) on investments | | | (7,550,813 | ) | | | 234,355,040 | | | | | | 10,996,880 | | | | 47,504,291 | |
Change in Net Assets from Operations | | | 62,440,778 | | | | 331,009,348 | | | | | | 34,284,612 | | | | 68,759,122 | |
| | | | | |
Distributions to Shareholders | | | | | | | | | | | | | | | | | | |
From net investment income: | | | | | | | | | | | | | | | | | | |
Class A | | | — | | | | (533,519 | ) | | | | | (97,842 | ) | | | (115,412 | ) |
Class I | | | (1,087,598 | ) | | | (1,791,199 | ) | | | | | (861,350 | ) | | | (478,883 | ) |
Class Y | | | (465,795 | ) | | | (444,562 | ) | | | | | (1,324,401 | ) | | | (441,840 | ) |
From net realized gains on investments | | | | | | | | | | | | | | | | | | |
Class A | | | (26,760,113 | ) | | | (34,347,875 | ) | | | | | (3,421,995 | ) | | | (2,423,480 | ) |
Class C | | | (2,606,415 | ) | | | (3,002,406 | ) | | | | | (894,081 | ) | | | (817,146 | ) |
Class I | | | (29,780,665 | ) | | | (32,082,848 | ) | | | | | (8,318,543 | ) | | | (5,974,114 | ) |
Class Y | | | (7,193,312 | ) | | | (5,666,701 | ) | | | | | (9,418,635 | ) | | | (4,110,398 | ) |
Change in Net Assets from Distributions to Shareholders | | | (67,893,898 | ) | | | (77,869,110 | ) | | | | | (24,336,847 | ) | | | (14,361,273 | ) |
Change in net assets from capital transactions | | | 176,539,958 | | | | 234,171,643 | | | | | | 346,044,639 | | | | 168,113,682 | |
| | | | | |
Total Change in Net Assets | | | 171,086,838 | | | | 487,311,881 | | | | | | 355,992,404 | | | | 222,511,531 | |
| | | | | |
Net Assets: | | | | | | | | | | | | | | | | | | |
Beginning of period | | | 1,269,512,310 | | | | 782,200,429 | | | | | | 335,741,971 | | | | 113,230,440 | |
End of period | | $ | 1,440,599,148 | | | $ | 1,269,512,310 | | | | | $ | 691,734,375 | | | $ | 335,741,971 | |
Accumulated Net Investment Income (Loss) | | $ | (3,855,916 | ) | | $ | (361,185 | ) | | | | $ | (889,291 | ) | | $ | 47,250 | |
See accompanying Notes to Financial Statements.
| | | | | | | | | | | | | | |
| 58 | | DIAMOND HILL FUNDS | | | | | ANNUAL REPORT | | | | | DECEMBER 31, 2014 | | | | | DIAMOND-HILL.COM |
Diamond Hill Funds
Statements of Changes in Net Assets
| | | | | | | | | | | | | | | | | | |
| | | Small Cap Fund | | | | | Small-Mid Cap Fund | |
| | | For the year
Ended
December 31,
2014 | | | For the year
Ended
December 31,
2013 | | | | | For the year
Ended
December 31,
2014 | | | For the year
Ended
December 31,
2013 | |
Capital Transactions: | | | | | | | | | | | | | | | | | | |
Class A | | | | | | | | | | | | | | | | | | |
Proceeds from shares sold | | $ | 163,951,547 | | | $ | 165,177,369 | | | | | $ | 71,580,018 | | | $ | 38,242,590 | |
Reinvested distributions | | | 23,997,393 | | | | 30,242,858 | | | | | | 3,383,422 | | | | 2,421,734 | |
Payments for shares redeemed | | | (186,573,027 | ) | | | (138,668,826 | ) | | | | | (37,038,128 | ) | | | (7,936,194 | ) |
Change in Net Assets from Class A Share Transactions | | | 1,375,913 | | | | 56,751,401 | | | | | | 37,925,312 | | | | 32,728,130 | |
Class C | | | | | | | | | | | | | | | | | | |
Proceeds from shares sold | | | 10,082,105 | | | | 9,707,889 | | | | | | 7,165,730 | | | | 7,652,948 | |
Reinvested distributions | | | 2,388,761 | | | | 2,629,701 | | | | | | 739,233 | | | | 662,650 | |
Payments for shares redeemed | | | (6,363,572 | ) | | | (4,847,800 | ) | | | | | (2,352,304 | ) | | | (1,866,100 | ) |
Change in Net Assets from Class C Share Transactions | | | 6,107,294 | | | | 7,489,790 | | | | | | 5,552,659 | | | | 6,449,498 | |
Class I | | | | | | | | | | | | | | | | | | |
Proceeds from shares sold | | | 263,463,371 | | | | 225,280,544 | | | | | | 136,631,482 | | | | 83,551,819 | |
Reinvested distributions | | | 26,397,666 | | | | 28,099,503 | | | | | | 8,527,522 | | | | 6,179,065 | |
Payments for shares redeemed | | | (177,960,023 | ) | | | (101,483,831 | ) | | | | | (34,258,641 | ) | | | (18,344,466 | ) |
Change in Net Assets from Class I Share Transactions | | | 111,901,014 | | | | 151,896,216 | | | | | | 110,900,363 | | | | 71,386,418 | |
Class Y | | | | | | | | | | | | | | | | | | |
Proceeds from shares sold | | | 82,950,293 | | | | 33,561,017 | | | | | | 219,529,521 | | | | 64,314,644 | |
Reinvested distributions | | | 6,213,790 | | | | 3,773,497 | | | | | | 9,863,029 | | | | 3,290,464 | |
Payments for shares redeemed | | | (32,008,346 | ) | | | (19,300,278 | ) | | | | | (37,726,245 | ) | | | (10,055,472 | ) |
Change in Net Assets from Class Y Share Transactions | | | 57,155,737 | | | | 18,034,236 | | | | | | 191,666,305 | | | | 57,549,636 | |
Change in net assets from capital transactions: | | $ | 176,539,958 | | | $ | 234,171,643 | | | | | $ | 346,044,639 | | | $ | 168,113,682 | |
Share Transactions: | | | | | | | | | | | | | | | | | | |
Class A | | | | | | | | | | | | | | | | | | |
Issued | | | 4,876,928 | | | | 5,415,775 | | | | | | 3,892,262 | | | | 2,330,744 | |
Reinvested | | | 755,348 | | | | 945,435 | | | | | | 188,753 | | | | 140,712 | |
Redeemed | | | (5,553,515 | ) | | | (4,550,379 | ) | | | | | (2,051,184 | ) | | | (493,468 | ) |
Change in shares outstanding | | | 78,761 | | | | 1,810,831 | | | | | | 2,029,831 | | | | 1,977,988 | |
Class C | | | | | | | | | | | | | | | | | | |
Issued | | | 332,880 | | | | 345,369 | | | | | | 419,573 | | | | 488,475 | |
Reinvested | | | 83,875 | | | | 90,648 | | | | | | 43,976 | | | | 40,754 | |
Redeemed | | | (209,462 | ) | | | (175,434 | ) | | | | | (136,691 | ) | | | (118,701 | ) |
Change in shares outstanding | | | 207,293 | | | | 260,583 | | | | | | 326,858 | | | | 410,528 | |
Class I | | | | | | | | | | | | | | | | | | |
Issued | | | 7,744,583 | | | | 7,187,816 | | | | | | 7,414,344 | | | | 5,033,134 | |
Reinvested | | | 817,909 | | | | 866,046 | | | | | | 470,118 | | | | 355,716 | |
Redeemed | | | (5,257,355 | ) | | | (3,248,208 | ) | | | | | (1,883,825 | ) | | | (1,105,337 | ) |
Change in shares outstanding | | | 3,305,137 | | | | 4,805,654 | | | | | | 6,000,637 | | | | 4,283,513 | |
Class Y | | | | | | | | | | | | | | | | | | |
Issued | | | 2,461,689 | | | | 1,042,811 | | | | | | 11,832,417 | | | | 4,004,439 | |
Reinvested | | | 192,089 | | | | 116,151 | | | | | | 542,196 | | | | 189,056 | |
Redeemed | | | (936,054 | ) | | | (623,502 | ) | | | | | (2,036,793 | ) | | | (602,726 | ) |
Change in shares outstanding | | | 1,717,724 | | | | 535,460 | | | | | | 10,337,820 | | | | 3,590,769 | |
Change in shares | | | 5,308,915 | | | | 7,412,528 | | | | | | 18,695,146 | | | | 10,262,798 | |
See accompanying Notes to Financial Statements.
| | | | | | | | | | | | | | | | |
| DIAMOND HILL FUNDS | | | | | ANNUAL REPORT | | | | | DECEMBER 31, 2014 | | | | | DIAMOND-HILL.COM | | | 59 | |
Diamond Hill Funds
Statements of Changes in Net Assets
| | | | | | | | | | | | | | |
| | | Mid Cap Fund | | | | | Large Cap Fund | |
| | | For the year
Ended
December 31,
2014(A) | | | | | For the year
Ended
December 31,
2014 | | | For the year
Ended
December 31,
2013 | |
From Operations | | | | | | | | | | | | | | |
Net investment income (loss) | | $ | 106,245 | | | | | $ | 31,966,574 | | | $ | 23,081,746 | |
Net realized gains (losses) on security sales | | | (62,720) | | | | | | 125,582,411 | | | | 138,434,603 | |
Net change in unrealized appreciation (depreciation) on investments | | | 896,761 | | | | | | 142,741,561 | | | | 483,885,254 | |
Change in Net Assets from Operations | | | 940,286 | | | | | | 300,290,546 | | | | 645,401,603 | |
Distributions to Shareholders | | | | | | | | | | | | | | |
From net investment income: | | | | | | | | | | | | | | |
Class A | | | (11,479) | | | | | | (9,908,459) | | | | (6,747,239) | |
Class C | | | — | | | | | | (256,868) | | | | (139,928) | |
Class I | | | (18,216) | | | | | | (16,863,005) | | | | (12,890,969) | |
Class Y | | | (77,180) | | | | | | (4,953,319) | | | | (3,306,084) | |
From net realized gains on investments | | | | | | | | | | | | | | |
Class A | | | — | | | | | | (32,207,367) | | | | (33,542,957) | |
Class C | | | — | | | | | | (2,991,271) | | | | (2,081,765) | |
Class I | | | — | | | | | | (55,020,203) | | | | (48,662,043) | |
Class Y | | | — | | | | | | (14,152,581) | | | | (11,860,159) | |
Change in Net Assets from Distributions to Shareholders | | | (106,875) | | | | | | (136,353,073) | | | | (119,231,144) | |
Change in net assets from capital transactions | | | 15,470,039 | | | | | | 552,427,211 | | | | 338,093,297 | |
| | | | |
Total Change in Net Assets | | | 16,303,450 | | | | | | 716,364,684 | | | | 864,263,756 | |
| | | | |
Net Assets: | | | | | | | | | | | | | | |
Beginning of period | | | — | | | | | | 2,530,079,812 | | | | 1,665,816,056 | |
End of period | | $ | 16,303,450 | | | | | $ | 3,246,444,496 | | | $ | 2,530,079,812 | |
Accumulated Net Investment Income (Loss) | | $ | — | | | | | $ | — | | | $ | 3,375,180 | |
| (A) | Inception date of the Fund is December 31, 2013. The Fund commenced public offering and investment operations on January 2, 2014. |
See accompanying Notes to Financial Statements.
| | | | | | | | | | | | | | |
| 60 | | DIAMOND HILL FUNDS | | | | | ANNUAL REPORT | | | | | DECEMBER 31, 2014 | | | | | DIAMOND-HILL.COM |
Diamond Hill Funds
Statements of Changes in Net Assets
| | | | | | | | | | | | | | |
| | | Mid Cap Fund | | | | | Large Cap Fund | |
| | | For the year
Ended
December 31,
2014(A) | | | | | For the year
Ended
December 31,
2014 | | | For the year
Ended
December 31,
2013 | |
Capital Transactions: | | | | | | | | | | | | | | |
Class A | | | | | | | | | | | | | | |
Proceeds from shares sold | | $ | 2,230,864 | | | | | $ | 675,618,011 | | | $ | 248,239,786 | |
Reinvested distributions | | | 11,479 | | | | | | 41,200,721 | | | | 38,836,172 | |
Payments for shares redeemed | | | (76,052 | ) | | | | | (476,582,111 | ) | | | (215,590,426 | ) |
Change in Net Assets from Class A Share Transactions | | | 2,166,291 | | | | | | 240,236,621 | | | | 71,485,532 | |
Class C | | | | | | | | | | | | | | |
Proceeds from shares sold | | | 110,000 | | | | | | 32,282,101 | | | | 14,413,166 | |
Reinvested distributions | | | — | | | | | | 3,020,461 | | | | 1,983,502 | |
Payments for shares redeemed | | | — | | | | | | (8,349,968 | ) | | | (6,639,393 | ) |
Change in Net Assets from Class C Share Transactions | | | 110,000 | | | | | | 26,952,594 | | | | 9,757,275 | |
Class I | | | | | | | | | | | | | | |
Proceeds from shares sold | | | 2,839,158 | | | | | | 561,769,061 | | | | 460,966,189 | |
Reinvested distributions | | | 18,216 | | | | | | 65,076,964 | | | | 56,849,085 | |
Payments for shares redeemed | | | (54,192 | ) | | | | | (395,308,230 | ) | | | (265,423,375 | ) |
Change in Net Assets from Class I Share Transactions | | | 2,803,182 | | | | | | 231,537,795 | | | | 252,391,899 | |
Class Y | | | | | | | | | | | | | | |
Proceeds from shares sold | | | 10,386,365 | | | | | | 185,192,312 | | | | 94,306,770 | |
Reinvested distributions | | | 4,703 | | | | | | 18,359,189 | | | | 14,585,063 | |
Payments for shares redeemed | | | (502 | ) | | | | | (149,851,300 | ) | | | (104,433,242 | ) |
Change in Net Assets from Class Y Share Transactions | | | 10,390,566 | | | | | | 53,700,201 | | | | 4,458,591 | |
Change in net assets from capital transactions: | | $ | 15,470,039 | | | | | $ | 552,427,211 | | | $ | 338,093,297 | |
Share Transactions: | | | | | | | | | | | | | | |
Class A | | | | | | | | | | | | | | |
Issued | | | 204,372 | | | | | | 30,236,017 | | | | 12,461,646 | |
Reinvested | | | 1,064 | | | | | | 1,832,879 | | | | 1,856,512 | |
Redeemed | | | (7,302 | ) | | | | | (20,922,183 | ) | | | (10,745,402 | ) |
Change in shares outstanding | | | 198,134 | | | | | | 11,146,713 | | | | 3,572,756 | |
Class C | | | | | | | | | | | | | | |
Issued | | | 2,021 | | | | | | 1,523,376 | | | | 742,624 | |
Reinvested | | | — | | | | | | 141,460 | | | | 99,272 | |
Redeemed | | | — | | | | | | (391,306 | ) | | | (350,984 | ) |
Change in shares outstanding | | | 2,021 | | | | | | 1,273,530 | | | | 490,912 | |
Class I | | | | | | | | | | | | | | |
Issued | | | 259,503 | | | | | | 25,069,556 | | | | 22,942,850 | |
Reinvested | | | 1,685 | | | | | | 2,876,815 | | | | 2,697,837 | |
Redeemed | | | (5,217 | ) | | | | | (17,585,207 | ) | | | (13,258,578 | ) |
Change in shares outstanding | | | 255,971 | | | | | | 10,361,164 | | | | 12,382,109 | |
Class Y | | | | | | | | | | | | | | |
Issued | | | 1,063,879 | | | | | | 8,197,893 | | | | 4,870,973 | |
Reinvested | | | 434 | | | | | | 810,343 | | | | 691,318 | |
Redeemed | | | (49 | ) | | | | | (6,653,800 | ) | | | (5,050,304 | ) |
Change in shares outstanding | | | 1,064,264 | | | | | | 2,354,436 | | | | 511,987 | |
Change in shares | | | 1,520,390 | | | | | | 25,135,843 | | | | 16,957,764 | |
| (A) | Inception date of the Fund is December 31, 2013. The Fund commenced public offering and investment operations on January 2, 2014. |
See accompanying Notes to Financial Statements.
| | | | | | | | | | | | | | | | |
| DIAMOND HILL FUNDS | | | | | ANNUAL REPORT | | | | | DECEMBER 31, 2014 | | | | | DIAMOND-HILL.COM | | | 61 | |
Diamond Hill Funds
Statements of Changes in Net Assets
| | | | | | | | | | | | | | | | | | |
| | | Select Fund | | | | | Long-Short Fund | |
| | | For the year
Ended
December 31,
2014 | | | For the year
Ended
December 31,
2013 | | | | | For the year
Ended
December 31,
2014 | | | For the year
Ended
December 31,
2013 | |
From Operations | | | | | | | | | | | | | | | | | | |
Net investment income (loss) | | $ | 358,129 | | | $ | 349,042 | | | | | $ | (6,184,693 | ) | | $ | (2,747,916) | |
Net realized gains (losses) on security sales | | | 13,569,740 | | | | 12,311,674 | | | | | | 228,188,910 | | | | 203,510,573 | |
Net realized gains (losses) on closed short positions | | | — | | | | — | | | | | | (23,364,376 | ) | | | (42,885,934) | |
Net change in unrealized appreciation (depreciation) on investments | | | (5,538,997 | ) | | | 9,446,142 | | | | | | 42,862,088 | | | | 386,363,411 | |
Change in Net Assets from Operations | | | 8,388,872 | | | | 22,106,858 | | | | | | 241,501,929 | | | | 544,240,134 | |
| | | | | |
Distributions to Shareholders | | | | | | | | | | | | | | | | | | |
From net investment income: | | | | | | | | | | | | | | | | | | |
Class A | | | (54,815 | ) | | | (58,077 | ) | | | | | — | | | | (1,895,312) | |
Class C | | | — | | | | (12,751 | ) | | | | | — | | | | — | |
Class I | | | (165,932 | ) | | | (420,708 | ) | | | | | — | | | | (7,019,064) | |
Class Y | | | (67,401 | ) | | | (67,107 | ) | | | | | — | | | | (713,266) | |
From net realized gains on investments | | | | | | | | | | | | | | | | | | |
Class A | | | (1,293,630 | ) | | | (1,126,599 | ) | | | | | — | | | | — | |
Class C | | | (839,134 | ) | | | (717,235 | ) | | | | | — | | | | — | |
Class I | | | (4,414,099 | ) | | | (5,839,372 | ) | | | | | — | | | | — | |
Class Y | | | (848,338 | ) | | | (823,726 | ) | | | | | — | | | | — | |
Change in Net Assets from Distributions to Shareholders | | | (7,683,349 | ) | | | (9,065,575 | ) | | | | | — | | | | (9,627,642) | |
Change in net assets from capital transactions | | | (6,490,816 | ) | | | (3,982,244 | ) | | | | | 714,224,685 | | | | 206,628,459 | |
| | | | | |
Total Change in Net Assets | | | (5,785,293 | ) | | | 9,059,039 | | | | | | 955,726,614 | | | | 741,240,951 | |
| | | | | |
Net Assets: | | | | | | | | | | | | | | | | | | |
Beginning of period | | | 67,758,262 | | | | 58,699,223 | | | | | | 3,016,388,487 | | | | 2,275,147,536 | |
End of period | | $ | 61,972,969 | | | $ | 67,758,262 | | | | | $ | 3,972,115,101 | | | $ | 3,016,388,487 | |
Accumulated Net Investment Income (Loss) | | $ | 341,863 | | | $ | 271,882 | | | | | $ | — | | | $ | — | |
See accompanying Notes to Financial Statements.
| | | | | | | | | | | | | | |
| 62 | | DIAMOND HILL FUNDS | | | | | ANNUAL REPORT | | | | | DECEMBER 31, 2014 | | | | | DIAMOND-HILL.COM |
Diamond Hill Funds
Statements of Changes in Net Assets
| | | | | | | | | | | | | | | | | | |
| | | Select Fund | | | | | Long-Short Fund | |
| | | For the year
Ended
December 31,
2014 | | | For the year
Ended
December 31,
2013 | | | | | For the year
Ended
December 31,
2014 | | | For the year
Ended
December 31,
2013 | |
Capital Transactions: | | | | | | | | | | | | | | | | | | |
Class A | | | | | | | | | | | |
Proceeds from shares sold | | $ | 6,574,390 | | | $ | 5,520,970 | | | | | $ | 353,604,286 | | | $ | 423,707,255 | |
Reinvested distributions | | | 1,281,926 | | | | 1,053,131 | | | | | | — | | | | 1,400,669 | |
Payments for shares redeemed | | | (3,756,810 | ) | | | (7,262,672 | ) | | | | | (564,143,804 | ) | | | (236,227,305 | ) |
Change in Net Assets from Class A Share Transactions | | | 4,099,506 | | | | (688,571 | ) | | | | | (210,539,518 | ) | | | 188,880,619 | |
Class C | | | | | | | | | | | | | | | | | | |
Proceeds from shares sold | | | 3,272,404 | | | | 1,604,721 | | | | | | 47,160,963 | | | | 21,761,845 | |
Reinvested distributions | | | 608,129 | | | | 511,932 | | | | | | — | | | | — | |
Payments for shares redeemed | | | (1,093,371 | ) | | | (560,024 | ) | | | | | (16,655,534 | ) | | | (17,232,284 | ) |
Change in Net Assets from Class C Share Transactions | | | 2,787,162 | | | | 1,556,629 | | | | | | 30,505,429 | | | | 4,529,561 | |
Class I | | | | | | | | | | | | | | | | | | |
Proceeds from shares sold | | | 15,319,351 | | | | 14,747,954 | | | | | | 1,621,991,232 | | | | 826,268,492 | |
Reinvested distributions | | | 4,428,229 | | | | 6,137,359 | | | | | | — | | | | 3,004,906 | |
Payments for shares redeemed | | | (35,336,851 | ) | | | (25,003,837 | ) | | | | | (822,198,936 | ) | | | (882,010,369 | ) |
Change in Net Assets from Class I Share Transactions | | | (15,589,271 | ) | | | (4,118,524 | ) | | | | | 799,792,296 | | | | (52,736,971 | ) |
Class Y | | | | | | | | | | | | | | | | | | |
Proceeds from shares sold | | | 2,232,687 | | | | 986,885 | | | | | | 187,543,106 | | | | 107,214,613 | |
Reinvested distributions | | | 885,602 | | | | 849,213 | | | | | | — | | | | 536,170 | |
Payments for shares redeemed | | | (906,502 | ) | | | (2,567,876 | ) | | | | | (93,076,628 | ) | | | (41,795,533 | ) |
Change in Net Assets from Class Y Share Transactions | | | 2,211,787 | | | | (731,778 | ) | | | | | 94,466,478 | | | | 65,955,250 | |
Change in net assets from capital transactions: | | $ | (6,490,816 | ) | | $ | (3,982,244 | ) | | | | $ | 714,224,685 | | | $ | 206,628,459 | |
Share Transactions: | | | | | | | | | | | | | | | | | | |
Class A | | | | | | | | | | | | | | | | | | |
Issued | | | 494,796 | | | | 420,223 | | | | | | 15,427,099 | | | | 20,427,417 | |
Reinvested | | | 100,982 | | | | 83,536 | | | | | | — | | | | 63,009 | |
Redeemed | | | (280,407 | ) | | | (563,124 | ) | | | | | (24,506,686 | ) | | | (11,342,338 | ) |
Change in shares outstanding | | | 315,371 | | | | (59,365 | ) | | | | | (9,079,587 | ) | | | 9,148,088 | |
Class C | | | | | | | | | | | | | | | | | | |
Issued | | | 254,945 | | | | 122,894 | | | | | | 2,214,584 | | | | 1,122,301 | |
Reinvested | | | 49,765 | | | | 41,871 | | | | | | — | | | | — | |
Redeemed | | | (82,338 | ) | | | (46,966 | ) | | | | | (782,083 | ) | | | (915,518 | ) |
Change in shares outstanding | | | 222,372 | | | | 117,799 | | | | | | 1,432,501 | | | | 206,783 | |
Class I | | | | | | | | | | | | | | | | | | |
Issued | | | 1,156,717 | | | | 1,232,972 | | | | | | 69,336,502 | | | | 39,656,689 | |
Reinvested | | | 348,626 | | | | 486,641 | | | | | | — | | | | 133,613 | |
Redeemed | | | (2,641,236 | ) | | | (2,127,353 | ) | | | | | (35,523,578 | ) | | | (41,967,509 | ) |
Change in shares outstanding | | | (1,135,893 | ) | | | (407,740 | ) | | | | | 33,812,924 | | | | (2,177,207 | ) |
Class Y | | | | | | | | | | | | | | | | | | |
Issued | | | 168,726 | | | | 82,490 | | | | | | 8,060,507 | | | | 4,902,596 | |
Reinvested | | | 69,549 | | | | 67,243 | | | | | | — | | | | 23,840 | |
Redeemed | | | (66,413 | ) | | | (201,479 | ) | | | | | (3,987,297 | ) | | | (1,975,140 | ) |
Change in shares outstanding | | | 171,862 | | | | (51,746 | ) | | | | | 4,073,210 | | | | 2,951,296 | |
Change in shares | | | (426,288 | ) | | | (401,052 | ) | | | | | 30,239,048 | | | | 10,128,960 | |
See accompanying Notes to Financial Statements.
| | | | | | | | | | | | | | | | |
| DIAMOND HILL FUNDS | | | | | ANNUAL REPORT | | | | | DECEMBER 31, 2014 | | | | | DIAMOND-HILL.COM | | | 63 | |
Diamond Hill Funds
Statements of Changes in Net Assets
| | | | | | | | | | | | | | | | | | |
| | | Research Opportunities Fund | | | | | Financial Long-Short Fund | |
| | | For the year
Ended
December 31,
2014 | | | For the year
Ended
December 31,
2013 | | | | | For the year
Ended
December 31,
2014 | | | For the year
Ended
December 31,
2013 | |
From Operations | | | | | | | | | | | | | | | | | | |
Net investment income (loss) | | $ | (35,208 | ) | | $ | (71,707 | ) | | | | $ | (17,187 | ) | | $ | (67,827 | ) |
Net realized gains (losses) on security sales | | | 5,537,934 | | | | 5,898,271 | | | | | | 2,334,465 | | | | 2,622,718 | |
Net realized gains (losses) on closed short positions | | | (208,743 | ) | | | (247,513 | ) | | | | | (512,591 | ) | | | (124,201 | ) |
Net realized gains (losses) on foreign currency transactions | | | (3,118 | ) | | | (12 | ) | | | | | — | | | | — | |
Net change in unrealized appreciation (depreciation) on investments and foreign currency translations | | | (235,699 | ) | | | 7,153,341 | | | | | | 318,785 | | | | 3,423,470 | |
Change in Net Assets from Operations | | | 5,055,166 | | | | 12,732,380 | | | | | | 2,123,472 | | | | 5,854,160 | |
| | | | | |
Distributions to Shareholders | | | | | | | | | | | | | | | | | | |
From net investment income: | | | | | | | | | | | | | | | | | | |
Class A | | | (4,864 | ) | | | — | | | | | | — | | | | — | |
Class I | | | (136,937 | ) | | | (15,692 | ) | | | | | (42,765 | ) | | | — | |
Class Y | | | (71,226 | ) | | | (19,853 | ) | | | | | — | | | | — | |
From net realized gains on investments | | | | | | | | | | | | | | | | | | |
Class A | | | (689,050 | ) | | | (378,678 | ) | | | | | — | | | | — | |
Class C | | | (48,069 | ) | | | (30,078 | ) | | | | | — | | | | — | |
Class I | | | (3,632,483 | ) | | | (2,519,666 | ) | | | | | — | | | | — | |
Class Y | | | (1,365,593 | ) | | | (952,360 | ) | | | | | — | | | | — | |
Change in Net Assets from Distributions to Shareholders | | | (5,948,222 | ) | | | (3,916,327 | ) | | | | | (42,765 | ) | | | — | |
Change in net assets from capital transactions | | | 12,463,191 | | | | 28,182,596 | | | | | | (4,120,905 | ) | | | 13,159,707 | |
| | | | | |
Total Change in Net Assets | | | 11,570,135 | | | | 36,998,649 | | | | | | (2,040,198 | ) | | | 19,013,867 | |
| | | | | |
Net Assets: | | | | | | | | | | | | | | | | | | |
Beginning of period | | | 65,816,197 | | | | 28,817,548 | | | | | | 31,626,536 | | | | 12,612,669 | |
End of period | | $ | 77,386,332 | | | $ | 65,816,197 | | | | | $ | 29,586,338 | | | $ | 31,626,536 | |
Accumulated Net Investment Income (Loss) | | $ | (387,819 | ) | | $ | (28,842 | ) | | | | $ | (72,197 | ) | | $ | (27,019 | ) |
See accompanying Notes to Financial Statements.
| | | | | | | | | | | | | | |
| 64 | | DIAMOND HILL FUNDS | | | | | ANNUAL REPORT | | | | | DECEMBER 31, 2014 | | | | | DIAMOND-HILL.COM |
Diamond Hill Funds
Statements of Changes in Net Assets
| | | | | | | | | | | | | | | | | | |
| | | Research Opportunities Fund | | | | | Financial Long-Short Fund | |
| | | For the year
Ended
December 31,
2014 | | | For the year
Ended
December 31,
2013 | | | | | For the year
Ended
December 31,
2014 | | | For the year
Ended
December 31,
2013 | |
Capital Transactions: | | | | | | | | | | | | | | | | | | |
Class A | | | | | | | | | | | | | | | | | | |
Proceeds from shares sold | | $ | 3,466,741 | | | $ | 5,961,001 | | | | | $ | 1,773,833 | | | $ | 10,490,996 | |
Reinvested distributions | | | 684,086 | | | | 375,385 | | | | | | — | | | | — | |
Payments for shares redeemed | | | (1,379,684 | ) | | | (1,119,135 | ) | | | | | (8,439,654 | ) | | | (3,967,741 | ) |
Change in Net Assets from Class A Share Transactions | | | 2,771,143 | | | | 5,217,251 | | | | | | (6,665,821 | ) | | | 6,523,255 | |
Class C | | | | | | | | | | | | | | | | | | |
Proceeds from shares sold | | | 161,017 | | | | 304,069 | | | | | | 456,348 | | | | 1,904,919 | |
Reinvested distributions | | | 32,165 | | | | 19,039 | | | | | | — | | | | — | |
Payments for shares redeemed | | | (7,706 | ) | | | (21,266 | ) | | | | | (1,317,301 | ) | | | (180,733 | ) |
Change in Net Assets from Class C Share Transactions | | | 185,476 | | | | 301,842 | | | | | | (860,953 | ) | | | 1,724,186 | |
Class I | | | | | | | | | | | | | | | | | | |
Proceeds from shares sold | | | 14,210,006 | | | | 21,221,626 | | | | | | 7,450,674 | | | | 9,827,355 | |
Reinvested distributions | | | 3,642,863 | | | | 2,425,927 | | | | | | 23,483 | | | | — | |
Payments for shares redeemed | | | (10,449,087 | ) | | | (1,938,550 | ) | | | | | (4,068,288 | ) | | | (4,915,089 | ) |
Change in Net Assets from Class I Share Transactions | | | 7,403,782 | | | | 21,709,003 | | | | | | 3,405,869 | | | | 4,912,266 | |
Class Y | | | | | | | | | | | | | | | | | | |
Proceeds from shares sold | | | 2,058,515 | | | | 971,712 | | | | | | — | | | | — | |
Reinvested distributions | | | 318,230 | | | | 127,533 | | | | | | — | | | | — | |
Payments for shares redeemed | | | (273,955 | ) | | | (144,745 | ) | | | | | — | | | | — | |
Change in Net Assets from Class Y Share Transactions | | | 2,102,790 | | | | 954,500 | | | | | | — | | | | — | |
Change in net assets from capital transactions: | | $ | 12,463,191 | | | $ | 28,182,596 | | | | | $ | (4,120,905 | ) | | $ | 13,159,707 | |
Share Transactions: | | | | | | | | | | | | | | | | | | |
Class A | | | | | | | | | | | | | | | | | | |
Issued | | | 149,736 | | | | 271,231 | | | | | | 97,321 | | | | 629,506 | |
Reinvested | | | 31,061 | | | | 16,924 | | | | | | — | | | | — | |
Redeemed | | | (58,821 | ) | | | (49,664 | ) | | | | | (468,090 | ) | | | (238,627 | ) |
Change in shares outstanding | | | 121,976 | | | | 238,491 | | | | | | (370,769 | ) | | | 390,879 | |
Class C | | | | | | | | | | | | | | | | | | |
Issued | | | 7,249 | | | | 13,931 | | | | | | 26,346 | | | | 120,474 | |
Reinvested | | | 1,496 | | | | 871 | | | | | | — | | | | — | |
Redeemed | | | (341 | ) | | | (950 | ) | | | | | (77,974 | ) | | | (12,077 | ) |
Change in shares outstanding | | | 8,404 | | | | 13,852 | | | | | | (51,628 | ) | | | 108,397 | |
Class I | | | | | | | | | | | | | | | | | | |
Issued | | | 612,297 | | | | 985,371 | | | | | | 406,009 | | | | 598,221 | |
Reinvested | | | 164,311 | | | | 108,978 | | | | | | 1,192 | | | | — | |
Redeemed | | | (447,242 | ) | | | (85,942 | ) | | | | | (222,771 | ) | | | (298,665 | ) |
Change in shares outstanding | | | 329,366 | | | | 1,008,407 | | | | | | 184,430 | | | | 299,556 | |
Class Y | | | | | | | | | | | | | | | | | | |
Issued | | | 87,218 | | | | 45,740 | | | | | | — | | | | — | |
Reinvested | | | 14,310 | | | | 5,716 | | | | | | — | | | | — | |
Redeemed | | | (11,912 | ) | | | (6,810 | ) | | | | | — | | | | — | |
Change in shares outstanding | | | 89,616 | | | | 44,646 | | | | | | — | | | | — | |
Change in shares | | | 549,362 | | | | 1,305,396 | | | | | | (237,967 | ) | | | 798,832 | |
See accompanying Notes to Financial Statements.
| | | | | | | | | | | | | | | | |
| DIAMOND HILL FUNDS | | | | | ANNUAL REPORT | | | | | DECEMBER 31, 2014 | | | | | DIAMOND-HILL.COM | | | 65 | |
Diamond Hill Funds
Statements of Changes in Net Assets
| | | | | | | | |
| | | Strategic Income Fund | |
| | | For the year
Ended
December 31,
2014 | | | For the year
Ended
December 31,
2013 | |
From Operations | | | | | | | | |
Net investment income (loss) | | $ | 10,023,683 | | | $ | 9,044,832 | |
Net realized gains (losses) on security sales | | | 2,971,392 | | | | 2,476,137 | |
Net change in unrealized appreciation (depreciation) on investments | | | (8,718,179 | ) | | | (2,572,800 | ) |
Change in Net Assets from Operations | | | 4,276,896 | | | | 8,948,169 | |
| | |
Distributions to Shareholders | | | | | | | | |
From net investment income: | | | | | | | | |
Class A | | | (1,703,833 | ) | | | (2,028,579 | ) |
Class C | | | (940,177 | ) | | | (1,115,927 | ) |
Class I | | | (6,306,750 | ) | | | (5,535,511 | ) |
Class Y | | | (684,523 | ) | | | (213,357 | ) |
Change in Net Assets from Distributions to Shareholders | | | (9,635,283 | ) | | | (8,893,374 | ) |
Change in net assets from capital transactions | | | 38,433,025 | | | | 8,381,314 | |
| | |
Total Change in Net Assets | | | 33,074,638 | | | | 8,436,109 | |
| | |
Net Assets: | | | | | | | | |
Beginning of period | | | 186,864,030 | | | | 178,427,921 | |
End of period | | $ | 219,938,668 | | | $ | 186,864,030 | |
Accumulated Net Investment Income (Loss) | | $ | 651,679 | | | $ | 263,278 | |
See accompanying Notes to Financial Statements.
| | | | | | | | | | | | | | |
| 66 | | DIAMOND HILL FUNDS | | | | | ANNUAL REPORT | | | | | DECEMBER 31, 2014 | | | | | DIAMOND-HILL.COM |
Diamond Hill Funds
Statements of Changes in Net Assets
| | | | | | | | |
| | | Strategic Income Fund | |
| | | For the year
Ended
December 31,
2014 | | | For the year
Ended
December 31,
2013 | |
Capital Transactions: | | | | | | | | |
Class A | | | | | | | | |
Proceeds from shares sold | | $ | 15,957,484 | | | $ | 12,464,286 | |
Reinvested distributions | | | 1,343,253 | | | | 1,545,137 | |
Payments for shares redeemed | | | (25,111,482 | ) | | | (18,588,448 | ) |
Change in Net Assets from Class A Share Transactions | | | (7,810,745 | ) | | | (4,579,025 | ) |
Class C | | | | | | | | |
Proceeds from shares sold | | | 3,210,666 | | | | 4,441,821 | |
Reinvested distributions | | | 483,336 | | | | 589,609 | |
Payments for shares redeemed | | | (5,155,055 | ) | | | (6,689,744 | ) |
Change in Net Assets from Class C Share Transactions | | | (1,461,053 | ) | | | (1,658,314 | ) |
Class I | | | | | | | | |
Proceeds from shares sold | | | 62,622,412 | | | | 27,028,588 | |
Reinvested distributions | | | 5,276,429 | | | | 4,243,707 | |
Payments for shares redeemed | | | (32,499,589 | ) | | | (18,070,663 | ) |
Change in Net Assets from Class I Share Transactions | | | 35,399,252 | | | | 13,201,632 | |
Class Y | | | | | | | | |
Proceeds from shares sold | | | 12,129,992 | | | | 4,100,685 | |
Reinvested distributions | | | 684,414 | | | | 202,958 | |
Payments for shares redeemed | | | (508,835 | ) | | | (2,886,622 | ) |
Change in Net Assets from Class Y Share Transactions | | | 12,305,571 | | | | 1,417,021 | |
Change in net assets from capital transactions: | | $ | 38,433,025 | | | $ | 8,381,314 | |
Share Transactions: | | | | | | | | |
Class A | | | | | | | | |
Issued | | | 1,423,260 | | | | 1,114,827 | |
Reinvested | | | 120,274 | | | | 138,609 | |
Redeemed | | | (2,242,148 | ) | | | (1,663,010 | ) |
Change in shares outstanding | | | (698,614 | ) | | | (409,574 | ) |
Class C | | | | | | | | |
Issued | | | 288,054 | | | | 397,803 | |
Reinvested | | | 43,407 | | | | 52,965 | |
Redeemed | | | (464,281 | ) | | | (600,972 | ) |
Change in shares outstanding | | | (132,820 | ) | | | (150,204 | ) |
Class I | | | | | | | | |
Issued | | | 5,624,478 | | | | 2,425,873 | |
Reinvested | | | 474,994 | | | | 381,497 | |
Redeemed | | | (2,950,922 | ) | | | (1,619,623 | ) |
Change in shares outstanding | | | 3,148,550 | | | | 1,187,747 | |
Class Y | | | | | | | | |
Issued | | | 1,084,325 | | | | 366,054 | |
Reinvested | | | 61,601 | | | | 18,272 | |
Redeemed | | | (46,568 | ) | | | (257,975 | ) |
Change in shares outstanding | | | 1,099,358 | | | | 126,351 | |
Change in shares | | | 3,416,474 | | | | 754,320 | |
See accompanying Notes to Financial Statements.
| | | | | | | | | | | | | | | | |
| DIAMOND HILL FUNDS | | | | | ANNUAL REPORT | | | | | DECEMBER 31, 2014 | | | | | DIAMOND-HILL.COM | | | 67 | |
Small Cap Fund
Financial Highlights
Selected data for a share outstanding throughout the periods indicated
| | | | | | | | | | | | | | | | |
| Small Cap Fund | | Net asset
value,
beginning
of period | | | Net
investment
income
(loss) | | | Net
realized
and
unrealized
gains
(losses) on
investments | | | Total from
investment
operations | |
| | | | |
Class A | | | | | | | | | | | | | | | | |
For the year ended December 31, 2014 | | | $32.72 | | | | (0.11 | )(C) | | | 1.57 | | | | 1.46 | |
For the year ended December 31, 2013 | | | $24.95 | | | | — | (C)(D) | | | 9.86 | | | | 9.86 | |
For the year ended December 31, 2012 | | | $23.04 | | | | 0.07 | (C) | | | 2.88 | | | | 2.95 | |
For the year ended December 31, 2011 | | | $25.80 | | | | (0.08 | ) | | | (1.80 | ) | | | (1.88 | ) |
For the year ended December 31, 2010 | | | $21.31 | | | | (0.05 | ) | | | 4.95 | | | | 4.90 | |
| | | | |
Class C | | | | | | | | | | | | | | | | |
For the year ended December 31, 2014 | | | $29.70 | | | | (0.33 | )(C) | | | 1.43 | | | | 1.10 | |
For the year ended December 31, 2013 | | | $22.94 | | | | (0.21 | )(C) | | | 9.03 | | | | 8.82 | |
For the year ended December 31, 2012 | | | $21.34 | | | | (0.10 | )(C) | | | 2.65 | | | | 2.55 | |
For the year ended December 31, 2011 | | | $24.14 | | | | (0.25 | ) | | | (1.67 | ) | | | (1.92 | ) |
For the year ended December 31, 2010 | | | $20.12 | | | | (0.16 | ) | | | 4.59 | | | | 4.43 | |
| | | | |
Class I | | | | | | | | | | | | | | | | |
For the year ended December 31, 2014 | | | $33.10 | | | | (0.02 | )(C) | | | 1.59 | | | | 1.57 | |
For the year ended December 31, 2013 | | | $25.21 | | | | 0.07 | (C) | | | 9.98 | | | | 10.05 | |
For the year ended December 31, 2012 | | | $23.27 | | | | 0.14 | (C) | | | 2.90 | | | | 3.04 | |
For the year ended December 31, 2011 | | | $26.01 | | | | (0.01 | ) | | | (1.82 | ) | | | (1.83 | ) |
For the year ended December 31, 2010 | | | $21.41 | | | | — | (D) | | | 5.01 | | | | 5.01 | |
| | | | |
Class Y(E) | | | | | | | | | | | | | | | | |
For the year ended December 31, 2014 | | | $33.09 | | | | 0.03 | (C) | | | 1.60 | | | | 1.63 | |
For the year ended December 31, 2013 | | | $25.20 | | | | 0.12 | (C) | | | 9.97 | | | | 10.09 | |
For the year ended December 31, 2012 | | | $23.27 | | | | 0.20 | (C) | | | 2.88 | | | | 3.08 | |
| (A) | Total returns shown exclude the effect of applicable sales charges. |
| (B) | Portfolio turnover rate is calculated on the basis of the Fund as a whole without distinguishing between classes of shares issued. |
| (C) | Net investment income (loss) per share has been calculated using the average daily shares outstanding during the period. |
See accompanying Notes to Financial Statements.
| | | | | | | | | | | | | | |
| 68 | | DIAMOND HILL FUNDS | | | | | ANNUAL REPORT | | | | | DECEMBER 31, 2014 | | | | | DIAMOND-HILL.COM |
| | | | | | | | | | | | | | | | | | | | | | | | | | | | | | | | | | |
Dividends
from net
investment
income | | | Distributions
from net
realized
gains | | | Total
distributions | | | Net asset
value at
end of
period | | | Total
return(A) | | | Net assets
at end
of period
(000’s) | | | Ratio
of total
expenses
to average
net assets | | | Ratio
of net
investment
income
(loss) to
average
net assets | | | Portfolio
turnover
rate(B) | |
| | | | | | | | |
| | | | | | | | | | | | | | | | | | | | | | | | | | | | | | | | | | |
| | — | | | | (1.57 | ) | | | (1.57 | ) | | | $32.61 | | | | 4.60 | % | | | $571,941 | | | | 1.30 | % | | | (0.34 | )% | | | 16 | % |
| | (0.03) | | | | (2.06 | ) | | | (2.09 | ) | | | $32.72 | | | | 39.70 | % | | | $571,167 | | | | 1.31 | % | | | (0.01 | )% | | | 43 | % |
| | (0.09) | | | | (0.95 | ) | | | (1.04 | ) | | | $24.95 | | | | 12.88 | % | | | $390,371 | | | | 1.31 | % | | | 0.30 | % | | | 13 | % |
| | — | | | | (0.88 | ) | | | (0.88 | ) | | | $23.04 | | | | (7.17 | )% | | | $431,313 | | | | 1.33 | % | | | (0.32 | )% | | | 28 | % |
| | — | | | | (0.41 | ) | | | (0.41 | ) | | | $25.80 | | | | 22.99 | % | | | $501,237 | | | | 1.37 | % | | | (0.24 | )% | | | 35 | % |
| | | | | | | | |
| | | | | | | | | | | | | | | | | | | | | | | | | | | | | | | | | | |
| | — | | | | (1.57 | ) | | | (1.57 | ) | | | $29.23 | | | | 3.86 | % | | | $51,794 | | | | 2.05 | % | | | (1.07 | )% | | | 16 | % |
| | — | | | | (2.06 | ) | | | (2.06 | ) | | | $29.70 | | | | 38.64 | % | | | $46,476 | | | | 2.06 | % | | | (0.76 | )% | | | 43 | % |
| | — | | | | (0.95 | ) | | | (0.95 | ) | | | $22.94 | | | | 12.04 | % | | | $29,917 | | | | 2.06 | % | | | (0.45 | )% | | | 13 | % |
| | — | | | | (0.88 | ) | | | (0.88 | ) | | | $21.34 | | | | (7.83 | )% | | | $31,664 | | | | 2.08 | % | | | (1.07 | )% | | | 28 | % |
| | — | | | | (0.41 | ) | | | (0.41 | ) | | | $24.14 | | | | 22.01 | % | | | $35,093 | | | | 2.12 | % | | | (0.96 | )% | | | 35 | % |
| | | | | | | | |
| | | | | | | | | | | | | | | | | | | | | | | | | | | | | | | | | | |
| | (0.06) | | | | (1.57 | ) | | | (1.63 | ) | | | $33.04 | | | | 4.86 | % | | | $659,199 | | | | 1.05 | % | | | (0.06 | )% | | | 16 | % |
| | (0.10) | | | | (2.06 | ) | | | (2.16 | ) | | | $33.10 | | | | 40.08 | % | | | $550,844 | | | | 1.06 | % | | | 0.22 | % | | | 43 | % |
| | (0.15) | | | | (0.95 | ) | | | (1.10 | ) | | | $25.21 | | | | 13.17 | % | | | $298,473 | | | | 1.06 | % | | | 0.56 | % | | | 13 | % |
| | (0.03) | | | | (0.88 | ) | | | (0.91 | ) | | | $23.27 | | | | (6.91 | )% | | | $314,149 | | | | 1.04 | % | | | (0.03 | )% | | | 28 | % |
| | — | | | | (0.41 | ) | | | (0.41 | ) | | | $26.01 | | | | 23.39 | % | | | $312,295 | | | | 1.00 | % | | | 0.20 | % | | | 35 | % |
| | | | | | | | |
| | | | | | | | | | | | | | | | | | | | | | | | | | | | | | | | | | |
| | (0.10) | | | | (1.57 | ) | | | (1.67 | ) | | | $33.05 | | | | 5.06 | % | | | $157,665 | | | | 0.90 | % | | | 0.10 | % | | | 16 | % |
| | (0.14) | | | | (2.06 | ) | | | (2.20 | ) | | | $33.09 | | | | 40.25 | % | | | $101,026 | | | | 0.91 | % | | | 0.40 | % | | | 43 | % |
| | (0.20) | | | | (0.95 | ) | | | (1.15 | ) | | | $25.20 | | | | 13.34 | % | | | $63,439 | | | | 0.91 | % | | | 0.82 | % | | | 13 | % |
| (D) | Amount is less than $0.005. |
| (E) | Inception date of Class Y is December 30, 2011. Class Y commenced public offering on January 3, 2012. |
See accompanying Notes to Financial Statements.
| | | | | | | | | | | | | | | | |
| DIAMOND HILL FUNDS | | | | | ANNUAL REPORT | | | | | DECEMBER 31, 2014 | | | | | DIAMOND-HILL.COM | | | 69 | |
Small-Mid Cap Fund
Financial Highlights
Selected data for a share outstanding throughout the periods indicated
| | | | | | | | | | | | | | | | |
| Small-Mid Cap Fund | | Net asset
value,
beginning
of period | | | Net
investment
income
(loss) | | | Net
realized
and
unrealized
gains
(losses) on
investments | | | Total from
investment
operations | |
| | | | |
Class A | | | | | | | | | | | | | | | | |
For the year ended December 31, 2014 | | | $17.73 | | | | 0.03 | (C) | | | 1.23 | | | | 1.26 | |
For the year ended December 31, 2013 | | | $13.13 | | | | 0.04 | (C) | | | 5.35 | | | | 5.39 | |
For the year ended December 31, 2012 | | | $11.71 | | | | 0.02 | (C) | | | 1.78 | | | | 1.80 | |
For the year ended December 31, 2011 | | | $12.56 | | | | — | (D) | | | (0.53 | ) | | | (0.53 | ) |
For the year ended December 31, 2010 | | | $10.22 | | | | (0.04 | ) | | | 2.38 | | | | 2.34 | |
| | | | |
Class C | | | | | | | | | | | | | | | | |
For the year ended December 31, 2014 | | | $16.80 | | | | (0.10 | )(C) | | | 1.15 | | | | 1.05 | |
For the year ended December 31, 2013 | | | $12.54 | | | | (0.07 | )(C) | | | 5.09 | | | | 5.02 | |
For the year ended December 31, 2012 | | | $11.28 | | | | (0.07 | )(C) | | | 1.71 | | | | 1.64 | |
For the year ended December 31, 2011 | | | $12.21 | | | | (0.06 | ) | | | (0.55 | ) | | | (0.61 | ) |
For the year ended December 31, 2010 | | | $10.00 | | | | (0.05 | ) | | | 2.26 | | | | 2.21 | |
| | | | |
Class I | | | | | | | | | | | | | | | | |
For the year ended December 31, 2014 | | | $17.87 | | | | 0.08 | (C) | | | 1.22 | | | | 1.30 | |
For the year ended December 31, 2013 | | | $13.21 | | | | 0.09 | (C) | | | 5.38 | | | | 5.47 | |
For the year ended December 31, 2012 | | | $11.78 | | | | 0.05 | (C) | | | 1.80 | | | | 1.85 | |
For the year ended December 31, 2011 | | | $12.61 | | | | 0.04 | | | | (0.54 | ) | | | (0.50 | ) |
For the year ended December 31, 2010 | | | $10.23 | | | | 0.02 | | | | 2.37 | | | | 2.39 | |
| | | | |
Class Y(F) | | | | | | | | | | | | | | | | |
For the year ended December 31, 2014 | | | $17.87 | | | | 0.11 | (C) | | | 1.23 | | | | 1.34 | |
For the year ended December 31, 2013 | | | $13.20 | | | | 0.12 | (C) | | | 5.38 | | | | 5.50 | |
For the year ended December 31, 2012 | | | $11.78 | | | | 0.09 | (C) | | | 1.77 | | | | 1.86 | |
| (A) | Total returns shown exclude the effect of applicable sales charges. |
| (B) | Portfolio turnover rate is calculated on the basis of the Fund as a whole without distinguishing between classes of shares issued. |
| (C) | Net investment income (loss) per share has been calculated using the average daily shares outstanding during the period. |
See accompanying Notes to Financial Statements.
| | | | | | | | | | | | | | |
| 70 | | DIAMOND HILL FUNDS | | | | | ANNUAL REPORT | | | | | DECEMBER 31, 2014 | | | | | DIAMOND-HILL.COM |
| | | | | | | | | | | | | | | | | | | | | | | | | | | | | | | | | | |
Dividends
from net
investment
income | | | Distributions
from net
realized
gains | | | Total
distributions | | | Net asset
value at
end of
period | | | Total
return(A) | | | Net assets
at end
of period
(000’s) | | | Ratio
of total
expenses
to average
net assets | | | Ratio
of net
investment
income
(loss) to
average
net assets | | | Portfolio
turnover
rate(B) | |
| | | | | | | | |
| | | | | | | | | | | | | | | | | | | | | | | | | | | | | | | | | | |
| | (0.02) | | | | (0.64 | ) | | | (0.66 | ) | | | $18.33 | | | | 7.17 | % | | | $100,820 | | | | 1.25 | % | | | 0.18 | % | | | 27 | % |
| | (0.03) | | | | (0.76 | ) | | | (0.79 | ) | | | $17.73 | | | | 41.25 | % | | | $61,563 | | | | 1.26 | % | | | 0.27 | % | | | 35 | % |
| | — | (D) | | | (0.38 | ) | | | (0.38 | ) | | | $13.13 | | | | 15.43 | % | | | $19,607 | | | | 1.26 | % | | | 0.15 | % | | | 26 | % |
| | — | | | | (0.32 | ) | | | (0.32 | ) | | | $11.71 | | | | (4.19 | )% | | | $17,461 | | | | 1.28 | % | | | — | %(E) | | | 48 | % |
| | — | | | | — | (D) | | | — | (D) | | | $12.56 | | | | 23.03 | % | | | $17,216 | | | | 1.32 | % | | | (0.17 | )% | | | 35 | % |
| | | | | | | | |
| | | | | | | | | | | | | | | | | | | | | | | | | | | | | | | | | | |
| | — | | | | (0.64 | ) | | | (0.64 | ) | | | $17.21 | | | | 6.33 | % | | | $25,276 | | | | 2.00 | % | | | (0.59 | )% | | | 27 | % |
| | — | | | | (0.76 | ) | | | (0.76 | ) | | | $16.80 | | | | 40.21 | % | | | $19,184 | | | | 2.01 | % | | | (0.45 | )% | | | 35 | % |
| | — | | | | (0.38 | ) | | | (0.38 | ) | | | $12.54 | | | | 14.57 | % | | | $9,169 | | | | 2.01 | % | | | (0.59 | )% | | | 26 | % |
| | — | | | | (0.32 | ) | | | (0.32 | ) | | | $11.28 | | | | (4.89 | )% | | | $8,110 | | | | 2.02 | % | | | (0.74 | )% | | | 48 | % |
| | — | | | | — | (D) | | | — | (D) | | | $12.21 | | | | 22.14 | % | | | $7,417 | | | | 2.07 | % | | | (0.90 | )% | | | 35 | % |
| | | | | | | | |
| | | | | | | | | | | | | | | | | | | | | | | | | | | | | | | | | | |
| | (0.06) | | | | (0.64 | ) | | | (0.70 | ) | | | $18.47 | | | | 7.36 | % | | | $264,824 | | | | 1.00 | % | | | 0.42 | % | | | 27 | % |
| | (0.05) | | | | (0.76 | ) | | | (0.81 | ) | | | $17.87 | | | | 41.64 | % | | | $148,927 | | | | 1.01 | % | | | 0.54 | % | | | 35 | % |
| | (0.04) | | | | (0.38 | ) | | | (0.42 | ) | | | $13.21 | | | | 15.74 | % | | | $53,514 | | | | 1.01 | % | | | 0.42 | % | | | 26 | % |
| | (0.01) | | | | (0.32 | ) | | | (0.33 | ) | | | $11.78 | | | | (3.86 | )% | | | $43,485 | | | | 0.99 | % | | | 0.29 | % | | | 48 | % |
| | (0.01) | | | | — | (D) | | | (0.01 | ) | | | $12.61 | | | | 23.43 | % | | | $44,711 | | | | 0.95 | % | | | 0.22 | % | | | 35 | % |
| | | | | | | | |
| | | | | | | | | | | | | | | | | | | | | | | | | | | | | | | | | | |
| | (0.08) | | | | (0.64 | ) | | | (0.72 | ) | | | $18.49 | | | | 7.60 | % | | | $300,815 | | | | 0.85 | % | | | 0.62 | % | | | 27 | % |
| | (0.07) | | | | (0.76 | ) | | | (0.83 | ) | | | $17.87 | | | | 41.88 | % | | | $106,068 | | | | 0.86 | % | | | 0.73 | % | | | 35 | % |
| | (0.06) | | | | (0.38 | ) | | | (0.44 | ) | | | $13.20 | | | | 15.84 | % | | | $30,940 | | | | 0.86 | % | | | 0.68 | % | | | 26 | % |
| (D) | Amount is less than $0.005. |
| (E) | Amount is less than 0.005%. |
| (F) | Inception date of Class Y is December 30, 2011. Class Y commenced public offering on January 3, 2012. |
See accompanying Notes to Financial Statements.
| | | | | | | | | | | | | | | | |
| DIAMOND HILL FUNDS | | | | | ANNUAL REPORT | | | | | DECEMBER 31, 2014 | | | | | DIAMOND-HILL.COM | | | 71 | |
Mid Cap Fund
Financial Highlights
Selected data for a share outstanding throughout the periods indicated
| | | | | | | | | | | | | | | | |
| Mid Cap Fund(C) | | Net asset
value,
beginning
of period | | | Net
investment
income
(loss) | | | Net
realized
and
unrealized
gains
(losses) on
investments | | | Total from
investment
operations | |
| | | | |
Class A | | | | | | | | | | | | | | | | |
For the year ended December 31, 2014 | | | $10.00 | | | | 0.06 | (D) | | | 0.70 | | | | 0.76 | |
| | | | |
Class C | | | | | | | | | | | | | | | | |
For the year ended December 31, 2014 | | | $10.00 | | | | (0.03 | )(D) | | | 0.71 | | | | 0.68 | |
| | | | |
Class I | | | | | | | | | | | | | | | | |
For the year ended December 31, 2014 | | | $10.00 | | | | 0.09 | (D) | | | 0.70 | | | | 0.79 | |
| | | | |
Class Y | | | | | | | | | | | | | | | | |
For the year ended December 31, 2014 | | | $10.00 | | | | 0.09 | (D) | | | 0.71 | | | | 0.80 | |
| (A) | Total returns shown exclude the effect of applicable sales charges. |
| (B) | Portfolio turnover rate is calculated on the basis of the Fund as a whole without distinguishing between classes of shares issued. |
See accompanying Notes to Financial Statements.
| | | | | | | | | | | | | | |
| 72 | | DIAMOND HILL FUNDS | | | | | ANNUAL REPORT | | | | | DECEMBER 31, 2014 | | | | | DIAMOND-HILL.COM |
| | | | | | | | | | | | | | | | | | | | | | | | | | | | | | | | | | |
Dividends
from net
investment
income | | | Distributions
from net
realized
gains | | | Total
distributions | | | Net asset
value at
end of
period | | | Total
return(A) | | | Net assets
at end
of period
(000’s) | | | Ratio
of total
expenses
to average
net assets | | | Ratio
of net
investment
income
(loss) to
average
net assets | | | Portfolio
turnover
rate(B) | |
| | | | | | | | |
| | | | | | | | | | | | | | | | | | | | | | | | | | | | | | | | | | |
| | (0.06) | | | | — | | | | (0.06 | ) | | | $10.70 | | | | 7.57 | % | | | $2,120 | | | | 1.15 | % | | | 0.59 | % | | | 28 | % |
| | | | | | | | |
| | | | | | | | | | | | | | | | | | | | | | | | | | | | | | | | | | |
| | — | | | | — | | | | — | | | | $10.68 | | | | 6.80 | % | | | $22 | | | | 1.90 | % | | | (0.25 | )% | | | 28 | % |
| | | | | | | | |
| | | | | | | | | | | | | | | | | | | | | | | | | | | | | | | | | | |
| | (0.07) | | | | — | | | | (0.07 | ) | | | $10.72 | | | | 7.91 | % | | | $2,743 | | | | 0.90 | % | | | 0.87 | % | | | 28 | % |
| | | | | | | | |
| | | | | | | | | | | | | | | | | | | | | | | | | | | | | | | | | | |
| | (0.07) | | | | — | | | | (0.07 | ) | | | $10.73 | | | | 8.02 | % | | | $11,419 | | | | 0.75 | % | | | 0.87 | % | | | 28 | % |
| (C) | Inception date of the Fund is December 31, 2013. The Fund commenced public offering and investment operations on January 2, 2014. |
| (D) | Net investment income (loss) per share has been calculated using the average daily shares outstanding during the period. |
See accompanying Notes to Financial Statements.
| | | | | | | | | | | | | | | | |
| DIAMOND HILL FUNDS | | | | | ANNUAL REPORT | | | | | DECEMBER 31, 2014 | | | | | DIAMOND-HILL.COM | | | 73 | |
Large Cap Fund
Financial Highlights
Selected data for a share outstanding throughout the periods indicated
| | | | | | | | | | | | | | | | |
| Large Cap Fund | | Net asset
value,
beginning
of period | | | Net
investment
income
(loss) | | | Net
realized
and
unrealized
gains
(losses) on
investments | | | Total from
investment
operations | |
| | | | |
Class A | | | | | | | | | | | | | | | | |
For the year ended December 31, 2014 | | | $21.49 | | | | 0.21 | (C) | | | 2.01 | | | | 2.22 | |
For the year ended December 31, 2013 | | | $16.54 | | | | 0.18 | (C) | | | 5.79 | | | | 5.97 | |
For the year ended December 31, 2012 | | | $14.96 | | | | 0.22 | (C) | | | 1.62 | | | | 1.84 | |
For the year ended December 31, 2011 | | | $14.78 | | | | 0.18 | (C) | | | 0.17 | | | | 0.35 | |
For the year ended December 31, 2010 | | | $13.62 | | | | 0.10 | | | | 1.17 | | | | 1.27 | |
| | | | |
Class C | | | | | | | | | | | | | | | | |
For the year ended December 31, 2014 | | | $20.68 | | | | 0.04 | (C) | | | 1.93 | | | | 1.97 | |
For the year ended December 31, 2013 | | | $15.98 | | | | 0.03 | (C) | | | 5.58 | | | | 5.61 | |
For the year ended December 31, 2012 | | | $14.46 | | | | 0.10 | (C) | | | 1.56 | | | | 1.66 | |
For the year ended December 31, 2011 | | | $14.29 | | | | 0.06 | | | | 0.16 | | | | 0.22 | |
For the year ended December 31, 2010 | | | $13.18 | | | | 0.02 | | | | 1.09 | | | | 1.11 | |
| | | | |
Class I | | | | | | | | | | | | | | | | |
For the year ended December 31, 2014 | | | $21.58 | | | | 0.27 | (C) | | | 2.03 | | | | 2.30 | |
For the year ended December 31, 2013 | | | $16.61 | | | | 0.24 | (C) | | | 5.80 | | | | 6.04 | |
For the year ended December 31, 2012 | | | $15.01 | | | | 0.26 | (C) | | | 1.63 | | | | 1.89 | |
For the year ended December 31, 2011 | | | $14.82 | | | | 0.22 | | | | 0.17 | | | | 0.39 | |
For the year ended December 31, 2010 | | | $13.65 | | | | 0.13 | | | | 1.20 | | | | 1.33 | |
| | | | |
Class Y(E) | | | | | | | | | | | | | | | | |
For the year ended December 31, 2014 | | | $21.59 | | | | 0.31 | (C) | | | 2.02 | | | | 2.33 | |
For the year ended December 31, 2013 | | | $16.60 | | | | 0.26 | (C) | | | 5.83 | | | | 6.09 | |
For the year ended December 31, 2012 | | | $15.01 | | | | 0.30 | (C) | | | 1.62 | | | | 1.92 | |
| (A) | Total returns shown exclude the effect of applicable sales charges. |
| (B) | Portfolio turnover rate is calculated on the basis of the Fund as a whole without distinguishing between classes of shares issued. |
| (C) | Net investment income (loss) per share has been calculated using the average daily shares outstanding during the period. |
See accompanying Notes to Financial Statements.
| | | | | | | | | | | | | | |
| 74 | | DIAMOND HILL FUNDS | | | | | ANNUAL REPORT | | | | | DECEMBER 31, 2014 | | | | | DIAMOND-HILL.COM |
| | | | | | | | | | | | | | | | | | | | | | | | | | | | | | | | | | |
Dividends
from net
investment
income | | | Distributions
from net
realized
gains | | | Total
distributions | | | Net asset
value at
end of
period | | | Total
return(A) | | | Net assets
at end
of period
(000’s) | | | Ratio
of total
expenses
to average
net assets | | | Ratio
of net
investment
income
(loss) to
average
net assets | | | Portfolio
turnover
rate(B) | |
| | | | | | | | |
| | | | | | | | | | | | | | | | | | | | | | | | | | | | | | | | | | |
| | (0.19 | ) | | | (0.81 | ) | | | (1.00 | ) | | | $22.71 | | | | 10.42 | % | | | $1,182,155 | | | | 1.05 | % | | | 0.94 | % | | | 24 | % |
| | (0.16 | ) | | | (0.86 | ) | | | (1.02 | ) | | | $21.49 | | | | 36.33 | % | | | $878,903 | | | | 1.06 | % | | | 0.92 | % | | | 21 | % |
| | (0.21 | ) | | | (0.05 | ) | | | (0.26 | ) | | | $16.54 | | | | 12.29 | % | | | $617,407 | | | | 1.06 | % | | | 1.37 | % | | | 28 | % |
| | (0.17 | ) | | | — | | | | (0.17 | ) | | | $14.96 | | | | 2.35 | % | | | $593,124 | | | | 1.12 | % | | | 1.19 | % | | | 16 | % |
| | (0.11 | ) | | | — | | | | (0.11 | ) | | | $14.78 | | | | 9.29 | % | | | $459,659 | | | | 1.18 | % | | | 0.90 | % | | | 16 | % |
| | | | | | | | |
| | | | | | | | | | | | | | | | | | | | | | | | | | | | | | | | | | |
| | (0.07 | ) | | | (0.81 | ) | | | (0.88 | ) | | | $21.77 | | | | 9.60 | % | | | $83,781 | | | | 1.80 | % | | | 0.19 | % | | | 24 | % |
| | (0.05 | ) | | | (0.86 | ) | | | (0.91 | ) | | | $20.68 | | | | 35.33 | % | | | $53,241 | | | | 1.81 | % | | | 0.18 | % | | | 21 | % |
| | (0.09 | ) | | | (0.05 | ) | | | (0.14 | ) | | | $15.98 | | | | 11.49 | % | | | $33,305 | | | | 1.81 | % | | | 0.62 | % | | | 28 | % |
| | (0.05 | ) | | | — | | | | (0.05 | ) | | | $14.46 | | | | 1.55 | % | | | $30,465 | | | | 1.87 | % | | | 0.45 | % | | | 16 | % |
| | — | (D) | | | — | | | | — | (D) | | | $14.29 | | | | 8.45 | % | | | $29,274 | | | | 1.93 | % | | | 0.15 | % | | | 16 | % |
| | | | | | | | |
| | | | | | | | | | | | | | | | | | | | | | | | | | | | | | | | | | |
| | (0.24 | ) | | | (0.81 | ) | | | (1.05 | ) | | | $22.83 | | | | 10.74 | % | | | $1,606,797 | | | | 0.80 | % | | | 1.20 | % | | | 24 | % |
| | (0.21 | ) | | | (0.86 | ) | | | (1.07 | ) | | | $21.58 | | | | 36.60 | % | | | $1,295,477 | | | | 0.81 | % | | | 1.18 | % | | | 21 | % |
| | (0.24 | ) | | | (0.05 | ) | | | (0.29 | ) | | | $16.61 | | | | 12.62 | % | | | $791,031 | | | | 0.81 | % | | | 1.62 | % | | | 28 | % |
| | (0.20 | ) | | | — | | | | (0.20 | ) | | | $15.01 | | | | 2.60 | % | | | $684,156 | | | | 0.83 | % | | | 1.49 | % | | | 16 | % |
| | (0.16 | ) | | | — | | | | (0.16 | ) | | | $14.82 | | | | 9.72 | % | | | $623,147 | | | | 0.81 | % | | | 1.29 | % | | | 16 | % |
| | | | | | | | |
| | | | | | | | | | | | | | | | | | | | | | | | | | | | | | | | | | |
| | (0.27 | ) | | | (0.81 | ) | | | (1.08 | ) | | | $22.84 | | | | 10.89 | % | | | $373,711 | | | | 0.65 | % | | | 1.36 | % | | | 24 | % |
| | (0.24 | ) | | | (0.86 | ) | | | (1.10 | ) | | | $21.59 | | | | 36.87 | % | | | $302,458 | | | | 0.66 | % | | | 1.32 | % | | | 21 | % |
| | (0.28 | ) | | | (0.05 | ) | | | (0.33 | ) | | | $16.60 | | | | 12.79 | % | | | $224,073 | | | | 0.66 | % | | | 1.87 | % | | | 28 | % |
| (D) | Amount is less than $0.005. |
| (E) | Inception date of Class Y is December 30, 2011. Class Y commenced public offering on January 3, 2012. |
See accompanying Notes to Financial Statements.
| | | | | | | | | | | | | | | | |
| DIAMOND HILL FUNDS | | | | | ANNUAL REPORT | | | | | DECEMBER 31, 2014 | | | | | DIAMOND-HILL.COM | | | 75 | |
Select Fund
Financial Highlights
Selected data for a share outstanding throughout the periods indicated
| | | | | | | | | | | | | | | | |
| Select Fund | | Net asset
value,
beginning
of period | | | Net
investment
income
(loss) | | | Net
realized
and
unrealized
gains
(losses) on
investments | | | Total from
investment
operations | |
| | | | |
Class A | | | | | | | | | | | | | | | | |
For the year ended December 31, 2014 | | | $13.00 | | | | 0.05 | (C) | | | 1.38 | | | | 1.43 | |
For the year ended December 31, 2013 | | | $10.45 | | | | 0.05 | (C) | | | 4.48 | | | | 4.53 | |
For the year ended December 31, 2012 | | | $9.69 | | | | 0.12 | (C) | | | 0.97 | | | | 1.09 | |
For the year ended December 31, 2011 | | | $9.99 | | | | 0.08 | | | | (0.33 | ) | | | (0.25 | ) |
For the year ended December 31, 2010 | | | $9.02 | | | | 0.07 | | | | 0.91 | | | | 0.98 | |
| | | | |
Class C | | | | | | | | | | | | | | | | |
For the year ended December 31, 2014 | | | $12.67 | | | | (0.05 | )(C) | | | 1.34 | | | | 1.29 | |
For the year ended December 31, 2013 | | | $10.25 | | | | (0.04 | )(C) | | | 4.38 | | | | 4.34 | |
For the year ended December 31, 2012 | | | $9.51 | | | | 0.04 | (C) | | | 0.95 | | | | 0.99 | |
For the year ended December 31, 2011 | | | $9.83 | | | | 0.02 | | | | (0.34 | ) | | | (0.32 | ) |
For the year ended December 31, 2010 | | | $8.94 | | | | (0.01 | ) | | | 0.90 | | | | 0.89 | |
| | | | |
Class I | | | | | | | | | | | | | | | | |
For the year ended December 31, 2014 | | | $12.97 | | | | 0.09 | (C) | | | 1.38 | | | | 1.47 | |
For the year ended December 31, 2013 | | | $10.43 | | | | 0.09 | (C) | | | 4.46 | | | | 4.55 | |
For the year ended December 31, 2012 | | | $9.68 | | | | 0.15 | (C) | | | 0.96 | | | | 1.11 | |
For the year ended December 31, 2011 | | | $9.98 | | | | 0.11 | | | | (0.33 | ) | | | (0.22 | ) |
For the year ended December 31, 2010 | | | $9.02 | | | | 0.07 | | | | 0.94 | | | | 1.01 | |
| | | | |
Class Y(D) | | | | | | | | | | | | | | | | |
For the year ended December 31, 2014 | | | $12.99 | | | | 0.10 | (C) | | | 1.39 | | | | 1.49 | |
For the year ended December 31, 2013 | | | $10.43 | | | | 0.11 | (C) | | | 4.48 | | | | 4.59 | |
For the year ended December 31, 2012 | | | $9.68 | | | | 0.17 | (C) | | | 0.96 | | | | 1.13 | |
| (A) | Total returns shown exclude the effect of applicable sales charges. |
| (B) | Portfolio turnover rate is calculated on the basis of the Fund as a whole without distinguishing between classes of shares issued. |
See accompanying Notes to Financial Statements.
| | | | | | | | | | | | | | |
| 76 | | DIAMOND HILL FUNDS | | | | | ANNUAL REPORT | | | | | DECEMBER 31, 2014 | | | | | DIAMOND-HILL.COM |
| | | | | | | | | | | | | | | | | | | | | | | | | | | | | | | | | | |
Dividends
from net
investment
income | | | Distributions
from net
realized
gains | | | Total
distributions | | | Net asset
value at
end of
period | | | Total
return(A) | | | Net assets
at end of
period
(000’s) | | | Ratio
of total
expenses
to average
net assets | | | Ratio
of net
investment
income
(loss) to
average
net assets | | | Portfolio
turnover
rate(B) | |
| | | | | | | | |
| | | | | | | | | | | | | | | | | | | | | | | | | | | | | | | | | | |
| | (0.05) | | | | (1.42 | ) | | | (1.47 | ) | | | $12.96 | | | | 11.30 | % | | | $12,963 | | | | 1.20 | % | | | 0.36 | % | | | 53 | % |
| | (0.09) | | | | (1.89 | ) | | | (1.98 | ) | | | $13.00 | | | | 44.04 | % | | | $8,905 | | | | 1.22 | % | | | 0.42 | % | | | 70 | % |
| | (0.08) | | | | (0.25 | ) | | | (0.33 | ) | | | $10.45 | | | | 11.27 | % | | | $7,778 | | | | 1.21 | % | | | 1.15 | % | | | 38 | % |
| | (0.05) | | | | — | | | | (0.05 | ) | | | $9.69 | | | | (2.53 | )% | | | $8,071 | | | | 1.23 | % | | | 0.92 | % | | | 26 | % |
| | (0.01) | | | | — | | | | (0.01 | ) | | | $9.99 | | | | 10.83 | % | | | $7,437 | | | | 1.28 | % | | | 0.67 | % | | | 18 | % |
| | | | | | | | |
| | | | | | | | | | | | | | | | | | | | | | | | | | | | | | | | | | |
| | — | | | | (1.42 | ) | | | (1.42 | ) | | | $12.54 | | | | 10.46 | % | | | $8,265 | | | | 1.95 | % | | | (0.39 | )% | | | 53 | % |
| | (0.03) | | | | (1.89 | ) | | | (1.92 | ) | | | $12.67 | | | | 43.08 | % | | | $5,533 | | | | 1.97 | % | | | (0.35 | )% | | | 70 | % |
| | — | | | | (0.25 | ) | | | (0.25 | ) | | | $10.25 | | | | 10.44 | % | | | $3,271 | | | | 1.96 | % | | | 0.41 | % | | | 38 | % |
| | — | | | | — | | | | — | | | | $9.51 | | | | (3.26 | )% | | | $3,630 | | | | 1.98 | % | | | 0.15 | % | | | 26 | % |
| | — | | | | — | | | | — | | | | $9.83 | | | | 9.96 | % | | | $4,254 | | | | 2.03 | % | | | (0.08 | )% | | | 18 | % |
| | | | | | | | |
| | | | | | | | | | | | | | | | | | | | | | | | | | | | | | | | | | |
| | (0.07) | | | | (1.42 | ) | | | (1.49 | ) | | | $12.95 | | | | 11.57 | % | | | $31,999 | | | | 0.95 | % | | | 0.64 | % | | | 53 | % |
| | (0.12) | | | | (1.89 | ) | | | (2.01 | ) | | | $12.97 | | | | 44.35 | % | | | $46,787 | | | | 0.97 | % | | | 0.66 | % | | | 70 | % |
| | (0.11) | | | | (0.25 | ) | | | (0.36 | ) | | | $10.43 | | | | 11.54 | % | | | $41,862 | | | | 0.96 | % | | | 1.44 | % | | | 38 | % |
| | (0.08) | | | | — | | | | (0.08 | ) | | | $9.68 | | | | (2.25 | )% | | | $34,388 | | | | 0.95 | % | | | 1.21 | % | | | 26 | % |
| | (0.05) | | | | — | | | | (0.05 | ) | | | $9.98 | | | | 11.19 | % | | | $31,619 | | | | 0.91 | % | | | 1.05 | % | | | 18 | % |
| | | | | | | | |
| | | | | | | | | | | | | | | | | | | | | | | | | | | | | | | | | | |
| | (0.10) | | | | (1.42 | ) | | | (1.52 | ) | | | $12.96 | | | | 11.74 | % | | | $8,746 | | | | 0.80 | % | | | 0.76 | % | | | 53 | % |
| | (0.14) | | | | (1.89 | ) | | | (2.03 | ) | | | $12.99 | | | | 44.70 | % | | | $6,534 | | | | 0.82 | % | | | 0.82 | % | | | 70 | % |
| | (0.13) | | | | (0.25 | ) | | | (0.38 | ) | | | $10.43 | | | | 11.69 | % | | | $5,788 | | | | 0.81 | % | | | 1.62 | % | | | 38 | % |
| (C) | Net investment income (loss) per share has been calculated using the average daily shares outstanding during the period. |
| (D) | Inception date of Class Y is December 30, 2011. Class Y commenced public offering on January 3, 2012. |
See accompanying Notes to Financial Statements.
| | | | | | | | | | | | | | | | |
| DIAMOND HILL FUNDS | | | | | ANNUAL REPORT | | | | | DECEMBER 31, 2014 | | | | | DIAMOND-HILL.COM | | | 77 | |
Long-Short Fund
Financial Highlights
Selected data for a share outstanding throughout the periods indicated
| | | | | | | | | | | | | | | | |
| Long-Short Fund | | Net asset
value,
beginning
of period | | | Net
investment
income
(loss) | | | Net
realized
and
unrealized
gains
(losses) on
investments | | | Total from
investment
operations | |
| | | | |
Class A | | | | | | | | | | | | | | | | |
For the year ended December 31, 2014 | | | $22.26 | | | | (0.08 | )(C) | | | 1.69 | | | | 1.61 | |
For the year ended December 31, 2013 | | | $18.15 | | | | (0.05 | )(C) | | | 4.21 | | | | 4.16 | |
For the year ended December 31, 2012 | | | $16.75 | | | | 0.06 | (C) | | | 1.36 | | | | 1.42 | |
For the year ended December 31, 2011 | | | $16.26 | | | | 0.03 | (C) | | | 0.46 | | | | 0.49 | |
For the year ended December 31, 2010 | | | $16.31 | | | | — | (D) | | | (0.05 | ) | | | (0.05 | ) |
| | | | |
Class C | | | | | | | | | | | | | | | | |
For the year ended December 31, 2014 | | | $20.65 | | | | (0.23 | )(C) | | | 1.56 | | | | 1.33 | |
For the year ended December 31, 2013 | | | $16.93 | | | | (0.19 | )(C) | | | 3.91 | | | | 3.72 | |
For the year ended December 31, 2012 | | | $15.72 | | | | (0.07 | )(C) | | | 1.28 | | | | 1.21 | |
For the year ended December 31, 2011 | | | $15.37 | | | | (0.08 | )(C) | | | 0.43 | | | | 0.35 | |
For the year ended December 31, 2010 | | | $15.54 | | | | (0.19 | ) | | | 0.02 | | | | (0.17 | ) |
| | | | |
Class I | | | | | | | | | | | | | | | | |
For the year ended December 31, 2014 | | | $22.52 | | | | (0.02 | )(C) | | | 1.72 | | | | 1.70 | |
For the year ended December 31, 2013 | | | $18.35 | | | | — | (C)(D) | | | 4.26 | | | | 4.26 | |
For the year ended December 31, 2012 | | | $16.93 | | | | 0.10 | (C) | | | 1.38 | | | | 1.48 | |
For the year ended December 31, 2011 | | | $16.42 | | | | 0.09 | (C) | | | 0.45 | | | | 0.54 | |
For the year ended December 31, 2010 | | | $16.42 | | | | 0.04 | | | | (0.03 | ) | | | 0.01 | |
| | | | |
Class Y(F) | | | | | | | | | | | | | | | | |
For the year ended December 31, 2014 | | | $22.52 | | | | 0.01 | (C) | | | 1.72 | | | | 1.73 | |
For the year ended December 31, 2013 | | | $18.35 | | | | 0.04 | (C) | | | 4.25 | | | | 4.29 | |
For the year ended December 31, 2012 | | | $16.93 | | | | 0.14 | (C) | | | 1.37 | | | | 1.51 | |
| (A) | Total returns shown exclude the effect of applicable sales charges. |
| (B) | Portfolio turnover rate is calculated on the basis of the Fund as a whole without distinguishing between classes of shares issued. |
| (C) | Net investment income (loss) per share has been calculated using the average daily shares outstanding during the period. |
See accompanying Notes to Financial Statements.
| | | | | | | | | | | | | | |
| 78 | | DIAMOND HILL FUNDS | | | | | ANNUAL REPORT | | | | | DECEMBER 31, 2014 | | | | | DIAMOND-HILL.COM |
| | | | | | | | | | | | | | | | | | | | | | | | | | | | | | | | | | | | | | |
Dividends
from net
investment
income | | | Distributions
from net
realized
gains | | | Total
distributions | | | Net asset
value at
end of
period | | | Total
return(A) | | | Net assets
at end
of period
(000’s) | | | Ratio
of total
expenses
to average
net assets | | | Ratio
of net
investment
income
(loss) to
average
net assets | | | Ratio
of total
expenses to
average net
assets,
excluding
expenses
and fees on
securities
sold short | | | Portfolio
turnover
rate(B) | |
| | | | | | | | | |
| | | | | | | | | | | | | | | | | | | | | | | | | | | | | | | | | | | | | | |
| | — | | | | — | | | | — | | | | $23.87 | | | | 7.23 | % | | | $703,572 | | | | 1.83 | % | | | (0.33 | )% | | | 1.40 | % | | | 60 | % |
| | (0.05) | | | | — | | | | (0.05 | ) | | | $22.26 | | | | 22.92 | % | | | $858,112 | | | | 1.83 | % | | | (0.25 | )% | | | 1.41 | % | | | 30 | % |
| | (0.02) | | | | — | | | | (0.02 | ) | | | $18.15 | | | | 8.46 | % | | | $533,722 | | | | 1.75 | % | | | 0.32 | % | | | 1.41 | % | | | 39 | % |
| | — | | | | — | | | | — | | | | $16.75 | | | | 3.01 | % | | | $512,870 | | | | 1.67 | % | | | 0.21 | % | | | 1.43 | % | | | 50 | % |
| | — | | | | — | | | | — | | | | $16.26 | | | | (0.31 | )% | | | $698,670 | | | | 1.81 | % | | | 0.01 | % | | | 1.48 | % | | | 43 | % |
| | | | | | | | | |
| | | | | | | | | | | | | | | | | | | | | | | | | | | | | | | | | | | | | | |
| | — | | | | — | | | | — | | | | $21.98 | | | | 6.44 | % | | | $170,278 | | | | 2.58 | % | | | (1.09 | )% | | | 2.15 | % | | | 60 | % |
| | — | | | | — | | | | — | | | | $20.65 | | | | 21.97 | % | | | $130,388 | | | | 2.58 | % | | | (0.99 | )% | | | 2.16 | % | | | 30 | % |
| | — | | | | — | | | | — | | | | $16.93 | | | | 7.70 | % | | | $103,393 | | | | 2.50 | % | | | (0.43 | )% | | | 2.16 | % | | | 39 | % |
| | — | | | | — | | | | — | | | | $15.72 | | | | 2.28 | % | | | $119,850 | | | | 2.43 | % | | | (0.54 | )% | | | 2.19 | % | | | 50 | % |
| | — | | | | — | | | | — | | | | $15.37 | | | | (1.09 | )% | | | $179,214 | | | | 2.56 | % | | | (0.73 | )% | | | 2.23 | % | | | 43 | % |
| | | | | | | | | |
| | | | | | | | | | | | | | | | | | | | | | | | | | | | | | | | | | | | | | |
| | — | | | | — | | | | — | | | | $24.22 | | | | 7.55 | % | | | $2,817,671 | | | | 1.58 | % | | | (0.09 | )% | | | 1.15 | % | | | 60 | % |
| | (0.09) | | | | — | | | | (0.09 | ) | | | $22.52 | | | | 23.19 | % | | | $1,859,054 | | | | 1.58 | % | | | — | %(E) | | | 1.16 | % | | | 30 | % |
| | (0.06) | | | | — | | | | (0.06 | ) | | | $18.35 | | | | 8.77 | % | | | $1,554,623 | | | | 1.50 | % | | | 0.58 | % | | | 1.16 | % | | | 39 | % |
| | (0.03) | | | | — | | | | (0.03 | ) | | | $16.93 | | | | 3.29 | % | | | $1,213,122 | | | | 1.39 | % | | | 0.52 | % | | | 1.15 | % | | | 50 | % |
| | (0.01) | | | | — | | | | (0.01 | ) | | | $16.42 | | | | 0.03 | % | | | $1,045,686 | | | | 1.46 | % | | | 0.42 | % | | | 1.11 | % | | | 43 | % |
| | | | | | | | | |
| | | | | | | | | | | | | | | | | | | | | | | | | | | | | | | | | | | | | | |
| | — | | | | — | | | | — | | | | $24.25 | | | | 7.68 | % | | | $280,595 | | | | 1.43 | % | | | 0.06 | % | | | 1.00 | % | | | 60 | % |
| | (0.12) | | | | — | | | | (0.12 | ) | | | $22.52 | | | | 23.39 | % | | | $168,835 | | | | 1.43 | % | | | 0.18 | % | | | 1.01 | % | | | 30 | % |
| | (0.09) | | | | — | | | | (0.09 | ) | | | $18.35 | | | | 8.95 | % | | | $83,409 | | | | 1.35 | % | | | 0.79 | % | | | 1.01 | % | | | 39 | % |
| (D) | Amount is less than $0.005. |
| (E) | Amount is less than 0.005%. |
| (F) | Inception date of Class Y is December 30, 2011. Class Y commenced public offering on January 3, 2012. |
See accompanying Notes to Financial Statements.
| | | | | | | | | | | | | | | | |
| DIAMOND HILL FUNDS | | | | | ANNUAL REPORT | | | | | DECEMBER 31, 2014 | | | | | DIAMOND-HILL.COM | | | 79 | |
Research Opportunities Fund
Financial Highlights
Selected data for a share outstanding throughout the periods indicated
| | | | | | | | | | | | | | | | |
| Research Opportunities Fund(C) | | Net asset
value,
beginning
of period | | | Net
investment
income
(loss) | | | Net
realized
and
unrealized
gains
(losses) on
investments | | | Total from
investment
operations | |
| | | | |
Class A | | | | | | | | | | | | | | | | |
For the year ended December 31, 2014 | | | $22.82 | | | | (0.07 | )(D) | | | 1.62 | | | | 1.55 | |
For the year ended December 31, 2013 | | | $18.34 | | | | (0.10 | )(D) | | | 6.01 | | | | 5.91 | |
For the year ended December 31, 2012 | | | $16.60 | | | | 0.02 | (D) | | | 1.93 | | | | 1.95 | |
| | | | |
Class C | | | | | | | | | | | | | | | | |
For the year ended December 31, 2014 | | | $22.49 | | | | (0.24 | )(D) | | | 1.58 | | | | 1.34 | |
For the year ended December 31, 2013 | | | $18.22 | | | | (0.26 | )(D) | | | 5.96 | | | | 5.70 | |
For the year ended December 31, 2012 | | | $16.60 | | | | (0.09 | )(D) | | | 1.90 | | | | 1.81 | |
| | | | |
Class I | | | | | | | | | | | | | | | | |
For the year ended December 31, 2014 | | | $22.90 | | | | (0.01 | )(D) | | | 1.62 | | | | 1.61 | |
For the year ended December 31, 2013 | | | $18.36 | | | | (0.04 | )(D) | | | 6.01 | | | | 5.97 | |
For the year ended December 31, 2012 | | | $16.60 | | | | 0.05 | (D) | | | 1.95 | | | | 2.00 | |
| | | | |
Class Y | | | | | | | | | | | | | | | | |
For the year ended December 31, 2014 | | | $22.92 | | | | 0.03 | (D) | | | 1.62 | | | | 1.65 | |
For the year ended December 31, 2013 | | | $18.36 | | | | — | (D)(E) | | | 6.02 | | | | 6.02 | |
For the year ended December 31, 2012 | | | $16.60 | | | | 0.08 | (D) | | | 1.94 | | | | 2.02 | |
| (A) | Total returns shown exclude the effect of applicable sales charges. |
| (B) | Portfolio turnover rate is calculated on the basis of the Fund as a whole without distinguishing between classes of shares issued. |
| (C) | Inception date of Class Y is December 30, 2011. Class Y commenced public offering on January 3, 2012. |
See accompanying Notes to Financial Statements.
| | | | | | | | | | | | | | |
| 80 | | DIAMOND HILL FUNDS | | | | | ANNUAL REPORT | | | | | DECEMBER 31, 2014 | | | | | DIAMOND-HILL.COM |
| | | | | | | | | | | | | | | | | | | | | | | | | | | | | | | | | | | | | | |
Dividends
from net
investment
income | | | Distributions
from net
realized
gains | | | Total
distributions | | | Net asset
value at
end of
period | | | Total
return(A) | | | Net assets
at end
of period
(000’s) | | | Ratio
of total
expenses
to average
net assets | | | Ratio
of net
investment
income
(loss) to
average
net assets | | | Ratio
of total
expenses to
average net
assets,
excluding
expenses
and fees on
securities
sold short | | | Portfolio
turnover
rate(B) | |
| | | | | | | | | |
| | | | | | | | | | | | | | | | | | | | | | | | | | | | | | | | | | | | | | |
| | (0.02 | ) | | | (1.83 | ) | | | (1.85 | ) | | | $22.52 | | | | 6.96 | % | | | $9,492 | | | | 1.74 | % | | | (0.29 | )% | | | 1.50 | % | | | 57 | % |
| | — | | | | (1.43 | ) | | | (1.43 | ) | | | $22.82 | | | | 32.43 | % | | | $6,836 | | | | 1.77 | % | | | (0.45 | )% | | | 1.51 | % | | | 72 | % |
| | (0.02 | ) | | | (0.19 | ) | | | (0.21 | ) | | | $18.34 | | | | 11.73 | % | | | $1,120 | | | | 1.63 | % | | | 0.10 | % | | | 1.53 | % | | | 35 | % |
| | | | | | | | | |
| | | | | | | | | | | | | | | | | | | | | | | | | | | | | | | | | | | | | | |
| | — | | | | (1.83 | ) | | | (1.83 | ) | | | $22.00 | | | | 6.17 | % | | | $668 | | | | 2.49 | % | | | (1.03 | )% | | | 2.25 | % | | | 57 | % |
| | — | | | | (1.43 | ) | | | (1.43 | ) | | | $22.49 | | | | 31.48 | % | | | $494 | | | | 2.52 | % | | | (1.19 | )% | | | 2.26 | % | | | 72 | % |
| | — | | | | (0.19 | ) | | | (0.19 | ) | | | $18.22 | | | | 10.91 | % | | | $148 | | | | 2.38 | % | | | (0.51 | )% | | | 2.28 | % | | | 35 | % |
| | | | | | | | | |
| | | | | | | | | | | | | | | | | | | | | | | | | | | | | | | | | | | | | | |
| | (0.07 | ) | | | (1.83 | ) | | | (1.90 | ) | | | $22.61 | | | | 7.21 | % | | | $49,920 | | | | 1.49 | % | | | (0.05 | )% | | | 1.25 | % | | | 57 | % |
| | — | (E) | | | (1.43 | ) | | | (1.43 | ) | | | $22.90 | | | | 32.76 | % | | | $43,018 | | | | 1.52 | % | | | (0.17 | )% | | | 1.26 | % | | | 72 | % |
| | (0.05 | ) | | | (0.19 | ) | | | (0.24 | ) | | | $18.36 | | | | 12.03 | % | | | $15,978 | | | | 1.38 | % | | | 0.30 | % | | | 1.28 | % | | | 35 | % |
| | | | | | | | | |
| | | | | | | | | | | | | | | | | | | | | | | | | | | | | | | | | | | | | | |
| | (0.10 | ) | | | (1.83 | ) | | | (1.93 | ) | | | $22.64 | | | | 7.37 | % | | | $17,307 | | | | 1.34 | % | | | 0.11 | % | | | 1.10 | % | | | 57 | % |
| | (0.03 | ) | | | (1.43 | ) | | | (1.46 | ) | | | $22.92 | | | | 32.99 | % | | | $15,468 | | | | 1.37 | % | | | 0.02 | % | | | 1.11 | % | | | 72 | % |
| | (0.07 | ) | | | (0.19 | ) | | | (0.26 | ) | | | $18.36 | | | | 12.17 | % | | | $11,572 | | | | 1.23 | % | | | 0.45 | % | | | 1.13 | % | | | 35 | % |
| (D) | Net investment income (loss) per share has been calculated using the average daily shares outstanding during the period. |
| (E) | Amount is less than $0.005. |
See accompanying Notes to Financial Statements.
| | | | | | | | | | | | | | | | |
| DIAMOND HILL FUNDS | | | | | ANNUAL REPORT | | | | | DECEMBER 31, 2014 | | | | | DIAMOND-HILL.COM | | | 81 | |
Financial Long-Short Fund
Financial Highlights
Selected data for a share outstanding throughout the periods indicated
| | | | | | | | | | | | | | | | |
| Financial Long-Short Fund | | Net asset
value,
beginning
of period | | | Net
investment
income
(loss) | | | Net
realized
and
unrealized
gains
(losses) on
investments | | | Total from
investment
operations | |
|
Class A | |
For the year ended December 31, 2014 | | | $18.13 | | | | (0.02 | )(C) | | | 1.50 | | | | 1.48 | |
For the year ended December 31, 2013 | | | $13.24 | | | | (0.05 | )(C) | | | 4.94 | | | | 4.89 | |
For the year ended December 31, 2012 | | | $10.51 | | | | 0.06 | (C) | | | 2.74 | | | | 2.80 | |
For the year ended December 31, 2011 | | | $12.18 | | | | 0.02 | | | | (1.65 | ) | | | (1.63 | ) |
For the year ended December 31, 2010 | | | $10.43 | | | | 0.02 | | | | 1.73 | | | | 1.75 | |
|
Class C | |
For the year ended December 31, 2014 | | | $17.00 | | | | (0.15 | )(C) | | | 1.41 | | | | 1.26 | |
For the year ended December 31, 2013 | | | $12.51 | | | | (0.17 | )(C) | | | 4.66 | | | | 4.49 | |
For the year ended December 31, 2012 | | | $9.96 | | | | (0.02 | )(C) | | | 2.57 | | | | 2.55 | |
For the year ended December 31, 2011 | | | $11.58 | | | | (0.07 | )(C) | | | (1.55 | ) | | | (1.62 | ) |
For the year ended December 31, 2010 | | | $9.99 | | | | (0.10 | ) | | | 1.69 | | | | 1.59 | |
|
Class I | |
For the year ended December 31, 2014 | | | $18.10 | | | | 0.02 | (C) | | | 1.50 | | | | 1.52 | |
For the year ended December 31, 2013 | | | $13.18 | | | | (0.02 | )(C) | | | 4.94 | | | | 4.92 | |
For the year ended December 31, 2012 | | | $10.47 | | | | 0.10 | (C) | | | 2.72 | | | | 2.82 | |
For the year ended December 31, 2011 | | | $12.14 | | | | 0.07 | | | | (1.67 | ) | | | (1.60 | ) |
For the year ended December 31, 2010 | | | $10.37 | | | | 0.08 | | | | 1.71 | | | | 1.79 | |
| (A) | Total returns shown exclude the effect of applicable sales charges. |
| (B) | Portfolio turnover rate is calculated on the basis of the Fund as a whole without distinguishing between classes of shares issued. |
See accompanying Notes to Financial Statements.
| | | | | | | | | | | | | | |
| 82 | | DIAMOND HILL FUNDS | | | | | ANNUAL REPORT | | | | | DECEMBER 31, 2014 | | | | | DIAMOND-HILL.COM |
| | | | | | | | | | | | | | | | | | | | | | | | | | | | | | | | | | | | | | |
Dividends
from net
investment
income | | | Distributions
from net
realized
gains | | | Total
distributions | | | Net asset
value at
end of
period | | | Total
return(A) | | | Net assets
at end
of period
(000’s) | | | Ratio
of total
expenses
to average
net assets | | | Ratio
of net
investment
income
(loss) to
average
net assets | | | Ratio
of total
expenses to
average net
assets,
excluding
expenses
and fees on
securities
sold short | | | Portfolio
turnover
rate(B) | |
| | | | | | | | | |
| | | | | | | | | | | | | | | | | | | | | | | | | | | | | | | | | | | | | | |
| | — | | | | — | | | | — | | | | $19.61 | | | | 8.16 | % | | | $12,043 | | | | 1.74 | % | | | (0.10 | )% | | | 1.50 | % | | | 51 | % |
| | — | | | | — | | | | — | | | | $18.13 | | | | 36.93 | % | | | $17,852 | | | | 1.70 | % | | | (0.31 | )% | | | 1.52 | % | | | 66 | % |
| | (0.07) | | | | — | | | | (0.07 | ) | | | $13.24 | | | | 26.62 | % | | | $7,862 | | | | 1.76 | % | | | 0.49 | % | | | 1.56 | % | | | 58 | % |
| | (0.04) | | | | — | | | | (0.04 | ) | | | $10.51 | | | | (13.39 | )% | | | $6,650 | | | | 1.66 | % | | | 0.14 | % | | | 1.54 | % | | | 52 | % |
| | — | | | | — | | | | — | | | | $12.18 | | | | 16.78 | % | | | $8,543 | | | | 1.71 | % | | | 0.09 | % | | | 1.56 | % | | | 60 | % |
| | | | | | | | | |
| | | | | | | | | | | | | | | | | | | | | | | | | | | | | | | | | | | | | | |
| | — | | | | — | | | | — | | | | $18.26 | | | | 7.41 | % | | | $2,233 | | | | 2.49 | % | | | (0.86 | )% | | | 2.25 | % | | | 51 | % |
| | — | | | | — | | | | — | | | | $17.00 | | | | 35.89 | % | | | $2,958 | | | | 2.45 | % | | | (1.06 | )% | | | 2.27 | % | | | 66 | % |
| | — | | | | — | | | | — | | | | $12.51 | | | | 25.60 | % | | | $820 | | | | 2.51 | % | | | (0.20 | )% | | | 2.31 | % | | | 58 | % |
| | — | | | | — | | | | — | | | | $9.96 | | | | (13.99 | )% | | | $795 | | | | 2.41 | % | | | (0.60 | )% | | | 2.29 | % | | | 52 | % |
| | — | | | | — | | | | — | | | | $11.58 | | | | 15.92 | % | | | $1,381 | | | | 2.46 | % | | | (0.66 | )% | | | 2.31 | % | | | 60 | % |
| | | | | | | | | |
| | | | | | | | | | | | | | | | | | | | | | | | | | | | | | | | | | | | | | |
| | (0.05) | | | | — | | | | (0.05 | ) | | | $19.57 | | | | 8.42 | % | | | $15,310 | | | | 1.49 | % | | | 0.12 | % | | | 1.25 | % | | | 51 | % |
| | — | | | | — | | | | — | | | | $18.10 | | | | 37.33 | % | | | $10,817 | | | | 1.45 | % | | | (0.12 | )% | | | 1.27 | % | | | 66 | % |
| | (0.11) | | | | — | | | | (0.11 | ) | | | $13.18 | | | | 26.94 | % | | | $3,931 | | | | 1.51 | % | | | 0.85 | % | | | 1.31 | % | | | 58 | % |
| | (0.07) | | | | — | | | | (0.07 | ) | | | $10.47 | | | | (13.21 | )% | | | $1,584 | | | | 1.37 | % | | | 0.47 | % | | | 1.25 | % | | | 52 | % |
| | (0.02) | | | | — | | | | (0.02 | ) | | | $12.14 | | | | 17.29 | % | | | $1,873 | | | | 1.34 | % | | | 0.45 | % | | | 1.19 | % | | | 60 | % |
| (C) | Net investment income (loss) per share has been calculated using the average daily shares outstanding during the period. |
See accompanying Notes to Financial Statements.
| | | | | | | | | | | | | | | | |
| DIAMOND HILL FUNDS | | | | | ANNUAL REPORT | | | | | DECEMBER 31, 2014 | | | | | DIAMOND-HILL.COM | | | 83 | |
Strategic Income Fund
Financial Highlights
Selected data for a share outstanding throughout the periods indicated
| | | | | | | | | | | | | | | | |
| Strategic Income Fund | | Net asset
value,
beginning
of period | | | Net
investment
income
(loss) | | | Net
realized
and
unrealized
gains
(losses) on
investments | | | Total from
investment
operations | |
|
Class A | |
For the year ended December 31, 2014 | | | $11.19 | | | | 0.51 | (C) | | | (0.28 | ) | | | 0.23 | |
For the year ended December 31, 2013 | | | $11.18 | | | | 0.56 | (C) | | | — | (D) | | | 0.56 | |
For the year ended December 31, 2012 | | | $10.79 | | | | 0.62 | (C) | | | 0.39 | | | | 1.01 | |
For the year ended December 31, 2011 | | | $10.86 | | | | 0.65 | | | | (0.09 | ) | | | 0.56 | |
For the year ended December 31, 2010 | | | $10.15 | | | | 0.64 | | | | 0.69 | | | | 1.33 | |
|
Class C | |
For the year ended December 31, 2014 | | | $11.17 | | | | 0.42 | (C) | | | (0.27 | ) | | | 0.15 | |
For the year ended December 31, 2013 | | | $11.17 | | | | 0.47 | (C) | | | — | (D) | | | 0.47 | |
For the year ended December 31, 2012 | | | $10.78 | | | | 0.53 | (C) | | | 0.40 | | | | 0.93 | |
For the year ended December 31, 2011 | | | $10.85 | | | | 0.56 | | | | (0.08 | ) | | | 0.48 | |
For the year ended December 31, 2010 | | | $10.15 | | | | 0.54 | | | | 0.70 | | | | 1.24 | |
|
Class I | |
For the year ended December 31, 2014 | | | $11.16 | | | | 0.54 | (C) | | | (0.27 | ) | | | 0.27 | |
For the year ended December 31, 2013 | | | $11.16 | | | | 0.58 | (C) | | | — | (D) | | | 0.58 | |
For the year ended December 31, 2012 | | | $10.77 | | | | 0.64 | (C) | | | 0.40 | | | | 1.04 | |
For the year ended December 31, 2011 | | | $10.84 | | | | 0.67 | | | | (0.08 | ) | | | 0.59 | |
For the year ended December 31, 2010 | | | $10.13 | | | | 0.64 | | | | 0.72 | | | | 1.36 | |
|
Class Y(E) | |
For the year ended December 31, 2014 | | | $11.16 | | | | 0.55 | (C) | | | (0.27 | ) | | | 0.28 | |
For the year ended December 31, 2013 | | | $11.15 | | | | 0.60 | (C) | | | — | (D) | | | 0.60 | |
For the year ended December 31, 2012 | | | $10.77 | | | | 0.66 | (C) | | | 0.38 | | | | 1.04 | |
| (A) | Total returns shown exclude the effect of applicable sales charges. |
| (B) | Portfolio turnover rate is calculated on the basis of the Fund as a whole without distinguishing between classes of shares issued. |
| (C) | Net investment income (loss) per share has been calculated using the average daily shares outstanding during the period. |
See accompanying Notes to Financial Statements.
| | | | | | | | | | | | | | |
| 84 | | DIAMOND HILL FUNDS | | | | | ANNUAL REPORT | | | | | DECEMBER 31, 2014 | | | | | DIAMOND-HILL.COM |
| | | | | | | | | | | | | | | | | | | | | | | | | | | | | | | | | | |
Dividends
from net
investment
income | | | Distributions
from net
realized
gains | | | Total
distributions | | | Net asset
value at
end of
period | | | Total
return(A) | | | Net assets
at end
of period
(000’s) | | | Ratio
of total
expenses
to average
net assets | | | Ratio
of net
investment
income
(loss) to
average
net assets | | | Portfolio
turnover
rate(B) | |
| | | | | | | | |
| | | | | | | | | | | | | | | | | | | | | | | | | | | | | | | | | | |
| | (0.48) | | | | — | | | | (0.48 | ) | | | $10.94 | | | | 2.10 | % | | | $31,282 | | | | 1.00 | % | | | 4.52 | % | | | 56 | % |
| | (0.55) | | | | — | | | | (0.55 | ) | | | $11.19 | | | | 5.13 | % | | | $39,801 | | | | 1.02 | % | | | 5.00 | % | | | 60 | % |
| | (0.62) | | | | — | | | | (0.62 | ) | | | $11.18 | | | | 9.55 | % | | | $44,374 | | | | 1.02 | % | | | 5.57 | % | | | 33 | % |
| | (0.63) | | | | — | | | | (0.63 | ) | | | $10.79 | | | | 5.21 | % | | | $38,895 | | | | 1.02 | % | | | 5.80 | % | | | 36 | % |
| | (0.62) | | | | — | | | | (0.62 | ) | | | $10.86 | | | | 13.33 | % | | | $42,360 | | | | 1.06 | % | | | 5.81 | % | | | 68 | % |
| | | | | | | | |
| | | | | | | | | | | | | | | | | | | | | | | | | | | | | | | | | | |
| | (0.40) | | | | — | | | | (0.40 | ) | | | $10.92 | | | | 1.37 | % | | | $24,088 | | | | 1.75 | % | | | 3.80 | % | | | 56 | % |
| | (0.47) | | | | — | | | | (0.47 | ) | | | $11.17 | | | | 4.26 | % | | | $26,126 | | | | 1.77 | % | | | 4.25 | % | | | 60 | % |
| | (0.54) | | | | — | | | | (0.54 | ) | | | $11.17 | | | | 8.76 | % | | | $27,801 | | | | 1.77 | % | | | 4.81 | % | | | 33 | % |
| | (0.55) | | | | — | | | | (0.55 | ) | | | $10.78 | | | | 4.48 | % | | | $23,717 | | | | 1.77 | % | | | 5.06 | % | | | 36 | % |
| | (0.54) | | | | — | | | | (0.54 | ) | | | $10.85 | | | | 12.39 | % | | | $24,264 | | | | 1.81 | % | | | 5.06 | % | | | 68 | % |
| | | | | | | | |
| | | | | | | | | | | | | | | | | | | | | | | | | | | | | | | | | | |
| | (0.52) | | | | — | | | | (0.52 | ) | | | $10.91 | | | | 2.38 | % | | | $148,737 | | | | 0.75 | % | | | 4.82 | % | | | 56 | % |
| | (0.58) | | | | — | | | | (0.58 | ) | | | $11.16 | | | | 5.30 | % | | | $117,009 | | | | 0.77 | % | | | 5.24 | % | | | 60 | % |
| | (0.65) | | | | — | | | | (0.65 | ) | | | $11.16 | | | | 9.83 | % | | | $103,738 | | | | 0.77 | % | | | 5.81 | % | | | 33 | % |
| | (0.66) | | | | — | | | | (0.66 | ) | | | $10.77 | | | | 5.53 | % | | | $83,418 | | | | 0.73 | % | | | 6.10 | % | | | 36 | % |
| | (0.65) | | | | — | | | | (0.65 | ) | | | $10.84 | | | | 13.77 | % | | | $76,893 | | | | 0.69 | % | | | 6.18 | % | | | 68 | % |
| | | | | | | | |
| | | | | | | | | | | | | | | | | | | | | | | | | | | | | | | | | | |
| | (0.53) | | | | — | | | | (0.53 | ) | | | $10.91 | | | | 2.54 | % | | | $15,831 | | | | 0.60 | % | | | 4.96 | % | | | 56 | % |
| | (0.59) | | | | — | | | | (0.59 | ) | | | $11.16 | | | | 5.55 | % | | | $3,927 | | | | 0.62 | % | | | 5.35 | % | | | 60 | % |
| | (0.66) | | | | — | | | | (0.66 | ) | | | $11.15 | | | | 9.90 | % | | | $2,515 | | | | 0.62 | % | | | 5.95 | % | | | 33 | % |
| (D) | Amount is less than $0.005. |
| (E) | Inception date of Class Y is December 30, 2011. Class Y commenced public offering on January 3, 2012. |
See accompanying Notes to Financial Statements.
| | | | | | | | | | | | | | | | |
| DIAMOND HILL FUNDS | | | | | ANNUAL REPORT | | | | | DECEMBER 31, 2014 | | | | | DIAMOND-HILL.COM | | | 85 | |
Diamond Hill Funds
Notes to Financial Statements
December 31, 2014
Organization
The Diamond Hill Small Cap Fund (“Small Cap Fund”), Diamond Hill Small-Mid Cap Fund (“Small-Mid Cap Fund”), Diamond Hill Mid Cap Fund (“Mid Cap Fund”), Diamond Hill Large Cap Fund (“Large Cap Fund”), Diamond Hill Select Fund (“Select Fund”), Diamond Hill Long-Short Fund (“Long-Short Fund”), Diamond Hill Research Opportunities Fund (“Research Opportunities Fund”), Diamond Hill Financial Long-Short Fund (“Financial Long-Short Fund”) and Diamond Hill Strategic Income Fund (“Strategic Income Fund”), are each a series of the Diamond Hill Funds (the “Trust”) (each a “Fund” and collectively the “Funds”). The Trust is an Ohio business trust, which is registered under the Investment Company Act of 1940, as amended, (the “1940 Act”) as an open-end, management investment company. Each Fund is a diversified series of the Trust.
On January 2, 2014, the Diamond Hill Mid Cap Fund commenced public offering and investment operations.
With the exception of the Financial Long-Short Fund, the Funds offer four classes of shares: Class A, Class C, Class I and Class Y. The Financial Long-Short Fund offers three classes of shares: Class A, Class C and Class I. Each class of shares for each Fund has identical rights and privileges except with respect to distribution (12b-1) and service fees, voting rights on matters affecting a single class of shares, exchange privileges of each class of shares and sales charges. Class A has a maximum sales charge on purchases of 5.00% as a percentage of the original purchase price except for Strategic Income Fund which is 3.50%. Class C has a contingent deferred sales charge of 1.00% for shares redeemed within a year of the purchase date.
Significant Accounting Policies
The following is a summary of the Funds’ significant accounting policies:
Estimates — The preparation of financial statements in conformity with U.S. generally accepted accounting principles (“GAAP”) requires management to make estimates and assumptions that affect the reported amounts of assets and liabilities and disclosure of contingent assets and liabilities at the date of the financial statements and the reported amounts of income and expenses during the reporting period. Actual results could differ from those estimates.
Security valuation — The Funds record their investments at fair value. Fair value is defined as the price that would be received to sell an asset or paid to transfer a liability in an orderly transaction between market participants at the measurement date. The valuation techniques used by the Funds maximize the use of observable inputs and minimize the use of unobservable inputs in determining fair value. These inputs are summarized in the three broad levels listed below:
| Ÿ | | Level 1 — quoted prices in active markets for identical securities |
| | | | | | | | | | | | | | |
| 86 | | DIAMOND HILL FUNDS | | | | | ANNUAL REPORT | | | | | DECEMBER 31, 2014 | | | | | DIAMOND-HILL.COM |
Diamond Hill Funds
Notes to Financial Statements (Continued)
December 31, 2014
| Ÿ | | Level 2 — other significant observable inputs (including quoted prices for similar securities, interest rates, prepayment speeds, credit risk, etc.) |
| Ÿ | | Level 3 — significant unobservable inputs (including the Funds’ own assumptions in determining the fair value of investments) |
Listed securities for which market quotations are readily available are valued at the closing prices as determined by the primary exchange where the securities are traded. Unlisted securities or listed securities for which the latest sales prices are not readily available are valued at the closing bid price in the principal market where such securities are normally traded. Investments in other investment companies are valued at their reported net asset value. In each of these types of situations, valuations are typically categorized as Level 1 in the fair value hierarchy.
Debt securities are valued on the basis of valuations provided by dealers or by an independent pricing service that determines valuations based upon market transactions for normal, institutional-size trading units of similar securities. Short-term debt investments of sufficient credit quality maturing in less than 61 days may be valued at amortized cost, which may approximate fair value. In each of these situations, valuations are typically categorized as Level 2 in the fair value hierarchy.
Securities for which market quotations are not readily available (e.g., an approved pricing service does not provide a price, certain stale prices, or an event occurs that materially affects the furnished price) are valued by the Fair Value Committee. In these cases, the Fair Value Committee, established and appointed by the Trustees, determines in good faith, subject to Trust procedures, the fair value of portfolio securities held by a Fund (“good faith fair valuation”). When a good faith fair valuation of a security is required, consideration is generally given to a number of factors, including, but not limited to the following: dealer quotes, published analyses by dealers or analysts of the situation at issue, transactions implicitly valuing the security (such as a merger, tender offer, etc.), the value of other securities or contracts which derive their value from the security at issue, and the implications (whether negative or positive) of the circumstances which have caused trading in the security to halt. Depending on the source and relative significance of the valuation inputs in these instances, the valuations for these securities may be classified as Level 2 or Level 3 in the fair value hierarchy.
In accordance with procedures adopted by the Board of Trustees, fair value pricing may be used if events materially affecting the value of foreign securities occur between the time the exchange on which they are traded closes and the time the Funds’ net asset values are calculated. The Funds use a systematic valuation model, provided daily by an independent third party to fair value their international equity securities. These valuations are considered as Level 2 in the fair value hierarchy.
| | | | | | | | | | | | | | | | |
| DIAMOND HILL FUNDS | | | | | ANNUAL REPORT | | | | | DECEMBER 31, 2014 | | | | | DIAMOND-HILL.COM | | | 87 | |
Diamond Hill Funds
Notes to Financial Statements (Continued)
December 31, 2014
Approximately 0.4% of the Strategic Income Fund’s December 31, 2014 net assets are being valued using estimates provided by the Fair Value Committee.
Changes in valuation techniques may result in transfers in or out of an assigned level within the disclosure hierarchy. The Trust determines transfers between fair value hierarchy levels at the reporting period end. There were no transfers between Levels 1, 2 or 3 as of December 31, 2014 based on input levels assigned at December 31, 2013.
The inputs or methodology used for valuing securities are not necessarily an indication of the risk associated with investing in those securities. For example, short-term debt securities of sufficient credit quality maturing in less than 61 days may be valued using amortized cost in accordance with rules under the 1940 Act. Generally, amortized cost approximates the current fair value of a security, but since the value is not obtained from a quoted price in an active market, such securities are reflected as Level 2.
The following is a summary of the inputs used to value the Funds’ investments as of December 31, 2014:
| | | | | | | | |
| | | Level 1 –
Quoted
Prices | | | Level 2 –
Other
Significant
Observable
Inputs | |
Investments in Securities: (Assets) | | | | | | | | |
Small Cap Fund | | | | | | | | |
Common Stocks* | | $ | 1,157,436,972 | | | $ | — | |
Registered Investment Companies | | | 354,795,267 | | | | — | |
| | | | | | | | |
Total | | | 1,512,232,239 | | | | — | |
Small-Mid Cap Fund | | | | | | | | |
Common Stocks* | | | 630,755,048 | | | | — | |
Registered Investment Companies | | | 94,183,087 | | | | — | |
| | | | | | | | |
Total | | | 724,938,135 | | | | — | |
Mid Cap Fund | | | | | | | | |
Common Stocks* | | | 15,235,325 | | | | — | |
Registered Investment Companies | | | 5,759,470 | | | | — | |
| | | | | | | | |
Total | | | 20,994,795 | | | | — | |
Large Cap Fund | | | | | | | | |
Common Stocks* | | | 3,206,190,153 | | | | — | |
Registered Investment Companies | | | 102,115,146 | | | | — | |
| | | | | | | | |
Total | | | 3,308,305,299 | | | | — | |
| | | | | | | | | | | | | | |
| 88 | | DIAMOND HILL FUNDS | | | | | ANNUAL REPORT | | | | | DECEMBER 31, 2014 | | | | | DIAMOND-HILL.COM |
Diamond Hill Funds
Notes to Financial Statements (Continued)
December 31, 2014
| | | | | | | | |
| | | Level 1 –
Quoted
Prices | | | Level 2 –
Other
Significant
Observable
Inputs | |
Select Fund | | | | | | | | |
Common Stocks* | | $ | 59,604,452 | | | $ | — | |
Registered Investment Companies | | | 9,488,204 | | | | — | |
| | | | | | | | |
Total | | | 69,092,656 | | | | — | |
Long-Short Fund | | | | | | | | |
Common Stocks* | | | 3,215,110,316 | | | | — | |
Registered Investment Companies | | | 658,025,481 | | | | — | |
| | | | | | | | |
Total | | | 3,873,135,797 | | | | — | |
Research Opportunities Fund | | | | | | | | |
Common Stocks* | | | 71,308,071 | | | | 1,503,908 | |
Registered Investment Companies | | | 24,471,504 | | | | — | |
| | | | | | | | |
Total | | | 95,779,575 | | | | 1,503,908 | |
Financial Long-Short Fund | | | | | | | | |
Common Stocks* | | | 25,992,820 | | | | — | |
Registered Investment Companies | | | 11,699,755 | | | | — | |
| | | | | | | | |
Total | | | 37,692,575 | | | | — | |
Strategic Income Fund | | | | | | | | |
Collateralized Debt Obligations | | | — | | | | 936,341 | |
Corporate Bonds* | | | — | | | | 209,496,142 | |
Registered Investment Companies | | | 38,509,027 | | | | — | |
| | | | | | | | |
Total | | | 38,509,027 | | | | 210,432,483 | |
| | |
Investments in Securities Sold
Short: (Liabilities) | | | | | | | | |
Long-Short Fund | | | | | | | | |
Common Stocks* | | | (789,836,393 | ) | | | — | |
Research Opportunities Fund | | | | | | | | |
Common Stocks* | | | (10,031,515 | ) | | | — | |
Financial Long-Short Fund | | | | | | | | |
Common Stocks* | | | (2,363,411 | ) | | | — | |
| * | See Schedule of Investments and Schedule of Investments Sold Short for industry classification. |
The Funds did not hold any Level 3 securities during the year ended December 31, 2014.
Short sales — The Long-Short Fund, Research Opportunities Fund, Financial Long-Short Fund and Strategic Income Fund are permitted to make short sales of securities. Short sales
| | | | | | | | | | | | | | | | |
| DIAMOND HILL FUNDS | | | | | ANNUAL REPORT | | | | | DECEMBER 31, 2014 | | | | | DIAMOND-HILL.COM | | | 89 | |
Diamond Hill Funds
Notes to Financial Statements (Continued)
December 31, 2014
are effective when it is believed that the price of a particular security will decline, and involves the sale of a security which the Fund does not own in hope of purchasing the same security at a later date at a lower price. To make delivery to the buyer, a Fund must borrow the security, and the Fund is obligated to return the security to the lender, which is accomplished by a later purchase of the security by the Fund. Cash received from short sales is maintained by the custodian and is used as collateral. It is included as “Cash deposits with custodian for securities sold short” on the Statements of Assets & Liabilities and “Segregated Cash With Custodian” on the Schedules of Investments.
A Fund will incur a loss as a result of a short sale if the price of the security increases between the date of the short sale and the date on which the Fund purchases the security to replace the borrowed security. The use of short sales may cause a Fund to have higher expenses (especially dividend expenses) than those of other equity mutual funds. Short sales are speculative transactions and involve special risks, including greater reliance on the ability of the Funds’ investment advisor, Diamond Hill Capital Management, Inc. (“DHCM”) to accurately anticipate the future value of a security.
Securities lending — State Street Bank and Trust Company (“State Street”) replaced Citibank, N.A. as the securities lending agent for the Funds on June 23, 2014. Under the terms of the securities lending agreement with State Street, State Street is authorized to loan securities on behalf of the Funds to approved borrowers. In exchange, the Funds receive cash collateral in the amount of at least 100% of the value of the securities loaned. Any collateral shortfalls due to changes in security market prices are adjusted the next business day. The cash collateral is invested in short-term instruments as noted in each Fund’s Schedule of Investments. Although risk is mitigated by the collateral, the Funds could experience a delay in recovering their securities and possible loss of income or value if the borrower fails to return them. The agreement indemnifies the Funds from losses incurred in the event of a borrower’s material default of the terms and conditions of the borrower agreement. The agreement provides that after predetermined rebates to borrowers, the Funds each retain 85% of their respective net securities lending income and pay State Street the remaining 15%.
| | | | | | | | | | | | | | |
| 90 | | DIAMOND HILL FUNDS | | | | | ANNUAL REPORT | | | | | DECEMBER 31, 2014 | | | | | DIAMOND-HILL.COM |
Diamond Hill Funds
Notes to Financial Statements (Continued)
December 31, 2014
As of December 31, 2014, the fair value of securities loaned and the collateral held were as follows:
| | | | | | | | |
| | | Fair Value of
Securities Loaned | | | Fair Value of
Collateral Received | |
Small Cap Fund | | $ | 67,146,296 | | | $ | 69,361,116 | |
Small-Mid Cap Fund | | | 21,935,974 | | | | 22,736,122 | |
Mid Cap Fund | | | 4,526,893 | | | | 4,681,977 | |
Large Cap Fund | | | 17,078,134 | | | | 17,812,411 | |
Select Fund | | | 6,913,173 | | | | 7,141,083 | |
Long-Short Fund | | | 29,554,942 | | | | 30,570,119 | |
Research Opportunities Fund | | | 21,186,745 | | | | 21,897,592 | |
Financial Long-Short Fund | | | 8,234,881 | | | | 8,517,762 | |
Strategic Income Fund | | | 31,605,984 | | | | 32,929,385 | |
Security transactions — Throughout the reporting period, investment transactions are recorded no later than the first business day following trade date. For financial reporting purposes, investments are reported on trade date on the last business day of the reporting period. The specific identification method is used for determining realized gains or losses for financial statements and income tax purposes. Dividend income is recognized on the ex-dividend date and interest income is recognized on an accrual basis. Discounts and premiums on securities purchased are amortized using the daily effective yield method. The Funds record distributions received from investments in Real Estate Investment Trusts (“REITS”) in excess of income from underlying investments as a reduction of cost of investments and/or realized gain. Such amounts are based on estimates if actual amounts are not available and actual amounts of income, realized gain and return of capital may differ from the estimated amounts. The Funds adjust the estimated amounts once the issuers provide information about the actual composition of the distributions.
Share valuation — The net asset value per share of each class of shares of each Fund is calculated daily by dividing the total value of a Fund’s assets attributable to that class, less liabilities attributable to that class, by the number of shares of that class outstanding.
Federal income taxes — Each Fund’s policy is to continue to comply with the requirements of the Internal Revenue Code that are applicable to regulated investment companies and to distribute substantially all of its taxable net investment income and any net realized capital gains to its shareholders. The Funds have analyzed their tax positions taken on Federal income tax returns for all open tax years (tax years ended December 31, 2011 through 2014) and have concluded that no provision for income tax is required in their financial statements.
Distributions to shareholders — Dividends from net investment income are declared and paid monthly for the Strategic Income Fund. Dividends from net investment income are
| | | | | | | | | | | | | | | | |
| DIAMOND HILL FUNDS | | | | | ANNUAL REPORT | | | | | DECEMBER 31, 2014 | | | | | DIAMOND-HILL.COM | | | 91 | |
Diamond Hill Funds
Notes to Financial Statements (Continued)
December 31, 2014
declared and paid on an annual basis for the Small Cap Fund, Small-Mid Cap Fund, Mid Cap Fund, Large Cap Fund, Select Fund, Long-Short Fund, Research Opportunities Fund, and Financial Long-Short Fund. Dividends are declared separately for each class. No class has preferential dividend rights; differences in per share rates are due to differences in separate class expenses. Net realized capital gains, if any, are distributed at least annually. Distributions from net investment income and from net capital gains are determined in accordance with U.S. income tax regulations, which may differ from GAAP. These differences are primarily due to differing treatments for paydown gains and losses on mortgage-backed securities, expiring capital loss carry-forwards and deferrals of certain losses. Permanent book and tax basis differences are reclassified among the components of net assets. Certain Funds may utilize earnings and profits distributed to shareholders on redemption of shares as part of the dividends paid deduction for income tax purposes.
Allocations — Investment income earned, realized capital gains and losses, and unrealized appreciation and depreciation for the Funds are allocated daily to each class of shares based upon its proportionate share of total net assets of the Fund. Class specific expenses are charged directly to the class incurring the expense. Common expenses, which are not attributable to a specific class, are allocated daily to each class of shares based upon its proportionate share of total net assets of the Fund. Expenses not directly billed to a Fund are allocated proportionally among all Funds daily in relation to net assets of each Fund or another reasonable measure.
Foreign securities country risk — Investing in non-U.S. securities may entail risk due to foreign economic and political developments; this risk may be higher when investing in emerging markets. Changes in currency exchange rates and differences in accounting and taxation policies outside the U.S. can raise or lower returns.
Foreign currency translation — The books and records of the Funds are maintained in U.S. dollars. Investment securities and other assets and liabilities denominated in a foreign currency are translated into U.S. dollars on the date of valuation. The Funds do not isolate that portion of realized or unrealized gains and losses resulting from changes in the foreign exchange rate from fluctuations arising from changes in the market prices of the securities. These gains and losses are included in net realized and unrealized gains and losses on investments in the Statements of Operations. Net realized and unrealized gains and losses on foreign currency transactions represent net foreign exchange gains or losses from foreign currency exchange contracts, disposition of foreign currencies, currency gains or losses realized between trade and settlement dates in securities transactions and the difference between the amount of the investment income and foreign withholding taxes recorded on the Funds’ books and the U.S. dollar equivalent amounts actually received or paid.
| | | | | | | | | | | | | | |
| 92 | | DIAMOND HILL FUNDS | | | | | ANNUAL REPORT | | | | | DECEMBER 31, 2014 | | | | | DIAMOND-HILL.COM |
Diamond Hill Funds
Notes to Financial Statements (Continued)
December 31, 2014
Investment Transactions
For the year ended December 31, 2014, purchases and sales (including maturities) of investment securities (excluding short-term securities and U.S. government obligations) were as follows:
| | | | | | | | |
| | | Purchases | | | Sales | |
Small Cap Fund | | $ | 222,511,785 | | | $ | 181,573,431 | |
Small-Mid Cap Fund | | | 404,591,648 | | | | 120,543,523 | |
Mid Cap Fund | | | 17,783,077 | | | | 3,381,224 | |
Large Cap Fund | | | 1,114,109,489 | | | | 673,535,952 | |
Select Fund | | | 45,008,903 | | | | 35,793,624 | |
Long-Short Fund | | | 1,570,340,723 | | | | 1,383,579,788 | |
Research Opportunities Fund | | | 43,382,640 | | | | 31,726,970 | |
Financial Long-Short Fund | | | 11,312,777 | | | | 11,534,258 | |
Strategic Income Fund | | | 152,130,030 | | | | 112,676,915 | |
The Funds pay commissions on the purchase and sale of investment securities. The commissions are treated as transaction costs and, therefore, are included as part of the cost of purchases or net proceeds on the sale of investment securities and are not included in the presentation of Fund expenses on the Statements of Operations. The Funds paid the following commissions during the year ended December 31, 2014:
| | | | | | | | |
| | | Total
Commissions | | | Commissions
as a % of
Average
Net Assets | |
Small Cap Fund | | $ | 268,665 | | | | 0.02 | % |
Small-Mid Cap Fund | | | 345,474 | | | | 0.07 | % |
Mid Cap Fund | | | 12,405 | | | | 0.10 | % |
Large Cap Fund | | | 790,924 | | | | 0.03 | % |
Select Fund | | | 35,946 | | | | 0.05 | % |
Long-Short Fund | | | 1,334,853 | | | | 0.04 | % |
Research Opportunities Fund | | | 38,821 | | | | 0.05 | % |
Financial Long-Short Fund | | | 11,659 | | | | 0.04 | % |
Investment Advisory Fees and Other Transactions with Affiliates
The Small Cap Fund, Small-Mid Cap Fund, Mid Cap Fund, Large Cap Fund, Select Fund, Long-Short Fund, Research Opportunities Fund, Financial Long-Short Fund and Strategic Income Fund each receive investment management and advisory services from DHCM under management agreements that provide for fees to be paid at an annual rate of 0.80%, 0.75%, 0.65%, 0.55%, 0.70%, 0.90%, 1.00%, 1.00% and 0.50% of the Fund’s average daily net
| | | | | | | | | | | | | | | | |
| DIAMOND HILL FUNDS | | | | | ANNUAL REPORT | | | | | DECEMBER 31, 2014 | | | | | DIAMOND-HILL.COM | | | 93 | |
Diamond Hill Funds
Notes to Financial Statements (Continued)
December 31, 2014
assets, respectively. The advisory agreements are subject to annual approval by the Board of Trustees. In addition, each Fund entered into an administrative services agreement whereby DHCM is paid a fee at an annual rate of 0.24% for Class A Shares, Class C Shares and Class I Shares and 0.10% for Class Y shares of each class’ average daily net assets. Prior to January 1, 2015, the fees paid by Class A Shares, Class C Shares and Class I Shares under the administrative services agreement was 0.25% of each class’ average daily net assets. These administrative fees are used to pay most of the Funds’ operating expenses except advisory fees, distribution fees, custody fees, brokerage fees, taxes, interest and dividend expense on securities sold short and extraordinary expenses.
Pursuant to Rule 12b-1 under the 1940 Act, the Trust has adopted a distribution plan on behalf of each Fund’s Class A and Class C Shares (the “Plan”). Under the Plan, Class A shares pay a distribution fee at an annual rate of 0.25% of Class A average daily net assets. Class C shares pay distribution and shareholder-servicing fees at an annual rate of 0.75% and 0.25%, respectively, of Class C’s average daily net assets. Class I and Class Y shares are not subject to any distribution or shareholder-servicing fees. The Trust entered into a Distribution Agreement on behalf of the Funds with BHIL Distributors, Inc. (“Distributor”), an affiliate of DHCM. Pursuant to the Distribution Agreement, the Distributor acts as principal underwriter of each Fund’s shares.
For year ended December 31, 2014, the Distributor retained the following amounts in sales commissions from the sales of Class A shares of the Funds as follows:
| | | | |
Small Cap Fund | | $ | 22,842 | |
Small-Mid Cap Fund | | | 14,042 | |
Large Cap Fund | | | 52,407 | |
Select Fund | | | 4,486 | |
Long-Short Fund | | | 77,386 | |
Research Opportunities Fund | | | 358 | |
Financial Long-Short Fund | | | 276 | |
Strategic Income Fund | | | 2,686 | |
DHCM, as the financing agent for Class C shares, received contingent deferred sales charges relating to the redemptions of Class C shares of the Funds for the year ended December 31, 2014 as follows:
| | | | |
Small Cap Fund | | $ | 4,703 | |
Small-Mid Cap Fund | | | 744 | |
Large Cap Fund | | | 3,002 | |
Select Fund | | | 58 | |
Long-Short Fund | | | 3,690 | |
Research Opportunities Fund | | | 71 | |
Financial Long-Short Fund | | | 257 | |
Strategic Income Fund | | | 1,947 | |
| | | | | | | | | | | | | | |
| 94 | | DIAMOND HILL FUNDS | | | | | ANNUAL REPORT | | | | | DECEMBER 31, 2014 | | | | | DIAMOND-HILL.COM |
Diamond Hill Funds
Notes to Financial Statements (Continued)
December 31, 2014
Certain Officers of the Trust are affiliated with DHCM or the Distributor. Such Officers receive no compensation from the Funds for serving in their respective roles.
Trustee Fees
The Independent Trustees are compensated for their services to the Funds by DHCM as part of the administration services agreement. Collectively, the Independent Trustees were paid $254,500 in fees during the year ended December 31, 2014.
Commitments and Contingencies
The Funds indemnify the Trust’s Officers and Trustees for certain liabilities that might arise from their performance of their duties to the Funds. Additionally, in the normal course of business, the Funds enter into contracts that contain a variety of representations and warranties and which provide general indemnifications. The Funds’ maximum exposure under these arrangements is unknown, as this would involve future claims that may be made against the Funds that have not yet occurred. However, based on experience, the Funds expect the risk of loss to be remote.
Federal Tax Information
The amount and character of income and capital gain distributions paid by the Funds are determined in accordance with Federal income tax regulations which may differ from GAAP. The tax character of distributions paid may differ from the character of distributions shown on the Statements of Changes in Net Assets, as items such as short-term capital gains are treated as ordinary income for tax purposes.
The tax character of distributions paid during 2014 was as follows:
| | | | | | | | | | | | | | | | | | | | |
| | | Small Cap
Fund | | | Small-Mid
Cap Fund | | | Mid Cap
Fund | | | Large Cap
Fund | | | Select
Fund | |
Distributions paid from: | | | | | | | | | | | | | | | | | | | | |
Ordinary income | | $ | 3,245,857 | | | $ | 3,901,585 | | | $ | 106,875 | | | $ | 45,353,389 | | | $ | 1,999,961 | |
Long-term capital gains | | | 64,648,041 | | | | 20,435,261 | | | | — | | | | 90,999,684 | | | | 5,683,388 | |
| | | | | | | | | | | | | | | | | | | | |
Total distributions | | $ | 67,893,898 | | | $ | 24,336,846 | | | $ | 106,875 | | | $ | 136,353,073 | | | $ | 7,683,349 | |
| | | | | | | | | | | | | | | | | | | | |
| | | | | |
| | | | | | Long-Short
Fund | | | Research
Opportunities
Fund | | | Financial
Long-Short
Fund | | | Strategic
Income
Fund | |
Distributions paid from: | | | | | | | | | | | | | | | | | | | | |
Ordinary income | | | | | | $ | — | | | $ | 1,387,607 | | | $ | 42,765 | | | $ | 9,635,283 | |
Long-term capital gains | | | | | | | — | | | | 4,560,615 | | | | — | | | | — | |
| | | | | | | | | | | | | | | | | | | | |
Total distributions | | | | | | $ | — | | | $ | 5,948,222 | | | $ | 42,765 | | | $ | 9,635,283 | |
| | | | | | | | | | | | | | | | | | | | |
| | | | | | | | | | | | | | | | |
| DIAMOND HILL FUNDS | | | | | ANNUAL REPORT | | | | | DECEMBER 31, 2014 | | | | | DIAMOND-HILL.COM | | | 95 | |
Diamond Hill Funds
Notes to Financial Statements (Continued)
December 31, 2014
The following information is computed on a tax basis for each item as of December 31, 2014:
| | | | | | | | | | | | | | | | | | | | |
| | | Small Cap
Fund | | | Small-Mid
Cap Fund | | | Mid Cap
Fund | | | Large Cap
Fund | | | Select
Fund | |
Net unrealized appreciation on portfolio investments | | $ | 337,338,082 | | | $ | 73,145,428 | | | $ | 896,761 | | | $ | 858,629,594 | | | $ | 11,034,106 | |
Undistributed ordinary income | | | 2,400,195 | | | | — | | | | — | | | | — | | | | 398,855 | |
Undistributed capital gains | | | 2,811,559 | | | | 2,107,452 | | | | — | | | | 38,107,839 | | | | 326,740 | |
Capital loss carryforwards | | | — | | | | — | | | | (62,720 | ) | | | — | | | | — | |
| | | | | | | | | | | | | | | | | | | | |
Accumulated earnings | | $ | 342,549,836 | | | $ | 75,252,880 | | | $ | 834,041 | | | $ | 896,737,433 | | | $ | 11,759,701 | |
| | | | | | | | | | | | | | | | | | | | |
| | | | | | | | | | | | | | | | |
| | | Long-Short
Fund | | | Research
Opportunities
Fund | | | Financial
Long-Short
Fund | | | Strategic
Income
Fund | |
Net unrealized appreciation (depreciation) on portfolio investments | | $ | 707,939,802 | | | $ | 9,047,195 | | | $ | 5,253,087 | | | $ | (4,338,747 | ) |
Undistributed ordinary income | | | — | | | | 8,631 | | | | 19,196 | | | | 685,734 | |
Undistributed capital gains | | | — | | | | 1,016,805 | | | | — | | | | — | |
Capital loss carryforwards | | | (118,576,181 | ) | | | — | | | | (9,084,715 | ) | | | (11,474,175 | ) |
| | | | | | | | | | | | | | | | |
Accumulated earnings (deficit) | | $ | 589,363,621 | | | $ | 10,072,631 | | | $ | (3,812,432 | ) | | $ | (15,127,188 | ) |
| | | | | | | | | | | | | | | | |
As of December 31, 2014, the Funds’ federal tax cost of investment securities and net unrealized appreciation (depreciation) were as follows:
| | | | | | | | | | | | | | | | | | | | |
| | | Small Cap
Fund | | | Small-Mid
Cap Fund | | | Mid Cap
Fund | | | Large Cap
Fund | | | Select
Fund | |
Tax cost of portfolio investments | | $ | 1,174,894,157 | | | $ | 651,792,707 | | | $ | 20,098,034 | | | $ | 2,449,675,706 | | | $ | 58,058,550 | |
| | | | | | | | | | | | | | | | | | | | |
Gross unrealized appreciation | | | 373,619,830 | | | | 85,039,899 | | | | 1,464,290 | | | | 874,478,792 | | | | 11,395,339 | |
Gross unrealized depreciation | | | (36,281,748 | ) | | | (11,894,471 | ) | | | (567,529 | ) | | | (15,849,198 | ) | | | (361,233 | ) |
| | | | | | | | | | | | | | | | | | | | |
Net unrealized appreciation on portfolio investments | | $ | 337,338,082 | | | $ | 73,145,428 | | | $ | 896,761 | | | $ | 858,629,594 | | | $ | 11,034,106 | |
| | | | | | | | | | | | | | | | | | | | |
| | | | | | | | | | | | | | |
| 96 | | DIAMOND HILL FUNDS | | | | | ANNUAL REPORT | | | | | DECEMBER 31, 2014 | | | | | DIAMOND-HILL.COM |
Diamond Hill Funds
Notes to Financial Statements (Continued)
December 31, 2014
| | | | | | | | | | | | | | | | |
| | | Long-Short
Fund | | | Research
Opportunities
Fund | | | Financial
Long-Short
Fund | | | Strategic
Income
Fund | |
Tax cost of long portfolio investments | | $ | 2,972,611,543 | | | $ | 87,004,396 | | | $ | 32,110,852 | | | $ | 253,280,257 | |
| | | | | | | | | | | | | | | | |
Gross unrealized appreciation | | | 910,333,388 | | | | 12,351,718 | | | | 5,850,973 | | | | 2,259,523 | |
Gross unrealized depreciation | | | (9,809,134 | ) | | | (2,072,631 | ) | | | (269,250 | ) | | | (6,598,270 | ) |
| | | | | | | | | | | | | | | | |
Net unrealized appreciation (depreciation) on long portfolio investments | | $ | 900,524,254 | | | $ | 10,279,087 | | | $ | 5,581,723 | | | $ | (4,338,747 | ) |
| | | | | | | | | | | | | | | | |
The difference between book basis and tax basis net unrealized appreciation (depreciation) is attributable primarily to the tax deferral of losses on wash sales.
As of the latest tax year ended December 31, 2014, the following Funds have capital loss carry forwards (“CLCFs”) as summarized in the tables below. CLCFs subject to expiration are applied as short-term capital loss regardless of whether the originating capital loss was short-term or long-term. CLCFs that are not subject to expiration must be utilized before those that are subject to expire. The Mid Cap Fund has a short-term CLCF of $62,720 that is not subject to expiration.
CLCFs subject to expiration:
| | | | | | | | |
| | | Amount | | | Expires
December 31, | |
Long-Short Fund | | $ | 49,399,084 | | | | 2017 | |
| | | 69,177,097 | | | | 2018 | |
| | | | | | | | |
| | $ | 118,576,181 | | | | | |
| | | | | | | | |
Financial Long-Short Fund | | $ | 2,544,587 | | | | 2016 | |
| | | 6,540,128 | | | | 2017 | |
| | | | | | | | |
| | $ | 9,084,715 | | | | | |
| | | | | | | | |
Strategic Income Fund | | $ | 6,202,321 | | | | 2016 | |
| | | 5,271,854 | | | | 2017 | |
| | | | | | | | |
| | $ | 11,474,175 | | | | | |
| | | | | | | | |
As of the latest tax year ended December 31, 2014, Long-Short Fund, Financial Long-Short Fund and Strategic Income Fund utilized $186,138,457, $1,751,815 and $2,971,654, respectively, of CLCFs.
Reclassification of capital accounts — Reclassifications result primarily from the difference in the tax treatment of net investment losses, distributions in excess of net investment income, equalization, investments in REITS and publicly traded partnerships. The
| | | | | | | | | | | | | | | | |
| DIAMOND HILL FUNDS | | | | | ANNUAL REPORT | | | | | DECEMBER 31, 2014 | | | | | DIAMOND-HILL.COM | | | 97 | |
Diamond Hill Funds
Notes to Financial Statements (Continued)
December 31, 2014
following reclassifications have no impact on the net assets or net asset value per share of the Funds and are designed to present the Funds’ capital accounts on a tax basis:
| | | | | | | | | | | | |
| | | Paid-In
Capital | | | Undistributed
Net Investment
Income (Loss) | | | Accumulated
Net Realized
Gains
(Losses) | |
Small Cap Fund | | $ | 9,673,173 | | | $ | 745,403 | | | $ | (10,418,576 | ) |
Small-Mid Cap Fund | | | 3,066,502 | | | | (611,689 | ) | | | (2,454,813 | ) |
Mid Cap Fund | | | (630 | ) | | | 630 | | | | — | |
Large Cap Fund | | | 11,811,670 | | | | (3,360,103 | ) | | | (8,451,567 | ) |
Select Fund | | | 7,134,219 | | | | — | | | | (7,134,219 | ) |
Long-Short Fund | | | (6,184,694 | ) | | | 6,184,693 | | | | 1 | |
Research Opportunities Fund | | | 297,895 | | | | (110,742 | ) | | | (187,153 | ) |
Financial Long-Short Fund | | | (14,775 | ) | | | 14,774 | | | | 1 | |
Strategic Income Fund | | | — | | | | 1 | | | | (1 | ) |
In-kind Redemption Transactions
For the year ended December 31, 2014, the Select Fund delivered securities in lieu of cash for two shareholder redemptions. The value of the redemptions were as follows:
| | | | | | | | | | | | | | | | | | | | |
| Date | | Redemption | | | Securities | | | Cash | | | Realized
Gains | | | Class I
Shares
Redeemed | |
| June 9, 2014 | | $ | 10,145,012 | | | $ | 9,554,431 | | | $ | 590,581 | | | $ | 2,675,416 | | | | 735,364 | |
December 29,
2014 | | | 13,073,368 | | | | 12,555,140 | | | | 518,228 | | | | 3,726,909 | | | | 995,694 | |
Subsequent Events
The Funds evaluated events from December 31, 2014 through the date that these financial statements were issued. There were no subsequent events to report that would have a material impact on the Funds’ financial statements, other than disclosed below.
Effective February 28, 2015, the management fee of the Strategic Income Fund will decrease from 0.50% to 0.45%.
| | | | | | | | | | | | | | |
| 98 | | DIAMOND HILL FUNDS | | | | | ANNUAL REPORT | | | | | DECEMBER 31, 2014 | | | | | DIAMOND-HILL.COM |
Report of Independent Registered Public Accounting Firm
The Board of Trustees and Shareholders
of Diamond Hill Funds:
We have audited the accompanying statements of assets and liabilities, including the schedules of investments, of Diamond Hill Funds (comprising, respectively, the Diamond Hill Small Cap Fund, Diamond Hill Small-Mid Cap Fund, Diamond Hill Mid Cap Fund, Diamond Hill Large Cap Fund, Diamond Hill Select Fund, Diamond Hill Long-Short Fund, Diamond Hill Research Opportunities Fund, Diamond Hill Financial Long-Short Fund, and Diamond Hill Strategic Income Fund) (collectively, the “Funds”) as of December 31, 2014, and the related statements of operations for the year then ended, and the statements of changes in net assets and the financial highlights for the periods indicated therein. These financial statements and financial highlights are the responsibility of the Funds’ management. Our responsibility is to express an opinion on these financial statements and financial highlights based on our audits.
We conducted our audits in accordance with the standards of the Public Company Accounting Oversight Board (United States). Those standards require that we plan and perform the audit to obtain reasonable assurance about whether the financial statements and financial highlights are free of material misstatement. We were not engaged to perform an audit of the Funds’ internal control over financial reporting. Our audits included consideration of internal control over financial reporting as a basis for designing audit procedures that are appropriate in the circumstances, but not for the purpose of expressing an opinion on the effectiveness of the Funds’ internal control over financial reporting. Accordingly, we express no such opinion. An audit also includes examining, on a test basis, evidence supporting the amounts and disclosures in the financial statements and financial highlights, assessing the accounting principles used and significant estimates made by management, and evaluating the overall financial statement presentation. Our procedures included confirmation of securities owned as of December 31, 2014, by correspondence with the custodian and brokers or by other appropriate auditing procedures where replies from brokers were not received. We believe that our audits provide a reasonable basis for our opinion.
In our opinion, the financial statements and financial highlights referred to above present fairly, in all material respects, the financial position of each of the respective funds constituting the Diamond Hill Funds at December 31, 2014, the results of their operations for the year then ended, and the changes in their net assets and the financial highlights for each of the periods indicated therein, in conformity with U.S. generally accepted accounting principles.

Cincinnati, Ohio
February 24, 2015
| | | | | | | | | | | | | | | | |
| DIAMOND HILL FUNDS | | | | | ANNUAL REPORT | | | | | DECEMBER 31, 2014 | | | | | DIAMOND-HILL.COM | | | 99 | |
Diamond Hill Funds
Other Items
December 31, 2014 (Unaudited)
Proxy Voting
The investment adviser is responsible for exercising the voting rights associated with the securities purchased and held by the Funds. A description of the policies and procedures that the advisor uses in fulfilling this responsibility and information regarding how those proxies were voted during the twelve month period ended June 30 are available without charge upon request by calling toll free 1-888-226-5595 or on the Securities and Exchange Commission’s website at www.sec.gov.
Portfolio Disclosure
The Trust files a complete listing of portfolio holdings for each Fund as of the end of the first and third quarters of each fiscal year on Form N-Q and each second and fourth quarters of each fiscal year on Form N-CSR. The complete listing (i) is available on the Commission’s website; (ii) may be reviewed and copied at the Commission’s Public Reference Room in Washington, DC; and (iii) will be made available to shareholders upon request by calling 1-888-226-5595. Information on the operation of the Public Reference Room may be obtained by calling 1-800-SEC-0330. Monthly portfolio holdings are also available on www.diamond-hill.com.
Dividends Received Deduction
For corporate shareholders, the following ordinary dividends paid during the year ended December 31, 2014 qualify for the corporate dividends received deduction:
| | | | |
Small Cap Fund | | | 100.00 | % |
Small-Mid Cap Fund | | | 93.44 | % |
Mid Cap Fund | | | 100.00 | % |
Large Cap Fund | | | 100.00 | % |
Select Fund | | | 38.61 | % |
Research Opportunities Fund | | | 27.80 | % |
Financial Long-Short Fund | | | 100.00 | % |
Qualified Dividend Income
The Funds designated the maximum amount allowable of their net taxable income as qualified dividend income as provided in the Jobs and Growth Tax Relief Reconciliation Act of 2003. This amount was reflected on Form 1099-DIV for the calendar year 2014.
| | | | | | | | | | | | | | |
| 100 | | DIAMOND HILL FUNDS | | | | | ANNUAL REPORT | | | | | DECEMBER 31, 2014 | | | | | DIAMOND-HILL.COM |
Diamond Hill Funds
Other Items
December 31, 2014 (Unaudited) (Continued)
Capital Gain Distribution
For the year ended December 31, 2014, the following Funds designated long-term capital gain distributions:
| | | | |
Small Cap Fund | | $ | 74,321,215 | |
Small-Mid Cap Fund | | | 23,501,763 | |
Large Cap Fund | | | 102,811,352 | |
Select Fund | | | 6,587,234 | |
Research Opportunities Fund | | | 4,858,509 | |
Trustee Approval of Investment Advisory Agreements
The Trustees of Diamond Hill Funds (the “Trust”), considered a broad range of information specifically requested and relating to its consideration of the continuance of the investment advisory agreement at a regularly scheduled meeting on August 21, 2014. By a unanimous vote, the Trustees approved the Management Agreement between the Trust and Diamond Hill Capital Management, Inc. (the “Adviser”), for each series of the Trust (each separately, a “Fund”), with the exception of the Mid Cap Fund, which commenced operations in 2014. The Management Agreement between the Trust and the Adviser for the Mid Cap Fund was approved on November 21, 2013 and will be considered for renewal in 2015. The following disclosure encompasses the discussion at the August 21, 2014 meeting. The Trustees discussed the following factors, on a Fund-by-Fund basis, in connection with the Trust’s Management Agreement (“investment advisory agreement”):
| a) | Nature, Extent and Quality of Services. The Trustees considered the nature, extent and quality of the services provided by the Adviser under the investment advisory agreement, including a review of the services provided thereunder, the fee rates, fees paid, expenses assumed. They also considered the Adviser’s overall reputation, integrity and commitment to providing high quality service to the Funds. The Trustees noted the qualifications of the investment staff and that the Adviser continued to invest significant resources in its investment team, by growing its research team to 27 associates to help enhance the delivery of portfolio management services to the Funds. In addition, the Trustees reviewed information related to the compensation structure for portfolio managers and other key investment personnel. |
| | In evaluating the performance of each Fund, the Trustees reviewed each Fund’s absolute performance, relative to its passive benchmark, and performance relative to its peer group as of June 30, 2014, noting that for the five year trailing performance, three of the seven Funds beat their benchmark and that five Funds ranked in the 1st or 2nd quartile of their respective peer group and two ranked in the 3rd quartile. The Research Opportunities Fund underperformed its benchmark by 1.52% for the trailing three year performance history. The Trustees also reviewed and considered trailing five year investment results as of each previous calendar year end noting that in general each fund |
| | | | | | | | | | | | | | | | |
| DIAMOND HILL FUNDS | | | | | ANNUAL REPORT | | | | | DECEMBER 31, 2014 | | | | | DIAMOND-HILL.COM | | | 101 | |
Diamond Hill Funds
Other Items
December 31, 2014 (Unaudited) (Continued)
| | has achieved adequate returns over the various five year periods. In addition, the Trustees discussed the methodology for selecting funds to be included in each Fund’s respective peer group and the appropriateness of the benchmarks against with fund performance is measured. |
| b) | Reasonableness of Investment Advisory Fees. The Trustees noted that the contractual fee rates under the investment advisory agreement were below the average rates of comparable funds within each Fund’s respective peer group. |
| c) | Reasonableness of Total Expenses. The Trustees noted that the total expenses of each class of shares of each of the Funds were generally below the average total expenses of comparable funds within each Fund’s respective peer group. |
| d) | Reasonableness of Investment Advisory Fees as Compared to Fees Charged to Other Clients. The Trustees reviewed the fees paid by each of the Adviser’s other clients, as well as a summary of the differences in services provided. With limited exceptions, investment advisory fees charged by the Adviser to the Funds were comparable to the investment advisory fees the Adviser charges to its other similarly managed accounts (i.e. private partnerships and separate accounts). |
| e) | Profitability. The Trustees noted the reasonableness of each Fund’s profitability to the Adviser, including the Adviser’s methodology for calculating its profitability. The Trustees noted that the Adviser also is the administrator to the Funds (under the Administration Agreement) and the Trustees reviewed a separate profitability analysis relating to the administrative services provided to the Funds. The Trustees concluded that the Adviser’s pre-tax profit margin under the Management and the Administration Agreement represented a fair and entrepreneurial profit for managing the Funds. |
| f) | Economies of Scale. The Trustees reviewed the potential extent to which economies of scale would be realized as each Fund grows and whether fee levels reflect these economies of scale for the benefit of fund shareholders. They noted that while many advisory firms reduce fees as assets under management increase with predetermined break points, the Adviser has adopted a different strategy. The Trustees considered that rather than instituting break points, the Adviser has targeted its advisory fees to correspond to its mission to add value, meaning that rather than charging a lower fee on assets above a certain level, the Adviser prefers to close a strategy to new investors so that it can efficiently manage the fund’s assets and attempt to fulfill its responsibility to add value to existing investors accounts. The Trustees also noted that the Adviser has a history of voluntarily reducing its fees under the Administration Agreement when asset growth allows for the sharing of economies of scale. |
| g) | Ancillary Benefits. The Trustees considered ancillary benefits received by the Adviser as a result of its relationship with the Funds, including the ability to negotiate favorable commissions rates and have access to research that benefits all of the Adviser’s clients |
| | | | | | | | | | | | | | |
| 102 | | DIAMOND HILL FUNDS | | | | | ANNUAL REPORT | | | | | DECEMBER 31, 2014 | | | | | DIAMOND-HILL.COM |
Diamond Hill Funds
Other Items
December 31, 2014 (Unaudited) (Continued)
| | and the ability to serve as sub-adviser to other mutual funds . The Trustees noted that the Adviser is the Administrator to the Funds (under the Administration Agreement) and is expected to earn fees from the Funds for providing administrative services. The fees were shown separately in the profitability analysis presented to the Trustees. The Trustees noted that affiliates of the Adviser also have the ability to leverage these administrative services to other non-affiliated funds. The Trustees also considered revenue and expenses of the Administrator for providing financing arrangements related to the payment of commissions to financial intermediaries for the sale of C Shares of the Funds. |
In their deliberations, there was a comprehensive consideration of each of the factors above in connection with each Fund, and the Trustees, all of whom qualify as Independent Trustees under the 1940 Act, concluded the compensation to be received by the Adviser from each Fund was fair and reasonable and the continuance of the agreements was in the best interests of each Fund and its shareholders.
| | | | | | | | | | | | | | | | |
| DIAMOND HILL FUNDS | | | | | ANNUAL REPORT | | | | | DECEMBER 31, 2014 | | | | | DIAMOND-HILL.COM | | | 103 | |
Diamond Hill Funds
Schedule of Shareholder Expenses
Hypothetical Example of a $1,000 Investment at Beginning of Period
(Unaudited)
As a Fund shareholder, you may incur two types of costs: (1) transaction costs, including wire redemption fees and sales charges (loads) as applicable; and (2) ongoing costs, including management fees; distribution and service (12b-1) fees; and other Fund expenses. These examples are intended to help you understand your ongoing costs (in dollars) of investing in a Fund and to compare these costs with the ongoing costs of investing in other mutual funds. Please note that the expenses shown in the tables are meant to highlight your ongoing costs only and do not reflect any transactional costs or other fees that may apply, such as fees for low balance accounts. Therefore, the examples are useful in comparing ongoing costs only and will not help you determine the relative total cost of owning different funds. In addition, if these transactional costs and other fees were included, your costs would have been higher.
These examples are based on an investment of $1,000 invested at July 1, 2014 and held for the entire period from July 1, 2014 through December 31, 2014.
The Actual Expense example below provides information about actual account values and actual expenses. You may use this information, together with the amount you invested, to estimate the expenses that you paid over the period. Simply divide your account value by $1,000 (for example, an $8,600 account value divided by $1,000 = 8.6), then multiply the result by the number in the table under the heading entitled “Expenses paid during the period” to estimate the expenses you paid on your account during this period.
The Hypothetical Expense example below provides information about hypothetical account values and hypothetical expenses based on each Fund’s actual expense ratio and an assumed rate of return of 5% per year before expenses, which is not each Fund’s actual return. The hypothetical account values and expenses may not be used to estimate the actual ending account balance or expenses you paid for the period. You may use this information to compare the ongoing costs of investing in this Fund and other funds. To do so, compare this 5% hypothetical example with the 5% hypothetical examples that appear in the shareholder reports of the other funds.
| | | | | | | | | | | | | | | | | | | | | | | | | | | | |
| | | Account value
at the beginning
of the period ($) | | | Account value
at the end
of the period ($) | | | Expenses paid
during
the period ($)* | | | Funds
annualized
expense
ratio (%) | |
| | | Actual | | | Hypothetical | | | Actual | | | Hypothetical | | | Actual | | | Hypothetical | | | Actual | |
Small Cap Fund | |
Class A | | | 1,000.00 | | | | 1,000.00 | | | | 967.10 | | | | 1,018.65 | | | | 6.45 | | | | 6.61 | | | | 1.30 | |
Class C | | | 1,000.00 | | | | 1,000.00 | | | | 963.60 | | | | 1,014.87 | | | | 10.15 | | | | 10.41 | | | | 2.05 | |
Class I | | | 1,000.00 | | | | 1,000.00 | | | | 968.20 | | | | 1,019.91 | | | | 5.21 | | | | 5.35 | | | | 1.05 | |
Class Y | | | 1,000.00 | | | | 1,000.00 | | | | 969.10 | | | | 1,020.67 | | | | 4.47 | | | | 4.58 | | | | 0.90 | |
Small-Mid Cap Fund | |
Class A | | | 1,000.00 | | | | 1,000.00 | | | | 996.90 | | | | 1,018.90 | | | | 6.29 | | | | 6.36 | | | | 1.25 | |
Class C | | | 1,000.00 | | | | 1,000.00 | | | | 993.00 | | | | 1,015.12 | | | | 10.05 | | | | 10.16 | | | | 2.00 | |
Class I | | | 1,000.00 | | | | 1,000.00 | | | | 997.70 | | | | 1,020.16 | | | | 5.04 | | | | 5.09 | | | | 1.00 | |
Class Y | | | 1,000.00 | | | | 1,000.00 | | | | 998.90 | | | | 1,020.92 | | | | 4.28 | | | | 4.33 | | | | 0.85 | |
| | | | | | | | | | | | | | |
| 104 | | DIAMOND HILL FUNDS | | | | | ANNUAL REPORT | | | | | DECEMBER 31, 2014 | | | | | DIAMOND-HILL.COM |
Diamond Hill Funds
Schedule of Shareholder Expenses
Hypothetical Example of a $1,000 Investment at Beginning of Period
(Unaudited) (Continued)
| | | | | | | | | | | | | | | | | | | | | | | | | | | | |
| | | Account value
at the beginning
of the period ($) | | | Account value
at the end
of the period ($) | | | Expenses paid
during
the period ($)* | | | Funds
annualized
expense
ratio (%) | |
| | | Actual | | | Hypothetical | | | Actual | | | Hypothetical | | | Actual | | | Hypothetical | | | Actual | |
Mid Cap Fund Class | |
Class A | | | 1,000.00 | | | | 1,000.00 | | | | 1,003.50 | | | | 1,019.41 | | | | 5.81 | | | | 5.85 | | | | 1.15 | |
Class C | | | 1,000.00 | | | | 1,000.00 | | | | 999.10 | | | | 1,015.63 | | | | 9.57 | | | | 9.65 | | | | 1.90 | |
Class I | | | 1,000.00 | | | | 1,000.00 | | | | 1,004.80 | | | | 1,020.67 | | | | 4.55 | | | | 4.58 | | | | 0.90 | |
Class Y | | | 1,000.00 | | | | 1,000.00 | | | | 1,004.80 | | | | 1,021.42 | | | | 3.79 | | | | 3.82 | | | | 0.75 | |
Large Cap Fund | |
Class A | | | 1,000.00 | | | | 1,000.00 | | | | 1,043.10 | | | | 1,019.91 | | | | 5.41 | | | | 5.35 | | | | 1.05 | |
Class C | | | 1,000.00 | | | | 1,000.00 | | | | 1,039.30 | | | | 1,016.13 | | | | 9.25 | | | | 9.15 | | | | 1.80 | |
Class I | | | 1,000.00 | | | | 1,000.00 | | | | 1,044.50 | | | | 1,021.17 | | | | 4.12 | | | | 4.08 | | | | 0.80 | |
Class Y | | | 1,000.00 | | | | 1,000.00 | | | | 1,045.50 | | | | 1,021.93 | | | | 3.35 | | | | 3.31 | | | | 0.65 | |
Select Fund | |
Class A | | | 1,000.00 | | | | 1,000.00 | | | | 1,042.40 | | | | 1,019.16 | | | | 6.18 | | | | 6.11 | | | | 1.20 | |
Class C | | | 1,000.00 | | | | 1,000.00 | | | | 1,039.00 | | | | 1,015.38 | | | | 10.02 | | | | 9.91 | | | | 1.95 | |
Class I | | | 1,000.00 | | | | 1,000.00 | | | | 1,043.30 | | | | 1,020.42 | | | | 4.89 | | | | 4.84 | | | | 0.95 | |
Class Y | | | 1,000.00 | | | | 1,000.00 | | | | 1,045.00 | | | | 1,021.17 | | | | 4.12 | | | | 4.08 | | | | 0.80 | |
Long-Short Fund | |
Class A | | | 1,000.00 | | | | 1,000.00 | | | | 1,014.90 | | | | 1,015.98 | | | | 9.29 | | | | 9.30 | | | | 1.83 | |
Class C | | | 1,000.00 | | | | 1,000.00 | | | | 1,011.00 | | | | 1,012.20 | | | | 13.08 | | | | 13.09 | | | | 2.58 | |
Class I | | | 1,000.00 | | | | 1,000.00 | | | | 1,016.40 | | | | 1,017.24 | | | | 8.03 | | | | 8.03 | | | | 1.58 | |
Class Y | | | 1,000.00 | | | | 1,000.00 | | | | 1,016.80 | | | | 1,018.00 | | | | 7.27 | | | | 7.27 | | | | 1.43 | |
Research Opportunities Fund | |
Class A | | | 1,000.00 | | | | 1,000.00 | | | | 1,016.20 | | | | 1,016.43 | | | | 8.84 | | | | 8.84 | | | | 1.74 | |
Class C | | | 1,000.00 | | | | 1,000.00 | | | | 1,012.60 | | | | 1,012.65 | | | | 12.63 | | | | 12.63 | | | | 2.49 | |
Class I | | | 1,000.00 | | | | 1,000.00 | | | | 1,017.40 | | | | 1,017.69 | | | | 7.58 | | | | 7.58 | | | | 1.49 | |
Class Y | | | 1,000.00 | | | | 1,000.00 | | | | 1,018.20 | | | | 1,018.45 | | | | 6.82 | | | | 6.82 | | | | 1.34 | |
Financial Long-Short Fund | |
Class A | | | 1,000.00 | | | | 1,000.00 | | | | 1,044.20 | | | | 1,016.43 | | | | 8.97 | | | | 8.84 | | | | 1.74 | |
Class C | | | 1,000.00 | | | | 1,000.00 | | | | 1,039.90 | | | | 1,012.65 | | | | 12.80 | | | | 12.63 | | | | 2.49 | |
Class I | | | 1,000.00 | | | | 1,000.00 | | | | 1,045.00 | | | | 1,017.69 | | | | 7.68 | | | | 7.58 | | | | 1.49 | |
Strategic Income Fund | |
Class A | | | 1,000.00 | | | | 1,000.00 | | | | 993.90 | | | | 1,020.16 | | | | 5.03 | | | | 5.09 | | | | 1.00 | |
Class C | | | 1,000.00 | | | | 1,000.00 | | | | 990.30 | | | | 1,016.38 | | | | 8.78 | | | | 8.89 | | | | 1.75 | |
Class I | | | 1,000.00 | | | | 1,000.00 | | | | 995.50 | | | | 1,021.42 | | | | 3.77 | | | | 3.82 | | | | 0.75 | |
Class Y | | | 1,000.00 | | | | 1,000.00 | | | | 996.10 | | | | 1,022.18 | | | | 3.02 | | | | 3.06 | | | | 0.60 | |
| * | Expenses are equal to the Fund’s annualized expense ratio, multiplied by the average account value over the period, multiplied by the number of days in the most recent fiscal half-year divided by the number of days in the fiscal year (to reflect the one-half year period). |
You can find more information about the Fund’s expenses, including annual expense ratios for historical periods in the Financial Statements section of this report. For additional information on operating expenses and other shareholder costs, please refer to the Fund’s prospectus. The prospectus presents hypothetical shareholder costs over various time periods based upon a $10,000 investment and a return of 5% a year. The standardized example, which appears in all mutual fund prospectuses, may be useful to you in comparing the costs of investing in different funds.
| | | | | | | | | | | | | | | | |
| DIAMOND HILL FUNDS | | | | | ANNUAL REPORT | | | | | DECEMBER 31, 2014 | | | | | DIAMOND-HILL.COM | | | 105 | |
Diamond Hill Funds
Management of the Trust (unaudited)
Listed in the charts below is basic information regarding the Trustees and Officers of the Trust.
INDEPENDENT TRUSTEES:
| | | | | | | | | | |
Name/Address/1
Age | | Position(s)
Held with
Trust | | Term of Office2 and Length of Time Served | | Principal Occupation(s) At Least The Last 5 Years | | Number of
Portfolios
in Fund
Complex
Overseen
by Trustee | | Other
Directorships
Held by
Trustee |
| | | | | |
Tamara L. Fagely
Year of Birth: 1958 | | Trustee | | Since November 2014 | | Retired, January 2014 to present; Chief Operations Officer, Hartford Funds, 2012 to 2013; Chief Financial Officer, Hartford Funds, 2010 to 2012; Treasurer, Hartford Funds, 2001 to 2012. | | 9 | | None |
| | | | | |
Elizabeth P. Kessler
Year of Birth: 1968 | | Trustee | | Since November 2005 | | Partner in Charge, Columbus Ohio Office, Jones Day, January 2009 to present; Partner, Jones Day from January 2003 to January 2009. | | 9 | | None |
| | | | | |
D’Ray Moore Rice
Year of Birth: 1959 | | Chairman Trustee | | Since February 2014 Since August 2007 | | Retired, Community Volunteer, November 2001 to present. Independent Trustee of Advisors Investment Trust, July 2011 to present. | | 9 | | Advisors Investment Trust, July 2011 to present |
| | | | | |
George A. Skestos
Year of Birth: 1968 | | Trustee | | Since August 2000 | | Managing Member, Arcadia Holdings, LLC (private investment banking firm), June 2000 to present. | | 9 | | None |
| | | | | |
Peter E. Sundman
Year of Birth: 1959 | | Trustee | | Since November 2012 | | Retired 2012 to present; Chief Executive Officer, ClearBridge Advisors, LLC, 2009 to 2011; Chairman and Chief Executive Officer, Neuberger Berman Funds, 1988 to 2008; President, Neuberger Berman Management, 1988 to 2008. | | 9 | | Neuberger Berman Funds, March
1999 to December 2008 |
| | | | | | | | | | | | | | |
| 106 | | DIAMOND HILL FUNDS | | | | | ANNUAL REPORT | | | | | DECEMBER 31, 2014 | | | | | DIAMOND-HILL.COM |
Diamond Hill Funds
PRINCIPAL OFFICERS:
| | | | | | |
Name/Address/1
Age | | Position(s)
Held with Trust | | Term of Office and
Length of Time Served2 | | Principal Occupation(s) At Least the Last 5 Years |
| | | |
Thomas E. Line
Year of Birth: 1967 | | Chief Executive Officer | | Since November 2014 | | Chief Financial Officer and Treasurer of Diamond Hill Investment Group, Inc., from January 2015 to present. Managing Director – Finance of Diamond Hill Investment Group, Inc., April 2014 to January 2015; Chief Operating Officer of Lancaster Pollard & Company, January 2012 to April 2014; Managing Director and Chief Financial Officer of Red Capital Group, October 2005 to January 2012. |
| | | |
Gary R. Young
Year of Birth: 1969 | | President | | Since November 2014 | | Secretary of the Trust, May 2004 to November 2014; Chief Administrative Officer of the Trust, October 2010 to November 2014; Controller of Diamond Hill Investment Group, Inc., April 2004 to present. Chief Compliance Officer of Diamond Hill Capital Management Inc., October 2010 to present. |
| | | |
Karen R. Colvin
Year of Birth: 1966 | | Vice President Secretary | | Since November 2011 Since November 2014 | | Director-Fund Administration & Sales Support, Diamond Hill Capital Management, Inc., June 2009 to present; Assistant Vice President, Nationwide Financial Services, Inc., September 2000 to June 2009. |
| | | |
Trent M. Statczar
Year of Birth: 1971 | | Treasurer | | Since October 2010 | | Director, Beacon Hill Fund Services, Inc., 2008 to present. |
| | | |
Eimile J. Moore
Year of Birth: 1969 | | Chief Compliance Officer | | Since May 2014 | | Director, Beacon Hill Fund Services, Inc., September 2011 to present; Vice President, JPMorgan Distribution Services, Inc., 2006 to 2011. |
| | | |
Dana A. Gentile
Year of Birth: 1962 | | Assistant Secretary | | Since May 2013 | | Director, Beacon Hill Fund Services, Inc., 2013 to present; Senior Vice President, Citi Fund Services Ohio, Inc., 1987 to 2013. |
| | | |
Lori K. Cramer
Year of Birth: 1967 | | Assistant Secretary | | Since May 2014 | | Director, Beacon Hill Fund Services, Inc., March 2014 to present; Paralegal, Nationwide Financial Services, Inc., 2002 to March 2014. |
| | | |
Troy A. Sheets
Year of Birth: 1971 | | Assistant Treasurer | | Since October 2010 | | Director, Beacon Hill Fund Services, Inc., 2009 to present; Senior Vice President, Citi Fund Services Ohio, Inc., from 2002 to 2009. |
| 1 | The address of each Trustee and Officer is 325 John H. McConnell Boulevard — Suite 200, Columbus, Ohio 43215. |
| 2 | Each Trustee is elected to serve in accordance with the Declaration of Trust and Bylaws of the Trust until their resignation, removal or retirement. Trustees have a 15-year term limit. Each Officer is elected by the Trustees for a 1-year term to serve the Trust or until their resignation, removal or retirement. |
The Statement of Additional Information contains additional information about the Trustees and is available without charge on www.diamond-hill.com or by calling 1-888-226-5595.
| | | | | | | | | | | | | | | | |
| DIAMOND HILL FUNDS | | | | | ANNUAL REPORT | | | | | DECEMBER 31, 2014 | | | | | DIAMOND-HILL.COM | | | 107 | |
NOTICE OF PRIVACY POLICY FOR DIAMOND HILL FUNDS
We value you as a shareholder and take your personal privacy seriously. In order to enhance our ability to provide you with the best service possible, Diamond Hill Funds (referred to as “we” or “us” or the “Funds”) collect, use and share certain information about you. This policy explains what information we collect and with whom we share it. The practices described in this policy are applicable to all customers, including prospective, current and former customers. The policy also explains how we protect the security and confidentiality of certain customer information.
SAFEGUARDING PRIVACY
Diamond Hill Funds maintain physical, electronic and procedural safeguards that comply with federal standards to ensure the safety of non-public personal customer information. In addition, we require service providers to the Funds to maintain policies and procedures designed to assure only appropriate access to, and use of, information about customers and to maintain physical, electronic and procedural safeguards that comply with federal standards to guard non-public personal customer information.
INFORMATION WE COLLECT AND SOURCES OF INFORMATION
We may collect information about our customers to help identify you, evaluate your application, service and manage your account and offer services and products you may find valuable. We collect this information from a variety of sources including:
| Ÿ | | Information we receive from you on applications or other forms, such as your name, address, date of birth, social security number and investment information; |
| Ÿ | | Information about your transactions and experiences with us, such as your account balance, transaction history and investment selections; and |
| Ÿ | | Information you supply in written, telephonic or electronic communications with the Funds or service providers to the Funds. |
INFORMATION WE SHARE
We may disclose all non-public personal information we collect, as described above, to companies that perform services on our behalf, including those that assist us in responding to inquiries, processing transactions, preparing and mailing account statements and other forms of shareholder services, provided they use the information solely for these purposes and they enter into a confidentiality agreement regarding the information. We also may disclose non-public personal information as otherwise permitted by law.
QUESTIONS?
Questions regarding this policy may be directed to: 888-226-5595
| | | | | | | | | | | | | | |
| 108 | | DIAMOND HILL FUNDS | | | | | ANNUAL REPORT | | | | | DECEMBER 31, 2014 | | | | | DIAMOND-HILL.COM |
INVESTMENT ADVISER: DIAMOND HILL CAPITAL MANAGEMENT, INC.
DISTRIBUTOR: BHIL DISTRIBUTORS, INC. (MEMBER FINRA), AN AFFILIATE OF THE DIAMOND HILL FUNDS
| | | | | | | | | | | | | | | | | | | | |
| DIAMOND-HILL.COM | | | | | 855.255.8955 | | | | | 325 JOHN H. MCCONNELL BLVD | | | | | SUITE 200 | | | | | COLUMBUS, OHIO | | | | | 43215 |
DH-AR123114
Item 2. Code of Ethics.
(a) The registrant has adopted a code of ethics that applies to the registrant’s principal executive officer, principal financial officer, principal accounting officer or controller, or persons performing similar functions. This code of ethics is included as an Exhibit.
(b) During the period covered by the report, with respect to the registrant’s code of ethics that applies to its principal executive officer, principal financial officer, principal accounting officer or controller, or persons performing similar functions; there have been no amendments to, nor any waivers granted from, a provision that relates to any element of the code of ethics definition enumerated in paragraph (b) of this Item 2.
Item 3. Audit Committee Financial Expert.
3(a)(1) The registrant’s board of directors has determined that the registrant has at least one audit committee financial expert serving on its audit committee.
3(a)(2) The audit committee financial expert is Ms. Tamara L. Fagely, who is “independent” for purposes of this Item 3 of Form N-CSR.
Item 4. Principal Accountant Fees and Services.
(a) Audit Fees. Audit fees totaled $145,900 and $141,600 in fiscal 2014 and 2013, respectively. 2014 and 2013 fees include fees associated with the annual audit and filings of the registrant’s Form N-1A and Form N-SAR.
(b) Audit-Related Fees. There were no audit-related fees in fiscal 2014 and 2013.
(c) Tax Fees. Fees for tax compliance services totaled $47,700 and $46,300 in fiscal 2014 and 2013, respectively.
(d) All Other Fees. There were no other fees in fiscal 2014 and 2013.
(e)(1) Audit Committee Pre-Approval Policies. The Audit Committee’s pre-approval policies describe the types of audit, audit-related, tax and other services that may receive the general pre-approval of the Audit Committee. The pre-approval policies provide that annual audit service fees, tax services not specifically granted pre-approval, services exceeding pre-approved cost levels and other services that have not received general pre-approval will be subject to specific pre-approval by the Audit Committee. The pre-approval policies further provide that the Committee may grant general pre-approval to other audit services (statutory audits and services associated with SEC registration statements, periodic reports and other documents filed with the SEC or other documents issued in connection with securities offerings), audit-related services (accounting consultations related to accounting, financial reporting or disclosure matters not classified as “audit services,” assistance with understanding and implementing new accounting and financial reporting guidance from rulemaking authorities, agreed-upon or expanded audit procedures related to accounting and/or billing records required to respond to or comply with financial, accounting or regulatory reporting matters and assistance with internal control reporting requirements under Form N-SAR and Form N-CSR), tax services that have historically been provided by the auditor that the Committee believes would not impair the independence of the auditor and are consistent with the SEC’s rules on auditor independence and permissible non-audit services classified as “all other services” that are routine and recurring services.
(e)(2) 0.0% in fiscal 2014 and 2013.
(f) Not applicable.
(g) The aggregate non-audit fees for services to the registrant, its investment adviser and any entity controlling, controlled by, or under common control with the adviser that provides ongoing services to the registrant were $47,700 and $46,300 in 2014 and 2013, respectively.
(h) Not applicable.
Item 5. Audit Committee of Listed Registrants.
Not applicable.
Item 6. Schedule of Investments.
(a) The Schedule of Investments is included in the Annual Report to Shareholders filed under Item 1 of this Form.
(b) Not applicable.
Item 7. Disclosure of Proxy Voting Policies and Procedures for Closed-End Management Investment Companies.
Not applicable.
Item 8. Portfolio Managers of Closed-End Management Investment Companies.
Not applicable.
Item 9. Purchases of Equity Securities by Closed-End Management Investment Company and Affiliated Purchasers.
Not applicable.
Item 10. Submission of Matters to a Vote of Security Holders.
Not applicable.
Item 11. Controls and Procedures.
(a)The registrant’s principal executive officer and principal financial officer have concluded, based on their evaluation of the registrant’s disclosure controls and procedures as conducted within 90 days of the filing date of this report, that these disclosure controls and procedures are adequately designed and are operating effectively to ensure that information required to be disclosed by the registrant on Form N-CSR is recorded, processed, summarized and reported within the time periods specified in the Securities and Exchange Commission’s rules and forms.
(b)There were no changes in the registrant’s internal control over financial reporting (as defined in Rule 30a-3(d) under the Act (17 CFR 270.30a-3(d))) that occurred during the second fiscal quarter of the period covered by this report that have materially affected or are reasonably likely to materially affected, the registrant’s internal control over financial reporting.
Item 12. Exhibits.
| | |
| (a)(1) | | Code of Ethics for Senior Financial Officers is filed herewith. |
| |
| (a)(2) | | Certifications required by Item 12(a) of Form N-CSR are filed herewith. |
| |
| (a)(3) | | Not applicable. |
| |
| (b) | | Certification required by Item 12(b) of Form N-CSR is furnished herewith. |
SIGNATURES
Pursuant to the requirements of the Securities Exchange Act of 1934 and the Investment Company Act of 1940, the registrant has duly caused this report to be signed on its behalf by the undersigned, thereunto duly authorized.
(Registrant) Diamond Hill Funds
| | |
| |
| By (Signature and Title) | | /s/ Thomas E. Line |
| | Thomas E. Line, Chief Executive Officer |
Date February 26, 2015
Pursuant to the requirements of the Securities Exchange Act of 1934 and the Investment Company Act of 1940, this report has been signed below by the following persons on behalf of the registrant and in the capacities and on the dates indicated.
| | |
| By (Signature and Title) | | /s/ Thomas E. Line |
| | Thomas E. Line, Chief Executive Officer |
Date February 26, 2015
| | |
| By (Signature and Title) | | /s/ Trent M. Statczar |
| | Trent M. Statczar, Treasurer |
Date February 26, 2015