UNITED STATES
SECURITIES AND EXCHANGE COMMISSION
Washington, D.C. 20549
FORM N-CSR
CERTIFIED SHAREHOLDER REPORT OF REGISTERED
MANAGEMENT INVESTMENT COMPANIES
Investment Company Act file number: 811-8061
Diamond Hill Funds
(Exact name of registrant as specified in charter)
| | |
| 325 John H. McConnell Boulevard, Suite 200, Columbus, Ohio 43215 |
| (Address of principal executive offices) | | (Zip code) |
James F. Laird, Jr., 325 John H. McConnell Boulevard, Suite 200, Columbus, Ohio 43215
(Name and address of agent for service)
Registrant’s telephone number, including area code: 614-255-3333
Date of fiscal year end: December 31
Date of reporting period: December 31, 2011
Item 1. Reports to Stockholders.
This material must be preceded or accompanied by a current prospectus.
Annual Report

SMALL CAP FUND
SMALL-MID CAP FUND
LARGE CAP FUND
SELECT FUND
LONG-SHORT FUND
FINANCIAL LONG-SHORT FUND
STRATEGIC INCOME FUND
| | | | |
| Not FDIC Insured | | | May Lose Value | | | No Bank Guarantee |
Table of Contents
CAUTIONARY STATEMENT
At Diamond Hill, we pledge that, “we will communicate with our clients about our investment performance in a manner that will allow them to properly assess whether we are deserving of their trust.” Our views and opinions regarding the investment prospects of our portfolio holdings and Funds are “forward looking statements” which may or may not be accurate over the long term. While we believe we have a reasonable basis for our opinions, actual results may differ materially from those we anticipate. Information provided in this report should not be considered a recommendation to purchase or sell any particular security.
You can identify forward looking statements by words like “believe,” “expect,” “anticipate,” or similar expressions when discussing prospects for particular portfolio holdings and/or one of the Funds. We cannot assure future results. You should not place undue reliance on forward-looking statements, which speak only as of the date of this report. We disclaim any obligation to update or alter any forward-looking statements, whether as a result of new information, future events, or otherwise. This material is not authorized for distribution to prospective investors unless preceded or accompanied by a Prospectus. Please read the Prospectus carefully for a discussion of fees, expenses, and risks. Current performance may be lower or higher than that quoted herein. You may obtain a current copy of the Prospectus or more current performance information by calling 1-888-226-5595 or visit Diamond Hill’s website www.diamond-hill.com.
Letter to Shareholders
Dear Fellow Shareholders:
We are pleased to provide you with this year-end update for the Diamond Hill Funds. As we have noted in the past, U.S. stocks have increasingly moved in lock step with macro-economic forces, reacting to the headline news of the day. This was especially noteworthy in 2011. In our view, when stocks move for an extended period of time based on factors other than fundamental valuation, it generally creates investment opportunities. Assessing the impact of macro-economic factors has been a more important part of estimating the long-term intrinsic value of companies in recent years; however, it is still just one of many factors that we consider. Our investment process has not and will not change. We consider all relevant factors that might impact the discounted value of a company’s future cash flows. We will invest when we believe that we can make informed judgments about and estimates of those cash flows and when our estimate of intrinsic value provides a margin of safety relative to the current market price. If we are unable to make informed estimates of any factor, whether product success, government impact or other macro-economic forces; we will refrain from investing. We believe security selection through the independent valuation of businesses and the discipline to only purchase (short) securities selling at a discount (premium) to our estimate of intrinsic value are the keys to a successful long-term track record.
2011 Financial Markets
U.S. equity markets finished 2011 with strong increases in the fourth quarter. Despite the strong finish, the S&P 500 Index was essentially flat for the year, up just 2.1% including dividends, masking a year of significant market volatility. The S&P 500 Index swung from an 8% year-to-date return in April to a 13% year-to-date decline in early October. Investors traded on the headline news of the day during much of 2011, resulting in head-snapping volatility and high individual stock correlations. As stocks traded in lock-step with one another, individual company valuations were not as important to investors as macro-economic news. The S&P 500 Index closed up or down by 2% on 35 days in 2011. This compared to 22 days in 2010 and only two days in 2006. In 2005, there was not a single daily move of 2%.
| | Ÿ | | By the end of the first quarter, U.S. stocks had posted solid results with a 5.9% total return for the S&P 500 Index. This increase was achieved despite turmoil in the Middle East and the devastating earthquake and tsunami on March 11th in Japan as central banks absorbed some of the fallout by flooding the markets with money. |
| | Ÿ | | During the second quarter, news headlines were dominated by the sovereign debt concerns in Greece and weak U.S. economic data. The continuing political debate over raising the U.S. debt ceiling and the potential impact of a technical default on government obligations created additional uncertainty for financial markets. The S&P 500 Index returned just 0.1% including dividends. |
| | Ÿ | | In the third quarter, Europe’s debt problems deepened; U.S. economic data showed a continued slowing in economic growth, increasing concerns of a double-dip recession; and China and other emerging market economies showed signs of weakness. In addition, U.S. government policy-makers debated whether to increase America’s debt ceiling until the final hour, and Standard & Poor’s delivered the final blow to investor confidence with their downgrade of the U.S. credit rating, following the government’s decision to raise the debt ceiling. All of these factors caused investors to flee risky assets and seek safe havens, primarily in U.S. Treasuries and cash. The S&P 500 Index lost 13.8%. |
| | Ÿ | | During the fourth quarter, the U.S. economy continued to appear anemic relative to a normal recovery; however, economic data showed signs of life with production data continuing a positive trend, an encouraging non-farm payrolls report, employment gains, and a reduction in jobless claims. Manufacturing data continued to be mixed. The S&P 500 Index finished the year with a fourth quarter total return of 11.8%. |
Market Outlook
Our long-term economic view has not changed. We continue to believe that the economy will be challenged for many years by financial deleveraging and the ultimate withdrawal of fiscal and monetary stimulus. Debt levels remain high in the U.S. with few fiscal or monetary tools still available to offset the economic drag as the accumulated debt is worked down.
| | |
| Diamond Hill Funds Annual Report December 31, 2011 | | Page 1 |
Equity valuations are below long-term averages; however, corporate profit margins remain well above average. As a result, we believe valuations appear to be ‘in-line’ with long-term averages on a normalized basis. Larger capitalization and higher quality stocks have outperformed since mid-year, but both remain attractive relative to smaller capitalization and lower quality stocks.
Reflecting this outlook, our strategies continue to emphasize higher quality companies with the ability to withstand the reversal of monetary and fiscal stimulus in the years ahead. In our opinion, equities appear attractive relative to treasuries, and in all of our equity strategies we are finding more value in companies at the higher end of their respective market capitalization ranges. We continue to emphasize companies with stable business models, competitive positioning, quality management teams and strong balance sheets. From current levels, our expectation is for average equity market returns over the next five years.
Diamond Hill Capital Management, Inc.
| | |
| |
 | |  |
| Christopher M. Bingaman, CFA | | Christopher A. Welch, CFA |
| Co-Chief Investment Officer | | Co-Chief Investment Officer |
The views expressed are those of the portfolio managers as of December 31, 2011, are subject to change, and may differ from the views of other portfolio managers or the firm as a whole. These opinions are not intended to be a forecast of future events, a guarantee of future results, or investment advice. All data referenced are from sources deemed to be reliable but cannot be guaranteed. Securities and sectors referenced should not be construed as a solicitation or recommendation or be used as the sole basis for any investment decision.
The S&P 500 Index is a market capitalization-weighted index of 500 widely held stocks often used as a proxy for the stock market. Standard and Poor’s selects the companies for the index to widely represent the stock market based on market size, liquidity, and industry group representation. Indexes are unmanaged, do not incur fees, and cannot be invested in directly.
Investors should consider the investment objectives, risks, and charges and expenses of the Diamond Hill Funds carefully before investing. This and other information about the Funds is in the prospectus, which can be obtained at www.diamond-hill.com. Read the prospectus carefully before you invest. Diamond Hill Capital Management, Inc., a registered investment adviser, serves as Investment Adviser to the Diamond Hill Funds and is paid a fee for its services. The Diamond Hill Funds are distributed by BHIL Distributors, Inc. (Member FINRA), an affiliated company. Investors may obtain a copy of the current prospectus at 888-226-5595 or www.diamond-hill.com. Like all mutual funds, Diamond Hill Funds are not FDIC insured, may lose value, and have no bank guarantee.
| | |
| Page 2 | | Diamond Hill Funds Annual Report December 31, 2011 |
Mission Statement, Pledge and Fundamental Principles
Mission | The mission of Diamond Hill is to serve our clients through a disciplined intrinsic value-based approach to investing, while maintaining a long-term perspective, and aligning our interests with those of our clients. |
| | To successfully pursue our mission, we are: |
COMMITTED to the Graham-Buffett investment philosophy, with goals to outperform benchmarks and our peers over 5-year rolling periods and achieve absolute returns sufficient for the risk of the asset class.
DRIVEN by our conviction to create lasting value for clients and shareholders.
MOTIVATED through our ownership of Diamond Hill funds and company stock.
Investment Philosophy | At Diamond Hill, the investment philosophy, which is rooted in the teachings of Benjamin Graham and the methods of Warren Buffett, drives the investment process — not the opposite. |
| | Most simply, we invest in a company when its market price is at a discount to our appraisal of the intrinsic value of the business (or at a premium for short positions). |
There are four guiding principles to our investment philosophy:
| | ¿ | | Treat every investment as a partial ownership interest in that company |
| | ¿ | | Always invest with a margin of safety to ensure the protection of capital, as well as return on capital |
| | ¿ | | Possess a long-term investment temperament |
| | ¿ | | Recognize that market price and intrinsic value tend to converge over a reasonable period of time |
“Investment is most intelligent when it is most businesslike.”
— BENJAMIN GRAHAM
Pledge | Consistent with our mission & investment philosophy, we pledge the following to all of our clients: |
| | Our investment discipline is to assess the economics of the underlying business, its management, and the price that must be paid to own a piece of it. We seek to concentrate our investments in businesses that are available at prices below intrinsic value (above intrinsic value for short positions) and are managed or controlled by trustworthy and capable people. Benjamin Graham pioneered this discipline during the 1930s and many others have practiced it with great success ever since, most notably Warren Buffett. |
| | We will communicate with our clients about our investment performance in a manner that will allow them to properly assess whether we are deserving of their trust. |
| | Our investment team will be comprised of people with integrity, sound experience and education, in combination with a strong work ethic and independence of thought. Especially important is that each possesses the highest level of character, business ethics and professionalism. |
| | Our employees will enjoy a working environment that supports professional and personal growth, thereby enhancing employee satisfaction, the productivity of the firm and the experience of our clients. |
| | |
| Diamond Hill Funds Annual Report December 31, 2011 | | Page 3 |
| | “Invest With Us” means we will invest the capital you entrust to us with the same care that we invest our own capital. To this end, Diamond Hill employees and affiliates are significant investors in the same portfolios in which our clients invest and are collectively the largest shareholders in the Diamond Hill Funds. In addition, all Diamond Hill employees are subject to a Code of Ethics, which prohibits the purchase of any individual security that is eligible for purchase in one of Diamond Hill’s portfolios. The Code of Ethics also prohibits the purchase of third-party mutual funds that primarily invest in U.S. equity securities. Investment in the Diamond Hill mutual funds is encouraged, and third-party mutual funds can only be purchased in strategies not managed by Diamond Hill. |
Our fundamental equity investment principles | Valuation |
| | Every share of stock has an intrinsic value that is independent of its current stock market price. |
| | At any point in time, the stock market price may be either higher or lower than intrinsic value. |
| | Over short periods of time, as evidenced by extreme stock market volatility, the stock market price is heavily influenced by the emotions of market participants, which are far more difficult to predict than intrinsic value. While stock market prices may experience extreme fluctuations on a particular day, we believe intrinsic value is far less volatile. |
| | Over sufficiently long periods of time, five years and longer, the stock market price tends to converge with intrinsic value. |
| | Calculating Intrinsic Value Estimate |
| | We believe that we can determine a reasonable approximation of that intrinsic value in some cases. |
| | That value can be determined if we have a reasonable basis for projecting the future cash flows of a business and use an appropriate discount rate. |
| | In estimating intrinsic value, we use an interdisciplinary approach. Not only do we perform financial modeling including discounted cash flow, private market value and leveraged buyout analyses, we draw from other areas we believe are relevant to our investment decision-making. These include economics, statistics and probability theory, politics, psychology, and consumer behavior. |
| | In short, we do not want to exclude from our thinking anything that can help us forecast future cash flows, our most important as well as most difficult job. |
| | The Diamond Hill investment process continually compares market price to our estimate of intrinsic value, which is updated over time as new information arises. |
| | We only invest in a business when the stock market price is lower than our conservative assessment of per share intrinsic value (or higher than our assessment of per share intrinsic value for short positions). |
| | We concentrate our investments in businesses whose per share intrinsic value is likely to grow. |
| | To achieve this, we assess the underlying economics of the businesses in which we invest and the industries and markets in which they participate. We seek to invest in businesses that possess a competitive advantage and significant growth prospects as well as outstanding managers and employees. |
| | Every business in which we invest is “handicapped” by its price. While we would prefer to own only great businesses with superior managers, there are very few businesses that satisfy those criteria and additionally are available at attractive prices. As a result, we may invest in less attractive businesses at more than attractive prices. Depending on the price that we pay, our returns from less than ideal businesses may be even better than our returns from ideal businesses. |
| | |
| Page 4 | | Diamond Hill Funds Annual Report December 31, 2011 |
| | We intend to achieve our return from both the closing of the gap between our purchase price and intrinsic value and the growth in per share intrinsic value. For short positions, a growing intrinsic value may shorten the holding period. |
| | We define risk as the permanent loss of capital. We manage risk by investing in companies selling at a discount (premium) to our estimate of intrinsic value, with a full understanding of the fundamental drivers of intrinsic value. In addition, we carefully consider business risks that could impact our estimate of intrinsic value. We regularly monitor and update our estimate of intrinsic value, adjusting for new information. If we are successful in accurately assessing intrinsic value, we will minimize the risk of loss and increase the return potential. |
Our fundamental strategic income principles | Yield |
| | Our primary goal is to generate a yield greater than the current rate of inflation without bearing undue credit or interest rate risk. However, we cannot guarantee any specific yield. |
| | A flexible approach allows us to invest in both investment grade and non-investment grade corporate bonds as well as in preferred securities, real estate investment trusts, master limited partnerships, and closed end funds. |
| | We can also invest in securities issued by the U.S. government and its agencies when conditions warrant. |
| | We balance our income objective with a focus on total return. Over the next five years, our objective is to earn equity-like returns in the income markets with lower year-to-year volatility and more importantly, a much lower risk of permanent loss of capital. |
“You simply have to behave according to what is rational than according to what is fashionable.”
— WARREN BUFFETT
| | |
| Diamond Hill Funds Annual Report December 31, 2011 | | Page 5 |
Diamond Hill Small Cap Fund (unaudited)
Performance Update
| | | | | | | | | | | | | | | | | | | | |
| | | | | | |
Average Annual Total Returns as of December 31, 2011 | | One
Year | | | Three
Years | | | Five
Years | | | Ten
Years | | | Expense
Ratio* | |
PERFORMANCE AT NAV without sales charges | | | | | | | | | | | | | | | | | | | | |
Class A Shares | | | -7.17% | | | | 13.75% | | | | 0.94% | | | | 8.48% | | | | 1.35% | |
Class C Shares | | | -7.83% | | | | 12.91% | | | | 0.19% | | | | 7.67% | | | | 2.10% | |
Class I Shares | | | -6.91% | | | | 14.13% | | | | 1.31% | | | | 8.75% | | | | 1.08% | |
BENCHMARK | | | | | | | | | | | | | | | | | | | | |
Russell 2000 Index | | | -4.18% | | | | 15.63% | | | | 0.15% | | | | 5.62% | | | | — | |
PERFORMANCE AT POP includes sales charges | | | | | | | | | | | | | | | | | | | | |
Class A Shares | | | -11.82% | | | | 11.82% | | | | -0.09% | | | | 7.92% | | | | 1.35% | |
Class C Shares | | | -8.71% | | | | 12.91% | | | | 0.19% | | | | 7.67% | | | | 2.10% | |
Historical performance for Class I shares prior to its inception is based on the performance of Class A shares. Class I performance has been adjusted to reflect differences in sales charges.
| * | Reflects the expense ratio as reported in the Prospectus as amended August 19, 2011. |
Past performance does not guarantee future results. The performance data quoted represents past performance and current returns may be lower or higher. The investment return and principal value will fluctuate so that an investor’s shares, when redeemed, may be worth more or less than the original cost. To obtain performance information current to the most recent month end, please visit www.diamond-hill.com.
Portfolio Commentary
| | | | |
 | |  | |  |
Tom Schindler, CFA
Manager | | Chris Welch, CFA
Assistant Manager | | Chris Bingaman, CFA
Assistant Manager |
The Diamond Hill Small Cap Fund declined 7.17% (Class A, without sales charge) in 2011 compared to a 4.18% decline in the benchmark Russell 2000 Index. This partially reverses the strong outperformance of U.S. small cap equities relative to large cap equities in 2010. The year was marked by high volatility, with a strong fourth quarter rally reducing larger losses incurred over the summer months. Corporate earnings registered year-over-year gains, and U.S. government interest rates declined. However, despite these positives, there were also concerns about several possible European sovereign debt defaults and the subsequent ramifications to not only the major banks of those countries but also from the spread of financial contagion.
During the year, holdings in the financial and energy sectors were the largest source of the Fund’s underperformance. The consumer staples sector was the best performing sector for the Fund. We slightly outperformed in the industrial sector and underperformed in the consumer discretionary sector. Health care and information technology were largely non-factors in relation to the Index.
Oil prices remained at high levels with the continued global economic rebound keeping global demand growth around 1%. In addition, the “Arab spring” created new geo-political tensions that gave rise to actual cuts in Libyan exports as well as concerns about future supplies from the region. However, natural gas prices declined sharply, as the continued new supply from U.S. shale gas led to a natural gas glut. Rather than a short, self-correcting cycle, the excess supply of natural gas is persisting due to companies continuing to drill in order to hold leases and because wells with high liquid or oil content can still be economically attractive even with natural gas prices at such low levels.
Despite this dichotomy between the two principal energy commodities, our holdings were mostly negative for the year. Cimarex Energy Co. and Forest Oil Corp. both encountered marginal well results in different areas of the Mid-Continent. While setbacks, in neither case do we believe the extent of the stock decline was proportionate to the results. Whiting Petroleum Corp. and Denbury Resources, Inc. continue to focus on enhanced oil recovery projects, which we believe will display attractive economic returns based on the oil price futures curve. The fundamentals for Berry Petroleum Co., which uses natural gas to generate steam to help lift heavy crude, were satisfactory; however the results were not rewarded in the stock market. Only Hornbeck Offshore Services, Inc., a supplier of offshore vessels, managed a gain for the year before it was sold from the Fund due to price considerations.
| | |
| Page 6 | | Diamond Hill Funds Annual Report December 31, 2011 |
In the financial sector, the Fund continued to emphasize insurance companies, and Assurant, Inc.; Arch Capital Group Ltd. and White Mountains Insurance Group Ltd. registered solid gains. Assured Guaranty Ltd. provided the largest negative impact to the Fund in 2011, despite what we believe were several positive developments at the company. Early in the year, Standard & Poors proposed changing the methodology under which they assign ratings to bond insurers. This created uncertainty for much of the year for Assured Guaranty; however the company received a substantial cash payment from a settlement with Bank of America over representations and warranties made by Bank of America’s Countrywide Credit unit concerning mortgage backed securities, as well as an agreement for Bank of America to shoulder the majority of future losses from those mortgage securities. Additionally, Assured Guaranty was able to continue to earn respectable profits due to no unusual state and local government defaults. The banks owned by the Fund were mostly negative for the year. Sterling Bancorp; First Niagara Financial Group, Inc.; Huntington Bancshares, Inc.; City National Corp. and Popular, Inc. all contributed negatively to the Fund’s performance for the year.
The consumer staples sector again proved to be a fertile investment area for the Fund. B&G Foods, Inc. posted the largest gain in the sector and the second largest in the Fund due to strong earnings growth. Ralcorp Holdings, Inc. received an unsolicited offer from ConAgra Foods, Inc. during the year. While Ralcorp eventually rebuffed the offer in favor of spinning off its Post Cereal unit, the development highlighted the value in the company, and its stock appreciated meaningfully. Flowers Foods, Inc.; Energizer Holdings, Inc. and Ruddick Corp. also contributed positively for the year.
We will continue to balance risk and reward in our appraisal of individual company values. We appreciate your ongoing support and look forward to continuing to work with you in the coming years.

Thomas P. Schindler, CFA
Portfolio Manager
Growth of $10,000
Comparison of the change in value of a $10,000 Investment in the Diamond Hill Small Cap Fund Class A(A) and the Russell 2000 Index.
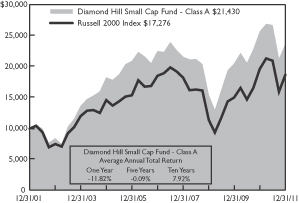
| (A) | The growth of $10,000 and total return charts represent the performance of Class A shares only, adjusted for the maximum applicable sales charge of 5.00%, which will vary from the performance of Class C and Class I shares based on the difference in loads and fees paid by shareholders in the different classes. |
The performance of the above Fund does not reflect the deduction of taxes that a shareholder would pay on Fund distributions or the redemption of Fund shares.
The chart above represents a comparison of a hypothetical $10,000 investment and the reinvestment of dividends and capital gains in the indicated share class versus a similar investment in the Russell 2000 Index (“Index”). The Index is a market capitalization-weighted index measuring performance of the smallest 2,000 companies, on a market capitalization basis, in the Russell 3000 Index. The Index is unmanaged, and does not reflect the deduction of fees associated with a mutual fund such as investment management and accounting fees. The Fund’s performance reflects the deduction of fees for these services. Investors cannot invest directly in an index although they can invest in the underlying securities.
Past performance does not guarantee future results. The performance data quoted represents past performance and current returns may be lower or higher. The investment return and principal value will fluctuate so that an investor’s shares, when redeemed, may be worth more or less than the original cost. To obtain performance information current to the most recent month end, please visit www.diamond-hill.com.
Tabular Presentation of Investments
The table below provides the Diamond Hill Small Cap Fund’s sector allocation. We hope it will be useful to shareholders as it summarizes key information about the Fund’s investments.
December 31, 2011 Sector Allocation* (Overweight in bold)
| | | | | | | | | | | | | | | | | | | | | | | | |
| | | Financials | | Industrials | | Consumer
Discretionary | | Energy | | Consumer
Staples | | Health
Care | | Information
Technology | | Utilities | | Materials | | Telecom | | Other | | Cash
& Equiv. |
Small Cap Fund | | 24.9% | | 17.0% | | 12.3% | | 10.5% | | 10.5% | | 5.5% | | 2.9% | | 2.8% | | — | | — | | — | | 13.7% |
Russell 2000 Index | | 22.2% | | 15.8% | | 13.3% | | 6.0% | | 3.6% | | 12.6% | | 16.3% | | 3.7% | | 4.9% | | 0.8% | | 0.8% | | — |
* Sector allocations may not total 100% due to rounding and are subject to change.
| | |
| Diamond Hill Funds Annual Report December 31, 2011 | | Page 7 |
Diamond Hill Small-Mid Cap Fund (unaudited)
Performance Update
| | | | | | | | | | | | | | | | | | | | |
| | | | | | |
Average Annual Total Returns as of December 31, 2011 | | One
Year | | | Three
Years | | | Five
Years | | | Since
Inception
(12/30/05) | | | Expense
Ratio* | |
PERFORMANCE AT NAV without sales charges | | | | | | | | | | | | | | | | | | | | |
Class A Shares | | | -4.19% | | | | 18.39% | | | | 2.85% | | | | 3.98% | | | | 1.30% | |
Class C Shares | | | -4.89% | | | | 17.56% | | | | 2.11% | | | | 3.24% | | | | 2.05% | |
Class I Shares | | | -3.86% | | | | 18.82% | | | | 3.24% | | | | 4.37% | | | | 1.03% | |
BENCHMARK | | | | | | | | | | | | | | | | | | | | |
Russell 2500 Index | | | -2.51% | | | | 18.41% | | | | 1.24% | | | | 3.59% | | | | — | |
PERFORMANCE AT POP includes sales charges | | | | | | | | | | | | | | | | | | | | |
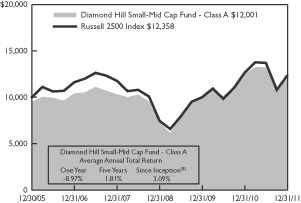
Class A Shares | | | -8.97% | | | | 16.39% | | | | 1.81% | | | | 3.09% | | | | 1.30% | |
Class C Shares | | | -5.81% | | | | 17.56% | | | | 2.11% | | | | 3.24% | | | | 2.05% | |
| * | Reflects the expense ratio as reported in the Prospectus as amended August 19, 2011. |
Past performance does not guarantee future results. The performance data quoted represents past performance and current returns may be lower or higher. The investment return and principal value will fluctuate so that an investor’s shares, when redeemed, may be worth more or less than the original cost. To obtain performance information current to the most recent month end, please visit www.diamond-hill.com.
Portfolio Commentary
| | | | |
| | | | |
Chris Welch, CFA
Manager | | Tom Schindler, CFA
Assistant Manager | | Chris Bingaman, CFA
Assistant Manager |
The Diamond Hill Small-Mid Cap Fund declined 4.19% (Class A, without sales charge) in 2011 compared to a 2.51% decline in the benchmark Russell 2500 Index. For the five-year period ending December 31, 2011, the Fund’s return was 2.85% annually while the Russell 2500 Index returned 1.24% over the same period. The 2011 performance trailed the benchmark largely due to poor stock selection in the energy and financials sectors. We are pleased, however, to have outperformed the Index over the longer five-year time period.
Entering the year, we felt the best investment opportunities were in higher quality stocks as well as those at the higher end of our market capitalization range. That proved to be true as the sovereign debt concerns in Greece, combined with weak economic data and budget concerns in the U.S., created a challenging equity investment environment. Large cap stocks performed meaningfully better than small and mid-cap stocks during the year, with the Russell 1000 Index return of 1.5% exceeding the 2.5% decline in the Russell 2500 Index by four percentage points. Unfortunately, our favorable positioning with respect to this trend was dwarfed by the negative returns we experienced with a handful of stocks.
The consumer staples and information technology sectors provided the most positive contribution to return in 2011. In consumer staples, we benefited from a large overweight relative to the benchmark in a sector that achieved greater than 15% returns for the year. Three of our holdings — ConAgra Foods, Inc.; B&G Foods, Inc. and Ralcorp Holdings, Inc. — increased more than 20%. Our returns in the information technology sector returns were bolstered by effective stock selection and well-timed purchases and sales. We sold KLA-Tencor Corp. in the first quarter, and then repurchased the shares during the third quarter market decline at prices more than 25% lower. We bought shares in Juniper Networks, Inc. after they fell more than 50% from their 2011 peak, providing positive contribution to the Fund’s return for the year. We also profited from our position in Alliance Data Systems Corp. before selling it in the second quarter when it reached our estimate of intrinsic value. The portfolio also benefited from the acquisitions of two of our holdings during the year — Verigy Ltd. and Pharmaceutical Product Development, Inc.
The financials and energy sectors provided the largest negative contributions to return for the year, primarily due to poor stock selection. In the financials sector, we were hurt by four stocks that continued to feel the effects of the financial crisis. Old Republic International’s mortgage insurance division has been a weight dragging down the company’s stock price, and we sold our position in the fourth quarter and used the proceeds to purchase a more attractive opportunity. Assured Guaranty Ltd.’s municipal bond business had favorable
| | |
| Page 8 | | Diamond Hill Funds Annual Report December 31, 2011 |
results, but the losses in their structured finance segment led the Standard and Poor’s rating agency to downgrade their credit rating during the year. The stock fell 25% in 2011; however, we continue to have confidence in the company’s future prospects. Popular, Inc. fell over 50% as the Puerto Rican bank’s credit losses continued to concern investors, even with an improved capital position. Despite a much-improved balance sheet compared to late 2008, real estate investment trust iStar Financial, Inc. was a negative contributor to our returns due to general concerns about leverage in financial institutions. In the energy sector, a few of our investments including Cimarex Energy Co., Denbury Resources, Inc. and Forest Oil Corp. lost value due to concerns about reduced production growth along with the decline in natural gas prices. Exterran Holdings, Inc. fell over 60% for the year as the company’s CEO resigned following disappointing results in its international gas compression services and equipment businesses.
Our 2012 outlook remains little changed from the past two years. We continue to emphasize high quality companies with consistent cash flow generation and solid balance sheets. We are still finding the best opportunities at the higher end of our market cap range. Our largest sector weights, financials and energy, are unchanged, and insurance remains the primary focus within our financial sector holdings. While there are some clear macroeconomic risks (European debt and the health of the Chinese economy being the largest in our opinion), equity valuations appear to discount a fair portion of that risk. We took advantage of some opportunities during 2011 to reduce our cash level to just over 3% from approximately 15% at the beginning of the year. We continue to maintain our focus on return of capital in addition to return on capital.
We appreciate your ongoing support and look forward to continuing to work with you in the coming years.
Christopher A. Welch, CFA
Portfolio Manager
Growth of $10,000
Comparison of the change in value of a $10,000 Investment in the Diamond Hill Small-Mid Cap Fund Class A(A) and the Russell 2500 Index.
| (A) | The growth of $10,000 and total return charts represent the performance of Class A shares only, adjusted for the maximum applicable sales charge of 5.00%, which will vary from the performance of Class C and Class I shares based on the difference in loads and fees paid by shareholders in the different classes. |
| (B) | Class A shares commenced operations on December 30, 2005. |
The performance of the above Fund does not reflect the deduction of taxes that a shareholder would pay on Fund distributions or the redemption of Fund shares.
The chart above represents a comparison of a hypothetical $10,000 investment and the reinvestment of dividends and capital gains in the indicated share class versus a similar investment in the Russell 2500 Index (“Index”). The Index is a market capitalization-weighted index measuring performance of the smallest 2,500 companies, on a market capitalization basis, in the Russell 3000 Index. The Index is unmanaged, and does not reflect the deduction of fees associated with a mutual fund such as investment management and accounting fees. The Fund’s performance reflects the deduction of fees for these services. Investors cannot invest directly in an index although they can invest in the underlying securities.
Past performance does not guarantee future results. The performance data quoted represents past performance and current returns may be lower or higher. The investment return and principal value will fluctuate so that an investor’s shares, when redeemed, may be worth more or less than the original cost. To obtain performance information current to the most recent month end, please visit www.diamond-hill.com.
Tabular Presentation of Investments
The table below provides the Diamond Hill Small-Mid Cap Fund’s sector allocation. We hope it will be useful to shareholders as it summarizes key information about the Fund’s investments.
December 31, 2011 Sector Allocation* (Overweight in bold)
| | | | | | | | | | | | | | | | | | | | | | | | |
| | | Financials | | Energy | | Consumer
Staples | | Industrials | | Health
Care | | Consumer
Discretionary | | Information
Technology | | Utilities | | Materials | | Telecom | | Other | | Cash
& Equiv. |
Small-Mid Cap Fund | | 21.2% | | 15.0% | | 14.6% | | 14.5% | | 11.7% | | 8.9% | | 8.3% | | 2.6% | | — | | — | | — | | 3.2% |
Russell 2500 Index | | 21.3% | | 6.3% | | 3.5% | | 15.4% | | 10.6% | | 13.8% | | 14.8% | | 5.9% | | 7.0% | | 1.0% | | 0.5% | | — |
* Sector allocations may not total 100% due to rounding and are subject to change.
| | |
| Diamond Hill Funds Annual Report December 31, 2011 | | Page 9 |
Diamond Hill Large Cap Fund (unaudited)
Performance Update
| | | | | | | | | | | | | | | | | | | | |
| | | | | | |
Average Annual Total Returns
as of December 31, 2011 | | One
Year | | | Three
Years | | | Five
Years | | | Ten
Years | | | Expense
Ratio* | |
PERFORMANCE AT NAV without sales charges | | | | | | | | | | | | | | | | | | | | |
Class A Shares | | | 2.35% | | | | 13.36% | | | | 0.25% | | | | 5.54% | | | | 1.09% | |
Class C Shares | | | 1.55% | | | | 12.52% | | | | -0.51% | | | | 4.70% | | | | 1.84% | |
Class I Shares | | | 2.60% | | | | 13.74% | | | | 0.61% | | | | 5.81% | | | | 0.82% | |
BENCHMARK | | | | | | | | | | | | | | | | | | | | |
Russell 1000 Index | | | 1.50% | | | | 14.81% | | | | -0.02% | | | | 3.34% | | | | — | |
PERFORMANCE AT POP includes sales charges | | | | | | | | | | | | | | | | | | | | |
Class A Shares | | | -2.78% | | | | 11.44% | | | | -0.77% | | | | 5.00% | | | | 1.09% | |
Class C Shares | | | 0.55% | | | | 12.52% | | | | -0.51% | | | | 4.70% | | | | 1.84% | |
Historical performance for Class I shares prior to its inception is based on the performance of Class A shares. Class I performance has been adjusted to reflect differences in sales charges.
| * | Reflects the expense ratio as reported in the Prospectus Supplement dated October 1, 2011. |
Past performance does not guarantee future results. The performance data quoted represents past performance and current returns may be lower or higher. The investment return and principal value will fluctuate so that an investor's shares, when redeemed, may be worth more or less than the original cost. To obtain performance information current to the most recent month end, please visit www.diamond-hill.com.
Portfolio Commentary
| | | | |
 | |  | | |
Chuck Bath, CFA
Manager | | Bill Dierker, CFA
Assistant Manager | | Chris Welch, CFA
Assistant Manager |
The Diamond Hill Large Cap Fund returned 2.35% (Class A, without sales charge) in 2011 compared to 1.50% for the Russell 1000 Index. While the returns were not particularly exciting, it was at least comforting to see the market achieve a positive return for the year. After peaking at the end of April, the market fell precipitously and bottomed in early October. The subsequent fourth quarter rally was substantial and allowed the market to provide a positive return for the year.
The Fund’s relative performance was similarly bifurcated in 2011. The Fund lagged the market rally in the first part of the year; however, the portfolio gained ground relative to the market during the fourth quarter, allowing the Fund to outperform the market for the year. More importantly, the Fund also outperformed for the five years ending December 31, 2011 returning 0.25% compared to a 0.02% decline in the Russell 1000 Index. As shareholders know, at Diamond Hill we place much more importance on five-year relative performance so I was gratified to see the Fund outperform for this period.
The health care sector provided the greatest positive contribution to portfolio return and was also the largest sector. Companies such as Pfizer, Inc.; UnitedHealth
Group, Inc. and Abbott Laboratories returned in excess of 20% for the year. Many of these holdings benefited from unusually low valuations and high dividend yields. As the year progressed, it seemed investors were placing a higher priority on dividend yield in an environment where it was difficult to find a high yield in any asset class.
The consumer discretionary sector was the second best contributing sector. Holdings in this sector provided the greatest absolute return; however, the consumer discretionary sector was a much smaller weighting than the healthcare sector, resulting in a smaller total contribution to return. McDonald’s Corp. was up more than 30% for the quarter and was the largest contributor in the sector. Other positive contributors were Nike, Inc. and Mattel, Inc.
Energy was a large weighting in the portfolio and unfortunately was also the biggest negative contributor, despite the energy sector’s strong cyclical recovery in the fourth quarter. The declines earlier in the year were substantial as investors were concerned with the possibility of lower oil prices in a weak economic environment. The economy continued to grow and oil prices eventually recovered to keep the losses in the portfolio relatively small. Devon Energy Corp. and Apache Corp. were the biggest negative contributors in the sector. Devon declined due to investor concerns regarding lower natural gas prices. While oil prices remained strong, natural gas prices weakened. Devon and Apache both have a large exposure to falling gas prices. In addition, Apache has a large exposure to Egypt. While there has not been any disruption to their Egyptian operations, the political environment in Egypt is
| | |
| Page 10 | | Diamond Hill Funds Annual Report December 31, 2011 |
unstable, adding risk to Apache’s operations in the North African country.
The financial sector was a negative contributor to the Fund’s absolute performance, but relative to the benchmark it was a significant contributor to the outperformance of the Fund. The holdings in the sector meaningfully outperformed due to the focus on property and casualty insurance stocks in the portfolio. Holdings such as Chubb Corp.; Marsh & McLennan Cos., Inc. and Travelers Cos., Inc. were all up more than 9% in a sector that mostly provided negative returns for the year. JPMorgan Chase & Co. was the biggest negative contributor as the investment banking business slowed and legacy asset quality issues continued to pressure the banking sector. Other bank stocks held in the portfolio performed poorly as well, with the exception of US Bancorp. This high quality bank provided a slightly positive return in a very difficult environment.
As the year progressed, we continued to find attractive valuations in many of the large capitalization, steady growth companies we discussed in 2010. Shares of American Express Co.; Walt Disney Co.; Nike and International Business Machines Corp. were added to the portfolio during the year. Purchases of Nike and American Express were particularly opportunistic as I attempted to take advantage of the market decline in the third quarter of 2011.
Certainly, as 2011 concluded, I was pleased to see the portfolio outperform its benchmark for the trailing five years. While absolute returns available in the markets during this period were disappointing, I am pleased the Diamond Hill Large Cap Fund outperformed the lackluster performance of the benchmark. Finally, the end of 2011 also marked the conclusion of my ninth full calendar year managing the Large Cap Fund. I am grateful for the opportunity shareholders have given me to manage their assets, and I look forward to the challenges certain to arise in 2012.

Charles S. Bath, CFA
Portfolio Manager
Growth of $10,000
Comparison of the change in value of a $10,000 Investment in the Diamond Hill Large Cap Fund Class A(A) and the Russell 1000 Index.
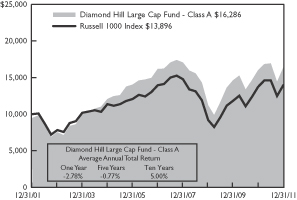
| (A) | The growth of $10,000 and total return charts represent the performance of Class A shares only, adjusted for the maximum applicable sales charge of 5.00%, which will vary from the performance of Class C and Class I shares based on the difference in loads and fees paid by shareholders in the different classes. |
The performance of the above Fund does not reflect the deduction of taxes that a shareholder would pay on Fund distributions or the redemption of Fund shares.
The chart above represents a comparison of a hypothetical $10,000 investment and the reinvestment of dividends and capital gains in the indicated share class versus a similar investment in the Russell 1000 Index (“Index”). The Index is a market capitalization-weighted index measuring performance of the largest 1,000 companies, on a market capitalization basis, in the Russell 3000 Index. The Index is unmanaged, and does not reflect the deduction of fees associated with a mutual fund such as investment management and accounting fees. The Fund’s performance reflects the deduction of fees for these services. Investors cannot invest directly in an index although they can invest in the underlying securities.
Past performance does not guarantee future results. The performance data quoted represents past performance and current returns may be lower or higher. The investment return and principal value will fluctuate so that an investor’s shares, when redeemed, may be worth more or less than the original cost. To obtain performance information current to the most recent month end, please visit www.diamond-hill.com.
Tabular Presentation of Investments
The table below provides the Diamond Hill Large Cap Fund’s sector allocation. We hope it will be useful to shareholders as it summarizes key information about the Fund’s investments.
December 31, 2011 Sector Allocation* (Overweight in bold)
| | | | | | | | | | | | | | | | | | | | | | |
| | | Health
Care | | Financials | | Energy | | Consumer
Staples | | Industrials | | Information
Technology | | Consumer
Discretionary | | Materials | | Telecom | | Utilities | | Cash
& Equiv. |
Large Cap Fund | | 20.9% | | 18.1% | | 17.0% | | 13.5% | | 11.8% | | 8.3% | | 5.8% | | 3.0% | | — | | — | | 1.7% |
Russell 1000 Index | | 11.7% | | 14.2% | | 11.8% | | 9.4% | | 10.9% | | 18.2% | | 12.8% | | 4.0% | | 3.1% | | 4.0% | | — |
* Sector allocations may not total 100% due to rounding and are subject to change.
| | |
| Diamond Hill Funds Annual Report December 31, 2011 | | Page 11 |
Diamond Hill Select Fund (unaudited)
Performance Update
| | | | | | | | | | | | | | | | | | | | |
| | | | | | |
Average Annual Total Returns
as of December 31, 2011 | | One
Year | | | Three
Years | | | Five
Years | | | Since
Inception
(12/30/05) | | | Expense
Ratio* | |
PERFORMANCE AT NAV without sales charges | | | | | | | | | | | | | | | | | | | | |
Class A Shares | | | -2.53% | | | | 12.63% | | | | 0.32% | | | | 2.43% | | | | 1.24% | |
Class C Shares | | | -3.26% | | | | 11.94% | | | | -0.45% | | | | 1.69% | | | | 1.99% | |
Class I Shares | | | -2.25% | | | | 13.25% | | | | 0.68% | | | | 2.80% | | | | 0.97% | |
BENCHMARK | | | | | | | | | | | | | | | | | | | | |
Russell 3000 Index | | | 1.03% | | | | 14.88% | | | | -0.01% | | | | 2.45% | | | | — | |
PERFORMANCE AT POP includes sales charges | | | | | | | | | | | | | | | | | | | | |
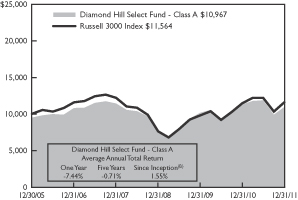
Class A Shares | | | -7.44% | | | | 10.72% | | | | -0.71% | | | | 1.55% | | | | 1.24% | |
Class C Shares | | | -4.22% | | | | 11.94% | | | | -0.45% | | | | 1.69% | | | | 1.99% | |
| * | Reflects the expense ratio as reported in the Prospectus as amended August 19, 2011. |
Past performance does not guarantee future results. The performance data quoted represents past performance and current returns may be lower or higher. The investment return and principal value will fluctuate so that an investor's shares, when redeemed, may be worth more or less than the original cost. To obtain performance information current to the most recent month end, please visit www.diamond-hill.com.
Portfolio Commentary
| | | | |
| | | | |
Bill Dierker, CFA
Manager | | Chuck Bath, CFA
Assistant Manager | | Chris Welch, CFA
Assistant Manager |
In 2011, the Diamond Hill Select Fund declined 2.53% (Class A, without sales charge) compared to our benchmark, the Russell 3000 Index, which returned 1.03%. In hindsight, one can get a sense of the 2011 investment environment, which I would classify as a risk adverse environment. This is consistent with the fact that the two best performing asset classes in 2011 were treasury bonds (+34.2%) and gold (+10.2%). For the five years ending in 2011, the Select Fund generated a compound annual rate of return of 0.32%, compared to our benchmark which declined 0.01%. September 11, 2011 was my five-year anniversary of managing the Select Fund.
Our three largest sector weights were in financials, healthcare and energy.
In the financial sector, our holdings were down, and we were overweight the sector. However, our stock selection was better, resulting in a positive impact relative to our benchmark. Several positions were positive for the year: Arch Capital Group Ltd.; Assurant, Inc.; Travelers Cos, Inc.; US Bancorp and PNC Financial Services Group, Inc.
In the healthcare sector, we were overweight the sector, and our stock selection was positive. The combination of an overweight in a strong sector and solid stock selection led to the largest contribution relative to our benchmark. Our top contributors were UnitedHealth Group, Inc.; Pfizer, Inc. and Abbott Laboratories.
In the energy sector, we were impacted by concerns regarding economic growth in the U.S. and Europe. While oil was up slightly during the year, natural gas was very weak, down over 40%. The energy sector was the largest detractor from our performance relative to our benchmark due to combination of an overweight in the sector and poor stock selection. Please note that “poor stock selection” does not mean that we have lost confidence in our holdings.
Other holdings that contributed to our performance include ConAgra Foods, Inc.; General Mills, Inc.; McDonald’s Corp. and KLA-Tencor Corp.
| | |
| Page 12 | | Diamond Hill Funds Annual Report December 31, 2011 |
We will not dwell on what worked and what did not work in 2011. We will remain focused on the price-to-intrinsic ratio of our investments. Our long-term time investment horizon allows us to focus on our margin of safety and the fundamental outlook for our holdings.
As 2011 was my fifth anniversary of managing the Select Fund, I would like to take this opportunity to thank you for your support.

William C. Dierker, CFA
Portfolio Manager
Growth of $10,000
Comparison of the change in value of a $10,000 Investment in the Diamond Hill Select Fund Class A(A) and the Russell 3000 Index.
| (A) | The growth of $10,000 and total return charts represent the performance of Class A shares only, adjusted for the maximum applicable sales charge of 5.00%, which will vary from the performance of Class C and Class I shares based on the difference in loads and fees paid by shareholders in the different classes. |
| (B) | Class A shares commenced operations on December 30, 2005. |
The performance of the above Fund does not reflect the deduction of taxes that a shareholder would pay on Fund distributions or the redemption of Fund shares.
The chart above represents a comparison of a hypothetical $10,000 investment and the reinvestment of dividends and capital gains in the indicated share class versus a similar investment in the Russell 3000 Index (“Index”). The Index is a widely recognized market capitalization-weighted index measuring the performance of the 3,000 largest U.S. companies based on total market capitalization. The Index is unmanaged, and does not reflect the deduction of fees associated with a mutual fund such as investment management and accounting fees. The Fund’s performance reflects the deduction of fees for these services. Investors cannot invest directly in an index although they can invest in the underlying securities.
Past performance does not guarantee future results. The performance data quoted represents past performance and current returns may be lower or higher. The investment return and principal value will fluctuate so that an investor’s shares, when redeemed, may be worth more or less than the original cost. To obtain performance information current to the most recent month end, please visit www.diamond-hill.com.
Tabular Presentation of Investments
The table below provides the Diamond Hill Select Fund’s sector allocation. We hope it will be useful to shareholders as it summarizes key information about the Fund’s investments.
December 31, 2011 Sector Allocation* (Overweight in bold)
| | | | | | | | | | | | | | | | | | | | | | |
| | | Financials | | Health
Care | | Energy | | Industrials | | Consumer
Staples | | Information
Technology | | Consumer
Discretionary | | Materials | | Telecom | | Utilities | | Cash
& Equiv. |
Select Fund | | 22.8% | | 19.7% | | 14.2% | | 13.8% | | 13.6% | | 7.3% | | 3.0% | | 2.6% | | — | | — | | 3.1% |
Russell 3000 Index | | 14.8% | | 11.7% | | 11.3% | | 11.3% | | 8.9% | | 18.1% | | 12.9% | | 4.0% | | 2.9% | | 4.0% | | — |
* Sector allocations may not total 100% due to rounding and are subject to change.
| | |
| Diamond Hill Funds Annual Report December 31, 2011 | | Page 13 |
Diamond Hill Long-Short Fund (unaudited)
Performance Update
| | | | | | | | | | | | | | | | | | | | |
| | | | | | |
Average Annual Total Returns
as of December 31, 2011 | | One
Year | | | Three
Years | | | Five
Years | | | Ten
Years | | | Expense
Ratio* | |
PERFORMANCE AT NAV without sales charges | | | | | | | | | | | | | | | | | | | | |
Class A Shares | | | 3.01% | | | | 6.59% | | | | -0.94% | | | | 5.71% | | | | 1.77% | |
Class C Shares | | | 2.28% | | | | 5.78% | | | | -1.69% | | | | 4.90% | | | | 2.52% | |
Class I Shares | | | 3.29% | | | | 6.95% | | | | -0.58% | | | | 5.99% | | | | 1.50% | |
BENCHMARK | | | | | | | | | | | | | | | | | | | | |
Russell 1000 Index | | | 1.50% | | | | 14.81% | | | | -0.02% | | | | 3.34% | | | | — | |
50% Russell 1000 Index/50% BofA ML US T-Bill 0-3 Mo. Index | | | 1.09% | | | | 7.71% | | | | 1.15% | | | | 2.94% | | | | — | |
PERFORMANCE AT POP includes sales charges | | | | | | | | | | | | | | | | | | | | |
Class A Shares | | | -2.16% | | | | 4.78% | | | | -1.95% | | | | 5.17% | | | | 1.77% | |
Class C Shares | | | 1.28% | | | | 5.78% | | | | -1.69% | | | | 4.90% | | | | 2.52% | |
Historical performance for Class I shares prior to its inception is based on the performance of Class A shares. Class I performance has been adjusted to reflect differences in sales charges.
| * | Reflects the expense ratio as reported in the Prospectus as amended August 19, 2011. |
Past performance does not guarantee future results. The performance data quoted represents past performance and current returns may be lower or higher. The investment return and principal value will fluctuate so that an investor's shares, when redeemed, may be worth more or less than the original cost. To obtain performance information current to the most recent month end, please visit www.diamond-hill.com.
Portfolio Commentary
| | | | |
| |  | | |
Chuck Bath, CFA
Co-Manager | | Ric Dillon, CFA
Co-Manager | | Chris Bingaman, CFA
Assistant Manager |
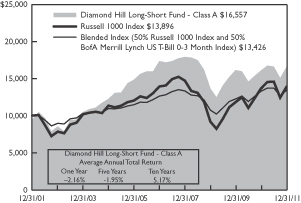
The Diamond Hill Long-Short Fund returned 3.01% (Class A, without sales charge) in 2011 compared to a 1.50% return for the long-only Russell 1000 Index and a 1.09% return for the blended benchmark (50% Russell 1000 Index / 50% BofA Merrill Lynch U.S. T-Bill 0-3 Month Index).
While we were pleased with the performance of the Fund in 2011, the returns occurred in a fairly tumultuous market. The portfolio trailed the strong market in the first four months of 2011. However, during the rapid market decline in the summer of 2011, the portfolio held up much better than the market. In the subsequent fourth quarter rally, the portfolio barely trailed the market in the strong recovery. Considering this is a long/short fund, we were gratified the portfolio was able to rally in the strong fourth quarter. It is difficult for a long/short fund to perform favorably compared to a long-only index in a strong market environment, so we were not at all disappointed that the double digit returns earned in the portfolio during the fourth quarter slightly trailed the Russell 1000 Index.
The long portion of the portfolio benefited from the strong performance of our healthcare sector holdings. The portfolio maintained a large weighting in the healthcare sector reflecting the inexpensive valuations, which proved to be beneficial in 2011. Holdings such as UnitedHealth Group, Inc.; Pfizer, Inc.; Abbott Laboratories and Amgen, Inc. provided returns in excess of 15%. Some of the holdings in this sector also benefited from their large dividend yields. As the year progressed, it seemed investors were placing a higher priority on dividend yield in an environment where it was difficult to find a high yield in any asset class.
The consumer discretionary sector was a relatively small weighting in the portfolio; however, there were a few important and successful investments in the sector. McDonald’s Corp. was the best performing stock as earnings growth continued to be strong and competitors continued to struggle. Nike, Inc. and Mattel, Inc. were also positive investments in the sector. For the most part, investments in this sector were concentrated in multinational companies with strong competitive positions. This proved to be a successful strategy in 2011.
Our energy holdings were the biggest drag on performance on the long side of the portfolio. While the sector experienced a strong cyclical recovery in the fourth quarter, it was not enough to overcome the weakness earlier in the year as investors feared a
| | |
| Page 14 | | Diamond Hill Funds Annual Report December 31, 2011 |
weakening economy would lead to falling energy prices. Devon Energy Corp. and Apache Corp. were the biggest negative contributors in the sector. Devon declined due to investor concerns regarding falling natural gas prices. While oil prices remained strong, natural gas prices weakened. Devon and Apache both have a large exposure to natural gas. In addition, Apache has a large exposure to Egypt. While there has not been any disruption to their Egyptian operations, the political environment in Egypt is unstable, adding risk to Apache’s operations in the North African country.
The short portfolio provided a positive contribution to return in 2011 with large gains in many of our technology short positions. Akamai Technologies, Inc. and Monster Worldwide, Inc. both returned in excess of 50% in 2011. Much of the success of these holdings came from covering our short positions during the period of great market stress in the third quarter of this year. Both positions were covered when the share prices reached our estimate of intrinsic value. Our investment discipline proved very beneficial in managing the short portfolio. Covering many of our short positions during the decline led to the portfolio becoming more net long as the market rallied in the fourth quarter of 2011. Other short positions such as Avery Denison Corp. and MGM Resorts International were very successful, but they did not match the return achieved in some of our technology shorts.
The biggest disappointments in our short portfolio were Macy’s, Inc. and Netflix, Inc. Both short positions were disappointing as company fundamentals continued to exceed our expectations. We continued to be short Macy’s as we remain skeptical of the long-term fundamentals.
As 2011 concluded, we were pleased with the performance of the Long-Short Fund. Although the absolute returns were modest they exceeded our benchmarks while experiencing less volatility than our long only strategies. We want to thank shareholders for their continued support and look forward to working with you in the years ahead.
| | |
| | 
|
Charles S. Bath, CFA Co-Portfolio Manager | | R. H. Dillon, CFA Co-Portfolio Manager |
Growth of $10,000
Comparison of the change in value of a $10,000 Investment in the Diamond Hill Long-Short Fund Class A(A), the Russell 1000 Index and the Blended Index (50% Russell 1000 Index and 50% BofA Merrill Lynch US T-Bill 0-3 Month Index)
| (A) | The growth of $10,000 and total return charts represent the performance of Class A shares only, adjusted for the maximum applicable sales charge of 5.00%, which will vary from the performance of Class C and Class I shares based on the difference in loads and fees paid by shareholders in the different classes. |
The performance of the above Fund does not reflect the deduction of taxes that a shareholder would pay on Fund distributions or the redemption of Fund shares.
The chart above represents a comparison of a hypothetical $10,000 investment and the reinvestment of dividends and capital gains in the indicated share class versus a similar investment in the Russell 1000 Index and the blended index. The Russell 1000 Index is a market capitalization-weighted index measuring performance of the largest 1,000 companies on a market capitalization basis, in the Russell 3000 Index. The blended index represents a 50% weighting of the Russell 1000 Index as described above and a 50% weighting of the BofA Merrill Lynch US T-Bill 0-3 Month Index. The BofA Merrill Lynch US T-Bill 0-3 Month Index tracks the performance of US dollar denominated US Treasury Bills publicly issued in the US domestic market with a remaining term to final maturity of less than 3 months. Both indices are unmanaged, and do not reflect the deduction of fees associated with a mutual fund such as investment management and accounting fees. The Fund’s performance reflects the deduction of fees for these services. Investors cannot invest directly in an index although they can invest in the underlying securities.
Past performance does not guarantee future results. The performance data quoted represents past performance and current returns may be lower or higher. The investment return and principal value will fluctuate so that an investor’s shares, when redeemed, may be worth more or less than the original cost. To obtain performance information current to the most recent month end, please visit www.diamond-hill.com.
Tabular Presentation of Investments
The table below provides the Diamond Hill Long-Short Fund’s sector allocation. We hope it will be useful to shareholders as it summarizes key information about the Fund’s investments.
December 31, 2011 Sector Allocation* (Overweight in bold)
| | | | | | | | | | | | | | | | | | | | | | | | |
| | | Health
Care | | Energy | | Financials | | Industrials | | Consumer
Staples | | Information
Technology | | Consumer
Discretionary | | Materials | | Other | | Telecom | | Utilities | | Cash
& Equiv. |
Long Portfolio | | 18.3% | | 17.5% | | 15.3% | | 11.0% | | 10.9% | | 7.7% | | 5.6% | | 3.2% | | — | | — | | — | | 10.6% |
Russell 1000 Index | | 11.7% | | 11.8% | | 14.2% | | 10.9% | | 9.4% | | 18.2% | | 12.8% | | 4.0% | | — | | 3.1% | | 4.0% | | — |
Short Portfolio | | (0.2%) | | — | | — | | (1.8%) | | (4.1%) | | (0.8%) | | (8.9%) | | — | | (1.1%) | | — | | — | | — |
* Sector allocations may not total 100% due to rounding and are subject to change.
| | |
| Diamond Hill Funds Annual Report December 31, 2011 | | Page 15 |
Diamond Hill Financial Long-Short Fund (unaudited)
Performance Update
| | | | | | | | | | | | | | | | | | | | |
| | | | | | |
Average Annual Total Returns as of December 31, 2011 | | One
Year | | | Three
Years | | | Five
Years | | | Ten
Years | | | Expense
Ratio* | |
PERFORMANCE AT NAV without sales charges | |
Class A Shares | | | -13.39% | | | | 8.05% | | | | -10.45% | | | | 2.14% | | | | 1.67% | |
Class C Shares | | | -13.99% | | | | 7.27% | | | | -11.15% | | | | 1.38% | | | | 2.42% | |
Class I Shares | | | -13.21% | | | | 8.46% | | | | -10.10% | | | | 2.35% | | | | 1.40% | |
BENCHMARK | | | | | | | | | | | | | | | | | | | | |
S&P 1500 Super Composite Financials Index | | | -15.01% | | | | 3.60% | | | | -15.40% | | | | -3.55% | | | | — | |
PERFORMANCE AT POP includes sales charges | | | | | | | | | | | | | | | | | | | | |
Class A Shares | | | -17.72% | | | | 6.20% | | | | -11.37% | | | | 1.62% | | | | 1.67% | |
Class C Shares | | | -14.85% | | | | 7.27% | | | | -11.15% | | | | 1.38% | | | | 2.42% | |
Historical performance for Class I shares prior to its inception is based on the performance of Class A shares. Class I performance has been adjusted to reflect differences in sales charges.
| * | Reflects the expense ratio as reported in the Prospectus as amended August 19, 2011. |
Past performance does not guarantee future results. The performance data quoted represents past performance and current returns may be lower or higher. The investment return and principal value will fluctuate so that an investor’s shares, when redeemed, may be worth more or less than the original cost. To obtain performance information current to the most recent month end, please visit www.diamond-hill.com.
Portfolio Commentary
| | | | |
| |  | |  |
Christopher M. Bingaman, CFA
Manager | | Austin Hawley, CFA
Assistant Manager | | John Loesch, CFA
Assistant Manager |
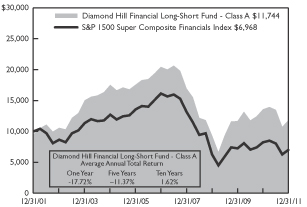
Without question, 2011 was a very difficult year for the financial sector. The Financial Long-Short Fund declined 13.39% (Class A, without sales charge) as it was negatively influenced by a heavy long bias throughout the year. The S&P 1500 SuperComposite Financials Index, the Fund’s primary benchmark, declined 15.01% and dramatically trailed the broader U.S. equity indices. The past year marked the fifth consecutive year that the financial sector trailed the broader market, and the KBW Bank Index (BKX) underperformed once again marking its seventh lagging year out of the past eight. For the trailing five-year period, the Fund declined 10.45% annually, compared to a 15.40% annual decline in the primary benchmark.
As we have written for the past few years, we believe the financial services sector is poised for attractive returns on both an absolute and relative basis over the next five years. After an extremely trying period of time, it appears most of the key industries within the sector are now well positioned for recovery after having generally dealt with credit, capital, and regulatory issues. More specifically, capital levels in virtually all areas of the
sector, but most importantly the banking industry, have increased once again over the past year, and it looks as if most of the larger domestic institutions are ready to easily meet the revised capital requirements in advance of new regulatory guidelines. Also, we continue to see greater capital clarity from key regulatory bodies, which should allow many companies to increase payouts in the coming year. Finally, valuations remain very attractive and should bode well for future returns.
Also as we have communicated over the years, we value stocks using a long time horizon and based on our estimates of normalized earnings. Once again, the combination of improving underlying business fundamentals, along with still modest valuations, led us to numerous undervalued situations and, therefore, a continuation of the heavy long bias in the portfolio. In particular, we continued to hold investments in companies which we believe have been able to substantially improve their competitive position during the recent economic/credit cycle. Examples at the larger end of the market capitalization spectrum would include two long-time holdings, Wells Fargo & Co. and US Bancorp. We also added meaningfully to a few of our small-cap holdings, many of which we now believe represent very attractive risk/reward opportunities. These organizations have either been the beneficiaries of FDIC assisted transactions or are simply dramatically undervalued relative to our estimates of underlying asset value. In addition, we continued to find value in a
| | |
| Page 16 | | Diamond Hill Funds Annual Report December 31, 2011 |
number of insurance companies with Assured Guaranty Ltd., Prudential Financial, Inc. and Hartford Financial Services Group, Inc. all in the top ten largest holdings at year-end. These companies generally experienced fundamental pressures relatively early in the cycle due to exposure to real estate related assets and/or broad exposure to the equity markets. Today, these organizations display sound balance sheets and are generally positioned to add profitable market share in their respective businesses. Finally, we continue to expect increased efficiency gains as many industries adjust to the deleveraging and generally slower economic growth of the ‘new normal’.
As always, we continue to believe shareholders in the Fund will benefit from a relatively concentrated portfolio. Also, as most of you are aware, we continue to manage the Fund as a long-short portfolio and will continue to do so for the foreseeable future. We do not intend to use our short positions as a “hedge” to mitigate our long exposure/volatility, but instead as a way to enhance our performance over time. Our short exposure will typically be much smaller than our long exposure, and therefore, we will have fewer and generally smaller positions. Finally, we continually strive to maintain our disciplined process of evaluating both the fundamentals and valuations of our current and prospective investments.
We would like to thank our shareholders for their continued support of the Fund.

Christopher M. Bingaman, CFA
Portfolio Manager
Growth of $10,000
Comparison of the change in value of a $10,000 Investment in the Diamond Hill Select Fund Class A(A) and the S&P 1500 Super Composite Financials Index.
| (A) | The growth of $10,000 and total return charts represent the performance of Class A shares only, adjusted for the maximum applicable sales charge of 5.00%, which will vary from the performance of Class C and Class I shares based on the difference in loads and fees paid by shareholders in the different classes. |
The performance of the above Fund does not reflect the deduction of taxes that a shareholder would pay on Fund distributions or the redemption of Fund shares.
The chart above represents a comparison of a hypothetical $10,000 investment and the reinvestment of dividends and capital gains in the indicated share class versus a similar investment in the S&P 1500 Super Composite Financials Index (“Index”). The Index is a market capitalized-weighted index which is comprised of the companies that represent the Financial Services Sector weighting within the S&P 1500 Super Composite Index. The Index is unmanaged, and does not reflect the deduction of fees associated with a mutual fund such as investment management and accounting fees. The Fund’s performance reflects the deduction of fees for these services. Investors cannot invest directly in an index although they can invest in the underlying securities.
Past performance does not guarantee future results. The performance data quoted represents past performance and current returns may be lower or higher. The investment return and principal value will fluctuate so that an investor’s shares, when redeemed, may be worth more or less than the original cost. To obtain performance information current to the most recent month end, please visit www.diamond-hill.com.
Tabular Presentation of Investments
The table below provides the Diamond Hill Financial Long-Short Fund’s sector allocation. We hope it will be useful to shareholders as it summarizes key information about the Fund’s investments.
December 31, 2011 Sector Allocation* (Overweight in bold)
| | | | | | | | | | | | | | | | |
| | | Banking
Services | | Insurance | | Financial
Services | | REITs &
Real Estate
Management | | Consumer
Financial
Services | | Other | | Capital
Markets | | Cash
& Equiv. |
Long Portfolio | | 38.3% | | 29.9% | | 13.8% | | 8.0% | | 2.0% | | 1.2% | | — | | 6.7% |
S&P 1500 SuperComposite Financials Index | | 20.1% | | 25.1% | | 17.7% | | 19.7% | | 4.9% | | — | | 12.5% | | — |
Short Portfolio | | (7.4%) | | — | | (0.8%) | | — | | — | | — | | — | | — |
* Sector allocations may not total 100% due to rounding and are subject to change.
| | |
| Diamond Hill Funds Annual Report December 31, 2011 | | Page 17 |
Diamond Hill Strategic Income Fund (unaudited)
Performance Update
| | | | | | | | | | | | | | | | | | | | |
| | | | | | |
Average Annual Total Returns as of December 31, 2011 | | One
Year | | | Three
Years | | | Five
Years | | | Since
Inception
(9/30/02) | | | Expense
Ratio* | |
PERFORMANCE AT NAV without sales charges | |
Class A Shares | | | 5.21% | | | | 16.36% | | | | 5.03% | | | | 7.52% | | | | 1.02% | |
Class C Shares | | | 4.48% | | | | 15.53% | | | | 4.26% | | | | 6.80% | | | | 1.77% | |
Class I Shares | | | 5.53% | | | | 16.79% | | | | 5.43% | | | | 7.83% | | | | 0.75% | |
BENCHMARK | | | | | | | | | | | | | | | | | | | | |
BofA Merrill Lynch U.S. Corporate, Government & Mortgage Index | | | 7.88% | | | | 6.51% | | | | 6.59% | | | | 5.38% | | | | — | |
BofA Merrill Lynch U.S. Corporate & High Yield Index | | | 6.80% | | | | 14.23% | | | | 6.68% | | | | 6.99% | | | | — | |
PERFORMANCE AT POP includes sales charges | | | | | | | | | | | | | | | | | | | | |
Class A Shares | | | 1.56% | | | | 14.99% | | | | 4.29% | | | | 7.11% | | | | 1.02% | |
Class C Shares | | | 3.48% | | | | 15.53% | | | | 4.26% | | | | 6.80% | | | | 1.77% | |
Historical performance for Class I shares prior to their inception is based on the performance of Class A shares. Class I performance has been adjusted to reflect differences in sales charges.
| * | Reflects the expense ratio as reported in the Prospectus as amended August 19, 2011. |
Past performance does not guarantee future results. The performance data quoted represents past performance and current returns may be lower or higher. The investment return and principal value will fluctuate so that an investor’s shares, when redeemed, may be worth more or less than the original cost. To obtain performance information current to the most recent month end, please visit www.diamond-hill.com.
Portfolio Commentary
| | | | |
 | | | | |
William Zox, CFA, J.D., LL.M.
Manager | | Christopher M. Bingaman, CFA
Assistant Manager | | Austin Hawley, CFA
Assistant Manager |
For 2011, the Diamond Hill Strategic Income Fund generated a 5.21% total return (Class A, without sales charge) compared to 7.88% for the Bank of America Merrill Lynch U.S. Corporate, Government and Mortgage Index (the “Primary Index”) and 6.80% for the Bank of America Merrill Lynch U.S. Corporate & High Yield Index (the “Supplemental Index”). For the trailing five-year period, the Fund generated a total return of 5.03% per year compared to 6.59% per year for the Primary Index and 6.68% per year for the Supplemental Index.
Since the financial crisis, the U.S. household and financial sectors have made progress in deleveraging their balance sheets but much of this has been offset by an increase in the leverage of the government sector. To this point, we have been fortunate that the markets have allowed us to proceed on the path of deleveraging in this fashion. By contrast, peripheral Europe is being forced to deleverage both private and public sectors simultaneously, which is
a difficult if not impossible task as growth continually comes in below projections.
The negative effects of the debt ceiling debacle and subsequent downgrade of the U.S. credit rating were borne by the equity markets while the Treasury bond and currency markets benefitted (although the European debt crisis and fears of a slowdown in global growth were also significant factors). Regardless, we do not believe it is prudent to assume that the markets’ patience with the U.S. Treasury will continue indefinitely during the many years of deleveraging still ahead. For this reason, as well as the historically low level of yields and the vigilance with which the Federal Reserve confronts the threat of deflation, we are not interested in bearing much interest rate risk.
In contrast, credit spreads are still attractive. At 7.23 percentage points, the year-end option adjusted spread of the Bank of America Merrill Lynch U.S. High Yield Master II Index was 1.79 percentage points wide of the 15-year median spread. While default rates have averaged about 4% per year, projections for 2012 seem to be in the range of 1.5-3.0% due in part to the significant amount of refinancing already completed over the last several years.
| | |
| Page 18 | | Diamond Hill Funds Annual Report December 31, 2011 |
For the last several years, we have discussed the impact on risk assets from the beginning of the withdrawal of the Federal Reserve’s extraordinarily accommodative monetary policy. The Federal Reserve has now communicated that it may well increase the level of accommodation in the coming months and it is highly unlikely to begin to reverse course for at least two years. We expect this policy to be beneficial to the corporate bonds in our portfolio.
We continue to maintain a portfolio of corporate bonds that generates an attractive yield with modest interest rate risk. To do this, we have to bear credit risk, and our focus is on earning an appropriate yield for the level of credit risk that we bear on each position.

William Zox, CFA, J.D., LL.M.
Portfolio Manager
Growth of $10,000
Comparison of the change in value of a $10,000 Investment in the Diamond Hill Select Fund Class A(A), the BofA Merrill Lynch U.S. Corporate, Government & Mortgage Index and BofA Merrill Lynch U.S. Corporate & High Yield Index.
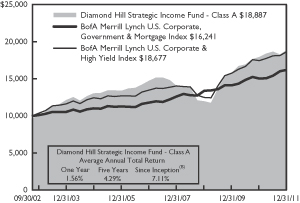
| (A) | The growth of $10,000 and total return charts represent the performance of Class A shares only, adjusted for the maximum applicable sales charge of 3.50%, which will vary from the performance of Class C and Class I shares based on the difference in loads and fees paid by shareholders in the different classes. |
| (B) | Class A shares commenced operations on September 30, 2002. |
The performance of the above Fund does not reflect the deduction of taxes that a shareholder would pay on Fund distributions or the redemption of Fund shares.
The chart above represents a comparison of a hypothetical $10,000 investment and the reinvestment of dividends and capital gains in the indicated share class versus a similar investment in the BofA Merrill Lynch U.S. Corporate, Government & Mortgage Index and the BofA Merrill Lynch U.S. Corporate & High Yield Index. The BofA Merrill Lynch U.S. Corporate, Government & Mortgage Index measures the performance of a mixture of government bonds, corporate bonds and mortgage pass through securities of investment grade quality, having a maturity greater than or equal to one year. The BofA Merrill Lynch U.S. Corporate & High Yield Index tracks the performance of the U.S. dollar denominated investment grade and below investment grade corporate debt publically issued in the U.S. domestic market. Both indices are unmanaged, and do not reflect the deduction of fees associated with a mutual fund such as investment management and accounting fees. The Fund’s performance reflects the deduction of fees for these services. Investors cannot invest directly in an index although they can invest in the underlying securities.
Past performance does not guarantee future results. The performance data quoted represents past performance and current returns may be lower or higher. The investment return and principal value will fluctuate so that an investor’s shares, when redeemed, may be worth more or less than the original cost. To obtain performance information current to the most recent month end, please visit www.diamond-hill.com.
Tabular Presentation of Investments
The table below provides the Diamond Hill Strategic Income Fund’s sector allocation. We hope it will be useful to shareholders as it summarizes key information about the Fund’s investments.
December 31, 2011 Sector Allocation (% of Net Assets)*
| | | | | | | | |
| | | Corporate Bonds | | Preferreds | | Asset-Backed
Securities | | Cash
& Equiv. |
Strategic Income Fund | | 90.4% | | 0.8% | | 0.6% | | 6.4% |
* Sector allocations may not total 100% due to rounding and are subject to change.
| | |
| Diamond Hill Funds Annual Report December 31, 2011 | | Page 19 |
Diamond Hill Small Cap Fund
Schedule of Investments
December 31, 2011
| | | | | | | | |
| | | Shares | | | Fair
Value | |
| |
| Common Stocks — 86.3% | | | | | |
Consumer Discretionary — 12.3% | | | | | |
Aaron’s, Inc.^ | | | 473,815 | | | $ | 12,641,384 | |
Callaway Golf Co.^ | | | 731,916 | | | | 4,047,496 | |
Carter’s, Inc.*^ | | | 137,905 | | | | 5,489,998 | |
Global Sources Ltd. | | | 936,347 | | | | 4,541,283 | |
Hanesbrands, Inc.* | | | 440,155 | | | | 9,621,788 | |
Hillenbrand, Inc.^ | | | 574,910 | | | | 12,831,991 | |
K-Swiss, Inc., Class A*^ | | | 727,206 | | | | 2,123,442 | |
Liquidity Services, Inc.* | | | 49,626 | | | | 1,831,200 | |
Live Nation Entertainment, Inc.*^ | | | 754,585 | | | | 6,270,601 | |
Steiner Leisure Ltd.* | | | 524,692 | | | | 23,815,770 | |
Tenneco, Inc.* | | | 411,890 | | | | 12,266,084 | |
| | | | | | | | 95,481,037 | |
| |
| Consumer Staples — 10.5% | | | | | |
B&G Foods, Inc.^ | | | 443,040 | | | | 10,663,973 | |
Diamond Foods, Inc.^ | | | 163,510 | | | | 5,276,468 | |
Energizer Holdings, Inc.* | | | 431,250 | | | | 33,413,250 | |
Flowers Foods, Inc. | | | 910,456 | | | | 17,280,455 | |
Ralcorp Holdings, Inc.* | | | 54,780 | | | | 4,683,690 | |
Ruddick Corp. | | | 190,230 | | | | 8,111,407 | |
Snyders-Lance, Inc.^ | | | 86,865 | | | | 1,954,462 | |
| | | | | | | | 81,383,705 | |
| |
| Energy — 10.5% | | | | | |
Berry Petroleum Co.,
Class A^ | | | 515,645 | | | | 21,667,403 | |
Carrizo Oil & Gas, Inc.*^ | | | 163,021 | | | | 4,295,603 | |
Cimarex Energy Co. | | | 241,295 | | | | 14,936,160 | |
Denbury Resources, Inc.* | | | 638,515 | | | | 9,641,577 | |
Exterran Holdings, Inc.*^ | | | 299,658 | | | | 2,726,888 | |
Forest Oil Corp.* | | | 222,020 | | | | 3,008,371 | |
Lone Pine Resources, Inc. | | | 135,984 | | | | 953,248 | |
Southwestern Energy Co.* | | | 208,230 | | | | 6,650,866 | |
Whiting Petroleum Corp.* | | | 375,300 | | | | 17,522,757 | |
| | | | | | | | 81,402,873 | |
| |
| Financials— 25.9% | | | | | |
Alleghany Corp.*^ | | | 40,532 | | | | 11,563,374 | |
Arch Capital Group Ltd.* | | | 280,320 | | | | 10,436,314 | |
Assurant, Inc. | | | 846,700 | | | | 34,765,502 | |
Assured Guaranty Ltd. | | | 2,416,472 | | | | 31,752,442 | |
City National Corp. | | | 101,775 | | | | 4,496,420 | |
CoreLogic, Inc.* | | | 605,225 | | | | 7,825,559 | |
First American Financial
Corp. | | | 138,245 | | | | 1,751,564 | |
First Niagara Financial Group, Inc. | | | 464,715 | | | | 4,010,490 | |
| | | | | | | | |
| | | Shares | | | Fair
Value | |
| Financials — 25.9% continued | | | | | |
HCC Insurance Holdings, Inc. | | | 212,545 | | | $ | 5,844,987 | |
Horace Mann Educators Corp. | | | 683,490 | | | | 9,370,648 | |
Huntington Bancshares, Inc. | | | 1,355,798 | | | | 7,443,331 | |
iStar Financial, Inc. REIT*^ | | | 1,963,930 | | | | 10,389,190 | |
Mid-America Apartment Communities, Inc. REIT | | | 127,569 | | | | 7,979,441 | |
National Penn Bancshares, Inc.^ | | | 659,430 | | | | 5,565,589 | |
Old Republic International Corp.^ | | | 1,707,885 | | | | 15,832,094 | |
Redwood Trust, Inc. REIT | | | 445,375 | | | | 4,533,918 | |
Selective Insurance Group, Inc. | | | 448,896 | | | | 7,958,926 | |
Sterling Bancorp | | | 493,537 | | | | 4,264,160 | |
United Fire & Casualty Co. | | | 212,675 | | | | 4,291,782 | |
White Mountains Insurance Group Ltd. | | | 15,951 | | | | 7,233,140 | |
Winthrop Realty Trust REIT | | | 378,925 | | | | 3,853,667 | |
| | | | | | | | 201,162,538 | |
| |
| Health Care — 5.5% | | | | | |
Greatbatch, Inc.* | | | 374,260 | | | | 8,271,146 | |
LifePoint Hospitals, Inc.* | | | 429,225 | | | | 15,945,709 | |
Myriad Genetics, Inc.* | | | 794,180 | | | | 16,630,129 | |
STERIS Corp. | | | 62,035 | | | | 1,849,884 | |
| | | | | | | | 42,696,868 | |
| |
| Industrials — 17.0% | | | | | |
AAR Corp. | | | 397,572 | | | | 7,621,455 | |
Allegiant Travel Co.*^ | | | 276,570 | | | | 14,752,244 | |
Apogee Enterprises, Inc.^ | | | 514,250 | | | | 6,304,705 | |
Brink’s Co., The | | | 445,435 | | | | 11,973,293 | |
Corrections Corp. of America* | | | 471,810 | | | | 9,610,770 | |
Hub Group, Inc., Class A* | | | 312,975 | | | | 10,149,779 | |
Kaydon Corp. | | | 121,285 | | | | 3,699,192 | |
Kennametal, Inc. | | | 707,865 | | | | 25,851,230 | |
NACCO Industries, Inc., Class A | | | 105,325 | | | | 9,397,096 | |
Saia, Inc. | | | 720,620 | | | | 8,993,337 | |
Southwest Airlines Co. | | | 422,564 | | | | 3,617,148 | |
Toro Co., The | | | 152,880 | | | | 9,273,701 | |
Trinity Industries, Inc. | | | 375,845 | | | | 11,297,901 | |
| | | | | | | | 132,541,851 | |
| | |
| Page 20 | | Diamond Hill Funds Annual Report December 31, 2011 |
Diamond Hill Small Cap Fund
Schedule of Investments (Continued)
December 31, 2011
| | | | | | | | |
| | | Shares | | | Fair
Value | |
|
| Common Stocks — 86.3% continued | |
Information Technology — 1.8% | | | | | |
Broadridge Financial Solutions, Inc. | | | 274,155 | | | $ | 6,182,195 | |
CSG Systems International, Inc.* | | | 561,947 | | | | 8,266,241 | |
| | | | | | | | 14,448,436 | |
| |
| Utilities — 2.8% | | | | | |
Cleco Corp. | | | 308,315 | | | | 11,746,801 | |
UGI Corp. | | | 349,690 | | | | 10,280,886 | |
| | | | | | | | 22,027,687 | |
| |
| Total Common Stocks | | | $ | 671,144,995 | |
|
Registered Investment Company — 6.3% | |
Fidelity Institutional Prime Money Market Portfolio, 0.16%† | | | 48,719,835 | | | | 48,719,835 | |
|
| Total Investment Securities — 92.6% | |
(Cost $667,548,496)** | | | | | | $ | 719,864,830 | |
| | |
| Net Other Assets (Liabilities) — 7.4% | | | | | | | 57,260,842 | |
| |
Net Assets — 100.0% | | | $ | 777,125,672 | |
| * | Non-income producing security. |
| ** | Represents cost for financial reporting purposes. |
| ^ | All or a portion of the security is on loan. The total fair value of the securities on loan, as of December 31, 2011, was $47,083,414. |
| † | This security, which was purchased using cash collateral received from securities on loan, represents collateral for securities loaned as of December 31, 2011. |
REIT – Real Estate Investment Trust
See accompanying Notes to Financial Statements.
Diamond Hill Small-Mid Cap Fund
Schedule of Investments
December 31, 2011
| | | | | | | | |
| | | Shares | | | Fair
Value | |
| |
| Common Stocks — 96.9% | | | | | |
| Consumer Discretionary — 8.9% | |
Aaron’s, Inc. | | | 15,085 | | | $ | 402,468 | |
Callaway Golf Co.^ | | | 76,185 | | | | 421,303 | |
Carter’s, Inc.*^ | | | 20,675 | | | | 823,072 | |
Hanesbrands, Inc.* | | | 29,450 | | | | 643,777 | |
Hillenbrand, Inc. | | | 45,580 | | | | 1,017,346 | |
K-Swiss, Inc., Class A* | | | 69,910 | | | | 204,137 | |
Leggett & Platt, Inc. | | | 38,500 | | | | 887,040 | |
Mattel, Inc. | | | 29,990 | | | | 832,522 | |
Steiner Leisure Ltd.* | | | 19,620 | | | | 890,552 | |
| | | | | | | | 6,122,217 | |
| |
| Consumer Staples — 14.6% | | | | | |
B&G Foods, Inc. | | | 33,470 | | | | 805,623 | |
ConAgra Foods, Inc. | | | 111,050 | | | | 2,931,720 | |
Energizer Holdings, Inc.* | | | 27,465 | | | | 2,127,988 | |
Flowers Foods, Inc. | | | 72,972 | | | | 1,385,008 | |
Molson Coors Brewing Co., Class B | | | 29,845 | | | | 1,299,451 | |
Ralcorp Holdings, Inc.* | | | 9,690 | | | | 828,495 | |
Ruddick Corp. | | | 16,390 | | | | 698,870 | |
| | | | | | | | 10,077,155 | |
| | |
| Energy — 15.0% | | | | | | | | |
Berry Petroleum Co., Class A | | | 23,080 | | | | 969,822 | |
Cimarex Energy Co. | | | 35,150 | | | | 2,175,785 | |
Denbury Resources, Inc.* | | | 98,358 | | | | 1,485,206 | |
Energen Corp. | | | 18,200 | | | | 910,000 | |
Exterran Holdings, Inc.* | | | 48,615 | | | | 442,396 | |
Forest Oil Corp.* | | | 10,245 | | | | 138,820 | |
Lone Pine Resources, Inc. | | | 6,509 | | | | 45,628 | |
Noble Energy, Inc. | | | 32,320 | | | | 3,050,685 | |
Southwestern Energy Co.* | | | 8,440 | | | | 269,574 | |
Whiting Petroleum Corp.* | | | 19,005 | | | | 887,343 | |
| | | | | | | | 10,375,259 | |
| | |
| Financials — 22.7% | | | | | | | | |
Alleghany Corp.*^ | | | 3,824 | | | | 1,090,949 | |
Arch Capital Group Ltd.* | | | 7,575 | | | | 282,017 | |
Assurant, Inc. | | | 52,665 | | | | 2,162,425 | |
Assured Guaranty Ltd. | | | 226,120 | | | | 2,971,217 | |
CoreLogic, Inc.* | | | 76,975 | | | | 995,287 | |
First Niagara Financial Group, Inc. | | | 119,755 | | | | 1,033,486 | |
Hartford Financial Services Group, Inc., The | | | 61,425 | | | | 998,156 | |
HCC Insurance Holdings, Inc. | | | 37,595 | | | | 1,033,862 | |
Huntington Bancshares, Inc. | | | 148,709 | | | | 816,412 | |
iStar Financial, Inc. REIT*^ | | | 149,605 | | | | 791,410 | |
National Penn Bancshares, Inc. | | | 84,500 | | | | 713,180 | |
| | |
| Diamond Hill Funds Annual Report December 31, 2011 | | Page 21 |
Diamond Hill Small-Mid Cap Fund
Schedule of Investments (Continued)
December 31, 2011
| | | | | | | | |
| | | Shares | | | Fair
Value | |
|
| Common Stocks — 96.9% continued | |
| Financials — 22.7% continued | | | | | |
Popular, Inc.* | | | 398,795 | | | $ | 554,325 | |
SunTrust Banks, Inc. | | | 24,365 | | | | 431,261 | |
White Mountains Insurance Group Ltd. | | | 1,405 | | | | 637,111 | |
XL Group plc | | | 57,315 | | | | 1,133,118 | |
| | | | | | | | 15,644,216 | |
| | |
| Health Care — 11.7% | | | | | | | | |
Forest Laboratories, Inc.* | | | 76,630 | | | | 2,318,824 | |
Greatbatch, Inc.* | | | 34,520 | | | | 762,892 | |
Life Technologies Corp.* | | | 17,585 | | | | 684,232 | |
LifePoint Hospitals, Inc.* | | | 28,000 | | | | 1,040,200 | |
Myriad Genetics, Inc.* | | | 38,540 | | | | 807,028 | |
Quest Diagnostics, Inc. | | | 42,665 | | | | 2,477,130 | |
| | | | | | | | 8,090,306 | |
| | |
| Industrials — 14.5% | | | | | | | | |
Alaska Air Group, Inc.* | | | 5,290 | | | | 397,226 | |
Brink’s Co., The | | | 31,735 | | | | 853,037 | |
Corrections Corp. of America* | | | 52,625 | | | | 1,071,971 | |
Dover Corp. | | | 47,420 | | | | 2,752,731 | |
Fluor Corp. | | | 12,790 | | | | 642,698 | |
Hub Group, Inc., Class A* | | | 22,445 | | | | 727,891 | |
Kennametal, Inc. | | | 22,790 | | | | 832,291 | |
Parker Hannifin Corp. | | | 6,325 | | | | 482,281 | |
Southwest Airlines Co. | | | 161,694 | | | | 1,384,101 | |
Toro Co., The | | | 14,665 | | | | 889,579 | |
| | | | | | | | 10,033,806 | |
| |
| Information Technology — 6.9% | | | | | |
Broadridge Financial Solutions, Inc. | | | 69,100 | | | | 1,558,205 | |
CSG Systems International, Inc.* | | | 40,075 | | | | 589,503 | |
Juniper Networks, Inc.* | | | 45,950 | | | | 937,840 | |
KLA-Tencor Corp. | | | 9,880 | | | | 476,710 | |
Linear Technology Corp. | | | 38,565 | | | | 1,158,107 | |
| | | | | | | | 4,720,365 | |
| | |
| Utilities — 2.6% | | | | | | | | |
Cleco Corp. | | | 16,855 | | | | 642,175 | |
UGI Corp. | | | 39,510 | | | | 1,161,594 | |
| | | | | | | | 1,803,769 | |
| | |
| Total Common Stocks | | | | | | $ | 66,867,093 | |
| | | | | | | | |
| | | Shares | | | Fair
Value | |
|
| Registered Investment Company — 3.0% | |
Fidelity Institutional Prime Money Market Portfolio, 0.16%† | | | 2,091,375 | | | $ | 2,091,375 | |
|
| Total Investment Securities — 99.9% | |
(Cost $62,712,411)** | | | | | | $ | 68,958,468 | |
| | |
| Net Other Assets (Liabilities) — 0.1% | | | | | | | 97,955 | |
| | |
| Net Assets — 100.0% | | | | | | $ | 69,056,423 | |
| * | Non-income producing security. |
| ** | Represents cost for financial reporting purposes. |
| ^ | All or a portion of the security is on loan. The total fair value of the securities on loan, as of December 31, 2011, was $1,985,296. |
| † | This security, which was purchased using cash collateral received from securities on loan, represents collateral for securities loaned as of December 31, 2011. |
REIT – Real Estate Investment Trust
See accompanying Notes to Financial Statements.
| | |
| Page 22 | | Diamond Hill Funds Annual Report December 31, 2011 |
Diamond Hill Large Cap Fund
Schedule of Investments
December 31, 2011
| | | | | | | | |
| | | Shares | | | Fair
Value | |
| |
Common Stocks — 98.2% | | | | | |
Consumer Discretionary — 5.8% | |
Mattel, Inc.^ | | | 625,450 | | | $ | 17,362,492 | |
McDonald’s Corp. | | | 270,259 | | | | 27,115,085 | |
Nike, Inc., Class B | | | 201,830 | | | | 19,450,357 | |
Walt Disney Co., The | | | 308,255 | | | | 11,559,563 | |
| | | | | | | | 75,487,497 | |
| |
Consumer Staples — 13.5% | | | | | |
ConAgra Foods, Inc. | | | 1,025,043 | | | | 27,061,135 | |
General Mills, Inc. | | | 645,653 | | | | 26,090,838 | |
Kimberly-Clark Corp.^ | | | 226,045 | | | | 16,627,870 | |
PepsiCo, Inc. | | | 603,125 | | | | 40,017,344 | |
Procter & Gamble Co., The | | | 599,832 | | | | 40,014,793 | |
Sysco Corp. | | | 907,564 | | | | 26,618,852 | |
| | | | | | | | 176,430,832 | |
| |
Energy — 17.0% | | | | | |
Anadarko Petroleum Corp. | | | 636,530 | | | | 48,586,335 | |
Apache Corp. | | | 269,303 | | | | 24,393,466 | |
Devon Energy Corp. | | | 641,247 | | | | 39,757,314 | |
EOG Resources, Inc. | | | 312,223 | | | | 30,757,088 | |
Exxon Mobil Corp. | | | 322,160 | | | | 27,306,281 | |
Occidental Petroleum Corp. | | | 552,247 | | | | 51,745,544 | |
| | | | | | | | 222,546,028 | |
| |
Financials — 18.0% | | | | | |
American Express Co. | | | 379,540 | | | | 17,902,902 | |
Chubb Corp., The | | | 385,120 | | | | 26,658,006 | |
JPMorgan Chase & Co. | | | 631,095 | | | | 20,983,909 | |
Marsh & McLennan Cos., Inc. | | | 648,554 | | | | 20,507,277 | |
PNC Financial Services Group, Inc. | | | 605,305 | | | | 34,907,939 | |
Prudential Financial, Inc. | | | 515,713 | | | | 25,847,536 | |
Travelers Cos., Inc., The | | | 574,439 | | | | 33,989,556 | |
U.S. Bancorp | | | 1,006,753 | | | | 27,232,669 | |
Wells Fargo & Co. | | | 1,018,165 | | | | 28,060,627 | |
| | | | | | | | 236,090,421 | |
| |
Health Care — 20.9% | | | | | |
Abbott Laboratories | | | 710,717 | | | | 39,963,617 | |
Amgen, Inc. | | | 280,195 | | | | 17,991,321 | |
Baxter International, Inc. | | | 403,807 | | | | 19,980,370 | |
Johnson & Johnson | | | 460,159 | | | | 30,177,227 | |
Medtronic, Inc. | | | 1,064,892 | | | | 40,732,119 | |
Merck & Co., Inc. | | | 979,450 | | | | 36,925,265 | |
Pfizer, Inc. | | | 1,944,682 | | | | 42,082,919 | |
| | | | | | | | |
| | | Shares | | | Fair
Value | |
Health Care — 20.9% continued | | | | | |
Quest Diagnostics, Inc. | | | 331,775 | | | $ | 19,262,857 | |
UnitedHealth Group, Inc. | | | 510,096 | | | | 25,851,665 | |
| | | | | | | | 272,967,360 | |
| |
Industrials — 11.8% | | | | | |
3M Co. | | | 318,717 | | | | 26,048,740 | |
Dover Corp. | | | 476,483 | | | | 27,659,838 | |
Fluor Corp.^ | | | 236,120 | | | | 11,865,030 | |
Illinois Tool Works, Inc. | | | 481,684 | | | | 22,499,460 | |
Parker Hannifin Corp. | | | 311,634 | | | | 23,762,093 | |
United Technologies Corp. | | | 588,227 | | | | 42,993,511 | |
| | | | | | | | 154,828,672 | |
| |
Information Technology — 8.2% | | | | | |
Cisco Systems, Inc. | | | 1,381,336 | | | | 24,974,555 | |
International Business Machines Corp. | | | 137,105 | | | | 25,210,867 | |
Juniper Networks, Inc.* | | | 603,450 | | | | 12,316,415 | |
Linear Technology Corp. | | | 424,770 | | | | 12,755,843 | |
Microsoft Corp. | | | 1,262,495 | | | | 32,774,370 | |
| | | | | | | | 108,032,050 | |
| |
Materials — 3.0% | | | | | |
Air Products & Chemicals, Inc.^ | | | 310,165 | | | | 26,422,956 | |
PPG Industries, Inc. | | | 148,165 | | | | 12,370,296 | |
| | | | | | | | 38,793,252 | |
| | |
| Total Common Stocks | | | | | | $ | 1,285,176,112 | |
|
Registered Investment Company — 1.4% | |
Fidelity Institutional Prime Money Market Portfolio, 0.16%† | | | 17,791,000 | | | | 17,791,000 | |
|
Total Investment Securities — 99.6% | |
(Cost $1,152,266,162)** | | | | | | $ | 1,302,967,112 | |
| | |
| Net Other Assets (Liabilities) — 0.4% | | | | | | | 4,777,261 | |
| | |
| Net Assets — 100.0% | | | | | | $ | 1,307,744,373 | |
| * | Non-income producing security. |
| ** | Represents cost for financial reporting purposes. |
| ^ | All or a portion of the security is on loan. The total fair value of the securities on loan, as of December 31, 2011, was $17,350,743. |
| † | This security, which was purchased using cash collateral received from securities on loan, represents collateral for securities loaned as of December 31, 2011. |
See accompanying Notes to Financial Statements.
| | |
| Diamond Hill Funds Annual Report December 31, 2011 | | Page 23 |
Diamond Hill Select Fund
Schedule of Investments
December 31, 2011
| | | | | | | | |
| | | Shares | | | Fair
Value | |
| |
Common Stocks — 96.9% | | | | | |
Consumer Discretionary — 2.9% | |
Hanesbrands, Inc.* | | | 18,185 | | | $ | 397,524 | |
McDonald’s Corp. | | | 9,615 | | | | 964,673 | |
| | | | | | | | 1,362,197 | |
| |
Consumer Staples — 13.6% | | | | | |
ConAgra Foods, Inc. | | | 63,383 | | | | 1,673,311 | |
General Mills, Inc. | | | 23,355 | | | | 943,776 | |
PepsiCo, Inc. | | | 13,605 | | | | 902,692 | |
Procter & Gamble Co., The | | | 17,095 | | | | 1,140,407 | |
Sysco Corp.^ | | | 54,765 | | | | 1,606,257 | |
| | | | | | | | 6,266,443 | |
| |
Energy — 14.2% | | | | | |
Anadarko Petroleum Corp. | | | 12,820 | | | | 978,551 | |
Apache Corp. | | | 15,345 | | | | 1,389,950 | |
Cimarex Energy Co. | | | 17,650 | | | | 1,092,535 | |
Devon Energy Corp. | | | 20,075 | | | | 1,244,650 | |
Occidental Petroleum Corp. | | | 15,770 | | | | 1,477,649 | |
Southwestern Energy Co.* | | | 11,665 | | | | 372,580 | |
| | | | | | | | 6,555,915 | |
| |
Financials — 22.8% | | | | | |
Arch Capital Group Ltd.* | | | 19,495 | | | | 725,799 | |
Assurant, Inc. | | | 30,180 | | | | 1,239,191 | |
Assured Guaranty Ltd. | | | 111,820 | | | | 1,469,315 | |
iStar Financial, Inc. REIT*^ | | | 74,230 | | | | 392,677 | |
JPMorgan Chase & Co. | | | 35,640 | | | | 1,185,030 | |
PNC Financial Services Group, Inc. | | | 8,740 | | | | 504,036 | |
Prudential Financial, Inc. | | | 31,760 | | | | 1,591,811 | |
Travelers Cos., Inc., The | | | 8,520 | | | | 504,128 | |
U.S. Bancorp | | | 51,825 | | | | 1,401,866 | |
Wells Fargo & Co. | | | 54,260 | | | | 1,495,405 | |
| | | | | | | | 10,509,258 | |
| |
Health Care — 19.7% | | | | | |
Abbott Laboratories | | | 21,340 | | | | 1,199,948 | |
Baxter International, Inc. | | | 24,360 | | | | 1,205,333 | |
Johnson & Johnson | | | 16,685 | | | | 1,094,202 | |
Medtronic, Inc. | | | 40,441 | | | | 1,546,868 | |
Merck & Co., Inc. | | | 33,640 | | | | 1,268,228 | |
Pfizer, Inc. | | | 59,240 | | | | 1,281,954 | |
UnitedHealth Group, Inc. | | | 29,062 | | | | 1,472,862 | |
| | | | | | | | 9,069,395 | |
| |
Industrials — 13.8% | | | | | |
3M Co. | | | 10,955 | | | | 895,352 | |
Dover Corp. | | | 16,555 | | | | 961,018 | |
Illinois Tool Works, Inc. | | | 19,953 | | | | 932,005 | |
| | | | | | | | |
| | | Shares | | | Fair
Value | |
Industrials — 13.8% continued | | | | | |
Parker Hannifin Corp. | | | 8,220 | | | $ | 626,775 | |
Southwest Airlines Co. | | | 158,235 | | | | 1,354,492 | |
United Technologies Corp. | | | 21,870 | | | | 1,598,478 | |
| | | | | | | | 6,368,120 | |
| |
Information Technology — 7.3% | | | | | |
Cisco Systems, Inc. | | | 28,070 | | | | 507,506 | |
International Business Machines Corp. | | | 7,950 | | | | 1,461,846 | |
Microsoft Corp. | | | 53,075 | | | | 1,377,827 | |
| | | | | | | | 3,347,179 | |
| |
Materials — 2.6% | | | | | |
Air Products & Chemicals, Inc. | | | 13,915 | | | | 1,185,419 | |
| | |
| Total Common Stocks | | | | | | $ | 44,663,926 | |
|
Registered Investment Company — 4.5% | |
Fidelity Institutional Prime Money Market Portfolio, 0.16%† | | | 2,071,644 | | | | 2,071,644 | |
|
Total Investment Securities — 101.4% | |
(Cost $42,313,226)** | | | | | | $ | 46,735,570 | |
| | |
| Net Other Assets (Liabilities) — (1.4)% | | | | | | | (646,771 | ) |
| | |
| Net Assets — 100.0% | | | | | | $ | 46,088,799 | |
| * | Non-income producing security. |
| ** | Represents cost for financial reporting purposes. |
| ^ | All or a portion of the security is on loan. The total fair value of the securities on loan, as of December 31, 2011, was $1,974,768. |
| † | This security, which was purchased using cash collateral received from securities on loan, represents collateral for securities loaned as of December 31, 2011. |
REIT – Real Estate Investment Trust
See accompanying Notes to Financial Statements.
| | |
| Page 24 | | Diamond Hill Funds Annual Report December 31, 2011 |
Diamond Hill Long-Short Fund
Schedule of Investments
December 31, 2011
| | | | | | | | |
| | | Shares | | | Fair Value | |
|
Common Stocks — 89.2% | |
Consumer Discretionary — 5.6% | | | | | |
Mattel, Inc. | | | 1,009,592 | | | $ | 28,026,274 | |
McDonald’s Corp. | | | 387,109 | | | | 38,838,646 | |
Nike, Inc., Class B | | | 209,190 | | | | 20,159,640 | |
Walt Disney Co., The | | | 436,705 | | | | 16,376,438 | |
| | | | | | | | 103,400,998 | |
|
Consumer Staples — 10.9% | |
ConAgra Foods, Inc. | | | 1,495,270 | | | | 39,475,128 | |
General Mills, Inc. | | | 969,432 | | | | 39,174,747 | |
PepsiCo, Inc. | | | 671,715 | | | | 44,568,290 | |
Procter & Gamble Co., The | | | 712,625 | | | | 47,539,214 | |
Sysco Corp.^ | | | 1,030,662 | | | | 30,229,317 | |
| | | | | | | | 200,986,696 | |
|
Energy — 17.4% | |
Anadarko Petroleum Corp. | | | 878,818 | | | | 67,080,178 | |
Apache Corp. | | | 390,101 | | | | 35,335,349 | |
Cimarex Energy Co. | | | 247,155 | | | | 15,298,894 | |
Devon Energy Corp. | | | 724,160 | | | | 44,897,920 | |
EOG Resources, Inc. | | | 458,785 | | | | 45,194,910 | |
Exxon Mobil Corp. | | | 496,873 | | | | 42,114,955 | |
Occidental Petroleum Corp. | | | 765,008 | | | | 71,681,250 | |
| | | | | | | | 321,603,456 | |
|
Financials — 15.3% | |
American Express Co. | | | 590,085 | | | | 27,834,309 | |
Assurant, Inc. | | | 474,550 | | | | 19,485,023 | |
Assured Guaranty Ltd.& | | | 1,720,965 | | | | 22,613,480 | |
Chubb Corp., The | | | 243,080 | | | | 16,825,998 | |
JPMorgan Chase & Co. | | | 456,960 | | | | 15,193,920 | |
PNC Financial Services Group, Inc. | | | 657,985 | | | | 37,945,995 | |
Prudential Financial, Inc. | | | 684,790 | | | | 34,321,675 | |
Travelers Cos., Inc., The | | | 743,060 | | | | 43,966,860 | |
U.S. Bancorp& | | | 1,237,337 | | | | 33,469,966 | |
Wells Fargo & Co.& | | | 1,112,985 | | | | 30,673,867 | |
| | | | | | | | 282,331,093 | |
|
Health Care — 18.2% | |
Abbott Laboratories& | | | 894,385 | | | | 50,291,269 | |
Amgen, Inc. | | | 395,390 | | | | 25,387,992 | |
Baxter International, Inc. | | | 532,601 | | | | 26,353,097 | |
Johnson & Johnson | | | 484,675 | | | | 31,784,987 | |
Medtronic, Inc. | | | 1,201,662 | | | | 45,963,571 | |
Merck & Co., Inc. | | | 983,440 | | | | 37,075,688 | |
Pfizer, Inc. | | | 2,399,810 | | | | 51,931,888 | |
| | | | | | | | |
| | | Shares | | | Fair Value | |
| |
| Health Care — 18.2% continued | | | | | |
Quest Diagnostics, Inc.^ | | | 520,710 | | | $ | 30,232,423 | |
UnitedHealth Group, Inc.& | | | 734,855 | | | | 37,242,451 | |
| | | | | | | | 336,263,366 | |
| | |
| Industrials — 11.0% | | | | | | | | |
3M Co. | | | 388,675 | | | | 31,766,408 | |
Dover Corp. | | | 631,235 | | | | 36,643,191 | |
Fluor Corp. | | | 308,080 | | | | 15,481,020 | |
Illinois Tool Works, Inc. | | | 580,380 | | | | 27,109,550 | |
Parker Hannifin Corp. | | | 492,400 | | | | 37,545,500 | |
United Technologies Corp. | | | 738,400 | | | | 53,969,656 | |
| | | | | | | | 202,515,325 | |
| |
| Information Technology — 7.6% | | | | | |
Cisco Systems, Inc. | | | 1,926,670 | | | | 34,834,194 | |
International Business Machines Corp.^ | | | 273,945 | | | | 50,373,006 | |
Juniper Networks, Inc.* | | | 967,305 | | | | 19,742,695 | |
Microsoft Corp.& | | | 1,393,525 | | | | 36,175,909 | |
| | | | | | | | 141,125,804 | |
| | |
| Materials — 3.2% | | | | | | | | |
Air Products & Chemicals, Inc.& | | | 464,683 | | | | 39,586,345 | |
PPG Industries, Inc. | | | 222,500 | | | | 18,576,525 | |
| | | | | | | | 58,162,870 | |
| |
| Total Common Stocks | | | $ | 1,646,389,608 | |
|
Registered Investment Company — 0.5% | |
Fidelity Institutional Prime Money Market Portfolio, 0.16%† | | | 8,718,022 | | | | 8,718,022 | |
|
Total Investment Securities — 89.7% | |
(Cost $1,369,348,114)** | | | | | | $ | 1,655,107,630 | |
| |
Segregated Cash
With Brokers — 17.0% | | | | 314,226,784 | |
| |
Securities Sold Short — (16.8%) | | | | | |
(Proceeds $273,799,681) | | | | (310,123,005 | ) |
| | |
| Net Other Assets (Liabilities) — 10.1% | | | | | | | 186,629,841 | |
| | |
| Net Assets — 100.0% | | | | | | $ | 1,845,841,250 | |
| | |
| Diamond Hill Funds Annual Report December 31, 2011 | | Page 25 |
Diamond Hill Long-Short Fund
Schedule of Investments (Continued)
December 31, 2011
| * | Non-income producing security. |
| ** | Represents cost for financial reporting purposes. |
| ^ | All or a portion of the security is on loan. The total fair value of the securities on loan, as of December 31, 2011, was $8,440,103. |
| & | Security position is either entirely or partially held in a segregated account as collateral for securities sold short and aggregates to a total fair value of $181,628,963. |
| † | This security, which was purchased using cash collateral received from securities on loan, represents collateral for securities loaned as of December 31, 2011. |
See accompanying Notes to Financial Statements.
Diamond Hill Long-Short Fund
Schedule of Investments Sold Short
December 31, 2011
| | | | | | | | |
| | | Shares | | | Fair Value | |
| |
| Common Stocks — 15.7% | | | | | |
Consumer Discretionary — 8.9% | | | | | |
Apollo Group, Inc., Class A* | | | 737,840 | | | $ | 39,747,441 | |
Brunswick Corp. | | | 935,075 | | | | 16,887,455 | |
ITT Educational Services, Inc.* | | | 63,690 | | | | 3,623,324 | |
Life Time Fitness, Inc.* | | | 753,174 | | | | 35,210,885 | |
Macy’s, Inc. | | | 884,055 | | | | 28,448,890 | |
MGM Resorts International* | | | 457,481 | | | | 4,771,527 | |
Nordstrom, Inc. | | | 89,715 | | | | 4,459,733 | |
Panera Bread Co., Class A* | | | 78,150 | | | | 11,054,317 | |
Red Robin Gourmet Burgers, Inc.* | | | 323,655 | | | | 8,965,243 | |
Tractor Supply Co. | | | 161,929 | | | | 11,359,319 | |
| | | | | | | | 164,528,134 | |
| |
| Consumer Staples — 4.1% | | | | | |
Campbell Soup Co. | | | 280,200 | | | | 9,313,848 | |
Colgate-Palmolive Co. | | | 183,535 | | | | 16,956,799 | |
H.J. Heinz Co. | | | 367,538 | | | | 19,861,753 | |
Kraft Foods, Inc., Class A | | | 774,400 | | | | 28,931,584 | |
| | | | | | | | 75,063,984 | |
| | |
| Health Care — 0.1% | | | | | | | | |
Lincare Holdings, Inc. | | | 111,255 | | | | 2,860,366 | |
| | |
| Industrials — 1.8% | | | | | | | | |
Boeing Co., The | | | 442,235 | | | | 32,437,937 | |
| |
| Information Technology — 0.8% | | | | | |
Advent Software, Inc.* | | | 199,750 | | | | 4,865,910 | |
Nokia Oyj, SP ADR | | | 2,227,315 | | | | 10,735,658 | |
| | | | | | | | 15,601,568 | |
| |
| Total Common Stocks Sold Short | | | $ | 290,491,989 | |
| |
| Exchange Traded Fund — 1.1% | | | | | |
iShares Russell 2000 Index Fund | | | 266,400 | | | $ | 19,631,016 | |
| |
| Total Securities Sold Short — 16.8% | | | | | |
(Proceeds $273,799,681) | | | | | | $ | 310,123,005 | |
| * | Non-dividend expense producing security. |
ADR – American Depository Receipt
Percentages disclosed are based on total net assets of the Fund at December 31, 2011.
See accompanying Notes to Financial Statements.
| | |
| Page 26 | | Diamond Hill Funds Annual Report December 31, 2011 |
Diamond Hill Financial Long-Short Fund
Schedule of Investments
December 31, 2011
| | | | | | | | |
| | | Shares | | | Fair Value | |
|
Preferred Stocks — 2.4% | |
Banking Services — 1.1% | | | | | |
Citizens Funding Trust I, 0.47% | | | 4,405 | | | $ | 103,914 | |
|
REITs & Real Estate Management — 1.3% | |
iStar Financial, Inc., Series F, 0.49% | | | 8,017 | | | | 115,044 | |
| | |
| Total Preferred Stocks | | | | | | $ | 218,958 | |
|
Common Stocks — 89.8% | |
Banking Services — 36.0% | | | | | |
BB&T Corp. | | | 3,201 | | | | 80,569 | |
City National Corp. | | | 2,375 | | | | 104,927 | |
First California Financial Group, Inc. | | | 21,626 | | | | 70,501 | |
First Financial Holdings, Inc. | | | 18,884 | | | | 168,634 | |
First Niagara Financial Group, Inc. | | | 21,250 | | | | 183,387 | |
First of Long Island Corp., The | | | 6,245 | | | | 164,368 | |
First Republic Bank of California* | | | 3,675 | | | | 112,492 | |
Huntington Bancshares, Inc.& | | | 30,036 | | | | 164,898 | |
National Penn Bancshares, Inc. | | | 5,290 | | | | 44,648 | |
PNC Financial Services Group, Inc.& | | | 7,374 | | | | 425,259 | |
Popular, Inc.* | | | 179,050 | | | | 248,879 | |
Sterling Bancorp | | | 16,425 | | | | 141,912 | |
SunTrust Banks, Inc. | | | 10,777 | | | | 190,753 | |
U.S. Bancorp& | | | 16,213 | | | | 438,562 | |
Wells Fargo & Co.& | | | 25,911 | | | | 714,107 | |
| | | | | | | | 3,253,896 | |
|
Consumer Financial Services — 2.0% | |
American Express Co. | | | 2,905 | | | | 137,029 | |
Discover Financial Services | | | 1,855 | | | | 44,520 | |
| | | | | | | | 181,549 | |
|
Financial Services — 13.8% | |
Bank of America Corp. | | | 8,515 | | | | 47,344 | |
Bank of New York Mellon Corp., The& | | | 10,944 | | | | 217,895 | |
CME Group, Inc. | | | 800 | | | | 194,936 | |
JPMorgan Chase & Co. | | | 16,500 | | | | 548,625 | |
Morgan Stanley& | | | 15,825 | | | | 239,432 | |
| | | | | | | | 1,248,232 | |
|
Insurance — 30.0% | |
ACE Ltd. | | | 2,260 | | | | 158,471 | |
Alleghany Corp.* | | | 168 | | | | 47,929 | |
Assurant, Inc.& | | | 5,610 | | | | 230,347 | |
| | | | | | | | |
| | | Shares | | | Fair Value | |
| |
Insurance — 30.0% continued | | | | | |
Assured Guaranty Ltd. | | | 42,080 | | | $ | 552,930 | |
Chubb Corp., The | | | 780 | | | | 53,992 | |
Hartford Financial Services Group, Inc., The | | | 18,193 | | | | 295,636 | |
HCC Insurance Holdings, Inc. | | | 3,790 | | | | 104,225 | |
Horace Mann Educators Corp. | | | 14,613 | | | | 200,344 | |
Old Republic International Corp. | | | 7,680 | | | | 71,194 | |
Prudential Financial, Inc. | | | 7,545 | | | | 378,155 | |
Selective Insurance Group, Inc. | | | 7,440 | | | | 131,911 | |
Travelers Cos., Inc., The | | | 2,750 | | | | 162,717 | |
White Mountains Insurance Group Ltd. | | | 200 | | | | 90,692 | |
XL Group plc | | | 11,430 | | | | 225,971 | |
| | | | | | | | 2,704,514 | |
| | |
| Other — 1.2% | | | | | | | | |
CoreLogic, Inc.* | | | 8,490 | | | | 109,776 | |
|
| REITs & Real Estate Management — 6.8% | |
iStar Financial, Inc. REIT*^ | | | 45,900 | | | | 242,811 | |
Redwood Trust, Inc. REIT | | | 20,840 | | | | 212,151 | |
Winthrop Realty Trust REIT | | | 15,220 | | | | 154,788 | |
| | | | | | | | 609,750 | |
| |
| Total Common Stocks | | | $ | 8,107,717 | |
| | |
| Corporate Bond — 1.1% | | | | | | | | |
Banking Services — 1.1% | | | | | | | | |
Synovus Financial Corp.,
4.88%, 2/15/13 | | | 105,000 | | | $ | 100,275 | |
|
Registered Investment Company — 2.6% | |
Fidelity Institutional Prime Money Market Portfolio, 0.16%† | | | 235,175 | | | | 235,175 | |
|
Total Investment Securities — 95.9% | |
(Cost $8,640,798)** | | | | | | $ | 8,662,125 | |
| |
Segregated Cash
With Brokers — 8.1% | | | | 728,910 | |
| |
Securities Sold Short — (8.2%) | | | | | |
(Proceeds $666,762) | | | | (739,272 | ) |
| | |
| Net Other Assets (Liabilities) — 4.2% | | | | | | | 377,839 | |
| | |
| Net Assets — 100.0% | | | | | | $ | 9,029,602 | |
| | |
| Diamond Hill Funds Annual Report December 31, 2011 | | Page 27 |
Diamond Hill Financial Long-Short Fund
Schedule of Investments (Continued)
December 31, 2011
| * | Non-income producing security. |
| ** | Represents cost for financial reporting purposes. |
| ^ | All or a portion of the security is on loan. The total fair value of the securities on loan, as of December 31, 2011, was $216,361. |
| & | Security position is either entirely or partially held in a segregated account as collateral for securities sold short and aggregates to a total fair value of $1,614,634. |
| † | This security, which was purchased using cash collateral received from securities on loan, represents collateral for securities loaned as of December 31, 2011. |
REIT – Real Estate Investment Trust
See accompanying Notes to Financial Statements.
Diamond Hill Financial Long-Short Fund
Schedule of Investments Sold Short
December 31, 2011
| | | | | | | | |
| | | Shares | | | Fair Value | |
| |
| Common Stocks — 8.2% | | | | | |
Banking Services — 7.4% | | | | | |
Bank of the Ozarks, Inc. | | | 8,100 | | | $ | 240,003 | |
Home Bancshares, Inc. | | | 5,400 | | | | 139,914 | |
Lakeland Bancorp, Inc. | | | 5,760 | | | | 49,651 | |
United Bankshares, Inc. | | | 7,264 | | | | 205,354 | |
WesBanco, Inc. | | | 1,675 | | | | 32,612 | |
| | | | | | | | 667,534 | |
| | |
| Financial Services — 0.8% | | | | | | | | |
Moody’s Corp. | | | 2,130 | | | | 71,738 | |
| |
| Total Securities Sold Short — 8.2% | | | | | |
(Proceeds $666,762) | | | | | | $ | 739,272 | |
Percentages disclosed are based on total net assets of the Fund at December 31, 2011.
See accompanying Notes to Financial Statements.
| | |
| Page 28 | | Diamond Hill Funds Annual Report December 31, 2011 |
Diamond Hill Strategic Income Fund
Schedule of Investments
December 31, 2011
| | | | | | | | |
| | | Shares/ Par Value | | | Fair Value | |
|
| Collateralized Debt Obligations — 0.6% | |
Alesco Preferred Funding III, 4/5/2034*# | | $ | 724,100 | | | $ | 107,819 | |
Alesco Preferred Funding Ltd., Series 6A, Class PPNE, 3/23/2035*# | | | 336,608 | | | | 94,536 | |
Alesco Preferred Funding VI PNN, 3/23/2035*# | | | 621,631 | | | | 175,474 | |
Fort Sheridan ABS CDO Ltd., Series 2005-1A, Class PPN2, 5/11/2041*# | | | 611,948 | | | | 186,503 | |
Taberna Preferred Funding Ltd., Series 2005-1A, Class PPN2, 5/7/2035*# | | | 1,175,564 | | | | 316,544 | |
| | |
Total Collateralized
Debt Obligations | | | | | | $ | 880,876 | |
| |
| Preferred Stocks — 0.8% | | | | | |
Eagle Hospitality Properties Trust, Inc., 8.25%,
Series A REIT†† | | | 21,007 | | | | 32,561 | |
Hartford Financial Services Group, Inc., 7.25%,
Series F, 0.45%^ | | | 60,135 | | | | 1,129,335 | |
| | |
| Total Preferred Stocks | | | | | | $ | 1,161,896 | |
| |
| Corporate Bonds — 90.4% | | | | | |
Consumer Discretionary — 10.9% | | | | | |
Expedia, Inc., 8.50%, 7/1/16^ | | $ | 3,000,000 | | | | 3,235,413 | |
Expedia, Inc., 7.46%, 8/15/18 | | | 1,700,000 | | | | 1,914,416 | |
Goodyear Tire & Rubber Co., The,
10.50%, 5/15/16 | | | 3,285,000 | | | | 3,621,712 | |
Jarden Corp.,
8.00%, 5/1/16 | | | 2,650,000 | | | | 2,862,000 | |
Tenneco, Inc.,
7.75%, 8/15/18^ | | | 4,115,000 | | | | 4,361,900 | |
| | | | | | | | 15,995,441 | |
| |
| Consumer Staples — 2.3% | | | | | |
B&G Foods, Inc.,
7.63%, 1/15/18^ | | | 1,850,000 | | | | 1,965,625 | |
TreeHouse Foods, Inc., 7.75%, 3/1/18 | | | 1,350,000 | | | | 1,461,375 | |
| | | | | | | | 3,427,000 | |
| | |
| Energy — 10.0% | | | | | | | | |
Anadarko Petroleum Corp., 5.95%, 9/15/16^ | | | 4,400,000 | | | | 4,988,654 | |
| | | | | | | | |
| | | Par Value | | | Fair Value | |
| |
| Energy — 10.0% continued | | | | | |
Bristow Group, Inc.,
7.50%, 9/15/17 | | $ | 1,665,000 | | | $ | 1,731,600 | |
Carrizo Oil & Gas, Inc., 8.63%, 10/15/18 | | | 3,000,000 | | | | 3,030,000 | |
Cimarex Energy Co.,
7.13%, 5/1/17 | | | 4,640,000 | | | | 4,837,200 | |
| | | | | | | | 14,587,454 | |
| | |
| Financials— 23.1% | | | | | | | | |
AmSouth Bank, Series AI, 4.85%, 4/1/13^ | | | 1,850,000 | | | | 1,789,875 | |
CNA Financial Corp.,
6.50%, 8/15/16^ | | | 2,165,000 | | | | 2,342,249 | |
Discover Financial Services, 6.45%, 6/12/17 | | | 2,700,000 | | | | 2,821,238 | |
First Horizon National Corp.,
4.50%, 5/15/13 | | | 1,400,000 | | | | 1,404,654 | |
First Horizon National Corp.,
5.38%, 12/15/15 | | | 3,000,000 | | | | 3,037,293 | |
First Tennessee Bank NA, 5.05%, 1/15/15 | | | 1,150,000 | | | | 1,152,122 | |
iStar Financial, Inc., Series B, 5.70%, 3/1/14 | | | 5,275,000 | | | | 4,391,437 | |
Nuveen Investments, Inc., 10.50%, 11/15/15 | | | 3,000,000 | | | | 2,977,500 | |
Regions Financial Corp., 5.75%, 6/15/15 | | | 3,000,000 | | | | 2,865,000 | |
Symetra Financial Corp., 6.13%, 4/1/16†† | | | 4,750,000 | | | | 4,800,939 | |
Synovus Financial Corp., 4.88%, 2/15/13 | | | 1,530,000 | | | | 1,461,150 | |
Zions Bancorp.,
7.75%, 9/23/14 | | | 4,380,000 | | | | 4,644,635 | |
| | | | | | | | 33,688,092 | |
| | |
| Health Care— 4.4% | | | | | | | | |
HealthSouth Corp.,
7.25%, 10/1/18 | | | 2,045,000 | | | | 2,029,663 | |
Mylan, Inc., 7.63%, 7/15/17†† | | | 4,000,000 | | | | 4,365,000 | |
| | | | | | | | 6,394,663 | |
| | |
| Industrials— 27.3% | | | | | | | | |
Avis Budget Car Rental, 9.63%, 3/15/18^ | | | 5,800,000 | | | | 6,003,000 | |
BE Aerospace, Inc.,
8.50%, 7/1/18^ | | | 5,020,000 | | | | 5,496,900 | |
Continental Airlines, Inc., 6.75%, 9/15/15 | | | 2,000,000 | | | | 1,905,000 | |
| | |
| Diamond Hill Funds Annual Report December 31, 2011 | | Page 29 |
Diamond Hill Strategic Income Fund
Schedule of Investments (Continued)
December 31, 2011
| | | | | | | | |
| | | Par Value | | | Fair Value | |
|
| Corporate Bonds — 90.4% continued | |
Industrials — 27.3% continued | | | | | |
Corrections Corp. of America,
7.75%, 6/1/17^ | | $ | 2,050,000 | | | $ | 2,224,250 | |
Crown Americas LLC/Crown Americas Capital Corp. II,
7.63%, 5/15/17 | | | 1,710,000 | | | | 1,866,037 | |
Iron Mountain, Inc.,
6.63%, 1/1/16^ | | | 4,075,000 | | | | 4,075,000 | |
Kansas City Southern, 8.00%, 2/1/18 | | | 2,850,000 | | | | 3,120,750 | |
RSC Equipment Rental, Inc./RSC Holdings
III LLC,
9.50%, 12/1/14 | | | 3,000,000 | | | | 3,082,500 | |
Triumph Group, Inc., 8.00%, 11/15/17 | | | 3,525,000 | | | | 3,754,125 | |
United Rentals North America, Inc.,
10.88%, 6/15/16^ | | | 4,110,000 | | | | 4,562,100 | |
Wabtec Corp.,
6.88%, 7/31/13^ | | | 3,650,000 | | | | 3,805,125 | |
| | | | | | | | 39,894,787 | |
| |
| Information Technology — 4.6% | | | | | |
KLA-Tencor Corp.,
6.90%, 5/1/18^ | | | 4,478,000 | | | | 5,162,471 | |
ManTech International Corp.,
7.25%, 4/15/18 | | | 1,500,000 | | | | 1,528,125 | |
| | | | | | | | 6,690,596 | |
| | |
| Materials — 2.7% | | | | | | | | |
NewMarket Corp.,
7.13%, 12/15/16 | | | 2,200,000 | | | | 2,249,500 | |
Silgan Holdings, Inc., 7.25%, 8/15/16 | | | 1,625,000 | | | | 1,734,688 | |
| | | | | | | | 3,984,188 | |
|
| Telecommunication Services — 2.2% | |
Level 3 Financing, Inc., 10.00%, 2/1/18 | | | 3,025,000 | | | | 3,206,500 | |
| | |
| Utilities — 2.9% | | | | | | | | |
Source Gas LLC,
5.90%, 4/1/17†† | | | 4,000,000 | | | | 4,244,220 | |
| | |
| Total Corporate Bonds | | | | | | $ | 132,112,941 | |
| | | | | | | | |
| | | Shares | | | Fair Value | |
|
| Registered Investment Company —10.4% | |
Fidelity Institutional Prime Money Market Portfolio, 0.16%† | | | 15,132,697 | | | $ | 15,132,697 | |
|
| Total Investment Securities — 102.2% | |
(Cost $147,418,090)** | | | | | | $ | 149,288,410 | |
| | |
| Net Other Assets (Liabilities) — (2.2)% | | | | | | | (3,257,880 | ) |
| | |
| Net Assets — 100.0% | | | | | | $ | 146,030,530 | |
| * | Non-income producing security. |
| ** | Represents cost for financial reporting purposes. |
| ^ | All or a portion of the security is on loan. The total fair value of the securities on loan, as of December 31, 2011, was $14,429,204. |
| † | This security, which was purchased using cash collateral received from securities on loan, represents collateral for securities loaned as of December 31, 2011. |
| †† | Restricted securities not registered under the Securities Act of 1933 and deemed liquid based on procedures approved by the Board of Trustees are as follows: |
| | | | | | | | | | | | | | | | |
| | | Acquisition
Date | | | Current
Cost | | | Value | | | Value as a
% of
Net Assets | |
Eagle Hospitality Properties Trust, Inc. | | | February-07 | | | $ | 494,217 | | | $ | 32,561 | | | | 0.0% | |
Mylan, Inc. | | | September-10 | | | | 4,264,477 | | | | 4,365,000 | | | | 3.0% | |
Source Gas LLC | | | March-10 | | | | 3,871,259 | | | | 4,244,220 | | | | 2.9% | |
Symetra Financial Corp. | | | February-11 | | | | 4,943,475 | | | | 4,800,939 | | | | 3.3% | |
| | | | | | | | | | | | | | | | |
| | | | | | $ | 13,573,428 | | | $ | 13,442,720 | | | | 9.2% | |
| | | | | | | | | | | | | | | | |
| # | Restricted and illiquid securities not registered under the securities Act of 1933 and valued at fair value by management: |
| | | | | | | | | | | | | | | | |
| | | Acquisition
Date | | | Current
Cost | | | Value | | | Value as a
% of
Net Assets | |
Alesco Preferred Funding III | | | March-05 | | | $ | 724,100 | | | $ | 107,819 | | | | 0.1% | |
Alesco Preferred Funding Ltd., Series 6A, Class PPNE | | | May-05 | | | | 336,608 | | | | 94,536 | | | | 0.1% | |
Alesco Preferred Funding VI PNN | | | March-05 | | | | 621,631 | | | | 175,474 | | | | 0.1% | |
Fort Sheridan ABS CDO Ltd., Series 2005-1A, Class PPN2 | | | March-05 | | | | 511,640 | | | | 186,503 | | | | 0.1% | |
Taberna Preferred Funding Ltd., Series 2005-1A, Class PPN2 | | | March-05 | | | | 1,038,401 | | | | 316,544 | | | | 0.2% | |
| | | | | | | | | | | | | | | | |
| | | | | | $ | 3,232,380 | | | $ | 880,876 | | | | 0.6% | |
| | | | | | | | | | | | | | | | |
REIT – Real Estate Investment Trust
See accompanying Notes to Financial Statements.
| | |
| Page 30 | | Diamond Hill Funds Annual Report December 31, 2011 |
Diamond Hill Funds
Statements of Assets & Liabilities
December 31, 2011
| | | | | | | | | | | | | | | | |
| | | Small Cap
Fund | | | Small-Mid
Cap
Fund | | | Large Cap
Fund | | | Select
Fund | |
Assets | | | | | | | | | | | | | | | | |
Total investment securities, at cost | | $ | 667,548,496 | | | $ | 62,712,411 | | | $ | 1,152,266,162 | | | $ | 42,313,226 | |
| | | | | | | | |
Investment securities, at fair value - including $47,083,414, $1,985,296, $17,350,743, and $1,974,768 of securities loaned | | $ | 719,864,830 | | | $ | 68,958,468 | | | $ | 1,302,967,112 | | | $ | 46,735,570 | |
Cash | | | 106,958,680 | | | | 2,192,753 | | | | 21,558,808 | | | | 1,417,835 | |
Receivable for fund shares issued | | | 921,413 | | | | 9,959 | | | | 1,200,255 | | | | 3,935 | |
Receivable for dividends and interest | | | 573,704 | | | | 64,717 | | | | 1,962,943 | | | | 58,994 | |
| | | | | | | | |
Total Assets | | | 828,318,627 | | | | 71,225,897 | | | | 1,327,689,118 | | | | 48,216,334 | |
| | | | | | | | |
| | | | |
Liabilities | | | | | | | | | | | | | | | | |
Payable for securities purchased | | | 135,457 | | | | - | | | | - | | | | - | |
Payable for fund shares redeemed | | | 1,467,408 | | | | 3,575 | | | | 1,022,781 | | | | 10,076 | |
Payable for return of collateral received | | | 48,719,835 | | | | 2,091,375 | | | | 17,791,000 | | | | 2,071,644 | |
Payable to Investment Adviser | | | 525,836 | | | | 43,937 | | | | 604,140 | | | | 27,234 | |
Payable to Administrator | | | 165,599 | | | | 14,496 | | | | 274,036 | | | | 9,537 | |
Accrued distribution and service fees | | | 118,202 | | | | 10,643 | | | | 149,299 | | | | 4,792 | |
Payable to accountant and custodian | | | 60,618 | | | | 5,448 | | | | 103,489 | | | | 4,252 | |
| | | | | | | | |
Total Liabilities | | | 51,192,955 | | | | 2,169,474 | | | | 19,944,745 | | | | 2,127,535 | |
| | | | | | | | |
| | | | |
Net Assets | | $ | 777,125,672 | | | $ | 69,056,423 | | | $ | 1,307,744,373 | | | $ | 46,088,799 | |
| | | | | | | | |
| | | | |
Components of Net Assets | | | | | | | | | | | | | | | | |
Paid-in capital | | $ | 723,489,231 | | | $ | 63,501,434 | | | $ | 1,217,028,305 | | | $ | 42,689,738 | |
Accumulated net investment income (loss) | | | - | | | | 47,075 | | | | 3,375,715 | | | | 472,840 | |
Accumulated net realized gains (losses) from investment transactions | | | 1,320,107 | | | | (738,143 | ) | | | (63,360,597 | ) | | | (1,496,123 | ) |
Net unrealized appreciation (depreciation) on investments | | | 52,316,334 | | | | 6,246,057 | | | | 150,700,950 | | | | 4,422,344 | |
| | | | | | | | |
Net Assets | | $ | 777,125,672 | | | $ | 69,056,423 | | | $ | 1,307,744,373 | | | $ | 46,088,799 | |
| | | | | | | | |
| | | | |
Pricing of Class A Shares | | | | | | | | | | | | | | | | |
Net assets attributable to Class A shares | | $ | 431,313,119 | | | $ | 17,461,142 | | | $ | 593,123,540 | | | $ | 8,071,039 | |
| | | | | | | | |
Shares of beneficial interest outstanding
(unlimited number of shares authorized, no par value) | | | 18,722,768 | | | | 1,491,214 | | | | 39,660,432 | | | | 832,972 | |
| | | | | | | | |
Net asset value and redemption price per share | | $ | 23.04 | | | $ | 11.71 | | | $ | 14.96 | | | $ | 9.69 | |
| | | | | | | | |
Maximum offering price per share | | $ | 24.25 | | | $ | 12.33 | | | $ | 15.75 | | | $ | 10.20 | |
| | | | | | | | |
| | | | |
Pricing of Class C Shares | | | | | | | | | | | | | | | | |
Net assets attributable to Class C shares | | $ | 31,664,009 | | | $ | 8,110,323 | | | $ | 30,464,999 | | | $ | 3,629,854 | |
| | | | | | | | |
Shares of beneficial interest outstanding
(unlimited number of shares authorized, no par value) | | | 1,484,066 | | | | 719,089 | | | | 2,106,603 | | | | 381,609 | |
| | | | | | | | |
Net asset value, offering price and redemption price per share(A) | | $ | 21.34 | | | $ | 11.28 | | | $ | 14.46 | | | $ | 9.51 | |
| | | | | | | | |
| | | | |
Pricing of Class I Shares | | | | | | | | | | | | | | | | |
Net assets attributable to Class I shares | | $ | 314,148,544 | | | $ | 43,484,958 | | | $ | 684,155,834 | | | $ | 34,387,906 | |
| | | | | | | | |
Shares of beneficial interest outstanding
(unlimited number of shares authorized, no par value) | | | 13,497,868 | | | | 3,692,062 | | | | 45,591,712 | | | | 3,553,447 | |
| | | | | | | | |
Net asset value, offering price and redemption price per share | | $ | 23.27 | | | $ | 11.78 | | | $ | 15.01 | | | $ | 9.68 | |
| | | | | | | | |
| (A) | Redemption price per share varies based upon holding period. |
See accompanying Notes to Financial Statements.
| | |
| Diamond Hill Funds Annual Report December 31, 2011 | | Page 31 |
Diamond Hill Funds
Statements of Assets & Liabilities
December 31, 2011
| | | | | | | | | | | | |
| | | Long-Short
Fund | | | Financial
Long-Short
Fund | | | Strategic
Income
Fund | |
Assets | | | | | | | | | | | | |
Total investment securities, at cost | | $ | 1,369,348,114 | | | $ | 8,640,798 | | | $ | 147,418,090 | |
| | | | | | | | |
Investment securities, at fair value - including $8,440,103, $216,361, and $14,429,204 of securities loaned | | $ | 1,655,107,630 | | | $ | 8,662,125 | | | $ | 149,288,410 | |
Cash | | | 192,303,593 | | | | 646,213 | | | | 9,389,083 | |
Deposit with broker for securities sold short | | | 314,226,784 | | | | 728,910 | | | | - | |
Receivable for securities sold | | | - | | | | 76,267 | | | | - | |
Receivable for fund shares issued | | | 5,974,871 | | | | 7,957 | | | | 70,846 | |
Receivable for dividends and interest | | | 2,098,636 | | | | 12,920 | | | | 2,555,767 | |
| | | | | | | | |
Total Assets | | | 2,169,711,514 | | | | 10,134,392 | | | | 161,304,106 | |
| | | | | | | | |
| | | |
Liabilities | | | | | | | | | | | | |
Securities sold short, at fair value (proceeds $273,799,681 for the Long-Short Fund and $666,762 for the Financial Long-Short Fund) | | | 310,123,005 | | | | 739,272 | | | | - | |
Payable for securities purchased | | | - | | | | 44,321 | | | | - | |
Payable for dividends on securities sold short | | | 570,658 | | | | 2,275 | | | | - | |
Payable for fund shares redeemed | | | 2,341,703 | | | | 73,026 | | | | 20,315 | |
Payable for return of collateral received | | | 8,718,022 | | | | 235,175 | | | | 15,132,697 | |
Payable to Investment Adviser | | | 1,397,843 | | | | 6,600 | | | | 60,838 | |
Payable to Administrator | | | 383,447 | | | | 1,975 | | | | 30,247 | |
Accrued distribution and service fees | | | 210,384 | | | | 2,136 | | | | 28,046 | |
Payable to accountant and custodian | | | 125,202 | | | | 10 | | | | 1,433 | |
| | | | | | | | |
Total Liabilities | | | 323,870,264 | | | | 1,104,790 | | | | 15,273,576 | |
| | | | | | | | |
| | | |
Net Assets | | $ | 1,845,841,250 | | | $ | 9,029,602 | | | $ | 146,030,530 | |
| | | | | | | | |
| | | |
Components of Net Assets | | | | | | | | | | | | |
Paid-in capital | | $ | 2,202,507,230 | | | $ | 23,284,805 | | | $ | 161,481,024 | |
Accumulated net investment income (loss) | | | 6,308,984 | | | | - | | | | 165,784 | |
Accumulated net realized gains (losses) from investment transactions | | | (612,411,156 | ) | | | (14,204,020 | ) | | | (17,486,598 | ) |
Net unrealized appreciation (depreciation) on investments | | | 249,436,192 | | | | (51,183 | ) | | | 1,870,320 | |
| | | | | | | | |
Net Assets | | $ | 1,845,841,250 | | | $ | 9,029,602 | | | $ | 146,030,530 | |
| | | | | | | | |
| | | |
Pricing of Class A Shares | | | | | | | | | | | | |
Net assets attributable to Class A shares | | $ | 512,869,535 | | | $ | 6,650,381 | | | $ | 38,894,803 | |
| | | | | | | | |
Shares of beneficial interest outstanding
(unlimited number of shares authorized, no par value) | | | 30,627,189 | | | | 632,768 | | | | 3,603,138 | |
| | | | | | | | |
Net asset value and redemption price per share | | $ | 16.75 | | | $ | 10.51 | | | $ | 10.79 | |
| | | | | | | | |
Maximum offering price per share | | $ | 17.63 | | | $ | 11.06 | | | $ | 11.18 | |
| | | | | | | | |
| | | |
Pricing of Class C Shares | | | | | | | | | | | | |
Net assets attributable to Class C shares | | $ | 119,849,595 | | | $ | 795,204 | | | $ | 23,717,263 | |
| | | | | | | | |
Shares of beneficial interest outstanding
(unlimited number of shares authorized, no par value) | | | 7,625,025 | | | | 79,881 | | | | 2,199,431 | |
| | | | | | | | |
Net asset value, offering price and redemption price per share(A)(B) | | $ | 15.72 | | | $ | 9.96 | | | $ | 10.78 | |
| | | | | | | | |
| | | |
Pricing of Class I Shares | | | | | | | | | | | | |
Net assets attributable to Class I shares | | $ | 1,213,122,120 | | | $ | 1,584,017 | | | $ | 83,418,464 | |
| | | | | | | | |
Shares of beneficial interest outstanding
(unlimited number of shares authorized, no par value) | | | 71,648,581 | | | | 151,250 | | | | 7,743,272 | |
| | | | | | | | |
Net asset value, offering price and redemption price per share | | $ | 16.93 | | | $ | 10.47 | | | $ | 10.77 | |
| | | | | | | | |
| (A) | Redemption price per share varies based upon holding period. |
| (B) | Per share amounts may not recalculate due to the timing of reporting trades for financial statement purposes. |
See accompanying Notes to Financial Statements.
| | |
| Page 32 | | Diamond Hill Funds Annual Report December 31, 2011 |
Diamond Hill Funds
Statements of Operations
For the year ended December 31, 2011
| | | | | | | | | | | | | | | | |
| | | Small Cap
Fund | | | Small-Mid
Cap
Fund | | | Large Cap
Fund | | | Select
Fund | |
Investment Income | | | | | | | | | | | | | | | | |
Dividends | | $ | 8,390,810 | | | $ | 978,491 | | | $ | 27,087,467 | | | $ | 957,446 | |
Interest | | | 25,682 | | | | 444 | | | | 5,039 | | | | 363 | |
| | | | | | | | |
Total Investment Income | | | 8,416,492 | | | | 978,935 | | | | 27,092,506 | | | | 957,809 | |
| | | | | | | | |
| | | | |
Expenses | | | | | | | | | | | | | | | | |
Investment advisory fees | | | 6,658,505 | | | | 573,961 | | | | 6,872,894 | | | | 311,406 | |
Administration fees | | | 2,107,925 | | | | 187,228 | | | | 2,890,359 | | | | 107,328 | |
Distribution fees - Class A | | | 1,183,209 | | | | 48,883 | | | | 1,191,513 | | | | 19,910 | |
Distribution and service fees - Class C | | | 345,843 | | | | 83,768 | | | | 299,874 | | | | 39,206 | |
Accounting and custody fees | | | 86,283 | | | | 6,711 | | | | 170,856 | | | | 7,118 | |
| | | | | | | | |
Net Expenses | | | 10,381,765 | | | | 900,551 | | | | 11,425,496 | | | | 484,968 | |
| | | | | | | | |
| | | | |
Net Investment Income (Loss) | | | (1,965,273 | ) | | | 78,384 | | | | 15,667,010 | | | | 472,841 | |
| | | | | | | | |
| | | | |
Realized and Unrealized Gains (Losses) on Investments | | | | | | | | | | | | | | | | |
Net realized gains (losses) from security sales | | | 37,188,307 | | | | 2,139,908 | | | | 12,766,818 | | | | 791,820 | |
Net change in unrealized appreciation (depreciation) on investments | | | (95,394,991 | ) | | | (6,346,976 | ) | | | 2,373,247 | | | | (2,133,231 | ) |
| | | | | | | | |
Net Realized and Unrealized Gains (Losses) on Investments | | | (58,206,684 | ) | | | (4,207,068 | ) | | | 15,140,065 | | | | (1,341,411 | ) |
| | | | | | | | |
| | | | |
Change in Net Assets from Operations | | $ | (60,171,957 | ) | | $ | (4,128,684 | ) | | $ | 30,807,075 | | | $ | (868,570 | ) |
| | | | | | | | |
| | | | |
| | | | | | Long-Short
Fund | | | Financial
Long-Short
Fund | | | Strategic
Income
Fund | |
Investment Income | | | | | | | | | | | | | | | | |
Dividends | | | | | | $ | 35,355,066 | | | $ | 197,967 | | | $ | 109,046 | |
Interest | | | | | | | 39,250 | | | | 3,611 | | | | 9,973,701 | |
Securities lending income | | | | | | | - | | | | - | | | | 3,951 | |
| | | | | | | | | | | | |
Total Investment Income | | | | | | | 35,394,316 | | | | 201,578 | | | | 10,086,698 | |
| | | | | | | | | | | | |
| | | | |
Expenses | | | | | | | | | | | | | | | | |
Investment advisory fees | | | | | | | 16,786,488 | | | | 111,530 | | | | 738,671 | |
Administration fees | | | | | | | 4,593,348 | | | | 28,999 | | | | 365,990 | |
Distribution fees - Class A | | | | | | | 1,479,759 | | | | 19,325 | | | | 107,454 | |
Distribution and service fees - Class C | | | | | | | 1,435,157 | | | | 11,398 | | | | 239,216 | |
Accounting and custody fees | | | | | | | 298,580 | | | | 1,886 | | | | - | |
Dividend expense on securities sold short | | | | | | | 4,491,965 | | | | 13,895 | | | | - | |
| | | | | | | | | | | | |
Net Expenses | | | | | | | 29,085,297 | | | | 187,033 | | | | 1,451,331 | |
| | | | | | | | | | | | |
| | | | |
Net Investment Income (Loss) | | | | | | | 6,309,019 | | | | 14,545 | | | | 8,635,367 | |
| | | | | | | | | | | | |
| | | | |
Realized and Unrealized Gains (Losses) on Investments | | | | | | | | | | | | | | | | |
Net realized gains (losses) from security sales | | | | | | | (9,156,109 | ) | | | 251,461 | | | | 1,292,968 | |
Net realized gains (losses) on closed short positions | | | | | | | 4,274,910 | | | | 66,927 | | | | - | |
Net change in unrealized appreciation (depreciation) on investments | | | | | | | 50,048,450 | | | | (2,061,015 | ) | | | (2,444,055 | ) |
| | | | | | | | | | | | |
Net Realized and Unrealized Gains (Losses) on Investments | | | | | | | 45,167,251 | | | | (1,742,627 | ) | | | (1,151,087 | ) |
| | | | | | | | | | | | |
| | | | |
Change in Net Assets from Operations | | | | | | $ | 51,476,270 | | | $ | (1,728,082 | ) | | $ | 7,484,280 | |
| | | | | | | | | | | | |
See accompanying Notes to Financial Statements.
| | |
| Diamond Hill Funds Annual Report December 31, 2011 | | Page 33 |
Diamond Hill Funds
Statements of Changes in Net Assets
| | | | | | | | | | | | | | | | | | | | | | | | | | | | | | | | | | | | | | |
| | | Small Cap Fund | | | | | Small-Mid Cap Fund | | | | | Large Cap Fund | | | | | Select Fund | |
| | | For the Year
Ended
December 31,
2011 | | | For the Year
Ended
December 31,
2010 | | | | | For the Year
Ended
December 31,
2011 | | | For the Year
Ended
December 31,
2010 | | | | | For the Year
Ended
December 31,
2011 | | | For the Year
Ended
December 31,
2010 | | | | | For the Year
Ended
December 31,
2011 | | | For the Year
Ended
December 31,
2010 | |
From Operations | | | | | | | | | | | | | | | | | | | | | | | | | | | | | | | | | | | | | | |
Net investment income (loss) | | $ | (1,965,273 | ) | | $ | (880,390 | ) | | | | $ | 78,384 | | | $ | 8,692 | | | | | $ | 15,667,010 | | | $ | 9,679,313 | | | | | $ | 472,841 | | | $ | 305,602 | |
Net realized gains (losses) from security sales | | | 37,188,307 | | | | 52,577,163 | | | | | | 2,139,908 | | | | 3,294,096 | | | | | | 12,766,818 | | | | 10,149,784 | | | | | | 791,820 | | | | 853,152 | |
Net change in unrealized appreciation (depreciation) on investments | | | (95,394,991 | ) | | | 96,105,153 | | | | | | (6,346,976 | ) | | | 8,000,766 | | | | | | 2,373,247 | | | | 72,974,502 | | | | | | (2,133,231 | ) | | | 2,910,338 | |
| | | | | | | | | | | | | | | | | | | | | | |
Change in Net Assets from Operations | | | (60,171,957 | ) | | | 147,801,926 | | | | | | (4,128,684 | ) | | | 11,303,554 | | | | | | 30,807,075 | | | | 92,803,599 | | | | | | (868,570 | ) | | | 4,069,092 | |
| | | | | | | | | | | | | | | | | | | | | | |
| | | | | | | | | | | |
Distributions to Shareholders | | | | | | | | | | | | | | | | | | | | | | | | | | | | | | | | | | | | | | |
From net investment income: | | | | | | | | | | | | | | | | | | | | | | | | | | | | | | | | | | | | | | |
Class A | | | - | | | | - | | | | | | - | | | | - | | | | | | (6,627,845 | ) | | | (3,174,891 | ) | | | | | (39,417 | ) | | | (5,324 | ) |
Class C | | | - | | | | - | | | | | | - | | | | - | | | | | | (108,384 | ) | | | (7,277 | ) | | | | | - | | | | - | |
Class I | | | (445,201 | ) | | | - | | | | | | (40,001 | ) | | | (47,033 | ) | | | | | (8,894,235 | ) | | | (6,529,972 | ) | | | | | (266,183 | ) | | | (155,500 | ) |
From net realized gains on investments: | | | | | | | | | | | | | | | | | | | | | | | | | | | | | | | | | | | | | | |
Class A | | | (16,023,649 | ) | | | (7,686,104 | ) | | | | | (471,879 | ) | | | (4,694 | ) | | | | | - | | | | - | | | | | | - | | | | - | |
Class C | | | (1,266,765 | ) | | | (574,550 | ) | | | | | (228,014 | ) | | | (2,217 | ) | | | | | - | | | | - | | | | | | - | | | | - | |
Class I | | | (11,544,894 | ) | | | (4,688,890 | ) | | | | | (1,160,054 | ) | | | (13,348 | ) | | | | | - | | | | - | | | | | | - | | | | - | |
| | | | | | | | | | | | | | | | | | | | | | |
Change in Net Assets from Distributions to Shareholders | | | (29,280,509 | ) | | | (12,949,544 | ) | | | | | (1,899,948 | ) | | | (67,292 | ) | | | | | (15,630,464 | ) | | | (9,712,140 | ) | | | | | (305,600 | ) | | | (160,824 | ) |
| | | | | | | | | | | | | | | | | | | | | | |
| | | | | | | | | | | |
From Capital Transactions | | | | | | | | | | | | | | | | | | | | | | | | | | | | | | | | | | | | | | |
Class A | | | | | | | | | | | | | | | | | | | | | | | | | | | | | | | | | | | | | | |
Proceeds from shares sold | | | 131,626,237 | | | | 165,849,296 | | | | | | 8,319,078 | | | | 12,157,686 | | | | | | 289,734,415 | | | | 219,386,955 | | | | | | 3,731,198 | | | | 2,049,801 | |
Reinvested distributions | | | 14,169,771 | | | | 7,134,182 | | | | | | 407,144 | | | | 4,133 | | | | | | 6,334,730 | | | | 3,000,868 | | | | | | 36,147 | | | | 4,779 | |
Payments for shares redeemed | | | (164,898,697 | ) | | | (195,854,251 | ) | | | | | (6,999,177 | ) | | | (5,901,187 | ) | | | | | (168,247,710 | ) | | | (140,028,087 | ) | | | | | (3,032,680 | ) | | | (2,211,552 | ) |
| | | | | | | | | | | | | | | | | | | | | | |
Change in Net Assets from Class A Share Transactions | | | (19,102,689 | ) | | | (22,870,773 | ) | | | | | 1,727,045 | | | | 6,260,632 | | | | | | 127,821,435 | | | | 82,359,736 | | | | | | 734,665 | | | | (156,972 | ) |
| | | | | | | | | | | | | | | | | | | | | | |
| | | | | | | | | | | |
Class C | | | | | | | | | | | | | | | | | | | | | | | | | | | | | | | | | | | | | | |
Proceeds from shares sold | | | 4,817,516 | | | | 10,432,535 | | | | | | 2,444,891 | | | | 3,003,957 | | | | | | 8,075,647 | | | | 8,599,012 | | | | | | 880,095 | | | | 1,462,563 | |
Reinvested distributions | | | 1,125,427 | | | | 513,137 | | | | | | 165,889 | | | | 1,579 | | | | | | 90,617 | | | | 6,204 | | | | | | - | | | | - | |
Payments for shares redeemed | | | (5,186,954 | ) | | | (4,383,475 | ) | | | | | (1,193,527 | ) | | | (1,073,799 | ) | | | | | (7,215,073 | ) | | | (7,084,631 | ) | | | | | (1,420,240 | ) | | | (1,013,783 | ) |
| | | | | | | | | | | | | | | | | | | | | | |
Change in Net Assets from Class C Share Transactions | | | 755,989 | | | | 6,562,197 | | | | | | 1,417,253 | | | | 1,931,737 | | | | | | 951,191 | | | | 1,520,585 | | | | | | (540,145 | ) | | | 448,780 | |
| | | | | | | | | | | | | | | | | | | | | | |
| | | | | | | | | | | |
Class I | | | | | | | | | | | | | | | | | | | | | | | | | | | | | | | | | | | | | | |
Proceeds from shares sold | | | 151,539,487 | | | | 267,239,689 | | | | | | 15,324,872 | | | | 14,273,930 | | | | | | 216,458,037 | | | | 322,102,816 | | | | | | 11,919,530 | | | | 8,271,464 | |
Reinvested distributions | | | 9,502,510 | | | | 3,784,526 | | | | | | 1,007,091 | | | | 48,470 | | | | | | 7,384,792 | | | | 5,074,239 | | | | | | 246,689 | | | | 143,710 | |
Payments for shares redeemed | | | (124,741,223 | ) | | | (109,398,154 | ) | | | | | (13,735,919 | ) | | | (3,493,338 | ) | | | | | (172,128,016 | ) | | | (99,975,636 | ) | | | | | (8,407,897 | ) | | | (2,809,148 | ) |
| | | | | | | | | | | | | | | | | | | | | | |
Change in Net Assets from Class I Share Transactions | | | 36,300,774 | | | | 161,626,061 | | | | | | 2,596,044 | | | | 10,829,062 | | | | | | 51,714,813 | | | | 227,201,419 | | | | | | 3,758,322 | | | | 5,606,026 | |
| | | | | | | | | | | | | | | | | | | | | | |
| | | | | | | | | | | |
Total Change in Net Assets | | | (71,498,392 | ) | | | 280,169,867 | | | | | | (288,290 | ) | | | 30,257,693 | | | | | | 195,664,050 | | | | 394,173,199 | | | | | | 2,778,672 | | | | 9,806,102 | |
| | | | | | | | | | | |
Net Assets | | | | | | | | | | | | | | | | | | | | | | | | | | | | | | | | | | | | | | |
Beginning of period | | | 848,624,064 | | | | 568,454,197 | | | | | | 69,344,713 | | | | 39,087,020 | | | | | | 1,112,080,323 | | | | 717,907,124 | | | | | | 43,310,127 | | | | 33,504,025 | |
| | | | | | | | | | | | | | | | | | | | | | |
End of period | | $ | 777,125,672 | | | $ | 848,624,064 | | | | | $ | 69,056,423 | | | $ | 69,344,713 | | | | | $ | 1,307,744,373 | | | $ | 1,112,080,323 | | | | | $ | 46,088,799 | | | $ | 43,310,127 | |
| | | | | | | | | | | | | | | | | | | | | | |
| | | | | | | | | | | |
Accumulated Net Investment Income (Loss) | | $ | - | | | $ | 337,270 | | | | | $ | 47,075 | | | $ | 8,693 | | | | | $ | 3,375,715 | | | $ | 3,339,169 | | | | | $ | 472,840 | | | $ | 305,599 | |
| | | | | | | | | | | | | | | | | | | | | | |
See accompanying notes to Financial Statements.
| | |
| Page 34 | | Diamond Hill Funds Annual Report December 31, 2011 |
Diamond Hill Funds
Statements of Changes in Net Assets
| | | | | | | | | | | | | | | | | | | | | | | | | | | | |
| | | Long-Short Fund | | | | | Financial Long-Short Fund | | | | | Strategic Income Fund | |
| | | For the Year
Ended
December 31,
2011 | | | For the Year
Ended
December 31,
2010 | | | | | For the Year
Ended
December 31,
2011 | | | For the Year
Ended
December 31,
2010 | | | | | For the Year
Ended
December 31,
2011 | | | For the Year
Ended
December 31,
2010 | |
From Operations | | | | | | | | | | | | | | | | | | | | | | | | | | | | |
Net investment income (loss) | | $ | 6,309,019 | | | $ | 2,198,195 | | | | | $ | 14,545 | | | $ | 6,049 | | | | | $ | 8,635,367 | | | $ | 8,348,213 | |
Net realized gains (losses) from security sales | | | (9,156,109 | ) | | | 50,130,474 | | | | | | 251,461 | | | | 1,027,389 | | | | | | 1,292,968 | | | | 5,110,915 | |
Net realized gains (losses) on closed short positions | | | 4,274,910 | | | | (132,584,179 | ) | | | | | 66,927 | | | | 92,336 | | | | | | - | | | | - | |
Net change in unrealized appreciation (depreciation) on investments | | | 50,048,450 | | | | 68,454,353 | | | | | | (2,061,015 | ) | | | 606,059 | | | | | | (2,444,055 | ) | | | 3,918,466 | |
| | | | | | | | | | | | | | | | |
Change in Net Assets from Operations | | | 51,476,270 | | | | (11,801,157 | ) | | | | | (1,728,082 | ) | | | 1,731,833 | | | | | | 7,484,280 | | | | 17,377,594 | |
| | | | | | | | | | | | | | | | |
| | | | | | | | |
Distributions to Shareholders | | | | | | | | | | | | | | | | | | | | | | | | | | | | |
From net investment income: | | | | | | | | | | | | | | | | | | | | | | | | | | | | |
Class A | | | - | | | | - | | | | | | (24,449 | ) | | | - | | | | | | (2,447,874 | ) | | | (2,537,128 | ) |
Class C | | | - | | | | - | | | | | | - | | | | - | | | | | | (1,200,578 | ) | | | (1,215,833 | ) |
Class I | | | (2,198,228 | ) | | | (334,787 | ) | | | | | (10,300 | ) | | | (3,500 | ) | | | | | (4,886,777 | ) | | | (4,529,534 | ) |
| | | | | | | | | | | | | | | | |
Change in Net Assets from
Distributions to Shareholders | | | (2,198,228 | ) | | | (334,787 | ) | | | | | (34,749 | ) | | | (3,500 | ) | | | | | (8,535,229 | ) | | | (8,282,495 | ) |
| | | | | | | | | | | | | | | | |
| | | | | | | | |
From Capital Transactions | | | | | | | | | | | | | | | | | | | | | | | | | | | | |
Class A | | | | | | | | | | | | | | | | | | | | | | | | | | | | |
Proceeds from shares sold | | | 189,806,993 | | | | 319,968,417 | | | | | | 2,865,147 | | | | 5,852,273 | | | | | | 26,060,492 | | | | 24,626,078 | |
Reinvested distributions | | | - | | | | - | | | | | | 19,203 | | | | - | | | | | | 1,692,066 | | | | 1,852,244 | |
Payments for shares redeemed | | | (390,748,620 | ) | | | (569,340,467 | ) | | | | | (3,541,151 | ) | | | (6,742,636 | ) | | | | | (30,843,853 | ) | | | (27,978,007 | ) |
| | | | | | | | | | | | | | | | |
Change in Net Assets from
Class A Share Transactions | | | (200,941,627 | ) | | | (249,372,050 | ) | | | | | (656,801 | ) | | | (890,363 | ) | | | | | (3,091,295 | ) | | | (1,499,685 | ) |
| | | | | | | | | | | | | | | | |
| | | | | | | | |
Class C | | | | | | | | | | | | | | | | | | | | | | | | | | | | |
Proceeds from shares sold | | | 7,670,004 | | | | 25,789,006 | | | | | | 149,651 | | | | 455,017 | | | | | | 4,116,876 | | | | 6,405,155 | |
Reinvested distributions | | | - | | | | - | | | | | | - | | | | - | | | | | | 613,594 | | | | 648,128 | |
Payments for shares redeemed | | | (70,332,026 | ) | | | (97,574,427 | ) | | | | | (565,644 | ) | | | (558,844 | ) | | | | | (5,145,192 | ) | | | (6,492,327 | ) |
| | | | | | | | | | | | | | | | |
Change in Net Assets from
Class C Share Transactions | | | (62,662,022 | ) | | | (71,785,421 | ) | | | | | (415,993 | ) | | | (103,827 | ) | | | | | (414,722 | ) | | | 560,956 | |
| | | | | | | | | | | | | | | | |
| | | | | | | | |
Class I | | | | | | | | | | | | | | | | | | | | | | | | | | | | |
Proceeds from shares sold | | | 521,061,532 | | | | 725,972,530 | | | | | | 1,659,056 | | | | 2,442,106 | | | | | | 15,732,671 | | | | 18,456,655 | |
Reinvested distributions | | | 859,426 | | | | 146,563 | | | | | | 8,655 | | | | 2,305 | | | | | | 3,563,436 | | | | 3,484,096 | |
Payments for shares redeemed | | | (385,324,224 | ) | | | (424,991,830 | ) | | | | | (1,599,131 | ) | | | (1,400,675 | ) | | | | | (12,225,093 | ) | | | (14,155,841 | ) |
| | | | | | | | | | | | | | | | |
Change in Net Assets from
Class I Share Transactions | | | 136,596,734 | | | | 301,127,263 | | | | | | 68,580 | | | | 1,043,736 | | | | | | 7,071,014 | | | | 7,784,910 | |
| | | | | | | | | | | | | | | | |
| | | | | | | | |
Total Change in Net Assets | | | (77,728,873 | ) | | | (32,166,152 | ) | | | | | (2,767,045 | ) | | | 1,777,879 | | | | | | 2,514,048 | | | | 15,941,280 | |
| | | | | | | | |
Net Assets | | | | | | | | | | | | | | | | | | | | | | | | | | | | |
Beginning of period | | | 1,923,570,123 | | | | 1,955,736,275 | | | | | | 11,796,647 | | | | 10,018,768 | | | | | | 143,516,482 | | | | 127,575,202 | |
| | | | | | | | | | | | | | | | |
End of period | | $ | 1,845,841,250 | | | $ | 1,923,570,123 | | | | | $ | 9,029,602 | | | $ | 11,796,647 | | | | | $ | 146,030,530 | | | $ | 143,516,482 | |
| | | | | | | | | | | | | | | | |
| | | | | | | | |
Accumulated Net Investment Income (Loss) | | $ | 6,308,984 | | | $ | 2,198,193 | | | | | $ | - | | | $ | 14,479 | | | | | $ | 165,784 | | | $ | 65,646 | |
| | | | | | | | | | | | | | | | |
See accompanying notes to Financial Statements.
| | |
| Diamond Hill Funds Annual Report December 31, 2011 | | Page 35 |
Diamond Hill Funds
Schedule of Share Transactions
| | | | | | | | | | | | | | | | | | | | | | | | | | | | | | | | | | | | | | |
| | | Small Cap Fund | | | | | Small-Mid Cap Fund | | | | | Large Cap Fund | | | | | Select Fund | |
| | | For the Year
Ended
December 31,
2011 | | | For the Year
Ended
December 31,
2010 | | | | | For the Year
Ended
December 31,
2011 | | | For the Year
Ended
December 31,
2010 | | | | | For the Year
Ended
December 31,
2011 | | | For the Year
Ended
December 31,
2010 | | | | | For the Year
Ended
December 31,
2011 | | | For the Year
Ended
December 31,
2010 | |
Shares | | | | | | | | | | | | | | | | | | | | | | | | | | | | |
Class A Shares | | | | | | | | | | | | | | | | | | | | | | | | | | | | |
Issued | | | 5,243,052 | | | | 7,155,291 | | | | | | 655,207 | | | | 1,077,346 | | | | | | 19,355,285 | | | | 15,937,265 | | | | | | 393,761 | | | | 222,167 | |
Reinvested | | | 633,427 | | | | 278,244 | | | | | | 35,967 | | | | 331 | | | | | | 421,472 | | | | 203,173 | | | | | | 3,711 | | | | 478 | |
Redeemed | | | (6,584,334 | ) | | | (8,587,264 | ) | | | | | (570,129 | ) | | | (550,505 | ) | | | | | (11,213,426 | ) | | | (10,326,539 | ) | | | | | (308,761 | ) | | | (244,323 | ) |
| | | | | | | | | | | | | | | | | | | | | | |
Change in shares outstanding | | | (707,855 | ) | | | (1,153,729 | ) | | | | | 121,045 | | | | 527,172 | | | | | | 8,563,331 | | | | 5,813,899 | | | | | | 88,711 | | | | (21,678 | ) |
| | | | | | | | | | | |
Class C | | | | | | | | | | | | | | | | | | | | | | | | | | | | | | | | | | | | | | |
Issued | | | 201,229 | | | | 481,177 | | | | | | 199,391 | | | | 273,718 | | | | | | 555,863 | | | | 652,105 | | | | | | 97,843 | | | | 155,983 | |
Reinvested | | | 54,316 | | | | 21,372 | | | | | | 15,205 | | | | 130 | | | | | | 6,236 | | | | 434 | | | | | | - | | | | - | |
Redeemed | | | (224,894 | ) | | | (200,794 | ) | | | | | (103,138 | ) | | | (102,293 | ) | | | | | (504,137 | ) | | | (535,306 | ) | | | | | (148,897 | ) | | | (111,650 | ) |
| | | | | | | | | | | | | | | | | | | | | | |
Change in shares outstanding | | | 30,651 | | | | 301,755 | | | | | | 111,458 | | | | 171,555 | | | | | | 57,962 | | | | 117,233 | | | | | | (51,054 | ) | | | 44,333 | |
| | | | | | | | | | | |
Class I | | | | | | | | | | | | | | | | | | | | | | | | | | | | | | | | | | | | | | |
Issued | | | 5,987,256 | | | | 11,575,522 | | | | | | 1,189,658 | | | | 1,301,149 | | | | | | 14,534,993 | | | | 23,434,165 | | | | | | 1,196,597 | | | | 896,622 | |
Reinvested | | | 419,571 | | | | 146,346 | | | | | | 88,232 | | | | 3,835 | | | | | | 489,708 | | | | 342,623 | | | | | | 25,380 | | | | 14,400 | |
Redeemed | | | (4,913,993 | ) | | | (4,694,221 | ) | | | | | (1,130,873 | ) | | | (311,832 | ) | | | | | (11,492,104 | ) | | | (7,205,259 | ) | | | | | (837,541 | ) | | | (306,496 | ) |
| | | | | | | | | | | | | | | | | | | | | | |
Change in shares outstanding | | | 1,492,834 | | | | 7,027,647 | | | | | | 147,017 | | | | 993,152 | | | | | | 3,532,597 | | | | 16,571,529 | | | | | | 384,436 | | | | 604,526 | |
| | | | | | | | |
| | | | | | | | | | | Long-Short Fund | | | | | Financial Long-Short Fund | | | | | Strategic Income Fund | |
| | | | | | | | | | | For the Year
Ended
December 31,
2011 | | | For the Year
Ended
December 31,
2010 | | | | | For the Year
Ended
December 31,
2011 | | | For the Year
Ended
December 31,
2010 | | | | | For the Year
Ended
December 31,
2011 | | | For the Year
Ended
December 31,
2010 | |
Shares | | | | | | | | | | | | | | | | | | | | | | | | | | | | | | | | | | | | | | |
Class A Shares | | | | | | | | | | | | | | | | | | | | | | | | | | | | | | | | | | | | | | |
Issued | | | | | | | | | | | | | 11,487,001 | | | | 20,215,595 | | | | | | 243,557 | | | | 524,460 | | | | | | 2,377,879 | | | | 2,319,678 | |
Reinvested | | | | | | | | | | | | | - | | | | - | | | | | | 1,820 | | | | - | | | | | | 154,925 | | | | 173,782 | |
Redeemed | | | | | | | | | | | | | (23,834,152 | ) | | | (36,439,875 | ) | | | | | (313,720 | ) | | | (595,480 | ) | | | | | (2,831,935 | ) | | | (2,634,548 | ) |
| | | | | | | | | | | | | | | | | | | | | | |
Change in shares outstanding | | | | | | | | | | | | | (12,347,151 | ) | | | (16,224,280 | ) | | | | | (68,343 | ) | | | (71,020 | ) | | | | | (299,131 | ) | | | (141,088 | ) |
Class C | | | | | | | | | | | | | | | | | | | | | | | | | | | | | | | | | | | | | | |
Issued | | | | | | | | | | | | | 491,072 | | | | 1,699,414 | | | | | | 13,408 | | | | 41,998 | | | | | | 377,761 | | | | 604,466 | |
Reinvested | | | | | | | | | | | | | - | | | | - | | | | | | - | | | | - | | | | | | 56,269 | | | | 60,738 | |
Redeemed | | | | | | | | | | | | | (4,522,291 | ) | | | (6,546,127 | ) | | | | | (52,707 | ) | | | (52,413 | ) | | | | | (471,092 | ) | | | (608,807 | ) |
| | | | | | | | | | | | | | | | | | | | | | |
Change in shares outstanding | | | | | | | | | | | | | (4,031,219 | ) | | | (4,846,713 | ) | | | | | (39,299 | ) | | | (10,415 | ) | | | | | (37,062 | ) | | | 56,397 | |
Class I | | | | | | | | | | | | | | | | | | | | | | | | | | | | | | | | | | | | | | |
Issued | | | | | | | | | | | | | 31,237,550 | | | | 45,807,193 | | | | | | 135,903 | | | | 215,283 | | | | | | 1,443,472 | | | | 1,738,613 | |
Reinvested | | | | | | | | | | | | | 50,614 | | | | 8,942 | | | | | | 824 | | | | 190 | | | | | | 327,465 | | | | 327,091 | |
Redeemed | | | | | | | | | | | | | (23,318,156 | ) | | | (26,843,681 | ) | | | | | (139,844 | ) | | | (125,867 | ) | | | | | (1,124,068 | ) | | | (1,324,791 | ) |
| | | | | | | | | | | | | | | | | | | | | | |
Change in shares outstanding | | | | | | | | | | | | | 7,970,008 | | | | 18,972,454 | | | | | | (3,117 | ) | | | 89,606 | | | | | | 646,869 | | | | 740,913 | |
See accompanying notes to Financial Statements.
| | |
| Page 36 | | Diamond Hill Funds Annual Report December 31, 2011 |
Diamond Hill Funds
Financial Highlights
(For a share of beneficial interest outstanding throughout each period)
| | | | | | | | | | | | | | | | | | | | |
| Diamond Hill Small Cap Fund - Class A | | Year Ended
December 31,
2011 | | | Year Ended
December 31,
2010 | | | Year Ended
December 31,
2009 | | | Year Ended
December 31
2008 | | | Year Ended
December 31,
2007 | |
Net asset value at beginning of period | | $ | 25.80 | | | $ | 21.31 | | | $ | 16.53 | | | $ | 22.53 | | | $ | 25.03 | |
| | | | | | | | | | | | | | | | | | | | |
Income (loss) from Investment operations: | | | | | | | | | | | | | | | | | | | | |
Net investment income (loss) | | | (0.08 | ) | | | (0.05 | ) | | | (0.01 | ) | | | 0.13 | | | | 0.08 | |
Net realized and unrealized gains (losses) on investments | | | (1.80 | ) | | | 4.95 | | | | 4.79 | | | | (5.98 | ) | | | (1.00 | ) |
| | | | | | | | | | | | | | | | | | | | |
Total from Investment operations | | | (1.88 | ) | | | 4.90 | | | | 4.78 | | | | (5.85 | ) | | | (0.92 | ) |
| | | | | | | | | | | | | | | | | | | | |
Less distributions: | | | | | | | | | | | | | | | | | | | | |
Dividends from net investment income | | | - | | | | - | | | | - | | | | (0.12 | ) | | | (0.08 | ) |
Distributions from net realized gains | | | (0.88 | ) | | | (0.41 | ) | | | - | | | | (0.03 | ) | | | (1.50 | ) |
| | | | | | | | | | | | | | | | | | | | |
Total distributions | | | (0.88 | ) | | | (0.41 | ) | | | - | | | | (0.15 | ) | | | (1.58 | ) |
| | | | | | | | | | | | | | | | | | | | |
Net asset value at end of period | | $ | 23.04 | | | $ | 25.80 | | | $ | 21.31 | | | $ | 16.53 | | | $ | 22.53 | |
| | | | | | | | | | | | | | | | | | | | |
Total return(A) | | | (7.17% | ) | | | 22.99% | | | | 28.92% | | | | (25.99% | ) | | | (3.79% | ) |
| | | | | | | | | | | | | | | | | | | | |
Net assets at end of period (000’s) | | $ | 431,313 | | | $ | 501,237 | | | $ | 438,722 | | | $ | 308,832 | | | $ | 315,378 | |
| | | | | | | | | | | | | | | | | | | | |
Ratio of net expenses to average net assets | | | 1.33% | | | | 1.37% | | | | 1.38% | | | | 1.35% | | | | 1.39% | |
Ratio of net investment income (loss) to average net assets | | | (0.32% | ) | | | (0.24% | ) | | | (0.09% | ) | | | 0.75% | | | | 0.29% | |
Portfolio turnover rate(B) | | | 28% | | | | 35% | | | | 47% | | | | 47% | | | | 21% | |
| | | | | |
Diamond Hill Small Cap Fund - Class C | | | | | | | | | | | | | | | | | | | | |
Net asset value at beginning of period | | $ | 24.14 | | | $ | 20.12 | | | $ | 15.72 | | | $ | 21.44 | | | $ | 24.00 | |
| | | | | | | | | | | | | | | | | | | | |
Income (loss) from investment operations: | | | | | | | | | | | | | | | | | | | | |
Net investment income (loss) | | | (0.25 | ) | | | (0.16 | ) | | | (0.13 | ) | | | (0.01 | ) | | | (0.15 | ) |
Net realized and unrealized gains (losses) on investments | | | (1.67 | ) | | | 4.59 | | | | 4.53 | | | | (5.68 | ) | | | (0.91 | ) |
| | | | | | | | | | | | | | | | | | | | |
Total from investment operations | | | (1.92 | ) | | | 4.43 | | | | 4.40 | | | | (5.69 | ) | | | (1.06 | ) |
| | | | | | | | | | | | | | | | | | | | |
Less distributions: | | | | | | | | | | | | | | | | | | | | |
Distributions from net realized gains | | | (0.88 | ) | | | (0.41 | ) | | | - | | | | (0.03 | ) | | | (1.50 | ) |
| | | | | | | | | | | | | | | | | | | | |
Total distributions | | | (0.88 | ) | | | (0.41 | ) | | | - | | | | (0.03 | ) | | | (1.50 | ) |
| | | | | | | | | | | | | | | | | | | | |
Net asset value at end of period | | $ | 21.34 | | | $ | 24.14 | | | $ | 20.12 | | | $ | 15.72 | | | $ | 21.44 | |
| | | | | | | | | | | | | | | | | | | | |
Total return(A) | | | (7.83% | ) | | | 22.01% | | | | 27.99% | | | | (26.55% | ) | | | (4.51% | ) |
| | | | | | | | | | | | | | | | | | | | |
Net assets at end of period (000’s) | | $ | 31,664 | | | $ | 35,093 | | | $ | 23,172 | | | $ | 16,790 | | | $ | 25,158 | |
| | | | | | | | | | | | | | | | | | | | |
Ratio of net expenses to average net assets | | | 2.08% | | | | 2.12% | | | | 2.13% | | | | 2.11% | | | | 2.14% | |
Ratio of net investment income (loss) to average net assets | | | (1.07% | ) | | | (0.96% | ) | | | (0.83% | ) | | | (0.03% | ) | | | (0.46% | ) |
Portfolio turnover rate(B) | | | 28% | | | | 35% | | | | 47% | | | | 47% | | | | 21% | |
| | | | | |
Diamond Hill Small Cap Fund - Class I | | | | | | | | | | | | | | | | | | | | |
Net asset value at beginning of period | | $ | 26.01 | | | $ | 21.41 | | | $ | 16.55 | | | $ | 22.57 | | | $ | 25.08 | |
| | | | | | | | | | | | | | | | | | | | |
Income (loss) from investment operations: | | | | | | | | | | | | | | | | | | | | |
Net investment income (loss) | | | (0.01 | ) | | | - | (C) | | | 0.04 | | | | 0.17 | | | | 0.22 | |
Net realized and unrealized gains (losses) on investments | | | (1.82 | ) | | | 5.01 | | | | 4.83 | | | | (5.97 | ) | | | (1.05 | ) |
| | | | | | | | | | | | | | | | | | | | |
Total from investment operations | | | (1.83 | ) | | | 5.01 | | | | 4.87 | | | | (5.80 | ) | | | (0.83 | ) |
| | | | | | | | | | | | | | | | | | | | |
Less distributions: | | | | | | | | | | | | | | | | | | | | |
Dividends from net investment income | | | (0.03 | ) | | | - | | | | (0.01 | ) | | | (0.19 | ) | | | (0.18 | ) |
Distributions from net realized gains | | | (0.88 | ) | | | (0.41 | ) | | | - | | | | (0.03 | ) | | | (1.50 | ) |
| | | | | | | | | | | | | | | | | | | | |
Total distributions | | | (0.91 | ) | | | (0.41 | ) | | | (0.01 | ) | | | (0.22 | ) | | | (1.68 | ) |
| | | | | | | | | | | | | | | | | | | | |
Net asset value at end of period | | $ | 23.27 | | | $ | 26.01 | | | $ | 21.41 | | | $ | 16.55 | | | $ | 22.57 | |
| | | | | | | | | | | | | | | | | | | | |
Total return | | | (6.91% | ) | | | 23.39% | | | | 29.43% | | | | (25.69% | ) | | | (3.41% | ) |
| | | | | | | | | | | | | | | | | | | | |
Net assets at end of period (000’s) | | $ | 314,149 | | | $ | 312,295 | | | $ | 106,561 | | | $ | 38,967 | | | $ | 32,057 | |
| | | | | | | | | | | | | | | | | | | | |
Ratio of net expenses to average net assets | | | 1.04% | | | | 1.00% | | | | 0.99% | | | | 0.98% | | | | 0.98% | |
Ratio of net investment income (loss) to average net assets | | | (0.03% | ) | | | 0.20% | | | | 0.30% | | | | 1.17% | | | | 0.69% | |
Portfolio turnover rate(B) | | | 28% | | | | 35% | | | | 47% | | | | 47% | | | | 21% | |
| (A) | Total returns shown exclude the effect of applicable sales charges. |
| (B) | Portfolio turnover rate is calculated on the basis of the Fund as a whole without distinguishing between classes of shares issued. |
| (C) | Amount is less than $0.005. |
See accompanying Notes to Financial Statements.
| | |
| Diamond Hill Funds Annual Report December 31, 2011 | | Page 37 |
Diamond Hill Funds
Financial Highlights
(For a share of beneficial interest outstanding throughout each period)
| | | | | | | | | | | | | | | | | | | | |
| Diamond Hill Small-Mid Cap Fund - Class A | | Year Ended
December 31,
2011 | | | Year Ended
December 31,
2010 | | | Year Ended
December 31,
2009 | | | Year Ended
December 31,
2008 | | | Year Ended
December 31,
2007 | |
Net asset value at beginning of period | | $ | 12.56 | | | $ | 10.22 | | | $ | 7.26 | | | $ | 10.50 | | | $ | 10.91 | |
| | | | | | | | | | | | | | | | | | | | |
Income (loss) from Investment operations: | | | | | | | | | | | | | | | | | | | | |
Net investment income (loss) | | | - | (C) | | | (0.04 | ) | | | 0.03 | | | | 0.10 | | | | 0.06 | |
Net realized and unrealized gains (losses) on investments | | | (0.53 | ) | | | 2.38 | | | | 2.93 | | | | (3.25 | ) | | | (0.15 | ) |
| | | | | | | | | | | | | | | | | | | | |
Total from Investment operations | | | (0.53 | ) | | | 2.34 | | | | 2.96 | | | | (3.15 | ) | | | (0.09 | ) |
| | | | | | | | | | | | | | | | | | | | |
Less distributions: | | | | | | | | | | | | | | | | | | | | |
Dividends from net investment income | | | - | | | | - | | | | - | | | | (0.09 | ) | | | (0.04 | ) |
Distributions from net realized gains | | | (0.32 | ) | | | - | (C) | | | - | | | | - | | | | (0.28 | ) |
| | | | | | | | | | | | | | | | | | | | |
Total distributions | | | (0.32 | ) | | | - | (C) | | | - | | | | (0.09 | ) | | | (0.32 | ) |
| | | | | | | | | | | | | | | | | | | | |
Net asset value at end of period | | $ | 11.71 | | | $ | 12.56 | | | $ | 10.22 | | | $ | 7.26 | | | $ | 10.50 | |
| | | | | | | | | | | | | | | | | | | | |
Total return(A) | | | (4.19% | ) | | | 23.03% | | | | 40.77% | | | | (30.01% | ) | | | (0.91% | ) |
| | | | | | | | | | | | | | | | | | | | |
Net assets at end of period (000’s) | | $ | 17,461 | | | $ | 17,216 | | | $ | 8,616 | | | $ | 7,557 | | | $ | 10,549 | |
| | | | | | | | | | | | | | | | | | | | |
Ratio of net expenses to average net assets | | | 1.28% | | | | 1.32% | | | | 1.33% | | | | 1.32% | | | | 1.33% | |
Ratio of net investment income (loss) to average net assets | | | -% | (D) | | | (0.17% | ) | | | 0.17% | | | | 1.11% | | | | 0.54% | |
Ratio of gross expenses to average net assets | | | 1.28% | | | | 1.32% | | | | 1.33% | | | | 1.32% | | | | 1.34% | |
Portfolio turnover rate(B) | | | 48% | | | | 35% | | | | 74% | | | | 91% | | | | 39% | |
| | | | | |
Diamond Hill Small-Mid Cap Fund - Class C | | | | | | | | | | | | | | | | | | | | |
Net asset value at beginning of period | | $ | 12.21 | | | $ | 10.00 | | | $ | 7.15 | | | $ | 10.40 | | | $ | 10.85 | |
| | | | | | | | | | | | | | | | | | | | |
Income (loss) from investment operations: | | | | | | | | | | | | | | | | | | | | |
Net investment income (loss) | | | (0.06 | ) | | | (0.05 | ) | | | (0.04 | ) | | | 0.04 | | | | (0.02 | ) |
Net realized and unrealized gains (losses) on investments | | | (0.55 | ) | | | 2.26 | | | | 2.89 | | | | (3.22 | ) | | | (0.15 | ) |
| | | | | | | | | | | | | | | | | | | | |
Total from investment operations | | | (0.61 | ) | | | 2.21 | | | | 2.85 | | | | (3.18 | ) | | | (0.17 | ) |
| | | | | | | | | | | | | | | | | | | | |
Less distributions: | | | | | | | | | | | | | | | | | | | | |
Dividends from net investment income | | | - | | | | - | | | | - | | | | (0.07 | ) | | | - | |
Distributions from net realized gains | | | (0.32 | ) | | | - | (C) | | | - | | | | - | | | | (0.28 | ) |
| | | | | | | | | | | | | | | | | | | | |
Total distributions | | | (0.32 | ) | | | - | (C) | | | - | | | | (0.07 | ) | | | (0.28 | ) |
| | | | | | | | | | | | | | | | | | | | |
Net asset value at end of period | | $ | 11.28 | | | $ | 12.21 | | | $ | 10.00 | | | $ | 7.15 | | | $ | 10.40 | |
| | | | | | | | | | | | | | | | | | | | |
Total return(A) | | | (4.89% | ) | | | 22.14% | | | | 39.86% | | | | (30.54% | ) | | | (1.65% | ) |
| | | | | | | | | | | | | | | | | | | | |
Net assets at end of period (000’s) | | $ | 8,110 | | | $ | 7,417 | | | $ | 4,361 | | | $ | 2,920 | | | $ | 2,388 | |
| | | | | | | | | | | | | | | | | | | | |
Ratio of net expenses to average net assets | | | 2.02% | | | | 2.07% | | | | 2.08% | | | | 2.05% | | | | 2.08% | |
Ratio of net investment income (loss) to average net assets | | | (0.74% | ) | | | (0.90% | ) | | | (0.59% | ) | | | 0.48% | | | | (0.21% | ) |
Ratio of gross expenses to average net assets | | | 2.02% | | | | 2.07% | | | | 2.08% | | | | 2.05% | | | | 2.09% | |
Portfolio turnover rate(B) | | | 48% | | | | 35% | | | | 74% | | | | 91% | | | | 39% | |
| | | | | |
| Diamond Hill Small-Mid Cap Fund - Class I | | | | | | | | | | | | | | | | | | | | |
Net asset value at beginning of period | | $ | 12.61 | | | $ | 10.23 | | | $ | 7.25 | | | $ | 10.50 | | | $ | 10.91 | |
| | | | | | | | | | | | |
Income (loss) from investment operations: | | | | | | | | | | | | | | | | | | | | |
Net investment income (loss) | | | 0.04 | | | | 0.02 | | | | 0.04 | | | | 0.13 | | | | 0.09 | |
Net realized and unrealized gains (losses) on investments | | | (0.54 | ) | | | 2.37 | | | | 2.96 | | | | (3.26 | ) | | | (0.13 | ) |
| | | | | | | | | | | | | | | | | | | | |
Total from investment operations | | | (0.50 | ) | | | 2.39 | | | | 3.00 | | | | (3.13 | ) | | | (0.04 | ) |
| | | | | | | | | | | | | | | | | | | | |
Less distributions: | | | | | | | | | | | | | | | | | | | | |
Dividends from net investment income | | | (0.01 | ) | | | (0.01 | ) | | | (0.02 | ) | | | (0.12 | ) | | | (0.09 | ) |
Distributions from net realized gains | | | (0.32 | ) | | | - | (C) | | | - | | | | - | | | | (0.28 | ) |
| | | | | | | | | | | | | | | | | | | | |
Total distributions | | | (0.33 | ) | | | (0.01 | ) | | | (0.02 | ) | | | (0.12 | ) | | | (0.37 | ) |
| | | | | | | | | | | | | | | | | | | | |
Net asset value at end of period | | $ | 11.78 | | | $ | 12.61 | | | $ | 10.23 | | | $ | 7.25 | | | $ | 10.50 | |
| | | | | | | | | | | | | | | | | | | | |
Total return | | | (3.86% | ) | | | 23.43% | | | | 41.36% | | | | (29.77% | ) | | | (0.44% | ) |
| | | | | | | | | | | | | | | | | | | | |
Net assets at end of period (000’s) | | $ | 43,485 | | | $ | 44,711 | | | $ | 26,110 | | | $ | 14,815 | | | $ | 18,478 | |
| | | | | | | | | | | | | | | | | | | | |
Ratio of net expenses to average net assets | | | 0.99% | | | | 0.95% | | | | 0.94% | | | | 0.93% | | | | 0.93% | |
Ratio of net investment income (loss) to average net assets | | | 0.29% | | | | 0.22% | | | | 0.54% | | | | 1.49% | | | | 0.97% | |
Ratio of gross expenses to average net assets | | | 0.99% | | | | 0.95% | | | | 0.94% | | | | 0.93% | | | | 0.94% | |
Portfolio turnover rate(B) | | | 48% | | | | 35% | | | | 74% | | | | 91% | | | | 39% | |
| (A) | Total returns shown exclude the effect of applicable sales charges. |
| (B) | Portfolio turnover rate is calculated on the basis of the Fund as a whole without distinguishing between classes of shares issued. |
| (C) | Amount is less than $0.005. |
| (D) | Amount is less than 0.005%. |
See accompanying Notes to Financial Statements.
| | |
| Page 38 | | Diamond Hill Funds Annual Report December 31, 2011 |
Diamond Hill Funds
Financial Highlights
(For a share of beneficial interest outstanding throughout each period)
| | | | | | | | | | | | | | | | | | | | |
| Diamond Hill Large Cap Fund - Class A | | Year Ended
December 31,
2011 | | | Year Ended
December 31,
2010 | | | Year Ended
December 31,
2009 | | | Year Ended
December 31,
2008 | | | Year Ended
December 31,
2007 | |
Net asset value at beginning of period | | $ | 14.78 | | | $ | 13.62 | | | $ | 10.47 | | | $ | 16.25 | | | $ | 16.36 | |
| | | | | | | | | | | | | | | | | | | | |
Income (loss) from Investment operations: | | | | | | | | | | | | | | | | | | | | |
Net investment income (loss) | | | 0.18 | (C) | | | 0.10 | | | | 0.10 | | | | 0.15 | | | | 0.21 | |
Net realized and unrealized gains (losses) on investments | | | 0.17 | | | | 1.17 | | | | 3.06 | | | | (5.69 | ) | | | 0.69 | |
| | | | | | | | | | | | | | | | | | | | |
Total from Investment operations | | | 0.35 | | | | 1.27 | | | | 3.16 | | | | (5.54 | ) | | | 0.90 | |
| | | | | | | | | | | | | | | | | | | | |
Less distributions: | | | | | | | | | | | | | | | | | | | | |
Dividends from net investment income | | | (0.17 | ) | | | (0.11 | ) | | | (0.01 | ) | | | (0.14 | ) | | | (0.19 | ) |
Distributions from net realized gains | | | - | | | | - | | | | - | | | | (0.10 | ) | | | (0.82 | ) |
| | | | | | | | | | | | | | | | | | | | |
Total distributions | | | (0.17 | ) | | | (0.11 | ) | | | (0.01 | ) | | | (0.24 | ) | | | (1.01 | ) |
| | | | | | | | | | | | | | | | | | | | |
Net asset value at end of period | | $ | 14.96 | | | $ | 14.78 | | | $ | 13.62 | | | $ | 10.47 | | | $ | 16.25 | |
| | | | | | | | | | | | | | | | | | | | |
Total return(A) | | | 2.35% | | | | 9.29% | | | | 30.21% | | | | (34.06% | ) | | | 5.42% | |
| | | | | | | | | | | | | | | | | | | | |
Net assets at end of period (000’s) | | $ | 593,124 | | | $ | 459,659 | | | $ | 344,456 | | | $ | 254,688 | | | $ | 309,617 | |
| | | | | | | | | | | | | | | | | | | | |
Ratio of net expenses to average net assets | | | 1.12% | | | | 1.18% | | | | 1.18% | | | | 1.16% | | | | 1.18% | |
Ratio of net investment income (loss) to average net assets | | | 1.19% | | | | 0.90% | | | | 0.91% | | | | 1.23% | | | | 1.15% | |
Ratio of gross expenses to average net assets | | | 1.12% | | | | 1.18% | | | | 1.18% | | | | 1.16% | | | | 1.19% | |
Portfolio turnover rate(B) | | | 16% | | | | 16% | | | | 31% | | | | 28% | | | | 44% | |
| | | | | |
Diamond Hill Large Cap Fund - Class C | | | | | | | | | | | | | | | | | | | | |
Net asset value at beginning of period | | $ | 14.29 | | | $ | 13.18 | | | $ | 10.19 | | | $ | 15.84 | | | $ | 15.99 | |
| | | | | | | | | | | | | | | | | | | | |
Income (loss) from investment operations: | | | | | | | | | | | | | | | | | | | | |
Net investment income (loss) | | | 0.06 | | | | 0.02 | | | | 0.02 | | | | 0.06 | | | | 0.06 | |
Net realized and unrealized gains (losses) on investments | | | 0.16 | | | | 1.09 | | | | 2.97 | | | | (5.55 | ) | | | 0.70 | |
| | | | | | | | | | | | | | | | | | | | |
Total from investment operations | | | 0.22 | | | | 1.11 | | | | 2.99 | | | | (5.49 | ) | | | 0.76 | |
| | | | | | | | | | | | | | | | | | | | |
Less distributions: | | | | | | | | | | | | | | | | | | | | |
Dividends from net investment income | | | (0.05 | ) | | | - | (D) | | | - | | | | (0.06 | ) | | | (0.09 | ) |
Distributions from net realized gains | | | - | | | | - | | | | - | | | | (0.10 | ) | | | (0.82 | ) |
| | | | | | | | | | | | | | | | | | | | |
Total distributions | | | (0.05 | ) | | | - | (D) | | | - | | | | (0.16 | ) | | | (0.91 | ) |
| | | | | | | | | | | | | | | | | | | | |
Net asset value at end of period | | $ | 14.46 | | | $ | 14.29 | | | $ | 13.18 | | | $ | 10.19 | | | $ | 15.84 | |
| | | | | | | | | | | | | | | | | | | | |
Total return(A) | | | 1.55% | | | | 8.45% | | | | 29.34% | | | | (34.64% | ) | | | 4.68% | |
| | | | | | | | | | | | | | | | | | | | |
Net assets at end of period (000’s) | | $ | 30,465 | | | $ | 29,274 | | | $ | 25,454 | | | $ | 20,656 | | | $ | 27,084 | |
| | | | | | | | | | | | | | | | | | | | |
Ratio of net expenses to average net assets | | | 1.87% | | | | 1.93% | | | | 1.93% | | | | 1.91% | | | | 1.93% | |
Ratio of net investment income (loss) to average net assets | | | 0.45% | | | | 0.15% | | | | 0.17% | | | | 0.48% | | | | 0.43% | |
Portfolio turnover rate(B) | | | 16% | | | | 16% | | | | 31% | | | | 28% | | | | 44% | |
| | | | | |
Diamond Hill Large Cap Fund - Class I | | | | | | | | | | | | | | | | | | | | |
Net asset value at beginning of period | | $ | 14.82 | | | $ | 13.65 | | | $ | 10.49 | | | $ | 16.29 | | | $ | 16.40 | |
| | | | | | | | | | | | | | | | | | | | |
Income (loss) from investment operations: | | | | | | | | | | | | | | | | | | | | |
Net investment income (loss) | | | 0.22 | | | | 0.13 | | | | 0.11 | | | | 0.23 | | | | 0.25 | |
Net realized and unrealized gains (losses) on investments | | | 0.17 | | | | 1.20 | | | | 3.11 | | | | (5.74 | ) | | | 0.73 | |
| | | | | | | | | | | | | | | | | | | | |
Total from investment operations | | | 0.39 | | | | 1.33 | | | | 3.22 | | | | (5.51 | ) | | | 0.98 | |
| | | | | | | | | | | | | | | | | | | | |
Less distributions: | | | | | | | | | | | | | | | | | | | | |
Dividends from net investment income | | | (0.20 | ) | | | (0.16 | ) | | | (0.06 | ) | | | (0.19 | ) | | | (0.27 | ) |
Distributions from net realized gains | | | - | | | | - | | | | - | | | | (0.10 | ) | | | (0.82 | ) |
| | | | | | | | | | | | | | | | | | | | |
Total distributions | | | (0.20 | ) | | | (0.16 | ) | | | (0.06 | ) | | | (0.29 | ) | | | (1.09 | ) |
| | | | | | | | | | | | | | | | | | | | |
Net asset value at end of period | | $ | 15.01 | | | $ | 14.82 | | | $ | 13.65 | | | $ | 10.49 | | | $ | 16.29 | |
| | | | | | | | | | | | | | | | | | | | |
Total return | | | 2.60% | | | | 9.72% | | | | 30.71% | | | | (33.82% | ) | | | 5.88% | |
| | | | | | | | | | | | | | | | | | | | |
Net assets at end of period (000’s) | | $ | 684,156 | | | $ | 623,147 | | | $ | 347,998 | | | $ | 141,416 | | | $ | 84,129 | |
| | | | | | | | | | | | | | | | | | | | |
Ratio of net expenses to average net assets | | | 0.83% | | | | 0.81% | | | | 0.79% | | | | 0.78% | | | | 0.78% | |
Ratio of net investment income (loss) to average net assets | | | 1.49% | | | | 1.29% | | | | 1.28% | | | | 1.67% | | | | 1.60% | |
Portfolio turnover rate(B) | | | 16% | | | | 16% | | | | 31% | | | | 28% | | | | 44% | |
| (A) | Total returns shown exclude the effect of applicable sales charges. |
| (B) | Portfolio turnover rate is calculated on the basis of the Fund as a whole without distinguishing between classes of shares issued. |
| (C) | Net investment income (loss) has been calculated using the average daily shares outstanding during the period. |
| (D) | Amount is less than $0.005. |
See accompanying Notes to Financial Statements.
| | |
| Diamond Hill Funds Annual Report December 31, 2011 | | Page 39 |
Diamond Hill Funds
Financial Highlights
(For a share of beneficial interest outstanding throughout each period)
| | | | | | | | | | | | | | | | | | | | |
| Diamond Hill Select Fund - Class A | | Year Ended
December 31,
2011 | | | Year Ended
December 31,
2010 | | | Year Ended
December 31,
2009 | | | Year Ended
December 31,
2008 | | | Year Ended
December 31,
2007 | |
Net asset value at beginning of period | | $ | 9.99 | | | $ | 9.02 | | | $ | 6.82 | | | $ | 10.61 | | | $ | 11.17 | |
| | | | | | | | | | | | | | | | | | | | |
Income (loss) from Investment operations: | | | | | | | | | | | | | | | | | | | | |
Net investment income (loss) | | | 0.08 | | | | 0.07 | | | | 0.04 | | | | 0.09 | | | | 0.12 | |
Net realized and unrealized gains (losses) on investments | | | (0.33 | ) | | | 0.91 | | | | 2.16 | | | | (3.55 | ) | | | 0.53 | |
| | | | | | | | | | | | | | | | | | | | |
Total from Investment operations | | | (0.25 | ) | | | 0.98 | | | | 2.20 | | | | (3.46 | ) | | | 0.65 | |
| | | | | | | | | | | | | | | | | | | | |
Less distributions: | | | | | | | | | | | | | | | | | | | | |
Dividends from net investment income | | | (0.05 | ) | | | (0.01 | ) | | | - | | | | (0.08 | ) | | | (0.09 | ) |
Distributions from net realized gains | | | - | | | | - | | | | - | | | | (0.25 | ) | | | (1.12 | ) |
| | | | | | | | | | | | | | | | | | | | |
Total distributions | | | (0.05 | ) | | | (0.01 | ) | | | - | | | | (0.33 | ) | | | (1.21 | ) |
| | | | | | | | | | | | | | | | | | | | |
Net asset value at end of period | | $ | 9.69 | | | $ | 9.99 | | | $ | 9.02 | | | $ | 6.82 | | | $ | 10.61 | |
| | | | | | | | | | | | | | | | | | | | |
Total return(A) | | | (2.53% | ) | | | 10.83% | | | | 32.26% | | | | (32.68% | ) | | | 5.63% | |
| | | | | | | | | | | | | | | | | | | | |
Net assets at end of period (000’s) | | $ | 8,071 | | | $ | 7,437 | | | $ | 6,910 | | | $ | 4,030 | | | $ | 6,841 | |
| | | | | | | | | | | | | | | | | | | | |
Ratio of net expenses to average net assets | | | 1.23% | | | | 1.28% | | | | 1.28% | | | | 1.28% | | | | 1.29% | |
Ratio of net investment income (loss) to average net assets | | | 0.92% | | | | 0.67% | | | | 0.60% | | | | 1.10% | | | | 0.90% | |
Portfolio turnover rate(B) | | | 26% | | | | 18% | | | | 57% | | | | 85% | | | | 55% | |
| | | | | |
Diamond Hill Select Fund - Class C | | | | | | | | | | | | | | | | | | | | |
Net asset value at beginning of period | | $ | 9.83 | | | $ | 8.94 | | | $ | 6.78 | | | $ | 10.56 | | | $ | 11.16 | |
| | | | | | | | | | | | | | | | | | | | |
Income (loss) from investment operations: | | | | | | | | | | | | | | | | | | | | |
Net investment income (loss) | | | 0.02 | | | | (0.01 | ) | | | 0.01 | | | | 0.02 | | | | 0.02 | |
Net realized and unrealized gains (losses) on investments | | | (0.34 | ) | | | 0.90 | | | | 2.15 | | | | (3.55 | ) | | | 0.54 | |
| | | | | | | | | | | | | | | | | | | | |
Total from investment operations | | | (0.32 | ) | | | 0.89 | | | | 2.16 | | | | (3.53 | ) | | | 0.56 | |
| | | | | | | | | | | | | | | | | | | | |
Less distributions: | | | | | | | | | | | | | | | | | | | | |
Dividends from net investment income | | | - | | | | - | | | | - | | | | - | | | | (0.04 | ) |
Distributions from net realized gains | | | - | | | | - | | | | - | | | | (0.25 | ) | | | (1.12 | ) |
| | | | | | | | | | | | | | | | | | | | |
Total distributions | | | - | | | | - | | | | - | | | | (0.25 | ) | | | (1.16 | ) |
| | | | | | | | | | | | | | | | | | | | |
Net asset value at end of period | | $ | 9.51 | | | $ | 9.83 | | | $ | 8.94 | | | $ | 6.78 | | | $ | 10.56 | |
| | | | | | | | | | | | | | | | | | | | |
Total return(A) | | | (3.26% | ) | | | 9.96% | | | | 31.86% | | | | (33.48% | ) | | | 4.78% | |
| | | | | | | | | | | | | | | | | | | | |
Net assets at end of period (000’s) | | $ | 3,630 | | | $ | 4,254 | | | $ | 3,472 | | | $ | 3,366 | | | $ | 6,912 | |
| | | | | | | | | | | | | | | | | | | | |
Ratio of net expenses to average net assets | | | 1.98% | | | | 2.03% | | | | 2.03% | | | | 2.01% | | | | 2.03% | |
Ratio of net investment income (loss) to average net assets | | | 0.15% | | | | (0.08% | ) | | | 0.07% | | | | 0.28% | | | | 0.23% | |
Ratio of gross expenses to average net assets | | | 1.98% | | | | 2.03% | | | | 2.03% | | | | 2.02% | | | | 2.04% | |
Portfolio turnover rate(B) | | | 26% | | | | 18% | | | | 57% | | | | 85% | | | | 55% | |
| | | | | |
Diamond Hill Select Fund - Class I | | | | | | | | | | | | | | | | | | | | |
Net asset value at beginning of period | | $ | 9.98 | | | $ | 9.02 | | | $ | 6.75 | | | $ | 10.59 | | | $ | 11.16 | |
| | | | | | | | | | | | | | | | | | | | |
Income (loss) from investment operations: | | | | | | | | | | | | | | | | | | | | |
Net investment income (loss) | | | 0.11 | | | | 0.07 | | | | 0.05 | | | | 0.11 | | | | 0.13 | |
Net realized and unrealized gains (losses) on investments | | | (0.33 | ) | | | 0.94 | | | | 2.22 | | | | (3.58 | ) | | | 0.57 | |
| | | | | | | | | | | | | | | | | | | | |
Total from investment operations | | | (0.22 | ) | | | 1.01 | | | | 2.27 | | | | (3.47 | ) | | | 0.70 | |
| | | | | | | | | | | | | | | | | | | | |
Less distributions: | | | | | | | | | | | | | | | | | | | | |
Dividends from net investment income | | | (0.08 | ) | | | (0.05 | ) | | | - | | | | (0.12 | ) | | | (0.15 | ) |
Distributions from net realized gains | | | - | | | | - | | | | - | | | | (0.25 | ) | | | (1.12 | ) |
| | | | | | | | | | | | | | | | | | | | |
Total distributions | | | (0.08 | ) | | | (0.05 | ) | | | - | | | | (0.37 | ) | | | (1.27 | ) |
| | | | | | | | | | | | | | | | | | | | |
Net asset value at end of period | | $ | 9.68 | | | $ | 9.98 | | | $ | 9.02 | | | $ | 6.75 | | | $ | 10.59 | |
| | | | | | | | | | | | | | | | | | | | |
Total return | | | (2.25% | ) | | | 11.19% | | | | 33.63% | | | | (32.85% | ) | | | 6.10% | |
| | | | | | | | | | | | | | | | | | | | |
Net assets at end of period (000’s) | | $ | 34,388 | | | $ | 31,619 | | | $ | 23,122 | | | $ | 7,489 | | | $ | 4,667 | |
| | | | | | | | | | | | | | | | | | | | |
Ratio of net expenses to average net assets | | | 0.95% | | | | 0.91% | | | | 0.89% | | | | 0.87% | | | | 0.88% | |
Ratio of net investment income (loss) to average net assets | | | 1.21% | | | | 1.05% | | | | 1.29% | | | | 1.58% | | | | 1.37% | |
Ratio of gross expenses to average net assets | | | 0.95% | | | | 0.91% | | | | 0.89% | | | | 0.87% | | | | 0.89% | |
Portfolio turnover rate(B) | | | 26% | | | | 18% | | | | 57% | | | | 85% | | | | 55% | |
| (A) | Total returns shown exclude the effect of applicable sales charges. |
| (B) | Portfolio turnover rate is calculated on the basis of the Fund as a whole without distinguishing between classes of shares issued. |
See accompanying Notes to Financial Statements.
| | |
| Page 40 | | Diamond Hill Funds Annual Report December 31, 2011 |
Diamond Hill Funds
Financial Highlights
(For a share of beneficial interest outstanding throughout each period)
| | | | | | | | | | | | | | | | | | | | |
| Diamond Hill Long-Short Fund – Class A | | Year Ended
December 31,
2011 | | | Year Ended
December 31,
2010 | | | Year Ended
December 31,
2009 | | | Year Ended
December 31,
2008 | | | Year Ended
December 31,
2007 | |
Net asset value at beginning of period | | $ | 16.26 | | | $ | 16.31 | | | $ | 13.83 | | | $ | 18.40 | | | $ | 18.57 | |
| | | | | | | | | | | | | | | | | | | | |
Income (loss) from Investment operations: | | | | | | | | | | | | | | | | | | | | |
Net investment income (loss) | | | 0.03 | (C) | | | - | (D) | | | - | (D) | | | 0.16 | | | | 0.44 | |
Net realized and unrealized gains (losses) on investments | | | 0.46 | | | | (0.05 | ) | | | 2.48 | | | | (4.52 | ) | | | 0.16 | |
| | | | | | | | | | | | | | | | | | | | |
Total from Investment operations | | | 0.49 | | | | (0.05 | ) | | | 2.48 | | | | (4.36 | ) | | | 0.60 | |
| | | | | | | | | | | | | | | | | | | | |
Less distributions: | | | | | | | | | | | | | | | | | | | | |
Dividends from net investment income | | | - | | | | - | | | | - | | | | (0.15 | ) | | | (0.42 | ) |
Distributions from net realized gains | | | - | | | | - | | | | - | | | | (0.06 | ) | | | (0.35 | ) |
| | | | | | | | | | | | | | | | | | | | |
Total distributions | | | - | | | | - | | | | - | | | | (0.21 | ) | | | (0.77 | ) |
| | | | | | | | | | | | | | | | | | | | |
Net asset value at end of period | | $ | 16.75 | | | $ | 16.26 | | | $ | 16.31 | | | $ | 13.83 | | | $ | 18.40 | |
| | | | | | | | | | | | | | | | | | | | |
Total return(A) | | | 3.01% | | | | (0.31% | ) | | | 17.93% | | | | (23.65% | ) | | | 3.14% | |
| | | | | | | | | | | | | | | | | | | | |
Net assets at end of period (000’s) | | $ | 512,870 | | | $ | 698,670 | | | $ | 965,382 | | | $ | 1,110,982 | | | $ | 965,259 | |
| | | | | | | | | | | | | | | | | | | | |
Ratio of net expenses to average net assets | | | 1.67% | | | | 1.81% | | | | 1.85% | | | | 1.62% | | | | 1.69% | |
Ratio of net investment income (loss) to average net assets | | | 0.21% | | | | 0.01% | | | | -% | (E) | | | 0.95% | | | | 2.46% | |
Ratio of net expenses to average net assets, excluding dividends on securities sold short | | | 1.43% | | | | 1.48% | | | | 1.48% | | | | 1.45% | | | | 1.48% | |
Portfolio turnover rate(B) | | | 50% | | | | 43% | | | | 44% | | | | 59% | | | | 59% | |
| | | | | |
Diamond Hill Long-Short Fund – Class C | | | | | | | | | | | | | | | | | | | | |
Net asset value at beginning of period | | $ | 15.37 | | | $ | 15.54 | | | $ | 13.28 | | | $ | 17.65 | | | $ | 17.88 | |
| | | | | | | | | | | | | | | | | | | | |
Income (loss) from investment operations: | | | | | | | | | | | | | | | | | | | | |
Net investment income (loss) | | | (0.08 | )(C) | | | (0.19 | ) | | | (0.12 | ) | | | 0.04 | | | | 0.27 | |
Net realized and unrealized gains (losses) on investments | | | 0.43 | | | | 0.02 | | | | 2.38 | | | | (4.32 | ) | | | 0.16 | |
| | | | | | | | | | | | | | | | | | | | |
Total from investment operations | | | 0.35 | | | | (0.17 | ) | | | 2.26 | | | | (4.28 | ) | | | 0.43 | |
| | | | | | | | | | | | | | | | | | | | |
Less distributions: | | | | | | | | | | | | | | | | | | | | |
Dividends from net investment income | | | - | | | | - | | | | - | | | | (0.03 | ) | | | (0.31 | ) |
Distributions from net realized gains | | | - | | | | - | | | | - | | | | (0.06 | ) | | | (0.35 | ) |
| | | | | | | | | | | | | | | | | | | | |
Total distributions | | | - | | | | - | | | | - | | | | (0.09 | ) | | | (0.66 | ) |
| | | | | | | | | | | | | | | | | | | | |
Net asset value at end of period | | $ | 15.72 | | | $ | 15.37 | | | $ | 15.54 | | | $ | 13.28 | | | $ | 17.65 | |
| | | | | | | | | | | | | | | | | | | | |
Total return(A) | | | 2.28% | | | | (1.09% | ) | | | 17.02% | | | | (24.26% | ) | | | 2.41% | |
| | | | | | | | | | | | | | | | | | | | |
Net assets at end of period (000’s) | | $ | 119,850 | | | $ | 179,214 | | | $ | 256,445 | | | $ | 278,069 | | | $ | 303,392 | |
| | | | | | | | | | | | | | | | | | | | |
Ratio of net expenses to average net assets | | | 2.43% | | | | 2.56% | | | | 2.60% | | | | 2.37% | | | | 2.44% | |
Ratio of net investment income (loss) to average net assets | | | (0.54% | ) | | | (0.73% | ) | | | (0.76% | ) | | | 0.22% | | | | 1.72% | |
Ratio of net expenses to average net assets, excluding dividends on securities sold short | | | 2.19% | | | | 2.23% | | | | 2.23% | | | | 2.20% | | | | 2.23% | |
Portfolio turnover rate(B) | | | 50% | | | | 43% | | | | 44% | | | | 59% | | | | 59% | |
| | | | | |
| Diamond Hill Long-Short Fund – Class I | | | | | | | | | | | | | | | | | | | | |
Net asset value at beginning of period | | $ | 16.42 | | | $ | 16.42 | | | $ | 13.87 | | | $ | 18.46 | | | $ | 18.63 | |
| | | | | | | | | | | | | | | | | | | | |
Income (loss) from investment operations: | | | | | | | | | | | | | | | | | | | | |
Net investment income (loss) | | | 0.09 | (C) | | | 0.04 | | | | 0.05 | | | | 0.19 | | | | 0.48 | |
Net realized and unrealized gains (losses) on investments | | | 0.45 | | | | (0.03 | ) | | | 2.50 | | | | (4.51 | ) | | | 0.19 | |
| | | | | | | | | | | | | | | | | | | | |
Total from investment operations | | | 0.54 | | | | 0.01 | | | | 2.55 | | | | (4.32 | ) | | | 0.67 | |
| | | | | | | | | | | | | | | | | | | | |
Less distributions: | | | | | | | | | | | | | | | | | | | | |
Dividends from net investment income | | | (0.03 | ) | | | (0.01 | ) | | | - | (D) | | | (0.21 | ) | | | (0.49 | ) |
Distributions from net realized gains | | | - | | | | - | | | | - | | | | (0.06 | ) | | | (0.35 | ) |
| | | | | | | | | | | | | | | | | | | | |
Total distributions | | | (0.03 | ) | | | (0.01 | ) | | | - | (D) | | | (0.27 | ) | | | (0.84 | ) |
| | | | | | | | | | | | | | | | | | | | |
Net asset value at end of period | | $ | 16.93 | | | $ | 16.42 | | | $ | 16.42 | | | $ | 13.87 | | | $ | 18.46 | |
| | | | | | | | | | | | | | | | | | | | |
Total return | | | 3.29% | | | | 0.03% | | | | 18.39% | | | | (23.36% | ) | | | 3.59% | |
| | | | | | | | | | | | | | | | | | | | |
Net assets at end of period (000’s) | | $ | 1,213,122 | | | $ | 1,045,686 | | | $ | 733,909 | | | $ | 657,662 | | | $ | 500,425 | |
| | | | | | | | | | | | | | | | | | | | |
Ratio of net expenses to average net assets | | | 1.39% | | | | 1.46% | | | | 1.47% | | | | 1.24% | | | | 1.29% | |
Ratio of net investment income (loss) to average net assets | | | 0.52% | | | | 0.42% | | | | 0.37% | | | | 1.33% | | | | 2.87% | |
Ratio of net expenses to average net assets, excluding dividends on securities sold short | | | 1.15% | | | | 1.11% | | | | 1.10% | | | | 1.08% | | | | 1.08% | |
Portfolio turnover rate(B) | | | 50% | | | | 43% | | | | 44% | | | | 59% | | | | 59% | |
| (A) | Total returns shown exclude the effect of applicable sales charges. |
| (B) | Portfolio turnover rate is calculated on the basis of the Fund as a whole without distinguishing between classes of shares issued. |
| (C) | Net investment income (loss) per share has been calculated using the average daily shares outstanding during the period. |
| (D) | Amount is less than $0.005. |
| (E) | Amount is less than 0.005%. |
See accompanying Notes to Financial Statements.
| | |
| Diamond Hill Funds Annual Report December 31, 2011 | | Page 41 |
Diamond Hill Funds
Financial Highlights
(For a share of beneficial interest outstanding throughout each period)
| | | | | | | | | | | | | | | | | | | | |
| Diamond Hill Financial Long-Short Fund – Class A | | Year Ended
December 31,
2011 | | | Year Ended
December 31,
2010 | | | Year Ended
December 31,
2009 | | | Year Ended
December 31,
2008 | | | Year Ended
December 31,
2007 | |
Net asset value at beginning of period | | $ | 12.18 | | | $ | 10.43 | | | $ | 8.48 | | | $ | 16.20 | | | $ | 20.90 | |
| | | | | | | | | | | | | | | | | | | | |
Income (loss) from Investment operations: | | | | | | | | | | | | | | | | | | | | |
Net investment income (loss) | | | 0.02 | | | | 0.02 | | | | 0.16 | (C) | | | 0.45 | | | | 0.49 | |
Net realized and unrealized gains (losses) on investments | | | (1.65 | ) | | | 1.73 | | | | 1.94 | | | | (7.74 | ) | | | (4.04 | ) |
| | | | | | | | | | | | | | | | | | | | |
Total from Investment operations | | | (1.63 | ) | | | 1.75 | | | | 2.10 | | | | (7.29 | ) | | | (3.55 | ) |
| | | | | | | | | | | | | | | | | | | | |
Less distributions: | | | | | | | | | | | | | | | | | | | | |
Dividends from net investment income | | | (0.04 | ) | | | - | | | | (0.15 | ) | | | (0.42 | ) | | | (0.47 | ) |
Distributions from net realized gains | | | - | | | | - | | | | - | | | | (0.01 | ) | | | (0.68 | ) |
| | | | | | | | | | | | | | | | | | | | |
Total distributions | | | (0.04 | ) | | | - | | | | (0.15 | ) | | | (0.43 | ) | | | (1.15 | ) |
| | | | | | | | | | | | | | | | | | | | |
Net asset value at end of period | | $ | 10.51 | | | $ | 12.18 | | | $ | 10.43 | | | $ | 8.48 | | | $ | 16.20 | |
| | | | | | | | | | | | | | | | | | | | |
Total return(A) | | | (13.39% | ) | | | 16.78% | | | | 24.73% | | | | (44.98% | ) | | | 17.05% | |
| | | | | | | | | | | | | | | | | | | | |
Net assets at end of period (000’s) | | $ | 6,650 | | | $ | 8,543 | | | $ | 8,053 | | | $ | 7,596 | | | $ | 27,597 | |
| | | | | | | | | | | | | | | | | | | | |
Ratio of net expenses to average net assets | | | 1.66% | | | | 1.71% | | | | 1.77% | | | | 1.85% | | | | 1.81% | |
Ratio of net investment income (loss) to average net assets | | | 0.14% | | | | 0.09% | | | | 1.92% | | | | 2.37% | | | | 2.17% | |
Ratio of gross expenses to average net assets | | | 1.66% | | | | 1.71% | | | | 1.77% | | | | 1.85% | | | | 1.82% | |
Ratio of net expenses to average net assets, excluding dividends on securities sold short | | | 1.54% | | | | 1.56% | | | | 1.58% | | | | 1.56% | | | | 1.59% | |
Portfolio turnover rate(B) | | | 52% | | | | 60% | | | | 85% | | | | 74% | | | | 55% | |
Diamond Hill Financial Long-Short Fund – Class C | | | | | | | | | | | | | | | | | | | | |
Net asset value at beginning of period | | $ | 11.58 | | | $ | 9.99 | | | $ | 8.12 | | | $ | 15.60 | | | $ | 20.10 | |
| | | | | | | | | | | | | | | | | | | | |
Income (loss) from investment operations: | | | | | | | | | | | | | | | | | | | | |
Net investment income (loss) | | | (0.07 | )(C) | | | (0.10 | ) | | | 0.09 | (C) | | | 0.21 | | | | 0.34 | |
Net realized and unrealized gains (losses) on investments | | | (1.55 | ) | | | 1.69 | | | | 1.84 | | | | (7.31 | ) | | | (3.88 | ) |
| | | | | | | | | | | | | | | | | | | | |
Total from investment operations | | | (1.62 | ) | | | 1.59 | | | | 1.93 | | | | (7.10 | ) | | | (3.54 | ) |
| | | | | | | | | | | | | | | | | | | | |
Less distributions: | | | | | | | | | | | | | | | | | | | | |
Dividends from net investment income | | | - | | | | - | | | | (0.06 | ) | | | (0.37 | ) | | | (0.28 | ) |
Distributions from net realized gains | | | - | | | | - | | | | - | | | | (0.01 | ) | | | (0.68 | ) |
| | | | | | | | | | | | | | | | | | | | |
Total distributions | | | - | | | | - | | | | (0.06 | ) | | | (0.38 | ) | | | (0.96 | ) |
| | | | | | | | | | | | | | | | | | | | |
Net asset value at end of period | | $ | 9.96 | | | $ | 11.58 | | | $ | 9.99 | | | $ | 8.12 | | | $ | 15.60 | |
| | | | | | | | | | | | | | | | | | | | |
Total return(A) | | | (13.99% | ) | | | 15.92% | | | | 23.81% | | | | (45.49% | ) | | | (17.68% | ) |
| | | | | | | | | | | | | | | | | | | | |
Net assets at end of period (000’s) | | $ | 795 | | | $ | 1,381 | | | $ | 1,295 | | | $ | 1,866 | | | $ | 3,287 | |
| | | | | | | | | | | | | | | | | | | | |
Ratio of net expenses to average net assets | | | 2.41% | | | | 2.46% | | | | 2.52% | | | | 2.58% | | | | 2.56% | |
Ratio of net investment income (loss) to average net assets | | | (0.60% | ) | | | (0.66% | ) | | | 1.17% | | | | 1.76% | | | | 1.42% | |
Ratio of gross expenses to average net assets | | | 2.41% | | | | 2.46% | | | | 2.52% | | | | 2.58% | | | | 2.57% | |
Ratio of net expenses to average net assets, excluding dividends on securities sold short | | | 2.29% | | | | 2.31% | | | | 2.35% | | | | 2.30% | | | | 2.34% | |
Portfolio turnover rate(B) | | | 52% | | | | 60% | | | | 85% | | | | 74% | | | | 55% | |
Diamond Hill Financial Long-Short Fund – Class I | | | | | | | | | | | | | | | | | | | | |
Net asset value at beginning of period | | $ | 12.14 | | | $ | 10.37 | | | $ | 8.43 | | | $ | 16.18 | | | $ | 20.90 | |
| | | | | | | | | | | | | | | | | | | | |
Income (loss) from investment operations: | | | | | | | | | | | | | | | | | | | | |
Net investment income (loss) | | | 0.07 | | | | 0.08 | | | | 0.21 | (C) | | | 0.63 | | | | 0.37 | |
Net realized and unrealized gains (losses) on investments | | | (1.67 | ) | | | 1.71 | | | | 1.92 | | | | (7.89 | ) | | | (3.83 | ) |
| | | | | | | | | | | | | | | | | | | | |
Total from investment operations | | | (1.60 | ) | | | 1.79 | | | | 2.13 | | | | (7.26 | ) | | | (3.46 | ) |
| | | | | | | | | | | | | | | | | | | | |
Less distributions: | | | | | | | | | | | | | | | | | | | | |
Dividends from net investment income | | | (0.07 | ) | | | (0.02 | ) | | | (0.19 | ) | | | (0.48 | ) | | | (0.58 | ) |
Distributions from net realized gains | | | - | | | | - | | | | - | | | | (0.01 | ) | | | (0.68 | ) |
| | | | | | | | | | | | | | | | | | | | |
Total distributions | | | (0.07 | ) | | | (0.02 | ) | | | (0.19 | ) | | | (0.49 | ) | | | (1.26 | ) |
| | | | | | | | | | | | | | | | | | | | |
Net asset value at end of period | | $ | 10.47 | | | $ | 12.14 | | | $ | 10.37 | | | $ | 8.43 | | | $ | 16.18 | |
| | | | | | | | | | | | | | | | | | | | |
Total return | | | (13.21% | ) | | | 17.29% | | | | 25.31% | | | | (44.79% | ) | | | (16.61% | ) |
| | | | | | | | | | | | | | | | | | | | |
Net assets at end of period (000’s) | | $ | 1,584 | | | $ | 1,873 | | | $ | 671 | | | $ | 709 | | | $ | 2,464 | |
| | | | | | | | | | | | | | | | | | | | |
Ratio of net expenses to average net assets | | | 1.37% | | | | 1.34% | | | | 1.38% | | | | 1.47% | | | | 1.41% | |
Ratio of net investment income (loss) to average net assets | | | 0.47% | | | | 0.45% | | | | 2.45% | | | | 2.80% | | | | 2.96% | |
Ratio of gross expenses to average net assets | | | 1.37% | | | | 1.34% | | | | 1.38% | | | | 1.47% | | | | 1.42% | |
Ratio of net expenses to average net assets, excluding dividends on securities sold short | | | 1.25% | | | | 1.19% | | | | 1.19% | | | | 1.18% | | | | 1.18% | |
Portfolio turnover rate(B) | | | 52% | | | | 60% | | | | 85% | | | | 74% | | | | 55% | |
| (A) | Total returns shown exclude the effect of applicable sales charges. |
| (B) | Portfolio turnover rate is calculated on the basis of the Fund as a whole without distinguishing between classes of shares issued. |
| (C) | Net investment income (loss) per share has been calculated using the average daily shares outstanding during the period. |
See accompanying Notes to Financial Statements.
| | |
| Page 42 | | Diamond Hill Funds Annual Report December 31, 2011 |
Diamond Hill Funds
Financial Highlights
(For a share of beneficial interest outstanding throughout each period)
| | | | | | | | | | | | | | | | | | | | |
| Diamond Hill Strategic Income Fund - Class A | | Year Ended
December 31,
2011 | | | Year Ended
December 31,
2010 | | | Year Ended
December 31,
2009 | | | Year Ended
December 31,
2008 | | | Year Ended
December 31,
2007 | |
Net asset value at beginning of period | | $ | 10.86 | | | $ | 10.15 | | | $ | 8.28 | | | $ | 10.41 | | | $ | 11.71 | |
| | | | | | | | | | | | | | | | | | | | |
Income (loss) from Investment operations: | | | | | | | | | | | | | | | | | | | | |
Net investment income (loss) | | | 0.65 | | | | 0.64 | | | | 0.69 | | | | 0.71 | | | | 0.68 | |
Net realized and unrealized gains (losses) on investments | | | (0.09 | ) | | | 0.69 | | | | 1.86 | | | | (2.19 | ) | | | (1.20 | ) |
| | | | | | | | | | | | | | | | | | | | |
Total from Investment operations | | | 0.56 | | | | 1.33 | | | | 2.55 | | | | (1.48 | ) | | | (0.52 | ) |
| | | | | | | | | | | | | | | | | | | | |
Less distributions: | | | | | | | | | | | | | | | | | | | | |
Dividends from net investment income | | | (0.63 | ) | | | (0.62 | ) | | | (0.68 | ) | | | (0.64 | ) | | | (0.67 | ) |
Distributions from net realized gains | | | - | | | | - | | | | - | | | | - | | | | (0.11 | ) |
Return of capital | | | - | | | | - | | | | - | | | | (0.01 | ) | | | - | |
| | | | | | | | | | | | | | | | | | | | |
Total distributions | | | (0.63 | ) | | | (0.62 | ) | | | (0.68 | ) | | | (0.65 | ) | | | (0.78 | ) |
| | | | | | | | | | | | | | | | | | | | |
Net asset value at end of period | | $ | 10.79 | | | $ | 10.86 | | | $ | 10.15 | | | $ | 8.28 | | | $ | 10.41 | |
| | | | | | | | | | | | | | | | | | | | |
Total return(A) | | | 5.21% | | | | 13.33% | | | | 32.13% | | | | (14.79% | ) | | | (4.78% | ) |
| | | | | | | | | | | | | | | | | | | | |
Net assets at end of period (000’s) | | $ | 38,895 | | | $ | 42,360 | | | $ | 41,048 | | | $ | 31,268 | | | $ | 54,435 | |
| | | | | | | | | | | | | | | | | | | | |
Ratio of net expenses to average net assets | | | 1.02% | | | | 1.06% | | | | 1.08% | | | | 1.06% | | | | 1.08% | |
Ratio of net investment income (loss) to average net assets | | | 5.80% | | | | 5.81% | | | | 7.64% | | | | 6.60% | | | | 6.15% | |
Ratio of gross expenses to average net assets | | | 1.02% | | | | 1.06% | | | | 1.08% | | | | 1.06% | | | | 1.09% | |
Portfolio turnover rate(B) | | | 36% | | | | 68% | | | | 83% | | | | 95% | | | | 142% | |
| | | | | |
Diamond Hill Strategic Income Fund - Class C | | | | | | | | | | | | | | | | | | | | |
Net asset value at beginning of period | | $ | 10.85 | | | $ | 10.15 | | | $ | 8.27 | | | $ | 10.41 | | | $ | 11.70 | |
| | | | | | | | | | | | | | | | | | | | |
Income (loss) from investment operations: | | | | | | | | | | | | | | | | | | | | |
Net investment income (loss) | | | 0.56 | | | | 0.54 | | | | 0.58 | | | | 0.65 | | | | 0.62 | |
Net realized and unrealized gains (losses) on investments | | | (0.08 | ) | | | 0.70 | | | | 1.91 | | | | (2.21 | ) | | | (1.22 | ) |
| | | | | | | | | | | | | | | | | | | | |
Total from investment operations | | | 0.48 | | | | 1.24 | | | | 2.49 | | | | 1.56 | | | | (0.60 | ) |
| | | | | | | | | | | | | | | | | | | | |
Less distributions: | | | | | | | | | | | | | | | | | | | | |
Dividends from net investment income | | | (0.55 | ) | | | (0.54 | ) | | | (0.61 | ) | | | (0.57 | ) | | | (0.58 | ) |
Distributions from net realized gains | | | - | | | | - | | | | - | | | | - | | | | (0.11 | ) |
Return of capital | | | - | | | | - | | | | - | | | | (0.01 | ) | | | - | |
| | | | | | | | | | | | | | | | | | | | |
Total distributions | | | (0.55 | ) | | | (0.54 | ) | | | (0.61 | ) | | | (0.58 | ) | | | (0.69 | ) |
| | | | | | | | | | | | | | | | | | | | |
Net asset value at end of period | | $ | 10.78 | | | $ | 10.85 | | | $ | 10.15 | | | $ | 8.27 | | | $ | 10.41 | |
| | | | | | | | | | | | | | | | | | | | |
Total return(A) | | | 4.48% | | | | 12.39% | | | | 31.34% | | | | (15.51% | ) | | | (5.43% | ) |
| | | | | | | | | | | | | | | | | | | | |
Net assets at end of period (000’s) | | $ | 23,717 | | | $ | 24,264 | | | $ | 22,120 | | | $ | 14,730 | | | $ | 24,638 | |
| | | | | | | | | | | | | | | | | | | | |
Ratio of net expenses to average net assets | | | 1.77% | | | | 1.81% | | | | 1.83% | | | | 1.80% | | | | 1.83% | |
Ratio of net investment income (loss) to average net assets | | | 5.06% | | | | 5.06% | | | | 6.88% | | | | 5.87% | | | | 5.35% | |
Ratio of gross expenses to average net assets | | | 1.77% | | | | 1.81% | | | | 1.83% | | | | 1.81% | | | | 1.84% | |
Portfolio turnover rate(B) | | | 36% | | | | 68% | | | | 83% | | | | 95% | | | | 142% | |
| | | | | |
Diamond Hill Strategic Income Fund - Class I | | | | | | | | | | | | | | | | | | | | |
Net asset value at beginning of period | | $ | 10.84 | | | $ | 10.13 | | | $ | 8.26 | | | $ | 10.40 | | | $ | 11.69 | |
| | | | | | | | | | | | | | | | | | | | |
Income (loss) from investment operations: | | | | | | | | | | | | | | | | | | | | |
Net investment income (loss) | | | 0.67 | | | | 0.64 | | | | 0.73 | | | | 0.70 | | | | 0.71 | |
Net realized and unrealized gains (losses) on investments | | | (0.08 | ) | | | 0.72 | | | | 1.85 | | | | (2.15 | ) | | | (1.17 | ) |
| | | | | | | | | | | | | | | | | | | | |
Total from investment operations | | | 0.59 | | | | 1.36 | | | | 2.58 | | | | (1.45 | ) | | | (0.46 | ) |
| | | | | | | | | | | | | | | | | | | | |
Less distributions: | | | | | | | | | | | | | | | | | | | | |
Dividends from net investment income | | | (0.66 | ) | | | (0.65 | ) | | | (0.71 | ) | | | (0.68 | ) | | | (0.72 | ) |
Distributions from net realized gains | | | - | | | | - | | | | - | | | | - | | | | (0.11 | ) |
Return of capital | | | - | | | | - | | | | - | | | | (0.01 | ) | | | - | |
| | | | | | | | | | | | | | | | | | | | |
Total distributions | | | (0.66 | ) | | | (0.65 | ) | | | (0.71 | ) | | | (0.69 | ) | | | (0.83 | ) |
| | | | | | | | | | | | | | | | | | | | |
Net asset value at end of period | | $ | 10.77 | | | $ | 10.84 | | | $ | 10.13 | | | $ | 8.26 | | | $ | 10.40 | |
| | | | | | | | | | | | | | | | | | | | |
Total return | | | 5.53% | | | | 13.77% | | | | 32.69% | | | | (14.55% | ) | | | (4.31% | ) |
| | | | | | | | | | | | | | | | | | | | |
Net assets at end of period (000’s) | | $ | 83,418 | | | $ | 76,893 | | | $ | 64,407 | | | $ | 50,185 | | | $ | 70,205 | |
| | | | | | | | | | | | | | | | | | | | |
Ratio of net expenses to average net assets | | | 0.73% | | | | 0.69% | | | | 0.69% | | | | 0.67% | | | | 0.68% | |
Ratio of net investment income (loss) to average net assets | | | 6.10% | | | | 6.18% | | | | 8.05% | | | | 7.05% | | | | 6.62% | |
Ratio of gross expenses to average net assets | | | 0.73% | | | | 0.69% | | | | 0.69% | | | | 0.68% | | | | 0.68% | |
Portfolio turnover rate(B) | | | 36% | | | | 68% | | | | 83% | | | | 95% | | | | 142% | |
| (A) | Total returns shown exclude the effect of applicable sales charges. |
| (B) | Portfolio turnover rate is calculated on the basis of the Fund as a whole without distinguishing between classes of shares issued. |
See accompanying Notes to Financial Statements.
| | |
| Diamond Hill Funds Annual Report December 31, 2011 | | Page 43 |
Diamond Hill Funds
Notes to Financial Statements
December 31, 2011
Organization
The Diamond Hill Small Cap Fund (“Small Cap Fund”), Diamond Hill Small-Mid Cap Fund (“Small-Mid Cap Fund”), Diamond Hill Large Cap Fund (“Large Cap Fund”), Diamond Hill Select Fund (“Select Fund”), Diamond Hill Long-Short Fund (“Long-Short Fund”), Diamond Hill Financial Long-Short Fund (“Financial Long-Short Fund”) and Diamond Hill Strategic Income Fund (“Strategic Income Fund”), are each a series of the Diamond Hill Funds (the “Trust”) (each a “Fund” and collectively the “Funds”). The Trust is an Ohio business trust, which is registered under the Investment Company Act of 1940, as amended, (the “1940 Act”) as an open-end, management investment company. Each Fund is a diversified series of the Trust.
The Funds offer three classes of shares: Class A, Class C and Class I. Each class of shares for each Fund has identical rights and privileges except with respect to distribution (12b-1) and service fees, voting rights on matters affecting a single class of shares, exchange privileges of each class of shares and sales charges. Class A has a maximum sales charge on purchases of 5.00% as a percentage of the original purchase price except for Strategic Income Fund which is 3.50%. Class C has a contingent deferred sales charge of 1.00% for shares redeemed within a year of the purchase date.
Significant Accounting Policies
The following is a summary of the Funds’ significant accounting policies:
Estimates — The preparation of financial statements in conformity with U.S. generally accepted accounting principles (“GAAP”) requires management to make estimates and assumptions that affect the reported amounts of assets and liabilities and disclosure of contingent assets and liabilities at the date of the financial statements and the reported amounts of income and expenses during the reporting period. Actual results could differ from those estimates.
Security valuation — The Funds record their investments at fair value. Fair value is defined as the price that would be received to sell an asset or paid to transfer a liability in an orderly transaction between market participants at the measurement date. The valuation techniques used to determine fair value are further described below.
Listed securities for which market quotations are readily available are valued at the closing prices as determined by the primary exchange where the securities are traded. Unlisted securities or listed securities for which the latest sales prices are not readily available are valued at the closing bid price in the principal market where such securities are normally traded. Debt securities are valued on the basis of valuations provided by dealers or by an independent pricing service that determines valuations based upon market transactions for normal, institutional-size trading units of similar securities. Short-term debt investments of sufficient credit quality maturing in less than 61 days are valued at amortized cost, which approximates fair value. Investments in other investment companies are valued at their reported net asset value. Securities for which market quotations are not readily available (e.g., an approved pricing service does not provide a price, certain stale prices, or an event occurs that materially affects the furnished price) are valued by the Fair Value Committee. In these cases, the Fair Value Committee established and appointed by the Trustees determines in good faith, subject to Trust procedures, the fair value of portfolio securities held by a Fund (“good faith fair valuation”). When a good faith fair valuation of a security is required, consideration is generally given to a number of factors, including, but not limited to the following: dealer quotes, published analyses by dealers or analysts of the situation at issue, transactions implicitly valuing the security (such as a merger, tender offer, etc.), the value of other securities or contracts which derive their value from the security at issue, and the implications (whether negative or positive) of the circumstances which have caused trading in the security to halt. Approximately 0.6% of the Strategic Income Fund’s net assets are being valued using estimates provided by the Fair Value Committee. The Fair Value Committee relied heavily upon analysis of the Strategic Income Fund’s portfolio manager in the absence of readily ascertainable fair values. These values may differ from the values that would have been used had a ready market for these securities existed, and the differences could be material.
The valuation techniques described maximize the use of observable inputs and minimize the use of unobservable inputs in determining fair value. These inputs are summarized in the three broad levels listed below:
| | • | | Level 1 – quoted prices in active markets for identical securities |
| | • | | Level 2 – other significant observable inputs (including quoted prices for similar securities, interest rates, prepayment speeds, credit risk, etc.) |
| | • | | Level 3 – significant unobservable inputs (including the Funds’ own assumptions in determining the fair value of investments) |
The inputs or methodology used for valuing securities are not necessarily an indication of the risk associated with investing in those securities. For example, short-term debt securities of sufficient credit quality maturing in less than
| | |
| Page 44 | | Diamond Hill Funds Annual Report December 31, 2011 |
Diamond Hill Funds
Notes to Financial Statements (Continued)
December 31, 2011
61 days are valued using amortized cost in accordance with rules under the 1940 Act. Generally, amortized cost approximates the current fair value of a security, but since the value is not obtained from a quoted price in an active market, such securities are reflected as Level 2.
The following is a summary of the inputs used to value the Funds’ investments as of December 31, 2011:
| | | | | | | | |
| | | Level 1 –
Quoted Prices | | | Level 2 –
Other Significant
Observable Inputs | |
Investments in Securities: (Assets) | | | | | | | | |
Small Cap Fund | | | | | | | | |
Common Stocks* | | $ | 671,144,995 | | | $ | - | |
Registered Investment Company | | | 48,719,835 | | | | - | |
| | | | | | | | |
Total | | | 719,864,830 | | | | - | |
Small-Mid Cap Fund | | | | | | | | |
Common Stocks* | | | 66,867,093 | | | | - | |
Registered Investment Company | | | 2,091,375 | | | | - | |
| | | | | | | | |
Total | | | 68,958,468 | | | | - | |
Large Cap Fund | | | | | | | | |
Common Stocks* | | | 1,285,176,112 | | | | - | |
Registered Investment Company | | | 17,791,000 | | | | - | |
| | | | | | | | |
Total | | | 1,302,967,112 | | | | - | |
Select Fund | | | | | | | | |
Common Stocks* | | | 44,663,926 | | | | - | |
Registered Investment Company | | | 2,071,644 | | | | - | |
| | | | | | | | |
Total | | | 46,735,570 | | | | - | |
Long-Short Fund | | | | | | | | |
Common Stocks* | | | 1,646,389,608 | | | | - | |
Registered Investment Company | | | 8,718,022 | | | | - | |
| | | | | | | | |
Total | | | 1,655,107,630 | | | | - | |
Financial Long-Short Fund | | | | | | | | |
Preferred Stocks* | | | 218,958 | | | | - | |
Common Stocks* | | | 8,107,717 | | | | - | |
Corporate Bond* | | | - | | | | 100,275 | |
Registered Investment Company | | | 235,175 | | | | - | |
| | | | | | | | |
Total | | | 8,561,850 | | | | 100,275 | |
Strategic Income Fund | | | | | | | | |
Collateralized Debt Obligations | | | - | | | | 880,876 | |
Preferred Stocks* | | | 1,129,335 | | | | 32,561 | |
Corporate Bonds* | | | - | | | | 132,112,941 | |
Registered Investment Company | | | 15,132,697 | | | | - | |
| | | | | | | | |
Total | | | 16,262,032 | | | | 133,026,378 | |
|
Investments in Securities Sold Short: (Liabilities) | |
Long-Short Fund | | | | | | | | |
Common Stocks* | | | (290,491,989 | ) | | | - | |
Exchange Traded Fund | | | (19,631,016 | ) | | | - | |
| | | | | | | | |
Total | | | (310,123,005 | ) | | | - | |
Financial Long-Short Fund | | | | | | | | |
Common Stocks* | | | (739,272 | ) | | | - | |
| * | See Schedule of Investments and Schedule of Investments Sold Short for industry classification. |
There were no significant transfers in and out of Levels 1, 2, or 3 during the year ended December 31, 2011 and the Funds held no Level 3 securities at December 31, 2011.
| | |
| Diamond Hill Funds Annual Report December 31, 2011 | | Page 45 |
Diamond Hill Funds
Notes to Financial Statements (Continued)
December 31, 2011
New accounting pronouncement — In May 2011, the Financial Accounting Standards Board issued Accounting Standard Update No. 2011-04, Fair Value Measurement (Topic 820) — Amendments to Achieve Common Fair Value Measurement and Disclosure Requirements in U.S. GAAP and International Financial Reporting Standards (“IFRS”). The update changes the wording used to describe the requirements in GAAP for measuring fair value and for disclosing information about fair value measurements. The update is effective during interim and annual periods beginning after December 15, 2011. Management is currently evaluating the impact of the update’s adoption on the Funds’ financial statement disclosures.
Short sales — The Long-Short Fund, Financial Long-Short Fund and Strategic Income Fund are permitted to make short sales of securities. Short sales are effective when it is believed that the price of a particular security will decline, and involves the sale of a security which the Fund does not own in hope of purchasing the same security at a later date at a lower price. To make delivery to the buyer, a Fund must borrow the security, and the Fund is obligated to return the security to the lender, which is accomplished by a later purchase of the security by the Fund. Cash received from short sales is maintained by brokers and is used to meet margin requirements for short calls. It is included as “Deposits with brokers for securities sold short” on the Statements of Assets & Liabilities.
A Fund will incur a loss as a result of a short sale if the price of the security increases between the date of the short sale and the date on which the Fund purchases the security to replace the borrowed security. The use of short sales may cause a Fund to have higher expenses (especially dividend expenses) than those of other equity mutual funds. Short sales are speculative transactions and involve special risks, including greater reliance on the ability of Diamond Hill Capital Management, Inc. to accurately anticipate the future value of a security.
Securities lending — Under the terms of the securities lending agreement with Citibank, N.A. (“Citibank”), Citibank is authorized to loan securities on behalf of the Funds to approved borrowers. In exchange, the Funds receive cash collateral in the amount of at least 100% of the value of the securities loaned. The cash collateral is invested in short-term instruments as noted in each Fund’s Schedule of Investments. Although risk is mitigated by the collateral, the Funds could experience a delay in recovering their securities and possible loss of income or value if the borrower fails to return them. The agreement indemnifies the Funds from losses incurred in the event of a borrower’s material default of the terms and conditions of the borrower agreement. The agreement provides that after predetermined rebates to brokers, the Funds pay Citibank 15% of the net securities lending income plus any costs and other charges incurred by each Fund with Citibank to be paid as credits. The securities lending income is first used to offset custody and accounting fees for each Fund and any remaining amount is paid to each Fund as securities lending income. Prior to August 22, 2011, the Funds had a securities lending agreement with JPMorgan Chase Bank N.A. (“JPMorgan”) with similar terms as listed above except the Funds paid JPMorgan 20% of the net securities lending income plus any costs and other charges incurred by each Fund.
As of December 31, 2011, the value of securities loaned and the collateral held were as follows:
| | | | | | | | |
| | | Fair Value of
Securities Loaned | | | Fair Value of
Collateral Received | |
Small Cap Fund | | $ | 47,083,414 | | | $ | 48,719,835 | |
Small-Mid Cap Fund | | | 1,985,296 | | | | 2,091,375 | |
Large Cap Fund | | | 17,350,743 | | | | 17,791,000 | |
Select Fund | | | 1,974,768 | | | | 2,071,644 | |
Long-Short Fund | | | 8,440,103 | | | | 8,718,022 | |
Financial Long-Short Fund | | | 216,361 | | | | 235,175 | |
Strategic Income Fund | | | 14,429,204 | | | | 15,132,697 | |
Security transactions — Throughout the reporting period, investment transactions are recorded no later than the first business day following trade date. For financial reporting purposes, investments are reported on trade date on the last business day of the reporting period. The specific identification method is used for determining realized gains or losses for financial statements and income tax purposes. Dividend income is recognized on the ex-dividend date and interest income is recognized on an accrual basis. Discounts and premiums on securities purchased are amortized using the daily effective yield method. The Funds record distributions received from investments in Real Estate Investment Trusts (REITS) in excess of income from underlying investments as a reduction of cost of investments and/or realized gain. Such amounts are based on estimates if actual amounts are not available and actual amounts of income, realized gain and return of capital may differ from the estimated amounts. The Funds adjust the estimated amounts once the issuers provide information about the actual composition of the distributions.
| | |
| Page 46 | | Diamond Hill Funds Annual Report December 31, 2011 |
Diamond Hill Funds
Notes to Financial Statements (Continued)
December 31, 2011
Share valuation — The net asset value per share of each class of shares of each Fund is calculated daily by dividing the total value of a Fund’s assets attributable to that class, less liabilities attributable to that class, by the number of shares of that class outstanding.
Federal income taxes — Each Fund’s policy is to continue to comply with the requirements of the Internal Revenue Code that are applicable to regulated investment companies and to distribute substantially all of its taxable net investment income and any net realized capital gains to its shareholders. The Funds have analyzed their tax positions taken on Federal income tax returns for all open tax years (tax years ended December 31, 2008 through 2011) and have concluded that no provision for income tax is required in their financial statements.
Distributions to shareholders — Dividends from net investment income are declared and paid monthly for the Strategic Income Fund. Dividends from net investment income are declared and paid on an annual basis for the Small Cap Fund, Small-Mid Cap Fund, Large Cap Fund, Select Fund, Long-Short Fund, and Financial Long-Short Fund. Dividends are declared separately for each class. No class has preferential dividend rights; differences in per share rates are due to differences in separate class expenses. Net realized capital gains, if any, are distributed at least annually. Distributions from net investment income and from net capital gains are determined in accordance with U.S. income tax regulations, which may differ from GAAP. These differences are primarily due to differing treatments for paydown gains and losses on mortgage-backed securities, expiring capital loss carry-forwards and deferrals of certain losses. Permanent book and tax basis differences are reclassified among the components of net assets. Certain Funds may utilize earnings and profits distributed to shareholders on redemption of shares as part of the dividends paid deduction for income tax purposes.
Allocations — Investment income earned, realized capital gains and losses, and unrealized appreciation and depreciation for the Funds are allocated daily to each class of shares based upon its proportionate share of total net assets of the Fund. Class specific expenses are charged directly to the class incurring the expense. Common expenses, which are not attributable to a specific class, are allocated daily to each class of shares based upon its proportionate share of total net assets of the Fund. Expenses not directly billed to a Fund are allocated proportionally among all Funds daily in relation to net assets of each Fund or another reasonable measure.
Investment Transactions
For the year ended December 31, 2011, the purchases and sales (including maturities) of investment securities (excluding short-term securities and U.S. government obligations) were as follows:
| | | | | | | | |
| | | Purchases | | | Sales | |
Small Cap Fund | | $ | 224,005,706 | | | $ | 193,760,949 | |
Small-Mid Cap Fund | | | 45,624,162 | | | | 33,613,313 | |
Large Cap Fund | | | 392,773,592 | | | | 190,281,912 | |
Select Fund | | | 15,891,935 | | | | 11,291,561 | |
Long-Short Fund | | | 875,380,660 | | | | 824,517,146 | |
Financial Long-Short Fund | | | 5,239,732 | | | | 5,618,470 | |
Strategic Income Fund | | | 49,483,504 | | | | 49,354,135 | |
The Funds pay commissions on the purchase and sale of investment securities. The commissions are treated as transaction costs and, therefore, are included as part of the cost of purchases or net proceeds on the sale of investment securities and are not included in the presentation of Fund expenses on the Statements of Operations. No portion of the commissions paid during the year was used to purchase so-called “soft dollar” services as defined in Section 28(e) of the Securities Exchange Act of 1934.The Funds paid the following commissions during the year ended December 31, 2011:
| | | | | | | | | | | | |
| | | Total Commissions | | | Total Commissions
Used to Pay for
Soft Dollar Services | | | Commissions as a %
of Average net Assets | |
Small Cap Fund | | $ | 407,237 | | | $ | - | | | | 0.05 | % |
Small-Mid Cap Fund | | | 88,836 | | | | - | | | | 0.13 | % |
Large Cap Fund | | | 349,311 | | | | - | | | | 0.03 | % |
Select Fund | | | 17,475 | | | | - | | | | 0.04 | % |
Long-Short Fund | | | 1,242,860 | | | | - | | | | 0.07 | % |
Financial Long-Short Fund | | | 12,223 | | | | - | | | | 0.14 | % |
Strategic Income Fund | | | - | | | | - | | | | 0.00 | % |
| | |
| Diamond Hill Funds Annual Report December 31, 2011 | | Page 47 |
Diamond Hill Funds
Notes to Financial Statements (Continued)
December 31, 2011
Investment Advisory Fees and Other Transactions with Affiliates
The Small Cap Fund, Small-Mid Cap Fund, Large Cap Fund, Select Fund, Long-Short Fund, Financial Long-Short Fund and Strategic Income Fund each receive investment management and advisory services from Diamond Hill Capital Management, Inc. (“DHCM”) under management agreements that provide for fees to be paid at an annual rate of 0.80%, 0.75%, 0.55%, 0.70%, 0.90%, 1.00% and 0.50% of the Fund’s average daily net assets, respectively. The advisory service fee for the Large Cap Fund was reduced from 0.60% to 0.55% on October 1, 2011. The advisory agreements are subject to annual approval by the Board of Trustees. In addition, each Fund has entered into an administrative services agreement whereby DHCM (“Administrator”) is paid a fee at an annual rate of 0.26% for Class A and Class C Shares and 0.24% for Class I shares of each class’ average daily net assets. Prior to March 1, 2011, the fees paid by Class A, Class C and Class I shares were paid at an annual rate of 0.30%, 0.30% and 0.19% of each class’ average daily net assets, respectively. These administrative fees are used to pay most of the Funds’ operating expenses except advisory, distribution, fund accounting, custody, brokerage, taxes, interest and dividend expense on securities sold short and extraordinary expenses.
Pursuant to rule 12b-1 of the 1940 Act, each Fund has adopted a distribution plan (together, the “Plans”). Under the Plans, Class A shares pay a distribution fee at an annual rate of 0.25% of Class A average daily net assets. Class C shares pay a distribution and shareholder-servicing fee at an annual rate of 0.75% and 0.25%, respectively, of Class C average daily net assets. Class I shares are not subject to any distribution or shareholder-servicing fees. The Trust entered into a Distribution Agreement on behalf of the Funds with BHIL Distributors, Inc. (“Distributor”), an affiliate of DHCM. Pursuant to the Distribution Agreement, the Distributor acts as principal underwriter of each Fund’s shares.
For the year ended December 31, 2011, the Distributor received the following amounts in sales commissions from the sales of Class A shares of the Funds as follows:
| | | | |
Small Cap Fund | | $ | 137,869 | |
Small-Mid Cap Fund | | | 23,404 | |
Large Cap Fund | | | 97,434 | |
Select Fund | | | 17,994 | |
Long-Short Fund | | | 170,244 | |
Financial Long-Short Fund | | | 26,083 | |
Strategic Income Fund | | | 36,780 | |
DHCM, as the financing agent for Class C shares, received contingent deferred sales charges relating to the redemptions of Class C shares of the Funds for the year ended December 31, 2011 as follows:
| | | | |
Small Cap Fund | | $ | 1,318 | |
Small-Mid Cap Fund | | | 329 | |
Large Cap Fund | | | 2,538 | |
Select Fund | | | 38 | |
Long-Short Fund | | | 6,686 | |
Financial Long-Short Fund | | | 420 | |
Strategic Income Fund | | | 1,027 | |
Certain officers of the Trust are affiliated with DHCM or the Distributor. Such officers receive no compensation from the Funds for serving in their respective roles.
Trustee Fees
The Independent Trustees are compensated for their services to the Funds by DHCM as part of the administration services agreement. The Independent Trustees were paid $161,500 in fees during the year ended December 31, 2011.
Commitments and Contingencies
The Funds indemnify the Trust’s officers and Trustees for certain liabilities that might arise from their performance of their duties to the Funds. Additionally, in the normal course of business, the Funds enter into contracts that contain a variety of representations and warranties and which provide general indemnifications. The Funds’ maximum exposure under these arrangements is unknown, as this would involve future claims that may be made against the Funds that have not yet occurred. However, based on experience, the Funds expect the risk of loss to be remote.
| | |
| Page 48 | | Diamond Hill Funds Annual Report December 31, 2011 |
Diamond Hill Funds
Notes to Financial Statements (Continued)
December 31, 2011
Federal Tax Information
The amount and character of income and capital gain distributions paid by the Funds are determined in accordance with Federal income tax regulations which may differ from GAAP. The tax character of distributions paid may differ from the character of distributions shown on the Statements of Changes in Net Assets, as items such as short-term capital gains are treated as ordinary income for tax purposes.
The tax character of distributions paid during 2011 and 2010 was as follows:
| | | | | | | | | | | | | | | | | | | | | | | | | | | | | | | | |
| | | Small Cap Fund | | | Small-Mid Cap Fund | | | Large Cap Fund | | | Select Fund | |
| | | 2011 | | | 2010 | | | 2011 | | | 2010 | | | 2011 | | | 2010 | | | 2011 | | | 2010 | |
Distributions paid from: | | | | | | | | | | | | | | | | | | | | | | | | | | | | | | | | |
Ordinary income | | $ | 1,610,834 | | | $ | — | | | $ | 40,001 | | | $ | 47,033 | | | $ | 15,630,464 | | | $ | 9,714,140 | | | $ | 305,600 | | | $ | 160,824 | |
Long-term capital gains | | | 27,669,675 | | | | 12,949,544 | | | | 1,859,946 | | | | 20,259 | | | | - | | | | - | | | | - | | | | - | |
| | | | | | | | | | | | | | | | | | | | | | | | | | | | | | | | |
Total distributions | | $ | 29,280,509 | | | $ | 12,949,544 | | | $ | 1,899,947 | | | $ | 67,292 | | | $ | 15,630,464 | | | $ | 9,714,140 | | | $ | 305,600 | | | $ | 160,824 | |
| | | | | | | | | | | | | | | | | | | | | | | | | | | | | | | | |
| | | | | |
| | | Long-Short Fund | | | Financial Long-Short Fund | | | Strategic Income Fund | | | | | | | |
Distributions paid from: | | | | | | | | | | | | | | | | | | | | | | | | | | | | | | | | |
Ordinary income | | $ | 2,198,228 | | | $ | 334,787 | | | $ | 34,749 | | | $ | 3,500 | | | $ | 8,535,229 | | | $ | 8,282,495 | | | | | | | | | |
| | | | | | | | | | | | | | | | | | | | | | | | | | | | | | | | |
Total distributions | | $ | 2,198,228 | | | $ | 334,787 | | | $ | 34,749 | | | $ | 3,500 | | | $ | 8,535,229 | | | $ | 8,282,495 | | | | | | | | | |
| | | | | | | | | | | | | | | | | | | | | | | | | | | | | | | | |
The following information is computed on a tax basis for each item as of December 31, 2011:
| | | | | | | | | | | | | | | | |
| | | Small Cap
Fund | | | Small-Mid
Cap Fund | | | Large Cap
Fund | | | Select Fund | |
Tax cost of portfolio investments | | $ | 667,737,465 | | | $ | 63,363,940 | | | $ | 1,153,668,469 | | | $ | 43,216,606 | |
| | | | | | | | | | | | | | | | |
Gross unrealized appreciation | | | 113,481,471 | | | | 9,355,819 | | | | 160,441,714 | | | | 5,929,057 | |
Gross unrealized depreciation | | | (61,354,106 | ) | | | (3,761,291 | ) | | | (11,143,071 | ) | | | (2,410,093 | ) |
| | | | | | | | | | | | | | | | |
Net unrealized appreciation | | | 52,127,365 | | | | 5,594,528 | | | | 149,298,643 | | | | 3,518,964 | |
Undistributed ordinary income | | | 469,137 | | | | 47,075 | | | | 3,375,715 | | | | 472,840 | |
Undistributed capital gains | | | 1,039,939 | | | | - | | | | - | | | | - | |
Capital loss carryforwards | | | - | | | | - | | | | (61,958,289 | ) | | | (488,344 | ) |
Qualified Late Year Capital Losses deferred | | | - | | | | (86,614 | ) | | | - | | | | (104,398 | ) |
| | | | | | | | | | | | | | | | |
Accumulated earnings | | $ | 53,636,441 | | | $ | 5,554,989 | | | $ | 90,716,069 | | | $ | 3,399,062 | |
| | | | | | | | | | | | | | | | |
| | | | |
| | | Long-Short
Fund | | | Financial
Long-Short
Fund | | | Strategic
Income Fund | | | | |
Tax cost of portfolio investments | | $ | 1,099,563,910 | | | $ | 8,241,992 | | | $ | 147,442,171 | | | | | |
| | | | | | | | | | | | | | | | |
Gross unrealized appreciation | | | 337,841,589 | | | | 1,034,823 | | | | 5,927,941 | | | | | |
Gross unrealized depreciation | | | (92,420,874 | ) | | | (1,353,962 | ) | | | (4,081,702 | ) | | | | |
| | | | | | | | | | | | | | | | |
Net unrealized appreciation (depreciation) | | | 245,420,715 | | | | (319,139 | ) | | | 1,846,239 | | | | | |
Undistributed ordinary income | | | 6,308,984 | | | | - | | | | 189,865 | | | | | |
Capital loss carryforwards | | | (608,395,679 | ) | | | (13,835,471 | ) | | | (17,486,599 | ) | | | | |
Qualified Late Year Capital Losses deferred | | | - | | | | (100,593 | ) | | | - | | | | | |
| | | | | | | | | | | | | | | | |
Accumulated deficit | | $ | (356,665,980 | ) | | $ | (14,255,203 | ) | | $ | (15,450,495 | ) | | | | |
| | | | | | | | | | | | | | | | |
The difference between book basis and tax basis net unrealized appreciation (depreciation) is attributable primarily to the tax deferral of losses on wash sales.
As of the end of tax year ended December 31, 2011, the following Funds have capital loss carry forwards (“CLCFs”) as summarized in the table below. Under the provisions of the Regulated Investment Company Modernization Act of 2010,
| | |
| Diamond Hill Funds Annual Report December 31, 2011 | | Page 49 |
Diamond Hill Funds
Notes to Financial Statements (Continued)
December 31, 2011
CLCFs that originated in a tax year that began before December 23, 2010 (pre-effective CLCFs) may be carried forward, subject to certain limitations, and applied to offset future capital gains, and thus reduce the amount of distributable capital gains, for up to eight succeeding tax years, after which any unutilized CLCFs expire. Pre-effective CLCFs are applied as short-term capital loss regardless of whether the originating capital loss was short term or long term. CLCFs that originate in tax years beginning after December 22, 2010 (post-effective CLCFs), are applied consistent with the character in which they originated as a new loss on the first day of the immediately succeeding tax year, and thus take precedent over the application of pre-effective CLCFs. Post-effective CLCFs can be carried forward indefinitely.
Pre-effective CLCFs subject to expiration:
| | | | | | |
| | | Amount | | | Expires
December 31, |
Large Cap Fund | | $ | 20,679,102 | | | 2016 |
| | | 41,279,187 | | | 2017 |
| | | | | | |
| | $ | 61,958,289 | | | |
| | | | | | |
Select Fund | | $ | 488,344 | | | 2017 |
| | | | | | |
Long-Short Fund | | $ | 101,454,175 | | | 2016 |
| | | 417,551,311 | | | 2017 |
| | | 69,177,097 | | | 2018 |
| | | | | | |
| | $ | 588,182,583 | | | |
| | | | | | |
Financial Long-Short Fund | | $ | 7,295,343 | | | 2016 |
| | | 6,540,128 | | | 2017 |
| | | | | | |
| | $ | 13,835,471 | | | |
| | | | | | |
Strategic income Fund | | $ | 12,138,231 | | | 2016 |
| | | 5,271,854 | | | 2017 |
| | | | | | |
| | $ | 17,410,085 | | | |
| | | | | | |
Post-effective CLCFs not subject to expiration:
| | | | | | | | | | | | |
| | | Short-Term
Amount | | | Long-Term
Amount | | | Total | |
Long-Short Fund | | $ | 20,213,096 | | | $ | - | | | $ | 20,213,096 | |
Strategic Income Fund | | | - | | | | 76,514 | | | | 76,514 | |
The Large Cap Fund, Select Fund and Financial Long Short Fund utilized $13,197,470, $905,868 and $498,301, respectively, of CLCFs in the current fiscal year.
The Funds also elected to defer until their subsequent tax year capital losses incurred after October 31, 2011. The CLCFs and “Qualified Late Year Capital Losses” losses may be utilized in future years to offset net realized capital gains, if any, prior to distributing such gains to shareholders.
Reclassification of capital accounts — Reclassifications result primarily from the difference in the tax treatment of net investment losses, distributions in excess of net investment income, investments in REITS and contributed securities. The following reclassifications have no impact on the net assets or net asset value per share of the Funds and are designed to present the Funds’ capital accounts on a tax basis:
| | | | | | | | | | | | |
| | | Paid-In
Capital | | | Undistributed
Net Investment
Income (Loss) | | | Accumulated
Net Realized
Gains (Losses) | |
Small Cap Fund | | $ | 6,534,585 | | | $ | 2,410,474 | | | $ | (8,945,059 | ) |
Small-Mid Cap Fund | | | 804,647 | | | | (1 | ) | | | (804,646 | ) |
Financial Long-Short Fund | | | (17,696 | ) | | | 17,655 | | | | 41 | |
| | |
| Page 50 | | Diamond Hill Funds Annual Report December 31, 2011 |
Diamond Hill Funds
Notes to Financial Statements (Continued)
December 31, 2011
Subsequent Events
The Funds evaluated events from December 31, 2011 through the date that these financial statements were issued. There were no subsequent events to report that would have a material impact on the Funds’ financial statements, other than disclosed below.
On January 3, 2012, the Class Y shares of the Small Cap Fund, Small-Mid Cap Fund, Large Cap Fund, Select Fund, Long-Short Fund and Strategic Income Fund commenced public offering and investment operations.
On January 3, 2012, the Diamond Hill Research Opportunities Fund commenced public offering and investment operations. The Fund’s investment objective is to provide long-term capital growth by investing in companies selling for less than and shorting companies selling for more than Diamond Hill Capital Management’s appraisal of intrinsic value. The Diamond Hill Research Opportunities Fund is co-managed by 14 Diamond Hill Research Analysts, each of whom is responsible for a sleeve of securities within one of five sector teams.
| | |
| Diamond Hill Funds Annual Report December 31, 2011 | | Page 51 |
Report of Independent Registered Public Accounting Firm
The Board of Trustees and Shareholders
of the Diamond Hill Funds:
We have audited the accompanying statements of assets and liabilities of the Diamond Hill Funds (comprised of the Diamond Hill Small Cap Fund, Diamond Hill Small-Mid Cap Fund, Diamond Hill Large Cap Fund, Diamond Hill Select Fund, Diamond Hill Long-Short Fund, Diamond Hill Financial Long-Short Fund, and Diamond Hill Strategic Income Fund) (collectively, the “Funds”), including the schedules of investments, as of December 31, 2011, and the related statements of operations for the year then ended, the statements of changes in net assets for each of the two years in the period then ended, and the financial highlights for each of the five years in the period then ended. These financial statements and financial highlights are the responsibility of the Funds’ management. Our responsibility is to express an opinion on these financial statements and financial highlights based on our audits.
We conducted our audits in accordance with the standards of the Public Company Accounting Oversight Board (United States). Those standards require that we plan and perform the audit to obtain reasonable assurance about whether the financial statements and financial highlights are free of material misstatement. We were not engaged to perform an audit of the Funds’ internal control over financial reporting. Our audits included consideration of internal control over financial reporting as a basis for designing audit procedures that are appropriate in the circumstances, but not for the purpose of expressing an opinion on the effectiveness of the Funds’ internal control over financial reporting. Accordingly, we express no such opinion. An audit also includes examining, on a test basis, evidence supporting the amounts and disclosures in the financial statements and financial highlights, assessing the accounting principles used and significant estimates made by management, and evaluating the overall financial statement presentation. Our procedures included confirmation of securities owned as of December 31, 2011, by correspondence with the custodian and brokers or by other auditing procedures where replies from brokers were not received. We believe that our audits provide a reasonable basis for our opinion.
In our opinion, the financial statements and financial highlights referred to above present fairly, in all material respects, the financial position of the Diamond Hill Funds at December 31, 2011, the results of their operations for the year then ended, the changes in their net assets for each of the two years in the period then ended, and the financial highlights for each of the five years in the period then ended, in conformity with U.S. generally accepted accounting principles.

Cincinnati, Ohio
February 27, 2012
| | |
| Page 52 | | Diamond Hill Funds Annual Report December 31, 2011 |
Diamond Hill Funds
Other Items
December 31, 2011
(Unaudited)
Proxy Voting
The investment adviser is responsible for exercising the voting rights associated with the securities purchased and held by the Funds. A description of the policies and procedures that the advisor uses in fulfilling this responsibility and information regarding how those proxies were voted during the twelve month period ended June 30 are available without charge upon request by calling toll free 1-888-226-5595 or on the Securities and Exchange Commission’s website at http://www.sec.gov.
Portfolio Disclosure
The Trust files a complete listing of portfolio holdings as of the end of the first and third quarters of each fiscal year on Form N-Q and each second and fourth quarters of each fiscal year on Form N-CSR. The complete listing (i) is available on the Commission’s website; (ii) may be reviewed and copied at the Commission’s Public Reference Room in Washington, DC; and (iii) will be made available to shareholders upon request by calling 1-888-226-5595. Information on the operation of the Public Reference Room may be obtained by calling 1-800-SEC-0330. Monthly portfolio holdings are also available on www.diamond-hill.com.
Dividends Received Deduction
For corporate shareholders, the following ordinary dividends paid during the year ended December 31, 2011 qualify for the corporate dividends received deduction:
| | | | |
Small Cap Fund | | | 100.00% | |
Small-Mid Cap Fund | | | 100.00% | |
Large Cap Fund | | | 100.00% | |
Select Fund | | | 100.00% | |
Long-Short Fund | | | 100.00% | |
Financial Long-Short Fund | | | 100.00% | |
Strategic Income Fund | | | 0.67% | |
Qualified Dividend Income
The Funds designated the maximum amount allowable of their net taxable income as qualified dividend income as provided in the Jobs and Growth Tax Relief Reconciliation Act of 2003. This amount was reflected on form 1099-div for the calendar year 2011.
Capital Gain Distribution
For the year ended December 31, 2011, the following Funds designated long-term capital gain distributions:
| | | | |
Small Cap Fund | | | $34,204,260 | |
Small-Mid Cap Fund | | | 2,664,591 | |
| | |
| Diamond Hill Funds Annual Report December 31, 2011 | | Page 53 |
Diamond Hill Funds
Schedule of Shareholder Expenses
Hypothetical Example of a $1,000 Investments at Beginning of Period
(Unaudited)
As a Fund shareholder, you may incur two types of costs: (1) transaction costs, including wire redemption fees and sales charges (loads) as applicable; and (2) ongoing costs, including management fees; distribution and service (12b-1) fees; and other Fund expenses. These examples are intended to help you understand your ongoing costs (in dollars) of investing in a Fund and to compare these costs with the ongoing costs of investing in other mutual funds. Please note that the expenses shown in the tables are meant to highlight your ongoing costs only and do not reflect any transactional costs or other fees that may be apply, such as fees for low balance accounts. Therefore, the examples are useful in comparing ongoing costs only and will not help you determine the relative total cost of owning different funds. In addition, if these transactional costs and other fees were included, your costs would have been higher.
These examples are based on an investment of $1,000 invested at July 1, 2011 and held for the entire period from July 1, 2011 through December 31, 2011.
The Actual Expense example below provides information about actual account values and actual expenses. You may use this information, together with the amount you invested, to estimate the expenses that you paid over the period. Simply divide your account value by $1,000 (for example, an $8,600 account value divided by $1,000 = 8.6), then multiply the result by the number in the table under the heading entitled “Expenses paid during the period” to estimate the expenses you paid on your account during this period.
The Hypothetical Expense example below provides information about hypothetical account values and hypothetical expenses based on each Fund’s actual expense ratio and an assumed rate of return of 5% per year before expenses, which is not each Fund’s actual return. The hypothetical account values and expenses may not be used to estimate the actual ending account balance or expenses you paid for the period. You may use this information to compare the ongoing costs of investing in this Fund and other funds. To do so, compare this 5% hypothetical example with the 5% hypothetical examples that appear in the shareholder reports of the other funds.
| | | | | | | | | | | | | | | | | | | | | | | | | | | | |
| | | Account value
at the beginning
of the period ($) | | | Account value
at the end
of the period ($) | | | Expenses paid
during
the period ($)* | | | Funds
annualized
expense
ratio (%) | |
| | | Actual | | | Hypothetical | | | Actual | | | Hypothetical | | | Actual | | | Hypothetical | | | Actual | |
Small Cap Fund | | | | | | | | | | | | | | | | | | | | | | | | | | | | |
Class A | | | 1,000.00 | | | | 1,000.00 | | | | 894.00 | | | | 1,018.55 | | | | 6.30 | | | | 6.72 | | | | 1.32 | |
Class C | | | 1,000.00 | | | | 1,000.00 | | | | 890.70 | | | | 1,014.77 | | | | 9.86 | | | | 10.51 | | | | 2.07 | |
Class I | | | 1,000.00 | | | | 1,000.00 | | | | 894.80 | | | | 1,019.91 | | | | 5.01 | | | | 5.35 | | | | 1.05 | |
Small-Mid Cap Fund | | | | | | | | | | | | | | | | | | | | | | | | | | | | |
Class A | | | 1,000.00 | | | | 1,000.00 | | | | 906.90 | | | | 1,018.80 | | | | 6.10 | | | | 6.46 | | | | 1.27 | |
Class C | | | 1,000.00 | | | | 1,000.00 | | | | 903.70 | | | | 1,015.02 | | | | 9.69 | | | | 10.26 | | | | 2.02 | |
Class I | | | 1,000.00 | | | | 1,000.00 | | | | 908.10 | | | | 1,020.16 | | | | 4.81 | | | | 5.09 | | | | 1.00 | |
Large Cap Fund | | | | | | | | | | | | | | | | | | | | | | | | | | | | |
Class A | | | 1,000.00 | | | | 1,000.00 | | | | 966.60 | | | | 1,019.66 | | | | 5.45 | | | | 5.60 | | | | 1.10 | |
Class C | | | 1,000.00 | | | | 1,000.00 | | | | 962.90 | | | | 1,015.88 | | | | 9.15 | | | | 9.40 | | | | 1.85 | |
Class I | | | 1,000.00 | | | | 1,000.00 | | | | 967.90 | | | | 1,021.02 | | | | 4.12 | | | | 4.23 | | | | 0.83 | |
Select Fund | | | | | | | | | | | | | | | | | | | | | | | | | | | | |
Class A | | | 1,000.00 | | | | 1,000.00 | | | | 926.50 | | | | 1,019.06 | | | | 5.92 | | | | 6.21 | | | | 1.22 | |
Class C | | | 1,000.00 | | | | 1,000.00 | | | | 922.40 | | | | 1,015.27 | | | | 9.55 | | | | 10.01 | | | | 1.97 | |
Class I | | | 1,000.00 | | | | 1,000.00 | | | | 928.20 | | | | 1,020.42 | | | | 4.62 | | | | 4.84 | | | | 0.95 | |
Long-Short Fund | | | | | | | | | | | | | | | | | | | | | | | | | | | | |
Class A | | | 1,000.00 | | | | 1,000.00 | | | | 995.80 | | | | 1,016.94 | | | | 8.25 | | | | 8.34 | | | | 1.64 | |
Class C | | | 1,000.00 | | | | 1,000.00 | | | | 991.80 | | | | 1,013.16 | | | | 12.00 | | | | 12.13 | | | | 2.39 | |
Class I | | | 1,000.00 | | | | 1,000.00 | | | | 996.50 | | | | 1,018.30 | | | | 6.89 | | | | 6.97 | | | | 1.37 | |
| | |
| Page 54 | | Diamond Hill Funds Annual Report December 31, 2011 |
Diamond Hill Funds
Schedule of Shareholder Expenses
Hypothetical Example of a $1,000 Investments at Beginning of Period
(Unaudited) Continued
| | | | | | | | | | | | | | | | | | | | | | | | | | | | |
| | | Account value
at the beginning
of the period ($) | | | Account value
at the end
of the period ($) | | | Expenses paid
during
the period ($)* | | | Funds
annualized
expense
ratio (%) | |
| | | Actual | | | Hypothetical | | | Actual | | | Hypothetical | | | Actual | | | Hypothetical | | | Actual | |
Financial Long-Short Fund | | | | | | | | | | | | | | | | | | | | | | | | | | | | |
Class A | | | 1,000.00 | | | | 1,000.00 | | | | 874.70 | | | | 1,017.09 | | | | 7.61 | | | | 8.19 | | | | 1.61 | |
Class C | | | 1,000.00 | | | | 1,000.00 | | | | 872.20 | | | | 1,013.31 | | | | 11.14 | | | | 11.98 | | | | 2.36 | |
Class I | | | 1,000.00 | | | | 1,000.00 | | | | 875.90 | | | | 1,018.45 | | | | 6.34 | | | | 6.82 | | | | 1.34 | |
Strategic Income Fund | | | | | | | | | | | | | | | | | | | | | | | | | | | | |
Class A | | | 1,000.00 | | | | 1,000.00 | | | | 1,009.80 | | | | 1,020.11 | | | | 5.12 | | | | 5.14 | | | | 1.01 | |
Class C | | | 1,000.00 | | | | 1,000.00 | | | | 1,006.20 | | | | 1,016.33 | | | | 8.90 | | | | 8.94 | | | | 1.76 | |
Class I | | | 1,000.00 | | | | 1,000.00 | | | | 1,012.10 | | | | 1,021.48 | | | | 3.75 | | | | 3.77 | | | | 0.74 | |
| * | Expenses are equal to the Fund’s annualized expense ratio, multiplied by the average account value over the period, multiplied by the number of days in the most recent fiscal half-year divided by the number of days in the fiscal year (to reflect the one-half year period). |
You can find more information about the Fund’s expenses, including annual expense ratios for historical periods in the Financial Statements section of this report. For additional information on operating expenses and other shareholder costs, please refer to the Fund’s prospectus. The prospectus presents hypothetical shareholder costs over various time periods based upon a $10,000 investment and a return of 5% a year. The standardized example, which appears in all mutual fund prospectuses, may be useful to you in comparing the costs of investing in different funds.
| | |
| Diamond Hill Funds Annual Report December 31, 2011 | | Page 55 |
Diamond Hill Funds
Management of the Trust (unaudited)
Listed in the charts below is basic information regarding the Trustees and officers of the Trust.
INDEPENDENT TRUSTEES:
| | | | | | | | | | |
| | | | | | |
Name/ Address/1 Age | | Position(s)
Held with Trust | | Term of Office2 and
Length of Time Served | | Principal Occupation(s) At Least The Last 5 Years | | Number of
Portfolios in
Fund Complex
Overseen by
Trustee | | Other
Directorships
Held by
Trustee |
| | | | | |
| Thomas E. Line Year of Birth: 1967 | | Chairman
Trustee | | Since November 2005 | | Chief Operating Officer, Lancaster Pollard & Company from January 2012 to present; Senior Managing Director and Chief Financial Officer, Red Capital Group, October 2005 to December 2011. | | 7 | | N/A |
| | | | | |
| Elizabeth P. Kessler Year of Birth: 1968 | | Trustee | | Since November 2005 | | Partner in Charge, Columbus Ohio Office, Jones Day from January 2009 to present; Partner, Jones Day from January 2003 to January 2009. | | 7 | | N/A |
| | | | | |
| D’Ray Moore Rice Year of Birth: 1959 | | Trustee | | Since August 2007 | | Retired, Community Volunteer. Trustee of American Performance Funds from October 2003 to October 2007. | | 7 | | Independent
Trustee of
Advisors
Investment
Trust from
July 2011 to
present |
| | | | | |
| George A. Skestos Year of Birth: 1968 | | Trustee | | Since August 2000 | | Managing Member, Arcadia Holdings, LLC (private investment banking firm), May 2001 to the present; President of Homewood Corporation (real estate development firm), September 1999 to May 2001. | | 7 | | N/A |
PRINCIPAL OFFICERS:
| | | | | | |
| | | | |
Name/ Address/1 Age | | Position(s)
Held with Trust | | Term of Office and
Length of Time Served | | Principal Occupation(s) At Least the Last 5 Years |
| | | |
| James F. Laird, Jr. Year of Birth: 1957 | | President | | Since December 2001 | | Chief Financial Officer of Diamond Hill Investment Group, Inc., since December 2001. |
| | | |
| Gary R. Young Year of Birth: 1969 | | Chief Administration Officer and Secretary | | Since October 2010 Since May 2004 | | Controller of Diamond Hill Investment Group, Inc. since April 2004. Chief Compliance Officer of Diamond Hill Capital Management Inc., since October 2010. |
| | | |
| Trent M. Statczar Year of Birth: 1971 | | Treasurer | | Since October 2010 | | Director, Beacon Hill Fund Services, Inc. 2008 to present: Vice President, Citi Fund Services Ohio, Inc. from 2004 to 2007. |
| | | |
| George L. Stevens Year of Birth: 1951 | | Chief Compliance Officer | | Since October 2010 | | Director, Beacon Hill Fund Services, Inc. 2008 to present: Vice President, Citi Fund Services Ohio, Inc. from 2004 to 2007. |
| 1 | The address of each Trustee and Officer is 325 John H. McConnell Boulevard - Suite 200, Columbus, Ohio 43215. |
| 2 | Each Trustee is elected to serve in accordance with the Declaration of Trust and Bylaws of the Trust until his or her successor is duly elected and qualified. |
The Statement of Additional Information contains additional information about the Trustees and is available without charge on www.diamond-hill.com or by calling 1-888-226-5595.
| | |
| Page 56 | | Diamond Hill Funds Annual Report December 31, 2011 |
NOTICE OF PRIVACY POLICY FOR DIAMOND HILL FUNDS
We value you as a shareholder and take your personal privacy seriously. In order to enhance our ability to provide you with the best service possible, Diamond Hill Funds (referred to as “we” or “us” or the “Funds”) collect, use and share certain information about you. This policy explains what information we collect and with whom we share it. The practices described in this policy are applicable to all customers, including prospective, current and former customers. The policy also explains how we protect the security and confidentiality of certain customer information.
SAFEGUARDING PRIVACY
Diamond Hill Funds maintain physical, electronic and procedural safeguards that comply with federal standards to ensure the safety of non-public personal customer information. In addition, we require service providers to the Funds to maintain policies and procedures designed to assure only appropriate access to, and use of, information about customers and to maintain physical, electronic and procedural safeguards that comply with federal standards to guard non-public personal customer information.
INFORMATION WE COLLECT AND SOURCES OF INFORMATION
We may collect information about our customers to help identify you, evaluate your application, service and manage your account and offer services and products you may find valuable. We collect this information from a variety of sources including:
| | • | | Information we receive from you on applications or other forms, such as your name, address, date of birth, social security number and investment information; |
| | • | | Information about your transactions and experiences with us, such as your account balance, transaction history and investment selections; and |
| | • | | Information you supply in written, telephonic or electronic communications with the Funds or service providers to the Funds. |
INFORMATION WE SHARE
We may disclose all non-public personal information we collect, as described above, to companies that perform services on our behalf, including those that assist us in responding to inquiries, processing transactions, preparing and mailing account statements and other forms of shareholder services, provided they use the information solely for these purposes and they enter into a confidentiality agreement regarding the information. We also may disclose non-public personal information as otherwise permitted by law.
QUESTIONS?
Questions regarding this policy may be directed to: 888-226-5595
| | |
| Diamond Hill Funds Annual Report December 31, 2010 | | Page 57 |

325 John H. McConnell Blvd., Suite 200
Columbus, Ohio 43215
614.255.3333
www.diamond-hill.com
Investment Adviser
Diamond Hill Capital Management, Inc.
Distributor
BHIL Distributors, Inc.
For additional information, call:
Diamond Hill Funds
TOLLFREE 888.226.5595
Item 2. Code of Ethics.
(a) The registrant has adopted a code of ethics that applies to the registrant’s principal executive officer, principal financial officer, principal accounting officer or controller, or persons performing similar functions. This code of ethics is included as an Exhibit.
(b) During the period covered by the report, with respect to the registrant’s code of ethics that applies to its principal executive officer, principal financial officer, principal accounting officer or controller, or persons performing similar functions; there have been no amendments to, nor any waivers granted from, a provision that relates to any element of the code of ethics definition enumerated in paragraph (b) of this Item 2.
Item 3. Audit Committee Financial Expert.
3(a)(1) The registrant’s board of directors has determined that the registrant has at least one audit committee financial expert serving on its audit committee.
3(a)(2) The audit committee financial expert is Mr. Thomas E Line, who is “independent” for purposes of this Item 3 of Form N-CSR.
Item 4. Principal Accountant Fees and Services.
(a) Audit Fees. Audit fees totaled $100,900 and $100,900 in fiscal 2011 and 2010, respectively. 2011 and 2010 fees include fees associated with the annual audit and filings of the registrant’s Form N-1A and Form N-SAR.
(b) Audit-Related Fees. There were no audit-related fees in fiscal 2011 and 2010.
(c) Tax Fees. Fees for tax compliance services totaled $32,900 and $32,900 in fiscal 2011 and 2010, respectively.
(d) All Other Fees. There were no other fees in fiscal 2011 and 2010.
(e)(1) Audit Committee Pre-Approval Policies. The Audit Committee’s pre-approval policies describe the types of audit, audit-related, tax and other services that may receive the general pre-approval of the Audit Committee. The pre-approval policies provide that annual audit service fees, tax services not specifically granted pre-approval, services exceeding pre-approved cost levels and other services that have not received general pre-approval will be subject to specific pre-approval by the Audit Committee. The pre-approval policies further provide that the Committee may grant general pre-approval to other audit services (statutory audits and services associated with SEC registration statements, periodic reports and other documents filed with the SEC or other documents issued in connection with securities offerings), audit-related services (accounting consultations related to accounting, financial reporting or disclosure matters not classified as “audit services,” assistance with understanding and implementing new accounting and financial reporting guidance from rulemaking authorities, agreed-upon or expanded audit procedures related to accounting and/or billing records required to respond to or comply with financial, accounting or regulatory reporting matters and assistance with internal control reporting requirements under Form N-SAR and Form N-CSR), tax services that have historically been provided by the auditor that the Committee believes would not impair the independence of the auditor and are consistent with the SEC’s rules on auditor independence and permissible non-audit services classified as “all other services” that are routine and recurring services.
(e)(2) 0.0% in fiscal 2011 and 2010.
(f) Not applicable.
(g) The aggregate non-audit fees for services to the registrant, its investment adviser and any entity controlling, controlled by, or under common control with the adviser that provides ongoing services to the registrant were $79,600 and $79,600 in 2011 and 2010, respectively.
(h) Not applicable.
Item 5. Audit Committee of Listed Registrants.
Not applicable.
Item 6. Schedule of Investments.
(a) The Schedule of Investments is included in the Annual Report to Shareholders filed under Item 1 of this Form.
(b) Not applicable.
Item 7. Disclosure of Proxy Voting Policies and Procedures for Closed-End Management Investment Companies.
Not applicable.
Item 8. Portfolio Managers of Closed-End Management Investment Companies.
Not applicable.
Item 9. Purchases of Equity Securities by Closed-End Management Investment Company and Affiliated Purchasers.
Not applicable.
Item 10. Submission of Matters to a Vote of Security Holders.
Not applicable.
Item 11. Controls and Procedures.
(a)The registrant’s principal executive officer and principal financial officer have concluded, based on their evaluation of the registrant’s disclosure controls and procedures as conducted within 90 days of the filing date of this report, that these disclosure controls and procedures are adequately designed and are operating effectively to ensure that information required to be disclosed by the registrant on Form N-CSR is recorded, processed, summarized and reported within the time periods specified in the Securities and Exchange Commission’s rules and forms.
(b)There were no changes in the registrant’s internal control over financial reporting (as defined in Rule 30a-3(d) under the Act (17 CFR 270.30a-3(d)) that occurred during the second fiscal quarter of the period covered by this report that have materially affected or are reasonably likely to materially affect, the registrant’s internal control over financial reporting.
Item 12. Exhibits.
| | |
| |
| (a)(1) | | Code of Ethics for Senior Financial Officers is filed herewith. |
| |
| (a)(2) | | Certifications required by Item 12(a) of Form N-CSR are filed herewith. |
| |
| (a)(3) | | Not applicable. |
| |
| (b) | | Certification required by Item 12(b) of Form N-CSR is furnished herewith. |
SIGNATURES
Pursuant to the requirements of the Securities Exchange Act of 1934 and the Investment Company Act of 1940, the registrant has duly caused this report to be signed on its behalf by the undersigned, thereunto duly authorized.
| | |
| (Registrant) | | Diamond Hill Funds |
| | |
| |
| By (Signature and Title) | | /s/ James F. Laird, Jr. |
| | James F. Laird, Jr., President |
Pursuant to the requirements of the Securities Exchange Act of 1934 and the Investment Company Act of 1940, this report has been signed below by the following persons on behalf of the registrant and in the capacities and on the dates indicated.
| | |
| |
| By (Signature and Title) | | /s/ James F. Laird, Jr. |
| | James F. Laird, Jr., President |
| | |
| |
| By (Signature and Title) | | /s/ Trent M. Statczar |
| | Trent M. Statczar, Treasurer |