UNITED STATES
SECURITIES AND EXCHANGE COMMISSION
Washington, D.C. 20549
FORM N-CSR
CERTIFIED SHAREHOLDER REPORT OF REGISTERED
MANAGEMENT INVESTMENT COMPANIES
Investment Company Act file number: 811-08061
Diamond Hill Funds
(Exact name of registrant as specified in charter)
325 John H. McConnell Boulevard, Suite 200, Columbus, Ohio 43215
(Address of principal executive offices) (Zip code)
Thomas E. Line, 325 John H. McConnell Boulevard, Suite 200, Columbus, Ohio 43215
(Name and address of agent for service)
Registrant’s telephone number, including area code: 614-255-3333
Date of fiscal year end: December 31
Date of reporting period: December 31, 2015
Item 1. Reports to Stockholders.

Annual Report
December 31, 2015
| | |
| Small Cap Fund | | Long-Short Fund |
| Small-Mid Cap Fund | | Research Opportunities Fund |
| Mid Cap Fund | | Financial Long-Short Fund |
| Large Cap Fund | | Strategic Income Fund |
| Select Fund | | |
This material must be preceded or accompanied by a current prospectus.
Not FDIC Insured. May Lose Value. No Bank Guarantee.

Table of Contents
Cautionary Statement: At Diamond Hill, we pledge that, “we will communicate with our clients about our investment performance in a manner that will allow them to properly assess whether we are deserving of their trust.” Our views and opinions regarding the investment prospects of our portfolio holdings and Funds are “forward looking statements” which may or may not be accurate over the long term. While we believe we have a reasonable basis for our opinions, actual results may differ materially from those we anticipate. Information provided in this report should not be considered a recommendation to purchase or sell any particular security.
You can identify forward looking statements by words like “believe,” “expect,” “anticipate,” or similar expressions when discussing prospects for particular portfolio holdings and/or one of the Funds. We cannot assure future results. You should not place undue reliance on forward-looking statements, which speak only as of the date of this report. We disclaim any obligation to update or alter any forward-looking statements, whether as a result of new information, future events, or otherwise.
This material is not authorized for distribution to prospective investors unless preceded or accompanied by a Prospectus. Investors should consider the investment objectives, risks, charges, and expenses of the Diamond Hill Funds carefully before investing. The prospectus or summary prospectus contain this and other important information about the Fund(s) and are available at diamond-hill.com or by calling 888.226.5595. Please read the prospectus or summary prospectus carefully before investing. The Diamond Hill Funds are distributed by BHIL Distributors, Inc. (Member FINRA), an affiliated company. Diamond Hill Capital Management, Inc., a registered investment adviser, serves as Investment Adviser to the Diamond Hill Funds and is paid a fee for its services. Diamond Hill Funds are not FDIC insured, may lose value, and have no bank guarantee.
Letter to Shareholders
Dear Fellow Shareholders:
We are pleased to provide you with this year-end update for the Diamond Hill Funds. 2015 was another challenging year for active managers. The debate around active versus passive management has intensified as market conditions over the past five years have made it difficult for many active managers, including Diamond Hill, to outperform passive benchmarks. These performance headwinds, coupled with higher fees for active management strategies, have caused some investors to question whether active management is still relevant.
We believe that active managers with a consistent, disciplined, and repeatable investment process have the potential to outperform a passive alternative over the long-term and to offer downside protection, limiting losses, during market declines. Diamond Hill Funds have generally demonstrated both of these qualities over long periods of time. The performance of active strategies relative to a passive benchmark tends to be cyclical. These cycles are created because price momentum can persist in the short-term but reverts in the long-term. Market returns are often driven by investor emotions and unpredictable market psychology in the short-term, which has been extended in recent years by unprecedented monetary stimulus; an extended bull market characterized by lower volatility, lower dispersion, and higher correlations; less focus on individual, bottom-up company fundamentals; and self-reinforcing passive flows.
While market conditions over the past five years have made it difficult for many active managers to outperform passive alternatives, we expect the cycle will turn in favor of active management, and we are beginning to see signs of a turning point. Dispersion between individual stock returns is increasing and in December 2015, the Federal Reserve increased its Fed Funds target rate for the first time since 2006. We continue to believe that Diamond Hill’s intrinsic value-focused approach will outperform over a full market cycle, supported by a shared commitment to our intrinsic value-based investment philosophy, long-term perspective, disciplined approach, and alignment with our clients’ interests.
In 2015, our Funds’ returns relative to benchmarks were mixed. More importantly, as of December 31, 2015, the since-inception returns for nearly all of our Funds exceeded their respective benchmark returns. The only exceptions were our Research Opportunities Fund and our Mid Cap Fund, which have less than a five-year track record. As always, we remain focused on five-year periods to evaluate our results, as we believe five years is the shortest time period for statistical significance.
2015 Financial Markets
U.S. stocks rose modestly in the first half of 2015 but lost momentum in the third quarter as investor concerns over a slowdown in China’s economic growth negatively impacted commodity prices. China is the world’s largest importer of raw materials. This slowdown has also strained many other developing countries and large portions of the global industrial sector as China has been a meaningful source of incremental demand for key industrial end markets. A strong fourth quarter was not enough to completely save the year and most major market indexes ended 2015 somewhere close to even. The Russell 1000 Index posted a total return, including dividends, of 0.92% for the year, while the broader
| | | | | | | | | | | | | | | | |
| DIAMOND HILL FUNDS | | | | | ANNUAL REPORT | | | | | DECEMBER 31, 2015 | | | | | DIAMOND-HILL.COM | | | 1 | |
Letter to Shareholders
Russell 3000 Index posted a 0.48% total return. Small cap stocks fared worse than large cap stocks, with the Russell 2000 Index posting a total return of -4.41%.
Outlook
The U.S. economy appears to be continuing the healing process with real growth generally staying in the 2% - 3% range. Globally, central banks remain extraordinarily accommodative in an attempt to provide a backdrop for increased economic growth. Europe, which has been an economic laggard over the past few years, has shown some signs of stabilization. However, China has seen a significant slowdown in its rate of economic expansion. While the U.S. Fed Funds rate remains extremely low, the 25 basis point increase in December indicates policymakers’ confidence in the recovery of U.S. labor markets and an expectation of slowly rising inflation. It is expected that further rate increases will come at a gradual pace, which may be affected by volatility in global financial markets.
We continue to expect positive but below average equity market returns over the next five years. Our conclusion is primarily based on the combination of above average price/earnings multiples applied to already very strong levels of corporate profit margins, which likely tempers prospective returns. This expectation also seems consistent with the current interest rate environment.
Diamond Hill Capital Management, Inc.
| | |
 | |  |
| |
Chris Welch, CFA Co-Chief Investment Officer | | Austin Hawley, CFA Co-Chief Investment Officer |
The views expressed are those of the portfolio managers as of December 31, 2015, are subject to change, and may differ from the views of other portfolio managers or the firm as a whole. These opinions are not intended to be a forecast of future events, a guarantee of future results, or investment advice. All data referenced are from sources deemed to be reliable but cannot be guaranteed. Securities and sectors referenced should not be construed as a solicitation or recommendation or be used as the sole basis for any investment decision.
The Russell 1000 Index is an unmanaged market capitalization-weighted index comprised of the largest 1,000 companies by market capitalization in the Russell 3000 Index. The Russell 2000 Index is an unmanaged market capitalization-weighted index comprised of the smallest 2,000 companies by market capitalization in the Russell 3000 Index. The Russell 3000 Index is an unmanaged market capitalization-weighted index comprised of the 3,000 largest U.S. companies by total market capitalization. These indexes do not incur fees and expenses (which would lower the return) and are not available for direct investment.
| | | | | | | | | | | | | | |
| 2 | | DIAMOND HILL FUNDS | | | | | ANNUAL REPORT | | | | | DECEMBER 31, 2015 | | | | | DIAMOND-HILL.COM |
Our Mission
At Diamond Hill, we serve our clients by providing investment strategies that deliver lasting value through a shared commitment to our intrinsic value-based investment philosophy, long-term perspective, disciplined approach and alignment with our clients’ interests.
VALUE
We believe market price and intrinsic value are independent in the short-term but tend to converge over time.
LONG-TERM
We maintain a long-term focus both in investment analysis and management of our business.
DISCIPLINE
We invest with discipline to increase potential return and protect capital.
PARTNERSHIP
We align our interests with those of our clients through significant personal investment in our strategies.
| | | | | | | | | | | | | | | | |
| DIAMOND HILL FUNDS | | | | | ANNUAL REPORT | | | | | DECEMBER 31, 2015 | | | | | DIAMOND-HILL.COM | | | 3 | |
Fundamental Principles
The Importance of Valuation
We believe that a company’s intrinsic value is independent of its stock price and that intrinsic value can be reasonably estimated using a discounted cash flow methodology. Our entire investment team shares the same investment philosophy, which drives our investment process.
We focus on the fundamentals of intrinsic value, which are far less volatile than market price, and our actions are ultimately dictated by the price to intrinsic value relationship.
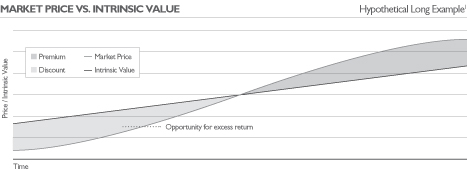
| | There is no guarantee that a discount to intrinsic value will be achieved or that market price and/or intrinsic value will increase over time. |
| 1 | The inverse is true for short position |
| | | | | | | | | | | | | | |
| 4 | | DIAMOND HILL FUNDS | | | | | ANNUAL REPORT | | | | | DECEMBER 31, 2015 | | | | | DIAMOND-HILL.COM |
Fundamental Principles
Equity Investment Principles
Valuation
| • | | We believe that every share of stock has an intrinsic value that is independent of its current market price, and at any point in time, the market price may be higher or lower than intrinsic value. |
| • | | Over short periods of time, the market price is heavily influenced by the emotions of market participants, which are far more difficult to predict than intrinsic value. While market prices may experience extreme fluctuations on a particular day, we believe intrinsic value is far less volatile. |
| • | | Over sufficiently long periods of time, five years or longer, the market price tends to converge with intrinsic value. |
Intrinsic Value Estimate
| • | | We believe that we can determine a reasonable approximation of intrinsic value if we are confident in projecting the future cash flows of a business and use an appropriate discount rate. |
Suitable Investments
| • | | We only invest when the market price is lower than our conservative assessment of per share intrinsic value (or at a premium for short positions). |
| • | | We concentrate our investments in businesses whose per share intrinsic value is likely to increase. We invest in businesses that possess a competitive advantage, conservative balance sheet, and outstanding managers and employees. For short positions, the inverse is often true, and a growing intrinsic value is a detriment to the performance of the position. |
Risk & Return
| • | | We intend to achieve our return from both the closing of the gap between our purchase price and intrinsic value and the increase in per share intrinsic value. For short positions, an increasing intrinsic value may shorten the holding period. |
| • | | We define risk as the permanent loss of capital rather than price volatility. We manage risk by investing in companies selling at a discount (premium for short positions) to our estimate of intrinsic value. |
| | | | | | | | | | | | | | | | |
| DIAMOND HILL FUNDS | | | | | ANNUAL REPORT | | | | | DECEMBER 31, 2015 | | | | | DIAMOND-HILL.COM | | | 5 | |
Fundamental Principles
Fixed Income Investment Principles
Business Analysis
| • | | We believe we can leverage our research team’s industry analysis of the fundamental economic drivers of the business to identify attractive corporate bonds and other senior corporate securities. |
| • | | We evaluate the quality of a firm’s management and their treatment of bondholders and stockholders. We believe managements that focus on growth, without regard to return on invested capital or long-term cost of capital, are more likely to destroy value for bondholders and stockholders. In contrast, managements that understand the competitive dynamics of their business and prudent capital allocation often produce value for both bondholders and stockholders. |
Valuation
| • | | We focus on the intrinsic value of the business in relation to the amount of debt in the capital structure. We also evaluate the sources and uses of cash for the business. |
| • | | The liquidity and expected volatility of a corporate bond are also important factors in valuation. Because of our long-term time horizon, we will invest in less liquid or more volatile securities; however, we require a higher yield as compensation. |
Suitable Investments
| • | | We generally invest in corporate bonds of companies with improving competitive positions and return on invested capital. |
| • | | Our core competency is the evaluation of credit risk. We typically favor lower duration, shorter maturity corporate bonds. We focus almost entirely on the secondary market for corporate bonds rather than the primary (new issue) market. We primarily invest in investment grade and below-investment grade (high yield) corporate bonds, including a significant allocation to defensive high yield corporate bonds (due to low duration and higher credit quality). |
Risk & Return
| • | | We define risk as the permanent loss of capital. We seek to avoid a permanent loss of capital and to earn a sufficient return on capital to grow our purchasing power. |
| • | | We expect to achieve our return objective by investing in corporate bonds when we believe the market price discounts a greater risk of default or a greater loss upon default than is warranted. An additional source of return exists when the market price provides attractive compensation for short-term illiquidity or volatility, both of which are of less concern to a long-term investor. |
| • | | We focus on credit risk, interest rate risk, liquidity risk, call risk, reinvestment risk, and other risks when evaluating corporate bonds. |
| | | | | | | | | | | | | | |
| 6 | | DIAMOND HILL FUNDS | | | | | ANNUAL REPORT | | | | | DECEMBER 31, 2015 | | | | | DIAMOND-HILL.COM |
Diamond Hill Small Cap Fund
2015 Portfolio Commentary
The Diamond Hill Small Cap Fund returned -3.47% (Class I) in 2015 compared to a -4.41% return for the Russell 2000 Index. In 2015, small cap indices underperformed large cap, and value style indices underperformed growth. For example, the larger cap Russell 1000 returned 0.92% and the Russell 2000 Growth Index returned -1.38% compared to the Russell 2000 Value Index return of -7.47%. Health care and information technology were the only two sectors in the Russell 2000 experiencing a positive return, while energy was by far the worst-performing sector in 2015, as it was in 2014. The Diamond Hill Small Cap Fund had positive contributions from the consumer discretionary, consumer staples, financials, information technology, and health care sectors. The primary detractors from Fund performance were industrials and energy, both of which had more exposure in the Fund than the index. The Fund had built a sizable lead through the first nine months of the year, but a poor relative fourth quarter limited the amount of outperformance.
The Fund’s largest exposure is financials, averaging roughly 28% of net assets during the year. Returns varied greatly in the sector, however. HCC Insurance Holdings agreed to be acquired for cash by Tokio Marine Holdings at a premium representing a multiple of 1.9x book value, making the full-year return 47%. Navigators Group also registered a healthy 17% return and currently trades at approximately 1.1x book value. Apartment REIT Mid-American Apartment Communities returned 26% as strong demand continues for multi-family apartments. The Fund also benefitted from two combination stock-and-cash offers from larger banks. Keycorp has offered to buy First Niagara Financial Group, and BB&T has offered to buy National Penn Bancshares. The largest detractors within financials were Fortress Investment Group (down 31%), Nationstar Mortgage Holdings (down 53%), Popular (down 16%), iStar (down 14%), and Greenlight Capital (down 43%).
Industrials were the largest detractor from Fund performance during the year. Avis Budget Group was the Fund’s largest holding at year-end, and had been an outstanding performer in 2013 and 2014. However, the stock returned a negative 45% in 2015. The three major car rental companies — Enterprise, Hertz, and Avis with their various brands — control about 90% of the market share in North America. While the company’s results came in below our expectations, in our opinion, the stock price reaction was extremely disproportionate to the business results. Avis now trades at a free cash flow yield approaching 20%.
Alaska Air Group continues to perform well as fundamentals in the airline business remain favorable. Toro Company has also steadily grown earnings with the stock following suit. Industrials, with significant exposure to energy and mining such as Kennametal and Colfax, however, had a very poor year.
In the energy sector, crude oil prices, as measured by the front month contract for West Texas Intermediate, declined about 30% for the year. Natural gas prices also declined about 19%, as measured by Henry Hub prices, with prices in some regions down even more. The companies the Fund has owned in the energy sector have been exploration and production
| | | | | | | | | | | | | | | | |
| DIAMOND HILL FUNDS | | | | | ANNUAL REPORT | | | | | DECEMBER 31, 2015 | | | | | DIAMOND-HILL.COM | | | 7 | |
Diamond Hill Small Cap Fund
companies, and all declined meaningfully in 2015. Ordinarily, we seek to buy more as the stock prices of companies owned in the portfolio decline; however, for the most part, we have not added to these energy stocks, acknowledging that the range of potential outcomes is wide. In retrospect, these stocks should have been sold upon the shift in strategy of Saudi Arabia to not reduce production to balance an oversupplied market. While the dramatic reductions in capital spending on the part of U.S. shale producers should eventually reduce production, this comes at a time of potentially slowing demand growth as emerging economies’ growth rates come down.
Both consumer discretionary and consumer staples companies contributed positively to Fund returns in 2015. Steiner Leisure was acquired by private equity firm Catterton Partners. This was a satisfactory result as Steiner had shown more positive results in its Ideal Image business, which had struggled for several quarters. Vail Resorts also continues to succeed as the dominant ski resort operator in the United States. Thus far in 2016, the company has had better snowfall in the Lake Tahoe area, as well as continued strong season pass sales that allow skiers to access any of Vail’s resorts. Aaron’s declined after the company reported third-quarter results that showed margin compression in their Progressive business, stemming from increased bad debt expense caused by a systems issue from earlier in the year. The company says the issue has been resolved, and if so, the stock appears attractive at less than 10x estimated earnings.
Both health care and information technology comprise less of the Fund’s portfolio than that of the Russell 2000 index. Natus Medical was the standout in health care, and DST Systems, Broadridge Financial Solutions, and CSG Systems International were all positive in the information technology sector.
Thank you for your continued interest in the Small Cap Fund.

Tom Schindler, CFA
Portfolio Manager
| | | | | | | | | | | | | | |
| 8 | | DIAMOND HILL FUNDS | | | | | ANNUAL REPORT | | | | | DECEMBER 31, 2015 | | | | | DIAMOND-HILL.COM |
Diamond Hill Small Cap Fund
AVERAGE ANNUAL TOTAL RETURNS AS OF DECEMBER 31, 2015
| | | | | | | | | | | | | | | | | | | | | | | | |
| | | Inception Date | | | One
Year | | | Three
Years | | | Five
Years | | | Ten
Years | | | Expense
Ratio* | |
| PERFORMANCE AT NAV WITHOUT SALES CHARGES | | | | | | | | | | | | | | | | | | | | | |
| Class A Shares | | | 12/29/2000 | | | | -3.73 | % | | | 12.05 | % | | | 8.07 | % | | | 5.94 | % | | | 1.31 | % |
| Class C Shares | | | 2/20/2001 | | | | -4.47 | | | | 11.21 | | | | 7.27 | | | | 5.15 | | | | 2.06 | |
| Class I Shares | | | 4/29/2005 | | | | -3.47 | | | | 12.34 | | | | 8.36 | | | | 6.29 | | | | 1.02 | |
| Class Y Shares | | | 12/30/2011 | | | | -3.36 | | | | 12.50 | | | | 8.42 | | | | 6.12 | | | | 0.92 | |
| BENCHMARK | | | | | | | | | | | | | | | | | | | | | |
| Russell 2000 Index | | | | | | | -4.41 | | | | 11.65 | | | | 9.19 | | | | 6.80 | | | | — | |
| PERFORMANCE AT PUBLIC OFFERING PRICE INCLUDING SALES CHARGES** | | | | | | | | | | | | | | | | | | | | | |
| Class A Shares | | | 12/29/2000 | | | | -8.55 | | | | 10.16 | | | | 6.97 | | | | 5.40 | | | | 1.31 | |
| Class C Shares | | | 2/20/2001 | | | | -5.42 | | | | 11.21 | | | | 7.27 | | | | 5.15 | | | | 2.06 | |
| * | Reflects the expense ratio as reported in the Prospectus dated February 26, 2016. |
| ** | The maximum sales charge for Class A shares on purchases and for Class C shares on certain redemptions are 5.00% and 1.00%, respectively. |
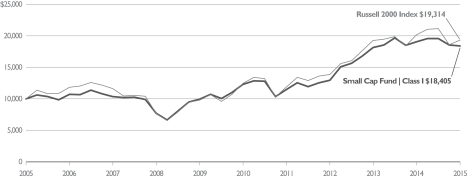
GROWTH OF $10,000
Comparison of the change in value of a $10,000 Investment in the Diamond Hill Small Cap Fund Class I(A) and the Russell 2000 Index.
| (A) | The growth of $10,000 chart represents the performance of Class I shares only, which will vary from the performance of Class A, Class C and Class Y shares based on the difference in loads and fees paid by shareholders in the different classes. |
| | The performance of the above Fund does not reflect the deduction of taxes that a shareholder would pay on Fund distributions or the redemption of Fund shares. |
| | The chart above represents a comparison of a hypothetical $10,000 investment and the reinvestment of dividends and capital gains in the indicated share class versus a similar investment in the Russell 2000 Index (“Index”). The Index is a market capitalization-weighted index measuring performance of the smallest 2,000 companies, on a market capitalization basis, in the Russell 3000 Index. The Index is unmanaged, and does not reflect the deduction of fees associated with a mutual fund such as investment management and accounting fees. The Fund’s performance reflects the deduction of fees for these services. Investors cannot invest directly in an index although they can invest in the underlying securities. |
| | Historical performance for Class Y shares prior to its inception is based on the performance of Class A shares. Class Y performance has been adjusted to reflect differences in sales charges and expenses between classes. |
| | Past performance does not guarantee future results. The performance data quoted represents past performance and current returns may be lower or higher. The investment return and principal value will fluctuate so that an investor’s shares, when redeemed, may be worth more or less than the original cost. To obtain performance information current to the most recent month end, please visit
www.diamond-hill.com. |
| | | | | | | | | | | | | | | | |
| DIAMOND HILL FUNDS | | | | | ANNUAL REPORT | | | | | DECEMBER 31, 2015 | | | | | DIAMOND-HILL.COM | | | 9 | |
Diamond Hill Small-Mid Cap Fund
2015 Portfolio Commentary
The Diamond Hill Small-Mid Cap Fund gained 1.32% (Class I) in 2015 compared to a 2.90% decrease in the benchmark Russell 2500 Index. For the five-year period ended December 31, 2015, the Fund’s return was 11.38% annualized while the Russell 2500 Index returned 10.32% over the same period. In the ten years since inception, the Fund’s annualized return of 8.71% outpaced the 7.56% benchmark return.
Consumer staples was the most positive area of performance in 2015. The portfolio benefited from gains exceeding 20% in four stocks despite the overall market decline. While none of the stocks we owned in the sector were acquired, each of our big gainers benefited from acquisition activity. Post Holdings led the way with a 47% increase based on strong results from the numerous acquisitions they have completed in the past couple of years. Molson Coors Brewing Company rose after a merger between competitors enabled them to purchase the other half of their MillerCoors U.S. joint venture from SABMiller. B&G Foods investors looked favorably on the company’s acquisition of the Green Giant brand from General Mills. Finally, Coty announced a deal to acquire the beauty brands of Procter & Gamble, and that transaction is expected to boost Coty’s earnings and cash flows when it is completed in mid-2016.
The technology sector was also a source of favorable stock selection for the Small Mid Cap Fund in 2015. CSG Systems International, which we bought in January 2015, rose more than 50% from our purchase price based on favorable volumes and cost management in their cable billing business. Payment processor Vantiv was up nearly 40% as electronic transactions continue to gain share from cash and checks in the financial world. Juniper Networks rose more than 25% based on improving sales to their large telecom provider clients, as well as cost cuts and share repurchases.
The portfolio experienced headwinds from stock selection in the industrials sector. Companies with direct or indirect exposure to energy and mining were under significant pressure throughout the year, and that negatively impacted a number of our portfolio holdings including Colfax, Kennametal, and new position Kirby Corporation. While we believe some of these impacts are cyclical, we have a less constructive long-term view on energy prices than we have at any point during the 10 years the portfolio has been in existence. As such, we decreased our energy sector weight to 3.4% of the portfolio at year-end, far below the 15% weight we held as recently as four years ago.
Kirby is a good example of the type of stock that has helped us deliver strong returns to clients over time. It is the leading U.S. tank barge operator with approximately 25% market share in both the inland and coastal waterway markets. The company’s near-term results have been under pressure due to the decline in energy prices as some of their volumes are crude oil, natural gas condensate and related products. However, approximately 50% of their volumes are from the transport of petrochemicals. That market is expected to see significant additional U.S. capacity come online over the 2017-2020 time frame. The stock weakness in the second half of 2015 gave us a nice opportunity to buy a well-managed company with favorable long-term demand characteristics at a very attractive valuation.
| | | | | | | | | | | | | | |
| 10 | | DIAMOND HILL FUNDS | | | | | ANNUAL REPORT | | | | | DECEMBER 31, 2015 | | | | | DIAMOND-HILL.COM |
Diamond Hill Small-Mid Cap Fund
We have benefited in the past from the purchase of stocks such as Boston Scientific and Forest Laboratories, when their unattractive near-term fundamentals masked a favorable long-term outlook, and we will continue to look for such opportunities in the future.
I’d like to once again highlight our outstanding team of 18 research analysts and 11 research associates who work hard to generate ideas and deliver strong returns to clients. They do excellent work in pursuit of identifying long-term investment opportunities on your behalf.
The increased market volatility since mid-year 2015 has created some opportunities, many of which have arisen in stocks with meaningful exposure to the economic cycle. In particular, many of those stock have exposure to the energy and industrials sectors, as well as to demand from China. These stocks tend to have a high correlation in the short-term when investors are fearful about slower economic growth. However, the long-term returns they generate tend to be highly differentiated based on the earnings and cash flows produced by the individual companies over time. We are carefully assessing long-term opportunities and working to best position your capital in investments that offer the promise of above-average long-term returns while minimizing the risk of permanent loss of capital. We maintain our insistence on an attractive discount to intrinsic value with any investment we make and our strict focus on a long-term investment time horizon.
We appreciate your ongoing support and look forward to continuing to work with you in the coming years.
Chris Welch, CFA
Portfolio Manager
| | | | | | | | | | | | | | | | |
| DIAMOND HILL FUNDS | | | | | ANNUAL REPORT | | | | | DECEMBER 31, 2015 | | | | | DIAMOND-HILL.COM | | | 11 | |
Diamond Hill Small-Mid Cap Fund
AVERAGE ANNUAL TOTAL RETURNS AS OF DECEMBER 31, 2015
| | | | | | | | | | | | | | | | | | | | | | | | |
| | | Inception Date | | | One
Year | | | Three
Years | | | Five
Years | | | Ten
Years | | | Expense
Ratio* | |
| PERFORMANCE AT NAV WITHOUT SALES CHARGES | | | | | | | | | | | | | | | | | |
| Class A Shares | | | 12/30/2005 | | | | 0.98 | % | | | 15.20 | % | | | 11.07 | % | | | 8.35 | % | | | 1.25 | % |
| Class C Shares | | | 12/30/2005 | | | | 0.24 | | | | 14.33 | | | | 10.25 | | | | 7.56 | | | | 2.00 | |
| Class I Shares | | | 12/30/2005 | | | | 1.32 | | | | 15.50 | | | | 11.38 | | | | 8.71 | | | | 0.96 | |
| Class Y Shares | | | 12/30/2011 | | | | 1.41 | | | | 15.69 | | | | 11.43 | | | | 8.53 | | | | 0.86 | |
| BENCHMARK | | | | | | | | | | | | | | | | | |
| Russell 2500 Index | | | | | | | -2.90 | | | | 12.46 | | | | 10.32 | | | | 7.56 | | | | — | |
| PERFORMANCE AT PUBLIC OFFERING PRICE INCLUDING SALES CHARGES** | | | | | | | | | | | | | | | | | |
| Class A Shares | | | 12/30/2005 | | | | -4.05 | | | | 13.25 | | | | 9.94 | | | | 7.79 | | | | 1.25 | |
| Class C Shares | | | 12/30/2005 | | | | -0.75 | | | | 14.33 | | | | 10.25 | | | | 7.56 | | | | 2.00 | |
| * | Reflects the expense ratio as reported in the Prospectus dated February 26, 2016. |
| ** | The maximum sales charge for Class A shares on purchases and for Class C shares on certain redemptions are 5.00% and 1.00%, respectively. |
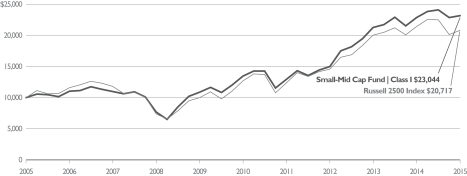
GROWTH OF $10,000
Comparison of the change in value of a $10,000 Investment in the Diamond Hill Small-Mid Cap Fund Class I(A) and the Russell 2500 Index.
| (A) | The growth of $10,000 chart represents the performance of Class I shares only, which will vary from the performance of Class A, Class C and Class Y shares based on the difference in loads and fees paid by shareholders in the different classes. |
| | The performance of the above Fund does not reflect the deduction of taxes that a shareholder would pay on Fund distributions or the redemption of Fund shares. |
| | The chart above represents a comparison of a hypothetical $10,000 investment and the reinvestment of dividends and capital gains in the indicated share class versus a similar investment in the Russell 2500 Index (“Index”). The Index is a market capitalization-weighted index measuring performance of the smallest 2,500 companies, on a market capitalization basis, in the Russell 3000 Index. The Index is unmanaged, and does not reflect the deduction of fees associated with a mutual fund such as investment management and accounting fees. The Fund’s performance reflects the deduction of fees for these services. Investors cannot invest directly in an index although they can invest in the underlying securities. |
| | Historical performance for Class Y shares prior to its inception is based on the performance of Class A shares. Class Y performance has been adjusted to reflect differences in sales charges and expenses between classes. |
| | Past performance does not guarantee future results. The performance data quoted represents past performance and current returns may be lower or higher. The investment return and principal value will fluctuate so that an investor’s shares, when redeemed, may be worth more or less than the original cost. To obtain performance information current to the most recent month end, please visit
www.diamond-hill.com. |
| | | | | | | | | | | | | | |
| 12 | | DIAMOND HILL FUNDS | | | | | ANNUAL REPORT | | | | | DECEMBER 31, 2015 | | | | | DIAMOND-HILL.COM |
Diamond Hill Mid Cap Fund
2015 Portfolio Commentary
The Diamond Hill Mid Cap Fund gained 0.74% (Class I) in 2015 compared to a 2.44% decrease in the benchmark Russell Midcap Index. For the two-year period since inception, the Fund’s annualized return was 4.27% while the Russell Midcap Index returned 5.10% over the same period.
This was the second consecutive year during which the large market capitalization segment of the stock market delivered meaningfully better results than smaller-size stocks. The Russell 1000 Index (large cap domestic stocks) rose 0.92% during the year, while the Russell 2000 Index, which is widely used to measure the performance of small cap domestic stocks, fell 4.41%. Growth stocks also outperformed value stocks, as the Russell Midcap Growth Index delivered returns that were more than 4 percentage points in excess of those of the Russell Midcap Value Index. Neither of these trends had a major impact on the portfolio this year, as individual stock selection was the major driver of returns.
Consumer staples was the Fund’s most positive area of performance in 2015. The portfolio benefited from gains exceeding 20% in four stocks despite the overall market decline. While none of the stocks we owned in the sector were acquired, each of our big gainers benefited from acquisition activity. Post Holdings led the way with a 47% increase based on strong results from the numerous acquisitions they have completed in the past couple of years. Molson Coors Brewing Company rose after a merger between competitors enabled them to purchase the other half of their MillerCoors U.S. joint venture from SABMiller. B&G Foods investors looked favorably on the company’s acquisition of the Green Giant brand from General Mills. Finally, Coty announced a deal to acquire the beauty brands of Procter & Gamble, and that transaction is expected to boost Coty’s earnings and cash flows when it is completed in mid-2016.
The portfolio experienced headwinds from stock selection in the industrials sector. Companies with direct or indirect exposure to energy and mining were under significant pressure throughout the year, and that negatively impacted a number of portfolio holdings including Colfax, Kennametal, and new position Kirby Corporation. While we believe some of these impacts are cyclical, we have a less constructive long-term view on energy prices than we have in the past. As such, we decreased our energy sector weight to 3.3% of the portfolio at year-end, down from more than 10% as recently as six quarters ago.
Kirby is a good example of the type of stock we believe will help us deliver strong returns to clients over time. It is the leading U.S. tank barge operator with approximately 25% market share in both the inland and coastal waterway markets. The company’s near-term results have been under pressure due to the decline in energy prices as some of their volumes are crude oil, natural gas condensate, and related products. However, approximately 50% of their volumes are from the transport of petrochemicals. That market is expected to see significant additional U.S. capacity come online over the 2017-2020 timeframe. The stock weakness in the second half of 2015 gave us a nice opportunity to buy a well-managed company with favorable long-term demand characteristics at a very attractive valuation.
| | | | | | | | | | | | | | | | |
| DIAMOND HILL FUNDS | | | | | ANNUAL REPORT | | | | | DECEMBER 31, 2015 | | | | | DIAMOND-HILL.COM | | | 13 | |
Diamond Hill Mid Cap Fund
Agricultural equipment manufacturer Deere & Company, which we purchased in the third quarter of 2015, is another example of a firm with a similar mix of near-term headwinds and long-term attractive characteristics. We will continue to look for such opportunities in the future.
I’d like to once again highlight our outstanding team of 18 research analysts and 11 research associates who work hard to generate ideas and deliver strong returns to clients. They do excellent work in pursuit of identifying long-term investment opportunities on your behalf.
The increased market volatility since mid-year 2015 has created some opportunities, many of which have arisen in stocks with meaningful exposure to the economic cycle. In particular, many of those stock have exposure to the energy and industrials sectors, as well as to demand from China. These stocks tend to have a high correlation in the short-term when investors are fearful about slower economic growth. However, the long-term returns they generate tend to be highly differentiated based on the earnings and cash flows produced by the individual companies over time. We are carefully assessing long-term opportunities and working to best position your capital in investments that offer the promise of above-average long-term returns while minimizing the risk of permanent loss of capital. We maintain our insistence on an attractive discount to intrinsic value with any investment we make and our strict focus on a long-term investment time horizon.
We appreciate your ongoing support and look forward to continuing to work with you in the coming years.
Chris Welch, CFA
Portfolio Manager
| | | | | | | | | | | | | | |
| 14 | | DIAMOND HILL FUNDS | | | | | ANNUAL REPORT | | | | | DECEMBER 31, 2015 | | | | | DIAMOND-HILL.COM |
Diamond Hill Mid Cap Fund
AVERAGE ANNUAL TOTAL RETURNS AS OF DECEMBER 31, 2015
| | | | | | | | | | | | | | | | | | |
| | | | | Inception Date | | | One
Year | | | Since
Inception
(12/31/13) | | | Expense
Ratio* | |
| PERFORMANCE AT NAV WITHOUT SALES CHARGES | | | | | | | | | | | | | |
| Class A Shares | | | | | 12/31/2013 | | | | 0.44 | % | | | 3.94 | % | | | 1.14 | % |
| Class C Shares | | | | | 12/31/2013 | | | | -0.33 | | | | 3.17 | | | | 1.89 | |
| Class I Shares | | | | | 12/31/2013 | | | | 0.74 | | | | 4.27 | | | | 0.85 | |
| Class Y Shares | | | | | 12/31/2013 | | | | 0.84 | | | | 4.37 | | | | 0.75 | |
| BENCHMARK | | | | | | | | | | | | | |
| Russell Midcap Index | | | | | | | | | -2.44 | | | | 5.10 | | | | — | |
| PERFORMANCE AT PUBLIC OFFERING PRICE INCLUDING SALES CHARGES** | | | | | | | | | | | | | |
| Class A Shares | | | | | 12/31/2013 | | | | -4.56 | | | | 1.29 | | | | 1.14 | |
| Class C Shares | | | | | 12/31/2013 | | | | -1.33 | | | | 3.17 | | | | 1.89 | |
| * | Reflects the expense ratio as reported in the Prospectus dated February 26, 2016. |
| ** | The maximum sales charge for Class A shares on purchases and for Class C shares on certain redemptions are 5.00% and 1.00%, respectively. |
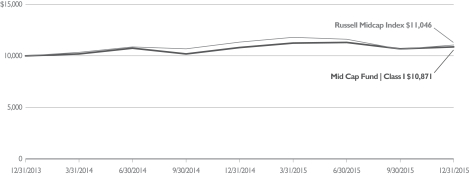
GROWTH OF $10,000
Comparison of the change in value of a $10,000 Investment in the Diamond Hill Mid Cap Fund Class I(A) and the Russell Midcap Index.
| (A) | The growth of $10,000 chart represents the performance of Class I shares only, which will vary from the performance of Class A, Class C and Class Y shares based on the difference in loads and fees paid by shareholders in the different classes. |
| | The performance of the above Fund does not reflect the deduction of taxes that a shareholder would pay on Fund distributions or the redemption of Fund shares. |
| | The chart above represents a comparison of a hypothetical $10,000 investment and the reinvestment of dividends and capital gains in the indicated share class versus a similar investment in the Russell Midcap Index (“Index”). The Index is a market capitalization-weighted index measuring performance of the 800 smallest companies in the Russell 1000 Index. The Index is unmanaged, and does not reflect the deduction of fees associated with a mutual fund such as investment management and accounting fees. The Fund’s performance reflects the deduction of fees for these services. Investors cannot invest directly in an index although they can invest in the underlying securities. |
| | Past performance does not guarantee future results. The performance data quoted represents past performance and current returns may be lower or higher. The investment return and principal value will fluctuate so that an investor’s shares, when redeemed, may be worth more or less than the original cost. To obtain performance information current to the most recent month end, please visit
www.diamond-hill.com. |
| | | | | | | | | | | | | | | | |
| DIAMOND HILL FUNDS | | | | | ANNUAL REPORT | | | | | DECEMBER 31, 2015 | | | | | DIAMOND-HILL.COM | | | 15 | |
Diamond Hill Large Cap Fund
2015 Portfolio Commentary
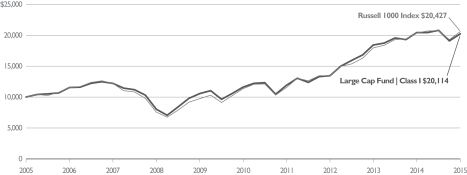
The Diamond Hill Large Cap Fund returned -0.85% (Class I) in 2015 compared to 0.92% for the Russell 1000 Index. This was a particularly difficult year for value investors as the value indexes meaningfully underperformed the broader market. The poor performance of the value sector was in part related to the severe distress in the energy sector. However, there were also stresses in the technology and consumer durables sectors, which impacted the performance of the industries well-represented in the value sectors of the market.
Information technology was the top performing sector for the Fund in 2015; however, the performance was relatively narrow as only a few names drove the sector. Vantiv, Alphabet, Juniper Networks, and Microsoft were all up in excess of 20% for the year. Alphabet was a major contributor to performance, which was somewhat gratifying as the initial position was purchased in 2015. The shares were inexpensively valued as investors were concerned regarding the transfer to mobile search and its impact on Google. However, continued strong revenue and earnings growth alleviated these fears and allowed the stock to appreciate substantially after we purchased the shares. Vantiv, Microsoft and Juniper are long-term holdings of the Fund with attractive valuations. As earnings growth began to improve for these companies, the attractive valuation allowed for meaningful price appreciation. All four of these holdings continue to be held in the portfolio as of December 31, 2015 as they still sell at a comfortable discount to intrinsic value.
Health care was another important contributor to the portfolio in 2015. The health care sector has performed well for several years now as earnings growth in the sector has outpaced earnings growth in the market as a whole. Boston Scientific was the most important contributor as its shares appreciated 39% due to improved revenue growth and the positive impact that had on earnings. The other large gainer in the sector was Baxalta. The shares appreciated as Shire PLC was rumored to be attempting to purchase the company at a premium to the current market price. That bid materialized in 2016 to the benefit of shareholders.
Energy was a controversial sector again in 2015 as declining oil and gas prices pressured the financial performance of the companies in the sector. Fortunately, we took advantage of opportunities to reduce our exposure in 2015, so the underweighting in the sector benefited the relative performance of the portfolio. At year end, only Cimarex and EOG were held in the Diamond Hill Large Cap Fund. Both of these holding declined more than 15%, but the relatively small weighting of the sector in the portfolio limited the damage to the Fund’s performance.
The consumer discretionary sector was the biggest disappointment in the performance of the Fund. Several large holdings were down more than 20% for the year. These included BorgWarner, Twenty-First Century Fox, and Whirlpool Corporation. Disappointing performance in emerging markets is a common theme for Whirlpool and BorgWarner. Slowdown in demand from these markets led to revenue growth and earnings that failed to
| | | | | | | | | | | | | | |
| 16 | | DIAMOND HILL FUNDS | | | | | ANNUAL REPORT | | | | | DECEMBER 31, 2015 | | | | | DIAMOND-HILL.COM |
Diamond Hill Large Cap Fund
meet expectations. However, the shares continue to be held in the portfolio as of December 31, 2015 due to their attractive valuation. The poor performance of Twenty-First Century Fox reflected the disappointment in their domestic broadcasting business. They lost market share in their end markets throughout the year, which led to lower-than-expected earnings growth. The company remains focused on turning around that sector, but the results have not reflected any improvement so far.
Financials represents the largest sector in the portfolio. At year-end, the financials sector represented nearly 27% of the portfolio. These securities are from a variety of industries including banking, insurance, brokerage, and asset management. It is a relatively heterogeneous sector, so there is not a common theme in the performance of the holdings. However, for the year, our holdings slightly trailed the sector performance of the index. Franklin Resources was the worst-performing security as their asset management business lost market share to competitors. Competitive pressures remain intense, but the valuation is attractive and the shares remain in the portfolio. Morgan Stanley was also down more than 15% as profits from their trading operations remain under pressure. This is an industry-wide problem and management is focused on reducing costs and improving profitability.
Several new names were added to the portfolio in 2015 including BorgWarner, Precision Castparts, Baxalta, and Loews Corporation. However, Alphabet was the new name that had the biggest impact on the portfolio in 2015. As always, we judge the performance of an investment over the long term. The fact that the shares are still in the portfolio indicates the stock is at a discount to intrinsic value and we remain optimistic about the prospect of the company and the shares.
2015 was a very difficult environment for value investing; however, we strive to outperform in difficult environments so the performance of the Large Cap Fund was disappointing. I look forward to 2016 and the challenges a new year provides to investors. 2015 was my 13th year managing the Diamond Hill Large Cap Fund and I remain grateful for the opportunity our shareholders provide. Thank you for your continued support.

Chuck Bath, CFA
Portfolio Manager
| | | | | | | | | | | | | | | | |
| DIAMOND HILL FUNDS | | | | | ANNUAL REPORT | | | | | DECEMBER 31, 2015 | | | | | DIAMOND-HILL.COM | | | 17 | |
Diamond Hill Large Cap Fund
AVERAGE ANNUAL TOTAL RETURNS AS OF DECEMBER 31, 2015
| | | | | | | | | | | | | | | | | | | | | | | | |
| | | Inception Date | | | One
Year | | | Three
Years | | | Five
Years | | | Ten
Years | | | Expense
Ratio* | |
| PERFORMANCE AT NAV WITHOUT SALES CHARGES | | | | | | | | | | | | | | | | | |
| Class A Shares | | | 6/29/2001 | | | | -1.10 | % | | | 14.19 | % | | | 11.34 | % | | | 6.89 | % | | | 0.99 | % |
| Class C Shares | | | 9/25/2001 | | | | -1.83 | | | | 13.34 | | | | 10.52 | | | | 6.09 | | | | 1.74 | |
| Class I Shares | | | 1/31/2005 | | | | -0.85 | | | | 14.47 | | | | 11.62 | | | | 7.24 | | | | 0.70 | |
| Class Y Shares | | | 12/30/2011 | | | | -0.74 | | | | 14.64 | | | | 11.71 | | | | 7.07 | | | | 0.60 | |
| BENCHMARK | | | | | | | | | | | | | | | | | | | | | | | | |
| Russell 1000 Index | | | | | | | 0.92 | | | | 15.01 | | | | 12.44 | | | | 7.40 | | | | — | |
| PERFORMANCE AT PUBLIC OFFERING PRICE INCLUDING SALES CHARGES** | | | | | | | | | | | | | | | | | |
| Class A Shares | | | 6/29/2001 | | | | -6.06 | | | | 12.25 | | | | 10.20 | | | | 6.35 | | | | 0.99 | |
| Class C Shares | | | 9/25/2001 | | | | -2.77 | | | | 13.34 | | | | 10.52 | | | | 6.09 | | | | 1.74 | |
| * | Reflects the expense ratio as reported in the Prospectus dated February 26, 2016. |
| ** | The maximum sales charge for Class A shares on purchases and for Class C shares on certain redemptions are 5.00% and 1.00%, respectively. |
GROWTH OF $10,000
Comparison of the change in value of a $10,000 Investment in the Diamond Hill Large Cap Fund Class I(A) and the Russell 1000 Index.
| (A) | The growth of $10,000 chart represents the performance of Class I shares only, which will vary from the performance of Class A, Class C and Class Y shares based on the difference in loads and fees paid by shareholders in the different classes. |
| | The performance of the above Fund does not reflect the deduction of taxes that a shareholder would pay on Fund distributions or the redemption of Fund shares. |
| | The chart above represents a comparison of a hypothetical $10,000 investment and the reinvestment of dividends and capital gains in the indicated share class versus a similar investment in the Russell 1000 Index (“Index”). The Index is a market capitalization-weighted index measuring performance of the largest 1,000 companies, on a market capitalization basis, in the Russell 3000 Index. The Index is unmanaged, and does not reflect the deduction of fees associated with a mutual fund such as investment management and accounting fees. The Fund’s performance reflects the deduction of fees for these services. Investors cannot invest directly in an index although they can invest in the underlying securities. |
| | Historical performance for Class Y shares prior to its inception is based on the performance of Class A shares. Class Y performance has been adjusted to reflect differences in sales charges and expenses between classes. |
| | Past performance does not guarantee future results. The performance data quoted represents past performance and current returns may be lower or higher. The investment return and principal value will fluctuate so that an investor’s shares, when redeemed, may be worth more or less than the original cost. To obtain performance information current to the most recent month end, please visit
www.diamond-hill.com. |
| | | | | | | | | | | | | | |
| 18 | | DIAMOND HILL FUNDS | | | | | ANNUAL REPORT | | | | | DECEMBER 31, 2015 | | | | | DIAMOND-HILL.COM |
Diamond Hill Select Fund
2015 Portfolio Commentary
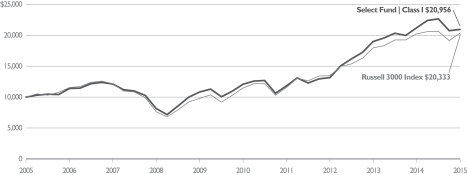
The Diamond Hill Select Fund declined 1.14% (Class I) in 2015 compared to our benchmark, the Russell 3000 Index, which increased 0.48%.
2015 was a tale of two halves for the Select Fund. During the first six months, the Fund outperformed its benchmark by nearly 5%, but then trailed its benchmark by more than 7% during the second half of the year. The first half benefited from a large percentage of holdings outperforming as well as outsized gains on a handful of positions. Nearly 60% of our positions posted returns in excess of the benchmark through June 30, with five holdings increasing by more than 25% and only one small position declining by more than 20%. For the full year, we had our share of winners, with just over 50% of positions meeting or exceeding the benchmark return and five positions increasing by more than 25% (although not the same five as in the first six months). However, this was more than offset by a handful of our highest-conviction holdings suffering significant price declines in the second half of the year. For the full year, five holdings declined in value by greater than 25%, and the average weight of those five positions was more than 50% larger than that of our outsized gainers. These five holdings were accountable for more than 7% of relative underperformance for the year and represent the difference between a good and bad annual result.
We are long-term investors and do not put too much weight on returns in any six month or one-year period. We prefer to measure results over periods of five years and longer. However, patience on the part of Fund shareholders in the face of short-term underperformance requires a clear understanding of the logic behind our decisions as managers, and an expectation that those decisions will increase value over the long term. Thus, some further detail on the largest detractors from performance is in order.
The five holdings that declined by 25% or more during 2015 are Nationstar, Twenty-First Century Fox, Valeant, Colfax, and Franklin Resources. We still held each of these companies in the Select Fund at year-end; in fact, each was a top-ten holding. The drivers of the short-term weakness in these companies’ shares was idiosyncratic, as they have virtually nothing in common. The largest detractors to 2015 performance come from five different industries and have little or no overlap in terms of products sold, customers, competitors, or input costs. While each is exposed in some way to the major macro developments that affected the global economy in 2015, the specific causes of their relative underperformance were unique to each firm.
In the cases of Nationstar and Twenty-First Century Fox, fundamental results — earnings, cash flow, and asset values — were in-line with our expectations and we saw no significant change to our estimates of intrinsic value for these companies. We attribute the share price declines to changing investor sentiment about the industries in which they operate, not a worsening long-term fundamental outlook.
| | | | | | | | | | | | | | | | |
| DIAMOND HILL FUNDS | | | | | ANNUAL REPORT | | | | | DECEMBER 31, 2015 | | | | | DIAMOND-HILL.COM | | | 19 | |
Diamond Hill Select Fund
In the cases of Valeant, Colfax, and Franklin Resources, negative fundamental developments did lead us to lower our estimate of each firm’s intrinsic value during the year. Valeant’s long-term prospects continue to look very promising, but scrutiny over its pricing of certain drugs and the severing of its relationship with a significant distribution partner will certainly lead to weaker-than-expected cash flow for a number of quarters. Franklin Resources witnessed larger-than-expected outflows from its asset management business after disappointing short-term investment performance and exposure to emerging markets and the energy sector heightened investor concerns. Colfax saw demand for its products fall more than we anticipated, as energy markets collapsed and global infrastructure buildout slowed, primarily driven by weakness in China. In each instance, we promptly adjusted our fundamental assumptions as new data emerged and took a more conservative stance in estimating intrinsic value. We did not anticipate the negative developments at these three companies, but in each case, we believe we were able to quantify the impact of changes on the value of the business and the magnitude of those changes were far smaller than the accompanying declines in share price.
Based on our fundamental outlook for their respective businesses, we continue to view the valuations of Nationstar, Twenty-First Century Fox, Valeant, Colfax, and Franklin Resources as very attractive — trading at low multiples of earnings, cash flow, or even liquidation value. All of these companies are expected to produce meaningful free cash flow, and in each case, management anticipates utilizing some or all of the free cash flow to repurchase shares and/or debt at what we believe to be deeply discounted values. The combination of attractive valuation, free cash flow, and prudent capital allocation puts these firms in a strong position to significantly increase value for shareholders going forward.
The Select Fund experienced poor results in 2015, which disappoints us as fiduciaries and as significant shareholders of the Fund ourselves. However, we believe irrational price declines created attractive opportunities to reposition the portfolio in a manner we believe will deliver strong results over the coming years. We appreciate your support and look forward to 2016.
| | |
| |  |
| |
Austin Hawley, CFA Portfolio Manager | | Rick Snowdon, CFA Portfolio Manager |
| | | | | | | | | | | | | | |
| 20 | | DIAMOND HILL FUNDS | | | | | ANNUAL REPORT | | | | | DECEMBER 31, 2015 | | | | | DIAMOND-HILL.COM |
Diamond Hill Select Fund
AVERAGE ANNUAL TOTAL RETURNS AS OF DECEMBER 31, 2015
| | | | | | | | | | | | | | | | | | | | | | | | |
| | | Inception Date | | | One
Year | | | Three
Years | | | Five
Years | | | Ten
Years | | | Expense
Ratio* | |
| PERFORMANCE AT NAV WITHOUT SALES CHARGES | | | | | | | | | | | | | | | | | |
| Class A Shares | | | 12/30/2005 | | | | -1.44 | % | | | 16.47 | % | | | 11.38 | % | | | 7.34 | % | | | 1.19 | % |
| Class C Shares | | | 12/30/2005 | | | | -2.21 | | | | 15.62 | | | | 10.55 | | | | 6.56 | | | | 1.94 | |
| Class I Shares | | | 12/30/2005 | | | | -1.14 | | | | 16.77 | | | | 11.66 | | | | 7.68 | | | | 0.90 | |
| Class Y Shares | | | 12/30/2011 | | | | -1.06 | | | | 16.96 | | | | 11.74 | | | | 7.51 | | | | 0.80 | |
| BENCHMARK | | | | | | | | | | | | | | | | | | | | | | | | |
| Russell 3000 Index | | | | | | | 0.48 | | | | 14.74 | | | | 12.18 | | | | 7.35 | | | | — | |
| PERFORMANCE AT PUBLIC OFFERING PRICE INCLUDING SALES CHARGES** | | | | | | | | | | | | | | | | | |
| Class A Shares | | | 12/30/2005 | | | | -6.36 | | | | 14.50 | | | | 10.23 | | | | 6.79 | | | | 1.19 | |
| Class C Shares | | | 12/30/2005 | | | | -3.16 | | | | 15.62 | | | | 10.55 | | | | 6.56 | | | | 1.94 | |
| * | Reflects the expense ratio as reported in the Prospectus dated February 26, 2016. |
| ** | The maximum sales charge for Class A shares on purchases and for Class C shares on certain redemptions are 5.00% and 1.00%, respectively. |
GROWTH OF $10,000
Comparison of the change in value of a $10,000 Investment in the Diamond Hill Select Fund Class I(A) and the Russell 3000 Index.
| (A) | The growth of $10,000 chart represents the performance of Class I shares only, which will vary from the performance of Class A, Class C and Class Y shares based on the difference in loads and fees paid by shareholders in the different classes. |
| | The performance of the above Fund does not reflect the deduction of taxes that a shareholder would pay on Fund distributions or the redemption of Fund shares. |
| | The chart above represents a comparison of a hypothetical $10,000 investment and the reinvestment of dividends and capital gains in the indicated share class versus a similar investment in the Russell 3000 Index (“Index”). The Index is a widely recognized market capitalization-weighted index measuring the performance of the 3,000 largest U.S. companies based on total market capitalization. The Index is unmanaged, and does not reflect the deduction of fees associated with a mutual fund such as investment management and accounting fees. The Fund’s performance reflects the deduction of fees for these services. Investors cannot invest directly in an index although they can invest in the underlying securities. |
| | Historical performance for Class Y shares prior to its inception is based on the performance of Class A shares. Class Y performance has been adjusted to reflect differences in sales charges and expenses between classes. |
| | Past performance does not guarantee future results. The performance data quoted represents past performance and current returns may be lower or higher. The investment return and principal value will fluctuate so that an investor’s shares, when redeemed, may be worth more or less than the original cost. To obtain performance information current to the most recent month end, please visit
www.diamond-hill.com. |
| | | | | | | | | | | | | | | | |
| DIAMOND HILL FUNDS | | | | | ANNUAL REPORT | | | | | DECEMBER 31, 2015 | | | | | DIAMOND-HILL.COM | | | 21 | |
Diamond Hill Long-Short Fund
2015 Portfolio Commentary
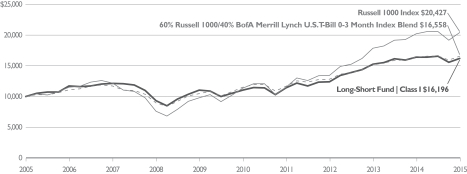
The Diamond Hill Long-Short Fund returned -1.40% (Class I) in 2015 compared to 0.92% for the long-only Russell 1000 Index and a 0.75% return for the blended benchmark (60% Russell 1000 Index/40% BofA Merrill Lynch U.S. T-Bill 0-3 Month Index). While the portfolio lagged the long-only Russell 1000 Index, we were more disappointed that the Fund slightly lagged the blended benchmark, which takes into account the portfolio’s general 60% net long bias. As we have communicated in the past, we strive to outperform the blended benchmark in all market environments. During 2015, the Fund lagged as both sides of the portfolio modestly underperformed. The short portfolio was up a bit more than the benchmark, largely as a result of several positions being acquired at meaningful premiums. The long side lagged slightly as many of the more cyclically-sensitive holdings came under significant pressure during the second half of the year.
During 2015, the bias for the portfolio was to remain roughly in-line with our blended benchmark, maintaining net long exposure between 57% and 63% during most of the year. At year-end, the net long exposure was again very close to 61%.
The information technology and health care sectors provided the biggest positive contribution to return in the long portfolio. Within the tech sector, Alphabet, Vantiv, Juniper Networks, and Microsoft were all very strong performers during the period as the market searched for companies with relatively strong revenue growth outlooks. Med tech provider Boston Scientific was also a meaningful contributor, as were Pfizer, Medtronic, and Baxalta to a smaller extent. Lastly, the consumer staples sector was a modest positive on the long side of the portfolio as Kimberly-Clark once again performed well despite strong currency headwinds.
The biggest disappointments in the long portfolio were in the industrials and financials sectors. Within the former, Parker-Hannifin, Colfax, and United Technologies were meaningful detractors as the market began to fear very weak energy and mining end markets as well as the overall sluggishness in the global manufacturing economy. Meanwhile, financials suffered in back half of the year as the modest rate of global economic growth translated into softening inflation expectations, a delay in the outlook for a more normalized level of interest rates, and increased credit cost concerns. This backdrop weighed most heavily on our positions in the banking and life insurance industries.
Additionally, energy was again a drag on performance during 2015 as key holdings Devon Energy, EOG Resources, and Cimarex were all down during the year. However, due to relatively modest levels of exposure, this drag on performance was smaller than the performance impact of the energy sector in the overall market. We eliminated Occidental Petroleum during the first half of year and meaningfully reduced exposure to long-time holding Devon Energy during the second half of the year.
| | | | | | | | | | | | | | |
| 22 | | DIAMOND HILL FUNDS | | | | | ANNUAL REPORT | | | | | DECEMBER 31, 2015 | | | | | DIAMOND-HILL.COM |
Diamond Hill Long-Short Fund
The short portfolio detracted slightly from performance in 2015 as five of our short positions were acquired during the period. Advent Software, Lifetime Fitness, Hospira, Cablevision and Plum Creek Timber all announced plans to be purchased by other organizations at various levels of premium. Additionally, our financials sector shorts detracted from performance as we tended to be positioned in areas that were generally viewed as somewhat defensive relative to both our long holdings and the benchmark. Positively, we did have a number of short positions that provided strong returns to the Fund, led by Macy’s, which has been in the portfolio for a number of years and clearly began to experience the fundamental headwinds we have been forecasting. Other shorts providing positive contributions included Kohl’s, Best Buy, Cabela’s, International Paper, and regional auto insurer Mercury General Corp.
Finally, we continue to believe the five-year outlook for domestic equities includes total returns at the low end of historical ranges, and as always, we are focused on long time horizons and buying good (or better) businesses at average (or better) prices. Our exposures and net positioning will, at any given point in time, be dictated by the sum of the individual opportunities we are finding in the market. We introduced shorting to this Fund more than a decade ago to provide clients with a long/short strategy to meet the needs of their investment portfolios. We have been gratified by the growing acceptance of long/short strategies in general and the Diamond Hill Long-Short Fund in particular. We are grateful for your continued support and appreciate the opportunity to continue to earn your trust in 2016.
| | |

| |  |
| |
Ric Dillon, CFA Portfolio Manager | | Chris Bingaman, CFA Portfolio Manager |
| | | | | | | | | | | | | | | | |
| DIAMOND HILL FUNDS | | | | | ANNUAL REPORT | | | | | DECEMBER 31, 2015 | | | | | DIAMOND-HILL.COM | | | 23 | |
Diamond Hill Long-Short Fund
AVERAGE ANNUAL TOTAL RETURNS AS OF DECEMBER 31, 2015
| | | | | | | | | | | | | | | | | | | | | | | | |
| | | Inception Date | | | One
Year | | | Three
Years | | | Five
Years | | | Ten
Years | | | Expense
Ratio* | |
| PERFORMANCE AT NAV WITHOUT SALES CHARGES | | | | | | | | | | | | | | | | | | | | | |
| Class A Shares | | | 6/30/2000 | | | | -1.67 | % | | | 9.03 | % | | | 7.69 | % | | | 4.60 | % | | | 1.91 | % |
| Class C Shares | | | 2/13/2001 | | | | -2.40 | | | | 8.21 | | | | 6.89 | | | | 3.81 | | | | 2.66 | |
| Class I Shares | | | 1/31/2005 | | | | -1.40 | | | | 9.32 | | | | 7.98 | | | | 4.94 | | | | 1.62 | |
| Class Y Shares | | | 12/30/2011 | | | | -1.27 | | | | 9.47 | | | | 8.04 | | | | 4.77 | | | | 1.52 | |
| BENCHMARK | | | | | | | | | | | | | | | | | | | | | |
| Russell 1000 Index | | | | | | | 0.92 | | | | 15.01 | | | | 12.44 | | | | 7.40 | | | | — | |
60% Russell 1000 Index/40% BofA Merrill Lynch U.S. T-Bill 0-3 Mo. Index | | | | | | | 0.75 | | | | 8.93 | | | | 7.50 | | | | 5.17 | | | | — | |
| PERFORMANCE AT PUBLIC OFFERING PRICE INCLUDING SALES CHARGES** | | | | | | | | | | | | | | | | | | | | | |
| Class A Shares | | | 6/30/2000 | | | | -6.60 | | | | 7.17 | | | | 6.58 | | | | 4.06 | | | | 1.91 | |
| Class C Shares | | | 2/13/2001 | | | | -3.38 | | | | 8.21 | | | | 6.89 | | | | 3.81 | | | | 2.66 | |
| * | Reflects the expense ratio as reported in the Prospectus dated February 26, 2016. |
| ** | The maximum sales charge for Class A shares on purchases and for Class C shares on certain redemptions are 5.00% and 1.00%, respectively. |
GROWTH OF $10,000
Comparison of the change in value of a $10,000 Investment in the Diamond Hill Long-Short Fund Class I(A), the Russell 1000 Index and the Blended Index (60% Russell 1000 Index and 40% BofA Merrill Lynch U.S. T-Bill 0-3 Month Index)
| (A) | The growth of $10,000 chart represents the performance of Class I shares only, which will vary from the performance of Class A, Class C and Class Y shares based on the difference in loads and fees paid by shareholders in the different classes. |
| | The performance of the above Fund does not reflect the deduction of taxes that a shareholder would pay on Fund distributions or the redemption of Fund shares. |
| | The chart above represents a comparison of a hypothetical $10,000 investment and the reinvestment of dividends and capital gains in the indicated share class versus a similar investment in the Russell 1000 Index and the blended index. The Russell 1000 Index is a market capitalization-weighted index measuring performance of the largest 1,000 companies on a market capitalization basis, in the Russell 3000 Index. The blended index represents a 60% weighting of the Russell 1000 Index as described above and a 40% weighting of the BofA Merrill Lynch U.S. T-Bill 0-3 Month Index. The BofA Merrill Lynch U.S. T-Bill 0-3 Month Index tracks the performance of U.S. dollar denominated U.S. Treasury Bills publicly issued in the U.S. domestic market with a remaining term to final maturity of less than 3 months. Both indices are unmanaged, and do not reflect the deduction of fees associated with a mutual fund such as investment management and accounting fees. The Fund’s performance reflects the deduction of fees for these services. Investors cannot invest directly in an index although they can invest in the underlying securities. |
| | Historical performance for Class Y shares prior to its inception is based on the performance of Class A shares. Class Y performance has been adjusted to reflect differences in sales charges and expenses between classes. |
| | Past performance does not guarantee future results. The performance data quoted represents past performance and current returns may be lower or higher. The investment return and principal value will fluctuate so that an investor’s shares, when redeemed, may be worth more or less than the original cost. To obtain performance information current to the most recent month end, please visit
www.diamond-hill.com. |
| | | | | | | | | | | | | | |
| 24 | | DIAMOND HILL FUNDS | | | | | ANNUAL REPORT | | | | | DECEMBER 31, 2015 | | | | | DIAMOND-HILL.COM |
Diamond Hill Research Opportunities Fund
2015 Portfolio Commentary
The Diamond Hill Research Opportunities Fund declined 5.00% (Class I) during 2015 compared to a 0.48% increase in the long-only Russell 3000 Index. At Diamond Hill, we have a long-term investment horizon and therefore evaluate our performance over rolling five-year periods. At the end of 2015, our five-year annualized return was 9.06% versus 12.18% for the Russell 3000 Index. While the absolute returns of the fund were adequate, we are disappointed with our relative results. In addition to negative contributions from the short portfolio, our willingness to take more concentrated positions was a drag on performance as some of our largest weights underperformed. We continue to believe our disciplined approach to capital allocation will deliver satisfactory absolute and relative results over most rolling five-year periods.
During 2015, the long portfolio detracted from Fund’s return with an average long exposure of 96%, while the positions in the short portfolio detracted modestly with average short exposure of (17)%. The largest positive contributors to performance were long investments in Post Holdings, Boston Scientific, and Juniper Networks.
Post Holdings delivered solid results and provided guidance ahead of street estimates. Post’s acquisition of MOM Brands, a value-focused cereal manufacturer, alleviated concerns about their acquisition-driven growth strategy. The company also positively surprised the market by managing the Avian Flu situation well and limiting its impact on their bottom line.
Boston Scientific continued on its recovery path in 2015, showing good strategic vision and excellent commercial execution. Under the leadership of CEO Mike Mahoney, the company has improved core organic growth from low single digits to 5% on the back of new product introductions. The company still has potential to improve on its margin structure in the coming years, with a 30% EBIT margin target offering 500 basis points of upside. Investors are also recognizing the potential for Synergy, the next-generation cardiovascular stent, to allow the company to gain share in its most profitable business line. These aspects provide a good backdrop for the fundamental outlook in 2016 and beyond.
Following a disappointing end to 2014, Juniper delivered steady improvements in its earnings results throughout 2015. These improvements were a result of increased demand for the firm’s products, tighter expense controls, and a reduction in share count. Juniper’s shares reacted favorably to the firm’s improving financial performance, and we exited our position during the second quarter.
Long positions in Twenty-First Century Fox, Whirlpool, BioScrip, and Nationstar Mortgage Holdings were the largest detractors from performance during 2015.
Twenty-First Century Fox underperformed due to continued weakness in its broadcast network, where it has had ratings challenges, and adverse currency movements in its international segments. As a result, the company revised down the EBITDA outlook for 2016
| | | | | | | | | | | | | | | | |
| DIAMOND HILL FUNDS | | | | | ANNUAL REPORT | | | | | DECEMBER 31, 2015 | | | | | DIAMOND-HILL.COM | | | 25 | |
Diamond Hill Research Opportunities Fund
that it had laid out previously. Post Disney’s announcement of subscriber loss at ESPN, the entire media sector has underperformed meaningfully as the market grew concerned about TV subscribers “cutting the cord,” which impacts the affiliate fee revenues of media companies including FOX. We continue to believe that the broadcast ratings concerns are transitory in nature and the company will be able to overcome them with better content.
Economic weakness in Brazil, foreign exchange challenges, and a heightened competitive environment domestically all challenged Whirlpool in 2015. The strength of the U.S. dollar not only eroded the value of international revenues, it also increased the attractiveness for foreign competitors to discount domestic units in attempt to gain share. Whirlpool has diligently worked to expand their domestic margins, but were not immune to this competitive dynamic and have chosen to pivot from their previous strategy in an attempt to defend market share and drive volumes. 2016 will be a telling year of their ability to walk the proverbial tightrope of margin and volume.
BioScrip is the largest pure-play home infusion provider, a market growing in the high single digits due to the cost savings it offers versus hospital-based treatments. The shares sold off following integration issues with acquired pharmacies and liquidity concerns. The company has improved its liquidity by selling its pharmacy benefit manager and has guided to being operating cash flow positive for 2016. Activist investors have also replaced a large percentage of the board and management. After reviewing the company’s turnaround plan and speaking with management, we remain confident that the equity is substantially undervalued using conservative assumptions.
Shares in Nationstar Mortgage Holdings declined meaningfully in 2015. The company reported a poor fundamental first quarter and investors grew increasingly frustrated with their one step forward, two steps back performance. The company also had talked up potentially receiving a minority investment in their Xome platform in 2015 at a very attractive valuation, only to have its CEO resign unexpectedly in early November. The profitability in their core servicing business improved throughout the year and management is focused on continued profitability improvement in 2016. In mid-December, the board of directors approved a $150 million buyback which, if executed, would represent more than 12% of the shares outstanding.
As of December 31, 2015, the Fund held 52 long and 25 short positions with the top ten positions representing 40.5% of net assets.
We want to thank shareholders for their support, and we look forward to working with you in the years ahead.
Diamond Hill Research Analysts
| | | | | | | | | | | | | | |
| 26 | | DIAMOND HILL FUNDS | | | | | ANNUAL REPORT | | | | | DECEMBER 31, 2015 | | | | | DIAMOND-HILL.COM |
Diamond Hill Research Opportunities Fund
AVERAGE ANNUAL TOTAL RETURNS AS OF DECEMBER 31, 2015
| | | | | | | | | | | | | | | | | | | | | | | | |
| | | Inception Date | | | One Year | | | Three
Years | | | Five
Years | | | Since
Inception* | | | Expense
Ratio** | |
| PERFORMANCE AT NAV WITHOUT SALES CHARGES | | | | | | | | | | | | | | | | | | | | | |
| Class A Shares | | | 12/30/2011 | | | | -5.29 | % | | | 10.29 | % | | | 8.77 | % | | | 13.75 | % | | | 1.83 | % |
| Class C Shares | | | 12/30/2011 | | | | -5.96 | | | | 9.49 | | | | 7.97 | | | | 12.91 | | | | 2.58 | |
| Class I Shares | | | 12/30/2011 | | | | -5.00 | | | | 10.58 | | | | 9.06 | | | | 14.05 | | | | 1.54 | |
| Class Y Shares | | | 12/30/2011 | | | | -4.91 | | | | 10.73 | | | | 9.21 | | | | 14.21 | | | | 1.44 | |
| BENCHMARK | | | | | | | | | | | | | | | | | | | | | | | | |
| Russell 3000 Index | | | | | | | 0.48 | | | | 14.74 | | | | 12.18 | | | | 17.61 | | | | — | |
| PERFORMANCE AT PUBLIC OFFERING PRICE INCLUDING SALES CHARGES*** | | | | | | | | | | | | | | | | | | | | | |
| Class A Shares | | | 12/30/2011 | | | | -10.05 | | | | 8.41 | | | | 7.65 | | | | 12.88 | | | | 1.83 | |
| Class C Shares | | | 12/30/2011 | | | | -6.83 | | | | 9.49 | | | | 7.97 | | | | 12.91 | | | | 2.58 | |
| ** | Reflects the expense ratio as reported in the Prospectus dated February 26, 2016. |
| *** | The maximum sales charge for Class A shares on purchases and for Class C shares on certain redemptions are 5.00% and 1.00%, respectively. |
GROWTH OF $10,000
Comparison of the change in value of a $10,000 Investment in the Diamond Hill Research Opportunities Fund Class I(A) and the Russell 3000 Index.
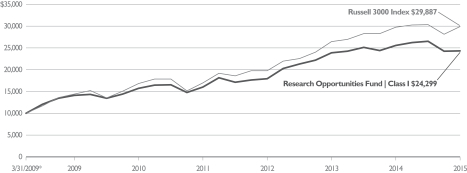
| (A) | The growth of $10,000 chart represents the performance of Class I shares only, which will vary from the performance of Class A, Class C and Class Y shares based on the difference in loads and fees paid by shareholders in the different classes. |
| | The performance of the above Fund does not reflect the deduction of taxes that a shareholder would pay on Fund distributions or the redemption of Fund shares. |
| | The chart above represents a comparison of a hypothetical $10,000 investment and the reinvestment of dividends and capital gains in the indicated share class versus a similar investment in the Russell 3000 Index (“Index”). The Index is a widely recognized market capitalization-weighted index measuring the performance of the 3,000 largest U.S. companies based on total market capitalization. The Index is unmanaged, and does not reflect the deduction of fees associated with a mutual fund such as investment management and accounting fees. The Fund’s performance reflects the deduction of fees for these services. Investors cannot invest directly in an index although they can invest in the underlying securities. |
| * | The quoted performance for the Fund reflects the past performance of Diamond Hill Research Partners, L. P. (the “Research Partnership”), a private fund managed with full investment authority by the Fund’s Adviser for periods prior to the fund’s inception date. The Fund is managed in all material respects in a manner equivalent to the management of the predecessor unregistered fund. The Fund’s objectives, policies, guidelines and restrictions are in all material respects equivalent to the predecessor, and the Fund was created for reasons entirely unrelated to the establishment of a performance record. The assets of the Research Partnership were converted into assets of the Fund prior to commencement of operation of the Fund. The Fund’s inception date is December 30, 2011. The performance of the Research Partnership has been restated to reflect the net expenses and maximum applicable sales charge of the Fund for its initial years of investment operations. The Research Partnership was not registered under the Investment Company Act of 1940 and therefore was not subject to certain investment restrictions imposed by the 1940 Act. If the Research Partnership had been registered under the 1940 Act, its performance may have been adversely affected. Performance is measured from March 31, 2009, the inception of the Research Partnership and is not the performance of the Fund for the period prior to December 30, 2011. The Research Partnership’s past performance is not necessarily an indication of how the Fund will perform in the future either before or after taxes. |
| | Past performance does not guarantee future results. The performance data quoted represents past performance and current returns may be lower or higher. The investment return and principal value will fluctuate so that an investor’s shares, when redeemed, may be worth more or less than the original cost. To obtain performance information current to the most recent month end, please visit
www.diamond-hill.com. |
| | | | | | | | | | | | | | | | |
| DIAMOND HILL FUNDS | | | | | ANNUAL REPORT | | | | | DECEMBER 31, 2015 | | | | | DIAMOND-HILL.COM | | | 27 | |
Diamond Hill Financial Long-Short Fund
2015 Portfolio Commentary
The U.S. equity markets were essentially flat in 2015, and financial services companies underperformed the broader market. The Diamond Hill Financial Long-Short Fund trailed both the overall index and sector benchmark returns, generating a return of -4.40% (Class I), primarily driven by poor returns from a select group of our larger holdings.
The Russell 3000 Financials Index, the Fund’s primary benchmark, returned 0.68% in 2015. For the trailing five-year period, the Fund generated an annualized return of 9.42% annually versus 11.48% for the benchmark.
The Fund’s underperformance in 2015 can be completely attributed to five of our larger holdings: iStar, Popular, Franklin Resources, Fortress Investment Group, and Nationstar Mortgage Holdings. In each case, we believe the stock price declines reflect more of a change in investor sentiment than a decline in company fundamentals or our estimates of intrinsic value.
iStar, a commercial mortgage REIT, has been a core holding in the Fund for several years. The company has been executing a multi-year repositioning and its balance sheet is the healthiest it’s been since prior to the financial crisis. Management is repurchasing debt at significant discounts to par during the crisis, accessing the capital markets at opportune times, and buying back stock at attractive valuations. We support these actions and believe the stock continues to trade at a meaningful discount to our estimate of net asset value.
Popular, the largest bank in Puerto Rico, has also been in the Fund for several years and was a top positive contributor in 2014. Sentiment shifted in 2015 as the fiscal situation in Puerto Rico grabbed headlines. Though Popular’s direct exposure to the government is immaterial, the constant drumbeat of negative press created a significant headwind. The return of meaningful economic growth to Puerto Rico has never been central to our thesis for Popular. They have the dominant position in the market, an attractive valuation, and an enormous excess capital position that we believe will be returned to shareholders eventually. We see significant value in their shares as steps are taken to resolve the fiscal situation of the Commonwealth.
Franklin Resources is one of the largest asset management firms in the world, with strong franchises across asset classes and a robust distribution network. While long-term performance numbers remain strong, they have suffered short-term setbacks, particularly in their large global bond complex, leading to outflows. Management has run the business very conservatively and currently has over $9 billion in cash on the balance sheet. While much of this is overseas cash, management has indicated a more constructive stance by stepping up their share buybacks. We like to buy shares of good franchises at single digit multiples, especially in industries like asset management that have high returns on capital.
Fortress Investment Group suffered both from company-specific negative sentiment as well as that directed toward alternative asset managers in general based on fears of dwindling incentive fees and capital markets disruption. Specific to Fortress, there was widespread media coverage of the poor performance and eventual closing of their Macro hedge fund. Despite representing less than 2.5% of their $74 billion in assets, it was often referenced as their “flagship” fund. As part of the wind-down of the Macro fund, the company repurchased more than 12% of the shares outstanding from the retiring principal. After accounting for the
| | | | | | | | | | | | | | |
| 28 | | DIAMOND HILL FUNDS | | | | | ANNUAL REPORT | | | | | DECEMBER 31, 2015 | | | | | DIAMOND-HILL.COM |
Diamond Hill Financial Long-Short Fund
imbedded value of the cash and investments on their balance sheet, the shares are currently trading at less than 5x distributable earnings from management fees, ignoring any future incentive fees and/or value creation from their more than $8 billion in dry powder.
Lastly, Nationstar Mortgage Holdings, the largest non-bank mortgage servicer, was our most challenging position. The sell-off began after a poor fundamental first quarter. Management is now laser focused on execution and improving the profitability of their core servicing operation. Also, in late November, the CEO of their Xome subsidiary resigned unexpectedly, which was viewed as a setback. We believe the continued decline late in 2015 was also fueled by tax loss selling that was exacerbated by a limited float due to Fortress owning 60% of the shares. Management and the board responded with a $150 million share buyback program in December, which could repurchase more than 12% of the shares outstanding at prices we view as very attractive. We have continued to add to our position and believe the shares are trading well below liquidation value.
Results elsewhere in the portfolio were quite positive. For example, payment processor Vantiv continued to produce strong fundamental results throughout the year and was our largest positive contributor. After a tough proxy contest, Willis Group was able to complete the merger with Towers Watson, which we believe will create meaningful value for shareholders. Additionally, First Republic bank provided significant positive returns to the Fund as the fundamentals of their niche franchise serving urban/coastal/wealthy clients continues to outperform peers.
On the short side, we maintained modest exposure, and our stock selection was mixed in 2015. As a result, the short portfolio ended up being only a very small detractor from the portfolio’s overall return. As a reminder, we continue to believe shareholders in the Fund will benefit from a relatively concentrated portfolio as well as the ability to utilize short selling. We intend to use our short positions as a way to enhance the performance of the Fund over time, not simply as a “hedge” to mitigate our long exposure or volatility. Our short exposure will typically be much smaller than our long exposure, and therefore, we will have fewer and generally smaller positions.
After U.S. equity markets muddled along in 2015, the sell-off late in the year and early in 2016 improved the prospects of future returns and we continue to believe the financials sector is likely to perform well relative to other sectors of the market. The primary industries within the sector are positioned for reasonable growth, which should drive modestly rising earnings and increased return of excess capital to shareholders.
We would like to thank our shareholders for your continued support of the Fund.
| | | | |
| | | |  |
| | |
Chris Bingaman, CFA Portfolio Manager | | Austin Hawley, CFA Portfolio Manager | | John Loesch, CFA Portfolio Manager |
| | | | | | | | | | | | | | | | |
| DIAMOND HILL FUNDS | | | | | ANNUAL REPORT | | | | | DECEMBER 31, 2015 | | | | | DIAMOND-HILL.COM | | | 29 | |
Diamond Hill Financial Long-Short Fund
AVERAGE ANNUAL TOTAL RETURNS AS OF DECEMBER 31, 2015
| | | | | | | | | | | | | | | | | | | | | | | | |
| | | Inception Date | | | One
Year | | | Three
Years | | | Five
Years | | | Ten
Years | | | Expense
Ratio* | |
| PERFORMANCE AT NAV WITHOUT SALES CHARGES | | | | | | | | | | | | | | | | | | | | | |
| Class A Shares | | | 8/1/1997 | | | | -4.67 | % | | | 12.19 | % | | | 9.14 | % | | | 1.82 | % | | | 1.85 | % |
| Class C Shares | | | 6/3/1999 | | | | -5.37 | | | | 11.37 | | | | 8.33 | | | | 1.04 | | | | 2.60 | |
| Class I Shares | | | 12/31/2006 | | | | -4.40 | | | | 12.49 | | | | 9.42 | | | | 2.13 | | | | 1.56 | |
| BENCHMARK | | | | | | | | | | | | | | | | | | | | | |
| Russell 3000 Financials Index | | | | | | | 0.68 | | | | 15.58 | | | | 11.48 | | | | 1.53 | | | | — | |
| PERFORMANCE AT PUBLIC OFFERING PRICE INCLUDING SALES CHARGES** | | | | | | | | | | | | | | | | | | | | | |
| Class A Shares | | | 8/1/1997 | | | | -9.43 | | | | 10.28 | | | | 8.02 | | | | 1.30 | | | | 1.85 | |
| Class C Shares | | | 6/3/1999 | | | | -6.31 | | | | 11.37 | | | | 8.33 | | | | 1.04 | | | | 2.60 | |
| * | Reflects the expense ratio as reported in the Prospectus dated February 26, 2016. |
| ** | The maximum sales charge for Class A shares on purchases and for Class C shares on certain redemptions are 5.00% and 1.00%, respectively. |
GROWTH OF $10,000
Comparison of the change in value of a $10,000 Investment in the Diamond Hill Financial Long-Short Fund Class I(A) and Russell 3000 Financials Index.
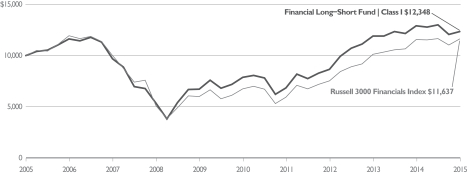
| (A) | The growth of $10,000 chart represents the performance of Class I shares only, which will vary from the performance of Class A and Class C shares based on the difference in loads and fees paid by shareholders in the different classes. |
| | The performance of the above Fund does not reflect the deduction of taxes that a shareholder would pay on Fund distributions or the redemption of Fund shares. |
| | The chart above represents a comparison of a hypothetical $10,000 investment and the reinvestment of dividends and capital gains in the indicated share class versus a similar investment in the Russell 3000 Financials Index (“Index”). The Index consists of Russell 3000 companies involved in banking, mortgage finance, consumer finance, specialized finance, investment banking and brokerage, asset management and custody, corporate lending, insurance, financial investments and real estate, including REITS. The Index measures the performance of the largest 3,000 U.S. companies representing approximately 98% of the investable U.S. equity market. The Index is unmanaged, and does not reflect the deduction of fees associated with a mutual fund such as investment management and accounting fees. The Fund’s performance reflects the deduction of fees for these services. Investors cannot invest directly in an index although they can invest in the underlying securities. |
| | Historical performance for Class I shares prior to its inception is based on the performance of Class A shares. Class I performance has been adjusted to reflect differences in sales charges and expenses between classes. |
| | Past performance does not guarantee future results. The performance data quoted represents past performance and current returns may be lower or higher. The investment return and principal value will fluctuate so that an investor’s shares, when redeemed, may be worth more or less than the original cost. To obtain performance information current to the most recent month end, please visit
www.diamond-hill.com. |
| | | | | | | | | | | | | | |
| 30 | | DIAMOND HILL FUNDS | | | | | ANNUAL REPORT | | | | | DECEMBER 31, 2015 | | | | | DIAMOND-HILL.COM |
Diamond Hill Strategic Income Fund
2015 Portfolio Commentary
The Diamond Hill Strategic Income Fund generated a 1.49% return (Class I) in 2015 compared to a negative 1.37% return for the Bank of America Merrill Lynch U.S. Corporate & High Yield Index. For the trailing five years, the Fund generated an annualized return of 4.87% compared to 4.61% for the benchmark.
The high yield portion of the U.S. corporate bond market, as represented by the Bank of America Merrill Lynch U.S. High Yield Index, has been down for five of the last six quarters. Since June 30, 2014, the High Yield Index generated a negative 7.47% return. We are pleased that the Fund was able to generate a positive return of 1.04% for those same six quarters.
A litany of interrelated factors — diverging monetary policy, strong dollar, weak China and Brazil, cratering commodity prices, concerns about access to capital for the most highly leveraged companies — has pressured the high yield market since the middle of 2014. There has also been consternation about illiquidity in the bond market for several years. These issues came to a head in December 2015 when a distressed debt mutual fund, masquerading as a high yield credit mutual fund, put up a gate preventing shareholders from redeeming under normal procedures.
An important part of the Strategic Income Fund’s strategy is to provide liquidity to an illiquid market when the compensation for doing so is attractive. Thus, we want to be in a strong position to buy corporate bonds when others are forced sellers. We also want to hold up well in difficult markets and generate good risk-adjusted returns over complete market cycles. The following are the questions that we would ask when evaluating the liquidity risk of a high yield mutual fund:
First, how does the volatility of the fund compare to its peer group? While our Fund is unique and not a pure high yield fund, it has been categorized as a high yield fund. The volatility of the Fund has been substantially lower than that of the average fund in the high yield category.
Second, how does the yield compare to a high yield benchmark index? The Fund’s yield-to-worst was just below 7% at year-end, compared to 8.76% for the High Yield Index.
Third, what is the average dollar price of the bonds in the fund compared to the index? The Strategic Income Fund’s average dollar price was 96 at year-end, compared to 89 for the High Yield Index. An average dollar price much lower than the index may indicate higher credit risk and lower liquidity.
Fourth, what percentage of the fund is in non-rated bonds or bonds rated CCC and below compared to the index? What is the weighted-average yield-to-worst of that portion of the fund compared to the index? Less than 8% of the Strategic Income Fund’s holdings were in this category at year-end, compared to about 11% for the High Yield Index. The yield-to-worst of the Fund’s holdings in this category is a little over 13% compared to almost 18% for the High Yield Index. The Fund typically does not invest more than 10% in securities rated at or below Caa1 by Moody’s, CCC+ by Standard & Poor’s, and CCC+ by Fitch at the time of purchase.
| | | | | | | | | | | | | | | | |
| DIAMOND HILL FUNDS | | | | | ANNUAL REPORT | | | | | DECEMBER 31, 2015 | | | | | DIAMOND-HILL.COM | | | 31 | |
Diamond Hill Strategic Income Fund
Fifth, what percentage of each bond does the fund hold? Being prudent with capacity is especially important in the high yield bond market, yet the market is dominated by huge players. Currently, our Fund does not own more than 5% of any bond. When estimating how large our high yield bond strategies could get before closing, we are comfortable owning 5% of any bond but generally want to stay under 10%.
Sixth, what percentage of the strategy is in securities that are classified as illiquid in the fund’s financial statements? Less than one-half of one percent of the Strategic Income Fund’s portfolio is classified as illiquid.
Seventh, how have the managers of the fund performed during difficult markets? The yield-to-worst of our Fund ended the year at 6.76%. This compares to a yield-to-worst of 3.18% on June 30, 2014. Over that 18-month period, the Fund’s yield-to-worst increased 358 basis points while generating a positive total return of 1.04%. By way of comparison, the yield-to-worst of the High Yield Index was 5.01% on June 30, 2014 and 8.76% at the end of 2015. Over the same period of time, the yield-to-worst of the High Yield Index increased 375 basis points, but the index suffered a negative total return of 7.47%.
We believe that our unique and durable competitive advantages include: we don’t manage against a benchmark; we have a deep and talented Diamond Hill research team; we have the flexibility to be nimble in the secondary market and selective in the new issue market; the Fund is concentrated in our best ideas; and we have patient shareholders who share our long-term time horizon. These advantages have allowed us to hold up over the last 18 months and positioned us well to achieve our absolute return goals: 1) inflation plus 3%; and 2) 7% nominal — each measured over rolling five-year periods. Our goal is to achieve these objectives while minimizing the risk of downside volatility over longer time periods.
Thank you for your continued support.
| | |

| |  |
| |
Bill Zox, CFA Portfolio Manager | | John McClain Portfolio Manager |
| | | | | | | | | | | | | | |
| 32 | | DIAMOND HILL FUNDS | | | | | ANNUAL REPORT | | | | | DECEMBER 31, 2015 | | | | | DIAMOND-HILL.COM |
Diamond Hill Strategic Income Fund
AVERAGE ANNUAL TOTAL RETURNS AS OF DECEMBER 31, 2015
| | | | | | | | | | | | | | | | | | | | | | | | |
| | | Inception Date | | | One
Year | | | Three
Years | | | Five
Years | | | Ten
Years | | | Expense
Ratio* | |
| PERFORMANCE AT NAV WITHOUT SALES CHARGES | | | | | | | | | | | | | | | | | |
| Class A Shares | | | 9/30/2002 | | | | 1.19 | % | | | 2.79 | % | | | 4.59 | % | | | 5.31 | % | | | 0.94 | % |
| Class C Shares | | | 9/30/2002 | | | | 0.44 | | | | 2.01 | | | | 3.82 | | | | 4.53 | | | | 1.69 | |
| Class I Shares | | | 1/31/2005 | | | | 1.49 | | | | 3.05 | | | | 4.87 | | | | 5.66 | | | | 0.65 | |
| Class Y Shares | | | 12/30/2011 | | | | 1.60 | | | | 3.22 | | | | 4.92 | | | | 5.47 | | | | 0.55 | |
| BENCHMARK | | | | | | | | | | | | | | | | | |
BofA Merrill Lynch U.S. Corporate & High Yield Index | | | | | | | -1.37 | | | | 1.75 | | | | 4.61 | | | | 5.58 | | | | — | |
| Consumer Price Index - All Urban Consumers from the Bureau of Labor Statistics plus 3% annual risk premium | | | | | | | 0.73 | | | | 1.00 | | | | 1.53 | | | | 1.86 | | | | — | |
| PERFORMANCE AT PUBLIC OFFERING PRICE INCLUDING SALES CHARGES** | | | | | | | | | | | | | | | | | |
| Class A Shares | | | 9/30/2002 | | | | -2.38 | | | | 1.57 | | | | 3.86 | | | | 4.93 | | | | 0.94 | |
| Class C Shares | | | 9/30/2002 | | | | -0.52 | | | | 2.01 | | | | 3.82 | | | | 4.53 | | | | 1.69 | |
| * | Reflects the expense ratio as reported in the Prospectus dated February 26, 2016. |
| ** | The maximum sales charge for Class A shares on purchases and for Class C shares on certain redemptions are 3.50% and 1.00%, respectively. |
GROWTH OF $10,000
Comparison of the change in value of a $10,000 Investment in the Diamond Hill Strategic Income Fund Class I(A), BofA Merrill Lynch U.S. Corporate & High Yield Index, and Consumer Price Index - All Urban Consumers from the Bureau of Labor Statistics plus 3% annual risk premium.
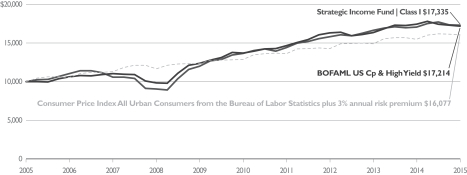
| (A) | The growth of $10,000 chart represents the performance of Class I shares only, which will vary from the performance of Class A, Class C and Class Y shares based on the difference in loads and fees paid by shareholders in the different classes. |
| | The performance of the above Fund does not reflect the deduction of taxes that a shareholder would pay on Fund distributions or the redemption of Fund shares. |
| | The chart above represents a comparison of a hypothetical $10,000 investment and the reinvestment of dividends and capital gains in the indicated share class versus a similar investment in the BofA Merrill Lynch U.S. Corporate & High Yield Index and the Consumer Price Index — All Urban Consumers from the Bureau of Labor Statistics (CPI) plus 3% risk premium. The BofA Merrill Lynch U.S. Corporate & High Yield Index tracks the performance of the U.S. dollar denominated investment grade and below investment grade corporate debt publically issued in the U.S. domestic market. The CPI is an economic metric that measures prices for a basket of goods and services sold to urban consumers. The CPI is increased by a 3 percent risk premium to correspond with the Fund’s long-term goals of achieving returns above the rate of inflation. All indices are unmanaged, and do not reflect the deduction of fees associated with a mutual fund such as investment management and accounting fees. The Fund’s performance reflects the deduction of fees for these services. Investors cannot invest directly in an index although they can invest in the underlying securities. |
| | Historical performance for Class Y shares prior to its inception is based on the performance of Class A shares. Class Y performance has been adjusted to reflect differences in sales charges and expenses between classes. |
| | Past performance does not guarantee future results. The performance data quoted represents past performance and current returns may be lower or higher. The investment return and principal value will fluctuate so that an investor’s shares, when redeemed, may be worth more or less than the original cost. To obtain performance information current to the most recent month end, please visit
www.diamond-hill.com. |
| | | | | | | | | | | | | | | | |
| DIAMOND HILL FUNDS | | | | | ANNUAL REPORT | | | | | DECEMBER 31, 2015 | | | | | DIAMOND-HILL.COM | | | 33 | |
Diamond Hill Small Cap Fund
Schedule of Investments
December 31, 2015
| | | | | | | | |
| | | Shares | | | Fair
Value | |
|
| Common Stocks — 79.9% | |
| Consumer Discretionary — 8.2% | |
Aaron’s, Inc. | | | 739,285 | | | $ | 16,552,591 | |
Callaway Golf Co. | | | 375,583 | | | | 3,537,992 | |
Carter’s, Inc. | | | 126,105 | | | | 11,227,128 | |
Global Sources Ltd.* | | | 365,181 | | | | 2,848,412 | |
Hillenbrand, Inc. | | | 444,955 | | | | 13,184,017 | |
Horizon Global Corp.* | | | 171,140 | | | | 1,774,722 | |
Live Nation Entertainment, Inc.*^ | | | 1,278,180 | | | | 31,404,883 | |
Tenneco, Inc.* | | | 494,775 | | | | 22,715,120 | |
Vail Resorts, Inc. | | | 258,105 | | | | 33,034,858 | |
| | | | | | | | 136,279,723 | |
|
| Consumer Staples — 5.4% | |
B&G Foods, Inc.^ | | | 724,040 | | | | 25,355,880 | |
Edgewell Personal Care Co. | | | 158,880 | | | | 12,451,426 | |
Energizer Holdings, Inc. | | | 129,105 | | | | 4,397,316 | |
Flowers Foods, Inc.^ | | | 1,136,289 | | | | 24,418,851 | |
Post Holdings, Inc.* | | | 372,670 | | | | 22,993,739 | |
| | | | | | | | 89,617,212 | |
|
| Energy — 2.8% | |
Carrizo Oil & Gas, Inc.*^ | | | 141,561 | | | | 4,187,374 | |
Cimarex Energy Co. | | | 322,910 | | | | 28,861,697 | |
Contango Oil & Gas Co.*^ | | | 368,437 | | | | 2,361,681 | |
Noble Energy, Inc. | | | 161,642 | | | | 5,322,871 | |
Southwestern Energy Co.*^ | | | 177,485 | | | | 1,261,918 | |
Whiting Petroleum Corp.*^ | | | 427,635 | | | | 4,036,874 | |
| | | | | | | | 46,032,415 | |
|
| Financials — 27.7% | |
Alleghany Corp.* | | | 36,757 | | | | 17,567,273 | |
American Equity Investment Life Holding Co.^ | | | 267,005 | | | | 6,416,130 | |
Assured Guaranty Ltd. | | | 335,697 | | | | 8,872,472 | |
BankUnited, Inc. | | | 781,280 | | | | 28,172,957 | |
BOK Financial Corp.^ | | | 186,835 | | | | 11,170,865 | |
Brown & Brown, Inc. | | | 1,334,470 | | | | 42,836,486 | |
Colony Capital, Inc., Class A | | | 686,080 | | | | 13,364,838 | |
Endurance Specialty Holdings Ltd. | | | 331,645 | | | | 21,221,964 | |
Enstar Group Ltd.* | | | 213,307 | | | | 32,004,582 | |
First Horizon National Corp.^ | | | 704,395 | | | | 10,227,815 | |
| | | | | | | | |
| | | Shares | | | Fair
Value | |
|
| Financials — 27.7% continued | |
First Niagara Financial Group, Inc. | | | 658,720 | | | $ | 7,147,112 | |
First of Long Island Corp., The^ | | | 265,980 | | | | 7,979,400 | |
Fortress Investment Group LLC, Class A | | | 2,766,755 | | | | 14,082,783 | |
Greenlight Capital Re Ltd., Class A*^ | | | 185,365 | | | | 3,468,179 | |
iStar Financial, Inc. REIT*^ | | | 3,417,105 | | | | 40,082,642 | |
Mid-America Apartment Communities, Inc. REIT^ | | | 177,749 | | | | 16,141,386 | |
National Penn Bancshares, Inc. | | | 725,250 | | | | 8,942,333 | |
Nationstar Mortgage Holdings, Inc.*^ | | | 780,925 | | | | 10,440,967 | |
Navigators Group, Inc.* | | | 556,258 | | | | 47,721,373 | |
Popular, Inc.^ | | | 1,277,883 | | | | 36,215,205 | |
ProAssurance Corp. | | | 424,690 | | | | 20,610,206 | |
Reinsurance Group of America | | | 127,270 | | | | 10,887,949 | |
State Bank Financial Corp.^ | | | 342,875 | | | | 7,210,661 | |
Sterling Bancorp | | | 709,860 | | | | 11,513,929 | |
Tanger Factory Outlet Center, Inc. | | | 356,555 | | | | 11,659,349 | |
Winthrop Realty Trust REIT^ | | | 884,650 | | | | 11,473,911 | |
| | | | | | | | 457,432,767 | |
|
| Health Care — 8.8% | |
Alere, Inc.* | | | 1,167,510 | | | | 45,637,966 | |
BioScrip, Inc.*^ | | | 2,273,417 | | | | 3,978,480 | |
Concordia Healthcare Corp. | | | 810,415 | | | | 33,089,244 | |
Greatbatch, Inc.*^ | | | 316,050 | | | | 16,592,625 | |
LifePoint Hospitals, Inc.* | | | 180,425 | | | | 13,243,195 | |
Natus Medical, Inc.*^ | | | 471,375 | | | | 22,649,569 | |
Universal American Financial Corp.^ | | | 1,455,156 | | | | 10,186,092 | |
| | | | | | | | 145,377,171 | |
|
| Industrials — 16.3% | |
Aircastle Ltd.^ | | | 1,409,955 | | | | 29,453,960 | |
Alaska Air Group, Inc. | | | 238,560 | | | | 19,206,466 | |
Avis Budget Group, Inc.*^ | | | 1,635,460 | | | | 59,350,844 | |
Brink’s Co., The | | | 265,460 | | | | 7,661,176 | |
Colfax Corp.*^ | | | 422,385 | | | | 9,862,690 | |
Corrections Corp. of America^ | | | 628,463 | | | | 16,647,985 | |
| | | | | | | | | | | | | | |
| 34 | | DIAMOND HILL FUNDS | | | | | ANNUAL REPORT | | | | | DECEMBER 31, 2015 | | | | | DIAMOND-HILL.COM |
Diamond Hill Small Cap Fund
Schedule of Investments (Continued)
December 31, 2015
| | | | | | | | |
| | | Shares | | | Fair
Value | |
|
| Common Stocks — 79.9% continued | |
| Industrials — 16.3% continued | |
Hub Group, Inc., Class A* | | | 906,855 | | | $ | 29,880,872 | |
Hyster-Yale Materials Handling, Inc. | | | 221,165 | | | | 11,600,104 | |
Kennametal, Inc.^ | | | 304,400 | | | | 5,844,480 | |
Kirby Corp.* | | | 268,195 | | | | 14,112,421 | |
SPX FLOW, Inc.* | | | 422,035 | | | | 11,778,997 | |
Toro Co., The | | | 188,380 | | | | 13,764,926 | |
TriMas Corp.*^ | | | 427,850 | | | | 7,979,403 | |
Trinity Industries, Inc.^ | | | 1,331,500 | | | | 31,982,629 | |
| | | | | | | | 269,126,953 | |
|
| Information Technology — 7.4% | |
Anixter International, Inc.* | | | 169,765 | | | | 10,252,108 | |
Broadridge Financial Solutions, Inc. | | | 476,525 | | | | 25,603,688 | |
CommScope Holding, Inc.* | | | 925,575 | | | | 23,963,137 | |
CSG Systems International, Inc.^ | | | 234,697 | | | | 8,444,398 | |
DST Systems, Inc. | | | 421,130 | | | | 48,034,088 | |
Rovi Corp.*^ | | | 361,885 | | | | 6,029,004 | |
| | | | | | | | 122,326,423 | |
|
| Utilities — 3.3% | |
Cleco Corp. | | | 205,390 | | | | 10,723,412 | |
ITC Holdings Corp. | | | 494,268 | | | | 19,400,019 | |
UGI Corp. | | | 740,970 | | | | 25,015,147 | |
| | | | | | | | 55,138,578 | |
| |
| Total Common Stocks | | | $ | 1,321,331,242 | |
|
| Registered Investment Companies — 31.0% | |
State Street Institutional Liquid Reserves Fund, Premier Class, 0.24%S | | | 340,000,466 | | | | 340,000,466 | |
State Street Navigator Securities Lending Prime Portfolio, 0.31%†S | | | 173,063,700 | | | | 173,063,700 | |
| |
| Total Registered Investment Companies | | | $ | 513,064,166 | |
|
| Total Investment Securities — 110.9% | |
(Cost $1,616,017,223)** | | | $ | 1,834,395,408 | |
| | | | | | |
| | | Shares | | Fair
Value | |
| |
Net Other Assets
(Liabilities) — (10.9)% | | $ | (179,735,742 | ) |
| |
| Net Assets — 100.0% | | $ | 1,654,659,666 | |
| * | Non-income producing security. |
| ^ | All or a portion of the security is on loan. The total fair value of the securities on loan as of December 31, 2015 was $168,281,666. |
| † | This security, which was purchased using cash collateral received from securities on loan, represents collateral for securities loaned as of December 31, 2015. |
| S | Rate represents the daily yield on December 31, 2015. |
| ** | Represents cost for financial reporting purposes. |
REIT – Real Estate Investment Trust
See accompanying Notes to Financial Statements
| | | | | | | | | | | | | | | | |
| DIAMOND HILL FUNDS | | | | | ANNUAL REPORT | | | | | DECEMBER 31, 2015 | | | | | DIAMOND-HILL.COM | | | 35 | |
Diamond Hill Small-Mid Cap Fund
Schedule of Investments
December 31, 2015
| | | | | | | | |
| | | Shares | | | Fair
Value | |
|
| Common Stocks — 91.0% | |
| Consumer Discretionary — 14.8% | |
Aaron’s, Inc. | | | 866,582 | | | $ | 19,402,771 | |
BorgWarner, Inc. | | | 836,097 | | | | 36,144,474 | |
Goodyear Tire & Rubber Co., The | | | 522,514 | | | | 17,070,532 | |
Jarden Corp.*^ | | | 750,541 | | | | 42,870,902 | |
NVR, Inc.*^ | | | 5,056 | | | | 8,307,008 | |
Staples, Inc. | | | 2,060,486 | | | | 19,512,802 | |
TEGNA, Inc. | | | 1,143,227 | | | | 29,175,153 | |
Whirlpool Corp. | | | 129,732 | | | | 19,053,739 | |
| | | | | | | | 191,537,381 | |
|
| Consumer Staples — 10.4% | |
B&G Foods, Inc.^ | | | 687,985 | | | | 24,093,235 | |
Coty, Inc.^ | | | 318,961 | | | | 8,174,970 | |
Edgewell Personal Care Co. | | | 104,471 | | | | 8,187,392 | |
Energizer Holdings, Inc. | | | 116,775 | | | | 3,977,357 | |
Flowers Foods, Inc.^ | | | 1,252,332 | | | | 26,912,615 | |
Molson Coors Brewing Co., Class B^ | | | 323,621 | | | | 30,394,484 | |
Post Holdings, Inc.* | | | 534,945 | | | | 33,006,106 | |
| | | | | | | | 134,746,159 | |
|
| Energy — 3.4% | |
Cimarex Energy Co. | | | 400,743 | | | | 35,818,409 | |
Energen Corp.^ | | | 190,211 | | | | 7,796,749 | |
| | | | | | | | 43,615,158 | |
|
| Financials — 27.9% | |
BankUnited, Inc. | | | 775,024 | | | | 27,947,365 | |
BOK Financial Corp.^ | | | 287,414 | | | | 17,184,483 | |
Brown & Brown, Inc. | | | 1,129,450 | | | | 36,255,346 | |
Colony Capital, Inc., Class A^ | | | 336,521 | | | | 6,555,429 | |
Endurance Specialty Holdings Ltd. | | | 317,468 | | | | 20,314,777 | |
Enstar Group Ltd.* | | | 40,148 | | | | 6,023,806 | |
First Horizon National Corp.^ | | | 1,085,038 | | | | 15,754,752 | |
First Republic Bank | | | 373,720 | | | | 24,687,943 | |
Infinity Property & Casualty Corp. | | | 78,900 | | | | 6,487,947 | |
iStar Financial, Inc. REIT*^ | | | 1,510,068 | | | | 17,713,098 | |
Mid-America Apartment Communities, Inc. REIT^ | | | 155,555 | | | | 14,125,950 | |
National Penn Bancshares, Inc. | | | 1,083,535 | | | | 13,359,987 | |
| | | | | | | | |
| | | Shares | | | Fair
Value | |
|
| Financials — 27.9% continued | |
Nationstar Mortgage Holdings, Inc.*^ | | | 1,803,133 | | | $ | 24,107,888 | |
Navigators Group, Inc.* | | | 161,665 | | | | 13,869,240 | |
Popular, Inc. | | | 727,974 | | | | 20,630,783 | |
Reinsurance Group of America | | | 116,808 | | | | 9,992,924 | |
Willis Group Holdings plc | | | 1,511,030 | | | | 73,390,728 | |
XL Group plc^ | | | 339,971 | | | | 13,320,064 | |
| | | | | | | | 361,722,510 | |
|
| Health Care — 8.9% | |
Boston Scientific Corp.* | | | 2,654,306 | | | | 48,945,403 | |
LifePoint Hospitals, Inc.* | | | 491,586 | | | | 36,082,412 | |
Orthofix International NV* | | | 520,620 | | | | 20,413,510 | |
Universal American Financial Corp.^ | | | 1,474,662 | | | | 10,322,634 | |
| | | | | | | | 115,763,959 | |
|
| Industrials — 11.7% | |
Aircastle Ltd.^ | | | 548,415 | | | | 11,456,389 | |
Brink’s Co., The | | | 320,424 | | | | 9,247,437 | |
Colfax Corp.*^ | | | 1,192,367 | | | | 27,841,768 | |
Corrections Corp. of America^ | | | 329,112 | | | | 8,718,177 | |
Dover Corp. | | | 270,449 | | | | 16,581,228 | |
Hub Group, Inc., Class A* | | | 969,884 | | | | 31,957,678 | |
Kennametal, Inc.^ | | | 433,981 | | | | 8,332,435 | |
Kirby Corp.* | | | 300,845 | | | | 15,830,464 | |
Knowles Corp.*^ | | | 385,824 | | | | 5,143,034 | |
Parker Hannifin Corp.^ | | | 72,370 | | | | 7,018,443 | |
SPX FLOW, Inc.* | | | 331,361 | | | | 9,248,286 | |
| | | | | | | | 151,375,339 | |
|
| Information Technology — 9.2% | |
Anixter International, Inc.* | | | 226,476 | | | | 13,676,886 | |
Broadridge Financial Solutions, Inc. | | | 133,393 | | | | 7,167,206 | |
CommScope Holding, Inc.* | | | 494,770 | | | | 12,809,595 | |
CSG Systems International, Inc.^ | | | 257,604 | | | | 9,268,592 | |
Juniper Networks, Inc. | | | 934,744 | | | | 25,798,935 | |
Keysight Technologies, Inc.* | | | 331,941 | | | | 9,403,888 | |
Linear Technology Corp. | | | 519,910 | | | | 22,080,578 | |
Vantiv, Inc., Class A* | | | 402,939 | | | | 19,107,367 | |
| | | | | | | | 119,313,047 | |
| | | | | | | | | | | | | | |
| 36 | | DIAMOND HILL FUNDS | | | | | ANNUAL REPORT | | | | | DECEMBER 31, 2015 | | | | | DIAMOND-HILL.COM |
Diamond Hill Small-Mid Cap Fund
Schedule of Investments (Continued)
December 31, 2015
Diamond Hill Mid Cap Fund
Schedule of Investments
December 31, 2015
| | | | | | | | |
| | | Shares | | | Fair
Value | |
|
| Common Stocks — 91.0% continued | |
| Materials — 1.4% | |
Axalta Coating Systems Ltd.*^ | | | 683,826 | | | $ | 18,223,963 | |
|
| Utilities — 3.3% | |
Cleco Corp. | | | 46,330 | | | | 2,418,889 | |
ITC Holdings Corp. | | | 414,035 | | | | 16,250,874 | |
UGI Corp.^ | | | 712,586 | | | | 24,056,903 | |
| | | | | | | | 42,726,666 | |
| |
| Total Common Stocks | | | $ | 1,179,024,182 | |
|
| Registered Investment Companies — 22.0% | |
State Street Institutional Liquid Reserves Fund, Premier Class,
0.24%S | | | 127,956,351 | | | | 127,956,351 | |
State Street Navigator Securities Lending Prime Portfolio,
0.31%†S | | | 158,330,851 | | | | 158,330,851 | |
| |
| Total Registered Investment Companies | | | $ | 286,287,202 | |
|
| Total Investment Securities — 113.0% | |
(Cost $1,419,637,857)** | | | $ | 1,465,311,384 | |
| |
Net Other Assets
(Liabilities) — (13.0)% | | | | (166,545,329 | ) |
| |
| Net Assets — 100.0% | | | $ | 1,298,766,055 | |
| * | Non-income producing security. |
| ^ | All or a portion of the security is on loan. The total fair value of the securities on loan as of December 31, 2015 was $154,410,593. |
| † | This security, which was purchased using cash collateral received from securities on loan, represents collateral for securities loaned as of December 31, 2015. |
| S | Rate represents the daily yield on December 31, 2015. |
| ** | Represents cost for financial reporting purposes. |
PLC – Public Limited Company
REIT – Real Estate Investment Trust
See accompanying Notes to Financial Statements
| | | | | | | | |
| | | Shares | | | Fair
Value | |
|
| Common Stocks — 92.1% | |
| Consumer Discretionary — 17.4% | |
Aaron’s, Inc. | | | 10,374 | | | $ | 232,274 | |
BorgWarner, Inc. | | | 11,760 | | | | 508,385 | |
Dollar General Corp. | | | 2,463 | | | | 177,016 | |
Goodyear Tire & Rubber Co., The | | | 7,630 | | | | 249,272 | |
Jarden Corp.*^ | | | 10,287 | | | | 587,593 | |
NVR, Inc.*^ | | | 65 | | | | 106,795 | |
Staples, Inc.^ | | | 23,405 | | | | 221,645 | |
TEGNA, Inc.^ | | | 13,450 | | | | 343,244 | |
VF Corp. | | | 4,495 | | | | 279,814 | |
Whirlpool Corp. | | | 3,551 | | | | 521,535 | |
| | | | | | | | 3,227,573 | |
|
| Consumer Staples — 12.0% | |
B&G Foods, Inc.^ | | | 8,485 | | | | 297,145 | |
Coty, Inc.^ | | | 5,175 | | | | 132,635 | |
Edgewell Personal Care Co. | | | 1,295 | | | | 101,489 | |
Energizer Holdings, Inc. | | | 1,295 | | | | 44,108 | |
Flowers Foods, Inc.^ | | | 17,961 | | | | 385,982 | |
Molson Coors Brewing Co., Class B^ | | | 4,837 | | | | 454,291 | |
Post Holdings, Inc.*^ | | | 7,460 | | | | 460,282 | |
Sysco Corp. | | | 8,575 | | | | 351,575 | |
| | | | | | | | 2,227,507 | |
|
| Energy — 3.3% | |
Cimarex Energy Co. | | | 5,628 | | | | 503,030 | |
Energen Corp.^ | | | 2,525 | | | | 103,500 | |
| | | | | | | | 606,530 | |
|
| Financials — 29.4% | |
BankUnited, Inc. | | | 8,915 | | | | 321,475 | |
BOK Financial Corp.^ | | | 3,640 | | | | 217,636 | |
Brown & Brown, Inc.^ | | | 14,670 | | | | 470,907 | |
Endurance Specialty Holdings Ltd. | | | 3,465 | | | | 221,725 | |
Enstar Group Ltd.*^ | | | 1,085 | | | | 162,793 | |
First Horizon National Corp.^ | | | 14,805 | | | | 214,969 | |
First Republic Bank^ | | | 5,175 | | | | 341,860 | |
Franklin Resources, Inc.^ | | | 7,585 | | | | 279,280 | |
Loews Corp. | | | 13,890 | | | | 533,376 | |
Mid-America Apartment Communities, Inc. REIT^ | | | 2,106 | | | | 191,246 | |
National Penn Bancshares, Inc.^ | | | 18,663 | | | | 230,115 | |
Nationstar Mortgage Holdings, Inc.*^ | | | 22,831 | | | | 305,250 | |
Popular, Inc. | | | 9,881 | | | | 280,028 | |
| | | | | | | | | | | | | | | | |
| DIAMOND HILL FUNDS | | | | | ANNUAL REPORT | | | | | DECEMBER 31, 2015 | | | | | DIAMOND-HILL.COM | | | 37 | |
Diamond Hill Mid Cap Fund
Schedule of Investments (Continued)
December 31, 2015
| | | | | | | | |
| | | Shares | | | Fair
Value | |
|
| Common Stocks — 92.1% continued | |
| Financials — 29.4% continued | |
Reinsurance Group of America | | | 1,384 | | | $ | 118,401 | |
SunTrust Banks, Inc. | | | 6,692 | | | | 286,685 | |
Willis Group Holdings plc | | | 21,682 | | | | 1,053,096 | |
XL Group plc | | | 5,741 | | | | 224,932 | |
| | | | | | | | 5,453,774 | |
|
| Health Care — 7.7% | |
Boston Scientific Corp.* | | | 45,928 | | | | 846,912 | |
ENDO International plc*^ | | | 2,000 | | | | 122,440 | |
LifePoint Hospitals, Inc.*^ | | | 6,395 | | | | 469,393 | |
| | | | | | | | 1,438,745 | |
|
| Industrials — 9.8% | |
Colfax Corp.* | | | 14,135 | | | | 330,052 | |
Corrections Corp. of America^ | | | 5,457 | | | | 144,556 | |
Deere & Co.^ | | | 3,595 | | | | 274,191 | |
Dover Corp.^ | | | 3,700 | | | | 226,847 | |
Hub Group, Inc., Class A*^ | | | 9,445 | | | | 311,213 | |
Kirby Corp.* | | | 4,070 | | | | 214,163 | |
Parker Hannifin Corp.^ | | | 3,316 | | | | 321,586 | |
| | | | | | | | 1,822,608 | |
|
| Information Technology — 7.4% | |
Broadridge Financial Solutions, Inc. | | | 2,530 | | | | 135,937 | |
CommScope Holding, Inc.*^ | | | 6,825 | | | | 176,699 | |
Juniper Networks, Inc.^ | | | 13,636 | | | | 376,353 | |
Keysight Technologies, Inc.* | | | 4,360 | | | | 123,519 | |
Linear Technology Corp.^ | | | 6,770 | | | | 287,522 | |
Vantiv, Inc., Class A* | | | 5,885 | | | | 279,067 | |
| | | | | | | | 1,379,097 | |
|
| Materials — 2.2% | |
Axalta Coating Systems Ltd.*^ | | | 8,695 | | | | 231,721 | |
Eastman Chemical Co.^ | | | 2,560 | | | | 172,826 | |
| | | | | | | | 404,547 | |
|
| Utilities — 2.9% | |
ITC Holdings Corp. | | | 5,849 | | | | 229,573 | |
UGI Corp.^ | | | 9,169 | | | | 309,546 | |
| | | | | | | | 539,119 | |
| |
| Total Common Stocks | | | $ | 17,099,500 | |
| | | | | | | | |
| | | Shares | | | Fair
Value | |
|
| Registered Investment Companies — 37.1% | |
State Street Institutional Liquid Reserves Fund, Premier Class, 0.24%S | | | 1,516,473 | | | $ | 1,516,473 | |
State Street Navigator Securities Lending Prime Portfolio,
0.31%†S | | | 5,381,516 | | | | 5,381,516 | |
| |
| Total Registered Investment Companies | | | $ | 6,897,989 | |
|
| Total Investment Securities — 129.2% | |
(Cost $23,154,282)** | | | $ | 23,997,489 | |
| |
Net Other Assets
(Liabilities) — (29.2)% | | | | (5,424,015 | ) |
| |
| Net Assets — 100.0% | | | $ | 18,573,474 | |
| * | Non-income producing security. |
| ^ | All or a portion of the security is on loan. The total fair value of the securities on loan as of December 31, 2015 was $5,257,506. |
| † | This security, which was purchased using cash collateral received from securities on loan, represents collateral for securities loaned as of December 31, 2015. |
| S | Rate represents the daily yield on December 31, 2015. |
| ** | Represents cost for financial reporting purposes. |
PLC – Public Limited Company
REIT – Real Estate Investment Trust
See accompanying Notes to Financial Statements
| | | | | | | | | | | | | | |
| 38 | | DIAMOND HILL FUNDS | | | | | ANNUAL REPORT | | | | | DECEMBER 31, 2015 | | | | | DIAMOND-HILL.COM |
Diamond Hill Large Cap Fund
Schedule of Investments
December 31, 2015
| | | | | | | | |
| | | Shares | | | Fair
Value | |
|
| Common Stocks — 98.7% | |
| Consumer Discretionary — 16.4% | |
BorgWarner, Inc. | | | 1,633,945 | | | $ | 70,635,442 | |
Charter Communications, Inc., Class A*^ | | | 99,770 | | | | 18,267,887 | |
Comcast Corp., Class A | | | 1,158,555 | | | | 65,377,258 | |
Goodyear Tire & Rubber Co., The | | | 1,272,230 | | | | 41,563,754 | |
TEGNA, Inc.^ | | | 1,774,710 | | | | 45,290,599 | |
TJX Cos., Inc., The | | | 1,281,660 | | | | 90,882,511 | |
Twenty-First Century Fox, Inc. | | | 1,665,055 | | | | 45,339,448 | |
VF Corp. | | | 999,895 | | | | 62,243,464 | |
Walt Disney Co., The | | | 615,890 | | | | 64,717,721 | |
Whirlpool Corp. | | | 418,070 | | | | 61,401,941 | |
| | | | | | | | 565,720,025 | |
|
| Consumer Staples — 10.5% | |
Kimberly-Clark Corp. | | | 704,030 | | | | 89,623,019 | |
Philip Morris International | | | 604,275 | | | | 53,121,815 | |
Procter & Gamble Co., The | | | 1,462,001 | | | | 116,097,500 | |
Sysco Corp. | | | 2,507,269 | | | | 102,798,029 | |
| | | | | | | | 361,640,363 | |
|
| Energy — 3.4% | |
Cimarex Energy Co. | | | 681,445 | | | | 60,907,554 | |
EOG Resources, Inc. | | | 808,126 | | | | 57,207,240 | |
| | | | | | | | 118,114,794 | |
|
| Financials — 26.7% | |
American International Group, Inc. | | | 1,845,246 | | | | 114,349,895 | |
Capital One Financial Corp. | | | 1,111,135 | | | | 80,201,724 | |
Citigroup, Inc. | | | 2,177,780 | | | | 112,700,115 | |
Franklin Resources, Inc. | | | 1,229,425 | | | | 45,267,429 | |
JPMorgan Chase & Co. | | | 1,606,903 | | | | 106,103,805 | |
Loews Corp. | | | 1,150,105 | | | | 44,164,032 | |
Marsh & McLennan Cos., Inc. | | | 1,392,835 | | | | 77,232,701 | |
MetLife, Inc. | | | 1,725,935 | | | | 83,207,326 | |
Morgan Stanley | | | 3,217,410 | | | | 102,345,812 | |
PNC Financial Services Group, Inc. | | | 448,975 | | | | 42,791,807 | |
Progressive Corp. | | | 2,127,515 | | | | 67,654,977 | |
Wells Fargo & Co. | | | 829,026 | | | | 45,065,853 | |
| | | | | | | | 921,085,476 | |
| | | | | | | | |
| | | Shares | | | Fair
Value | |
|
| Health Care — 16.2% | |
Abbott Laboratories | | | 2,502,125 | | | $ | 112,370,433 | |
Baxalta, Inc. | | | 992,855 | | | | 38,751,131 | |
Boston Scientific Corp.* | | | 5,166,675 | | | | 95,273,487 | |
Express Scripts Holding Co.* | | | 692,850 | | | | 60,562,019 | |
Medtronic plc | | | 1,315,627 | | | | 101,198,028 | |
Pfizer, Inc. | | | 3,420,967 | | | | 110,428,815 | |
Stryker Corp. | | | 435,405 | | | | 40,466,541 | |
| | | | | | | | 559,050,454 | |
|
| Industrials — 8.0% | |
Illinois Tool Works, Inc. | | | 669,004 | | | | 62,003,291 | |
Parker Hannifin Corp.^ | | | 577,399 | | | | 55,996,155 | |
United Parcel Service, Inc. | | | 441,853 | | | | 42,519,514 | |
United Technologies Corp. | | | 1,205,457 | | | | 115,808,254 | |
| | | | | | | | 276,327,214 | |
|
| Information Technology — 15.2% | |
Alphabet, Inc., Class A* | | | 117,669 | | | | 91,547,659 | |
Apple Computer, Inc. | | | 741,442 | | | | 78,044,185 | |
Cisco Systems, Inc. | | | 3,543,363 | | | | 96,220,022 | |
International Business Machines Corp. | | | 361,340 | | | | 49,727,611 | |
Juniper Networks, Inc. | | | 1,466,035 | | | | 40,462,566 | |
Linear Technology Corp. | | | 1,102,050 | | | | 46,804,064 | |
Microsoft Corp. | | | 1,282,480 | | | | 71,151,990 | |
Vantiv, Inc., Class A* | | | 1,016,410 | | | | 48,198,162 | |
| | | | | | | | 522,156,259 | |
|
| Materials — 2.3% | |
Eastman Chemical Co. | | | 458,485 | | | | 30,952,322 | |
Praxair, Inc. | | | 477,612 | | | | 48,907,469 | |
| | | | | | | | 79,859,791 | |
| |
| Total Common Stocks | | | $ | 3,403,954,376 | |
|
| Registered Investment Companies — 2.2% | |
State Street Institutional Liquid Reserves Fund, Premier Class,
0.24%S | | | 51,977,047 | | | | 51,977,047 | |
| | | | | | | | | | | | | | | | |
| DIAMOND HILL FUNDS | | | | | ANNUAL REPORT | | | | | DECEMBER 31, 2015 | | | | | DIAMOND-HILL.COM | | | 39 | |
Diamond Hill Large Cap Fund
Schedule of Investments (Continued)
December 31, 2015
Diamond Hill Select Fund
Schedule of Investments
December 31, 2015
| | | | | | | | |
| | | Shares | | | Fair
Value | |
|
| Registered Investment Companies — 2.2% continued | |
State Street Navigator Securities Lending Prime Portfolio,
0.31%†S | | | 22,216,363 | | | $ | 22,216,363 | |
| |
| Total Registered Investment Companies | | | $ | 74,193,410 | |
|
| Total Investment Securities — 100.9% | |
(Cost $2,837,667,536)** | | | $ | 3,478,147,786 | |
| |
Net Other Assets
(Liabilities) — (0.9)% | | | | (37,734,942 | ) |
| |
| Net Assets — 100.0% | | | $ | 3,440,412,844 | |
| * | Non-income producing security. |
| ^ | All or a portion of the security is on loan. The total fair value of the securities on loan as of December 31, 2015 was $21,728,282. |
| † | This security, which was purchased using cash collateral received from securities on loan, represents collateral for securities loaned as of December 31, 2015. |
| S | Rate represents the daily yield on December 31, 2015. |
| ** | Represents cost for financial reporting purposes. |
PLC – Public Limited Company
See accompanying Notes to Financial Statements
| | | | | | | | |
| | | Shares | | | Fair
Value | |
|
| Common Stocks — 97.3% | |
| Consumer Discretionary — 18.4% | |
BorgWarner, Inc.^ | | | 113,955 | | | $ | 4,926,275 | |
Jarden Corp.*^ | | | 66,784 | | | | 3,814,702 | |
Liberty Global plc, Class A* | | | 95,870 | | | | 4,061,053 | |
TJX Cos., Inc., The | | | 44,177 | | | | 3,132,591 | |
Twenty-First Century Fox, Inc.^ | | | 215,948 | | | | 5,880,264 | |
Whirlpool Corp. | | | 41,016 | | | | 6,024,020 | |
| | | | | | | | 27,838,905 | |
|
| Consumer Staples — 3.0% | |
Post Holdings, Inc.*^ | | | 73,211 | | | | 4,517,119 | |
|
| Energy — 1.7% | |
Cimarex Energy Co. | | | 29,253 | | | | 2,614,633 | |
|
| Financials — 33.9% | |
BankUnited, Inc. | | | 82,350 | | | | 2,969,541 | |
Berkshire Hathaway, Inc., Class B* | | | 28,495 | | | | 3,762,480 | |
Brown & Brown, Inc.^ | | | 106,011 | | | | 3,402,953 | |
Citigroup, Inc. | | | 80,458 | | | | 4,163,702 | |
Franklin Resources, Inc.^ | | | 164,363 | | | | 6,051,846 | |
iStar Financial, Inc. REIT*^ | | | 194,302 | | | | 2,279,162 | |
Loews Corp. | | | 118,633 | | | | 4,555,507 | |
MetLife, Inc. | | | 96,502 | | | | 4,652,361 | |
Nationstar Mortgage Holdings, Inc.*^ | | | 526,380 | | | | 7,037,701 | |
Popular, Inc.^ | | | 107,892 | | | | 3,057,659 | |
Willis Group Holdings plc | | | 190,573 | | | | 9,256,131 | |
| | | | | | | | 51,189,043 | |
|
| Health Care — 12.0% | |
Allergan plc* | | | 14,945 | | | | 4,670,313 | |
LifePoint Hospitals, Inc.*^ | | | 76,691 | | | | 5,629,119 | |
Valeant Pharmaceuticals International, Inc.* | | | 76,663 | | | | 7,792,794 | |
| | | | | | | | 18,092,226 | |
|
| Industrials — 17.1% | |
Colfax Corp.*^ | | | 278,818 | | | | 6,510,399 | |
Deere & Co.^ | | | 60,410 | | | | 4,607,471 | |
Hub Group, Inc., Class A* | | | 205,211 | | | | 6,761,702 | |
Parker Hannifin Corp.^ | | | 42,125 | | | | 4,085,283 | |
United Technologies Corp. | | | 40,779 | | | | 3,917,639 | |
| | | | | | | | 25,882,494 | |
| | | | | | | | | | | | | | |
| 40 | | DIAMOND HILL FUNDS | | | | | ANNUAL REPORT | | | | | DECEMBER 31, 2015 | | | | | DIAMOND-HILL.COM |
Diamond Hill Select Fund
Schedule of Investments (Continued)
December 31, 2015
Diamond Hill Long-Short Fund
Schedule of Investments
December 31, 2015
| | | | | | | | |
| | | Shares | | | Fair
Value | |
|
| Common Stocks — 97.3% continued | |
| Information Technology — 11.2% | |
Alphabet, Inc., Class A* | | | 5,630 | | | $ | 4,380,196 | |
Alphabet, Inc., Class C* | | | 1,845 | | | | 1,400,134 | |
Apple Computer, Inc. | | | 61,459 | | | | 6,469,174 | |
Linear Technology Corp.^ | | | 51,650 | | | | 2,193,576 | |
Vantiv, Inc., Class A* | | | 53,603 | | | | 2,541,854 | |
| | | | | | | | 16,984,934 | |
| |
| Total Common Stocks | | | $ | 147,119,354 | |
|
| Registered Investment Companies — 26.6% | |
State Street Institutional Liquid Reserves Fund, Premier Class,
0.24%S | | | 3,978,759 | | | | 3,978,759 | |
State Street Navigator Securities Lending Prime Portfolio,
0.31%†S | | | 36,200,105 | | | | 36,200,105 | |
| |
| Total Registered Investment Companies | | | $ | 40,178,864 | |
|
| Total Investment Securities — 123.9% | |
(Cost $185,827,992)** | | | $ | 187,298,218 | |
| |
Net Other Assets
(Liabilities) — (23.9)% | | | | (36,526,766 | ) |
| |
| Net Assets — 100.0% | | | $ | 150,771,452 | |
| * | Non-income producing security. |
| ^ | All or a portion of the security is on loan. The total fair value of the securities on loan as of December 31, 2015 was $35,333,834. |
| † | This security, which was purchased using cash collateral received from securities on loan, represents collateral for securities loaned as of December 31, 2015. |
| S | Rate represents the daily yield on December 31, 2015. |
| ** | Represents cost for financial reporting purposes. |
PLC – Public Limited Company
REIT – Real Estate Investment Trust
See accompanying Notes to Financial Statements
| | | | | | | | |
| | | Shares | | | Fair
Value | |
|
| Common Stocks — 82.9% | |
| Consumer Discretionary — 18.8% | |
BorgWarner, Inc.^ | | | 2,039,725 | | | $ | 88,177,312 | |
Comcast Corp., Class A^ | | | 1,082,305 | | | | 61,074,471 | |
Goodyear Tire & Rubber Co., The | | | 1,327,755 | | | | 43,377,756 | |
Jarden Corp.* | | | 2,375,525 | | | | 135,689,986 | |
TEGNA, Inc.^ | | | 2,394,445 | | | | 61,106,236 | |
TJX Cos., Inc., The | | | 1,136,540 | | | | 80,592,052 | |
Twenty-First Century Fox, Inc. | | | 4,234,450 | | | | 115,304,075 | |
VF Corp.^ | | | 1,063,055 | | | | 66,175,174 | |
Walt Disney Co., The^ | | | 629,081 | | | | 66,103,831 | |
Whirlpool Corp. | | | 756,915 | | | | 111,168,106 | |
| | | | | | | | 828,768,999 | |
|
| Consumer Staples — 4.5% | |
Kimberly-Clark Corp.^ | | | 517,385 | | | | 65,863,111 | |
Procter & Gamble Co., The^ | | | 963,200 | | | | 76,487,712 | |
Sysco Corp.^ | | | 1,356,982 | | | | 55,636,262 | |
| | | | | | | | 197,987,085 | |
|
| Energy — 3.3% | |
Cimarex Energy Co.^ | | | 938,289 | | | | 83,864,271 | |
Devon Energy Corp.^ | | | 328,508 | | | | 10,512,256 | |
EOG Resources, Inc.^ | | | 748,927 | | | | 53,016,542 | |
| | | | | | | | 147,393,069 | |
|
| Financials — 26.3% | |
Berkshire Hathaway, Inc., Class B* | | | 387,400 | | | | 51,152,296 | |
Brown & Brown, Inc.^ | | | 1,827,400 | | | | 58,659,540 | |
Capital One Financial Corp.^ | | | 1,564,610 | | | | 112,933,550 | |
Citigroup, Inc.^ | | | 2,998,504 | | | | 155,172,581 | |
Franklin Resources, Inc.^ | | | 2,595,170 | | | | 95,554,159 | |
JPMorgan Chase & Co.^ | | | 1,164,020 | | | | 76,860,241 | |
Loews Corp.^ | | | 1,980,525 | | | | 76,052,160 | |
MetLife, Inc. | | | 2,424,199 | | | | 116,870,634 | |
Morgan Stanley | | | 2,400,825 | | | | 76,370,243 | |
PNC Financial Services Group, Inc.^ | | | 299,370 | | | | 28,532,955 | |
Popular, Inc.^ | | | 3,687,842 | | | | 104,513,442 | |
Prudential Financial, Inc.^ | | | 625,998 | | | | 50,962,497 | |
Wells Fargo & Co. | | | 171,302 | | | | 9,311,977 | |
Willis Group Holdings plc | | | 3,038,245 | | | | 147,567,559 | |
| | | | | | | | 1,160,513,834 | |
|
| Health Care — 10.0% | |
Abbott Laboratories^ | | | 2,933,510 | | | | 131,743,935 | |
Alere, Inc.*^ | | | 1,003,095 | | | | 39,210,984 | |
| | | | | | | | | | | | | | | | |
| DIAMOND HILL FUNDS | | | | | ANNUAL REPORT | | | | | DECEMBER 31, 2015 | | | | | DIAMOND-HILL.COM | | | 41 | |
Diamond Hill Long-Short Fund
Schedule of Investments (Continued)
December 31, 2015
| | | | | | | | |
| | | Shares | | | Fair
Value | |
|
| Health Care — 10.0% continued | |
Baxalta, Inc. | | | 1,259,956 | | | $ | 49,176,083 | |
Boston Scientific Corp.*^ | | | 3,565,453 | | | | 65,746,953 | |
Medtronic plc^ | | | 693,597 | | | | 53,351,481 | |
Pfizer, Inc.^ | | | 3,242,310 | | | | 104,661,766 | |
| | | | | | | | 443,891,202 | |
|
| Industrials — 8.2% | |
Colfax Corp.*^ | | | 2,292,520 | | | | 53,530,342 | |
Deere & Co.^ | | | 592,350 | | | | 45,178,535 | |
Dover Corp.^ | | | 160,390 | | | | 9,833,511 | |
Illinois Tool Works, Inc.^ | | | 653,305 | | | | 60,548,307 | |
Parker Hannifin Corp.^ | | | 874,130 | | | | 84,773,128 | |
United Technologies Corp.^ | | | 1,130,190 | | | | 108,577,353 | |
| | | | | | | | 362,441,176 | |
|
| Information Technology — 11.8% | |
Alphabet, Inc., Class A* | | | 152,975 | | | | 119,016,080 | |
Apple Computer, Inc.^ | | | 976,961 | | | | 102,834,915 | |
Cisco Systems, Inc.^ | | | 3,058,370 | | | | 83,050,037 | |
International Business Machines Corp.^ | | | 485,540 | | | | 66,820,015 | |
Juniper Networks, Inc.^ | | | 1,371,715 | | | | 37,859,334 | |
Microsoft Corp. | | | 908,009 | | | | 50,376,339 | |
Vantiv, Inc., Class A*^ | | | 1,285,230 | | | | 60,945,607 | |
| | | | | | | | 520,902,327 | |
| |
| Total Common Stocks | | | $ | 3,661,897,692 | |
|
| Registered Investment Companies — 35.9% | |
State Street Institutional Liquid Reserves Fund, Premier Class,
0.24%S | | | 712,734,898 | | | $ | 712,734,898 | |
State Street Navigator Securities Lending Prime Portfolio,
0.31%†S | | | 869,849,277 | | | | 869,849,277 | |
| |
| Total Registered Investment Companies | | | $ | 1,582,584,175 | |
| | | | | | |
| | | Shares | | Fair
Value | |
|
| Total Investment Securities — 118.8% | |
Cost ($4,671,826,492)** | | $ | 5,244,481,867 | |
| |
Segregated Cash
With Custodian — 19.6% | | | 866,200,205 | |
|
| Securities Sold Short — (22.0)% | |
(Proceeds $910,148,607) | | | (968,197,388 | ) |
| |
Net Other Assets
(Liabilities) — (16.4)% | | | (729,781,697 | ) |
| |
| Net Assets — 100.0% | | $ | 4,412,702,987 | |
| * | Non-income producing security. |
| ^ | All or a portion of the security is on loan. The total fair value of the securities on loan as of December 31, 2015 was $850,920,868. |
| † | This security, which was purchased using cash collateral received from securities on loan, represents collateral for securities loaned as of December 31, 2015. |
| S | Rate represents the daily yield on December 31, 2015. |
| ** | Represents cost for financial reporting purposes. |
PLC – Public Limited Company
See accompanying Notes to Financial Statements
| | | | | | | | | | | | | | |
| 42 | | DIAMOND HILL FUNDS | | | | | ANNUAL REPORT | | | | | DECEMBER 31, 2015 | | | | | DIAMOND-HILL.COM |
Diamond Hill Long-Short Fund
Schedule of Investments Sold Short
December 31, 2015
| | | | | | | | |
| | | Shares | | | Fair
Value | |
|
| Common Stocks — 22.0% | |
| Consumer Discretionary — 4.9% | |
American Eagle Outfitters, Inc. | | | 606,290 | | | $ | 9,397,495 | |
Best Buy Co., Inc. | | | 1,774,745 | | | | 54,040,985 | |
Brunswick Corp. | | | 581,595 | | | | 29,376,364 | |
Grand Canyon Education, Inc.* | | | 665,870 | | | | 26,714,704 | |
New York Times Co., The, Class A | | | 1,462,880 | | | | 19,631,850 | |
Polaris Industries, Inc. | | | 179,895 | | | | 15,461,975 | |
Tractor Supply Co. | | | 490,773 | | | | 41,961,092 | |
Under Armour, Inc., Class A* | | | 226,585 | | | | 18,265,017 | |
| | | | | | | | 214,849,482 | |
|
| Consumer Staples — 2.8% | |
Campbell Soup Co. | | | 1,034,270 | | | | 54,350,887 | |
Colgate-Palmolive Co. | | | 296,700 | | | | 19,766,154 | |
ConAgra Foods, Inc. | | | 334,680 | | | | 14,110,109 | |
Kellogg Co. | | | 465,445 | | | | 33,637,710 | |
| | | | | | | | 121,864,860 | |
|
| Energy — 0.4% | |
BP plc | | | 512,435 | | | | 16,018,718 | |
|
| Financials — 4.6% | |
BancorpSouth, Inc. | | | 405,920 | | | | 9,738,021 | |
Cincinnati Financial Corp. | | | 1,228,365 | | | | 72,682,356 | |
First American Financial Corp. | | | 947,675 | | | | 34,021,533 | |
Hanover Insurance Group, Inc. | | | 468,830 | | | | 38,134,632 | |
Mercury General Corp. | | | 386,430 | | | | 17,996,045 | |
Selective Insurance Group, Inc. | | | 980,850 | | | | 32,936,943 | |
| | | | | | | | 205,509,530 | |
|
| Health Care — 2.7% | |
Abbvie, Inc. | | | 410,585 | | | | 24,323,055 | |
Celgene Corp.* | | | 266,660 | | | | 31,935,202 | |
DENTSPLY International, Inc. | | | 351,075 | | | | 21,362,914 | |
IDEXX Laboratories, Inc.* | | | 281,355 | | | | 20,516,407 | |
Myriad Genetics, Inc.* | | | 488,550 | | | | 21,085,818 | |
| | | | | | | | 119,223,396 | |
|
| Industrials — 0.2% | |
JetBlue Airways Corp.* | | | 402,270 | | | | 9,111,416 | |
|
| Information Technology — 1.9% | |
Arista Networks, Inc.* | | | 288,375 | | | | 22,447,110 | |
| | | | | | | | |
| | | Shares | | | Fair
Value | |
|
| Information Technology — 1.9% continued | |
LogMeIn, Inc.* | | | 413,510 | | | $ | 27,746,521 | |
NETGEAR, Inc.* | | | 309,215 | | | | 12,959,201 | |
Western Union Co. | | | 1,183,700 | | | | 21,200,067 | |
| | | | | | | | 84,352,899 | |
|
| Telecommunication Services — 1.2% | |
AT&T, Inc. | | | 652,645 | | | | 22,457,514 | |
Level 3 Communications, Inc.* | | | 563,590 | | | | 30,636,753 | |
| | | | | | | | 53,094,267 | |
|
| Utilities — 0.3% | |
Consolidated Edison, Inc. | | | 193,650 | | | | 12,445,886 | |
| |
| Total Common Stocks | | | $ | 836,470,454 | |
|
| Registered Investment Company — 3.0% | |
| Industrials — 3.0% | |
Industrial Select Sector SPDR Fund
2.10% | | | 2,484,945 | | | | 131,726,934 | |
|
| Total Securities Sold Short — 22.0% | |
(Proceeds $910,148,607) | | | $ | 968,197,388 | |
| * | Non-dividend expense producing security. |
Percentages disclosed are based on total net assets of the Fund at December 31, 2015.
PLC – Public Limited Company
SPDR – Standard & Poor’s Depositary Receipt
See accompanying Notes to Financial Statements
| | | | | | | | | | | | | | | | |
| DIAMOND HILL FUNDS | | | | | ANNUAL REPORT | | | | | DECEMBER 31, 2015 | | | | | DIAMOND-HILL.COM | | | 43 | |
Diamond Hill Research Opportunities Fund
Schedule of Investments
December 31, 2015
| | | | | | | | |
| | | Shares | | | Fair
Value | |
|
| Common Stocks — 98.2% | |
| Consumer Discretionary — 17.5% | |
Aaron’s, Inc. | | | 24,000 | | | $ | 537,360 | |
Charter Communications, Inc., Class A*^ | | | 1,900 | | | | 347,890 | |
Dollar General Corp. | | | 4,030 | | | | 289,636 | |
Jarden Corp.*^ | | | 27,400 | | | | 1,565,089 | |
Liberty Global plc, Class A*^ | | | 39,405 | | | | 1,669,196 | |
TJX Cos., Inc., The | | | 6,426 | | | | 455,668 | |
Twenty-First Century Fox, Inc. | | | 40,080 | | | | 1,091,378 | |
Vail Resorts, Inc. | | | 8,800 | | | | 1,126,312 | |
VF Corp. | | | 12,300 | | | | 765,675 | |
Whirlpool Corp. | | | 12,430 | | | | 1,825,594 | |
| | | | | | | | 9,673,798 | |
|
| Consumer Staples — 6.7% | |
B&G Foods, Inc.^ | | | 22,165 | | | | 776,218 | |
Post Holdings, Inc.*^ | | | 35,028 | | | | 2,161,227 | |
Tesco plc ADR* | | | 113,030 | | | | 744,868 | |
| | | | | | | | 3,682,313 | |
|
| Energy — 0.9% | |
Cimarex Energy Co. | | | 5,791 | | | | 517,600 | |
|
| Financials — 13.7% | |
Fortress Investment Group LLC, Class A | | | 184,471 | | | | 938,958 | |
Franklin Resources, Inc.^ | | | 23,621 | | | | 869,725 | |
iStar Financial, Inc. REIT*^ | | | 68,185 | | | | 799,810 | |
MetLife, Inc. | | | 22,170 | | | | 1,068,817 | |
Nationstar Mortgage Holdings, Inc.* | | | 126,284 | | | | 1,688,416 | |
Popular, Inc. | | | 38,460 | | | | 1,089,956 | |
Willis Group Holdings plc | | | 22,599 | | | | 1,097,632 | |
| | | | | | | | 7,553,314 | |
|
| Health Care — 21.7% | |
Alere, Inc.* | | | 16,120 | | | | 630,132 | |
Allergan plc*^ | | | 2,625 | | | | 820,313 | |
BioScrip, Inc.*^ | | | 692,399 | | | | 1,211,698 | |
Concordia Healthcare Corp. | | | 12,750 | | | | 520,583 | |
ENDO International plc*^ | | | 11,350 | | | | 694,847 | |
Express Scripts Holding Co.*^ | | | 4,100 | | | | 358,381 | |
GlaxoSmithKline plc ADR | | | 63,943 | | | | 2,580,100 | |
H. Lundbeck A/S (DK)* | | | 16,464 | | | | 562,266 | |
LifePoint Hospitals, Inc.* | | | 8,795 | | | | 645,553 | |
Stryker Corp.^ | | | 6,395 | | | | 594,351 | |
Universal American Financial Corp. | | | 66,660 | | | | 466,620 | |
Valeant Pharmaceuticals International, Inc.* | | | 28,525 | | | | 2,899,566 | |
| | | | | | | | 11,984,410 | |
| | | | | | | | |
| | | Shares | | | Fair
Value | |
|
| Industrials — 15.7% | |
Aircastle Ltd.^ | | | 44,000 | | | $ | 919,160 | |
Colfax Corp.*^ | | | 92,925 | | | | 2,169,798 | |
Emerson Electric Co. | | | 5,190 | | | | 248,238 | |
Hub Group, Inc., Class A* | | | 108,620 | | | | 3,579,028 | |
Kirby Corp.* | | | 28,500 | | | | 1,499,670 | |
SPX FLOW, Inc.* | | | 9,360 | | | | 261,238 | |
| | | | | | | | 8,677,132 | |
|
| Information Technology — 21.6% | |
Alphabet, Inc., Class A* | | | 1,771 | | | | 1,377,856 | |
Anixter International, Inc.*^ | | | 13,970 | | | | 843,648 | |
Apple Computer, Inc. | | | 6,005 | | | | 632,086 | |
Cisco Systems, Inc.^ | | | 71,398 | | | | 1,938,812 | |
CommScope Holding, Inc.*^ | | | 73,106 | | | | 1,892,714 | |
CSG Systems International, Inc.^ | | | 25,285 | | | | 909,754 | |
International Business Machines Corp.^ | | | 10,692 | | | | 1,471,433 | |
Keysight Technologies, Inc.* | | | 29,130 | | | | 825,253 | |
Linear Technology Corp.^ | | | 25,442 | | | | 1,080,523 | |
Microsoft Corp.^ | | | 17,710 | | | | 982,551 | |
| | | | | | | | 11,954,630 | |
|
| Materials — 0.4% | |
Axalta Coating Systems Ltd.* | | | 9,050 | | | | 241,183 | |
| |
| Total Common Stocks | | | $ | 54,284,380 | |
|
| Corporate Bonds — 3.4% | |
| Consumer Discretionary — 0.7% | |
Laureate Education, Inc., 10.00%, 09/01/19 | | $ | 650,000 | | | | 403,000 | |
|
| Telecommunication Services — 2.7% | |
Frontier Communications Corp., 10.50%, 09/15/22 | | $ | 1,500,000 | | | | 1,490,625 | |
| |
| Total Corporate Bonds | | | $ | 1,893,625 | |
|
| Registered Investment Company — 29.0% | |
State Street Navigator Securities Lending Prime Portfolio,
0.31%†S | | | 15,985,758 | | | | 15,985,758 | |
| |
| Total Registered Investment Companies | | | $ | 15,985,758 | |
| | | | | | | | | | | | | | |
| 44 | | DIAMOND HILL FUNDS | | | | | ANNUAL REPORT | | | | | DECEMBER 31, 2015 | | | | | DIAMOND-HILL.COM |
Diamond Hill Research Opportunities Fund
Schedule of Investments (Continued)
December 31, 2015
Diamond Hill Research Opportunities Fund
Schedule of Investments Sold Short
December 31, 2015
| | | | | | |
| | | Shares | | Fair
Value | |
|
| Total Investment Securities — 130.6% | |
Cost ($71,169,125)** | | $ | 72,163,763 | |
| |
Segregated Cash
With Custodian — 20.2% | | | 11,159,004 | |
|
| Securities Sold Short — (20.1)% | |
(Proceeds $10,603,911) | | | | | (11,124,763 | ) |
| |
Net Other Assets
(Liabilities) — (30.7)% | | | (16,992,908 | ) |
| | |
| Net Assets — 100.0% | | | | $ | 55,205,096 | |
| * | Non-income producing security. |
| ^ | All or a portion of the security is on loan. The total fair value of the securities on loan as of December 31, 2015 was $15,534,005. |
| † | This security, which was purchased using cash collateral received from securities on loan, represents collateral for securities loaned as of December 31, 2015. |
| S | Rate represents the daily yield on December 31, 2015. |
| ** | Represents cost for financial reporting purposes. |
PLC – Public Limited Company
REIT – Real Estate Investment Trust
ADR – American Depositary Receipt
DK – Danish Security
See accompanying Notes to Financial Statements
| | | | | | | | |
| | | Shares | | | Fair
Value | |
| Common Stocks — 20.1% | |
| Consumer Discretionary — 5.7% | |
American Eagle Outfitters, Inc. | | | 35,285 | | | $ | 546,918 | |
Best Buy Co., Inc. | | | 43,885 | | | | 1,336,297 | |
Brunswick Corp. | | | 6,500 | | | | 328,315 | |
Grand Canyon Education, Inc.* | | | 3,553 | | | | 142,546 | |
Polaris Industries, Inc. | | | 5,420 | | | | 465,849 | |
Under Armour, Inc., Class A* | | | 4,400 | | | | 354,684 | |
| | | | | | | | 3,174,609 | |
| Consumer Staples — 2.1% | |
Campbell Soup Co. | | | 9,000 | | | | 472,950 | |
ConAgra Foods, Inc. | | | 6,000 | | | | 252,960 | |
Kellogg Co. | | | 6,000 | | | | 433,620 | |
| | | | | | | | 1,159,530 | |
| Financials — 2.3% | |
BancorpSouth, Inc. | | | 9,960 | | | | 238,940 | |
Cincinnati Financial Corp. | | | 3,521 | | | | 208,338 | |
First American Financial Corp. | | | 6,850 | | | | 245,915 | |
Hanover Insurance Group, Inc. | | | 4,790 | | | | 389,619 | |
Selective Insurance Group, Inc. | | | 5,153 | | | | 173,038 | |
| | | | | | | | 1,255,850 | |
| Health Care — 3.8% | |
Abbvie, Inc. | | | 4,133 | | | | 244,839 | |
Celgene Corp.* | | | 5,335 | | | | 638,920 | |
DENTSPLY International, Inc. | | | 7,695 | | | | 468,241 | |
IDEXX Laboratories, Inc.* | | | 5,840 | | | | 425,853 | |
Myriad Genetics, Inc.* | | | 7,200 | | | | 310,752 | |
| | | | | | | | 2,088,605 | |
| Industrials — 1.3% | |
Boeing Co., The | | | 5,000 | | | | 722,950 | |
| Information Technology — 4.1% | |
Arista Networks, Inc.* | | | 4,693 | | | | 365,303 | |
LogMeIn, Inc.* | | | 16,188 | | | | 1,086,214 | |
NETGEAR, Inc.* | | | 9,183 | | | | 384,860 | |
Western Union Co. | | | 23,666 | | | | 423,858 | |
| | | | | | | | 2,260,235 | |
| Telecommunication Services — 0.8% | |
Level 3 Communications, Inc.* | | | 8,517 | | | | 462,984 | |
|
| Total Securities Sold Short — 20.1% | |
(Proceeds $10,603,911) | | | $ | 11,124,763 | |
| * | Non-dividend expense producing security. |
Percentages disclosed are based on total net assets of the Fund at December 31, 2015.
See accompanying Notes to Financial Statements
| | | | | | | | | | | | | | | | |
| DIAMOND HILL FUNDS | | | | | ANNUAL REPORT | | | | | DECEMBER 31, 2015 | | | | | DIAMOND-HILL.COM | | | 45 | |
Diamond Hill Financial Long-Short Fund
Schedule of Investments
December 31, 2015
| | | | | | | | |
| | | Shares | | | Fair Value | |
|
| Common Stocks — 93.7% | |
| Banks, Thrifts & Mortgage Finance — 34.3% | |
Bank of Marin Bancorp | | | 2,581 | | | $ | 137,825 | |
BOK Financial Corp.^ | | | 9,575 | | | | 572,489 | |
Bridge Bancorp, Inc. | | | 19,225 | | | | 585,017 | |
Citigroup, Inc.^ | | | 35,905 | | | | 1,858,083 | |
First Horizon National Corp.^ | | | 22,985 | | | | 333,742 | |
First of Long Island Corp., The | | | 15,223 | | | | 456,690 | |
First Republic Bank^ | | | 7,555 | | | | 499,083 | |
Nationstar Mortgage Holdings, Inc.* | | | 94,770 | | | | 1,267,075 | |
PNC Financial Services Group, Inc.^ | | | 984 | | | | 93,785 | |
Popular, Inc.^ | | | 63,070 | | | | 1,787,404 | |
State Bank Financial Corp. | | | 25,190 | | | | 529,746 | |
Sterling Bancorp | | | 17,268 | | | | 280,087 | |
SunTrust Banks, Inc. | | | 6,237 | | | | 267,193 | |
SVB Financial Group* | | | 5,175 | | | | 615,308 | |
Wells Fargo & Co. | | | 2,300 | | | | 125,028 | |
| | | | | | | | 9,408,555 | |
|
| Capital Markets — 9.2% | |
Fortress Investment Group LLC, Class A | | | 267,070 | | | | 1,359,387 | |
Franklin Resources, Inc.^ | | | 31,860 | | | | 1,173,085 | |
| | | | | | | | 2,532,472 | |
|
| Consumer Financial Services — 7.3% | |
American Express Co. | | | 10,610 | | | | 737,926 | |
Capital One Financial Corp.^ | | | 17,380 | | | | 1,254,487 | |
| | | | | | | | 1,992,413 | |
|
| Diversified Financial Services — 8.8% | |
BankUnited, Inc. | | | 22,785 | | | | 821,627 | |
JPMorgan Chase & Co.^ | | | 11,800 | | | | 779,154 | |
Morgan Stanley | | | 25,925 | | | | 824,674 | |
| | | | | | | | 2,425,455 | |
|
| Insurance — 25.2% | |
American International Group, Inc. | | | 2,245 | | | | 139,123 | |
Brown & Brown, Inc.^ | | | 32,475 | | | | 1,042,447 | |
Enstar Group Ltd.* | | | 2,380 | | | | 357,095 | |
Loews Corp.^ | | | 31,680 | | | | 1,216,512 | |
MetLife, Inc. | | | 29,390 | | | | 1,416,892 | |
ProAssurance Corp. | | | 5,050 | | | | 245,077 | |
Progressive Corp.^ | | | 4,510 | | | | 143,418 | |
Prudential Financial, Inc.^ | | | 5,345 | | | | 435,136 | |
Willis Group Holdings plc | | | 38,750 | | | | 1,882,088 | |
| | | | | | | | 6,877,788 | |
| | | | | | | | |
| | | Shares | | | Fair Value | |
|
| IT Services/Other — 1.5% | |
Vantiv, Inc., Class A*^ | | | 9,060 | | | $ | 429,626 | |
|
| REITs & Real Estate Management — 7.4% | |
Colony Capital, Inc., Class A | | | 44,620 | | | | 869,198 | |
iStar Financial, Inc. REIT*^ | | | 99,258 | | | | 1,164,296 | |
| | | | | | | | 2,033,494 | |
| |
| Total Common Stocks | | | $ | 25,699,803 | |
|
| Registered Investment Companies — 31.9% | |
State Street Institutional Liquid Reserves Fund, Premier Class,
0.24%S | | | 1,203,256 | | | | 1,203,256 | |
State Street Navigator Securities Lending Prime Portfolio,
0.31%†S | | | 7,536,021 | | | | 7,536,021 | |
| |
| Total Registered Investment Companies | | | $ | 8,739,277 | |
|
| Total Investment Securities — 125.6% | |
(Cost $33,527,226)** | | | $ | 34,439,080 | |
| |
Segregated Cash
With Custodian — 12.3% | | | | 3,361,324 | |
|
| Securities Sold Short — (11.7)% | |
(Proceeds $2,855,461) | | | | (3,226,240 | ) |
| |
Net Other Assets
(Liabilities) — (26.2)% | | | | (7,157,697 | ) |
| |
| Net Assets — 100.0% | | | $ | 27,416,467 | |
| * | Non-income producing security. |
| ^ | All or a portion of the security is on loan. The total fair value of the securities on loan as of December 31, 2015 was $7,365,041. |
| † | This security, which was purchased using cash collateral received from securities on loan, represents collateral for securities loaned as of December 31, 2015. |
| S | Rate represents the daily yield on December 31, 2015. |
| ** | Represents cost for financial reporting purposes. |
PLC – Public Liability Company
REIT – Real Estate Investment Trust
See accompanying Notes to Financial Statements
| | | | | | | | | | | | | | |
| 46 | | DIAMOND HILL FUNDS | | | | | ANNUAL REPORT | | | | | DECEMBER 31, 2015 | | | | | DIAMOND-HILL.COM |
Diamond Hill Financial Long-Short Fund
Schedule of Investments Sold Short
December 31, 2015
Diamond Hill Strategic Income Fund
Schedule of Investments
December 31, 2015
| | | | | | | | |
| | | Shares | | | Fair Value | |
|
| Common Stocks — 11.7% | |
| Banks, Thrifts & Mortgage Finance — 1.1% | |
BancorpSouth, Inc. | | | 6,915 | | | $ | 165,891 | |
Westamerica BanCorp. | | | 3,135 | | | | 146,561 | |
| | | | | | | | 312,452 | |
|
| Insurance — 9.5% | |
Cincinnati Financial Corp. | | | 12,850 | | | | 760,334 | |
First American Financial Corp. | | | 13,715 | | | | 492,369 | |
Hanover Insurance Group, Inc. | | | 8,370 | | | | 680,815 | |
Mercury General Corp. | | | 4,480 | | | | 208,634 | |
Selective Insurance Group, Inc. | | | 13,720 | | | | 460,718 | |
| | | | | | | | 2,602,870 | |
|
| IT Services/Other — 1.1% | |
Western Union Co. | | | 17,360 | | | | 310,918 | |
|
| Total Securities Sold Short — 11.7% | |
(Proceeds $2,855,461) | | | $ | 3,226,240 | |
Percentages disclosed are based on total net assets of the Fund at December 31, 2015.
See accompanying Notes to Financial Statements
| | | | | | | | |
| | | Shares/
Par Value | | | Fair
Value | |
|
| Collateralized Debt Obligations — 0.3% | |
Alesco Preferred Funding Ltd., Class PPNE, 3/23/35#* | | $ | 336,608 | | | $ | 106,745 | |
Alesco Preferred Funding VI, Class PNN, 3/23/35#* | | | 621,631 | | | | 206,804 | |
Fort Sheridan ABS CDO Ltd., Class PPN2, 11/5/41#* | | | 611,948 | | | | 239,113 | |
Taberna Preferred Funding Ltd., Class PPN2, 7/5/35#* | | | 1,175,564 | | | | 390,604 | |
| |
| Total Collateralized Debt Obligations | | | $ | 943,266 | |
|
| Corporate Bonds — 82.5% | |
| Consumer Discretionary — 18.5% | |
Altice SA,
7.75%, 5/15/22†† | | | 5,300,000 | | | | 4,783,250 | |
Avis Budget Car/Finance,
4.88%, 11/15/17 | | | 5,304,000 | | | | 5,410,080 | |
Bankrate, Inc.,
6.13%, 8/15/18^†† | | | 5,634,000 | | | | 5,690,340 | |
CCM Merger, Inc.,
9.13%, 5/1/19†† | | | 4,755,000 | | | | 4,963,031 | |
Cimpress NV,
7.00%, 4/1/22†† | | | 685,000 | | | | 657,600 | |
Laureate Education, Inc.,
10.00%, 9/1/19^†† | | | 4,700,000 | | | | 2,914,000 | |
Liberty Interactive LLC,
8.25%, 2/1/30 | | | 2,922,000 | | | | 2,907,390 | |
Live Nation Entertainment,
7.00%, 9/1/20†† | | | 6,144,000 | | | | 6,359,039 | |
McGraw-Hill Global Education Holdings LLC,
9.75%, 4/1/21 | | | 1,075,000 | | | | 1,139,500 | |
MHGE Parent LLC/Finance,
8.50%, 8/1/19^†† | | | 3,150,000 | | | | 3,118,500 | |
Playa Resorts Holdings,
8.00%, 8/15/20†† | | | 210,000 | | | | 213,150 | |
Radio One, Inc.,
7.38%, 10/15/22†† | | | 1,900,000 | | | | 1,691,000 | |
Radio One, Inc.,
9.25%, 2/15/20†† | | | 3,434,000 | | | | 2,712,860 | |
Rent-A-Center, Inc.,
4.75%, 5/1/21 | | | 8,484,000 | | | | 6,341,790 | |
| | | | | | | | | | | | | | | | |
| DIAMOND HILL FUNDS | | | | | ANNUAL REPORT | | | | | DECEMBER 31, 2015 | | | | | DIAMOND-HILL.COM | | | 47 | |
Diamond Hill Strategic Income Fund
Schedule of Investments (Continued)
December 31, 2015
| | | | | | | | |
| | | Shares/
Par Value | | | Fair
Value | |
|
| Corporate Bonds — 82.5% continued | |
| Consumer Discretionary — 18.5% continued | |
Rivers Pittsburgh Borrower LP/Finance,
9.50%, 6/15/19†† | | $ | 8,066,000 | | | $ | 8,348,310 | |
Tenneco, Inc.,
6.88%, 12/15/20 | | | 4,186,000 | | | | 4,332,510 | |
| | | | | | | | 61,582,350 | |
|
| Consumer Staples — 0.5% | |
Post Holdings, Inc.,
7.75%, 3/15/24†† | | | 1,635,000 | | | | 1,712,663 | |
|
| Energy — 7.3% | |
Carrizo Oil & Gas, Inc.,
7.50%, 9/15/20 | | | 5,560,000 | | | | 4,858,050 | |
Cimarex Energy Co.,
5.88%, 5/1/22 | | | 1,460,000 | | | | 1,398,743 | |
Continental Resources, Inc.,
4.90%, 6/1/44 | | | 3,925,000 | | | | 2,367,470 | |
Diamondback Energy, Inc.,
7.63%, 10/1/21 | | | 4,921,000 | | | | 4,970,210 | |
Energen Corp.,
7.13%, 2/15/28^ | | | 400,000 | | | | 367,000 | |
McDermott International, Inc.,
8.00%, 5/1/21^†† | | | 4,634,000 | | | | 3,684,030 | |
Southwestern Energy Co.,
4.95%, 1/23/25^ | | | 3,210,000 | | | | 2,022,300 | |
Southwestern Energy Co.,
7.50%, 2/1/18^ | | | 2,450,000 | | | | 2,082,500 | |
WPX Energy, Inc.,
7.50%, 8/1/20^ | | | 3,140,000 | | | | 2,543,400 | |
| | |
| | | | | | | | 24,293,703 | |
|
| Financials — 16.5% | |
Axalta Coating Systems Dutch Holding,
7.38%, 5/1/21†† | | | 545,000 | | | | 574,634 | |
CNA Financial Corp.,
6.50%, 8/15/16 | | | 2,165,000 | | | | 2,229,251 | |
Compass Investors, Inc.,
7.75%, 1/15/21†† | | | 3,350,000 | | | | 3,216,000 | |
iStar Financial, Inc., Series B,
9.00%, 6/1/17 | | | 1,445,000 | | | | 1,517,250 | |
iStar Financial, Inc.,
4.88%, 7/1/18 | | | 4,725,000 | | | | 4,630,500 | |
iStar Financial, Inc.,
5.00%, 7/1/19 | | | 2,160,000 | | | | 2,097,900 | |
| | | | | | | | |
| | | Shares/
Par Value | | | Fair
Value | |
|
| Financials —16.5% continued | |
Nationstar Mortgage/Capital Corp.,
9.63%, 5/1/19 | | $ | 3,780,000 | | | $ | 3,902,850 | |
Nationstar Mortgage/Capital Corp.,
6.50%, 7/1/21 | | | 7,440,000 | | | | 6,584,400 | |
OneMain Finance Holdings, Inc.,
7.25%, 12/15/21†† | | | 4,800,000 | | | | 4,812,000 | |
Popular, Inc.,
7.00%, 7/1/19 | | | 12,573,000 | | | | 11,755,755 | |
Quicken Loans, Inc.,
5.75%, 5/1/25†† | | | 1,950,000 | | | | 1,857,375 | |
Radian Group, Inc.,
5.25%, 6/15/20 | | | 6,775,000 | | | | 6,552,780 | |
Synovus Financial Corp.,
5.13%, 6/15/17 | | | 3,350,000 | | | | 3,433,750 | |
Synovus Financial Corp.,
7.88%, 2/15/19 | | | 1,775,000 | | | | 1,970,250 | |
| |
| | | | | 55,134,695 | |
|
| Health Care — 9.9% | |
BioScrip, Inc.,
8.88%, 2/15/21 | | | 4,155,000 | | | | 3,303,225 | |
Concordia Healthcare Corp.,
9.50%, 10/21/22^†† | | | 1,925,000 | | | | 1,896,125 | |
Endo Finance LLC,
6.00%, 7/15/23†† | | | 1,750,000 | | | | 1,741,250 | |
Greatbatch Ltd.,
9.13%, 11/1/23†† | | | 4,840,000 | | | | 4,791,600 | |
Horizon Pharma Financing,
6.63%, 5/1/23^†† | | | 2,975,000 | | | | 2,647,750 | |
Kindred Healthcare, Inc.,
8.75%, 1/15/23 | | | 4,800,000 | | | | 4,416,000 | |
Kindred Healthcare, Inc.,
6.38%, 4/15/22 | | | 1,900,000 | | | | 1,577,000 | |
Tenet Healthcare Corp.,
8.13%, 4/1/22 | | | 3,000,000 | | | | 2,992,500 | |
Valeant Pharmaceuticals International, Inc.,
6.38%, 10/15/20†† | | | 9,840,000 | | | | 9,495,600 | |
| | |
| | | | | | | | 32,861,050 | |
|
| Industrials — 12.9% | |
American Airlines, Inc., Class B, Series 2013-1,
5.63%, 1/15/21†† | | | 2,654,717 | | | | 2,687,901 | |
BlueLine Rental LLC,
7.00%, 2/1/19†† | | | 2,815,000 | | | | 2,533,500 | |
| | | | | | | | | | | | | | |
| 48 | | DIAMOND HILL FUNDS | | | | | ANNUAL REPORT | | | | | DECEMBER 31, 2015 | | | | | DIAMOND-HILL.COM |
Diamond Hill Strategic Income Fund
Schedule of Investments (Continued)
December 31, 2015
| | | | | | | | |
| | | Shares/
Par Value | | | Fair
Value | |
|
| Corporate Bonds — 82.5% continued | |
| Industrials — 12.9% continued | |
Casella Waste Systems, Inc.,
7.75%, 2/15/19 | | $ | 10,235,000 | | | $ | 10,158,237 | |
Optimas OE Solution Holding,
8.63%, 6/1/21†† | | | 4,375,000 | | | | 3,718,750 | |
Summit Materials LLC,
6.13%, 7/15/23 | | | 250,000 | | | | 246,250 | |
Summit Materials LLC/Finance,
6.13%, 7/15/23†† | | | 2,000,000 | | | | 1,970,000 | |
U.S. Airways Pass-Through Trust, Class B, Series 2012-2B,
6.75%, 6/3/21 | | | 3,643,339 | | | | 3,825,506 | |
United Airlines, Inc., Class B, Series 2013-1B,
5.38%, 2/15/23 | | | 6,412,950 | | | | 6,621,372 | |
United Airlines, Inc., Class A, Series 2007-1,
6.64%, 7/2/22 | | | 3,633,467 | | | | 3,869,642 | |
United Rentals, Inc.,
7.63%, 4/15/22 | | | 3,775,000 | | | | 4,034,343 | |
Vander Intermediate Holding,
9.75%, 2/1/19^†† | | | 1,595,000 | | | | 1,036,750 | |
XPO Logistics, Inc.,
6.50%, 6/15/22^†† | | | 2,590,000 | | | | 2,395,750 | |
| | |
| | | | | | | | 43,098,001 | |
|
| Information Technology—1.8% | |
Activision Blizzard, Inc.,
5.63%, 9/15/21†† | | | 2,000,000 | | | | 2,095,000 | |
Interface Security Systems Holdings, Inc.,
9.25%, 1/15/18 | | | 4,090,000 | | | | 4,008,200 | |
| | |
| | | | | | | | 6,103,200 | |
|
| Materials — 6.3% | |
Cemex Finance LLC,
9.38%, 10/12/22†† | | | 6,335,000 | | | | 6,667,588 | |
FMG Resources (August 2006),
9.75%, 3/1/22^†† | | | 2,650,000 | | | | 2,424,750 | |
Mobile Mini, Inc.,
7.88%, 12/1/20 | | | 4,255,000 | | | | 4,403,925 | |
| | | | | | | | |
| | | Shares/
Par Value | | | Fair
Value | |
|
| Materials — 6.3% continued | |
NCI Building Systems, Inc.,
8.25%, 1/15/23†† | | $ | 2,522,000 | | | $ | 2,648,100 | |
Platform Specialty Products,
6.50%, 2/1/22^†† | | | 5,540,000 | | | | 4,792,100 | |
| | | | | | | | 20,936,463 | |
|
| Telecommunication Services — 7.6% | |
Cincinnati Bell, Inc.,
8.38%, 10/15/20 | | | 10,242,000 | | | | 10,472,445 | |
Cogent Communications Finance, Inc.,
5.63%, 4/15/21†† | | | 8,615,000 | | | | 8,011,950 | |
Frontier Communications Corp.,
10.50%, 9/15/22†† | | | 6,800,000 | | | | 6,757,500 | |
| | | | | | | | 25,241,895 | |
|
| Utilities — 1.2% | |
Source Gas LLC,
5.90%, 4/1/17†† | | | 4,000,000 | | | | 4,157,928 | |
| |
| Total Corporate Bonds | | | $ | 275,121,948 | |
|
| Registered Investment Companies — 17.4% | |
State Street Institutional Liquid Reserves Fund, Premier Class,
0.24%S | | | 35,797,669 | | | | 35,797,669 | |
State Street Navigator Securities Lending Prime Portfolio,
0.31%†S | | | 22,253,070 | | | | 22,253,070 | |
| |
| Total Registered Investment Companies | | | $ | 58,050,739 | |
|
| Total Investment Securities — 100.2% | |
(Cost $351,034,970)** | | | $ | 334,115,953 | |
| |
Net Other Assets
(Liabilities) — (0.2)% | | | | (578,177 | ) |
| |
| Net Assets — 100.0% | | | $ | 333,537,776 | |
| * | Non-income producing security. |
| ** | Represents cost for financial reporting purposes. |
| | | | | | | | | | | | | | | | |
| DIAMOND HILL FUNDS | | | | | ANNUAL REPORT | | | | | DECEMBER 31, 2015 | | | | | DIAMOND-HILL.COM | | | 49 | |
Diamond Hill Strategic Income Fund
Schedule of Investments (Continued)
December 31, 2015
| †† | Restricted securities not registered under the Securities Act of 1933 are as follows: |
| | | | | | | | | | | | | | | | |
| | | Acquisition
Date | | | Current
Cost | | | Fair
Value | | | Value
as a
% of
Net
Assets | |
Activision Blizzard, Inc. | | | August-15 | | | $ | 2,100,000 | | | $ | 2,095,000 | | | | 0.6% | |
Altice SA | | | May-15 | | | | 5,232,749 | | | | 4,783,250 | | | | 1.4% | |
American Airlines, Inc., Series 2013-1, Class B | | | October-15 | | | | 2,714,448 | | | | 2,687,901 | | | | 0.8% | |
Axalta Coating Systems Dutch Holding | | | September-15 | | | | 577,155 | | | | 574,634 | | | | 0.2% | |
Bankrate, Inc. | | | September-15 | | | | 5,508,070 | | | | 5,690,340 | | | | 1.7% | |
BlueLine Rental LLC | | | July-15 | | | | 2,868,100 | | | | 2,533,500 | | | | 0.8% | |
CCM Merger, Inc. | | | September-15 | | | | 4,992,981 | | | | 4,963,031 | | | | 1.5% | |
Cemex Finance LLC | | | September-15 | | | | 6,977,525 | | | | 6,667,588 | | | | 2.1% | |
Cimpress NV | | | | | | | 668,850 | | | | 657,600 | | | | 0.2% | |
Cogent Communications Finance, Inc. | | | April-15 | | | | 8,431,675 | | | | 8,011,950 | | | | 2.4% | |
Compass Investors, Inc. | | | August-15 | | | | 3,260,385 | | | | 3,216,000 | | | | 1.0% | |
Concordia Healthcare Corp. | | | | | | | 1,867,250 | | | | 1,896,125 | | | | 0.6% | |
Endo Finance LLC | | | June-15 | | | | 1,750,000 | | | | 1,741,250 | | | | 0.5% | |
FMG Resources (August 2006) | | | April-15 | | | | 2,603,750 | | | | 2,424,750 | | | | 0.7% | |
Frontier Communications Corp. | | | September-15 | | | | 6,954,275 | | | | 6,757,500 | | | | 2.0% | |
Greatbatch Ltd. | | | | | | | 4,840,350 | | | | 4,791,600 | | | | 1.5% | |
Horizon Pharma Financing | | | April-15 | | | | 3,029,150 | | | | 2,647,750 | | | | 0.8% | |
Laureate Education, Inc. | | | August-15 | | | | 4,620,013 | | | | 2,914,000 | | | | 0.9% | |
Live Nation Entertainment | | | February-15 | | | | 6,695,749 | | | | 6,359,039 | | | | 2.0% | |
McDermott International, Inc. | | | July-15 | | | | 4,489,114 | | | | 3,684,030 | | | | 1.1% | |
MHGE Parent LLC/Finance | | | July-15 | | | | 3,093,955 | | | | 3,118,500 | | | | 0.9% | |
NCI Building Systems, Inc. | | | January-15 | | | | 2,579,482 | | | | 2,648,100 | | | | 0.8% | |
OneMain Finance Holdings, Inc. | | | March-15 | | | | 5,010,000 | | | | 4,812,000 | | | | 1.4% | |
Optimas OE Solution Holding | | | April-15 | | | | 4,417,375 | | | | 3,718,750 | | | | 1.1% | |
Platform Specialty Products | | | February-15 | | | | 5,427,796 | | | | 4,792,100 | | | | 1.4% | |
Playa Resorts Holdings | | | | | | | 207,900 | | | | 213,150 | | | | 0.1% | |
Post Holdings, Inc. | | | August-15 | | | | 1,635,000 | | | | 1,712,663 | | | | 0.5% | |
Quicken Loans, Inc. | | | September-15 | | | | 1,827,760 | | | | 1,857,375 | | | | 0.6% | |
Radio One, Inc. | | | July-15 | | | | 5,571,345 | | | | 4,403,860 | | | | 1.3% | |
Rivers Pittsburgh Borrower LP/Finance | | | November-15 | | | | 8,520,104 | | | | 8,348,310 | | | | 2.5% | |
Source Gas LLC | | | March-15 | | | | 3,840,000 | | | | 4,157,928 | | | | 1.2% | |
Summit Materials LLC/Finance | | | | | | | 1,987,500 | | | | 1,970,000 | | | | 0.6% | |
Valeant Pharmaceuticals International, Inc. | | | April-15 | | | | 9,458,045 | | | | 9,495,600 | | | | 2.8% | |
| | | | | | | | | | | | | | | | |
| | | Acquisition
Date | | | Current
Cost | | | Fair
Value | | | Value
as a
% of
Net
Assets | |
Vander Intermediate Holding | | | February-15 | | | $ | 1,602,550 | | | $ | 1,036,750 | | | | 0.3% | |
XPO Logistics, Inc. | | | June-15 | | | | 2,538,200 | | | | 2,395,750 | | | | 0.7% | |
| | | | | | | | | | | | | | | | |
| | | | | | $ | 137,898,601 | | | $ | 129,777,674 | | | | 39.0% | |
| | | | | | | | | | | | | | | | |
| # | Restricted and illiquid securities not registered under the Securities Act of 1933 and valued at fair value by the Fair Value Committee based on procedures approved by the Board of Trustees are as follows: |
| | | | | | | | | | | | | | | | |
| | | Acquisition
Date | | | Current
Cost | | | Fair
Value | | | Value
as a
% of
Net
Assets | |
Alesco Preferred Funding Ltd., Series 6A, Class PPNE | | | March-15 | | | $ | 336,608 | | | $ | 106,745 | | | | 0.0% | |
Alesco Preferred Funding VI, Class PNN | | | December-15 | | | | 621,631 | | | | 206,804 | | | | 0.1% | |
Fort Sheridan ABS CDO Ltd., Series 2005-1A, Class PPN2 | | | November-15 | | | | 509,448 | | | | 239,113 | | | | 0.1% | |
Taberna Preferred Funding Ltd., Series 2005-1A, Class PPN2 | | | March-15 | | | | 1,035,359 | | | | 390,604 | | | | 0.1% | |
| | | | | | | | | | | | | | | | |
| | | | | | $ | 2,503,046 | | | $ | 943,266 | | | | 0.3% | |
| | | | | | | | | | | | | | | | |
| ^ | All or a portion of the security is on loan. The total fair value of the securities on loan as of December 31, 2015 was $21,177,235. |
| † | This security, which was purchased using cash collateral received from securities on loan, represents collateral for securities loaned as of December 31, 2015. |
| S | Rate represents the daily yield on December 31, 2015. |
See accompanying Notes to Financial Statements
| | | | | | | | | | | | | | |
| 50 | | DIAMOND HILL FUNDS | | | | | ANNUAL REPORT | | | | | DECEMBER 31, 2015 | | | | | DIAMOND-HILL.COM |
Diamond Hill Funds
Tabular Presentation of Schedules of Investments
December 31, 2015
| | | | |
Diamond Hill Small Cap Fund | |
Sector Allocation | | % of
Net Assets | |
Financials | | | 27.7% | |
Industrials | | | 16.3% | |
Health Care | | | 8.8% | |
Consumer Discretionary | | | 8.2% | |
Information Technology | | | 7.4% | |
Consumer Staples | | | 5.4% | |
Utilities | | | 3.3% | |
Energy | | | 2.8% | |
Cash and Cash Equivalents | | | 31.0% | |
Other | | | | |
Net Other Assets (Liabilities) | | | -10.9% | |
| | | | | |
| | | | 100% | |
| | | | | |
Russell 2000 Index
Sector Allocation | �� | % of
Index | |
Financials | | | 25.6% | |
Industrials | | | 11.9% | |
Health Care | | | 16.7% | |
Consumer Discretionary | | | 13.6% | |
Information Technology | | | 18.0% | |
Consumer Staples | | | 3.4% | |
Utilities | | | 3.7% | |
Energy | | | 2.7% | |
Materials | | | 3.6% | |
Telecom | | | 0.8% | |
| | | | | |
| | | | 100% | |
| | | | | |
| | | | | |
| | | | |
Diamond Hill Small-Mid Cap Fund | |
Sector Allocation | | % of
Net Assets | |
Financials | | | 27.9% | |
Consumer Discretionary | | | 14.8% | |
Industrials | | | 11.7% | |
Consumer Staples | | | 10.4% | |
Information Technology | | | 9.2% | |
Health Care | | | 8.9% | |
Energy | | | 3.4% | |
Utilities | | | 3.3% | |
Materials | | | 1.4% | |
Cash and Cash Equivalents | | | 22.0% | |
Other | | | | |
Net Other Assets (Liabilities) | | | -13.0% | |
| | | | | |
| | | | 100% | |
| | | | | |
Russell 2500 Index
Sector Allocation | | % of
Index | |
Financials | | | 25.3% | |
Consumer Discretionary | | | 14.5% | |
Industrials | | | 14.6% | |
Consumer Staples | | | 3.1% | |
Information Technology | | | 15.3% | |
Health Care | | | 13.0% | |
Energy | | | 2.9% | |
Utilities | | | 4.8% | |
Materials | | | 5.8% | |
Telecom | | | 0.7% | |
| | | | | |
| | | | 100% | |
| | | | | |
| | | | | |
| | | | | | | | | | | | | | | | |
| DIAMOND HILL FUNDS | | | | | ANNUAL REPORT | | | | | DECEMBER 31, 2015 | | | | | DIAMOND-HILL.COM | | | 51 | |
Diamond Hill Funds
Tabular Presentation of Schedules of Investments (Continued)
December 31, 2015
| | | | |
Diamond Hill Mid Cap Fund | |
Sector Allocation | | % of
Net Assets | |
Financials | | | 29.4% | |
Consumer Discretionary | | | 17.4% | |
Consumer Staples | | | 12.0% | |
Industrials | | | 9.8% | |
Health Care | | | 7.7% | |
Information Technology | | | 7.4% | |
Energy | | | 3.3% | |
Utilities | | | 2.9% | |
Materials | | | 2.2% | |
Cash and Cash Equivalents | | | 37.1% | |
Other | | | | |
Net Other Assets (Liabilities) | | | -29.2% | |
| | | | | |
| | | | 100% | |
| | | | | |
Russell Midcap Index
Sector Allocation | | % of
Index | |
Financials | | | 22.7% | |
Consumer Discretionary | | | 16.3% | |
Consumer Staples | | | 6.3% | |
Industrials | | | 12.6% | |
Health Care | | | 9.9% | |
Information Technology | | | 15.1% | |
Energy | | | 4.2% | |
Utilities | | | 6.2% | |
Materials | | | 5.2% | |
Telecom | | | 1.5% | |
| | | | | |
| | | | 100% | |
| | | | | |
| | | | | |
| | | | |
Diamond Hill Large Cap Fund | |
Sector Allocation | | % of
Net Assets | |
Financials | | | 26.7% | |
Consumer Discretionary | | | 16.4% | |
Health Care | | | 16.2% | |
Information Technology | | | 15.2% | |
Consumer Staples | | | 10.5% | |
Industrials | | | 8.0% | |
Energy | | | 3.4% | |
Materials | | | 2.3% | |
Cash and Cash Equivalents | | | 2.2% | |
Other | | | | |
Net Other Assets (Liabilities) | | | -0.9% | |
| | | | | |
| | | | 100% | |
| | | | | |
Russell 1000 Index
Sector Allocation | | % of
Index | |
Financials | | | 17.3% | |
Consumer Discretionary | | | 13.9% | |
Health Care | | | 14.6% | |
Information Technology | | | 20.1% | |
Consumer Staples | | | 8.8% | |
Industrials | | | 10.6% | |
Energy | | | 6.2% | |
Materials | | | 3.0% | |
Utilities | | | 3.1% | |
Telecom | | | 2.4% | |
| | | | | |
| | | | 100% | |
| | | | | |
| | | | | |
| | | | | | | | | | | | | | |
| 52 | | DIAMOND HILL FUNDS | | | | | ANNUAL REPORT | | | | | DECEMBER 31, 2015 | | | | | DIAMOND-HILL.COM |
Diamond Hill Funds
Tabular Presentation of Schedules of Investments (Continued)
December 31, 2015
| | | | |
Diamond Hill Select Fund | |
Sector Allocation | | % of
Net Assets | |
Financials | | | 33.9% | |
Consumer Discretionary | | | 18.4% | |
Industrials | | | 17.1% | |
Health Care | | | 12.0% | |
Information Technology | | | 11.2% | |
Consumer Staples | | | 3.0% | |
Energy | | | 1.7% | |
Cash and Cash Equivalents | | | 26.6% | |
Other | | | | |
Net Other Assets (Liabilities) | | | -23.9% | |
| | | | | |
| | | | 100% | |
| | | | | |
Russell 3000 Index
Sector Allocation | | % of
Index | |
Financials | | | 17.8% | |
Consumer Discretionary | | | 13.9% | |
Industrials | | | 10.7% | |
Health Care | | | 14.8% | |
Information Technology | | | 20.0% | |
Consumer Staples | | | 8.4% | |
Energy | | | 5.9% | |
Utilities | | | 3.1% | |
Materials | | | 3.1% | |
Telecom | | | 2.3% | |
| | | | | |
| | | | 100% | |
| | | | | |
| | | | | |
| | | | |
Diamond Hill Long-Short Fund | |
Long Portfolio Sector Allocation | | % of
Net Assets | |
Financials | | | 26.3% | |
Consumer Discretionary | | | 18.8% | |
Information Technology | | | 11.8% | |
Health Care | | | 10.0% | |
Industrials | | | 8.2% | |
Consumer Staples | | | 4.5% | |
Energy | | | 3.3% | |
Cash and Cash Equivalents | | | 35.9% | |
| | |
Short Portfolio
Sector Allocation | | % of
Net Assets | |
Industrials | | | -3.2% | |
Utilities | | | -0.3% | |
Energy | | | -0.4% | |
Telecommunication Services | | | -1.2% | |
Health Care | | | -2.7% | |
Consumer Staples | | | -2.8% | |
Financials | | | -4.6% | |
Information Technology | | | -1.9% | |
Consumer Discretionary | | | -4.9% | |
Other | | | | |
Segregated Cash With Brokers | | | 19.6% | |
Net Other Assets (Liabilities) | | | -16.4% | |
| | | | | |
| | | | 100% | |
| | | | | |
Russell 1000 Index
Sector Allocation | | % of
Index | |
Financials | | | 17.3% | |
Consumer Discretionary | | | 13.9% | |
Information Technology | | | 20.1% | |
Health Care | | | 14.6% | |
Industrials | | | 10.6% | |
Consumer Staples | | | 8.8% | |
Energy | | | 6.2% | |
Telecom | | | 2.4% | |
Utilities | | | 3.1% | |
Materials | | | 3.0% | |
| | | | | |
| | | | 100% | |
| | | | | |
| | | | | |
| | | | | | | | | | | | | | | | |
| DIAMOND HILL FUNDS | | | | | ANNUAL REPORT | | | | | DECEMBER 31, 2015 | | | | | DIAMOND-HILL.COM | | | 53 | |
Diamond Hill Funds
Tabular Presentation of Schedules of Investments (Continued)
December 31, 2015
| | | | |
Diamond Hill Financial Long-Short Fund | |
Long Portfolio
Sector Allocation | | % of
Net Assets | |
Banks, Thrifts & Mortgage Finance | | | 34.3% | |
Insurance | | | 25.2% | |
Capital Markets | | | 9.2% | |
Diversified Financial Services | | | 8.8% | |
REITs & Real Estate Management | | | 7.4% | |
Consumer Financial Services | | | 7.3% | |
IT Services/Other | | | 1.5% | |
Cash and Cash Equivalents | | | 31.9% | |
| | |
Short Portfolio
Sector Allocation | | % of
Net Assets | |
IT Services/Other | | | -1.1% | |
Banks, Thrifts & Mortgage Finance | | | -1.1% | |
Insurance | | | -9.5% | |
Other | | | | |
Segregated Cash With Brokers | | | 12.3% | |
Net Other Assets (Liabilities) | | | -26.2% | |
| | | | | |
| | | | 100% | |
| | | | | |
| | |
Russell 3000 Financials Index
Sector Allocation | | % of
Index | |
Banks, Thrifts & Mortgage Finance | | | 28.6% | |
Insurance | | | 14.8% | |
Capital Markets | | | 6.9% | |
Diversified Financial Services | | | 14.6% | |
REITs & Real Estate Management | | | 19.4% | |
Consumer Financial Services | | | 3.8% | |
IT Services/Other | | | 11.9% | |
| | | | | |
| | | | 100% | |
| | | | | |
| | | | | |
| | | | |
Diamond Hill Research Opportunities Fund | |
Long Portfolio
Sector Allocation | | % of
Net Assets | |
Health Care | | | 21.7% | |
Information Technology | | | 21.6% | |
Consumer Discretionary | | | 18.2% | |
Industrials | | | 15.7% | |
Financials | | | 13.7% | |
Consumer Staples | | | 6.7% | |
Telecommunication Services | | | 2.7% | |
Energy | | | 0.9% | |
Materials | | | 0.4% | |
Cash and Cash Equivalents | | | 29.0% | |
| | |
Short Portfolio
Sector Allocation | | % of
Net Assets | |
Telecommunication Services | | | -0.8% | |
Industrials | | | -1.3% | |
Consumer Staples | | | -2.1% | |
Financials | | | -2.3% | |
Health Care | | | -3.8% | |
Information Technology | | | -4.1% | |
Consumer Discretionary | | | -5.7% | |
Other | | | | |
Segregated Cash With Brokers | | | 20.2% | |
Net Other Assets (Liabilities) | | | -30.7% | |
| | | | | |
| | | | 100% | |
| | | | | |
Russell 3000 Index
Sector Allocation | | % of
Index | |
Health Care | | | 14.8% | |
Information Technology | | | 19.9% | |
Consumer Discretionary | | | 13.9% | |
Industrials | | | 10.7% | |
Financials | | | 17.9% | |
Consumer Staples | | | 8.4% | |
Telecommunication Services | | | 2.3% | |
Energy | | | 5.9% | |
Materials | | | 3.1% | |
Utilities | | | 3.1% | |
| | | | | |
| | | | 100% | |
| | | | | |
| | | | | |
| | | | | | | | | | | | | | |
| 54 | | DIAMOND HILL FUNDS | | | | | ANNUAL REPORT | | | | | DECEMBER 31, 2015 | | | | | DIAMOND-HILL.COM |
Diamond Hill Funds
Tabular Presentation of Schedules of Investments (Continued)
December 31, 2015
| | | | |
Diamond Hill Strategic Income Fund | |
Sector Allocation | | % of
Net Assets | |
Consumer Discretionary | | | 18.5% | |
Financials | | | 16.5% | |
Industrials | | | 12.9% | |
Health Care | | | 9.9% | |
Telecommunication Services | | | 7.6% | |
Energy | | | 7.3% | |
Materials | | | 6.3% | |
Information Technology | | | 1.8% | |
Utilities | | | 1.2% | |
Consumer Staples | | | 0.5% | |
Other | | | 0.3% | |
Cash and Cash Equivalents | | | 17.4% | |
| | | | | |
Other | | | | |
Net Other Assets (Liabilities) | | | -0.2% | |
| | | | | |
| | | | 100% | |
| | | | | |
| | | | | |
| | | | | | | | | | | | | | | | |
| DIAMOND HILL FUNDS | | | | | ANNUAL REPORT | | | | | DECEMBER 31, 2015 | | | | | DIAMOND-HILL.COM | | | 55 | |
Diamond Hill Funds
Statements of Assets & Liabilities
December 31, 2015
| | | | | | | | |
| | | Small Cap Fund | | | Small-Mid
Cap Fund | |
Assets | | | | | | | | |
Total investment securities, at cost | | $ | 1,616,017,223 | | | $ | 1,419,637,857 | |
Investment securities, at fair value — including $168,281,666, $154,410,593, $5,257,506, $21,728,282, $35,333,834, $850,920,868, $15,534,005, $7,365,041 and $21,177,235 of securities loaned | | $ | 1,834,395,408 | | | $ | 1,465,311,384 | |
Cash | | | — | | | | 51,496 | |
Foreign Currency | | | — | | | | — | |
Cash deposits with custodian for securities sold short | | | — | | | | — | |
Receivable for fund shares issued | | | 9,618,906 | | | | 12,289,318 | |
Receivable for dividends and interest | | | 2,364,835 | | | | 1,307,196 | |
Receivable for investments sold | | | 1,209,252 | | | | — | |
Prepaid expenses and other assets | | | 363 | | | | 1,071 | |
Total Assets | | | 1,847,588,764 | | | | 1,478,960,465 | |
| | |
Liabilities | | | | | | | | |
Securities sold short, at fair value (proceeds $—, $—, $—, $—, $—, $910,148,607, $10,603,911, $2,855,461 and $—) | | | — | | | | — | |
Cash overdraft | | | 6,156 | | | | — | |
Payable for securities purchased | | | 12,497,726 | | | | 14,129,520 | |
Payable for expenses and fees on securities sold short | | | — | | | | — | |
Payable for fund shares redeemed | | | 5,801,020 | | | | 6,729,863 | |
Payable for return of collateral received | | | 173,063,700 | | | | 158,330,851 | |
Payable to Investment Adviser | | | 1,116,107 | | | | 775,365 | |
Payable to Administrator | | | 286,303 | | | | 170,717 | |
Accrued distribution and service fees | | | 155,573 | | | | 58,094 | |
Payable to accountant and custodian | | | 2,513 | | | | — | |
Total Liabilities | | | 192,929,098 | | | | 180,194,410 | |
| | |
Net Assets | | $ | 1,654,659,666 | | | $ | 1,298,766,055 | |
| | |
Components of Net Assets | | | | | | | | |
Paid-in capital | | $ | 1,406,764,309 | | | $ | 1,241,472,531 | |
Accumulated net investment income (loss) | | | (8,227,127 | ) | | | (813,253 | ) |
Accumulated net realized gains (losses) from investment transactions | | | 37,744,299 | | | | 12,433,250 | |
Net unrealized appreciation (depreciation) on investments | | | 218,378,185 | | | | 45,673,527 | |
Net Assets | | $ | 1,654,659,666 | | | $ | 1,298,766,055 | |
| | |
Net Assets | | | | | | | | |
Class A Shares | | $ | 492,810,002 | | | $ | 156,122,372 | |
Class C Shares | | $ | 57,875,204 | | | $ | 32,962,632 | |
Class I Shares | | $ | 882,350,459 | | | $ | 506,730,177 | |
Class Y Shares | | $ | 221,624,001 | | | $ | 602,950,874 | |
| | |
Shares of beneficial interest outstanding (unlimited number of shares authorized, no par value) | | | | | | | | |
Class A Shares | | | 15,953,352 | | | | 8,534,562 | |
Class C Shares | | | 2,103,673 | | | | 1,931,880 | |
Class I Shares | | | 28,205,667 | | | | 27,455,746 | |
Class Y Shares | | | 7,082,848 | | | | 32,633,084 | |
| | |
Net Asset Value, offering (except Class A Shares) and redemption price per share: | | | | | | | | |
Class A Shares | | $ | 30.89 | | | $ | 18.29 | |
Class C Shares(A) | | $ | 27.51 | | | $ | 17.06 | |
Class I Shares | | $ | 31.28 | | | $ | 18.46 | |
Class Y Shares | | $ | 31.29 | | | $ | 18.48 | |
| | |
Maximum Offering Price | | | | | | | | |
Maximum sales charge — Class A Shares | | | 5.00% | | | | 5.00% | |
(100%/(100%-maximum sales charge) of net asset value adjusted to the nearest cent) per share — Class A Shares | | $ | 32.52 | | | $ | 19.25 | |
| (A) | Redemption price per share varies based on the holding period. |
See accompanying Notes to Financial Statements.
| | | | | | | | | | | | | | |
| 56 | | DIAMOND HILL FUNDS | | | | | ANNUAL REPORT | | | | | DECEMBER 31, 2015 | | | | | DIAMOND-HILL.COM |
| | | | | | | | | | | | | | | | | | | | | | | | | | |
Mid Cap
Fund | | | Large Cap Fund | | | Select Fund | | | Long-Short Fund | | | Research Opportunities Fund | | | Financial Long-Short Fund | | | Strategic Income Fund | |
| | | | | | | | | | | | | | | | | | | | | | | | | | |
| $ | 23,154,282 | | | $ | 2,837,667,536 | | | $ | 185,827,992 | | | $ | 4,671,826,492 | | | $ | 71,169,125 | | | $ | 33,527,226 | | | $ | 351,034,970 | |
| $ | 23,997,489 | | | $ | 3,478,147,786 | | | $ | 187,298,218 | | | $ | 5,244,481,867 | | | $ | 72,163,763 | | | $ | 34,439,080 | | | $ | 334,115,953 | |
| | 676 | | | | — | | | | 945 | | | | 14,716 | | | | 4,272 | | | | 38 | | | | — | |
| | — | | | | — | | | | — | | | | — | | | | — | | | | — | | | | — | |
| | — | | | | — | | | | — | | | | 866,200,205 | | | | 11,159,004 | | | | 3,361,324 | | | | — | |
| | 22,000 | | | | 5,815,567 | | | | 130,266 | | | | 16,693,240 | | | | 2,241 | | | | 134,622 | | | | 17,592,271 | |
| | 22,277 | | | | 3,499,114 | | | | 91,911 | | | | 3,221,355 | | | | 130,506 | | | | 43,394 | | | | 6,008,712 | |
| | — | | | | — | | | | — | | | | 148,504,013 | | | | 498,598 | | | | 240,049 | | | | — | |
| | 12 | | | | 466 | | | | 98 | | | | 201 | | | | 518 | | | | 140 | | | | — | |
| | 24,042,454 | | | | 3,487,462,933 | | | | 187,521,438 | | | | 6,279,115,597 | | | | 83,958,902 | | | | 38,218,647 | | | | 357,716,936 | |
| | | | | | |
| | | | | | | | | | | | | | | | | | | | | | | | | | |
| | — | | | | — | | | | — | | | | 968,197,388 | | | | 11,124,763 | | | | 3,226,240 | | | | — | |
| | — | | | | 8,333 | | | | — | | | | — | | | | — | | | | — | | | | 1,135 | |
| | 73,866 | | | | 12,953,413 | | | | — | | | | — | | | | 1,254,443 | | | | — | | | | 850,000 | |
| | — | | | | — | | | | — | | | | 401,248 | | | | 8,078 | | | | 6,282 | | | | — | |
| | 420 | | | | 9,337,236 | | | | 403,486 | | | | 23,489,381 | | | | 307,656 | | | | 1,151 | | | | 876,235 | |
| | 5,381,516 | | | | 22,216,363 | | | | 36,200,105 | | | | 869,849,277 | | | | 15,985,758 | | | | 7,536,021 | | | | 22,253,070 | |
| | 10,232 | | | | 1,613,933 | | | | 94,995 | | | | 3,397,972 | | | | 55,597 | | | | 23,328 | | | | 115,806 | |
| | 2,240 | | | | 607,185 | | | | 29,023 | | | | 783,235 | | | | 10,607 | | | | 5,222 | | | | 53,951 | |
| | 706 | | | | 313,191 | | | | 22,377 | | | | 269,927 | | | | 6,904 | | | | 3,936 | | | | 28,885 | |
| | — | | | | 435 | | | | — | | | | 24,182 | | | | — | | | | — | | | | 78 | |
| | 5,468,980 | | | | 47,050,089 | | | | 36,749,986 | | | | 1,866,412,610 | | | | 28,753,806 | | | | 10,802,180 | | | | 24,179,160 | |
| | | | | | |
| $ | 18,573,474 | | | $ | 3,440,412,844 | | | $ | 150,771,452 | | | $ | 4,412,702,987 | | | $ | 55,205,096 | | | $ | 27,416,467 | | | $ | 333,537,776 | |
| | | | | | |
| | | | | | | | | | | | | | | | | | | | | | | | | | |
| $ | 17,764,779 | | | $ | 2,754,665,674 | | | $ | 155,656,427 | | | $ | 3,902,736,058 | | | $ | 56,736,618 | | | $ | 32,864,008 | | | $ | 360,392,479 | |
| | 10,028 | | | | — | | | | 129,870 | | | | — | | | | (411,836 | ) | | | (85,789 | ) | | | 909,361 | |
| | (44,540 | ) | | | 45,266,920 | | | | (6,485,071 | ) | | | (4,639,665 | ) | | | (1,593,472 | ) | | | (5,902,827 | ) | | | (10,845,047 | ) |
| | 843,207 | | | | 640,480,250 | | | | 1,470,226 | | | | 514,606,594 | | | | 473,786 | | | | 541,075 | | | | (16,919,017 | ) |
| $ | 18,573,474 | | | $ | 3,440,412,844 | | | $ | 150,771,452 | | | $ | 4,412,702,987 | | | $ | 55,205,096 | | | $ | 27,416,467 | | | $ | 333,537,776 | |
| | | | | | |
| | | | | | | | | | | | | | | | | | | | | | | | | | |
| $ | 3,081,841 | | | $ | 1,122,165,467 | | | $ | 43,638,453 | | | $ | 569,217,883 | | | $ | 8,637,133 | | | $ | 10,759,584 | | | $ | 44,353,881 | |
| $ | 77,743 | | | $ | 84,549,931 | | | $ | 15,021,935 | | | $ | 169,860,763 | | | $ | 5,096,773 | | | $ | 1,845,078 | | | $ | 23,649,056 | |
| $ | 3,337,040 | | | $ | 1,803,129,572 | | | $ | 81,408,264 | | | $ | 3,382,696,642 | | | $ | 26,186,318 | | | $ | 14,811,805 | | | $ | 247,521,751 | |
| $ | 12,076,850 | | | $ | 430,567,874 | | | $ | 10,702,800 | | | $ | 290,927,699 | | | $ | 15,284,872 | | | $ | — | | | $ | 18,013,088 | |
| | | | | | |
| | | | | | | | | | | | | | | | | | | | | | | | | | |
| | 287,660 | | | | 52,335,482 | | | | 3,530,819 | | | | 24,365,419 | | | | 438,365 | | | | 577,801 | | | | 4,211,077 | |
| | 7,311 | | | | 4,126,772 | | | | 1,267,560 | | | | 7,960,301 | | | | 267,461 | | | | 106,784 | | | | 2,249,838 | |
| | 310,785 | | | | 83,659,050 | | | | 6,571,975 | | | | 142,339,341 | | | | 1,322,153 | | | | 796,590 | | | | 23,572,572 | |
| | 1,123,146 | | | | 19,969,211 | | | | 862,698 | | | | 12,208,142 | | | | 771,915 | | | | — | | | | 1,715,748 | |
| | | | | | |
| | | | | | | | | | | | | | | | | | | | | | | | | | |
| $ | 10.71 | | | $ | 21.44 | | | $ | 12.36 | | | $ | 23.36 | | | $ | 19.70 | | | $ | 18.62 | | | $ | 10.53 | |
| $ | 10.63 | | | $ | 20.49 | | | $ | 11.85 | | | $ | 21.34 | | | $ | 19.06 | | | $ | 17.28 | | | $ | 10.51 | |
| $ | 10.74 | | | $ | 21.55 | | | $ | 12.39 | | | $ | 23.77 | | | $ | 19.81 | | | $ | 18.59 | | | $ | 10.50 | |
| $ | 10.75 | | | $ | 21.56 | | | $ | 12.41 | | | $ | 23.83 | | | $ | 19.80 | | | $ | — | | | $ | 10.50 | |
| | | | | | |
| | | | | | | | | | | | | | | | | | | | | | | | | | |
| | 5.00% | | | | 5.00% | | | | 5.00% | | | | 5.00% | | | | 5.00% | | | | 5.00% | | | | 3.50% | |
$ | 11.27 | | | $ | 22.57 | | | $ | 13.01 | | | $ | 24.59 | | | $ | 20.74 | | | $ | 19.60 | | | $ | 10.91 | |
| | | | | | | | | | | | | | | | |
| DIAMOND HILL FUNDS | | | | | ANNUAL REPORT | | | | | DECEMBER 31, 2015 | | | | | DIAMOND-HILL.COM | | | 57 | |
Diamond Hill Funds
Statements of Operations
For the year ended December 31, 2015
| | | | | | | | | | | | | | | | |
| | | Small Cap
Fund | | | Small-Mid
Cap Fund | | | Mid Cap
Fund | | | Large Cap Fund | |
Investment Income | | | | | | | | | | | | | | | | |
Dividends | | $ | 18,359,090 | | | $ | 12,920,488 | | | $ | 254,844 | | | $ | 63,991,981 | |
Securities lending income | | | 322,510 | | | | 331,295 | | | | 9,455 | | | | 207,238 | |
Foreign taxes withheld | | | (39,917 | ) | | | (18,706 | ) | | | (296 | ) | | | — | |
Total Investment Income | | | 18,641,683 | | | | 13,233,077 | | | | 264,003 | | | | 64,199,219 | |
| | | | |
Expenses | | | | | | | | | | | | | | | | |
Investment advisory fees | | | 12,639,281 | | | | 7,510,010 | | | | 115,986 | | | | 18,730,300 | |
Administration fees | | | 3,409,948 | | | | 1,695,205 | | | | 25,192 | | | | 7,317,566 | |
Distribution fees — Class A | | | 1,387,390 | | | | 286,493 | | | | 6,473 | | | | 2,949,931 | |
Distribution and service fees — Class C | | | 573,735 | | | | 275,952 | | | | 396 | | | | 842,438 | |
Other fees | | | 397 | | | | 348 | | | | 323 | | | | 344 | |
Total Expenses | | | 18,010,751 | | | | 9,768,008 | | | | 148,370 | | | | 29,840,579 | |
| | | | |
Net Investment Income (Loss) | | | 630,932 | | | | 3,465,069 | | | | 115,633 | | | | 34,358,640 | |
| | | | |
Realized and Unrealized Gains (Losses) on Investments | | | | | | | | | | | | | | | | |
Net realized gains (losses) on security sales | | | 61,854,520 | | | | 24,745,917 | | | | 17,349 | | | | 153,357,141 | |
Net change in unrealized appreciation (depreciation) on investments | | | (124,772,396 | ) | | | (28,553,481 | ) | | | (53,554 | ) | | | (219,309,609 | ) |
Net Realized and Unrealized Gains (Losses) on Investments | | | (62,917,876 | ) | | | (3,807,564 | ) | | | (36,205 | ) | | | (65,952,468 | ) |
| | | | |
Change in Net Assets from Operations | | $ | (62,286,944 | ) | | $ | (342,495 | ) | | $ | 79,428 | | | $ | (31,593,828 | ) |
See accompanying Notes to Financial Statements.
| | | | | | | | | | | | | | |
| 58 | | DIAMOND HILL FUNDS | | | | | ANNUAL REPORT | | | | | DECEMBER 31, 2015 | | | | | DIAMOND-HILL.COM |
Diamond Hill Funds
Statements of Operations
For the year ended December 31, 2015
| | | | | | | | | | | | | | | | | | | | |
| | | Select Fund | | | Long-Short
Fund | | | Research
Opportunities
Fund | | | Financial
Long-Short
Fund | | | Strategic
Income
Fund | |
Investment Income | | | | | | | | | | | | | | | | | | | | |
Dividends | | $ | 1,395,200 | | | $ | 59,351,618 | | | $ | 1,145,062 | | | $ | 545,626 | | | $ | 25,568 | |
Interest | | | — | | | | — | | | | 80,270 | | | | — | | | | 15,832,390 | |
Securities lending income | | | 59,227 | | | | 353,541 | | | | 34,925 | | | | 12,705 | | | | 87,299 | |
Foreign taxes withheld | | | (3,850 | ) | | | (108,778 | ) | | | 3,230 | | | | (2,001 | ) | | | — | |
Total Investment Income | | | 1,450,577 | | | | 59,596,381 | | | | 1,263,487 | | | | 556,330 | | | | 15,945,257 | |
| | | | | |
Expenses | | | | | | | | | | | | | | | | | | | | |
Investment advisory fees | | | 866,409 | | | | 37,945,860 | | | | 820,273 | | | | 302,451 | | | | 1,176,308 | |
Administration fees | | | 267,417 | | | | 9,192,959 | | | | 165,790 | | | | 69,899 | | | | 563,229 | |
Distribution fees — Class A | | | 71,302 | | | | 1,660,751 | | | | 30,746 | | | | 27,592 | | | | 87,341 | |
Distribution and service fees — Class C | | | 115,251 | | | | 1,748,679 | | | | 37,725 | | | | 21,639 | | | | 242,957 | |
Other fees | | | 328 | | | | 345 | | | | 463 | | | | 322 | | | | 326 | |
Expenses and fees on securities sold short | | | — | | | | 20,922,276 | | | | 277,281 | | | | 107,482 | | | | — | |
Total Expenses | | | 1,320,707 | | | | 71,470,870 | | | | 1,332,278 | | | | 529,385 | | | | 2,070,161 | |
| | | | | |
Net Investment Income (Loss) | | | 129,870 | | | | (11,874,489 | ) | | | (68,791 | ) | | | 26,945 | | | | 13,875,096 | |
| | | | | |
Realized and Unrealized Gains (Losses) on Investments | | | | | | | | | | | | | | | | | | | | |
Net realized gains (losses) on security sales | | | (1,306,472 | ) | | | 282,565,938 | | | | 5,018,282 | | | | 3,341,781 | | | | 629,391 | |
Net realized gains (losses) on closed short positions | | | — | | | | (145,044,409 | ) | | | (1,252,359 | ) | | | (82,958 | ) | | | — | |
Net realized gains (losses) on foreign currency transactions | | | — | | | | — | | | | (2,578 | ) | | | — | | | | — | |
Net change in unrealized appreciation (depreciation) on investments and foreign currency translations | | | (9,625,023 | ) | | | (195,033,861 | ) | | | (9,014,463 | ) | | | (4,875,135 | ) | | | (12,614,587 | ) |
Net Realized and Unrealized Gains (Losses) on Investments | | | (10,931,495 | ) | | | (57,512,332 | ) | | | (5,251,118 | ) | | | (1,616,312 | ) | | | (11,985,196 | ) |
| | | | | |
Change in Net Assets from Operations | | $ | (10,801,625 | ) | | $ | (69,386,821 | ) | | $ | (5,319,909 | ) | | $ | (1,589,367 | ) | | $ | 1,889,900 | |
See accompanying Notes to Financial Statements.
| | | | | | | | | | | | | | | | |
| DIAMOND HILL FUNDS | | | | | ANNUAL REPORT | | | | | DECEMBER 31, 2015 | | | | | DIAMOND-HILL.COM | | | 59 | |
Diamond Hill Funds
Statements of Changes in Net Assets
| | | | | | | | | | | | | | | | | | |
| | | Small Cap Fund | | | | | Small-Mid Cap Fund | |
| | | For the year
ended
December 31,
2015 | | | For the year
ended
December 31,
2014 | | | | | For the year
ended
December 31,
2015 | | | For the year
ended
December 31,
2014 | |
From Operations | | | | | | | | | | | | | | | | | | |
Net investment income (loss) | | $ | 630,932 | | | $ | (2,686,741 | ) | | | | $ | 3,465,069 | | | $ | 1,958,741 | |
Net realized gains (losses) on security sales | | | 61,854,520 | | | | 72,678,332 | | | | | | 24,745,917 | | | | 21,328,991 | |
Net change in unrealized appreciation (depreciation) on investments | | | (124,772,396 | ) | | | (7,550,813 | ) | | | | | (28,553,481 | ) | | | 10,996,880 | |
Change in Net Assets from Operations | | | (62,286,944 | ) | | | 62,440,778 | | | | | | (342,495 | ) | | | 34,284,612 | |
| | | | | |
Distributions to Shareholders | | | | | | | | | | | | | | | | | | |
From net investment income: | | | | | | | | | | | | | | | | | | |
Class A | | | (1,478,191 | ) | | | — | | | | | | (235,006 | ) | | | (97,842 | ) |
Class I | | | (5,604,727 | ) | | | (1,087,598 | ) | | | | | (1,681,410 | ) | | | (861,350 | ) |
Class Y | | | (1,670,446 | ) | | | (465,795 | ) | | | | | (2,566,167 | ) | | | (1,324,401 | ) |
From net realized gains on investments | | | | | | | | | | | | | | | | | | |
Class A | | | (6,430,005 | ) | | | (26,760,113 | ) | | | | | (1,545,869 | ) | | | (3,421,995 | ) |
Class C | | | (854,771 | ) | | | (2,606,415 | ) | | | | | (339,284 | ) | | | (894,081 | ) |
Class I | | | (10,939,941 | ) | | | (29,780,665 | ) | | | | | (4,932,534 | ) | | | (8,318,543 | ) |
Class Y | | | (2,834,619 | ) | | | (7,193,312 | ) | | | | | (5,285,728 | ) | | | (9,418,635 | ) |
Change in Net Assets from Distributions to Shareholders | | | (29,812,700 | ) | | | (67,893,898 | ) | | | | | (16,585,998 | ) | | | (24,336,847 | ) |
Change in net assets from capital transactions | | | 306,160,162 | | | | 176,539,958 | | | | | | 623,960,173 | | | | 346,044,639 | |
| | | | | |
Total Change in Net Assets | | | 214,060,518 | | | | 171,086,838 | | | | | | 607,031,680 | | | | 355,992,404 | |
| | | | | |
Net Assets: | | | | | | | | | | | | | | | | | | |
Beginning of period | | | 1,440,599,148 | | | | 1,269,512,310 | | | | | | 691,734,375 | | | | 335,741,971 | |
End of period | | $ | 1,654,659,666 | | | $ | 1,440,599,148 | | | | | $ | 1,298,766,055 | | | $ | 691,734,375 | |
Accumulated Net Investment Income (Loss) | | $ | (8,227,127 | ) | | $ | (3,855,916 | ) | | | | $ | (813,253 | ) | | $ | (889,291 | ) |
See accompanying Notes to Financial Statements.
| | | | | | | | | | | | | | |
| 60 | | DIAMOND HILL FUNDS | | | | | ANNUAL REPORT | | | | | DECEMBER 31, 2015 | | | | | DIAMOND-HILL.COM |
Diamond Hill Funds
Statements of Changes in Net Assets
| | | | | | | | | | | | | | | | | | |
| | | Small Cap Fund | | | | | Small-Mid Cap Fund | |
| | | For the year
ended
December 31,
2015 | | | For the year
ended
December 31,
2014 | | | | | For the year
ended
December 31,
2015 | | | For the year
ended
December 31,
2014 | |
Capital Transactions | | | | | | | | | | | | | | | | | | |
Class A | | | | | | | | | | | | | | | | | | |
Proceeds from shares sold | | $ | 163,984,100 | | | $ | 163,951,547 | | | | | $ | 80,279,604 | | | $ | 71,580,018 | |
Reinvested distributions | | | 7,080,943 | | | | 23,997,393 | | | | | | 1,710,659 | | | | 3,383,422 | |
Payments for shares redeemed | | | (224,067,186 | ) | | | (186,573,027 | ) | | | | | (24,404,965 | ) | | | (37,038,128 | ) |
Change in Net Assets from Class A Share Transactions | | | (53,002,143 | ) | | | 1,375,913 | | | | | | 57,585,298 | | | | 37,925,312 | |
Class C | | | | | | | | | | | | | | | | | | |
Proceeds from shares sold | | | 18,654,572 | | | | 10,082,105 | | | | | | 12,183,360 | | | | 7,165,730 | |
Reinvested distributions | | | 806,755 | | | | 2,388,761 | | | | | | 301,197 | | | | 739,233 | |
Payments for shares redeemed | | | (9,715,442 | ) | | | (6,363,572 | ) | | | | | (4,377,301 | ) | | | (2,352,304 | ) |
Change in Net Assets from Class C Share Transactions | | | 9,745,885 | | | | 6,107,294 | | | | | | 8,107,256 | | | | 5,552,659 | |
Class I | | | | | | | | | | | | | | | | | | |
Proceeds from shares sold | | | 460,433,412 | | | | 263,463,371 | | | | | | 334,255,108 | | | | 136,631,482 | |
Reinvested distributions | | | 14,553,562 | | | | 26,397,666 | | | | | | 6,158,097 | | | | 8,527,522 | |
Payments for shares redeemed | | | (204,740,459 | ) | | | (177,960,023 | ) | | | | | (90,731,981 | ) | | | (34,258,641 | ) |
Change in Net Assets from Class I Share Transactions | | | 270,246,515 | | | | 111,901,014 | | | | | | 249,681,224 | | | | 110,900,363 | |
Class Y | | | | | | | | | | | | | | | | | | |
Proceeds from shares sold | | | 132,713,949 | | | | 82,950,293 | | | | | | 362,017,776 | | | | 219,529,521 | |
Reinvested distributions | | | 4,505,061 | | | | 6,213,790 | | | | | | 7,525,610 | | | | 9,863,029 | |
Payments for shares redeemed | | | (58,049,105 | ) | | | (32,008,346 | ) | | | | | (60,956,991 | ) | | | (37,726,245 | ) |
Change in Net Assets from Class Y Share Transactions | | | 79,169,905 | | | | 57,155,737 | | | | | | 308,586,395 | | | | 191,666,305 | |
Change in net assets from capital transactions: | | $ | 306,160,162 | | | $ | 176,539,958 | | | | | $ | 623,960,173 | | | $ | 346,044,639 | |
Share Transactions: | | | | | | | | | | | | | | | | | | |
Class A | | | | | | | | | | | | | | | | | | |
Issued | | | 5,004,907 | | | | 4,876,928 | | | | | | 4,225,045 | | | | 3,892,262 | |
Reinvested | | | 229,358 | | | | 755,348 | | | | | | 93,708 | | | | 188,753 | |
Redeemed | | | (6,817,882 | ) | | | (5,553,515 | ) | | | | | (1,285,463 | ) | | | (2,051,184 | ) |
Change in shares outstanding | | | (1,583,617 | ) | | | 78,761 | | | | | | 3,033,290 | | | | 2,029,831 | |
Class C | | | | | | | | | | | | | | | | | | |
Issued | | | 635,982 | | | | 332,880 | | | | | | 690,711 | | | | 419,573 | |
Reinvested | | | 29,465 | | | | 83,875 | | | | | | 17,728 | | | | 43,976 | |
Redeemed | | | (334,013 | ) | | | (209,462 | ) | | | | | (245,334 | ) | | | (136,691 | ) |
Change in shares outstanding | | | 331,434 | | | | 207,293 | | | | | | 463,105 | | | | 326,858 | |
Class I | | | | | | | | | | | | | | | | | | |
Issued | | | 13,937,293 | | | | 7,744,583 | | | | | | 17,539,516 | | | | 7,414,344 | |
Reinvested | | | 463,830 | | | | 817,909 | | | | | | 333,524 | | | | 470,118 | |
Redeemed | | | (6,144,341 | ) | | | (5,257,355 | ) | | | | | (4,753,680 | ) | | | (1,883,825 | ) |
Change in shares outstanding | | | 8,256,782 | | | | 3,305,137 | | | | | | 13,119,360 | | | | 6,000,637 | |
Class Y | | | | | | | | | | | | | | | | | | |
Issued | | | 3,931,177 | | | | 2,461,689 | | | | | | 19,121,662 | | | | 11,832,417 | |
Reinvested | | | 143,436 | | | | 192,089 | | | | | | 406,591 | | | | 542,196 | |
Redeemed | | | (1,762,405 | ) | | | (936,054 | ) | | | | | (3,167,008 | ) | | | (2,036,793 | ) |
Change in shares outstanding | | | 2,312,208 | | | | 1,717,724 | | | | | | 16,361,245 | | | | 10,337,820 | |
Change in shares | | | 9,316,807 | | | | 5,308,915 | | | | | | 32,977,000 | | | | 18,695,146 | |
See accompanying Notes to Financial Statements.
| | | | | | | | | | | | | | | | |
| DIAMOND HILL FUNDS | | | | | ANNUAL REPORT | | | | | DECEMBER 31, 2015 | | | | | DIAMOND-HILL.COM | | | 61 | |
Diamond Hill Funds
Statements of Changes in Net Assets
| | | | | | | | | | | | | | | | | | |
| | | Mid Cap Fund | | | | | Large Cap Fund | |
| | | For the year
ended
December 31,
2015 | | | For the year
ended
December 31,
2014(A) | | | | | For the year
ended
December 31,
2015 | | | For the year
ended
December 31,
2014 | |
From Operations | | | | | | | | | | | | | | | | | | |
Net investment income (loss) | | $ | 115,633 | | | $ | 106,245 | | | | | $ | 34,358,640 | | | $ | 31,966,574 | |
Net realized gains (losses) on security sales | | | 17,349 | | | | (62,720 | ) | | | | | 153,357,141 | | | | 125,582,411 | |
Net change in unrealized appreciation (depreciation) on investments | | | (53,554 | ) | | | 896,761 | | | | | | (219,309,609 | ) | | | 142,741,561 | |
Change in Net Assets from Operations | | | 79,428 | | | | 940,286 | | | | | | (31,593,828 | ) | | | 300,290,546 | |
| | | | | |
Distributions to Shareholders | | | | | | | | | | | | | | | | | | |
From net investment income: | | | | | | | | | | | | | | | | | | |
Class A | | | (10,631 | ) | | | (11,479 | ) | | | | | (9,117,086 | ) | | | (9,908,459 | ) |
Class C | | | (107 | ) | | | — | | | | | | (145,150 | ) | | | (256,868 | ) |
Class I | | | (18,513 | ) | | | (18,216 | ) | | | | | (19,842,489 | ) | | | (16,863,005 | ) |
Class Y | | | (78,987 | ) | | | (77,180 | ) | | | | | (5,258,725 | ) | | | (4,953,319 | ) |
From net realized gains on investments | | | | | | | | | | | | | | | | | | |
Class A | | | — | | | | — | | | | | | (42,511,645 | ) | | | (32,207,367 | ) |
Class C | | | — | | | | — | | | | | | (3,355,736 | ) | | | (2,991,271 | ) |
Class I | | | — | | | | — | | | | | | (67,211,166 | ) | | | (55,020,203 | ) |
Class Y | | | — | | | | — | | | | | | (16,037,907 | ) | | | (14,152,581 | ) |
Change in Net Assets from Distributions to Shareholders | | | (108,238 | ) | | | (106,875 | ) | | | | | (163,479,904 | ) | | | (136,353,073 | ) |
Change in net assets from capital transactions | | | 2,298,834 | | | | 15,470,039 | | | | | | 389,042,080 | | | | 552,427,211 | |
| | | | | |
Total Change in Net Assets | | | 2,270,024 | | | | 16,303,450 | | | | | | 193,968,348 | | | | 716,364,684 | |
| | | | | |
Net Assets: | | | | | | | | | | | | | | | | | | |
Beginning of period | | | 16,303,450 | | | | — | | | | | | 3,246,444,496 | | | | 2,530,079,812 | |
End of period | | $ | 18,573,474 | | | $ | 16,303,450 | | | | | $ | 3,440,412,844 | | | $ | 3,246,444,496 | |
Accumulated Net Investment Income (Loss) | | $ | 10,028 | | | $ | — | | | | | $ | — | | | $ | — | |
| (A) | Inception date of the Fund is December 31, 2013. Fund commenced public offering and investment operations on January 2, 2014. |
See accompanying Notes to Financial Statements.
| | | | | | | | | | | | | | |
| 62 | | DIAMOND HILL FUNDS | | | | | ANNUAL REPORT | | | | | DECEMBER 31, 2015 | | | | | DIAMOND-HILL.COM |
Diamond Hill Funds
Statements of Changes in Net Assets
| | | | | | | | | | | | | | | | | | |
| | | Mid Cap Fund | | | | | Large Cap Fund | |
| | | For the year
ended
December 31,
2015 | | | For the year
ended
December 31,
2014(A) | | | | | For the year
ended
December 31,
2015 | | | For the year
ended
December 31,
2014 | |
Capital Transactions: | | | | | | | | | | | | | | | | | | |
Class A | | | | | | | | | | | | | | | | | | |
Proceeds from shares sold | | $ | 1,108,834 | | | $ | 2,230,864 | | | | | $ | 264,797,180 | | | $ | 675,618,011 | |
Reinvested distributions | | | 10,630 | | | | 11,479 | | | | | | 50,751,629 | | | | 41,200,721 | |
Payments for shares redeemed | | | (132,759 | ) | | | (76,052 | ) | | | | | (311,900,741 | ) | | | (476,582,111 | ) |
Change in Net Assets from Class A Share Transactions | | | 986,705 | | | | 2,166,291 | | | | | | 3,648,068 | | | | 240,236,621 | |
Class C | | | | | | | | | | | | | | | | | | |
Proceeds from shares sold | | | 58,656 | | | | 110,000 | | | | | | 15,926,061 | | | | 32,282,101 | |
Reinvested distributions | | | 92 | | | | — | | | | | | 3,293,098 | | | | 3,020,461 | |
Payments for shares redeemed | | | — | | | | — | | | | | | (13,413,048 | ) | | | (8,349,968 | ) |
Change in Net Assets from Class C Share Transactions | | | 58,748 | | | | 110,000 | | | | | | 5,806,111 | | | | 26,952,594 | |
Class I | | | | | | | | | | | | | | | | | | |
Proceeds from shares sold | | | 827,197 | | | | 2,839,158 | | | | | | 598,498,015 | | | | 561,769,061 | |
Reinvested distributions | | | 18,242 | | | | 18,216 | | | | | | 75,414,430 | | | | 65,076,964 | |
Payments for shares redeemed | | | (241,799 | ) | | | (54,192 | ) | | | | | (375,299,825 | ) | | | (395,308,230 | ) |
Change in Net Assets from Class I Share Transactions | | | 603,640 | | | | 2,803,182 | | | | | | 298,612,620 | | | | 231,537,795 | |
Class Y | | | | | | | | | | | | | | | | | | |
Proceeds from shares sold | | | 650,076 | | | | 10,386,365 | | | | | | 138,505,316 | | | | 185,192,312 | |
Reinvested distributions | | | 8,681 | | | | 4,703 | | | | | | 20,470,934 | | | | 18,359,189 | |
Payments for shares redeemed | | | (9,016 | ) | | | (502 | ) | | | | | (78,000,969 | ) | | | (149,851,300 | ) |
Change in Net Assets from Class Y Share Transactions | | | 649,741 | | | | 10,390,566 | | | | | | 80,975,281 | | | | 53,700,201 | |
Change in net assets from capital transactions: | | $ | 2,298,834 | | | $ | 15,470,039 | | | | | $ | 389,042,080 | | | $ | 552,427,211 | |
Share Transactions: | | | | | | | | | | | | | | | | | | |
Class A | | | | | | | | | | | | | | | | | | |
Issued | | | 100,678 | | | | 204,372 | | | | | | 11,692,415 | | | | 30,236,017 | |
Reinvested | | | 985 | | | | 1,064 | | | | | | 2,338,656 | | | | 1,832,879 | |
Redeemed | | | (12,137 | ) | | | (7,302 | ) | | | | | (13,741,083 | ) | | | (20,922,183 | ) |
Change in shares outstanding | | | 89,526 | | | | 198,134 | | | | | | 289,988 | | | | 11,146,713 | |
Class C | | | | | | | | | | | | | | | | | | |
Issued | | | 5,281 | | | | 2,021 | | | | | | 735,551 | | | | 1,523,376 | |
Reinvested | | | 9 | | | | — | | | | | | 159,679 | | | | 141,460 | |
Redeemed | | | — | | | | — | | | | | | (616,874 | ) | | | (391,306 | ) |
Change in shares outstanding | | | 5,290 | | | | 2,021 | | | | | | 278,356 | | | | 1,273,530 | |
Class I | | | | | | | | | | | | | | | | | | |
Issued | | | 74,986 | | | | 259,503 | | | | | | 26,269,684 | | | | 25,069,556 | |
Reinvested | | | 1,687 | | | | 1,685 | | | | | | 3,450,704 | | | | 2,876,815 | |
Redeemed | | | (21,859 | ) | | | (5,217 | ) | | | | | (16,440,230 | ) | | | (17,585,207 | ) |
Change in shares outstanding | | | 54,814 | | | | 255,971 | | | | | | 13,280,158 | | | | 10,361,164 | |
Class Y | | | | | | | | | | | | | | | | | | |
Issued | | | 58,896 | | | | 1,063,879 | | | | | | 6,087,546 | | | | 8,197,893 | |
Reinvested | | | 801 | | | | 434 | | | | | | 935,616 | | | | 810,343 | |
Redeemed | | | (815 | ) | | | (49 | ) | | | | | (3,418,942 | ) | | | (6,653,800 | ) |
Change in shares outstanding | | | 58,882 | | | | 1,064,264 | | | | | | 3,604,220 | | | | 2,354,436 | |
Change in shares | | | 208,512 | | | | 1,520,390 | | | | | | 17,452,722 | | | | 25,135,843 | |
| (A) | Inception date of the Fund is December 31, 2013. Fund commenced public offering and investment operations on January 2, 2014. |
See accompanying Notes to Financial Statements.
| | | | | | | | | | | | | | | | |
| DIAMOND HILL FUNDS | | | | | ANNUAL REPORT | | | | | DECEMBER 31, 2015 | | | | | DIAMOND-HILL.COM | | | 63 | |
Diamond Hill Funds
Statements of Changes in Net Assets
| | | | | | | | | | | | | | | | | | |
| | | Select Fund | | | | | Long-Short Fund | |
| | | For the year
ended
December 31,
2015 | | | For the year
ended
December 31,
2014 | | | | | For the year
ended
December 31,
2015 | | | For the year
ended
December 31,
2014 | |
From Operations | | | | | | | | | | | | | | | | | | |
Net investment income (loss) | | $ | 129,870 | | | $ | 358,129 | | | | | $ | (11,874,489 | ) | | $ | (6,184,693 | ) |
Net realized gains (losses) on security sales | | | (1,306,472 | ) | | | 13,569,740 | | | | | | 282,565,938 | | | | 228,188,910 | |
Net realized gains (losses) on closed short positions | | | — | | | | — | | | | | | (145,044,409 | ) | | | (23,364,376 | ) |
Net change in unrealized appreciation (depreciation) on investments | | | (9,625,023 | ) | | | (5,538,997 | ) | | | | | (195,033,861 | ) | | | 42,862,088 | |
Change in Net Assets from Operations | | | (10,801,625 | ) | | | 8,388,872 | | | | | | (69,386,821 | ) | | | 241,501,929 | |
| | | | | |
Distributions to Shareholders | | | | | | | | | | | | | | | | | | |
From net investment income: | | | | | | | | | | | | | | | | | | |
Class A | | | — | | | | (54,815 | ) | | | | | — | | | | — | |
Class I | | | — | | | | (165,932 | ) | | | | | — | | | | — | |
Class Y | | | — | | | | (67,401 | ) | | | | | — | | | | — | |
From net realized gains on investments | | | | | | | | | | | | | | | | | | |
Class A | | | (1,452,241 | ) | | | (1,293,630 | ) | | | | | (2,769,878 | ) | | | — | |
Class C | | | (502,498 | ) | | | (839,134 | ) | | | | | (892,455 | ) | | | — | |
Class I | | | (2,650,605 | ) | | | (4,414,099 | ) | | | | | (15,735,080 | ) | | | — | |
Class Y | | | (346,711 | ) | | | (848,338 | ) | | | | | (1,388,802 | ) | | | — | |
Change in Net Assets from Distributions to Shareholders | | | (4,952,055 | ) | | | (7,683,349 | ) | | | | | (20,786,215 | ) | | | — | |
Change in net assets from capital transactions | | | 104,552,163 | | | | (6,490,816 | ) | | | | | 530,760,922 | | | | 714,224,685 | |
| | | | | |
Total Change in Net Assets | | | 88,798,483 | | | | (5,785,293 | ) | | | | | 440,587,886 | | | | 955,726,614 | |
| | | | | |
Net Assets: | | | | | | | | | | | | | | | | | | |
Beginning of period | | | 61,972,969 | | | | 67,758,262 | | | | | | 3,972,115,101 | | | | 3,016,388,487 | |
End of period | | $ | 150,771,452 | | | $ | 61,972,969 | | | | | $ | 4,412,702,987 | | | $ | 3,972,115,101 | |
Accumulated Net Investment Income (Loss) | | $ | 129,870 | | | $ | 341,863 | | | | | $ | — | | | $ | — | |
See accompanying Notes to Financial Statements.
| | | | | | | | | | | | | | |
| 64 | | DIAMOND HILL FUNDS | | | | | ANNUAL REPORT | | | | | DECEMBER 31, 2015 | | | | | DIAMOND-HILL.COM |
Diamond Hill Funds
Statements of Changes in Net Assets
| | | | | | | | | | | | | | | | | | |
| | | Select Fund | | | | | Long-Short Fund | |
| | | For the year
ended
December 31,
2015 | | | For the year
ended
December 31,
2014 | | | | | For the year
ended
December 31,
2015 | | | For the year
ended
December 31,
2014 | |
Capital Transactions: | | | | | | | | | | | | | | | | | | |
Class A | | | | | | | | | | | | | | | | | | |
Proceeds from shares sold | | $ | 46,758,363 | | | $ | 6,574,390 | | | | | $ | 206,033,175 | | | $ | 353,604,286 | |
Reinvested distributions | | | 1,248,087 | | | | 1,281,926 | | | | | | 2,488,265 | | | | — | |
Payments for shares redeemed | | | (12,804,427 | ) | | | (3,756,810 | ) | | | | | (329,536,806 | ) | | | (564,143,804 | ) |
Change in Net Assets from Class A Share Transactions | | | 35,202,023 | | | | 4,099,506 | | | | | | (121,015,366 | ) | | | (210,539,518 | ) |
Class C | | | | | | | | | | | | | | | | | | |
Proceeds from shares sold | | | 8,977,380 | | | | 3,272,404 | | | | | | 30,172,350 | | | | 47,160,963 | |
Reinvested distributions | | | 400,489 | | | | 608,129 | | | | | | 768,315 | | | | — | |
Payments for shares redeemed | | | (1,481,802 | ) | | | (1,093,371 | ) | | | | | (26,093,019 | ) | | | (16,655,534 | ) |
Change in Net Assets from Class C Share Transactions | | | 7,896,067 | | | | 2,787,162 | | | | | | 4,847,646 | | | | 30,505,429 | |
Class I | | | | | | | | | | | | | | | | | | |
Proceeds from shares sold | | | 120,581,528 | | | | 15,319,351 | | | | | | 1,485,217,775 | | | | 1,621,991,232 | |
Reinvested distributions | | | 2,542,802 | | | | 4,428,229 | | | | | | 12,003,836 | | | | — | |
Payments for shares redeemed | | | (64,201,194 | ) | | | (35,336,851 | ) | | | | | (866,062,430 | ) | | | (822,198,936 | ) |
Change in Net Assets from Class I Share Transactions | | | 58,923,136 | | | | (15,589,271 | ) | | | | | 631,159,181 | | | | 799,792,296 | |
Class Y | | | | | | | | | | | | | | | | | | |
Proceeds from shares sold | | | 2,636,273 | | | | 2,232,687 | | | | | | 119,279,729 | | | | 187,543,106 | |
Reinvested distributions | | | 346,711 | | | | 885,602 | | | | | | 836,382 | | | | — | |
Payments for shares redeemed | | | (452,047 | ) | | | (906,502 | ) | | | | | (104,346,650 | ) | | | (93,076,628 | ) |
Change in Net Assets from Class Y Share Transactions | | | 2,530,937 | | | | 2,211,787 | | | | | | 15,769,461 | �� | | | 94,466,478 | |
Change in net assets from capital transactions: | | $ | 104,552,163 | | | $ | (6,490,816 | ) | | | | $ | 530,760,922 | | | $ | 714,224,685 | |
Share Transactions: | | | | | | | | | | | | | | | | | | |
Class A | | | | | | | | | | | | | | | | | | |
Issued | | | 3,409,632 | | | | 494,796 | | | | | | 8,726,389 | | | | 15,427,099 | |
Reinvested | | | 101,553 | | | | 100,982 | | | | | | 106,291 | | | | — | |
Redeemed | | | (980,738 | ) | | | (280,407 | ) | | | | | (13,940,659 | ) | | | (24,506,686 | ) |
Change in shares outstanding | | | 2,530,447 | | | | 315,371 | | | | | | (5,107,979 | ) | | | (9,079,587 | ) |
Class C | | | | | | | | | | | | | | | | | | |
Issued | | | 690,808 | | | | 254,945 | | | | | | 1,376,619 | | | | 2,214,584 | |
Reinvested | | | 33,969 | | | | 49,765 | | | | | | 35,919 | | | | — | |
Redeemed | | | (116,456 | ) | | | (82,338 | ) | | | | | (1,199,867 | ) | | | (782,083 | ) |
Change in shares outstanding | | | 608,321 | | | | 222,372 | | | | | | 212,671 | | | | 1,432,501 | |
Class I | | | | | | | | | | | | | | | | | | |
Issued | | | 8,827,777 | | | | 1,156,717 | | | | | | 61,485,773 | | | | 69,336,502 | |
Reinvested | | | 206,396 | | | | 348,626 | | | | | | 504,151 | | | | — | |
Redeemed | | | (4,932,725 | ) | | | (2,641,236 | ) | | | | | (36,001,773 | ) | | | (35,523,578 | ) |
Change in shares outstanding | | | 4,101,448 | | | | (1,135,893 | ) | | | | | 25,988,151 | | | | 33,812,924 | |
Class Y | | | | | | | | | | | | | | | | | | |
Issued | | | 195,011 | | | | 168,726 | | | | | | 4,939,472 | | | | 8,060,507 | |
Reinvested | | | 28,097 | | | | 69,549 | | | | | | 35,024 | | | | — | |
Redeemed | | | (35,381 | ) | | | (66,413 | ) | | | | | (4,335,659 | ) | | | (3,987,297 | ) |
Change in shares outstanding | | | 187,727 | | | | 171,862 | | | | | | 638,837 | | | | 4,073,210 | |
Change in shares | | | 7,427,943 | | | | (426,288 | ) | | | | | 21,731,680 | | | | 30,239,048 | |
See accompanying Notes to Financial Statements.
| | | | | | | | | | | | | | | | |
| DIAMOND HILL FUNDS | | | | | ANNUAL REPORT | | | | | DECEMBER 31, 2015 | | | | | DIAMOND-HILL.COM | | | 65 | |
Diamond Hill Funds
Statements of Changes in Net Assets
| | | | | | | | | | | | | | | | | | |
| | | Research Opportunities Fund | | | | | Financial Long-Short Fund | |
| | | For the year
ended
December 31,
2015 | | | For the year
ended
December 31,
2014 | | | | | For the year
ended
December 31,
2015 | | | For the year
ended
December 31,
2014 | |
From Operations | | | | | | | | | | | | | | | | | | |
Net investment income (loss) | | $ | (68,791 | ) | | $ | (35,208 | ) | | | | $ | 26,945 | | | $ | (17,187 | ) |
Net realized gains (losses) on security sales | | | 5,018,282 | | | | 5,537,934 | | | | | | 3,341,781 | | | | 2,334,465 | |
Net realized gains (losses) on closed short positions | | | (1,252,359 | ) | | | (208,743 | ) | | | | | (82,958 | ) | | | (512,591 | ) |
Net realized gains (losses) on foreign currency transactions | | | (2,578 | ) | | | (3,118 | ) | | | | | — | | | | — | |
Net change in unrealized appreciation (depreciation) on investments and foreign currency translations | | | (9,014,463 | ) | | | (235,699 | ) | | | | | (4,875,135 | ) | | | 318,785 | |
Change in Net Assets from Operations | | | (5,319,909 | ) | | | 5,055,166 | | | | | | (1,589,367 | ) | | | 2,123,472 | |
| | | | | |
Distributions to Shareholders | | | | | | | | | | | | | | | | | | |
From net investment income: | | | | | | | | | | | | | | | | | | |
Class A | | | — | | | | (4,864 | ) | | | | | (43,179 | ) | | | — | |
Class I | | | (52,987 | ) | | | (136,937 | ) | | | | | (91,032 | ) | | | (42,765 | ) |
Class Y | | | (77,016 | ) | | | (71,226 | ) | | | | | — | | | | — | |
From net realized gains on investments | | | | | | | | | | | | | | | | | | |
Class A | | | (662,379 | ) | | | (689,050 | ) | | | | | — | | | | — | |
Class C | | | (360,854 | ) | | | (48,069 | ) | | | | | — | | | | — | |
Class I | | | (2,063,440 | ) | | | (3,632,483 | ) | | | | | — | | | | — | |
Class Y | | | (1,216,539 | ) | | | (1,365,593 | ) | | | | | — | | | | — | |
Change in Net Assets from Distributions to Shareholders | | | (4,433,215 | ) | | | (5,948,222 | ) | | | | | (134,211 | ) | | | (42,765 | ) |
Change in net assets from capital transactions | | | (12,428,112 | ) | | | 12,463,191 | | | | | | (446,293 | ) | | | (4,120,905 | ) |
| | | | | |
Total Change in Net Assets | | | (22,181,236 | ) | | | 11,570,135 | | | | | | (2,169,871 | ) | | | (2,040,198 | ) |
| | | | | |
Net Assets: | | | | | | | | | | | | | | | | | | |
Beginning of period | | | 77,386,332 | | | | 65,816,197 | | | | | | 29,586,338 | | | | 31,626,536 | |
End of period | | $ | 55,205,096 | | | $ | 77,386,332 | | | | | $ | 27,416,467 | | | $ | 29,586,338 | |
Accumulated Net Investment Income (Loss) | | $ | (411,836 | ) | | $ | (387,819 | ) | | | | $ | (85,789 | ) | | $ | (72,197 | ) |
See accompanying Notes to Financial Statements.
| | | | | | | | | | | | | | |
| 66 | | DIAMOND HILL FUNDS | | | | | ANNUAL REPORT | | | | | DECEMBER 31, 2015 | | | | | DIAMOND-HILL.COM |
Diamond Hill Funds
Statements of Changes in Net Assets
| | | | | | | | | | | | | | | | | | |
| | | Research Opportunities Fund | | | | | Financial Long-Short Fund | |
| | | For the year
ended
December 31,
2015 | | | For the year
ended
December 31,
2014 | | | | | For the year
ended
December 31,
2015 | | | For the year
ended
December 31,
2014 | |
Capital Transactions: | | | | | | | | | | | | | | | | | | |
Class A | | | | | | | | | | | | | | | | | | |
Proceeds from shares sold | | $ | 7,998,672 | | | $ | 3,466,741 | | | | | $ | 2,028,899 | | | $ | 1,773,833 | |
Reinvested distributions | | | 639,430 | | | | 684,086 | | | | | | 25,963 | | | | — | |
Payments for shares redeemed | | | (7,702,776 | ) | | | (1,379,684 | ) | | | | | (2,753,690 | ) | | | (8,439,654 | ) |
Change in Net Assets from Class A Share Transactions | | | 935,326 | | | | 2,771,143 | | | | | | (698,828 | ) | | | (6,665,821 | ) |
Class C | | | | | | | | | | | | | | | | | | |
Proceeds from shares sold | | | 6,880,044 | | | | 161,017 | | | | | | 162,132 | | | | 456,348 | |
Reinvested distributions | | | 341,164 | | | | 32,165 | | | | | | — | | | | — | |
Payments for shares redeemed | | | (1,799,883 | ) | | | (7,706 | ) | | | | | (437,261 | ) | | | (1,317,301 | ) |
Change in Net Assets from Class C Share Transactions | | | 5,421,325 | | | | 185,476 | | | | | | (275,129 | ) | | | (860,953 | ) |
Class I | | | | | | | | | | | | | | | | | | |
Proceeds from shares sold | | | 16,175,668 | | | | 14,210,006 | | | | | | 10,129,768 | | | | 7,450,674 | |
Reinvested distributions | | | 2,108,795 | | | | 3,642,863 | | | | | | 80,737 | | | | 23,483 | |
Payments for shares redeemed | | | (37,170,502 | ) | | | (10,449,087 | ) | | | | | (9,682,841 | ) | | | (4,068,288 | ) |
Change in Net Assets from Class I Share Transactions | | | (18,886,039 | ) | | | 7,403,782 | | | | | | 527,664 | | | | 3,405,869 | |
Class Y | | | | | | | | | | | | | | | | | | |
Proceeds from shares sold | | | 1,523,034 | | | | 2,058,515 | | | | | | — | | | | — | |
Reinvested distributions | | | 399,089 | | | | 318,230 | | | | | | — | | | | — | |
Payments for shares redeemed | | | (1,820,847 | ) | | | (273,955 | ) | | | | | — | | | | — | |
Change in Net Assets from Class Y Share Transactions | | | 101,276 | | | | 2,102,790 | | | | | | — | | | | — | |
Change in net assets from capital transactions: | | $ | (12,428,112 | ) | | $ | 12,463,191 | | | | | $ | (446,293 | ) | | $ | (4,120,905 | ) |
Share Transactions: | | | | | | | | | | | | | | | | | | |
Class A | | | | | | | | | | | | | | | | | | |
Issued | | | 344,138 | | | | 149,736 | | | | | | 104,825 | | | | 97,321 | |
Reinvested | | | 32,657 | | | | 31,061 | | | | | | 1,388 | | | | — | |
Redeemed | | | (359,951 | ) | | | (58,821 | ) | | | | | (142,522 | ) | | | (468,090 | ) |
Change in shares outstanding | | | 16,844 | | | | 121,976 | | | | | | (36,309 | ) | | | (370,769 | ) |
Class C | | | | | | | | | | | | | | | | | | |
Issued | | | 306,509 | | | | 7,249 | | | | | | 9,305 | | | | 26,346 | |
Reinvested | | | 18,013 | | | | 1,496 | | | | | | — | | | | — | |
Redeemed | | | (87,434 | ) | | | (341 | ) | | | | | (24,834 | ) | | | (77,974 | ) |
Change in shares outstanding | | | 237,088 | | | | 8,404 | | | | | | (15,529 | ) | | | (51,628 | ) |
Class I | | | | | | | | | | | | | | | | | | |
Issued | | | 697,619 | | | | 612,297 | | | | | | 518,918 | | | | 406,009 | |
Reinvested | | | 106,915 | | | | 164,311 | | | | | | 4,322 | | | | 1,192 | |
Redeemed | | | (1,690,625 | ) | | | (447,242 | ) | | | | | (508,801 | ) | | | (222,771 | ) |
Change in shares outstanding | | | (886,091 | ) | | | 329,366 | | | | | | 14,439 | | | | 184,430 | |
Class Y | | | | | | | | | | | | | | | | | | |
Issued | | | 65,960 | | | | 87,218 | | | | | | — | | | | — | |
Reinvested | | | 20,180 | | | | 14,310 | | | | | | — | | | | — | |
Redeemed | | | (78,760 | ) | | | (11,912 | ) | | | | | — | | | | — | |
Change in shares outstanding | | | 7,380 | | | | 89,616 | | | | | | — | | | | — | |
Change in shares | | | (624,779 | ) | | | 549,362 | | | | | | (37,399 | ) | | | (237,967 | ) |
See accompanying Notes to Financial Statements.
| | | | | | | | | | | | | | | | |
| DIAMOND HILL FUNDS | | | | | ANNUAL REPORT | | | | | DECEMBER 31, 2015 | | | | | DIAMOND-HILL.COM | | | 67 | |
Diamond Hill Funds
Statements of Changes in Net Assets
| | | | | | | | |
| | | Strategic Income Fund | |
| | | For the year
ended
December 31,
2015 | | | For the year
ended
December 31,
2014 | |
From Operations | | | | | | | | |
Net investment income (loss) | | $ | 13,875,096 | | | $ | 10,023,683 | |
Net realized gains (losses) on security sales | | | 629,391 | | | | 2,971,392 | |
Net change in unrealized appreciation (depreciation) on investments | | | (12,614,587 | ) | | | (8,718,179 | ) |
Change in Net Assets from Operations | | | 1,889,900 | | | | 4,276,896 | |
| | |
Distributions to Shareholders | | | | | | | | |
From net investment income: | | | | | | | | |
Class A | | | (1,772,505 | ) | | | (1,703,833 | ) |
Class C | | | (1,033,624 | ) | | | (940,177 | ) |
Class I | | | (9,849,445 | ) | | | (6,306,750 | ) |
Class Y | | | (961,840 | ) | | | (684,523 | ) |
Change in Net Assets from Distributions to Shareholders | | | (13,617,414 | ) | | | (9,635,283 | ) |
Change in net assets from capital transactions | | | 125,326,622 | | | | 38,433,025 | |
| | |
Total Change in Net Assets | | | 113,599,108 | | | | 33,074,638 | |
| | |
Net Assets: | | | | | | | | |
Beginning of period | | | 219,938,668 | | | | 186,864,030 | |
End of period | | $ | 333,537,776 | | | $ | 219,938,668 | |
Accumulated Net Investment Income (Loss) | | $ | 909,361 | | | $ | 651,679 | |
See accompanying Notes to Financial Statements.
| | | | | | | | | | | | | | |
| 68 | | DIAMOND HILL FUNDS | | | | | ANNUAL REPORT | | | | | DECEMBER 31, 2015 | | | | | DIAMOND-HILL.COM |
Diamond Hill Funds
Statements of Changes in Net Assets
| | | | | | | | |
| | | Strategic Income Fund | |
| | | For the year
ended
December 31,
2015 | | | For the year
ended
December 31,
2014 | |
Capital Transactions: | | | | | | | | |
Class A | | | | | | | | |
Proceeds from shares sold | | $ | 25,002,825 | | | $ | 15,957,484 | |
Reinvested distributions | | | 1,449,226 | | | | 1,343,253 | |
Payments for shares redeemed | | | (11,790,094 | ) | | | (25,111,482 | ) |
Change in Net Assets from Class A Share Transactions | | | 14,661,957 | | | | (7,810,745 | ) |
Class C | | | | | | | | |
Proceeds from shares sold | | | 4,711,613 | | | | 3,210,666 | |
Reinvested distributions | | | 617,137 | | | | 483,336 | |
Payments for shares redeemed | | | (4,870,148 | ) | | | (5,155,055 | ) |
Change in Net Assets from Class C Share Transactions | | | 458,602 | | | | (1,461,053 | ) |
Class I | | | | | | | | |
Proceeds from shares sold | | | 145,139,779 | | | | 62,622,412 | |
Reinvested distributions | | | 8,919,431 | | | | 5,276,429 | |
Payments for shares redeemed | | | (46,810,896 | ) | | | (32,499,589 | ) |
Change in Net Assets from Class I Share Transactions | | | 107,248,314 | | | | 35,399,252 | |
Class Y | | | | | | | | |
Proceeds from shares sold | | | 3,740,291 | | | | 12,129,992 | |
Reinvested distributions | | | 961,840 | | | | 684,414 | |
Payments for shares redeemed | | | (1,744,382 | ) | | | (508,835 | ) |
Change in Net Assets from Class Y Share Transactions | | | 2,957,749 | | | | 12,305,571 | |
Change in net assets from capital transactions: | | $ | 125,326,622 | | | $ | 38,433,025 | |
Share Transactions: | | | | | | | | |
Class A | | | | | | | | |
Issued | | | 2,289,120 | | | | 1,423,260 | |
Reinvested | | | 132,730 | | | | 120,274 | |
Redeemed | | | (1,069,893 | ) | | | (2,242,148 | ) |
Change in shares outstanding | | | 1,351,957 | | | | (698,614 | ) |
Class C | | | | | | | | |
Issued | | | 432,305 | | | | 288,054 | |
Reinvested | | | 56,561 | | | | 43,407 | |
Redeemed | | | (444,919 | ) | | | (464,281 | ) |
Change in shares outstanding | | | 43,947 | | | | (132,820 | ) |
Class I | | | | | | | | |
Issued | | | 13,431,461 | | | | 5,624,478 | |
Reinvested | | | 819,468 | | | | 474,994 | |
Redeemed | | | (4,308,315 | ) | | | (2,950,922 | ) |
Change in shares outstanding | | | 9,942,614 | | | | 3,148,550 | |
Class Y | | | | | | | | |
Issued | | | 340,930 | | | | 1,084,325 | |
Reinvested | | | 88,211 | | | | 61,601 | |
Redeemed | | | (164,616 | ) | | | (46,568 | ) |
Change in shares outstanding | | | 264,525 | | | | 1,099,358 | |
Change in shares | | | 11,603,043 | | | | 3,416,474 | |
See accompanying Notes to Financial Statements.
| | | | | | | | | | | | | | | | |
| DIAMOND HILL FUNDS | | | | | ANNUAL REPORT | | | | | DECEMBER 31, 2015 | | | | | DIAMOND-HILL.COM | | | 69 | |
Small Cap Fund
Financial Highlights
Selected data for a share outstanding throughout the periods indicated
| | | | | | | | | | | | | | | | |
| Small Cap Fund | | Net asset
value,
beginning
of period | | | Net
investment
income
(loss) | | | Net
realized
and
unrealized
gains
(losses) on
investments | | | Total from
investment
operations | |
| | | | |
Class A | | | | | | | | | | | | | | | | |
For the year ended December 31, 2015 | | | $32.61 | | | | (0.05 | )(C) | | | (1.17 | ) | | | (1.22 | ) |
For the year ended December 31, 2014 | | | $32.72 | | | | (0.11 | )(C) | | | 1.57 | | | | 1.46 | |
For the year ended December 31, 2013 | | | $24.95 | | | | — | (C)(D) | | | 9.86 | | | | 9.86 | |
For the year ended December 31, 2012 | | | $23.04 | | | | 0.07 | (C) | | | 2.88 | | | | 2.95 | |
For the year ended December 31, 2011 | | | $25.80 | | | | (0.08 | ) | | | (1.80 | ) | | | (1.88 | ) |
| | | | |
Class C | | | | | | | | | | | | | | | | |
For the year ended December 31, 2015 | | | $29.23 | | | | (0.25 | )(C) | | | (1.06 | ) | | | (1.31 | ) |
For the year ended December 31, 2014 | | | $29.70 | | | | (0.33 | )(C) | | | 1.43 | | | | 1.10 | |
For the year ended December 31, 2013 | | | $22.94 | | | | (0.21 | )(C) | | | 9.03 | | | | 8.82 | |
For the year ended December 31, 2012 | | | $21.34 | | | | (0.10 | )(C) | | | 2.65 | | | | 2.55 | |
For the year ended December 31, 2011 | | | $24.14 | | | | (0.25 | ) | | | (1.67 | ) | | | (1.92 | ) |
| | | | |
Class I | | | | | | | | | | | | | | | | |
For the year ended December 31, 2015 | | | $33.04 | | | | 0.05 | (C) | | | (1.20 | ) | | | (1.15 | ) |
For the year ended December 31, 2014 | | | $33.10 | | | | (0.02 | )(C) | | | 1.59 | | | | 1.57 | |
For the year ended December 31, 2013 | | | $25.21 | | | | 0.07 | (C) | | | 9.98 | | | | 10.05 | |
For the year ended December 31, 2012 | | | $23.27 | | | | 0.14 | (C) | | | 2.90 | | | | 3.04 | |
For the year ended December 31, 2011 | | | $26.01 | | | | (0.01 | ) | | | (1.82 | ) | | | (1.83 | ) |
| | | | |
Class Y(E) | | | | | | | | | | | | | | | | |
For the year ended December 31, 2015 | | | $33.05 | | | | 0.12 | (C) | | | (1.23 | ) | | | (1.11 | ) |
For the year ended December 31, 2014 | | | $33.09 | | | | 0.03 | (C) | | | 1.60 | | | | 1.63 | |
For the year ended December 31, 2013 | | | $25.20 | | | | 0.12 | (C) | | | 9.97 | | | | 10.09 | |
For the year ended December 31, 2012 | | | $23.27 | | | | 0.20 | (C) | | | 2.88 | | | | 3.08 | |
| (A) | Total returns shown exclude the effect of applicable sales charges. |
| (B) | Portfolio turnover rate is calculated on the basis of the Fund as a whole without distinguishing between classes of shares issued. |
| (C) | Net investment income (loss) per share has been calculated using the average daily shares outstanding during the period. |
See accompanying Notes to Financial Statements.
| | | | | | | | | | | | | | |
| 70 | | DIAMOND HILL FUNDS | | | | | ANNUAL REPORT | | | | | DECEMBER 31, 2015 | | | | | DIAMOND-HILL.COM |
| | | | | | | | | | | | | | | | | | | | | | | | | | | | | | | | | | |
Dividends
from net
investment
income | | | Distributions
from net
realized
gains | | | Total
distributions | | | Net asset
value at
end of
period | | | Total
return(A) | | | Net assets
at end
of period
(000’s) | | | Ratio
of total
expenses
to average
net assets | | | Ratio
of net
investment
income
(loss) to
average
net assets | | | Portfolio
turnover
rate(B) | |
| | | | | | | | |
| | | | | | | | | | | | | | | | | | | | | | | | | | | | | | | | | | |
| | (0.09) | | | | (0.41 | ) | | | (0.50 | ) | | | $30.89 | | | | (3.73 | )% | | | $492,810 | | | | 1.29 | % | | | (0.15 | )% | | | 17 | % |
| | — | | | | (1.57 | ) | | | (1.57 | ) | | | $32.61 | | | | 4.60 | % | | | $571,941 | | | | 1.30 | % | | | (0.34 | )% | | | 16 | % |
| | (0.03) | | | | (2.06 | ) | | | (2.09 | ) | | | $32.72 | | | | 39.70 | % | | | $571,167 | | | | 1.31 | % | | | (0.01 | )% | | | 43 | % |
| | (0.09) | | | | (0.95 | ) | | | (1.04 | ) | | | $24.95 | | | | 12.88 | % | | | $390,371 | | | | 1.31 | % | | | 0.30 | % | | | 13 | % |
| | — | | | | (0.88 | ) | | | (0.88 | ) | | | $23.04 | | | | (7.17 | )% | | | $431,313 | | | | 1.33 | % | | | (0.32 | )% | | | 28 | % |
| | | | | | | | |
| | | | | | | | | | | | | | | | | | | | | | | | | | | | | | | | | | |
| | — | | | | (0.41 | ) | | | (0.41 | ) | | | $27.51 | | | | (4.47 | )% | | | $57,875 | | | | 2.04 | % | | | (0.87 | )% | | | 17 | % |
| | — | | | | (1.57 | ) | | | (1.57 | ) | | | $29.23 | | | | 3.86 | % | | | $51,794 | | | | 2.05 | % | | | (1.07 | )% | | | 16 | % |
| | — | | | | (2.06 | ) | | | (2.06 | ) | | | $29.70 | | | | 38.64 | % | | | $46,476 | | | | 2.06 | % | | | (0.76 | )% | | | 43 | % |
| | — | | | | (0.95 | ) | | | (0.95 | ) | | | $22.94 | | | | 12.04 | % | | | $29,917 | | | | 2.06 | % | | | (0.45 | )% | | | 13 | % |
| | — | | | | (0.88 | ) | | | (0.88 | ) | | | $21.34 | | | | (7.83 | )% | | | $31,664 | | | | 2.08 | % | | | (1.07 | )% | | | 28 | % |
| | | | | | | | |
| | | | | | | | | | | | | | | | | | | | | | | | | | | | | | | | | | |
| | (0.20) | | | | (0.41 | ) | | | (0.61 | ) | | | $31.28 | | | | (3.47 | )% | | | $882,350 | | | | 1.02 | % | | | 0.16 | % | | | 17 | % |
| | (0.06) | | | | (1.57 | ) | | | (1.63 | ) | | | $33.04 | | | | 4.86 | % | | | $659,199 | | | | 1.05 | % | | | (0.06 | )% | | | 16 | % |
| | (0.10) | | | | (2.06 | ) | | | (2.16 | ) | | | $33.10 | | | | 40.08 | % | | | $550,844 | | | | 1.06 | % | | | 0.22 | % | | | 43 | % |
| | (0.15) | | | | (0.95 | ) | | | (1.10 | ) | | | $25.21 | | | | 13.17 | % | | | $298,473 | | | | 1.06 | % | | | 0.56 | % | | | 13 | % |
| | (0.03) | | | | (0.88 | ) | | | (0.91 | ) | | | $23.27 | | | | (6.91 | )% | | | $314,149 | | | | 1.04 | % | | | (0.03 | )% | | | 28 | % |
| | | | | | | | |
| | | | | | | | | | | | | | | | | | | | | | | | | | | | | | | | | | |
| | (0.24) | | | | (0.41 | ) | | | (0.65 | ) | | | $31.29 | | | | (3.36 | )% | | | $221,624 | | | | 0.90 | % | | | 0.37 | % | | | 17 | % |
| | (0.10) | | | | (1.57 | ) | | | (1.67 | ) | | | $33.05 | | | | 5.06 | % | | | $157,665 | | | | 0.90 | % | | | 0.10 | % | | | 16 | % |
| | (0.14) | | | | (2.06 | ) | | | (2.20 | ) | | | $33.09 | | | | 40.25 | % | | | $101,026 | | | | 0.91 | % | | | 0.40 | % | | | 43 | % |
| | (0.20) | | | | (0.95 | ) | | | (1.15 | ) | | | $25.20 | | | | 13.34 | % | | | $63,439 | | | | 0.91 | % | | | 0.82 | % | | | 13 | % |
| (D) | Amount is less than $0.005. |
| (E) | Inception date of Class Y is December 30, 2011. Class Y commenced public offering on January 3, 2012. |
See accompanying Notes to Financial Statements.
| | | | | | | | | | | | | | | | |
| DIAMOND HILL FUNDS | | | | | ANNUAL REPORT | | | | | DECEMBER 31, 2015 | | | | | DIAMOND-HILL.COM | | | 71 | |
Small-Mid Cap Fund
Financial Highlights
Selected data for a share outstanding throughout the periods indicated
| | | | | | | | | | | | | | | | |
| Small-Mid Cap Fund | | Net asset
value,
beginning
of period | | | Net
investment
income
(loss) | | | Net
realized
and
unrealized
gains
(losses) on
investments | | | Total from
investment
operations | |
| | | | |
Class A | | | | | | | | | | | | | | | | |
For the year ended December 31, 2015 | | | $18.33 | | | | 0.01 | (C) | | | 0.17 | | | | 0.18 | |
For the year ended December 31, 2014 | | | $17.73 | | | | 0.03 | (C) | | | 1.23 | | | | 1.26 | |
For the year ended December 31, 2013 | | | $13.13 | | | | 0.04 | (C) | | | 5.35 | | | | 5.39 | |
For the year ended December 31, 2012 | | | $11.71 | | | | 0.02 | (C) | | | 1.78 | | | | 1.80 | |
For the year ended December 31, 2011 | | | $12.56 | | | | — | (D) | | | (0.53 | ) | | | (0.53 | ) |
| | | | |
Class C | | | | | | | | | | | | | | | | |
For the year ended December 31, 2015 | | | $17.21 | | | | (0.12 | )(C) | | | 0.16 | | | | 0.04 | |
For the year ended December 31, 2014 | | | $16.80 | | | | (0.10 | )(C) | | | 1.15 | | | | 1.05 | |
For the year ended December 31, 2013 | | | $12.54 | | | | (0.07 | )(C) | | | 5.09 | | | | 5.02 | |
For the year ended December 31, 2012 | | | $11.28 | | | | (0.07 | )(C) | | | 1.71 | | | | 1.64 | |
For the year ended December 31, 2011 | | | $12.21 | | | | (0.06 | ) | | | (0.55 | ) | | | (0.61 | ) |
| | | | |
Class I | | | | | | | | | | | | | | | | |
For the year ended December 31, 2015 | | | $18.47 | | | | 0.07 | (C) | | | 0.17 | | | | 0.24 | |
For the year ended December 31, 2014 | | | $17.87 | | | | 0.08 | (C) | | | 1.22 | | | | 1.30 | |
For the year ended December 31, 2013 | | | $13.21 | | | | 0.09 | (C) | | | 5.38 | | | | 5.47 | |
For the year ended December 31, 2012 | | | $11.78 | | | | 0.05 | (C) | | | 1.80 | | | | 1.85 | |
For the year ended December 31, 2011 | | | $12.61 | | | | 0.04 | | | | (0.54 | ) | | | (0.50 | ) |
| | | | |
Class Y(F) | | | | | | | | | | | | | | | | |
For the year ended December 31, 2015 | | | $18.49 | | | | 0.09 | (C) | | | 0.17 | | | | 0.26 | |
For the year ended December 31, 2014 | | | $17.87 | | | | 0.11 | (C) | | | 1.23 | | | | 1.34 | |
For the year ended December 31, 2013 | | | $13.20 | | | | 0.12 | (C) | | | 5.38 | | | | 5.50 | |
For the year ended December 31, 2012 | | | $11.78 | | | | 0.09 | (C) | | | 1.77 | | | | 1.86 | |
| (A) | Total returns shown exclude the effect of applicable sales charges. |
| (B) | Portfolio turnover rate is calculated on the basis of the Fund as a whole without distinguishing between classes of shares issued. |
| (C) | Net investment income (loss) per share has been calculated using the average daily shares outstanding during the period. |
See accompanying Notes to Financial Statements.
| | | | | | | | | | | | | | |
| 72 | | DIAMOND HILL FUNDS | | | | | ANNUAL REPORT | | | | | DECEMBER 31, 2015 | | | | | DIAMOND-HILL.COM |
| | | | | | | | | | | | | | | | | | | | | | | | | | | | | | | | | | |
Dividends
from net
investment
income | | | Distributions
from net
realized
gains | | | Total
distributions | | | Net asset
value at
end of
period | | | Total
return(A) | | | Net assets
at end of
period
(000’s) | | | Ratio
of total
expenses
to average
net assets | | | Ratio
of net
investment
income
(loss) to
average
net assets | | | Portfolio
turnover
rate(B) | |
| | | | | | | | |
| | | | | | | | | | | | | | | | | | | | | | | | | | | | | | | | | | |
| | (0.03) | | | | (0.19 | ) | | | (0.22 | ) | | | $18.29 | | | | 0.98 | % | | | $156,122 | | | | 1.24 | % | | | 0.06 | % | | | 21 | % |
| | (0.02) | | | | (0.64 | ) | | | (0.66 | ) | | | $18.33 | | | | 7.17 | % | | | $100,820 | | | | 1.25 | % | | | 0.18 | % | | | 27 | % |
| | (0.03) | | | | (0.76 | ) | | | (0.79 | ) | | | $17.73 | | | | 41.25 | % | | | $61,563 | | | | 1.26 | % | | | 0.27 | % | | | 35 | % |
| | — | (D) | | | (0.38 | ) | | | (0.38 | ) | | | $13.13 | | | | 15.43 | % | | | $19,607 | | | | 1.26 | % | | | 0.15 | % | | | 26 | % |
| | — | | | | (0.32 | ) | | | (0.32 | ) | | | $11.71 | | | | (4.19 | )% | | | $17,461 | | | | 1.28 | % | | | — | %(E) | | | 48 | % |
| | | | | | | | |
| | | | | | | | | | | | | | | | | | | | | | | | | | | | | | | | | | |
| | — | | | | (0.19 | ) | | | (0.19 | ) | | | $17.06 | | | | 0.24 | % | | | $32,963 | | | | 1.99 | % | | | (0.69 | )% | | | 21 | % |
| | — | | | | (0.64 | ) | | | (0.64 | ) | | | $17.21 | | | | 6.33 | % | | | $25,276 | | | | 2.00 | % | | | (0.59 | )% | | | 27 | % |
| | — | | | | (0.76 | ) | | | (0.76 | ) | | | $16.80 | | | | 40.21 | % | | | $19,184 | | | | 2.01 | % | | | (0.45 | )% | | | 35 | % |
| | — | | | | (0.38 | ) | | | (0.38 | ) | | | $12.54 | | | | 14.57 | % | | | $9,169 | | | | 2.01 | % | | | (0.59 | )% | | | 26 | % |
| | — | | | | (0.32 | ) | | | (0.32 | ) | | | $11.28 | | | | (4.89 | )% | | | $8,110 | | | | 2.02 | % | | | (0.74 | )% | | | 48 | % |
| | | | | | | | |
| | | | | | | | | | | | | | | | | | | | | | | | | | | | | | | | | | |
| | (0.06) | | | | (0.19 | ) | | | (0.25 | ) | | | $18.46 | | | | 1.32 | % | | | $506,730 | | | | 0.97 | % | | | 0.35 | % | | | 21 | % |
| | (0.06) | | | | (0.64 | ) | | | (0.70 | ) | | | $18.47 | | | | 7.36 | % | | | $264,824 | | | | 1.00 | % | | | 0.42 | % | | | 27 | % |
| | (0.05) | | | | (0.76 | ) | | | (0.81 | ) | | | $17.87 | | | | 41.64 | % | | | $148,927 | | | | 1.01 | % | | | 0.54 | % | | | 35 | % |
| | (0.04) | | | | (0.38 | ) | | | (0.42 | ) | | | $13.21 | | | | 15.74 | % | | | $53,514 | | | | 1.01 | % | | | 0.42 | % | | | 26 | % |
| | (0.01) | | | | (0.32 | ) | | | (0.33 | ) | | | $11.78 | | | | (3.86 | )% | | | $43,485 | | | | 0.99 | % | | | 0.29 | % | | | 48 | % |
| | | | | | | | |
| | | | | | | | | | | | | | | | | | | | | | | | | | | | | | | | | | |
| | (0.08) | | | | (0.19 | ) | | | (0.27 | ) | | | $18.48 | | | | 1.41 | % | | | $602,951 | | | | 0.85 | % | | | 0.48 | % | | | 21 | % |
| | (0.08) | | | | (0.64 | ) | | | (0.72 | ) | | | $18.49 | | | | 7.60 | % | | | $300,815 | | | | 0.85 | % | | | 0.62 | % | | | 27 | % |
| | (0.07) | | | | (0.76 | ) | | | (0.83 | ) | | | $17.87 | | | | 41.88 | % | | | $106,068 | | | | 0.86 | % | | | 0.73 | % | | | 35 | % |
| | (0.06) | | | | (0.38 | ) | | | (0.44 | ) | | | $13.20 | | | | 15.84 | % | | | $30,940 | | | | 0.86 | % | | | 0.68 | % | | | 26 | % |
| (D) | Amount is less than $0.005. |
| (E) | Amount is less than 0.005%. |
| (F) | Inception date of Class Y is December 30, 2011. Class Y commenced public offering on January 3, 2012. |
See accompanying Notes to Financial Statements.
| | | | | | | | | | | | | | | | |
| DIAMOND HILL FUNDS | | | | | ANNUAL REPORT | | | | | DECEMBER 31, 2015 | | | | | DIAMOND-HILL.COM | | | 73 | |
Mid Cap Fund
Financial Highlights
Selected data for a share outstanding throughout the periods indicated
| | | | | | | | | | | | | | | | |
| Mid Cap Fund(D) | | Net asset
value,
beginning
of period | | | Net
investment
income
(loss) (A) | | | Net
realized
and
unrealized
gains
(losses) on
investments | | | Total from
investment
operations | |
| | | | |
Class A | | | | | | | | | | | | | | | | |
For the year ended December 31, 2015 | | | $10.70 | | | | 0.04 | | | | 0.01 | | | | 0.05 | |
For the year ended December 31, 2014 | | | $10.00 | | | | 0.06 | | | | 0.70 | | | | 0.76 | |
| | | | |
Class C | | | | | | | | | | | | | | | | |
For the year ended December 31, 2015 | | | $10.68 | | | | (0.03 | ) | | | (0.01 | ) | | | (0.04 | ) |
For the year ended December 31, 2014 | | | $10.00 | | | | (0.03 | ) | | | 0.71 | | | | 0.68 | |
| | | | |
Class I | | | | | | | | | | | | | | | | |
For the year ended December 31, 2015 | | | $10.72 | | | | 0.07 | | | | 0.01 | | | | 0.08 | |
For the year ended December 31, 2014 | | | $10.00 | | | | 0.09 | | | | 0.70 | | | | 0.79 | |
| | | | |
Class Y | | | | | | | | | | | | | | | | |
For the year ended December 31, 2015 | | | $10.73 | | | | 0.08 | | | | 0.01 | | | | 0.09 | |
For the year ended December 31, 2014 | | | $10.00 | | | | 0.09 | | | | 0.71 | | | | 0.80 | |
| (A) | Net investment income (loss) per share has been calculated using the average daily shares outstanding during the period. |
| (B) | Total returns shown exclude the effect of applicable sales charges. |
See accompanying Notes to Financial Statements.
| | | | | | | | | | | | | | |
| 74 | | DIAMOND HILL FUNDS | | | | | ANNUAL REPORT | | | | | DECEMBER 31, 2015 | | | | | DIAMOND-HILL.COM |
| | | | | | | | | | | | | | | | | | | | | | | | | | | | | | | | | | |
Dividends
from net
investment
income | | | Distributions
from net
realized
gains | | | Total
distributions | | | Net asset
value at
end of
period | | | Total
return(B) | | | Net assets
at end
of period
(000’s) | | | Ratio
of total
expenses
to average
net assets | | | Ratio
of net
investment
income
(loss) to
average
net assets | | | Portfolio
turnover
rate(C) | |
| | | | | | | | |
| | | | | | | | | | | | | | | | | | | | | | | | | | | | | | | | | | |
| | (0.04) | | | | — | | | | (0.04 | ) | | | $10.71 | | | | 0.44 | % | | | $3,082 | | | | 1.14 | % | | | 0.35 | % | | | 29 | % |
| | (0.06) | | | | — | | | | (0.06 | ) | | | $10.70 | | | | 7.57 | % | | | $2,120 | | | | 1.15 | % | | | 0.59 | % | | | 28 | % |
| | | | | | | | |
| | | | | | | | | | | | | | | | | | | | | | | | | | | | | | | | | | |
| | (0.01) | | | | — | | | | (0.01 | ) | | | $10.63 | | | | (0.33 | )% | | | $78 | | | | 1.89 | % | | | (0.32 | )% | | | 29 | % |
| | — | | | | — | | | | — | | | | $10.68 | | | | 6.80 | % | | | $22 | | | | 1.90 | % | | | (0.25 | )% | | | 28 | % |
| | | | | | | | |
| | | | | | | | | | | | | | | | | | | | | | | | | | | | | | | | | | |
| | (0.06) | | | | — | | | | (0.06 | ) | | | $10.74 | | | | 0.74 | % | | | $3,337 | | | | 0.87 | % | | | 0.61 | % | | | 29 | % |
| | (0.07) | | | | — | | | | (0.07 | ) | | | $10.72 | | | | 7.91 | % | | | $2,743 | | | | 0.90 | % | | | 0.87 | % | | | 28 | % |
| | | | | | | | |
| | | | | | | | | | | | | | | | | | | | | | | | | | | | | | | | | | |
| | (0.07) | | | | — | | | | (0.07 | ) | | | $10.75 | | | | 0.84 | % | | | $12,077 | | | | 0.75 | % | | | 0.72 | % | | | 29 | % |
| | (0.07) | | | | — | | | | (0.07 | ) | | | $10.73 | | | | 8.02 | % | | | $11,419 | | | | 0.75 | % | | | 0.87 | % | | | 28 | % |
| (C) | Portfolio turnover rate is calculated on the basis of the Fund as a whole without distinguishing between classes of shares issued. |
| (D) | Inception date of the Fund is December 31, 2013. Fund commenced public offering and investment operations on January 2, 2014. |
See accompanying Notes to Financial Statements.
| | | | | | | | | | | | | | | | |
| DIAMOND HILL FUNDS | | | | | ANNUAL REPORT | | | | | DECEMBER 31, 2015 | | | | | DIAMOND-HILL.COM | | | 75 | |
Large Cap Fund
Financial Highlights
Selected data for a share outstanding throughout the periods indicated
| | | | | | | | | | | | | | | | |
| Large Cap Fund | | Net asset
value,
beginning
of period | | | Net
investment
income
(loss) | | | Net
realized
and
unrealized
gains
(losses) on
investments | | | Total from
investment
operations | |
| | | | |
Class A | | | | | | | | | | | | | | | | |
For the year ended December 31, 2015 | | | $22.71 | | | | 0.19 | (C) | | | (0.43 | ) | | | (0.24 | ) |
For the year ended December 31, 2014 | | | $21.49 | | | | 0.21 | (C) | | | 2.01 | | | | 2.22 | |
For the year ended December 31, 2013 | | | $16.54 | | | | 0.18 | (C) | | | 5.79 | | | | 5.97 | |
For the year ended December 31, 2012 | | | $14.96 | | | | 0.22 | (C) | | | 1.62 | | | | 1.84 | |
For the year ended December 31, 2011 | | | $14.78 | | | | 0.18 | (C) | | | 0.17 | | | | 0.35 | |
| | | | |
Class C | | | | | | | | | | | | | | | | |
For the year ended December 31, 2015 | | | $21.77 | | | | 0.02 | (C) | | | (0.41 | ) | | | (0.39 | ) |
For the year ended December 31, 2014 | | | $20.68 | | | | 0.04 | (C) | | | 1.93 | | | | 1.97 | |
For the year ended December 31, 2013 | | | $15.98 | | | | 0.03 | (C) | | | 5.58 | | | | 5.61 | |
For the year ended December 31, 2012 | | | $14.46 | | | | 0.10 | (C) | | | 1.56 | | | | 1.66 | |
For the year ended December 31, 2011 | | | $14.29 | | | | 0.06 | | | | 0.16 | | | | 0.22 | |
| | | | |
Class I | | | | | | | | | | | | | | | | |
For the year ended December 31, 2015 | | | $22.83 | | | | 0.25 | (C) | | | (0.44 | ) | | | (0.19 | ) |
For the year ended December 31, 2014 | | | $21.58 | | | | 0.27 | (C) | | | 2.03 | | | | 2.30 | |
For the year ended December 31, 2013 | | | $16.61 | | | | 0.24 | (C) | | | 5.80 | | | | 6.04 | |
For the year ended December 31, 2012 | | | $15.01 | | | | 0.26 | (C) | | | 1.63 | | | | 1.89 | |
For the year ended December 31, 2011 | | | $14.82 | | | | 0.22 | | | | 0.17 | | | | 0.39 | |
| | | | |
Class Y(D) | | | | | | | | | | | | | | | | |
For the year ended December 31, 2015 | | | $22.84 | | | | 0.28 | (C) | | | (0.44 | ) | | | (0.16 | ) |
For the year ended December 31, 2014 | | | $21.59 | | | | 0.31 | (C) | | | 2.02 | | | | 2.33 | |
For the year ended December 31, 2013 | | | $16.60 | | | | 0.26 | (C) | | | 5.83 | | | | 6.09 | |
For the year ended December 31, 2012 | | | $15.01 | | | | 0.30 | (C) | | | 1.62 | | | | 1.92 | |
| (A) | Total returns shown exclude the effect of applicable sales charges. |
| (B) | Portfolio turnover rate is calculated on the basis of the Fund as a whole without distinguishing between classes of shares issued. |
See accompanying Notes to Financial Statements.
| | | | | | | | | | | | | | |
| 76 | | DIAMOND HILL FUNDS | | | | | ANNUAL REPORT | | | | | DECEMBER 31, 2015 | | | | | DIAMOND-HILL.COM |
| | | | | | | | | | | | | | | | | | | | | | | | | | | | | | | | | | |
Dividends
from net
investment
income | | | Distributions
from net
realized
gains | | | Total
distributions | | | Net asset
value at
end of
period | | | Total
return(A) | | | Net assets
at end
of period
(000’s) | | | Ratio
of total
expenses
to average
net assets | | | Ratio
of net
investment
income
(loss) to
average
net assets | | | Portfolio
turnover
rate(B) | |
| | | | | | | | |
| | | | | | | | | | | | | | | | | | | | | | | | | | | | | | | | | | |
| | (0.18) | | | | (0.85 | ) | | | (1.03 | ) | | | $21.44 | | | | (1.10 | )% | | | $1,122,165 | | | | 1.04 | % | | | 0.85 | % | | | 20 | % |
| | (0.19) | | | | (0.81 | ) | | | (1.00 | ) | | | $22.71 | | | | 10.42 | % | | | $1,182,155 | | | | 1.05 | % | | | 0.94 | % | | | 24 | % |
| | (0.16) | | | | (0.86 | ) | | | (1.02 | ) | | | $21.49 | | | | 36.33 | % | | | $878,903 | | | | 1.06 | % | | | 0.92 | % | | | 21 | % |
| | (0.21) | | | | (0.05 | ) | | | (0.26 | ) | | | $16.54 | | | | 12.29 | % | | | $617,407 | | | | 1.06 | % | | | 1.37 | % | | | 28 | % |
| | (0.17) | | | | — | | | | (0.17 | ) | | | $14.96 | | | | 2.35 | % | | | $593,124 | | | | 1.12 | % | | | 1.19 | % | | | 16 | % |
| | | | | | | | |
| | | | | | | | | | | | | | | | | | | | | | | | | | | | | | | | | | |
| | (0.04) | | | | (0.85 | ) | | | (0.89 | ) | | | $20.49 | | | | (1.83 | )% | | | $84,550 | | | | 1.79 | % | | | 0.10 | % | | | 20 | % |
| | (0.07) | | | | (0.81 | ) | | | (0.88 | ) | | | $21.77 | | | | 9.60 | % | | | $83,781 | | | | 1.80 | % | | | 0.19 | % | | | 24 | % |
| | (0.05) | | | | (0.86 | ) | | | (0.91 | ) | | | $20.68 | | | | 35.33 | % | | | $53,241 | | | | 1.81 | % | | | 0.18 | % | | | 21 | % |
| | (0.09) | | | | (0.05 | ) | | | (0.14 | ) | | | $15.98 | | | | 11.49 | % | | | $33,305 | | | | 1.81 | % | | | 0.62 | % | | | 28 | % |
| | (0.05) | | | | — | | | | (0.05 | ) | | | $14.46 | | | | 1.55 | % | | | $30,465 | | | | 1.87 | % | | | 0.45 | % | | | 16 | % |
| | | | | | | | |
| | | | | | | | | | | | | | | | | | | | | | | | | | | | | | | | | | |
| | (0.24) | | | | (0.85 | ) | | | (1.09 | ) | | | $21.55 | | | | (0.85 | )% | | | $1,803,130 | | | | 0.77 | % | | | 1.11 | % | | | 20 | % |
| | (0.24) | | | | (0.81 | ) | | | (1.05 | ) | | | $22.83 | | | | 10.74 | % | | | $1,606,797 | | | | 0.80 | % | | | 1.20 | % | | | 24 | % |
| | (0.21) | | | | (0.86 | ) | | | (1.07 | ) | | | $21.58 | | | | 36.60 | % | | | $1,295,477 | | | | 0.81 | % | | | 1.18 | % | | | 21 | % |
| | (0.24) | | | | (0.05 | ) | | | (0.29 | ) | | | $16.61 | | | | 12.62 | % | | | $791,031 | | | | 0.81 | % | | | 1.62 | % | | | 28 | % |
| | (0.20) | | | | — | | | | (0.20 | ) | | | $15.01 | | | | 2.60 | % | | | $684,156 | | | | 0.83 | % | | | 1.49 | % | | | 16 | % |
| | | | | | | | |
| | | | | | | | | | | | | | | | | | | | | | | | | | | | | | | | | | |
| | (0.27) | | | | (0.85 | ) | | | (1.12 | ) | | | $21.56 | | | | (0.74 | )% | | | $430,568 | | | | 0.65 | % | | | 1.23 | % | | | 20 | % |
| | (0.27) | | | | (0.81 | ) | | | (1.08 | ) | | | $22.84 | | | | 10.89 | % | | | $373,711 | | | | 0.65 | % | | | 1.36 | % | | | 24 | % |
| | (0.24) | | | | (0.86 | ) | | | (1.10 | ) | | | $21.59 | | | | 36.87 | % | | | $302,458 | | | | 0.66 | % | | | 1.32 | % | | | 21 | % |
| | (0.28) | | | | (0.05 | ) | | | (0.33 | ) | | | $16.60 | | | | 12.79 | % | | | $224,073 | | | | 0.66 | % | | | 1.87 | % | | | 28 | % |
| (C) | Net investment income (loss) per share has been calculated using the average daily shares outstanding during the period. |
| (D) | Inception date of Class Y is December 30, 2011. Class Y commenced public offering on January 3, 2012. |
See accompanying Notes to Financial Statements.
| | | | | | | | | | | | | | | | |
| DIAMOND HILL FUNDS | | | | | ANNUAL REPORT | | | | | DECEMBER 31, 2015 | | | | | DIAMOND-HILL.COM | | | 77 | |
Select Fund
Financial Highlights
Selected data for a share outstanding throughout the periods indicated
| | | | | | | | | | | | | | | | |
| Select Fund | | Net asset
value,
beginning
of period | | | Net
investment
income
(loss) | | | Net
realized
and
unrealized
gains
(losses) on
investments | | | Total from
investment
operations | |
|
Class A | |
For the year ended December 31, 2015 | | | $12.96 | | | | — | (C)(D) | | | (0.19 | ) | | | (0.19 | ) |
For the year ended December 31, 2014 | | | $13.00 | | | | 0.05 | (D) | | | 1.38 | | | | 1.43 | |
For the year ended December 31, 2013 | | | $10.45 | | | | 0.05 | (D) | | | 4.48 | | | | 4.53 | |
For the year ended December 31, 2012 | | | $9.69 | | | | 0.12 | (D) | | | 0.97 | | | | 1.09 | |
For the year ended December 31, 2011 | | | $9.99 | | | | 0.08 | | | | (0.33 | ) | | | (0.25 | ) |
| | | | |
Class C | | | | | | | | | | | | | | | | |
For the year ended December 31, 2015 | | | $12.54 | | | | (0.10 | )(D) | | | (0.18 | ) | | | (0.28 | ) |
For the year ended December 31, 2014 | | | $12.67 | | | | (0.05 | )(D) | | | 1.34 | | | | 1.29 | |
For the year ended December 31, 2013 | | | $10.25 | | | | (0.04 | )(D) | | | 4.38 | | | | 4.34 | |
For the year ended December 31, 2012 | | | $9.51 | | | | 0.04 | (D) | | | 0.95 | | | | 0.99 | |
For the year ended December 31, 2011 | | | $9.83 | | | | 0.02 | | | | (0.34 | ) | | | (0.32 | ) |
| | | | |
Class I | | | | | | | | | | | | | | | | |
For the year ended December 31, 2015 | | | $12.95 | | | | 0.03 | (D) | | | (0.18 | ) | | | (0.15 | ) |
For the year ended December 31, 2014 | | | $12.97 | | | | 0.09 | (D) | | | 1.38 | | | | 1.47 | |
For the year ended December 31, 2013 | | | $10.43 | | | | 0.09 | (D) | | | 4.46 | | | | 4.55 | |
For the year ended December 31, 2012 | | | $9.68 | | | | 0.15 | (D) | | | 0.96 | | | | 1.11 | |
For the year ended December 31, 2011 | | | $9.98 | | | | 0.11 | | | | (0.33 | ) | | | (0.22 | ) |
| | | | |
Class Y(E) | | | | | | | | | | | | | | | | |
For the year ended December 31, 2015 | | | $12.96 | | | | 0.05 | (D) | | | (0.19 | ) | | | (0.14 | ) |
For the year ended December 31, 2014 | | | $12.99 | | | | 0.10 | (D) | | | 1.39 | | | | 1.49 | |
For the year ended December 31, 2013 | | | $10.43 | | | | 0.11 | (D) | | | 4.48 | | | | 4.59 | |
For the year ended December 31, 2012 | | | $9.68 | | | | 0.17 | (D) | | | 0.96 | | | | 1.13 | |
| (A) | Total returns shown exclude the effect of applicable sales charges. |
| (B) | Portfolio turnover rate is calculated on the basis of the Fund as a whole without distinguishing between classes of shares issued. |
| (C) | Amount is less than $0.005. |
See accompanying Notes to Financial Statements.
| | | | | | | | | | | | | | |
| 78 | | DIAMOND HILL FUNDS | | | | | ANNUAL REPORT | | | | | DECEMBER 31, 2015 | | | | | DIAMOND-HILL.COM |
| | | | | | | | | | | | | | | | | | | | | | | | | | | | | | | | | | |
Dividends
from net
investment
income | | | Distributions
from net
realized
gains | | | Total
distributions | | | Net asset
value at
end of
period | | | Total
return(A) | | | Net assets
at end
of period
(000’s) | | | Ratio
of total
expenses
to average
net assets | | | Ratio
of net
investment
income
(loss) to
average
net assets | | | Portfolio
turnover
rate(B) | |
| | | | | | | | |
| | | | | | | | | | | | | | | | | | | | | | | | | | | | | | | | | | |
| | — | | | | (0.41 | ) | | | (0.41 | ) | | | $12.36 | | | | (1.44 | )% | | | $43,638 | | | | 1.19 | % | | | (0.01 | )% | | | 89 | % |
| | (0.05) | | | | (1.42 | ) | | | (1.47 | ) | | | $12.96 | | | | 11.30 | % | | | $12,963 | | | | 1.20 | % | | | 0.36 | % | | | 53 | % |
| | (0.09) | | | | (1.89 | ) | | | (1.98 | ) | | | $13.00 | | | | 44.04 | % | | | $8,905 | | | | 1.22 | % | | | 0.42 | % | | | 70 | % |
| | (0.08) | | | | (0.25 | ) | | | (0.33 | ) | | | $10.45 | | | | 11.27 | % | | | $7,778 | | | | 1.21 | % | | | 1.15 | % | | | 38 | % |
| | (0.05) | | | | — | | | | (0.05 | ) | | | $9.69 | | | | (2.53 | )% | | | $8,071 | | | | 1.23 | % | | | 0.92 | % | | | 26 | % |
| | | | | | | | |
| | | | | | | | | | | | | | | | | | | | | | | | | | | | | | | | | | |
| | — | | | | (0.41 | ) | | | (0.41 | ) | | | $11.85 | | | | (2.21 | )% | | | $15,022 | | | | 1.94 | % | | | (0.78 | )% | | | 89 | % |
| | — | | | | (1.42 | ) | | | (1.42 | ) | | | $12.54 | | | | 10.46 | % | | | $8,265 | | | | 1.95 | % | | | (0.39 | )% | | | 53 | % |
| | (0.03) | | | | (1.89 | ) | | | (1.92 | ) | | | $12.67 | | | | 43.08 | % | | | $5,533 | | | | 1.97 | % | | | (0.35 | )% | | | 70 | % |
| | — | | | | (0.25 | ) | | | (0.25 | ) | | | $10.25 | | | | 10.44 | % | | | $3,271 | | | | 1.96 | % | | | 0.41 | % | | | 38 | % |
| | — | | | | — | | | | — | | | | $9.51 | | | | (3.26 | )% | | | $3,630 | | | | 1.98 | % | | | 0.15 | % | | | 26 | % |
| | | | | | | | |
| | | | | | | | | | | | | | | | | | | | | | | | | | | | | | | | | | |
| | — | | | | (0.41 | ) | | | (0.41 | ) | | | $12.39 | | | | (1.14 | )% | | | $81,408 | | | | 0.92 | % | | | 0.25 | % | | | 89 | % |
| | (0.07) | | | | (1.42 | ) | | | (1.49 | ) | | | $12.95 | | | | 11.57 | % | | | $31,999 | | | | 0.95 | % | | | 0.64 | % | | | 53 | % |
| | (0.12) | | | | (1.89 | ) | | | (2.01 | ) | | | $12.97 | | | | 44.35 | % | | | $46,787 | | | | 0.97 | % | | | 0.66 | % | | | 70 | % |
| | (0.11) | | | | (0.25 | ) | | | (0.36 | ) | | | $10.43 | | | | 11.54 | % | | | $41,862 | | | | 0.96 | % | | | 1.44 | % | | | 38 | % |
| | (0.08) | | | | — | | | | (0.08 | ) | | | $9.68 | | | | (2.25 | )% | | | $34,388 | | | | 0.95 | % | | | 1.21 | % | | | 26 | % |
| | | | | | | | |
| | | | | | | | | | | | | | | | | | | | | | | | | | | | | | | | | | |
| | — | | | | (0.41 | ) | | | (0.41 | ) | | | $12.41 | | | | (1.06 | )% | | | $10,703 | | | | 0.80 | % | | | 0.35 | % | | | 89 | % |
| | (0.10) | | | | (1.42 | ) | | | (1.52 | ) | | | $12.96 | | | | 11.74 | % | | | $8,746 | | | | 0.80 | % | | | 0.76 | % | | | 53 | % |
| | (0.14) | | | | (1.89 | ) | | | (2.03 | ) | | | $12.99 | | | | 44.70 | % | | | $6,534 | | | | 0.82 | % | | | 0.82 | % | | | 70 | % |
| | (0.13) | | | | (0.25 | ) | | | (0.38 | ) | | | $10.43 | | | | 11.69 | % | | | $5,788 | | | | 0.81 | % | | | 1.62 | % | | | 38 | % |
| (D) | Net investment income (loss) per share has been calculated using the average daily shares outstanding during the period. |
| (E) | Inception date of Class Y is December 30, 2011. Class Y commenced public offering on January 3, 2012. |
See accompanying Notes to Financial Statements.
| | | | | | | | | | | | | | | | |
| DIAMOND HILL FUNDS | | | | | ANNUAL REPORT | | | | | DECEMBER 31, 2015 | | | | | DIAMOND-HILL.COM | | | 79 | |
Long-Short Fund
Financial Highlights
Selected data for a share outstanding throughout the periods indicated
| | | | | | | | | | | | | | | | |
| Long-Short Fund | | Net asset
value,
beginning
of period | | | Net
investment
income
(loss)(A) | | | Net
realized
and
unrealized
gains
(losses) on
investments | | | Total from
investment
operations | |
| | | | |
Class A | | | | | | | | | | | | | | | | |
For the year ended December 31, 2015 | | | $23.87 | | | | (0.11 | ) | | | (0.29 | ) | | | (0.40 | ) |
For the year ended December 31, 2014 | | | $22.26 | | | | (0.08 | ) | | | 1.69 | | | | 1.61 | |
For the year ended December 31, 2013 | | | $18.15 | | | | (0.05 | ) | | | 4.21 | | | | 4.16 | |
For the year ended December 31, 2012 | | | $16.75 | | | | 0.06 | | | | 1.36 | | | | 1.42 | |
For the year ended December 31, 2011 | | | $16.26 | | | | 0.03 | | | | 0.46 | | | | 0.49 | |
| | | | |
Class C | | | | | | | | | | | | | | | | |
For the year ended December 31, 2015 | | | $21.98 | | | | (0.27 | ) | | | (0.26 | ) | | | (0.53 | ) |
For the year ended December 31, 2014 | | | $20.65 | | | | (0.23 | ) | | | 1.56 | | | | 1.33 | |
For the year ended December 31, 2013 | | | $16.93 | | | | (0.19 | ) | | | 3.91 | | | | 3.72 | |
For the year ended December 31, 2012 | | | $15.72 | | | | (0.07 | ) | | | 1.28 | | | | 1.21 | |
For the year ended December 31, 2011 | | | $15.37 | | | | (0.08 | ) | | | 0.43 | | | | 0.35 | |
| | | | |
Class I | | | | | | | | | | | | | | | | |
For the year ended December 31, 2015 | | | $24.22 | | | | (0.05 | ) | | | (0.29 | ) | | | (0.34 | ) |
For the year ended December 31, 2014 | | | $22.52 | | | | (0.02 | ) | | | 1.72 | | | | 1.70 | |
For the year ended December 31, 2013 | | | $18.35 | | | | — | (E) | | | 4.26 | | | | 4.26 | |
For the year ended December 31, 2012 | | | $16.93 | | | | 0.10 | | | | 1.38 | | | | 1.48 | |
For the year ended December 31, 2011 | | | $16.42 | | | | 0.09 | | | | 0.45 | | | | 0.54 | |
| | | | |
Class Y(G) | | | | | | | | | | | | | | | | |
For the year ended December 31, 2015 | | | $24.25 | | | | (0.02 | ) | | | (0.29 | ) | | | (0.31 | ) |
For the year ended December 31, 2014 | | | $22.52 | | | | 0.01 | | | | 1.72 | | | | 1.73 | |
For the year ended December 31, 2013 | | | $18.35 | | | | 0.04 | | | | 4.25 | | | | 4.29 | |
For the year ended December 31, 2012 | | | $16.93 | | | | 0.14 | | | | 1.37 | | | | 1.51 | |
| (A) | Net investment income (loss) per share has been calculated using the average daily shares outstanding during the period. |
| (B) | Total returns shown exclude the effect of applicable sales charges. |
| (C) | This fund invests in short positions and as such incurs certain expenses and fees. If such expenses and fees had not occurred, the ratios of total expenses to average net assets would have been 1.39% for Class A, 2.14% for Class C, 1.12% for Class I and 1.00% for Class Y. |
See accompanying Notes to Financial Statements.
| | | | | | | | | | | | | | |
| 80 | | DIAMOND HILL FUNDS | | | | | ANNUAL REPORT | | | | | DECEMBER 31, 2015 | | | | | DIAMOND-HILL.COM |
| | | | | | | | | | | | | | | | | | | | | | | | | | | | | | | | | | |
Dividends
from net
investment
income | | | Distributions
from net
realized
gains | | | Total
distributions | | | Net asset
value at
end of
period | | | Total
return(B) | | | Net assets
at end
of period
(000’s) | | | Ratio
of total
expenses
to average
net assets(C) | | | Ratio
of net
investment
income
(loss) to
average
net assets | | | Portfolio
turnover
rate(D) | |
| | | | | | | | |
| | | | | | | | | | | | | | | | | | | | | | | | | | | | | | | | | | |
| | — | | | | (0.11 | ) | | | (0.11 | ) | | | $23.36 | | | | (1.67 | )% | | | $569,218 | | | | 1.89 | % | | | (0.47 | )% | | | 81 | % |
| | — | | | | — | | | | — | | | | $23.87 | | | | 7.23 | % | | | $703,572 | | | | 1.83 | % | | | (0.33 | )% | | | 60 | % |
| | (0.05) | | | | — | | | | (0.05 | ) | | | $22.26 | | | | 22.92 | % | | | $858,112 | | | | 1.83 | % | | | (0.25 | )% | | | 30 | % |
| | (0.02) | | | | — | | | | (0.02 | ) | | | $18.15 | | | | 8.46 | % | | | $533,722 | | | | 1.75 | % | | | 0.32 | % | | | 39 | % |
| | — | | | | — | | | | — | | | | $16.75 | | | | 3.01 | % | | | $512,870 | | | | 1.67 | % | | | 0.21 | % | | | 50 | % |
| | | | | | | | |
| | | | | | | | | | | | | | | | | | | | | | | | | | | | | | | | | | |
| | — | | | | (0.11 | ) | | | (0.11 | ) | | | $21.34 | | | | (2.40 | )% | | | $169,861 | | | | 2.64 | % | | | (1.22 | )% | | | 81 | % |
| | — | | | | — | | | | — | | | | $21.98 | | | | 6.44 | % | | | $170,278 | | | | 2.58 | % | | | (1.09 | )% | | | 60 | % |
| | — | | | | — | | | | — | | | | $20.65 | | | | 21.97 | % | | | $130,388 | | | | 2.58 | % | | | (0.99 | )% | | | 30 | % |
| | — | | | | — | | | | — | | | | $16.93 | | | | 7.70 | % | | | $103,393 | | | | 2.50 | % | | | (0.43 | )% | | | 39 | % |
| | — | | | | — | | | | — | | | | $15.72 | | | | 2.28 | % | | | $119,850 | | | | 2.43 | % | | | (0.54 | )% | | | 50 | % |
| | | | | | | | |
| | | | | | | | | | | | | | | | | | | | | | | | | | | | | | | | | | |
| | — | | | | (0.11 | ) | | | (0.11 | ) | | | $23.77 | | | | (1.40 | )% | | | $3,382,697 | | | | 1.62 | % | | | (0.21 | )% | | | 81 | % |
| | — | | | | — | | | | — | | | | $24.22 | | | | 7.55 | % | | | $2,817,671 | | | | 1.58 | % | | | (0.09 | )% | | | 60 | % |
| | (0.09) | | | | — | | | | (0.09 | ) | | | $22.52 | | | | 23.19 | % | | | $1,859,054 | | | | 1.58 | % | | | — | %(F) | | | 30 | % |
| | (0.06) | | | | — | | | | (0.06 | ) | | | $18.35 | | | | 8.77 | % | | | $1,554,623 | | | | 1.50 | % | | | 0.58 | % | | | 39 | % |
| | (0.03) | | | | — | | | | (0.03 | ) | | | $16.93 | | | | 3.29 | % | | | $1,213,122 | | | | 1.39 | % | | | 0.52 | % | | | 50 | % |
| | | | | | | | |
| | | | | | | | | | | | | | | | | | | | | | | | | | | | | | | | | | |
| | — | | | | (0.11 | ) | | | (0.11 | ) | | | $23.83 | | | | (1.27 | )% | | | $290,928 | | | | 1.50 | % | | | (0.08 | )% | | | 81 | % |
| | — | | | | — | | | | — | | | | $24.25 | | | | 7.68 | % | | | $280,595 | | | | 1.43 | % | | | 0.06 | % | | | 60 | % |
| | (0.12) | | | | — | | | | (0.12 | ) | | | $22.52 | | | | 23.39 | % | | | $168,835 | | | | 1.43 | % | | | 0.18 | % | | | 30 | % |
| | (0.09) | | | | — | | | | (0.09 | ) | | | $18.35 | | | | 8.95 | % | | | $83,409 | | | | 1.35 | % | | | 0.79 | % | | | 39 | % |
| (D) | Portfolio turnover rate is calculated on the basis of the Fund as a whole without distinguishing between classes of shares issued. |
| (E) | Amount is less than $0.005. |
| (F) | Amount is less than 0.005% |
| (G) | Inception date of Class Y is December 30, 2011. Class Y commenced public offering on January 3, 2012. |
See accompanying Notes to Financial Statements.
| | | | | | | | | | | | | | | | |
| DIAMOND HILL FUNDS | | | | | ANNUAL REPORT | | | | | DECEMBER 31, 2015 | | | | | DIAMOND-HILL.COM | | | 81 | |
Research Opportunities Fund
Financial Highlights
Selected data for a share outstanding throughout the periods indicated
| | | | | | | | | | | | | | | | |
| Research Opportunities Fund | | Net asset
value,
beginning
of period | | | Net
investment
income
(loss)(A) | | | Net
realized
and
unrealized
gains
(losses) on
investments | | | Total from
investment
operations | |
| | | | |
Class A | | | | | | | | | | | | | | | | |
For the year ended December 31, 2015 | | | $22.52 | | | | (0.06 | ) | | | (1.14 | ) | | | (1.20 | ) |
For the year ended December 31, 2014 | | | $22.82 | | | | (0.07 | ) | | | 1.62 | | | | 1.55 | |
For the year ended December 31, 2013 | | | $18.34 | | | | (0.10 | ) | | | 6.01 | | | | 5.91 | |
For the year ended December 31, 2012 | | | $16.60 | | | | 0.02 | | | | 1.93 | | | | 1.95 | |
| | | | |
Class C | | | | | | | | | | | | | | | | |
For the year ended December 31, 2015 | | | $22.00 | | | | (0.21 | ) | | | (1.11 | ) | | | (1.32 | ) |
For the year ended December 31, 2014 | | | $22.49 | | | | (0.24 | ) | | | 1.58 | | | | 1.34 | |
For the year ended December 31, 2013 | | | $18.22 | | | | (0.26 | ) | | | 5.96 | | | | 5.70 | |
For the year ended December 31, 2012 | | | $16.60 | | | | (0.09 | ) | | | 1.90 | | | | 1.81 | |
| | | | |
Class I | | | | | | | | | | | | | | | | |
For the year ended December 31, 2015 | | | $22.61 | | | | (0.01 | ) | | | (1.13 | ) | | | (1.14 | ) |
For the year ended December 31, 2014 | | | $22.90 | | | | (0.01 | ) | | | 1.62 | | | | 1.61 | |
For the year ended December 31, 2013 | | | $18.36 | | | | (0.04 | ) | | | 6.01 | | | | 5.97 | |
For the year ended December 31, 2012 | | | $16.60 | | | | 0.05 | | | | 1.95 | | | | 2.00 | |
| | | | |
Class Y(F) | | | | | | | | | | | | | | | | |
For the year ended December 31, 2015 | | | $22.64 | | | | 0.02 | | | | (1.14 | ) | | | (1.12 | ) |
For the year ended December 31, 2014 | | | $22.92 | | | | 0.03 | | | | 1.62 | | | | 1.65 | |
For the year ended December 31, 2013 | | | $18.36 | | | | — | (E) | | | 6.02 | | | | 6.02 | |
For the year ended December 31, 2012 | | | $16.60 | | | | 0.08 | | | | 1.94 | | | | 2.02 | |
| (A) | Net investment income (loss) per share has been calculated using the average daily shares outstanding during the period. |
| (B) | Total returns shown exclude the effect of applicable sales charges. |
| (C) | This fund invests in short positions and as such incurs certain expenses and fees. If such expenses and fees had not occurred, the ratios of total expenses to average net assets would have been 1.49% for Class A, 2.24% for Class C, 1.23% for Class I and 1.10% for Class Y. |
See accompanying Notes to Financial Statements.
| | | | | | | | | | | | | | |
| 82 | | DIAMOND HILL FUNDS | | | | | ANNUAL REPORT | | | | | DECEMBER 31, 2015 | | | | | DIAMOND-HILL.COM |
| | | | | | | | | | | | | | | | | | | | | | | | | | | | | | | | | | |
Dividends
from net
investment
income | | | Distributions
from net
realized
gains | | | Total
distributions | | | Net asset
value at
end of
period | | | Total
return(B) | | | Net assets
at end
of period
(000’s) | | | Ratio
of total
expenses
to average
net assets(C) | | | Ratio
of net
investment
income
(loss) to
average
net assets | | | Portfolio
turnover
rate(D) | |
| | | | | | | | |
| | | | | | | | | | | | | | | | | | | | | | | | | | | | | | | | | | |
| | — | | | | (1.62 | ) | | | (1.62 | ) | | | $19.70 | | | | (5.29 | )% | | | $8,637 | | | | 1.83 | % | | | (0.27 | )% | | | 147 | % |
| | (0.02) | | | | (1.83 | ) | | | (1.85 | ) | | | $22.52 | | | | 6.96 | % | | | $9,492 | | | | 1.74 | % | | | (0.29 | )% | | | 57 | % |
| | — | | | | (1.43 | ) | | | (1.43 | ) | | | $22.82 | | | | 32.43 | % | | | $6,836 | | | | 1.77 | % | | | (0.45 | )% | | | 72 | % |
| | (0.02) | | | | (0.19 | ) | | | (0.21 | ) | | | $18.34 | | | | 11.73 | % | | | $1,120 | | | | 1.63 | % | | | 0.10 | % | | | 35 | % |
| | | | | | | | |
| | | | | | | | | | | | | | | | | | | | | | | | | | | | | | | | | | |
| | — | | | | (1.62 | ) | | | (1.62 | ) | | | $19.06 | | | | (5.96 | )% | | | $5,097 | | | | 2.58 | % | | | (0.96 | )% | | | 147 | % |
| | — | | | | (1.83 | ) | | | (1.83 | ) | | | $22.00 | | | | 6.17 | % | | | $668 | | | | 2.49 | % | | | (1.03 | )% | | | 57 | % |
| | — | | | | (1.43 | ) | | | (1.43 | ) | | | $22.49 | | | | 31.48 | % | | | $494 | | | | 2.52 | % | | | (1.19 | )% | | | 72 | % |
| | — | | | | (0.19 | ) | | | (0.19 | ) | | | $18.22 | | | | 10.91 | % | | | $148 | | | | 2.38 | % | | | (0.51 | )% | | | 35 | % |
| | | | | | | | |
| | | | | | | | | | | | | | | | | | | | | | | | | | | | | | | | | | |
| | (0.04) | | | | (1.62 | ) | | | (1.66 | ) | | | $19.81 | | | | (5.00 | )% | | | $26,186 | | | | 1.57 | % | | | (0.03 | )% | | | 147 | % |
| | (0.07) | | | | (1.83 | ) | | | (1.90 | ) | | | $22.61 | | | | 7.21 | % | | | $49,920 | | | | 1.49 | % | | | (0.05 | )% | | | 57 | % |
| | —( | D) | | | (1.43 | ) | | | (1.43 | ) | | | $22.90 | | | | 32.76 | % | | | $43,018 | | | | 1.52 | % | | | (0.17 | )% | | | 72 | % |
| | (0.05) | | | | (0.19 | ) | | | (0.24 | ) | | | $18.36 | | | | 12.03 | % | | | $15,978 | | | | 1.38 | % | | | 0.30 | % | | | 35 | % |
| | | | | | | | |
| | | | | | | | | | | | | | | | | | | | | | | | | | | | | | | | | | |
| | (0.10) | | | | (1.62 | ) | | | (1.72 | ) | | | $19.80 | | | | (4.91 | )% | | | $15,285 | | | | 1.44 | % | | | 0.10 | % | | | 147 | % |
| | (0.10) | | | | (1.83 | ) | | | (1.93 | ) | | | $22.64 | | | | 7.37 | % | | | $17,307 | | | | 1.34 | % | | | 0.11 | % | | | 57 | % |
| | (0.03) | | | | (1.43 | ) | | | (1.46 | ) | | | $22.92 | | | | 32.99 | % | | | $15,468 | | | | 1.37 | % | | | 0.02 | % | | | 72 | % |
| | (0.07) | | | | (0.19 | ) | | | (0.26 | ) | | | $18.36 | | | | 12.17 | % | | | $11,572 | | | | 1.23 | % | | | 0.45 | % | | | 35 | % |
| (D) | Portfolio turnover rate is calculated on the basis of the Fund as a whole without distinguishing between classes of shares issued. |
| (E) | Amount is less than $0.005. |
| (F) | Inception date of Class Y is December 30, 2011. Class Y commenced public offering on January 3, 2012. |
See accompanying Notes to Financial Statements.
| | | | | | | | | | | | | | | | |
| DIAMOND HILL FUNDS | | | | | ANNUAL REPORT | | | | | DECEMBER 31, 2015 | | | | | DIAMOND-HILL.COM | | | 83 | |
Financial Long-Short Fund
Financial Highlights
Selected data for a share outstanding throughout the periods indicated
| | | | | | | | | | | | | | | | |
| Financial Long-Short Fund | | Net asset
value,
beginning
of period | | | Net
investment
income
(loss) | | | Net
realized
and
unrealized
gains
(losses) on
investments | | | Total from
investment
operations | |
| | | | |
Class A | | | | | | | | | | | | | | | | |
For the year ended December 31, 2015 | | | $19.61 | | | | — | (D)(E) | | | (0.92 | ) | | | (0.92 | ) |
For the year ended December 31, 2014 | | | $18.13 | | | | (0.02 | )(E) | | | 1.50 | | | | 1.48 | |
For the year ended December 31, 2013 | | | $13.24 | | | | (0.05 | )(E) | | | 4.94 | | | | 4.89 | |
For the year ended December 31, 2012 | | | $10.51 | | | | 0.06 | (E) | | | 2.74 | | | | 2.80 | |
For the year ended December 31, 2011 | | | $12.18 | | | | 0.02 | | | | (1.65 | ) | | | (1.63 | ) |
| | | | |
Class C | | | | | | | | | | | | | | | | |
For the year ended December 31, 2015 | | | $18.26 | | | | (0.13 | )(E) | | | (0.85 | ) | | | (0.98 | ) |
For the year ended December 31, 2014 | | | $17.00 | | | | (0.15 | )(E) | | | 1.41 | | | | 1.26 | |
For the year ended December 31, 2013 | | | $12.51 | | | | (0.17 | )(E) | | | 4.66 | | | | 4.49 | |
For the year ended December 31, 2012 | | | $9.96 | | | | (0.02 | )(E) | | | 2.57 | | | | 2.55 | |
For the year ended December 31, 2011 | | | $11.58 | | | | (0.07 | )(E) | | | (1.55 | ) | | | (1.62 | ) |
| | | | |
Class I | | | | | | | | | | | | | | | | |
For the year ended December 31, 2015 | | | $19.57 | | | | 0.05 | (E) | | | (0.91 | ) | | | (0.86 | ) |
For the year ended December 31, 2014 | | | $18.10 | | | | 0.02 | (E) | | | 1.50 | | | | 1.52 | |
For the year ended December 31, 2013 | | | $13.18 | | | | (0.02 | )(E) | | | 4.94 | | | | 4.92 | |
For the year ended December 31, 2012 | | | $10.47 | | | | 0.10 | (E) | | | 2.72 | | | | 2.82 | |
For the year ended December 31, 2011 | | | $12.14 | | | | 0.07 | | | | (1.67 | ) | | | (1.60 | ) |
| (A) | Total returns shown exclude the effect of applicable sales charges. |
| (B) | This fund invests in short positions and as such incurs certain expenses and fees. If such expenses and fees had not occurred, the ratios of total expenses to average net assets would have been 1.50% for Class A, 2.25% for Class C and 1.23% for Class I. |
See accompanying Notes to Financial Statements.
| | | | | | | | | | | | | | |
| 84 | | DIAMOND HILL FUNDS | | | | | ANNUAL REPORT | | | | | DECEMBER 31, 2015 | | | | | DIAMOND-HILL.COM |
| | | | | | | | | | | | | | | | | | | | | | | | | | | | | | | | | | |
Dividends
from net
investment
income | | | Distributions
from net
realized
gains | | | Total
distributions | | | Net asset
value at
end of
period | | | Total
return(A) | | | Net assets
at end
of period
(000’s) | | | Ratio
of total
expenses
to average
net assets(B) | | | Ratio
of net
investment
income
(loss) to
average
net assets | | | Portfolio
turnover
rate(C) | |
| | | | | | | | |
| | | | | | | | | | | | | | | | | | | | | | | | | | | | | | | | | | |
| | (0.07) | | | | — | | | | (0.07 | ) | | | $18.62 | | | | (4.67 | )% | | | $10,760 | | | | 1.85 | % | | | 0.02 | % | | | 63 | % |
| | — | | | | — | | | | — | | | | $19.61 | | | | 8.16 | % | | | $12,043 | | | | 1.74 | % | | | (0.10 | )% | | | 51 | % |
| | — | | | | — | | | | — | | | | $18.13 | | | | 36.93 | % | | | $17,852 | | | | 1.70 | % | | | (0.31 | )% | | | 66 | % |
| | (0.07) | | | | — | | | | (0.07 | ) | | | $13.24 | | | | 26.62 | % | | | $7,862 | | | | 1.76 | % | | | 0.49 | % | | | 58 | % |
| | (0.04) | | | | — | | | | (0.04 | ) | | | $10.51 | | | | (13.39 | )% | | | $6,650 | | | | 1.66 | % | | | 0.14 | % | | | 52 | % |
| | | | | | | | |
| | | | | | | | | | | | | | | | | | | | | | | | | | | | | | | | | | |
| | — | | | | — | | | | — | | | | $17.28 | | | | (5.37 | )% | | | $1,845 | | | | 2.60 | % | | | (0.75 | )% | | | 63 | % |
| | — | | | | — | | | | — | | | | $18.26 | | | | 7.41 | % | | | $2,233 | | | | 2.49 | % | | | (0.86 | )% | | | 51 | % |
| | — | | | | — | | | | — | | | | $17.00 | | | | 35.89 | % | | | $2,958 | | | | 2.45 | % | | | (1.06 | )% | | | 66 | % |
| | — | | | | — | | | | — | | | | $12.51 | | | | 25.60 | % | | | $820 | | | | 2.51 | % | | | (0.20 | )% | | | 58 | % |
| | — | | | | — | | | | — | | | | $9.96 | | | | (13.99 | )% | | | $795 | | | | 2.41 | % | | | (0.60 | )% | | | 52 | % |
| | | | | | | | |
| | | | | | | | | | | | | | | | | | | | | | | | | | | | | | | | | | |
| | (0.12) | | | | — | | | | (0.12 | ) | | | $18.59 | | | | (4.40 | )% | | | $14,812 | | | | 1.58 | % | | | 0.24 | % | | | 63 | % |
| | (0.05) | | | | — | | | | (0.05 | ) | | | $19.57 | | | | 8.42 | % | | | $15,310 | | | | 1.49 | % | | | 0.12 | % | | | 51 | % |
| | — | | | | — | | | | — | | | | $18.10 | | | | 37.33 | % | | | $10,817 | | | | 1.45 | % | | | (0.12 | )% | | | 66 | % |
| | (0.11) | | | | — | | | | (0.11 | ) | | | $13.18 | | | | 26.94 | % | | | $3,931 | | | | 1.51 | % | | | 0.85 | % | | | 58 | % |
| | (0.07) | | | | — | | | | (0.07 | ) | | | $10.47 | | | | (13.21 | )% | | | $1,584 | | | | 1.37 | % | | | 0.47 | % | | | 52 | % |
| (C) | Portfolio turnover rate is calculated on the basis of the Fund as a whole without distinguishing between classes of shares issued. |
| (D) | Amount is less than $0.005. |
| (E) | Net investment income (loss) per share has been calculated using the average daily shares outstanding during the period. |
See accompanying Notes to Financial Statements.
| | | | | | | | | | | | | | | | |
| DIAMOND HILL FUNDS | | | | | ANNUAL REPORT | | | | | DECEMBER 31, 2015 | | | | | DIAMOND-HILL.COM | | | 85 | |
Strategic Income Fund
Financial Highlights
Selected data for a share outstanding throughout the periods indicated
| | | | | | | | | | | | | | | | |
| Strategic Income Fund | | Net asset
value,
beginning
of period | | | Net
investment
income
(loss) | | | Net
realized
and
unrealized
gains
(losses) on
investments | | | Total from
investment
operations | |
|
Class A | |
For the year ended December 31, 2015 | | | $10.94 | | | | 0.58 | (C) | | | (0.44 | ) | | | 0.14 | |
For the year ended December 31, 2014 | | | $11.19 | | | | 0.51 | (C) | | | (0.28 | ) | | | 0.23 | |
For the year ended December 31, 2013 | | | $11.18 | | | | 0.56 | (C) | | | — | (D) | | | 0.56 | |
For the year ended December 31, 2012 | | | $10.79 | | | | 0.62 | (C) | | | 0.39 | | | | 1.01 | |
For the year ended December 31, 2011 | | | $10.86 | | | | 0.65 | | | | (0.09 | ) | | | 0.56 | |
| | | | |
Class C | | | | | | | | | | | | | | | | |
For the year ended December 31, 2015 | | | $10.92 | | | | 0.49 | (C) | | | (0.43 | ) | | | 0.06 | |
For the year ended December 31, 2014 | | | $11.17 | | | | 0.42 | (C) | | | (0.27 | ) | | | 0.15 | |
For the year ended December 31, 2013 | | | $11.17 | | | | 0.47 | (C) | | | — | (D) | | | 0.47 | |
For the year ended December 31, 2012 | | | $10.78 | | | | 0.53 | (C) | | | 0.40 | | | | 0.93 | |
For the year ended December 31, 2011 | | | $10.85 | | | | 0.56 | | | | (0.08 | ) | | | 0.48 | |
| | | | |
Class I | | | | | | | | | | | | | | | | |
For the year ended December 31, 2015 | | | $10.91 | | | | 0.60 | (C) | | | (0.43 | ) | | | 0.17 | |
For the year ended December 31, 2014 | | | $11.16 | | | | 0.54 | (C) | | | (0.27 | ) | | | 0.27 | |
For the year ended December 31, 2013 | | | $11.16 | | | | 0.58 | (C) | | | — | (D) | | | 0.58 | |
For the year ended December 31, 2012 | | | $10.77 | | | | 0.64 | (C) | | | 0.40 | | | | 1.04 | |
For the year ended December 31, 2011 | | | $10.84 | | | | 0.67 | | | | (0.08 | ) | | | 0.59 | |
| | | | |
Class Y(E) | | | | | | | | | | | | | | | | |
For the year ended December 31, 2015 | | | $10.91 | | | | 0.62 | (C) | | | (0.44 | ) | | | 0.18 | |
For the year ended December 31, 2014 | | | $11.16 | | | | 0.55 | (C) | | | (0.27 | ) | | | 0.28 | |
For the year ended December 31, 2013 | | | $11.15 | | | | 0.60 | (C) | | | — | (D) | | | 0.60 | |
For the year ended December 31, 2012 | | | $10.77 | | | | 0.66 | (C) | | | 0.38 | | | | 1.04 | |
| (A) | Total returns shown exclude the effect of applicable sales charges. |
| (B) | Portfolio turnover rate is calculated on the basis of the Fund as a whole without distinguishing between classes of shares issued. |
See accompanying Notes to Financial Statements.
| | | | | | | | | | | | | | |
| 86 | | DIAMOND HILL FUNDS | | | | | ANNUAL REPORT | | | | | DECEMBER 31, 2015 | | | | | DIAMOND-HILL.COM |
| | | | | | | | | | | | | | | | | | | | | | | | | | | | | | | | | | |
Dividends
from net
investment
income | | | Distributions
from net
realized
gains | | | Total
distributions | | | Net asset
value at
end of
period | | | Total
return(A) | | | Net assets
at end
of period
(000’s) | | | Ratio
of total
expenses
to average
net assets | | | Ratio
of net
investment
income
(loss) to
average
net assets | | | Portfolio
turnover
rate(B) | |
| | | | | | | | |
| | | | | | | | | | | | | | | | | | | | | | | | | | | | | | | | | | |
| | (0.55) | | | | — | | | | (0.55 | ) | | | $10.53 | | | | 1.19 | % | | | $44,354 | | | | 0.95 | % | | | 5.24 | % | | | 48 | % |
| | (0.48) | | | | — | | | | (0.48 | ) | | | $10.94 | | | | 2.10 | % | | | $31,282 | | | | 1.00 | % | | | 4.52 | % | | | 56 | % |
| | (0.55) | | | | — | | | | (0.55 | ) | | | $11.19 | | | | 5.13 | % | | | $39,801 | | | | 1.02 | % | | | 5.00 | % | | | 60 | % |
| | (0.62) | | | | — | | | | (0.62 | ) | | | $11.18 | | | | 9.55 | % | | | $44,374 | | | | 1.02 | % | | | 5.57 | % | | | 33 | % |
| | (0.63) | | | | — | | | | (0.63 | ) | | | $10.79 | | | | 5.21 | % | | | $38,895 | | | | 1.02 | % | | | 5.80 | % | | | 36 | % |
| | | | | | | | |
| | | | | | | | | | | | | | | | | | | | | | | | | | | | | | | | | | |
| | (0.47) | | | | — | | | | (0.47 | ) | | | $10.51 | | | | 0.44 | % | | | $23,649 | | | | 1.70 | % | | | 4.47 | % | | | 48 | % |
| | (0.40) | | | | — | | | | (0.40 | ) | | | $10.92 | | | | 1.37 | % | | | $24,088 | | | | 1.75 | % | | | 3.80 | % | | | 56 | % |
| | (0.47) | | | | — | | | | (0.47 | ) | | | $11.17 | | | | 4.26 | % | | | $26,126 | | | | 1.77 | % | | | 4.25 | % | | | 60 | % |
| | (0.54) | | | | — | | | | (0.54 | ) | | | $11.17 | | | | 8.76 | % | | | $27,801 | | | | 1.77 | % | | | 4.81 | % | | | 33 | % |
| | (0.55) | | | | — | | | | (0.55 | ) | | | $10.78 | | | | 4.48 | % | | | $23,717 | | | | 1.77 | % | | | 5.06 | % | | | 36 | % |
| | | | | | | | |
| | | | | | | | | | | | | | | | | | | | | | | | | | | | | | | | | | |
| | (0.58) | | | | — | | | | (0.58 | ) | | | $10.50 | | | | 1.49 | % | | | $247,522 | | | | 0.68 | % | | | 5.51 | % | | | 48 | % |
| | (0.52) | | | | — | | | | (0.52 | ) | | | $10.91 | | | | 2.38 | % | | | $148,737 | | | | 0.75 | % | | | 4.82 | % | | | 56 | % |
| | (0.58) | | | | — | | | | (0.58 | ) | | | $11.16 | | | | 5.30 | % | | | $117,009 | | | | 0.77 | % | | | 5.24 | % | | | 60 | % |
| | (0.65) | | | | — | | | | (0.65 | ) | | | $11.16 | | | | 9.83 | % | | | $103,738 | | | | 0.77 | % | | | 5.81 | % | | | 33 | % |
| | (0.66) | | | | — | | | | (0.66 | ) | | | $10.77 | | | | 5.53 | % | | | $83,418 | | | | 0.73 | % | | | 6.10 | % | | | 36 | % |
| | | | | | | | |
| | | | | | | | | | | | | | | | | | | | | | | | | | | | | | | | | | |
| | (0.59) | | | | — | | | | (0.59 | ) | | | $10.50 | | | | 1.60 | % | | | $18,013 | | | | 0.56 | % | | | 5.62 | % | | | 48 | % |
| | (0.53) | | | | — | | | | (0.53 | ) | | | $10.91 | | | | 2.54 | % | | | $15,831 | | | | 0.60 | % | | | 4.96 | % | | | 56 | % |
| | (0.59) | | | | — | | | | (0.59 | ) | | | $11.16 | | | | 5.55 | % | | | $3,927 | | | | 0.62 | % | | | 5.35 | % | | | 60 | % |
| | (0.66) | | | | — | | | | (0.66 | ) | | | $11.15 | | | | 9.90 | % | | | $2,515 | | | | 0.62 | % | | | 5.95 | % | | | 33 | % |
| (C) | Net investment income (loss) per share has been calculated using the average daily shares outstanding during the period. |
| (D) | Amount is less than $0.005. |
| (E) | Inception date of Class Y is December 30, 2011. Class Y commenced public offering on January 3, 2012. |
See accompanying Notes to Financial Statements.
| | | | | | | | | | | | | | | | |
| DIAMOND HILL FUNDS | | | | | ANNUAL REPORT | | | | | DECEMBER 31, 2015 | | | | | DIAMOND-HILL.COM | | | 87 | |
Diamond Hill Funds
Notes to Financial Statements
December 31, 2015
Organization
The Diamond Hill Small Cap Fund (“Small Cap Fund”), Diamond Hill Small-Mid Cap Fund (“Small-Mid Cap Fund”), Diamond Hill Mid Cap Fund (“Mid Cap Fund”), Diamond Hill Large Cap Fund (“Large Cap Fund”), Diamond Hill Select Fund (“Select Fund”), Diamond Hill Long-Short Fund (“Long-Short Fund”), Diamond Hill Research Opportunities Fund (“Research Opportunities Fund”), Diamond Hill Financial Long-Short Fund (“Financial Long-Short Fund”) and Diamond Hill Strategic Income Fund (“Strategic Income Fund”), are each a series of the Diamond Hill Funds (the “Trust”) (each a “Fund” and collectively the “Funds”). The Trust is an Ohio business trust, which is registered under the Investment Company Act of 1940, as amended, (the “1940 Act”) as an open-end, management investment company and thus follows accounting and reporting guidance for investment companies. Each Fund is a diversified series of the Trust.
Effective June 12, 2015, the Long-Short Fund closed to most new investors. Effective December 31, 2015, the Small Cap Fund closed to most new investors.
With the exception of the Financial Long-Short Fund, the Funds offer four classes of shares: Class A, Class C, Class I and Class Y. The Financial Long-Short Fund offers three classes of shares: Class A, Class C and Class I. Each class of shares for each Fund has identical rights and privileges except with respect to distribution (12b-1) and service fees, voting rights on matters affecting a single class of shares, exchange privileges of each class of shares and sales charges. Class A has a maximum sales charge on purchases of 5.00% as a percentage of the original purchase price except for Strategic Income Fund which is 3.50%. Class C has a contingent deferred sales charge of 1.00% for shares redeemed within a year of the purchase date.
Significant Accounting Policies
The following is a summary of the Funds’ significant accounting policies:
Estimates — The preparation of financial statements in conformity with U.S. generally accepted accounting principles (“GAAP”) requires management to make estimates and assumptions that affect the reported amounts of assets and liabilities and disclosure of contingent assets and liabilities at the date of the financial statements and the reported amounts of income and expenses during the reporting period. Actual results could differ from those estimates.
Security valuation — The Funds record their investments at fair value. Fair value is defined as the price that would be received to sell an asset or paid to transfer a liability in an orderly transaction between market participants at the measurement date. The valuation techniques used by the Funds maximize the use of observable inputs and minimize the use of unobservable inputs in determining fair value. These inputs are summarized in the three broad levels listed below:
| • | | Level 1 — quoted prices in active markets for identical securities |
| | | | | | | | | | | | | | |
| 88 | | DIAMOND HILL FUNDS | | | | | ANNUAL REPORT | | | | | DECEMBER 31, 2015 | | | | | DIAMOND-HILL.COM |
Diamond Hill Funds
Notes to Financial Statements (Continued)
December 31, 2015
| • | | Level 2 — other significant observable inputs (including quoted prices for similar securities, interest rates, prepayment speeds, credit risk, etc.) |
| • | | Level 3 — significant unobservable inputs (including the Funds’ own assumptions in determining the fair value of investments) |
Listed securities for which market quotations are readily available are valued at the closing prices as determined by the primary exchange where the securities are traded. Unlisted securities or listed securities for which the latest sales prices are not readily available are valued at the closing bid price in the principal market where such securities are normally traded. Investments in other investment companies are valued at their reported net asset value. In each of these types of situations, valuations are typically categorized as Level 1 in the fair value hierarchy.
Debt securities are valued on the basis of valuations provided by dealers or by an independent pricing service that determines valuations based upon market transactions for normal, institutional-size trading units of similar securities. Short-term debt investments of sufficient credit quality maturing in less than 61 days may be valued at amortized cost, which may approximate fair value. In each of these situations, valuations are typically categorized as Level 2 in the fair value hierarchy.
Securities for which market quotations are not readily available (e.g., an approved pricing service does not provide a price, certain stale prices, or an event occurs that materially affects the furnished price) are valued by the Fair Value Committee. In these cases, the Fair Value Committee, established and appointed by the Trustees, determines in good faith, subject to Trust procedures, the fair value of portfolio securities held by a Fund (“good faith fair valuation”). When a good faith fair valuation of a security is required, consideration is generally given to a number of factors, including, but not limited to the following: dealer quotes, published analyses by dealers or analysts of the situation at issue, transactions implicitly valuing the security (such as a merger, tender offer, etc.), the value of other securities or contracts which derive their value from the security at issue, and the implications (whether negative or positive) of the circumstances which have caused trading in the security to halt. Depending on the source and relative significance of the valuation inputs in these instances, the valuations for these securities may be classified as Level 2 or Level 3 in the fair value hierarchy.
In accordance with procedures adopted by the Board of Trustees, fair value pricing may be used if events materially affecting the value of foreign securities occur between the time the exchange on which they are traded closes and the time the Funds’ net asset values are calculated. The Funds use a systematic valuation model, provided daily by an independent third party to fair value their international equity securities. These valuations are considered as Level 2 in the fair value hierarchy.
| | | | | | | | | | | | | | | | |
| DIAMOND HILL FUNDS | | | | | ANNUAL REPORT | | | | | DECEMBER 31, 2015 | | | | | DIAMOND-HILL.COM | | | 89 | |
Diamond Hill Funds
Notes to Financial Statements (Continued)
December 31, 2015
Approximately 0.3% of the Strategic Income Fund’s December 31, 2015 net assets are being valued using estimates provided by the Fair Value Committee.
Changes in valuation techniques may result in transfers in or out of an assigned level within the disclosure hierarchy. The Trust determines transfers between fair value hierarchy levels at the reporting period end. There were no transfers between Levels 1, 2 or 3 as of December 31, 2015 based on input levels assigned at December 31, 2014.
The inputs or methodology used for valuing securities are not necessarily an indication of the risk associated with investing in those securities. For example, short-term debt securities of sufficient credit quality maturing in less than 61 days may be valued using amortized cost in accordance with rules under the 1940 Act. Generally, amortized cost approximates the current fair value of a security, but since the value is not obtained from a quoted price in an active market, such securities are reflected as Level 2.
The following is a summary of the inputs used to value the Funds’ investments as of December 31, 2015:
| | | | | | | | |
| | | Level 1 –
Quoted
Prices | | | Level 2 –
Other
Significant
Observable
Inputs | |
Investments in Securities: (Assets) | |
Small Cap Fund | | | | | | | | |
Common Stocks* | | $ | 1,321,331,242 | | | $ | — | |
Registered Investment Companies | | | 513,064,166 | | | | — | |
| | | | | | | | |
Total | | | 1,834,395,408 | | | | — | |
Small-Mid Cap Fund | | | | | | | | |
Common Stocks* | | | 1,179,024,182 | | | | — | |
Registered Investment Companies | | | 286,287,202 | | | | — | |
| | | | | | | | |
Total | | | 1,465,311,384 | | | | — | |
Mid Cap Fund | | | | | | | | |
Common Stocks* | | | 17,099,500 | | | | — | |
Registered Investment Companies | | | 6,897,989 | | | | — | |
| | | | | | | | |
Total | | | 23,997,489 | | | | — | |
Large Cap Fund | | | | | | | | |
Common Stocks* | | | 3,403,954,376 | | | | — | |
Registered Investment Companies | | | 74,193,410 | | | | — | |
| | | | | | | | |
Total | | | 3,478,147,786 | | | | — | |
| | | | | | | | | | | | | | |
| 90 | | DIAMOND HILL FUNDS | | | | | ANNUAL REPORT | | | | | DECEMBER 31, 2015 | | | | | DIAMOND-HILL.COM |
Diamond Hill Funds
Notes to Financial Statements (Continued)
December 31, 2015
| | | | | | | | |
| | | Level 1 –
Quoted
Prices | | | Level 2 –
Other
Significant
Observable
Inputs | |
Select Fund | | | | | | | | |
Common Stocks* | | $ | 147,119,354 | | | $ | — | |
Registered Investment Companies | | | 40,178,864 | | | | — | |
| | | | | | | | |
Total | | | 187,298,218 | | | | — | |
Long-Short Fund | | | | | | | | |
Common Stocks* | | | 3,661,897,692 | | | | — | |
Registered Investment Companies | | | 1,582,584,175 | | | | — | |
| | | | | | | | |
Total | | | 5,244,481,867 | | | | — | |
Research Opportunities Fund | | | | | | | | |
Common Stocks* | | | 53,722,114 | | | | 562,266 | |
Corporate Bonds* | | | — | | | | 1,893,625 | |
Registered Investment Companies | | | 15,985,758 | | | | — | |
| | | | | | | | |
Total | | | 69,707,872 | | | | 2,455,891 | |
Financial Long-Short Fund | | | | | | | | |
Common Stocks* | | | 25,699,803 | | | | — | |
Registered Investment Companies | | | 8,739,277 | | | | — | |
| | | | | | | | |
Total | | | 34,439,080 | | | | — | |
Strategic Income Fund | | | | | | | | |
Collateralized Debt Obligations | | | — | | | | 943,266 | |
Corporate Bonds* | | | — | | | | 275,121,948 | |
Registered Investment Companies | | | 58,050,739 | | | | — | |
| | | | | | | | |
Total | | | 58,050,739 | | | | 276,065,214 | |
| | |
Investments in Securities Sold Short: (Liabilities) | | | | | | | | |
Long-Short Fund | | | | | | | | |
Common Stocks* | | | (836,470,454 | ) | | | — | |
Registered Investment Company | | | (131,726,934 | ) | | | — | |
| | | | | | | | |
Total | | | (968,197,388 | ) | | | — | |
Research Opportunities Fund | | | | | | | | |
Common Stocks* | | | (11,124,763 | ) | | | — | |
Financial Long-Short Fund | | | | | | | | |
Common Stocks* | | | (3,226,240 | ) | | | — | |
| * | See Schedule of Investments and Schedule of Investments Sold Short for industry classification. |
| | | | | | | | | | | | | | | | |
| DIAMOND HILL FUNDS | | | | | ANNUAL REPORT | | | | | DECEMBER 31, 2015 | | | | | DIAMOND-HILL.COM | | | 91 | |
Diamond Hill Funds
Notes to Financial Statements (Continued)
December 31, 2015
The Funds did not hold any Level 3 securities during the year ended December 31, 2015.
Short sales — The Long-Short Fund, Research Opportunities Fund, Financial Long-Short Fund and Strategic Income Fund are permitted to make short sales of securities. Short sales are effective when it is believed that the price of a particular security will decline, and involves the sale of a security which the Fund does not own in hope of purchasing the same security at a later date at a lower price. To make delivery to the buyer, a Fund must borrow the security, and the Fund is obligated to return the security to the lender, which is accomplished by a later purchase of the security by the Fund. Cash received from short sales is maintained by the custodian and is used as collateral. It is included as “Cash deposits with custodian for securities sold short” on the Statements of Assets & Liabilities and “Segregated Cash With Custodian” on the Schedules of Investments.
A Fund will incur a loss as a result of a short sale if the price of the security increases between the date of the short sale and the date on which the Fund purchases the security to replace the borrowed security. The use of short sales may cause a Fund to have higher expenses (especially dividend expenses) than those of other equity mutual funds. Short sales are speculative transactions and involve special risks, including greater reliance on the ability of the Funds’ investment advisor, Diamond Hill Capital Management, Inc. (“DHCM”) to accurately anticipate the future value of a security.
Securities lending — Under the terms of the securities lending agreement with State Street Bank and Trust Company (“State Street”), State Street is authorized to loan securities on behalf of the Funds to approved borrowers. The contractual maturity of securities lending transactions are on an overnight and continuous basis. In exchange, the Funds receive cash collateral in the amount of at least 100% of the value of the securities loaned. Any collateral shortfalls due to changes in security market prices are adjusted the next business day. The cash collateral is invested in short-term instruments as noted in each Fund’s Schedule of Investments. Although risk is mitigated by the collateral, the Funds could experience a delay in recovering their securities and possible loss of income or value if the borrower fails to return them. The agreement indemnifies the Funds from losses incurred in the event of a borrower’s material default of the terms and conditions of the borrower agreement. The agreement provides that after predetermined rebates to borrowers, the Funds each retain 85% of their respective net securities lending income and pay State Street the remaining 15%.
As of December 31, 2015, the fair value of securities loaned and the collateral held were as follows:
| | | | | | | | |
| | | Fair Value of
Securities Loaned | | | Fair Value of
Collateral Received | |
Small Cap Fund | | $ | 168,281,666 | | | $ | 173,063,700 | |
Small-Mid Cap Fund | | | 154,410,593 | | | | 158,330,851 | |
Mid Cap Fund | | | 5,257,506 | | | | 5,381,516 | |
| | | | | | | | | | | | | | |
| 92 | | DIAMOND HILL FUNDS | | | | | ANNUAL REPORT | | | | | DECEMBER 31, 2015 | | | | | DIAMOND-HILL.COM |
Diamond Hill Funds
Notes to Financial Statements (Continued)
December 31, 2015
| | | | | | | | |
| | | Fair Value of
Securities Loaned | | | Fair Value of
Collateral Received | |
Large Cap Fund | | $ | 21,728,282 | | | $ | 22,216,363 | |
Select Fund | | | 35,333,834 | | | | 36,200,105 | |
Long-Short Fund | | | 850,920,868 | | | | 869,849,277 | |
Research Opportunities Fund | | | 15,534,005 | | | | 15,985,758 | |
Financial Long-Short Fund | | | 7,365,041 | | | | 7,536,021 | |
Strategic Income Fund | | | 21,177,235 | | | | 22,253,070 | |
Security transactions — Throughout the reporting period, investment transactions are recorded no later than the first business day following trade date. For financial reporting purposes, investments are reported on trade date on the last business day of the reporting period. The specific identification method is used for determining realized gains or losses for financial statements and income tax purposes. Dividend income is recognized on the ex-dividend date and interest income is recognized on an accrual basis. Discounts and premiums on securities purchased are amortized using the daily effective yield method. The Funds record distributions received from investments in Real Estate Investment Trusts (“REITS”) in excess of income from underlying investments as a reduction of cost of investments and/or realized gain. Such amounts are based on estimates if actual amounts are not available and actual amounts of income, realized gain and return of capital may differ from the estimated amounts. The Funds adjust the estimated amounts once the issuers provide information about the actual composition of the distributions.
Share valuation — The net asset value per share of each class of shares of each Fund is calculated daily by dividing the total value of a Fund’s assets attributable to that class, less liabilities attributable to that class, by the number of shares of that class outstanding.
Federal income taxes — Each Fund’s policy is to continue to comply with the requirements of the Internal Revenue Code that are applicable to regulated investment companies and to distribute substantially all of its taxable net investment income and any net realized capital gains to its shareholders. The Funds have analyzed their tax positions taken on Federal income tax returns for all open tax years (tax years ended December 31, 2012 through 2015) and have concluded that no provision for income tax is required in their financial statements.
Distributions to shareholders — Dividends from net investment income are declared and paid monthly for the Strategic Income Fund. Dividends from net investment income are declared and paid on an annual basis for the Small Cap Fund, Small-Mid Cap Fund, Mid Cap Fund, Large Cap Fund, Select Fund, Long-Short Fund, Research Opportunities Fund, and Financial Long-Short Fund. Dividends are declared separately for each class. No class has preferential dividend rights; differences in per share rates are due to differences in separate class expenses. Net realized capital gains, if any, are distributed at least annually. Distributions from net investment income and from net capital gains are determined in accordance with U.S. income tax regulations, which may differ from GAAP. These
| | | | | | | | | | | | | | | | |
| DIAMOND HILL FUNDS | | | | | ANNUAL REPORT | | | | | DECEMBER 31, 2015 | | | | | DIAMOND-HILL.COM | | | 93 | |
Diamond Hill Funds
Notes to Financial Statements (Continued)
December 31, 2015
differences are primarily due to differing treatments for paydown gains and losses on mortgage-backed securities, expiring capital loss carry-forwards and deferrals of certain losses. Permanent book and tax basis differences are reclassified among the components of net assets. Certain Funds may utilize earnings and profits distributed to shareholders on redemption of shares as part of the dividends paid deduction for income tax purposes.
Allocations — Investment income earned, realized capital gains and losses, and unrealized appreciation and depreciation for the Funds are allocated daily to each class of shares based upon its proportionate share of total net assets of the Fund. Class specific expenses are charged directly to the class incurring the expense. Common expenses, which are not attributable to a specific class, are allocated daily to each class of shares based upon its proportionate share of total net assets of the Fund. Expenses not directly billed to a Fund are allocated proportionally among all Funds daily in relation to net assets of each Fund or another reasonable measure.
Foreign securities country risk — Investing in non-U.S. securities may entail risk due to foreign economic and political developments; this risk may be higher when investing in emerging markets. Changes in currency exchange rates and differences in accounting and taxation policies outside the U.S. can raise or lower returns.
Foreign currency translation — The books and records of the Funds are maintained in U.S. dollars. Investment securities and other assets and liabilities denominated in a foreign currency are translated into U.S. dollars on the date of valuation. The Funds do not isolate that portion of realized or unrealized gains and losses resulting from changes in the foreign exchange rate from fluctuations arising from changes in the market prices of the securities. These gains and losses are included in net realized and unrealized gains and losses on investments in the Statements of Operations. Net realized and unrealized gains and losses on foreign currency transactions represent net foreign exchange gains or losses from foreign currency exchange contracts, disposition of foreign currencies, currency gains or losses realized between trade and settlement dates on securities transactions and the difference between the amount of the investment income and foreign withholding taxes recorded on the Funds’ books and the U.S. dollar equivalent amounts actually received or paid.
Investment Transactions
For the year ended December 31, 2015, purchases and sales (including maturities) of investment securities (excluding short-term securities and U.S. government obligations) were as follows:
| | | | | | | | |
| | | Purchases | | | Sales | |
Small Cap Fund | | | $ 489,846,791 | | | | $ 220,873,181 | |
Small-Mid Cap Fund | | | 808,431,276 | | | | 188,938,129 | |
Mid Cap Fund | | | 7,774,745 | | | | 4,788,241 | |
| | | | | | | | | | | | | | |
| 94 | | DIAMOND HILL FUNDS | | | | | ANNUAL REPORT | | | | | DECEMBER 31, 2015 | | | | | DIAMOND-HILL.COM |
Diamond Hill Funds
Notes to Financial Statements (Continued)
December 31, 2015
| | | | | | | | |
| | | Purchases | | | Sales | |
Large Cap Fund | | | $ 940,529,274 | | | | $ 656,989,018 | |
Select Fund | | | 225,894,177 | | | | 104,653,499 | |
Long-Short Fund | | | 2,435,544,553 | | | | 2,062,044,980 | |
Research Opportunities Fund | | | 93,677,439 | | | | 98,982,001 | |
Financial Long-Short Fund | | | 19,941,146 | | | | 15,321,502 | |
Strategic Income Fund | | | 196,539,139 | | | | 112,798,407 | |
The Funds pay commissions on the purchase and sale of investment securities. The commissions are treated as transaction costs and, therefore, are included as part of the cost of purchases or net proceeds on the sale of investment securities and are not included in the presentation of Fund expenses on the Statements of Operations. The Funds paid the following commissions during the year ended December 31, 2015:
| | | | | | | | |
| | | Total
Commissions | | | Commissions
as a % of
Average
Net Assets | |
Small Cap Fund | | $ | 340,587 | | | | 0.02 | % |
Small-Mid Cap Fund | | | 561,429 | | | | 0.06 | % |
Mid Cap Fund | | | 5,208 | | | | 0.03 | % |
Large Cap Fund | | | 566,255 | | | | 0.02 | % |
Select Fund | | | 117,765 | | | | 0.09 | % |
Long-Short Fund | | | 1,974,750 | | | | 0.05 | % |
Research Opportunities Fund | | | 92,311 | | | | 0.11 | % |
Financial Long-Short Fund | | | 14,784 | | | | 0.05 | % |
Investment Advisory Fees and Other Transactions with Affiliates
As of December 31, 2015, the Small Cap Fund, Small-Mid Cap Fund, Mid Cap Fund, Large Cap Fund, Select Fund, Long-Short Fund, Research Opportunities Fund, Financial Long-Short Fund and Strategic Income Fund each receive investment management and advisory services from DHCM under management agreements that provide for fees to be paid at an annual rate of 0.80%, 0.75%, 0.65%, 0.55%, 0.70%, 0.90%, 1.00%, 1.00% and 0.45% of the Fund’s average daily net assets, respectively. Prior to February 28, 2015, the annual rate for the Strategic Income Fund was 0.50% of the Fund’s average daily net assets. The advisory agreements are subject to annual approval by the Board of Trustees. In addition, each Fund entered into an administrative services agreement whereby DHCM is paid a fee at an annual rate of 0.24% for Class A Shares and Class C Shares, 0.21% for Class I Shares and 0.10% for Class Y shares of each class’ average daily net assets. Prior to July 1, 2015, the fees paid by Class I shares under the administrative services agreement was 0.24% of each class’
| | | | | | | | | | | | | | | | |
| DIAMOND HILL FUNDS | | | | | ANNUAL REPORT | | | | | DECEMBER 31, 2015 | | | | | DIAMOND-HILL.COM | | | 95 | |
Diamond Hill Funds
Notes to Financial Statements (Continued)
December 31, 2015
average daily net assets. These administrative fees are used to pay most of the Funds’ operating expenses except advisory fees, distribution fees, custody fees, brokerage fees, taxes, interest and dividend expense on securities sold short and extraordinary expenses.
Pursuant to Rule 12b-1 under the 1940 Act, the Trust has adopted a distribution plan on behalf of each Fund’s Class A and Class C Shares (the “Plan”). Under the Plan, Class A shares pay a distribution fee at an annual rate of 0.25% of Class A average daily net assets. Class C shares pay distribution and shareholder-servicing fees at an annual rate of 0.75% and 0.25%, respectively, of Class C’s average daily net assets. Class I and Class Y shares are not subject to any distribution or shareholder-servicing fees. The Trust entered into a Distribution Agreement on behalf of the Funds with BHIL Distributors, Inc. (“Distributor”), an affiliate of DHCM. Pursuant to the Distribution Agreement, the Distributor acts as principal underwriter of each Fund’s shares.
For the year ended December 31, 2015, the Distributor retained the following amounts in sales commissions from the sales of Class A shares of the Funds as follows:
| | | | |
Small Cap Fund | | $ | 17,858 | |
Small-Mid Cap Fund | | | 13,224 | |
Large Cap Fund | | | 46,924 | |
Select Fund | | | 15,314 | |
Long-Short Fund | | | 53,206 | |
Research Opportunities Fund | | | 175 | |
Financial Long-Short Fund | | | 1,270 | |
Strategic Income Fund | | | 7,031 | |
DHCM, as the financing agent for Class C shares, received contingent deferred sales charges relating to the redemptions of Class C shares of the Funds for the year ended December 31, 2015 as follows:
| | | | |
Small Cap Fund | | $ | 1,075 | |
Small-Mid Cap Fund | | | 1,134 | |
Large Cap Fund | | | 2,388 | |
Select Fund | | | 1,138 | |
Long-Short Fund | | | 3,497 | |
Research Opportunities Fund | | | 101 | |
Strategic Income Fund | | | 1,738 | |
Certain Officers of the Trust are affiliated with DHCM or the Distributor. Such Officers receive no compensation from the Funds for serving in their respective roles.
| | | | | | | | | | | | | | |
| 96 | | DIAMOND HILL FUNDS | | | | | ANNUAL REPORT | | | | | DECEMBER 31, 2015 | | | | | DIAMOND-HILL.COM |
Diamond Hill Funds
Notes to Financial Statements (Continued)
December 31, 2015
Trustee Fees
The Independent Trustees are compensated for their services to the Funds by DHCM as part of the administration services agreement. Collectively, the Independent Trustees were paid $362,500 in fees during the year ended December 31, 2015.
Commitments and Contingencies
The Funds indemnify the Trust’s Officers and Trustees for certain liabilities that might arise from their performance of their duties to the Funds. Additionally, in the normal course of business, the Funds enter into contracts that contain a variety of representations and warranties and which provide general indemnifications. The Funds’ maximum exposure under these arrangements is unknown, as this would involve future claims that may be made against the Funds that have not yet occurred. However, based on experience, the Funds expect the risk of loss to be remote.
Federal Tax Information
The amount and character of income and capital gain distributions paid by the Funds are determined in accordance with Federal income tax regulations which may differ from GAAP. The tax character of distributions paid may differ from the character of distributions shown on the Statements of Changes in Net Assets, as items such as short-term capital gains are treated as ordinary income for tax purposes.
The tax character of distributions paid during 2015 was as follows:
| | | | | | | | | | | | | | | | | | | | |
| | | Small Cap
Fund | | | Small-Mid
Cap Fund | | | Mid Cap
Fund | | | Large Cap
Fund | | | Select
Fund | |
Distributions paid from: | | | | | | | | | | | | | | | | | | | | |
Ordinary income | | $ | 8,403,924 | | | $ | 3,498,225 | | | $ | 108,238 | | | $ | 34,363,450 | | | $ | 359,589 | |
Long-term capital gains | | | 21,408,776 | | | | 13,087,774 | | | | — | | | | 129,116,454 | | | | 4,592,466 | |
| | | | | | | | | | | | | | | | | | | | |
Total distributions | | $ | 29,812,700 | | | $ | 16,585,999 | | | $ | 108,238 | | | $ | 163,479,904 | | | $ | 4,952,055 | |
| | | | | | | | | | | | | | | | | | | | |
| | | | | |
| | | | | | Long-Short
Fund | | | Research
Opportunities
Fund | | | Financial
Long-Short
Fund | | | Strategic
Income
Fund | |
Distributions paid from: | | | | | | | | | | | | | | | | | | | | |
Ordinary income | | | | | | $ | — | | | $ | 340,851 | | | $ | 134,211 | | | $ | 13,617,414 | |
Long-term capital gains | | | | | | | 20,786,215 | | | | 4,092,364 | | | | — | | | | — | |
| | | | | | | | | | | | | | | | | | | | |
Total distributions | | | | | | $ | 20,786,215 | | | $ | 4,433,215 | | | $ | 134,211 | | | $ | 13,617,414 | |
| | | | | | | | | | | | | | | | | | | | |
| | | | | | | | | | | | | | | | |
| DIAMOND HILL FUNDS | | | | | ANNUAL REPORT | | | | | DECEMBER 31, 2015 | | | | | DIAMOND—HILL.COM | | | 97 | |
Diamond Hill Funds
Notes to Financial Statements (Continued)
December 31, 2015
The following information is computed on a tax basis for each item as of December 31, 2015:
| | | | | | | | | | | | | | | | | | | | |
| | | Small Cap
Fund | | | Small-Mid
Cap Fund | | | Mid Cap
Fund | | | Large Cap
Fund | | | Select
Fund | |
Net unrealized appreciation (depreciation) on portfolio investments | | $ | 212,255,508 | | | $ | 44,137,744 | | | $ | 845,840 | | | $ | 639,704,687 | | | $ | (6,758,361 | ) |
Undistributed ordinary income | | | — | | | | — | | | | 7,395 | | | | 2,113,996 | | | | 666,648 | |
Undistributed capital gains | | | 38,108,187 | | | | 13,155,779 | | | | — | | | | 43,928,487 | | | | 1,206,738 | |
Capital loss carryforwards | | | — | | | | — | | | | (44,539 | ) | | | — | | | | — | |
Late-year ordinary losses deferred | | | (2,468,339 | ) | | | — | | | | — | | | | — | | | | — | |
| | | | | | | | | | | | | | | | | | | | |
Accumulated earnings (deficit) | | $ | 247,895,356 | | | $ | 57,293,523 | | | $ | 808,696 | | | $ | 685,747,170 | | | $ | (4,884,975 | ) |
| | | | | | | | | | | | | | | | | | | | |
| | | | | |
| | | | | | Long-Short
Fund | | | Research
Opportunities
Fund | | | Financial
Long-Short
Fund | | | Strategic
Income
Fund | |
Net unrealized appreciation (depreciation) on portfolio investments | | | $ | 512,410,508 | | | $ | (1,070,244 | ) | | $ | 282,885 | | | $ | (16,992,688 | ) |
Undistributed ordinary income | | | | — | | | | — | | | | 31,152 | | | | 943,989 | |
Undistributed capital gains | | | | — | | | | 10,325 | | | | — | | | | — | |
Capital loss carryforwards | | | | — | | | | — | | | | (5,761,578 | ) | | | (10,806,004 | ) |
Post-October capital losses deferred | | | | (2,443,579 | ) | | | (356,313 | ) | | | — | | | | — | |
Late-year ordinary losses deferred | | | | — | | | | (115,290 | ) | | | — | | | | — | |
| | | | | | | | | | | | | | | | | | | | |
Accumulated earnings (deficit) | | | $ | 509,966,929 | | | $ | (1,531,522 | ) | | $ | (5,447,541 | ) | | $ | (26,854,703 | ) |
| | | | | | | | | | | | | | | | | | | | |
Qualified late-year losses (Late-year Ordinary losses and Post October Capital losses listed above) incurred after October 31, 2015 and within the taxable year, are deemed to arise on the first day of the Funds’ next taxable year.
As of December 31, 2015, the Funds’ federal tax cost of investment securities and net unrealized appreciation (depreciation) were as follows:
| | | | | | | | | | | | | | | | | | | | |
| | | Small Cap
Fund | | | Small-Mid
Cap Fund | | | Mid Cap
Fund | | | Large Cap
Fund | | | Select
Fund | |
Tax cost of portfolio investments | | $ | 1,622,112,910 | | | $ | 1,421,164,046 | | | $ | 23,151,445 | | | $ | 2,838,443,099 | | | $ | 194,056,579 | |
| | | | | | | | | | | | | | | | | | | | |
Gross unrealized appreciation | | | 294,729,658 | | | | 118,320,854 | | | | 1,914,382 | | | | 733,444,339 | | | | 9,465,383 | |
Gross unrealized depreciation | | | (82,447,160 | ) | | | (74,173,516 | ) | | | (1,068,338 | ) | | | (93,739,652 | ) | | | (16,223,744 | ) |
| | | | | | | | | | | | | | | | | | | | |
Net unrealized appreciation (depreciation) on portfolio investments | | $ | 212,282,498 | | | $ | 44,147,338 | | | $ | 846,044 | | | $ | 639,704,687 | | | $ | (6,758,361 | ) |
| | | | | | | | | | | | | | | | | | | | |
| | | | | | | | | | | | | | |
| 98 | | DIAMOND HILL FUNDS | | | | | ANNUAL REPORT | | | | | DECEMBER 31, 2015 | | | | | DIAMOND-HILL.COM |
Diamond Hill Funds
Notes to Financial Statements (Continued)
December 31, 2015
| | | | | | | | | | | | | | | | |
| | | Long-Short
Fund | | | Research
Opportunities
Fund | | | Financial
Long-Short
Fund | | | Strategic
Income
Fund | |
Tax cost of long portfolio investments | | $ | 4,673,404,782 | | | $ | 72,688,141 | | | $ | 33,785,416 | | | $ | 351,108,641 | |
| | | | | | | | | | | | | | | | |
Gross unrealized appreciation | | | 690,857,465 | | | | 6,918,530 | | | | 2,694,335 | | | | 1,062,325 | |
Gross unrealized depreciation | | | (119,780,380 | ) | | | (7,442,908 | ) | | | (2,040,671 | ) | | | (18,055,013 | ) |
| | | | | | | | | | | | | | | | |
Net unrealized appreciation (depreciation) on long portfolio investments | | $ | 571,077,085 | | | $ | (524,378 | ) | | $ | 653,664 | | | $ | (16,992,688 | ) |
| | | | | | | | | | | | | | | | |
The difference between book basis and tax basis net unrealized appreciation (depreciation) is attributable primarily to the tax deferral of losses on wash sales.
As of the latest tax year ended December 31, 2015, the following Funds have capital loss carry forwards (“CLCFs”) as summarized in the tables below. CLCFs subject to expiration are applied as short-term capital loss regardless of whether the originating capital loss was short-term or long-term. CLCFs that are not subject to expiration must be utilized before those that are subject to expire. The Mid Cap Fund has a short-term CLCF of $44,539 that is not subject to expiration.
CLCFs subject to expiration:
| | | | | | | | |
| | | Amount | | | Expires
December 31, | |
Financial Long-Short Fund | | $ | 5,761,578 | | | | 2017 | |
| | | | | | | | |
| | $ | 5,761,578 | | | | | |
| | | | | | | | |
Strategic Income Fund | | $ | 5,534,150 | | | | 2016 | |
| | | 5,271,854 | | | | 2017 | |
| | | | | | | | |
| | $ | 10,806,004 | | | | | |
| | | | | | | | |
As of the latest tax year ended December 31, 2015, Mid Cap Fund, Long-Short Fund, Financial Long-Short Fund and Strategic Income Fund utilized $18,308, $118,576,181, $3,311,081 and $668,171, respectively, of CLCFs.
Reclassification of capital accounts — Reclassifications result primarily from the difference in the tax treatment of net investment losses, distributions in excess of net investment income, utilization of earnings and profits on shareholder redemptions, investments in REITS and publicly traded partnerships. The following reclassifications have no impact on
| | | | | | | | | | | | | | | | |
| DIAMOND HILL FUNDS | | | | | ANNUAL REPORT | | | | | DECEMBER 31, 2015 | | | | | DIAMOND-HILL.COM | | | 99 | |
Diamond Hill Funds
Notes to Financial Statements (Continued)
December 31, 2015
the net assets or net asset value per share of the Funds and are designed to present the Funds’ capital accounts on a tax basis:
| | | | | | | | | | | | |
| | | Paid-In
Capital | | | Undistributed
Net Investment
Income (Loss) | | | Accumulated
Net Realized
Gains
(Losses) | |
Small Cap Fund | | $ | 2,554,834 | | | $ | 3,751,221 | | | $ | (6,306,055 | ) |
Small-Mid Cap Fund | | | 1,030,862 | | | | 1,093,552 | | | | (2,124,414 | ) |
Mid Cap Fund | | | (3,464 | ) | | | 2,633 | | | | 831 | |
Large Cap Fund | | | 15,916,530 | | | | 4,810 | | | | (15,921,340 | ) |
Select Fund | | | 890,997 | | | | (341,863 | ) | | | (549,134 | ) |
Long-Short Fund | | | (10,776,344 | ) | | | 11,874,489 | | | | (1,098,145 | ) |
Research Opportunities Fund | | | 1,850,406 | | | | 174,777 | | | | (2,025,183 | ) |
Financial Long-Short Fund | | | (88,469 | ) | | | 93,674 | | | | (5,205 | ) |
Subsequent Events
The Funds evaluated events from December 31, 2015 through the date that these financial statements were issued. There were no subsequent events to report that would have a material impact on the Funds’ financial statements, other than disclosed below:
Effective January 1, 2016, the administrative fee for all Class I shares decreased from 0.21% to 0.20%. The management fee of the Large Cap Fund decreased from 0.55% to 0.50%.
On January 4, 2016, the Diamond Hill High Yield Fund commenced public offering and investment operations. The investment objective of the Diamond Hill High Yield Fund is high current income with the opportunity for capital appreciation. The Diamond Hill High Yield Fund is co-managed by William Zox and John McClain.
Effective February 28, 2016, the Diamond Hill Strategic Income Fund’s name will change to the Diamond Hill Corporate Credit Fund.
| | | | | | | | | | | | | | |
| 100 | | DIAMOND HILL FUNDS | | | | | ANNUAL REPORT | | | | | DECEMBER 31, 2015 | | | | | DIAMOND-HILL.COM |
Report of Independent Registered Public Accounting Firm
The Board of Trustees and Shareholders
of Diamond Hill Funds:
We have audited the accompanying statements of assets and liabilities, including the schedules of investments, of Diamond Hill Funds (comprising, respectively, the Diamond Hill Small Cap Fund, Diamond Hill Small-Mid Cap Fund, Diamond Hill Mid Cap Fund, Diamond Hill Large Cap Fund, Diamond Hill Select Fund, Diamond Hill Long-Short Fund, Diamond Hill Research Opportunities Fund, Diamond Hill Financial Long-Short Fund, and Diamond Hill Strategic Income Fund) (collectively, the “Funds”) as of December 31, 2015, and the related statements of operations for the year then ended, the statements of changes in net assets for each of the two years in the period then ended, and the financial highlights for the periods indicated therein. These financial statements and financial highlights are the responsibility of the Funds’ management. Our responsibility is to express an opinion on these financial statements and financial highlights based on our audits.
We conducted our audits in accordance with the standards of the Public Company Accounting Oversight Board (United States). Those standards require that we plan and perform the audit to obtain reasonable assurance about whether the financial statements and financial highlights are free of material misstatement. We were not engaged to perform an audit of the Funds’ internal control over financial reporting. Our audits included consideration of internal control over financial reporting as a basis for designing audit procedures that are appropriate in the circumstances, but not for the purpose of expressing an opinion on the effectiveness of the Funds’ internal control over financial reporting. Accordingly, we express no such opinion. An audit also includes examining, on a test basis, evidence supporting the amounts and disclosures in the financial statements and financial highlights, assessing the accounting principles used and significant estimates made by management, and evaluating the overall financial statement presentation. Our procedures included confirmation of securities owned as of December 31, 2015, by correspondence with the custodian and brokers or by other appropriate auditing procedures where replies from brokers were not received. We believe that our audits provide a reasonable basis for our opinion.
In our opinion, the financial statements and financial highlights referred to above present fairly, in all material respects, the financial position of each of the respective funds constituting the Diamond Hill Funds at December 31, 2015, the results of their operations for the year then ended, the changes in their net assets for each of the two years in the period then ended, and the financial highlights for each of the periods indicated therein, in conformity with U.S. generally accepted accounting principles.

Cincinnati, Ohio
February 24, 2016
| | | | | | | | | | | | | | | | |
| DIAMOND HILL FUNDS | | | | | ANNUAL REPORT | | | | | DECEMBER 31, 2015 | | | | | DIAMOND-HILL.COM | | | 101 | |
Diamond Hill Funds
Other Items
December 31, 2015 (Unaudited)
Proxy Voting
The investment adviser is responsible for exercising the voting rights associated with the securities purchased and held by the Funds. A description of the policies and procedures that the advisor uses in fulfilling this responsibility and information regarding how those proxies were voted during the twelve month period ended June 30 are available without charge upon request by calling toll free 1-888-226-5595 or on the Securities and Exchange Commission’s website at www.sec.gov.
Portfolio Disclosure
The Trust files a complete listing of portfolio holdings for each Fund as of the end of the first and third quarters of each fiscal year on Form N-Q and each second and fourth quarters of each fiscal year on Form N-CSR. The complete listing (i) is available on the Commission’s website; (ii) may be reviewed and copied at the Commission’s Public Reference Room in Washington, DC; and (iii) will be made available to shareholders upon request by calling 1-888-226-5595. Information on the operation of the Public Reference Room may be obtained by calling 1-800-SEC-0330. Monthly portfolio holdings are also available on www.diamond-hill.com.
Dividends Received Deduction
For corporate shareholders, the following ordinary dividends paid during the year ended December 31, 2015 qualify for the corporate dividends received deduction:
| | | | |
Small Cap Fund | | | 100.00 | % |
Small-Mid Cap Fund | | | 100.00 | % |
Mid Cap Fund | | | 100.00 | % |
Large Cap Fund | | | 100.00 | % |
Select Fund | | | 46.88 | % |
Research Opportunities Fund | | | 100.00 | % |
Financial Long-Short Fund | | | 100.00 | % |
Qualified Dividend Income
The Funds designated the maximum amount allowable of their net taxable income as qualified dividend income as provided in the Jobs and Growth Tax Relief Reconciliation Act of 2003. This amount was reflected on Form 1099-DIV for the calendar year 2015.
| | | | | | | | | | | | | | |
| 102 | | DIAMOND HILL FUNDS | | | | | ANNUAL REPORT | | | | | DECEMBER 31, 2015 | | | | | DIAMOND-HILL.COM |
Diamond Hill Funds
Other Items
December 31, 2015 (Unaudited) (Continued)
Capital Gain Distribution
For the year ended December 31, 2015, the following Funds designated long-term capital gain distributions:
| | | | |
Small Cap Fund | | $ | 21,408,775 | |
Small-Mid Cap Fund | | | 13,087,774 | |
Large Cap Fund | | | 129,116,454 | |
Select Fund | | | 4,592,466 | |
Long-Short Fund | | | 20,786,215 | |
Research Opportunities Fund | | | 4,092,364 | |
Trustee Approval of Investment Advisory Agreement
The Trustees of Diamond Hill Funds (the “Trust”), considered a broad range of information specifically requested and relating to its consideration of the continuance of the investment advisory agreement at regularly scheduled meetings on July 22, 2015, and August 20, 2015. By a unanimous vote, the Trustees approved the Amended and Restated Investment Management Agreement (“Management Agreement”) between the Trust and Diamond Hill Capital Management, Inc. (the “Adviser”), for each series of the Trust (each separately, a “Fund”). The following disclosure encompasses the discussion at the August 20, 2015, meeting. The Trustees discussed the following factors, on a Fund-by-Fund basis, in connection with the Trust’s Management Agreement:
| a) | Nature, Extent and Quality of Services. The Trustees considered the nature, extent and quality of the services provided by the Adviser under the Management Agreement, including a review of the services provided thereunder, the fee rates, fees paid, and expenses assumed. They also considered the Adviser’s overall reputation, integrity and mission to serve its clients through a disciplined intrinsic-value-based approach to investment that aligns the Adviser’s interests with those of its clients. The Trustees noted the qualifications of the investment staff and other key personnel of the Adviser and that the Adviser continues to invest significant resources in human capital and attract and retain top talent. The Trustees also reviewed the Adviser’s succession plan for key investment and management staff. In addition, the Trustees reviewed information related to the compensation structure for portfolio managers and other key investment personnel. |
| | In evaluating the performance of each Fund, the Trustees reviewed each Fund’s absolute performance, performance relative to its passive benchmark, and performance relative to its peer group as of June 30, 2015. The Trustees noted that the performance results for the Small Cap Fund, Small-Mid Cap Fund, Mid Cap Fund, Large Cap Fund, and Select Fund |
| | | | | | | | | | | | | | | | |
| DIAMOND HILL FUNDS | | | | | ANNUAL REPORT | | | | | DECEMBER 31, 2015 | | | | | DIAMOND-HILL.COM | | | 103 | |
Diamond Hill Funds
Other Items
December 31, 2015 (Unaudited) (Continued)
| | (collectively, the “Long-Only Equity Funds”) are competitive with the results for the peer group, especially for the five-year time period. They also noted that, with the exception of the Select Fund, the Long-Only Equity Funds failed to exceed the returns of the benchmark indices for the five-year time period, but this is consistent with the peer group. Turning to the investment results for the Long-Short Fund, Research Opportunities Fund, Financial Long-Short Fund and Strategic Income Fund, the Trustees noted that the Research Opportunities Fund underperformed the Russell 3000 Index for the since-inception, five-year, three-year, and one-year periods, noting, however, that the Research Opportunities Fund’s average net market exposure for time periods was much less than the 100% of the Russell 3000 Index. With respect to the Strategic Income Fund, the Trustees noted that investment results exceeded the relative benchmark for all periods shown. With the exception of the Mid-Cap Fund and the Research Opportunities Fund, since-inception performance for the other Funds exceeded the benchmarks, with since-inception results for the Long-Only Equity Funds in the top decile. In addition, the Trustees discussed the methodology for selecting funds to be included in each Fund’s respective peer group and the appropriateness of the benchmarks against which Fund performance is measured. |
| b) | Reasonableness of Investment Advisory Fees. The Trustees noted that the contractual fee rates under the Management Agreement were below both the average and median rates of comparable funds within each Fund’s respective peer group. |
| c) | Reasonableness of Total Expenses. The Trustees noted that the total expenses of each class of shares of each of the Funds, with one exception, were at or below the average total expenses of comparable funds within each Fund’s respective peer group. |
| d) | Reasonableness of Investment Advisory Fees as Compared to Fees Charged to Other Clients. The Trustees reviewed the fees paid by each of the Adviser’s other clients, as well as a summary of the differences in services provided and how these differences affect fees, including the difference between acting as an adviser versus a sub-adviser. With limited exceptions, investment advisory fees charged by the Adviser to the Funds were comparable to the investment advisory fees the Adviser charges to its other similarly managed accounts (i.e. private partnerships and separately managed accounts). |
| e) | Profitability. The Trustees noted the reasonableness of each Fund’s profitability to the Adviser and the Adviser’s methodology for calculating its profitability. The Trustees noted that the Adviser is also the administrator to the Funds (under the Amended and Restated Administrative, Fund Accounting and Transfer Agency Services Agreement (“Administrative Agreement”)) and the Trustees reviewed a separate profitability analysis relating to the administrative services provided to the Funds. The Trustees concluded that the Adviser’s pre-tax profit margin under the Management Agreement and the administration margin and pro-forma administration margin under the Administrative Agreement represented a fair and entrepreneurial profit for managing the Funds. |
| | | | | | | | | | | | | | |
| 104 | | DIAMOND HILL FUNDS | | | | | ANNUAL REPORT | | | | | DECEMBER 31, 2015 | | | | | DIAMOND-HILL.COM |
Diamond Hill Funds
Other Items
December 31, 2015 (Unaudited) (Continued)
| f) | Economies of Scale. The Trustees reviewed the potential extent to which economies of scale would be realized as each Fund grows and whether fee levels reflect these economies of scale for the benefit of Fund shareholders. They noted that while many advisory firms reduce fees as assets under management increase with predetermined break points, the Adviser has adopted a different strategy. The Trustees considered that rather than instituting break points, the Adviser has targeted its advisory fees to correspond to its mission to add value, meaning that rather than charging a lower fee on assets above a certain level, the Adviser prefers to close a strategy to new investors so that it can efficiently manage the Fund’s assets and attempt to fulfill its responsibility to add value to existing investors. The Trustees also noted that the Adviser has a history of voluntarily reducing its fees under the Administrative Agreement when asset growth allows for the sharing of economies of scale. |
| g) | Ancillary Benefits. The Trustees considered ancillary benefits received by the Adviser as a result of its relationship with the Funds, including the ability to negotiate favorable commissions rates and have access to research that benefits all of the Adviser’s clients, the ability to serve as sub-adviser to other mutual funds, and the ability to launch an exchange-traded fund. The Trustees noted that the Adviser is the administrator to the Funds (under the Administrative Agreement) and is expected to earn fees from the Funds for providing administrative services. The fees were shown separately in the profitability analysis presented to the Trustees. The Trustees noted that affiliates of the Adviser also have the ability to leverage these administrative services to other non-affiliated funds. The Trustees also considered revenue and expenses of the Administrator for providing financing arrangements related to the payment of commissions to financial intermediaries for the sale of Class C Shares of the Funds. |
In their deliberations, there was a comprehensive consideration of each of the factors above in connection with each Fund, and the Trustees, all of whom qualify as Independent Trustees under the 1940 Act, concluded the compensation to be received by the Adviser from each Fund was fair and reasonable and the continuance of the Management Agreement was in the best interests of each Fund and its shareholders.
| | | | | | | | | | | | | | | | |
| DIAMOND HILL FUNDS | | | | | ANNUAL REPORT | | | | | DECEMBER 31, 2015 | | | | | DIAMOND-HILL.COM | | | 105 | |
Diamond Hill Funds
Schedule of Shareholder Expenses
Hypothetical Example of a $1,000 Investment at Beginning of Period
(Unaudited)
As a Fund shareholder, you may incur two types of costs: (1) transaction costs, including wire redemption fees and sales charges (loads) as applicable; and (2) ongoing costs, including management fees; distribution and service (12b-1) fees; and other Fund expenses. These examples are intended to help you understand your ongoing costs (in dollars) of investing in a Fund and to compare these costs with the ongoing costs of investing in other mutual funds. Please note that the expenses shown in the tables are meant to highlight your ongoing costs only and do not reflect any transactional costs or other fees that may apply, such as fees for low balance accounts. Therefore, the examples are useful in comparing ongoing costs only and will not help you determine the relative total cost of owning different funds. In addition, if these transactional costs and other fees were included, your costs would have been higher.
These examples are based on an investment of $1,000 invested at July 1, 2015 and held for the entire period from July 1, 2015 through December 31, 2015.
The Actual Expense example below provides information about actual account values and actual expenses. You may use this information, together with the amount you invested, to estimate the expenses that you paid over the period. Simply divide your account value by $1,000 (for example, an $8,600 account value divided by $1,000 = 8.6), then multiply the result by the number in the table under the heading entitled “Expenses paid during the period” to estimate the expenses you paid on your account during this period.
The Hypothetical Expense example below provides information about hypothetical account values and hypothetical expenses based on each Fund’s actual expense ratio and an assumed rate of return of 5% per year before expenses, which is not each Fund’s actual return. The hypothetical account values and expenses may not be used to estimate the actual ending account balance or expenses you paid for the period. You may use this information to compare the ongoing costs of investing in this Fund and other funds. To do so, compare this 5% hypothetical example with the 5% hypothetical examples that appear in the shareholder reports of the other funds.
| | | | | | | | | | | | | | | | | | | | | | | | | | | | |
| | | Account value
at the beginning
of the period ($) | | | Account value
at the end
of the period ($) | | | Expenses paid
during
the period ($)* | | | Funds
annualized
expense
ratio (%) | |
| | | Actual | | | Hypothetical | | | Actual | | | Hypothetical | | | Actual | | | Hypothetical | | | Actual | |
Small Cap Fund | | | | | | | | | | | | | | | | | | | | | |
Class A | | | 1,000.00 | | | | 1,000.00 | | | | 938.60 | | | | 1,018.70 | | | | 6.30 | | | | 6.56 | | | | 1.29 | |
Class C | | | 1,000.00 | | | | 1,000.00 | | | | 935.10 | | | | 1,014.92 | | | | 9.95 | | | | 10.36 | | | | 2.04 | |
Class I | | | 1,000.00 | | | | 1,000.00 | | | | 939.90 | | | | 1,020.11 | | | | 4.94 | | | | 5.14 | | | | 1.01 | |
Class Y | | | 1,000.00 | | | | 1,000.00 | | | | 940.50 | | | | 1,020.67 | | | | 4.40 | | | | 4.58 | | | | 0.90 | |
Small-Mid Cap Fund | | | | | | | | | | | | | | | | | | | | | |
Class A | | | 1,000.00 | | | | 1,000.00 | | | | 960.50 | | | | 1,018.95 | | | | 6.13 | | | | 6.31 | | | | 1.24 | |
Class C | | | 1,000.00 | | | | 1,000.00 | | | | 956.80 | | | | 1,015.17 | | | | 9.82 | | | | 10.11 | | | | 1.99 | |
Class I | | | 1,000.00 | | | | 1,000.00 | | | | 962.10 | | | | 1,020.37 | | | | 4.75 | | | | 4.89 | | | | 0.96 | |
Class Y | | | 1,000.00 | | | | 1,000.00 | | | | 962.60 | | | | 1,020.92 | | | | 4.20 | | | | 4.33 | | | | 0.85 | |
| | | | | | | | | | | | | | |
| 106 | | DIAMOND HILL FUNDS | | | | | ANNUAL REPORT | | | | | DECEMBER 31, 2015 | | | | | DIAMOND-HILL.COM |
Diamond Hill Funds
Schedule of Shareholder Expenses
Hypothetical Example of a $1,000 Investment at Beginning of Period
(Unaudited) (Continued)
| | | | | | | | | | | | | | | | | | | | | | | | | | | | |
| | | Account value
at the beginning
of the period ($) | | | Account value
at the end
of the period ($) | | | Expenses paid
during
the period ($)* | | | Funds
annualized
expense
ratio (%) | |
| | | Actual | | | Hypothetical | | | Actual | | | Hypothetical | | | Actual | | | Hypothetical | | | Actual | |
Mid Cap Fund Class | | | | | | | | | | | | | | | | | | | | | |
Class A | | | 1,000.00 | | | | 1,000.00 | | | | 961.30 | | | | 1,019.46 | | | | 5.64 | | | | 5.80 | | | | 1.14 | |
Class C | | | 1,000.00 | | | | 1,000.00 | | | | 958.10 | | | | 1,015.68 | | | | 9.33 | | | | 9.60 | | | | 1.89 | |
Class I | | | 1,000.00 | | | | 1,000.00 | | | | 963.40 | | | | 1,020.87 | | | | 4.26 | | | | 4.38 | | | | 0.86 | |
Class Y | | | 1,000.00 | | | | 1,000.00 | | | | 963.50 | | | | 1,021.42 | | | | 3.71 | | | | 3.82 | | | | 0.75 | |
Large Cap Fund | | | | | | | | | | | | | | | | | | | | | |
Class A | | | 1,000.00 | | | | 1,000.00 | | | | 971.90 | | | | 1,019.96 | | | | 5.17 | | | | 5.30 | | | | 1.04 | |
Class C | | | 1,000.00 | | | | 1,000.00 | | | | 968.30 | | | | 1,016.18 | | | | 8.88 | | | | 9.10 | | | | 1.79 | |
Class I | | | 1,000.00 | | | | 1,000.00 | | | | 973.10 | | | | 1,021.37 | | | | 3.78 | | | | 3.87 | | | | 0.76 | |
Class Y | | | 1,000.00 | | | | 1,000.00 | | | | 973.80 | | | | 1,021.93 | | | | 3.23 | | | | 3.31 | | | | 0.65 | |
Select Fund | | | | | | | | | | | | | | | | | | | | | |
Class A | | | 1,000.00 | | | | 1,000.00 | | | | 922.90 | | | | 1,019.21 | | | | 5.77 | | | | 6.06 | | | | 1.19 | |
Class C | | | 1,000.00 | | | | 1,000.00 | | | | 919.20 | | | | 1,015.43 | | | | 9.38 | | | | 9.86 | | | | 1.94 | |
Class I | | | 1,000.00 | | | | 1,000.00 | | | | 924.40 | | | | 1,020.62 | | | | 4.41 | | | | 4.63 | | | | 0.91 | |
Class Y | | | 1,000.00 | | | | 1,000.00 | | | | 924.50 | | | | 1,021.17 | | | | 3.88 | | | | 4.08 | | | | 0.80 | |
Long-Short Fund | | | | | | | | | | | | | | | | | | | | | |
Class A | | | 1,000.00 | | | | 1,000.00 | | | | 975.50 | | | | 1,015.32 | | | | 9.76 | | | | 9.96 | | | | 1.96 | |
Class C | | | 1,000.00 | | | | 1,000.00 | | | | 972.00 | | | | 1,011.54 | | | | 13.47 | | | | 13.74 | | | | 2.71 | |
Class I | | | 1,000.00 | | | | 1,000.00 | | | | 977.10 | | | | 1,016.74 | | | | 8.37 | | | | 8.54 | | | | 1.68 | |
Class Y | | | 1,000.00 | | | | 1,000.00 | | | | 977.60 | | | | 1,017.29 | | | | 7.83 | | | | 7.98 | | | | 1.57 | |
Research Opportunities Fund | | | | | | | | | | | | | | | | | | | | | |
Class A | | | 1,000.00 | | | | 1,000.00 | | | | 915.00 | | | | 1,015.58 | | | | 9.22 | | | | 9.70 | | | | 1.91 | |
Class C | | | 1,000.00 | | | | 1,000.00 | | | | 912.20 | | | | 1,011.80 | | | | 12.82 | | | | 13.49 | | | | 2.66 | |
Class I | | | 1,000.00 | | | | 1,000.00 | | | | 916.70 | | | | 1,017.04 | | | | 7.83 | | | | 8.24 | | | | 1.62 | |
Class Y | | | 1,000.00 | | | | 1,000.00 | | | | 916.90 | | | | 1,017.54 | | | | 7.34 | | | | 7.73 | | | | 1.52 | |
Financial Long-Short Fund | | | | | | | | | | | | | | | | | | | | | |
Class A | | | 1,000.00 | | | | 1,000.00 | | | | 947.50 | | | | 1,015.53 | | | | 9.42 | | | | 9.75 | | | | 1.92 | |
Class C | | | 1,000.00 | | | | 1,000.00 | | | | 943.70 | | | | 1,011.75 | | | | 13.08 | | | | 13.54 | | | | 2.67 | |
Class I | | | 1,000.00 | | | | 1,000.00 | | | | 948.70 | | | | 1,017.04 | | | | 7.96 | | | | 8.24 | | | | 1.62 | |
Strategic Income Fund | | | | | | | | | | | | | | | | | | | | | |
Class A | | | 1,000.00 | | | | 1,000.00 | | | | 975.60 | | | | 1,020.47 | | | | 4.68 | | | | 4.79 | | | | 0.94 | |
Class C | | | 1,000.00 | | | | 1,000.00 | | | | 971.60 | | | | 1,016.69 | | | | 8.40 | | | | 8.59 | | | | 1.69 | |
Class I | | | 1,000.00 | | | | 1,000.00 | | | | 977.00 | | | | 1,021.88 | | | | 3.29 | | | | 3.36 | | | | 0.66 | |
Class Y | | | 1,000.00 | | | | 1,000.00 | | | | 977.60 | | | | 1,022.43 | | | | 2.74 | | | | 2.80 | | | | 0.55 | |
| * | Expenses are equal to the Fund’s annualized expense ratio, multiplied by the average account value over the period, multiplied by the number of days in the most recent fiscal half-year divided by the number of days in the fiscal year (to reflect the one-half year period). |
You can find more information about the Fund’s expenses, including annual expense ratios for historical periods in the Financial Statements section of this report. For additional information on operating expenses and other shareholder costs, please refer to the Fund’s prospectus. The prospectus presents hypothetical shareholder costs over various time periods based upon a $10,000 investment and a return of 5% a year. The standardized example, which appears in all mutual fund prospectuses, may be useful to you in comparing the costs of investing in different funds.
| | | | | | | | | | | | | | | | |
| DIAMOND HILL FUNDS | | | | | ANNUAL REPORT | | | | | DECEMBER 31, 2015 | | | | | DIAMOND-HILL.COM | | | 107 | |
Diamond Hill Funds
Management of the Trust (unaudited)
Listed in the charts below is basic information regarding the Trustees and Officers of the Trust.
INDEPENDENT TRUSTEES:
| | | | | | | | | | |
Name/Address/1
Age | | Position(s)
Held with
Trust | | Term of
Office2
and
Length
of Time
Served | | Principal Occupation(s)
At Least The Last 5 Years | | Number of
Portfolios
in Fund
Complex
Overseen
by Trustee | | Other
Directorships
Held by
Trustee |
| | | | | |
Tamara L. Fagely
Year of Birth: 1958 | | Trustee | | Since November
2014 | | Retired, January 2014 to present; Chief Operations Officer, Hartford Funds, 2012 to 2013; Chief Financial Officer, Hartford Funds, 2010 to 2012; Treasurer, Hartford Funds, 2001 to 2012. | | 10 | | None |
| | | | | |
Elizabeth P. Kessler
Year of Birth: 1968 | | Trustee | | Since November
2005 | | Partner in Charge, Columbus Ohio Office, Jones Day, January 2009 to present. | | 10 | | None |
| | | | | |
D’Ray Moore Rice
Year of Birth: 1959 | | Chairman Trustee | | Since February 2014 Since August
2007 | | Retired, Community Volunteer, November 2001 to present. Independent Trustee of Advisors Investment Trust, July 2011 to present. | | 10 | | Advisors Investment Trust, July 2011 to present |
| | | | | |
Peter E. Sundman
Year of Birth: 1959 | | Trustee | | Since November 2012 | | Retired 2012 to present; Chief Executive Officer, ClearBridge Advisors, LLC, 2009 to 2011. | | 10 | | None |
PRINCIPAL OFFICERS:
| | | | | | |
Name/Address/1
Age | | Position(s)
Held with Trust | | Term of Office and
Length of Time Served2 | | Principal Occupation(s)
At Least the Last 5 Years |
| | | |
Thomas E. Line
Year of Birth: 1967 | | Chief Executive Officer | | Since November 2014 | | Chief Financial Officer and Treasurer of Diamond Hill Investment Group, Inc., from January 2015 to present. Managing Director – Finance of Diamond Hill Investment Group, Inc., April 2014 to January 2015; Chief Operating Officer of Lancaster Pollard & Company, January 2012 to April 2014; Managing Director and Chief Financial Officer of Red Capital Group, October 2005 to January 2012. |
| | | | | | | | | | | | | | |
| 108 | | DIAMOND HILL FUNDS | | | | | ANNUAL REPORT | | | | | DECEMBER 31, 2015 | | | | | DIAMOND-HILL.COM |
Diamond Hill Funds
| | | | | | |
Name/Address/1
Age | | Position(s)
Held with Trust | | Term of Office and
Length of Time Served2 | | Principal Occupation(s)
At Least the Last 5 Years |
| | | |
| Gary R. Young Year of Birth: 1969 | | President | | Since November 2014 | | Secretary of the Trust, May 2004 to November 2014; Chief Administrative Officer of the Trust, October 2010 to November 2014; Managing Director — Administration, January 2015 to present; Chief Compliance Officer of Diamond Hill Capital Management Inc., October 2010 to present; Controller of Diamond Hill Investment Group, Inc., April 2004 to March 2015. |
| | | |
| Karen R. Colvin Year of Birth: 1966 | | Vice President Secretary | | Since November 2011 Since November 2014 | | Director-Fund Administration & Sales Support, Diamond Hill Capital Management, Inc., June 2009 to present. |
| | | |
| Trent M. Statczar Year of Birth: 1971 | | Treasurer | | Since October 2010 | | Director, Beacon Hill Fund Services, Inc., 2008 to present. |
| | | |
| Eimile J. Moore Year of Birth: 1969 | | Chief Compliance Officer | | Since May 2014 | | Director, Beacon Hill Fund Services, Inc., September 2011 to present; Vice President, JPMorgan Distribution Services, Inc., 2006 to 2011. |
| | | |
Dana A. Gentile Year of Birth: 1962 | | Assistant Secretary | | Since May 2013 | | Director, Beacon Hill Fund Services, Inc., 2013 to present; Senior Vice President, Citi Fund Services Ohio, Inc., 1987 to 2013. |
| | | |
Lori K. Cramer Year of Birth: 1967 | | Assistant Secretary | | Since May 2014 | | Director, Beacon Hill Fund Services, Inc., March 2014 to present; Paralegal, Nationwide Financial Services, Inc., 2002 to March 2014. |
| | | |
Troy A. Sheets Year of Birth: 1971 | | Assistant Treasurer | | Since October 2010 | | Director, Beacon Hill Fund Services, Inc., 2009 to present. |
| 1 | The address of each Trustee and Officer is 325 John H. McConnell Boulevard — Suite 200, Columbus, Ohio 43215. |
| 2 | Each Trustee is elected to serve in accordance with the Declaration of Trust and Bylaws of the Trust until their resignation, removal or retirement. Trustees have a 15-year term limit. Each Officer is elected by the Trustees for a 1-year term to serve the Trust or until their resignation, removal or retirement. |
The Statement of Additional Information contains additional information about the Trustees and is available without charge on www.diamond-hill.com or by calling 1-888-226-5595.
| | | | | | | | | | | | | | | | |
| DIAMOND HILL FUNDS | | | | | ANNUAL REPORT | | | | | DECEMBER 31, 2015 | | | | | DIAMOND-HILL.COM | | | 109 | |
INVESTMENT ADVISER: DIAMOND HILL CAPITAL MANAGEMENT, INC.
DISTRIBUTOR: BHIL DISTRIBUTORS, INC. (MEMBER FINRA), AN AFFILIATE OF THE DIAMOND HILL FUNDS
| | | | | | | | | | | | | | | | | | | | |
| DIAMOND-HILL.COM | | | | | 855.255.8955 | | | | | 325 JOHN H. MCCONNELL BLVD | | | | | SUITE 200 | | | | | COLUMBUS, OHIO | | | | | 43215 |
DH-AR123115
Item 2. Code of Ethics.
(a) The registrant has adopted a code of ethics that applies to the registrant’s principal executive officer, principal financial officer, principal accounting officer or controller, or persons performing similar functions. This code of ethics is included as an Exhibit.
(b) During the period covered by the report, with respect to the registrant’s code of ethics that applies to its principal executive officer, principal financial officer, principal accounting officer or controller, or persons performing similar functions; there have been no amendments to, nor any waivers granted from, a provision that relates to any element of the code of ethics definition enumerated in paragraph (b) of this Item 2.
Item 3. Audit Committee Financial Expert.
3(a)(1) The registrant’s board of directors has determined that the registrant has at least one audit committee financial expert serving on its audit committee.
3(a)(2) The audit committee financial expert is Ms. Tamara L. Fagely, who is “independent” for purposes of this Item 3 of Form N-CSR.
Item 4. Principal Accountant Fees and Services.
(a) Audit Fees. Audit fees totaled $147,900 and $141,600 in fiscal 2015 and 2014, respectively. 2015 and 2014 fees include fees associated with the annual audit and filings of the registrant’s Form N-1A and Form N-SAR.
(b) Audit-Related Fees. There were no audit-related fees in fiscal 2015 and 2014.
(c) Tax Fees. Fees for tax compliance services totaled $47,700 and $46,300 in fiscal 2015 and 2014, respectively.
(d) All Other Fees. There were no other fees in fiscal 2015 and 2014.
(e)(1) Audit Committee Pre-Approval Policies. The Audit Committee’s pre-approval policies describe the types of audit, audit-related, tax and other services that may receive the general pre-approval of the Audit Committee. The pre-approval policies provide that annual audit service fees, tax services not specifically granted pre-approval, services exceeding pre-approved cost levels and other services that have not received general pre-approval will be subject to specific pre-approval by the Audit Committee. The pre-approval policies further provide that the Committee may grant general pre-approval to other audit services (statutory audits and services associated with SEC registration statements, periodic reports and other documents filed with the SEC or other documents issued in connection with securities offerings), audit-related services (accounting consultations related to accounting, financial reporting or disclosure matters not classified as “audit services,” assistance with understanding and implementing new accounting and financial reporting guidance from rulemaking authorities, agreed-upon or expanded audit procedures related to accounting and/or billing records required to respond to or comply with financial, accounting or regulatory reporting matters and assistance with internal control reporting requirements under Form N-SAR and Form N-CSR), tax services that have historically been provided by the auditor that the Committee believes would not impair the independence of the auditor and are consistent with the SEC’s rules on auditor independence and permissible non-audit services classified as “all other services” that are routine and recurring services.
(e)(2) 0.0% in fiscal 2015 and 2014.
(f) Not applicable.
(g) The aggregate non-audit fees for services to the registrant, its investment adviser and any entity controlling, controlled by, or under common control with the adviser that provides ongoing services to the registrant were $47,700 and $46,300 in 2015 and 2014, respectively.
(h) Not applicable.
Item 5. Audit Committee of Listed Registrants.
Not applicable.
Item 6. Schedule of Investments.
(a) The Schedule of Investments is included in the Annual Report to Shareholders filed under Item 1 of this Form.
(b) Not applicable.
Item 7. Disclosure of Proxy Voting Policies and Procedures for Closed-End Management Investment Companies.
Not applicable.
Item 8. Portfolio Managers of Closed-End Management Investment Companies.
Not applicable.
Item 9. Purchases of Equity Securities by Closed-End Management Investment Company and Affiliated Purchasers.
Not applicable.
Item 10. Submission of Matters to a Vote of Security Holders.
Not applicable.
Item 11. Controls and Procedures.
(a) The registrant’s principal executive officer and principal financial officer have concluded, based on their evaluation of the registrant’s disclosure controls and procedures as conducted within 90 days of the filing date of this report, that these disclosure controls and procedures are adequately designed and are operating effectively to ensure that information required to be disclosed by the registrant on Form N-CSR is recorded, processed, summarized and reported within the time periods specified in the Securities and Exchange Commission’s rules and forms.
(b) There were no changes in the registrant’s internal control over financial reporting (as defined in Rule 30a-3(d) under the Act (17 CFR 270.30a-3(d))) that occurred during the second fiscal quarter of the period covered by this report that have materially affected or are reasonably likely to materially affected, the registrant’s internal control over financial reporting.
Item 12. Exhibits.
| (a)(1) | Code of Ethics for Senior Financial Officers is filed herewith. |
| (a)(2) | Certifications required by Item 12(a) of Form N-CSR are filed herewith. |
| (b) | Certification required by Item 12(b) of Form N-CSR is furnished herewith. |
SIGNATURES
Pursuant to the requirements of the Securities Exchange Act of 1934 and the Investment Company Act of 1940, the registrant has duly caused this report to be signed on its behalf by the undersigned, thereunto duly authorized.
| | | | |
| Registrant | | Diamond Hill Funds | | |
| | |
| By (Signature and Title) | | /s/ Thomas E. Line | | |
| | Thomas E. Line, Chief Executive Officer | | |
| | |
| Date February 25, 2016 | | | | |
Pursuant to the requirements of the Securities Exchange Act of 1934 and the Investment Company Act of 1940, this report has been signed below by the following persons on behalf of the registrant and in the capacities and on the dates indicated.
| | | | |
| By (Signature and Title) | | /s/ Thomas E. Line | | |
| | Thomas E. Line, Chief Executive Officer | | |
| | |
| Date February 25, 2016 | | | | |
| | |
| By (Signature and Title) | | /s/ Trent M. Statczar | | |
| | Trent M. Statczar, Treasurer | | |
| | |
| Date February 25, 2016 | | | | |