Earnings Presentation First Quarter 2013 April 24, 2013
Cautionary Statement This presentation contains "forward-looking statements" within the meaning of the Private Securities Litigation Reform Act of 1995, as amended. Forward-looking statements, by their nature, involve estimates, projections, goals, forecasts, assumptions, risks and uncertainties that could cause actual results or outcomes to differ materially from those expressed in a forward-looking statement. Examples of forward-looking statements include statements regarding our expectations, beliefs, plans, goals, objectives and future financial or other performance. Words such as "expects," "anticipates," "intends," "plans," "believes," "seeks," "estimates" and variations of such words and similar expressions are intended to identify such forward-looking statements. Any forward-looking statement speaks only as of the date on which it is made. Except to fulfill our obligations under the U.S. securities laws, we undertake no obligation to update any such statement to reflect events or circumstances after the date on which it is made. There are a number of important factors that could cause future results to differ materially from historical performance and these forward-looking statements. Factors that might cause such a difference include: 1. Volatile interest rates that impact, amongst other things, (i) the mortgage business, (ii) our ability to originate loans and sell assets at a profit, (iii) prepayment speeds and (iv) our cost of funds, could adversely affect earnings, and our ability to pay dividends to stockholders; 2. Competitive factors for mortgage loan originations could negatively impact gain on loan sale margins; 3. Competition from banking and non-banking companies for deposits and loans can affect our earnings, gain on sale margins and market share; 4. Changes in the regulation of financial services companies and government-sponsored housing enterprises, and in particular, declines in the liquidity of the residential mortgage loan secondary market, could adversely affect our business; 5. Changes in regulatory capital requirements or an inability to achieve or maintain desired capital ratios could adversely affect our earnings opportunities and our ability to originate certain types of loans, as well as our ability to sell certain types of assets for fair market value; 6. General business and economic conditions, including unemployment rates, movements in interest rates, the slope of the yield curve, any increase in mortgage fraud and other related criminal activity and the further decline of asset values in certain geographic markets, may significantly affect our business activities, loan losses, reserves, earnings and business prospects; 7. Repurchases and indemnity demands by mortgage loan purchasers, guarantors and insurers, uncertainty related to foreclosure procedures, and the outcome of current and future legal or regulatory proceedings could result in unforeseen consequences and adversely affect our business activities and earnings; 8. The Dodd-Frank Wall Street Reform and Consumer Protection Act has resulted in the elimination of the Office of Thrift Supervision (the "OTS"), tightening of capital standards, and the creation of a new Consumer Financial Protection Bureau and has resulted, or will result, in new laws and regulations, such as the emerging mortgage servicing standards, that are expected to increase our costs of operations. In addition, the change to the Board of Governors of the Federal Reserve System (the "Federal Reserve") as our primary federal regulator and to the Office of the Comptroller of the Currency (the "OCC") as Flagstar Bank, FSB's (the "Bank") primary federal regulator may result in interpretations affecting our operations different than those of the OTS; 9. Both the volume and the nature of consumer actions and other forms of litigation against financial institutions have increased and to the extent that such actions are brought against us or threatened, the cost of defending such suits as well as potential exposure could increase our costs of operations; 10. Our compliance with the terms and conditions of the agreement with the U.S. Department of Justice, the impact of performance and enforcement of commitments under, and provisions contained in the agreement, and our accuracy and ability to estimate the financial impact of that agreement, including the fair value of the future payments required, could accelerate our litigation settlement expenses relating thereto; 11. Our, or the Bank's, failure to comply with the terms and conditions of the Supervisory Agreement with the Federal Reserve or the Consent Order with the OCC, respectively, could result in further enforcement actions against us, which could negatively affect our results of operations and financial condition; and 12. The downgrade of the long-term credit rating of the U.S. by one or more ratings agencies could materially affect global and domestic financial markets and economic conditions, which may affect our business activities, financial condition, and liquidity. Please also refer to Item 1A to Part I of our Annual Report on Form 10-K for further information on these and other factors affecting us. All of the above factors are difficult to predict, contain uncertainties that may materially affect actual results, and may be beyond our control. New factors emerge from time to time, and it is not possible for our management to predict all such factors or to assess the effect of each such factor on our business. Although we believe that these forward-looking statements are based on reasonable, estimates and assumptions, they are not guarantees of future performance and are subject to known and unknown risks, uncertainties, contingencies and other factors. Accordingly, we cannot give you any assurance that our expectations will in fact occur or that actual results will not differ materially from those expressed or implied by such forward-looking statements. In light of the significant uncertainties inherent in the forward-looking statements included herein, the inclusion of such information should not be regarded as a representation by us or any other person that the results or conditions described in such statements or our objectives and plans will be achieved. 2 1st Quarter 2013 Earnings Presentation
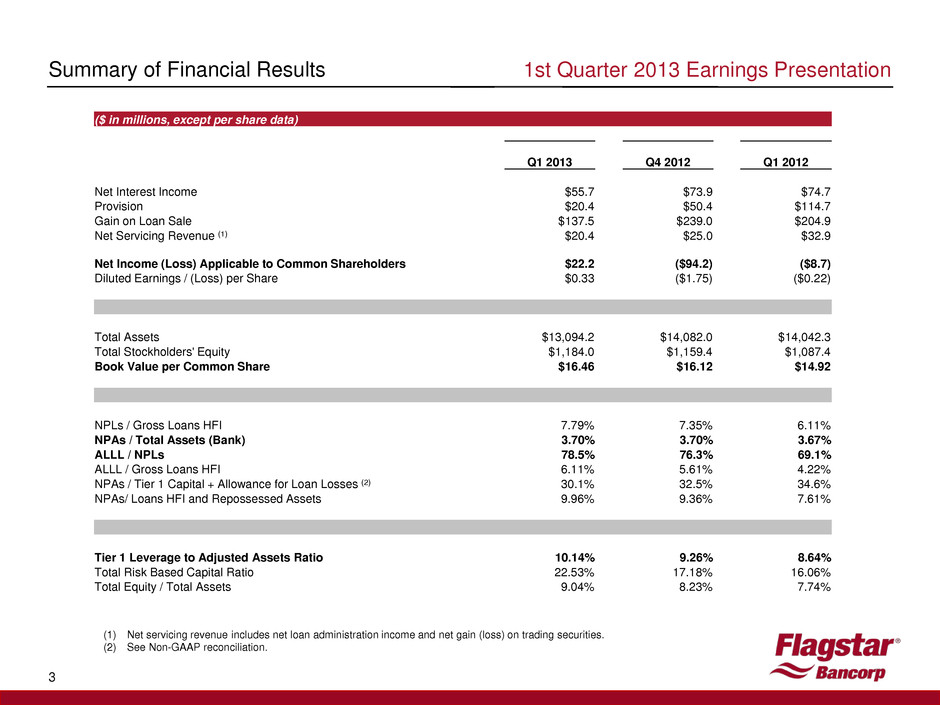
Summary of Financial Results 3 (1) Net servicing revenue includes net loan administration income and net gain (loss) on trading securities. (2) See Non-GAAP reconciliation. 1st Quarter 2013 Earnings Presentation ($ in millions, except per share data) Q1 2013 Q4 2012 Q1 2012 Net Interest Income $55.7 $73.9 $74.7 Provision $20.4 $50.4 $114.7 Gain on Loan Sale $137.5 $239.0 $204.9 Net Servicing Revenue (1) $20.4 $25.0 $32.9 Net Income (Loss) Applicable to Common Shareholders $22.2 ($94.2) ($8.7) Diluted Earnings / (Loss) per Share $0.33 ($1.75) ($0.22) Total Assets $13,094.2 $14,082.0 $14,042.3 Total Stockholders' Equity $1,184.0 $1,159.4 $1,087.4 Book Value per Common Share $16.46 $16.12 $14.92 NPLs / Gross Loans HFI 7.79% 7.35% 6.11% NPAs / Total Assets (Bank) 3.70% 3.70% 3.67% ALLL / NPLs 78.5% 76.3% 69.1% ALLL / Gross Loans HFI 6.11% 5.61% 4.22% NPAs / Tier 1 Capital + Allowance for Loan Losses (2) 30.1% 32.5% 34.6% NPAs/ Loans HFI and Repossessed Assets 9.96% 9.36% 7.61% Tier 1 Leverage to Adjusted Assets Ratio 10.14% 9.26% 8.64% Total Risk Based Capital Ratio 22.53% 17.18% 16.06% Total Equity / Total Assets 9.04% 8.23% 7.74%
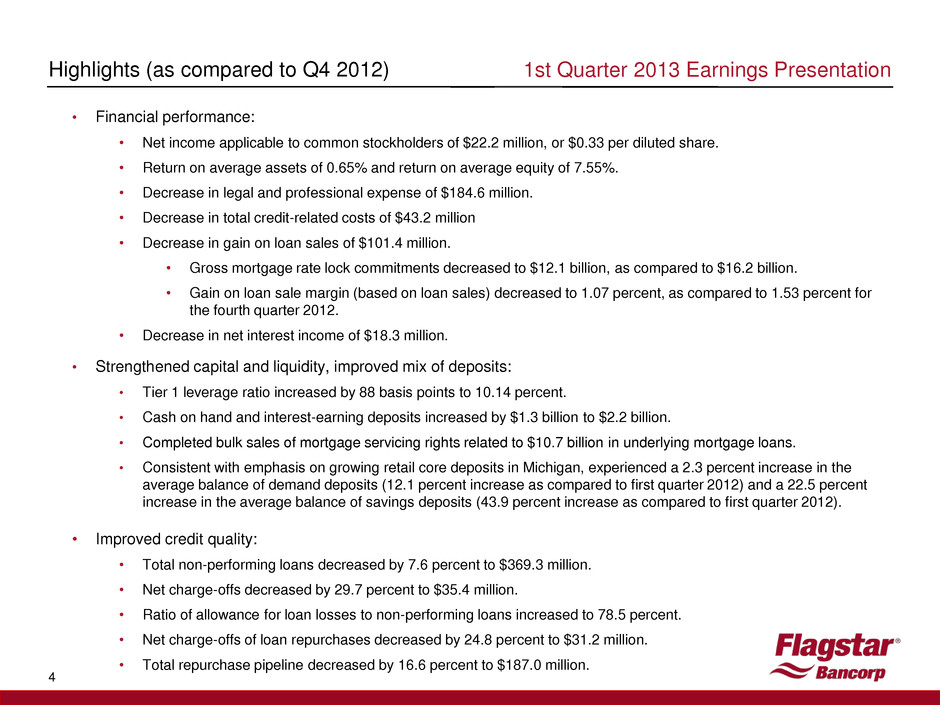
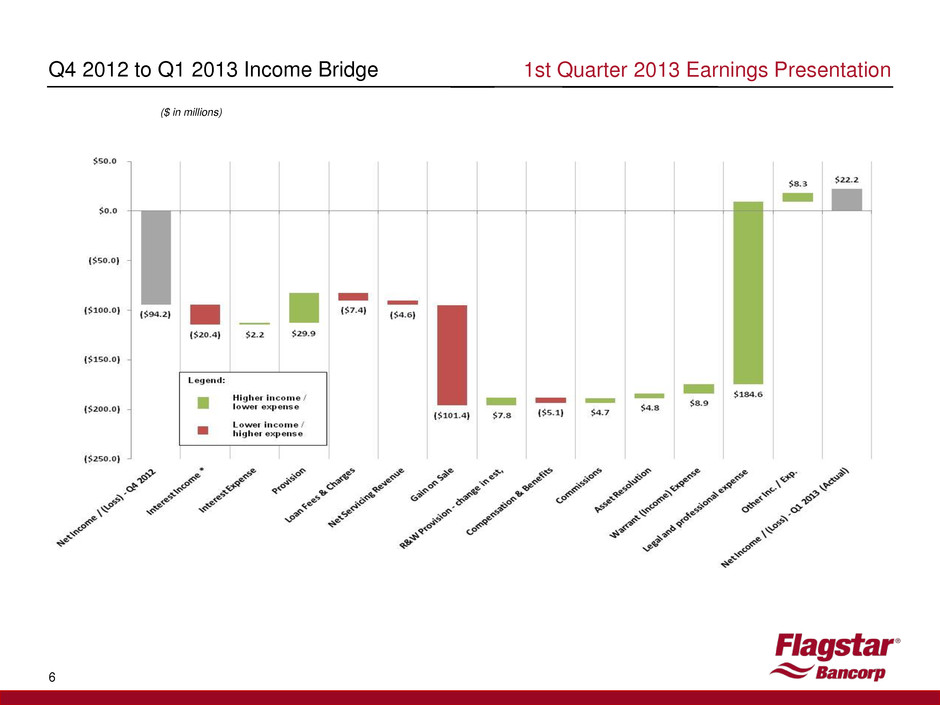
Highlights (as compared to Q4 2012) 4 1st Quarter 2013 Earnings Presentation • Financial performance: • Net income applicable to common stockholders of $22.2 million, or $0.33 per diluted share. • Return on average assets of 0.65% and return on average equity of 7.55%. • Decrease in legal and professional expense of $184.6 million. • Decrease in total credit-related costs of $43.2 million • Decrease in gain on loan sales of $101.4 million. • Gross mortgage rate lock commitments decreased to $12.1 billion, as compared to $16.2 billion. • Gain on loan sale margin (based on loan sales) decreased to 1.07 percent, as compared to 1.53 percent for the fourth quarter 2012. • Decrease in net interest income of $18.3 million. • Strengthened capital and liquidity, improved mix of deposits: • Tier 1 leverage ratio increased by 88 basis points to 10.14 percent. • Cash on hand and interest-earning deposits increased by $1.3 billion to $2.2 billion. • Completed bulk sales of mortgage servicing rights related to $10.7 billion in underlying mortgage loans. • Consistent with emphasis on growing retail core deposits in Michigan, experienced a 2.3 percent increase in the average balance of demand deposits (12.1 percent increase as compared to first quarter 2012) and a 22.5 percent increase in the average balance of savings deposits (43.9 percent increase as compared to first quarter 2012). • Improved credit quality: • Total non-performing loans decreased by 7.6 percent to $369.3 million. • Net charge-offs decreased by 29.7 percent to $35.4 million. • Ratio of allowance for loan losses to non-performing loans increased to 78.5 percent. • Net charge-offs of loan repurchases decreased by 24.8 percent to $31.2 million. • Total repurchase pipeline decreased by 16.6 percent to $187.0 million.
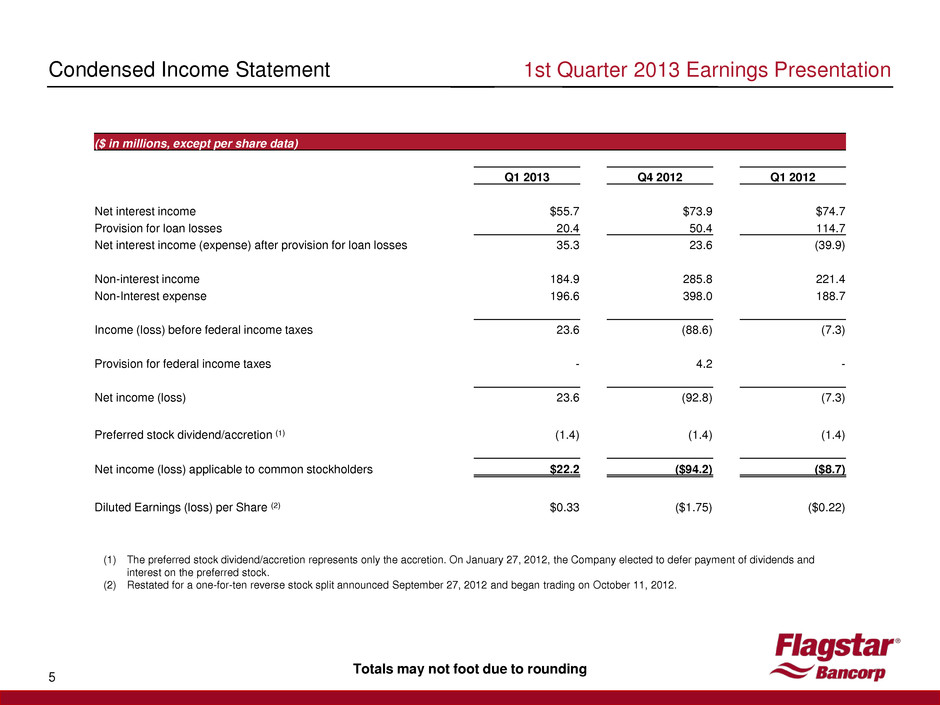
Condensed Income Statement 5 (1) The preferred stock dividend/accretion represents only the accretion. On January 27, 2012, the Company elected to defer payment of dividends and interest on the preferred stock. (2) Restated for a one-for-ten reverse stock split announced September 27, 2012 and began trading on October 11, 2012. Totals may not foot due to rounding 1st Quarter 2013 Earnings Presentation ($ in millions, except per share data) Q1 2013 Q4 2012 Q1 2012 Net interest income $55.7 $73.9 $74.7 Provision for loan losses 20.4 50.4 114.7 Net interest income (expense) after provision for loan losses 35.3 23.6 (39.9) Non-interest income 184.9 285.8 221.4 Non-Interest expense 196.6 398.0 188.7 Income (loss) before federal income taxes 23.6 (88.6) (7.3) Provision for federal income taxes - 4.2 - Net income (loss) 23.6 (92.8) (7.3) Preferred stock dividend/accretion (1) (1.4) (1.4) (1.4) Net income (loss) applicable to common stockholders $22.2 ($94.2) ($8.7) Diluted Earnings (loss) per Share (2) $0.33 ($1.75) ($0.22)
Q4 2012 to Q1 2013 Income Bridge 6 1st Quarter 2013 Earnings Presentation ($ in millions)
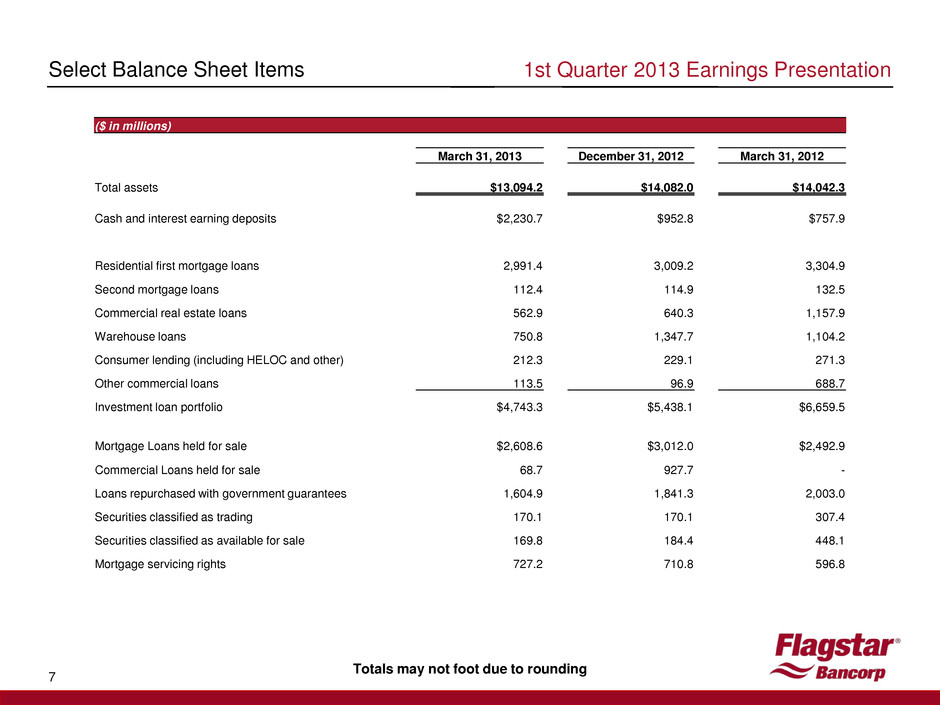
Select Balance Sheet Items 7 ($ in millions) March 31, 2013 December 31, 2012 March 31, 2012 Total assets $13,094.2 $14,082.0 $14,042.3 Cash and interest earning deposits $2,230.7 $952.8 $757.9 Residential first mortgage loans 2,991.4 3,009.2 3,304.9 Second mortgage loans 112.4 114.9 132.5 Commercial real estate loans 562.9 640.3 1,157.9 Warehouse loans 750.8 1,347.7 1,104.2 Consumer lending (including HELOC and other) 212.3 229.1 271.3 Other commercial loans 113.5 96.9 688.7 Investment loan portfolio $4,743.3 $5,438.1 $6,659.5 Mortgage Loans held for sale $2,608.6 $3,012.0 $2,492.9 Commercial Loans held for sale 68.7 927.7 - Loans repurchased with government guarantees 1,604.9 1,841.3 2,003.0 Securities classified as trading 170.1 170.1 307.4 Securities classified as available for sale 169.8 184.4 448.1 Mortgage servicing rights 727.2 710.8 596.8 Totals may not foot due to rounding 1st Quarter 2013 Earnings Presentation
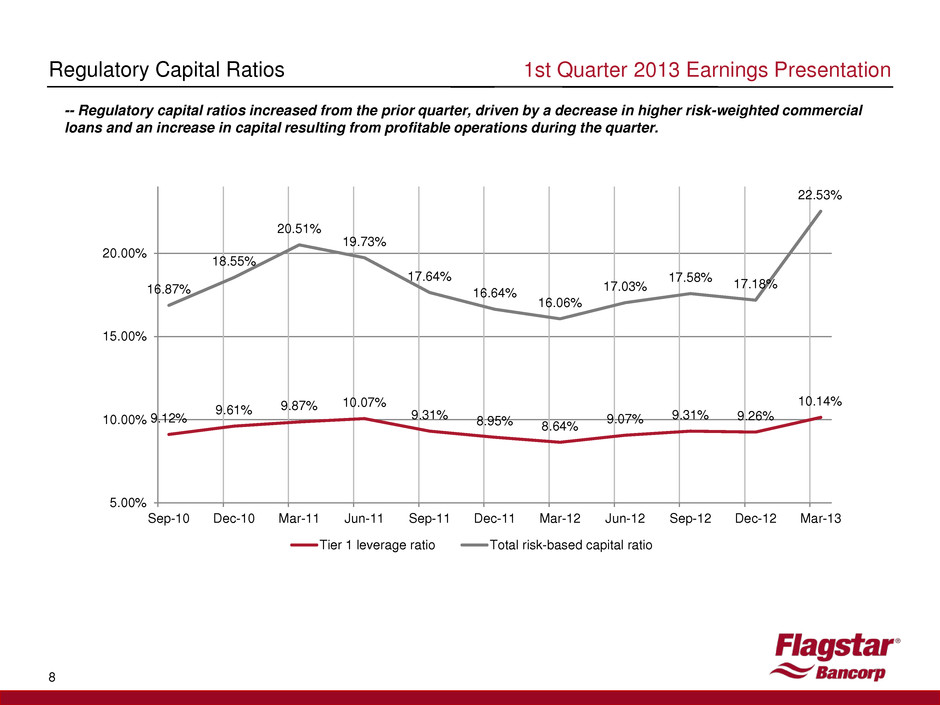
8 Regulatory Capital Ratios 1st Quarter 2013 Earnings Presentation 9.12% 9.61% 9.87% 10.07% 9.31% 8.95% 8.64% 9.07% 9.31% 9.26% 10.14% 16.87% 18.55% 20.51% 19.73% 17.64% 16.64% 16.06% 17.03% 17.58% 17.18% 22.53% 5.00% 10.00% 15.00% 20.00% Sep-10 Dec-10 Mar-11 Jun-11 Sep-11 Dec-11 Mar-12 Jun-12 Sep-12 Dec-12 Mar-13 Tier 1 leverage ratio Total risk-based capital ratio -- Regulatory capital ratios increased from the prior quarter, driven by a decrease in higher risk-weighted commercial loans and an increase in capital resulting from profitable operations during the quarter.
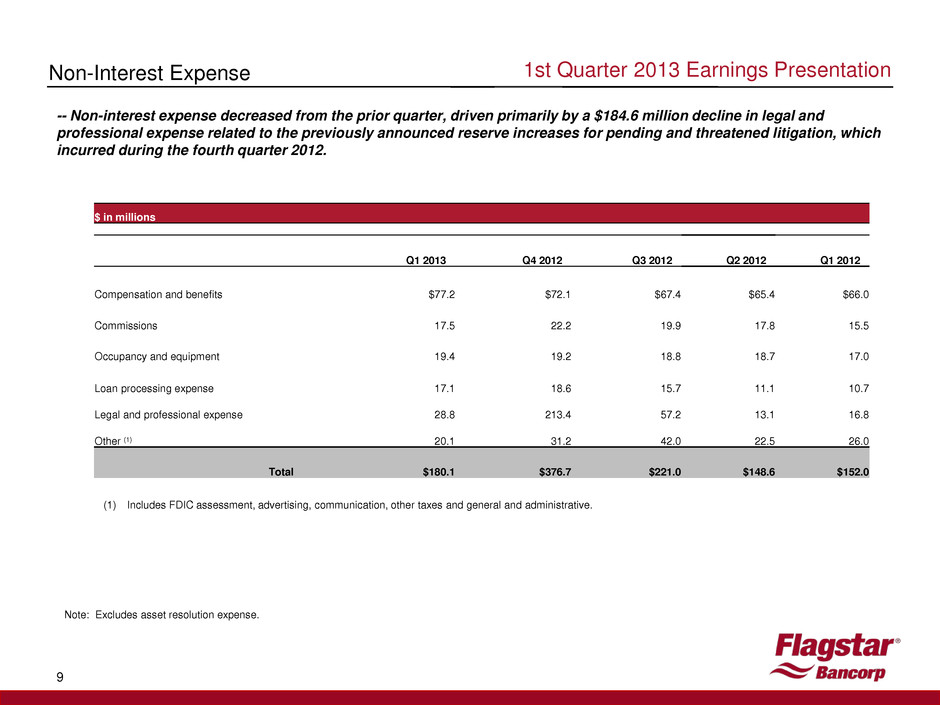
9 $ in millions Q1 2013 Q4 2012 Q3 2012 Q2 2012 Q1 2012 Compensation and benefits $77.2 $72.1 $67.4 $65.4 $66.0 Commissions 17.5 22.2 19.9 17.8 15.5 Occupancy and equipment 19.4 19.2 18.8 18.7 17.0 Loan processing expense 17.1 18.6 15.7 11.1 10.7 Legal and professional expense 28.8 213.4 57.2 13.1 16.8 Other (1) 20.1 31.2 42.0 22.5 26.0 Total $180.1 $376.7 $221.0 $148.6 $152.0 1st Quarter 2013 Earnings Presentation Non-Interest Expense Note: Excludes asset resolution expense. -- Non-interest expense decreased from the prior quarter, driven primarily by a $184.6 million decline in legal and professional expense related to the previously announced reserve increases for pending and threatened litigation, which incurred during the fourth quarter 2012. (1) Includes FDIC assessment, advertising, communication, other taxes and general and administrative.
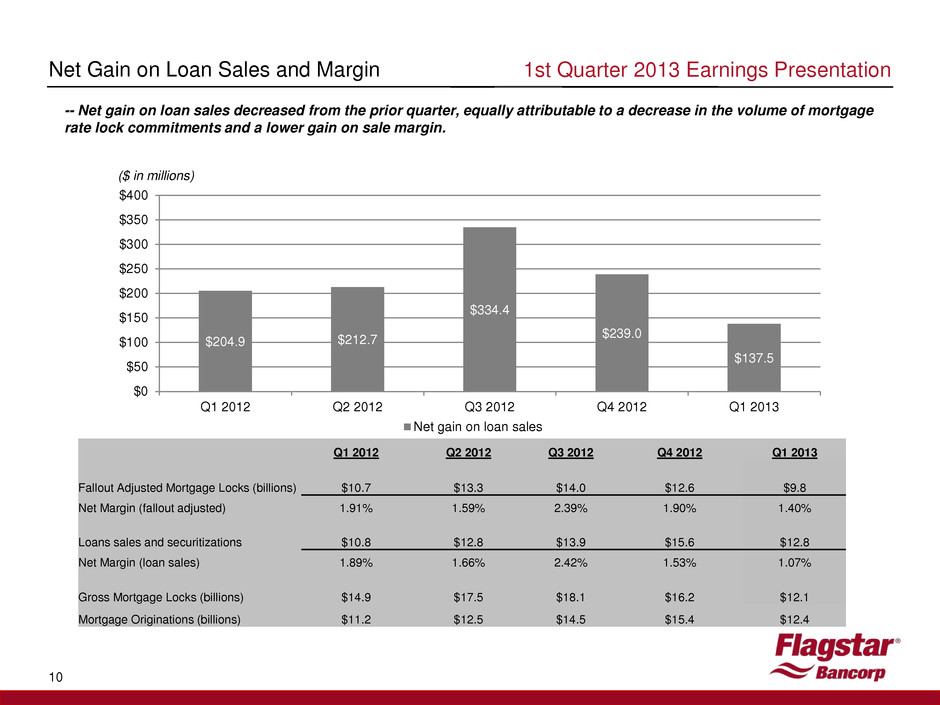
10 Net Gain on Loan Sales and Margin 1st Quarter 2013 Earnings Presentation Q1 2012 Q2 2012 Q3 2012 Q4 2012 Q1 2013 Fallout Adjusted Mortgage Locks (billions) $10.7 $13.3 $14.0 $12.6 $9.8 Net Margin (fallout adjusted) 1.91% 1.59% 2.39% 1.90% 1.40% Loans sales and securitizations $10.8 $12.8 $13.9 $15.6 $12.8 Net Margin (loan sales) 1.89% 1.66% 2.42% 1.53% 1.07% Gross Mortgage Locks (billions) $14.9 $17.5 $18.1 $16.2 $12.1 Mortgage Originations (billions) $11.2 $12.5 $14.5 $15.4 $12.4 $204.9 $212.7 $334.4 $239.0 $137.5 $0 $50 $100 $150 $200 $250 $300 $350 $400 Q1 2012 Q2 2012 Q3 2012 Q4 2012 Q1 2013 Net gain on loan sales ($ in millions) -- Net gain on loan sales decreased from the prior quarter, equally attributable to a decrease in the volume of mortgage rate lock commitments and a lower gain on sale margin.
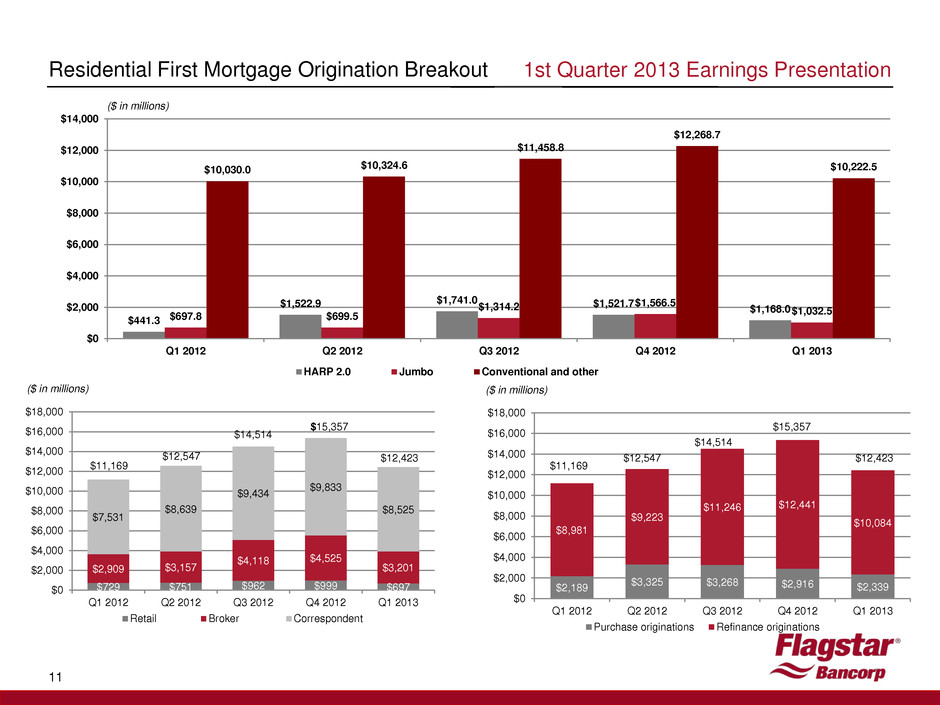
$2,189 $3,325 $3,268 $2,916 $2,339 $8,981 $9,223 $11,246 $12,441 $10,084 $0 $2,000 $4,000 $6,000 $8,000 $10,000 $12,000 $14,000 $16,000 $18,000 Q1 2012 Q2 2012 Q3 2012 Q4 2012 Q1 2013 Purchase originations Refinance originations $12,547 $14,514 $15,357 $12,423 $729 $751 $962 $999 $697 $2,909 $3,157 $4,118 $4,525 $3,201 $7,531 $8,639 $9,434 $9,833 $8,525 $0 $2,000 $4,000 $6,000 $8,000 $10,000 $12,000 $14,000 $16,000 $18,000 Q1 2012 Q2 2012 Q3 2012 Q4 2012 Q1 2013 Retail Broker Correspondent 11 Residential First Mortgage Origination Breakout $15,357 $14,514 $12,547 $11,169 $12,423 1st Quarter 2013 Earnings Presentation $11,169 ($ in millions) ($ in millions) ($ in millions) $441.3 $1,522.9 $1,741.0 $1,521.7 $1,168.0 $697.8 $699.5 $1,314.2 $1,566.5 $1,032.5 $10,030.0 $10,324.6 $11,458.8 $12,268.7 $10,222.5 $0 $2,000 $4,000 $6,000 $8,000 $10,000 $12,000 $14,000 Q1 2012 Q2 2012 Q3 2012 Q4 2012 Q1 2013 HARP 2.0 Jumbo Conventional and other
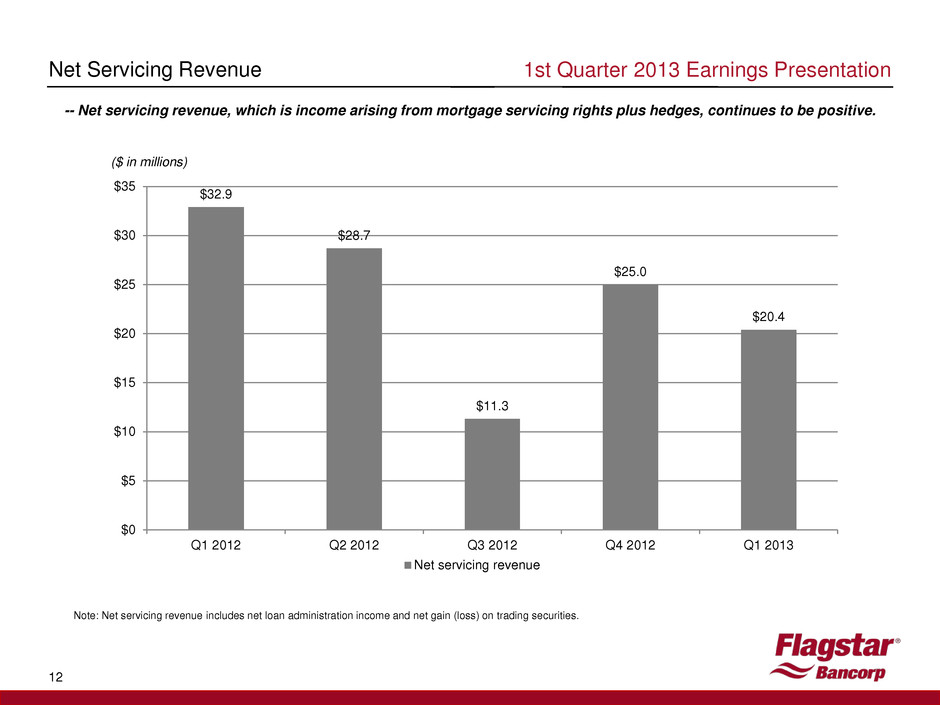
12 Net Servicing Revenue Note: Net servicing revenue includes net loan administration income and net gain (loss) on trading securities. 1st Quarter 2013 Earnings Presentation $32.9 $28.7 $11.3 $25.0 $20.4 $0 $5 $10 $15 $20 $25 $30 $35 Q1 2012 Q2 2012 Q3 2012 Q4 2012 Q1 2013 Net servicing revenue ($ in millions) -- Net servicing revenue, which is income arising from mortgage servicing rights plus hedges, continues to be positive.
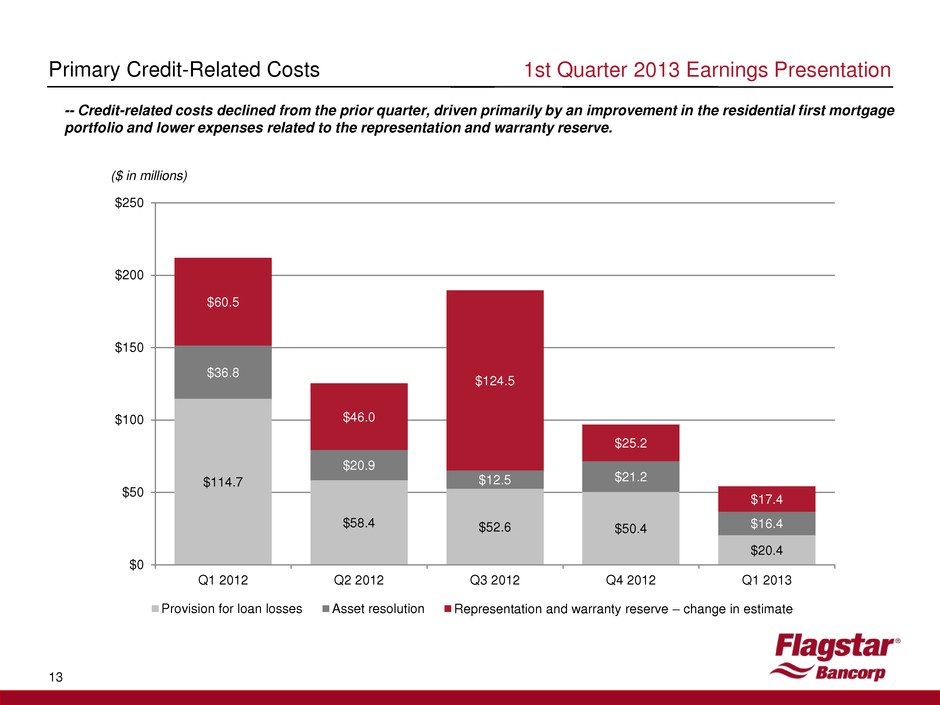
Primary Credit-Related Costs 1st Quarter 2013 Earnings Presentation 13 $114.7 $58.4 $52.6 $50.4 $20.4 $36.8 $20.9 $12.5 $21.2 $16.4 $60.5 $46.0 $124.5 $25.2 $17.4 $0 $50 $100 $150 $200 $250 Q1 2012 Q2 2012 Q3 2012 Q4 2012 Q1 2013 Provision for loan losses Asset resolution Representation and warranty reserve – change in estimate ($ in millions) -- Credit-related costs declined from the prior quarter, driven primarily by an improvement in the residential first mortgage portfolio and lower expenses related to the representation and warranty reserve.
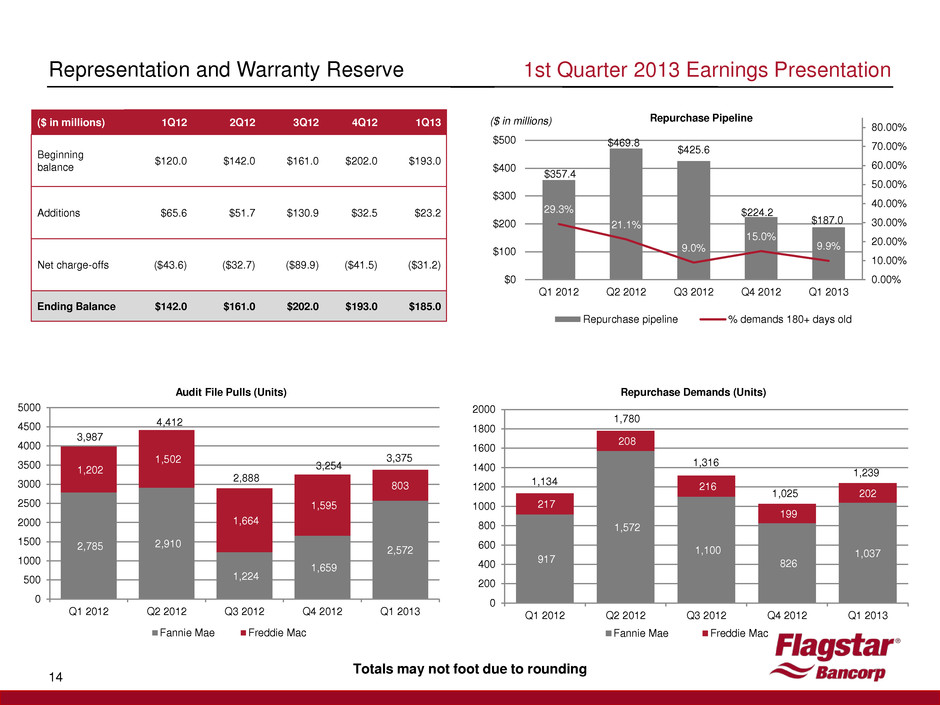
917 1,572 1,100 826 1,037 217 208 216 199 202 0 200 400 600 800 1000 1200 1400 1600 1800 2000 Q1 2012 Q2 2012 Q3 2012 Q4 2012 Q1 2013 Repurchase Demands (Units) Fannie Mae Freddie Mac 2,785 2,910 1,224 1,659 2,572 1,202 1,502 1,664 1,595 803 0 500 1000 1500 2000 2500 3000 3500 4000 4500 5000 Q1 2012 Q2 2012 Q3 2012 Q4 2012 Q1 2013 Audit File Pulls (Units) Fannie Mae Freddie Mac $357.4 $469.8 $425.6 $224.2 $187.0 29.3% 21.1% 9.0% 15.0% 9.9% 0.00% 10.00% 20.00% 30.00% 40.00% 50.00% 60.00% 70.00% 80.00% $0 $100 $200 $300 $400 $500 Q1 2012 Q2 2012 Q3 2012 Q4 2012 Q1 2013 Repurchase Pipeline Repurchase pipeline % demands 180+ days old 14 Representation and Warranty Reserve 1st Quarter 2013 Earnings Presentation ($ in millions) 1Q12 2Q12 3Q12 4Q12 1Q13 Beginning balance $120.0 $142.0 $161.0 $202.0 $193.0 Additions $65.6 $51.7 $130.9 $32.5 $23.2 Net charge-offs ($43.6) ($32.7) ($89.9) ($41.5) ($31.2) Ending Balance $142.0 $161.0 $202.0 $193.0 $185.0 Totals may not foot due to rounding ($ in millions) 3,987 4,412 2,888 3,254 1,025 1,134 1,780 1,316 3,375 1,239

15 Allowance for Loan Losses -- Allowance for loan losses decreased from the prior quarter, driven by a release of reserves associated with the commercial loan sales, and a decrease in the consumer reserves driven by portfolio run-off and lower loss rates. 1st Quarter 2013 Earnings Presentation $281.0 $287.0 $305.0 $305.0 $290.0 69.1% 66.5% 76.5% 76.3% 78.5% 0% 20% 40% 60% 80% 100% 120% $0 $50 $100 $150 $200 $250 $300 $350 $400 Allowance for loan losses ALLL / non-performing loans ($ in millions)
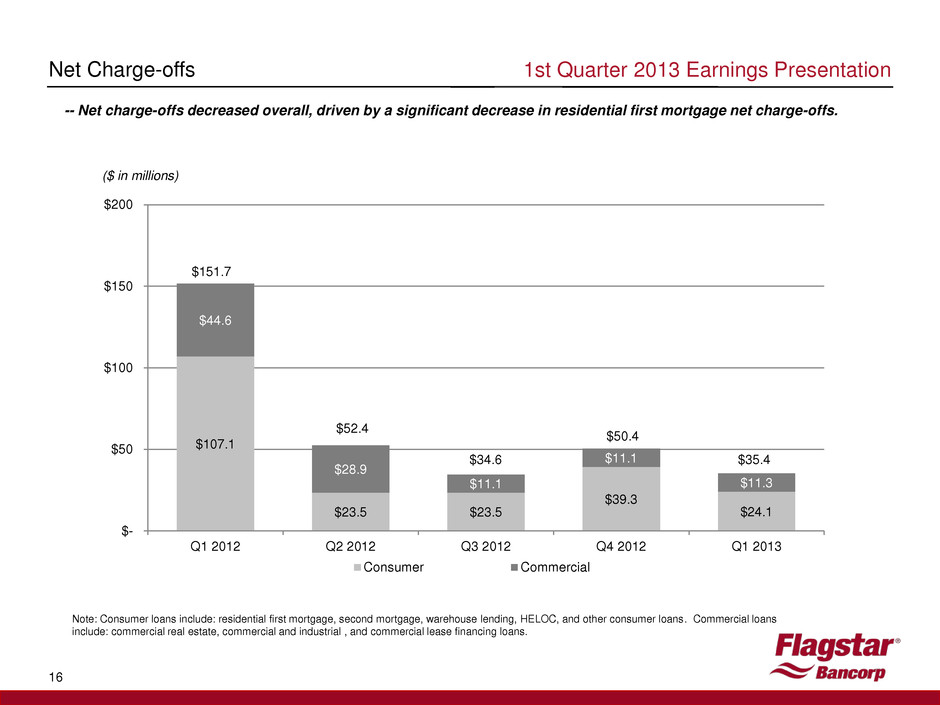
$107.1 $23.5 $23.5 $39.3 $24.1 $44.6 $28.9 $11.1 $11.1 $11.3 $- $50 $100 $150 $200 Q1 2012 Q2 2012 Q3 2012 Q4 2012 Q1 2013 Consumer Commercial $151.7 $52.4 $34.6 $50.4 $35.4 16 Net Charge-offs Note: Consumer loans include: residential first mortgage, second mortgage, warehouse lending, HELOC, and other consumer loans. Commercial loans include: commercial real estate, commercial and industrial , and commercial lease financing loans. 1st Quarter 2013 Earnings Presentation ($ in millions) -- Net charge-offs decreased overall, driven by a significant decrease in residential first mortgage net charge-offs.
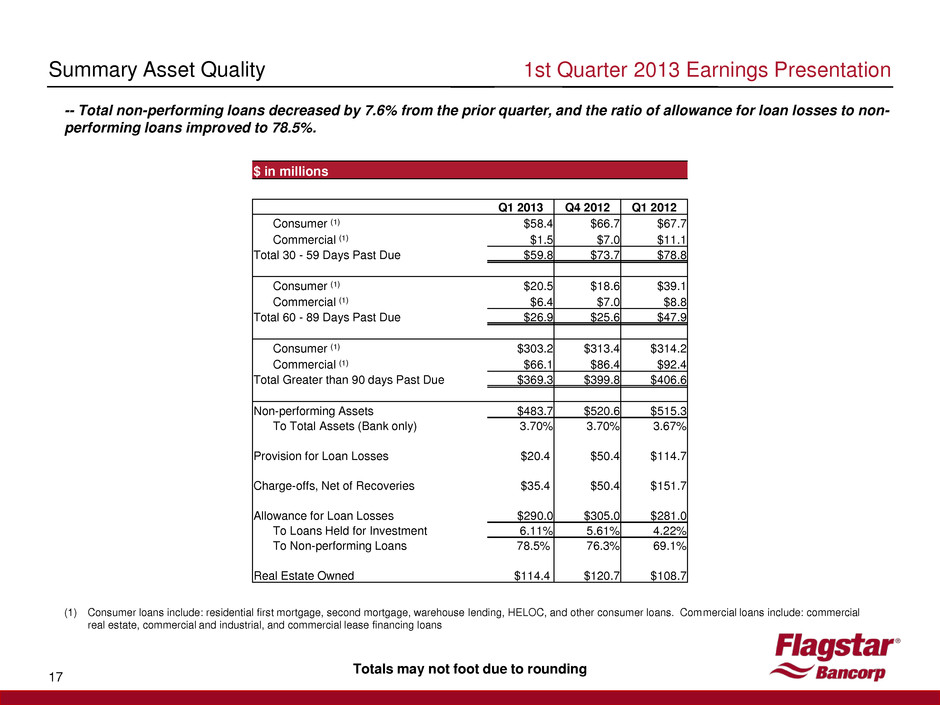
1st Quarter 2013 Earnings Presentation 17 Summary Asset Quality (1) Consumer loans include: residential first mortgage, second mortgage, warehouse lending, HELOC, and other consumer loans. Commercial loans include: commercial real estate, commercial and industrial, and commercial lease financing loans Totals may not foot due to rounding $ in millions Q1 2013 Q4 2012 Q1 2012 Consumer (1) $58.4 $66.7 $67.7 Commercial (1) $1.5 $7.0 $11.1 Total 30 - 59 Days Past Due $59.8 $73.7 $78.8 Consumer (1) $20.5 $18.6 $39.1 Commercial (1) $6.4 $7.0 $8.8 Total 60 - 89 Days Past Due $26.9 $25.6 $47.9 Consumer (1) $303.2 $313.4 $314.2 Commercial (1) $66.1 $86.4 $92.4 Total Greater than 90 days Past Due $369.3 $399.8 $406.6 Non-performing Assets $483.7 $520.6 $515.3 To Total Assets (Bank only) 3.70% 3.70% 3.67% Provision for Loan Losses $20.4 $50.4 $114.7 Charge-offs, Net of Recoveries $35.4 $50.4 $151.7 Allowance for Loan Losses $290.0 $305.0 $281.0 To Loans Held for Investment 6.11% 5.61% 4.22% To Non-performing Loans 78.5% 76.3% 69.1% Real Estate Owned $114.4 $120.7 $108.7 -- Total non-performing loans decreased by 7.6% from the prior quarter, and the ratio of allowance for loan losses to non- performing loans improved to 78.5%.
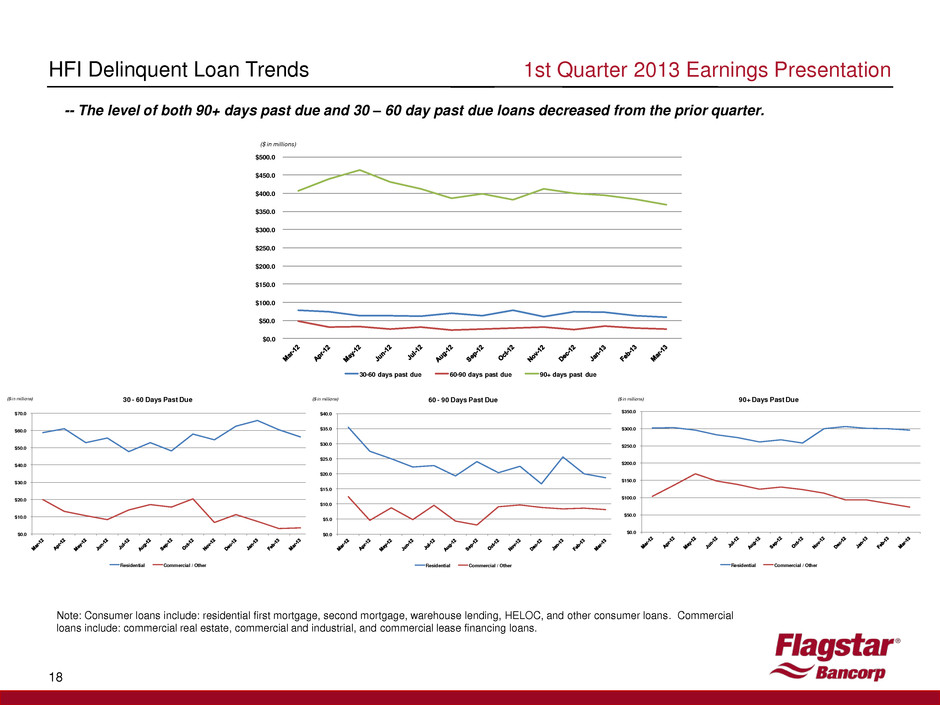
18 HFI Delinquent Loan Trends Note: Consumer loans include: residential first mortgage, second mortgage, warehouse lending, HELOC, and other consumer loans. Commercial loans include: commercial real estate, commercial and industrial, and commercial lease financing loans. -- The level of both 90+ days past due and 30 – 60 day past due loans decreased from the prior quarter. 1st Quarter 2013 Earnings Presentation $0.0 $50.0 $100.0 $150.0 $200.0 $250.0 $300.0 $350.0 $400.0 $450.0 $500.0 30-60 days past due 60-90 days past due 90+ days past due ($ in millions) $0.0 $10.0 $20.0 $30.0 $40.0 $50.0 $60.0 $70.0 30 - 60 Days Past Due Residential Commercial / Other ($ in millions) $0.0 $5.0 $10.0 $15.0 $20.0 $25.0 $30.0 $35.0 $40.0 60 - 90 ays Past Due Residential Commercial / Other ($ in millions) $0.0 $50.0 $100.0 $150.0 $200.0 $250.0 $300.0 $350.0 90+ Days Past Due Residential Commercial / Other ($ in millions)
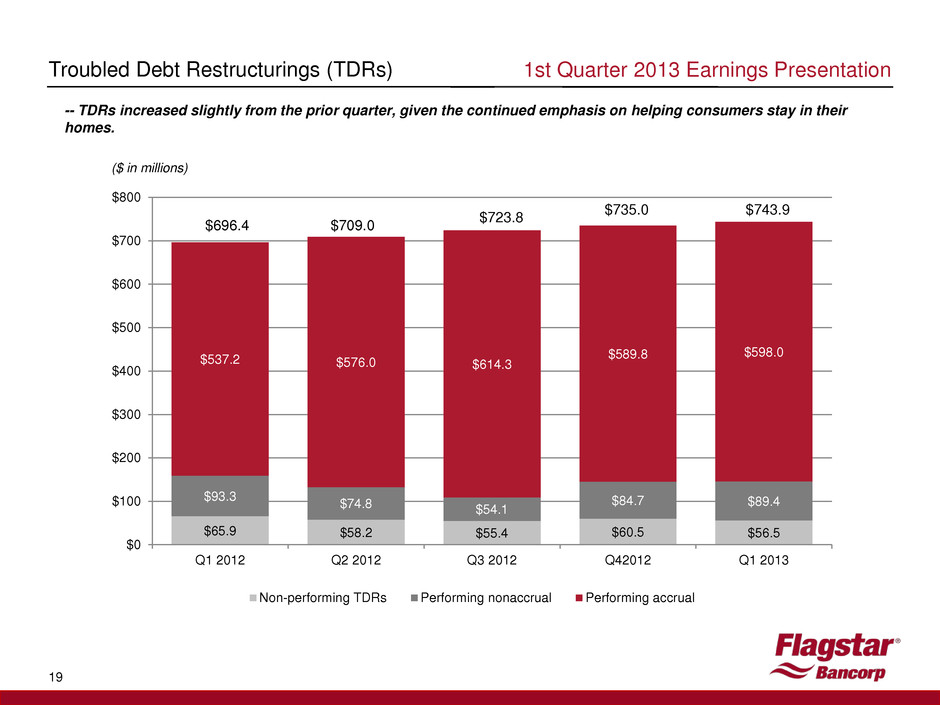
19 Troubled Debt Restructurings (TDRs) 1st Quarter 2013 Earnings Presentation ($ in millions) $65.9 $58.2 $55.4 $60.5 $56.5 $93.3 $74.8 $54.1 $84.7 $89.4 $537.2 $576.0 $614.3 $589.8 $598.0 $0 $100 $200 $300 $400 $500 $600 $700 $800 Q1 2012 Q2 2012 Q3 2012 Q42012 Q1 2013 Non-performing TDRs Performing nonaccrual Performing accrual $696.4 $709.0 $723.8 $735.0 $743.9 -- TDRs increased slightly from the prior quarter, given the continued emphasis on helping consumers stay in their homes.
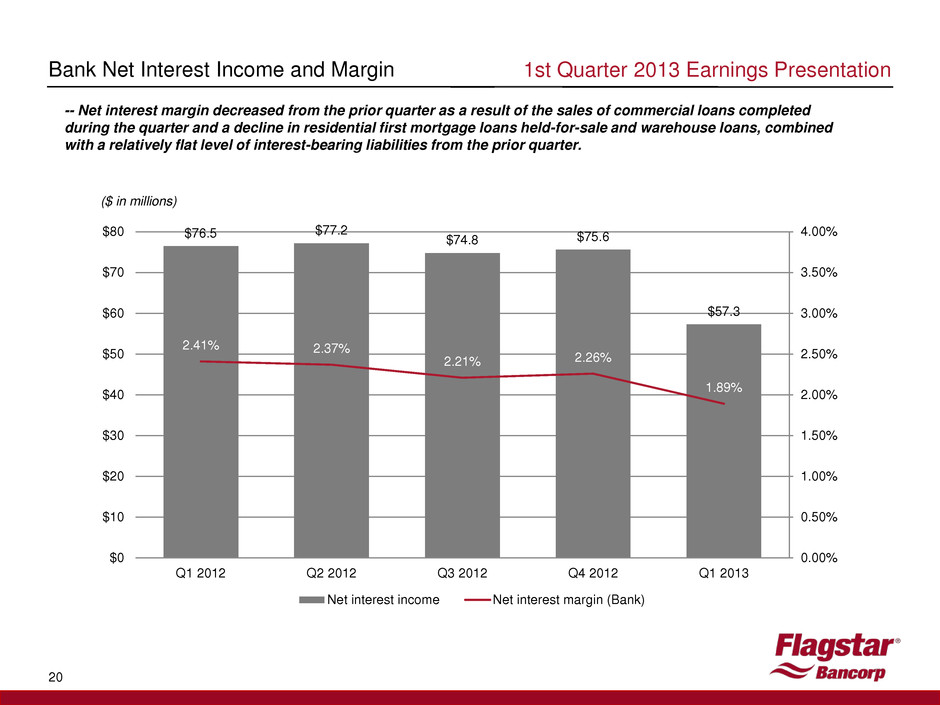
20 Bank Net Interest Income and Margin 1st Quarter 2013 Earnings Presentation -- Net interest margin decreased from the prior quarter as a result of the sales of commercial loans completed during the quarter and a decline in residential first mortgage loans held-for-sale and warehouse loans, combined with a relatively flat level of interest-bearing liabilities from the prior quarter. ($ in millions) $76.5 $77.2 $74.8 $75.6 $57.3 2.41% 2.37% 2.21% 2.26% 1.89% 0.00% 0.50% 1.00% 1.50% 2.00% 2.50% 3.00% 3.50% 4.00% $0 $10 $20 $30 $40 $50 $60 $70 $80 Q1 2012 Q2 2012 Q3 2012 Q4 2012 Q1 2013 Net interest income Net interest margin (Bank)
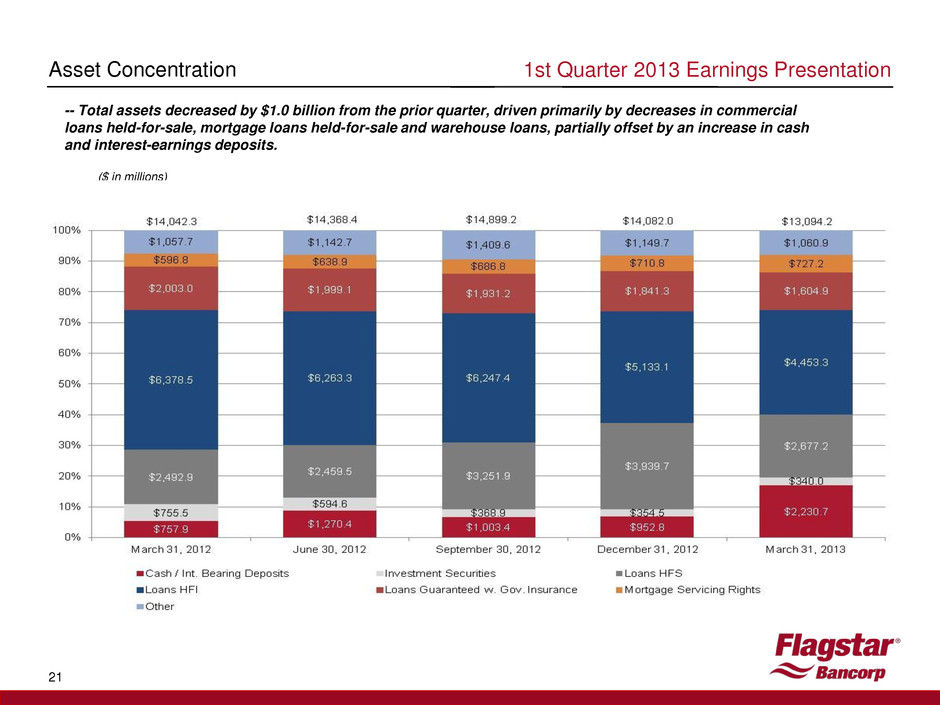
21 Asset Concentration 1st Quarter 2013 Earnings Presentation -- Total assets decreased by $1.0 billion from the prior quarter, driven primarily by decreases in commercial loans held-for-sale, mortgage loans held-for-sale and warehouse loans, partially offset by an increase in cash and interest-earnings deposits. ($ in millions)
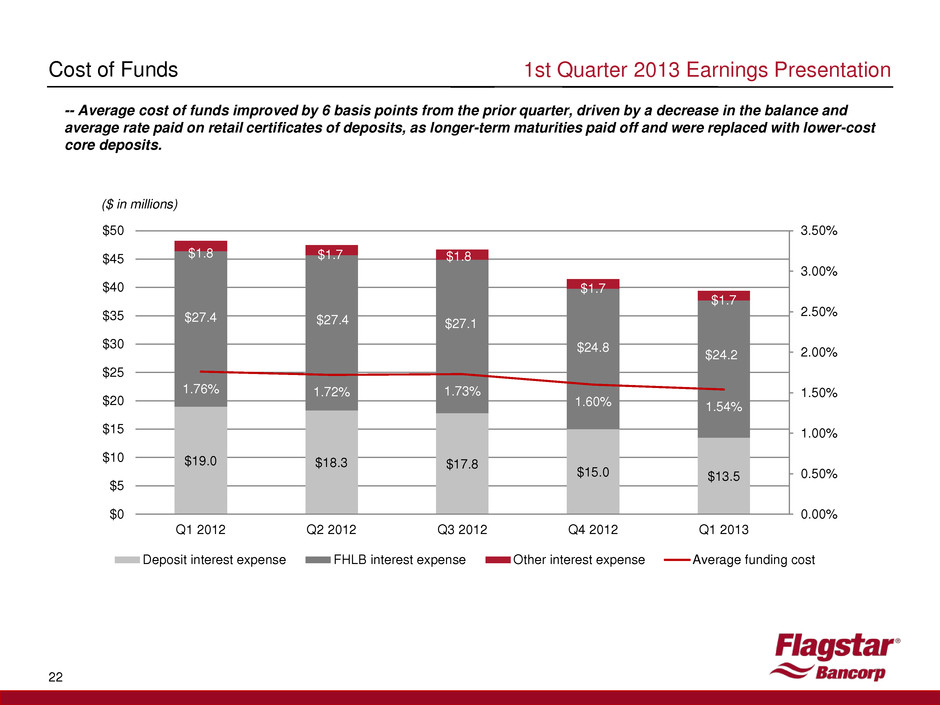
22 Cost of Funds -- Average cost of funds improved by 6 basis points from the prior quarter, driven by a decrease in the balance and average rate paid on retail certificates of deposits, as longer-term maturities paid off and were replaced with lower-cost core deposits. 1st Quarter 2013 Earnings Presentation $19.0 $18.3 $17.8 $15.0 $13.5 $27.4 $27.4 $27.1 $24.8 $24.2 $1.8 $1.7 $1.8 $1.7 $1.7 1.76% 1.72% 1.73% 1.60% 1.54% 0.00% 0.50% 1.00% 1.50% 2.00% 2.50% 3.00% 3.50% $0 $5 $10 $15 $20 $25 $30 $35 $40 $45 $50 Q1 2012 Q2 2012 Q3 2012 Q4 2012 Q1 2013 Deposit interest expense FHLB interest expense Other interest expense Average funding cost ($ in millions)
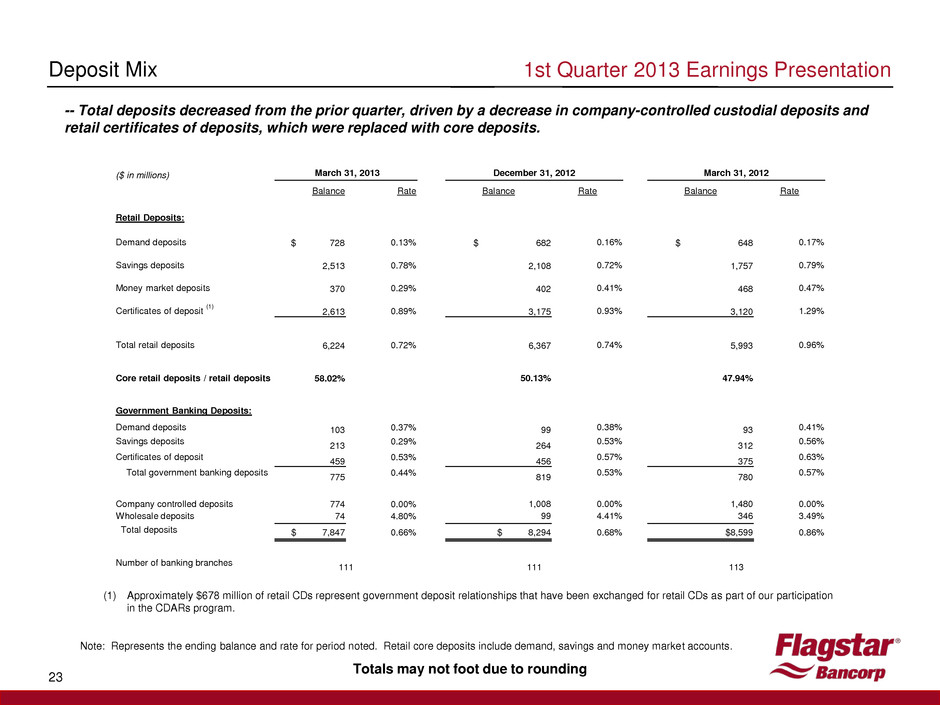
1st Quarter 2013 Earnings Presentation 23 Deposit Mix Note: Represents the ending balance and rate for period noted. Retail core deposits include demand, savings and money market accounts. Totals may not foot due to rounding -- Total deposits decreased from the prior quarter, driven by a decrease in company-controlled custodial deposits and retail certificates of deposits, which were replaced with core deposits. ($ in millions) March 31, 2013 December 31, 2012 March 31, 2012 Balance Rate Balance Rate Balance Rate Retail Deposits: Demand deposits $ 728 0.13% $ 682 0.16% $ 648 0.17% Savings deposits 2,513 0.78% 2,108 0.72% 1,757 0.79% Money market deposits 370 0.29% 402 0.41% 468 0.47% Certificates of deposit (1) 2,613 0.89% 3,175 0.93% 3,120 1.29% Total retail deposits 6,224 0.72% 6,367 0.74% 5,993 0.96% Core retail deposits / retail deposits 58.02% 50.13% 47.94% Government Banking Deposits: Demand deposits 103 0.37% 99 0.38% 93 0.41% Savings deposits 213 0.29% 264 0.53% 312 0.56% Certificates of deposit 459 0.53% 456 0.57% 375 0.63% Total government banking deposits 775 0.44% 819 0.53% 780 0.57% Company controlled deposits 774 0.00% 1,008 0.00% 1,480 0.00% Wholesale deposits 74 4.80% 99 4.41% 346 3.49% Total deposits $ 7,847 0.66% $ 8,294 0.68% $8,599 0.86% Number of banking branches 111 111 113 (1) Approximately $678 million of retail CDs represent government deposit relationships that have been exchanged for retail CDs as part of our participation in the CDARs program.
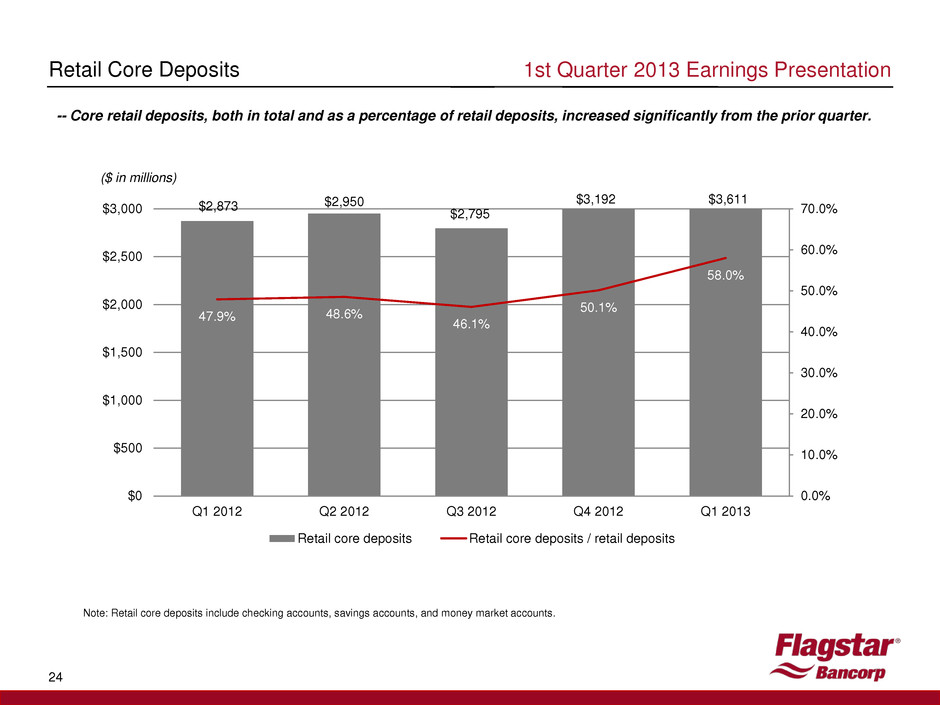
Note: Retail core deposits include checking accounts, savings accounts, and money market accounts. 24 Retail Core Deposits -- Core retail deposits, both in total and as a percentage of retail deposits, increased significantly from the prior quarter. 1st Quarter 2013 Earnings Presentation $2,873 $2,950 $2,795 $3,192 $3,611 47.9% 48.6% 46.1% 50.1% 58.0% 0.0% 10.0% 20.0% 30.0% 40.0% 50.0% 60.0% 70.0% $0 $500 $1,000 $1,500 $2,000 $2,500 $3,000 Q1 2012 Q2 2012 Q3 2012 Q4 2012 Q1 2013 Retail core deposits Retail core deposits / retail deposits ($ in millions)
1st Quarter 2013 Earnings Presentation 25 Appendix
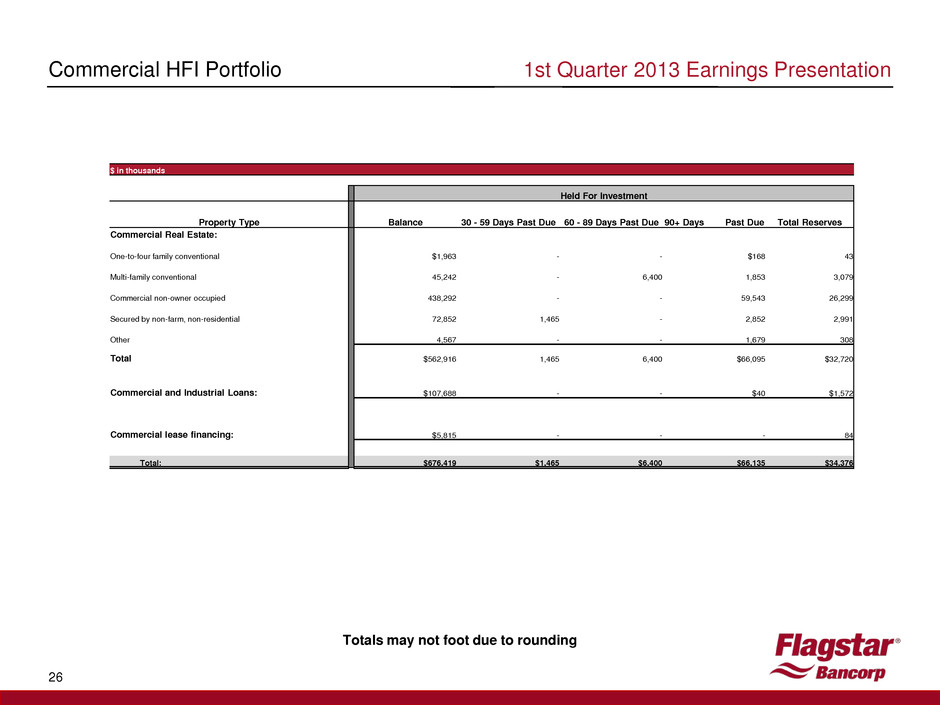
1st Quarter 2013 Earnings Presentation 26 Commercial HFI Portfolio $ in thousands Held For Investment Property Type Balance 30 - 59 Days Past Due 60 - 89 Days Past Due 90+ Days Past Due Total Reserves Commercial Real Estate: One-to-four family conventional $1,963 - - $168 43 Multi-family conventional 45,242 - 6,400 1,853 3,079 Commercial non-owner occupied 438,292 - - 59,543 26,299 Secured by non-farm, non-residential 72,852 1,465 - 2,852 2,991 Other 4,567 - - 1,679 308 Total $562,916 1,465 6,400 $66,095 $32,720 Commercial and Industrial Loans: $107,688 - - $40 $1,572 Commercial lease financing: $5,815 - - - 84 Total: $676,419 $1,465 $6,400 $66,135 $34,376 Totals may not foot due to rounding
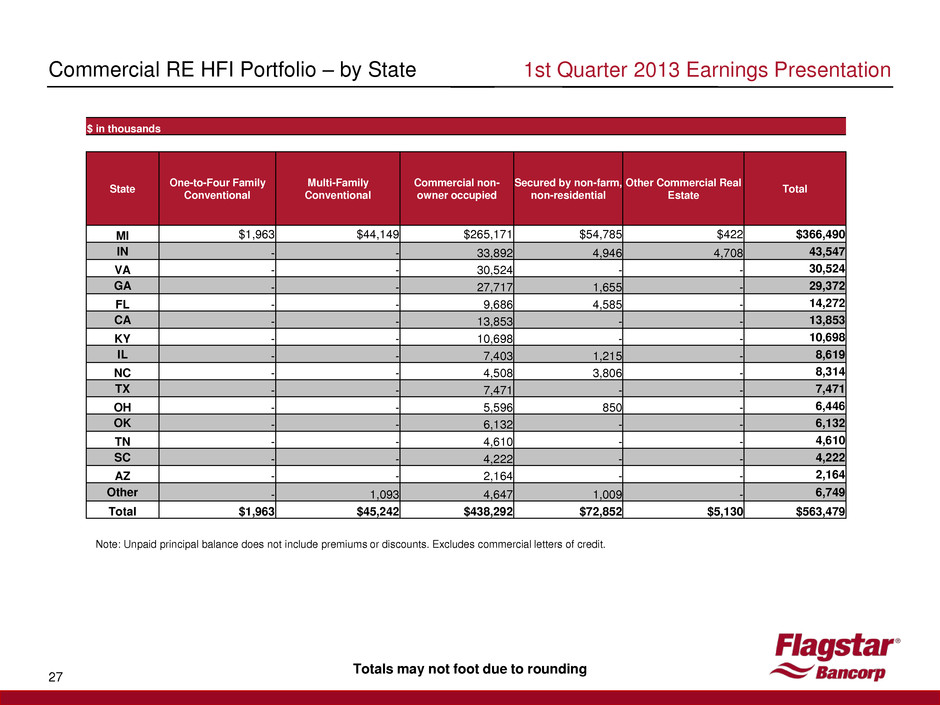
1st Quarter 2013 Earnings Presentation 27 Commercial RE HFI Portfolio – by State Note: Unpaid principal balance does not include premiums or discounts. Excludes commercial letters of credit. Totals may not foot due to rounding $ in thousands State One-to-Four Family Conventional Multi-Family Conventional Commercial non- owner occupied Secured by non-farm, non-residential Other Commercial Real Estate Total MI $1,963 $44,149 $265,171 $54,785 $422 $366,490 IN - - 33,892 4,946 4,708 43,547 VA - - 30,524 - - 30,524 GA - - 27,717 1,655 - 29,372 FL - - 9,686 4,585 - 14,272 CA - - 13,853 - - 13,853 KY - - 10,698 - - 10,698 IL - - 7,403 1,215 - 8,619 NC - - 4,508 3,806 - 8,314 TX - - 7,471 - - 7,471 OH - - 5,596 850 - 6,446 OK - - 6,132 - - 6,132 TN - - 4,610 - - 4,610 SC - - 4,222 - - 4,222 AZ - - 2,164 - - 2,164 Other - 1,093 4,647 1,009 - 6,749 Total $1,963 $45,242 $438,292 $72,852 $5,130 $563,479
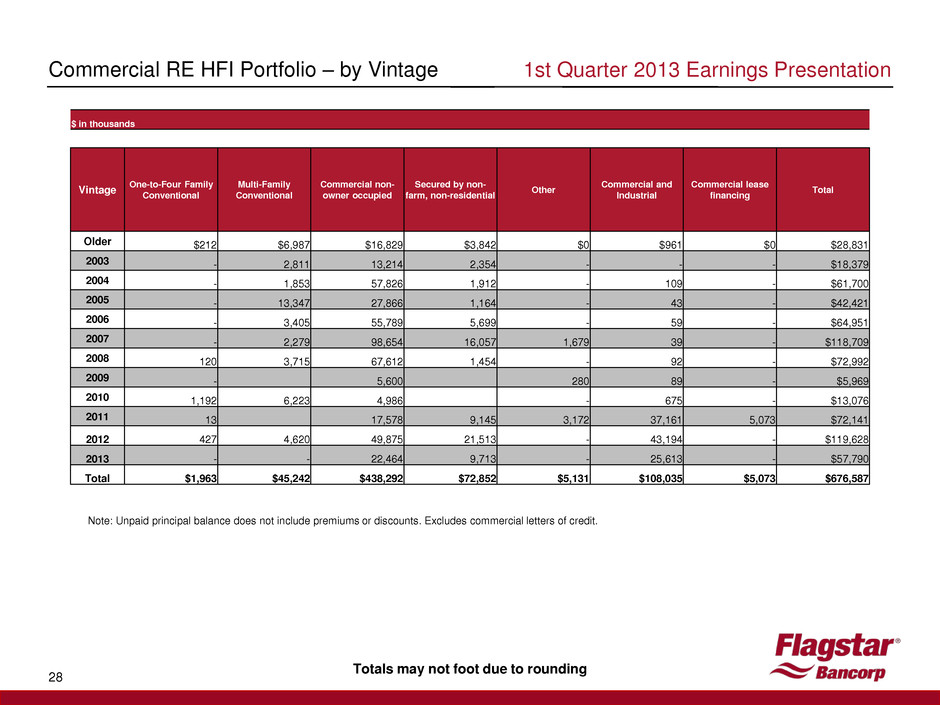
1st Quarter 2013 Earnings Presentation 28 Commercial RE HFI Portfolio – by Vintage Note: Unpaid principal balance does not include premiums or discounts. Excludes commercial letters of credit. Totals may not foot due to rounding $ in thousands Vintage One-to-Four Family Conventional Multi-Family Conventional Commercial non- owner occupied Secured by non- farm, non-residential Other Commercial and Industrial Commercial lease financing Total Older $212 $6,987 $16,829 $3,842 $0 $961 $0 $28,831 2003 - 2,811 13,214 2,354 - - - $18,379 2004 - 1,853 57,826 1,912 - 109 - $61,700 2005 - 13,347 27,866 1,164 - 43 - $42,421 2006 - 3,405 55,789 5,699 - 59 - $64,951 2007 - 2,279 98,654 16,057 1,679 39 - $118,709 2008 120 3,715 67,612 1,454 - 92 - $72,992 2009 - 5,600 280 89 - $5,969 2010 1,192 6,223 4,986 - 675 - $13,076 2011 13 17,578 9,145 3,172 37,161 5,073 $72,141 2012 427 4,620 49,875 21,513 - 43,194 - $119,628 2013 - - 22,464 9,713 - 25,613 - $57,790 Total $1,963 $45,242 $438,292 $72,852 $5,131 $108,035 $5,073 $676,587
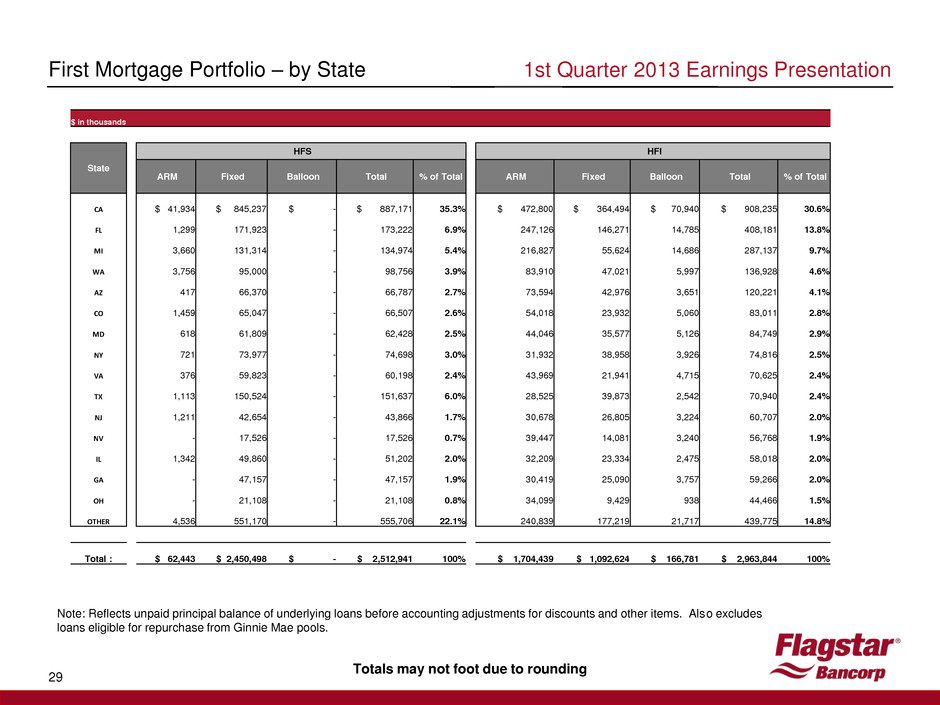
1st Quarter 2013 Earnings Presentation 29 First Mortgage Portfolio – by State Note: Reflects unpaid principal balance of underlying loans before accounting adjustments for discounts and other items. Also excludes loans eligible for repurchase from Ginnie Mae pools. Totals may not foot due to rounding $ in thousands State HFS HFI ARM Fixed Balloon Total % of Total ARM Fixed Balloon Total % of Total CA $ 41,934 $ 845,237 $ - $ 887,171 35.3% $ 472,800 $ 364,494 $ 70,940 $ 908,235 30.6% FL 1,299 171,923 - 173,222 6.9% 247,126 146,271 14,785 408,181 13.8% MI 3,660 131,314 - 134,974 5.4% 216,827 55,624 14,686 287,137 9.7% WA 3,756 95,000 - 98,756 3.9% 83,910 47,021 5,997 136,928 4.6% AZ 417 66,370 - 66,787 2.7% 73,594 42,976 3,651 120,221 4.1% CO 1,459 65,047 - 66,507 2.6% 54,018 23,932 5,060 83,011 2.8% MD 618 61,809 - 62,428 2.5% 44,046 35,577 5,126 84,749 2.9% NY 721 73,977 - 74,698 3.0% 31,932 38,958 3,926 74,816 2.5% VA 376 59,823 - 60,198 2.4% 43,969 21,941 4,715 70,625 2.4% TX 1,113 150,524 - 151,637 6.0% 28,525 39,873 2,542 70,940 2.4% NJ 1,211 42,654 - 43,866 1.7% 30,678 26,805 3,224 60,707 2.0% NV - 17,526 - 17,526 0.7% 39,447 14,081 3,240 56,768 1.9% IL 1,342 49,860 - 51,202 2.0% 32,209 23,334 2,475 58,018 2.0% GA - 47,157 - 47,157 1.9% 30,419 25,090 3,757 59,266 2.0% OH - 21,108 - 21,108 0.8% 34,099 9,429 938 44,466 1.5% OTHER 4,536 551,170 - 555,706 22.1% 240,839 177,219 21,717 439,775 14.8% Total : $ 62,443 $ 2,450,498 $ - $ 2,512,941 100% $ 1,704,439 $ 1,092,624 $ 166,781 $ 2,963,844 100%
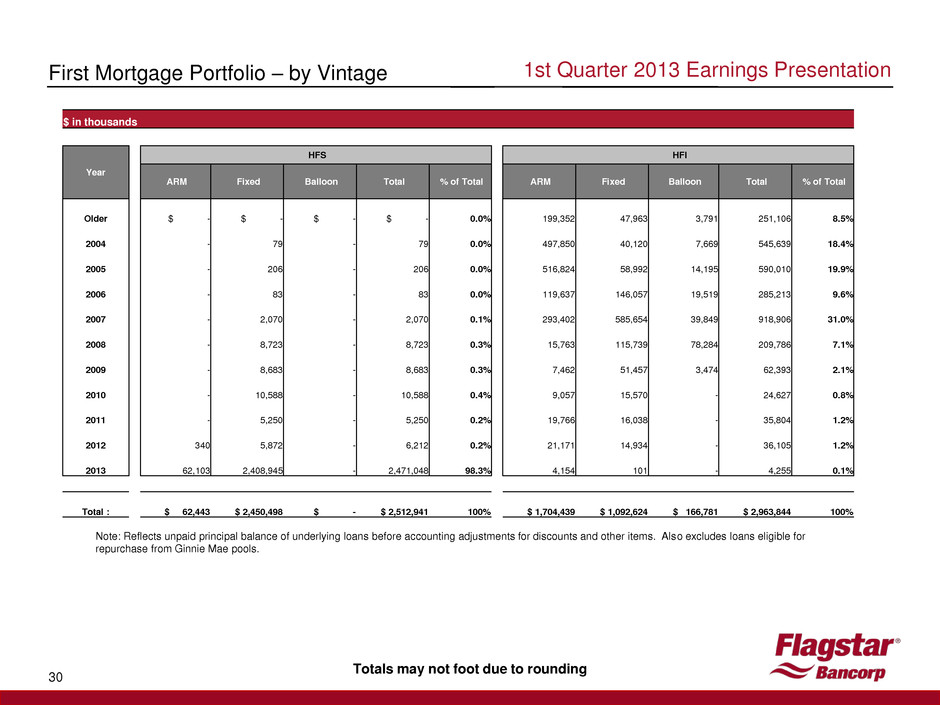
1st Quarter 2013 Earnings Presentation 30 First Mortgage Portfolio – by Vintage Note: Reflects unpaid principal balance of underlying loans before accounting adjustments for discounts and other items. Also excludes loans eligible for repurchase from Ginnie Mae pools. Totals may not foot due to rounding $ in thousands Year HFS HFI ARM Fixed Balloon Total % of Total ARM Fixed Balloon Total % of Total Older $ - $ - $ - $ - 0.0% 199,352 47,963 3,791 251,106 8.5% 2004 - 79 - 79 0.0% 497,850 40,120 7,669 545,639 18.4% 2005 - 206 - 206 0.0% 516,824 58,992 14,195 590,010 19.9% 2006 - 83 - 83 0.0% 119,637 146,057 19,519 285,213 9.6% 2007 - 2,070 - 2,070 0.1% 293,402 585,654 39,849 918,906 31.0% 2008 - 8,723 - 8,723 0.3% 15,763 115,739 78,284 209,786 7.1% 2009 - 8,683 - 8,683 0.3% 7,462 51,457 3,474 62,393 2.1% 2010 - 10,588 - 10,588 0.4% 9,057 15,570 - 24,627 0.8% 2011 - 5,250 - 5,250 0.2% 19,766 16,038 - 35,804 1.2% 2012 340 5,872 - 6,212 0.2% 21,171 14,934 - 36,105 1.2% 2013 62,103 2,408,945 - 2,471,048 98.3% 4,154 101 - 4,255 0.1% Total : $ 62,443 $ 2,450,498 $ - $ 2,512,941 100% $ 1,704,439 $ 1,092,624 $ 166,781 $ 2,963,844 100%
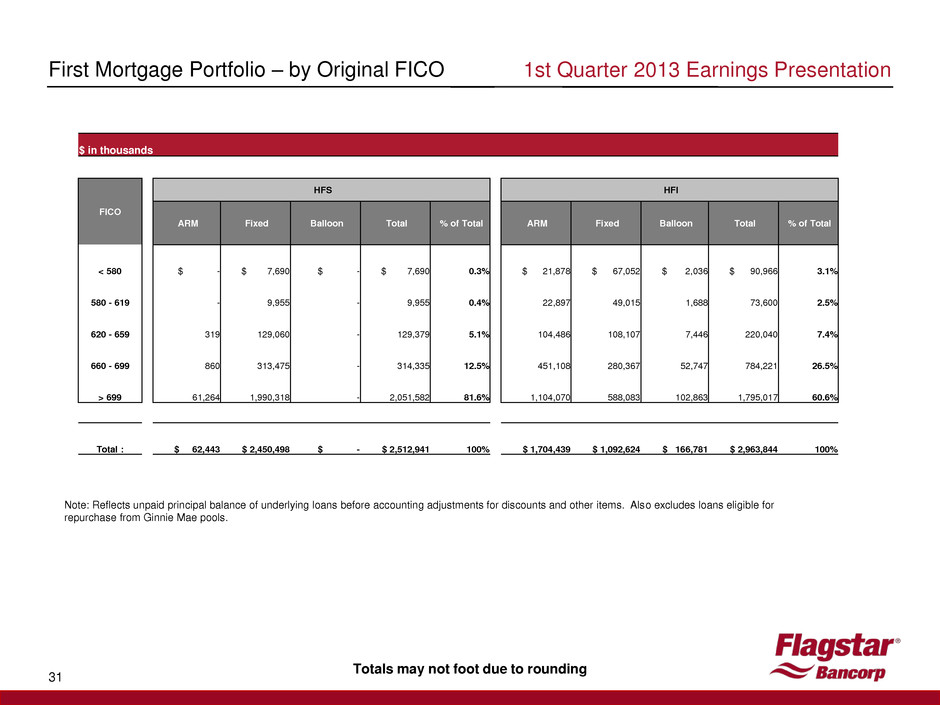
1st Quarter 2013 Earnings Presentation 31 First Mortgage Portfolio – by Original FICO Note: Reflects unpaid principal balance of underlying loans before accounting adjustments for discounts and other items. Also excludes loans eligible for repurchase from Ginnie Mae pools. Totals may not foot due to rounding $ in thousands FICO HFS HFI ARM Fixed Balloon Total % of Total ARM Fixed Balloon Total % of Total < 580 $ - $ 7,690 $ - $ 7,690 0.3% $ 21,878 $ 67,052 $ 2,036 $ 90,966 3.1% 580 - 619 - 9,955 - 9,955 0.4% 22,897 49,015 1,688 73,600 2.5% 620 - 659 319 129,060 - 129,379 5.1% 104,486 108,107 7,446 220,040 7.4% 660 - 699 860 313,475 - 314,335 12.5% 451,108 280,367 52,747 784,221 26.5% > 699 61,264 1,990,318 - 2,051,582 81.6% 1,104,070 588,083 102,863 1,795,017 60.6% Total : $ 62,443 $ 2,450,498 $ - $ 2,512,941 100% $ 1,704,439 $ 1,092,624 $ 166,781 $ 2,963,844 100%

1st Quarter 2013 Earnings Presentation 32 First Mortgage Portfolio – by Original LTV Note: Reflects unpaid principal balance of underlying loans before accounting adjustments for discounts and other items. Also excludes loans eligible for repurchase from Ginnie Mae pools. Totals may not foot due to rounding $ in thousands Original LTV HFS HFI ARM Fixed Balloon Total % of Total ARM Fixed Balloon Total % of Total <=70.00% $ 45,263 $ 720,151 $ - $ 765,414 30.5% $ 449,781 $ 311,775 $ 32,482 $ 794,037 26.8% >70.00% - 79.99% 11,500 687,583 - 699,083 27.8% 1,042,992 549,343 111,598 1,703,933 57.5% >80.00% - 89.99% 2,350 228,889 - 231,239 9.2% 110,467 86,067 14,258 210,791 7.1% >90.00% - 99.99% 3,107 620,943 - 624,050 24.8% 96,045 133,541 8,214 237,801 8.0% 100.00% -109.99% 222 94,788 - 95,010 3.8% 5,153 9,155 - 14,307 0.5% 110.00% -124.99% - 58,129 - 58,129 2.3% - 2,117 110 2,228 0.1% >125.00% - 40,015 - 40,015 1.6% - 626 119 745 0.0% Total: $ 62,443 $ 2,450,498 $ - $ 2,512,941 100% $ 1,704,439 $ 1,092,624 $ 166,781 $ 2,963,844 100%
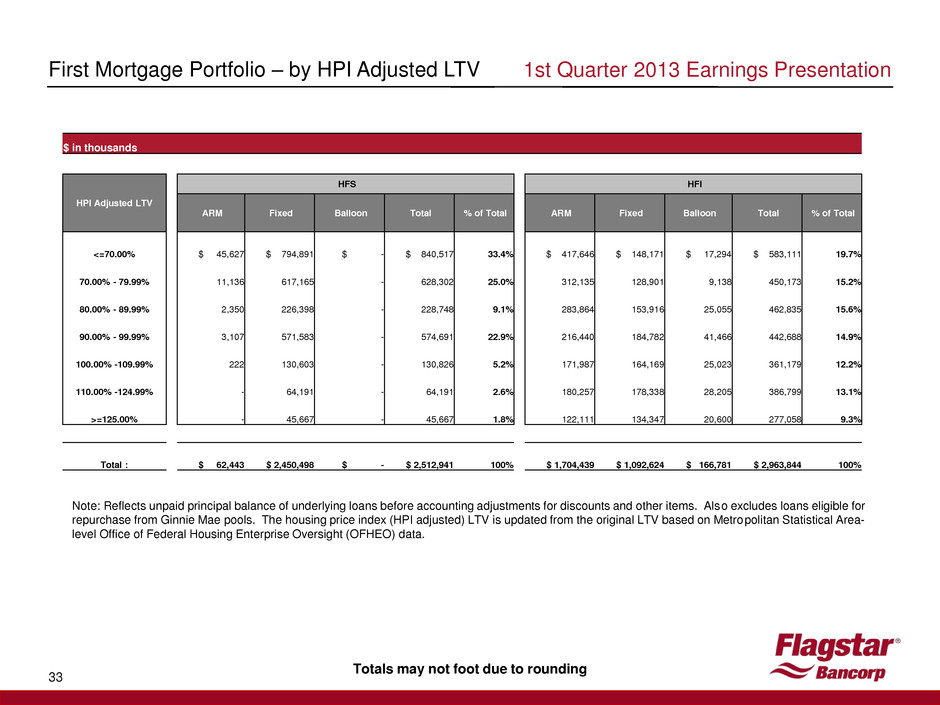
1st Quarter 2013 Earnings Presentation 33 First Mortgage Portfolio – by HPI Adjusted LTV Note: Reflects unpaid principal balance of underlying loans before accounting adjustments for discounts and other items. Also excludes loans eligible for repurchase from Ginnie Mae pools. The housing price index (HPI adjusted) LTV is updated from the original LTV based on Metropolitan Statistical Area- level Office of Federal Housing Enterprise Oversight (OFHEO) data. Totals may not foot due to rounding $ in thousands HPI Adjusted LTV HFS HFI ARM Fixed Balloon Total % of Total ARM Fixed Balloon Total % of Total <=70.00% $ 45,627 $ 794,891 $ - $ 840,517 33.4% $ 417,646 $ 148,171 $ 17,294 $ 583,111 19.7% 70.00% - 79.99% 11,136 617,165 - 628,302 25.0% 312,135 128,901 9,138 450,173 15.2% 80.00% - 89.99% 2,350 226,398 - 228,748 9.1% 283,864 153,916 25,055 462,835 15.6% 90.00% - 99.99% 3,107 571,583 - 574,691 22.9% 216,440 184,782 41,466 442,688 14.9% 100.00% -109.99% 222 130,603 - 130,826 5.2% 171,987 164,169 25,023 361,179 12.2% 110.00% -124.99% - 64,191 - 64,191 2.6% 180,257 178,338 28,205 386,799 13.1% >=125.00% - 45,667 - 45,667 1.8% 122,111 134,347 20,600 277,058 9.3% Total : $ 62,443 $ 2,450,498 $ - $ 2,512,941 100% $ 1,704,439 $ 1,092,624 $ 166,781 $ 2,963,844 100%
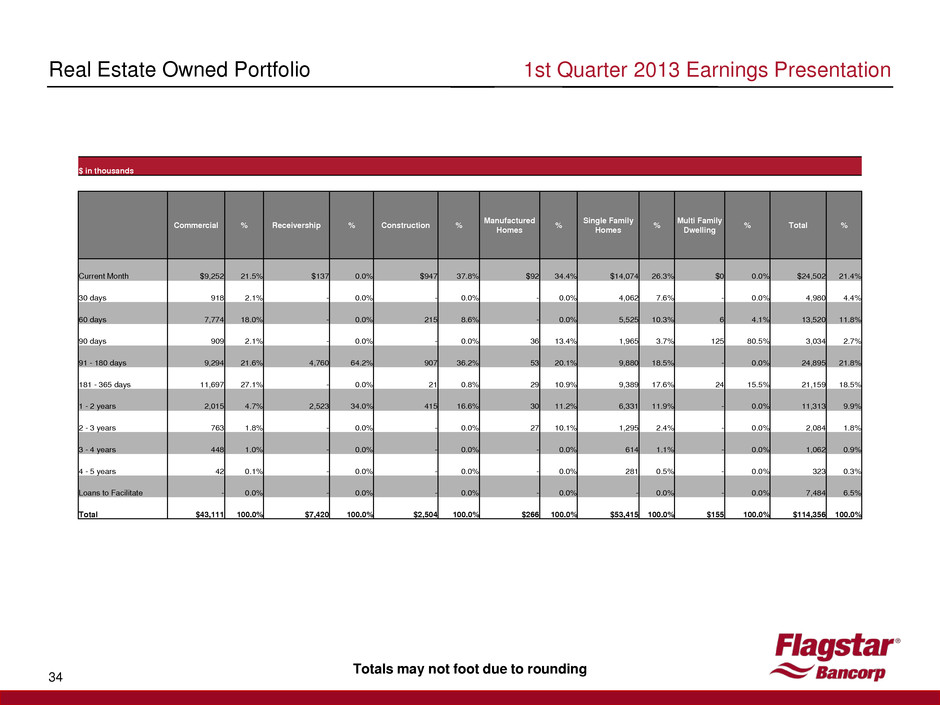
1st Quarter 2013 Earnings Presentation 34 Real Estate Owned Portfolio Totals may not foot due to rounding $ in thousands Commercial % Receivership % Construction % Manufactured Homes % Single Family Homes % Multi Family Dwelling % Total % Current Month $9,252 21.5% $137 0.0% $947 37.8% $92 34.4% $14,074 26.3% $0 0.0% $24,502 21.4% 30 days 918 2.1% - 0.0% - 0.0% - 0.0% 4,062 7.6% - 0.0% 4,980 4.4% 60 days 7,774 18.0% - 0.0% 215 8.6% - 0.0% 5,525 10.3% 6 4.1% 13,520 11.8% 90 days 909 2.1% - 0.0% - 0.0% 36 13.4% 1,965 3.7% 125 80.5% 3,034 2.7% 91 - 180 days 9,294 21.6% 4,760 64.2% 907 36.2% 53 20.1% 9,880 18.5% - 0.0% 24,895 21.8% 181 - 365 days 11,697 27.1% - 0.0% 21 0.8% 29 10.9% 9,389 17.6% 24 15.5% 21,159 18.5% 1 - 2 years 2,015 4.7% 2,523 34.0% 415 16.6% 30 11.2% 6,331 11.9% - 0.0% 11,313 9.9% 2 - 3 years 763 1.8% - 0.0% - 0.0% 27 10.1% 1,295 2.4% - 0.0% 2,084 1.8% 3 - 4 years 448 1.0% - 0.0% - 0.0% - 0.0% 614 1.1% - 0.0% 1,062 0.9% 4 - 5 years 42 0.1% - 0.0% - 0.0% - 0.0% 281 0.5% - 0.0% 323 0.3% Loans to Facilitate - 0.0% - 0.0% - 0.0% - 0.0% - 0.0% - 0.0% 7,484 6.5% Total $43,111 100.0% $7,420 100.0% $2,504 100.0% $266 100.0% $53,415 100.0% $155 100.0% $114,356 100.0%
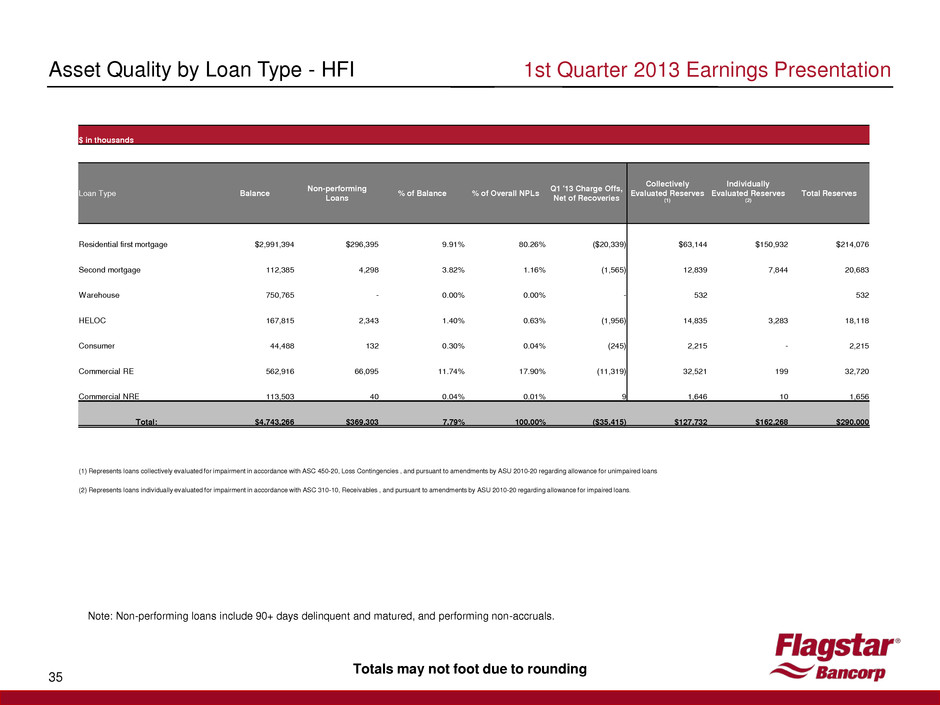
1st Quarter 2013 Earnings Presentation 35 Asset Quality by Loan Type - HFI Note: Non-performing loans include 90+ days delinquent and matured, and performing non-accruals. Totals may not foot due to rounding $ in thousands Loan Type Balance Non-performing Loans % of Balance % of Overall NPLs Q1 '13 Charge Offs, Net of Recoveries Collectively Evaluated Reserves (1) Individually Evaluated Reserves (2) Total Reserves Residential first mortgage $2,991,394 $296,395 9.91% 80.26% ($20,339) $63,144 $150,932 $214,076 Second mortgage 112,385 4,298 3.82% 1.16% (1,565) 12,839 7,844 20,683 Warehouse 750,765 - 0.00% 0.00% - 532 532 HELOC 167,815 2,343 1.40% 0.63% (1,956) 14,835 3,283 18,118 Consumer 44,488 132 0.30% 0.04% (245) 2,215 - 2,215 Commercial RE 562,916 66,095 11.74% 17.90% (11,319) 32,521 199 32,720 Commercial NRE 113,503 40 0.04% 0.01% 9 1,646 10 1,656 Total: $4,743,266 $369,303 7.79% 100.00% ($35,415) $127,732 $162,268 $290,000 (1) Represents loans collectively evaluated for impairment in accordance with ASC 450-20, Loss Contingencies , and pursuant to amendments by ASU 2010-20 regarding allowance for unimpaired loans (2) Represents loans individually evaluated for impairment in accordance with ASC 310-10, Receivables , and pursuant to amendments by ASU 2010-20 regarding allowance for impaired loans.
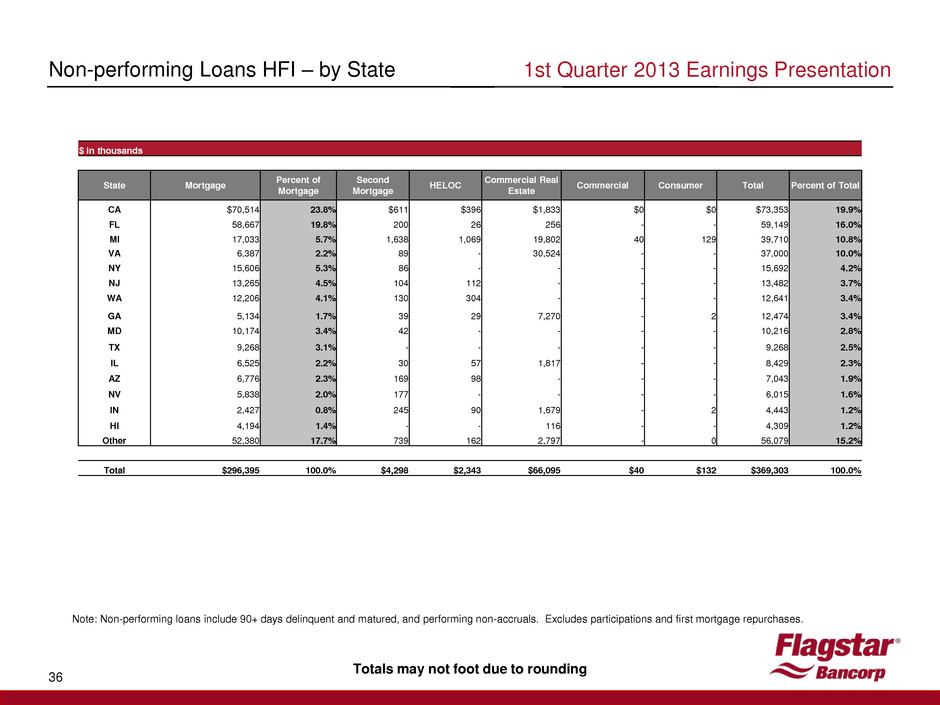
1st Quarter 2013 Earnings Presentation 36 Non-performing Loans HFI – by State Note: Non-performing loans include 90+ days delinquent and matured, and performing non-accruals. Excludes participations and first mortgage repurchases. Totals may not foot due to rounding $ in thousands State Mortgage Percent of Mortgage Second Mortgage HELOC Commercial Real Estate Commercial Consumer Total Percent of Total CA $70,514 23.8% $611 $396 $1,833 $0 $0 $73,353 19.9% FL 58,667 19.8% 200 26 256 - - 59,149 16.0% MI 17,033 5.7% 1,638 1,069 19,802 40 129 39,710 10.8% VA 6,387 2.2% 89 - 30,524 - - 37,000 10.0% NY 15,606 5.3% 86 - - - - 15,692 4.2% NJ 13,265 4.5% 104 112 - - - 13,482 3.7% WA 12,206 4.1% 130 304 - - - 12,641 3.4% GA 5,134 1.7% 39 29 7,270 - 2 12,474 3.4% MD 10,174 3.4% 42 - - - - 10,216 2.8% TX 9,268 3.1% - - - - - 9,268 2.5% IL 6,525 2.2% 30 57 1,817 - - 8,429 2.3% AZ 6,776 2.3% 169 98 - - - 7,043 1.9% NV 5,838 2.0% 177 - - - - 6,015 1.6% IN 2,427 0.8% 245 90 1,679 - 2 4,443 1.2% HI 4,194 1.4% - - 116 - - 4,309 1.2% Other 52,380 17.7% 739 162 2,797 - 0 56,079 15.2% Total $296,395 100.0% $4,298 $2,343 $66,095 $40 $132 $369,303 100.0%
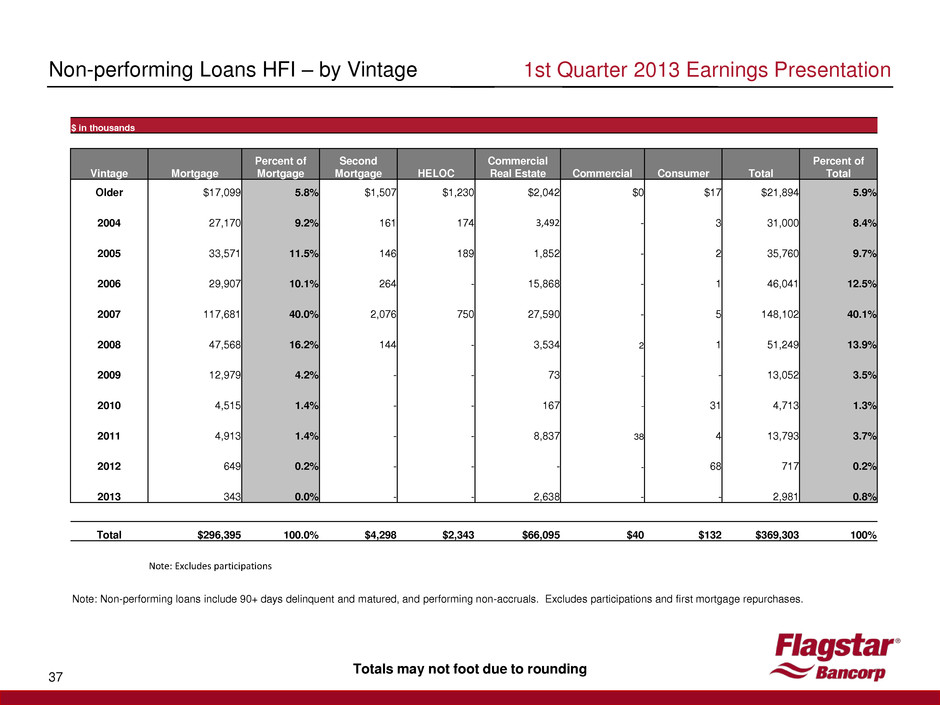
1st Quarter 2013 Earnings Presentation 37 Non-performing Loans HFI – by Vintage Totals may not foot due to rounding Note: Non-performing loans include 90+ days delinquent and matured, and performing non-accruals. Excludes participations and first mortgage repurchases. $ in thousands Vintage Mortgage Percent of Mortgage Second Mortgage HELOC Commercial Real Estate Commercial Consumer Total Percent of Total Older $17,099 5.8% $1,507 $1,230 $2,042 $0 $17 $21,894 5.9% 2004 27,170 9.2% 161 174 3,492 - 3 31,000 8.4% 2005 33,571 11.5% 146 189 1,852 - 2 35,760 9.7% 2006 29,907 10.1% 264 - 15,868 - 1 46,041 12.5% 2007 117,681 40.0% 2,076 750 27,590 - 5 148,102 40.1% 2008 47,568 16.2% 144 - 3,534 2 1 51,249 13.9% 2009 12,979 4.2% - - 73 - - 13,052 3.5% 2010 4,515 1.4% - - 167 - 31 4,713 1.3% 2011 4,913 1.4% - - 8,837 38 4 13,793 3.7% 2012 649 0.2% - - - - 68 717 0.2% 2013 343 0.0% - - 2,638 - - 2,981 0.8% Total $296,395 100.0% $4,298 $2,343 $66,095 $40 $132 $369,303 100% Note: Excludes participations
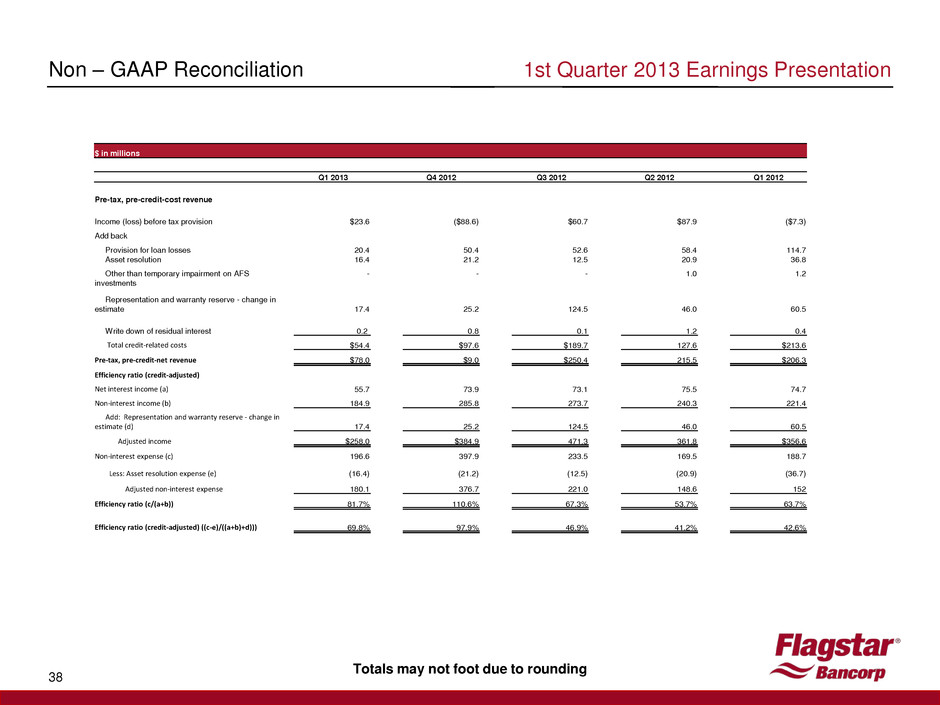
1st Quarter 2013 Earnings Presentation 38 Non – GAAP Reconciliation Totals may not foot due to rounding $ in millions Q1 2013 Q4 2012 Q3 2012 Q2 2012 Q1 2012 Pre-tax, pre-credit-cost revenue Income (loss) before tax provision $23.6 ($88.6) $60.7 $87.9 ($7.3) Add back Provision for loan losses 20.4 50.4 52.6 58.4 114.7 Asset resolution 16.4 21.2 12.5 20.9 36.8 Other than temporary impairment on AFS investments - - - 1.0 1.2 Representation and warranty reserve - change in estimate 17.4 25.2 124.5 46.0 60.5 Write down of residual interest 0.2 0.8 0.1 1.2 0.4 Total credit-related costs $54.4 $97.6 $189.7 127.6 $213.6 Pre-tax, pre-credit-net revenue $78.0 $9.0 $250.4 215.5 $206.3 Efficiency ratio (credit-adjusted) Net interest income (a) 55.7 73.9 73.1 75.5 74.7 Non-interest income (b) 184.9 285.8 273.7 240.3 221.4 Add: Representation and warranty reserve - change in estimate (d) 17.4 25.2 124.5 46.0 60.5 Adjusted income $258.0 $384.9 471.3 361.8 $356.6 Non-interest expense (c) 196.6 397.9 233.5 169.5 188.7 Less: Asset resolution expense (e) (16.4) (21.2) (12.5) (20.9) (36.7) Adjusted non-interest expense 180.1 376.7 221.0 148.6 152 Efficiency ratio (c/(a+b)) 81.7% 110.6% 67.3% 53.7% 63.7% Efficiency ratio (credit-adjusted) ((c-e)/((a+b)+d))) 69.8% 97.9% 46.9% 41.2% 42.6%
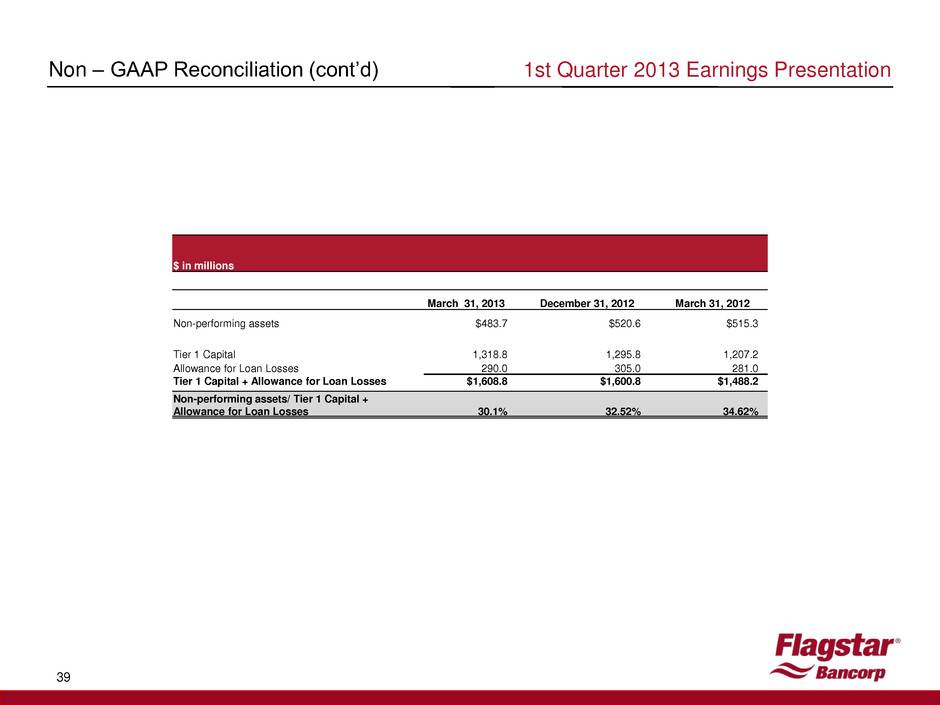
39 $ in millions March 31, 2013 December 31, 2012 March 31, 2012 Non-performing assets $483.7 $520.6 $515.3 Tier 1 Capital 1,318.8 1,295.8 1,207.2 Allowance for Loan Losses 290.0 305.0 281.0 Tier 1 Capital + Allowance for Loan Losses $1,608.8 $1,600.8 $1,488.2 Non-performing assets/ Tier 1 Capital + Allowance for Loan Losses 30.1% 32.52% 34.62% Non – GAAP Reconciliation (cont’d) 1st Quarter 2013 Earnings Presentation

FBC LISTED NYSE 40 1st Quarter 2013 Earnings Presentation


