
1 Flagstar Bancorp, Inc 3rd Quarter 2014 Earnings Presentation October 22, 2014 EXHIBIT 99.2
2 Cautionary Statement This presentation contains "forward-looking statements" within the meaning of the Private Securities Litigation Reform Act of 1995, as amended. Forward-looking statements, by their nature, involve estimates, projections, goals, forecasts, assumptions, risks and uncertainties that could cause actual results or outcomes to differ materially from those expressed in a forward-looking statement. Examples of forward-looking statements include statements regarding our expectations, beliefs, plans, goals, objectives and future financial or other performance. Words such as "expects," "anticipates," "intends," "plans," "believes," "seeks," "estimates" and variations of such words and similar expressions are intended to identify such forward-looking statements. Any forward-looking statement speaks only as of the date on which it is made. Except to fulfill our obligations under the U.S. securities laws, we undertake no obligation to update any such statement to reflect events or circumstances after the date on which it is made. There are a number of important factors that could cause future results to differ materially from historical performance and these forward-looking statements. Factors that might cause such a difference include, but are not limited to the following items: 1. General business and economic conditions, including unemployment rates, movements in interest rates, the slope of the yield curve, any increase in mortgage fraud and other related activity and the change in asset values in certain geographic markets, that affect us or our counterparties; 2. Volatile interest rates, and our ability to effectively hedge against them, which could affect, among other things, (i) the overall mortgage business, (ii) our ability to originate or acquire loans and to sell assets at a profit, (iii) prepayment speeds, (iv) our cost of funds and (v) investments in mortgage servicing rights; 3. The adequacy of our allowance for loan losses and our representation and warranty reserves; 4. Changes in accounting standards generally applicable to us and our application of such standards, including in the calculation of the fair value of our assets and liabilities; 5. Our ability to borrow funds, maintain or increase deposits or raise capital on commercially reasonable terms or at all and our ability to achieve or maintain desired capital ratios; 6. Changes in material factors affecting our loan portfolio, particularly our residential mortgage loans, and the market areas where our business is geographically concentrated or further loan portfolio or geographic concentration; 7. Changes in, or expansion of, the regulation of financial services companies and government-sponsored housing enterprises, including new legislation, regulations, rulemaking and interpretive guidance, enforcement actions, the imposition of fines and other penalties by our regulators, the impact of existing laws and regulations, new or changed roles or guidelines of government-sponsored entities, changes in regulatory capital ratios, and increases in deposit insurance premiums and special assessments of the Federal Deposit Insurance Corporation; 8. Our ability to comply with the terms and conditions of the Supervisory Agreement with the Board of Governors of the Federal Reserve and the Bank’s ability to comply with the Consent Order with the Office of Comptroller of the Currency and the Consent Order of the Consumer Financial Protection Bureau and our ability to address any further matters raised by these regulators, and other regulators or government bodies; 9. Our compliance with the terms and conditions of the agreement with the U.S. Department of Justice and the impact of compliance with that agreement and our ability to accurately estimate the financial impact of that agreement, including the fair value and timing of the future payments; 10. The Bank’s ability to make capital distributions and our ability to pay dividends on our capital stock or interest on our trust preferred securities; 11. Our ability to attract and retain senior management and other qualified personnel to execute our business strategy, including our entry into new lines of business, our introduction of new products and services and management of risks relating thereto, and our competing in the mortgage loan originations, mortgage servicing and community banking lines of business; 12. Our ability to satisfy our servicing and sub-servicing obligations and manage repurchases and indemnity demands by mortgage loan purchasers, guarantors and insurers; 13. The outcome and cost of defending current and future legal or regulatory litigation, proceedings or investigations; 14. Our ability to create and maintain an effective risk management framework and effectively manage risk, including, among other things, market, interest rate, credit and liquidity risk, including risks relating to the cyclicality and seasonality of our mortgage banking business, litigation and regulatory risk, operational risk, counterparty risk and reputational risk; 15. The control by, and influence of, our majority stockholder; 16. A failure of, interruption in or cybersecurity attack on our network or computer systems, which could impact our ability to properly collect, process and maintain personal data, ensure ongoing mortgage and banking operations, or maintain system integrity with respect to funds settlement; and 17. Our ability to meet our forecasted earnings such that we would need to establish a valuation allowance against our deferred tax asset; All of the above factors are difficult to predict, contain uncertainties that may materially affect actual results, and may be beyond our control. New factors emerge from time to time, and it is not possible for our management to predict all such factors or to assess the effect of each such factor on our business. Although we believe that these forward-looking statements are based on reasonable estimates and assumptions, they are not guaranties of future performance and are subject to known and unknown risks, uncertainties, contingencies and other factors. Accordingly, we cannot give you any assurance that our expectations will in fact occur or that actual results will not differ materially from those expressed or implied by such forward-looking statements. In light of the significant uncertainties inherent in forward- looking statements, the inclusion of such information should not be regarded as a representation by us or any other person that the results or conditions described in such statements or our objectives and plans will be achieved. 3rd Quarter 2014
3 Executive Overview Sandro DiNello, CEO
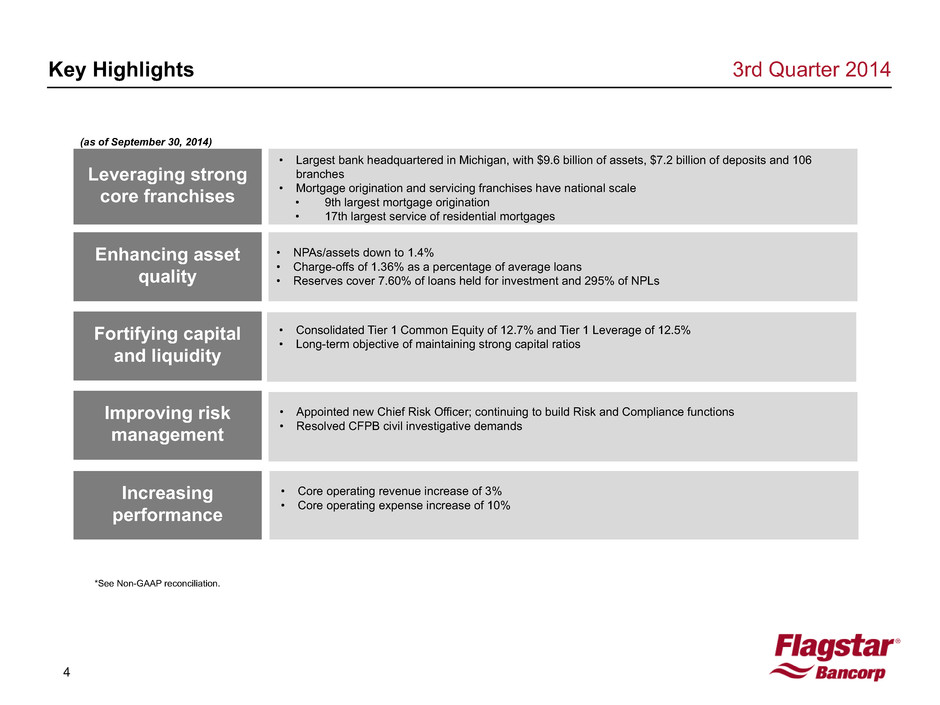
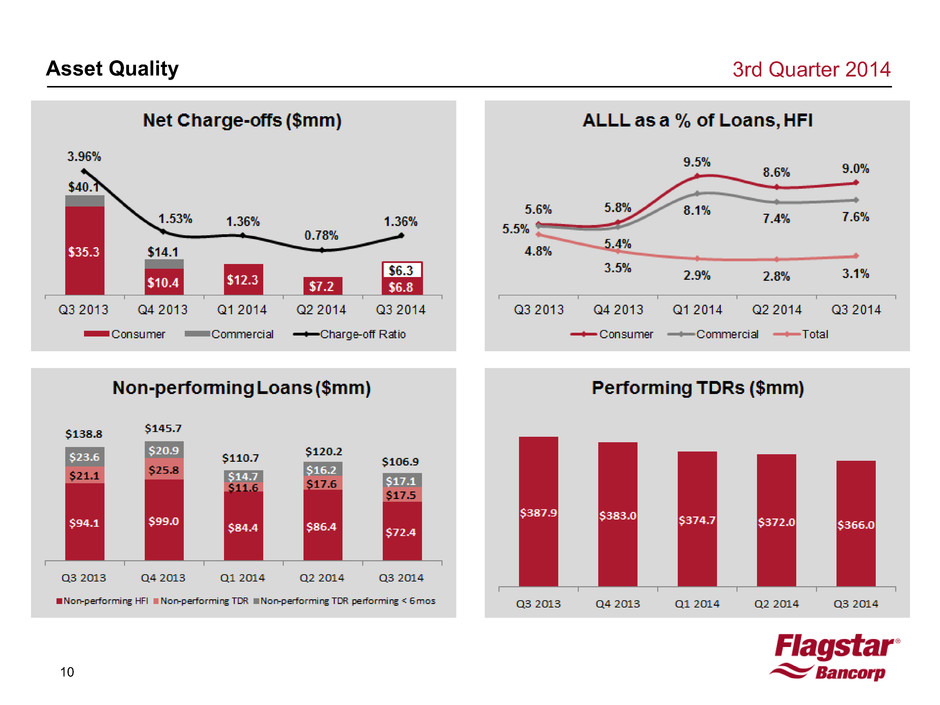
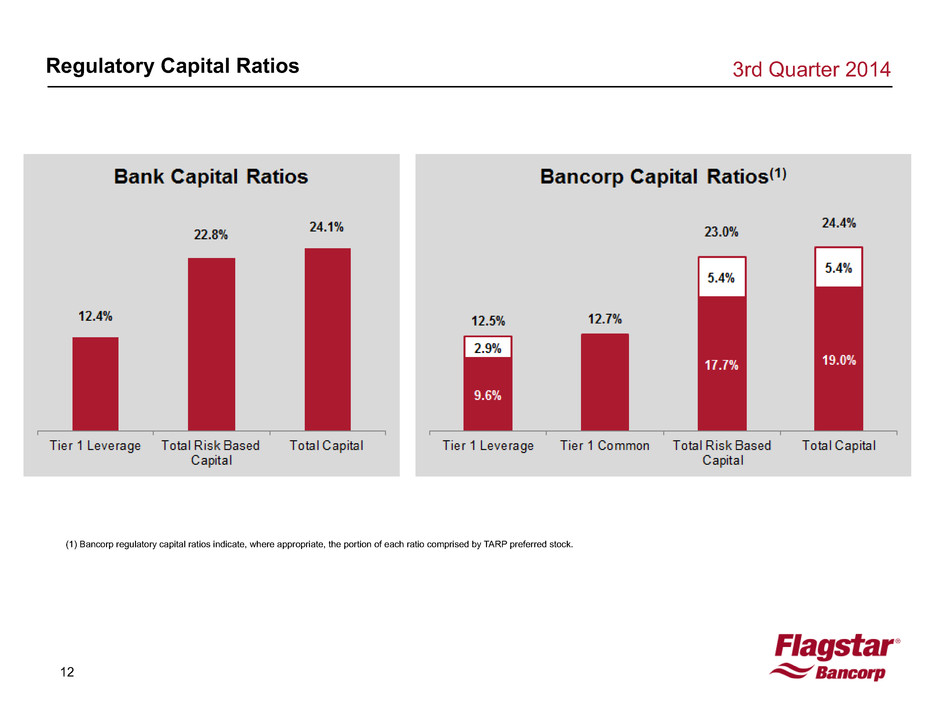
4 Key Highlights 3rd Quarter 2014 Leveraging strong core franchises Fortifying capital and liquidity • Largest bank headquartered in Michigan, with $9.6 billion of assets, $7.2 billion of deposits and 106 branches • Mortgage origination and servicing franchises have national scale • 9th largest mortgage origination • 17th largest service of residential mortgages • NPAs/assets down to 1.4% • Charge-offs of 1.36% as a percentage of average loans • Reserves cover 7.60% of loans held for investment and 295% of NPLs Increasing performance Improving risk management Enhancing asset quality • Consolidated Tier 1 Common Equity of 12.7% and Tier 1 Leverage of 12.5% • Long-term objective of maintaining strong capital ratios • Appointed new Chief Risk Officer; continuing to build Risk and Compliance functions • Resolved CFPB civil investigative demands • Core operating revenue increase of 3% • Core operating expense increase of 10% (as of September 30, 2014) *See Non-GAAP reconciliation.
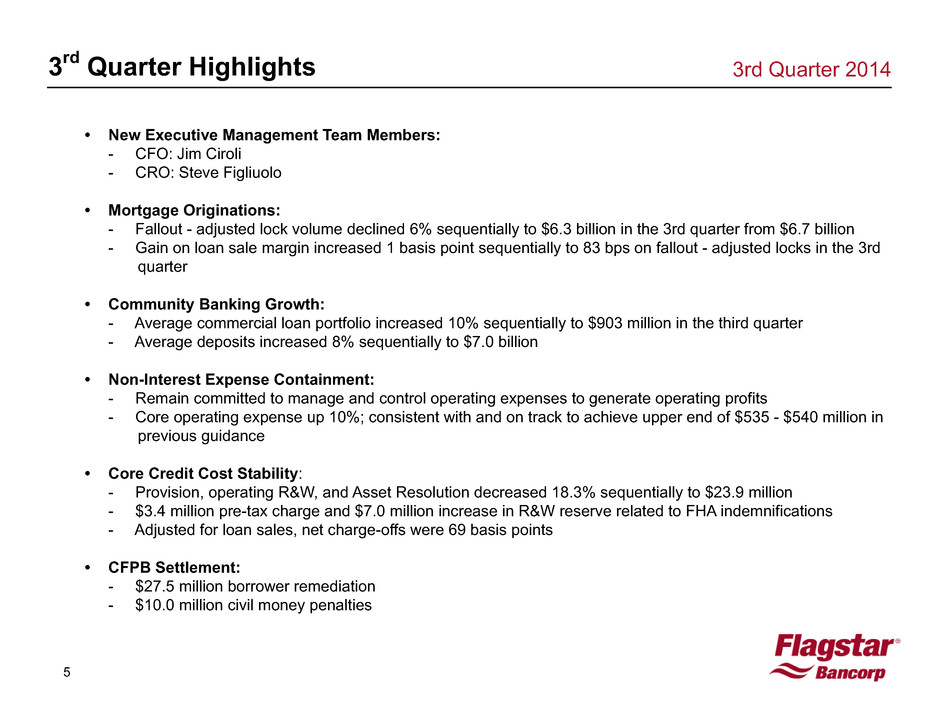
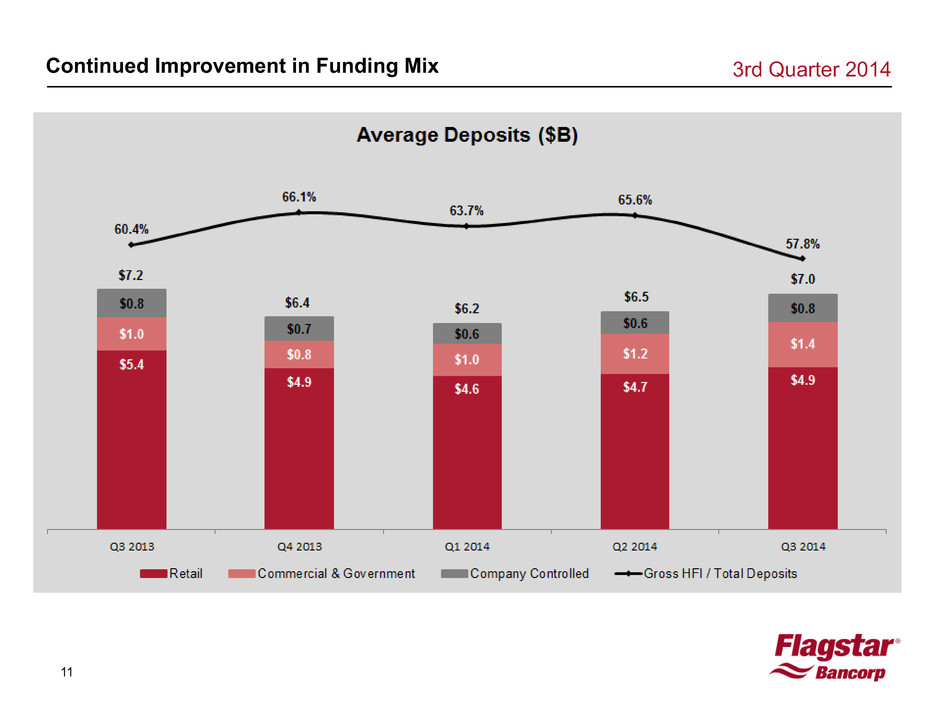
5 3rd Quarter Highlights 3rd Quarter 2014 • New Executive Management Team Members: - CFO: Jim Ciroli - CRO: Steve Figliuolo • Mortgage Originations: - Fallout - adjusted lock volume declined 6% sequentially to $6.3 billion in the 3rd quarter from $6.7 billion - Gain on loan sale margin increased 1 basis point sequentially to 83 bps on fallout - adjusted locks in the 3rd quarter • Community Banking Growth: - Average commercial loan portfolio increased 10% sequentially to $903 million in the third quarter - Average deposits increased 8% sequentially to $7.0 billion • Non-Interest Expense Containment: - Remain committed to manage and control operating expenses to generate operating profits - Core operating expense up 10%; consistent with and on track to achieve upper end of $535 - $540 million in previous guidance • Core Credit Cost Stability: - Provision, operating R&W, and Asset Resolution decreased 18.3% sequentially to $23.9 million - $3.4 million pre-tax charge and $7.0 million increase in R&W reserve related to FHA indemnifications - Adjusted for loan sales, net charge-offs were 69 basis points • CFPB Settlement: - $27.5 million borrower remediation - $10.0 million civil money penalties
6 Financial Overview Jim Ciroli, CFO
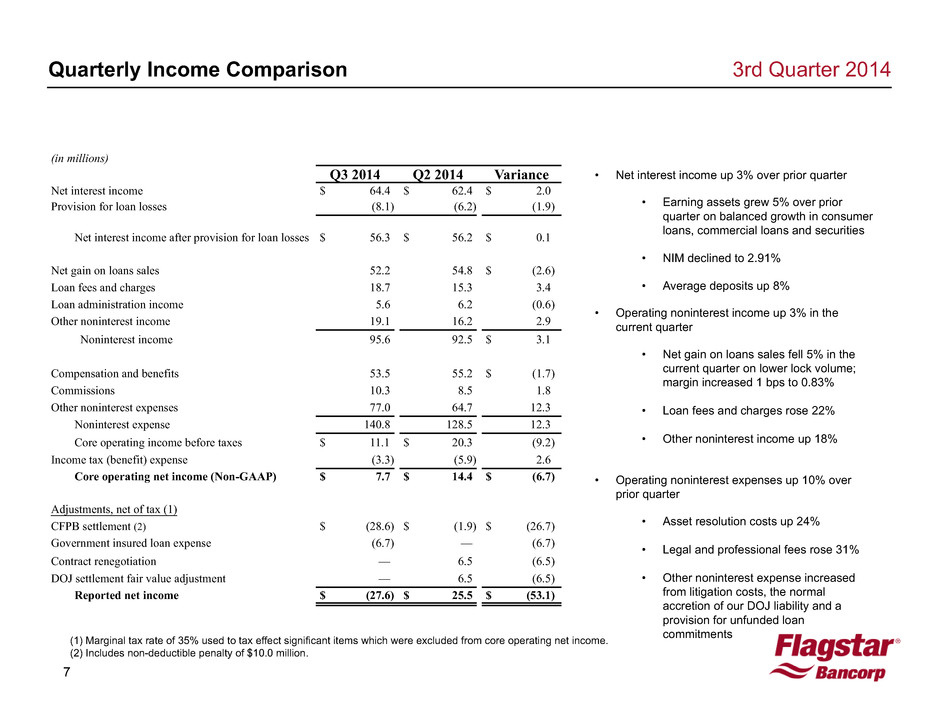
7 • Net interest income up 3% over prior quarter • Earning assets grew 5% over prior quarter on balanced growth in consumer loans, commercial loans and securities • NIM declined to 2.91% • Average deposits up 8% • Operating noninterest income up 3% in the current quarter • Net gain on loans sales fell 5% in the current quarter on lower lock volume; margin increased 1 bps to 0.83% • Loan fees and charges rose 22% • Other noninterest income up 18% • Operating noninterest expenses up 10% over prior quarter • Asset resolution costs up 24% • Legal and professional fees rose 31% • Other noninterest expense increased from litigation costs, the normal accretion of our DOJ liability and a provision for unfunded loan commitments 3rd Quarter 2014Quarterly Income Comparison (in millions) Q3 2014 Q2 2014 Variance Net interest income $ 64.4 $ 62.4 $ 2.0 Provision for loan losses (8.1) (6.2) (1.9) Net interest income after provision for loan losses $ 56.3 $ 56.2 $ 0.1 Net gain on loans sales 52.2 54.8 $ (2.6) Loan fees and charges 18.7 15.3 3.4 Loan administration income 5.6 6.2 (0.6) Other noninterest income 19.1 16.2 2.9 Noninterest income 95.6 92.5 $ 3.1 Compensation and benefits 53.5 55.2 $ (1.7) Commissions 10.3 8.5 1.8 Other noninterest expenses 77.0 64.7 12.3 Noninterest expense 140.8 128.5 12.3 Core operating income before taxes $ 11.1 $ 20.3 (9.2) Income tax (benefit) expense (3.3) (5.9) 2.6 Core operating net income (Non-GAAP) $ 7.7 $ 14.4 $ (6.7) Adjustments, net of tax (1) CFPB settlement (2) $ (28.6) $ (1.9) $ (26.7) Government insured loan expense (6.7) — (6.7) Contract renegotiation — 6.5 (6.5) DOJ settlement fair value adjustment — 6.5 (6.5) Reported net income $ (27.6) $ 25.5 $ (53.1) (1) Marginal tax rate of 35% used to tax effect significant items which were excluded from core operating net income. (2) Includes non-deductible penalty of $10.0 million.
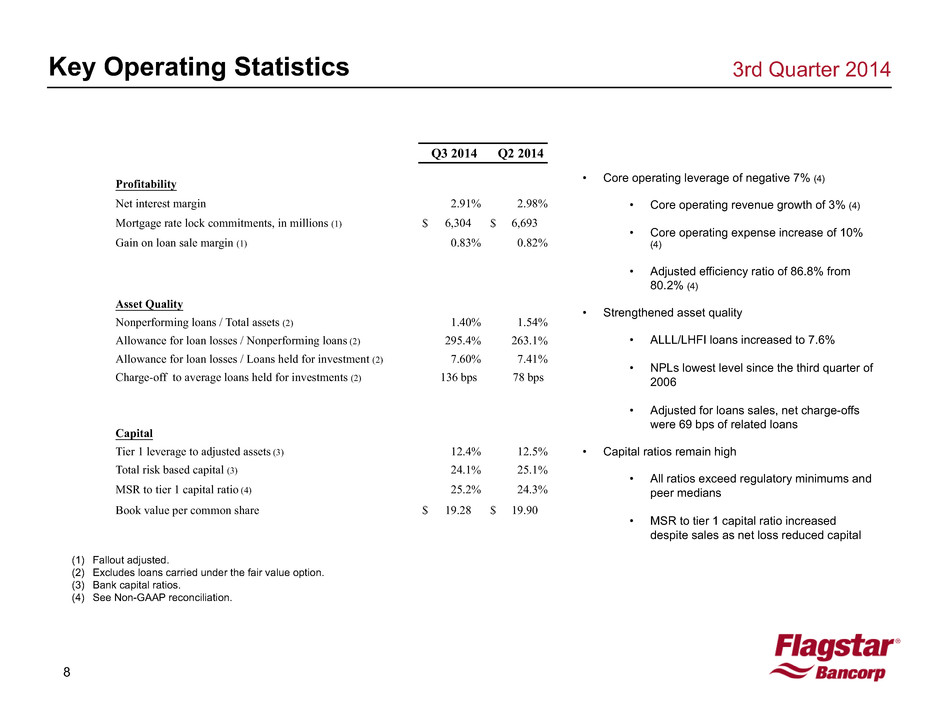
8 Key Operating Statistics 3rd Quarter 2014 • Core operating leverage of negative 7% (4) • Core operating revenue growth of 3% (4) • Core operating expense increase of 10% (4) • Adjusted efficiency ratio of 86.8% from 80.2% (4) • Strengthened asset quality • ALLL/LHFI loans increased to 7.6% • NPLs lowest level since the third quarter of 2006 • Adjusted for loans sales, net charge-offs were 69 bps of related loans • Capital ratios remain high • All ratios exceed regulatory minimums and peer medians • MSR to tier 1 capital ratio increased despite sales as net loss reduced capital Q3 2014 Q2 2014 Profitability Net interest margin 2.91% 2.98% Mortgage rate lock commitments, in millions (1) $ 6,304 $ 6,693 Gain on loan sale margin (1) 0.83% 0.82% Asset Quality Nonperforming loans / Total assets (2) 1.40% 1.54% Allowance for loan losses / Nonperforming loans (2) 295.4% 263.1% Allowance for loan losses / Loans held for investment (2) 7.60% 7.41% Charge-off to average loans held for investments (2) 136 bps 78 bps Capital Tier 1 leverage to adjusted assets (3) 12.4% 12.5% Total risk based capital (3) 24.1% 25.1% MSR to tier 1 capital ratio (4) 25.2% 24.3% Book value per common share $ 19.28 $ 19.90 (1) Fallout adjusted. (2) Excludes loans carried under the fair value option. (3) Bank capital ratios. (4) See Non-GAAP reconciliation.
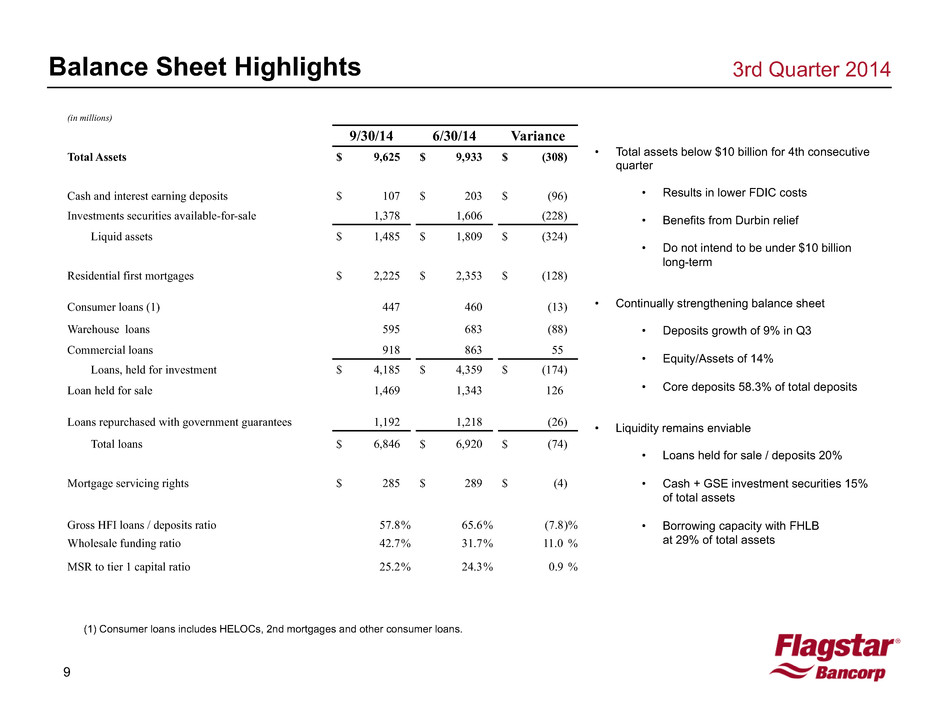
9 Balance Sheet Highlights 3rd Quarter 2014 (in millions) 9/30/14 6/30/14 Variance Total Assets $ 9,625 $ 9,933 $ (308) Cash and interest earning deposits $ 107 $ 203 $ (96) Investments securities available-for-sale 1,378 1,606 (228) Liquid assets $ 1,485 $ 1,809 $ (324) Residential first mortgages $ 2,225 $ 2,353 $ (128) Consumer loans (1) 447 460 (13) Warehouse loans 595 683 (88) Commercial loans 918 863 55 Loans, held for investment $ 4,185 $ 4,359 $ (174) Loan held for sale 1,469 1,343 126 Loans repurchased with government guarantees 1,192 1,218 (26) Total loans $ 6,846 $ 6,920 $ (74) Mortgage servicing rights $ 285 $ 289 $ (4) Gross HFI loans / deposits ratio 57.8% 65.6% (7.8)% Wholesale funding ratio 42.7% 31.7% 11.0 % MSR to tier 1 capital ratio 25.2% 24.3% 0.9 % (1) Consumer loans includes HELOCs, 2nd mortgages and other consumer loans. • Total assets below $10 billion for 4th consecutive quarter • Results in lower FDIC costs • Benefits from Durbin relief • Do not intend to be under $10 billion long-term • Continually strengthening balance sheet • Deposits growth of 9% in Q3 • Equity/Assets of 14% • Core deposits 58.3% of total deposits • Liquidity remains enviable • Loans held for sale / deposits 20% • Cash + GSE investment securities 15% of total assets • Borrowing capacity with FHLB at 29% of total assets
10 3rd Quarter 2014 Asset Quality
11 Continued Improvement in Funding Mix 3rd Quarter 2014
12 Regulatory Capital Ratios 3rd Quarter 2014 (1) Bancorp regulatory capital ratios indicate, where appropriate, the portion of each ratio comprised by TARP preferred stock.
13 Business Segment Overview Lee Smith, COO
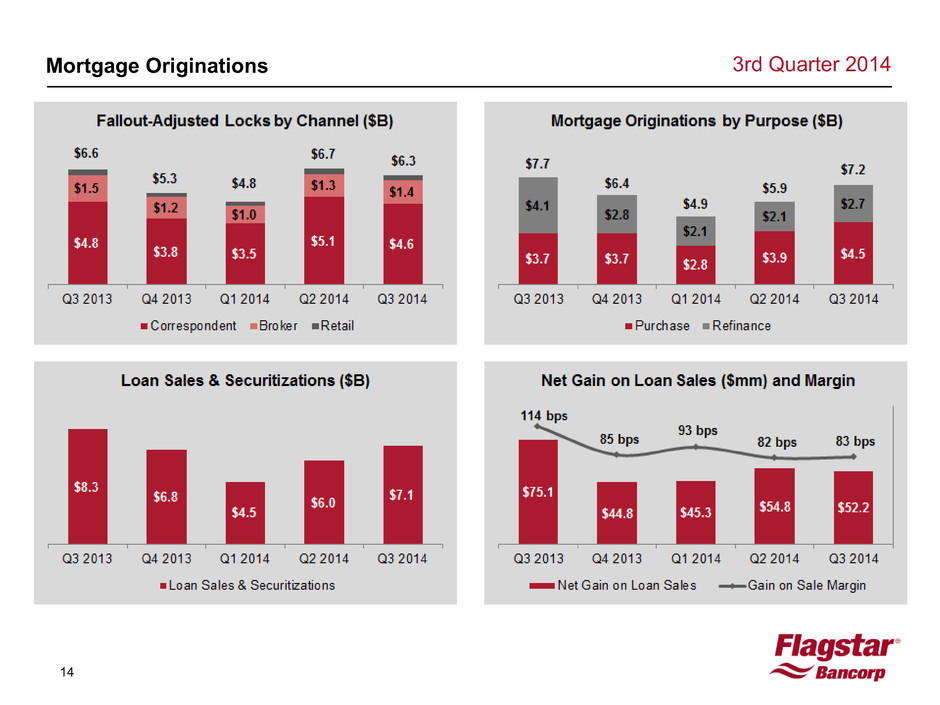
14 Mortgage Originations 3rd Quarter 2014
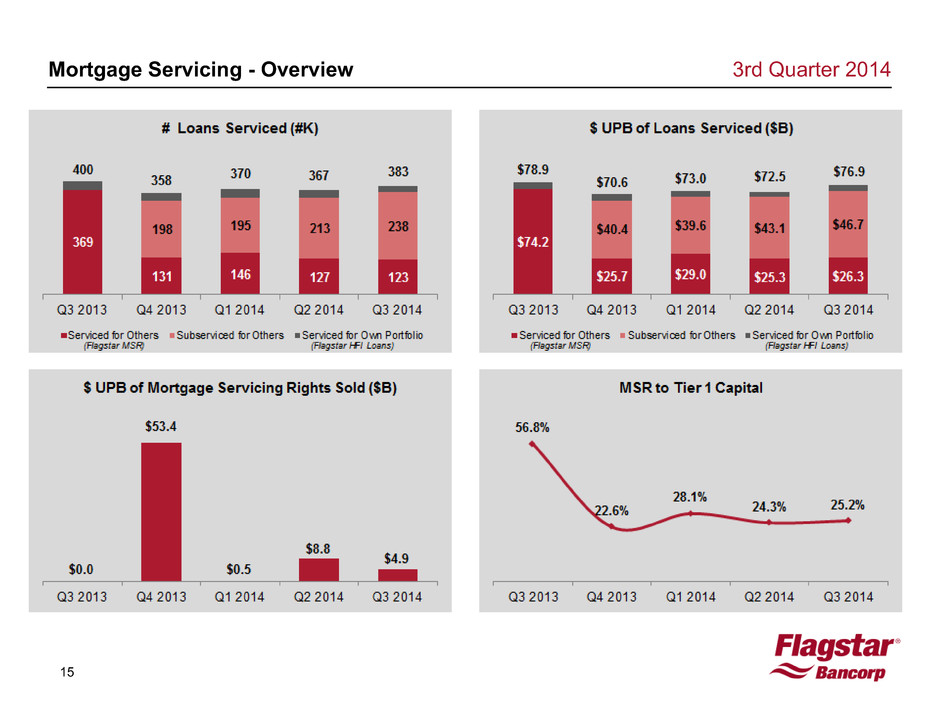
15 Mortgage Servicing - Overview 3rd Quarter 2014
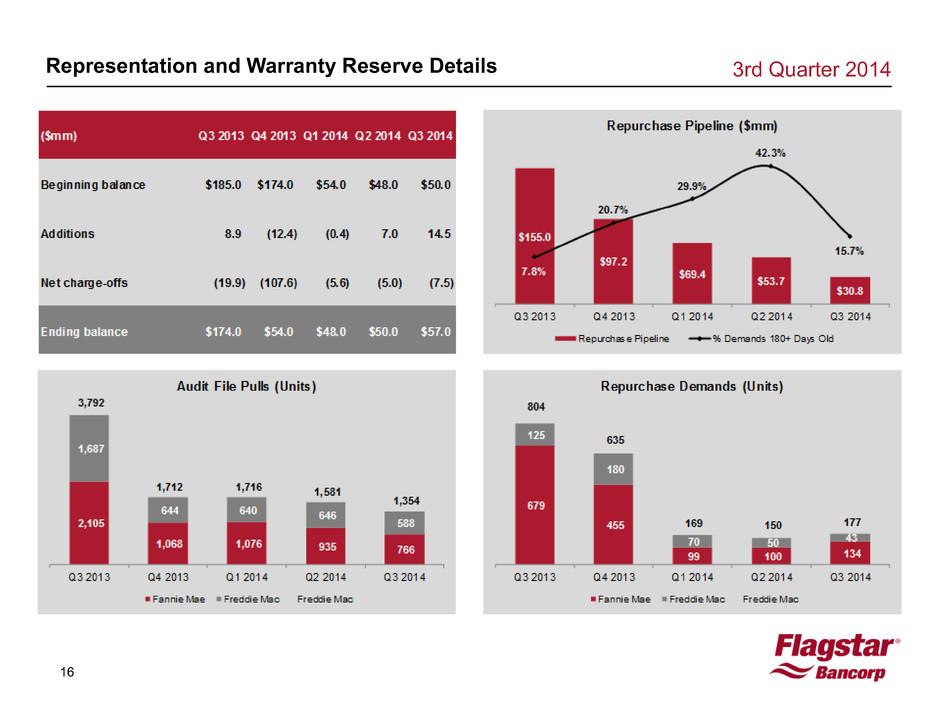
16 Representation and Warranty Reserve Details 3rd Quarter 2014 $97.2
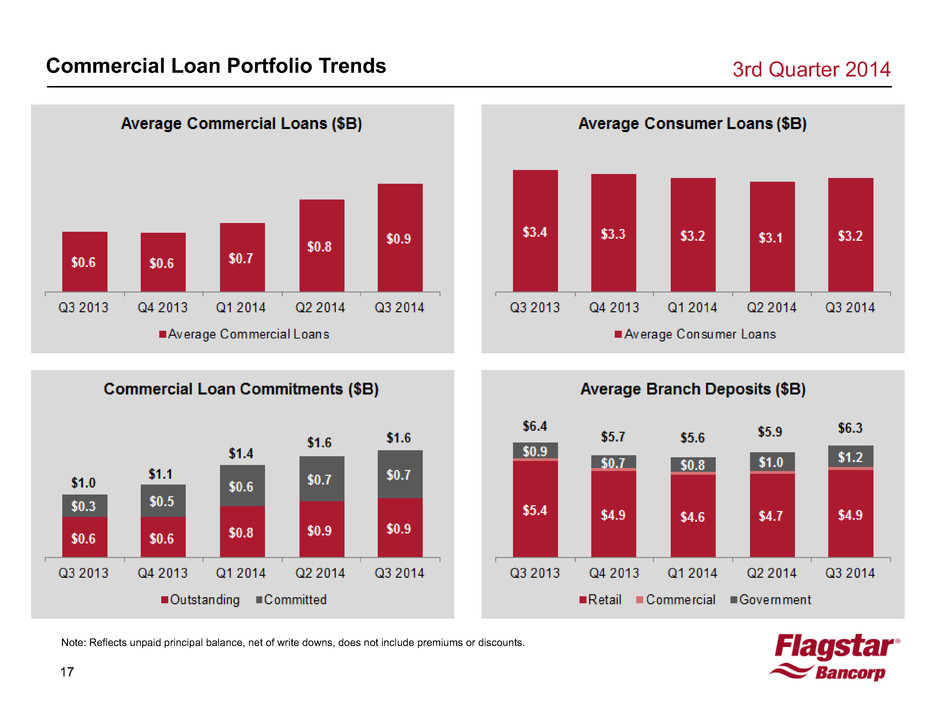
17 Commercial Loan Portfolio Trends 3rd Quarter 2014 Note: Reflects unpaid principal balance, net of write downs, does not include premiums or discounts.
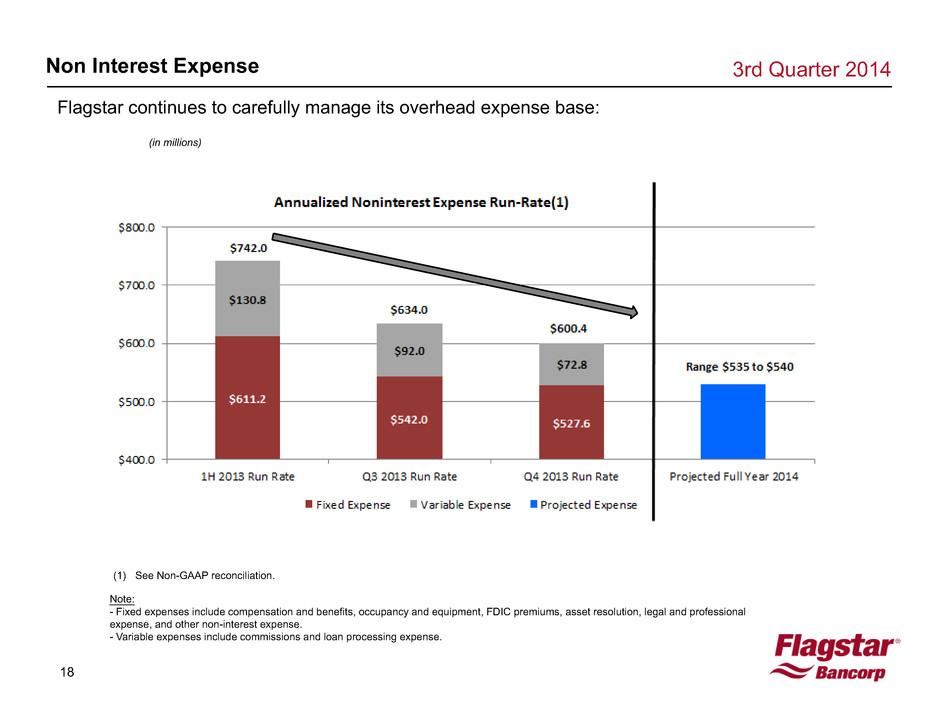
18 Non Interest Expense Note: - Fixed expenses include compensation and benefits, occupancy and equipment, FDIC premiums, asset resolution, legal and professional expense, and other non-interest expense. - Variable expenses include commissions and loan processing expense. 3rd Quarter 2014 (in millions) (1) See Non-GAAP reconciliation. Flagstar continues to carefully manage its overhead expense base:
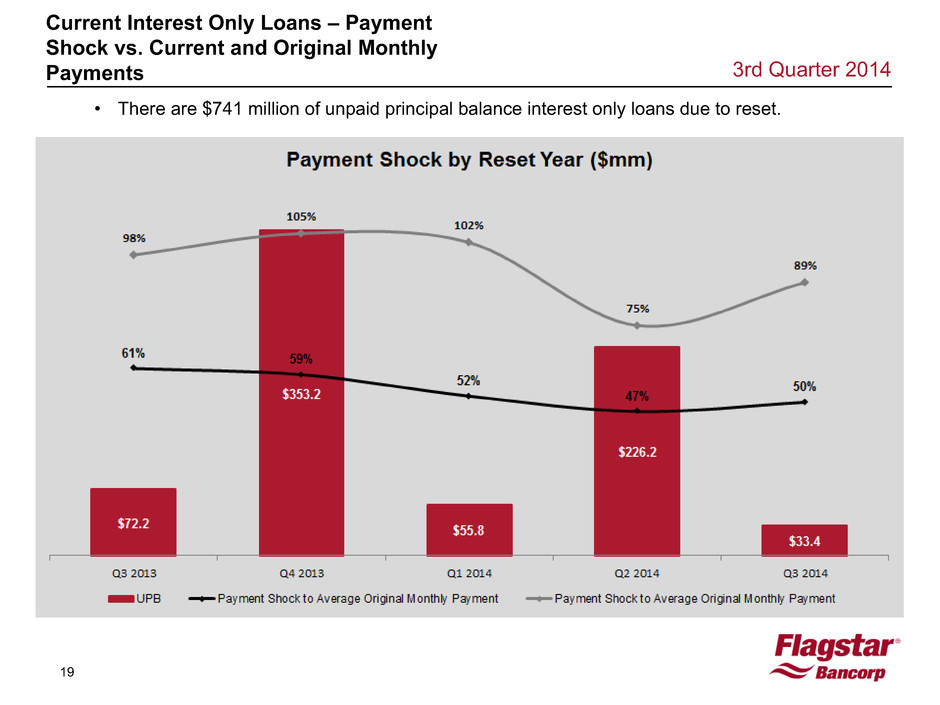
19 3rd Quarter 2014 Current Interest Only Loans – Payment Shock vs. Current and Original Monthly Payments 52% • There are $741 million of unpaid principal balance interest only loans due to reset.
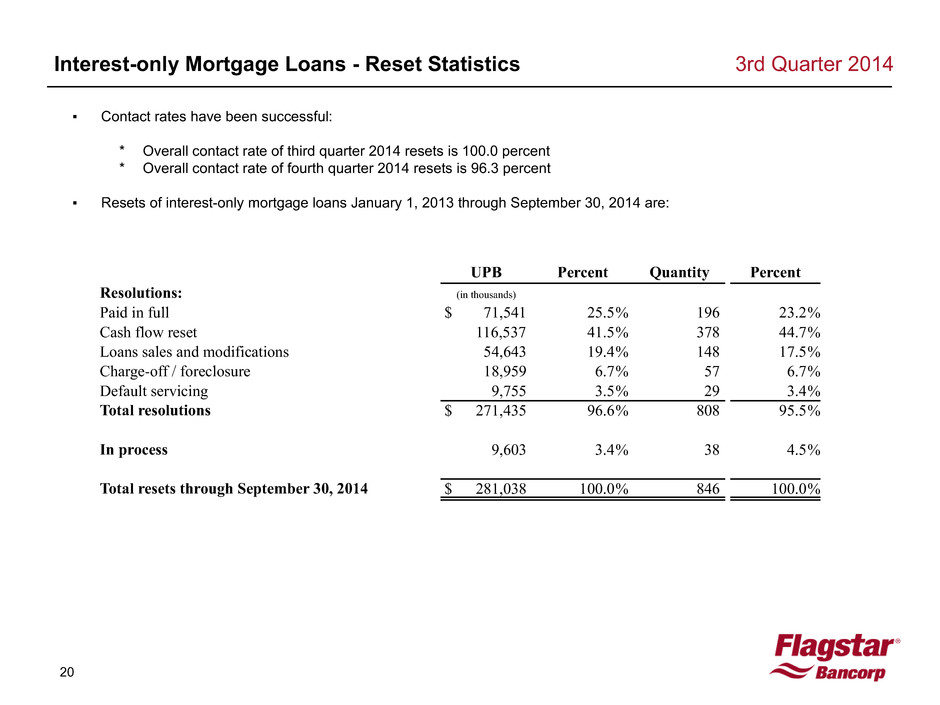
20 Interest-only Mortgage Loans - Reset Statistics 3rd Quarter 2014 ▪ Contact rates have been successful: * Overall contact rate of third quarter 2014 resets is 100.0 percent * Overall contact rate of fourth quarter 2014 resets is 96.3 percent ▪ Resets of interest-only mortgage loans January 1, 2013 through September 30, 2014 are: UPB Percent Quantity Percent Resolutions: (in thousands) Paid in full $ 71,541 25.5% 196 23.2% Cash flow reset 116,537 41.5% 378 44.7% Loans sales and modifications 54,643 19.4% 148 17.5% Charge-off / foreclosure 18,959 6.7% 57 6.7% Default servicing 9,755 3.5% 29 3.4% Total resolutions $ 271,435 96.6% 808 95.5% In process 9,603 3.4% 38 4.5% Total resets through September 30, 2014 $ 281,038 100.0% 846 100.0%
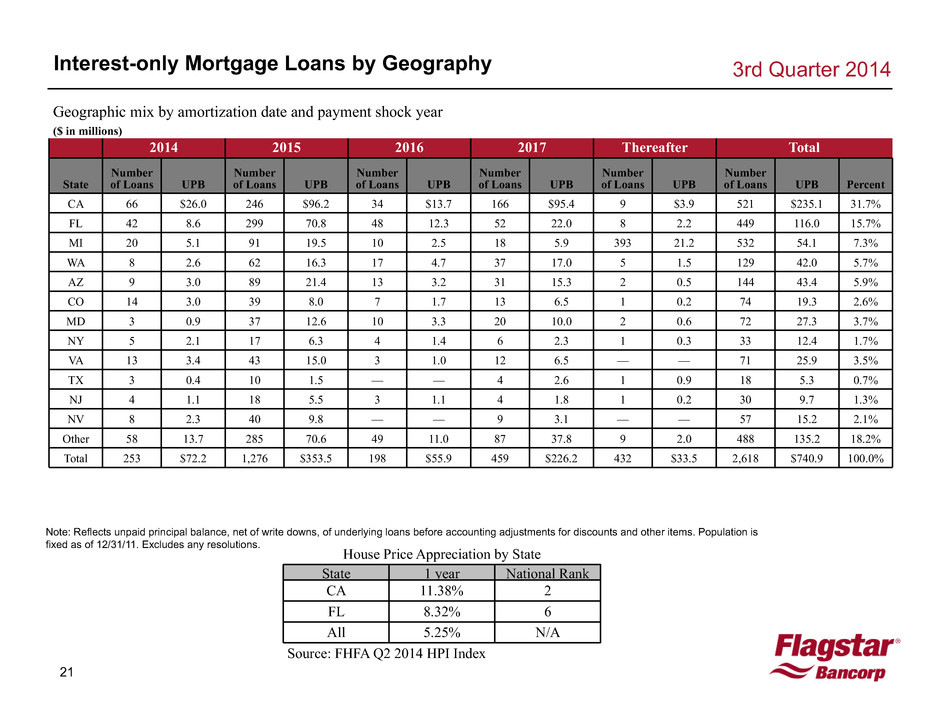
21 3rd Quarter 2014 Interest-only Mortgage Loans by Geography Geographic mix by amortization date and payment shock year ($ in millions) 2014 2015 2016 2017 Thereafter Total State Number of Loans UPB Number of Loans UPB Number of Loans UPB Number of Loans UPB Number of Loans UPB Number of Loans UPB Percent CA 66 $26.0 246 $96.2 34 $13.7 166 $95.4 9 $3.9 521 $235.1 31.7% FL 42 8.6 299 70.8 48 12.3 52 22.0 8 2.2 449 116.0 15.7% MI 20 5.1 91 19.5 10 2.5 18 5.9 393 21.2 532 54.1 7.3% WA 8 2.6 62 16.3 17 4.7 37 17.0 5 1.5 129 42.0 5.7% AZ 9 3.0 89 21.4 13 3.2 31 15.3 2 0.5 144 43.4 5.9% CO 14 3.0 39 8.0 7 1.7 13 6.5 1 0.2 74 19.3 2.6% MD 3 0.9 37 12.6 10 3.3 20 10.0 2 0.6 72 27.3 3.7% NY 5 2.1 17 6.3 4 1.4 6 2.3 1 0.3 33 12.4 1.7% VA 13 3.4 43 15.0 3 1.0 12 6.5 — — 71 25.9 3.5% TX 3 0.4 10 1.5 — — 4 2.6 1 0.9 18 5.3 0.7% NJ 4 1.1 18 5.5 3 1.1 4 1.8 1 0.2 30 9.7 1.3% NV 8 2.3 40 9.8 — — 9 3.1 — — 57 15.2 2.1% Other 58 13.7 285 70.6 49 11.0 87 37.8 9 2.0 488 135.2 18.2% Total 253 $72.2 1,276 $353.5 198 $55.9 459 $226.2 432 $33.5 2,618 $740.9 100.0% House Price Appreciation by State State 1 year National Rank CA 11.38% 2 FL 8.32% 6 All 5.25% N/A Source: FHFA Q2 2014 HPI Index Note: Reflects unpaid principal balance, net of write downs, of underlying loans before accounting adjustments for discounts and other items. Population is fixed as of 12/31/11. Excludes any resolutions.
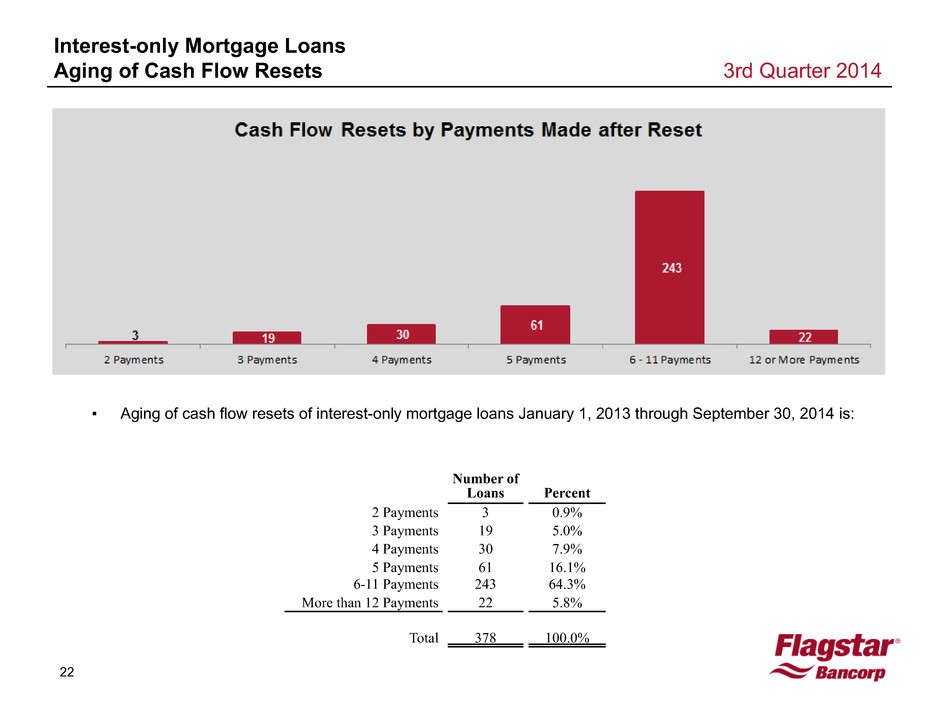
22 Interest-only Mortgage Loans Aging of Cash Flow Resets 3rd Quarter 2014 Number of Loans Percent 2 Payments 3 0.9% 3 Payments 19 5.0% 4 Payments 30 7.9% 5 Payments 61 16.1% 6-11 Payments 243 64.3% More than 12 Payments 22 5.8% Total 378 100.0% ▪ Aging of cash flow resets of interest-only mortgage loans January 1, 2013 through September 30, 2014 is:
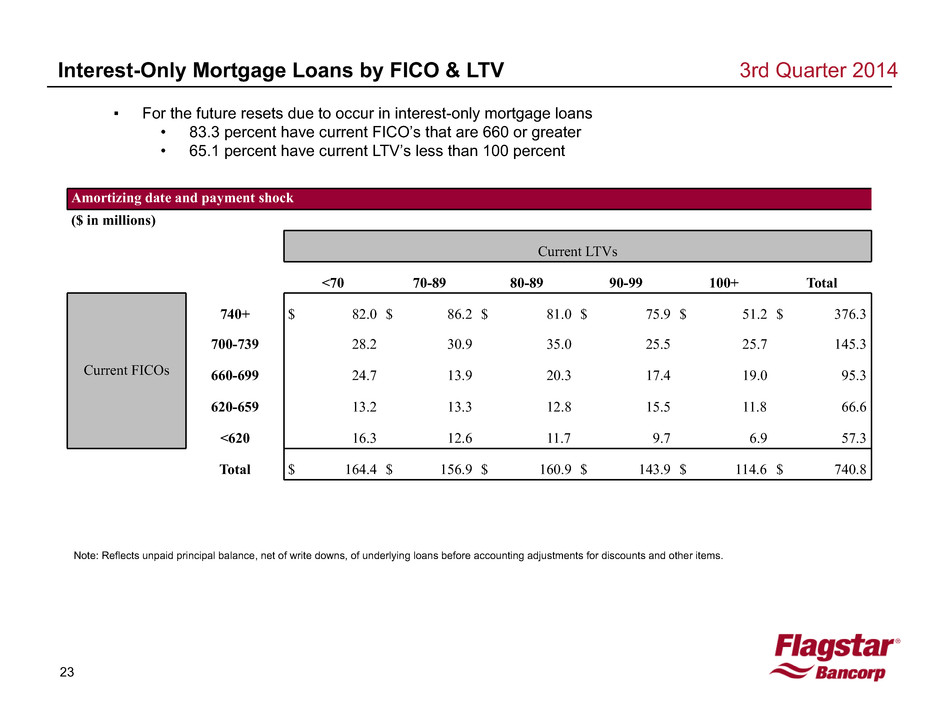
23 Interest-Only Mortgage Loans by FICO & LTV 3rd Quarter 2014 ▪ For the future resets due to occur in interest-only mortgage loans • 83.3 percent have current FICO’s that are 660 or greater • 65.1 percent have current LTV’s less than 100 percent Amortizing date and payment shock ($ in millions) Current LTVs <70 70-89 80-89 90-99 100+ Total Current FICOs 740+ $ 82.0 $ 86.2 $ 81.0 $ 75.9 $ 51.2 $ 376.3 700-739 28.2 30.9 35.0 25.5 25.7 145.3 660-699 24.7 13.9 20.3 17.4 19.0 95.3 620-659 13.2 13.3 12.8 15.5 11.8 66.6 <620 16.3 12.6 11.7 9.7 6.9 57.3 Total $ 164.4 $ 156.9 $ 160.9 $ 143.9 $ 114.6 $ 740.8 Note: Reflects unpaid principal balance, net of write downs, of underlying loans before accounting adjustments for discounts and other items.
24 Closing Remarks / Q&A Sandro DiNello, CEO

25 Guidance(1)(2) 3rd Quarter 2014 (1) See cautionary statement on slide 2 (2) All assumptions and estimates are subject to change and may impact 4th quarter outlook.

26 FBC LISTED NYSE 3rd Quarter 2014
27 3rd Quarter 2014 Appendix
28 3rd Quarter 2014 Appendix Index Credit 29 Loans & Deposits 32 Supplemental Financial Schedules 43 Non GAAP 46
29 3rd Quarter 2014 Credit Primary Credit-Related Costs 30 Asset Quality by Loan Type - Held for Investment 31
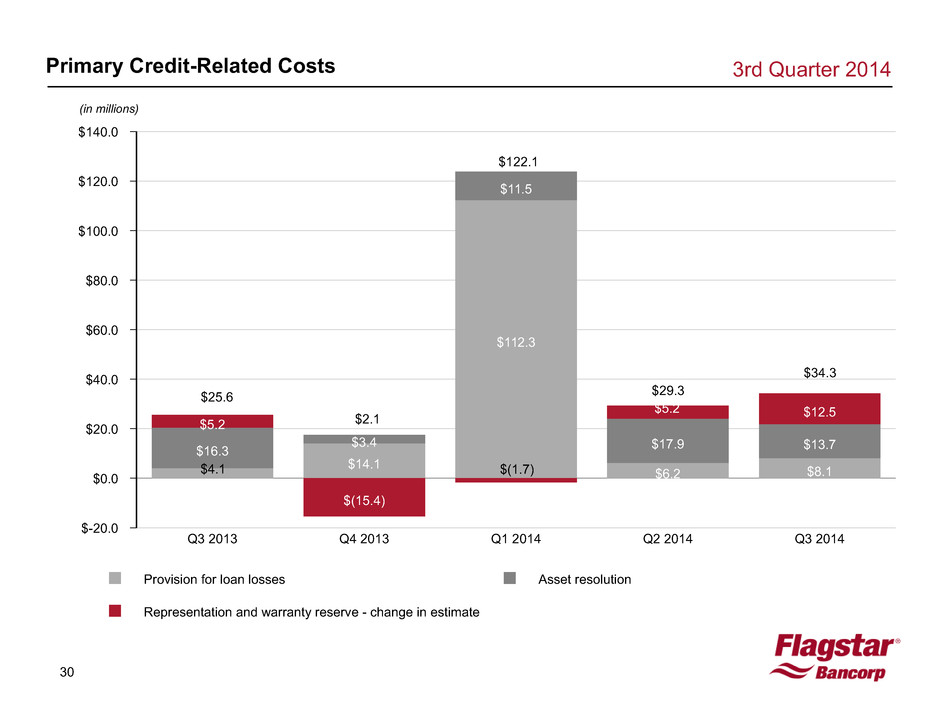
30 Provision for loan losses Asset resolution Representation and warranty reserve - change in estimate $140.0 $120.0 $100.0 $80.0 $60.0 $40.0 $20.0 $0.0 $-20.0 Q3 2013 Q4 2013 Q1 2014 Q2 2014 Q3 2014 $14.1 $112.3 $6.2 $8.1 $16.3 $3.4 $11.5 $17.9 $13.7 $5.2 $(15.4) $12.5 Primary Credit-Related Costs 3rd Quarter 2014 (in millions) $25.6 $2.1 $122.1 $28.9 $29.3 $4.1 $(1.7) $5.2 $34.3
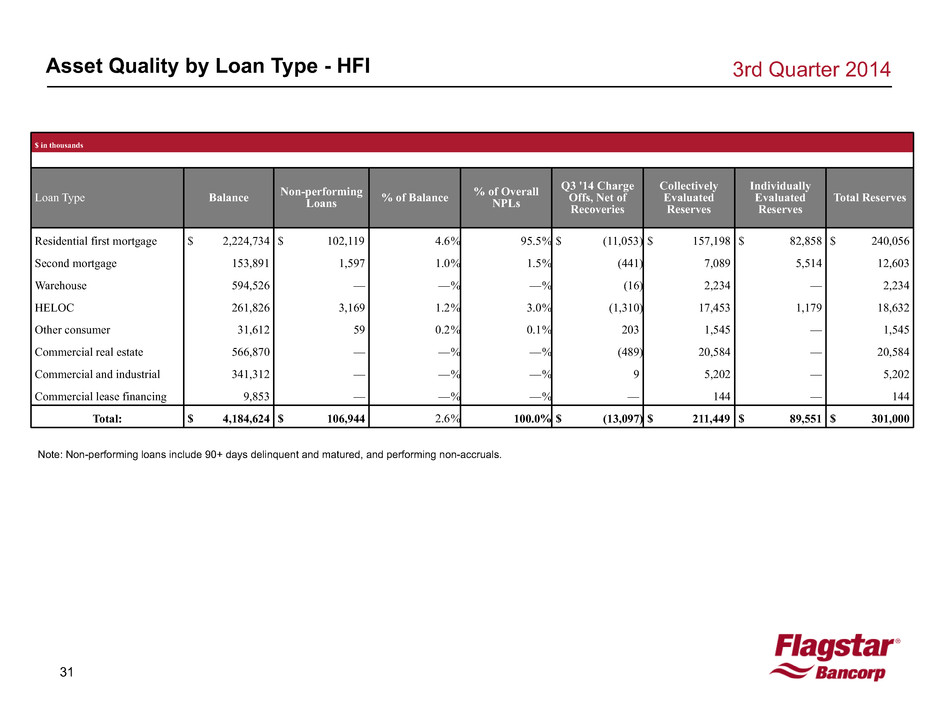
31 3rd Quarter 2014 Asset Quality by Loan Type - HFI Note: Non-performing loans include 90+ days delinquent and matured, and performing non-accruals. $ in thousands Loan Type Balance Non-performingLoans % of Balance % of Overall NPLs Q3 '14 Charge Offs, Net of Recoveries Collectively Evaluated Reserves Individually Evaluated Reserves Total Reserves Residential first mortgage $ 2,224,734 $ 102,119 4.6% 95.5% $ (11,053) $ 157,198 $ 82,858 $ 240,056 Second mortgage 153,891 1,597 1.0% 1.5% (441) 7,089 5,514 12,603 Warehouse 594,526 — —% —% (16) 2,234 — 2,234 HELOC 261,826 3,169 1.2% 3.0% (1,310) 17,453 1,179 18,632 Other consumer 31,612 59 0.2% 0.1% 203 1,545 — 1,545 Commercial real estate 566,870 — —% —% (489) 20,584 — 20,584 Commercial and industrial 341,312 — —% —% 9 5,202 — 5,202 Commercial lease financing 9,853 — —% —% — 144 — 144 Total: $ 4,184,624 $ 106,944 2.6% 100.0% $ (13,097) $ 211,449 $ 89,551 $ 301,000
32 3rd Quarter 2014 Loans and Deposits 2nd Mortgage and HELOC Portfolio Ordinated in 2009 and Prior 33 Commercial Porfolio 34 First Mortgage Portfolio - by State 35 First Mortgage Portfolio - by Vintage 36 First Mortgage Portfolio - by Original FICO 37 First Mortgage Portfolio - by Original LTV 38 First Mortgage Portfolio - by HPI Adjusted LTV 39 Non-performing Loans Held for Investment - by State 40 Non-performing Loans Held for Investment - by Vintage 41 Deposits 42
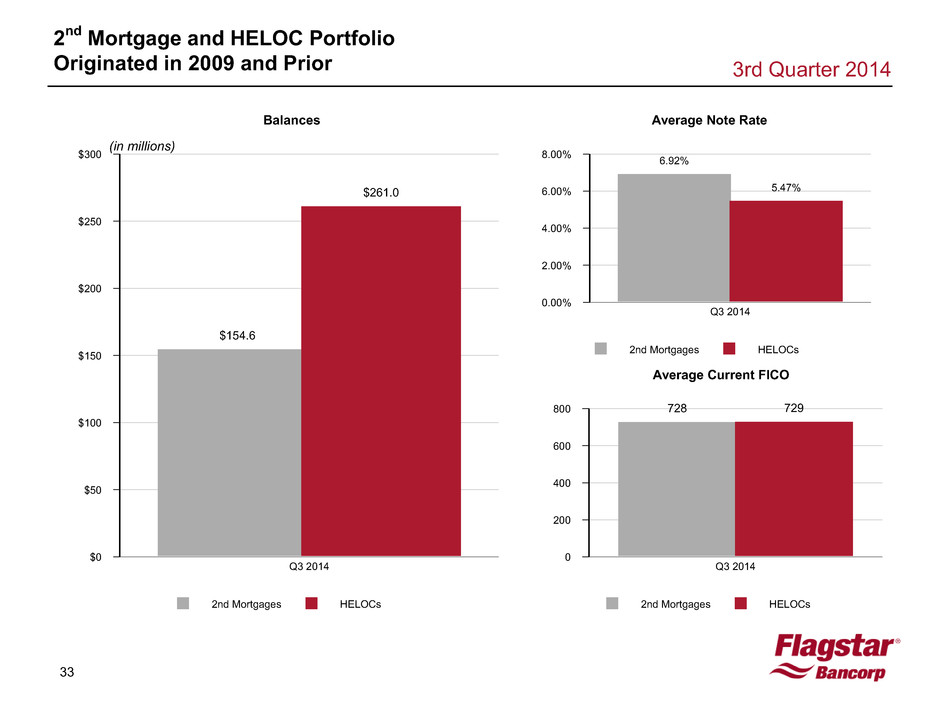
33 3rd Quarter 2014 2nd Mortgage and HELOC Portfolio Originated in 2009 and Prior (in millions) 2nd Mortgages HELOCs Average Current FICO 800 600 400 200 0 Q3 2014 728 729 2nd Mortgages HELOCs Balances $300 $250 $200 $150 $100 $50 $0 Q3 2014 $154.6 $261.0 2nd Mortgages HELOCs Average Note Rate 8.00% 6.00% 4.00% 2.00% 0.00% Q3 2014 6.92% 5.47%
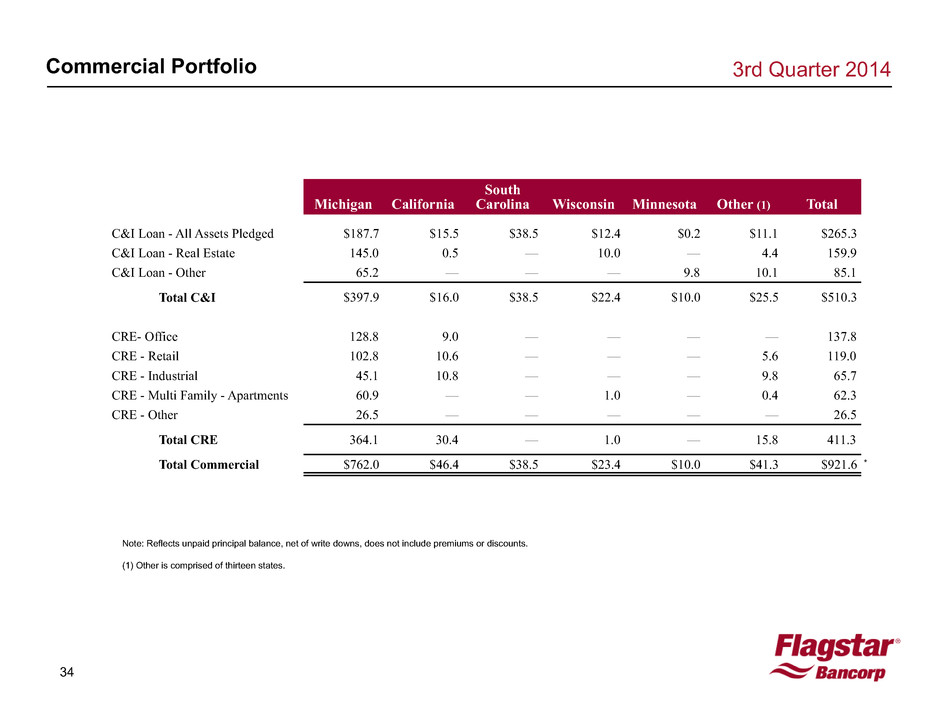
34 Commercial Portfolio 3rd Quarter 2014 Michigan California South Carolina Wisconsin Minnesota Other (1) Total C&I Loan - All Assets Pledged $187.7 $15.5 $38.5 $12.4 $0.2 $11.1 $265.3 C&I Loan - Real Estate 145.0 0.5 — 10.0 — 4.4 159.9 C&I Loan - Other 65.2 — — — 9.8 10.1 85.1 Total C&I $397.9 $16.0 $38.5 $22.4 $10.0 $25.5 $510.3 CRE- Office 128.8 9.0 — — — — 137.8 CRE - Retail 102.8 10.6 — — — 5.6 119.0 CRE - Industrial 45.1 10.8 — — — 9.8 65.7 CRE - Multi Family - Apartments 60.9 — — 1.0 — 0.4 62.3 CRE - Other 26.5 — — — — — 26.5 —Total CRE 364.1 30.4 — 1.0 — 15.8 411.3 Total Commercial $762.0 $46.4 $38.5 $23.4 $10.0 $41.3 $921.6 Note: Reflects unpaid principal balance, net of write downs, does not include premiums or discounts. (1) Other is comprised of thirteen states. *
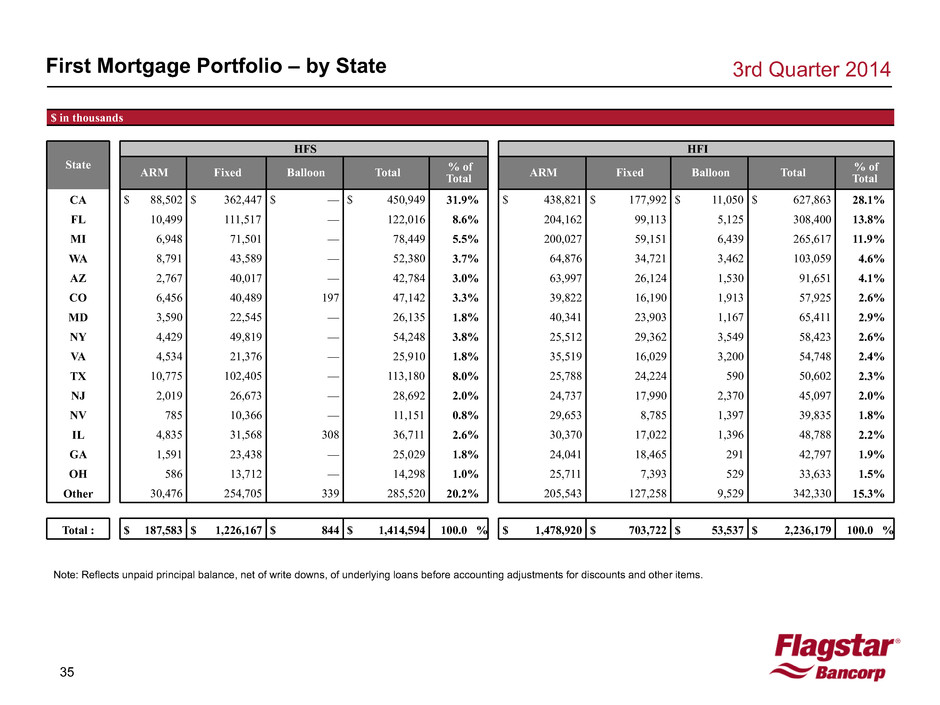
35 3rd Quarter 2014 First Mortgage Portfolio – by State Note: Reflects unpaid principal balance, net of write downs, of underlying loans before accounting adjustments for discounts and other items. $ in thousands State HFS HFI ARM Fixed Balloon Total % ofTotal ARM Fixed Balloon Total % of Total CA $ 88,502 $ 362,447 $ — $ 450,949 31.9% $ 438,821 $ 177,992 $ 11,050 $ 627,863 28.1% FL 10,499 111,517 — 122,016 8.6% 204,162 99,113 5,125 308,400 13.8% MI 6,948 71,501 — 78,449 5.5% 200,027 59,151 6,439 265,617 11.9% WA 8,791 43,589 — 52,380 3.7% 64,876 34,721 3,462 103,059 4.6% AZ 2,767 40,017 — 42,784 3.0% 63,997 26,124 1,530 91,651 4.1% CO 6,456 40,489 197 47,142 3.3% 39,822 16,190 1,913 57,925 2.6% MD 3,590 22,545 — 26,135 1.8% 40,341 23,903 1,167 65,411 2.9% NY 4,429 49,819 — 54,248 3.8% 25,512 29,362 3,549 58,423 2.6% VA 4,534 21,376 — 25,910 1.8% 35,519 16,029 3,200 54,748 2.4% TX 10,775 102,405 — 113,180 8.0% 25,788 24,224 590 50,602 2.3% NJ 2,019 26,673 — 28,692 2.0% 24,737 17,990 2,370 45,097 2.0% NV 785 10,366 — 11,151 0.8% 29,653 8,785 1,397 39,835 1.8% IL 4,835 31,568 308 36,711 2.6% 30,370 17,022 1,396 48,788 2.2% GA 1,591 23,438 — 25,029 1.8% 24,041 18,465 291 42,797 1.9% OH 586 13,712 — 14,298 1.0% 25,711 7,393 529 33,633 1.5% Other 30,476 254,705 339 285,520 20.2% 205,543 127,258 9,529 342,330 15.3% Total : $ 187,583 $ 1,226,167 $ 844 $ 1,414,594 100.0 % $ 1,478,920 $ 703,722 $ 53,537 $ 2,236,179 100.0 %
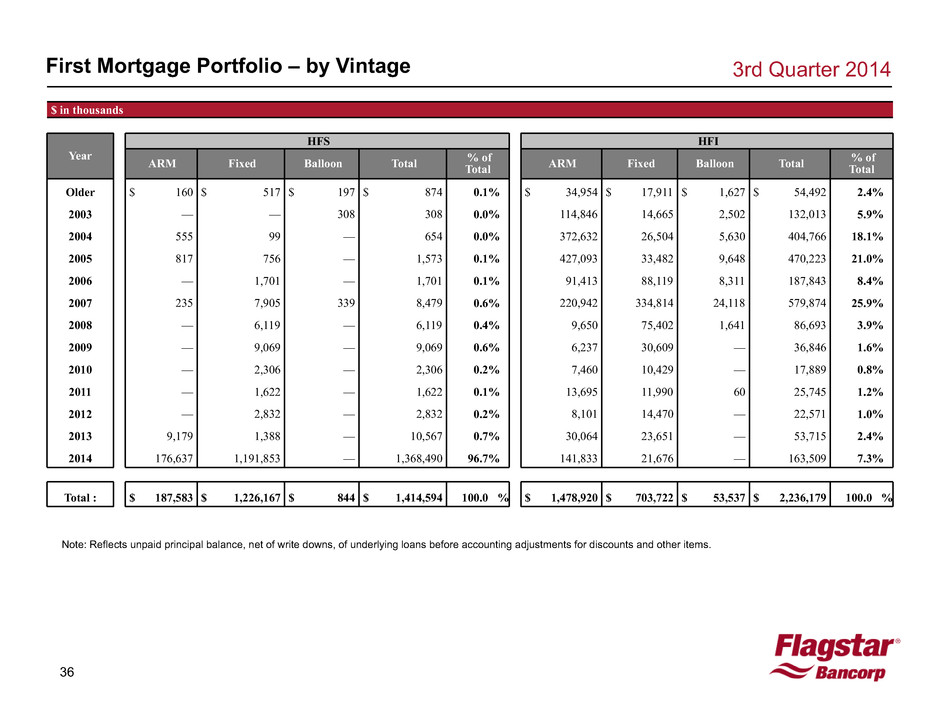
36 3rd Quarter 2014 First Mortgage Portfolio – by Vintage Note: Reflects unpaid principal balance, net of write downs, of underlying loans before accounting adjustments for discounts and other items. $ in thousands Year HFS HFI ARM Fixed Balloon Total % ofTotal ARM Fixed Balloon Total % of Total Older $ 160 $ 517 $ 197 $ 874 0.1% $ 34,954 $ 17,911 $ 1,627 $ 54,492 2.4% 2003 — — 308 308 0.0% 114,846 14,665 2,502 132,013 5.9% 2004 555 99 — 654 0.0% 372,632 26,504 5,630 404,766 18.1% 2005 817 756 — 1,573 0.1% 427,093 33,482 9,648 470,223 21.0% 2006 — 1,701 — 1,701 0.1% 91,413 88,119 8,311 187,843 8.4% 2007 235 7,905 339 8,479 0.6% 220,942 334,814 24,118 579,874 25.9% 2008 — 6,119 — 6,119 0.4% 9,650 75,402 1,641 86,693 3.9% 2009 — 9,069 — 9,069 0.6% 6,237 30,609 — 36,846 1.6% 2010 — 2,306 — 2,306 0.2% 7,460 10,429 — 17,889 0.8% 2011 — 1,622 — 1,622 0.1% 13,695 11,990 60 25,745 1.2% 2012 — 2,832 — 2,832 0.2% 8,101 14,470 — 22,571 1.0% 2013 9,179 1,388 — 10,567 0.7% 30,064 23,651 — 53,715 2.4% 2014 176,637 1,191,853 — 1,368,490 96.7% 141,833 21,676 — 163,509 7.3% Total : $ 187,583 $ 1,226,167 $ 844 $ 1,414,594 100.0 % $ 1,478,920 $ 703,722 $ 53,537 $ 2,236,179 100.0 %
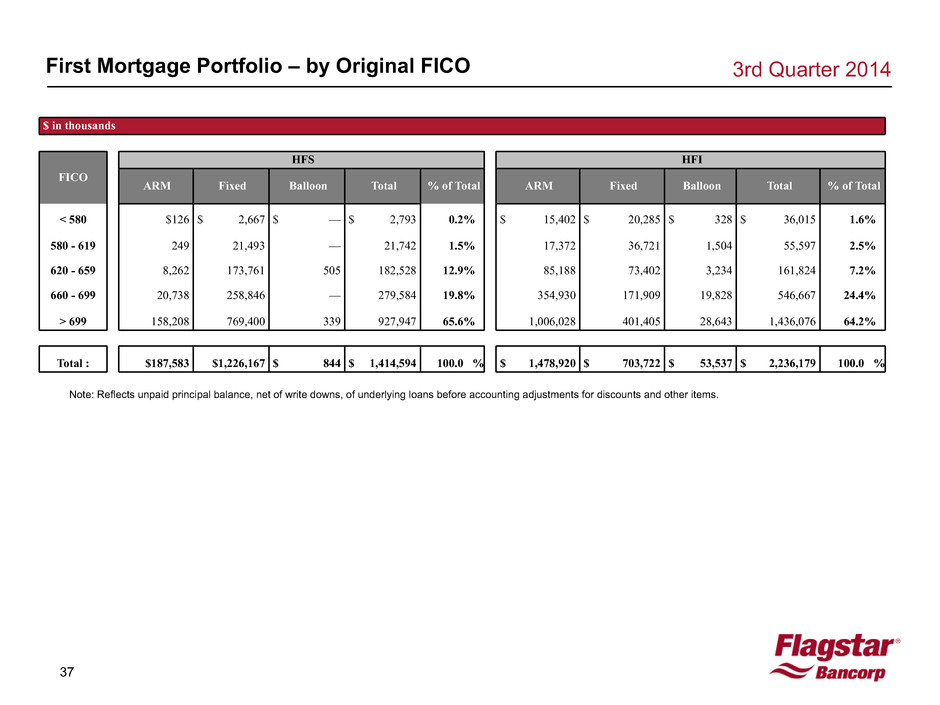
37 3rd Quarter 2014 First Mortgage Portfolio – by Original FICO Note: Reflects unpaid principal balance, net of write downs, of underlying loans before accounting adjustments for discounts and other items. $ in thousands FICO HFS HFI ARM Fixed Balloon Total % of Total ARM Fixed Balloon Total % of Total < 580 $126 $ 2,667 $ — $ 2,793 0.2% $ 15,402 $ 20,285 $ 328 $ 36,015 1.6% 580 - 619 249 21,493 — 21,742 1.5% 17,372 36,721 1,504 55,597 2.5% 620 - 659 8,262 173,761 505 182,528 12.9% 85,188 73,402 3,234 161,824 7.2% 660 - 699 20,738 258,846 — 279,584 19.8% 354,930 171,909 19,828 546,667 24.4% > 699 158,208 769,400 339 927,947 65.6% 1,006,028 401,405 28,643 1,436,076 64.2% Total : $187,583 $1,226,167 $ 844 $ 1,414,594 100.0 % $ 1,478,920 $ 703,722 $ 53,537 $ 2,236,179 100.0 %
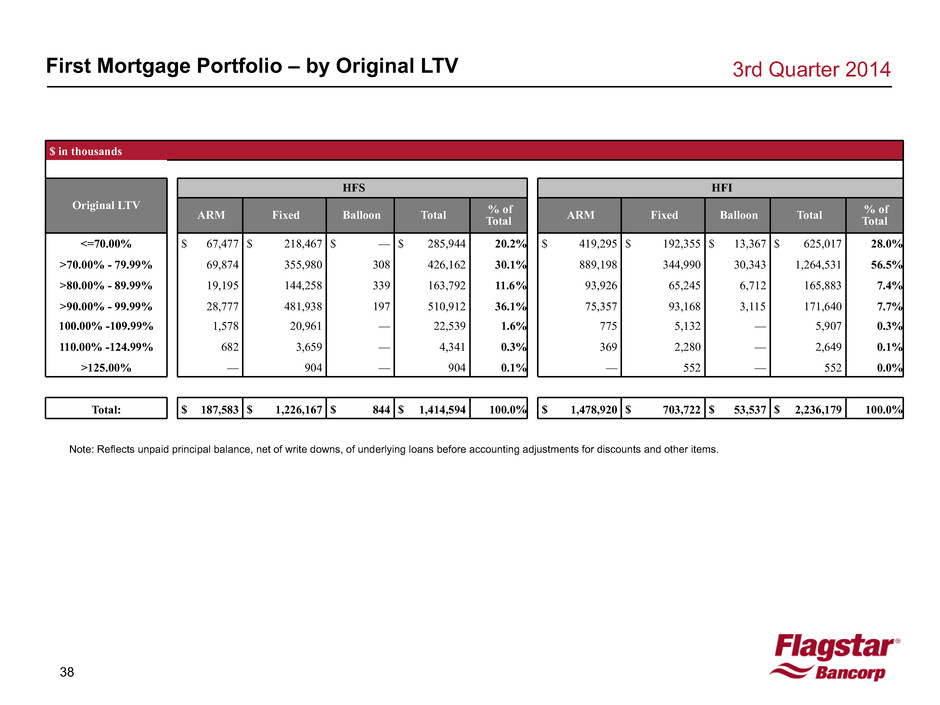
38 3rd Quarter 2014 First Mortgage Portfolio – by Original LTV Note: Reflects unpaid principal balance, net of write downs, of underlying loans before accounting adjustments for discounts and other items. $ in thousands Original LTV HFS HFI ARM Fixed Balloon Total % ofTotal ARM Fixed Balloon Total % of Total <=70.00% $ 67,477 $ 218,467 $ — $ 285,944 20.2% $ 419,295 $ 192,355 $ 13,367 $ 625,017 28.0% >70.00% - 79.99% 69,874 355,980 308 426,162 30.1% 889,198 344,990 30,343 1,264,531 56.5% >80.00% - 89.99% 19,195 144,258 339 163,792 11.6% 93,926 65,245 6,712 165,883 7.4% >90.00% - 99.99% 28,777 481,938 197 510,912 36.1% 75,357 93,168 3,115 171,640 7.7% 100.00% -109.99% 1,578 20,961 — 22,539 1.6% 775 5,132 — 5,907 0.3% 110.00% -124.99% 682 3,659 — 4,341 0.3% 369 2,280 — 2,649 0.1% >125.00% — 904 — 904 0.1% — 552 — 552 0.0% Total: $ 187,583 $ 1,226,167 $ 844 $ 1,414,594 100.0% $ 1,478,920 $ 703,722 $ 53,537 $ 2,236,179 100.0%
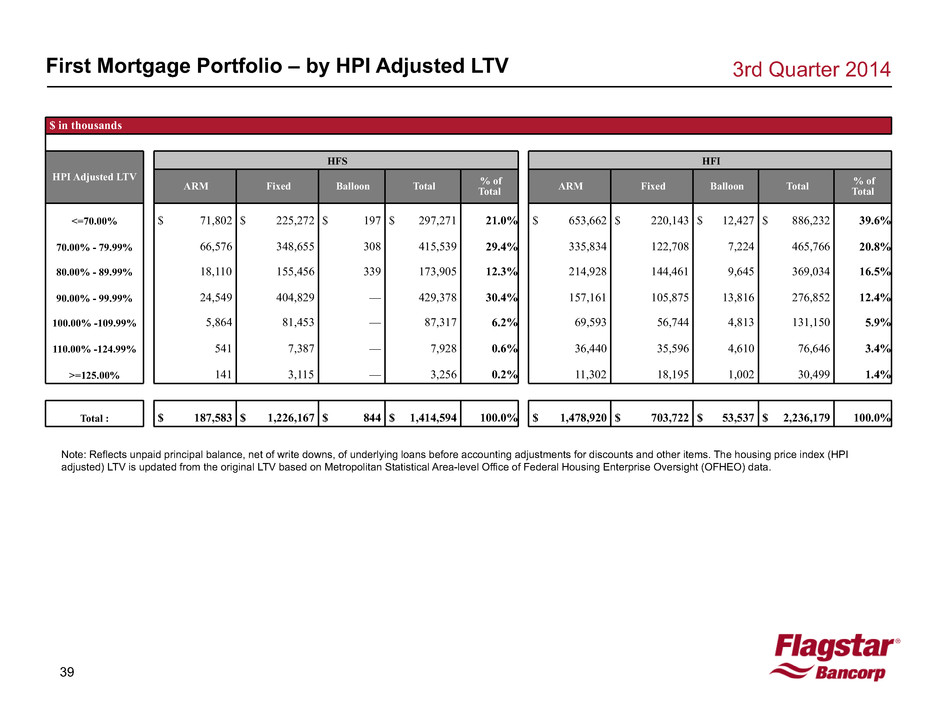
39 3rd Quarter 2014 First Mortgage Portfolio – by HPI Adjusted LTV Note: Reflects unpaid principal balance, net of write downs, of underlying loans before accounting adjustments for discounts and other items. The housing price index (HPI adjusted) LTV is updated from the original LTV based on Metropolitan Statistical Area-level Office of Federal Housing Enterprise Oversight (OFHEO) data. $ in thousands HPI Adjusted LTV HFS HFI ARM Fixed Balloon Total % ofTotal ARM Fixed Balloon Total % of Total <=70.00% $ 71,802 $ 225,272 $ 197 $ 297,271 21.0% $ 653,662 $ 220,143 $ 12,427 $ 886,232 39.6% 70.00% - 79.99% 66,576 348,655 308 415,539 29.4% 335,834 122,708 7,224 465,766 20.8% 80.00% - 89.99% 18,110 155,456 339 173,905 12.3% 214,928 144,461 9,645 369,034 16.5% 90.00% - 99.99% 24,549 404,829 — 429,378 30.4% 157,161 105,875 13,816 276,852 12.4% 100.00% -109.99% 5,864 81,453 — 87,317 6.2% 69,593 56,744 4,813 131,150 5.9% 110.00% -124.99% 541 7,387 — 7,928 0.6% 36,440 35,596 4,610 76,646 3.4% >=125.00% 141 3,115 — 3,256 0.2% 11,302 18,195 1,002 30,499 1.4% Total : $ 187,583 $ 1,226,167 $ 844 $ 1,414,594 100.0% $ 1,478,920 $ 703,722 $ 53,537 $ 2,236,179 100.0%
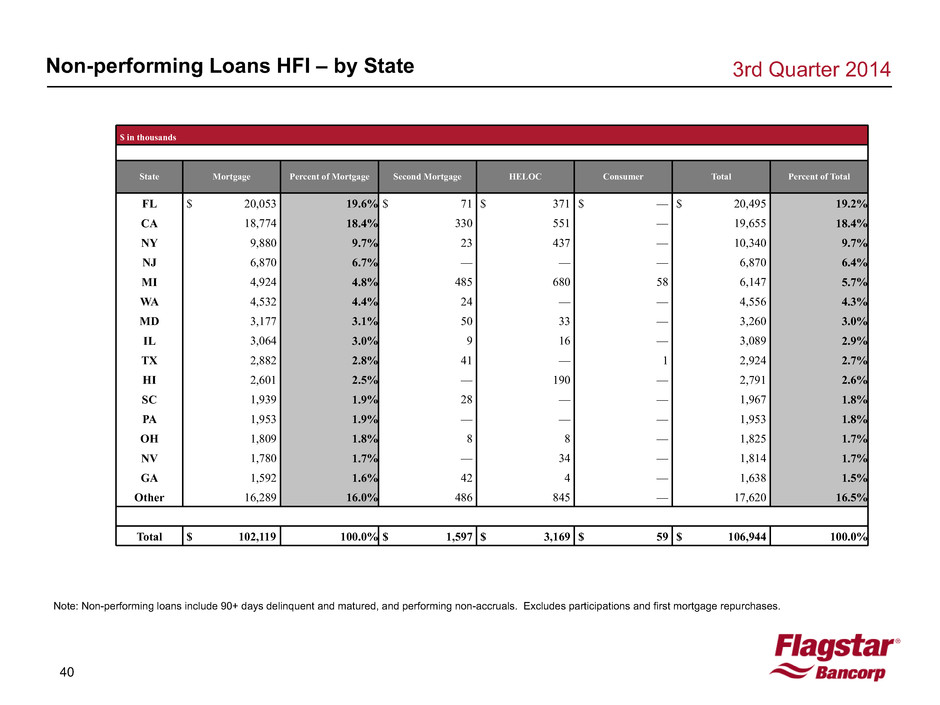
40 3rd Quarter 2014 Non-performing Loans HFI – by State Note: Non-performing loans include 90+ days delinquent and matured, and performing non-accruals. Excludes participations and first mortgage repurchases. $ in thousands State Mortgage Percent of Mortgage Second Mortgage HELOC Consumer Total Percent of Total FL $ 20,053 19.6% $ 71 $ 371 $ — $ 20,495 19.2% CA 18,774 18.4% 330 551 — 19,655 18.4% NY 9,880 9.7% 23 437 — 10,340 9.7% NJ 6,870 6.7% — — — 6,870 6.4% MI 4,924 4.8% 485 680 58 6,147 5.7% WA 4,532 4.4% 24 — — 4,556 4.3% MD 3,177 3.1% 50 33 — 3,260 3.0% IL 3,064 3.0% 9 16 — 3,089 2.9% TX 2,882 2.8% 41 — 1 2,924 2.7% HI 2,601 2.5% — 190 — 2,791 2.6% SC 1,939 1.9% 28 — — 1,967 1.8% PA 1,953 1.9% — — — 1,953 1.8% OH 1,809 1.8% 8 8 — 1,825 1.7% NV 1,780 1.7% — 34 — 1,814 1.7% GA 1,592 1.6% 42 4 — 1,638 1.5% Other 16,289 16.0% 486 845 — 17,620 16.5% Total $ 102,119 100.0% $ 1,597 $ 3,169 $ 59 $ 106,944 100.0%
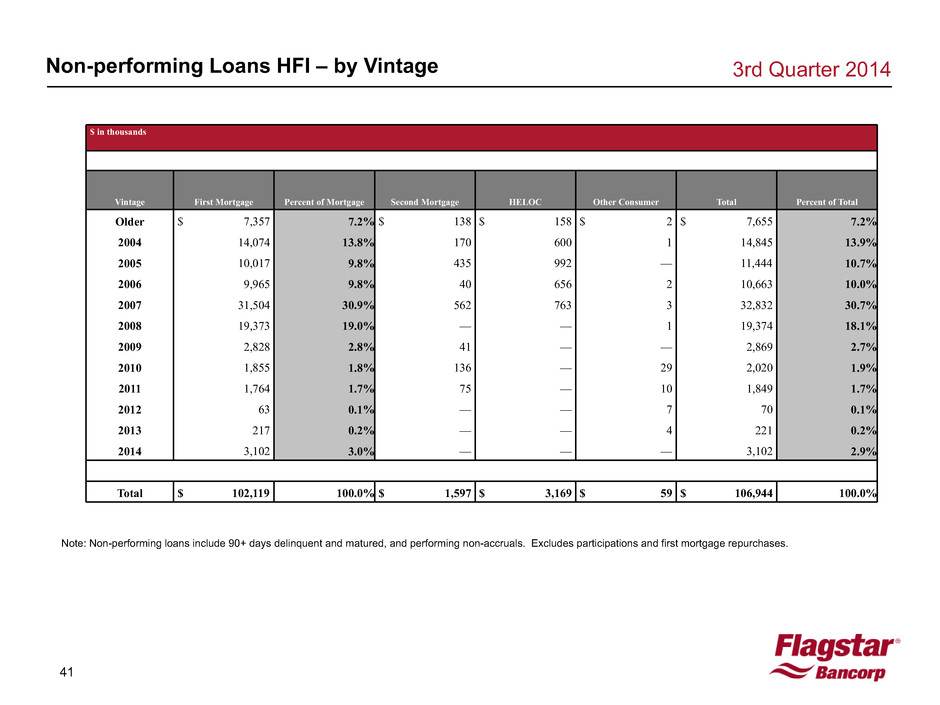
41 3rd Quarter 2014 Non-performing Loans HFI – by Vintage Note: Non-performing loans include 90+ days delinquent and matured, and performing non-accruals. Excludes participations and first mortgage repurchases. $ in thousands Vintage First Mortgage Percent of Mortgage Second Mortgage HELOC Other Consumer Total Percent of Total Older $ 7,357 7.2% $ 138 $ 158 $ 2 $ 7,655 7.2% 2004 14,074 13.8% 170 600 1 14,845 13.9% 2005 10,017 9.8% 435 992 — 11,444 10.7% 2006 9,965 9.8% 40 656 2 10,663 10.0% 2007 31,504 30.9% 562 763 3 32,832 30.7% 2008 19,373 19.0% — — 1 19,374 18.1% 2009 2,828 2.8% 41 — — 2,869 2.7% 2010 1,855 1.8% 136 — 29 2,020 1.9% 2011 1,764 1.7% 75 — 10 1,849 1.7% 2012 63 0.1% — — 7 70 0.1% 2013 217 0.2% — — 4 221 0.2% 2014 3,102 3.0% — — — 3,102 2.9% Total $ 102,119 100.0% $ 1,597 $ 3,169 $ 59 $ 106,944 100.0%
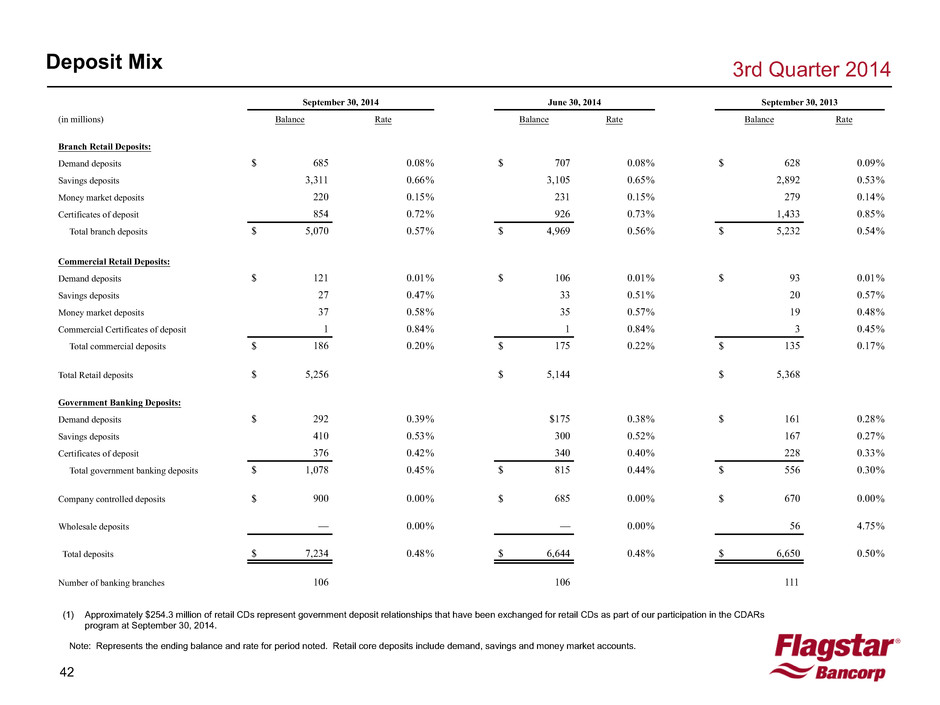
42 3rd Quarter 2014 Deposit Mix Note: Represents the ending balance and rate for period noted. Retail core deposits include demand, savings and money market accounts. (1) Approximately $254.3 million of retail CDs represent government deposit relationships that have been exchanged for retail CDs as part of our participation in the CDARs program at September 30, 2014. September 30, 2014 June 30, 2014 September 30, 2013 (in millions) Balance Rate Balance Rate Balance Rate Branch Retail Deposits: Demand deposits $ 685 0.08% $ 707 0.08% $ 628 0.09% Savings deposits 3,311 0.66% 3,105 0.65% 2,892 0.53% Money market deposits 220 0.15% 231 0.15% 279 0.14% Certificates of deposit 854 0.72% 926 0.73% 1,433 0.85% Total branch deposits $ 5,070 0.57% $ 4,969 0.56% $ 5,232 0.54% Commercial Retail Deposits: Demand deposits $ 121 0.01% $ 106 0.01% $ 93 0.01% Savings deposits 27 0.47% 33 0.51% 20 0.57% Money market deposits 37 0.58% 35 0.57% 19 0.48% Commercial Certificates of deposit 1 0.84% 1 0.84% 3 0.45% Total commercial deposits $ 186 0.20% $ 175 0.22% $ 135 0.17% Total Retail deposits $ 5,256 $ 5,144 $ 5,368 Government Banking Deposits: Demand deposits $ 292 0.39% $175 0.38% $ 161 0.28% Savings deposits 410 0.53% 300 0.52% 167 0.27% Certificates of deposit 376 0.42% 340 0.40% 228 0.33% Total government banking deposits $ 1,078 0.45% $ 815 0.44% $ 556 0.30% Company controlled deposits $ 900 0.00% $ 685 0.00% $ 670 0.00% Wholesale deposits — 0.00% — 0.00% 56 4.75% Total deposits $ 7,234 0.48% $ 6,644 0.48% $ 6,650 0.50% Number of banking branches 106 106 111
43 3rd Quarter 2014 Supplemental Financial Schedules Net Income Bridge - Q2 2014 to Q3 2014 44 Net Interest Income and Margin Trends 45
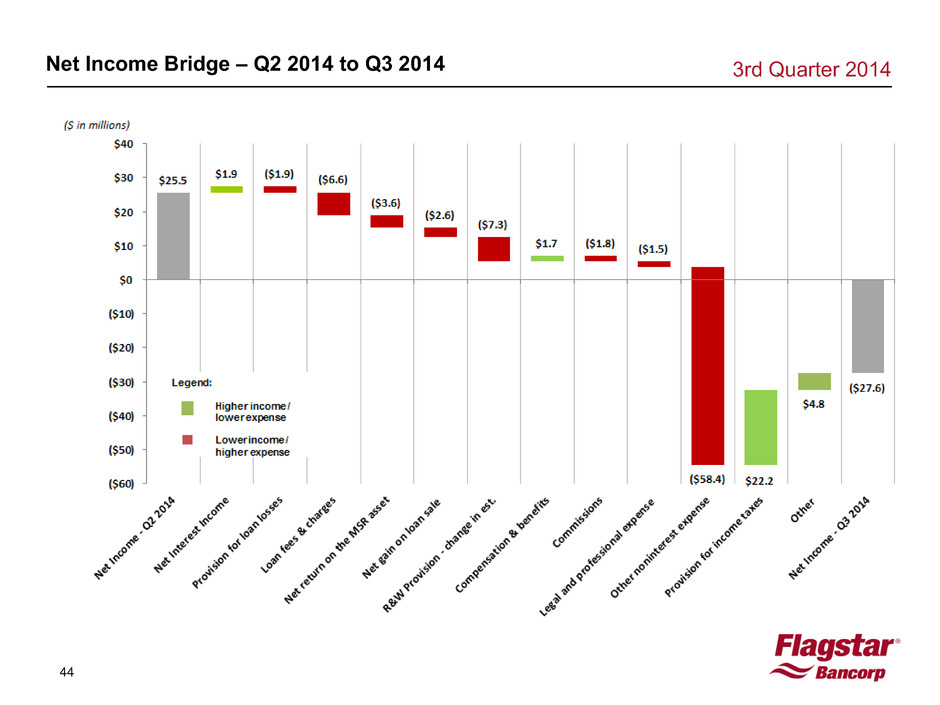
44 3rd Quarter 2014 Net Income Bridge – Q2 2014 to Q3 2014
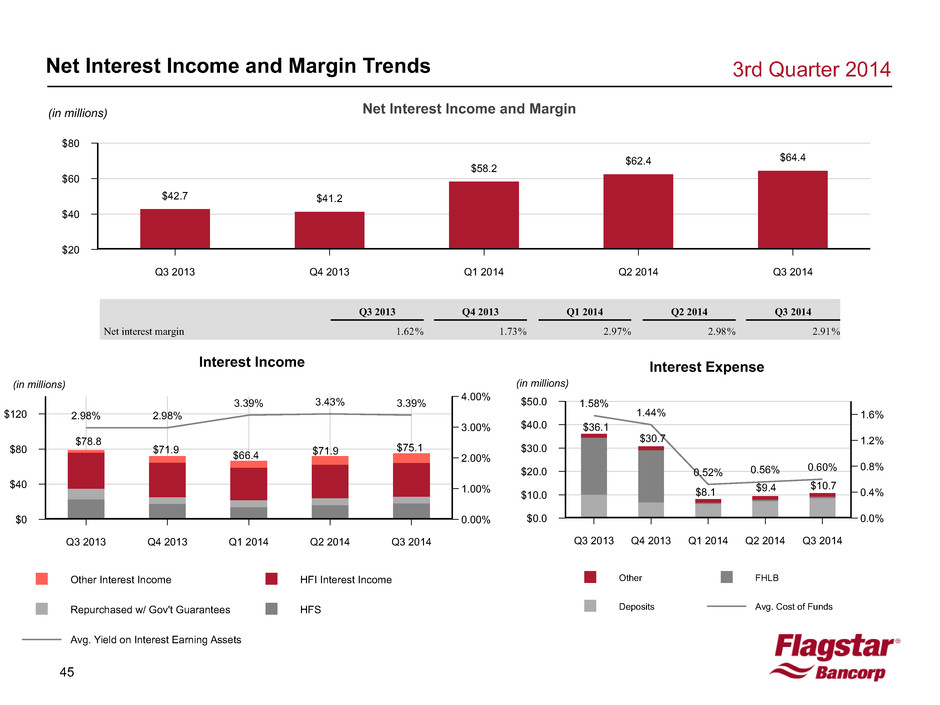
45 Net Interest Income and Margin $80 $60 $40 $20 Q3 2013 Q4 2013 Q1 2014 Q2 2014 Q3 2014 $42.7 $41.2 $58.2 $62.4 $64.4 Net Interest Income and Margin Trends 3rd Quarter 2014 (in millions) (in millions) (in millions) Q3 2013 Q4 2013 Q1 2014 Q2 2014 Q3 2014 Net interest margin 1.62% 1.73% 2.97% 2.98% 2.91% Other Interest Income HFI Interest Income Repurchased w/ Gov't Guarantees HFS Avg. Yield on Interest Earning Assets Interest Income $120 $80 $40 $0 4.00% 3.00% 2.00% 1.00% 0.00% Q3 2013 Q4 2013 Q1 2014 Q2 2014 Q3 2014 2.98% 2.98% 3.39% 3.43% 3.39% Other FHLB Deposits Avg. Cost of Funds Interest Expense $50.0 $40.0 $30.0 $20.0 $10.0 $0.0 1.6% 1.2% 0.8% 0.4% 0.0% Q3 2013 Q4 2013 Q1 2014 Q2 2014 Q3 2014 1.58% 1.44% 0.52% 0.56% 0.60% $78.8 $71.9 $66.4 $71.9 $36.1 $30.7 $8.1 $9.4 $75.1 $10.7
46 3rd Quarter 2014Non-GAAP Non-GAAP Reconciliation 47-51
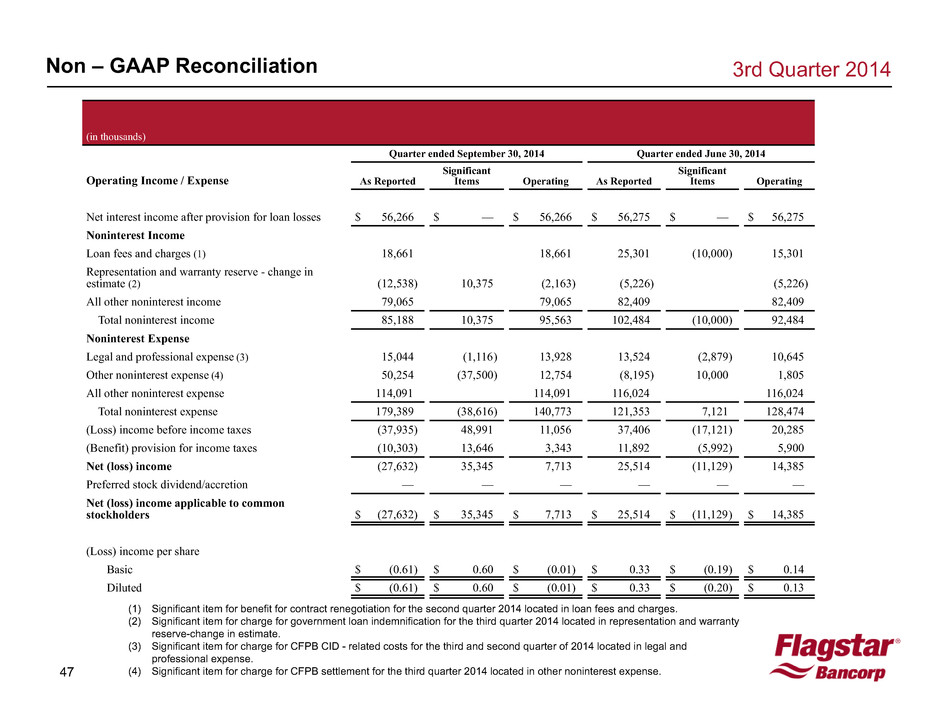
47 3rd Quarter 2014 Non – GAAP Reconciliation (in thousands) Quarter ended September 30, 2014 Quarter ended June 30, 2014 Operating Income / Expense As Reported Significant Items Operating As Reported Significant Items Operating Net interest income after provision for loan losses $ 56,266 $ — $ 56,266 $ 56,275 $ — $ 56,275 Noninterest Income Loan fees and charges (1) 18,661 18,661 25,301 (10,000) 15,301 Representation and warranty reserve - change in estimate (2) (12,538) 10,375 (2,163) (5,226) (5,226) All other noninterest income 79,065 79,065 82,409 82,409 Total noninterest income 85,188 10,375 95,563 102,484 (10,000) 92,484 Noninterest Expense Legal and professional expense (3) 15,044 (1,116) 13,928 13,524 (2,879) 10,645 Other noninterest expense (4) 50,254 (37,500) 12,754 (8,195) 10,000 1,805 All other noninterest expense 114,091 114,091 116,024 116,024 Total noninterest expense 179,389 (38,616) 140,773 121,353 7,121 128,474 (Loss) income before income taxes (37,935) 48,991 11,056 37,406 (17,121) 20,285 (Benefit) provision for income taxes (10,303) 13,646 3,343 11,892 (5,992) 5,900 Net (loss) income (27,632) 35,345 7,713 25,514 (11,129) 14,385 Preferred stock dividend/accretion — — — — — — Net (loss) income applicable to common stockholders $ (27,632) $ 35,345 $ 7,713 $ 25,514 $ (11,129) $ 14,385 (Loss) income per share Basic $ (0.61) $ 0.60 $ (0.01) $ 0.33 $ (0.19) $ 0.14 Diluted $ (0.61) $ 0.60 $ (0.01) $ 0.33 $ (0.20) $ 0.13 (1) Significant item for benefit for contract renegotiation for the second quarter 2014 located in loan fees and charges. (2) Significant item for charge for government loan indemnification for the third quarter 2014 located in representation and warranty reserve-change in estimate. (3) Significant item for charge for CFPB CID - related costs for the third and second quarter of 2014 located in legal and professional expense. (4) Significant item for charge for CFPB settlement for the third quarter 2014 located in other noninterest expense.
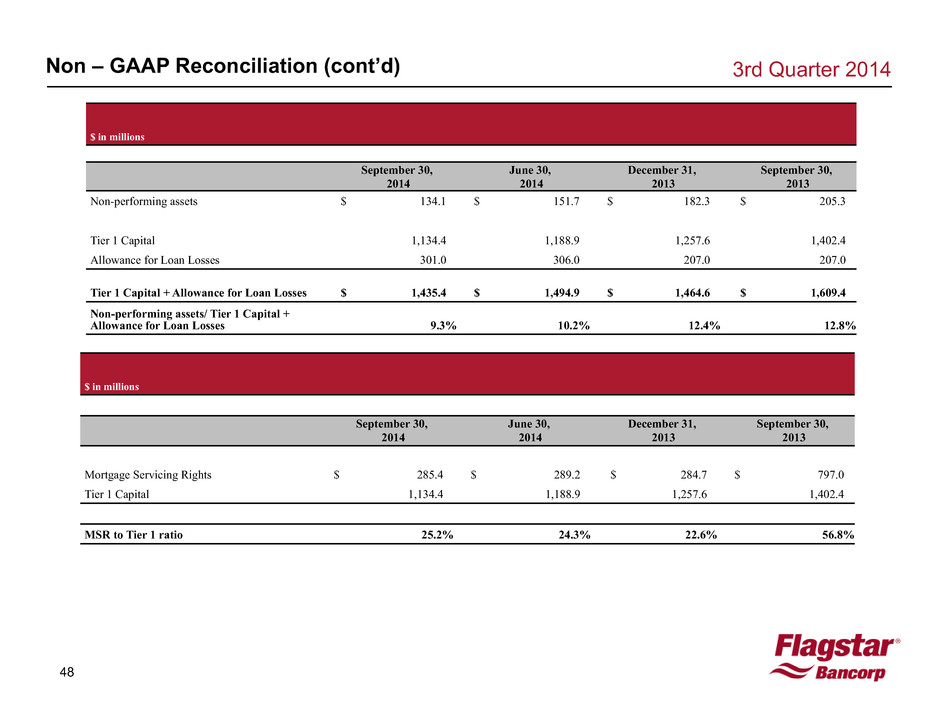
48 $ in millions September 30, 2014 June 30, 2014 December 31, 2013 September 30, 2013 Non-performing assets $ 134.1 $ 151.7 $ 182.3 $ 205.3 Tier 1 Capital 1,134.4 1,188.9 1,257.6 1,402.4 Allowance for Loan Losses 301.0 306.0 207.0 207.0 Tier 1 Capital + Allowance for Loan Losses $ 1,435.4 $ 1,494.9 $ 1,464.6 $ 1,609.4 Non-performing assets/ Tier 1 Capital + Allowance for Loan Losses 9.3% 10.2% 12.4% 12.8% Non – GAAP Reconciliation (cont’d) 3rd Quarter 2014 $ in millions September 30, 2014 June 30, 2014 December 31, 2013 September 30, 2013 Mortgage Servicing Rights $ 285.4 $ 289.2 $ 284.7 $ 797.0 Tier 1 Capital 1,134.4 1,188.9 1,257.6 1,402.4 MSR to Tier 1 ratio 25.2% 24.3% 22.6% 56.8%
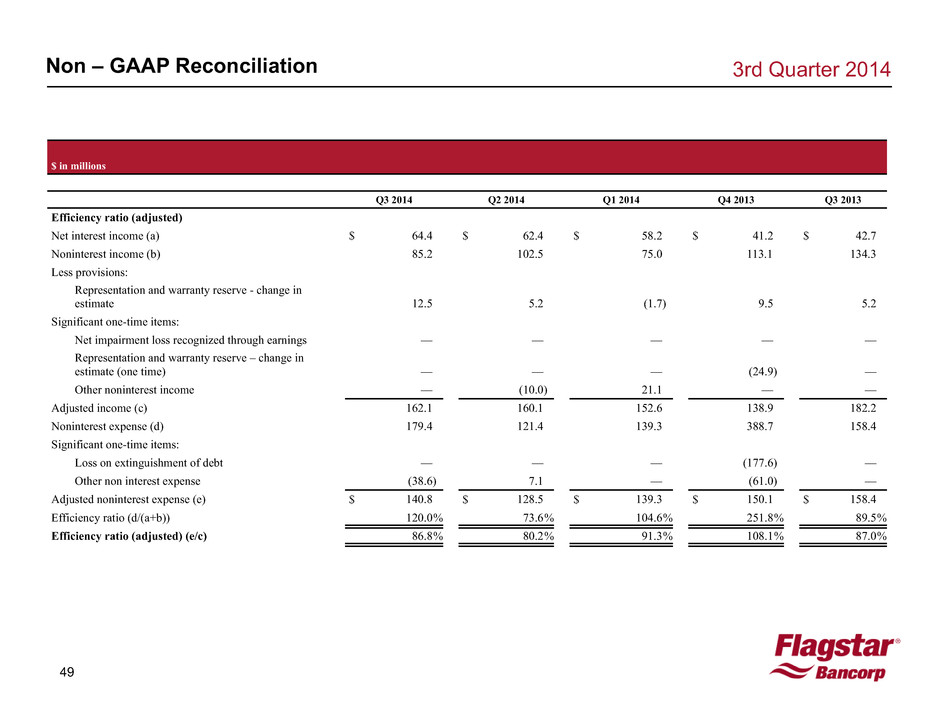
49 3rd Quarter 2014 Non – GAAP Reconciliation $ in millions Q3 2014 Q2 2014 Q1 2014 Q4 2013 Q3 2013 Efficiency ratio (adjusted) Net interest income (a) $ 64.4 $ 62.4 $ 58.2 $ 41.2 $ 42.7 Noninterest income (b) 85.2 102.5 75.0 113.1 134.3 Less provisions: Representation and warranty reserve - change in estimate 12.5 5.2 (1.7) 9.5 5.2 Significant one-time items: Net impairment loss recognized through earnings — — — — — Representation and warranty reserve – change in estimate (one time) — — — (24.9) — Other noninterest income — (10.0) 21.1 — — Adjusted income (c) 162.1 160.1 152.6 138.9 182.2 Noninterest expense (d) 179.4 121.4 139.3 388.7 158.4 Significant one-time items: Loss on extinguishment of debt — — — (177.6) — Other non interest expense (38.6) 7.1 — (61.0) — Adjusted noninterest expense (e) $ 140.8 $ 128.5 $ 139.3 $ 150.1 $ 158.4 Efficiency ratio (d/(a+b)) 120.0% 73.6% 104.6% 251.8% 89.5% Efficiency ratio (adjusted) (e/c) 86.8% 80.2% 91.3% 108.1% 87.0%
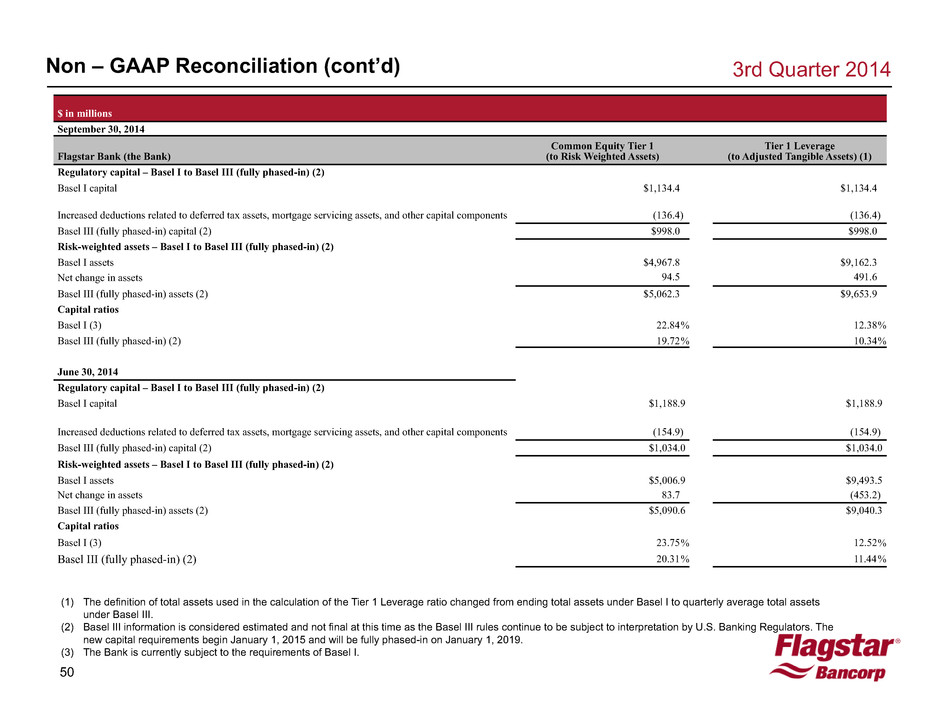
50 $ in millions September 30, 2014 Flagstar Bank (the Bank) Common Equity Tier 1 (to Risk Weighted Assets) Tier 1 Leverage (to Adjusted Tangible Assets) (1) Regulatory capital – Basel I to Basel III (fully phased-in) (2) Basel I capital $1,134.4 $1,134.4 Increased deductions related to deferred tax assets, mortgage servicing assets, and other capital components (136.4) (136.4) Basel III (fully phased-in) capital (2) $998.0 $998.0 Risk-weighted assets – Basel I to Basel III (fully phased-in) (2) Basel I assets $4,967.8 $9,162.3 Net change in assets 94.5 491.6 Basel III (fully phased-in) assets (2) $5,062.3 $9,653.9 Capital ratios Basel I (3) 22.84% 12.38% Basel III (fully phased-in) (2) 19.72% 10.34% June 30, 2014 Regulatory capital – Basel I to Basel III (fully phased-in) (2) Basel I capital $1,188.9 $1,188.9 Increased deductions related to deferred tax assets, mortgage servicing assets, and other capital components (154.9) (154.9) Basel III (fully phased-in) capital (2) $1,034.0 $1,034.0 Risk-weighted assets – Basel I to Basel III (fully phased-in) (2) Basel I assets $5,006.9 $9,493.5 Net change in assets 83.7 (453.2) Basel III (fully phased-in) assets (2) $5,090.6 $9,040.3 Capital ratios Basel I (3) 23.75% 12.52% Basel III (fully phased-in) (2) 20.31% 11.44% Non – GAAP Reconciliation (cont’d) 3rd Quarter 2014 (1) The definition of total assets used in the calculation of the Tier 1 Leverage ratio changed from ending total assets under Basel I to quarterly average total assets under Basel III. (2) Basel III information is considered estimated and not final at this time as the Basel III rules continue to be subject to interpretation by U.S. Banking Regulators. The new capital requirements begin January 1, 2015 and will be fully phased-in on January 1, 2019. (3) The Bank is currently subject to the requirements of Basel I.
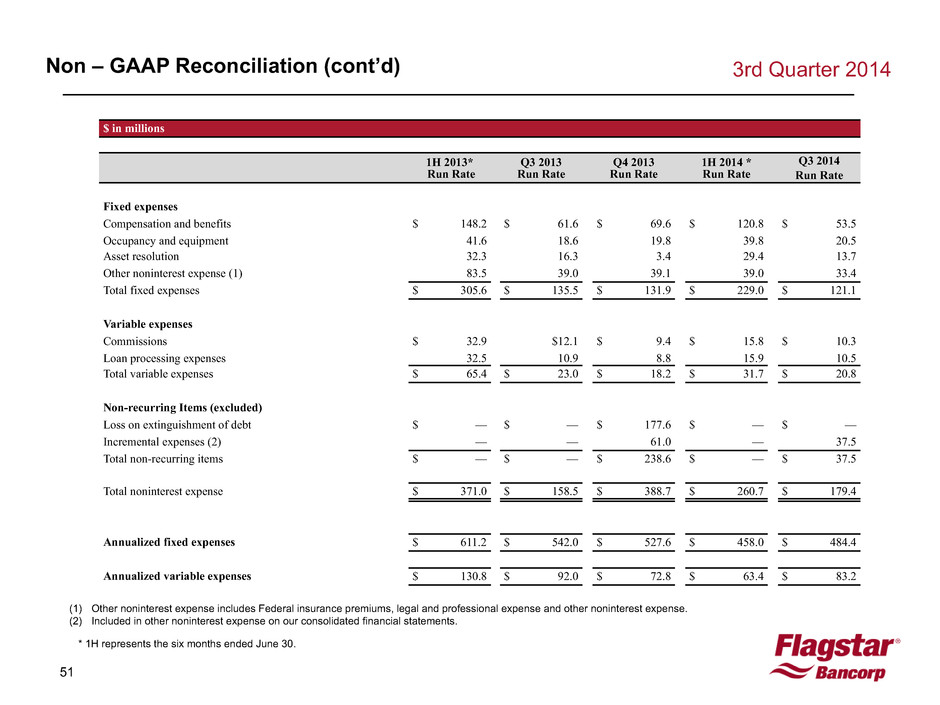
51 Non – GAAP Reconciliation (cont’d) 3rd Quarter 2014 $ in millions 1H 2013* Run Rate Q3 2013 Run Rate Q4 2013 Run Rate 1H 2014 * Run Rate Q3 2014 Run Rate Fixed expenses Compensation and benefits $ 148.2 $ 61.6 $ 69.6 $ 120.8 $ 53.5 Occupancy and equipment 41.6 18.6 19.8 39.8 20.5 Asset resolution 32.3 16.3 3.4 29.4 13.7 Other noninterest expense (1) 83.5 39.0 39.1 39.0 33.4 Total fixed expenses $ 305.6 $ 135.5 $ 131.9 $ 229.0 $ 121.1 Variable expenses Commissions $ 32.9 $12.1 $ 9.4 $ 15.8 $ 10.3 Loan processing expenses 32.5 10.9 8.8 15.9 10.5 Total variable expenses $ 65.4 $ 23.0 $ 18.2 $ 31.7 $ 20.8 Non-recurring Items (excluded) Loss on extinguishment of debt $ — $ — $ 177.6 $ — $ — Incremental expenses (2) — — 61.0 — 37.5 Total non-recurring items $ — $ — $ 238.6 $ — $ 37.5 Total noninterest expense $ 371.0 $ 158.5 $ 388.7 $ 260.7 $ 179.4 Annualized fixed expenses $ 611.2 $ 542.0 $ 527.6 $ 458.0 $ 484.4 Annualized variable expenses $ 130.8 $ 92.0 $ 72.8 $ 63.4 $ 83.2 (1) Other noninterest expense includes Federal insurance premiums, legal and professional expense and other noninterest expense. (2) Included in other noninterest expense on our consolidated financial statements. * 1H represents the six months ended June 30.