
4th Quarter 2014 Flagstar Bancorp, Inc. 154 7 35 Earnings Presentation 4th Quarter 2014 JANUARY 22, 2015 9

4th Quarter 2014 Cautionary statement This report contains "forward-looking statements" within the meaning of the Private Securities Litigation Reform Act of 1995, as amended. Forward-looking statements, by their nature, involve estimates, projections, goals, forecasts, assumptions, risks and uncertainties that could cause actual results or outcomes to differ materially from those expressed in a forward-looking statement. Examples of forward- looking statements include statements regarding our expectations, beliefs, plans, goals, objectives and future financial or other performance. Words such as "expects," "anticipates," "intends," "plans," "believes," "seeks," "estimates" and variations of such words and similar expressions are intended to identify such forward-looking statements. Any forward-looking statement speaks only as of the date on which it is made. Except to fulfill our obligations under the U.S. securities laws, we undertake no obligation to update any such statement to reflect events or circumstances after the date on which it is made. There are a number of important factors that could cause future results to differ materially from historical performance and these forward-looking statements. Factors that might cause such a difference include, but are not limited to the following items: 1. General business and economic conditions, including unemployment rates, movements in interest rates, the slope of the yield curve, any increase in mortgage fraud and other related activity and the changes in asset values in certain geographic markets, that affect us or our counterparties; 2. Volatile interest rates, and our ability to effectively hedge against them, which could affect, among other things, (i) the overall mortgage business, (ii) our ability to originate or acquire loans and to sell assets at a profit, (iii) prepayment speeds, (iv) our cost of funds and (v) investments in mortgage servicing rights; 3. The adequacy of our allowance for loan losses and our representation and warranty reserves; 4. Changes in accounting standards generally applicable to us and our application of such standards, including in the calculation of the fair value of our assets and liabilities; 5. Our ability to borrow funds, maintain or increase deposits or raise capital on commercially reasonable terms or at all and our ability to achieve or maintain desired capital ratios; 6. Changes in material factors affecting our loan portfolio, particularly our residential mortgage loans, and the market areas where our business is geographically concentrated or further loan portfolio or geographic concentration; 7. Changes in, or expansion of, the regulation of financial services companies and government-sponsored housing enterprises, including new legislation, regulations, rulemaking and interpretive guidance, enforcement actions, the imposition of fines and other penalties by our regulators, the impact of existing laws and regulations, new or changed roles or guidelines of government-sponsored entities, changes in regulatory capital ratios, and increases in deposit insurance premiums and special assessments of the Federal Deposit Insurance Corporation; 8. Our ability to comply with the terms and conditions of the Supervisory Agreement with the Board of Governors of the Federal Reserve and the Bank’s ability to comply with the Consent Order with the Office of Comptroller of the Currency and the Consent Order of the Consumer Financial Protection Bureau and our ability to address any further matters raised by these regulators, and other regulators or government bodies; 9. Our ability to comply with the terms and conditions of the agreement with the U.S. Department of Justice and the impact of compliance with that agreement and our ability to accurately estimate the financial impact of that agreement, including the fair value and timing of the future payments; 10. The Bank’s ability to make capital distributions and our ability to pay dividends on our capital stock or interest on our trust preferred securities; 11. Our ability to attract and retain senior management and other qualified personnel to execute our business strategy, including our entry into new lines of business, our introduction of new products and services and management of risks relating thereto, and our competing in the mortgage loan originations, mortgage servicing and commercial and retail banking lines of business; 12. Our ability to satisfy our mortgage servicing and subservicing obligations and manage repurchases and indemnity demands by mortgage loan purchasers, guarantors and insurers; 13. The outcome and cost of defending current and future legal or regulatory litigation, proceedings or investigations; 14. Our ability to create and maintain an effective risk management framework and effectively manage risk, including, among other things, market, interest rate, credit and liquidity risk, including risks relating to the cyclicality and seasonality of our mortgage banking business, litigation and regulatory risk, operational risk, counterparty risk and reputational risk; 15. The control by, and influence of, our majority stockholder; 16. A failure of, interruption in or cybersecurity attack on our network or computer systems, which could impact our ability to properly collect, process and maintain personal data, ensure ongoing mortgage and banking operations, or maintain system integrity with respect to funds settlement; and 17. Our ability to meet our forecasted earnings such that we would need to establish a valuation allowance against our deferred tax asset. All of the above factors are difficult to predict, contain uncertainties that may materially affect actual results, and may be beyond our control. New factors emerge from time to time, and it is not possible for our management to predict all such factors or to assess the effect of each such factor on our business. Although we believe that these forward-looking statements are based on reasonable estimates and assumptions, they are not guarantees of future performance and are subject to known and unknown risks, uncertainties, contingencies and other factors. Accordingly, we cannot give you any assurance that our expectations will in fact occur or that actual results will not differ materially from those expressed or implied by such forward-looking statements. In light of the significant uncertainties inherent in the forward-looking statements included herein, the inclusion of such information should not be regarded as a representation by us or any other person that the results or conditions described in such statements or our objectives and plans will be achieved.

4th Quarter 2014 Executive Overview Sandro DiNello, CEO

4th Quarter 2014 4th quarter key highlights Strong core franchises • Largest bank headquartered in Michigan, with $9.8 billion in assets, $7.1 billion of deposits and 107 branches • Mortgage origination (9th largest) and servicing (top 20) franchises have national scale Increased profitability • Net income up $3 million from 3Q14 adjusted net income of $8 million • No unusual adjustments affecting reported results Noninterest income growth • Noninterest income up $3 million to $98 million, up 3 percent from 3Q14 adjusted results - Increased net gain on loan sales led by a 4bps higher GOS margin of 0.87% - Improved recoveries on representation and warranty losses Expense discipline • Noninterest expense declined $2 million to $139 million, down 1 percent from third quarter 2014 adjusted results - Reduced expenses were led by decreased legal and professional fees, asset resolution expenses and other noninterest expenses Lower credit related costs • Provision for loan losses of $5.0 million vs. $8.1 million in the prior quarter • Representation and warranty benefit of $6.1 million vs. an adjusted charge of $2.2 million in the prior quarter • Asset resolution expense of $13.4 million vs. $13.7 million in the prior quarter Strong balance sheet and liquidity • Tier 1 leverage increased 9 bps to 12.6% • Total assets increased 2.2%, of which, 17% are invested in liquid assets 154 7 35 3

4th Quarter 2014 Financial Overview Jim Ciroli, CFO

4th Quarter 2014 Q4 2014 Q3 2014 Variance Net interest income $61.3 $64.4 ($3.1) Provision for loan losses 5.0 8.1 3.1 Net interest income after provision for loan losses 56.3 56.3 - Net gain on loans sales 53.5 52.2 1.4 Loan fees and charges 16.8 18.7 (1.9) Loan administration income 5.5 5.6 (0.1) Other noninterest income 22.7 8.8 13.9 Adjusting items(1) - 10.4 (10.4) Noninterest income 98.4 95.6 2.9 Gain sale / total revenue 35% 34% 0% Compensation and benefits 59.0 53.5 (5.5) Commissions 9.3 10.3 1.0 Other noninterest expenses 71.0 115.5 44.6 Adjusting items(1) - (38.6) (38.6) Noninterest expense 139.3 140.8 1.5 Adjusted efficiency ratio 91% 87% 4% Adjusted operating income before taxes 15.5 11.1 4.4 Income tax expense 4.4 3.3 (1.1) Adjusted net (loss) income $11.1 $7.7 $3.4 Quarterly adjusted income comparison(1) $mm Observations Lower net interest income • 11 bps decrease in NIM, primarily due to lower yield on loans with government guarantees • 1% decline in average earning assets; resulting from third quarter jumbo loan sales partially offset by increased commercial lending Lower credit related costs • Total credit costs of $12.3 million vs. $23.9 million in the prior quarter on an adjusted basis - Improvement in R&W provision due to lower loss experience & claim recoveries Revenue growth • Noninterest income increased $3 million, excluding $10.4 million of indemnity charges in Q3 - Net gain on loan sales up slightly on 4bps improvement in margin 5 Expense discipline • Noninterest expense decreased $2 million - Asset resolution, legal and professional and other noninterest expense down - Partially offset by higher compensation expense ¹ Please see adjustments in the non-GAAP reconciliations included in the appendix.
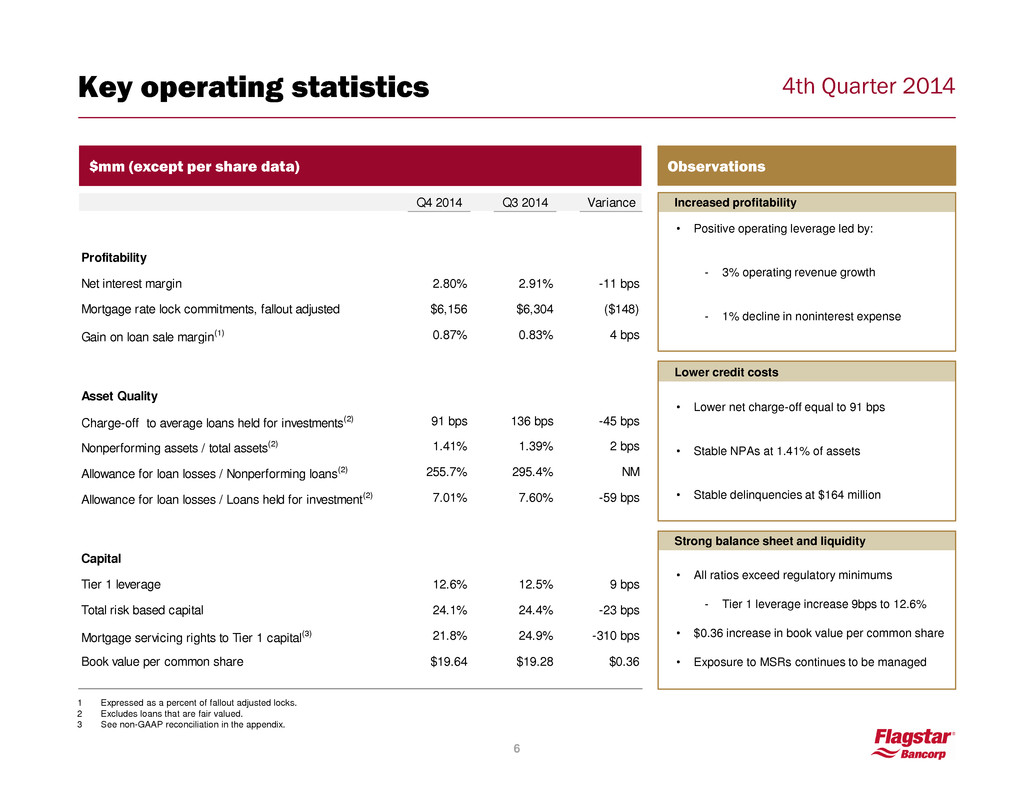
4th Quarter 2014 Key operating statistics $mm (except per share data) Observations Increased profitability • Positive operating leverage led by: - 3% operating revenue growth - 1% decline in noninterest expense Lower credit costs • Lower net charge-off equal to 91 bps • Stable NPAs at 1.41% of assets • Stable delinquencies at $164 million Strong balance sheet and liquidity • All ratios exceed regulatory minimums - Tier 1 leverage increase 9bps to 12.6% • $0.36 increase in book value per common share • Exposure to MSRs continues to be managed 6 B1 B2 C Q4 2014 Q3 2014 Variance Profitability Net interest margin 2.80% 2.91% -11 bps Mortgage rate lock commitments, fallout adjusted $6,156 $6,304 ($148) Gain on loan sale margin(1) 0.87% 0.83% 4 bps Asset Quality Charge-off to average loans held for investments(2) 91 bps 136 bps -45 bps Nonperforming assets / total assets(2) 1.41% 1.39% 2 bps Allowance for loan losses / Nonperforming loans(2) 255.7% 295.4% NM Allowance for loan losses / Loans held for investment(2) 7.01% 7.60% -59 bps Capital Tier 1 leverage 12.6% 12.5% 9 bps Total risk based ca ital 24.1% 24.4% -23 bps Mortgage servicing rights to Tier 1 capital(3) 21.8% 24.9% -310 bps Book value per common share $19.64 $19.28 $0.36 A 1 Expressed as a percent of fallout adjusted locks. 2 Excludes loans that are fair valued. 3 See non-GAAP reconciliation in the appendix.
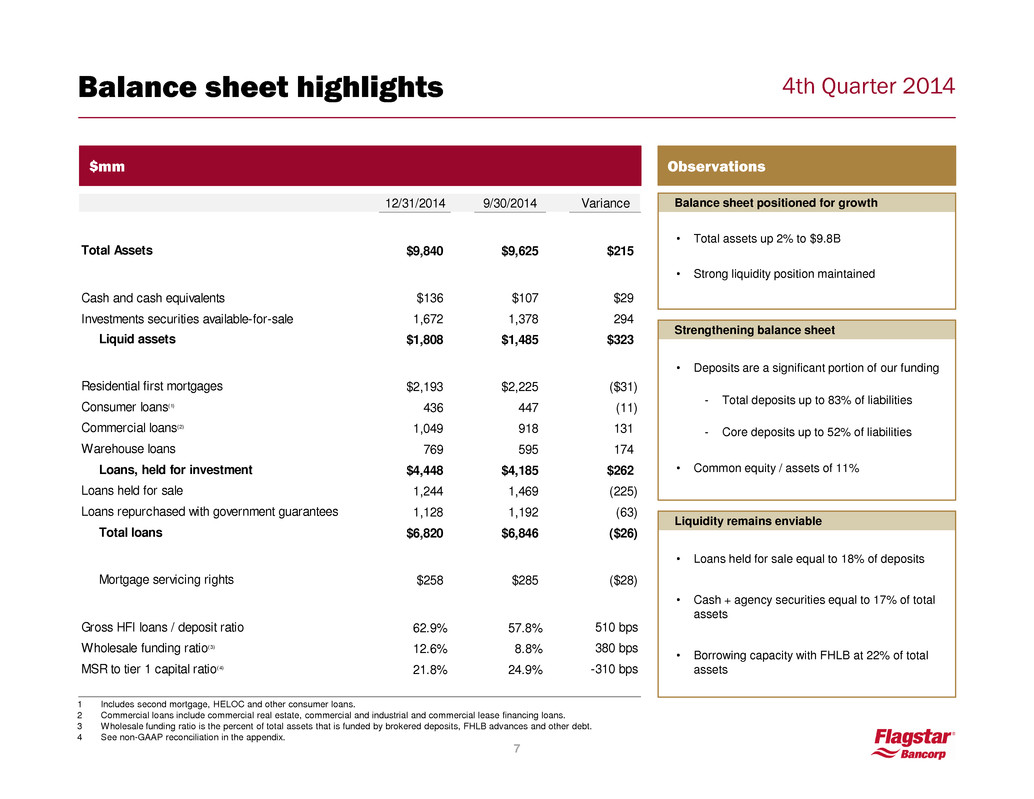
4th Quarter 2014 Balance sheet highlights $mm Observations Balance sheet positioned for growth • Total assets up 2% to $9.8B • Strong liquidity position maintained Strengthening balance sheet • Deposits are a significant portion of our funding - Total deposits up to 83% of liabilities - Core deposits up to 52% of liabilities • Common equity / assets of 11% Liquidity remains enviable • Loans held for sale equal to 18% of deposits • Cash + agency securities equal to 17% of total assets • Borrowing capacity with FHLB at 22% of total assets 7 B1 B2 C 12/31/2014 9/30/2014 Variance Total Assets $9,840 $9,625 $215 Cash and cash equivalents $136 $107 $29 Investments securities available-for-sale 1,672 1,378 294 Liquid assets $1,808 $1,485 $323 Residential first mortgages $2,193 $2,225 ($31) Consumer loans(1) 436 447 (11) Commercial loans(2) 1,049 918 131 Warehouse loans 769 595 174 Loans, held for investment $4,448 $4,185 $262 Loans held for sale 1,244 1,469 (225) Loans repurchased with government guarantees 1,128 1,192 (63) Total loans $6,820 $6,846 ($26) Mortgage servicing rights $258 $285 ($28) Gross HFI loans / deposit ratio 62.9% 57.8% 510 bps Wholesale funding rati (3) 12.6% 8.8% 380 bps MSR to tier 1 capital ratio(4) 21.8% 24.9% -310 bps A 1 Includes second mortgage, HELOC and other consumer loans. 2 Commercial loans include commercial real estate, commercial and industrial and commercial lease financing loans. 3 Wholesale funding ratio is the percent of total assets that is funded by brokered deposits, FHLB advances and other debt. 4 See non-GAAP reconciliation in the appendix.
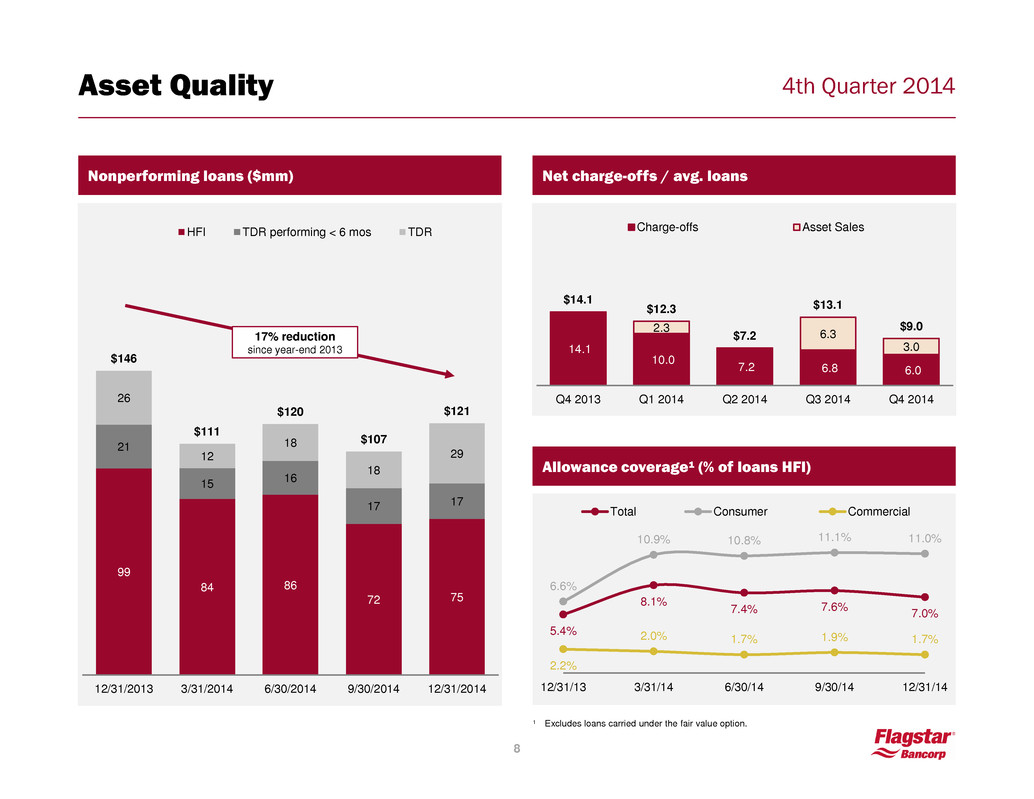
4th Quarter 2014 Nonperforming loans ($mm) Net charge-offs / avg. loans Allowance coverage¹ (% of loans HFI) 154 7 35 5.4% 8.1% 7.4% 7.6% 7.0% 6.6% 10.9% 10.8% 11.1% 11.0% 2.2% 2.0% 1.7% 1.9% 1.7% 12/31/13 3/31/14 6/30/14 9/30/14 12/31/14 Total Consumer Commercial 99 84 86 72 75 21 15 16 17 17 26 12 18 18 29 $146 $111 $120 $107 $121 12/31/2013 3/31/2014 6/30/2014 9/30/2014 12/31/2014 HFI TDR performing < 6 mos TDR 17% reduction since year-end 2013 8 Asset Quality 14.1 10.0 7.2 6.8 6.0 2.3 6.3 3.0 $14.1 $12.3 $7.2 $13.1 $9.0 Q4 2013 Q1 2014 Q2 2014 Q3 2014 Q4 2014 Charge-offs Asset Sales ¹ Excludes loans carried under the fair value option.
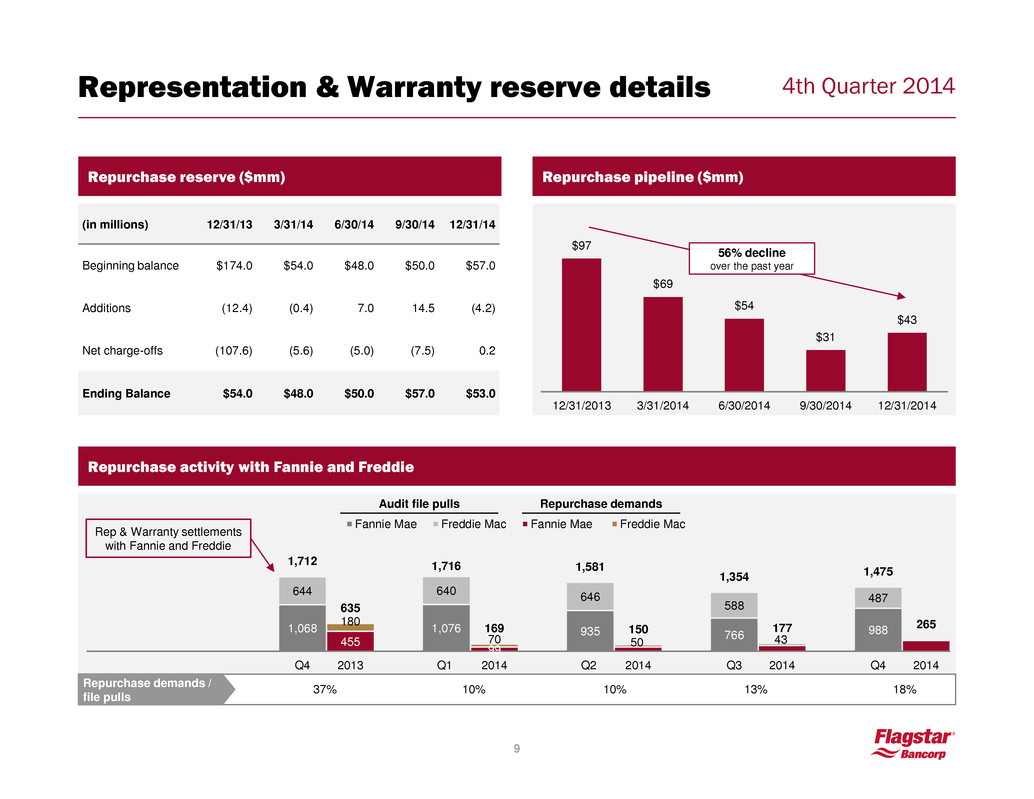
4th Quarter 2014 Representation & Warranty reserve details (in millions) 12/31/13 3/31/14 6/30/14 9/30/14 12/31/14 Beginning balance $174.0 $54.0 $48.0 $50.0 $57.0 Additions (12.4) (0.4) 7.0 14.5 (4.2) Net charge-offs (107.6) (5.6) (5.0) (7.5) 0.2 Ending Balance $54.0 $48.0 $50.0 $57.0 $53.0 $97 $69 $54 $31 $43 12/31/2013 3/31/2014 6/30/2014 9/30/2014 12/31/2014 Repurchase pipeline ($mm) Repurchase reserve ($mm) 1,068 1,076 935 766 988 644 640 646 588 487 455 99 180 70 50 43 1,712 635 1,716 169 1,581 150 1,354 177 1,475 265 Q4 2013 Q1 2014 Q2 2014 Q3 2014 Q4 2014 Fannie Mae Freddie Mac Fannie Mae Freddie Mac Audit file pulls Repurchase demands Repurchase activity with Fannie and Freddie Rep & Warranty settlements with Fannie and Freddie Repurchase demands / file pulls 10% 10% 13% 37% 9 18% 56% decline over the past year

4th Quarter 2014 Capital ratios Pro-forma capital ratios (12/31/14)(1) 10 Tier 1 capital 22.8% 14.5% 13.8% 13.7% 13.2% 11.6% 11.2% 10.7% 9.8% 9.6% 8.8% FBC FHN CBSH BOKF BXS TCB FMER ASBC FNFG VLY TCBI Weighted average: 11.6% 12.6% 11.7% 10.5% 10.2% 10.2% 10.2% 9.4% 8.2% 7.9% 7.4% 7.3% FBC FHN BXS BOKF TCB TCBI CBSH FMER ASBC VLY FNFG Tier 1 leverage Weighted average: 9.1% Source: SNL Financial; comparable data as of September 30, 2014. 1. Please see non-GAAP table in the appendix. To calculate the TARP payoff we assumed $56.3 million of deferred TARP dividends to be excluded from Tier 1 common equity and an additional $266.7 million of TARP payoff to be excluded from Tier 1 capital. 12.9% 12.6% 9.1% 10.2% 8.0% 6.9% Tier 1 Common Tier 1 Leverage Basel I Basel III Basel III & payoff TARP Basel III implementation overview • 3 year phase-in period, starting January 1, 2015 – January 1, 2018 • DTA and MSR assets are limited to 10% individually and 15% on a combined basis of common equity Tier 1 capital • DTA and MSR assets are weighted at 250% of the amount included in risk weighted assets • Average quarterly assets, rather than end of period assets, are measured for the Tier 1 leverage ratio

4th Quarter 2014 Business Segment Overview Lee Smith, COO

4th Quarter 2014 Community Banking 12 Average commercial loans ($bn) Commercial loan total commitments ($bn) Average consumer loans ($bn) Average deposits ($bn) $3.3 $3.2 $3.1 $3.2 $3.0 Q4 2013 Q1 2014 Q2 2014 Q3 2014 Q4 2014 0.2 0.2 0.3 0.4 0.4 0.4 0.4 0.5 0.6 0.6 0.3 0.3 0.4 0.6 0.5 $1.0 $0.9 $1.2 $1.5 $1.5 Q4 2013 Q1 2014 Q2 2014 Q3 2014 Q4 2014 Commercial and Industrial Commercial Real Estate Warehouse 0.4 0.5 0.6 0.6 0.6 0.5 0.6 0.6 0.7 0.8 2.1 1.8 1.6 1.4 1.6 $3.0 $2.9 $2.8 $2.7 $2.9 12/31/2013 3/31/2014 6/30/2014 9/30/2014 12/31/2014 Commercial and Industrial Commercial Real Estate Warehouse 2.6 2.6 2.4 2.3 2.2 $3.0 $2.9 $2.7 $2.6 $2.5 Residential First Residential Second Other Consumer 4.0 3.9 4.1 4.3 4.5 1.2 1.0 0.9 0.9 0.8 0.6 0.7 0.8 0.9 1.0 $5.7 $5.6 $5.8 $6.2 $6.3 Q4 2013 Q1 2014 Q2 2014 Q3 2014 Q4 2014 Retail excluding CDs Retail CDs Government

4th Quarter 2014 Mortgage originations 13 4.1 3.0 3.7 4.4 3.8 1.6 1.2 1.5 1.9 1.8 $6.4 $4.9 $6.0 $7.2 $6.6 Q4 2013 Q1 2014 Q2 2014 Q3 2014 Q4 2014 Conventional Government Jumbo Originations by purpose ($bn) 3.7 2.8 3.9 4.5 3.5 2.8 2.1 2.1 2.7 3.1 $6.4 $4.9 $6.0 $7.2 $6.6 Q4 2013 Q1 2014 Q2 2014 Q3 2014 Q4 2014 Purchase originations Refinance originations Originations by mortgage type ($bn) 64% 60% 62% 61% 62% Conforming (%) Gain on loan sale(1) – revenue and margin $44.8 $45.3 $54.8 $52.2 $53.5 0.85% 0.93% 0.82% 0.83% 0.87% 0.00% 0.50% 1.00% 1.50% 2.00% $0 $10 $20 $30 $40 $50 $60 Q4 2013 Q1 2014 Q2 2014 Q3 2014 Q4 2014 Fallout adjusted locks by channel ($bn) $5.3 $4.9 $6.7 $6.3 $6.2 Q4 2013 Q1 2014 Q2 2014 Q3 2014 Q4 2014 1. Based on fallout adjusted locks. 14% 16% 16% 15% 14% FHA (%)

4th Quarter 2014 Mortgage servicing 14 Loans serviced (‘000) Fannie 49% Freddie 7% Ginnie 37% HFI / Other 7% Breakdown of loans serviced 56% 22% 28% 24% 25% 22% 9/30/2013 12/31/2013 3/31/2014 6/30/2014 9/30/2014 12/31/2014 $ UPB of MSRs sold¹ ($bn) $53.4 $0.5 $8.8 $4.9 $6.4 Q4 2013 Q1 2014 Q2 2014 Q3 2014 Q4 2014 MSR / regulatory capital 369 131 146 127 123 118 198 195 213 238 238 37 34 34 32 27 26 406 364 376 372 388 383 9/30/2013 12/31/2013 3/31/2014 6/30/2014 9/30/2014 12/31/2014 Serviced for Others Subserviced for Others Flagstar Loans HFI ¹ Includes bulk and flow sales.

4th Quarter 2014 Interest-only loan portfolio Overview I/O reset by year FICO & LTV (as of December 31, 2014) 154 7 35 • Flagstar retains a $628mm IO portfolio that will reset from 2015-17 • The portfolio is well seasoned and naturally running off, with >68% sub- 90% LTV • I/O reserve was ~$94mm in Q4 2014 (~10% of outstanding loans) • Flagstar is aggressively managing this portfolio with proactive calling campaigns and refinancing/modification opportunities - 100% right party contact for resets that occurred during Q4 2014 - 95.4% right party contact for resets that will occur during Q1 2015 • 47% of portfolio is in CA/FL where it benefits from significant house price appreciation $313 $55 $221 $38 104% 102% 76% 103% 14% 3% 10% 11% 2015 2016 2017 Thereafter UPB ($mm) Payment shock to average current monthly payment Payment shock to average original monthly payment Key highlights 15 <70 70-79 80-89 90-99 100+ Total <70 70-79 80-89 90-99 100+ Total 740+ $96 $67 $66 $60 $37 $326 15% 11% 11% 10% 6% 52% 700-739 $31 $22 $32 $22 $16 $123 5 4 5 4 3 20 660-699 $19 $16 $16 $20 $11 $82 3% 2% 3% 3% 2% 13% 620-659 $9 $9 $13 $9 $6 $47 1 2 2 1 1 7 <620 $13 $10 $10 $7 $9 $50 2% 2% 2% 1% 1% 8% Total $168 $125 $137 $119 $79 $628 27% 20% 22% 19% 13% 100% Current LTVs Curre nt FIC Os $ %
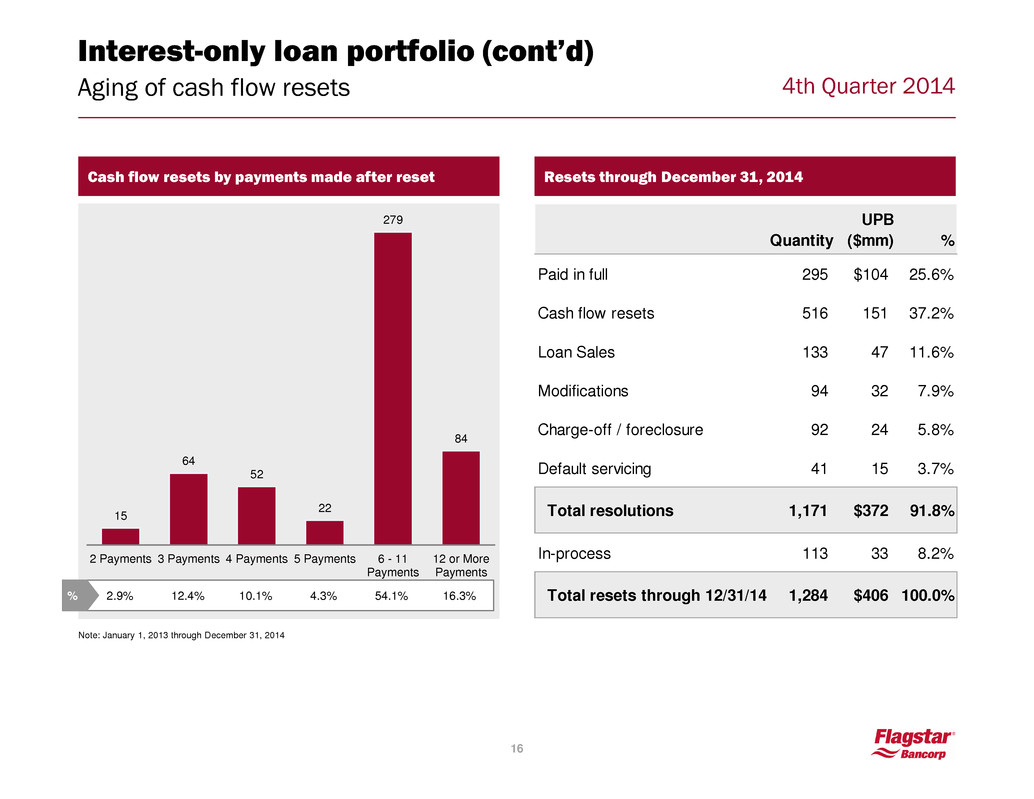
4th Quarter 2014 15 64 52 22 279 84 2 Payments 3 Payments 4 Payments 5 Payments 6 - 11 Payments 12 or More Payments 2.9% 12.4% 10.1% 4.3% 54.1% 16.3% Interest-only loan portfolio (cont’d) Aging of cash flow resets 16 Cash flow resets by payments made after reset Note: January 1, 2013 through December 31, 2014 % Resets through December 31, 2014 Quantity UPB ($mm) % Paid in full 295 $104 25.6% Cash flow resets 516 151 37.2% Loan Sales 133 47 11.6% Modifications 94 32 7.9% Charge-off / foreclosure 92 24 5.8% Default servicing 41 15 3.7% Total resolutions 1,171 $372 91.8% In-process 113 33 8.2% Total resets through 12/31/14 1,284 $406 100.0%

4th Quarter 2014 Adjusted noninterest expenses(1) 154 7 35 Quarterly noninterest expenses¹ ($mm) 131.9 124.3 111.7 120.0 18.3 15.0 16.7 20.8 119.4 19.9 $150.1 $139.3 $128.5 $140.8 $139.3 $0 $50 $100 $150 $200 Q4 2013 Q1 2014 Q2 2014 Q3 2014 Q4 2014 Fixed expense Variable expense Note: Fixed expenses include compensation and benefits, occupancy and equipment, FDIC premiums, asset resolution, legal and professional expense, and other noninterest expense; Variable expenses include commissions and loan processing expense ¹ See non-GAAP reconciliations in the appendix for excluded items. Quarters with adjusted totals include Q4 2013 and Q3 2014. 17

4th Quarter 2014 Closing Remarks / Q&A Sandro DiNello, CEO

4th Quarter 2014 Guidance(1)(2) Net interest income and margin • Net interest income expected to increase slightly • Modest earning asset growth comes from loans held for sale, jumbo mortgages and continued commercial build-out • Net interest margin is expected to be relatively stable to slightly down Mortgage originations • Given the current levels of interest rates and rate volatility, fallout adjusted mortgage locks are expected to be at least 5% above Q4 levels Gain on loan sales • Gain on loan sale margin expected to improve modestly as lower rate environment allows for better pricing and FHA refinance activity should be in more profitable channels Net servicing revenue • Net loan administration income expected to be flat to up • Net return on the mortgage servicing asset will continue to be challenged by volatility in interest rates and transaction costs on sales MSR to Tier 1 capital ratio • Given an oversupply of assets in the marketplace and uncertainties as to forward prepayment speeds, MSRs/Tier 1 may rise from 12/31/14 levels; we will react to market conditions as appropriate Credit related costs • Provision for loan losses are expected to be flat to slightly above Q4 levels • Asset resolution expenses are expected to decline • No significant change in representation and warranty reserve levels are anticipated 154 7 35 19 Noninterest expenses • Noninterest expenses are expected to be between $133 - $138 million 2015 1st quarter outlook (1) See cautionary statements on slide 1. (2) All assumptions and estimates are subject to change and may impact 2015 1st quarter outlook.

4th Quarter 2014 Appendix Company overview 21 Financial performance 23 Community banking segment 25 Mortgage origination segment 31 Mortgage servicing segment 33 Capital and liquidity 34 Asset quality 37 Non-GAAP reconciliation 45

4th Quarter 2014 Flagstar at a glance Corporate Community Banking Mortgage Origination Mortgage Servicing 154 7 35 Ticker: NYSE: FBC Headquarters: Troy, MI Assets: $9.8bn Market cap1: $926mm • Largest bank headquartered in Michigan, ranked #7 by deposit market share1 • $9.8bn of assets • $7.1bn of deposits • 107 branches • 51% growth in CRE and C&I loan commitments over the past 12 months • 9th largest originator nationally2 • Originated nearly $25bn of residential mortgage loans during the last 12 months • 18th largest combined servicer of mortgage loans nationwide2 • Currently servicing approximately 383,000 loans – 96% are performing loans • Scalable mortgage platform with capacity to service up to 1mm loans 1 Source: FDIC Deposit Market Share Report, as of June 30, 2014; Market data as of January 21, 2015. 2 Source: Inside Mortgage Finance, latest available statistics 21 COMPANY OVERVIEW

4th Quarter 2014 9/29/14 Settlement with CFPB related to loss mitigation and default servicing practices Substantial progress rebuilding Flagstar 154 7 35 R is k m it ig a tio n 7/17/13 Announced outsourcing of default servicing and intent to service only performing 8/28/13 Announced marketing partnership with Detroit Red Wings 12/18/13 Announced sale of $40.7bn of MSRs to Two Harbors, retaining subservicing 6/23/14 Stephen Figliuolo becomes CRO 8/4/2014 James Ciroli becomes CFO M a n a g e m e n t A c h ie v e m e n ts 2013 2014 5/2/13 Settlement with MBIA for $110mm 6/21/13 Settlement with Assured Guaranty for $105mm 11/6/13 Settlement with Fannie Mae R&W liability of $121mm for pre-2009 mortgages Q4 2013 Repaid $2.9bn of high cost FHLB advances 1/22/14 Announced reversal of $356mm DTA valuation allowance 12/30/13 Settlement with Freddie Mac R&W liability of $11mm for pre-2009 mortgages Q1 2014 Bolstered LLR by $100mm to raise resi I/O loss estimation from 12 to 18 months 3/4/13 Mike Flynn becomes General Counsel 5/17/13 Sandro DiNello becomes CEO, Lee Smith becomes COO 12/2/2014 Andy Fornarola becomes Director of Community Banking 22 FY 2014 Completed the sales of $72mm UPB of NPLs and TDRs FY 2013 Completed the sales of $508mm UPB of NPLs and TDRs COMPANY OVERVIEW
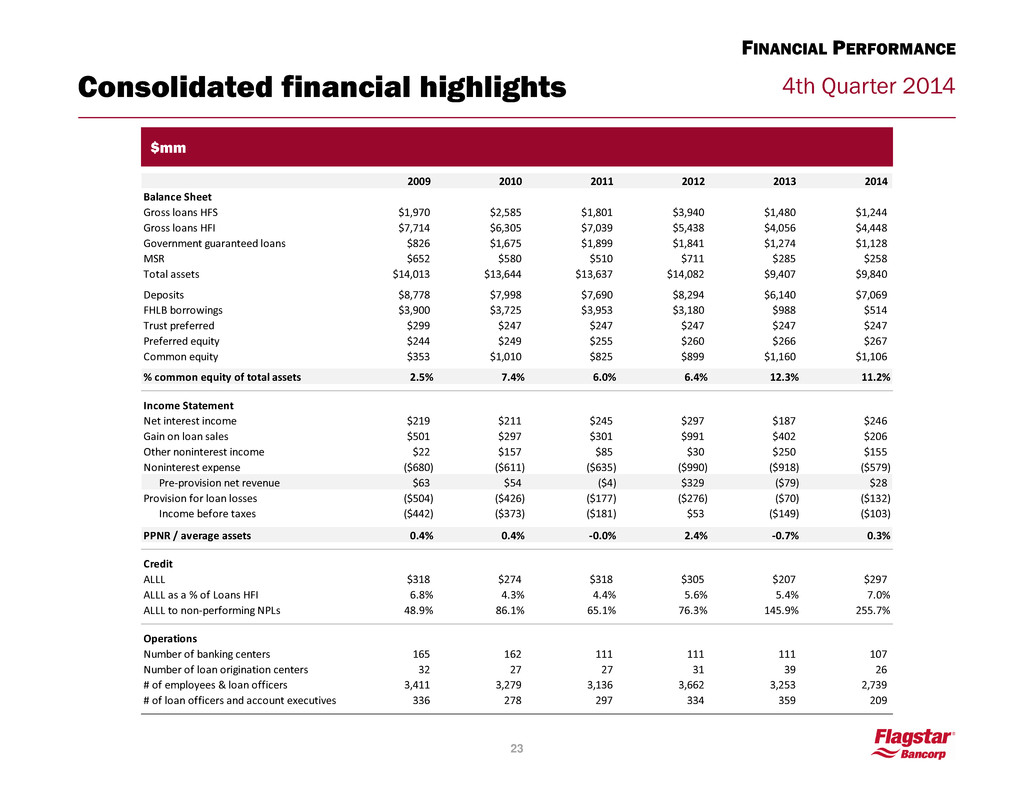
4th Quarter 2014 Consolidated financial highlights 154 7 35 23 FINANCIAL PERFORMANCE $mm 2009 2010 2011 2012 2013 2014 Balance Sheet Gross loans HFS $1,970 $2,585 $1,801 $3,940 $1,480 $1,244 Gross loans HFI $7,714 $6,305 $7,039 $5,438 $4,056 $4,448 Government guaranteed loans $826 $1,675 $1,899 $1,841 $1,274 $1,128 MSR $652 $580 $510 $711 $285 $258 Total assets $14,013 $13,644 $13,637 $14,082 $9,407 $9,840 Deposits $8,778 $7,998 $7,690 $8,294 $6,140 $7,069 FHLB borrowings $3,900 $3,725 $3,953 $3,180 $988 $514 Trust preferred $299 $247 $247 $247 $247 $247 Preferred equity $244 $249 $255 $260 $266 $267 Common equity $353 $1,010 $825 $899 $1,160 $1,106 % common equity of total assets 2.5% 7.4% 6.0% 6.4% 12.3% 11.2% Income Statement Net interest income $219 $211 $245 $297 $187 $246 Gain on loan sales $501 $297 $301 $991 $402 $206 Other noninterest income $22 $157 $85 $30 $250 $155 Noninterest expense ($680) ($611) ($635) ($990) ($918) ($579) Pre-provision net revenue $63 $54 ($4) $329 ($79) $28 Provision for loan losses ($504) ($426) ($177) ($276) ($70) ($132) Income before taxes ($442) ($373) ($181) $53 ($149) ($103) PPNR / average assets 0.4% 0.4% -0.0% 2.4% -0.7% 0.3% Credit ALLL $318 $274 $318 $305 $207 $297 ALLL as a % of Loans HFI 6.8% 4.3% 4.4% 5.6% 5.4% 7.0% ALLL to non-performing NPLs 48.9% 86.1% 65.1% 76.3% 145.9% 255.7% Operations Number of banking centers 165 162 111 111 111 107 Number of loan origination centers 32 27 27 31 39 26 # of employees & loan officers 3,411 3,279 3,136 3,662 3,253 2,739 # of loan officers and account executives 336 278 297 334 359 209
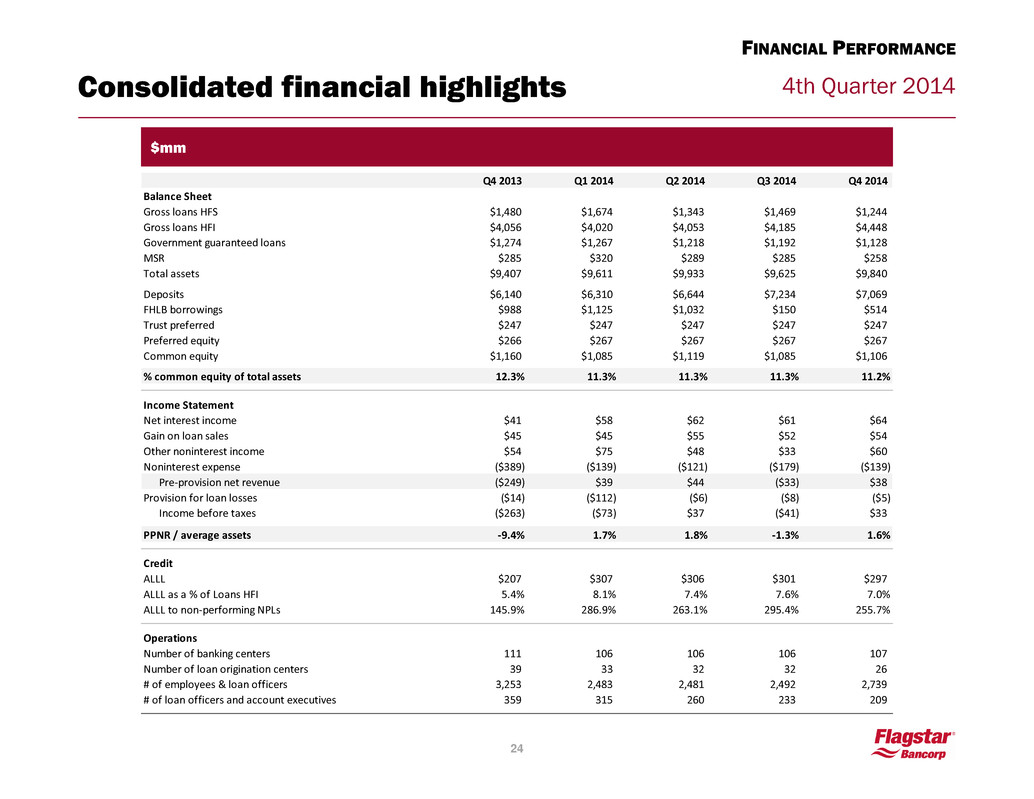
4th Quarter 2014 Consolidated financial highlights 154 7 35 24 FINANCIAL PERFORMANCE $mm Q4 2013 Q1 2014 Q2 2014 Q3 2014 Q4 2014 Balance Sheet Gross loans HFS $1,480 $1,674 $1,343 $1,469 $1,244 Gross loans HFI $4,056 $4,020 $4,053 $4,185 $4,448 Government guaranteed loans $1,274 $1,267 $1,218 $1,192 $1,128 MSR $285 $320 $289 $285 $258 Total assets 11,808 $9,407 $9,611 $9,933 $9,625 $9,840 Deposits $6,140 $6,310 $6,644 $7,234 $7,069 FHLB borrowings $988 $1,125 $1,032 $150 $514 Trust preferred $247 $247 $247 $247 $247 Preferred equity $266 $267 $267 $267 $267 Common equity $1,160 $1,085 $1,119 $1,085 $1,106 % common equity of total assets 12.3% 11.3% 11.3% 11.3% 11.2% Income Statement Net interest income $41 $58 $62 $61 $64 Gain on loan sales $45 $45 $55 $52 $54 Other noninterest income $54 $75 $48 $33 $60 Noninterest expense ($389) ($139) ($121) ($179) ($139) Pre-provision net revenue ($249) $39 $44 ($33) $38 Provision for loan losses ($14) ($112) ($6) ($8) ($5) Income before taxes ($263) ($73) $37 ($41) $33 PPNR / average assets -9.4% 1.7% 1.8% -1.3% 1.6% Credit ALLL $207 $307 $306 $301 $297 ALLL as a % of Loans HFI 5.4% 8.1% 7.4% 7.6% 7.0% ALLL to non-performing NPLs 145.9% 286.9% 263.1% 295.4% 255.7% Operations Number of banking centers 111 106 106 106 107 Number of loan origination centers 39 33 32 32 26 # of employees & loan officers 3,253 2,483 2,481 2,492 2,739 # of loan officers and account executives 359 315 260 233 209

4th Quarter 2014 Deposits Portfolio and strategy overview 5.1 4.9 5.0 5.2 5.3 $6.4 $6.2 $6.5 $7.0 $7.1 Q4 2013 Q1 2014 Q2 2014 Q3 2014 Q4 2014 Retail deposits Other deposits Total average deposits ($bn) +11.6% YOY • Flagstar gathers deposits from consumers, small businesses and select governmental entities – Traditionally, CDs and savings accounts represented the bulk of our branch-based retail depository relationships – Today, we are focused on gathering core DDA deposits from small business and consumers and represents $0.5bn of the overall deposit growth – We additionally maintain depository relationships in connection with our mortgage origination and servicing businesses, and with predominately MI governmental entities – MRQ cost of deposits of 0.58% DDA 11% Savings 47% MMDA 4% CD 12% Company controlled 12% Government & other 14% 74% retail Total : $7.1bn 0.58% MRQ cost of total deposits Q4 2014 total average deposits 25 COMMUNITY BANKING
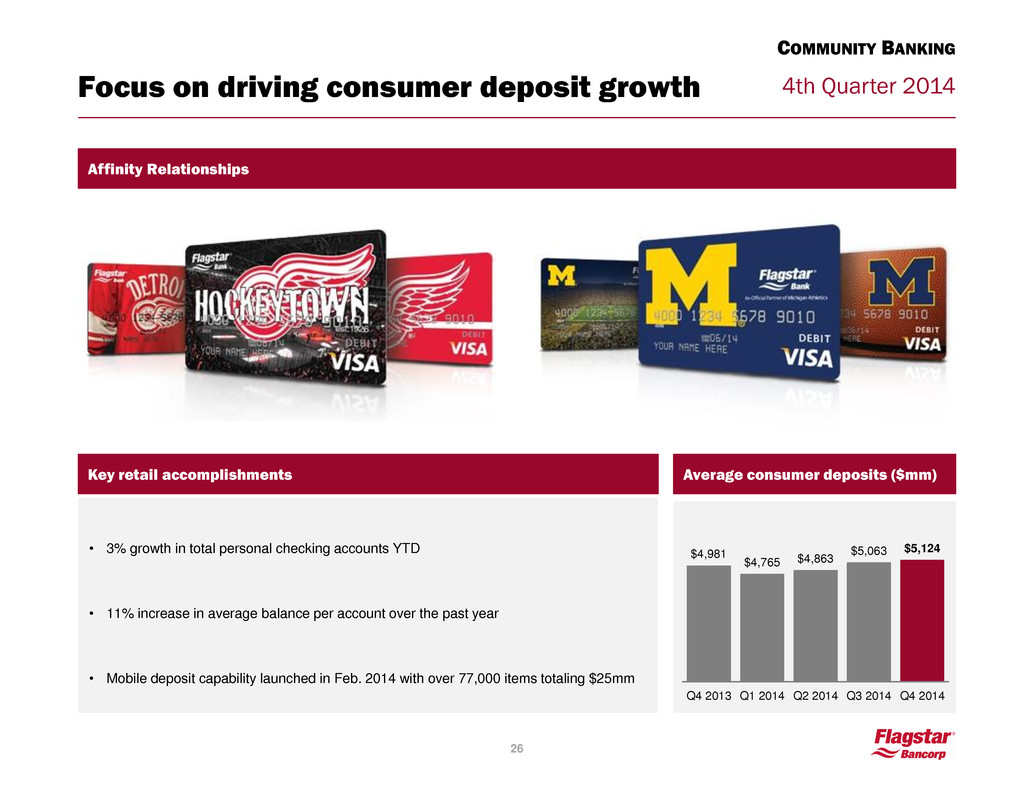
4th Quarter 2014 Focus on driving consumer deposit growth Key retail accomplishments • 3% growth in total personal checking accounts YTD • 11% increase in average balance per account over the past year • Mobile deposit capability launched in Feb. 2014 with over 77,000 items totaling $25mm Average consumer deposits ($mm) $4,981 $4,765 $4,863 $5,063 $5,124 Q4 2013 Q1 2014 Q2 2014 Q3 2014 Q4 2014 26 Affinity Relationships COMMUNITY BANKING

4th Quarter 2014 Deposit channel overviews: Commercial, Company Controlled, Government Average commercial ($mm) $144 $151 $172 $175 $191 Q4 2013 Q1 2014 Q2 2014 Q3 2014 Q4 2014 Average company controlled ($mm) $713 $616 $682 $865 $836 Q4 2013 Q1 2014 Q2 2014 Q3 2014 Q4 2014 Average government ($mm) $550 $674 $803 $944 $994 Q4 2013 Q1 2014 Q2 2014 Q3 2014 Q4 2014 • Arise due to servicing of loans for others and represent the portion of the investor custodial accounts on deposit with the Bank • Approximately $450mm of additional deposits are available at 12/31/2014 to return to our balance sheet once certain conditions are met • MRQ rate: 0.00% (highly efficient funding) • We call on local governmental agencies, and other public units, as an additional source for deposit funding • MRQ rate: 0.43% • Over the past year, treasury management services has driven: – 32% growth in commercial deposits – 102% growth in fee income • MRQ rate: 0.19% 27 COMMUNITY BANKING

4th Quarter 2014 1.6 1.3 1.5 1.7 1.7 4.1 4.0 4.1 4.2 4.2 1.2 1.3 1.2 1.2 1.1 $7.0 $6.6 $6.8 $7.1 $7.0 Q4 2013 Q1 2014 Q2 2014 Q3 2014 Q4 2014 Loans HFS Gross Loans HFI Government Guaranteed Loans 1st Mortgage HFI 32% 2nds, HELOC & other 6% Warehouse 8% CRE and C&I 14% GNMA buyouts 16% 1st Mortgage HFS 24% Q4 2014 average gross loans Lending Portfolio and strategy overview Total average loans ($bn) • Flagstar’s largest category of earning assets consists of loans held-for-investment, currently $4.4bn, gross – Loans to consumers consist of residential first mortgage loans, HELOC and other – C&I / CRE lending is an important growth strategy, offering risk diversification and asset sensitivity – Warehouse loans are extended to other mortgage lenders, offering attractive risk-adjusted returns • Flagstar maintains a balance of mortgage loans held for sale, currently $1.2bn – Essentially all of our mortgage loans produced are sold into the secondary market on a whole loan basis or by securitizing the loans into MBS – Flagstar has the option to direct a portion of the mortgage loans it originates to its own balance sheet • Flagstar also has a portfolio of FHA-insured or guaranteed delinquent loans securitized in Ginnie Mae pools, which it repurchases from time to time 28 COMMUNITY BANKING
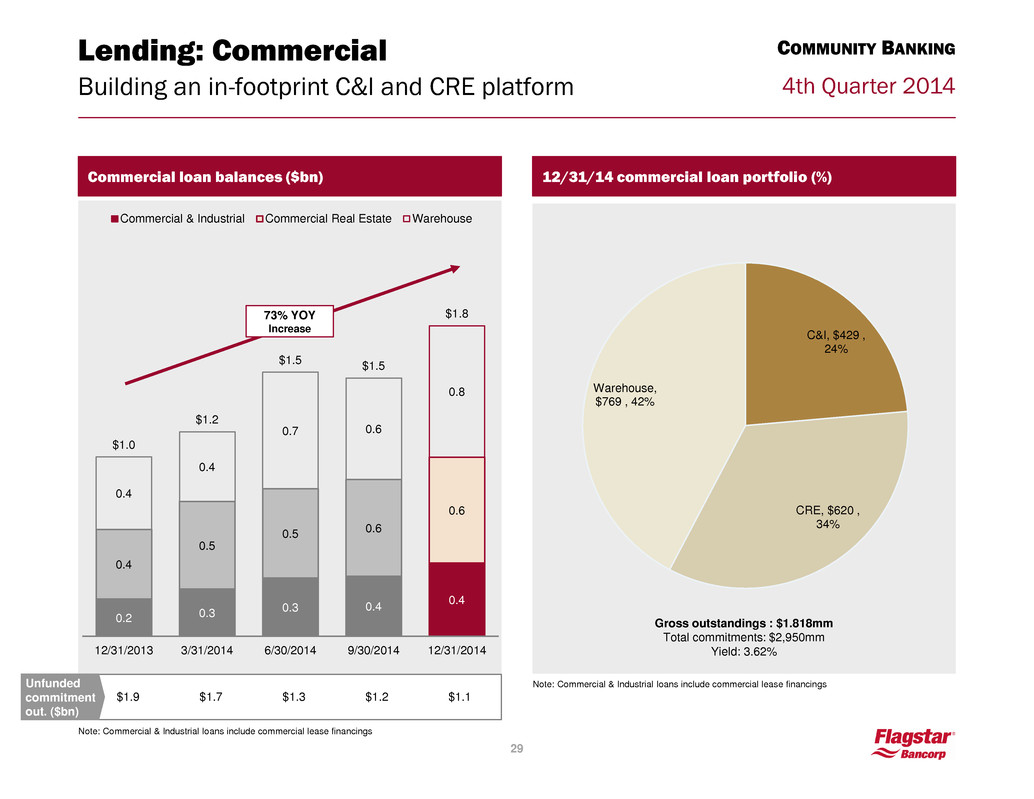
4th Quarter 2014 $1.9 $1.7 $1.3 $1.2 $1.1 C&I, $429 , 24% CRE, $620 , 34% Warehouse, $769 , 42% Gross outstandings : $1.818mm Total commitments: $2,950mm Yield: 3.62% Commercial loan balances ($bn) 154 7 35 0.2 0.3 0.3 0.4 0.4 0.4 0.5 0.5 0.6 0.6 0.4 0.4 0.7 0.6 0.8 $1.0 $1.2 $1.5 $1.5 $1.8 12/31/2013 3/31/2014 6/30/2014 9/30/2014 12/31/2014 Commercial & Industrial Commercial Real Estate Warehouse 73% YOY Increase 12/31/14 commercial loan portfolio (%) Note: Commercial & Industrial loans include commercial lease financings Lending: Commercial Building an in-footprint C&I and CRE platform 29 Unfunded commitment out. ($bn) COMMUNITY BANKING Note: Commercial & Industrial loans include commercial lease financings

4th Quarter 2014 Lending: Commercial Predominately in-footprint and well diversified 30 COMMUNITY BANKING MI 58% SC 11% MN 9% OH 8% CA 7% Other 7% Services 33% Financial / Insurance 34% Manufact. 19% Distribution 13% Govt & Educ. 1% MI 80% CA 4% GA 3% KY 3% NC 2% Other 8% Office 22% Retail 22% Multifamily 16% Industrial 11% Owner- Occupied Real Estate 24% Other 5% CRE ($620mm, 59% of total commercial loans) C&I ($429mm, 41% of total commercial loans) Property type: Property location: Borrower location: Borrower type:

4th Quarter 2014 Mortgages are originated primarily through the correspondent channel 31 Residential mortgage originations by channel ($bn) $4.5 $3.5 $4.4 $5.3 $4.8 Q4 2013 Q1 2014 Q2 2014 Q3 2014 Q4 2014 Correspondent Broker Retail $1.6 $1.1 $1.3 $1.5 $1.5 Q4 2013 Q1 2014 Q2 2014 Q3 2014 Q4 2014 $0.3 $0.2 $0.3 $0.3 $0.3 Q4 2013 Q1 2014 Q2 2014 Q3 2014 Q4 2014 • [ ] employees • $[ ] cost to originate per loan • [ ] brokerage relationships in [ ] states • Top 10 relationships account for [ ]% of overall brokerage volume • Gain on loan sale margin: [ ]% • [ ] employees • $[ ] cost to originate per loan • [ ] standalone home centers in [ ] states (down from 28 in 2010 and 104 in 2008) account for [ ]% of overall retail volume • Consumer direct is [ ]% of retail volume, remainder comes through branches • Gain on loan sale margin: [ ]% • ~800 correspondent partners in 50 states in Q4 2014 • Top 10 relationships account for 18% of overall correspondent volume • Warehouse lines to over 250 correspondent relationships • ~600 brokerage relationships in 50 states in Q4 2014 • Top 10 relationships account for 20% of overall brokerage volume • 26 standalone home centers in 15 states account for 64% of overall retail volume • Consumer direct is 36% of retail volume MORTGAGE ORIGINATIONS
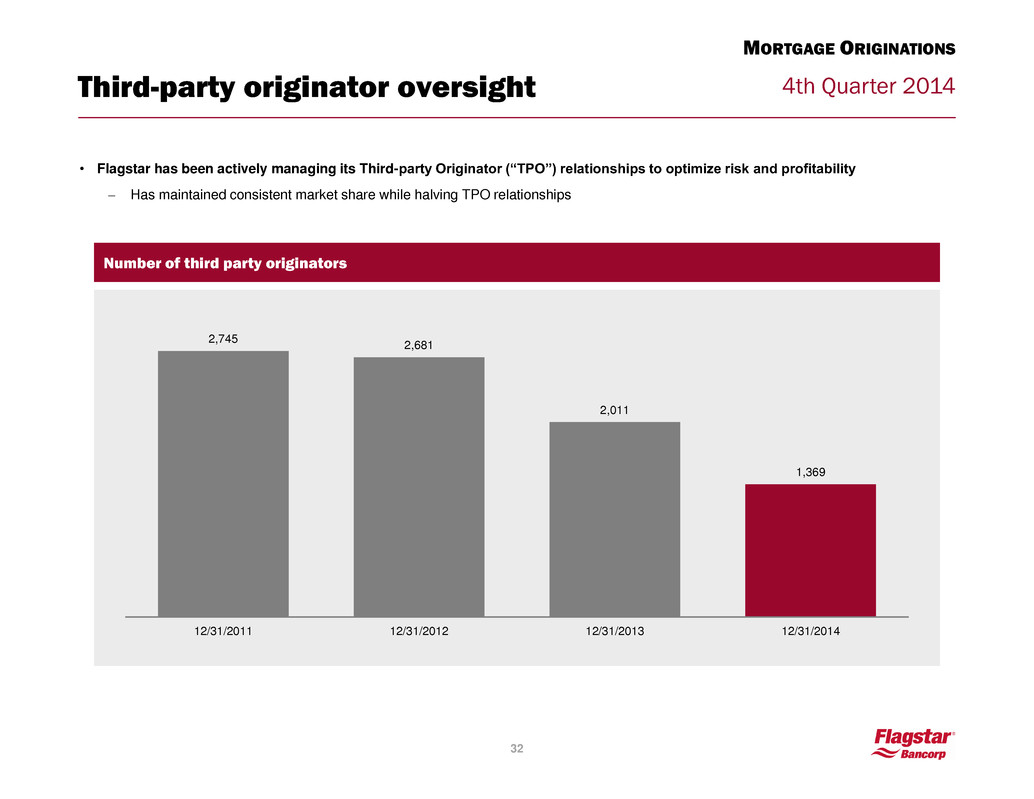
4th Quarter 2014 Third-party originator oversight • Flagstar has been actively managing its Third-party Originator (“TPO”) relationships to optimize risk and profitability – Has maintained consistent market share while halving TPO relationships 32 Number of third party originators 2,745 2,681 2,011 1,369 12/31/2011 12/31/2012 12/31/2013 12/31/2014 MORTGAGE ORIGINATIONS
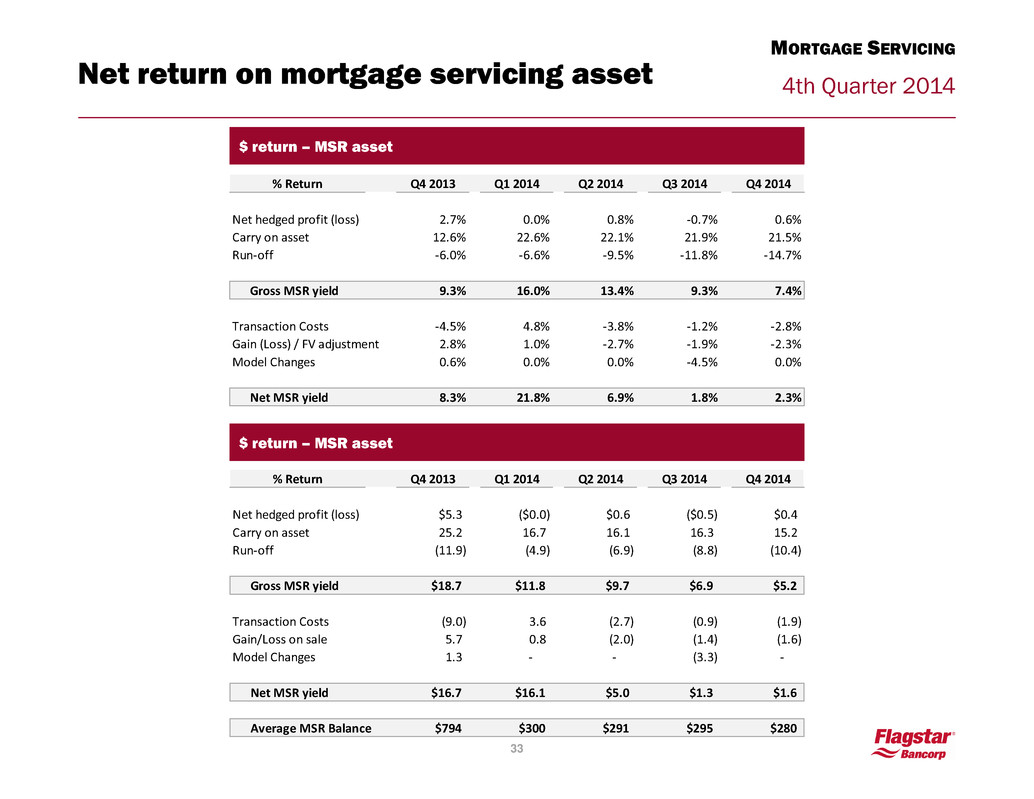
4th Quarter 2014 Net return on mortgage servicing asset MORTGAGE SERVICING 33 $ return – MSR asset % Return Q4 2013 Q1 2014 Q2 2014 Q3 2014 Q4 2014 Net hedged profit (loss) 2.7% 0.0% 0.8% -0.7% 0.6% Carry on asset 12.6% 22.6% 22.1% 21.9% 21.5% Run-off -6.0% -6.6% -9.5% -11.8% -14.7% Gross MSR yield 9.3% 16.0% 13.4% 9.3% 7.4% Transaction Costs -4.5% 4.8% -3.8% -1.2% -2.8% Gain (Loss) / FV adjustment 2.8% 1.0% -2.7% -1.9% -2.3% Model Changes 0.6% 0.0% 0.0% -4.5% 0.0% Net MSR yield 8.3% 21.8% 6.9% 1.8% 2.3% $ return – MSR asset % Return Q4 2013 Q1 2014 Q2 2014 Q3 2014 Q4 2014 Net hedged profit (loss) $5.3 ($0.0) $0.6 ($0.5) $0.4 Carry on asset 25.2 16.7 16.1 16.3 15.2 Run-off (11.9) (4.9) (6.9) (8.8) (10.4) Gross MSR yield $18.7 $11.8 $9.7 $6.9 $5.2 Transaction Costs (9.0) 3.6 (2.7) (0.9) (1.9) Gain/Loss on sale 5.7 0.8 (2.0) (1.4) (1.6) Model Changes 1.3 - - (3.3) - Net MSR yield $16.7 $16.1 $5.0 $1.3 $1.6 Average MSR Balance $794 $300 $291 $295 $280

4th Quarter 2014 Enviable liquidity position Gross loans/deposits Available liquidity/total assets 154 7 35 24% 27% 20% 20% 18% 66% 64% 66% 58% 63% 21% 20% 18% 16% 16% 111% 110% 104% 95% 96% 12/31/2013 3/31/2014 6/30/2014 9/30/2014 12/2013/2014 Gross loans HFS Gross loans HFI Gov. insured loans 34 CAPITAL AND LIQUIDITY 13% 13% 17% 14% 17% 19% 18% 18% 29% 22% 31% 31% 34% 43% 39% 12/31/2013 3/31/2014 6/30/2014 9/30/2014 12/2013/2014 Cash + AFS / assets FHLB borrowing capacity / assets
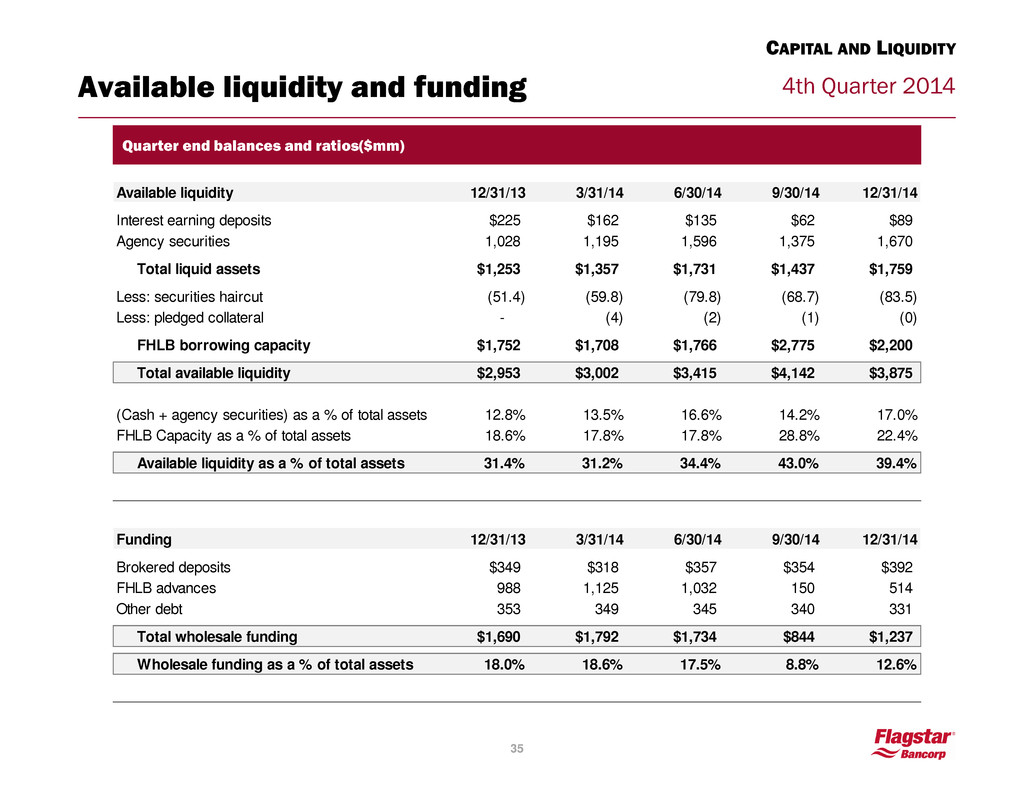
4th Quarter 2014 Available liquidity and funding 154 7 35 35 CAPITAL AND LIQUIDITY Quarter end balances and ratios($mm) Available liquidity 12/31/13 3/31/14 6/30/14 9/30/14 12/31/14 Interest earning deposits $225 $162 $135 $62 $89 Agency securities 1,028 1,195 1,596 1,375 1,670 Total liquid assets $1,253 $1,357 $1,731 $1,437 $1,759 Less: securities haircut (51.4) (59.8) (79.8) (68.7) (83.5) Less: pledged collateral - (4) (2) (1) (0) FHLB borrowing capacity $1,752 $1,708 $1,766 $2,775 $2,200 Total available liquidity $2,953 $3,002 $3,415 $4,142 $3,875 (Cash + agency securities) as a % of total assets 12.8% 13.5% 16.6% 14.2% 17.0% FHLB Capacity as a % of total assets 18.6% 17.8% 17.8% 28.8% 22.4% Available liquidity as a % of total assets 31.4% 31.2% 34.4% 43.0% 39.4% Funding 12/31/13 3/31/14 6/30/14 9/30/14 12/31/14 Brokered deposits $349 $318 $357 $354 $392 FHLB advances 988 1,125 1,032 150 514 Other debt 353 349 345 340 331 Total wholesale funding $1,690 $1,792 $1,734 $844 $1,237 Wholesale funding as a % of total assets 18.0% 18.6% 17.5% 8.8% 12.6%
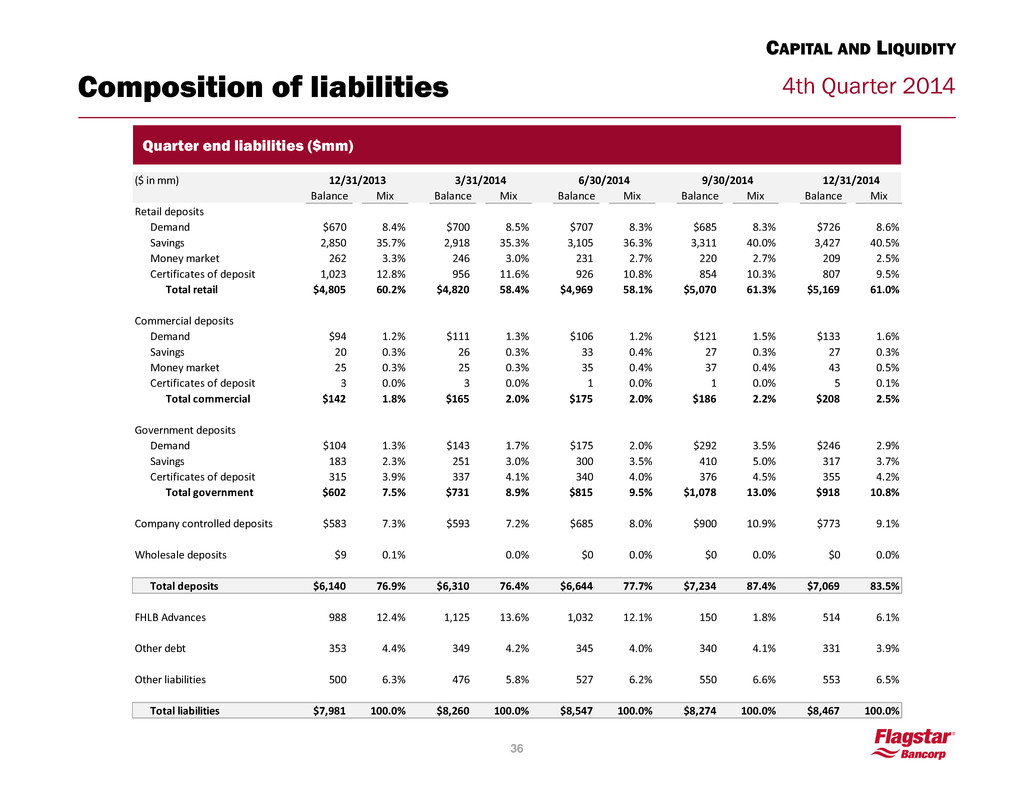
4th Quarter 2014 Composition of liabilities 154 7 35 36 CAPITAL AND LIQUIDITY Quarter end liabilities ($mm) ($ in mm) Balance Mix Balance Mix Balance Mix Balance Mix Balance Mix Retail deposits Demand $670 8.4% $700 8.5% $707 8.3% $685 8.3% $726 8.6% Savings 2,850 35.7% 2,918 35.3% 3,105 36.3% 3,311 40.0% 3,427 40.5% Money market 262 3.3% 246 3.0% 231 2.7% 220 2.7% 209 2.5% Certificates of deposit 1,023 12.8% 956 11.6% 926 10.8% 854 10.3% 807 9.5% Total retail $4,805 60.2% $4,820 58.4% $4,969 58.1% $5,070 61.3% $5,169 61.0% Commercial deposits Demand $94 1.2% $111 1.3% $106 1.2% $121 1.5% $133 1.6% Savings 20 0.3% 26 0.3% 33 0.4% 27 0.3% 27 0.3% Money market 25 0.3% 25 0.3% 35 0.4% 37 0.4% 43 0.5% Certificates of deposit 3 0.0% 3 0.0% 1 0.0% 1 0.0% 5 0.1% Total commercial $142 1.8% $165 2.0% $175 2.0% $186 2.2% $208 2.5% Government deposits Demand $104 1.3% $143 1.7% $175 2.0% $292 3.5% $246 2.9% Savings 183 2.3% 251 3.0% 300 3.5% 410 5.0% 317 3.7% Certificates of deposit 315 3.9% 337 4.1% 340 4.0% 376 4.5% 355 4.2% Total government $602 7.5% $731 8.9% $815 9.5% $1,078 13.0% $918 10.8% Company controlled deposits $583 7.3% $593 7.2% $685 8.0% $900 10.9% $773 9.1% Wholesale deposits $9 0.1% 0.0% $0 0.0% $0 0.0% $0 0.0% Total deposits $6,140 76.9% $6,310 76.4% $6,644 77.7% $7,234 87.4% $7,069 83.5% FHLB Advances 988 12.4% 1,125 13.6% 1,032 12.1% 150 1.8% 514 6.1% Other debt 353 4.4% 349 4.2% 345 4.0% 340 4.1% 331 3.9% Other liabilities 500 6.3% 476 5.8% 527 6.2% 550 6.6% 553 6.5% Total liabilities $7,981 100.0% $8,260 100.0% $8,547 100.0% $8,274 100.0% $8,467 100.0% 12/31/2013 3/31/2014 6/30/2014 9/30/2014 12/31/2014
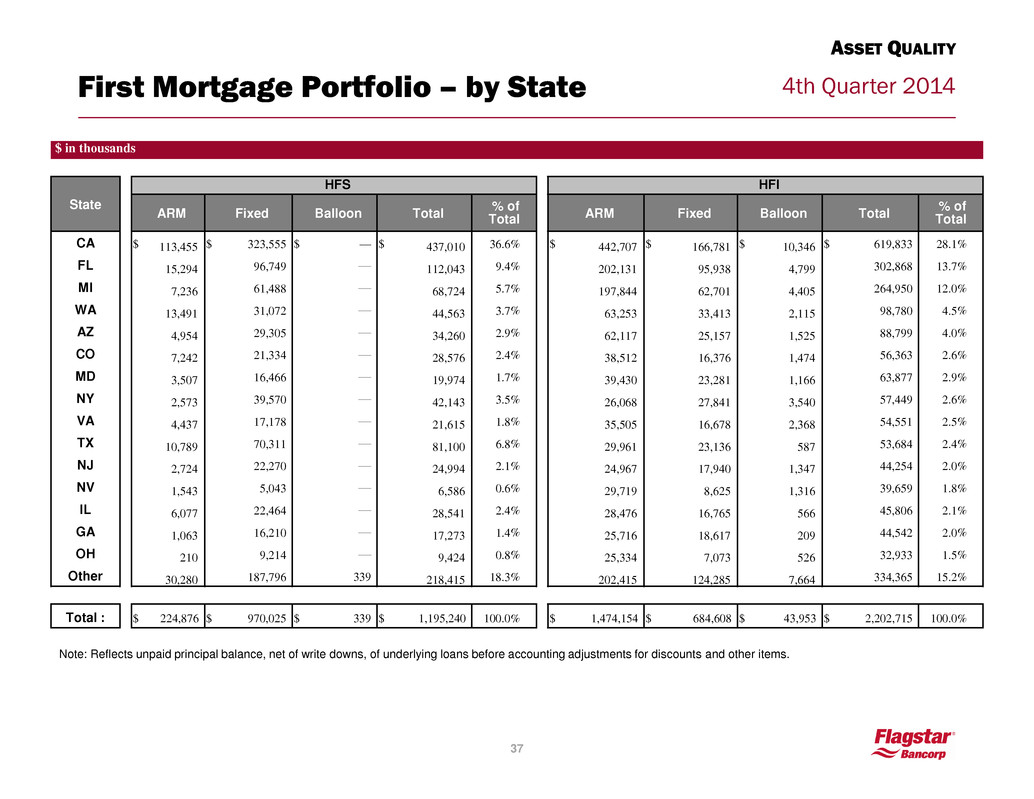
4th Quarter 2014 First Mortgage Portfolio – by State Note: Reflects unpaid principal balance, net of write downs, of underlying loans before accounting adjustments for discounts and other items. $ in thousands State HFS HFI ARM Fixed Balloon Total % of Total ARM Fixed Balloon Total % of Total CA $ 113,455 $ 323,555 $ — $ 437,010 36.6 % $ 442,707 $ 166,781 $ 10,346 $ 619,833 28.1 % FL 15,294 96,749 — 112,043 9.4 % 202,131 95,938 4,799 302,868 13.7 % MI 7,236 61,488 — 68,724 5.7 % 197,844 62,701 4,405 264,950 12.0 % WA 13,491 31,072 — 44,563 3.7 % 63,253 33,413 2,115 98,780 4.5 % AZ 4,954 29,305 — 34,260 2.9 % 62,117 25,157 1,525 88,799 4.0 % CO 7,242 21,334 — 28,576 2.4 % 38,512 16,376 1,474 56,363 2.6 % MD 3,507 16,466 — 19,974 1.7 % 39,430 23,281 1,166 63,877 2.9 % NY 2,573 39,570 — 42,143 3.5 % 26,068 27,841 3,540 57,449 2.6 % VA 4,437 17,178 — 21,615 1.8 % 35,505 16,678 2,368 54,551 2.5 % TX 10,789 70,311 — 81,100 6.8 % 29,961 23,136 587 53,684 2.4 % NJ 2,724 22,270 — 24,994 2.1 % 24,967 17,940 1,347 44,254 2.0 % NV 1,543 5,043 — 6,586 0.6 % 29,719 8,625 1,316 39,659 1.8 % IL 6,077 22,464 — 28,541 2.4 % 28,476 16,765 566 45,806 2.1 % GA 1,063 16,210 — 17,273 1.4 % 25,716 18,617 209 44,542 2.0 % OH 210 9,214 — 9,424 0.8 % 25,334 7,073 526 32,933 1.5 % Other 30,280 187,796 339 218,415 18.3 % 202,415 124,285 7,664 334,365 15.2 % Total : $ 224,876 $ 970,025 $ 339 $ 1,195,240 100.0 % $ 1,474,154 $ 684,608 $ 43,953 $ 2,202,715 100.0 % ASSET QUALITY 37

4th Quarter 2014 First Mortgage Portfolio – by Vintage Note: Reflects unpaid principal balance, net of write downs, of underlying loans before accounting adjustments for discounts and other items. $ in thousands Year HFS HFI ARM Fixed Balloon Total % of Total ARM Fixed Balloon Total % of Total Older $ 158 $ 476 $ — $ 633 0.1 % $ 33,649 $ 17,743 $ 1,318 $ 52,710 2.4 % 2003 — — — — 0.0 % 110,901 15,247 1,464 127,612 5.8 % 2004 438 54 — 492 0.0 % 353,584 28,547 3,862 385,993 17.5 % 2005 812 726 — 1,538 0.1 % 415,652 35,015 7,011 457,678 20.8 % 2006 — 1,913 — 1,913 0.2 % 87,645 82,444 7,381 177,471 8.1 % 2007 234 7,679 339 8,252 0.7 % 216,628 324,698 21,311 562,637 25.5 % 2008 — 6,545 — 6,545 0.5 % 9,502 73,145 1,546 84,193 3.8 % 2009 — 6,165 — 6,165 0.5 % 6,184 29,533 — 35,717 1.6 % 2010 — 2,659 — 2,659 0.2 % 6,692 10,219 — 16,911 0.8 % 2011 — 1,672 — 1,672 0.1 % 13,332 11,004 60 24,396 1.1 % 2012 — 219 — 219 0.0 % 7,947 13,479 — 21,425 1.0 % 2013 9,128 1,541 — 10,670 0.9 % 30,147 15,595 — 45,742 2.1 % 2014 214,106 940,376 — 1,154,482 96.6 % 182,290 27,940 — 210,229 9.5 % Total : $ 224,876 $ 970,025 $ 339 $ 1,195,240 100.0 % $ 1,474,154 $ 684,608 $ 43,953 $ 2,202,715 100.0 % ASSET QUALITY 38

4th Quarter 2014 First Mortgage Portfolio – by Original FICO Note: Reflects unpaid principal balance, net of write downs, of underlying loans before accounting adjustments for discounts and other items. $ in thousands FICO HFS HFI ARM Fixed Balloon Total % of Total ARM Fixed Balloon Total % of Total < 580 $ 124 $ 3,416 $ — $ 3,539 0.3 % $ 14,847 $ 19,136 $ 327 $ 34,310 1.6 % 580 - 619 275 11,531 — 11,806 1.0 % 16,955 36,025 1,359 54,340 2.5 % 620 - 659 4,400 127,669 — 132,068 11.0 % 83,047 70,686 2,661 156,395 7.1 % 660 - 699 17,000 207,224 — 224,224 18.8 % 341,717 168,654 15,276 525,647 23.9 % > 699 203,078 620,186 339 823,602 68.9 % 1,017,588 390,107 24,329 1,432,024 65.0 % Total : $ 224,876 $ 970,025 $ 339 $ 1,195,240 100.0 % $ 1,474,154 $ 684,608 $ 43,953 $ 2,202,715 100.0 % ASSET QUALITY 39

4th Quarter 2014 First Mortgage Portfolio – by Original LTV Note: Reflects unpaid principal balance, net of write downs, of underlying loans before accounting adjustments for discounts and other items. $ in thousands Original LTV HFS HFI ARM Fixed Balloon Total % of Total ARM Fixed Balloon Total % of Total <=70.00% $ 99,972 $ 226,235 $ — $ 326,207 27.3 % $ 422,567 $ 185,731 $ 10,754 $ 619,052 28.1 % >70.00% - 79.99% 84,778 251,090 — 335,868 28.1 % 885,726 336,748 24,598 1,247,073 56.6 % >80.00% - 89.99% 17,155 115,834 339 133,327 11.2 % 91,044 63,742 6,352 161,137 7.3 % >90.00% - 99.99% 22,374 356,694 — 379,069 31.7 % 73,683 90,933 2,249 166,865 7.6 % 100.00% -109.99% 598 14,568 — 15,166 1.3 % 767 4,673 — 5,439 0.2 % 110.00% -124.99% — 3,257 — 3,257 0.3 % 367 2,266 — 2,633 0.1 % >125.00% — 2,346 — 2,346 0.2 % — 516 — 516 0.0 % Total: $ 224,876 $ 970,025 $ 339 $ 1,195,240 100.0 % $ 1,474,154 $ 684,608 $ 43,953 $ 2,202,715 100.0 % ASSET QUALITY 40

4th Quarter 2014 First Mortgage Portfolio – by HPI Adjusted LTV Note: Reflects unpaid principal balance, net of write downs, of underlying loans before accounting adjustments for discounts and other items. The housing price index (HPI adjusted) LTV is updated from the original LTV based on Metropolitan Statistical Area-level Office of Federal Housing Enterprise Oversight (OFHEO) data. $ in thousands HPI Adjusted LTV HFS HFI ARM Fixed Balloon Total % of Total ARM Fixed Balloon Total % of Total <=70.00% $ 106,415 $ 233,219 $ — $ 339,633 28.4 % $ 705,585 $ 233,929 $ 10,723 $ 950,237 43.1 % 70.00% - 79.99% 78,440 246,194 — 324,633 27.2 % 331,088 120,728 6,061 457,877 20.8 % 80.00% - 89.99% 16,902 121,729 339 138,969 11.6 % 205,044 138,154 8,939 352,138 16.0 % 90.00% - 99.99% 22,004 293,921 — 315,924 26.4 % 137,648 100,067 11,267 248,982 11.3 % 100.00% -109.99% 1,116 64,998 — 66,114 5.5 % 59,904 49,822 2,303 112,028 5.1 % 110.00% -124.99% — 5,801 — 5,801 0.5 % 27,194 29,079 3,904 60,176 2.7 % >=125.00% — 4,164 — 4,164 0.3 % 7,690 12,829 756 21,275 1.0 % Total : $ 224,876 $ 970,025 $ 339 $ 1,195,240 100.0 % $ 1,474,154 $ 684,608 $ 43,953 $ 2,202,715 100.0 % ASSET QUALITY 41

4th Quarter 2014 2015 2016 2017 Thereafter Total State Number of Loans UPB Number of Loans UPB Number of Loans UPB Number of Loans UPB Number of Loans UPB Percent CA 217 $85.2 34 $13.7 164 $94.3 9 $3.9 424 $197.0 31.4% FL 264 62.2 48 12.3 49 21.2 8 1.8 369 97.6 15.5% MI 86 17.4 10 2.5 17 5.5 457 26.2 570 51.5 8.2% WA 61 16.3 16 4.3 36 16.8 5 1.3 118 38.7 6.2% AZ 79 19.5 14 3.4 30 14.9 2 0.5 125 38.2 6.1% CO 32 7.0 7 1.7 13 6.5 1 0.2 53 15.3 2.4% MD 34 11.6 10 3.3 20 10.0 2 0.6 66 25.5 4.1% NY 18 6.3 4 1.4 6 2.3 2 0.6 30 10.6 1.7% VA 36 11.9 3 1.0 11 6.0 — — 50 18.8 3.0% TX 8 1.3 — — 4 2.6 1 0.8 13 4.7 0.7% NJ 17 4.4 3 0.9 4 1.8 1 0.2 25 7.3 1.2% NV 36 9.0 — — 9 3.1 — — 45 12.0 1.9% Other 244 61.2 49 11.0 85 36.4 9 2.1 387 110.7 17.6% Total 1,134 $313.2 198 $55.3 448 $221.2 497 $38.2 2,275 $628.0 100.0% Interest-only loan portfolio Concentrated in states with high home price appreciation 42 Geographic mix by amortization date and payment shock by year Note: Reflects unpaid principal balance, net of write downs, of underlying loans before accounting adjustments for discounts and other items; Population is fixed as of 12/31/2011; Excludes any resolutions ASSET QUALITY Home price appreciation by state State 1 year National Rank CA 8.12% 3 FL 7.85% 5 All 4.55% N/A *FHFA Q3 2014 HPI Index House Price Appreciation by State Source: FHFA Q3 2014 HPI Index

4th Quarter 2014 Non-performing Loans HFI – by State Note: Non-performing loans include 90+ days delinquent and matured, and performing non-accruals. Excludes participations and first mortgage repurchases. $ in thousands State Mortgage Percent of Mortgage Second Mortgage HELOC Consumer Total Percent of Total CA $ 22,200 19.3 % $ 338 $ 528 $ — $ 23,066 19.1 % FL 20,854 18.1 % 275 384 — 21,512 17.9 % NY 10,752 9.3 % 86 210 — 11,048 9.2 % NJ 6,499 5.6 % — 213 — 6,713 5.6 % MI 6,269 5.4 % 552 679 117 7,617 6.3 % WA 4,516 3.9 % 25 — — 4,542 3.8 % MD 4,125 3.6 % 88 55 — 4,267 3.5 % TX 3,958 3.4 % 41 — 1 4,000 3.3 % IL 3,663 3.2 % 20 — — 3,683 3.1 % VA 3,294 2.9 % 34 — — 3,329 2.8 % CO 2,248 2.0 % 18 145 — 2,411 2.0 % HI 2,018 1.8 % — 186 — 2,204 1.8 % NV 2,004 1.7 % — 79 — 2,083 1.7 % OH 1,983 1.7 % 22 20 — 2,024 1.7 % MA 1,851 1.6 % 89 146 — 2,086 1.7 % Other 18,859 16.4 % 467 578 3 19,906 16.5 % Total $ 115,093 100.0 % $ 2,054 $ 3,222 $ 121 $ 120,491 100.0 % ASSET QUALITY 43

4th Quarter 2014 Non-performing Loans HFI – by Vintage Note: Non-performing loans include 90+ days delinquent and matured, and performing non-accruals. Excludes participations and first mortgage repurchases. $ in thousands Vintage First Mortgage Percent of Mortgage Second Mortgage HELOC Other Consumer Total Percent of Total Older $ 8,704 7.6 % $ 213 $ 39 $ 3 $ 8,959 7.4 % 2004 18,958 16.5 % 203 684 2 19,848 16.5 % 2005 12,017 10.4 % 362 1,106 12 13,497 11.2 % 2006 9,800 8.5 % 39 833 5 10,678 8.9 % 2007 36,931 32.1 % 1,016 520 4 38,472 31.9 % 2008 19,556 17.0 % — — 1 19,557 16.2 % 2009 3,435 3.0 % 40 — — 3,475 2.9 % 2010 1,866 1.6 % 106 — 31 2,003 1.7 % 2011 1,667 1.4 % 75 — 0 1,742 1.4 % 2012 — 0.0 % — — 6 46 0.0 % 2013 713 0.6 % — — 7 720 0.06 % 2014 1,444 1.3 % — — 50 1,494 1.2 % Total $ 115,093 100.0 % $ 2,054 $ 3,222 $ 121 $ 120,491 100.0 % ASSET QUALITY 44

4th Quarter 2014 Supplemental capital ratios 45 12/31/2014 9/30/2014 12/31/2013 Mortgage servicing rights $257.8 $285.4 $284.7 Tier 1 Capital $1,183.6 $1,146.2 $1,280.5 MSR to Tier 1 ratio 21.8% 24.9% 22.2% $mm NON-GAAP RECONCILIATION $mm Common Equity Tier 1 Leverage Tier 1 (to Risk (to Adjusted Flagstar Bancorp (the Company) Weighted Assets) Tangible Assets)(1) as of December 31, 2014 Basel I regulatory capital $670 $1,184 Increased deductions related to deferred tax assets, mortgage servicing assets, and other capital components ($205) ($209) Basel III regulatory capital (fully phased-in)(2) $464 $975 Basel risk weighted I assets $5,190 $9,403 Net change in assets ($98) $109 Basel III risk weighted assets (fully phased-in)(2) $5,092 $9,512 Basel I capital ratios(3) 12.90% 12.59% Basel III capital ratios (fully phased-in)(2) 9.12% 10.25% 1) The definition of total assets used in the calculation of the Tier 1 Leverage ratio changed from ending total assets under Basel I to quarterly average total assets under Basel III. 2) Basel III information is considered estimated and not final at this time as the Basel III rules continue to be subject to interpretation by U.S. Banking Regulators. 3) The Bank is currently subject to the requirements of Basel I.

4th Quarter 2014 Adjusted efficiency ratio and earnings per share 46 $mm 1) Significant item for charge for government loan indemnification for the third quarter 2014 located in representation and warranty reserve-change in estimate. 2) Significant item for charge for CFPB CID - related costs for the third and second quarter of 2014 located in legal and professional expense. 3) Significant item for charge for CFPB settlement for the third quarter 2014 located in other noninterest expense. NON-GAAP RECONCILIATION Q4 2014 Q3 2014 Q2 2014 Q1 2014 Q4 2013 Net interest income (a) $61.3 $64.4 $62.4 $58.2 $41.2 Noninterest income (b) 98.4 85.2 102.5 75.0 113.1 Less provisions: Representation and warranty reserve - change in estimate (6.1) 2.2 5.2 (1.7) 9.5 Adjusting items : Loan fees and charges - - (10.0) - - Net impairment loss recognized through earnings - - - Representation and warranty reserve – change in estimate (one time)(1) - 10.4 (24.9) Other noninterest income - - 21.1 - Adjusted noninterest income $98.4 $95.6 $92.5 $96.0 $88.2 Adjusted income (c) $153.7 $162.1 $160.1 $152.6 $138.9 Noninterest expense (d) $139.3 $179.4 $121.4 $139.3 $388.7 Adjusting items : Loss on extinguishment of debt - - - - (177.6) Legal and professional expense(2) (1.1) (2.9) - - Other noninterest expense(3) - (37.5) 10.0 - (61.0) Adjusted noninterest expense (e) $139.3 $140.8 $128.5 $139.3 $150.1 Efficiency ratio (d/(a+b)) 87.2% 120.0% 73.6% 104.6% 251.8% Efficiency ratio (adjusted) (e/c) 90.6% 86.8% 80.2% 91.3% 108.1% Net (loss) income applicable to common stockholders $11.1 ($27.6) $25.5 ($78.9) $160.5 Adjustment to remove adjusting items - 49.0 (17.1) 21.1 213.7 Tax impact of adjusting items - (13.6) 6.0 (7.4) (54.5) Adjusting tax item - - - - (355.8) Adjusted net (loss) income applicable to common stockholders $11.1 $7.7 $14.4 ($65.2) ($36.1) Diluted (loss) income per share $0.07 ($0.61) $0.33 ($1.51) $2.77 Adjustment to remove adjusting items - 0.86 (0.31) 0.38 3.77 Tax impact of adjusting items - (0.24) 0.11 (0.13) (0.96) Adjusting tax item - - - - (6.28) Diluted adjusted (loss) income per share $0.07 $0.01 $0.13 ($1.26) ($0.70) Weighted average shares outstanding Basic 56,310,858 56,249,300 56,230,458 56,194,184 56,126,895 Diluted 56,792,751 56,249,300 56,822,102 56,194,184 56,694,096
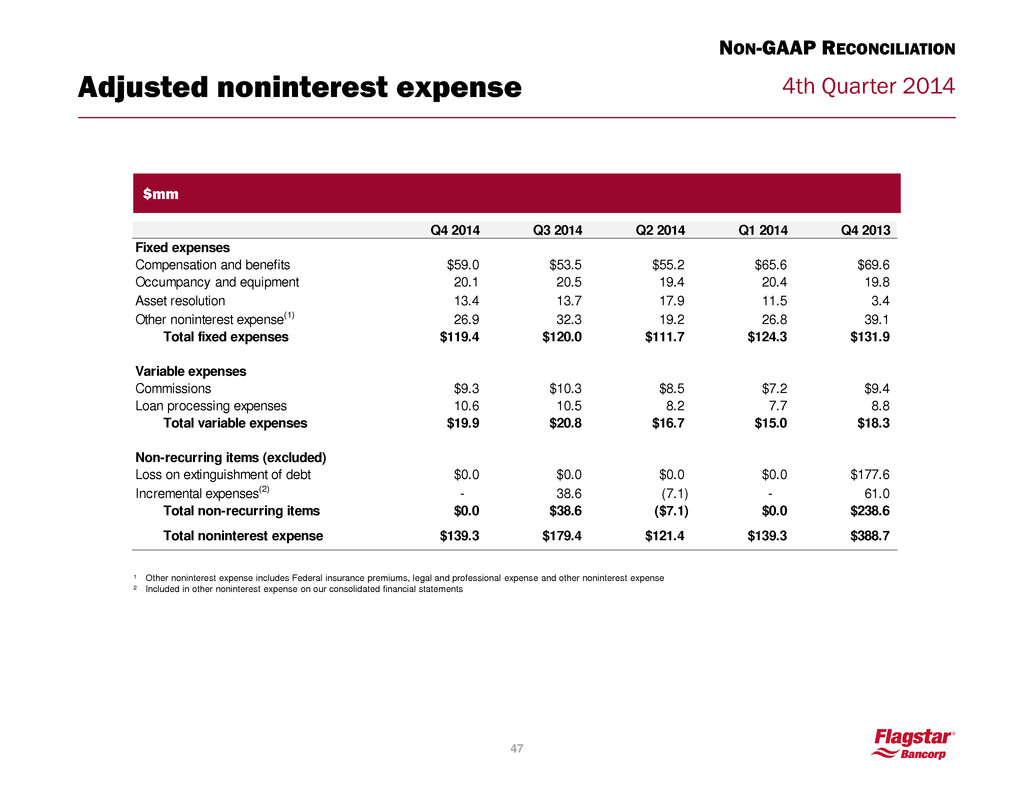
4th Quarter 2014 Adjusted noninterest expense 47 ¹ Other noninterest expense includes Federal insurance premiums, legal and professional expense and other noninterest expense ² Included in other noninterest expense on our consolidated financial statements $mm Q4 2014 Q3 2014 Q2 2014 Q1 2014 Q4 2013 Fixed expenses Compensation and benefits $59.0 $53.5 $55.2 $65.6 $69.6 Occumpancy and equipment 20.1 20.5 19.4 20.4 19.8 Asset resolution 13.4 13.7 17.9 11.5 3.4 Other noninterest expense(1) 26.9 32.3 19.2 26.8 39.1 Total fixed expenses $119.4 $120.0 $111.7 $124.3 $131.9 Variable expenses Commissions $9.3 $10.3 $8.5 $7.2 $9.4 Loan processing expenses 10.6 10.5 8.2 7.7 8.8 Total variable expenses $19.9 $20.8 $16.7 $15.0 $18.3 Non-recurring items (excluded) Loss on extinguishment of debt $0.0 $0.0 $0.0 $0.0 $177.6 Incremental expenses(2) - 38.6 (7.1) - 61.0 Total non-recurring items $0.0 $38.6 ($7.1) $0.0 $238.6 Total noninterest expense $139.3 $179.4 $121.4 $139.3 $388.7 NON-GAAP RECONCILIATION


