4th Quarter 2015 Flagstar Bancorp, Inc. (NYSE: FBC) Earnings Presentation 4th Quarter 2015 January 26, 2016
4th Quarter 2015 Cautionary statement This presentation contains "forward-looking statements" within the meaning of the Private Securities Litigation Reform Act of 1995, as amended. Forward-looking statements are based on management’s current expectations and assumptions regarding the Company’s business and performance, the economy and other future conditions, and forecasts of future events, circumstances and results. However, they are not guarantees of future performance and are subject to known and unknown risks, uncertainties, contingencies and other factors. Generally, forward-looking statements are not based on historical facts but instead represent our management’s beliefs regarding future events. Such statements may be identified by words such as believe, expect, anticipate, intend, plan, believe, estimate, may increase, may fluctuate, and similar expressions or future or conditional verbs such as will, should, would and could. Such statements are based on management’s current expectations and are subject to risks, uncertainties and changes in circumstances. Actual results and capital and other financial conditions may differ materially from those included in these statements due to a variety of factors, including without limitation those found in periodic Flagstar reports filed with the U.S. Securities and Exchange Commission, which are available on the Company’s website (flagstar.com) and on the Securities and Exchange Commission's website (sec.gov). Any forward-looking statements made by or on behalf of us speak only as to the date they are made, and we do not undertake to update forward-looking statements to reflect the impact of circumstances or events that arise after the date the forward-looking statements were made, except as required under United States securities laws. 2
4th Quarter 2015 Executive Overview Sandro DiNello, CEO

4th Quarter 2015 Progress on strategic initiatives 4 Focus on growth and diversification of earnings Expand mortgage originations • Accelerate growth in distributed and direct-to-consumer retail origination channels • Optimize fulfillment resources and secondary marketing execution to improve profitability Grow community banking • Refresh the Flagstar brand to build awareness and grow core deposit and lending relationships • Align lending platforms and develop complementary product offerings • Grow earning assets with high quality assets Enhance efficiency • Position bank to generate positive operating leverage • Drive productivity and revenue improvements to achieve long-term goal of mid-60’s efficiency ratio Sustain risk management • Maintain strong risk management and compliance culture • Exit regulatory orders Optimize capital structure • Redeem TARP (anticipated no later than 2nd half 2016) • Execute MSR reduction plan to meet Basel III phase-in target

4th Quarter 2015 Financial Overview Jim Ciroli, CFO

4th Quarter 2015 4th quarter key highlights Strong profitability • Net income of $33 million, $0.44 per diluted share, in 4Q15 - Down $14 million, $0.25 per diluted share vs. 3Q15 on lower mortgage revenues - Up $22 million, or $0.37 per diluted share vs. 4Q14 on higher net interest income, lower expenses and provision benefit - Returns on assets and equity up significantly vs. the same period last year Higher net interest income • Net interest income increased $3 million to $76 million, up 4% from 3Q15 and up 25% from 4Q14 - Average earning assets increased 5% led by growth in loans held for sale, CRE and residential mortgage loans - Net interest margin decreased 6bps to 2.69% Expense discipline • Noninterest expense decreased $2 million to $129 million, down 2% from 3Q15 - Commissions and loan processing expense declined on lower mortgage closings - Federal insurance premiums declined reflecting improved risk profile - Asset resolution expense remained low but increased slightly reflecting a prior quarter reimbursement benefit Improved asset quality • Net charge-offs and consumer delinquencies fell on solid credit performance - Adjusted charge-offs were $7mm or 51 bps - $1 million provision benefit - Allowance to loans held-for-investment remained strong at 3.0% Robust capital • Tier 1 leverage remains solid at 11.5% • On-balance sheet liquidity equal to 18.8% of total assets(1) 1) Liquid assets include interest earning deposits and investment securities; a 5% haircut is applied to investment securities to estimate liquidation costs. 6
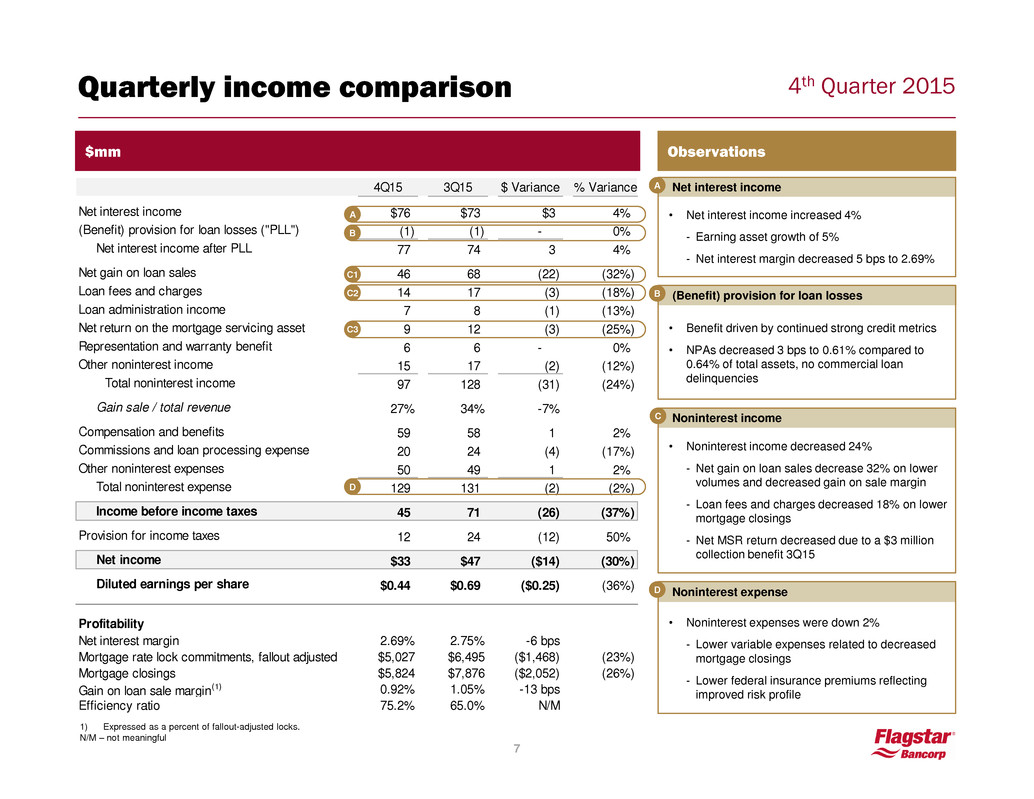
4th Quarter 2015 (Benefit) provision for loan losses • Benefit driven by continued strong credit metrics • NPAs decreased 3 bps to 0.61% compared to 0.64% of total assets, no commercial loan delinquencies B Quarterly income comparison $mm Observations 7 Noninterest income • Noninterest income decreased 24% - Net gain on loan sales decrease 32% on lower volumes and decreased gain on sale margin - Loan fees and charges decreased 18% on lower mortgage closings - Net MSR return decreased due to a $3 million collection benefit 3Q15 C Net interest income • Net interest income increased 4% - Earning asset growth of 5% - Net interest margin decreased 5 bps to 2.69% A 1) Expressed as a percent of fallout-adjusted locks. N/M – not meaningful Noninterest expense • Noninterest expenses were down 2% - Lower variable expenses related to decreased mortgage closings - Lower federal insurance premiums reflecting improved risk profile D 4Q15 3Q15 $ Variance % Variance Net interest income $76 $73 $3 4% (Benefit) provision for loan losses ("PLL") (1) (1) - 0% Net interest income after PLL 77 74 3 4% Net gain on loan sales 46 68 (22) (32%) Loan fees and charges 14 17 (3) (18%) Loan administration income 7 8 (1) (13%) Net return on the mortgage servicing asset 9 12 (3) (25%) Representation and warranty benefit 6 6 - 0% Other noninterest income 15 17 (2) (12%) Total noninterest income 97 128 (31) (24%) Gain sale / total revenue 27% 34% -7% Compensation and benefits 59 58 1 2% Commissions and loan processing expense 20 24 (4) (17%) Other noninterest expenses 50 49 1 2% Total noninterest expense 129 131 (2) (2%) Income before income taxes 45 71 (26) (37%) Provision for income taxes 12 24 (12) 50% Net income $33 $47 ($14) (30%) Diluted earnings per share $0.44 $0.69 ($0.25) (36%) Profitability Net interest margi 2.69% 2.75% -6 bps Mortgage rate lock commitments, fallout adjusted $5,027 $6,495 ($1,468) (23%) Mortgage closings $5,824 $7,876 ($2,052) (26%) Gain on loan sale margin(1) 0.92% 1.05% -13 bps Efficiency ratio 75.2% 65.0% N/M A B C2 D C1 C3

4th Quarter 2015 Book value per share • Price to book ratio of 86% based on closing price as of January 25, 2016 1) Measured vs. the prior quarter. 2) Consumer loans include second mortgage, HELOC and other loans; commercial loans include commercial real estate, commercial & industrial. 3) Other earning assets include interest earning deposits, investment securities and loans with government guarantees. 4) Book value per share has not been reduced for $86 million of unpaid dividends on our perpetual preferred stock, which has been deferred. If these dividends were paid, book value per share would be reduced by $1.53 per share. 5) Funding ratios are calculated on average balances; equity ratio is calculated on ending period balances. Strong balance sheet(5) • Deposits are a significant portion of our funding - Total deposits equaled 72% of liabilities - Retail deposits equaled 51% of liabilities • Common equity / assets of 9.2% Balance sheet highlights $mm Observations Balance sheet growth • Average balance sheet grew $0.5 billion or 4% • Total average loans increased 6% - Commercial loans rose 9% with commercial real estate loans up 17% - Loans held for sale increased 13% 8 $ $ % $ $ % Loans held-for-sale $2,484 $284 13% $2,576 $168 7% Consumer loans (2) 3,423 56 2% 3,650 347 11% Commercial loans (2) 2,219 174 9% 2,702 491 22% Total loans held-for-investment 5,642 230 4% 6,352 838 15% Other earning assets (3) 3,114 33 1% 3,201 304 10% Interest-earning assets $11,240 547 5% $12,129 1,310 12% Other assets 1,585 (27) (2%) 1,586 (114) (7%) Total assets $12,825 $520 4% $13,715 $1,196 10% Deposits $8,132 (128) (2%) $7,935 (202) (2%) FHLB advances 2,445 650 36% 3,541 1,517 75% Other liabilities 701 (39) (5%) 711 (144) (17%) Total liabilities $11,278 483 4% $12,187 1,171 11% Preferred Equity 267 - 0% 267 - 0% Common Equity 1,280 37 3% 1,261 25 2% Total liabilities and equity $12,825 $520 4% $13,715 $1,196 10% Common equity-to-asset ratio 10.0% 9.2% Book value per c mmon share (4) $22.33 $0.42 Incr (Decr) (1) Average Balance Sheet Ending Balance Sheet Incr (Decr) (1)
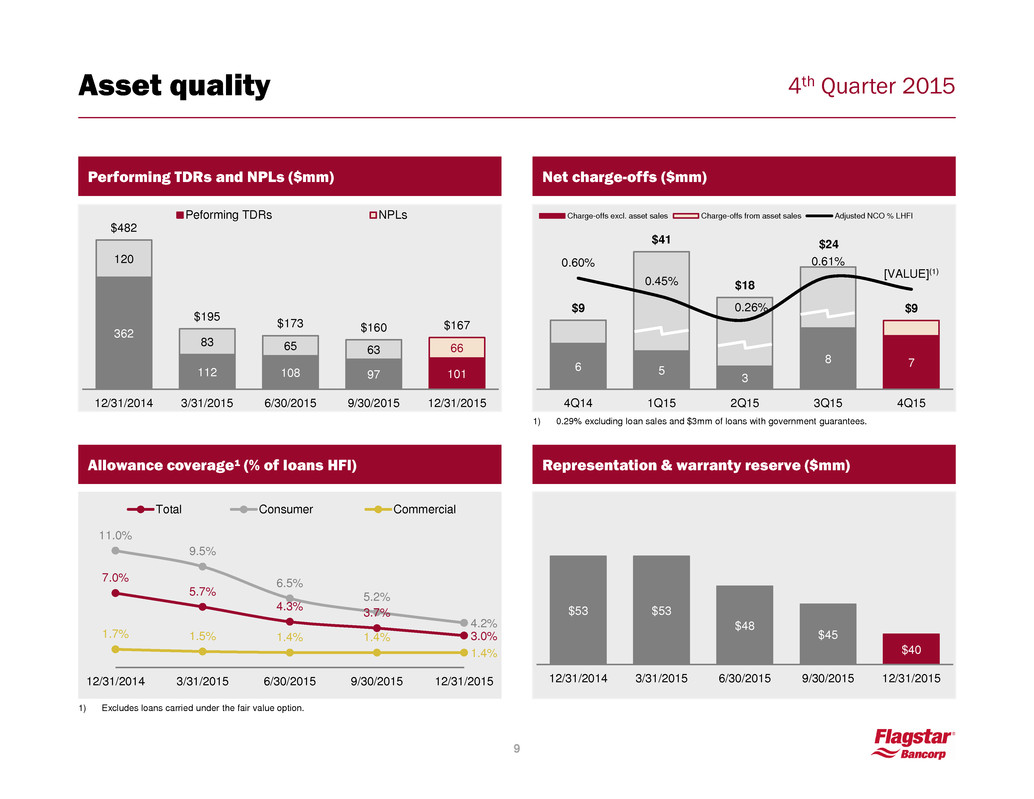
4th Quarter 2015 9 Asset quality Performing TDRs and NPLs ($mm) 362 112 108 97 101 120 83 65 63 66 $482 $195 $173 $160 $167 12/31/2014 3/31/2015 6/30/2015 9/30/2015 12/31/2015 Peforming TDRs NPLs 1) Excludes loans carried under the fair value option. Representation & warranty reserve ($mm) Allowance coverage¹ (% of loans HFI) 7.0% 5.7% 4.3% 3.7% 3.0% 11.0% 9.5% 6.5% 5.2% 4.2% 1.7% 1.5% 1.4% 1.4% 1.4% 12/31/2014 3/31/2015 6/30/2015 9/30/2015 12/31/2015 Total Consumer Commercial $53 $53 $48 $45 $40 12/31/2014 3/31/2015 6/30/2015 9/30/2015 12/31/2015 Net charge-offs ($mm) 6 5 3 8 7 $9 $41 $18 $24 $9 0.60% 0.45% 0.26% 0.61% [VALUE](1) 4Q14 1Q15 2Q15 3Q15 4Q15 Charge-offs excl. asset sales Charge-offs from asset sales Adjusted NCO % LHFI 1) 0.29% excluding loan sales and $3mm of loans with government guarantees.

4th Quarter 2015 Robust capital 10 • Decrease in regulatory ratios led by earnings asset growth partially offset by earnings retention and utilization of NOL- related deferred tax assets • Utilization of NOL-related DTA has released regulatory capital to support balance sheet growth (YTD 2015) - Benefit of 0.4% to Tier 1 Leverage ratio - Helped support earning asset growth of $2.0bn (24%) 9.2% 8.9% 8.5% 8.8% 8.6% 3.3% -96bps +46bps 3.2% -105bps +50bps 3.0% -43bps +61bps 2.9% -41bps +26bps 2.9% 12.5%(1) 12.0% 11.5% 11.7% 11.5% 12/31/14 3/31/15 6/30/15 9/30/15 12/31/15 • Flagstar has used excess capital to support balance sheet growth • Flagstar grows regulatory capital at a greater pace as it utilizes its NOL-related DTAs and scales back its concentration of MSRs • The balance sheet has trapped capital of: - $228mm of NOL-related DTAs (183bps of Tier 1 leverage) - $95mm of MSRs (76bps of Tier 1 leverage) • Robust capital generation will support future growth Observations 4Q15 1) Pro-forma under Basel III partial phase-in requirements. Please see non-GAAP tables in the appendix. Tier 1 leverage - 12/31/14 to 12/31/15 (Flagstar Bancorp) Well Capitalized 5.0% Tier 1 CET-1 Tier 1 Total RBC Leverage to RWA to RWA to RWA 12/31/15 11.5% 14.1% 19.0% 20.3% 9/30/15 11.7% 14.9% 20.3% 21.6% Repayment of TARP (targeted 2nd half of 2016) Tier 1 equity less TARP incl. deferred dividends TARP incl. deferred dividends Impact of balance sheet growth Net earnings contribution
4th Quarter 2015 Business Segment Overview Lee Smith, COO
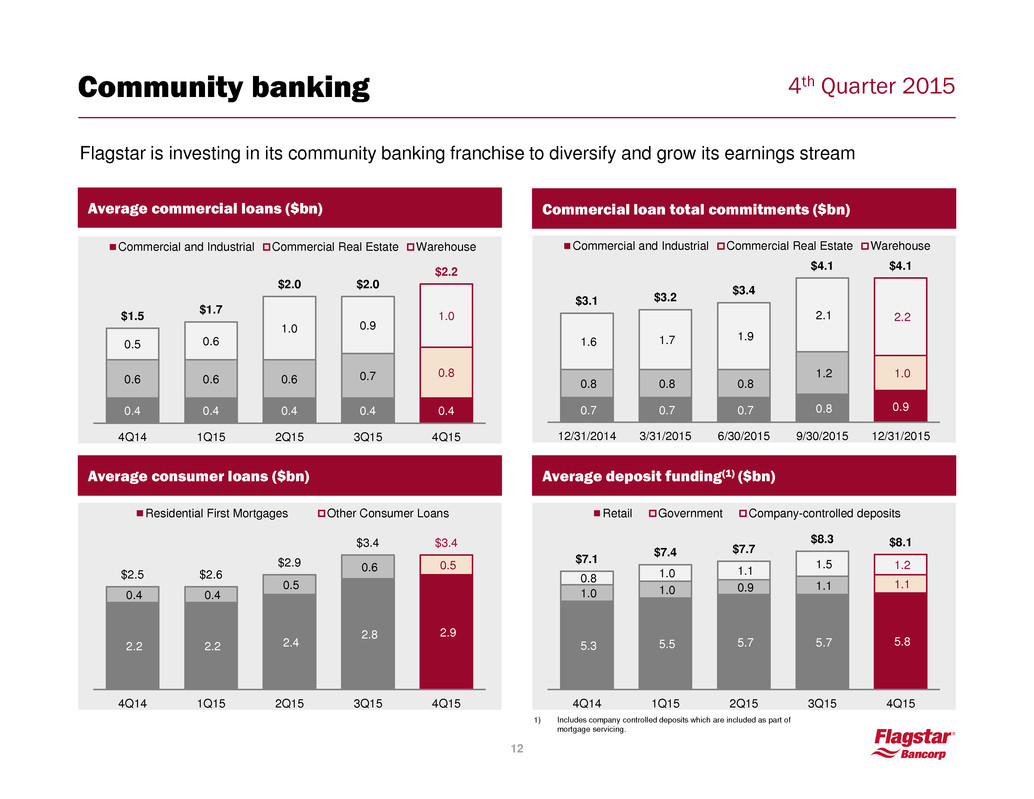
4th Quarter 2015 Flagstar is investing in its community banking franchise to diversify and grow its earnings stream Community banking 12 Average commercial loans ($bn) Commercial loan total commitments ($bn) Average consumer loans ($bn) Average deposit funding(1) ($bn) 0.4 0.4 0.4 0.4 0.4 0.6 0.6 0.6 0.7 0.8 0.5 0.6 1.0 0.9 1.0 $1.5 $1.7 $2.0 $2.0 $2.2 4Q14 1Q15 2Q15 3Q15 4Q15 Commercial and Industrial Commercial Real Estate Warehouse 0.7 0.7 0.7 0.8 0.9 0.8 0.8 0.8 1.2 1.0 1.6 1.7 1.9 2.1 2.2 $3.1 $3.2 $3.4 $4.1 $4.1 12/31/2014 3/31/2015 6/30/2015 9/30/2015 12/31/2015 Commercial and Industrial Commercial Real Estate Warehouse 2.2 2.2 2.4 2.8 2.9 0.4 0.4 0.5 0.6 0.5 $2.5 $2.6 $2.9 $3.4 $3.4 4Q14 1Q15 2Q15 3Q15 4Q15 Residential First Mortgages Other Consumer Loans 5.3 5.5 5.7 5.7 5.8 1.0 1.0 0.9 1.1 1.1 0.8 1.0 1.1 1.5 1.2 $7.1 $7.4 $7.7 $8.3 $8.1 4Q14 1Q15 2Q15 3Q15 4Q15 Retail Government Company-controlled deposits 1) Includes company controlled deposits which are included as part of mortgage servicing.

4th Quarter 2015 4.1 4.6 5.2 4.5 3.4 1.6 1.4 1.7 1.9 1.4 0.9 1.3 1.6 1.5 1.0 $6.6 $7.3 $8.5 $7.9 $5.8 4Q14 1Q15 2Q15 3Q15 4Q15 Conventional Government Jumbo Mortgage originations 13 Flagstar is focused on accelerating retail production growth to augment its third party channels Closings by purpose ($bn) 3.5 2.6 3.8 4.4 2.9 3.1 4.6 4.6 3.5 2.9 $6.6 $7.2 $8.4 $7.9 $5.8 4Q14 1Q15 2Q15 3Q15 4Q15 Purchase originations Refinance originations Closings by mortgage type ($bn) 62% 64% 61% 57% 58% Conforming (%) Gain on loan sale(1) – revenue and margin $53 $91 $83 $68 $46 0.87% 1.27% 1.21% 1.05% 0.92% 0.00% 0.50% 1.00% 1.50% 2.00% $0 $10 $20 $30 $40 $50 $60 $70 $80 $90 $100 4Q14 1Q15 2Q15 3Q15 4Q15 Fallout-adjusted locks ($bn) $6.2 $7.2 $6.8 $6.5 $5.0 4Q14 1Q15 2Q15 3Q15 4Q15 1) Based on fallout adjusted locks. 13% 11% 14% 16% 16% FHA (%)

4th Quarter 2015 14 Breakdown of loans serviced (as of 12/31/2015) MSR / regulatory capital Loans serviced (‘000) $ UPB of MSRs sold ($bn) $6.4 $2.6 $4.6 $6.7 $2.5 4Q14 1Q15 2Q15 3Q15 4Q15 118 126 124 119 119 238 231 225 220 212 26 27 28 30 31 383 385 378 369 361 12/31/2014 3/31/2015 6/30/2015 9/30/2015 12/31/2015 Serviced for Others Subserviced for Others Flagstar Loans HFI 39% 31% 33% 29% 28% 22% 22% 24% 21% 21% 12/31/2014 3/31/2015 6/30/2015 9/30/2015 12/31/2015 MSR to Tier 1 Common MSR to Tier 1 Capital Mortgage servicing Fannie, 47% Freddie, 8% Ginnie, 35% HFI / Other, 9%

4th Quarter 2015 Noninterest expenses and efficiency ratio Efficiency ratio 87% 75% 70% 65% 75% 4Q14 1Q15 2Q15 3Q15 4Q15 Quarterly noninterest expenses ($mm) $139 $138 $138 $131 $129 4Q14 1Q15 2Q15 3Q15 4Q15 15 • Flagstar‘s variable cost model and expense discipline is contributing to positive operating leverage Efficiency ratio FY 2014 – 95% FY 2015 – 71%

4th Quarter 2015 Closing Remarks / Q&A Sandro DiNello, CEO
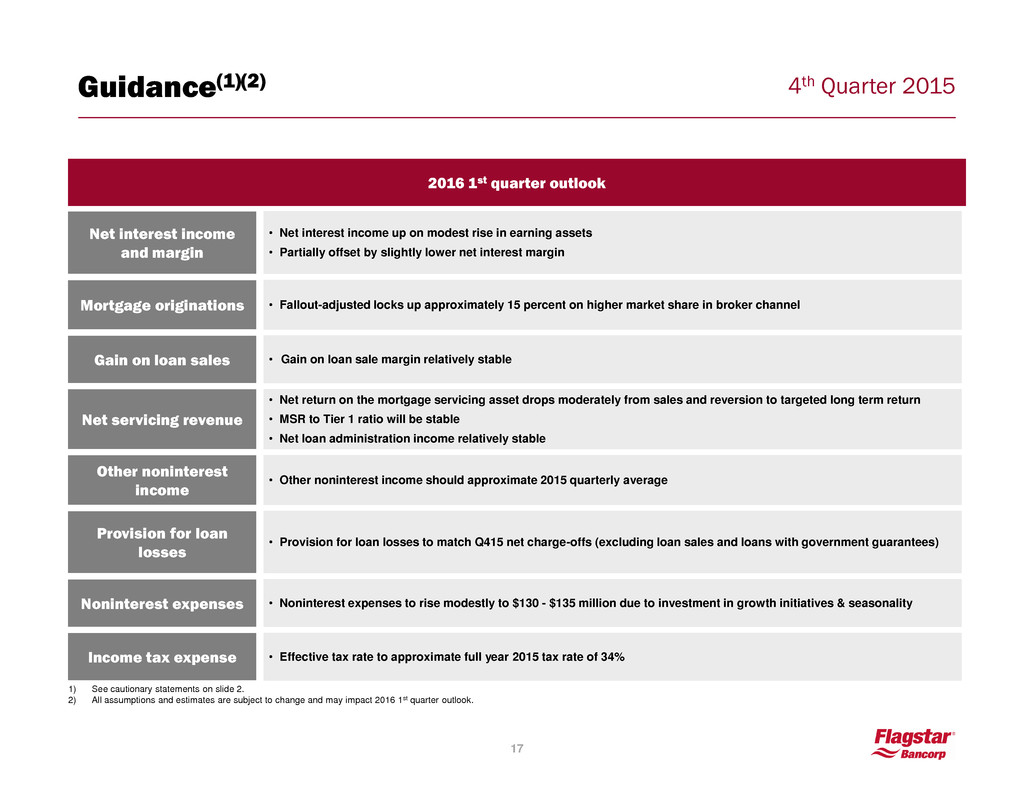
4th Quarter 2015 Guidance(1)(2) 17 1) See cautionary statements on slide 2. 2) All assumptions and estimates are subject to change and may impact 2016 1st quarter outlook. Net interest income and margin • Net interest income up on modest rise in earning assets • Partially offset by slightly lower net interest margin Mortgage originations • Fallout-adjusted locks up approximately 15 percent on higher market share in broker channel Gain on loan sales • Gain on loan sale margin relatively stable Net servicing revenue • Net return on the mortgage servicing asset drops moderately from sales and reversion to targeted long term return • MSR to Tier 1 ratio will be stable • Net loan administration income relatively stable Other noninterest income • Other noninterest income should approximate 2015 quarterly average Provision for loan losses • Provision for loan losses to match Q415 net charge-offs (excluding loan sales and loans with government guarantees) Noninterest expenses • Noninterest expenses to rise modestly to $130 - $135 million due to investment in growth initiatives & seasonality 2016 1st quarter outlook Income tax expense • Effective tax rate to approximate full year 2015 tax rate of 34%
4th Quarter 2015 Appendix Company overview 19 Financial performance 22 Community banking segment 25 Mortgage origination segment 31 Mortgage servicing segment 32 Capital and liquidity 33 Asset quality 36 Non-GAAP reconciliation 37

4th Quarter 2015 Solid core franchise 19 COMPANY OVERVIEW 3 Community bank • Largest Michigan based bank • #7 in deposit market share • $12.5bn of assets • $7.9bn of deposits • 99 branches Mortgage originator • 10th largest originator nationally • Originated more than $29bn of residential mortgage loans during the last 12 months • Approximately 1,200 TPO relationships Mortgage servicer • 9th largest sub-servicer of mortgage loans nationwide • Currently servicing more than 360k loans • Scalable mortgage platform to service up to 1mm loans

4th Quarter 2015 Flagstar is at a turning point 2013 – 2015 2015-16 2016+ Addressed post-crisis issues Assembled strong executive team Improved asset quality – Sold lower performing loans to de-risk balance sheet – $1.6bn of lower performing assets – $90bn (UPB) of MSRs – Reinvested proceeds into higher quality assets Increased capital & liquidity Resolved legal & regulatory issues Build foundation for growth Restored profitability – Grew earning assets – Increased NIM & GOS margin – Optimized cost structure Optimize capital structure – Redeem TARP (anticipated no later than 2nd half 2016) – Establish MSR reduction plan Continue strong risk management – Exit Consent Order (continue to make meaningful progress) Grow & diversify earnings Grow community banking – Add high-quality assets – Boost NIM & fee income Diversify mortgage originations – Accelerate retail & DTC distribution ahead of purchase mortgage market – Optimize fulfillment / secondary marketing Expand mortgage servicing – Grow sub-servicing portfolio – Cross sell to customers 20 COMPANY OVERVIEW

4th Quarter 2015 Assembled strong executive team 21 • Flagstar has rebuilt its management team with significant banking experience COMPANY OVERVIEW Sandro DiNello President & CEO Board of Directors Community Banking Sandro DiNello Currently serving as Director. Drew Ottaway Managing Director of Lending since 11/15 Has over 25 years of commercial lending experience in southeast Michigan with Comerica and NBD. Chief Financial Officer Jim Ciroli CFO since 8/14. Nearly 30 years of banking and financial services experience with First Niagara, Huntington and KeyCorp. Chief Operating Officer Lee Smith COO since 5/13. Formerly a partner of MatlinPatterson Global Advisors and a Senior Director at Zolfo Cooper with extensive experience in financial management and operations. He is a Chartered Accountant in England and Wales. Chief Risk Officer Steve Figliuolo CRO since 6/14. 35 years of financial services experience with Citizens Republic, Fleet Boston Financial, First Union and Chase Manhattan. Mortgage Banking Len Israel President of Mortgage Banking since 6/15. Nearly 30 years of mortgage industry experience with Mission Hills Mortgage, IndyMac and CitiMortgage. Chief Legal Officer Patrick McGuirk General Counsel since 6/15. 20 years of legal experience with the FDIC and Sidley Austin LLP. Internal Audit Dave Colajezzi CEO since 5/13 Over 35 years of banking experience with Flagstar and its predecessors with a strong emphasis on community banking including the management of retail operations and product strategy.

4th Quarter 2015 Restored profitability 22 FINANCIAL PERFORMANCE $mm (except per share data) Observations Increased net interest income • Net interest income bolstered by higher interest-earning assets, led by expansion of commercial banking platform and residential mortgage production A Higher noninterest income • Led by increased net gain on loan sales and improved returns on MSR asset • Net gain on loan sales improved by higher GOS margins C Improved operating leverage • Efficiently managed noninterest expense after implementing cost optimization efforts • Lower efficiency ratio led by higher revenues with stable expense base D Lower credit costs • Rotation into higher quality assets resulted in lower provision for loan losses • Sale of TDRs, I/Os and lower performing loans during 1Q15 - 3Q15 resulted in reserve releases B 12/31/15 9/30/15 6/30/15 3/31/15 12/31/14 12/31/15 12/31/14 Net interest income $76 $73 $73 $65 $61 $287 $247 (Benefit) provision for loan losses ("PLL") (1) (1) (13) (4) 5 (19) 132 Net interest income (loss) after PLL 77 74 86 69 56 306 115 Net gain on loans sales 46 68 83 91 53 288 206 Loan fees and charges 14 17 19 17 17 67 73 Loan administration income 7 8 7 4 5 26 24 Other noninterest income 30 35 17 7 23 89 58 Total noninterest income 97 128 126 119 98 470 361 Compensation and benefits 59 58 59 61 59 237 233 Commissions and loan processing 20 24 25 22 20 91 72 Other noninterest expense 50 49 54 55 60 208 274 Total noninterest expense 129 131 138 138 139 536 579 Income (loss) before income taxes 45 71 74 50 15 240 (103) Provision (benefit) for income taxes 12 24 28 18 4 82 (34) Net income (loss) to common $33 $47 $46 $32 $11 $158 ($69) Dilluted income (loss) per share $0.44 $0.69 $0.68 $0.43 $0.07 $2.24 ($1.72) Profitability Net interest margin 2.69% 2.75% 2.79% 2.75% 2.80% 2.74% 2.91% Mortgage rate lock commitments, fallout adjusted $5,027 $6,495 $6,804 $7,185 $6,156 $25,512 $24,007 Mortgage closings $5,824 $7,876 $8,448 $7,254 $6,603 $29,402 $24,608 Gain on loan sale margin 0.92% 1.05% 1.21% 1.27% 0.87% 1.13% 0.86% Efficiency ratio 75.2% 65.0% 69.6% 74.8% 87.2% 70.9% 95.4% Three Months Ended Fiscal Year Ended B D2 C2 C1 A D1

4th Quarter 2015 Consolidated financial highlights 23 FINANCIAL PERFORMANCE Quarterly results – $mm 4Q14 1Q15 2Q15 3Q15 4Q15 Balance Sheet Gross loans HFS $1,244 $2,097 $2,038 $2,408 $2,576 Gross loans HFI 4,448 4,631 5,335 5,514 6,352 Government guaranteed loans 1,128 704 592 509 485 MSR 258 279 317 294 296 Total assets $9,840 $11,571 $12,139 $12,519 $13,715 Deposits $7,069 $7,549 $7,648 $8,137 $7,935 FHLB borrowings 514 1,625 2,198 2,024 3,541 Trust preferred 247 247 247 247 247 Preferred equity 267 267 267 267 267 Common equity $1,106 $1,153 $1,184 $1,237 $1,262 % common equity of total assets 11.2% 10.0% 9.8% 9.9% 9.2% Income Statement Net interest income $61 $65 $73 $73 $76 Gain on loan sales 53 91 83 68 46 Other noninterest income 45 28 43 61 50 Noninterest expense (139) (138) (138) (131) (129) Pre-provision net revenue (expense) $20 $46 $61 $71 $43 Provision for loan losses 5 (4) (13) (1) (1) Income (loss) before taxes $15 $50 $74 $71 $45 PPNR / average assets 0.8% 1.7% 2.1% 2.3% 1.3% Credit ALLL $297 $297 $222 $197 $187 ALLL as a % of loans HFI (excl FV) 7.0% 7.0% 4.3% 3.7% 3.0% NPAs to total assets 1.40% 0.90% 0.70% 0.60% 0.60% Operations Number of banking centers 107 107 100 99 99 Number of loan origination centers 16 16 13 14 10 # of employees 2,739 2,680 2,713 2,677 2,713
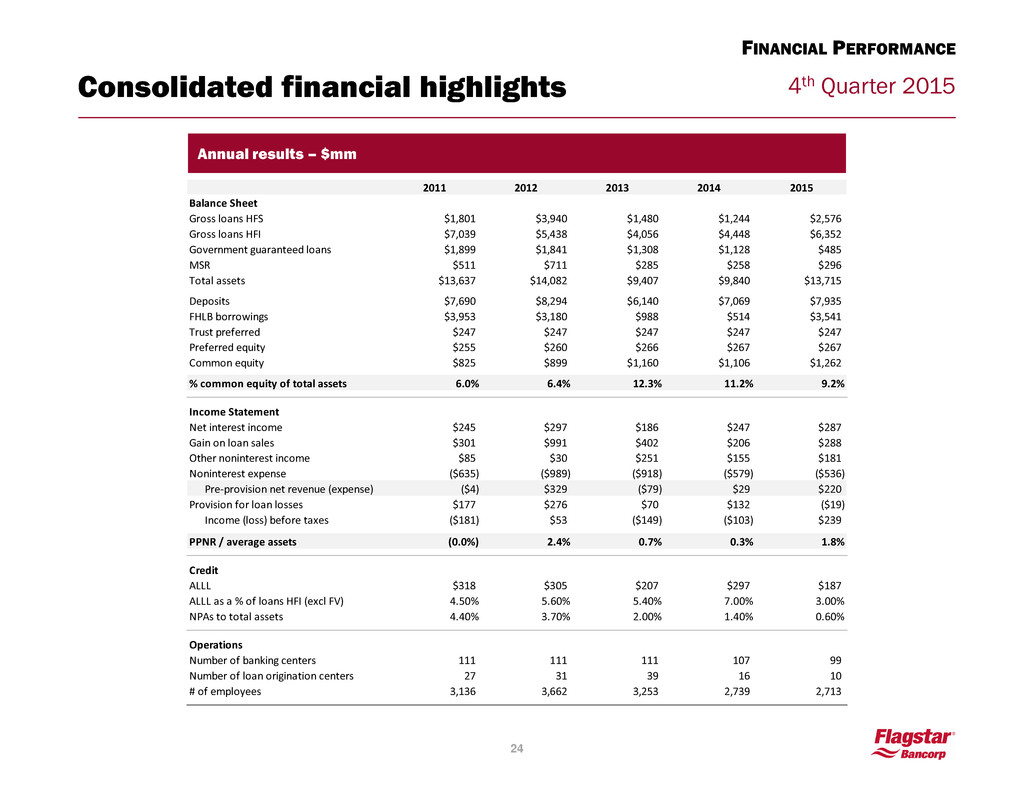
4th Quarter 2015 Consolidated financial highlights 24 FINANCIAL PERFORMANCE Annual results – $mm 2011 2012 2013 2014 2015 Balance Sheet Gross loans HFS $1,801 $3,940 $1,480 $1,244 $2,576 Gross loans HFI $7,039 $5,438 $4,056 $4,448 $6,352 Government guaranteed loans $1,899 $1,841 $1,308 $1,128 $485 MSR $511 $711 $285 $258 $296 Total assets $13,637 $14,082 $9,407 $9,840 $13,715 Deposits $7,690 $8,294 $6,140 $7,069 $7,935 FHLB borrowings $3,953 $3,180 $988 $514 $3,541 Trust preferred $247 $247 $247 $247 $247 Preferred equity $255 $260 $266 $267 $267 Common equity $825 $899 $1,160 $1,106 $1,262 % common equity of total assets 6.0% 6.4% 12.3% 11.2% 9.2% Income Statement Net interest income $245 $297 $186 $247 $287 Gain on loan sales $301 $991 $402 $206 $288 Other noninterest income $85 $30 $251 $155 $181 Noninterest expense ($635) ($989) ($918) ($579) ($536) Pre-provision net revenue (expense) ($4) $329 ($79) $29 $220 Provision for loan losses $177 $276 $70 $132 ($19) Income (loss) before taxes ($181) $53 ($149) ($103) $239 PPNR / average assets (0.0%) 2.4% 0.7% 0.3% 1.8% Credit ALLL $318 $305 $207 $297 $187 ALLL as a % of loans HFI (excl FV) 4.50% 5.60% 5.40% 7.00% 3.00% NPAs to total assets 4.40% 3.70% 2.00% 1.40% 0.60% Operations Number of banking centers 111 111 111 107 99 Number of loan origination centers 27 31 39 16 10 # of employees 3,136 3,662 3,253 2,739 2,713
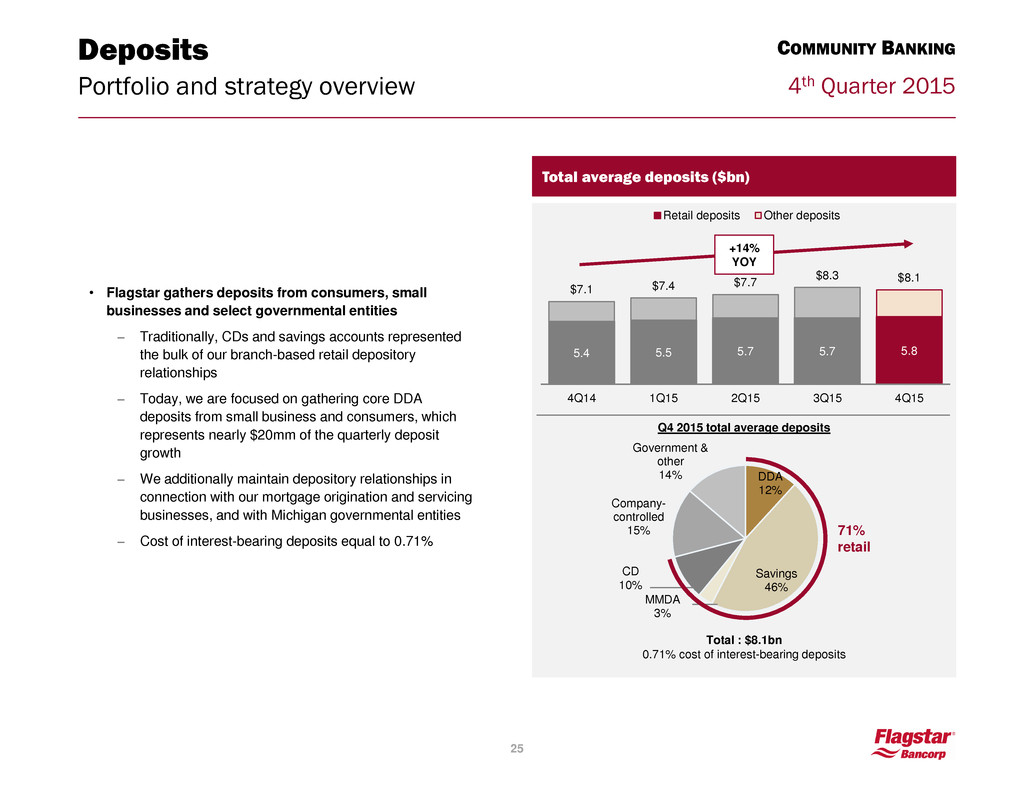
4th Quarter 2015 Deposits Portfolio and strategy overview 5.4 5.5 5.7 5.7 5.8 $7.1 $7.4 $7.7 $8.3 $8.1 4Q14 1Q15 2Q15 3Q15 4Q15 Retail deposits Other deposits Total average deposits ($bn) +14% YOY • Flagstar gathers deposits from consumers, small businesses and select governmental entities – Traditionally, CDs and savings accounts represented the bulk of our branch-based retail depository relationships – Today, we are focused on gathering core DDA deposits from small business and consumers, which represents nearly $20mm of the quarterly deposit growth – We additionally maintain depository relationships in connection with our mortgage origination and servicing businesses, and with Michigan governmental entities – Cost of interest-bearing deposits equal to 0.71% DDA 12% Savings 46% MMDA 3% CD 10% Company- controlled 15% Government & other 14% 71% retail Total : $8.1bn 0.71% cost of interest-bearing deposits Q4 2015 total average deposits 25 COMMUNITY BANKING

4th Quarter 2015 Focus on driving branch deposit growth Average deposits / branch ($mm)(1) $48 $49 $54 $55 $55 4Q14 1Q15 2Q15 3Q15 4Q15 26 Affinity Relationships COMMUNITY BANKING 1) Excludes commercial, government and company controlled deposits. Key consumer accomplishments • 4Q15 represented the 16th consecutive quarter with net growth in personal checking accounts • 2015 deposit fee income increased 17% led by a 39% increase in client debit card fees • Total branch deposits grew 7% during 2015 led by a 6% increase in retail demand deposits

4th Quarter 2015 Deposit channel overviews: Commercial, Company-controlled, government 27 COMMUNITY BANKING Average commercial ($mm) $191 $214 $242 $290 $307 4Q14 1Q15 2Q15 3Q15 4Q15 Average company-controlled ($mm) $836 $952 $1,131 $1,490 $1,246 4Q14 1Q15 2Q15 3Q15 4Q15 Average government ($mm) $994 $962 $947 $1,069 $1,118 4Q14 1Q15 2Q15 3Q15 4Q15 • Arise due to servicing and subservicing of loans for others and represent the portion of the investor custodial accounts on deposit with the Bank • The seasonal decline in average balances during 4Q15 for tax payments were partially offset by growth in government deposits • We call on local governmental agencies and other public units as an additional source for deposit funding • Cost of deposit 0.46% • Over the past year, treasury management services has driven: – 61% growth in commercial deposits – 21% year-over-year growth in service fee income • Cost of deposit: 0.56%

4th Quarter 2015 1.7 1.8 2.2 2.2 2.5 4.0 4.3 4.9 5.4 5.6 1.1 0.9 0.6 0.5 0.5 $6.8 $7.0 $7.7 $8.1 $8.6 4Q14 1Q15 2Q15 3Q15 4Q15 Loans HFS Gross Loans HFI Government Guaranteed Loans 1st Mortgage HFI 33% 2nds, HELOC & other 7% Warehouse 11% CRE and C&I 14% GNMA buyouts 6% 1st Mortgage HFS 29% Q4 2015 average gross loans Lending Portfolio and strategy overview Total average loans ($bn) • Flagstar’s largest category of earning assets consists of loans held-for-investment, gross, of $6.4bn at 12/31/15 – Loans to consumers consist of residential first mortgage loans, HELOC and other – C&I / CRE lending is an important growth strategy, offering risk diversification and asset sensitivity – Warehouse loans are extended to other mortgage lenders, offering attractive risk-adjusted returns • Flagstar maintains a balance of mortgage loans held for sale of $2.6bn at 12/31/15 – Essentially all of our mortgage loans originated are sold into the secondary market on a whole loan basis or by securitizing the loans into MBS – Flagstar has the option to direct a portion of the mortgage loans it originates to its own balance sheet 28 COMMUNITY BANKING

4th Quarter 2015 Lending: Commercial 29 COMMUNITY BANKING $1.3 $1.2 $1.3 $1.8 $1.4 C&I, $552 , 20% CRE, $814 , 30% Warehouse, $1,336 , 50% Gross outstandings : $2,702mm Total unfunded commitments: $1,396mm Q4 average yield: 3.77% Commercial loan balances ($bn) 0.4 0.4 0.4 0.5 0.6 0.6 0.6 0.6 0.7 0.8 0.8 1.1 1.2 1.0 1.3 $1.8 $2.1 $2.2 $2.2 $2.7 12/31/2014 3/31/2015 6/30/2015 9/30/2015 12/31/2015 Commercial & Industrial Commercial Real Estate Warehouse 49% YoY Increase 12/31/15 commercial loan portfolio (%) Note: Commercial & Industrial loans include commercial lease financings Unfunded commitment out. ($bn) ($mm)

4th Quarter 2015 Lending: Commercial C&I and CRE predominately in-footprint and well diversified 30 COMMUNITY BANKING MI 62% SC 11% FL 7% OH 5% CA 4% All Other 11% Services 39% Financial / Insurance 40% Manufacturing, 11% Distribution 5% Govt & Educ. 1% Office 18% Retail 22% Apartments 18% Industrial 7% Special Purpose 6% SFR Resi. & Land Devel. 5% Owner- Occupied 24% CRE as of 12/31/15 - $814 mm Property type: C&I as of 12/31/15 - $552 mm Property location: Borrower location: Borrower type: MI 76% NC 5% MN 4% HI 3% LA 2% All Other 10%

4th Quarter 2015 Mortgages are originated primarily through the correspondent channel 31 MORTGAGE ORIGINATIONS Residential mortgage originations by channel ($bn) $4.8 $5.0 $5.8 $5.6 $4.1 4Q14 1Q15 2Q15 3Q15 4Q15 Correspondent Broker Retail $1.5 $1.8 $2.2 $1.9 $1.4 4Q14 1Q15 2Q15 3Q15 4Q15 $0.3 $0.4 $0.5 $0.4 $0.3 4Q14 1Q15 2Q15 3Q15 4Q15 • Nearly 700 correspondent partners in 50 states in Q4 2015 • Top 10 relationships account for 16% of overall correspondent volume • Warehouse lines to over 250 correspondent relationships • More than 500 brokerage relationships in 50 states in Q4 2015 • Top 10 relationships account for 21% of overall brokerage volume • 10 standalone home loan centers in 9 states in Q4 2015 • Consumer direct is 36% of retail volume
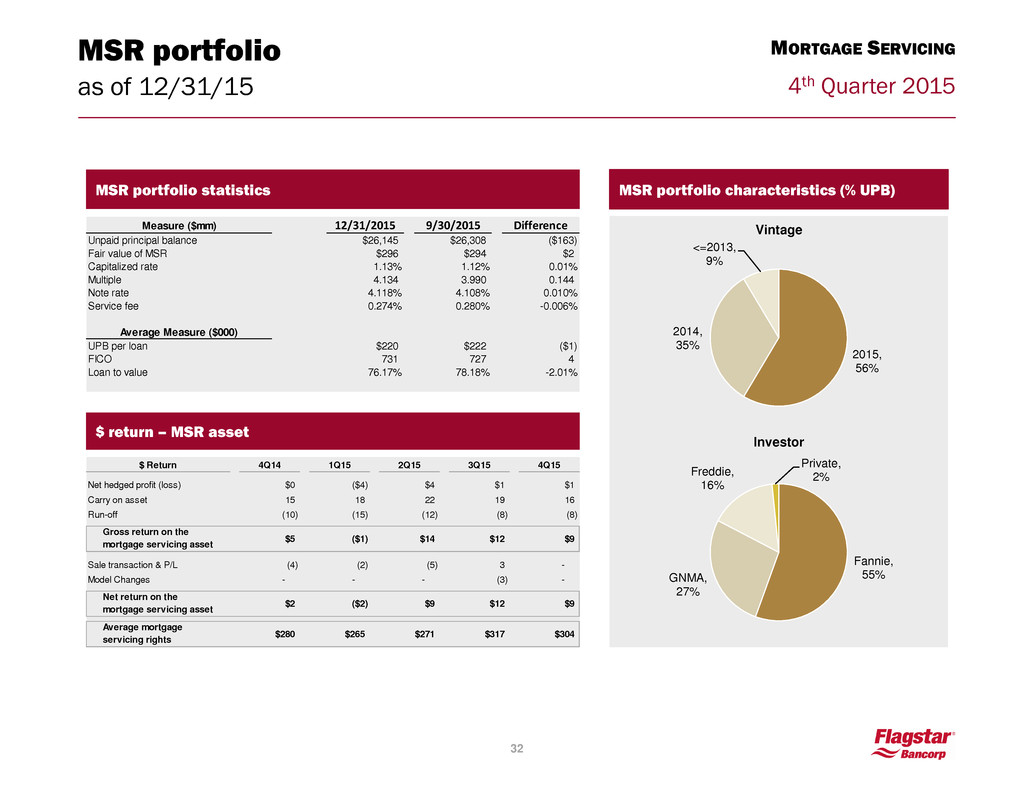
4th Quarter 2015 154 7 35 32 MSR portfolio as of 12/31/15 MSR portfolio characteristics (% UPB) MSR portfolio statistics Measure ($mm) 12/31/2015 9/30/2015 Difference Unpaid principal balance $26,145 $26,308 ($163) Fair value of MSR $296 $294 $2 Capitalized rate 1.13% 1.12% 0.01% Multiple 4.134 3.990 0.144 N te rate 4.118% 4.108% 0.010% Service fee 0.274% 0.280% -0.006% Average Measure ($000) UPB per loan $220 $222 ($1) FICO 731 727 4 Loan to value 76.17% 78.18% -2.01% $ return – MSR asset $ Return 4Q14 1Q15 2Q15 3Q15 4Q15 Net hedged profit (loss) $0 ($4) $4 $1 $1 Carry on asset 15 18 22 19 16 Run-off (10) (15) (12) (8) (8) Gr ss r turn on the mortgage servicing asset $5 ($1) $14 $12 $9 Sale transaction & P/L (4) (2) (5) 3 - Model Changes - - - (3) - Net return on the mortgage servicing asset $2 ($2) $9 $12 $9 Average mortgage servicing rights $280 $265 $271 $317 $304 2015, 56% 2014, 35% <=2013, 9% Vintage Fannie, 55% GNMA, 27% Freddie, 16% Private, 2% Investor MORTGAGE SERVICING

4th Quarter 2015 Liquidity 33 CAPITAL AND LIQUIDITY 1) Includes investment securities held-to-maturity and available-for-sale in all periods presented. Gross loans HFI/deposits 57% 57% 65% 67% 71% 12/31/2014 3/31/2015 6/30/2015 9/30/2015 12/31/2015 Available liquidity/total assets(1) 15% 18% 17% 16% 17% 22% 13% 10% 13% 4% 1% 2% 2% 1% 1% 39% 33% 28% 30% 22% 12/31/2014 3/31/2015 6/30/2015 9/30/2015 12/31/2015 Unencumbered Securities FHLB Borrowing Capacity Cash

4th Quarter 2015 Available liquidity and funding 34 CAPITAL AND LIQUIDITY Liquidity balances and ratios ($mm) Available liquidity 12/31/2014 3/31/2015 6/30/2015 9/30/2015 12/31/2015 Interest-earning deposits $87 $198 $193 $130 $154 Investment securites(1) 1,672 2,295 2,272 2,258 2,561 Less: securities haircut (84) (115) (114) (112) (127) Less: pledged collateral (0) - - (13) (14) Liquid assets $1,676 $2,379 $2,352 $2,263 $2,574 FHLB borrowing capacity $2,200 $1,476 $1,186 $1,569 $538 Total available liquidity $3,876 $3,855 $3,538 $3,832 $3,111 Liquid assets as a % of total assets 17.0% 20.6% 19.4% 18.1% 18.8% FHLB Capacity as a % of total assets 22.4% 12.8% 9.8% 12.5% 3.9% Available liquidity as a % of total assets 39.4% 33.3% 29.1% 30.6% 22.7% Funding 12/31/2014 3/31/2015 6/30/2015 9/30/2015 12/31/2015 Brokered deposits $392 $361 $328 $317 $304 FHLB advances 514 1,625 2,198 2,024 3,541 Other debt 331 317 283 279 247 Total wholesale funding $1,237 $2,303 $2,809 $2,620 $4,093 Wholesale funding as a % of total assets 12.6% 19.9% 23.1% 20.9% 29.8% 1) Includes investment securities held-to-maturity and available-for-sale in all periods presented.

4th Quarter 2015 Composition of liabilities 35 CAPITAL AND LIQUIDITY Quarter end liabilities ($mm) ($ in mm) Balance Mix Balance Mix Balance Mix Balance Mix Balance Mix Retail deposits Demand $726 8.6% $751 7.4% $757 7.1% $746 6.8% $797 6.5% Savings 3,428 40.5% 3,643 35.9% 3,749 35.1% 3,671 33.3% 3,717 30.5% Money market 209 2.5% 196 1.9% 185 1.7% 176 1.6% 163 1.3% Certificates of deposit 807 9.5% 769 7.6% 765 7.2% 799 7.3% 811 6.7% Total retail $5,170 61.1% $5,359 52.8% $5,456 51.0% $5,392 49.0% $5,488 45.0% Commercial deposits Demand $133 1.6% $139 1.4% $161 1.5% $149 1.4% $194 1.6% Savings 27 0.3% 35 0.3% 39 0.4% 32 0.3% 34 0.3% Money market 43 0.5% 56 0.6% 96 0.9% 75 0.7% 104 0.9% Certificates of deposit 5 0.1% 6 0.1% 2 0.0% 14 0.1% 14 0.1% Total commercial $208 2.5% $236 2.3% $298 2.8% $270 2.5% $346 2.8% Government deposits Demand $246 2.9% $346 3.4% $254 2.4% $367 3.3% $302 2.5% Savings 317 3.7% 356 3.5% 403 3.8% 468 4.2% 363 3.0% Certificates of deposit 355 4.2% 240 2.4% 312 2.9% 372 3.4% 397 3.3% Total government $918 10.8% $942 9.3% $969 9.1% $1,207 11.0% $1,062 8.7% Company controlled deposits $773 9.1% $1,012 10.0% $925 8.7% $1,267 11.5% $1,039 8.5% Total deposits $7,069 83.5% $7,549 74.4% $7,648 71.6% $8,136 73.9% $7,935 65.1% FHLB Advances 514 6.1% 1,625 16.0% 2,198 20.6% 2,024 18.4% 3,541 29.1% Other debt 331 3.9% 317 3.1% 283 2.6% 279 2.5% 247 2.0% Other liabilities 553 6.5% 660 6.5% 559 5.2% 575 5.2% 463 3.8% Total liabilities $8,467 100.0% $10,151 100.0% $10,688 100.0% $11,014 100.0% $12,186 100.0% 12/31/20159/30/20156/30/20153/31/201512/31/2014

4th Quarter 2015 988 1,185 912 788 778 487 449 442 402 337 1,475 265 1,634 237 1,354 150 1,190 56 1,115 60 4Q 2014 1Q 2015 2Q 2015 3Q 2015 4Q 2015 Fannie Mae Freddie Mac Fannie Mae Freddie Mac Audit file pulls Repurchase demands Representation & Warranty reserve details (in millions) 12/31/14 3/31/15 6/30/15 9/30/15 12/31/15 Beginning balance $57) $53) $53) $48) $45) Additions (4) 0) (3) (4) (5) Net charge-offs 0) (0) (2) 1) (0) Ending Balance $53) $53) $48) $45) $40 Repurchase pipeline ($mm) Repurchase reserve ($mm) Repurchase activity with Fannie and Freddie Repurchase demands / file pulls 15% 11% 5% 18% 36 5% ASSET QUALITY $43 $58 $46 $30 $20 12/31/2014 3/31/15 6/30/2015 9/30/2015 12/31/2015

4th Quarter 2015 Supplemental capital ratios 37 NON-GAAP RECONCILIATION $mm – Basel I to Basel III (transitional) as of 12/31/14 1) On January 1, 2015, the Basel III rules became effective, subject to transition provisions primarily related to regulatory deductions and adjustments impacting, risk weighted assets, adjusted tangible assets, common equity Tier 1 capital and Tier 1 capital. We reported under Basel I (which included the Market Risk Final Rules) at December 31, 2014. Flagstar Bancorp Common Equity Tier 1 (to Risk Weighted Assets) Tier 1 Leverage (to Adjusted Tangible Assets) Tier 1 Capital (to Risk Weighted Assets) Total Risk-Based Capital (to Risk Weighted Assets) Regulatory capital as of 12/31/14 Basel I capital N/A $1,184 $1,184 $1,252 Net change in capital N/A $37 $37 $37 Basel III capital(1) $876 $1,221 $1,221 $1,289 Risk-weighted assets as 12/31/14 Basel I assets N/A $9,403 $5,190 $5,190 Net change in assets N/A $351 $42 $42 Basel III assets(1) $5,232 $9,755 $5,232 $5,232 Capital ratios Basel I N/A 12.6% 22.8% 24.1% Basel III(1) 16.7% 12.5% 23.3% 24.6%


