1 2nd Quarter 2021 Flagstar Bancorp, Inc. (NYSE: FBC) Earnings Presentation 2nd Quarter 2021 July 28, 2021

2 2nd Quarter 2021Cautionary statements This presentation contains "forward-looking statements" within the meaning of the Private Securities Litigation Reform Act of 1995, as amended. Forward-looking statements are based on management’s current expectations and assumptions regarding the Company’s business and performance, the economy and other future conditions, and forecasts of future events, circumstances and results. However, they are not guarantees of future performance and are subject to known and unknown risks, uncertainties, contingencies and other factors. Generally, forward-looking statements are not based on historical facts but instead represent our management’s beliefs regarding future events. Such statements may be identified by words such as believe, expect, anticipate, intend, plan, estimate, may increase, may fluctuate, and similar expressions or future or conditional verbs such as will, should, would and could. Such statements are based on management’s current expectations and are subject to risks, uncertainties and changes in circumstances. Actual results and capital and other financial conditions may differ materially from those included in these statements due to a variety of factors, including without limitation those found in periodic Flagstar reports filed with the U.S. Securities and Exchange Commission, which are available on the Company’s website (flagstar.com) and on the Securities and Exchange Commission's website (sec.gov). Any forward-looking statements made by or on behalf of us speak only as to the date they are made, and we do not undertake to update forward-looking statements to reflect the impact of circumstances or events that arise after the date the forward-looking statements were made, except as required under United States securities laws. In addition to results presented in accordance with GAAP, this presentation includes non-GAAP financial measures. The Company believes these non-GAAP financial measures provide additional information that is useful to investors in helping to understand the capital requirements Flagstar will face in the future and underlying performance and trends of Flagstar. Non-GAAP financial measures have inherent limitations, which are not required to be uniformly applied. Readers should be aware of these limitations and should be cautious with respect to the use of such measures. To compensate for these limitations, we use non-GAAP measures as comparative tools, together with GAAP measures, to assist in the evaluation of our operating performance or financial condition. Also, we ensure that these measures are calculated using the appropriate GAAP or regulatory components in their entirety and that they are computed in a manner intended to facilitate consistent period-to-period comparisons. Flagstar’s method of calculating these non-GAAP measures may differ from methods used by other companies. These non-GAAP measures should not be considered in isolation or as a substitute for those financial measures prepared in accordance with GAAP or in-effect regulatory requirements. Where non-GAAP financial measures are used, the most directly comparable GAAP or regulatory financial measure, as well as the reconciliation to the most directly comparable GAAP or regulatory financial measure, can be found in these conference call slides. Additional discussion of the use of non-GAAP measures can also be found in the Form 8-K Current Report related to this presentation and in periodic Flagstar reports filed with the U.S. Securities and Exchange Commission. These documents can all be found on the Company’s website at flagstar.com.
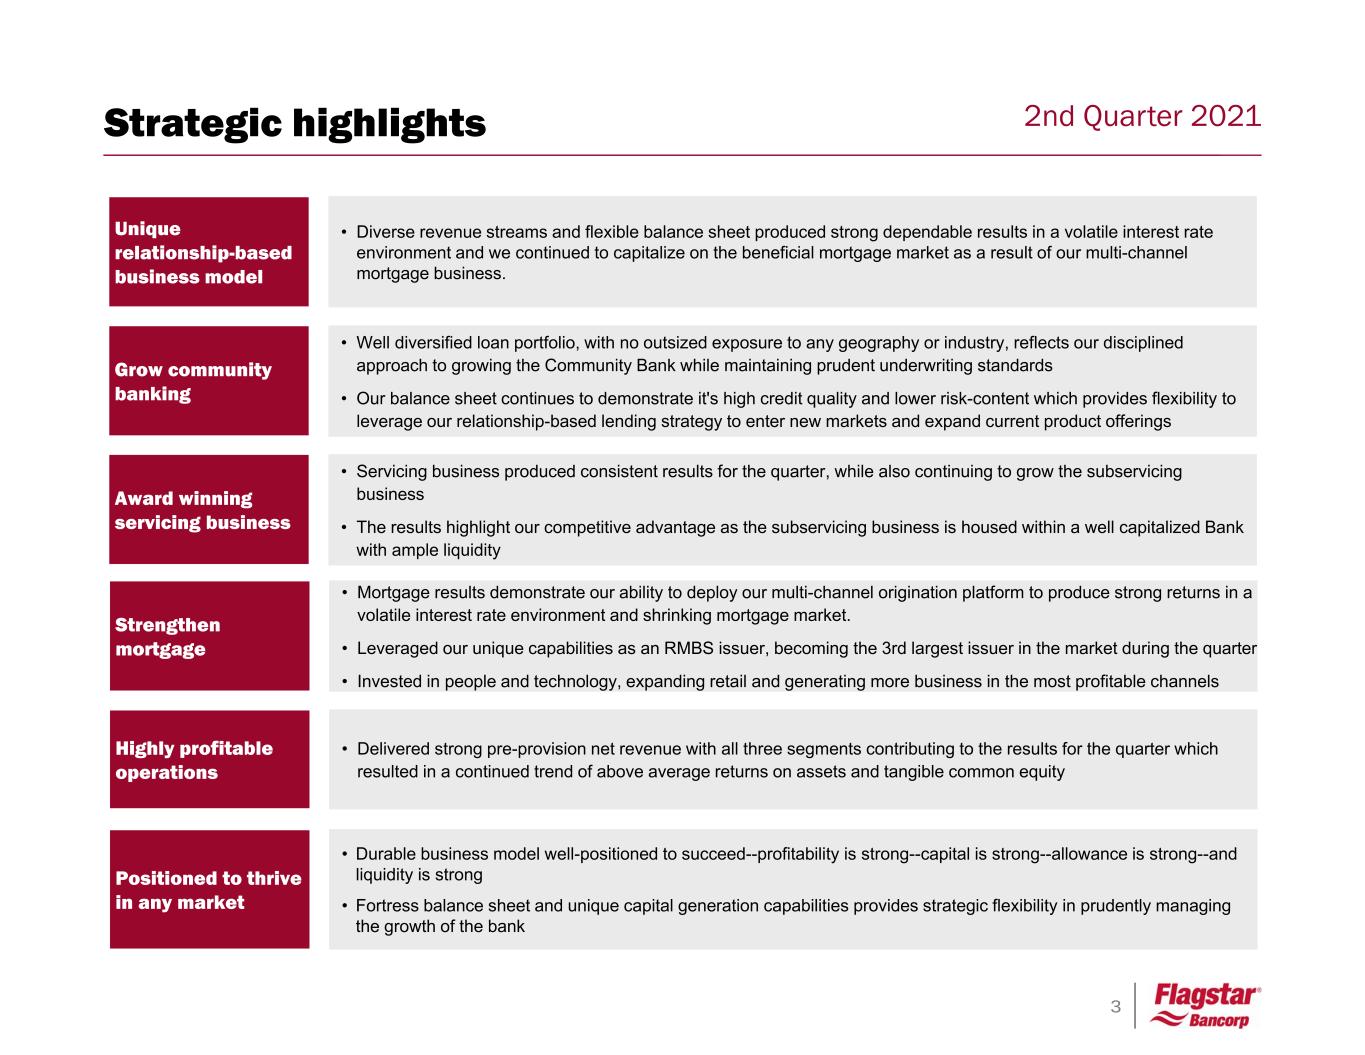
3 2nd Quarter 2021 Unique relationship-based business model • Well diversified loan portfolio, with no outsized exposure to any geography or industry, reflects our disciplined approach to growing the Community Bank while maintaining prudent underwriting standards • Our balance sheet continues to demonstrate it's high credit quality and lower risk-content which provides flexibility to leverage our relationship-based lending strategy to enter new markets and expand current product offerings Strengthen mortgage Grow community banking Highly profitable operations • Delivered strong pre-provision net revenue with all three segments contributing to the results for the quarter which resulted in a continued trend of above average returns on assets and tangible common equity Positioned to thrive in any market • Durable business model well-positioned to succeed--profitability is strong--capital is strong--allowance is strong--and liquidity is strong • Fortress balance sheet and unique capital generation capabilities provides strategic flexibility in prudently managing the growth of the bank • Diverse revenue streams and flexible balance sheet produced strong dependable results in a volatile interest rate environment and we continued to capitalize on the beneficial mortgage market as a result of our multi-channel mortgage business. • Mortgage results demonstrate our ability to deploy our multi-channel origination platform to produce strong returns in a volatile interest rate environment and shrinking mortgage market. • Leveraged our unique capabilities as an RMBS issuer, becoming the 3rd largest issuer in the market during the quarter • Invested in people and technology, expanding retail and generating more business in the most profitable channels Strategic highlights • Servicing business produced consistent results for the quarter, while also continuing to grow the subservicing business • The results highlight our competitive advantage as the subservicing business is housed within a well capitalized Bank with ample liquidity Award winning servicing business
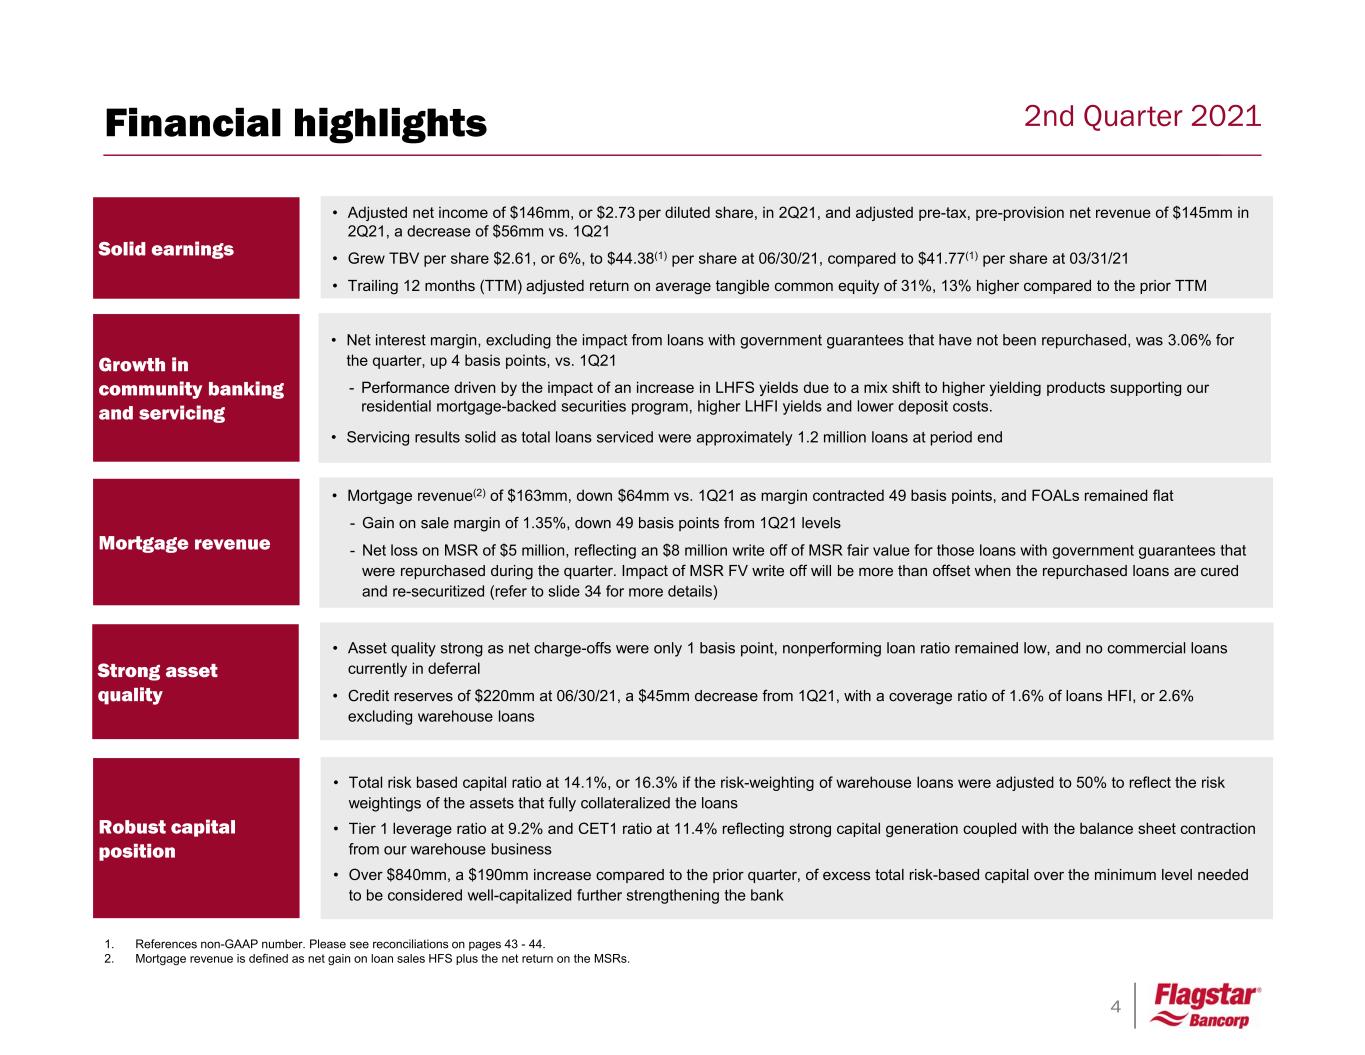
4 2nd Quarter 2021 1. References non-GAAP number. Please see reconciliations on pages 43 - 44. 2. Mortgage revenue is defined as net gain on loan sales HFS plus the net return on the MSRs. Solid earnings Growth in community banking and servicing • Net interest margin, excluding the impact from loans with government guarantees that have not been repurchased, was 3.06% for the quarter, up 4 basis points, vs. 1Q21 - Performance driven by the impact of an increase in LHFS yields due to a mix shift to higher yielding products supporting our residential mortgage-backed securities program, higher LHFI yields and lower deposit costs. • Servicing results solid as total loans serviced were approximately 1.2 million loans at period end Mortgage revenue Strong asset quality Robust capital position • Total risk based capital ratio at 14.1%, or 16.3% if the risk-weighting of warehouse loans were adjusted to 50% to reflect the risk weightings of the assets that fully collateralized the loans • Tier 1 leverage ratio at 9.2% and CET1 ratio at 11.4% reflecting strong capital generation coupled with the balance sheet contraction from our warehouse business • Over $840mm, a $190mm increase compared to the prior quarter, of excess total risk-based capital over the minimum level needed to be considered well-capitalized further strengthening the bank • Adjusted net income of $146mm, or $2.73 per diluted share, in 2Q21, and adjusted pre-tax, pre-provision net revenue of $145mm in 2Q21, a decrease of $56mm vs. 1Q21 • Grew TBV per share $2.61, or 6%, to $44.38(1) per share at 06/30/21, compared to $41.77(1) per share at 03/31/21 • Trailing 12 months (TTM) adjusted return on average tangible common equity of 31%, 13% higher compared to the prior TTM • Mortgage revenue(2) of $163mm, down $64mm vs. 1Q21 as margin contracted 49 basis points, and FOALs remained flat - Gain on sale margin of 1.35%, down 49 basis points from 1Q21 levels - Net loss on MSR of $5 million, reflecting an $8 million write off of MSR fair value for those loans with government guarantees that were repurchased during the quarter. Impact of MSR FV write off will be more than offset when the repurchased loans are cured and re-securitized (refer to slide 34 for more details) • Asset quality strong as net charge-offs were only 1 basis point, nonperforming loan ratio remained low, and no commercial loans currently in deferral • Credit reserves of $220mm at 06/30/21, a $45mm decrease from 1Q21, with a coverage ratio of 1.6% of loans HFI, or 2.6% excluding warehouse loans Financial highlights

5 2nd Quarter 2021 $mm Observations • Noninterest income decreased $72mm, or 22% - Net gain on loan sale margin decreased 49 basis points, to 1.35%, with FOALs flat. - Net loss on MSR was $5 million, primarily reflecting an $8 million write off of MSR fair value for those LGGs that were repurchased during the quarter. A future gain on sale benefit will be recognized on these repurchased loans as they cure and are re-securitized. Refer to slide 34 for more details. Noninterest income • Net interest income decreased $6mm - Net interest margin, excluding LGG that have not been repurchased, expanded 4 basis points to 3.06%. - Average earning assets declined $1.9 billion, or 7 percent, as warehouse balances were $1.0 billion (15 percent) lower and LHFS declined $0.6 billion. - Average deposits decreased 5%, due to a $1.0bn billion decrease in custodial deposits. Net interest income • Noninterest expense decreased $91mm, or 29%, refer to slide 7 for more details Noninterest expense Quarterly income comparison 2Q21 1Q21 $ Variance % Variance Net interest income $183 $189 ($6) (3%) Net gain on loan sales 168 227 (59) (26%) Loan fees and charges 37 42 (5) (12%) Loan administration income 28 27 1 4% Net return on mortgage servicing rights (5) - (5) (100%) Other noninterest income 24 28 (4) (14%) Total noninterest income 252 324 (72) (22%) Pre-provision total revenue 435 513 (78) (15%) Compensation and benefits 122 144 (22) (15%) Commissions and loan processing expense 73 83 (10) (12%) Other noninterest expenses 95 (1) 85 (1) 10 12% Total noninterest expense 290 (1) 312 (1) (22) (7%) Pretax, pre-provision net revenue 145 201 (56) (28%) (Benefit) provision for credit losses (44) (28) (16) 57% Income before income taxes 189 229 (40) (17%) Provision for income taxes 43 (1) 53 (1) (10) (19%) Net income $146 (1) $176 (1) ($30) (17%) Diluted income per share $2.73 (1) $3.31 (1) -$0.58 (18%) Profitability Net interest margin 2.90% 2.82% 8 bps Net interest margin, excl. LGG repurchase obligation(2) 3.06% 3.02% 4 bps Net gain on loan sales / total revenue 32.7% 44.2% -11.5% Mortgage rate lock commitments, fallout adjusted (3) $12,400 $12,300 $100 1% Mortgage closings (3) $12,800 $13,800 ($1,000) (7%) Net gain on loan sale margin, HFS 1.35% 1.84% (49) bps 1. Non-GAAP number, please see reconciliations on pages 43 and 44. 2. References non-GAAP number as it excludes the impact of $1.8 billion (1Q21) and $1.3 billion (2Q21) of average balance of loans with government guarantees that have not been repurchased and do not accrue interest. Please see reconciliations on pages 43 - 44. 3. Rounded to the nearest hundred million N/M = not meaningful
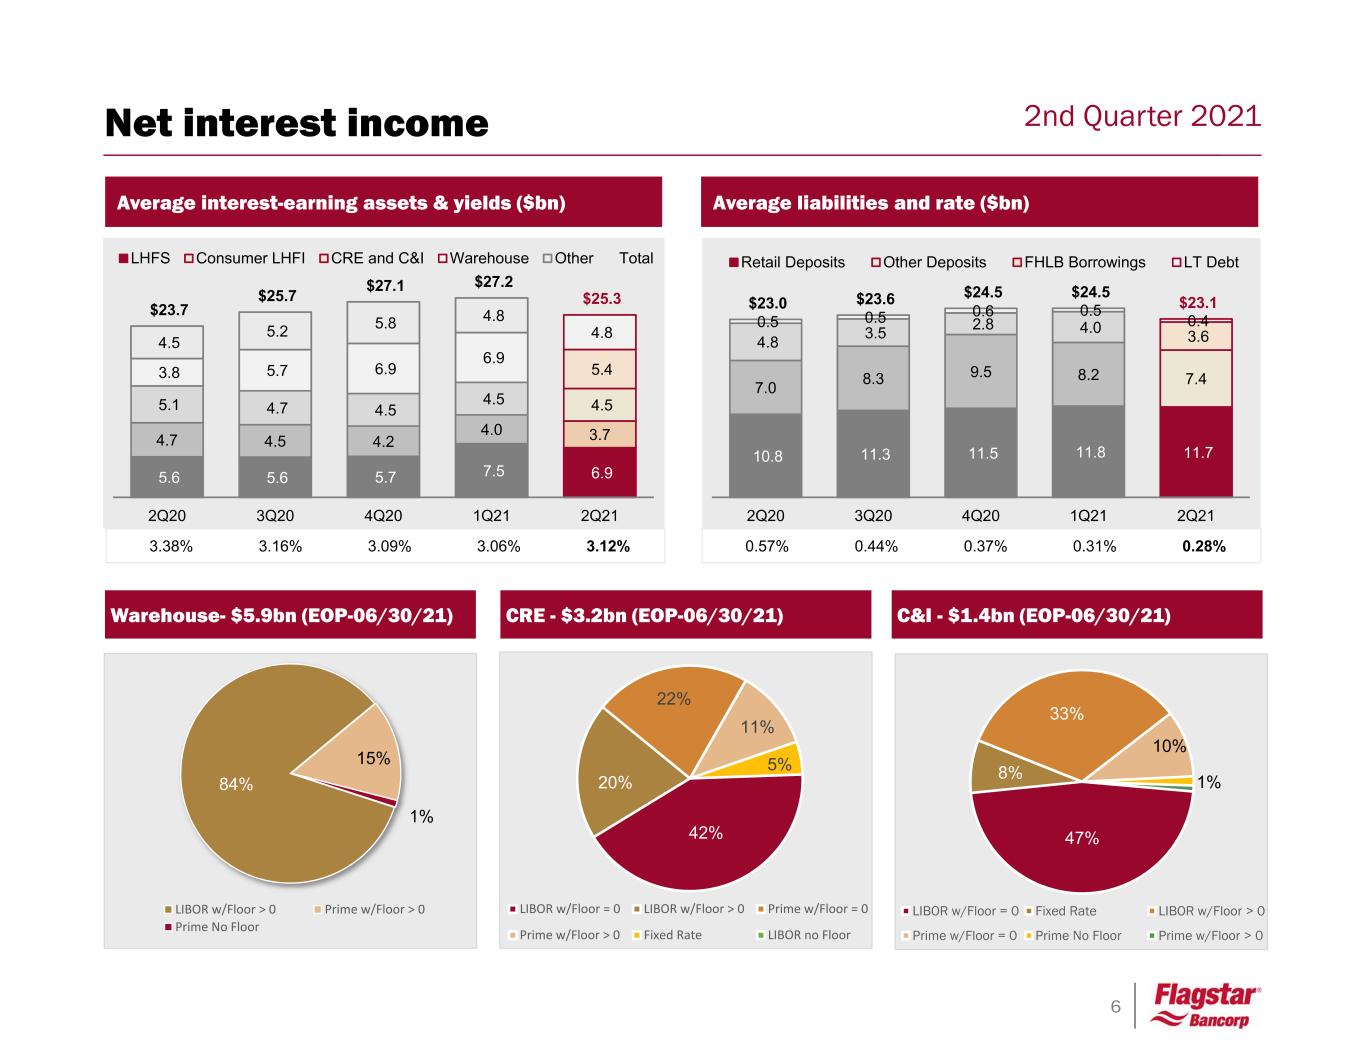
6 2nd Quarter 2021 3.38% 3.16% 3.09% 3.06% 3.12% 5.6 5.6 5.7 7.5 6.9 4.7 4.5 4.2 4.0 3.7 5.1 4.7 4.5 4.5 4.5 3.8 5.7 6.9 6.9 5.4 4.5 5.2 5.8 4.8 4.8 $23.7 $25.7 $27.1 $27.2 $25.3 2Q20 3Q20 4Q20 1Q21 2Q21 LHFS Consumer LHFI CRE and C&I Warehouse Other Total Average interest-earning assets & yields ($bn) 0.57% 0.44% 0.37% 0.31% 0.28% Average liabilities and rate ($bn) Warehouse- $5.9bn (EOP-06/30/21) CRE - $3.2bn (EOP-06/30/21) C&I - $1.4bn (EOP-06/30/21) Net interest income 10.8 11.3 11.5 11.8 11.7 7.0 8.3 9.5 8.2 7.4 4.8 3.5 2.8 4.0 3.6 0.5 0.5 0.6 0.5 0.4 $23.0 $23.6 $24.5 $24.5 $23.1 2Q20 3Q20 4Q20 1Q21 2Q21 Retail Deposits Other Deposits FHLB Borrowings LT Debt 42% 20% 22% 11% 5% LIBOR w/Floor = 0 LIBOR w/Floor > 0 Prime w/Floor = 0 Prime w/Floor > 0 Fixed Rate LIBOR no Floor 47% 8% 33% 10% 1% LIBOR w/Floor = 0 Fixed Rate LIBOR w/Floor > 0 Prime w/Floor = 0 Prime No Floor Prime w/Floor > 0 84% 15% 1% LIBOR w/Floor > 0 Prime w/Floor > 0 Prime No Floor
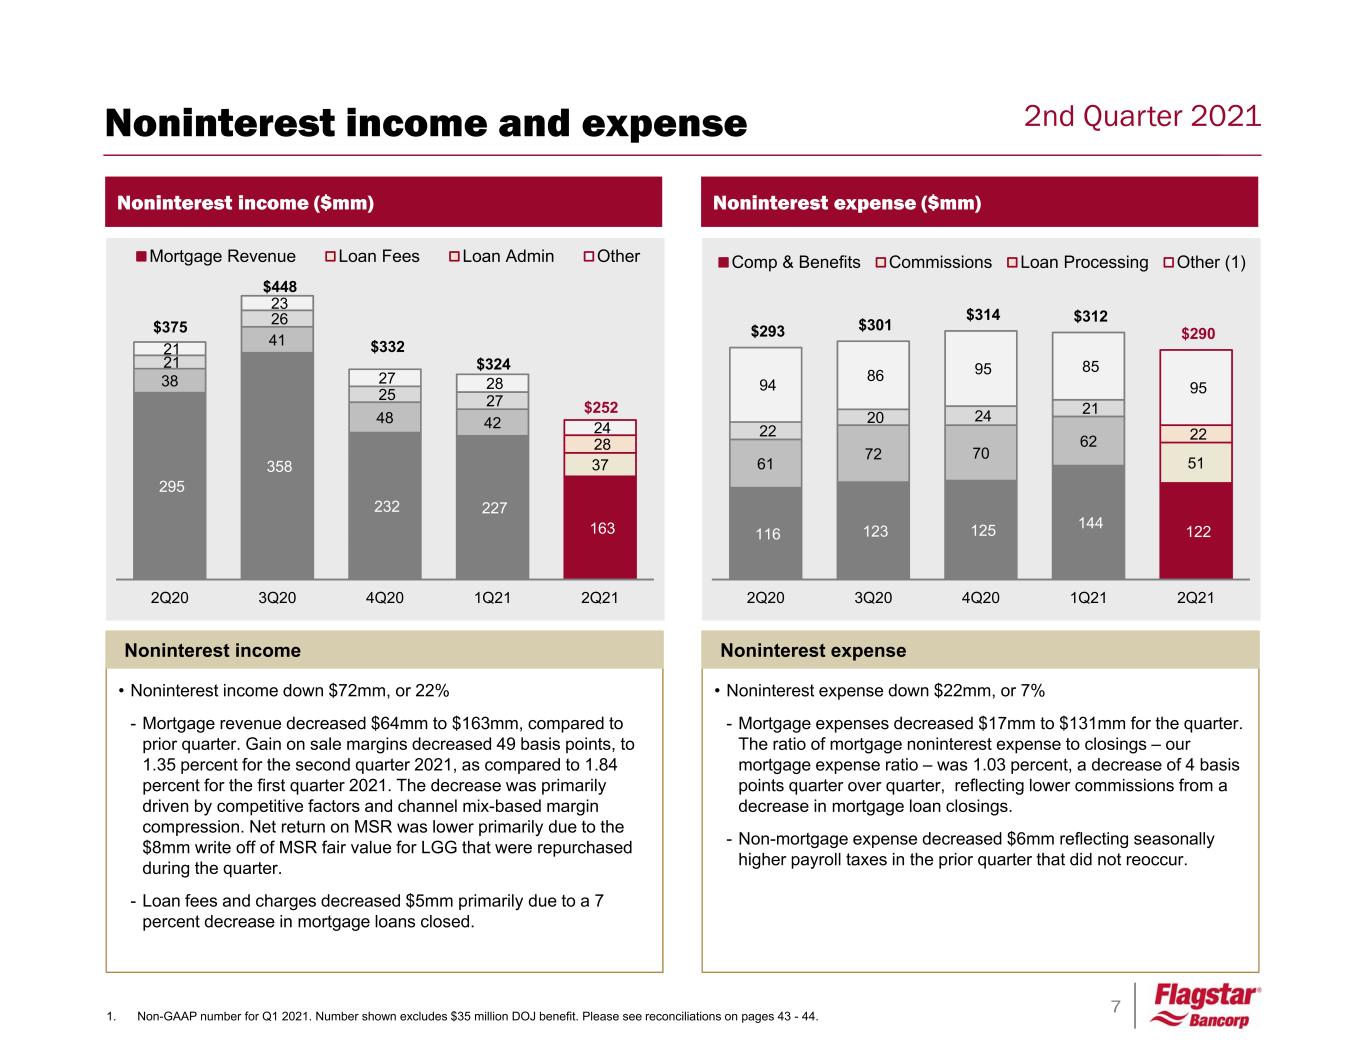
7 2nd Quarter 2021 295 358 232 227 163 38 41 48 42 37 21 26 25 27 28 21 23 27 28 24 $375 $448 $332 $324 $252 2Q20 3Q20 4Q20 1Q21 2Q21 Mortgage Revenue Loan Fees Loan Admin Other Noninterest income ($mm) 116 123 125 144 122 61 72 70 62 51 22 20 24 21 22 94 86 95 85 95 $293 $301 $314 $312 $290 2Q20 3Q20 4Q20 1Q21 2Q21 Comp & Benefits Commissions Loan Processing Other (1) Noninterest expense ($mm) • Noninterest income down $72mm, or 22% - Mortgage revenue decreased $64mm to $163mm, compared to prior quarter. Gain on sale margins decreased 49 basis points, to 1.35 percent for the second quarter 2021, as compared to 1.84 percent for the first quarter 2021. The decrease was primarily driven by competitive factors and channel mix-based margin compression. Net return on MSR was lower primarily due to the $8mm write off of MSR fair value for LGG that were repurchased during the quarter. - Loan fees and charges decreased $5mm primarily due to a 7 percent decrease in mortgage loans closed. Noninterest income • Noninterest expense down $22mm, or 7% - Mortgage expenses decreased $17mm to $131mm for the quarter. The ratio of mortgage noninterest expense to closings – our mortgage expense ratio – was 1.03 percent, a decrease of 4 basis points quarter over quarter, reflecting lower commissions from a decrease in mortgage loan closings. - Non-mortgage expense decreased $6mm reflecting seasonally higher payroll taxes in the prior quarter that did not reoccur. Noninterest expense Noninterest income and expense 1. Non-GAAP number for Q1 2021. Number shown excludes $35 million DOJ benefit. Please see reconciliations on pages 43 - 44.
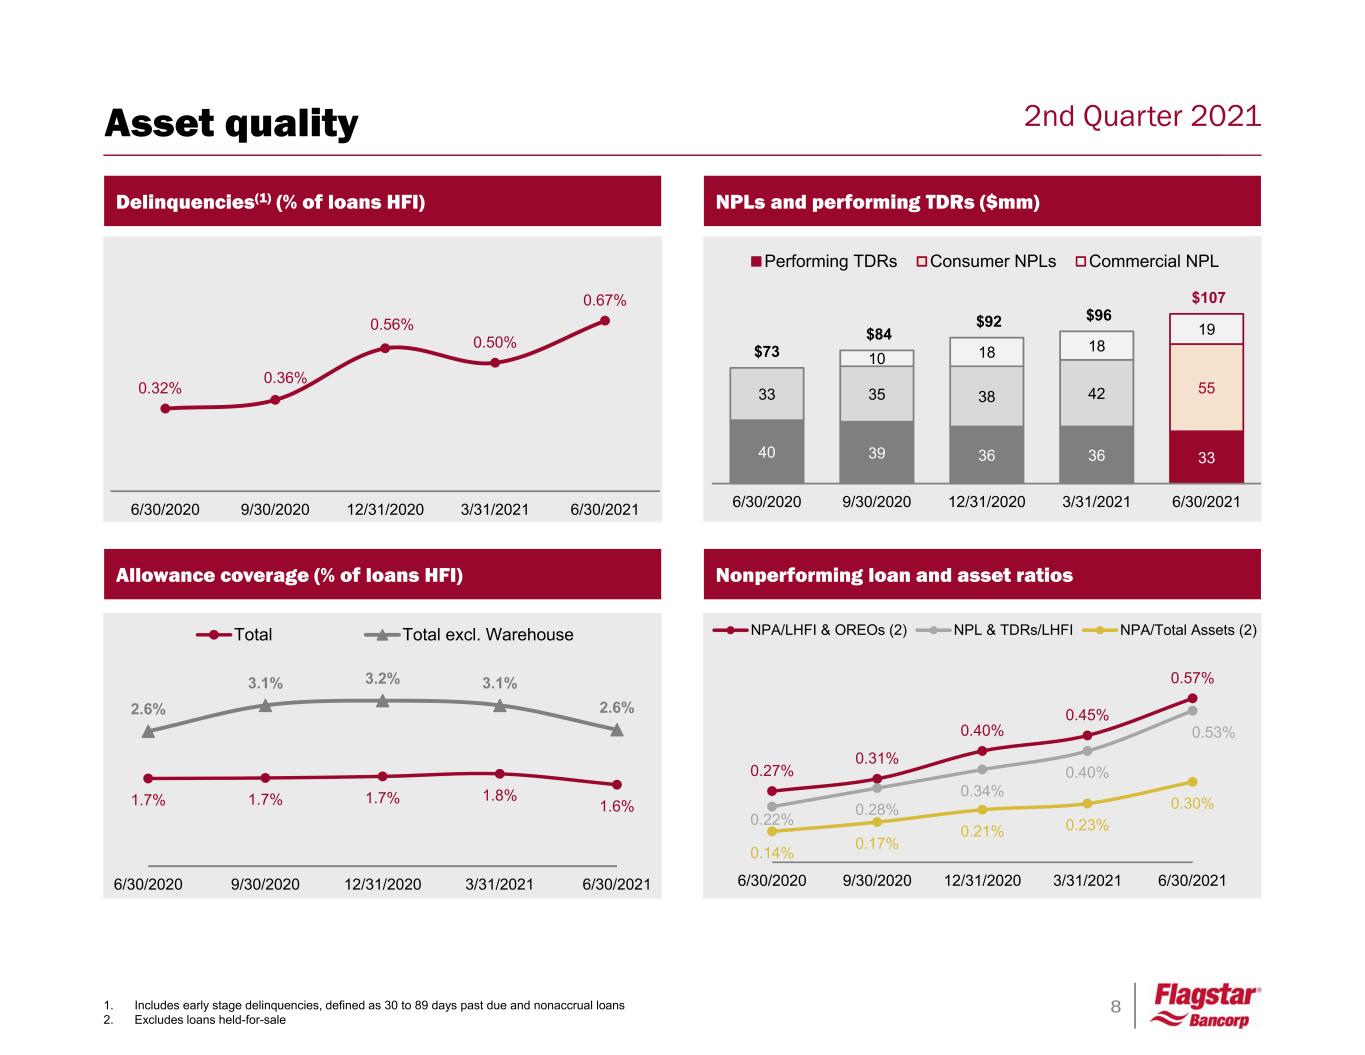
8 2nd Quarter 2021 NPLs and performing TDRs ($mm) 1. Includes early stage delinquencies, defined as 30 to 89 days past due and nonaccrual loans 2. Excludes loans held-for-sale Allowance coverage (% of loans HFI) 1.7% 1.7% 1.7% 1.8% 1.6% 2.6% 3.1% 3.2% 3.1% 2.6% 6/30/2020 9/30/2020 12/31/2020 3/31/2021 6/30/2021 Total Total excl. Warehouse Delinquencies(1) (% of loans HFI) Nonperforming loan and asset ratios Asset quality 0.32% 0.36% 0.56% 0.50% 0.67% 6/30/2020 9/30/2020 12/31/2020 3/31/2021 6/30/2021 0.27% 0.31% 0.40% 0.45% 0.57% 0.22% 0.28% 0.34% 0.40% 0.53% 0.14% 0.17% 0.21% 0.23% 0.30% 6/30/2020 9/30/2020 12/31/2020 3/31/2021 6/30/2021 NPA/LHFI & OREOs (2) NPL & TDRs/LHFI NPA/Total Assets (2) 40 39 36 36 33 33 35 38 42 55 10 18 18 19 $73 $84 $92 $96 $107 6/30/2020 9/30/2020 12/31/2020 3/31/2021 6/30/2021 Performing TDRs Consumer NPLs Commercial NPL
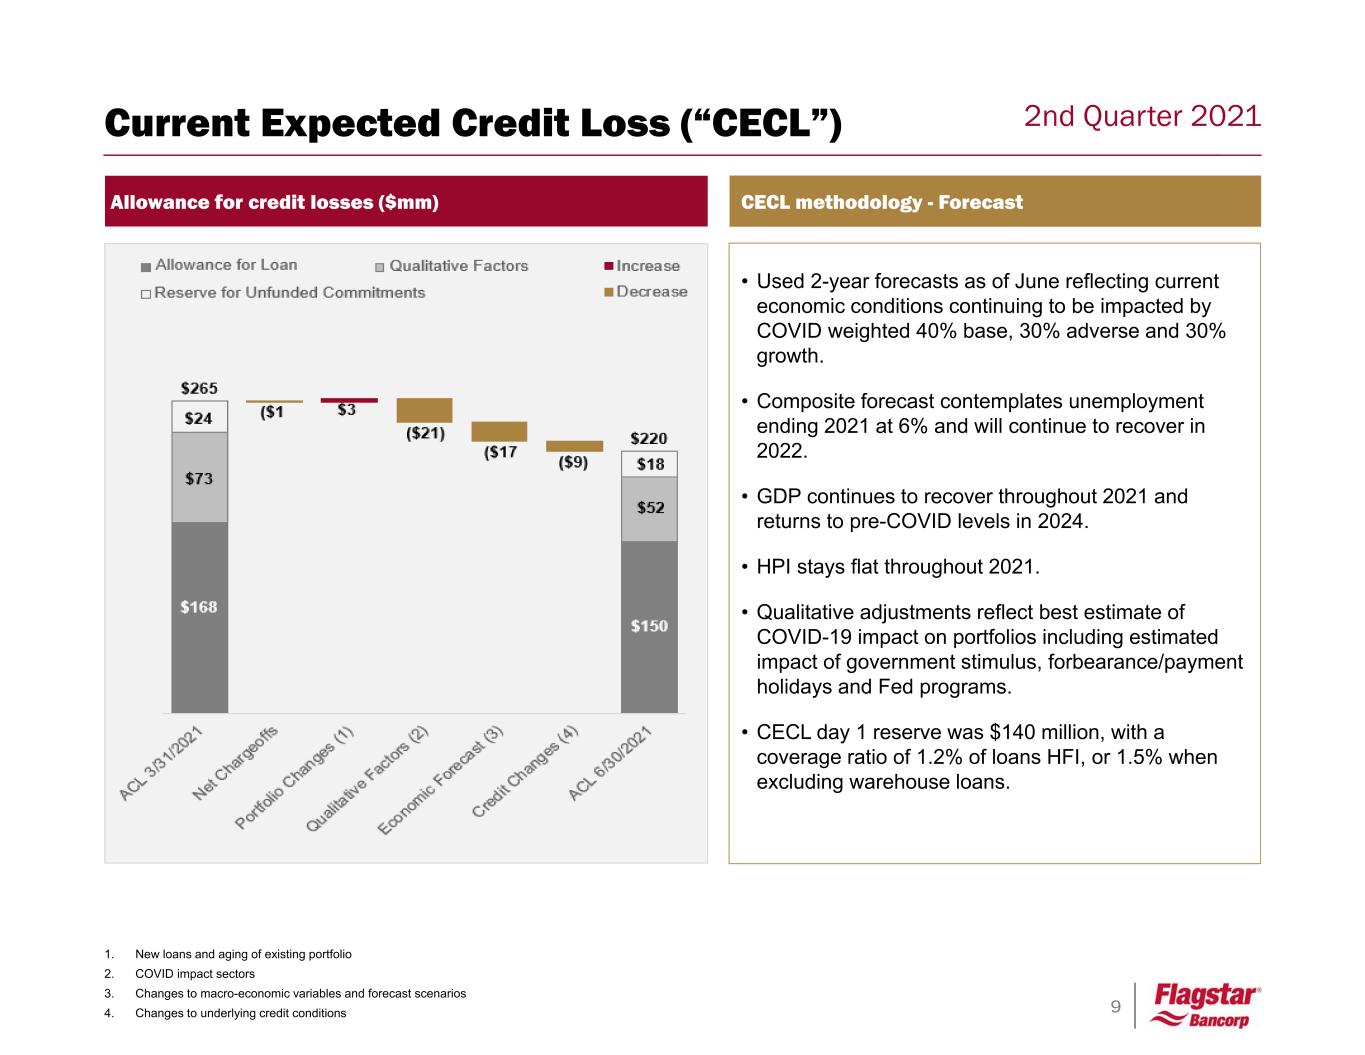
9 2nd Quarter 2021 CECL methodology - Forecast • Used 2-year forecasts as of June reflecting current economic conditions continuing to be impacted by COVID weighted 40% base, 30% adverse and 30% growth. • Composite forecast contemplates unemployment ending 2021 at 6% and will continue to recover in 2022. • GDP continues to recover throughout 2021 and returns to pre-COVID levels in 2024. • HPI stays flat throughout 2021. • Qualitative adjustments reflect best estimate of COVID-19 impact on portfolios including estimated impact of government stimulus, forbearance/payment holidays and Fed programs. • CECL day 1 reserve was $140 million, with a coverage ratio of 1.2% of loans HFI, or 1.5% when excluding warehouse loans. Allowance for credit losses ($mm) Current Expected Credit Loss (“CECL”) 1. New loans and aging of existing portfolio 2. COVID impact sectors 3. Changes to macro-economic variables and forecast scenarios 4. Changes to underlying credit conditions
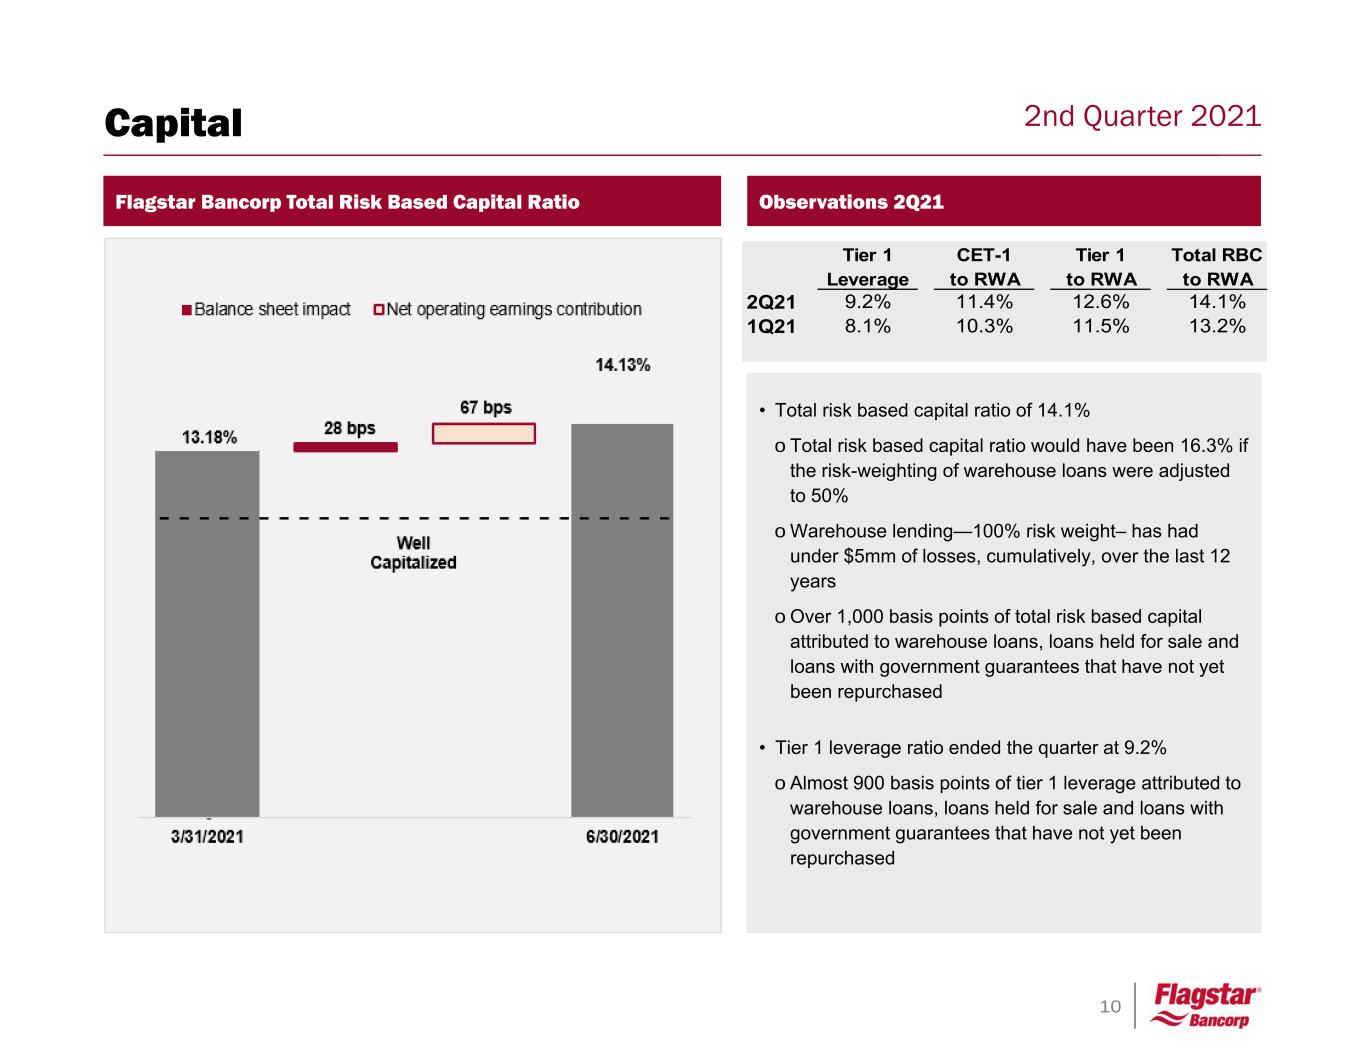
10 2nd Quarter 2021 Observations 2Q21 Tier 1 CET-1 Tier 1 Total RBC Leverage to RWA to RWA to RWA 2Q21 9.2% 11.4% 12.6% 14.1% 1Q21 8.1% 10.3% 11.5% 13.2% Flagstar Bancorp Total Risk Based Capital Ratio • Total risk based capital ratio of 14.1% o Total risk based capital ratio would have been 16.3% if the risk-weighting of warehouse loans were adjusted to 50% o Warehouse lending—100% risk weight– has had under $5mm of losses, cumulatively, over the last 12 years o Over 1,000 basis points of total risk based capital attributed to warehouse loans, loans held for sale and loans with government guarantees that have not yet been repurchased • Tier 1 leverage ratio ended the quarter at 9.2% o Almost 900 basis points of tier 1 leverage attributed to warehouse loans, loans held for sale and loans with government guarantees that have not yet been repurchased Capital 11.2% 11.3%

11 2nd Quarter 2021 DDA 20% Savings 20% MMDA 3% CD 7% Custodial 36% Government 9% Brokered 5% Deposits and Lending Portfolio and strategy overview • Flagstar gathers deposits from consumers, businesses and select governmental entities – Traditionally, CDs and savings accounts represented the bulk of our branch-based retail depository relationships – Today, we are focused on growing DDA balances with consumer, business banking and commercial relationships – We additionally maintain depository relationships in connection with our mortgage origination and servicing businesses, and with governmental entities – Cost of total deposits(1) equal to 0.18%, down 3 basis points from 0.21% in 1Q21 Total average deposits $19.1bn 1. Total deposits include noninterest bearing deposits. Total average LHFI $13.7bn Total: $19.1 bn 0.18% cost of total deposits(1) • Flagstar’s largest category of earning assets consists of loans held-for-investment which averaged $13.7bn during 2Q21 – Loans to consumers consist of residential first and second mortgage loans, HELOC and other – C&I / CRE lending is an important growth strategy, offering risk diversification and asset sensitivity – Warehouse lending to both originators that sell to Flagstar and those who sell to other investors 1st Mortgage 14% 2nds, HELOC & other 13% Warehouse 39% CRE 23% C&I 11% Total: $13.7 bn 3.75% LHFI yield

12 2nd Quarter 2021 Commercial lending Diversified relationship-based approach Commercial Real Estate - $3.2bn (06/30/2021) Commercial & Industrial - $1.4bn (06/30/2021) Financial, insurance & real estate 53% Services 19% Manufacturing 20% Healthcare 1% Distribution 5% Government & education 1% Warehouse - $5.9bn (06/30/2021)Overview • Warehouse lines with approximately 530 active relationships nationwide, of which approximately 56% sell a portion of their loans to Flagstar • Collateralized by mortgage loans being funded which are paid off once the loan is sold • Diversified property types which are primarily income- producing in the normal course of business • Focused on experienced top-tier developers with significant deposit and non-credit product opportunities • Lines of credit and term loans for working capital needs, equipment purchases, and expansion projects • Primarily Michigan based relationships or relationships with national finance companies Warehouse Commercial Real Estate Commercial & Industrial Industry % Advances sold to Flagstar Property type ~41 borrowers sell >75% ~52 borrowers sell 25% - 75% ~440 borrowers sell <25% Other 1% Home Building, 22% Multi Family, 19% Owner Occupied, 11% Retail, 10% Hotel/Motel, 10% Office, 8% Other, 20%
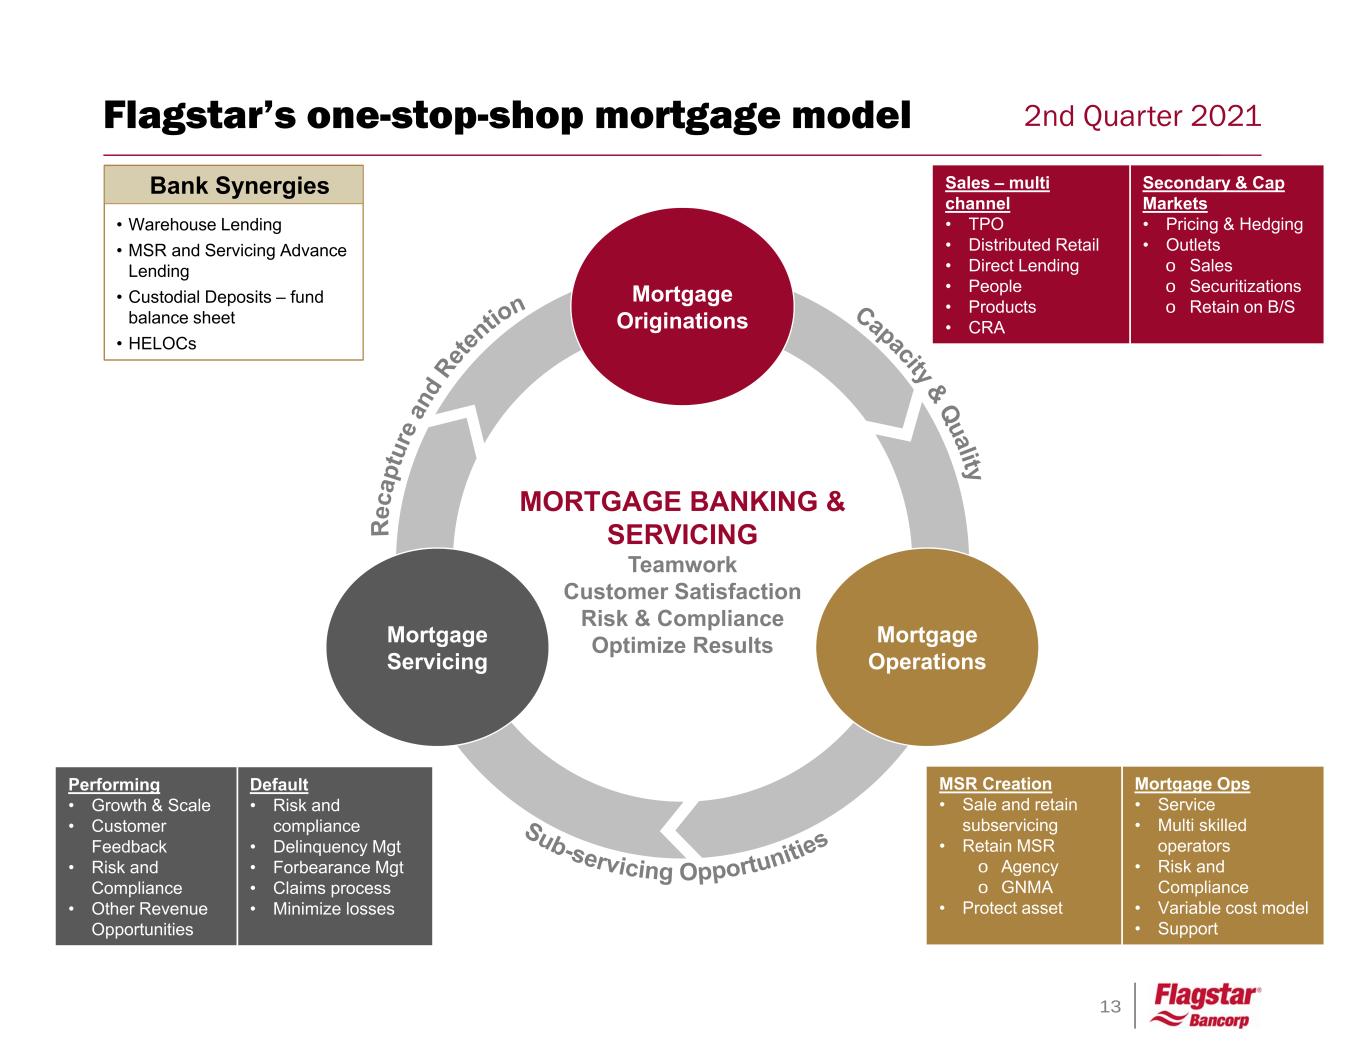
13 2nd Quarter 2021Flagstar’s one-stop-shop mortgage model MORTGAGE BANKING & SERVICING Teamwork Customer Satisfaction Risk & Compliance Optimize Results Mortgage Originations Mortgage Servicing Mortgage Operations • Warehouse Lending • MSR and Servicing Advance Lending • Custodial Deposits – fund balance sheet • HELOCs Bank Synergies Sales – multi channel • TPO • Distributed Retail • Direct Lending • People • Products • CRA Secondary & Cap Markets • Pricing & Hedging • Outlets o Sales o Securitizations o Retain on B/S Performing • Growth & Scale • Customer Feedback • Risk and Compliance • Other Revenue Opportunities Default • Risk and compliance • Delinquency Mgt • Forbearance Mgt • Claims process • Minimize losses MSR Creation • Sale and retain subservicing • Retain MSR o Agency o GNMA • Protect asset Mortgage Ops • Service • Multi skilled operators • Risk and Compliance • Variable cost model • Support
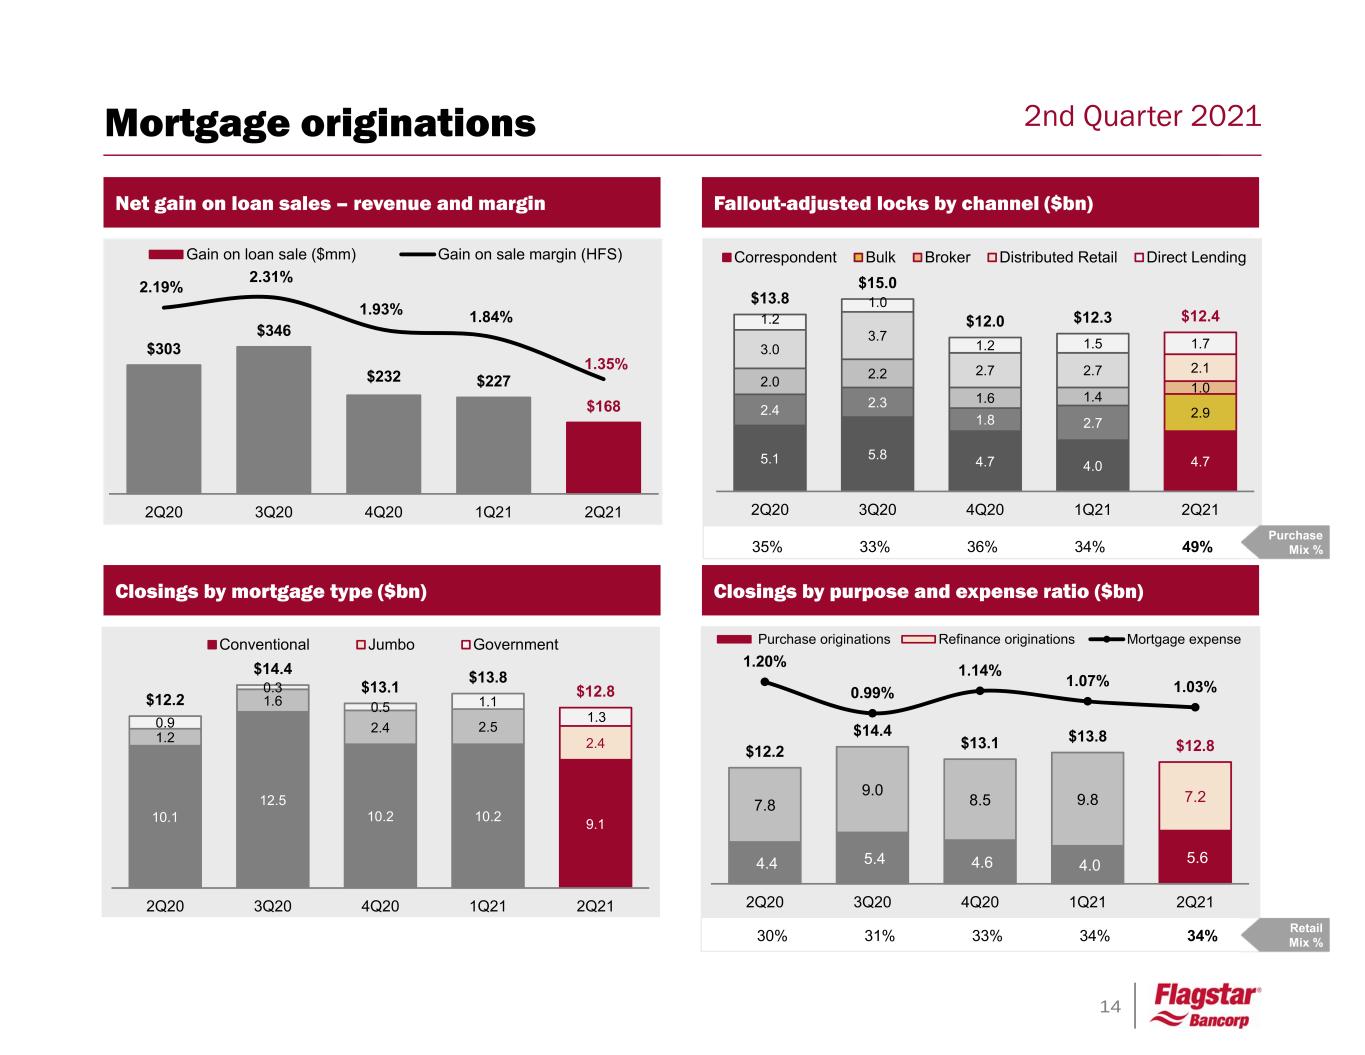
14 2nd Quarter 2021 35% 33% 36% 34% 49% 5.1 5.8 4.7 4.0 4.7 2.4 2.3 1.8 2.7 2.9 2.0 2.2 1.6 1.4 1.0 3.0 3.7 2.7 2.7 2.1 1.2 1.0 1.2 1.5 1.7 $13.8 $15.0 $12.0 $12.3 $12.4 2Q20 3Q20 4Q20 1Q21 2Q21 Correspondent Bulk Broker Distributed Retail Direct Lending 4.4 5.4 4.6 4.0 5.6 7.8 9.0 8.5 9.8 7.2 $12.2 $14.4 $13.1 $13.8 $12.8 1.20% 0.99% 1.14% 1.07% 1.03% 2Q20 3Q20 4Q20 1Q21 2Q21 Purchase originations Refinance originations Mortgage expense 10.1 12.5 10.2 10.2 9.1 1.2 1.6 2.4 2.5 2.4 0.9 0.3 0.5 1.1 1.3 $12.2 $14.4 $13.1 $13.8 $12.8 2Q20 3Q20 4Q20 1Q21 2Q21 Conventional Jumbo Government Closings by mortgage type ($bn) Net gain on loan sales – revenue and margin Fallout-adjusted locks by channel ($bn) $303 $346 $232 $227 $168 2.19% 2.31% 1.93% 1.84% 1.35% 2Q20 3Q20 4Q20 1Q21 2Q21 Gain on loan sale ($mm) Gain on sale margin (HFS) Closings by purpose and expense ratio ($bn) 30% 31% 33% 34% 34% Retail Mix % Mortgage originations Purchase Mix %
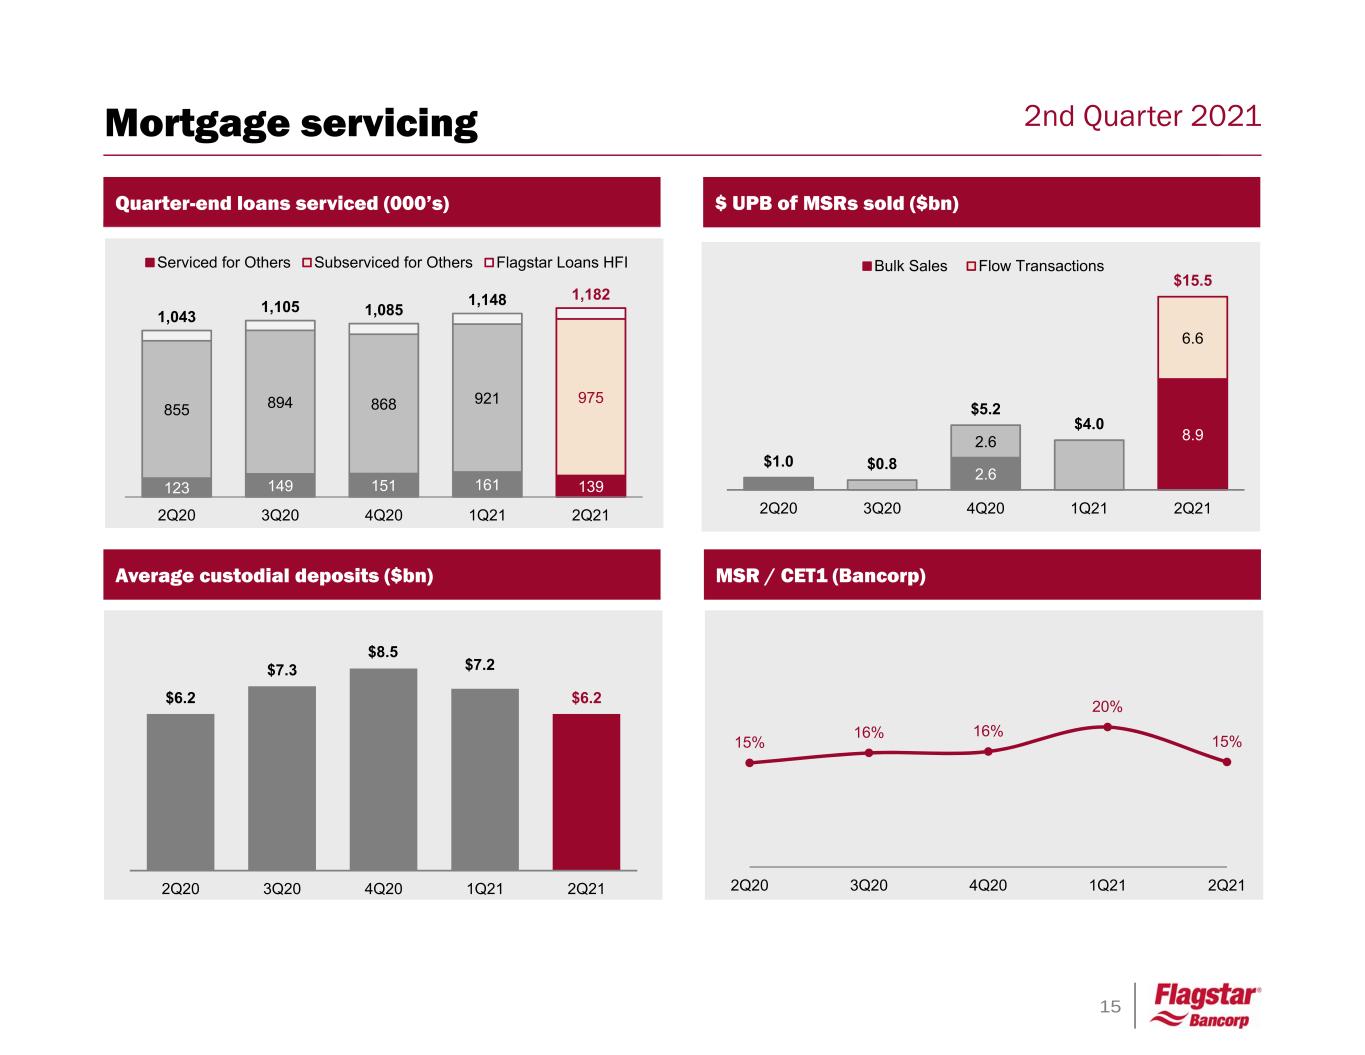
15 2nd Quarter 2021 MSR / CET1 (Bancorp) Quarter-end loans serviced (000’s) $ UPB of MSRs sold ($bn) 123 149 151 161 139 855 894 868 921 975 1,043 1,105 1,085 1,148 1,182 2Q20 3Q20 4Q20 1Q21 2Q21 Serviced for Others Subserviced for Others Flagstar Loans HFI 2.6 8.92.6 6.6 $1.0 $0.8 $5.2 $4.0 $15.5 2Q20 3Q20 4Q20 1Q21 2Q21 Bulk Sales Flow Transactions 15% 16% 16% 20% 15% 2Q20 3Q20 4Q20 1Q21 2Q21 Average custodial deposits ($bn) $7.2 $6.2 $7.3 $8.5 $6.2 2Q20 3Q20 4Q20 1Q21 2Q21 Mortgage servicing
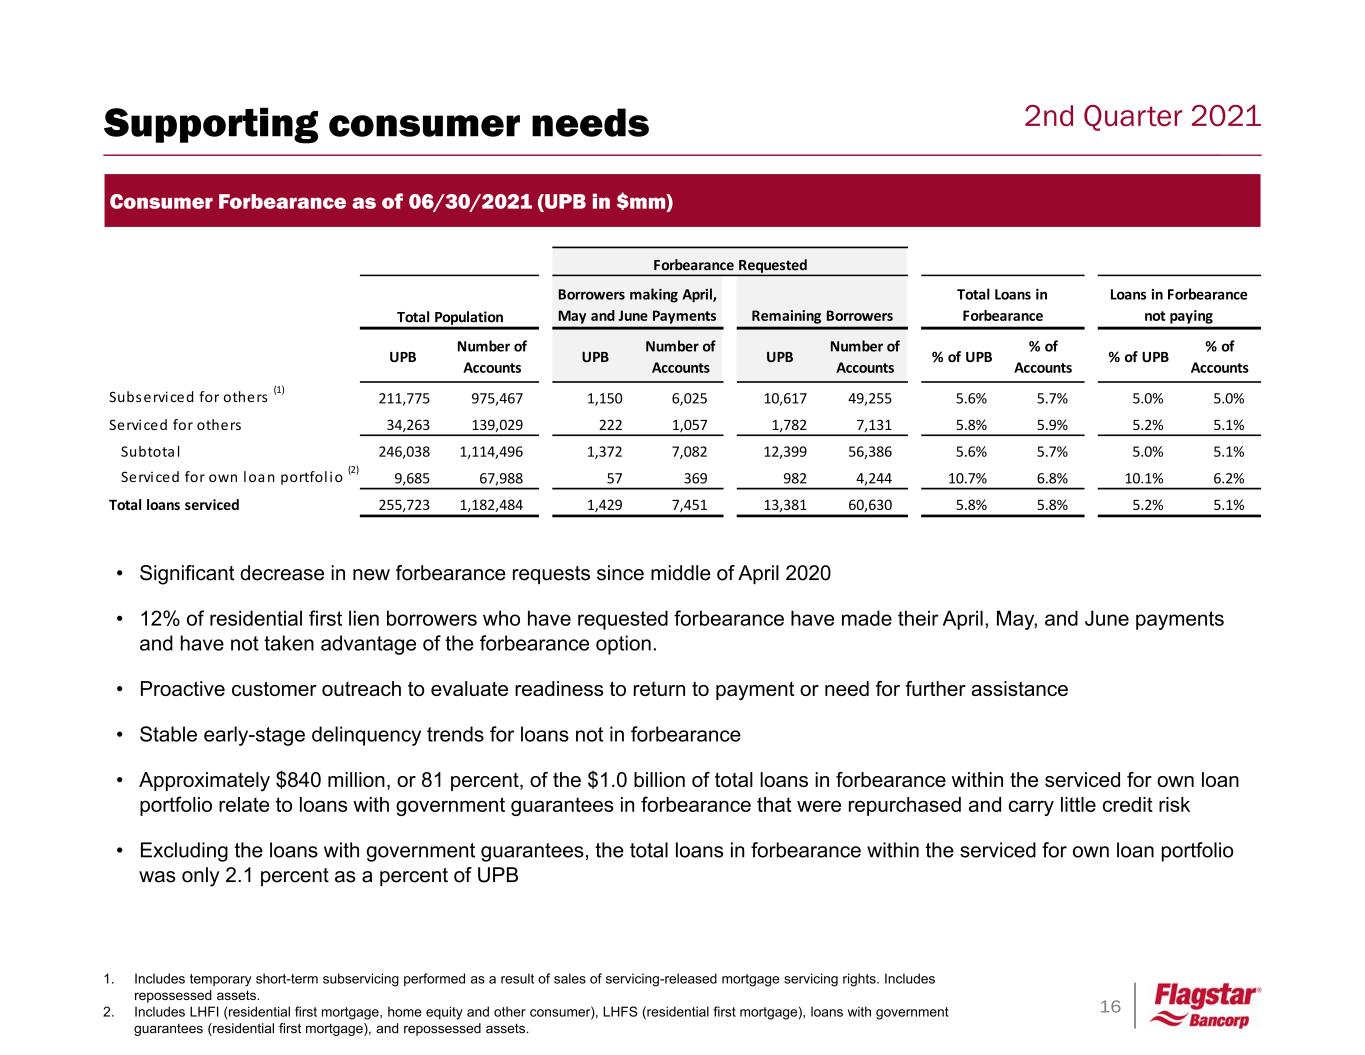
16 2nd Quarter 2021 Consumer Forbearance as of 06/30/2021 (UPB in $mm) • Significant decrease in new forbearance requests since middle of April 2020 • 12% of residential first lien borrowers who have requested forbearance have made their April, May, and June payments and have not taken advantage of the forbearance option. • Proactive customer outreach to evaluate readiness to return to payment or need for further assistance • Stable early-stage delinquency trends for loans not in forbearance • Approximately $840 million, or 81 percent, of the $1.0 billion of total loans in forbearance within the serviced for own loan portfolio relate to loans with government guarantees in forbearance that were repurchased and carry little credit risk • Excluding the loans with government guarantees, the total loans in forbearance within the serviced for own loan portfolio was only 2.1 percent as a percent of UPB 1. Includes temporary short-term subservicing performed as a result of sales of servicing-released mortgage servicing rights. Includes repossessed assets. 2. Includes LHFI (residential first mortgage, home equity and other consumer), LHFS (residential first mortgage), loans with government guarantees (residential first mortgage), and repossessed assets. Supporting consumer needs UPB Number of Accounts UPB Number of Accounts UPB Number of Accounts % of UPB % of Accounts % of UPB % of Accounts Subserviced for others (1) 211,775 975,467 1,150 6,025 10,617 49,255 5.6% 5.7% 5.0% 5.0% Serviced for others 34,263 139,029 222 1,057 1,782 7,131 5.8% 5.9% 5.2% 5.1% Subtota l 246,038 1,114,496 1,372 7,082 12,399 56,386 5.6% 5.7% 5.0% 5.1% Serviced for own loan portfol io (2) 9,685 67,988 57 369 982 4,244 10.7% 6.8% 10.1% 6.2% Total loans serviced 255,723 1,182,484 1,429 7,451 13,381 60,630 5.8% 5.8% 5.2% 5.1% Loans in Forbearance not paying Forbearance Requested Total Population Borrowers making April, May and June Payments Remaining Borrowers Total Loans in Forbearance
17 2nd Quarter 2021Appendix Company overview 18 Community banking 21 Mortgage servicing 32 Mortgage originations 35 Financial performance 37 Capital and liquidity 39 Guidance 42 Non-GAAP reconciliation 43
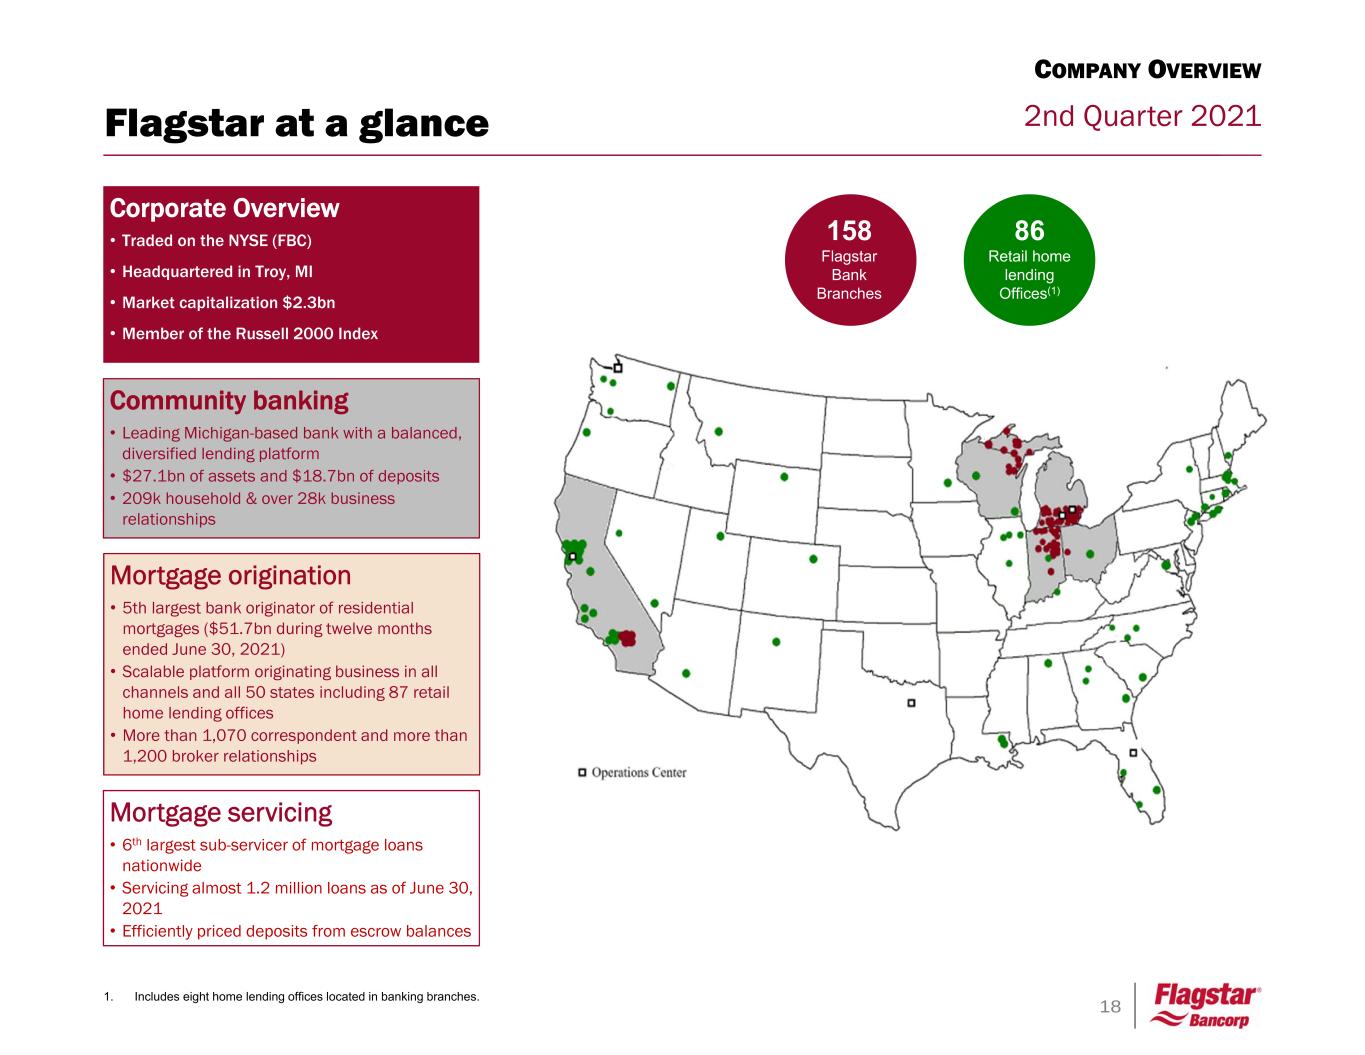
18 2nd Quarter 2021 Community banking • Leading Michigan-based bank with a balanced, diversified lending platform • $27.1bn of assets and $18.7bn of deposits • 209k household & over 28k business relationships Mortgage origination • 5th largest bank originator of residential mortgages ($51.7bn during twelve months ended June 30, 2021) • Scalable platform originating business in all channels and all 50 states including 87 retail home lending offices • More than 1,070 correspondent and more than 1,200 broker relationships Corporate Overview • Traded on the NYSE (FBC) • Headquartered in Troy, MI • Market capitalization $2.3bn • Member of the Russell 2000 Index 1. Includes eight home lending offices located in banking branches. 86 Retail home lending Offices(1) 158 Flagstar Bank Branches Mortgage servicing • 6th largest sub-servicer of mortgage loans nationwide • Servicing almost 1.2 million loans as of June 30, 2021 • Efficiently priced deposits from escrow balances Flagstar at a glance COMPANY OVERVIEW
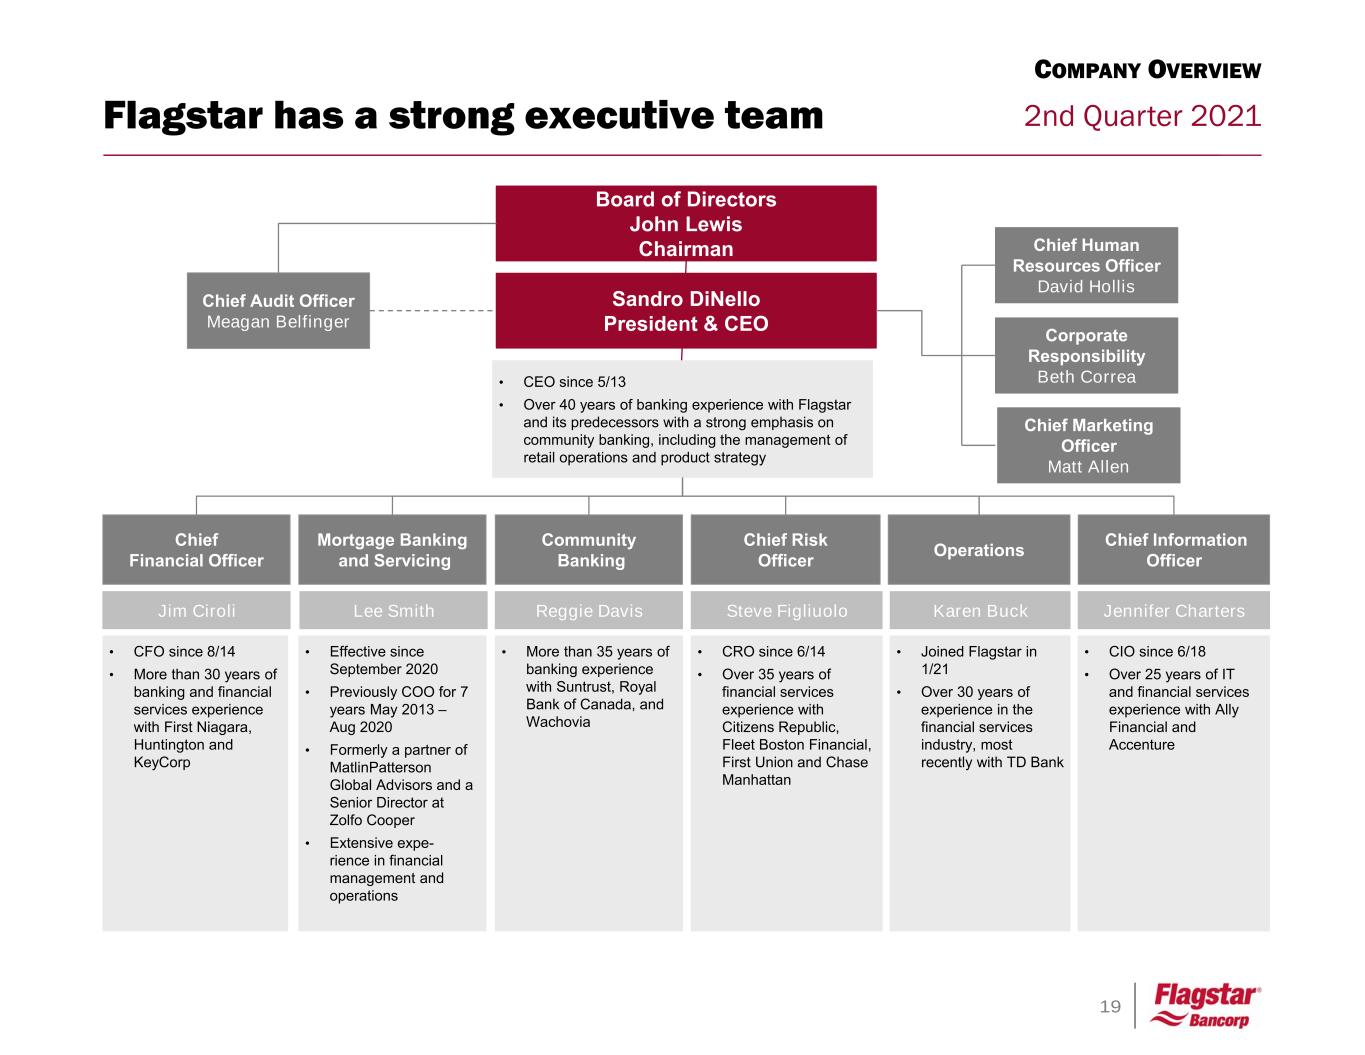
19 2nd Quarter 2021Flagstar has a strong executive team Board of Directors John Lewis Chairman Community Banking Chief Financial Officer • CFO since 8/14 • More than 30 years of banking and financial services experience with First Niagara, Huntington and KeyCorp Chief Risk Officer • CRO since 6/14 • Over 35 years of financial services experience with Citizens Republic, Fleet Boston Financial, First Union and Chase Manhattan Mortgage Banking and Servicing • Effective since September 2020 • Previously COO for 7 years May 2013 – Aug 2020 • Formerly a partner of MatlinPatterson Global Advisors and a Senior Director at Zolfo Cooper • Extensive expe- rience in financial management and operations Operations • Joined Flagstar in 1/21 • Over 30 years of experience in the financial services industry, most recently with TD Bank • CEO since 5/13 • Over 40 years of banking experience with Flagstar and its predecessors with a strong emphasis on community banking, including the management of retail operations and product strategy Karen BuckSteve FigliuoloReggie DavisLee SmithJim Ciroli • More than 35 years of banking experience with Suntrust, Royal Bank of Canada, and Wachovia Chief Audit Officer Meagan Belfinger Sandro DiNello President & CEO Chief Information Officer Jennifer Charters • CIO since 6/18 • Over 25 years of IT and financial services experience with Ally Financial and Accenture COMPANY OVERVIEW Chief Human Resources Officer David Hollis Corporate Responsibility Beth Correa Chief Marketing Officer Matt Allen
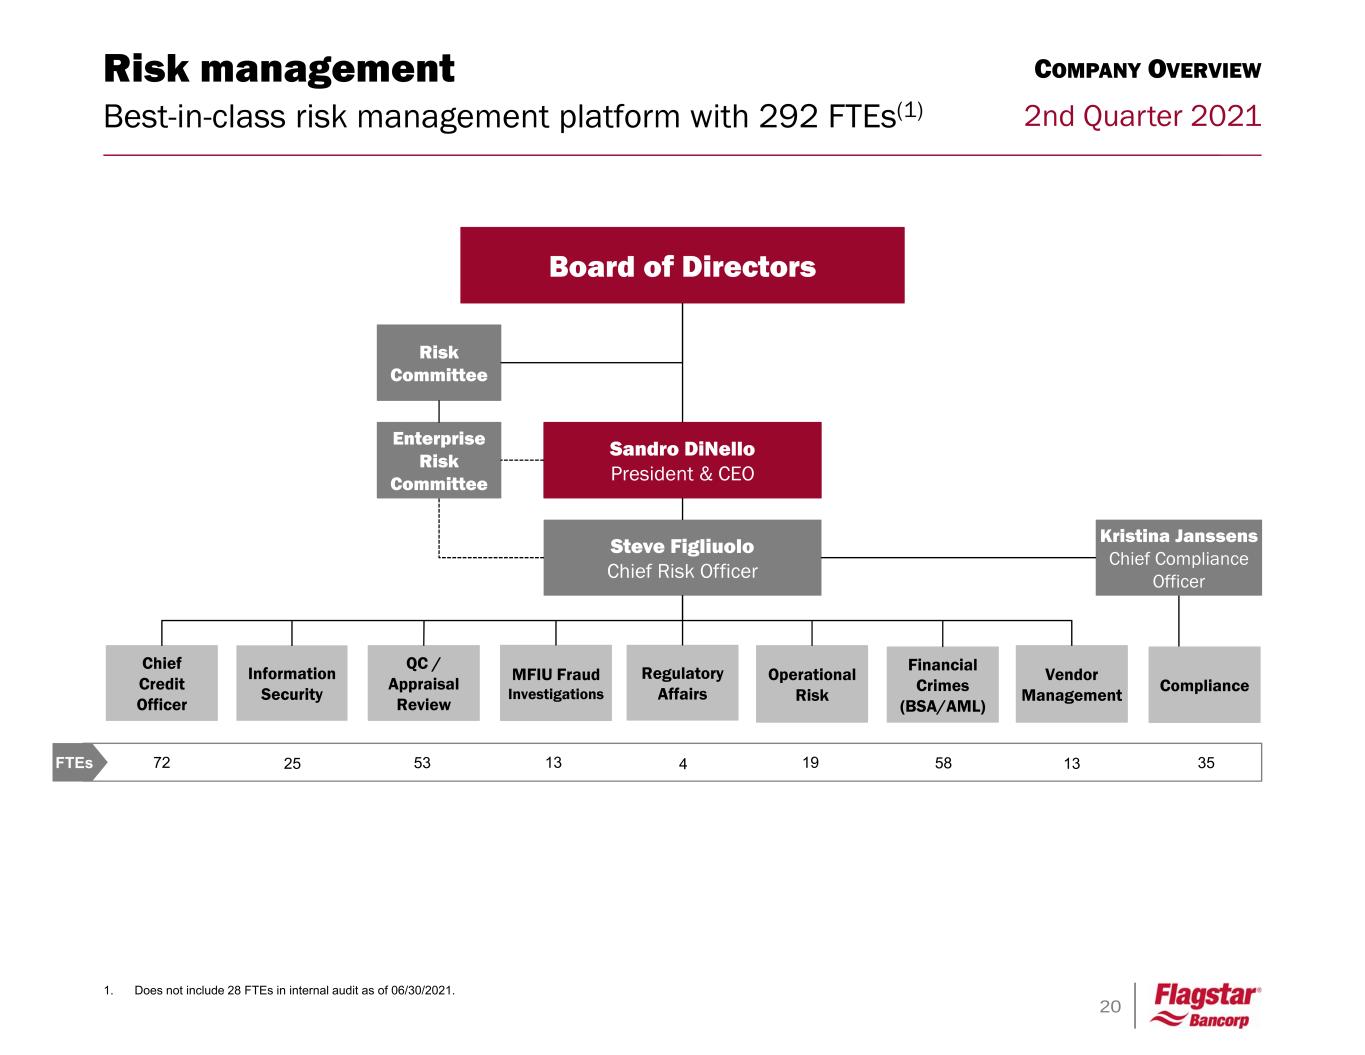
20 2nd Quarter 2021 Risk management Best-in-class risk management platform with 292 FTEs(1) 1. Does not include 28 FTEs in internal audit as of 06/30/2021. Kristina Janssens Chief Compliance Officer Sandro DiNello President & CEO Board of Directors Steve Figliuolo Chief Risk Officer Risk Committee Enterprise Risk Committee 72 53 13 4 19 58FTEs Regulatory Affairs Chief Credit Officer QC / Appraisal Review MFIU Fraud Investigations Operational Risk Financial Crimes (BSA/AML) Compliance 13 Vendor Management 35 Information Security 25 COMPANY OVERVIEW
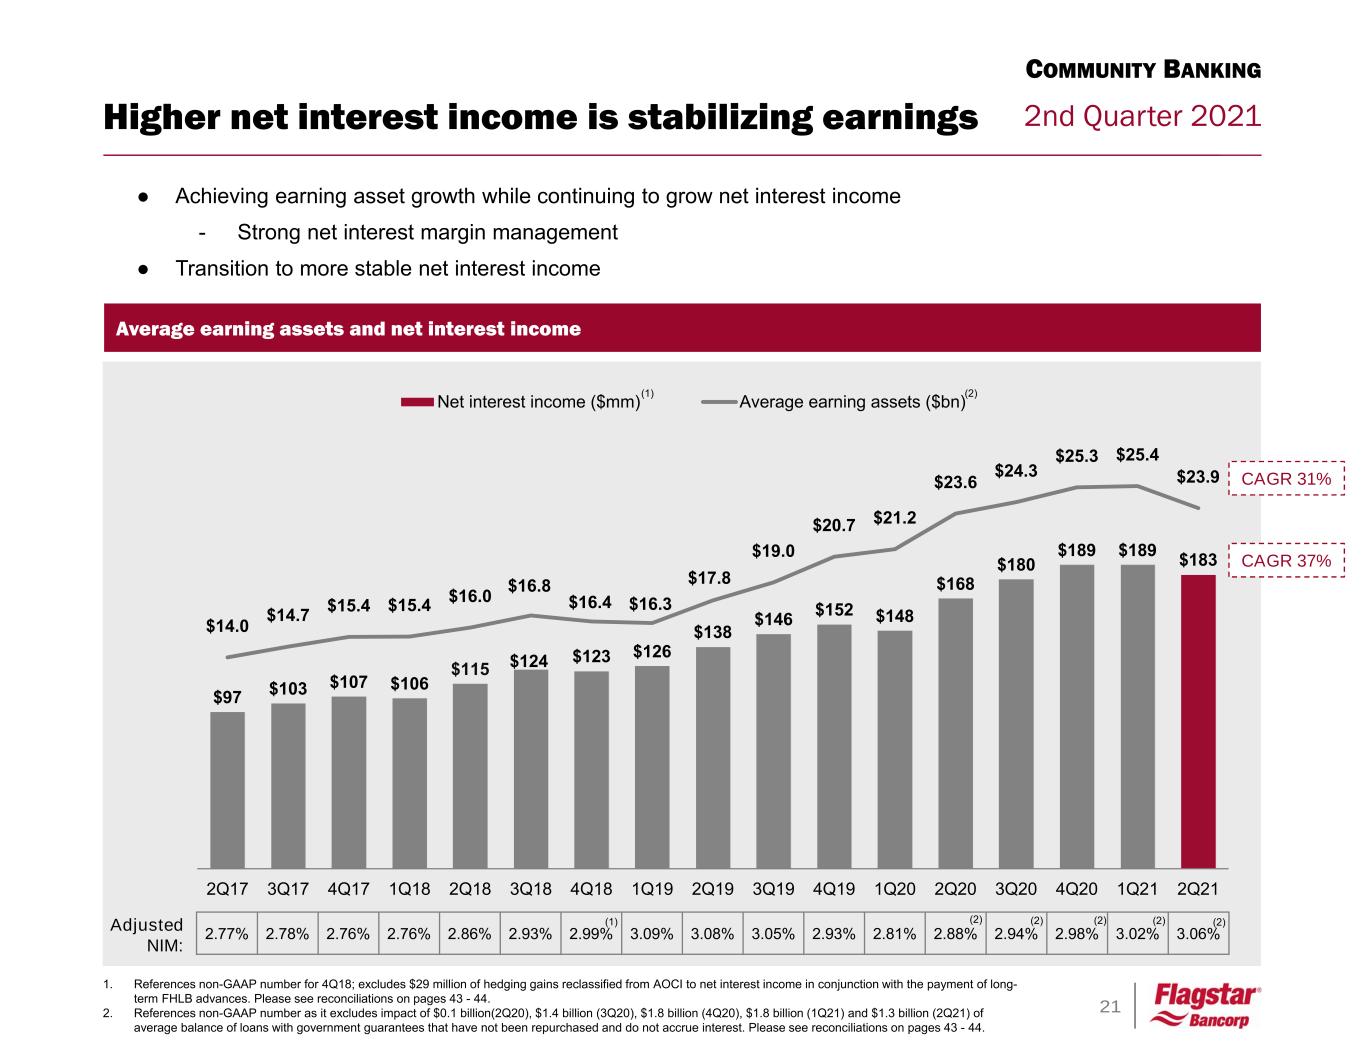
21 2nd Quarter 2021 $97 $103 $107 $106 $115 $124 $123 $126 $138 $146 $152 $148 $168 $180 $189 $189 $183 $14.0 $14.7 $15.4 $15.4 $16.0 $16.8 $16.4 $16.3 $17.8 $19.0 $20.7 $21.2 $23.6 $24.3 $25.3 $25.4 $23.9 2Q17 3Q17 4Q17 1Q18 2Q18 3Q18 4Q18 1Q19 2Q19 3Q19 4Q19 1Q20 2Q20 3Q20 4Q20 1Q21 2Q21 Net interest income ($mm) Average earning assets ($bn) 2.77% 2.78% 2.76% 2.76% 2.86% 2.93% 2.99% 3.09% 3.08% 3.05% 2.93% 2.81% 2.88% 2.94% 2.98% 3.02% 3.06% ● Achieving earning asset growth while continuing to grow net interest income - Strong net interest margin management ● Transition to more stable net interest income Average earning assets and net interest income Higher net interest income is stabilizing earnings 1. References non-GAAP number for 4Q18; excludes $29 million of hedging gains reclassified from AOCI to net interest income in conjunction with the payment of long- term FHLB advances. Please see reconciliations on pages 43 - 44. 2. References non-GAAP number as it excludes impact of $0.1 billion(2Q20), $1.4 billion (3Q20), $1.8 billion (4Q20), $1.8 billion (1Q21) and $1.3 billion (2Q21) of average balance of loans with government guarantees that have not been repurchased and do not accrue interest. Please see reconciliations on pages 43 - 44. COMMUNITY BANKING CAGR 31% CAGR 37% Adjusted NIM: (1) (2)(2) (1) (2) (2)(2) (2)
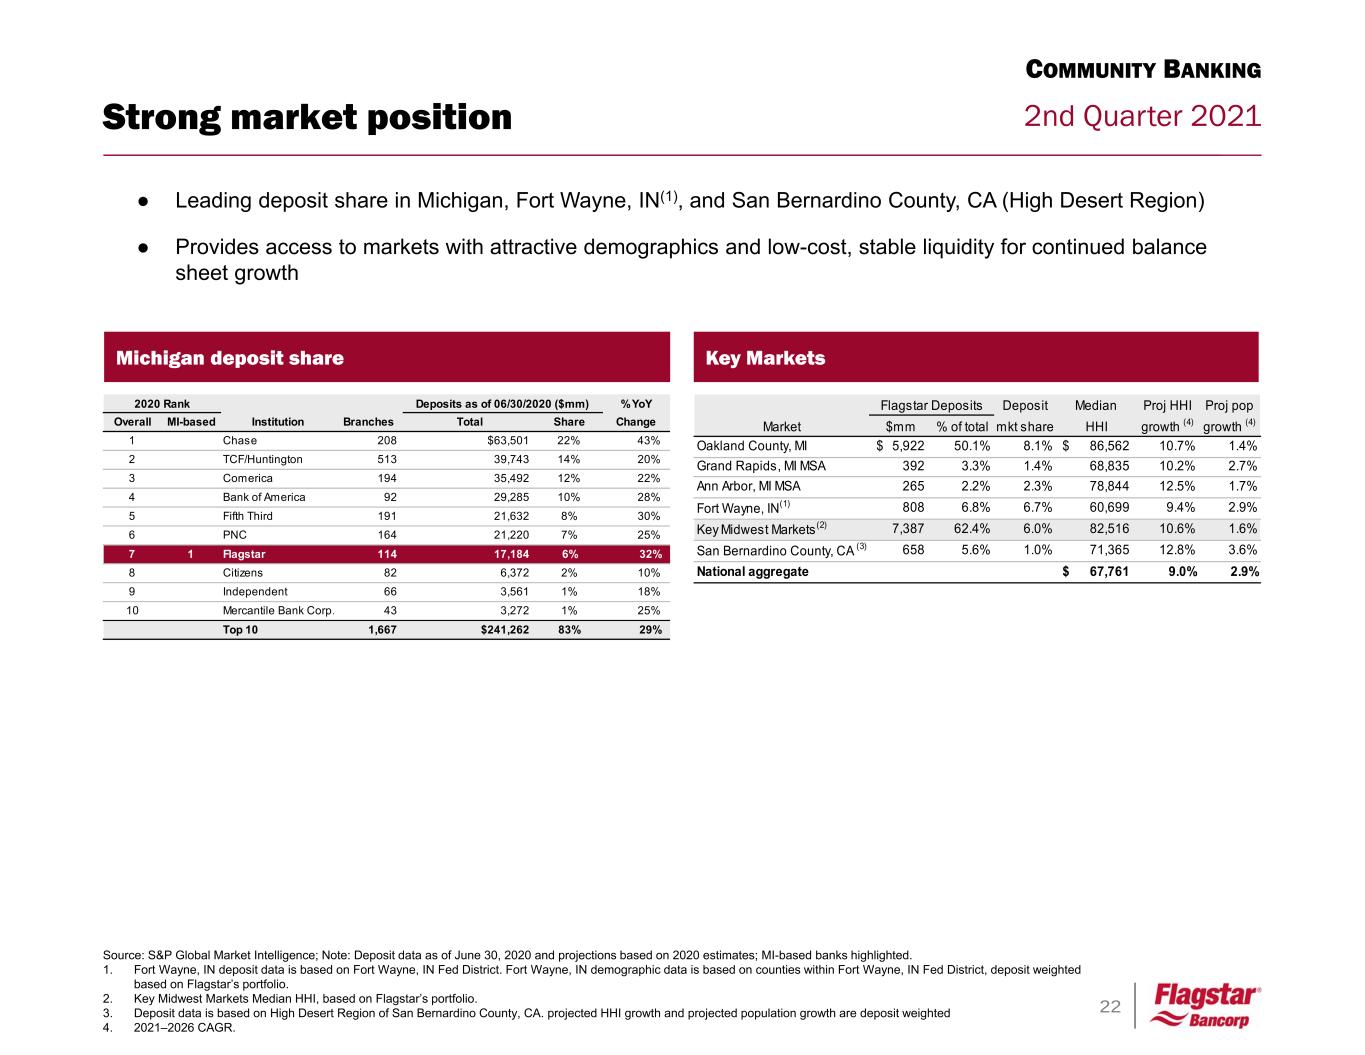
22 2nd Quarter 2021Strong market position Source: S&P Global Market Intelligence; Note: Deposit data as of June 30, 2020 and projections based on 2020 estimates; MI-based banks highlighted. 1. Fort Wayne, IN deposit data is based on Fort Wayne, IN Fed District. Fort Wayne, IN demographic data is based on counties within Fort Wayne, IN Fed District, deposit weighted based on Flagstar’s portfolio. 2. Key Midwest Markets Median HHI, based on Flagstar’s portfolio. 3. Deposit data is based on High Desert Region of San Bernardino County, CA. projected HHI growth and projected population growth are deposit weighted 4. 2021–2026 CAGR. Key Markets COMMUNITY BANKING Michigan deposit share ● Leading deposit share in Michigan, Fort Wayne, IN(1), and San Bernardino County, CA (High Desert Region) ● Provides access to markets with attractive demographics and low-cost, stable liquidity for continued balance sheet growth % YoY Overall MI-based Institution Branches Total Share Change 1 Chase 208 $63,501 22% 43% 2 TCF/Huntington 513 39,743 14% 20% 3 Comerica 194 35,492 12% 22% 4 Bank of America 92 29,285 10% 28% 5 Fifth Third 191 21,632 8% 30% 6 PNC 164 21,220 7% 25% 7 1 Flagstar 114 17,184 6% 32% 8 Citizens 82 6,372 2% 10% 9 Independent 66 3,561 1% 18% 10 Mercantile Bank Corp. 43 3,272 1% 25% Top 10 1,667 $241,262 83% 29% 2020 Rank Deposits as of 06/30/2020 ($mm) Deposit Median Proj HHI Proj pop Market $mm % of total mkt share HHI growth (4) growth (4) Oakland County, MI 5,922$ 50.1% 8.1% 86,562$ 10.7% 1.4% Grand Rapids, MI MSA 392 3.3% 1.4% 68,835 10.2% 2.7% Ann Arbor, MI MSA 265 2.2% 2.3% 78,844 12.5% 1.7% Fort Wayne, IN(1) 808 6.8% 6.7% 60,699 9.4% 2.9% Key Midwest Markets(2) 7,387 62.4% 6.0% 82,516 10.6% 1.6% San Bernardino County, CA (3) 658 5.6% 1.0% 71,365 12.8% 3.6% National aggregate 67,761$ 9.0% 2.9% Flagstar Deposits
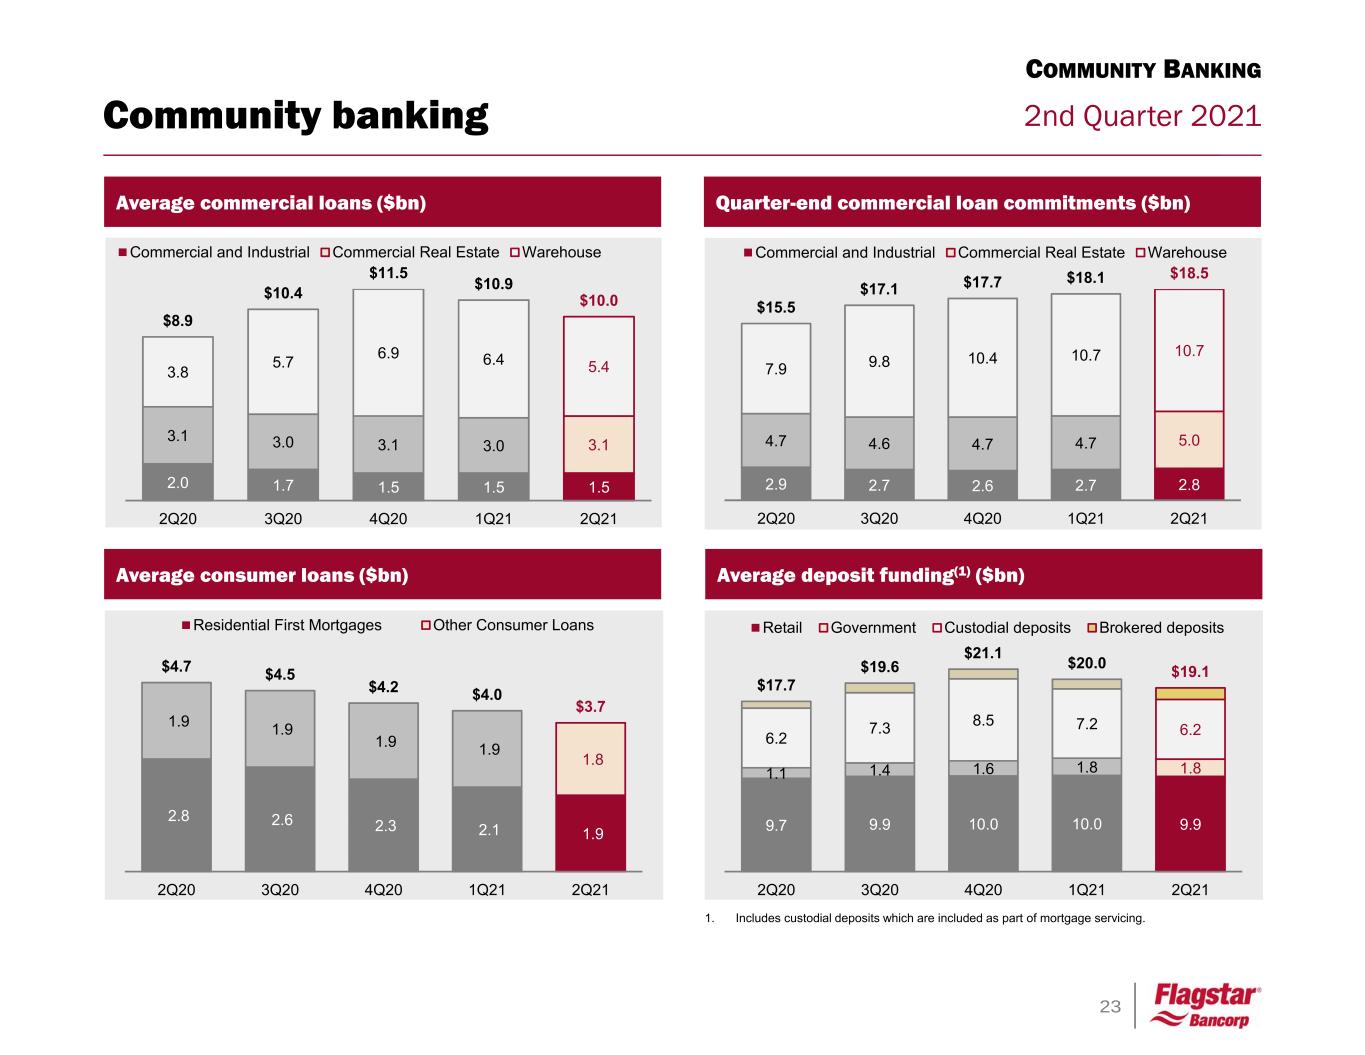
23 2nd Quarter 2021Community banking Quarter-end commercial loan commitments ($bn) Average deposit funding(1) ($bn) 9.7 9.9 10.0 10.0 9.9 1.1 1.4 1.6 1.8 1.8 6.2 7.3 8.5 7.2 6.2 $17.7 $19.6 $21.1 $20.0 $19.1 2Q20 3Q20 4Q20 1Q21 2Q21 Retail Government Custodial deposits Brokered deposits 1. Includes custodial deposits which are included as part of mortgage servicing. 2.9 2.7 2.6 2.7 2.8 4.7 4.6 4.7 4.7 5.0 7.9 9.8 10.4 10.7 10.7 $15.5 $17.1 $17.7 $18.1 $18.5 2Q20 3Q20 4Q20 1Q21 2Q21 Commercial and Industrial Commercial Real Estate Warehouse Average commercial loans ($bn) Average consumer loans ($bn) 2.0 1.7 1.5 1.5 1.5 3.1 3.0 3.1 3.0 3.1 3.8 5.7 6.9 6.4 5.4 $8.9 $10.4 $11.5 $10.9 $10.0 2Q20 3Q20 4Q20 1Q21 2Q21 Commercial and Industrial Commercial Real Estate Warehouse 2.8 2.6 2.3 2.1 1.9 1.9 1.9 1.9 1.9 1.8 $4.7 $4.5 $4.2 $4.0 $3.7 2Q20 3Q20 4Q20 1Q21 2Q21 Residential First Mortgages Other Consumer Loans COMMUNITY BANKING
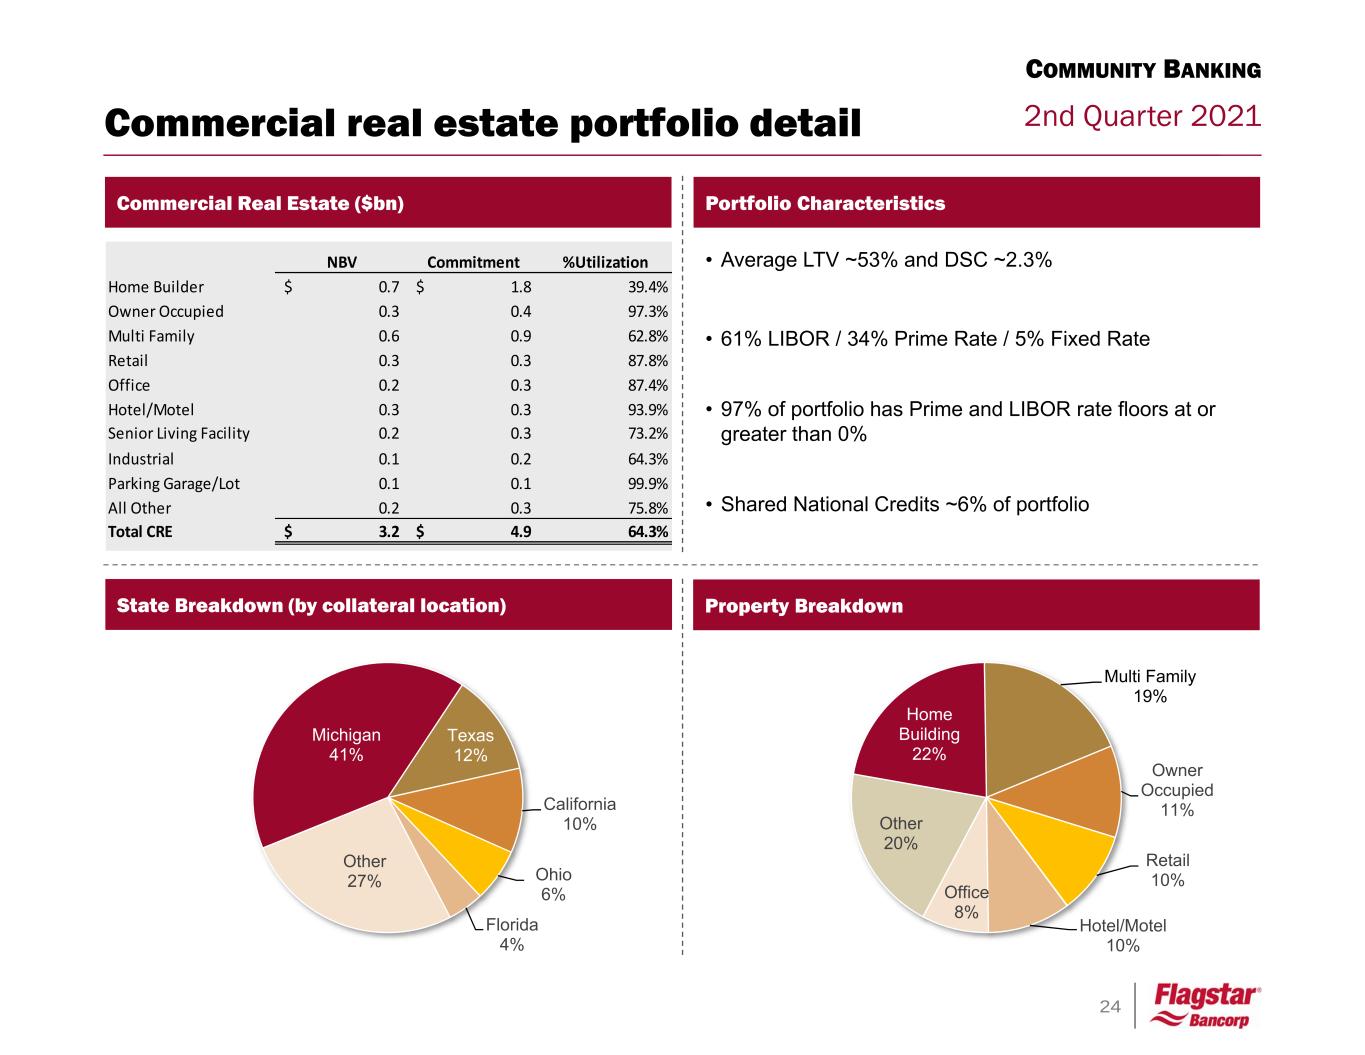
24 2nd Quarter 2021 • Average LTV ~53% and DSC ~2.3% • 61% LIBOR / 34% Prime Rate / 5% Fixed Rate • 97% of portfolio has Prime and LIBOR rate floors at or greater than 0% • Shared National Credits ~6% of portfolio Commercial Real Estate ($bn) Commercial real estate portfolio detail Portfolio Characteristics State Breakdown (by collateral location) COMMUNITY BANKING Property Breakdown Michigan 41% Texas 12% California 10% Ohio 6% Florida 4% Other 27% Home Building 22% Multi Family 19% Owner Occupied 11% Retail 10% Hotel/Motel 10% Office 8% Other 20% NBV Commitment %Utilization Home Builder 0.7$ 1.8$ 39.4% Owner Occupied 0.3 0.4 97.3% Multi Family 0.6 0.9 62.8% Retail 0.3 0.3 87.8% Office 0.2 0.3 87.4% Hotel/Motel 0.3 0.3 93.9% Senior Living Facility 0.2 0.3 73.2% Industrial 0.1 0.2 64.3% Parking Garage/Lot 0.1 0.1 99.9% All Other 0.2 0.3 75.8% Total CRE 3.2$ 4.9$ 64.3%
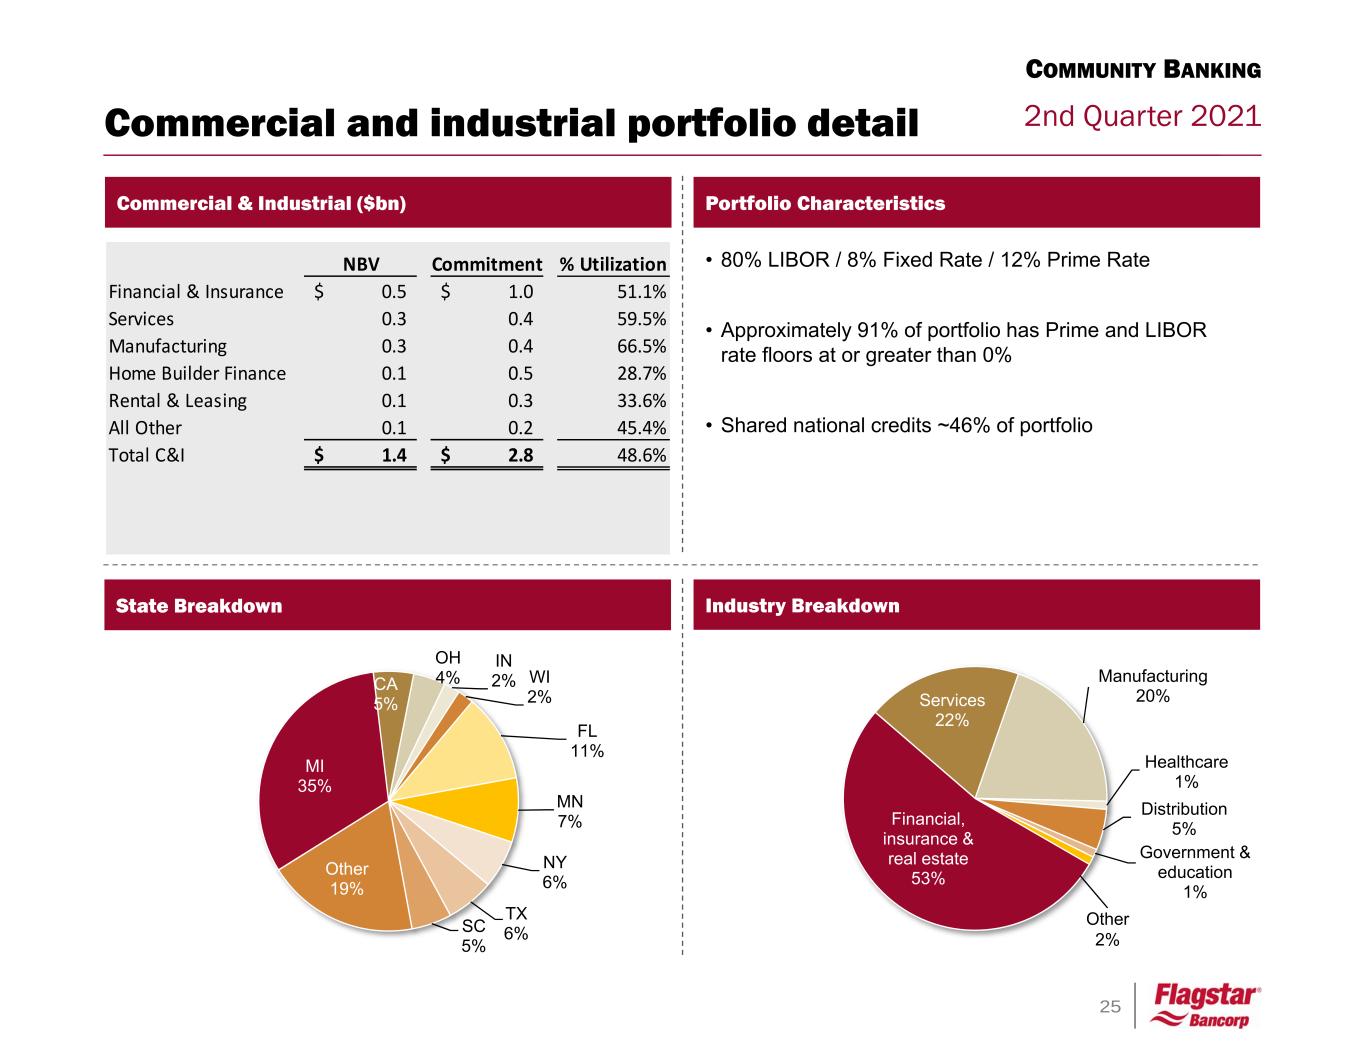
25 2nd Quarter 2021 Commercial & Industrial ($bn) Commercial and industrial portfolio detail Portfolio Characteristics State Breakdown COMMUNITY BANKING MI 35% CA 5% OH 4% IN 2% WI 2% FL 11% MN 7% NY 6% TX 6%SC 5% Other 19% • 80% LIBOR / 8% Fixed Rate / 12% Prime Rate • Approximately 91% of portfolio has Prime and LIBOR rate floors at or greater than 0% • Shared national credits ~46% of portfolio Industry Breakdown Financial, insurance & real estate 53% Services 22% Manufacturing 20% Healthcare 1% Distribution 5% Government & education 1% Other 2% NBV Commitment % Utilization Financial & Insurance 0.5$ 1.0$ 51.1% Services 0.3 0.4 59.5% Manufacturing 0.3 0.4 66.5% Home Builder Finance 0.1 0.5 28.7% Rental & Leasing 0.1 0.3 33.6% All Other 0.1 0.2 45.4% Total C&I 1.4$ 2.8$ 48.6%
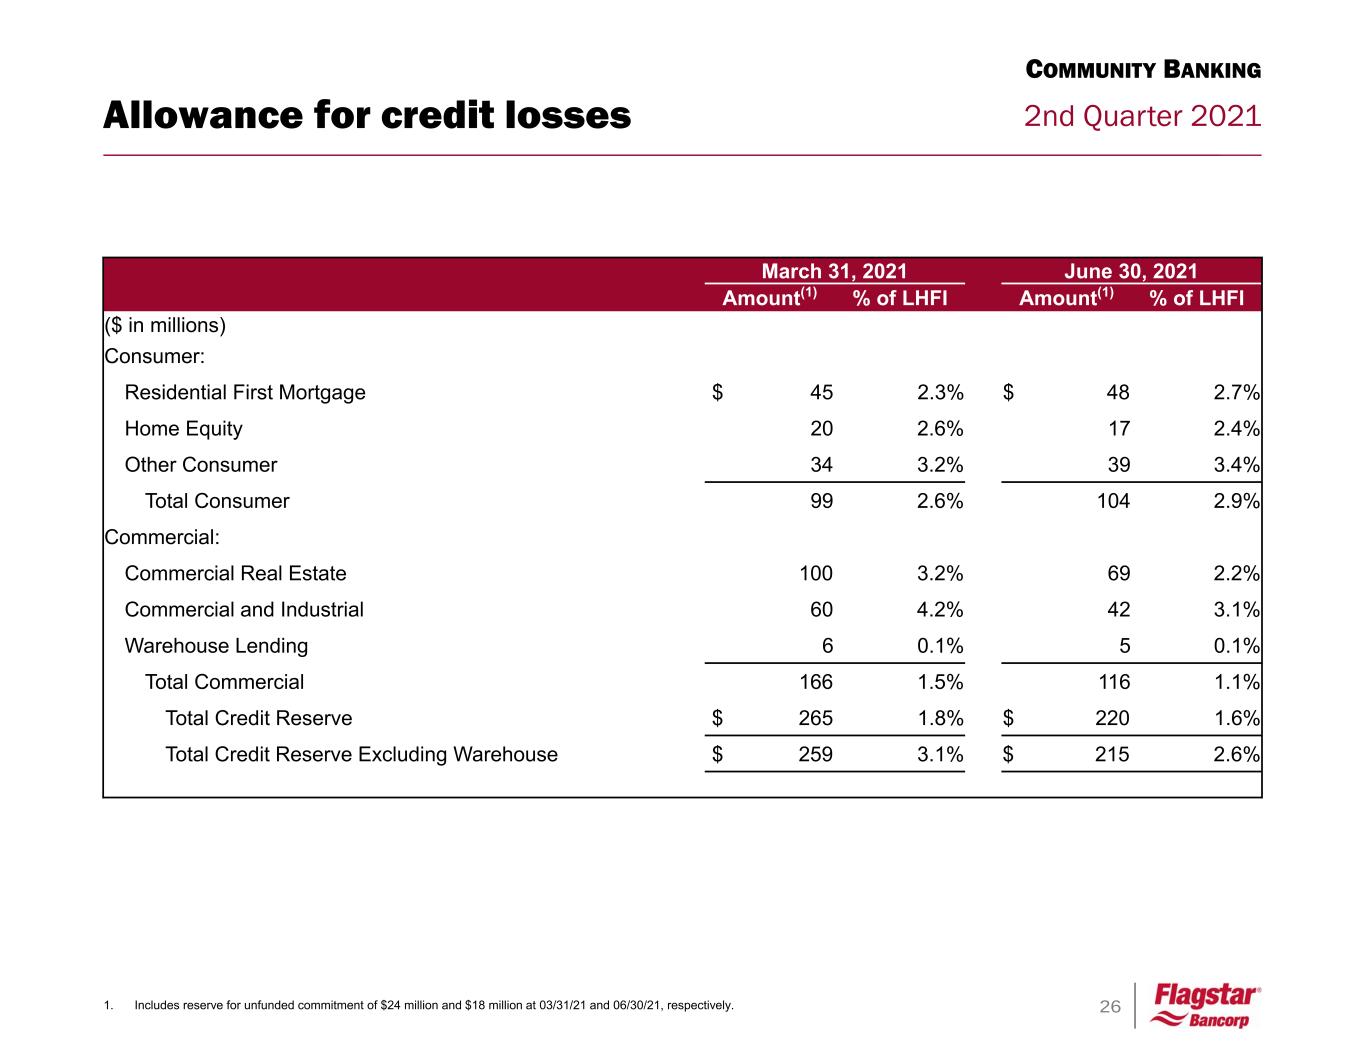
26 2nd Quarter 2021Allowance for credit losses COMMUNITY BANKING 1. Includes reserve for unfunded commitment of $24 million and $18 million at 03/31/21 and 06/30/21, respectively. March 31, 2021 June 30, 2021 Amount(1) % of LHFI Amount(1) % of LHFI ($ in millions) Consumer: Residential First Mortgage $ 45 2.3% $ 48 2.7% Home Equity 20 2.6% 17 2.4% Other Consumer 34 3.2% 39 3.4% Total Consumer 99 2.6% 104 2.9% Commercial: Commercial Real Estate 100 3.2% 69 2.2% Commercial and Industrial 60 4.2% 42 3.1% Warehouse Lending 6 0.1% 5 0.1% Total Commercial 166 1.5% 116 1.1% Total Credit Reserve $ 265 1.8% $ 220 1.6% Total Credit Reserve Excluding Warehouse $ 259 3.1% $ 215 2.6%
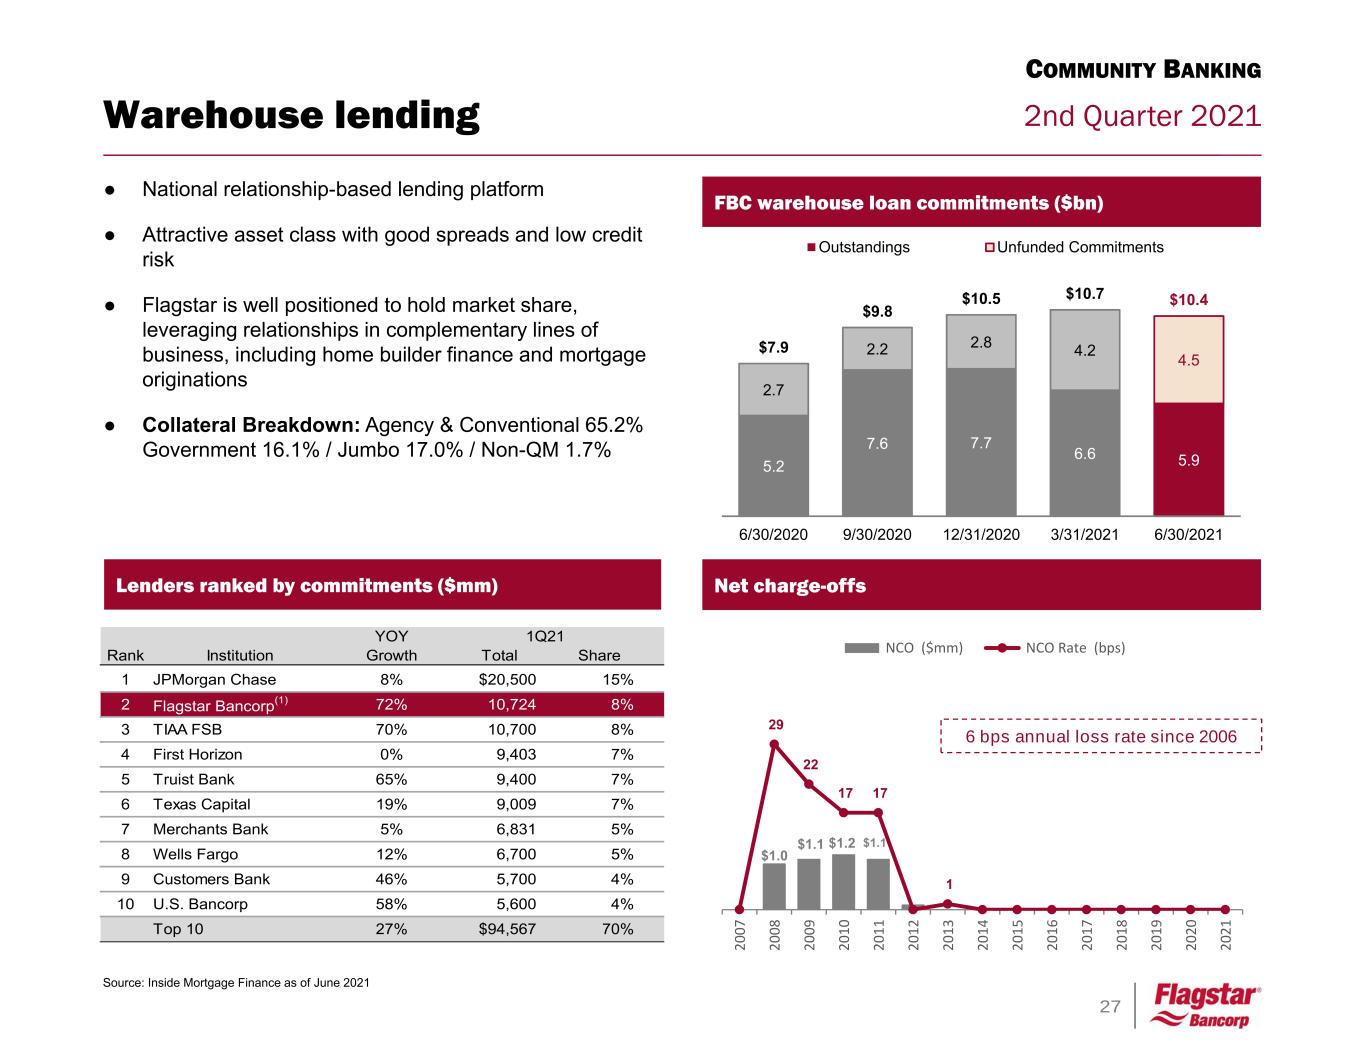
27 2nd Quarter 2021 $1.0 $1.1 $1.2 $1.1 29 22 17 17 1 20 07 20 08 20 09 20 10 20 11 20 12 20 13 20 14 20 15 20 16 20 17 20 18 20 19 20 20 20 21 NCO ($mm) NCO Rate (bps) 5.2 7.6 7.7 6.6 5.9 2.7 2.2 2.8 4.2 4.5 $7.9 $9.8 $10.5 $10.7 $10.4 6/30/2020 9/30/2020 12/31/2020 3/31/2021 6/30/2021 Outstandings Unfunded Commitments FBC warehouse loan commitments ($bn) Warehouse lending COMMUNITY BANKING Lenders ranked by commitments ($mm) Source: Inside Mortgage Finance as of June 2021 ● National relationship-based lending platform ● Attractive asset class with good spreads and low credit risk ● Flagstar is well positioned to hold market share, leveraging relationships in complementary lines of business, including home builder finance and mortgage originations ● Collateral Breakdown: Agency & Conventional 65.2% Government 16.1% / Jumbo 17.0% / Non-QM 1.7% YOY Rank Institution Growth Total Share 1 JPMorgan Chase 8% $20,500 15% 2 Flagstar Bancorp(1) 72% 10,724 8% 3 TIAA FSB 70% 10,700 8% 4 First Horizon 0% 9,403 7% 5 Truist Bank 65% 9,400 7% 6 Texas Capital 19% 9,009 7% 7 Merchants Bank 5% 6,831 5% 8 Wells Fargo 12% 6,700 5% 9 Customers Bank 46% 5,700 4% 10 U.S. Bancorp 58% 5,600 4% Top 10 27% $94,567 70% 1Q21 Net charge-offs 6 bps annual loss rate since 2006
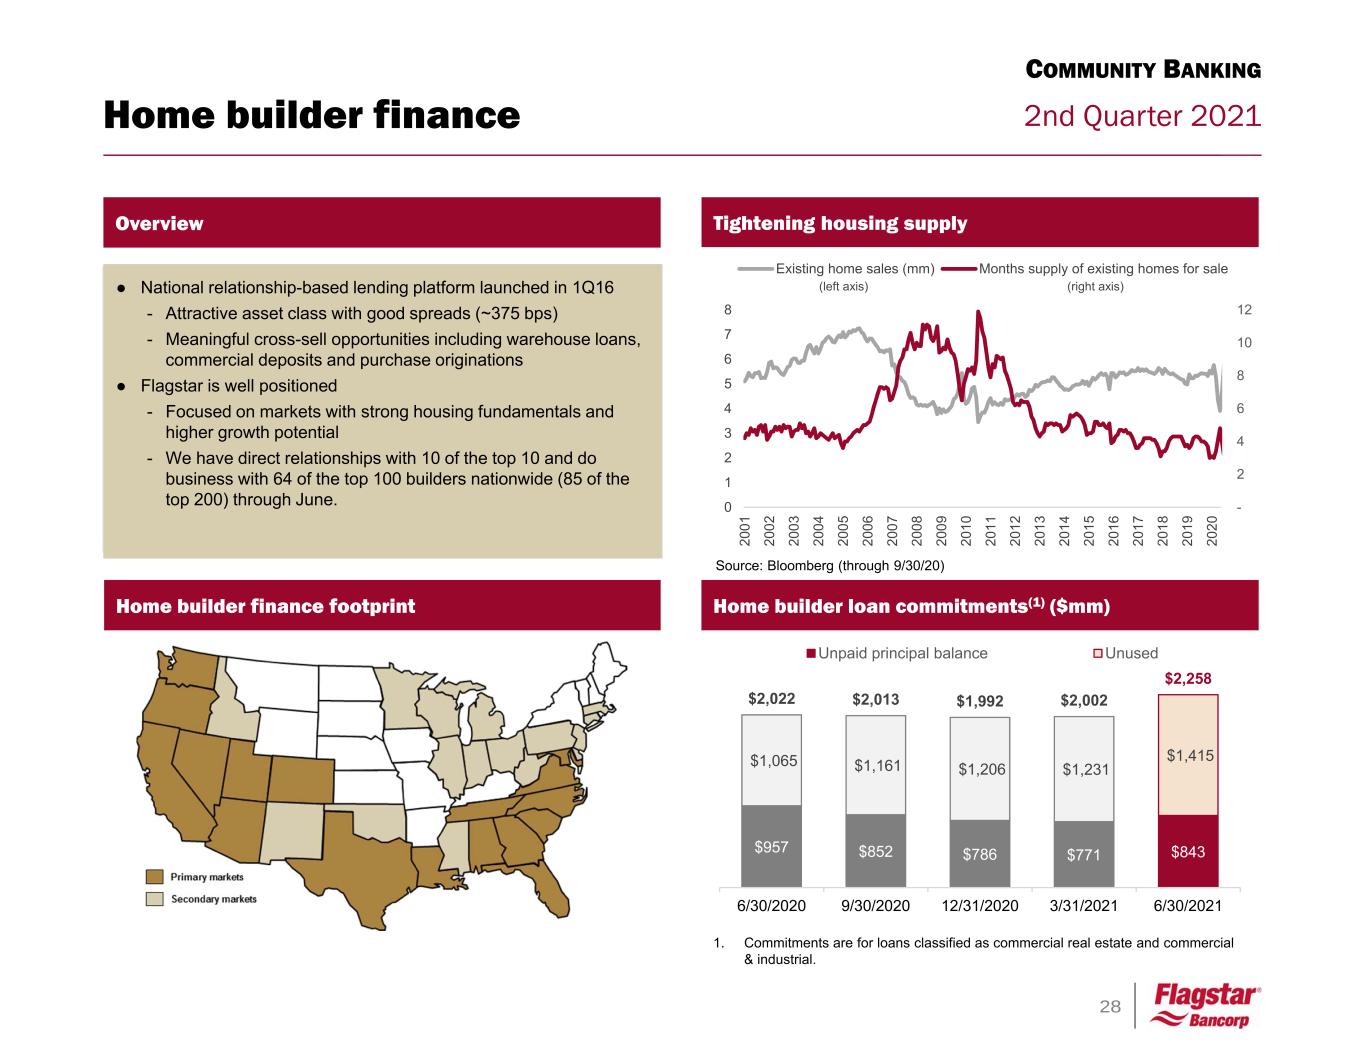
28 2nd Quarter 2021Home builder finance COMMUNITY BANKING Home builder loan commitments(1) ($mm) ● National relationship-based lending platform launched in 1Q16 - Attractive asset class with good spreads (~375 bps) - Meaningful cross-sell opportunities including warehouse loans, commercial deposits and purchase originations ● Flagstar is well positioned - Focused on markets with strong housing fundamentals and higher growth potential - We have direct relationships with 10 of the top 10 and do business with 64 of the top 100 builders nationwide (85 of the top 200) through June. Home builder finance footprint Overview $957 $852 $786 $771 $843 $1,065 $1,161 $1,206 $1,231 $1,415 $2,022 $2,013 $1,992 $2,002 $2,258 6/30/2020 9/30/2020 12/31/2020 3/31/2021 6/30/2021 Unpaid principal balance Unused Tightening housing supply - 2 4 6 8 10 12 0 1 2 3 4 5 6 7 8 20 01 20 02 20 03 20 04 20 05 20 06 20 07 20 08 20 09 20 10 20 11 20 12 20 13 20 14 20 15 20 16 20 17 20 18 20 19 20 20 Existing home sales (mm) Months supply of existing homes for sale Source: Bloomberg (through 9/30/20) 1. Commitments are for loans classified as commercial real estate and commercial & industrial. (left axis) (right axis)
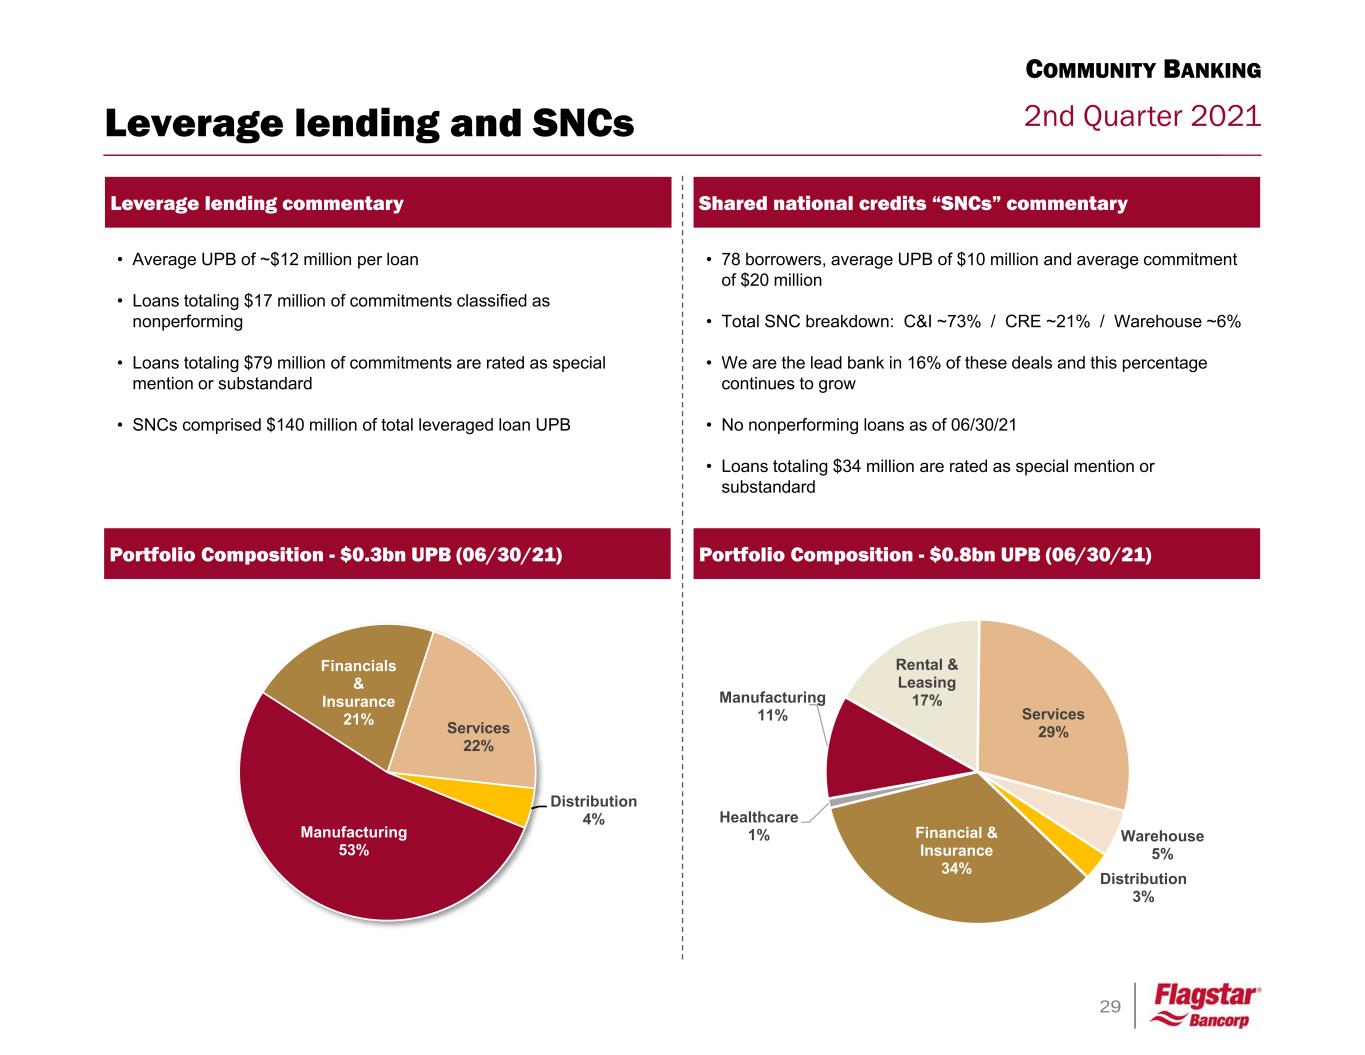
29 2nd Quarter 2021 • 78 borrowers, average UPB of $10 million and average commitment of $20 million • Total SNC breakdown: C&I ~73% / CRE ~21% / Warehouse ~6% • We are the lead bank in 16% of these deals and this percentage continues to grow • No nonperforming loans as of 06/30/21 • Loans totaling $34 million are rated as special mention or substandard • Average UPB of ~$12 million per loan • Loans totaling $17 million of commitments classified as nonperforming • Loans totaling $79 million of commitments are rated as special mention or substandard • SNCs comprised $140 million of total leveraged loan UPB Leverage lending commentary Leverage lending and SNCs Shared national credits “SNCs” commentary Portfolio Composition - $0.3bn UPB (06/30/21) COMMUNITY BANKING Portfolio Composition - $0.8bn UPB (06/30/21) Manufacturing 53% Financials & Insurance 21% Services 22% Distribution 4% Distribution 3% Financial & Insurance 34% Healthcare 1% Manufacturing 11% Rental & Leasing 17% Services 29% Warehouse 5%
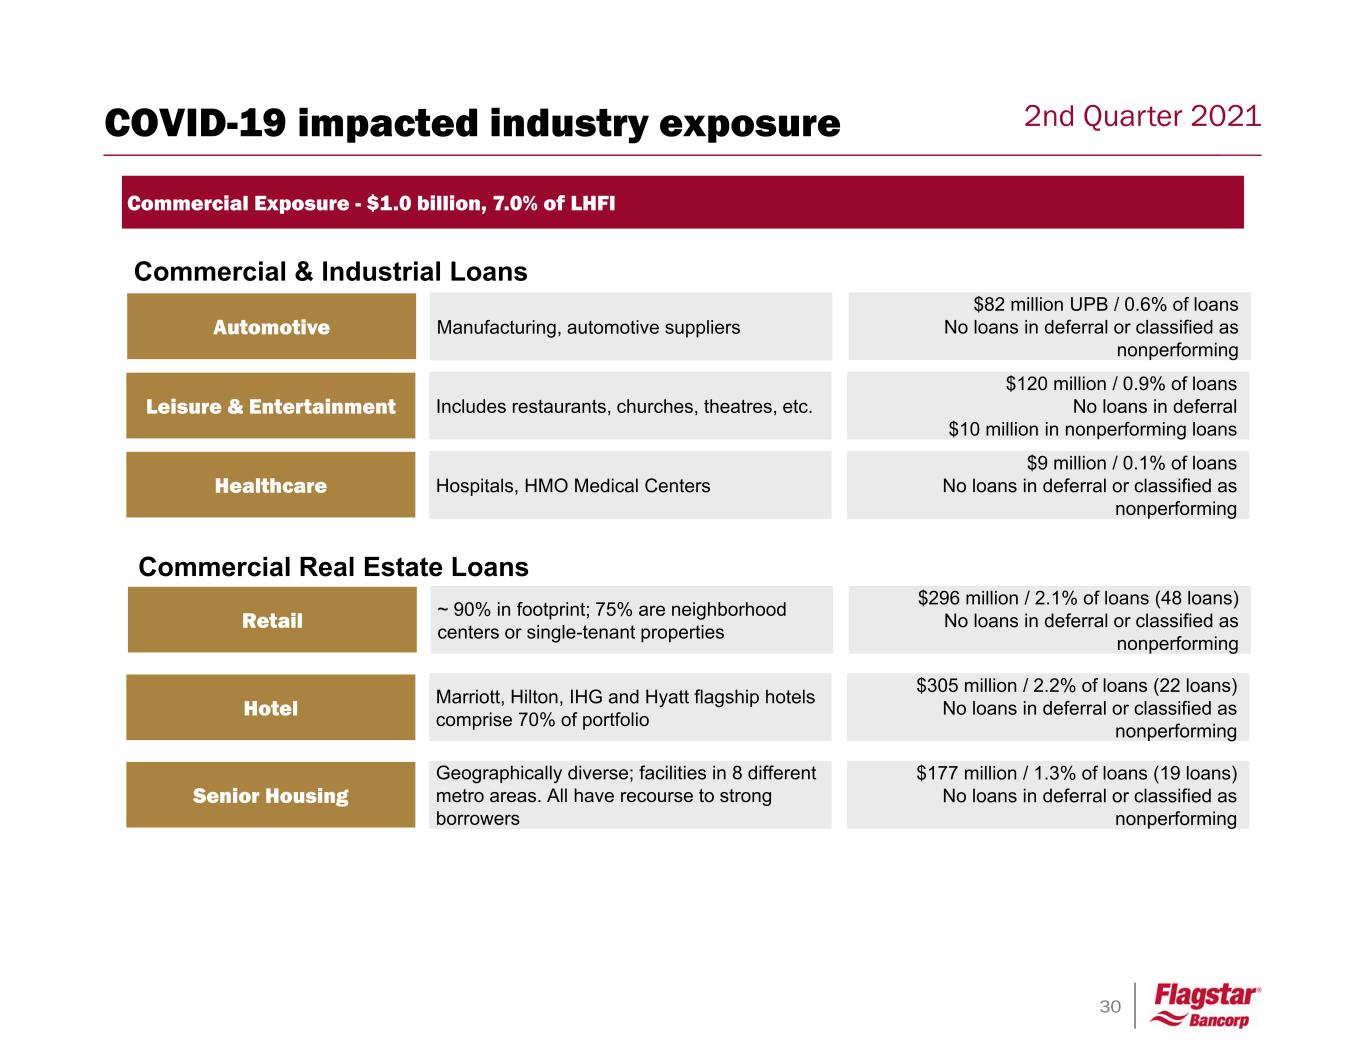
30 2nd Quarter 2021 Commercial Exposure - $1.0 billion, 7.0% of LHFI $120 million / 0.9% of loans No loans in deferral $10 million in nonperforming loans Leisure & Entertainment Includes restaurants, churches, theatres, etc. $305 million / 2.2% of loans (22 loans) No loans in deferral or classified as nonperforming Hotel Marriott, Hilton, IHG and Hyatt flagship hotels comprise 70% of portfolio $177 million / 1.3% of loans (19 loans) No loans in deferral or classified as nonperforming Senior Housing Geographically diverse; facilities in 8 different metro areas. All have recourse to strong borrowers $82 million UPB / 0.6% of loans No loans in deferral or classified as nonperforming Automotive Manufacturing, automotive suppliers $9 million / 0.1% of loans No loans in deferral or classified as nonperforming Healthcare Hospitals, HMO Medical Centers $296 million / 2.1% of loans (48 loans) No loans in deferral or classified as nonperforming Retail ~ 90% in footprint; 75% are neighborhood centers or single-tenant properties Commercial & Industrial Loans Commercial Real Estate Loans COVID-19 impacted industry exposure
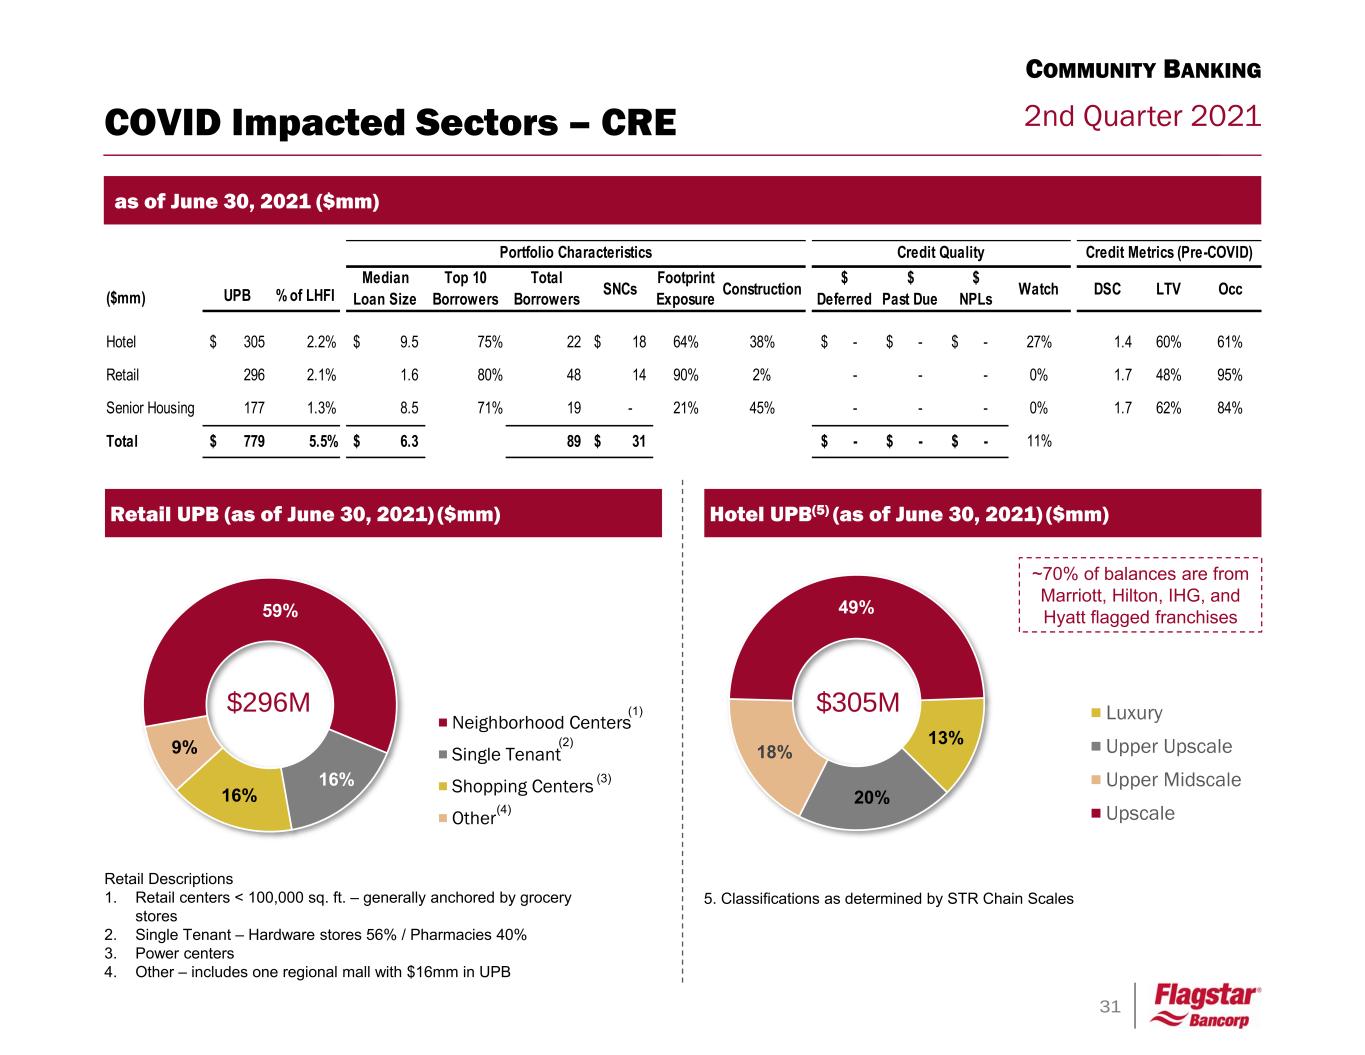
31 2nd Quarter 2021COVID Impacted Sectors – CRE 59% 16% 16% 9% Neighborhood Centers Single Tenant Shopping Centers Other $296M as of June 30, 2021 ($mm) Hotel UPB(5) (as of June 30, 2021) ($mm) 13% 20% 18% 49% Luxury Upper Upscale Upper Midscale Upscale 5. Classifications as determined by STR Chain Scales Retail Descriptions 1. Retail centers < 100,000 sq. ft. – generally anchored by grocery stores 2. Single Tenant – Hardware stores 56% / Pharmacies 40% 3. Power centers 4. Other – includes one regional mall with $16mm in UPB ~70% of balances are from Marriott, Hilton, IHG, and Hyatt flagged franchises Retail UPB (as of June 30, 2021) ($mm) $305M(1) (2) (3) (4) COMMUNITY BANKING ($mm) UPB % of LHFI Median Loan Size Top 10 Borrowers Total Borrowers SNCs Footprint Exposure Construction $ Deferred $ Past Due $ NPLs Watch DSC LTV Occ Hotel 305$ 2.2% 9.5$ 75% 22 18$ 64% 38% -$ -$ -$ 27% 1.4 60% 61% Retail 296 2.1% 1.6 80% 48 14 90% 2% - - - 0% 1.7 48% 95% Senior Housing 177 1.3% 8.5 71% 19 - 21% 45% - - - 0% 1.7 62% 84% Total 779$ 5.5% 6.3$ 89 31$ -$ -$ -$ 11% Portfolio Characteristics Credit Quality Credit Metrics (Pre-COVID)
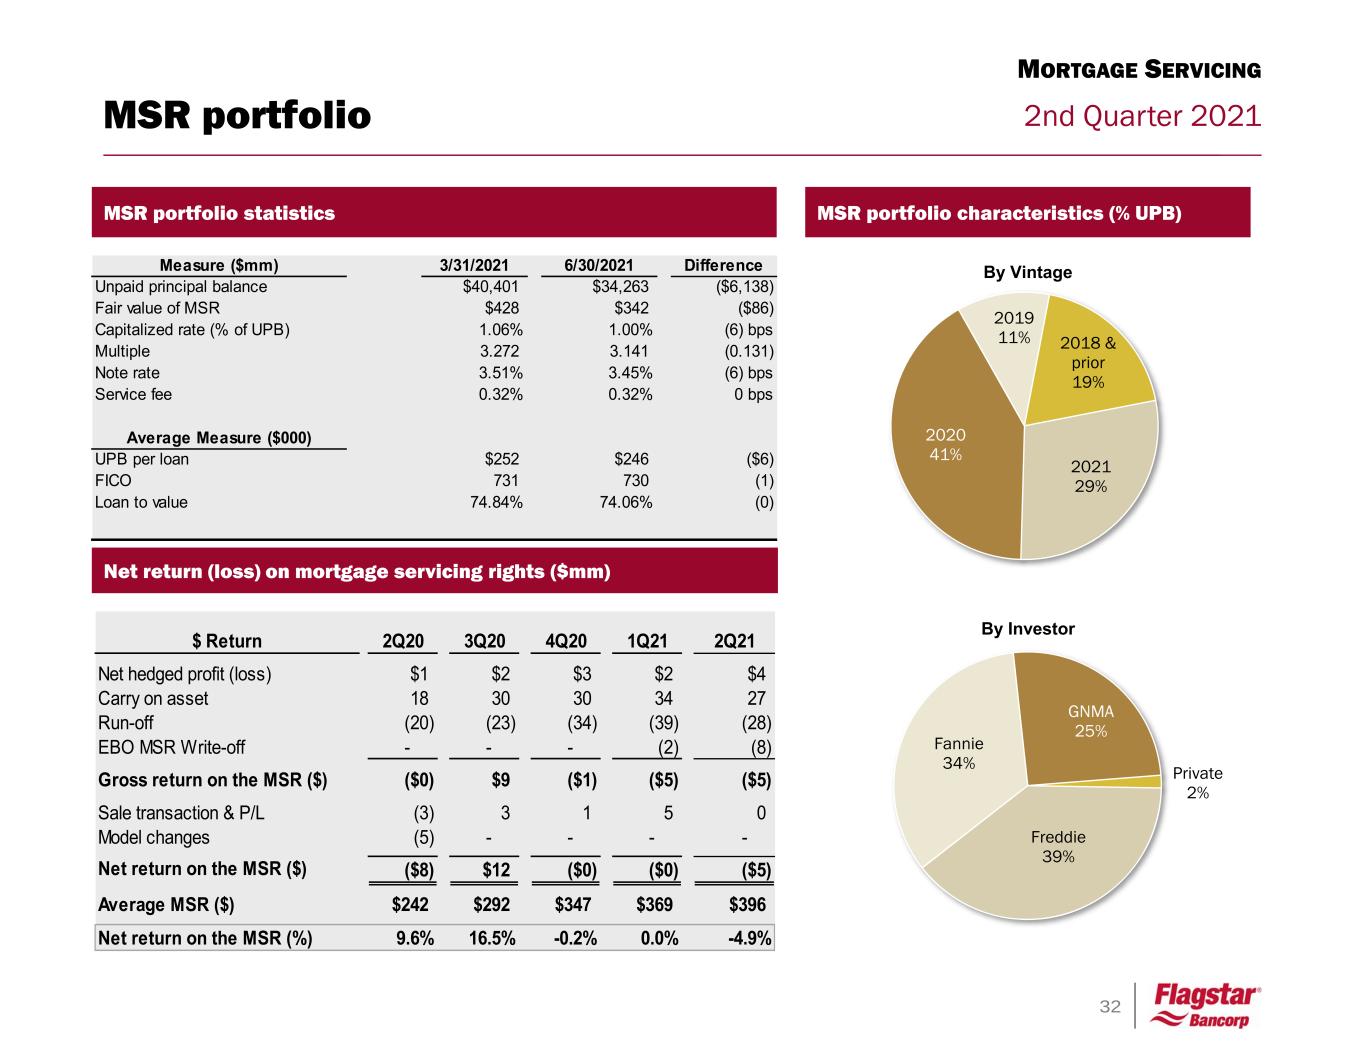
32 2nd Quarter 2021 Freddie 39% Fannie 34% GNMA 25% Private 2% By Investor MSR portfolio MSR portfolio characteristics (% UPB)MSR portfolio statistics Measure ($mm) 3/31/2021 6/30/2021 Difference Unpaid principal balance $40,401 $34,263 ($6,138) Fair value of MSR $428 $342 ($86) Capitalized rate (% of UPB) 1.06% 1.00% (6) bps Multiple 3.272 3.141 (0.131) Note rate 3.51% 3.45% (6) bps Service fee 0.32% 0.32% 0 bps Average Measure ($000) UPB per loan $252 $246 ($6) FICO 731 730 (1) Loan to value 74.84% 74.06% (0) Net return (loss) on mortgage servicing rights ($mm) $ Return 2Q20 3Q20 4Q20 1Q21 2Q21 Net hedged profit (loss) $1 $2 $3 $2 $4 Carry on asset 18 30 30 34 27 Run-off (20) (23) (34) (39) (28) EBO MSR Write-off - - - (2) (8) Gross return on the MSR ($) ($0) $9 ($1) ($5) ($5) Sale transaction & P/L (3) 3 1 5 0 Model changes (5) - - - - Net return on the MSR ($) ($8) $12 ($0) ($0) ($5) Average MSR ($) $242 $292 $347 $369 $396 Net return on the MSR (%) 9.6% 16.5% -0.2% 0.0% -4.9% MORTGAGE SERVICING 2021 29% 2020 41% 2019 11% 2018 & prior 19% By Vintage
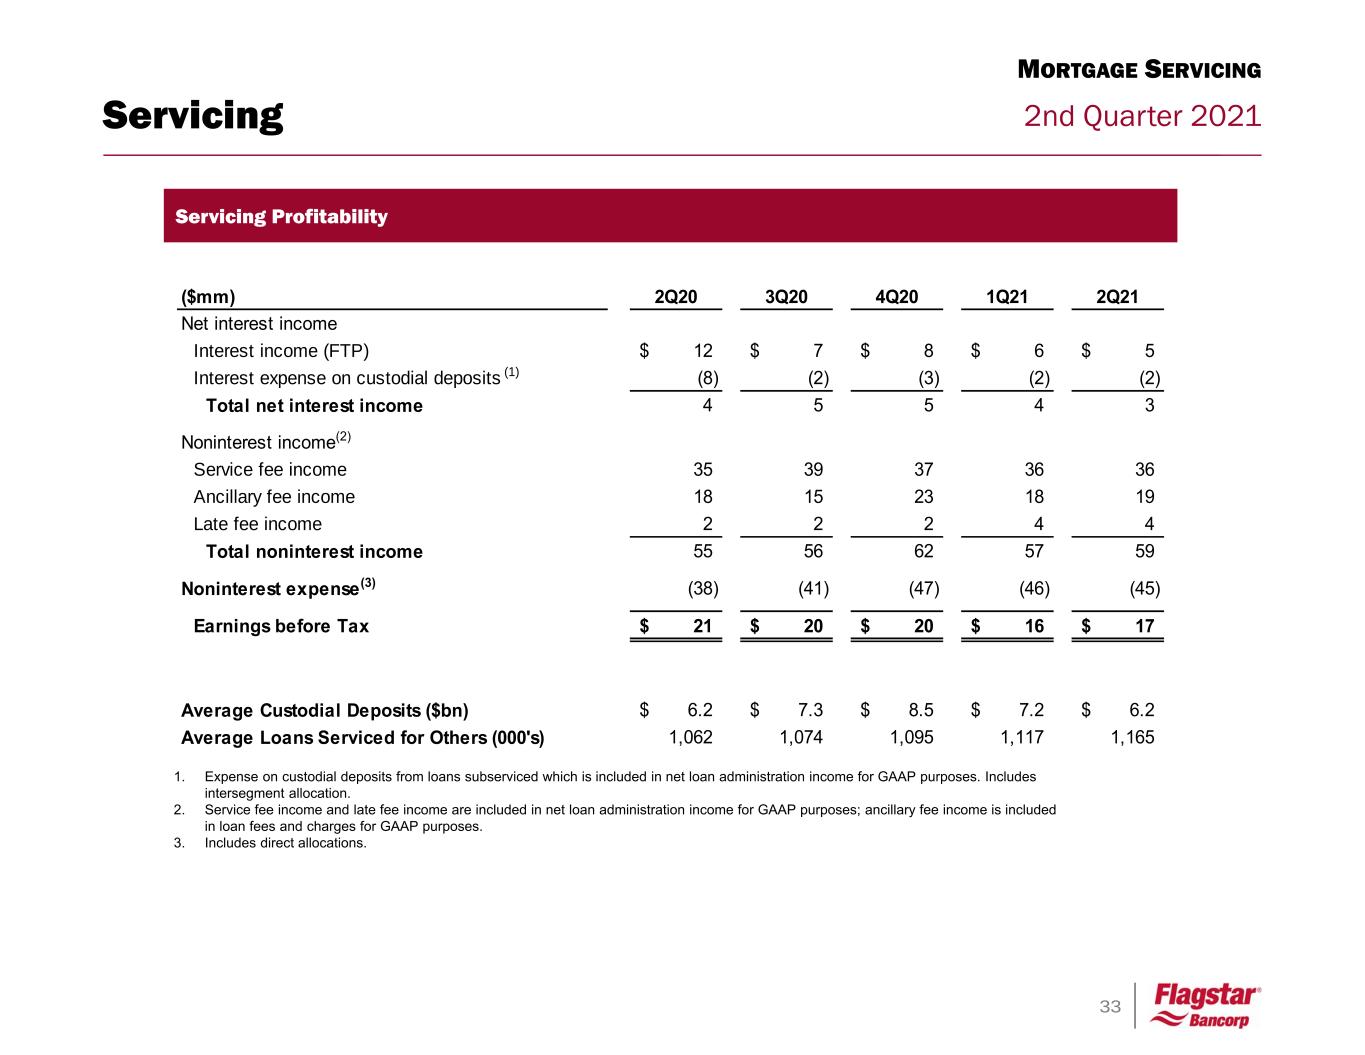
33 2nd Quarter 2021 ($mm) 2Q20 3Q20 4Q20 1Q21 2Q21 Net interest income Interest income (FTP) 12$ 7$ 8$ 6$ 5$ Interest expense on custodial deposits (1) (8) (2) (3) (2) (2) Total net interest income 4 5 5 4 3 Noninterest income(2) Service fee income 35 39 37 36 36 Ancillary fee income 18 15 23 18 19 Late fee income 2 2 2 4 4 Total noninterest income 55 56 62 57 59 Noninterest expense(3) (38) (41) (47) (46) (45) Earnings before Tax 21$ 20$ 20$ 16$ 17$ Average Custodial Deposits ($bn) 6.2$ 7.3$ 8.5$ 7.2$ 6.2$ Average Loans Serviced for Others (000's) 1,062 1,074 1,095 1,117 1,165 Servicing Servicing Profitability MORTGAGE SERVICING 1. Expense on custodial deposits from loans subserviced which is included in net loan administration income for GAAP purposes. Includes intersegment allocation. 2. Service fee income and late fee income are included in net loan administration income for GAAP purposes; ancillary fee income is included in loan fees and charges for GAAP purposes. 3. Includes direct allocations.
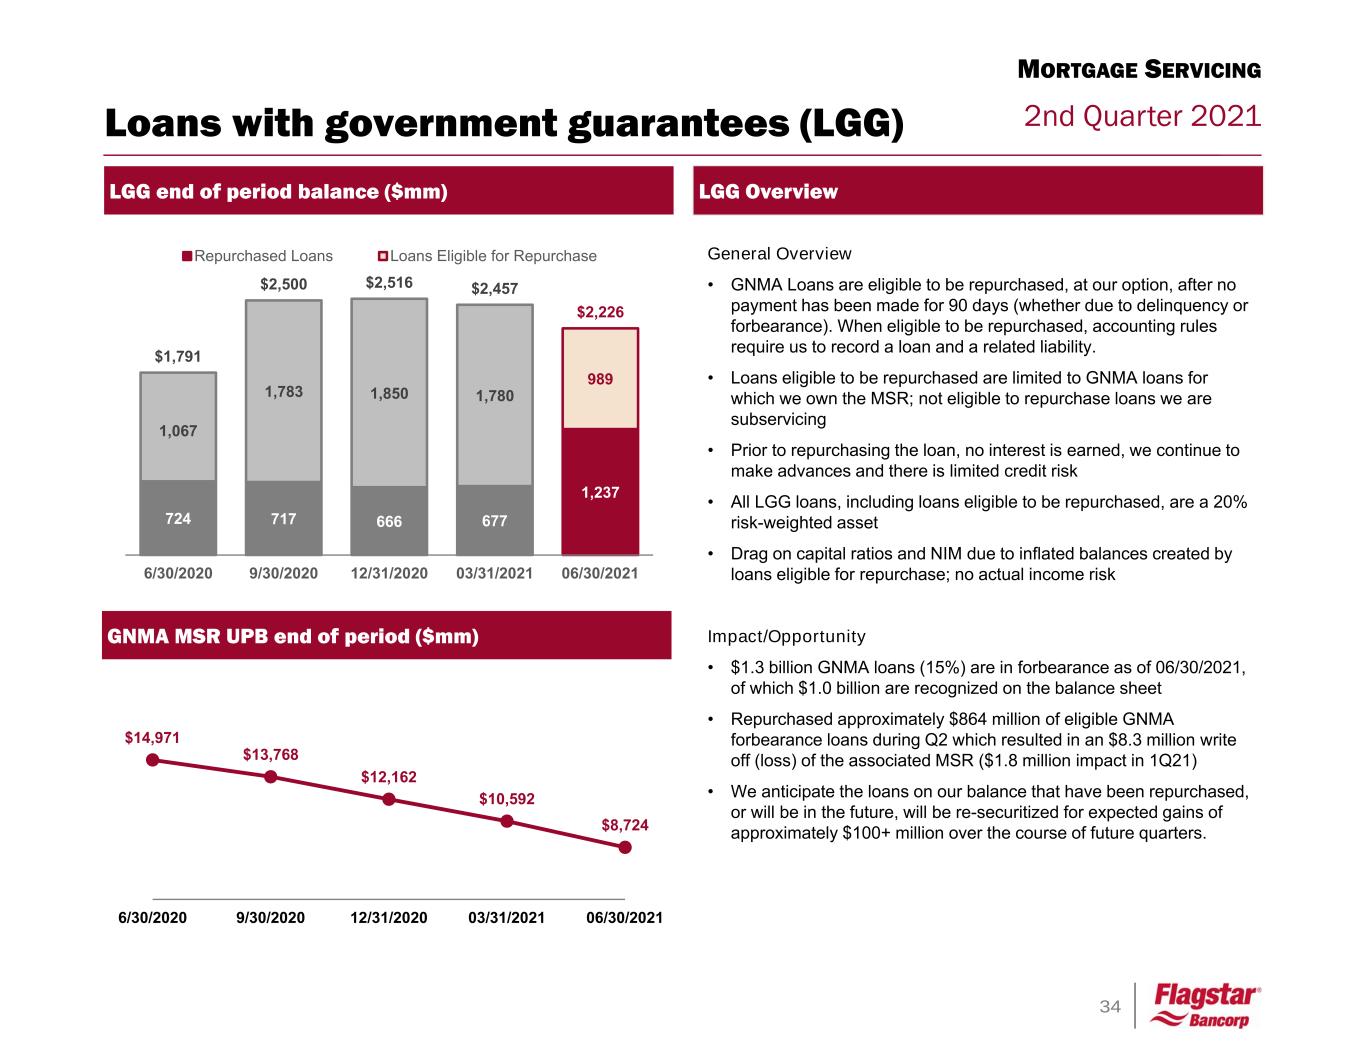
34 2nd Quarter 2021 LGG end of period balance ($mm) General Overview • GNMA Loans are eligible to be repurchased, at our option, after no payment has been made for 90 days (whether due to delinquency or forbearance). When eligible to be repurchased, accounting rules require us to record a loan and a related liability. • Loans eligible to be repurchased are limited to GNMA loans for which we own the MSR; not eligible to repurchase loans we are subservicing • Prior to repurchasing the loan, no interest is earned, we continue to make advances and there is limited credit risk • All LGG loans, including loans eligible to be repurchased, are a 20% risk-weighted asset • Drag on capital ratios and NIM due to inflated balances created by loans eligible for repurchase; no actual income risk Impact/Opportunity • $1.3 billion GNMA loans (15%) are in forbearance as of 06/30/2021, of which $1.0 billion are recognized on the balance sheet • Repurchased approximately $864 million of eligible GNMA forbearance loans during Q2 which resulted in an $8.3 million write off (loss) of the associated MSR ($1.8 million impact in 1Q21) • We anticipate the loans on our balance that have been repurchased, or will be in the future, will be re-securitized for expected gains of approximately $100+ million over the course of future quarters. LGG Overview Loans with government guarantees (LGG) 724 717 666 677 1,237 1,067 1,783 1,850 1,780 989 $1,791 $2,500 $2,516 $2,457 $2,226 6/30/2020 9/30/2020 12/31/2020 03/31/2021 06/30/2021 Repurchased Loans Loans Eligible for Repurchase $14,971 $13,768 $12,162 $10,592 $8,724 6/30/2020 9/30/2020 12/31/2020 03/31/2021 06/30/2021 GNMA MSR UPB end of period ($mm) MORTGAGE SERVICING
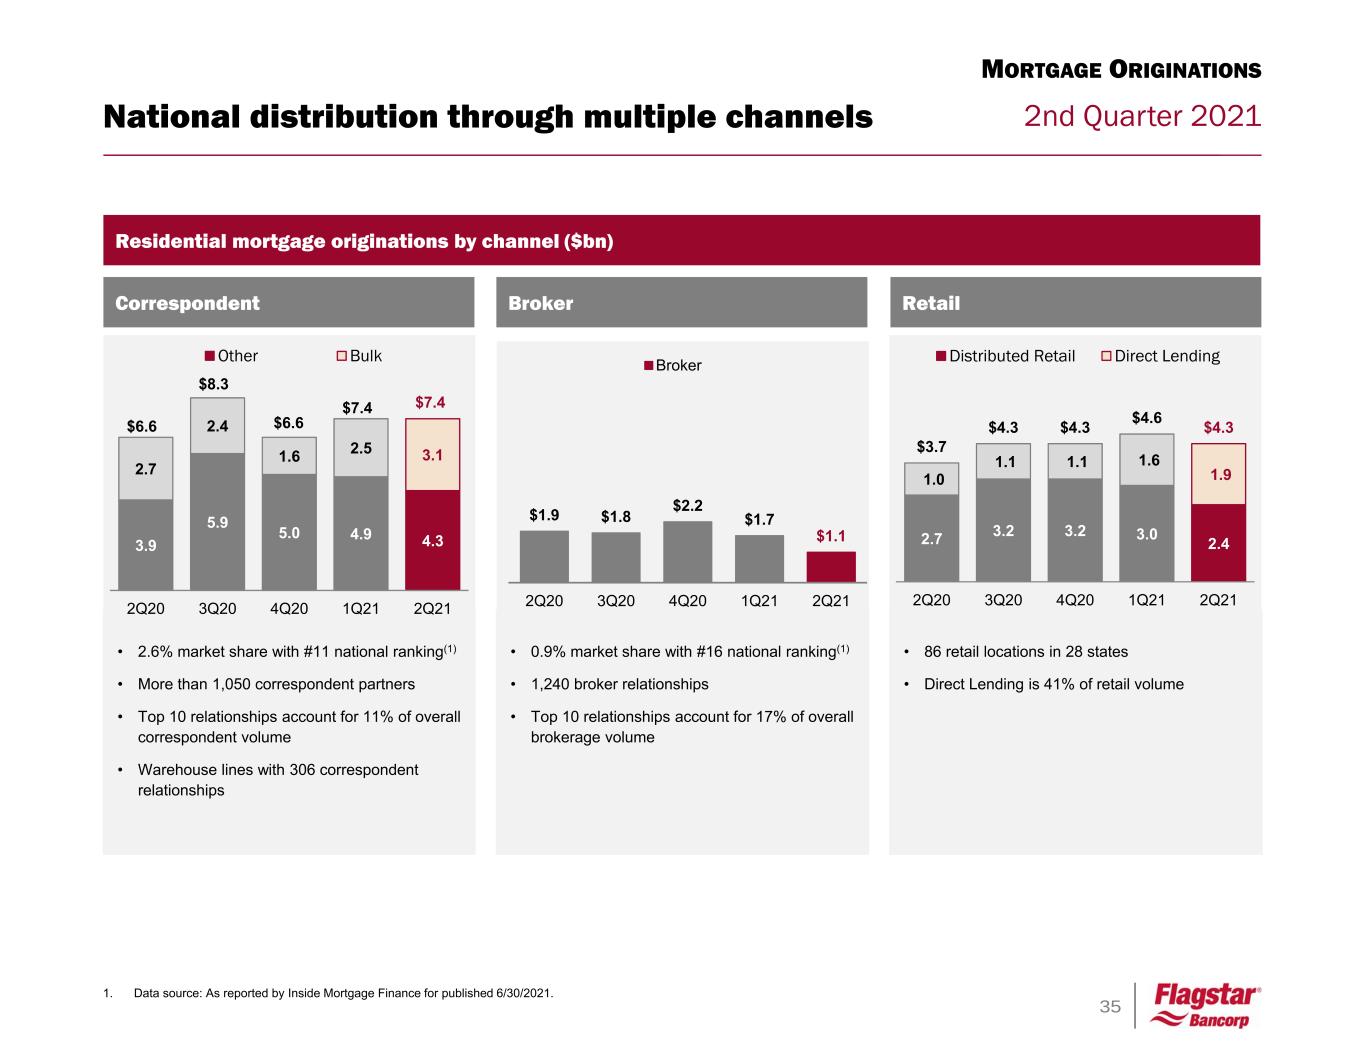
35 2nd Quarter 2021 • 2.6% market share with #11 national ranking(1) • More than 1,050 correspondent partners • Top 10 relationships account for 11% of overall correspondent volume • Warehouse lines with 306 correspondent relationships MORTGAGE ORIGINATIONS Residential mortgage originations by channel ($bn) BrokerCorrespondent Retail 3.9 5.9 5.0 4.9 4.3 2.7 2.4 1.6 2.5 3.1 2Q20 3Q20 4Q20 1Q21 2Q21 Other Bulk $8.3 $6.6 $7.4 $1.9 $1.8 $2.2 $1.7 $1.1 2Q20 3Q20 4Q20 1Q21 2Q21 Broker • 0.9% market share with #16 national ranking(1) • 1,240 broker relationships • Top 10 relationships account for 17% of overall brokerage volume 1. Data source: As reported by Inside Mortgage Finance for published 6/30/2021. • 86 retail locations in 28 states • Direct Lending is 41% of retail volume $6.6 National distribution through multiple channels $7.4 2.7 3.2 3.2 3.0 2.4 1.0 1.1 1.1 1.6 1.9 $3.7 $4.3 $4.3 $4.6 $4.3 2Q20 3Q20 4Q20 1Q21 2Q21 Distributed Retail Direct Lending
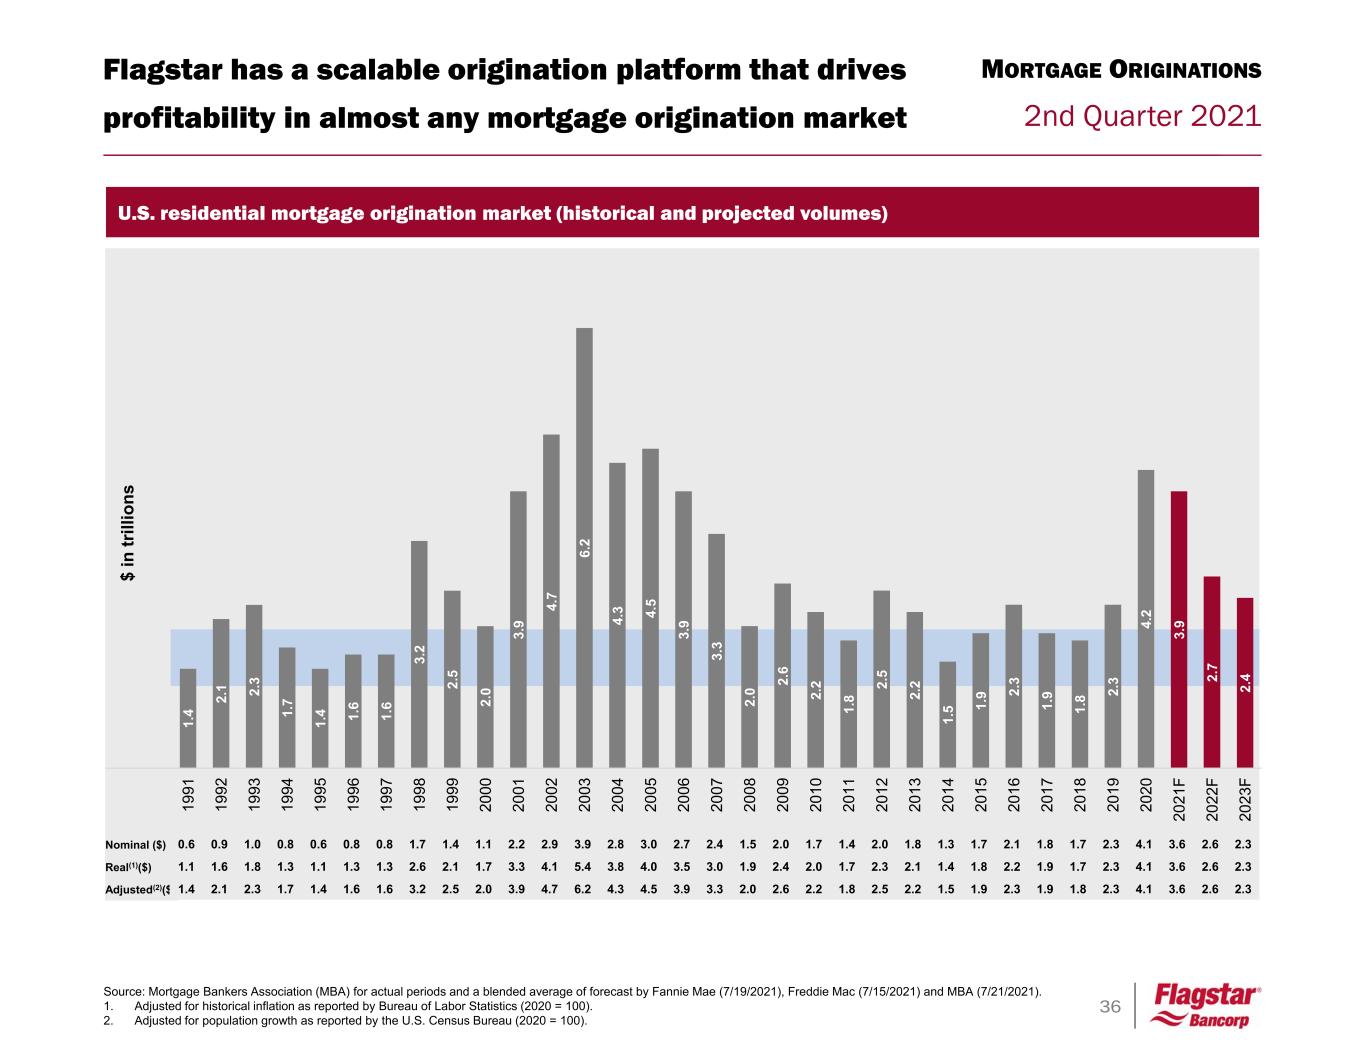
36 2nd Quarter 2021 1. 4 2. 1 2. 3 1. 7 1. 4 1. 6 1. 6 3. 2 2. 5 2. 0 3. 9 4. 7 6. 2 4. 3 4. 5 3. 9 3. 3 2. 0 2. 6 2. 2 1. 8 2. 5 2. 2 1. 5 1. 9 2. 3 1. 9 1. 8 2. 3 4. 2 3. 9 2. 7 2. 4 19 91 19 92 19 93 19 94 19 95 19 96 19 97 19 98 19 99 20 00 20 01 20 02 20 03 20 04 20 05 20 06 20 07 20 08 20 09 20 10 20 11 20 12 20 13 20 14 20 15 20 16 20 17 20 18 20 19 20 20 20 21 F 20 22 F 20 23 F $ in tr ill io ns Flagstar has a scalable origination platform that drives profitability in almost any mortgage origination market MORTGAGE ORIGINATIONS Source: Mortgage Bankers Association (MBA) for actual periods and a blended average of forecast by Fannie Mae (7/19/2021), Freddie Mac (7/15/2021) and MBA (7/21/2021). 1. Adjusted for historical inflation as reported by Bureau of Labor Statistics (2020 = 100). 2. Adjusted for population growth as reported by the U.S. Census Bureau (2020 = 100). U.S. residential mortgage origination market (historical and projected volumes) Nominal ($) Real(1)($) Adjusted(2)($) 0.6 0.9 1.0 0.8 0.6 0.8 0.8 1.7 1.4 1.1 2.2 2.9 3.9 2.8 3.0 2.7 2.4 1.5 2.0 1.7 1.4 2.0 1.8 1.3 1.7 2.1 1.8 1.7 2.3 4.1 3.6 2.6 2.3 1.1 1.6 1.8 1.3 1.1 1.3 1.3 2.6 2.1 1.7 3.3 4.1 5.4 3.8 4.0 3.5 3.0 1.9 2.4 2.0 1.7 2.3 2.1 1.4 1.8 2.2 1.9 1.7 2.3 4.1 3.6 2.6 2.3 1.4 2.1 2.3 1.7 1.4 1.6 1.6 3.2 2.5 2.0 3.9 4.7 6.2 4.3 4.5 3.9 3.3 2.0 2.6 2.2 1.8 2.5 2.2 1.5 1.9 2.3 1.9 1.8 2.3 4.1 3.6 2.6 2.3
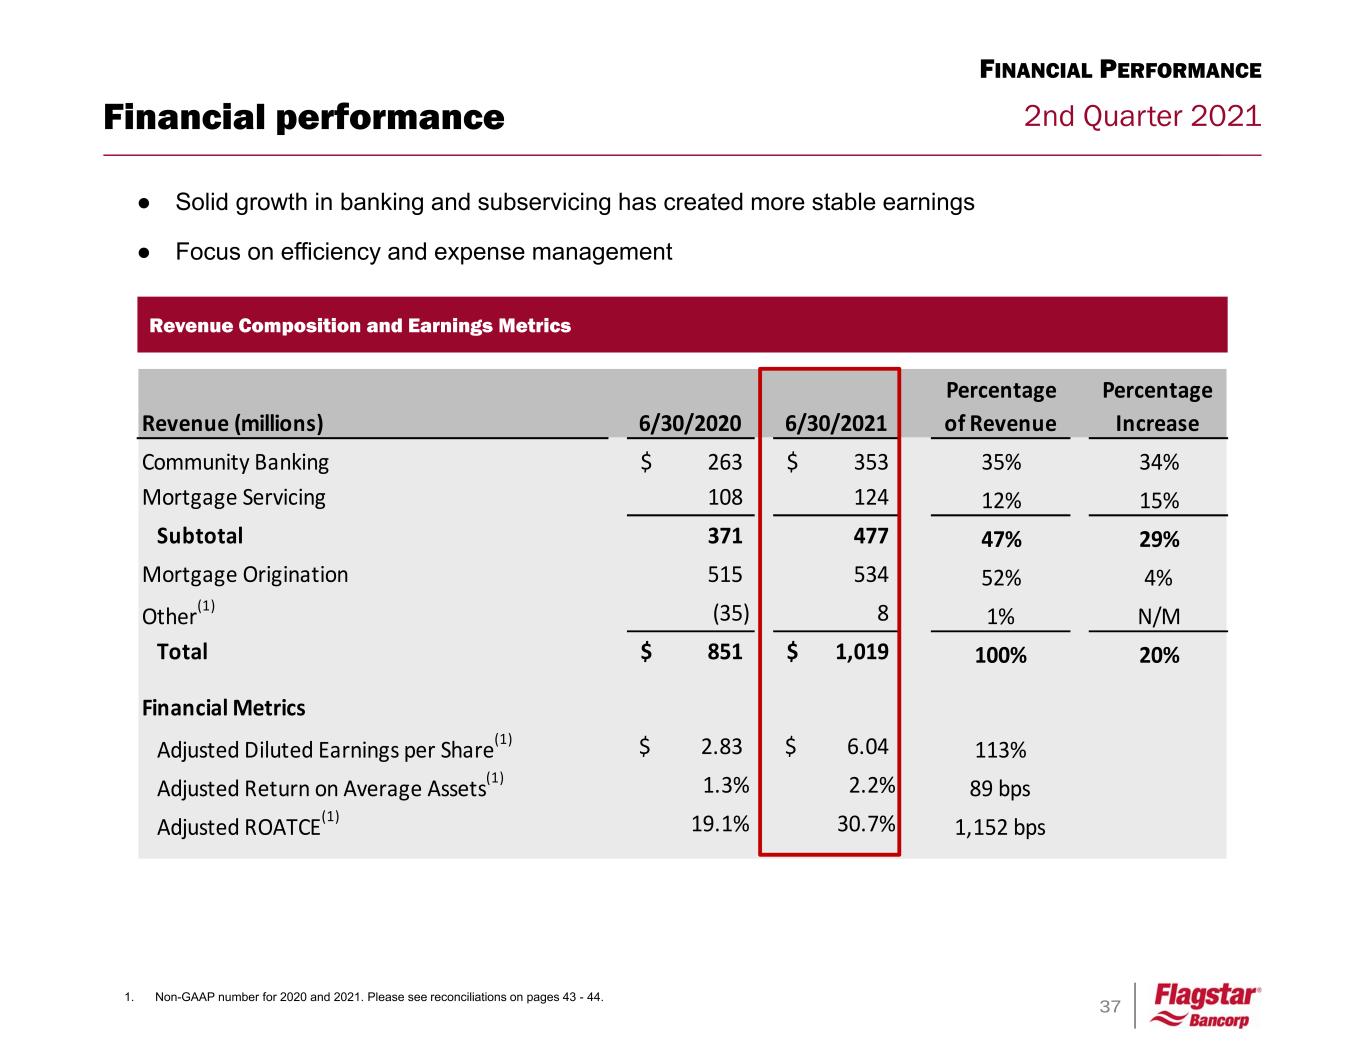
37 2nd Quarter 2021 ● Solid growth in banking and subservicing has created more stable earnings ● Focus on efficiency and expense management Financial performance Revenue Composition and Earnings Metrics Revenue (millions) 6/30/2020 6/30/2021 Percentage of Revenue Percentage Increase Community Banking 263$ 353$ 35% 34% Mortgage Servicing 108 124 12% 15% Subtotal 371 477 47% 29% Mortgage Origination 515 534 52% 4% Other(1) (35) 8 1% N/M Total 851$ 1,019$ 100% 20% Financial Metrics Adjusted Diluted Earnings per Share(1) 2.83$ 6.04$ 113% Adjusted Return on Average Assets(1) 1.3% 2.2% 89 bps Adjusted ROATCE(1) 19.1% 30.7% 1,152 bps FINANCIAL PERFORMANCE 1. Non-GAAP number for 2020 and 2021. Please see reconciliations on pages 43 - 44.
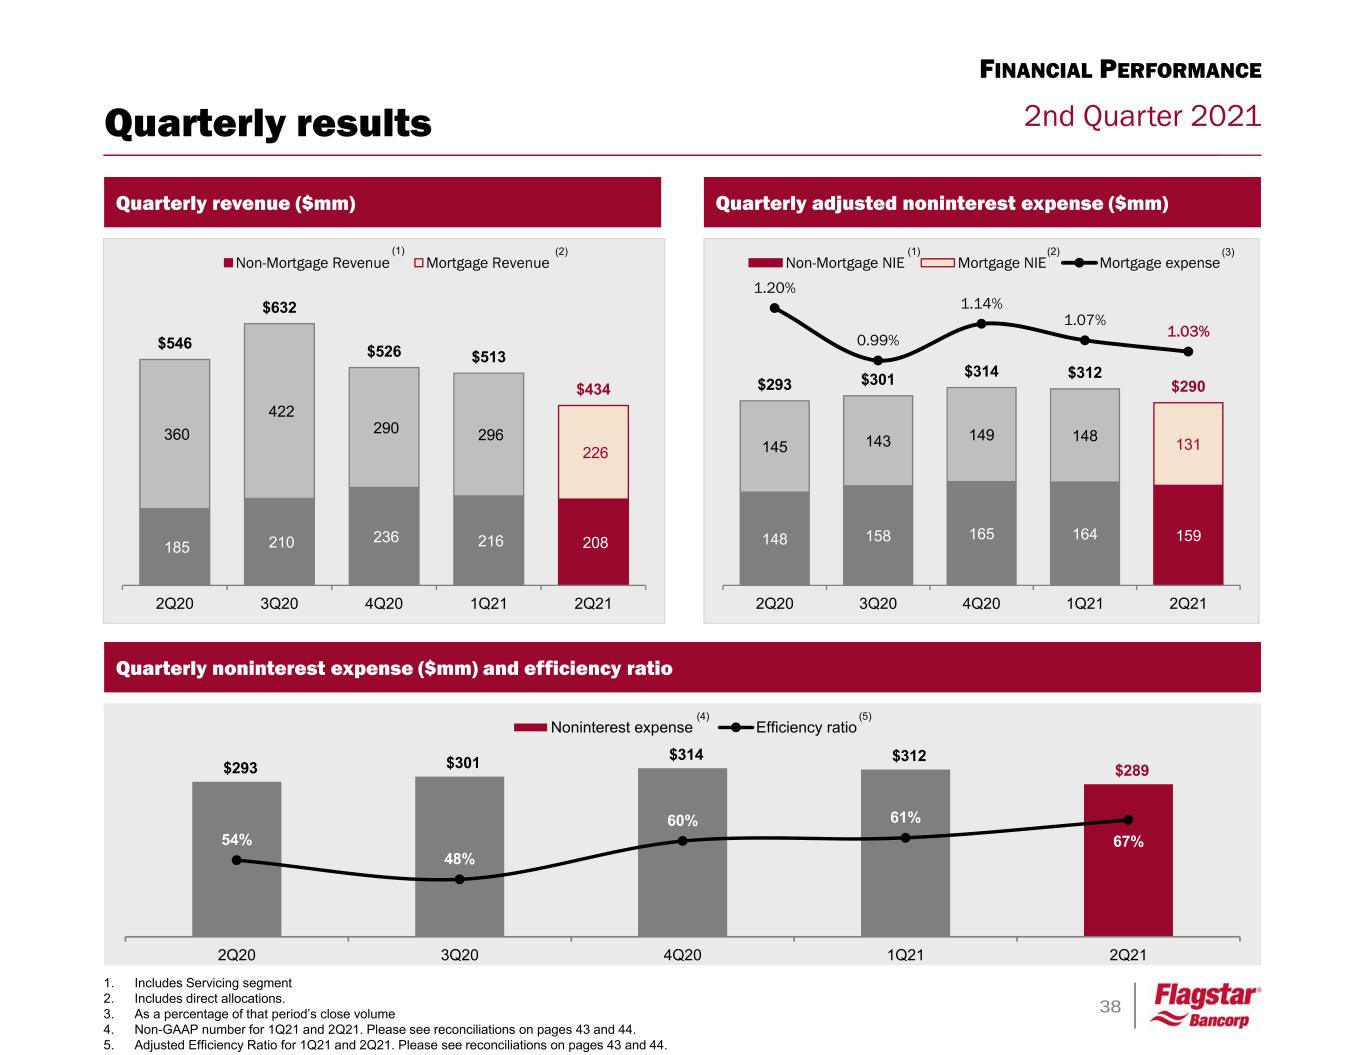
38 2nd Quarter 2021 Quarterly noninterest expense ($mm) and efficiency ratio $293 $301 $314 $312 $289 54% 48% 60% 61% 67% 2Q20 3Q20 4Q20 1Q21 2Q21 Noninterest expense Efficiency ratio (4) (5) Quarterly results Quarterly revenue ($mm) Quarterly adjusted noninterest expense ($mm) (5) (6) (3) 185 210 236 216 208 360 422 290 296 226 $546 $632 $526 $513 $434 2Q20 3Q20 4Q20 1Q21 2Q21 Non-Mortgage Revenue Mortgage Revenue (1) (2) (3)(1) (2) 1. Includes Servicing segment 2. Includes direct allocations. 3. As a percentage of that period’s close volume 4. Non-GAAP number for 1Q21 and 2Q21. Please see reconciliations on pages 43 and 44. 5. Adjusted Efficiency Ratio for 1Q21 and 2Q21. Please see reconciliations on pages 43 and 44. FINANCIAL PERFORMANCE 148 158 165 164 159 145 143 149 148 131 $293 $301 $314 $312 $290 1.20% 0.99% 1.14% 1.07% 1.03% 2Q20 3Q20 4Q20 1Q21 2Q21 Non-Mortgage NIE Mortgage NIE Mortgage expense (1) (2) ( )
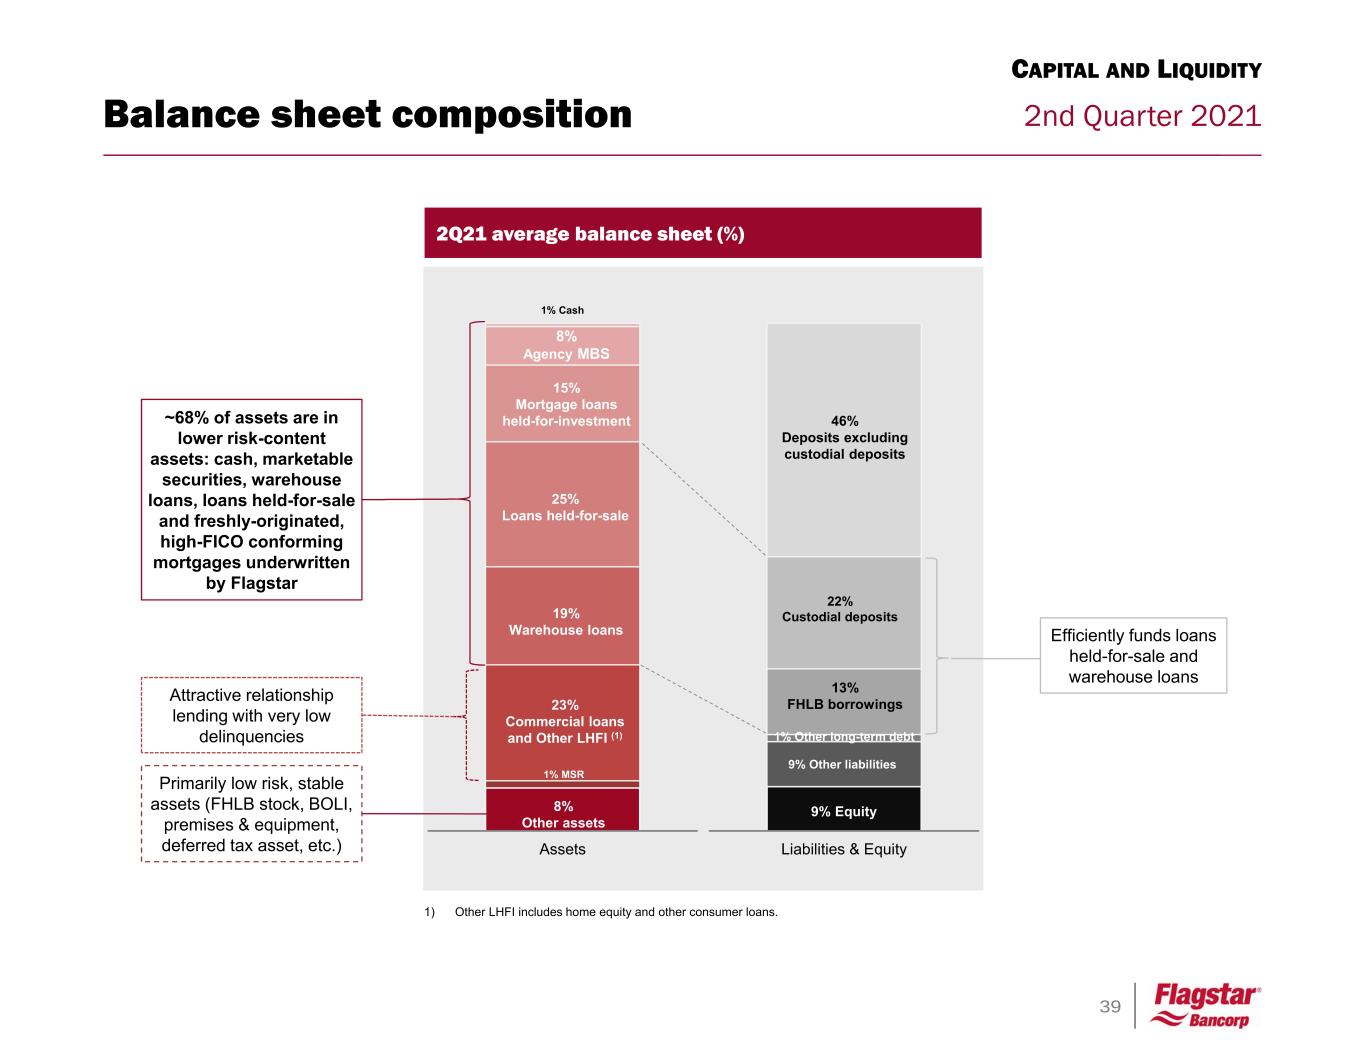
39 2nd Quarter 2021Balance sheet composition CAPITAL AND LIQUIDITY 9% Other liabilities 1% Other long-term debt Liabilities & Equity 2Q21 average balance sheet (%) Assets Attractive relationship lending with very low delinquencies Primarily low risk, stable assets (FHLB stock, BOLI, premises & equipment, deferred tax asset, etc.) ~68% of assets are in lower risk-content assets: cash, marketable securities, warehouse loans, loans held-for-sale and freshly-originated, high-FICO conforming mortgages underwritten by Flagstar 8% Other assets 19% Warehouse loans 25% Loans held-for-sale 23% Commercial loans and Other LHFI (1) Efficiently funds loans held-for-sale and warehouse loans 46% Deposits excluding custodial deposits 13% FHLB borrowings 9% Equity 22% Custodial deposits 15% Mortgage loans held-for-investment 8% Agency MBS 1% Cash 1% MSR 1) Other LHFI includes home equity and other consumer loans.
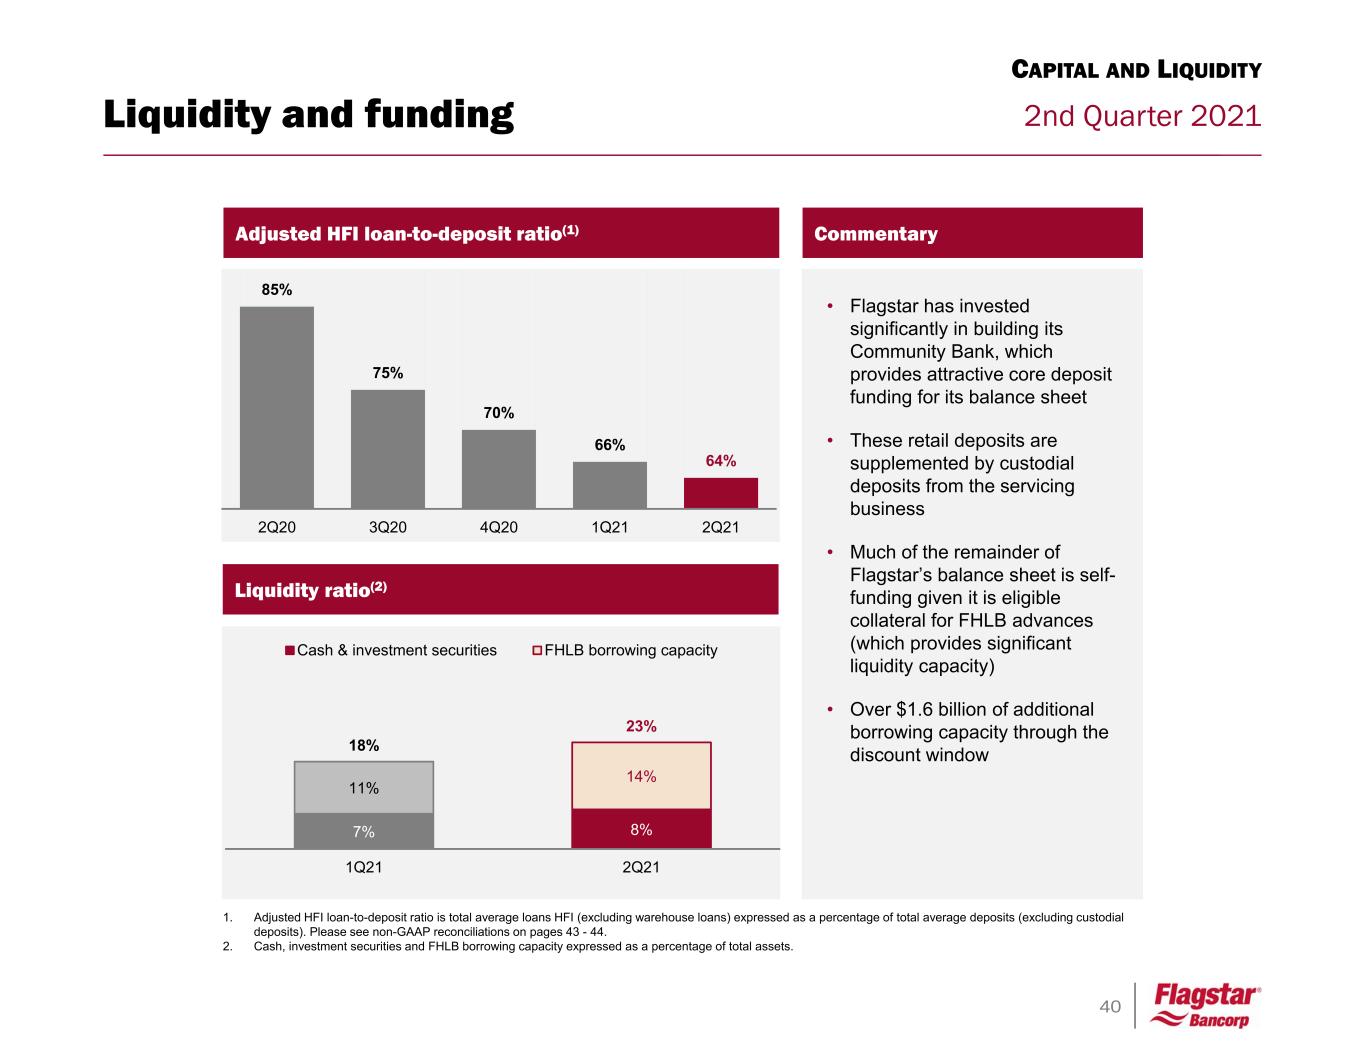
40 2nd Quarter 2021Liquidity and funding 85% 75% 70% 66% 64% 2Q20 3Q20 4Q20 1Q21 2Q21 1. Adjusted HFI loan-to-deposit ratio is total average loans HFI (excluding warehouse loans) expressed as a percentage of total average deposits (excluding custodial deposits). Please see non-GAAP reconciliations on pages 43 - 44. 2. Cash, investment securities and FHLB borrowing capacity expressed as a percentage of total assets. Adjusted HFI loan-to-deposit ratio(1) Commentary • Flagstar has invested significantly in building its Community Bank, which provides attractive core deposit funding for its balance sheet • These retail deposits are supplemented by custodial deposits from the servicing business • Much of the remainder of Flagstar’s balance sheet is self- funding given it is eligible collateral for FHLB advances (which provides significant liquidity capacity) • Over $1.6 billion of additional borrowing capacity through the discount window Liquidity ratio(2) 7% 8% 11% 14% 18% 23% 1Q21 2Q21 Cash & investment securities FHLB borrowing capacity CAPITAL AND LIQUIDITY
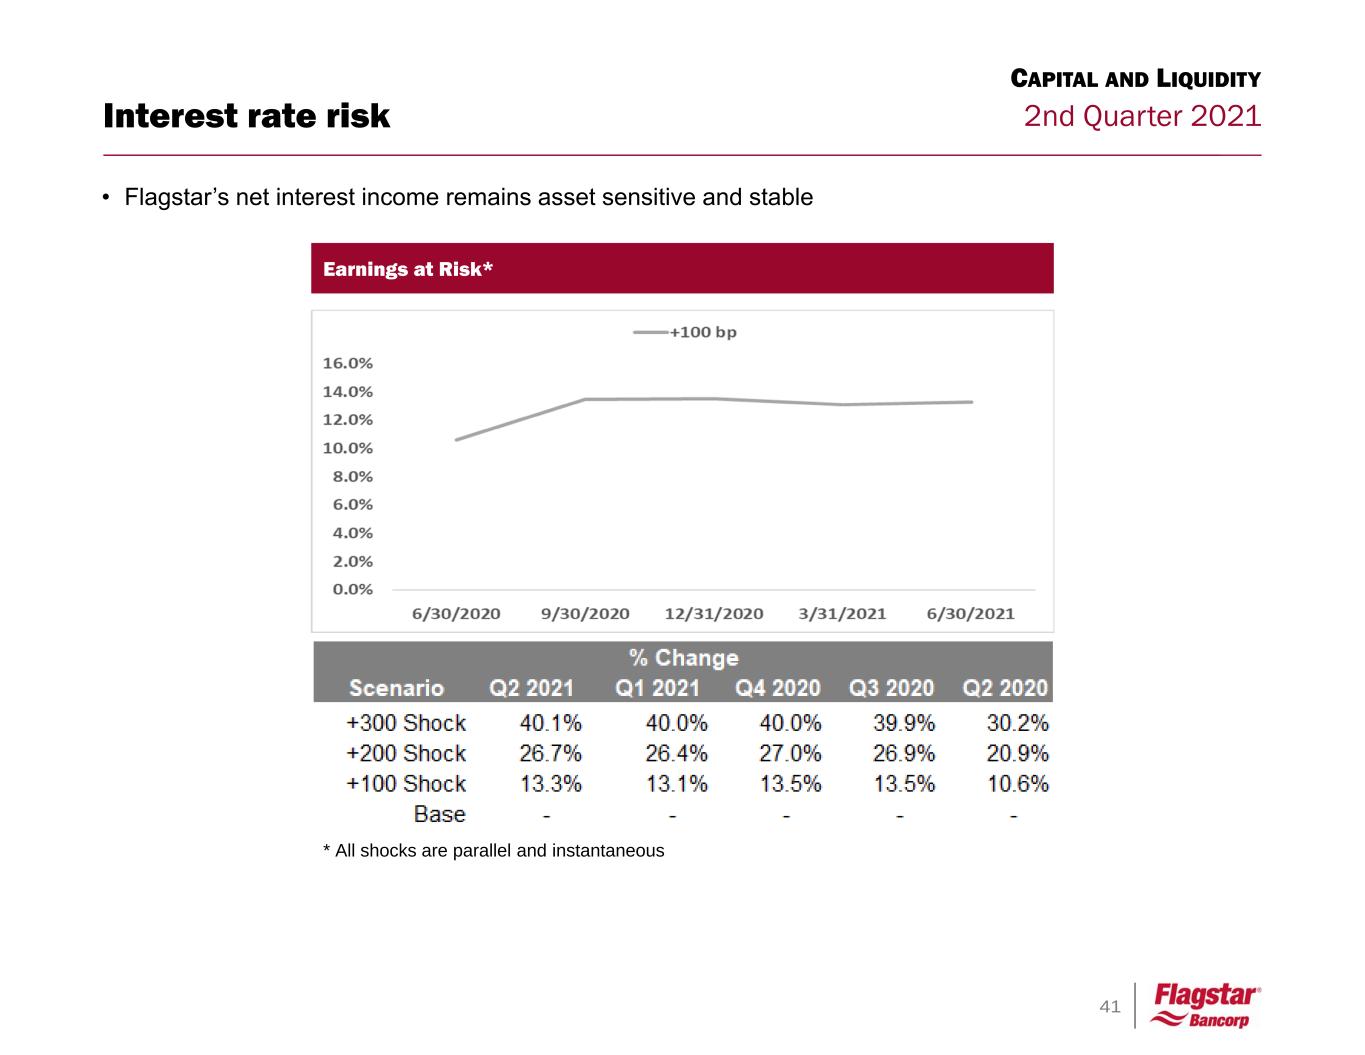
41 2nd Quarter 2021 • Flagstar’s net interest income remains asset sensitive and stable Interest rate risk CAPITAL AND LIQUIDITY Earnings at Risk* * All shocks are parallel and instantaneous
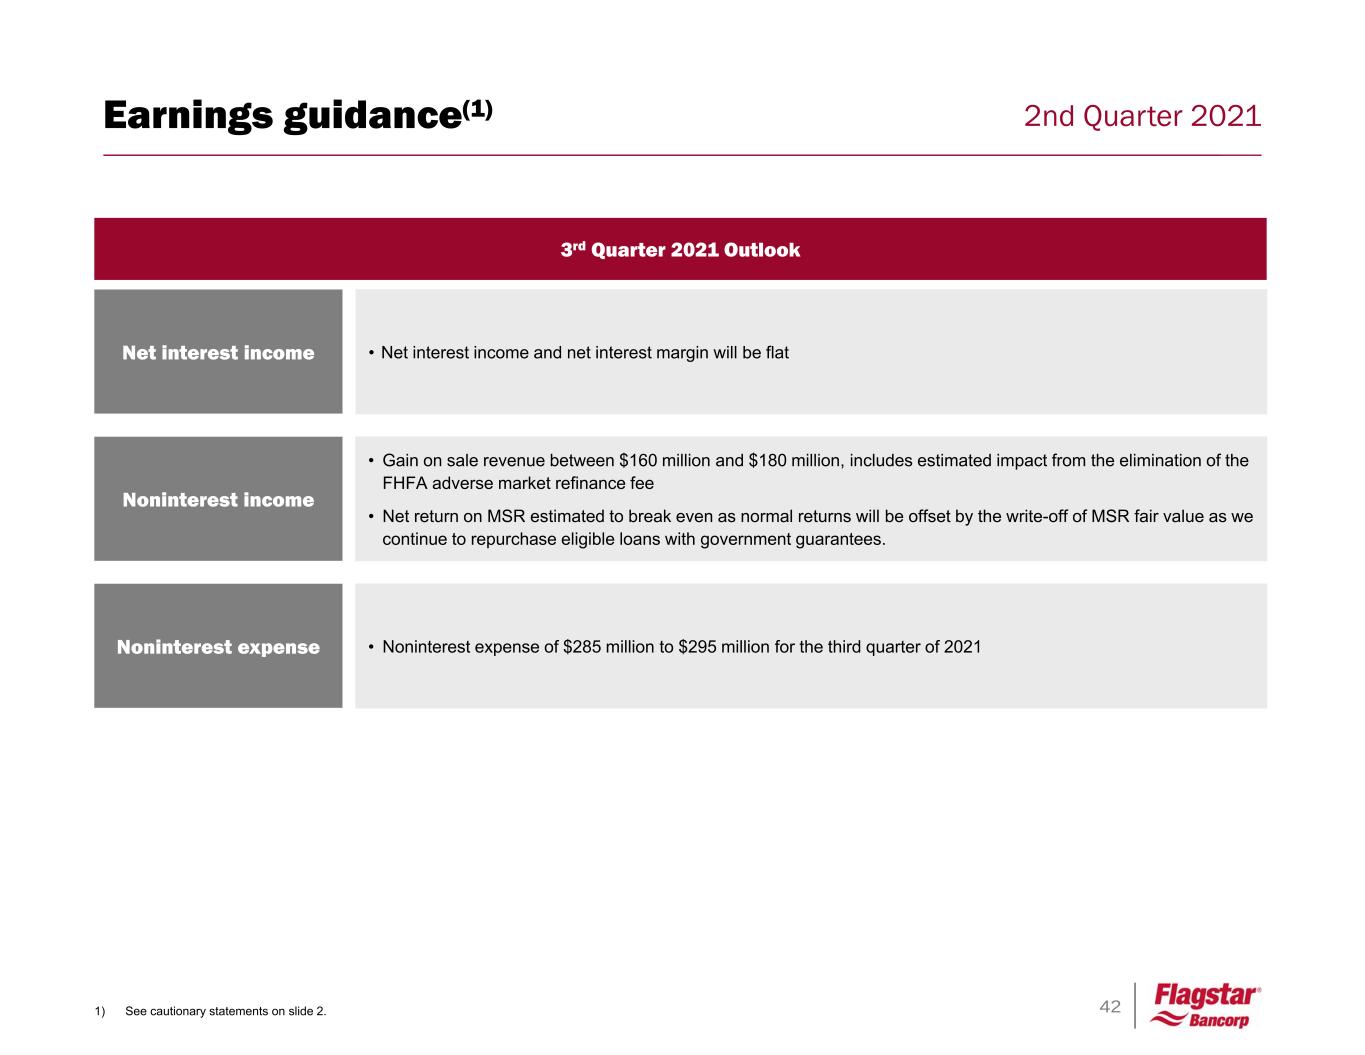
42 2nd Quarter 2021Earnings guidance(1) 1) See cautionary statements on slide 2. Net interest income • Net interest income and net interest margin will be flat Noninterest income • Gain on sale revenue between $160 million and $180 million, includes estimated impact from the elimination of the FHFA adverse market refinance fee • Net return on MSR estimated to break even as normal returns will be offset by the write-off of MSR fair value as we continue to repurchase eligible loans with government guarantees. Noninterest expense • Noninterest expense of $285 million to $295 million for the third quarter of 2021 3rd Quarter 2021 Outlook
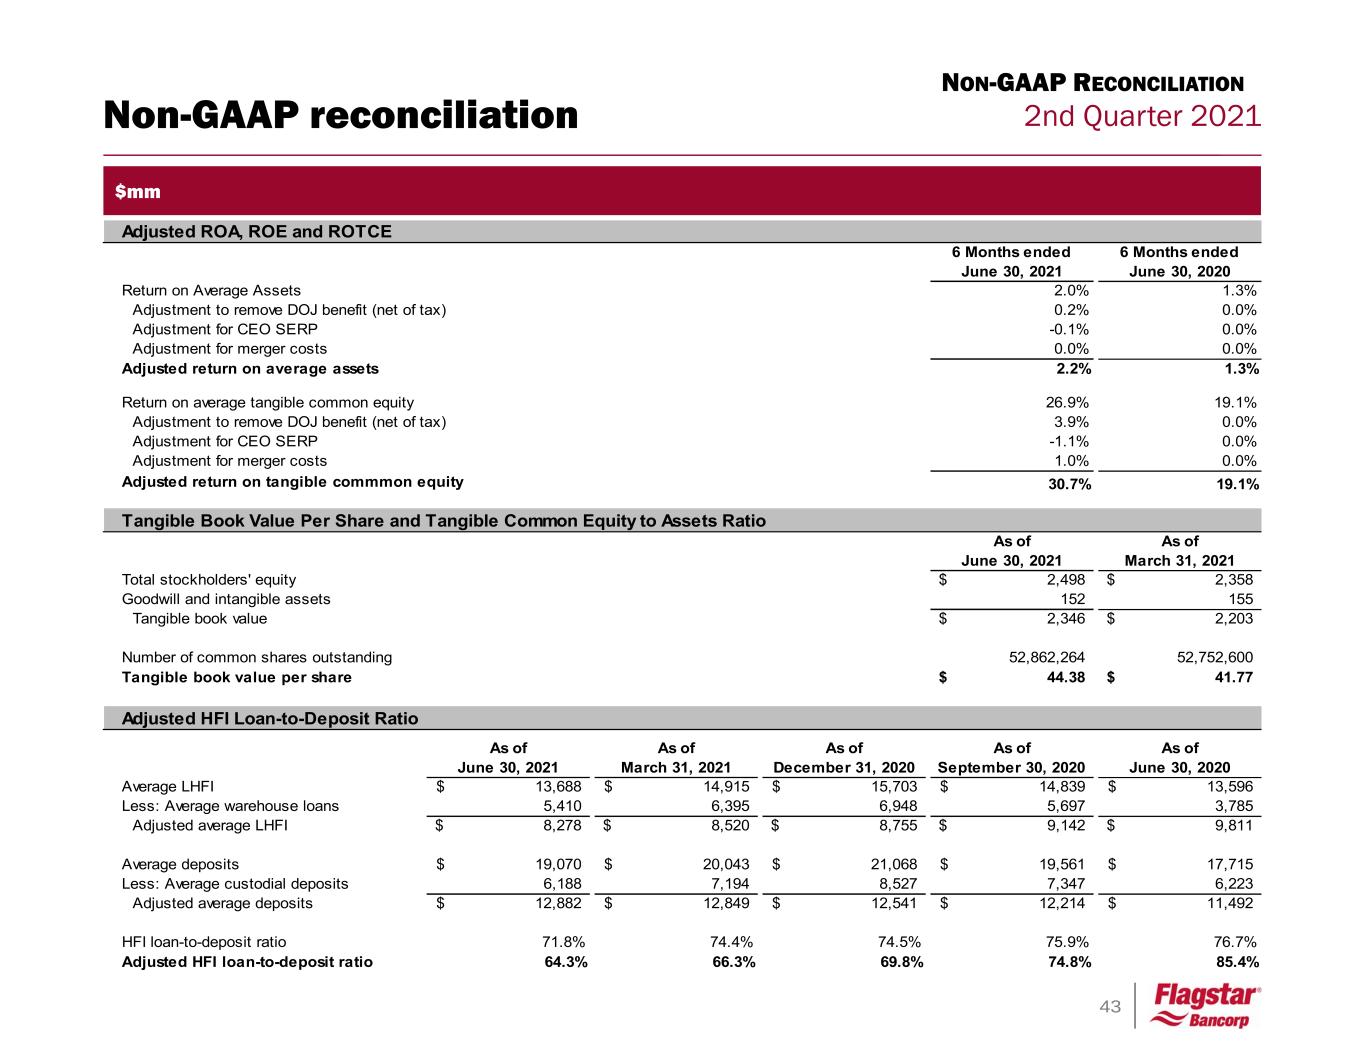
43 2nd Quarter 2021 Adjusted ROA, ROE and ROTCE 6 Months ended June 30, 2021 6 Months ended June 30, 2020 Return on Average Assets 2.0% 1.3% Adjustment to remove DOJ benefit (net of tax) 0.2% 0.0% Adjustment for CEO SERP -0.1% 0.0% Adjustment for merger costs 0.0% 0.0% Adjusted return on average assets 2.2% 1.3% Return on average tangible common equity 26.9% 19.1% Adjustment to remove DOJ benefit (net of tax) 3.9% 0.0% Adjustment for CEO SERP -1.1% 0.0% Adjustment for merger costs 1.0% 0.0% Adjusted return on tangible commmon equity 30.7% 19.1% As of June 30, 2021 As of March 31, 2021 Total stockholders' equity 2,498$ 2,358$ Goodwill and intangible assets 152 155 Tangible book value 2,346$ 2,203$ Number of common shares outstanding 52,862,264 52,752,600 Tangible book value per share 44.38$ 41.77$ As of June 30, 2021 As of March 31, 2021 As of December 31, 2020 As of September 30, 2020 As of June 30, 2020 Average LHFI 13,688$ 14,915$ 15,703$ 14,839$ 13,596$ Less: Average warehouse loans 5,410 6,395 6,948 5,697 3,785 Adjusted average LHFI 8,278$ 8,520$ 8,755$ 9,142$ 9,811$ Average deposits 19,070$ 20,043$ 21,068$ 19,561$ 17,715$ Less: Average custodial deposits 6,188 7,194 8,527 7,347 6,223 Adjusted average deposits 12,882$ 12,849$ 12,541$ 12,214$ 11,492$ HFI loan-to-deposit ratio 71.8% 74.4% 74.5% 75.9% 76.7% Adjusted HFI loan-to-deposit ratio 64.3% 66.3% 69.8% 74.8% 85.4% Tangible Book Value Per Share and Tangible Common Equity to Assets Ratio Adjusted HFI Loan-to-Deposit Ratio Non-GAAP reconciliation NON-GAAP RECONCILIATION $mm
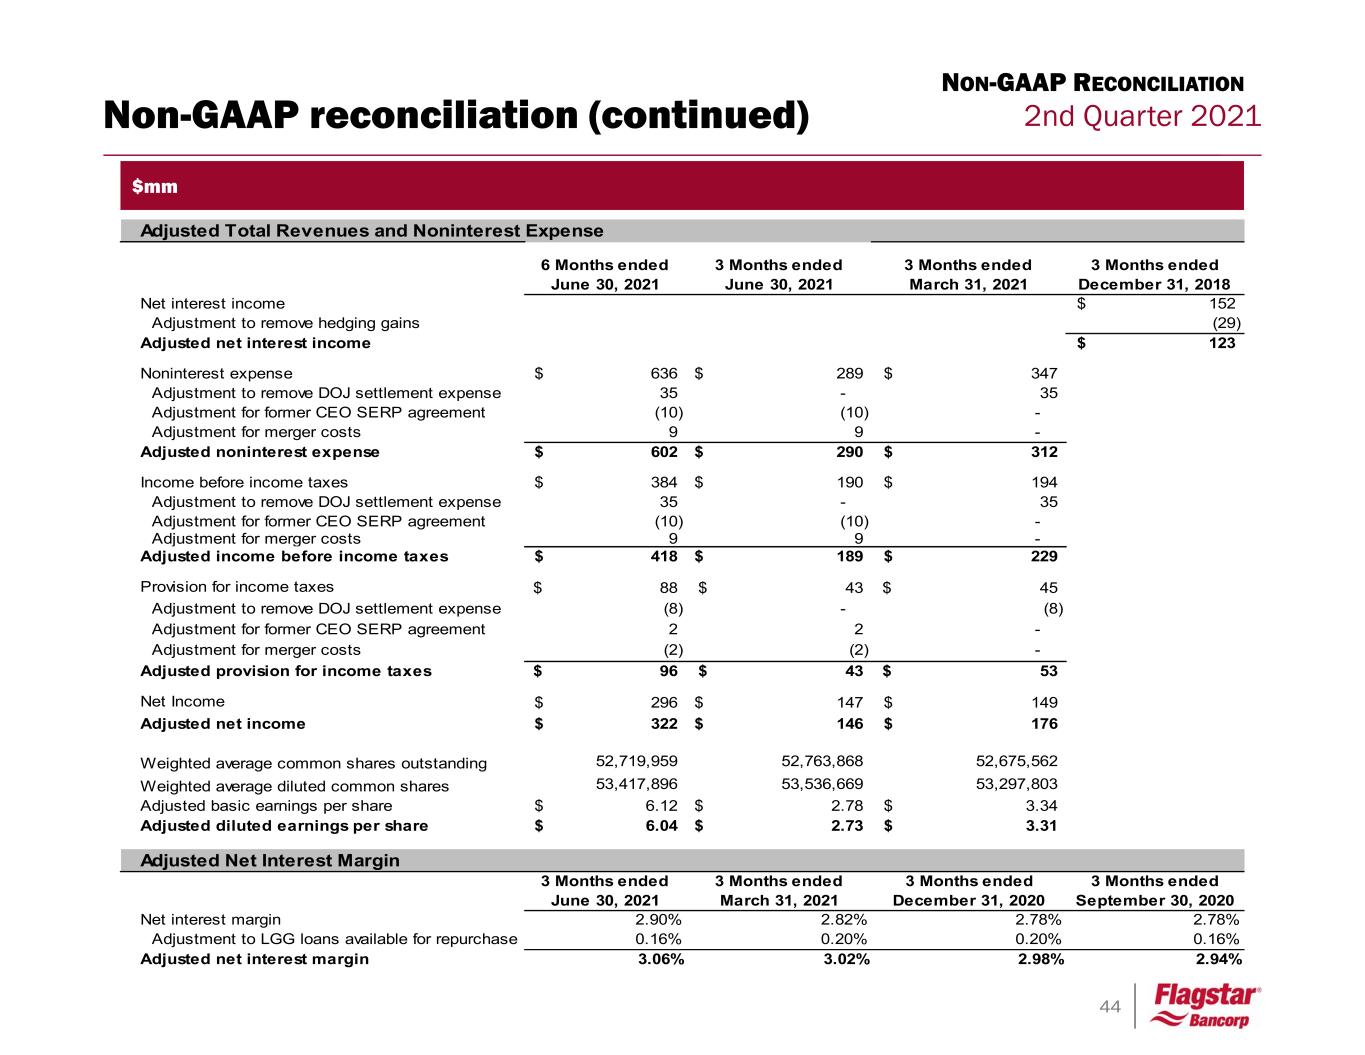
44 2nd Quarter 2021Non-GAAP reconciliation (continued) NON-GAAP RECONCILIATION $mm 6 Months ended June 30, 2021 3 Months ended June 30, 2021 3 Months ended March 31, 2021 3 Months ended December 31, 2018 Net interest income 152$ Adjustment to remove hedging gains (29) Adjusted net interest income 123$ Noninterest expense 636$ 289$ 347$ Adjustment to remove DOJ settlement expense 35 - 35 Adjustment for former CEO SERP agreement (10) (10) - Adjustment for merger costs 9 9 - Adjusted noninterest expense 602$ 290$ 312$ Income before income taxes 384$ 190$ 194$ Adjustment to remove DOJ settlement expense 35 - 35 Adjustment for former CEO SERP agreement (10) (10) - Adjustment for merger costs 9 9 - Adjusted income before income taxes 418$ 189$ 229$ Provision for income taxes 88$ 43$ 45$ Adjustment to remove DOJ settlement expense (8) - (8) Adjustment for former CEO SERP agreement 2 2 - Adjustment for merger costs (2) (2) - Adjusted provision for income taxes 96$ 43$ 53$ Net Income 296$ 147$ 149$ Adjusted net income 322$ 146$ 176$ Weighted average common shares outstanding 52,719,959 52,763,868 52,675,562 Weighted average diluted common shares 53,417,896 53,536,669 53,297,803 Adjusted basic earnings per share 6.12$ 2.78$ 3.34$ Adjusted diluted earnings per share 6.04$ 2.73$ 3.31$ Adjusted Total Revenues and Noninterest Expense 3 Months ended June 30, 2021 3 Months ended March 31, 2021 3 Months ended December 31, 2020 3 Months ended September 30, 2020 Net interest margin 2.90% 2.82% 2.78% 2.78% Adjustment to LGG loans available for repurchase 0.16% 0.20% 0.20% 0.16% Adjusted net interest margin 3.06% 3.02% 2.98% 2.94% Adjusted Net Interest Margin


