|
| Exhibit 99.2 |
|
Earnings Presentation
Fourth Quarter 2011
January 25, 2011
Presenters:
Joseph P. Campanelli
Chief Executive Officer
Paul D. Borja
Chief Financial Officer

Legal Disclaimer
This presentation includes forward ? looking statements (as such term is defined in the Private Securities Litigation Reform Act of 1995) and includes comments with respect to our objectives and strategies, and the results of our operations and our business. Forward ? looking statements can be identified by the fact that they do not relate strictly to historical or current facts. They often include words such as “expects,” “assumes,” “anticipates,” “intends,” “plans,” “believes,” “seeks,” “estimates” or words of similar meaning, or future or conditional words such as “assuming,” “will,” “would,” “possible,” “proposed,” “projected,” “positioned,” “vision,” “opportunity,” “should,” “could,” “indicative,” “target” or “may.”
Forward ? looking statements provide our expectations or predictions of future conditions, events or results. They are not guarantees of future performance. By their nature, these forward ? looking statements involve numerous assumptions, uncertainties and opportunities, both general and specific. These statements speak only as of the date they are made. We do not undertake to update forward ? looking statements to reflect the impact of circumstances or events that arise after the date the forward ? looking statements were made. There a number of factors, many of which are beyond our control that could cause actual conditions, events or results to differ significantly from those described in the forward looking statements. Some of these are:
• Volatile interest rates that impact , amongst profit , , things business , other (i) the mortgage banking (ii) our ability to originate loans and sell assets at a (iii) prepayment speeds and (iv) our cost of funds, could adversely affect earnings, growth opportunities and our ability to pay dividends to shareholders.
• Our ability to maintain capital levels.
• Competitive factors for loans could negatively impact gain on loan sale margins.
• Competition from banking and non? banking companies for deposits and loans can affect our growth opportunities, earnings, gain on sale margins, market share and ability to transform business model.
• Changes in the regulation of financial services companies and government ? sponsored housing enterprises, and in particular, declines in the liquidity of the mortgage loan secondary market, could adversely affect business.
• Our ability to resolve representation and warranty claims from the government ? sponsored housing enterprises or private insurers.
• Our ability to achieve resolution in any pending or threatened litigation including the timing and ability to reach a settlement.
• Changes in regulatory capital requirements or an inability to achieve desired capital ratios could adversely affect our growth and earnings opportunities and our ability to originate certain types of loans, as well as our ability to sell certain types of assets for fair market value or to transform business model.
• General business and economic conditions, including unemployment rates, further movements in interest rates, the slope of the yield curve, any increase in fraud and other criminal activity and the further decline of asset values in certains ‘ geograp hic markets, may significantly affect the company business activities, loan losses, reserves, earnings and business prospects.
• Factors concerning the implementation of proposed enhancements and transformation of business model could result in slower implementation times than we anticipate and negate any competitive advantage that we may enjoy.
Readers should carefully review Flagstar’s financial statements and notes thereto, as well as the risk factors described in Flagstar’s Annual Report on Form 10? K for the year ended December 31, 2010, Form 10? Q for the period ended September 30, 2011, and other documents Flagstar files from time to time with the Securities and Exchange Commission. The information contained in this presentation does not constitute a solicitation to buy Flagstar securities.

Fourth Quarter 2011 Highlights
Net loss to common stockholders of $(44.9) million
$131.6 million in pre? tax, pre? credit? cost income, 28.4% improvement from prior quarter Credit related costs of $173.2, compared to $111.7 in prior quarter Gain on loan sale income increased to $106.9 million, or 102 bps Net loan fees and charges increased by 55.6% from prior quarter to $28.6 million Net servicing revenue increased by 71.3% from prior quarter to $29.0 million Bank net interest margin improved by 13 basis points from prior quarter to 2.43%
Maintained strong capital and liquidity levels
Tier 1 capital ratio of 9.2%
Cash and cash equivalents of $731.1 million, in addition to $244 million in unencumbered marketable securities and over $550 million in unused capacity at FHLB
Continued emphasis on credit risk management, primarily associated with loans originated prior to 2009
Fortified balance sheet, adding $71.0 million in total reserves
Converted to nationally recognized residential mortgage loan servicing system and made significant investments and enhancements in loss mitigation and default servicing
Completed previously announced divestitures of Indiana and Georgia bank franchises, resulting in net gain of $21.4 million
Grew interest earning assets, improved retail deposit mix and reduced overall cost of funds
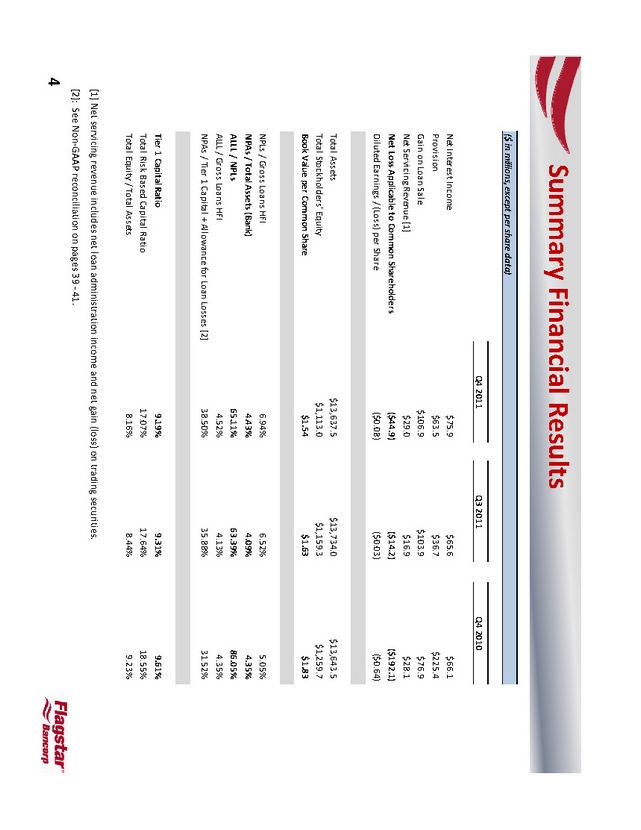
Summary Financial Results
($ in millions, except per share data)
Q4 2011 Q3 2011 Q4 2010
Net Interest Income $75.9 $65.6 $66.1
Provision $63.5 $36.7 $225.4
Gain on Loan Sale $106.9 $103.9 $76.9
Net Servicing Revenue [1] $29.0 $16.9 $28.1
Net Loss Applicable to Common Shareholders ($44.9) ($14.2) ($192.1)
Diluted Earnings / (Loss) per Share ($0.08) ($0.03) ($0.64)
Total Assets $13,637.5 $13,734.0 $13,643.5
Total Stockholders’ Equity $1,113.0 $1,159.3 $1,259.7
Book Value per Common Share $1.54 $1.63 $1.83
NPLs / Gross Loans HFI 6.94% 6.52% 5.05%
NPAs / Total Assets (Bank) 4.43% 4.09% 4.35%
ALLL / NPLs 65.11% 63.39% 86.05%
ALLL / Gross Loans HFI 4.52% 4.13% 4.35%
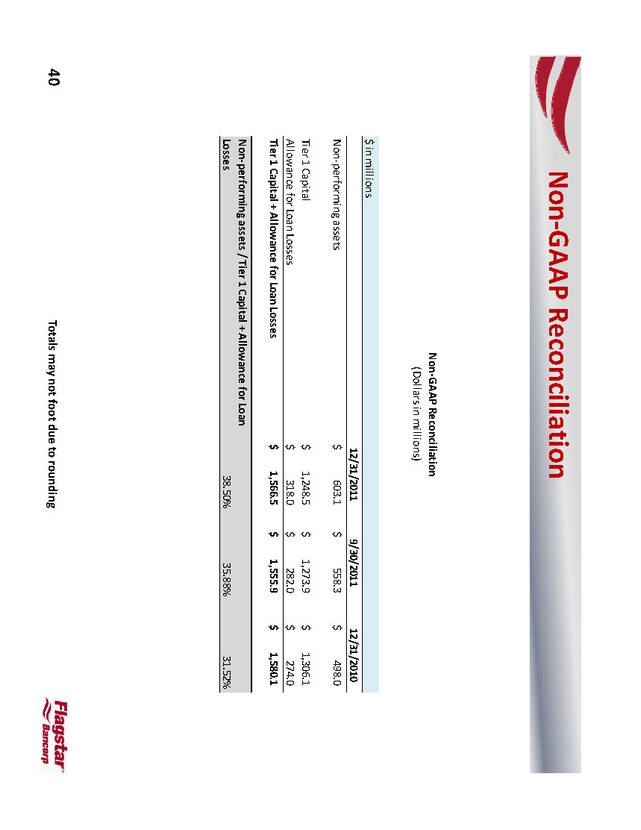
NPAs / Tier 1 Capital + Allowance for Loan Losses [2] 38.50% 35.88% 31.52%
Tier 1 Capital Ratio 9.19% 9.31% 9.61%
Total Risk Based Capital Ratio 17.07% 17.64% 18.55%
Total Equity / Total Assets 8.16% 8.44% 9.23%
[1] Net servicing revenue includes net loan administration income and net gain (loss) on trading securities.
[2]: See Non? GAAP reconciliation on pages 39 ? 41.
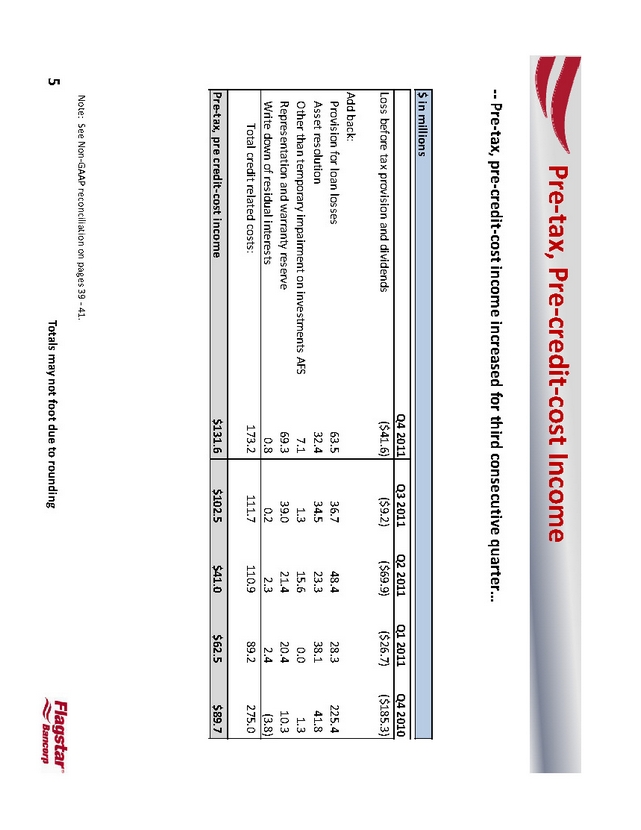
Pre? tax, Pre? credit? cost Income
?? Pre? tax, pre? credit? cost income increased for third consecutive quarter …
$ in millions
Q4 2011 Q3 2011 Q2 2011 Q1 2011 Q4 2010
Loss before tax provision and dividends ($41.6) ($9.2) ($69.9) ($26.7) ($185.3)
Add back:
Provision for loan losses 63.5 36.7 48.4 28.3 225.4
Asset resolution 32.4 34.5 23.3 38.1 41.8
Other than temporary impairment on investments AFS 7.1 1.3 15.6 0.0 1.3
Representation and warrant y reserve 69.3 39.0 21.4 20.4 10.3
Write down of residual interests 0.8 0.2 2.3 2.4 (3.8)
Total credit related costs: 173.2 111.7 110.9 89.2 275.0
Pre? tax, pre credit? cost income $131.6 $102.5 $41.0 $62.5 $89.7
Note: See Non? GAAP reconciliation on pages 39 ? 41.
Totals may not foot due to rounding
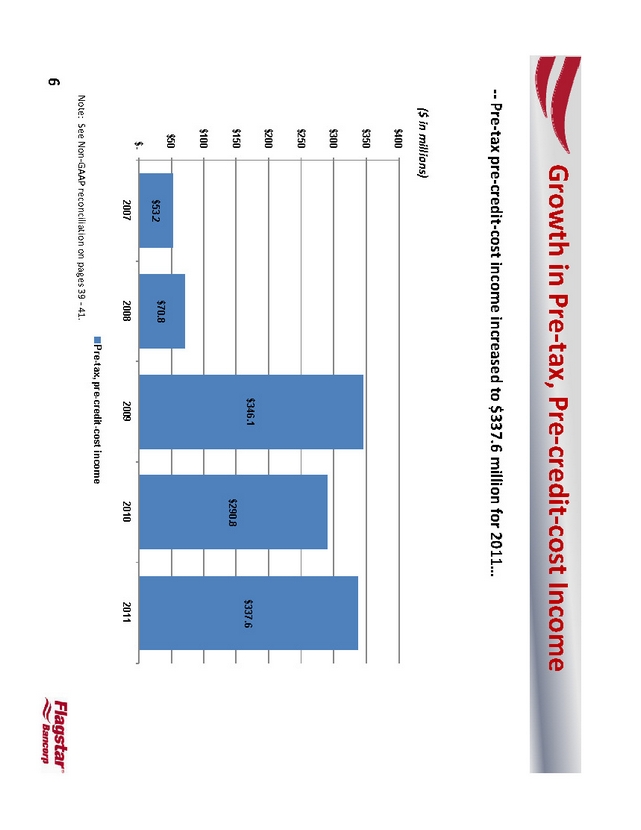
Growth in Pre? tax, Pre? credit? cost Income
?? Pre? tax pre? credit? cost income increased to $337.6 million for 2011…
($ in millions)
$400 $350 $300 $250 $200 $150 $100 $50 $-
$53.2
$70.8
$346.1
$290.8
$337.6
2007 2008 2009 2010 2011
Pre-tax, pre-credit-cost income
Note: See Non? GAAP reconciliation on pages 39 ? 41.
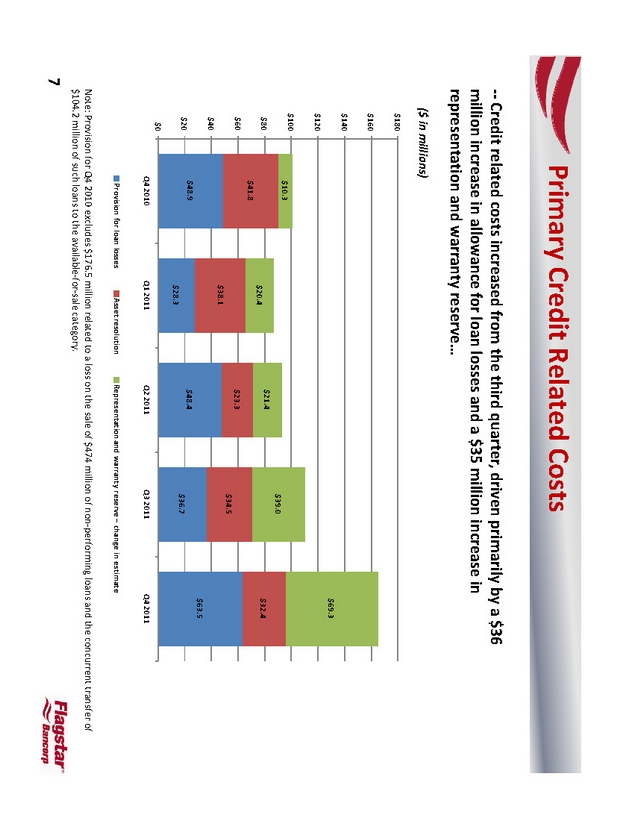
Primary Credit Related Costs
?? Credit related costs increased from the third quarter, driven primarily by a $36 million increase in allowance for loan losses and a $35 million increase in representation and warranty reserve …
($ in millions)
$180 $160 $140 $120 $100 $80 $60 $40 $20 $0
$10.3 $41.8 $48.9
$20.4 $38.1 $28.3
$21.4 $23.3 $48.4
$39.0 $34.5 $36.7
$69.3 $32.4 $63.5
Q4 2010 Q1 2011 Q2 2011 Q3 2011 Q4 2011
Provision for loan losses
Asset resolution
Representation and warranty reserve – change in estimate
Note: Provision for Q4 2010 excludes $176.5 million related to a loss on the sale of $474 million of non? performing loans and the concurrent transfer of $104.2 million of such loans to the available ? for? sale category.
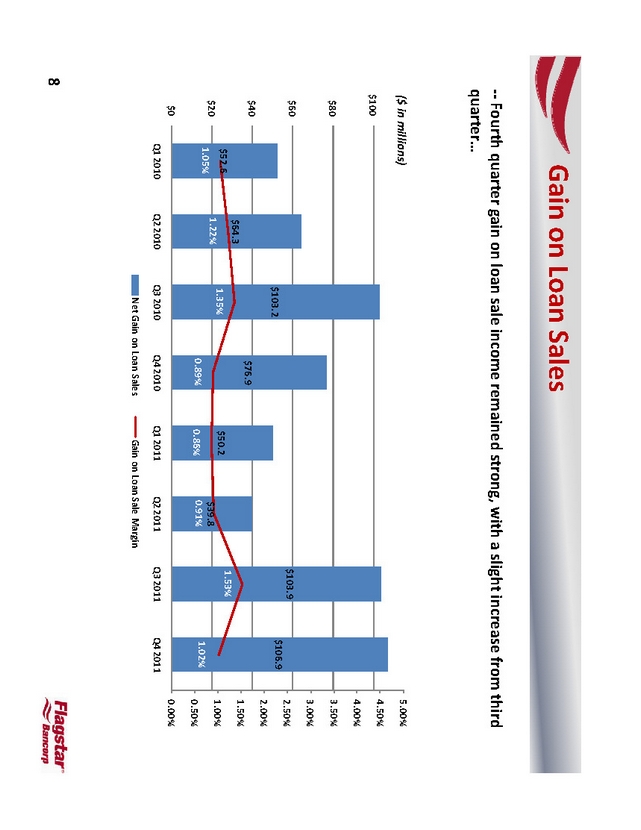
Gain on Loan Sales
?? Fourth quarter gain on loan sale income remained strong, with a slight increase from third quarter …
($ in millions)
$100 $80 $60 $40 $20 $0
$52.6
1.05%
$64.3
1.22%
$103.2
1.35%
$76.9
0.89%
$50.2
0.86%
$39.8 0.91%
$103.9
1.53%
$106.9
1.02%
5.00%
4.50%
4.00%
3.50%
3.00% 2.50% 2.00%
1.50%
1.00%
0.50%
0.00%
Q1 2010 Q2 2010 Q3 2010 Q4 2010 Q1 2011 Q2 2011 Q3 2011 Q4 2011
Net Gain on Loan Sales
Gain on Loan Sale Margin
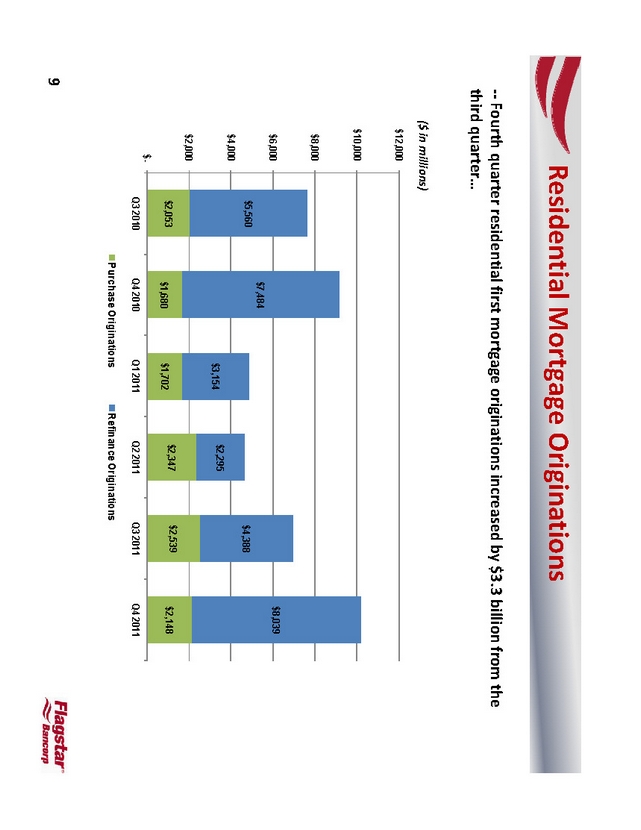
Residential Mortgage Originations
?? Fourth quarter residential first mortgage originations increased by $3.3 billion from the third quarter …
($ in millions)
$12,000 $10,000 $8,000 $6,000 $4,000 $2,000 $-
$5,560
$2,053
$7,484
$1,680
$3,154
$1,702
$2,295
$2,347
$4,388
$2,539
$8,039
$2,148
Q3 2010 Q4 2010 Q1 2011 Q2 2011 Q3 2011 Q4 2011
Purchase Originations
Refinance Originations
9
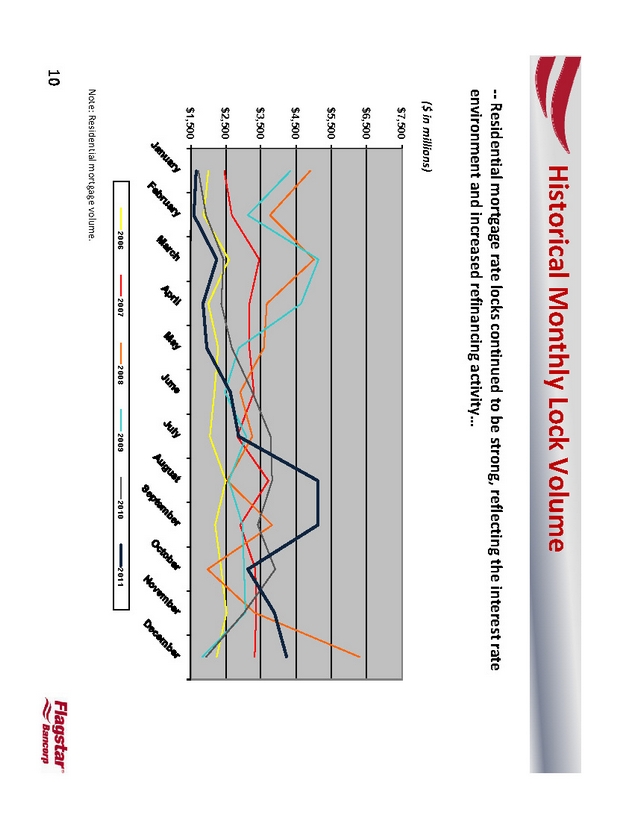
Historical Monthly Lock Volume
?? Residential mortgage rate locks continued to be strong, reflecting the interest rate environment and increased refinancing activity …
($ in millions)
$7,500 $6,500 $5,500 $4,500 $3,500 $2,500 $1,500
2006 2007 2008 2009 2010 2011
Note: Residential mortgage volume.
10
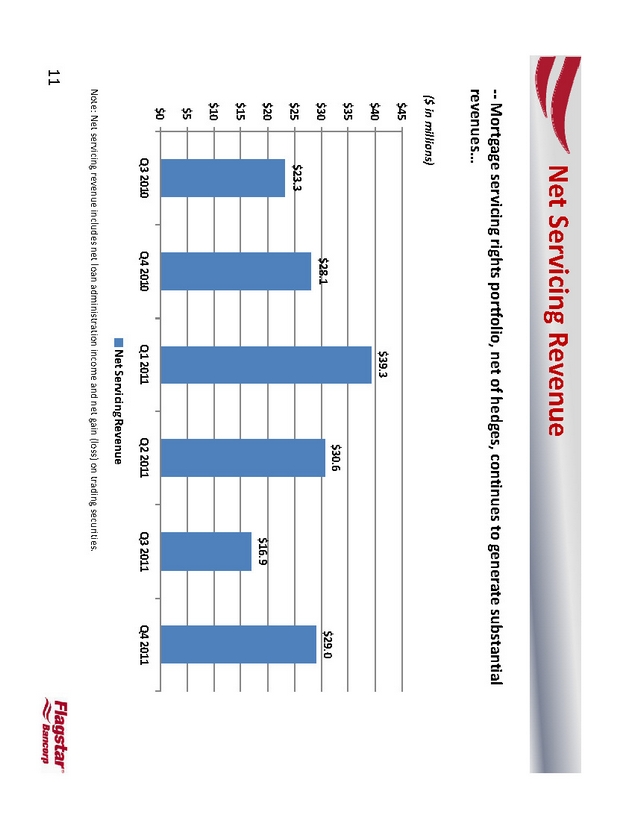
Net Servicing Revenue
?? Mortgage servicing rights portfolio, net of hedges, continues to generate substantial revenues …
($ in millions)
$45 $40 $35 $30 $25 $20 $15 $10 $5 $0
$23.3
$28.1
$39.3
$30.6
$16.9
$29.0
Q3 2010 Q4 2010 Q1 2011 Q2 2011 Q3 2011 Q4 2011
Net Servicing Revenue
Note: Net servicing revenue includes net loan administration income and net gain (loss) on trading securities.
11
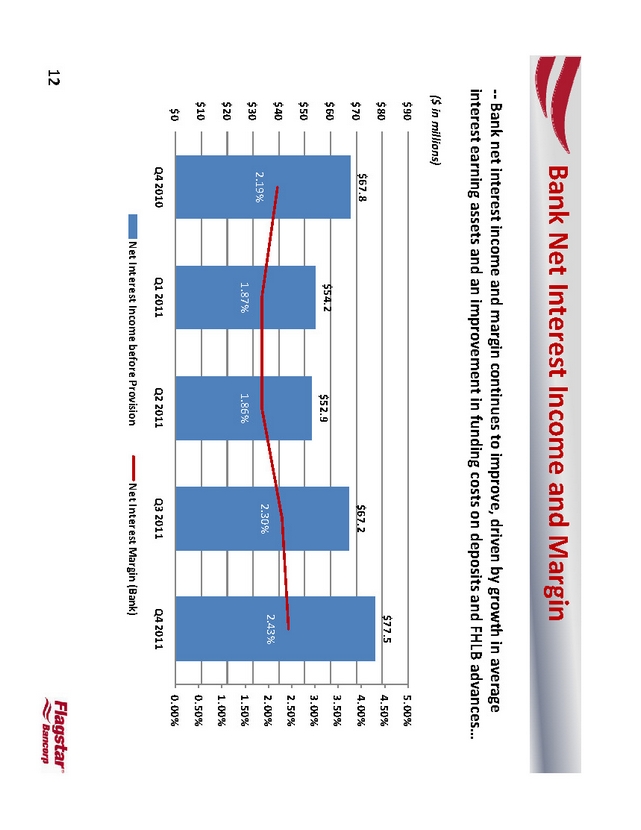
Bank Net Interest Income and Margin
?? Bank net interest income and margin continues to improve, driven by growth in average interest earning assets and an improvement in funding costs on deposits and FHLB advances …
($ in millions)
$90 $80 $70 $60 $50 $40 $30 $20 $10 $0
$67.8
2.19%
$54.2
1.87%
$52.9
1.86%
$67.2
2.30%
$77.5
2.43%
5.00% 4.50% 4.00% 3.50% 3.00% 2.50% 2.00% 1.50% 1.00% 0.50% 0.00%
Q4 2010 Q1 2011 Q2 2011 Q3 2011 Q4 2011
Net Interest Income before Provision
Net Interest Margin (Bank)
12
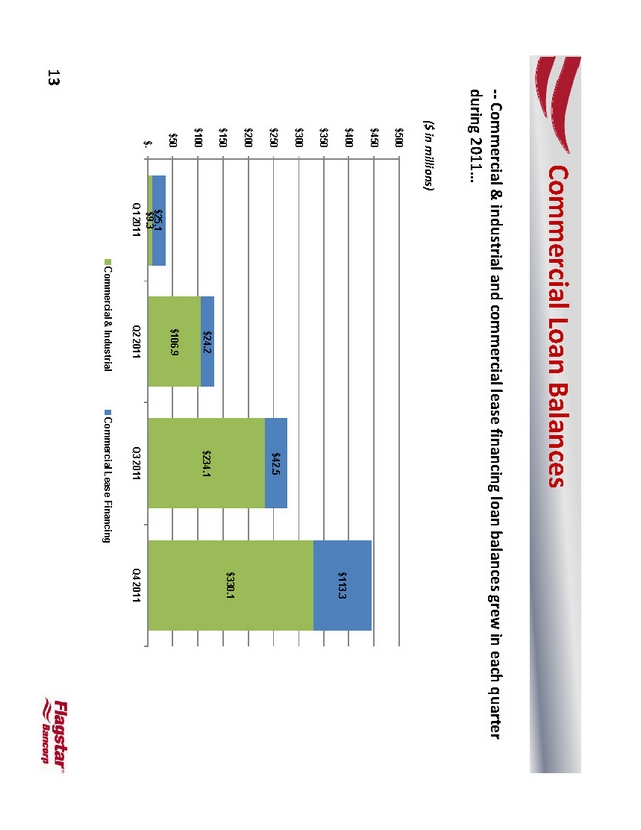
Commercial Loan Balances
?? Commercial & industrial and commercial lease financing loan balances grew in each quarter during 2011…
($ in millions)
$500 $450 $400 $350 $300 $250 $200 $150 $100 $50 $-
$25.1 $9.3 Q1 2011
$24.2 $106.9 Q2 2011
$42.5 $234.1 Q3 2011
$113.3
$330.1
Q4 2011
Commercial & Industrial
Commercial Lease Financing
13
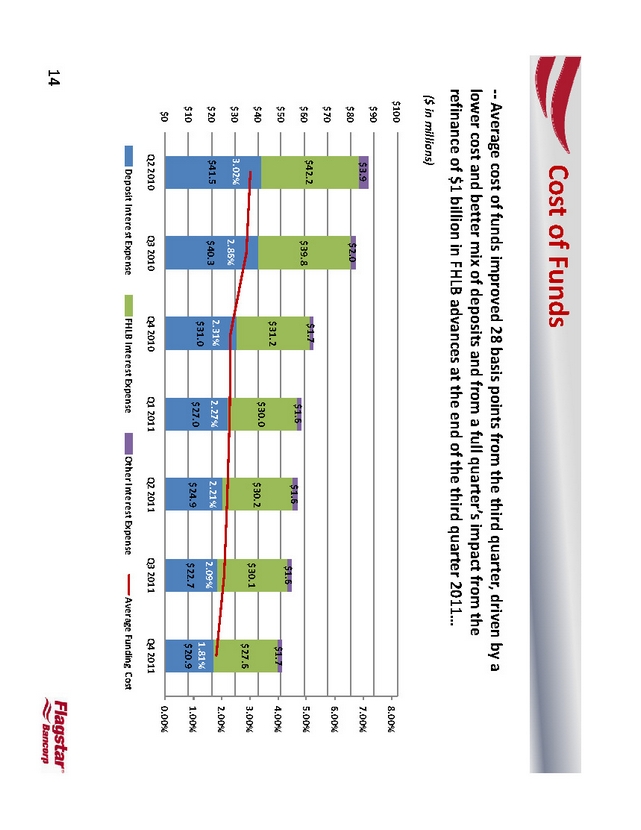
Cost of Funds
?? Average cost of funds improved 28 basis points from the third quarter, driven by a lower cost and better mix of deposits and from a full quarter’s impact from the refinance of $1 billion in FHLB advances at the end of the third quarter 2011…
($ in millions)
$100
$90
$80
$70
$60 $50 $40
$30
$20
$10
$0
$3.9
$42.2
3.02%
$41.5
Q2 2010
$2.0
$39.8
2.86%
$40.3
Q3 2010
$1.7
$31.2
2.31% $31.0
Q4 2010
$1.6
$30.0
2.27%
$27.0
Q1 2011
$1.6
$30.2
2.21%
$24.9
Q2 2011
$1.6
$30.1
2.09%
$22.7
Q3 2011
$1.7
$27.6
1.81% $20.9
Q4 2011
8.00% 7.00% 6.00% 5.00% 4.00% 3.00% 2.00% 1.00% 0.00%
Deposit Interest Expense
FHLB Interest Expense
Other Interest Expense
Average Funding Cost
14
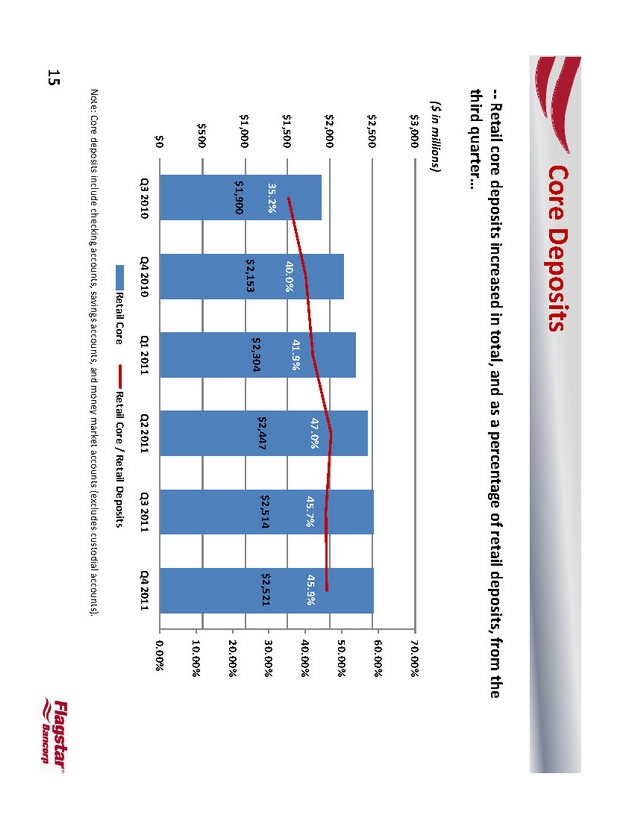
Core Deposits
?? Retail core deposits increased in total, and as a percentage of retail deposits, from the third quarter …
($ in millions)
$3,000 $2,500 $2,000 $1,500 $1,000 $500 $0
35.2%
$1,900
Q3 2010
40.0%
$2,153
Q4 2010
41.9%
$2,304
47.0%
$2,447
45.7%
$2,514
45.9%
$2,521
70.00% 60.00% 50.00% 40.00% 30.00% 20.00% 10.00% 0.00%
Q1 2011
Q2 2011
Q3 2011
Q4 2011
Retail Core
Retail Core / Retail Deposits
Note: Core deposits include checking accounts, savings accounts, and money market accounts (excludes custodial accounts) .
15
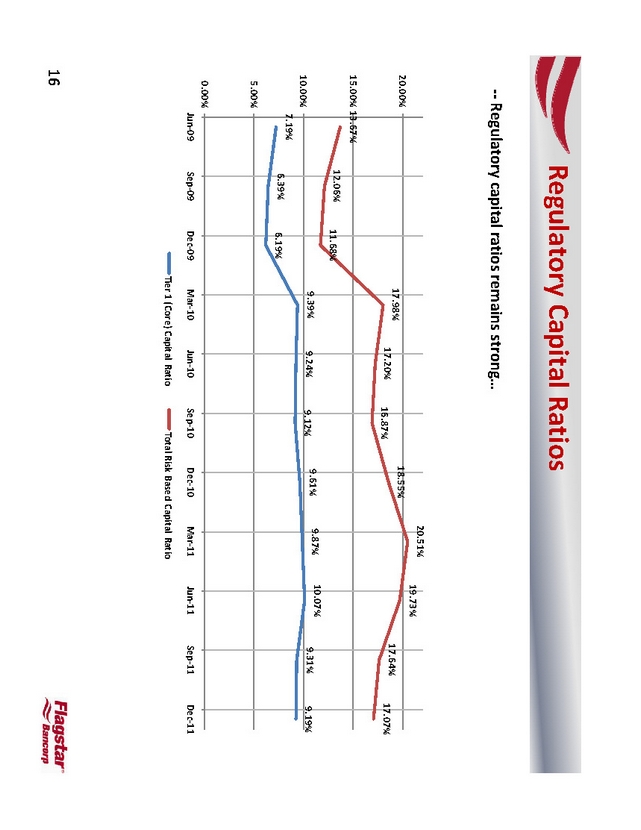
Regulatory Capital Ratios
?? Regulatory capital ratios remains strong…
19.73% 20.00% 18.55%
17.98% 17.20% 17.64%
16.87% 17.07%
15.00% 13.67%
12.06% 11.68%
9.87% 10.07%
9.39% 9.24% 9.61% 9.31%
9.12% 9.19% 10.00% 7.19% 6.39% 6.19%
5.00%
0.00%
Jun? 09 Sep? 09 Dec? 09 Mar? 10 Jun? 10 Sep? 10 Dec? 10 Mar? 11 Jun? 11 Sep? 11 Dec? 11
Tier 1 (Core) Capital Ratio Total Risk Based Capital Ratio
16
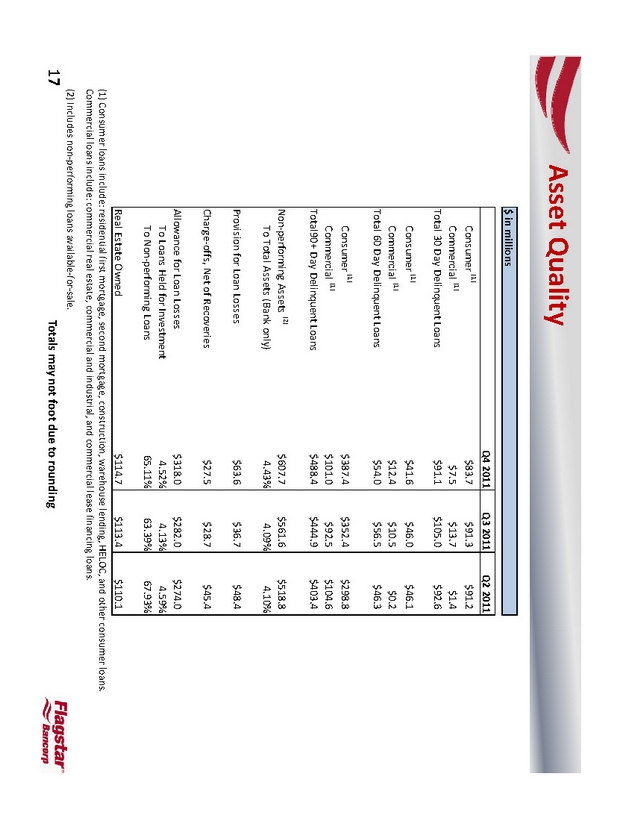
Asset Quality
$ in millions
Q4 2011 Q3 2011 Q2 2011
Consumer (1) $83.7 $91.3 $91.2
Commercial (1) $7.5 $13.7 $1.4
Total 30 Day Delinquent Loans $91.1 $105.0 $92.6
Consumer (1) $41.6 $46.0 $46.1
Commercial (1) $12.4 $10.5 $0.2
Total 60 Day Delinquent Loans $54.0 $56.5 $46.3
Consumer (1) $387.4 $352.4 $298.8
Commercial (1) $101.0 $92.5 $104.6
Total90+ Day Delinquent Loans $488.4 $444.9 $403.4
Non? performing Assets (2) 8 518. 607. 561. 7 6 $ $ $
To Total Assets (Bank only) 4.43% 4.09% 4.10%
Provision for Loan Losses $63.6 $36.7 $48.4
Charge? offs, Net of Recoveries $27.5 $28.7 $45.4
Allowance for Loan Losses $318.0 $282.0 $274.0
To Loans Held for Investment 4.52% 4.13% 4.59%
To Non? performing Loans 65.11% 63.39% 67.93%
Real Estate Owned $114. $113.110. 4 7 1 $
(1) Consumer loans include: residential first mortgage, second mortgage, construction, warehouse lending, HELOC, and other consumer loans. Commercial loans include: commercial real estate, commercial and industrial, and commercial lease financing loans.
(2) | | Includes non? performing loans available ? for? sale. |
Totals may not foot due to rounding
17
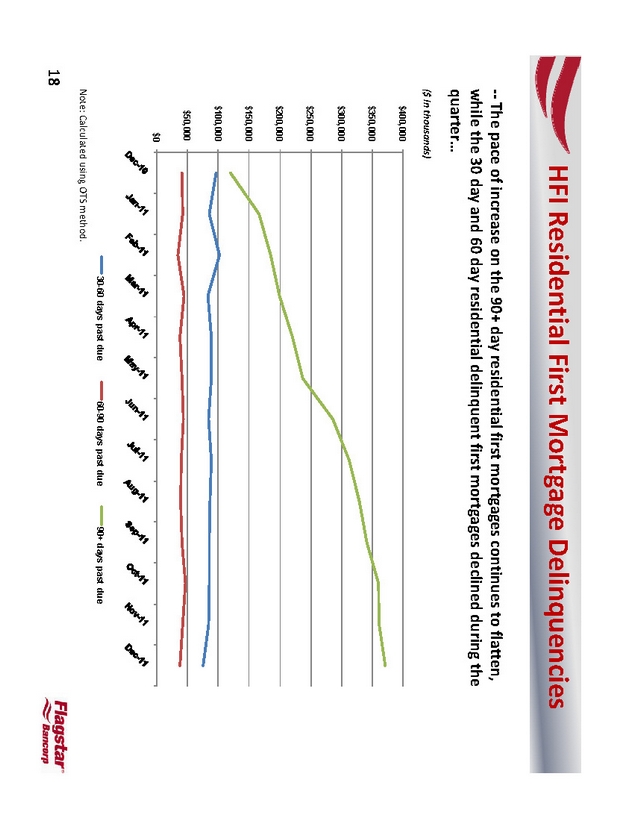
HFI Residential First Mortgage Delinquencies
?? The pace of increase on the 90+ day residential first mortgages continues to flatten, while the 30 day and 60 day residential delinquent first mortgages declined during the quarter …
($ in thousands)
$400,000 $350,000 $300,000 $250,000 $200,000 $150,000 $100,000 $50,000 $0
30-60 days past due 60-90 days past due 90+ days past due
Note: Calculated using OTS method.
18
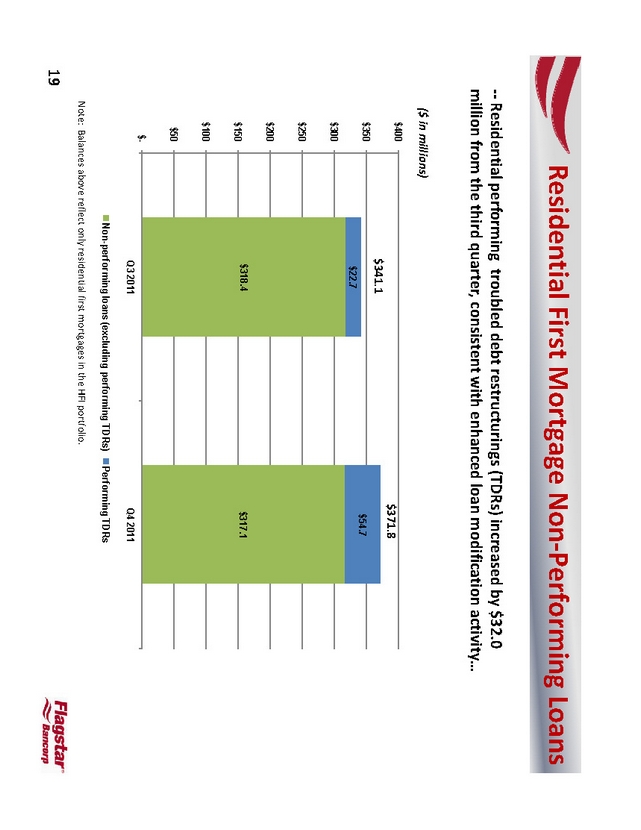
Residential First Mortgage Non? Performing Loans
?? Residential performing troubled debt restructurings (TDRs) increased by $32.0 million from the third quarter, consistent with enhanced loan modification activity …
($ in millions)
$400 $350 $300 $250 $200 $150 $100 $50 $-
$341.1
$22.7
$318.4
Q3 2011
$371.8
$54.7
$317.1
Q4 2011
Non-performing loans (excluding performing TDRs) Performing TDRs
Note: Balances above reflect only residential first mortgages in the HFI portfolio.
19
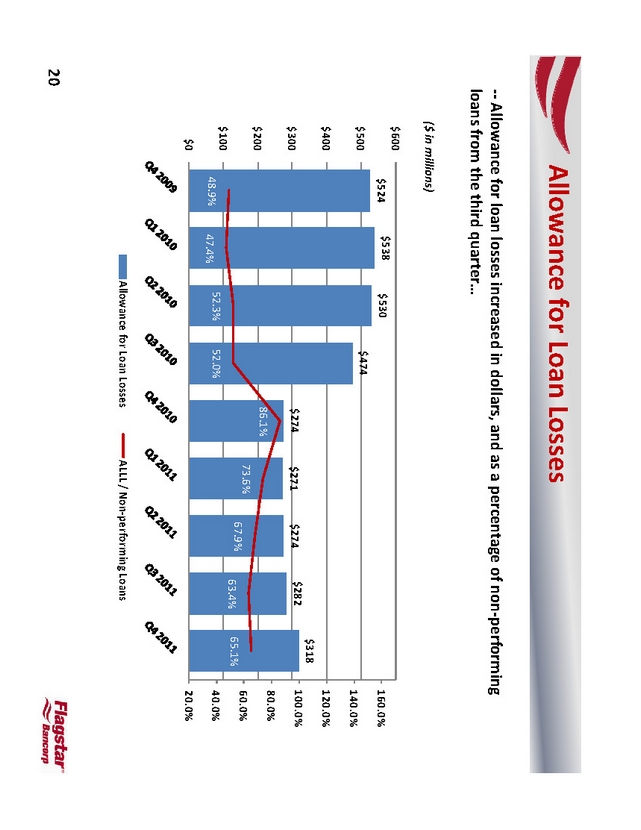
Allowance for Loan Losses
?? Allowance for loan losses increased in dollars, and as a percentage of non? performing loans from the third quarter …
($ in millions)
$600 $500 $400 $300 $200 $100 $0
$538 $530 $524 160.0% $474 140.0%
120.0% $318 $274 $274 $282 100.0% $271
80.0%
86.1%
73.6% 60.0% 67.9% 65.1% 63.4% 52.3% 52.0% 40.0% 48.9% 47.4%
20.0%
Allowance for Loan Losses ALLL / Non? performing Loans
20
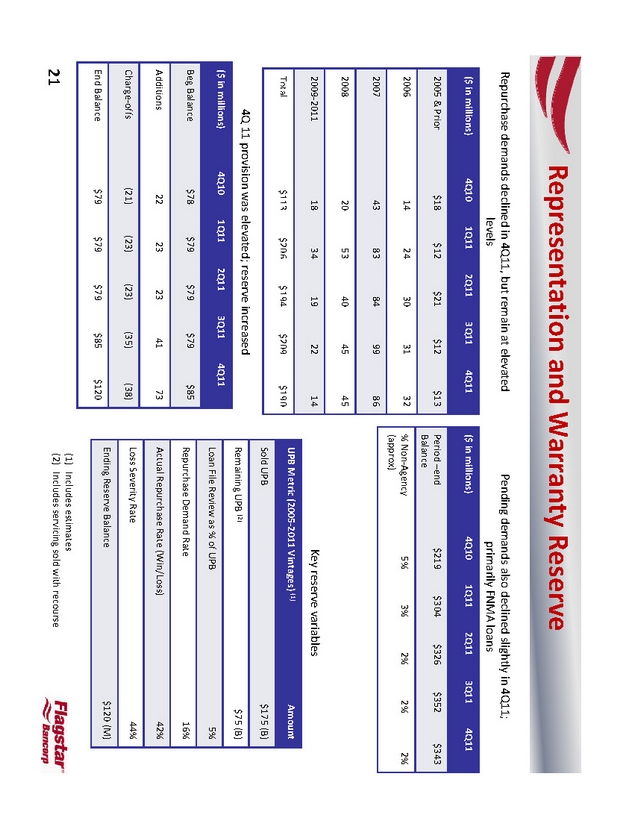
Representation and Warranty Reserve
Repurchase demands declined in 4Q11, but remain at elevated levels
($ in millions) 4Q10 1Q11 2Q11 3Q11 4Q11
2005 & Prior $18 $12 $21 $12 $13
2006 14 24 30 31 32
2007 43 83 84 99 86
2008 20 53 40 45 45
2009? 2011 18 34 19 22 14
Total $113 $206 $194 $209 $190
4Q 11 provision was elevated; reserve increased
($ in millions) 4Q10 1Q11 2Q11 3Q11 4Q11
Beg Balance $78 $79 $79 $79 $85
Additions 22 23 23 41 73
Charge? offs (21) (23) (23) (35) (38)
End Balance $79 $79 $79 $85 $120
21
Pending demands also declined slightly in 4Q11;
primarily FNMA loans
($ in millions) 4Q10 1Q11 2Q11 3Q11 4Q11
Period –end $219 $304 $326 $352 $343
Balance
% Non? Agency 5% 3% 2% 2% 2%
(approx)
Key reserve variables
UPB Metric (2005? 2011 Vintages) (1) Amount
Sold UPB $175 (B)
Remaining UPB (2) $75 (B)
Loan File Review as % of UPB 5%
Repurchase Demand Rate 16%
Actual Repurchase Rate (Win/Loss) 42%
Loss Severity Rate 44%
Ending Reserve Balance $120 (M)
(2) | | Includes servicing sold with recourse |

Appendix
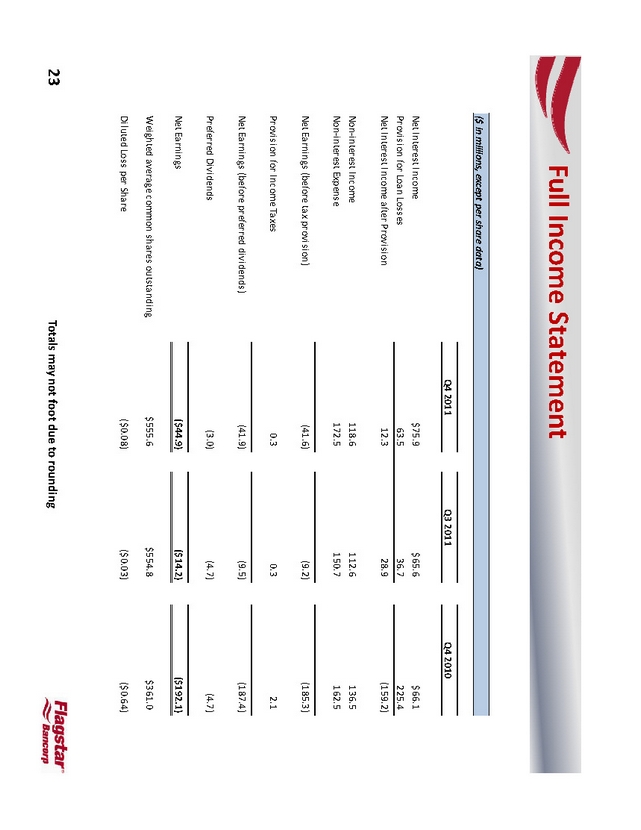
Full Income Statement
($ in millions, except per share data)
Q4 2011 Q3 2011 Q4 2010
Net Interest Income $75.9 $65.6 $66.1
Provision for Loan Losses 63.5 36.7 225.4
Net Interest Income after Provision 12.3 28.9 (159.2)
Non? interest Income 118.6 112.6 136.5
Non? interest Expense 172.5 150.7 162.5
Net Earnings (before tax provision) (41.6) (9.2) (185.3)
Provision for Income Taxes 0.3 0.3 2.1
Net Earnings (before preferred dividends) (41.9) (9.5) (187.4)
Preferred Dividends (3.0) (4.7) (4.7)
Net Earnings ($44.9) ($14.2) ($192.1)
Weighted average common shares outstanding $555.6 $554.8 $361.0
Diluted Loss per Share ($0.08) ($0.03) ($0.64)
23
Totals may not foot due to rounding
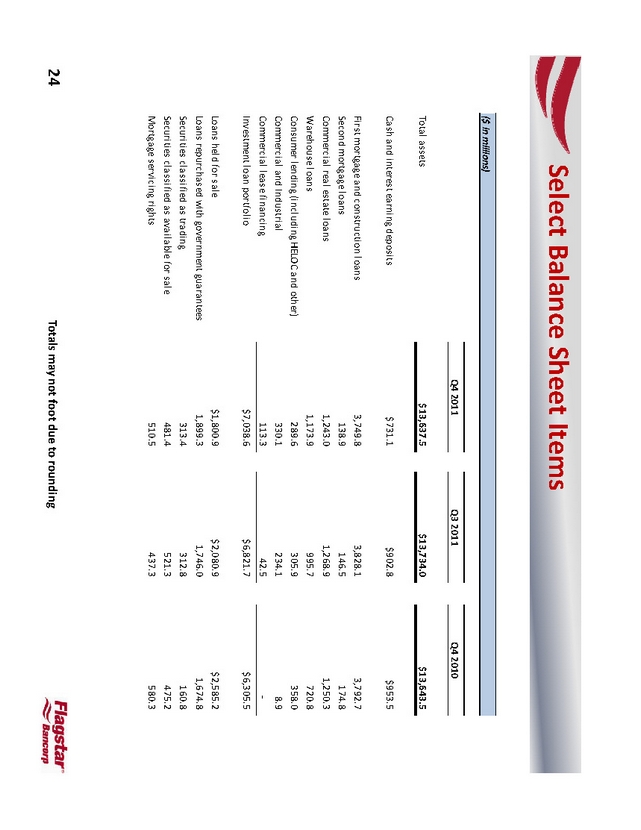
Select Balance Sheet Items
($ in millions)
Q4 2011 Q3 2011 Q4 2010
Total assets $13,637.5 $13,734.0 $13,643.5
Cash and interest earning deposits $731.1 $902.8 $953.5
First mortgage and construction loans 3,749.8 3,828.1 3,792.7
Second mortgage loans 138.9 146.5 174.8
Commercial real estate loans 1,243.0 1,268.9 1,250.3
Warehouse loans 1,173.9 995.7 720.8
Consumer lending (including HELOC and other) 289.6 305.9 358.0
Commercial and Industrial 9 234. 8. 1 1 330.
Commercial lease financing 113.3 42.5
Investment loan portfolio $7,038.6 $6,821.7 $6,305.5
Loans held for sale $1,800.9 $2,080.9 $2,585.2
Loans repurchased with government guarantees 1,8997461, .1, .3 .6748 0
Securities classified as trading 313.4 312.8 160.8
Securities classified as available for sale 481.4 521.3 475.2
Mortgage servicing rights 510.5 437.3 580.3
24
Totals may not foot due to rounding
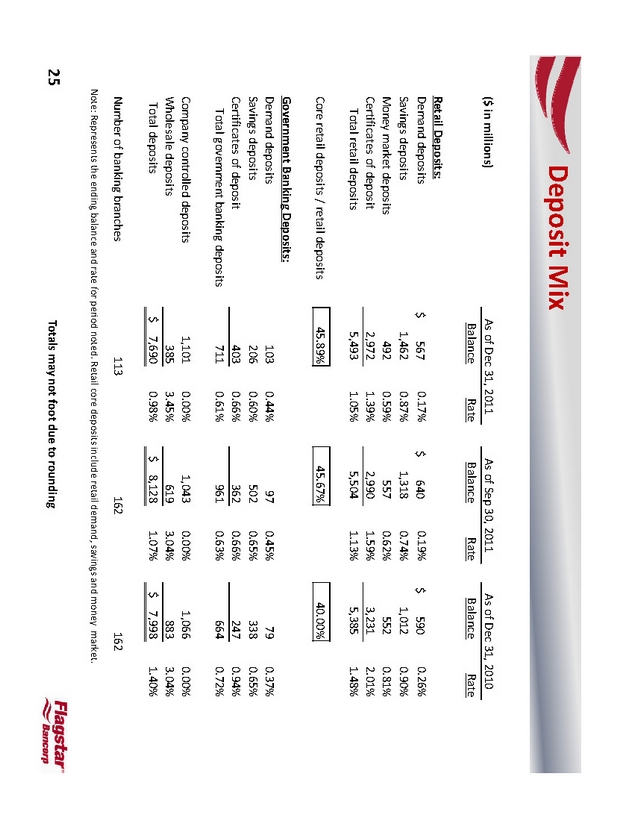
Deposit Mix
($ in millions) As of Dec 31, 2011 As of Sep 30, 2011 As of Dec 31, 2010
Balance Rate Balance Rate Balance Rate
Retail Deposits:
Demand deposits $ 567 0.17% $ 640 0.19% $ 590 0.26%
Savings deposits 1,462 0.87% 1,318 0.74% 1,012 0.90%
Money market deposits 492 0.59% 557 0.62% 552 0.81%
Certificates of deposit 2,972 1.39% 2,990 1.59% 3,231 2.01%
Total retail deposits 5,493 1.05% 5,504 1.13% 5,385 1.48%
Core retail deposits / retail deposits 45.89% 45.67% 40.00%
Government Banking Deposits:
Demand deposits 103 0.44% 97 0.45% 79 0.37%
Savings deposits 206 0.60% 502 0.65% 338 0.65%
Certificates of deposit 403 0.66% 362 0.66% 247 0.94%
Total government banking deposits 711 0.61% 961 0.63% 664 0.72%
Company controlled deposits 1,101 0.00% 1,043 0.00% 1,066 0.00%
Wholesale deposits 385 3.45% 619 3.04% 883 3.04%
Total deposits $ 7,690 0.98% $ 8,128 1.07% $ 7,998 1.40%
Number of banking branches 113 162 162
Note: Represents the ending balance and rate for period noted. Retail core deposits include retail demand, savings and money market.
Totals may not foot due to rounding
25
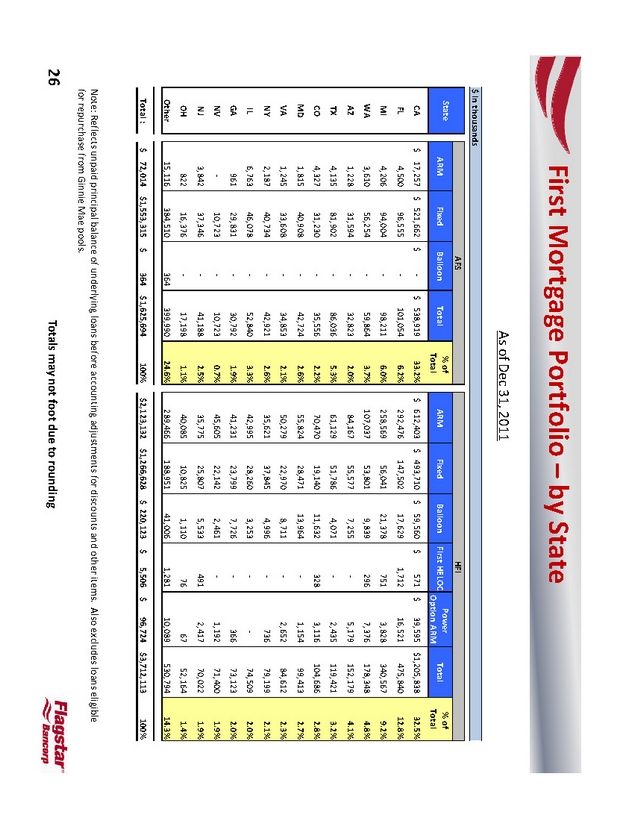
First Mortgage Portfolio – by State
As of Dec 31, 2011
$ in thousands
AFS HFI
State % of Power % of ARM Fixed Balloon Total ARM Fixed Balloon First HELOC Total Total Option ARM Total
CA $ 17,257 $ 521,662 $ $ ?538,919 33.2% $ 612,403 $ 493,710 $ 59,560 $ 571 $ 39,595 $ 1,205,838 32.5% FL 4,500 96,555 101,054 ? 6.2% 292,476 147,502 17,629 1,712 16,521 475,840 12.8% MI 4,206 94,004 98,211 ? 6.0% 258,569 56,041 21,378 751 3,828 340,567 9.2% WA 3,610 56,254 59,864 ? 3.7% 107,037 53,801 9,839 296 7,376 178,348 4.8% AZ 1,228 31,594 32,823 ? 2.0% 84,167 55,577 7,255 5,179 ? 152,179 4.1% TX 4,135 81,902 86,036 ? 5.3% 61,129 51,786 4,071 2,435 ? 119,421 3.2% CO 4,327 31,230 35,556 ? 2.2% 70,470 19,140 11,632 328 3,116 104,686 2.8% MD 1,815 40,908 42,724 ? 2.6% 55,824 28,471 13,964 1,154 ? 99,413 2.7% VA 1,245 33,608 34,853 ? 2.1% 50,279 22,970 8,711 2,652 ? 84,612 2.3% NY 2,187 40,734 42,921 ? 2.6% 35,621 37,845 4,996 736 ? 79,199 2.1% IL 6,763 46,078 52,840 ? 3.3% 42,995 28,260 3,253 ? 74,509 2.0% ?GA 961 29,831 30,792 ? 1.9% 41,231 23,799 7,726 366 ? 73,123 2.0% NV ? 10,723 10,723 ? 0.7% 45,605 22,142 2,461 1,192 ? 71,400 1.9% NJ 3, 842 37, 346 ? 41, 188 2.5% 35, 775417 5, 2, 25, 807 022 70, 533 491 1.9% OH 822 16,376 17,198 ? 1.1% 40,085 10,825 1,110 76 67 52,164 1.4% Other 15,116 384,510 364 399,990 24.6% 289,466 188,951 41,006 1,281 10,089 530,794 14.3%
Total : $ 72,014 $1,553,315 $ 364 $ 1,625,694 100% $ 2,123,132 $1,266,628 $ 220,123 $ 5,506 $ 96,724 $ 3,712,113 100%
Note: Reflects unpaid principal balance of underlying loans before accounting adjustments for discounts and other items. Also excludes loans eligible for repurchase from Ginnie Mae pools.
26
Totals may not foot due to rounding
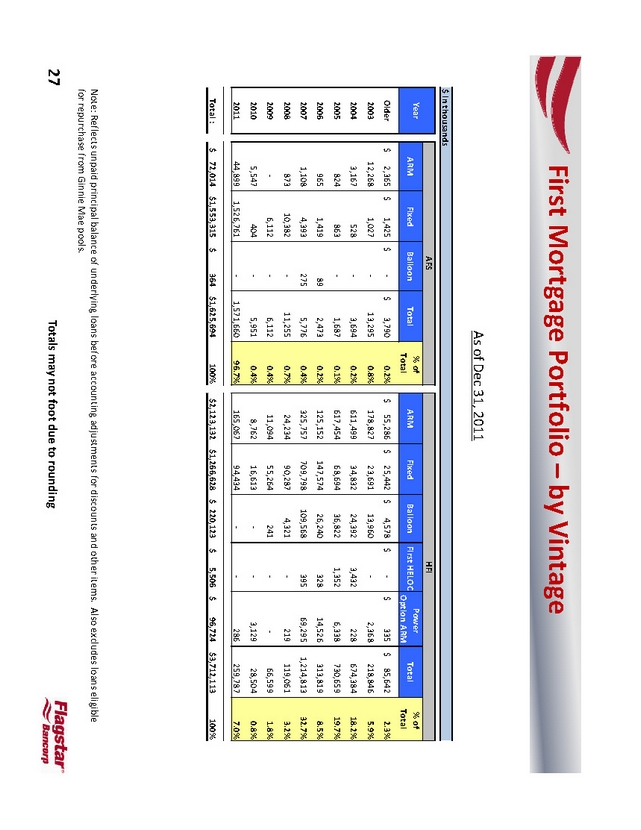
First Mortgage Portfolio – by Vintage
As of Dec 31, 2011
$ in thousands
AFS HFI
Year % of Power % of
ARM Fixed Balloon Total ARM Fixed Balloon First HELOC Total
Total Option ARM Total
Older $ 2,365 $ 1,425 $ $ 3,790 ? 0.2% $ 55,286 $ 25,442 $ 4,578 $ $ ? 335 $ 85,642 2.3%
2003 12,268 1,027 13,295 ? 0.8% 178,827 23,691 13,960 2,368 ? 218,846 5.9%
2004 3,167 528 3,694 0.2% ? 611,499 34,832 24,392 3,432 228 674,384 18.2%
2005 824 863 1,687 0.1% ? 617,454 68,694 36,822 1,352 6,338 730,659 19.7%
2006 965 1,419 89 2,473 0.2% 125,152 147,574 26,240 328 14,526 313,819 8.5%
2007 1,108 4,393 275 5,776 0.4% 325,757 709,798 109,568 395 69,295 1,214,813 32.7%
2008 873 10,382 11,255 ? 0.7% 24,234 90,287 4,321 219 ? 119,061 3.2%
2009 ? 6,112 6,112 ? 0.4% 11,094 55,264 241 ?66,599 1.8% ?
2010 5,547 404 5,951 0.4% ? 8,762 16,613 ? 3,129 ? 28,504 0.8%
2011 44,899 1,526,761 ? 1,571,660 96.7% 165,067 94,434 ? 286 259,787 ? 7.0%
Total : $ 72,014 $1,553,315 $ 364 $ 1,625,694 100% $ 2,123,132 $1,266,628 $ 220,123 $ 5,506 $ 96,724 $ 3,712,113 100%
Note: Reflects unpaid principal balance of underlying loans before accounting adjustments for discounts and other items. Also excludes loans eligible for repurchase from Ginnie Mae pools.
Totals may not foot due to rounding
27
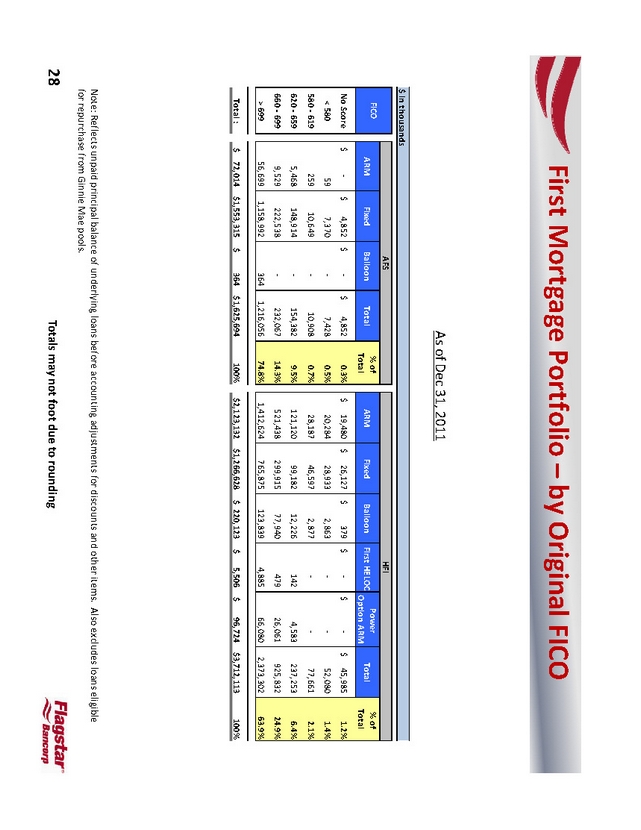
First Mortgage Portfolio – by Original FICO
, As of Dec 31 2011
$ in thousands
AFS HFI
FICO % of Power % of
ARM Fixed Balloon Total ARM Fixed Balloon First HELOC Total
Total Option ARM Total
No Score $ ? $ 4,852 $ $ 4,852 ? 0.3% $ 19,480 $ 26,127 $ 379 $ $ ?$ 45,985 ? 1.2%
< 580 59 7,370 7,428 ? 0.5% 20,284 28,933 2,863 ? 52,080 1.4% ?
580 ? 619 259 10,649 10,908 ? 0.7% 28,187 46,597 2,877 ? 77,661 2.1% ?
620 ? 659 5,468 148,914 154,382? 9.5% 121,120 99,182 12,226 142 4,583 237,253 6.4%
660 ? 699 9, 529 222, 538 232, ?067 14.3% 438 521, 299, 26, 77, 061 940 832 915 925, 479 24.9%
> 699 56,699 1,158,992 364 1,216,056 74.8% 1,412,624 765,875 123,839 4,885 66,080 2,373,302 63.9%
Total : $ 72,014 $1,553,315 $ 364 $ 1,625,694 100% $ 2,123,132 $1,266,628 $ 220,123 $ 5,506 $ 96,724 $ 3,712,113 100%
Note: Reflects unpaid principal balance of underlying loans before accounting adjustments for discounts and other items. Also excludes loans eligible for repurchase from Ginnie Mae pools.
Totals may not foot due to rounding
28
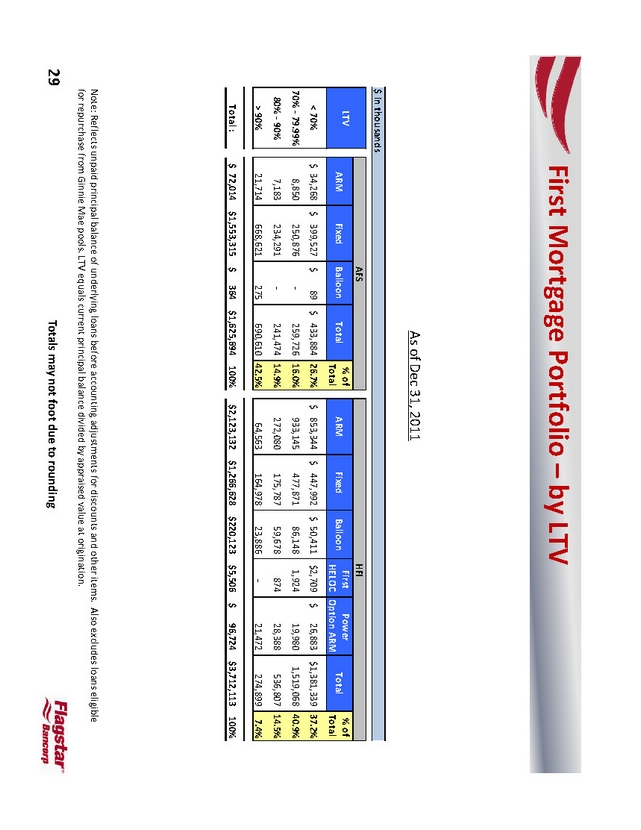
First Mortgage Portfolio – by LTV
As of Dec 31, 2011
$ in thousands
AFS HFI
LTV % of First Power % of
ARM Fixed Balloon Total ARM Fixed Balloon Total
Total HELOC Option ARM Total
< 70% $ 34,268 $ 399,527 $ 89 $ 433,884 26.7% $ 853,344 $ 447,992 $ 50,411 $2,709 $ 26,883 $1,381,339 37.2%
70% ? 79.99% 8,850 250,876 259,726? 16.0% 933,145 477,871 86,148 1,924 19,980 1,519,068 40.9%
80% ? 90% 7, 183 234, 291 241, ?474 14.9% 272, 175, 28, 59, 536, 678 080 807 388 787 874 14.5%
> 90% 21,714 668,621 275 690,610 42.5% 64,563 164,978 23,886 ?21,472 274,899 7.4%
Total : $ 72,014 $ 1,553,315 $ 364 $ 1,625,694 100% $2,123,132 $ 1,266,628 $ 220,123 $ 5,506 $ 96,724 $ 3,712,113 100%
Note: Reflects unpaid principal balance of underlying loans before accounting adjustments for discounts and other items. Also excludes loans eligible for repurchase from Ginnie Mae pools. LTV equals current principal balance divided by appraised value at origination.
Totals may not foot due to rounding
29
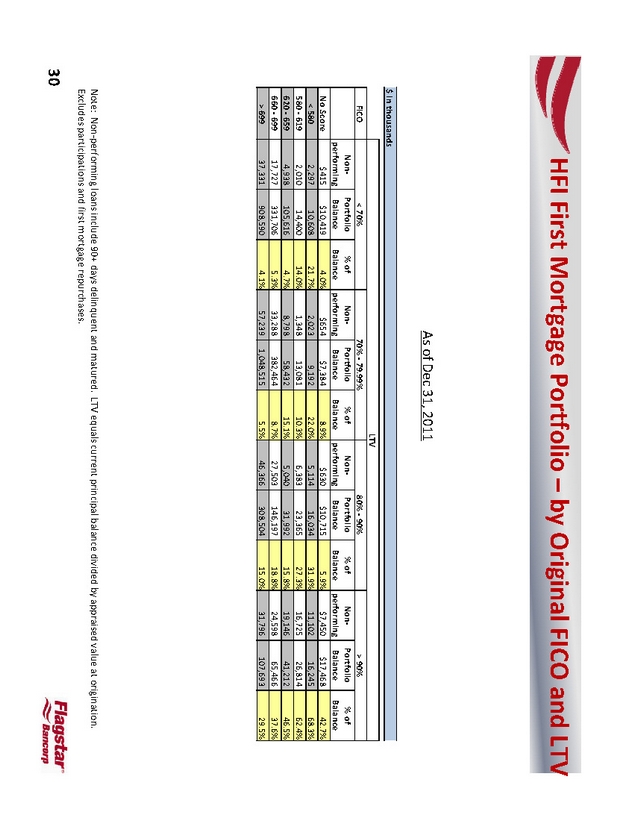
HFI First Mortgage Portfolio – by Original FICO and LTV
As of Dec 31, 2011
$ in thousands
LTV
FICO < 70% 70% ? 79.99% 80% ? 90% > 90%
Non? Portfolio % of Non? Portfolio % of Non? Portfolio % of Non? Portfolio % of
performing Balance Balance performing Balance Balance performing Balance Balance performing Balance Balance
No Score $415 $10,419 4.0% $654 $7,384 8.9% $630 $10,715 5.9% $7,450 $17,468 42.7%
< 580 2,297 10,608 21.7% 2,023 9,192 22.0% 5,114 16,034 31.9% 11,102 16,245 68.3%
580 ? 619 2,010 14,400 14.0% 1,348 13,081 10.3% 6,383 23,365 27.3% 16,725 26,814 62.4%
620 ? 659 4,938 105,616 4.7% 8,798 58,432 15.1% 5,040 31,992 15.8% 19,146 41,212 46.5%
660 ? 699 17,727 331,706 5.3% 33,288 382,464 8.7% 27,503 146,197 18.8% 24,598 65,466 37.6%
> 699 37,331 908,590 4.1% 57,239 1,048,515 5.5% 46,366 308,504 15.0% 31,796 107,693 29.5%
Note: Non? performing loans include 90+ days delinquent and matured. LTV equals current principal balance divided by appraised value at origination. Excludes participations and first mortgage repurchases.
30
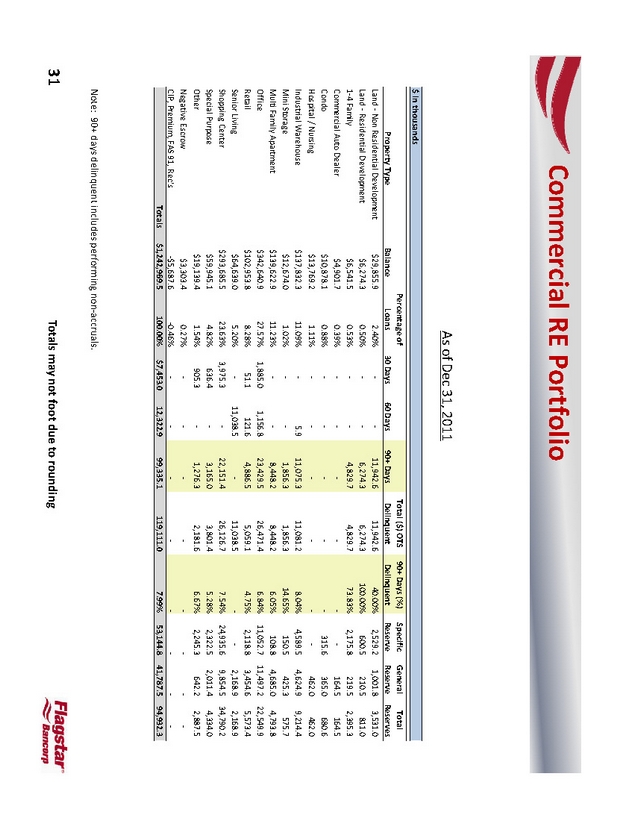
Commercial RE Portfolio
As of Dec 31, 2011
$ in thousands
Percentage of Total ($) OTS 90+ Days (%) Specific General Total
Property Type Balance Loans 30 Days 60 Days 90+ Days Delinquent Delinquent Reserve Reserve Reserves
Land - Non Residential Development $29,855.9 2.40% - 11,942.6 - 11,942.6 40.00% 2,529.2 1,001.8 3,531.0
Land -Residential Development $6,100. 274274274600. 210. 811. 6, .3 .0 6, 3 00% 5 50% 0. 5 3 - -
1- 4 Family $6,541.5 0.53% - 4,829.7 - 4,829.7 73.83% 2,175.8 219.5 2,395.3
Commercial Auto Dealer $4,901.7 0.39% - - - - 164.5 164.5 -
Condo $10,878.1 0.88% - - - -315.6 365.0 680.6 -
Hospital / Nursing $13,769.2 1.11% - - - - 462.0 462.0 -
Industrial Warehouse $137,832.3 11.09% - 5.9 11,075.3 11,081.2 8.04% 4,589.5 4,624.9 9,214.4
Mini Storage $12,674.0 1.02% - 1,856.3 - 1,856.3 14.65% 150.5 425.3 575.7
Multi Family Apartment $139,622.9 11.23% - 8,448.2 - 8,448.2 6.05% 108.8 4,685.0 4,793.8
Office $342,640.9 27.57% 1,885.0 1,156.8 23,429.5 26,471.4 6.84% 11,052.7 11,497.2 22,549.9
Retail $102,953.8 8.28% 51.1 121.6 4,886.5 5,059.1 4.75% 2,118.8 3,454.6 5,573.4
Senior Living $64,639.0 5.20% - 11,038.5 -11,038.5 2,168.9 - 2,168.9 -
Shopping Center $293,685.5 23.63% 3,975.3 22,151.4 - 26,126.7 7.54% 24,935.6 9,854.5 34,790.2
Special Purpose $59,945.1 4.82% 636.4 3,165.0 - 3,801.4 5.28% 2,322.5 2,011.4 4,334.0
Other $19, 4 1. 54% 905. 3887.139.2, 181.6. 2, 2453 .5 642. 2, 6 3 2 67% 1, - 276
Negative Escrow $3,303.4 0.27% - - - - -
CIP, Premium, FAS 91, Rec’s - $5,687.6 - 0.46% - - - - -
Totals $1,242,969.5 100.00% $7,453.0 12,322.9 99,335.1 119,111.0 7.99% 53,144.8 41,787.5 94,932.3
Note: 90+ days delinquent includes performing non- accruals.
Totals may not foot due to rounding
31
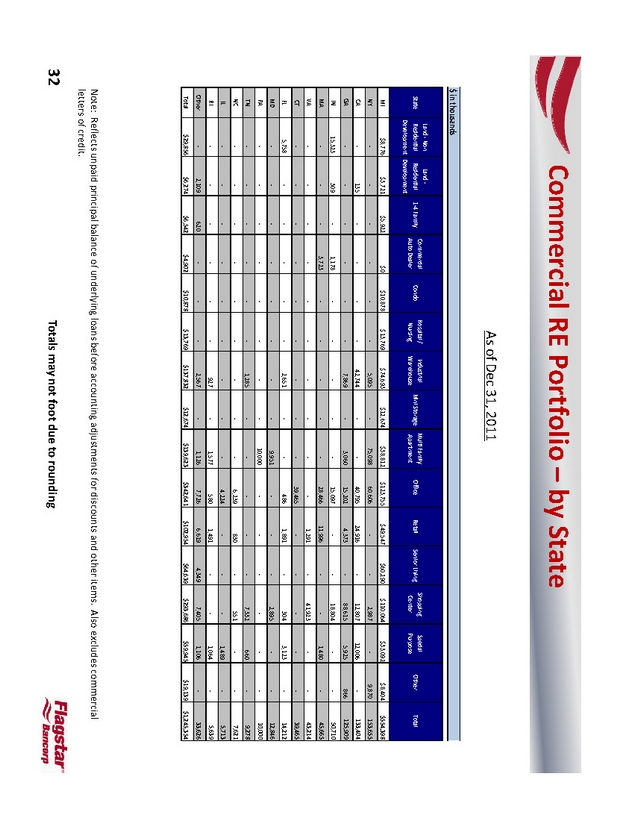
Commercial RE Portfolio – by State
As of Dec 31, 2011
$ in thousands
Land - Non Land - Commercial Hospital / Industrial Multi Family Shopping Special
State Residential Residential 1- 4 Family Auto Dealer Condo Nursing Warehouse Mini Storage Apartment Office Retail Senior Living Center Purpose Other Total
Development Development
MI $8,776 $3,721 $5,922 $0 $10,878 $13,769 $74,693 $12,674 $38,812 $123,755 $49,547 $60,290 $110,064 $33,092 $8,404 $554,398
NY - - - - 5,095 - - 75,098 -60,606 - 2,987 - 9,870 - 153,655
CA - 135 - - 42,744 - - - 40,795 24,916 - 12,807 - 12,006 133,404 -
GA - - - - 7,869 - - 3,060 -15,202 4,373 88,615 -5,925 866 125,909
IN 15,323 309 1,178 - - - - 15,097 - - - 18,804 - - 50,710
MA - 3,723 - - - - - 28,466 - 11,996 - - 1,480 - 45,665 -
VA - - - - - - - - 1,291 - - 41,923 - - 43,214
CT - - - - - - - 39,465 - - - - - 39,465 -
FL 5,758 - - - 2,651 - - - 486 1,891 - 304 - 3,123 14,212 -
MD - - - - - - 9,951 - - - 2,895 - - -12,846
PA - - - - - - 10,000 - - - - - - 10,000 -
TN - - - - 1,285 - - - - - 7,332 - 660 - 9,278
NC - - - - - - - 6,239 - 830 - 551 - 7,621 -
IL - - - - - - - 4,224 - - - 1,489 - - 5,713 -
RI - - - - 927 - - 1,577 580 - 1,491 -1,064 - 5,639 -
Other - 2, 109 620 - 2, -567 - 7, 1, 7, 1, 4, 349 405 126 726 6, 619 106 - 33,626 -
Total $29,856 $6,274 $6,542 $4,902 $10,878 $13,769 $137,832 $12,674 $139,623 $342,641 $102,954 $64,639 $293,686 $59,945 $19,139 $1,245,354
Note: Reflects unpaid principal balance of underlying loans before accounting adjustments for discounts and other items. Also excludes commercial letters of credit.
Totals may not foot due to rounding
32
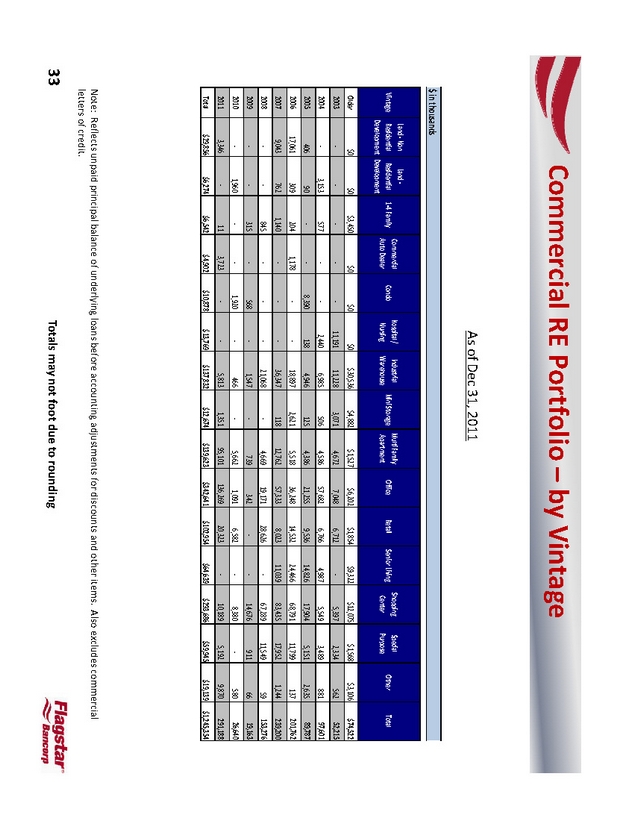
Commercial RE Portfolio – by Vintage
As of Dec 31, 2011
$ in thousands
Land - Non Land - Commercial Hospital / Industrial Multi Family Shopping Special
Vintage Residential Residential 1- 4 Family Auto Dealer Condo Nursing Warehouse Mini Storage Apartment Office Retail Senior Living Center Purpose Other Total
Development Development
Older $0 $0 $3,450 $0 $0 $0 $30,536 $4,882 $1,527 $6,202 $1,854 $9,322 $12,075 $1,568 $3,106 $74,522
2003 - - - 11,191 - 11,228 - 3,071 4,672 7,048 6,712 5,397 -2,334 562 52,215
2004 - 3,153 577 2,440 - 6,985 - 506 4,586 57,682 6,766 4,987 5,549 3,489 881 97,601
2005 406 90 8,390 - 138 - 4,946 125 4,386 21,255 9,536 14,826 17,904 5,151 2,635 89,787
2006 17,061 309 204 1,178 -18,897 2,621 - 5,518 36,248 14,532 24,466 68,791 11,799 137 201,762
2007 9, 043 762 1, 140 - 83, 57, 039 8, 12, 11, 435 17, 1, 347 023 36, 244 762 952 333 - - 118 239,200
2008 - 845 - - 21,068 - - 4,669 - 19,171 28,626 67,289 - 11,549 59 153,276
2009 - 315 - 568 - 1,547 - 739 - 342 14,676 - 911 - 66 19,163
2010 - 1,960 -1,920 - 466 - 5,662 1,091 - 6,582 8,380 - 580 -26,640
2011 3,346 11 -3,723 -5,813 1,351 - 95,101 136,269 20,323 10,189 - 5,192 9,870 291,188
Total $29,856 $6,274 $6,542 $4,902 $10,878 $13,769 $137,832 $12,674 $139,623 $342,641 $102,954 $64,639 $293,686 $59,945 $19,139 $1,245,354
Note: Reflects unpaid principal balance of underlying loans before accounting adjustments for discounts and other items. Also excludes commercial letters of credit.
Totals may not foot due to rounding
33
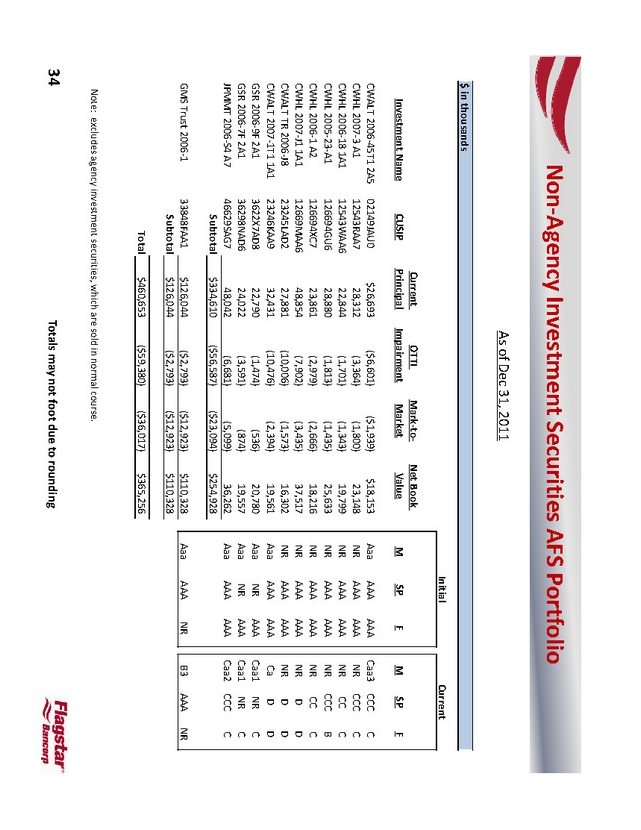
Non- Agency Investment Securities AFS Portfolio
As of Dec 31, 2011
$ in thousands
Initial Current
Current OTTI Mark- to- Net Book
Investment Name CUSIP Principal Impairment Market Value M SP F M SP F
CWALT 2006- 45T1 2A5 02149JAU0 $26,693 ($6,601) ($1,939) $18,153 Aaa AAA AAA Caa3 CCC C
CWHL 2007- 3 A1 12543RAA7 28,312 (3,364) (1,800) 23,148 NR AAA AAA NR CCC C
CWHL 2006- 18 1A1 12543WAA6 22,844 (1,701) (1,343) 19,799 NR AAA AAA NR CC C
CWHL 2005- 23- A1 126694GU6 28,880 (1,813) (1,435) 25,633 NR AAA AAA NR CCC B
CWHL 2006- 1 A2 126694XC7 23,861 (2,979) (2,666) 18,216 NR AAA AAA NR CC C
CWHL 2007- J1 1A1 12669MAA6 48,854 (7,902) (3,435) 37,517 NR AAA AAA NR D D
CWALT TR 2006- J8 23245LAD2 27,881 (101 ,) 573,006) ( 16,302 NR AAA AAA NR D D
CWALT 2007- 1T1 1A1 23246KAA9 32,431 (10,476) (2,394) 19,561 Aaa AAA AAA Ca D D
GSR 2006- 9F 2A1 3622X7AD8 22,790 (1,474) (536) 20,780 Aaa NR AAA Caa1 NR C
GSR 2006- 7F 2A1 36298NAD6 24,022 (3,591) (874) 19,557 Aaa NR AAA Caa1 NR C
JPMMT 2006- S4 A7 46629SAG7 48,042 (6,681) (5,099) 36,262 Aaa AAA AAA Caa2 CCC C
Subtotal $334,610 ($56,587) ($23,094) $254,928
GMS Trust 2006- 1 33848FAA1 $126,044 ($2,793) ($12,923) $110,328 Aaa AAA NR B3 AAA NR
Subtotal $126,044 ($2,793) ($12,923) $110,328
Total $460,653 ($59,380) ($36,017) $365,256
Note: excludes agency investment securities, which are sold in normal course.
Totals may not foot due to rounding
34
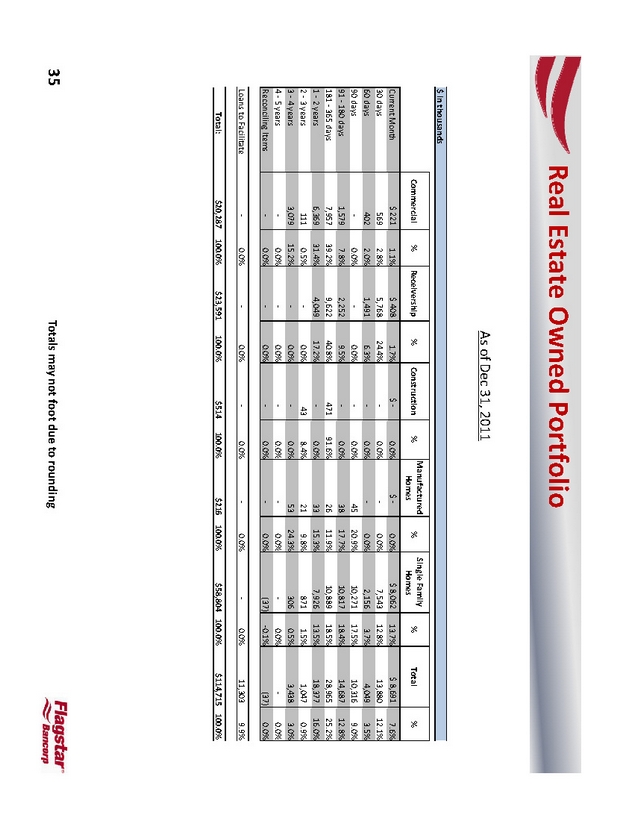
Real Estate Owned Portfolio
As of Dec 31, 2011
$ in thousands
Manufactured Single Family
Commercial % Receivership % Construction % % % Total %
Homes Homes
Current Month $ 221 1.1% $ 408 1.7% $ - 0.0% $ - 0.0% $ 8,062 13.7% $ 8,691 7.6%
30 days 569 2.8% 5,768 24.4% - 0.0% - 0.0% 7,543 12.8% 13,880 12.1%
60 days 402 2.0% 1,491 6.3% - 0.0% - 0.0% 2,156 3.7% 4,049 3.5%
90 days - 0.0% - 0.0% - 0.0% 45 20.9% 10,271 17.5% 10,316 9.0%
91 - 180 days 1,579 7.8% 2,252 9.5% - 0.0% 38 17.7% 10,817 18.4% 14,687 12.8%
181 - 365 days 7,957 39.2% 9,622 40.8% 471 91.6% 26 11.9% 10,889 18.5% 28,965 25.2%
1 | | - 2 years 6,369 31.4% 4,049 17.2% - 0.0% 33 15.3% 7,926 13.5% 18,377 16.0% |
2 | | - 3 years 111 0.5% - 0.0% 43 8.4% 21 9.8% 871 1.5% 1,047 0.9% |
3 | | - 4 years 3,079 15.2% - 0.0% - 0.0% 53 24.3% 306 0.5% 3,438 3.0% |
4 | | - 5 years - 0. - 0.0% 0. 0. 0% 0. 0. 0% 0% 0% 0% - - - - |
Reconciling Items - 0.0% - 0.0% - 0.0% - 0.0% (37) 0.1% (37) 0.0% -
Loans to Facilitate - 0.0% - 0.0% - 0.0% - 0.0% - 0.0% 11,303 9.9%
Total: $20,287 100.0% $23,591 100.0% $514 100.0% $216 100.0% $58,804 100.0% $114,715 100.0%
Totals may not foot due to rounding
35
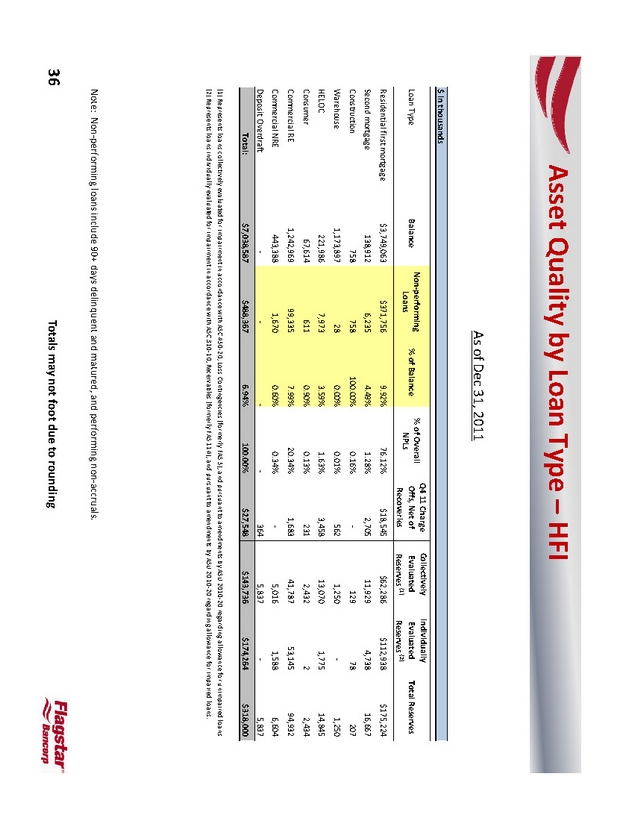
Asset Quality by Loan Type – HFI
As of Dec 31, 2011
$ in thousands
Non- performing % of Overall Q4 11 Charge Collectively Individually
Loan Type Balance Loans % of Balance NPLs Offs, Net of Evaluated Evaluated Total Reserves
Recoveries Reserves (1) Reserves (2)
Residential first mortgage $3,749,063 $371,756 9.92% 76.12% $18,545 $62,286 $112,938 $175,224
Second mortgage 138,912 6,235 4.49% 1.28% 2,705 11,929 4,738 16,667
Construction 758 758 100.00% 0.16% - 129 78 207
Warehouse 1,173,897 28 0.00% 0.01% 562 1,250 1,250 -
HELOC 221,986 7,973 3.59% 1.63% 3,458 13,070 1,775 14,845
Consumer 67,614 611 0.90% 0.13% 231 2,432 2 2,434
Commercial RE 1,242,969 99,335 7.99% 20.34% 1,683 41,787 53,145 94,932
Commercial NRE 443,388 1,670 0.60% 0.34% - 5,016 1,588 6,604
Deposit Overdraft - - 364 - 5,837 - 5,837 -
Total: $7,038,587 $488,367 6.94% 100.00% $27,548 $143,736 $174,264 $318,000
(1) Represents loans collectively evaluated for impairment in accordance with ASC 450- 20, Loss Contingencies (formerly FAS 5), and pursuant to amendments by ASU 2010- 20 regarding allowance for unimpaired loans (2) Represents loans individually evaluated for impairment in accordance with ASC 310- 10, Receivables (formerly FAS 114), and pursuant to amendments by ASU 2010- 20 regarding allowance for impaired loans.
Note: Non- performing loans include 90+ days delinquent and matured, and performing non- accruals.
Totals may not foot due to rounding
36
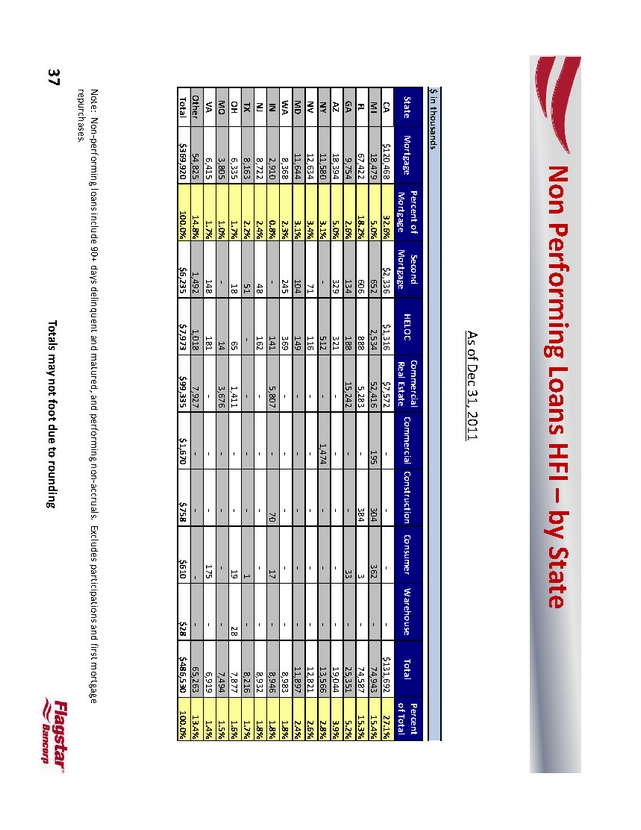
Non Performing Loans HFI – by State
As of Dec 31, 2011
$ in thousands
Percent of Second Commercial Percent
State Mortgage HELOC Commercial Construction Consumer Warehouse Total
Mortgage Mortgage Real Estate of Total
CA $120,468 32.6% $2,336 $1,316 $7,572 - - $131,692 - 27.1% -
MI 18,479 5.0% 652 2,534 52,416 195 304 362 74,943 15.4% -
FL 67, 422 18.2% 606 5, 587 74, 283 888 384 - 3 15.3% -
GA 9,754 2.6% 134 188 15,242 - 33 - 25,351 5.2% -
AZ 18,394 5.0% 329 321 - - - 19,044 - 3.9% -
NY 11,580 3.1% - 512 1,474 - - 13,566 - 2.8% -
NV 12,634 3.4% 71 116 - - - 12,821 - 2.6% -
MD 11,644 3.1% 104 149 - - - 11,897 - 2.4% -
WA 8,368 2.3% 245 369 - - - - 8,983 - 1.8%
IN 2,910 0.8% - 141 5,807 70 - 17 8,946 1.8% -
NJ 8,722 2.4% 48 162 - - - 8,932 - 1.8% -
TX 8,163 2.2% 51 - - -1 - 8,216 1.7% -
OH 6,335 1.7% 18 65 1,411 - 19 -28 7,877 1.6%
MO 3,805 1.0% - 14 3,676 - - 7,494 - 1.5% -
VA 6,415 1.7% 148 181 - - 175 - 6,919 1.4% -
Other 54, 825 14.8% 1, 492 1, 018 7, 927 263 - - 65, - 13.4% -
Total $369,920 100.0% $6,235 $7,973 $99,335 $1,670 $758 $610 $28 $486,530 100.0%
Note: Non- performing loans include 90+ days delinquent and matured, and performing non- accruals. Excludes participations and first mortgage repurchases.
Totals may not foot due to rounding
37
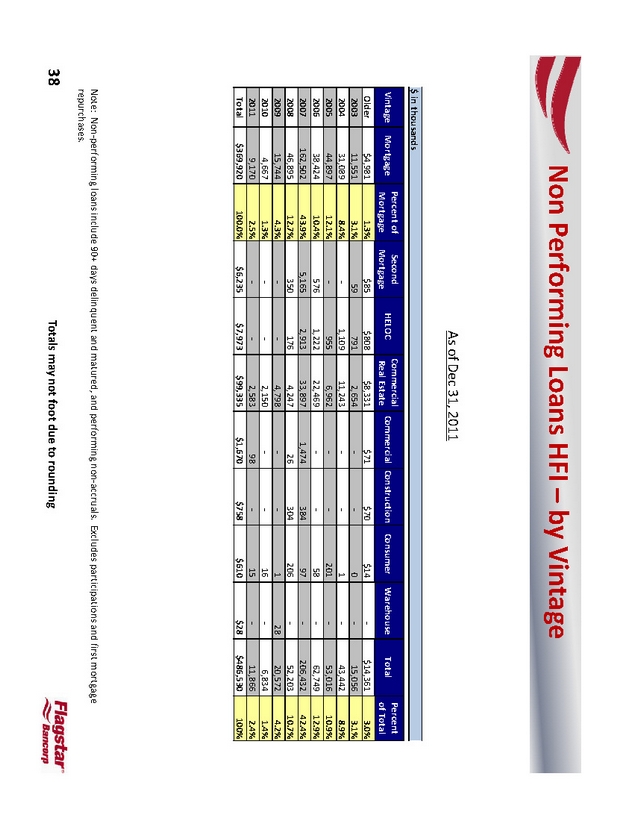
Non Performing Loans HFI – by Vintage
As of Dec 31, 2011
$ in thousands
Percent of Second Commercial Percent
Vintage Mortgage HELOC Commercial Construction Consumer Warehouse Total
Mortgage Mortgage Real Estate of Total
Older $4,981 1.3% $85 $808 $8,331 $71 $70 $14 - $14,361 3.0%
2003 11,551 3.1% 59 791 2,654 - 0 - 15,056 3.1%
2004 31,089 8.4% - 1,109 11,243 - 1 - 43,442 8.9%
2005 44,897 12.1% - 955 6,962 - 201 - 53,016 10.9% -
2006 38,424 10.4% 576 1,222 22,469 - 58 - 62,749 12.9% -
2007 162,502 43.9% 5,165 2,913 33,897 1,474 384 97 206,432 42.4% -
2008 46,895 12.7% 350 176 4,247 26 304 206 52,203 10.7% -
2009 15, 744 4.3% - 20, 798 4, 572 - - 1 - 28 4.2%
2010 4,667 1.3% - 2,150 - - 16 - 6,834 1.4% -
2011 9,170 2.5% - 2,583 - 98 15 - 11,866 2.4% -
Total $369,920 100.0% $6,235 $7,973 $99,335 $1,670 $758 $610 $28 $486,530 100%
Note: Non- performing loans include 90+ days delinquent and matured, and performing non- accruals. Excludes participations and first mortgage repurchases.
Totals may not foot due to rounding
38
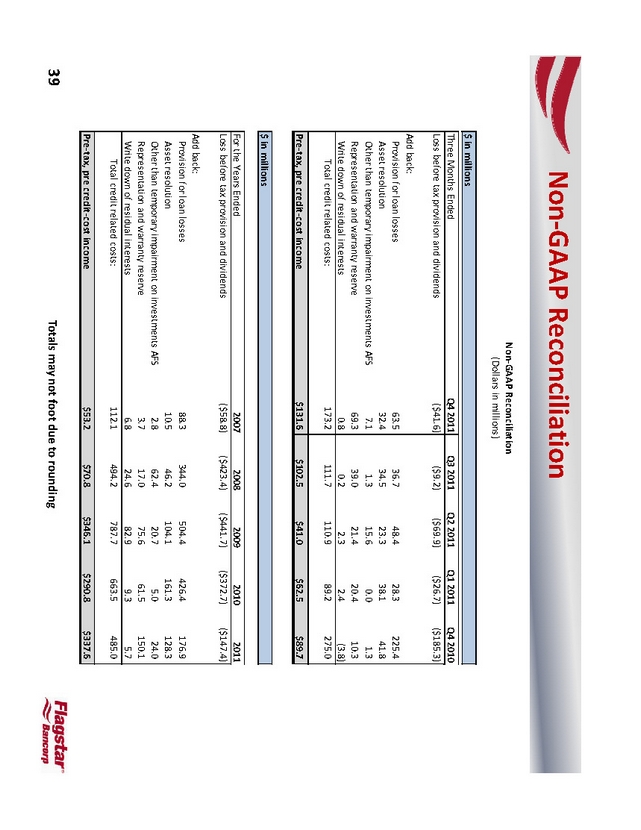
Non- GAAP Reconciliation
Non- GAAP Reconciliation
(Dollars in millions)
$ in millions
Three Months Ended Q4 2011 Q3 2011 Q2 2011 Q1 2011 Q4 2010
Loss before tax provision and dividends ($41.6) ($9.2) ($69.9) ($26.7) ($185.3)
Add back:
Provision for loan losses 63.5 36.7 48.4 28.3 225.4
Asset resolution 32.4 34.5 23.3 38.1 41.8
Other than temporary impairment on investments AFS 7.1 1.3 15.6 0.0 1.3
Representation and warranty reserve 69.3 39.0 21.4 20.4 10.3
Write down of residual interests 0.8 0.2 2.3 2.4 (3.8)
Total credit related costs: 173.2 111.7 110.9 89.2 275.0
Pre- tax, pre credit- cost income $131.6 $102.5 $41.0 $62.5 $89.7
$ in millions
For the Years Ended 2007 2008 2009 2010 2011
Loss before tax provision and dividends ($58.8) ($423.4) ($441.7) ($372.7) ($147.4)
Add back:
Provision for loan losses 88.3 344.0 504.4 426.4 176.9
Asset resolution 10.5 46.2 104.1 161.3 128.3
Other than temporary impairment on investments AFS 2.8 62.4 20.7 5.0 24.0
Representation and warranty reserve 3.7 17.0 75.6 61.5 150.1
Write down of residual interests 6.8 24.6 82.9 9.3 5.7
Total credit related costs: 112. 494. 2 787.663. 485. 1 7 0 5
Pre- tax, pre credit- cost income $53.2 $70.8 $346.1 $290.8 $337.6
Totals may not foot due to rounding
39
Non- GAAP Reconciliation
Non- GAAP Reconciliation
(Dollars in millions)
$ in millions
12/31/2011 9/30/2011 12/31/2010
Non- performing assets $ 603.1 $ 558.3 $ 498.0
Tier 1 Capital $ 1,248.5 $ 1,273.9 $ 1,306.1
Allowance for Loan Losses $ 318.0 $ 282.0 $ 274.0
Tier 1 Capital + Allowance for Loan Losses $ 1,566.5 $ 1,555.9 $ 1,580.1
Non- performing assets / Tier 1 Capital + Allowance for Loan
Losses 38.50% 35.88% 31.52%
Totals may not foot due to rounding
40
Non- GAAP Reconciliation
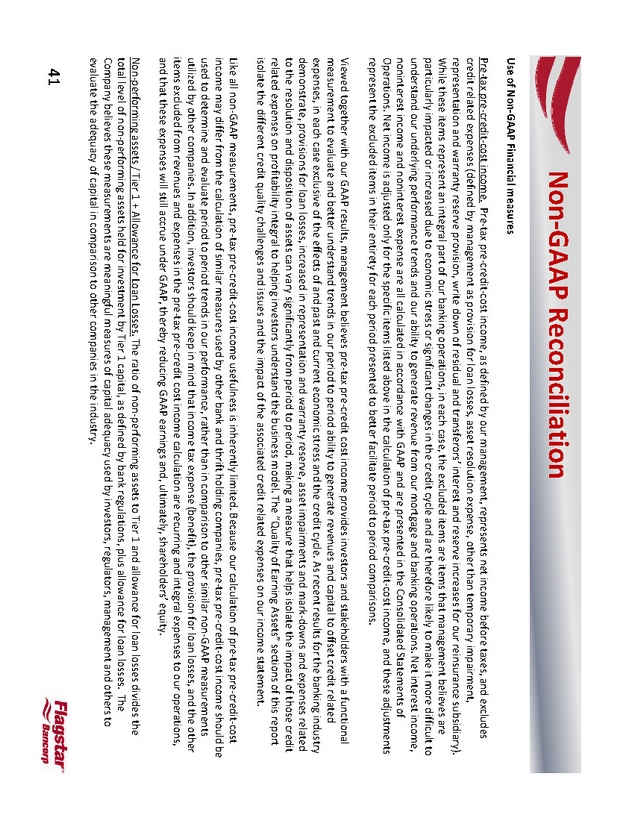
Use of Non- GAAP Financial measures
Pre- tax pre- credit- cost income. Pre- tax pre- credit- cost income, as defined by our management, represents net income before taxes, and excludes credit related expenses (defined by management as provision for loan losses, asset resolution expense, other than temporary impairment, representation and warranty reserve provision, write down of residual and transferors’ interest and reserve increases for our reinsurance subsidiary) . While these items represent an, , operations case integral part of our banking in each the excluded items are items that management believes are particularly impacted or increased due to economic stress or significant changes in the credit cycle and are therefore likely to make it more difficult to understand our underlying performance trends and our ability to generate revenue from our mortgage and banking operations. Net interest income, noninterest income and noninterest expense are all calculated in accordance with GAAP and are presented in the Consolidated Statements of Operations. Net income is adjusted only for the specific items listed above in the calculation of pre- tax pre- credit- cost income, and these adjustments represent the excluded items in their entirety for each period presented to better facilitate period to period comparisons.
Viewed together with our GAAP results, management believes pre- tax pre- credit cost income provides investors and stakeholders with a functional measurement to evaluate and better understand trends in our period to period ability to generate revenues and capital to offset credit related expenses, in each case exclusive of the effects of and past and current economic stress and the credit cycle. As recent results for the banking industry demonstrate, provisions for loan losses, increased in representation and warranty reserve, asset impairments and mark- downs and expenses related to the resolution and disposition of assets can vary significantly from period to period, making a measure that helps isolate the impact of those credit related expenses on profitability integral to helping investors understand the business model. The “Quality of Earning Assets” sections of this report isolate the different credit quality challenges and issues and the impact of the associated credit related expenses on our income statement.
Like all non- GAAP measurements, pre- tax pre- credit- cost income usefulness is inherently limited. Because our calculation of pre- tax pre- credit- cost income may differ from the calculation of similar measures used by other bank and thrift holding companies, pre- tax pre- credit- cost income should be used to determine and evaluate period to period trends in our performance, rather than in comparison to other similar non- GAAP measurements utilized by other companies. In addition, investors should keep in mind that income tax expense (benefit), the provision for loan losses, and the other items excluded from revenues and expenses in the pre- tax pre- credit cost income calculation are recurring and integral expenses to our operations, and that these expenses will still accrue under GAAP, thereby reducing GAAP earnings and, ultimately, shareholders’ equity.
Non- performing assets / Tier 1 + Allowance for Loan Losses. The ratio of non- performing assets to Tier 1 and allowance for loan losses divides the total level of non- performin g assets held for investment by Tier 1 capital as defined by bank regulations, , plus allowance for loan losses. The Company believes these measurements are meaningful measures of capital adequacy used by investors, regulators, management and others to evaluate the adequacy of capital in comparison to other companies in the industry.
41

FBC


