
FOIA Confidential Treatment Request
Confidential Treatment Requested by Flagstar Bancorp, Inc.
October 3, 2014
VIA EDGAR SUBMISSION
Mr. John P. Nolan
Senior Assistant Chief Accountant
Division of Corporation Finance
Securities and Exchange Commission
100 F Street, NE
Washington, D.C. 20549
| Re: | Flagstar Bancorp, Inc. |
Form 10-K for the period ended December 31, 2013
Filed March 5, 2014
Form 10-Q for the period ended March 31, 2014
Filed May 9, 2014
Form 10-Q for the period ended June 30, 2014
Filed July 29, 2014
File No. 001-16577
Dear Mr. Nolan:
Flagstar Bancorp, Inc. (“Flagstar”, the “Company”, “we” or “our”) is submitting this letter in response to the comment letter dated September 19, 2014 (the “Comment Letter”) from the staff of the Securities and Exchange Commission (“Staff”) concerning Flagstar’s Annual Report on Form 10-K for the year ended December 31, 2013, Periodic Report on Form 10-Q for the period ended March 31, 2014, and Periodic Report on Form 10-Q for the period ended June 30, 2014. To facilitate the Staff’s review, we have included the captions and numbered comments from the Comment Letter in bold text and have provided the Company’s response immediately following each numbered comment. In response to certain of the comments, we have provided confirmation that we will supplement our disclosures in future filings in an effort to address the Staff’s comments.
For reasons of business confidentiality, in a separate letter dated the date hereof, we requested that certain information in this letter in the Company’s response to comment 1 not be disclosed in response to any request made under the Freedom of Information Act, 5 U.S.C.A §552 or otherwise. Accordingly, pursuant to Rule 83 of the Commission’s Rules on Information and Requests (17 C.F.R. § 200.83), a complete copy of this letter will be provided only in paper form and not electronically as correspondence under the SEC’s EDGAR system. Omitted information has been replaced in this letter as filed via the EDGAR system with a placeholder identified by the mark “[***].”
Mr. John P. Nolan, Senior Assistant Chief Accountant
Securities and Exchange Commission
October 3, 2014
Page 2 - Confidential Treatment Requested by Flagstar Bancorp, Inc.
December 31, 2013 Form 10-K
Management’s Discussion and Analysis
Provision (Benefit) for Federal Income Taxes, page 79
Comment No. 1.a.:
We note your disclosure related to the reversal of your deferred tax asset allowance.
In determining the need for a valuation allowance, and considering the guidance in paragraphs 21 – 23 of ASC
740-10-30, please provide us with the following information to support the realizability of the net deferred tax asset at December 31, 2013.
| a. | You disclose that you adjusted historical losses for items that you believe are not indicative of your ability to generate taxable income after applying those items. Please provide us your analysis of cumulative recent losses that you relied upon in your assessment. If not included in your analysis, please provide a reconciliation of your 2013, 2012 and 2011 US GAAP income and clearly explain each significant adjustment. Also, provide us any accounting guidance which you believe supports adjusting historical losses when assessing cumulative losses in recent years. |
Response No. 1.a.:
At December 31, 2013, Flagstar had deferred tax assets that consisted primarily of: (i) tax loss carry forwards, and (ii) temporary differences primarily attributable to allowance for loan and lease losses (“ALLL”) and various other reserves. Flagstar concluded that, for the period ending December 31, 2013, the available positive evidence outweighed all available negative evidence and, therefore, it was more likely than not that Flagstar would realize its deferred tax assets (See ASC 740-10-30-17). This determination required significant judgment, and the Company drew its conclusion based upon extensive analysis to assess the relative impact of all available evidence, both positive and negative.
We focused a great deal of our analysis on ASC 740-10-30-21, which provides that cumulative losses in recent years are one type of negative evidence for entities to consider in evaluating the need for a valuation allowance, and such negative evidence is difficult to overcome. While the term “cumulative losses in recent years” is not specifically defined in ASC 740, the Company believes that, when applying the guidance (see ASC 740-10-30-22c), cumulative pre-tax losses for the most recent period and the preceding two years should be adjusted for permanent book/tax differences and certain non-recurring items that, in our judgment, are not indicative of future operations. Refer to Appendix A for additional accounting firm published literature that supports adjusting historical losses when assessing cumulative losses in recent years, which we utilized in performing the assessment.
We believed that, in our case, the negative evidence associated with our three-year cumulative loss could be overcome because our cumulative loss was the result of specific non-recurring items and fixed costs that were eliminated for future periods. Therefore, we believed we could rely on projections of future income.
Mr. John P. Nolan, Senior Assistant Chief Accountant
Securities and Exchange Commission
October 3, 2014
Page 3 - Confidential Treatment Requested by Flagstar Bancorp, Inc.
By way of elaboration, Flagstar has consistently analyzed its income on a rolling 12 quarter cumulative basis. We have summarized this quarterly analysis by annual period in the reconciliation of 2013, 2012 and 2011 U.S. GAAP income as follows:
(in thousands) | 12/31/2011 | 12/31/2012 | 12/31/2013 | Total | ||||||||||||
Pre-tax Book Income (Loss) | (180,722 | ) | 52,731 | (149,263 | ) | (277,254 | ) | |||||||||
Permanent Book/Tax Adjustments | (2,391 | ) | 13,618 | 1,769 | 12,996 | |||||||||||
Other Comprehensive Income - Mark-to-Market (Permanent Book/Tax Adjustment) | 8,346 | 26,041 | (1,275 | ) | 33,112 | |||||||||||
|
|
|
|
|
|
|
| |||||||||
Subtotal | (174,767 | ) | 92,390 | (148,769 | ) | (231,146 | ) | |||||||||
Nonrecurring Items | ||||||||||||||||
MBIA/Assured Litigation Accrual | — | 227,882 | — | 227,882 | ||||||||||||
MBIA/Assured Insurance Proceeds | (49,938 | ) | (39,184 | ) | (12,476 | ) | (101,598 | ) | ||||||||
Disposal of GA and IN Banking Centers | (15,100 | ) | — | — | (15,100 | ) | ||||||||||
Legal Settlement – DOJ | 33,300 | 800 | 73,900 | 108,000 | ||||||||||||
FHLB Interest Expense Adj. | 77,568 | 57,338 | 71,990 | 206,896 | ||||||||||||
FHLB Prepayment Expense | — | — | 177,556 | 177,556 | ||||||||||||
|
|
|
|
|
|
|
| |||||||||
Total Adjusted Pre-Tax Book Income | (128,937 | ) | 339,226 | 162,201 | 372,490 | |||||||||||
|
|
|
|
|
|
|
| |||||||||
As the starting point, the Company generated $(277) million of pre-tax book losses over the rolling 3-year period. We first adjusted these losses for permanent tax items. We then adjusted both positive and negative nonrecurring items from Q1 2011 through Q4 of 2013, as required by ASC 740-10-30-22c. The most significant nonrecurring items, which were eliminated to arrive at the cumulative adjusted income are, described below:
| • | MBIA Insurance Corporation (“MBIA”)/Assured Litigation Accrual: On January 11, 2013, MBIA filed a complaint against Company subsidiary, Flagstar Bank, FSB (the “Bank”) alleging certain breaches of various loan level representations and warranties related to mortgage loans insured by MBIA, and seeking relief for breach of contract, as well as full indemnification and reimbursement of amounts that MBIA had paid and was expected to pay under certain insurance policies, plus interest and costs. In a separate matter also alleging representation and warranty breaches related to insurance provided to cover pools of mortgage loans, on February 5, 2013, the U.S. District Court for the Southern District of New York issued a decision in favor of Assured |
Mr. John P. Nolan, Senior Assistant Chief Accountant
Securities and Exchange Commission
October 3, 2014
Page 4 - Confidential Treatment Requested by Flagstar Bancorp, Inc.
Guaranty Municipal Corp (“Assured”) against the Bank. Following the Court’s decision in the Assured case, and given the similarity of the facts and circumstances underlying the two lawsuits, the Company increased its accrual for pending and threatened litigation by approximately $228 million in Q4 2012. Each of these litigation matters resulted in negotiated settlements in connection with a very limited population of private label securitizations. The Company has issued no other private label securitizations, and currently has no plans to issue such securitizations in the future. Given these circumstances, no similar litigation or settlement is expected to recur in future years and thus, these losses were excluded in adjusting Company’s pre-tax income. |
| • | MBIA/Assured Insurance Proceeds: The litigation settlements discussed above are associated with the recovery of certain insurance and interest payments by both MBIA and Assured. The insurance proceeds and interest that were received within the three-year window of our analysis total $101.6 million. For the reasons discussed above, the income was excluded as a nonrecurring item as it is not reflective of future operations. |
| • | Sale of Georgia and Indiana Banking Centers: During Q4 2011, the Bank completed the sales of 27 banking centers in Georgia and 22 banking centers in Indiana to PNC and First Financial, respectively. With respect to the Georgia sale, PNC paid Flagstar the net carrying value of the acquired real estate and fixed and other personal assets associated with the branches ( no gain realized). Under the Indiana sale, First Financial paid the Company a consideration of a 7% premium on the consumer and commercial deposits for a gain of $22.1 million. As this sale is not reflective of our future operations, the gain was excluded in adjusting our pre-tax income. Additionally, these banking centers generated a 2011 operating loss of approximately $7 million. Since these branches were sold and the related losses are not indicative of our future earnings, these losses were also excluded in adjusting the pre-tax income amounts for a net adjustment of $(15.1) million. |
| • | Department of Justice Settlement: In 2011, the U.S. Department of Justice (“DOJ”) threatened a lawsuit contesting our mortgage lending practices in 2009 and years prior, relating solely to the origination of FHA loans. Due to significant changes in our mortgage lending practice as a result of the Company’s settlement with the DOJ, we have no reason to believe that we will be subject to lawsuits by the government regarding FHA lending during that time period or for periods since that time. In addition, the significant damages incurred that gave rise to this settlement were incurred outside of the 3-year horizon (prior to 2011) and were thus excluded from the 3-year cumulative income/loss analysis. Therefore, we adjusted our pre-tax book income for the amount of DOJ settlement expenses accrued for each respective year as a nonrecurring item, as we have no reason to believe we will be subject to any future settlement with the government concerning FHA lending. |
| • | FHLB Interest Expense Adjustment: The Company is a member of the Federal Home Loan Bank of Indianapolis (“FHLB”) and participates in the FHLB’s long and short-term advance lending programs. As part of the program, the FHLB provides long or short-term advances to members, which members in turn use to lend to customers for the financing of housing related projects. The FHLB’s goal is to provide members with funds to originate residential mortgage loans and thereby facilitate home ownership. |
The Company has borrowed funds from the FHLB with a weighted-average rate of 3.3% in several tranches of varying maturities. During Q4 of 2013, due to higher-than-targeted liquidity levels and significantly lower available interest rates on short and medium-term advances, the
Mr. John P. Nolan, Senior Assistant Chief Accountant
Securities and Exchange Commission
October 3, 2014
Page 5 - Confidential Treatment Requested by Flagstar Bancorp, Inc.
Company determined to prepay the then-outstanding FHLB long-term advances and replace them with funding from retail deposits or short-term advances. The settled debt was long-term and high cost, which was historically needed to maintain sufficient liquidity. Going forward, the Company expects to borrow from the FHLB primarily short-term advances with varying interest rates consistent with market pricing at that time. Given the resolution of outstanding contingencies culminating in Q4 2013 combined with the liquidity levels discussed above, the Company was able to execute this fundamental change in the funding structure.
Because this aspect of our “core business” has changed and the use of funding sources across the mortgage origination business has changed, we performed an analysis of the impact that this prepayment of our current long-term FHLB advances would have had on the core business during the current and two most recent years. This analysis, which looked back, on a quarterly basis, to the beginning of this time period and projected what the interest expense would have been using a portfolio mix of short-term advances over various periods (between 1-5 years). The portfolio mix of short-term advances is based on the mix that we have used to project our future earnings, representing the most reasonable estimate of the mix in historical periods. The Company applied historical information on interest rates corresponding with the short-term advance mix each quarter, and compared the total “as-if” interest expense to the actual. This calculation resulted in reduced interest expense totaling $207 million over the past 3 years.
| • | FHLB Prepayment Expense: As a result of the prepayment of its long-term advances with the FHLB, as discussed above, the Company was required to pay $178 million. This was not the first prepayment expense that the Company was required to pay as a result of paying off a loan prior to its originally-scheduled maturity. However, this expense was the result of settling this high cost debt to establish a more efficient and lower cost funding structure. Given that we anticipate a mixture of various short-term advance periods, any future prepayment expenses associated with such funding sources would be minimal, and due to the short-term nature of those sources, we would anticipate maturity at settlement in the future rather than prepayment. Ultimately, we believe that the prepayment expense we paid is not indicative of future operations, and therefore the amount is appropriately treated as nonrecurring. |
Comment No. 1.b.:
Please provide us an analysis comparing actual income versus forecasted taxable income or US GAAP income for the fiscal years ended December 31, 2013, 2012 and 2011 and for the most recent periods in 2014. Please explain the reasons for any significant differences.
Response No. 1.b.:
As part of the Company’s realizability analysis, specifically with respect to developing an understanding of the weight we can place on positive evidence in the form of our projections of future profitability, we have considered our historical forecast accuracy for the 3-year cumulative tax period from January 1, 2011 through December 31, 2013. The forecasted versus actual taxable income are shown below:
| Years Ended December 31 | ||||||||||||||||||||
| (in millions $) | ||||||||||||||||||||
| 2011 | 2012 | 2013 | Q1 2014 | Q2 2014 | ||||||||||||||||
Forecast Taxable Income | (9 | ) | 123 | 211 | 10 | 36 | ||||||||||||||
Actual Taxable Income | (181 | ) | 53 | (149 | ) | (118 | ) | 37 | ||||||||||||
|
|
|
|
|
|
|
|
|
| |||||||||||
Difference | (172 | ) | (70 | ) | (360 | ) | (128 | ) | 1 | |||||||||||
Mr. John P. Nolan, Senior Assistant Chief Accountant
Securities and Exchange Commission
October 3, 2014
Page 6 - Confidential Treatment Requested by Flagstar Bancorp, Inc.
These periods were not typical for Flagstar nor were they typical for the banking industry generally, as discussed further below. We identified five categories of items which explained the historical differences between our forecasts and our actual results. In addition to the matters discussed in the response to 1.a above, we evaluated each of these items for purposes of determining our ability to rely on our forecasts going forward. As illustrated further below in our response to 1c, the level of taxable earnings needed to fully realize the DTA before it expires is significantly less than what we have forecast. As a result, the average forecast precision needed to determine that the DTA is more likely than not to be realized before it expires is reduced.
The Company’s forecasting methodology consists of a macroeconomic, “top-down” approach that considers general industry forecasts and trends, in addition to a “bottom-up” approach that takes the Company’s specific business unit level planning into account. The Company’s macroeconomic forecasting methodology utilizes assumptions and data from published industry reports. The data is then analyzed and aggregated to generate the inputs employed in the Company’s forecasting model.
In working to understand historical variances, we reviewed actual versus forecasted pre-tax book income and considered evidence supporting significant assumptions utilized at the time the forecast was established. These assumptions were compared to actual results for the purpose of assessing variances and controls or other process put in place to limit variances in future periods. Given the nature of the Company’s business, the key factors included assumptions and results as they were at the time we performed the December 31, 2013 assessment related to gain on sale, net interest margin, adjusted non-interest income, adjusted non-interest expense, credit costs and nonrecurring items discussed below.
| • | Mortgage originations and gain on sale: From a macroeconomic perspective, trends in the origination market as well as proactive and reactive government intervention resulted in an overall mortgage market that was unusually volatile and unpredictable. The refinance wave in 2012 was not predicted by market analysts, nor was its ultimate impetus – government intervention in U.S. Treasury Bond and Agency Mortgage-Backed Securities markets (Federal Reserve Bank’s Quantitative Easing program, Treasury’s Home Affordable Refinance Program, and many others). Unpredictable structural shifts in the mortgage origination competitive landscape over the historical period also drove significant variance to forecasts. These unforeseen market developments were the primary driver of volatility in our performance relative to forecasts. Based on our current research and given the current absolute level, we believe interest rates will remain stable or increase for the foreseeable future; therefore, the eligible refinance market will likely decline (or, rather, continue to decline), essentially eliminating the potential for vast fluctuations in the amount of mortgage originations industry-wide going forward. |
Mr. John P. Nolan, Senior Assistant Chief Accountant
Securities and Exchange Commission
October 3, 2014
Page 7 - Confidential Treatment Requested by Flagstar Bancorp, Inc.
| • | Net interest margin: Excessive delinquencies across the nation drove the unprecedented government intervention aimed at reducing borrowers’ interest rates. The Company was not unique in experiencing delinquencies beyond expectations, which contributed to underperformance of this line item. These low rates also created incentive for high note-rate loans to prepay more rapidly than our forecast. Loans available-for-sale (“AFS”) and Warehouse loan balances naturally fluctuated with origination volumes, hence when origination volumes veered from forecasted amounts, these line items contributed to significant misses versus forecast. Additionally, our team occasionally managed certain asset balances to levels inconsistent with the forecasts to meet targeted capital ratios real-time on a consolidated basis. |
| • | Non-interest income: A large portion of our non-interest income relates to loan fees and charges and gain on loan sales, which are driven by volume of loan originations. As discussed above, the volume of originations was unusually volatile and unpredictable as a result of tremendous market fluctuation and was not accurately predicted by most, if not all, in the industry. Income from the Mortgage Servicing Rights assets (“MSRs”) was volatile over the historic forecast period. In late 2013, we disposed of a large portfolio of MSRs, which will meaningfully reduce our total balance, and we are developing a process to monetize newly-created MSRs going forward, all of which will allow for greater predictability in future periods. Gain-on-loan sales have been illustrated separately from adjusted non-interest income in the supporting documents for ease of analysis. |
| • | Non-interest expense: The majority of non-interest expense items relate to mortgage origination volumes, including, but not limited to, compensation and benefits, loan processing fees and commissions. As discussed above, mortgage originations were unpredictable due to largely unforeseeable market fluctuations. We believe that market fluctuations have leveled off, which we anticipate will result in stability of non-interest expenses. Further, we have outsourced our default loan servicing operations, which will improve the predictability of compensation and benefit expenses, and we have undertaken a bank-wide initiative to reduce and make more variable non-interest expenses, allowing us to more effectively scale non-interest expenses with any fluctuations in origination volumes. |
| • | Credit costs: Separate from loan origination-driven variances, credit costs were another non-interest related expense that caused our actual results to vary from budget. The primary credit costs are provision for loan losses, representation and warranty – change in estimate (“R&W”), and asset resolution. The housing market downturn continued to have an impact, generating high numbers of delinquencies, foreclosures and ultimately charge-offs to loan or property balances. In 2011, we experienced considerable increases in the serious delinquency rate of many of our loan portfolios, which was not estimable during the forecasting process. Part way through 2012, based on actual information gathered during the early part of the year, we increased our troubled debt restructurings (“TDR”) re-default risk estimate and certain other qualitative factors related to our estimates of loan losses, which impacted the provision for loan losses at that time, unexpectedly. During 2013, we disposed of a substantial portion of residential non-performing loans (“NPLs”) and TDRs, as well as substantially all of our commercial loans originated prior to and during the recent financial crisis (referred to as our Special Asset Group (“SAG”) loans). The NPLs and TDRs were sold at or above our net book value, (i.e. after reduction for our loan loss reserves), demonstrating the validity of our forecasting capability regarding these potential credit losses. The disposition of our SAG loans removed potential volatility from our forecasted credit costs for this loan category. With respect to variances in R&W, while the variances to forecast were significant over the prior three years, the Company achieved an important settlement with Fannie Mae in November 2013, as well as a settlement with Freddie Mac in December 2013, covering 2000-2008 vintage originations, which represented the majority of our legacy exposure. Our R&W reserve allocated to this specific exposure was adequate to meet the final payment amount to Fannie Mae under the settlement, indicating that our exposure assessment capabilities were valid, and as a result, our forecasting accuracy for R&W should improve going forward. The settlement itself will result in a significant |
Mr. John P. Nolan, Senior Assistant Chief Accountant
Securities and Exchange Commission
October 3, 2014
Page 8 - Confidential Treatment Requested by Flagstar Bancorp, Inc.
reduction in volatility of this line item, which was nearly entirely driven by Fannie Mae’s initiatives to increase repurchase demands on loans originated in these vintages. Finally, our forecasting for asset resolution has materially improved over the last three years, as evidenced in the supporting materials, due in large part to: (i) improvement in the macro economy, (ii) reductions in loans repurchased with government guarantees, (iii) the R&W settlements with Fannie Mae and Freddie Mac, (iv) declining delinquencies in the Company’s held-for-investment portfolio, and (v) the outsourcing of default servicing to a specialty servicer. |
Forecasted amounts for Q1 2014 differed from actual results due to the adjusted Allowance for Loan and Lease Loss and the adjustment to the originally recorded fair value of repurchased loans disclosed in the March 31, 2014 10-Q (see responses to Comments 2 and 5). Absent these adjustments, forecasted income for Q1 as compared to actual results would have been substantially similar. Actual results for Q2 were substantially the same as the forecast. We considered the above adjustments along with our overall earnings for Q1 and Q2 2014 and their impact on the realization of the deferred taxes. We determined that Q1 and Q2 results did not negatively impact our assessment of the utilization of our DTA carry forwards before it expires.
Comment No. 1.c.:
You disclose that your forecasts projected complete realization of your deferred tax asset even under stressed scenarios. Please provide us your detailed forecast including the stressed scenarios and:
| i. | identify the most significant inputs and assumptions |
| ii. | provide a qualitative and quantitative discussion of the inputs and assumptions to allow us to fully understand your projections |
| iii. | provide specific evidence which supports the inputs and assumptions, and |
| iv. | if not included in your forecast, provide a schedule detailing the generation of approximately $1.1 billion in pre-tax income over the next 20 years which you disclose is needed to realize your deferred tax asset. |
Response No. 1.c.:
[***]
March 31, 2014 Form 10-Q
Management’s Discussion and Analysis
Other Noninterest Income, page 68
Comment No. 2:
You disclose you recorded a loss of $21.1 million due to an adjustment to the originally recorded fair value of performing repurchased loans primarily caused by liquidity risk. Please provide us all facts and circumstances related to this adjustment including the dates the loans were repurchased and how the liquidity risk was initially assessed. Also, please tell us how the loans are accounted for (e.g. hold for sale, FVO, etc.), tell us how you considered what level in the valuation hierarchy was appropriate, and if you account for them using the fair value option please tell us where they are presented in the table on page 26.
Mr. John P. Nolan, Senior Assistant Chief Accountant
Securities and Exchange Commission
October 3, 2014
Page 9 - Confidential Treatment Requested by Flagstar Bancorp, Inc.
Response No. 2:
Flagstar periodically repurchases loans from Fannie Mae or Freddie Mac, which should be initially measured and recorded at fair value at the date of repurchase. The initially recorded fair value assumed that par equaled fair value, which was subsequently identified and determined to be an error during Q1 2014. The repurchase reason for these loans had historically been thought to be an insignificant defect which would have a minimal impact on their fair value. Upon further analysis, it was identified that the repurchase reason indicated that the defects causing the repurchase for many of these loans were more than insignificant. Therefore, we valued the loans at their original repurchase date to include a market liquidity adjustment relating to these defects and recorded an adjustment to correct the carrying value of these loans. The loans were primarily repurchased during the years from 2011-2013:
| Repurchased Loans | (in millions) | |||
Q4 2011 and Prior | $ | 3.4 | ||
Q1 2012 | 0.7 | |||
Q2 2012 | 0.8 | |||
Q3 2012 | 2.5 | |||
Q4 2012 | 3.0 | |||
Q1 2013 | 3.9 | |||
Q2 2013 | 3.7 | |||
Q3 2013 | 1.8 | |||
Q4 2013 | 0.9 | |||
Q1 2014 | 0.4 | |||
|
| |||
Total | $ | 21.1 | ||
In Q1 2014, Flagstar evaluated the impact of this error and concluded that the impact was not material under both the “rollover” and the “iron curtain” methods (see SEC Accounting Bulletins 99 and 108), but warranted current period disclosure. This conclusion was reached in consultation with the Audit Committee of the Company’s Board of Directors and our external auditor.
These loans were performing at the date of repurchase, are classified as held for investment and are subsequently accounted for using the amortized cost method. The fair value option is therefore not elected.
Mr. John P. Nolan, Senior Assistant Chief Accountant
Securities and Exchange Commission
October 3, 2014
Page 10 - Confidential Treatment Requested by Flagstar Bancorp, Inc.
June 30, 2014 Form 10-Q
Financial Statements
Note 3 – Fair Value Measurements – Fair Value Measurements Using Significant Unobservable Inputs, page 17
Comment No. 3:
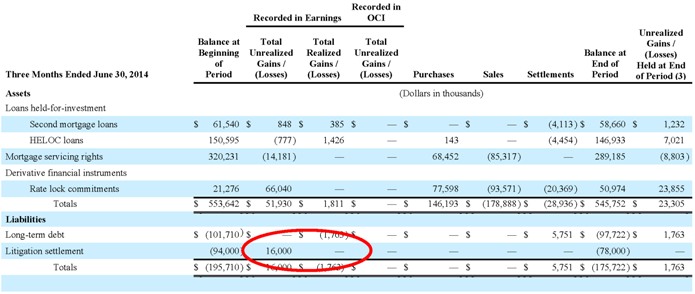
Please revise the level 3 fair value roll forward in future filings to present the change in fair value of the DOJ litigation settlement in the “Total Unrealized Gains/(Losses)” column or tell us why you believe the fair value changes are realized gains/(losses).
Response No. 3:
We will revise the level 3 fair value roll forward in the future to reflect the change in fair value of the DOJ litigation settlement in the “Total Unrealized Gains / (Losses) column.” See the table below demonstrating the revision using the June 30, 2014 table as an example:
Management’s Discussion and Analysis of Financial Condition and Results of Operations
Summary of Operations, page 62
Comment No. 4.a.:
We note that the fair value of the DOJ litigation settlement decreased from $94 million at March 31, 2014 to $78 million at June 30, 2014 which resulted in $16 million being recognized in earnings which represents 43% of your pre-tax quarterly income. We also note your disclosure that the fair value of the liability decreased principally from updating the related payment schedule within the schedule agreement.
| a. | Please tell us how often you update the payment schedule. If you do not update it quarterly, please tell us why and provide an analysis of the impact on historical earnings if you updated it quarterly. |
Mr. John P. Nolan, Senior Assistant Chief Accountant
Securities and Exchange Commission
October 3, 2014
Page 11 - Confidential Treatment Requested by Flagstar Bancorp, Inc.
Response No. 4.a.:
Flagstar updates the payment schedule and measures fair value on a quarterly basis.
Comment No. 4.b:
| b. | Please tell us and revise future filings to better explain the underlying factors that result in significant changes to assumptions in the fair value measurement. Specifically explain how the payment schedule was changed (e.g. – were estimated payments moved to later dates, etc.) and the underlying factors that drove the changes in the payment schedule. |
Response No. 4.b:
After the end of the second quarter, a subjective contractual provision outside of Flagstar’s control was exercised, causing us to be unable to make the previously estimated July 2014 payment. This was determined to be a Type I subsequent event impacting the measurement of the DOJ liability. The fair value measurement is impacted by the estimate of when the payments will be required to be paid based upon the provisions above. The fair value measurement of the DOJ liability at March 31, 2014 included an expectation that this $25 million payment would be made in July of 2014. This objection impacted the fair value measurement by rescheduling the estimated July 2014 payment of $25 million to 2021 and 2022.
By way of background, on February 24, 2012 we had entered into an agreement with the U.S. Department of Justice (“the DOJ agreement”). The DOJ Agreement required us to make an initial payment of $15 million and make additional payments of approximately $118.0 million (the “Additional Payments”), contingent upon the occurrence of certain events. The Additional Payments would be made if and only if all of the following events occur or have occurred:
| • | We generate positive income for a sustained period, such that part or all of our DTA valuation allowance could be reversed; |
| • | we are able to include capital derived from the reversal of the DTA valuation allowance in our Tier 1 capital, as limited by the regulatory capital requirements administered by the U.S. bank regulatory agencies; and |
| • | our obligation to repay the preferred stock held by the U.S. Treasury under the TARP Capital Purchase Program has been either extinguished or excluded from Tier 1 capital for purposes of calculating the Tier 1 capital ratio as described below. |
Upon the occurrence of each of the events described above, and provided doing so would not violate any banking regulatory requirement or the OCC does not otherwise object (which it did for purposes of payment in 2014), we would begin making Additional Payments, provided that: (i) each annual payment would be equal to the lesser of $25.0 million or the portion of the Additional Payments that remains outstanding after deducting prior payments, and (ii) no obligation arises until our call report as filed with the OCC, including any amendments thereto, for the period ending at least six months prior to the making
Mr. John P. Nolan, Senior Assistant Chief Accountant
Securities and Exchange Commission
October 3, 2014
Page 12 - Confidential Treatment Requested by Flagstar Bancorp, Inc.
of such Additional Payments, reflects a minimum Tier 1 capital ratio, after excluding any un-extinguished portion of the preferred stock issued in connection with our participation in the TARP Capital Purchase Program, of 11 percent (or higher ratio if required by regulators).
We will expand this disclosure in future filings to disclose more detail with respect to the significant assumptions in the fair value measurement, including the assumptions regarding the payment schedule and the underlying factors that result in significant changes to assumptions in the fair value measurement and specifically the underlying factors in the estimated payment schedule. A proposed disclosure would read:
“Legal and professional expenses decreased $33.4 million to $11.8 million for the six months ended June 30, 2014, primarily due to lower consulting fees and a decrease in the fair value liability associated with the U.S. Department of Justice (“DOJ”) settlement arising principally from updating our estimate of the timing of the payments to be made in accordance with the settlement agreement. The DOJ settlement requires us to begin making annual payments of $25.0 million upon the occurrence of certain events and, unless the OCC objects to such payments. During the second quarter of 2014, the OCC objected to having us make a $25 million payment which we had estimated to occur in July 2014. This resulted in extending the payment schedule to 2022 and moving that estimated cash payment to 2021 and 2022. The undiscounted amount of the DOJ liability remains at $118.0 million.”
Comment No. 4c.:
Please revise future filings to clearly disclose the undiscounted amount of your estimated DOJ liability. If the amount has changed from $118 million, please explain why.
Response No. 4c:
The undiscounted amount of the settlement due to the DOJ remains at $118 million. We will revise future filings to clearly disclose the undiscounted amount of $118 million when discussing the valuation of the DOJ settlement liability in Management’s Discussion and Analysis of Financial Condition and Results of Operations.
Summary of Operations, Provision for Loan Losses, page 69
Comment No. 5:
We note that your disclosure related to the lengthening of the loss emergence period. Please provide us your analysis describing in detail the specific facts and circumstances that led you to conclude that the average loss emergence period had lengthened. Also, tell us and disclose in future filings the amount of the increase in the allowance for loan loss that is attributed to the increase in the loss emergence period.
Mr. John P. Nolan, Senior Assistant Chief Accountant
Securities and Exchange Commission
October 3, 2014
Page 13 - Confidential Treatment Requested by Flagstar Bancorp, Inc.
Response No. 5:
We utilize the loss emergence period to estimate the average amount of time between when a loss event first occurs and the date that a specific loan is charged-off. This time period starts when the borrower first begins to experience financial difficulty, which may not be directly visible to us. The borrower’s performance then continues to deteriorate as evidenced by a first delinquency. It may continue through several stages of delinquency, which may be delayed by periodic payments, but may ultimately result in a charge-off. The estimate of the loss emergence period requires significant judgment, and is an assumption included in our measurement of the allowance for loan loss to determine our estimate of the period of incurred loss.
We considered our recent Q1 2014 data, including changes in early stage delinquency, the nominal increase in charge-offs for the first quarter of 2014, the continued emergence of nonperforming loans, and then held discussions with our regulator and determined an updated assessment of our loss emergence period was appropriate. Based on these considerations, we examined a sample of loans which had been charged-off through 2014 and prior to determine the length of time between charge-off and first delinquency. Although there was a wide range of experience, the loans in the sample that were charged-off in 2014 indicated that the length of time between first delinquency and the charge-off had increased on average. Additionally, management close to the loss mitigation process indicated that borrowers were more frequently maximizing their options to make periodic payments to avoid default as long as possible, qualitatively indicating an increase in the loss emergence period.
Management evaluated the data, and determined an appropriate extension of the loss emergence period, given the sample of loans that indicated that the loss emergence period for loans charged off in 2014 had lengthened and the discussions held with our regulators. As a result, Flagstar concluded that the estimate of the loss emergence period should be appropriately increased from 12 to 18 months.
This change in estimate was approved by the Company’s executive management team, the ALLL Committee, the Enterprise Risk Management Committee, and was reviewed with the Company’s regulators and discussed with the Audit Committee of the Company’s Board of Directors prior to filing the March 31, 2014 10-Q. The change in the estimate of the loss emergence period resulted in an increase of approximately $45.8 million.
We will disclose in future filings the amount of the increase in the allowance for loan loss that is attributed to the increase in the loss emergence period. Please see the response to comment No. 6 below for our planned disclosure.
Comment No. 6:
We note that your allowance for loan losses increased $99 million from December 31, 2013 to June 30, 2014. You disclose that the allowance for loan losses increased $51.2 million from December 31, 2013 to June 30, 2014 due to reset risk and the lengthening of the loss emergence period. Please tell us in detail and revise future filings to more comprehensively explain the reasons for the remaining increase in the allowance for loan losses. Specifically discuss how changes and trends in the underlying credit risk of loans collectively evaluated impacted your allowance for these loans.
Mr. John P. Nolan, Senior Assistant Chief Accountant
Securities and Exchange Commission
October 3, 2014
Page 14 - Confidential Treatment Requested by Flagstar Bancorp, Inc.
Response No. 6:
The $51.2 million you highlight in your comment above is the amount due to reset risk and the lengthening of the loss emergence period specific to only the interest-only and HELOC loans. We will revise future filings to more clearly explain the reasons for the remaining increase in the allowance for loan losses. Specifically, we will discuss how changes and trends in the underlying credit risk of loans collectively evaluated impacted your allowance for these loans as follows:
“Allowance for Loan and Lease Losses
Our allowance for loan losses considers the probable loss inherent in the portfolio. During the first six months of 2014, we increased our allowance for loan losses related to two significant factors. We analyzed our recent data, including early stage delinquency, the increase in charge-offs for the first quarter of 2014, continued emergence of nonperforming loans and our assessment of the time from first delinquency to charge-off. As a result, we determined that our estimate of the average loss emergence period should be lengthened. This change resulted in an increase to the allowance for loan and lease loss that reflects our updated estimate of probable losses inherent in the portfolio in the amount of $45.8 million during the six months ended June 30, 2014. The second significant factor is driven by the results of our model and the qualitative assessment of probable loss inherent in our portfolio, which increased by $53.2 million. This change was primarily due to the interest-only portfolio, both before and after the payment reset date. Prior to December 31, 2013, we had experienced an insignificant volume of resets. The first significant volume of resets occurred during the first and second quarter of 2014. Data we reviewed from those periods, as well as data we reviewed for the 17 months ended May 31, 2014, indicated that delinquency was greater than estimated at December 31, 2013. Additionally, loans that have recently reset or are expected to reset in the near future are refinancing at levels below what was previously estimated, which we believe may indicate an increase in future delinquency and charge-off. Based on our review of these initial indicators, we increased our allowance for loan losses based on our qualitative analysis of the recent data by approximately $30.6 million. The allowance for loan losses increased to $306.0 million at June 30, 2014 from $207.0 million at December 31, 2013, respectively. The portion of the above allowance for loan losses related only to certain interest-only loans included in our residential first mortgage and HELOC loan held-for-investment portfolios increased due to both the estimates of the average loss emergence period and the reset risk to approximately $103.5 million at June 30, 2014 from $52.3 million at December 31, 2013.”
Form 8-K Filed on August 26, 2014
Comment No. 7:
We note in your disclosure regarding the Civil Investigation Demands of the CFPB and your settlement discussions. Please ensure that you provide appropriate disclosure in your future filings in accordance with ASC 450 and Item 103 of Regulation S-K. Please provide us with your proposed disclosure, if appropriate.
Mr. John P. Nolan, Senior Assistant Chief Accountant
Securities and Exchange Commission
October 3, 2014
Page 15 - Confidential Treatment Requested by Flagstar Bancorp, Inc.
Response No. 7:
Since we received the Staff’s letter, we filed an updated disclosure on this matter via Form 8-K, describing the terms of the settlement reached with the CFPB. The following is a proposed draft disclosure regarding the CFPB matter for purposes of our upcoming Form 10-Q. This disclosure follows our practice of discussing our legal proceedings in the footnotes to our financial statements, which is then cross-referenced in Part II, Item 1 of the Form 10-Q. In addition to this disclosure, we expect to provide material updates on other pending matters or new matters, if any, as required by ASC 450 and Item 103 of Regulation S-K.
“On August 26, 2014, the Company disclosed that the Bank had commenced discussions with the Consumer Financial Protection Bureau (“CFPB”), related to alleged violations of federal consumer financial laws arising from the Bank’s loss mitigation practices and default servicing operations dating back to 2011. On September 29, 2014, the Bank reached a settlement with the CFPB. The settlement required the Bank to pay $27.5 million to the CPFB for borrower remediation and $10 million in civil monetary penalties. The settlement did not involve any admission of wrongdoing on the part of the Company or its employees, directors, officers or agents.”
Mr. John P. Nolan, Senior Assistant Chief Accountant
Securities and Exchange Commission
October 3, 2014
Page 16 - Confidential Treatment Requested by Flagstar Bancorp, Inc.
As requested in the Staff’s Comment Letter, the Company acknowledges that:
| • | The Company is responsible for the adequacy and accuracy of the disclosure in the filings; |
| • | Staff comments or changes to disclosures in response to Staff comments do not foreclose the Commission from taking any action with respect to the filings; and |
| • | The Company may not assert Staff comments as a defense in any proceeding initiated by the Commission or any person under the federal securities laws of the United States. |
We trust that the foregoing is responsive to your comments. If you have any questions regarding the foregoing or require further information, please contact Jim Ciroli at (248) 312-6133 orjim.ciroli@flagstar.com, or Bryan Marx at (248) 312-5699 orbryan.marx@flagstar.com.
Sincerely,
/s/ Alessandro P. DiNello
Alessandro P. DiNello
President and Chief Executive Officer
| cc: | Mr. Michael Volley, Securities Exchange Commission |
Appendix A
Deloitte – A Roadmap to Accounting for Income Taxes (March 2011)
Definition of “Cumulative Losses in Recent Years”
4.229 In practice, the most commonly used benchmark is a three-year period of pretax accounting income or loss from continuing operations (adjusted for permanent differences such as meals and entertainment). The three years consist of the current year and the two immediately preceding years. This practice arose, in part, as a result of proposed guidance in the exposure draft on Statement 109. This guidance was omitted in the final standard (codified in ASC 740) because the FASB decided that a “bright-line” definition of the term “cumulative losses in recent years” might be problematic. The standard’s Basis for Conclusions states that the “Board believes that the more likely than not criterion required by [ASC 740] is capable of appropriately dealing with all forms of negative evidence, including cumulative losses in recent years.” A three-year period generally supports the more-likely-than-not recognition threshold because it typically covers several operating cycles of the entity and one-time events in a given cycle do not overly skew the entity’s analysis.
Effect of Nonrecurring Items on Estimates of Future Income
4.238 Whether a valuation allowance is necessary is based on the weight of positive and negative evidence. When negative evidence is present, an entity usually must estimate future income (positive evidence) in determining the amount of the valuation allowance needed to reduce the DTA to an amount that is more likely than not to be realized. (For more information, see 4.236–4.237.)
4.239 When estimating future income or loss in recent years, an entity should generally not consider the effects of discontinued operations, cumulative effects of accounting changes, extraordinary items, and nonrecurring items included in its three-year historical amounts of pretax income or loss from continuing operations. Generally, these items are not relevant items of historical income or loss and are not indicative of an entity’s ability to generate taxable income in future years. Examples of nonrecurring items that are typically excluded include:
| • | One-time restructuring charges that permanently remove fixed costs from future cash flows. |
| • | Large litigation settlements or awards that are not expected to recur in future years. |
| • | Historical interest expense on debt that has been restructured or refinanced as of the date the financial statements are issued. |
| • | Historical fixed costs that have been reduced or eliminated as of the date the financial statements are issued. |
| • | Large permanent differences that are included in pretax accounting income or loss but are not a component of taxable income. |
| • | Severance payments related to management changes. |
4.240However, items that generally should not be considered nonrecurring for this purpose include the following:
| • | Unusual loss allowances (e.g., large loan loss or bad-debt loss provisions). |
| • | Poor operating results caused by an economic downturn, government intervention, or changes in regulation. |
| • | Operating losses attributable to a change in the focus or directives of a subsidiary or business unit. |
| • | The onerous effects on historical operations attributable to prior management decisions when a new management team is engaged (excluding any direct employment cost reductions associated with the replacement of the old management team). |
PWC – Accounting for Income Taxes Treatise (2013)
5.1.3 Cumulative Losses and Other Negative Evidence
5.1.3.1 General
ASC 740-10-30-21 indicates that it is difficult to avoid a valuation allowance when there is negative evidence such as cumulative losses in recent years. Other examples of negative evidence include:
| • | Losses expected in early future years. |
| • | A history of potential tax benefits expiring unused. |
| • | Uncertainties whose unfavorable resolution would adversely affect future results. |
| • | Brief carryback, carryforward periods in jurisdictions where results are traditionally cyclical or where a single year’s reversals of deductible differences will be larger than the typical level of taxable income. |
PwC Observation: Despite the Board’s decision to prohibit anticipation of the tax consequences of future tax losses(ASC 740-10-25-38), it is appropriate for management to consider future losses in determining whether, or to the extent, future taxable income is expected to exist (e.g., a tax-planning strategy that would serve only to reduce a future-year expected loss would not provide a source of income for realization of deferred tax assets).
Of the negative evidence cited, “cumulative losses in recent years” probably will have to be considered most frequently. ASC 740 deliberately does not define this term. Generally, we believe that the guideline, not a “bright line” but a starting point, should be cumulative pretax results as adjusted for permanent items (e.g., nondeductible goodwill impairments) for three years (the current and the two preceding years). This measure generally would include discontinued operations, other comprehensive income (OCI) and extraordinary items, as well as all other so-called “nonrecurring” items, such as restructuring or impairment charges. That is, all items, other than the cumulative effect of accounting changes, should be included in the determination of cumulative losses.
While such items may not be indicative of future results, they are part of total results, and there may be discontinued operations, OCI, extraordinary items, and other nonrecurring charges in future years. Also, while otherwise arbitrary, three years generally seems to be a long enough period to not be overly influenced by one-time events, but not so long that it would be irrelevant as a starting point for gauging the future. Further, we believe it is appropriate to conclude that there are cumulative losses in situations where an entity is projecting near-term future operating losses that will put it in a three-year cumulative loss position. In addition, the impact of a profitable discontinued operation should be carefully evaluated when the ongoing businesses otherwise would have had a cumulative loss.
This suggested guideline is admittedly an arbitrary measure and judgment is necessary to determine the weight given to the results of this specific calculation. However, as discussed above, ASC 740-10-30-23 requires that the weight given to the potential effect of negative and positive evidence “be commensurate with the extent to which it can be objectively verified.” Moreover, it indicates that “a cumulative loss in recent years is a significant piece of negative evidence that is difficult to overcome.” The FASB in its deliberations has indicated that an entity would need objective positive evidence of sufficient quality and quantity to support a conclusion that, based on the weight of all available evidence, a valuation allowance is not needed. (ASC 740-10-30-23.)
PwC Observation: A projection of future taxable income is inherently subjective and generally will not be sufficient to overcome negative evidence that includes cumulative losses in recent years, particularly if the projected future taxable income is dependent on an anticipated turnaround to operating profitability that has not yet been demonstrated.
[…]
5.1.3.2 Examples of Situations Where Positive Evidence Outweighed Significant Negative Evidence
We have dealt with several situations where it was determined that positive evidence outweighed significant negative evidence so that no, or only a small, valuation allowance was necessary. Each of these situations is based on specific facts and circumstances. Similar situations may not necessarily result in the same conclusions.
| 1. | An entity underwent a leveraged buyout (LBO) and incurred a large amount of debt as a result of that transaction. For several years after the LBO, the entity incurred substantial losses. Without the interest expense on the LBO-related debt, however, the entity would have been profitable. |
Recently, the entity had an initial public offering (IPO) of equity securities. The proceeds of the IPO were used to completely pay off the LBO debt.
After the IPO and the related payoff of the LBO debt, the entity concluded that future income would preclude the need for a valuation allowance for its NOL carryforward deferred tax asset.
PwC Observation: The above situation demonstrates the concept of “core earnings.” Absent the interest expense from the LBO, the company consistently demonstrated the ability to operate at a profit. While the company still had to overcome the significant negative evidence that resulted from cumulative losses in recent years, the company’s objectively verifiable core earnings were sufficient to overcome the losses caused by the LBO interest expense.
On the contrary, in a situation somewhat similar to the above, an entity was incurring significant losses as a result of interest on LBO-related debt. However, the entity planned to undergo an IPO three or four years into the future. Due to the uncertainty regarding the entity’s ability to carry out an IPO, it was concluded that a full valuation allowance was appropriate for the NOL carryforward deferred tax asset.
PwC Observation: IPOs involve significant risks and uncertainties. Accordingly, we do not believe that the potential effects of an IPO should be considered until the IPO occurs.
| 2. | During the past five years, a bank incurred substantial losses as a direct result of commercial real estate and lesser-developed-country (LDC) loans. The bank has fully reserved these problem loans and has not originated any new commercial real estate or LDC loans. The bank’s core earnings, which are primarily from consumer and non-real estate commercial lending, historically have been, and continue to be, very profitable. |
Management forecasts that, based on historical trends, these core earnings will, over the next five years, be more than sufficient to recover the losses resulting from the old commercial real estate and LDC loans. Accordingly, it was concluded that a valuation allowance was not necessary for the bank’s deferred tax asset.
PwC Observation: In this fact pattern, the bank had demonstrated the ability to be profitable in what it considered to be its core businesses (consumer and non-real estate commercial lending). Once it concluded that it was going to cease originating commercial real estate and LDC loans (and the bank had fully reserved problem loans), the available evidence supported recognition of the deferred tax asset. However, exiting unprofitable businesses does not necessarily ensure that the ongoing entity will be profitable. In some cases, the losses in certain lines of business are indicative of flaws in the company’s broader business model. In other cases, costs associated with those unprofitable businesses may need to be absorbed by the remaining businesses, hindering the historically profitable businesses’ abilities to continue to be profitable. Careful analysis should be performed to determine whether exiting an unprofitable business is sufficient to overcome the losses incurred in recent years.
| 3. | An entity had three separate and distinct lines of business. Historically, two of the lines have been, and continue to be, profitable. The third line incurred substantial losses that led to an NOL carryforward on the entity’s consolidated tax return. The entity recently discontinued its unprofitable line and sold the related assets. |
The historical profit levels of the continuing operations were such that the entity could “utilize” the NOL in approximately eight years. Because this was well within the NOL carryforward period in the applicable tax jurisdiction, it was concluded that a valuation allowance was not necessary for the entity’s NOL carryforward deferred tax asset.
PwC Observation: Consistent with the bank example above, the mere exiting of a business often does not, in and of itself, ensure future profitable operations. In this case, the company had a clear track record of profitable results in the other lines of business. That factor, coupled with a lengthy carryforward period, was considered sufficient positive evidence. Furthermore, realization of a deductible temporary difference is contingent on the existence of sufficient taxable income of the appropriate character within the carryforward period. In situations where an entity may carryforward tax attributes indefinitely, demonstrating a return to sustainable profitability is generally sufficient.
| 4. | A company had significant losses in the first two years of operations due to substantial start-up costs and marketing expenses. During year 3, the company incurred losses in the first three quarters and income in the last quarter which resulted in a near breakeven year. In year 4, although the entity reported increasing levels of income in each quarter, it was still in a three-year cumulative loss position at the end of its fiscal year. Management’s projections show continued profitability with significant growth going forward. NOL carryforwards were expected to be utilized well in advance of their expiration dates, even without considering any further growth in future years. Notwithstanding the cumulative loss evidence, as a result of the company’s demonstrated ability to recover the NOLs based on existing levels of taxable income, it was concluded that no valuation allowance is necessary. |
PwC Observation: Depending on the facts and circumstances, other factors, such as what caused the losses and when the losses occurred.