while telecom services, health care, and consumer staples lagged.
Lazard Retirement U.S. Strategic Equity Portfolio
For the six months ended June 30, 2009, the Lazard Retirement U.S. Strategic Equity Portfolio’s Service Shares posted a total return of 4.92%, as compared with the 3.16% return for the S&P 500® Index.
During the period, the Portfolio benefited from stock selection in the materials sector, as positions in Freeport-McMoRan Copper & Gold and Air Products & Chemicals performed well amid the difficult market environment. Freeport-McMoRan rose as copper prices rebounded from multiyear lows. The company also reported better-than-expected earnings as a result of management’s cost-cutting efforts. We subsequently sold the position during the period as it reached our valuation target. Air Products & Chemicals also reported better-than-expected earnings results, driven by strong pricing and cost-cutting efforts. Performance for the period was also positively impacted by a slightly overweight position in the financials sector, which rebounded sharply from lows achieved in March. However, stock selection in the sector diminished some of this benefit, as insurance holdings Allstate, Travelers, Marsh & McLennan, and PartnerRe lagged. We subsequently sold our positions in Allstate and Marsh & McLennan during the period. Less exposure to some of the diversified financial companies that rebounded sharply also detracted from performance. During the period, stock selection in the health care sector benefited returns, as shares of Wyeth rose sharply as a result of a takeover offer from Pfizer. We view this merger positively due to the potential for significant cost savings and robust cash flow generation of the combined companies.
On the negative side, stock selection in the information technology sector detracted from performance. While the majority of our technology holdings outperformed the overall market, and the sector was the best-performing group during the first half of 2009, a lack of exposure to certain technology hardware stocks that rebounded strongly during the period detracted from performance.
Lazard Retirement U.S. Small-Mid Cap Equity Portfolio
As of June 1, 2009, the Portfolio changed its name from “Lazard Retirement U.S. Small Cap Equity Portfolio” to “Lazard Retirement U.S. Small-Mid Cap Equity Portfolio,” changed its investment strategy to invest in small-mid cap companies, and began comparing its performance to the Russell 2500® Index. Prior to June 1, 2009, the Portfolio focused on small-cap U.S. companies and compared its performance to the Russell 2000® Index.
For the six months ended June 30, 2009, the Lazard Retirement U.S. Small-Mid Cap Equity Portfolio’s Service Shares posted a total return of 14.98%, as compared with the 6.52% return for the Russell 2500 Index, and the 2.30% return for the Russell 2000/2500 Linked Index.*
Stock selection in the financials, industrials, consumer discretionary, and energy sectors were the main contributors to returns, while stock selection in the information technology and health care sectors detracted from performance over the period.
In the financials sector, we continued to selectively build positions and to seek to avoid financial firms with balance sheet risk. The bank segment was the largest relative contributor within the sector, as we focused on companies with healthy balance sheets
and that we believed would be able to grow their businesses. Within the diversified financials segment, shares of Waddell & Reed Financial and Jefferies Group were up strongly as the businesses gained market share.
Outperformance within the industrials sector was led by holdings in the capital goods segment. Shares of Middleby, Orion Marine Group, Dycom Industries, and Axsys Technologies were all up significantly over the period. Following the companies’ outperformance, we sold our positions in Orion Marine Group and Axsys Technologies during the period.
Underperformance in the information technology sector was due to weaker-than-average returns in the software and services business. Overall performance in this sector lagged due to negative returns in both United Online and CACI. We decided to exit both positions during the period.
Stock selection in the health care sector also detracted from performance over the period, as several positions within the pharmaceuticals and biotechnology industry more than offset gains from our equipment and services companies.
Lazard Retirement International Equity Portfolio
For the six months ended June 30, 2009, the Lazard Retirement International Equity Portfolio’s Service Shares posted a total return of 1.22%, as compared with the 7.95% return for the MSCI Europe, Australasia and Far East® Index (the EAFE Index).
The Portfolio’s underweight exposure to the materials, financials, and consumer discretionary sectors detracted from performance. In spite of the opportunistic purchase of several financial stocks, the financials sector was a drag on performance, as companies
that had been hurt over the past year rallied strongly due to recapitalization and an improvement in the credit markets. While positions in BNP Paribas, Banco Santander, and Mitsubishi Estate performed well, and our stock selection in the insurance segment was beneficial, it was not enough to compensate for our underweight position in financial stocks, which rallied strongly.
On a positive note, the Portfolio benefited from stock selection in the information technology and consumer staples sectors. Anheuser-Busch InBev performed well, driven by continued execution of management’s ambitious debt and cost reduction plans. Within the information technology sector, shares of Ericsson were up due to confidence that the world’s largest wireless network provider will continue to gain relative strength through this economic cycle.
Lazard Retirement Emerging Markets Equity Portfolio
For the six months ended June 30, 2009, the Lazard Retirement Emerging Markets Equity Portfolio’s Service Shares posted a total return of 31.23%, while Investor Shares posted a total return of 31.43%, as compared with the 36.01% return for the EM Index.
For the period, a position in Mobile TeleSystems, a Russian telecommunications services company, helped performance due to stabilization of the ruble and investors’ focus on the company’s cash flow generation. Shares of Oriflame Cosmetics, a cosmetics producer in Central and Eastern Europe, were up as the company announced strong earnings results that beat bearish expectations for the cosmetics industry. Advanced Semiconductor Engineering, a Taiwanese integrated circuit manufacturer, also helped performance, as its shares rose on signs of robust free cash flow. Stock selection in the telecom services sector, as well as within Argentina and Taiwan helped performance.
Semi-Annual Report 5
Conversely, shares of Satyam Computer Services, an Indian software company, hurt returns over the period, as shares were weak due to investor concerns over an alleged fraud. We subsequently sold the position. Shares of Turkcell Iletisim Hizmetleri, a Turkish telecommunications services company, also fell over concerns that the weak macroeconomic conditions in Turkey and a weak currency would negatively affect margins. A position in OTP Bank, a Hungarian
banking company, suffered from investor concerns over systemic risk in Eastern Europe. We also exited our position in OTP Bank during the period. Stock selection in the information technology and consumer discretionary sectors, as well as within India and Brazil hurt performance over the period. An underweight exposure to the energy sector, and overweight exposures to the telecom services sector, Argentina, and Mexico also detracted from performance.
Notes to Investment Overviews:
All returns reflect reinvestment of all dividends and distributions, if any. Certain expenses of the Portfolios have been waived or reimbursed by the Fund’s Investment Manager or Administrator; without such waiver/reimbursement of expenses, the Portfolios’ returns would have been lower. Performance information does not reflect the fees and charges imposed by participating insurance companies at the separate account level, and such charges will have the effect of reducing performance. Past performance is not indicative, nor a guarantee, of future results.
The performance data of the indices and other market data have been prepared from sources and data that the Investment Manager believes to be reliable, but no representation is made as to their accuracy. These indices are unmanaged, have no fees or costs and are not available for investment.
The views of the Fund’s management and the portfolio holdings described in this report are as of June 30, 2009; these views and portfolio holdings may have changed subsequent to this date. Nothing herein should be construed as a recommendation to buy, sell, or hold a particular security. There is no assurance that the securities discussed herein will remain in each Portfolio at the time you receive this report, or that securities sold will not have been repurchased. The specific portfolio securities may in aggregate represent only a small percentage of each Portfolio’s holdings. It should not be assumed that investments in the securities identified and discussed were, or will be, profitable, or that the investment decisions we make in the future will be profitable, or equal the investment performance of the securities discussed herein.
The views and opinions expressed are provided for general information only, and do not constitute specific tax, legal, or investment advice to, or recommendations for, any person. There can be no guarantee as to the accuracy of the outlooks for markets, sectors and securities as discussed herein. You should read the Fund’s prospectus for a more detailed discussion of each Portfolio’s investment objective, strategies, risks and fees.
| |
* | The Russell 2500 Index is comprised of the 2,500 smallest U.S. companies included in the Russell 3000® Index (which consists of the 3,000 largest U.S. companies by capitalization). The Russell 2000/2500 Linked Index is an index created by the Portfolio’s Investment Manager, which links the performance of the Russell 2000 Index for all periods prior to June 1, 2009 and the Russell 2500 Index for all periods after May 31, 2009. The Russell 2000 Index is comprised of the 2,000 smallest U.S. companies included in the Russell 3000 Index. |
6 Semi-Annual Report
|
|
Lazard Retirement Series, Inc. Performance Overviews (unaudited) |
|
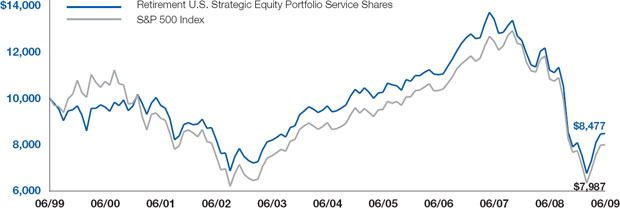
Lazard Retirement U.S. Strategic Equity Portfolio
Comparison of Changes in Value of $10,000 Investment in the Service Shares of Lazard Retirement U.S. Strategic Equity Portfolio and S&P 500® Index*
| | | | | | | | | | |
Average Annual Total Returns*
Periods Ended June 30, 2009 | | | | | | | | | | |
| | | | | | | | | |
| | One
Year | | Five
Years | | Ten
Years | |
|
Retirement U.S. Strategic Equity Portfolio | | | | | | | | | | |
| | | | | | | | | | | |
Service Shares | | | (24.37)% | | | (2.60)% | | | (1.64)% | |
| | | | | | | | | | | |
S&P 500 Index | | | (26.21)% | | | (2.24)% | | | (2.22)% | |
| | | | | | | | | | | |
| |
* | All returns reflect reinvestment of all dividends and distributions, if any. Certain expenses of the Portfolio have been waived or reimbursed by the Portfolio’s Investment Manager or Administrator; without such waiver/reimbursement of expenses, the Portfolio’s returns would have been lower. Performance information does not reflect the fees and charges imposed by participating insurance companies at the separate account level, and such charges will have the effect of reducing performance. |
| |
| The performance quoted represents past performance. Current performance may be lower or higher than the performance quoted. Past performance is not indicative, nor a guarantee, of future results; the investment return and principal value of the Portfolio will fluctuate, so that Portfolio shares, when redeemed, may be worth more or less than their original cost. Within the longer periods illustrated there may have been short-term fluctuations, counter to the overall trend of investment results, and no single period of any length may be taken as typical of what may be expected in future periods. |
| |
| The performance data of the index has been prepared from sources and data that the Investment Manager believes to be reliable, but no representation is made as to its accuracy. The S&P 500 Index is a market capitalization-weighted index of 500 common stocks, designed to measure performance of the broad domestic economy through changes in the aggregate market value of these stocks, which represent all major industries. The index is unmanaged, has no fees or costs and is not available for investment. |
| |
| Before May 1, 2007, the Portfolio was known as Lazard Retirement Equity Portfolio and had a different investment strategy. |
Semi-Annual Report 7
Lazard Retirement U.S. Small-Mid Cap Equity Portfolio
Comparison of Changes in Value of $10,000 Investment in the Service Shares of Lazard Retirement U.S. Small-Mid Cap Equity Portfolio, Russell 2500® Index, Russell 2000/2500 Linked Index and Russell 2000® Index*

| | | | | | | | | | |
Average Annual Total Returns*
Periods Ended June 30, 2009 | | | | | | | | | | |
| | | | | | | | | |
| | One
Year | | Five
Years | | Ten
Years | |
| | | | | | | | | | |
Retirement U.S. Small-Mid Cap Equity Portfolio | | | | | | | | | | |
| | | | | | | | | | | |
Service Shares | | | (19.80)% | | | (2.35)% | | | 3.64% | |
| | | | | | | | | | | |
Russell 2500 Index | | | (26.72)% | | | (0.93)% | | | 3.67% | |
| | | | | | | | | | | |
Russell 2000/2500 Linked Index | | | (25.26)% | | | (1.77)% | | | 2.34% | |
| | | | | | | | | | | |
Russell 2000 Index | | | (25.01)% | | | (1.71)% | | | 2.38% | |
| | | | | | | | | | | |
| |
* | All returns reflect reinvestment of all dividends and distributions, if any. Certain expenses of the Portfolio have been waived or reimbursed by the Portfolio’s Investment Manager or Administrator; without such waiver/reimbursement of expenses, the Portfolio’s returns would have been lower. Performance information does not reflect the fees and charges imposed by participating insurance companies at the separate account level, and such charges will have the effect of reducing performance. |
| |
| The performance quoted represents past performance. Current performance may be lower or higher than the performance quoted. Past performance is not indicative, nor a guarantee, of future results; the investment return and principal value of the Portfolio will fluctuate, so that Portfolio shares, when redeemed, may be worth more or less than their original cost. Within the longer periods illustrated there may have been short-term fluctuations, counter to the overall trend of investment results, and no single period of any length may be taken as typical of what may be expected in future periods. |
| |
| The performance data of the indices have been prepared from sources and data that the Investment Manager believes to be reliable, but no representation is made as to their accuracy. The Russell 2500 Index is comprised of the 2,500 smallest U.S. companies included in the Russell 3000® Index (which consists of the 3,000 largest U.S. companies by capitalization). The Russell 2000/2500 Linked Index is an index created by the Portfolio’s Investment Manager, which links the performance of the Russell 2000 Index for all periods prior to June 1, 2009 and the Russell 2500 Index for all periods after May 31, 2009. The Russell 2000 Index is comprised of the 2,000 smallest U.S. companies included in the Russell 3000 Index. The indices are unmanaged, have no fees or costs and are not available for investment. |
| |
| The Portfolio was previously known as Lazard Retirement Small Cap Portfolio (prior to May 1, 2008) and as Lazard Retirement U.S. Small Cap Equity Portfolio (between May 1, 2008 and May 31, 2009). As of June 1, 2009, the Portfolio changed its name to Lazard U.S. Small-Mid Cap Equity Portfolio and changed its investment strategy, to invest in equity securities of small-mid cap U.S. companies. |
8 Semi-Annual Report
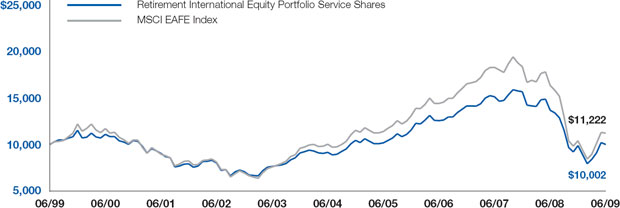
Lazard Retirement International Equity Portfolio
Comparison of Changes in Value of $10,000 Investment in the Service Shares of Lazard Retirement International Equity Portfolio and Morgan Stanley Capital International (MSCI®) Europe, Australasia and Far East (EAFE®) Index*
| | | | | | | | | | |
Average Annual Total Returns*
Periods Ended June 30, 2009 | | | | | | | |
| | | | | | |
| | One
Year | | Five
Years | | Ten
Years | |
Retirement International Equity Portfolio | | | | | | | | | | |
| | | | | | | | | | | |
Service Shares | | | (26.95)% | | | 1.79% | | | 0.00% | |
| | | | | | | | | | | |
MSCI EAFE Index | | | (31.35)% | | | 2.31% | | | 1.16% | |
| | | | | | | | | | | |
| |
* | All returns reflect reinvestment of all dividends and distributions, if any. Certain expenses of the Portfolio have been waived or reimbursed by the Portfolio’s Investment Manager or Administrator; without such waiver/reimbursement of expenses, the Portfolio’s returns would have been lower. Performance information does not reflect the fees and charges imposed by participating insurance companies at the separate account level, and such charges will have the effect of reducing performance. |
| |
| The performance quoted represents past performance. Current performance may be lower or higher than the performance quoted. Past performance is not indicative, nor a guarantee, of future results; the investment return and principal value of the Portfolio will fluctuate, so that Portfolio shares, when redeemed, may be worth more or less than their original cost. Within the longer periods illustrated there may have been short-term fluctuations, counter to the overall trend of investment results, and no single period of any length may be taken as typical of what may be expected in future periods. |
| |
| The performance data of the index has been prepared from sources and data that the Investment Manager believes to be reliable, but no representation is made as to its accuracy. The MSCI EAFE Index is a broadly diversified international index comprised of equity securities of approximately 1,000 companies located outside the United States. The index is unmanaged, has no fees or costs and is not available for investment. |
Semi-Annual Report 9
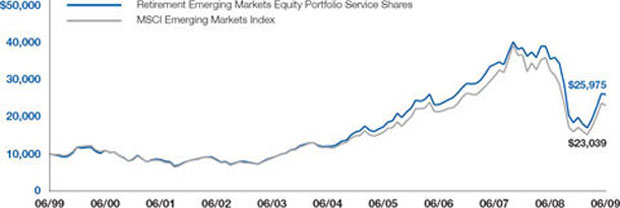
Lazard Retirement Emerging Markets Equity Portfolio
Comparison of Changes in Value of $10,000 Investment in the Service Shares of Lazard Retirement Emerging Markets Equity Portfolio and MSCI Emerging Markets Index*
| | | | | | | | | | | | | | | | |
Average Annual Total Returns* | | | | | | | | | | | | | | | | |
Periods Ended June 30, 2009 | | | | | |
| | | Service Shares | | Investor Shares | |
| | One
Year | | Five
Years | | Ten
Years | | One
Year | | Since
Inception | † |
| | | | | | | | | | | | |
Retirement Emerging Markets Equity Portfolio** | | | (26.80)% | | | 16.69% | | | 10.02% | | | (26.58)% | | | (0.03)% | |
| | | | | | | | | | | | | | | | | |
MSCI Emerging Markets Index | | | (28.07)% | | | 14.72% | | | 8.70% | | | (28.07)% | | | (1.38)% | |
| | | | | | | | | | | | | | | | | |
| |
* | All returns reflect reinvestment of all dividends and distributions, if any. Certain expenses of the Portfolio have been waived or reimbursed by the Portfolio’s Investment Manager or Administrator; without such waiver/reimbursement of expenses, the Portfolio’s returns would have been lower. Performance information does not reflect the fees and charges imposed by participating insurance companies at the separate account level, and such charges will have the effect of reducing performance. |
| |
| The performance quoted represents past performance. Current performance may be lower or higher than the performance quoted. Past performance is not indicative, nor a guarantee, of future results; the investment return and principal value of the Portfolio will fluctuate, so that Portfolio shares, when redeemed, may be worth more or less than their original cost. Within the longer periods illustrated there may have been short-term fluctuations, counter to the overall trend of investment results, and no single period of any length may be taken as typical of what may be expected in future periods. |
| |
| The performance data of the index has been prepared from sources and data that the Investment Manager believes to be reliable, but no representation is made as to its accuracy. The MSCI Emerging Markets Index is comprised of emerging market securities in countries open to non-local investors. The index is unmanaged, has no fees or costs and is not available for investment. |
| |
| Before May 1, 2008, the Portfolio was known as Lazard Retirement Emerging Markets Portfolio. |
| |
** | The performance of Service Shares may be greater than or less than the performance of Investor Shares, based on the differences in fees borne by shareholders investing in different classes. |
| |
† | The inception date for Investor Shares was May 1, 2006. |
10 Semi-Annual Report
|
|
Lazard Retirement Series, Inc. Information About Your Portfolio’s Expenses (unaudited) |
|
Expense Example
As a shareholder in a Portfolio of the Fund, you incur ongoing costs, including management fees, distribution and service (12b-1) fees (Service Shares only), and other expenses. This Example is intended to help you understand your ongoing costs (in dollars) of investing in a Portfolio and to compare these costs with the ongoing costs of investing in other mutual funds. The Example is based on an investment of $1,000 invested at the beginning of the six month period from January 1, 2009 through June 30, 2009 and held for the entire period.
Actual Expenses
For each Share class of the Portfolios, the first line of the table below provides information about actual account values and actual expenses. You may use the information in this line, together with the amount you invested, to estimate the expenses that you paid over the period. Simply divide your account value by $1,000 (for example, an $8,600 account value divided by $1,000=8.6), then multiply the result by the number in the first line under the heading entitled “Expenses Paid During Period” to estimate the expenses you paid on your account during this period.
Hypothetical Example for Comparison Purposes
For each Share class of the Portfolios, the second line of the table below provides information about hypothetical account values and hypothetical expenses based on the class’ actual expense ratio and an assumed rate of return of 5% per year before expenses, which is not the Portfolio’s actual return. The hypothetical account values and expenses may not be used to estimate the actual ending account balance or expenses you paid for the period. You may use this information to compare the ongoing costs of investing in the Portfolio and other mutual funds. To do so, compare this 5% hypothetical example with the 5% hypothetical examples that appear in the shareholders reports of the other funds.
Please note that you also bear fees and charges imposed by participating insurance companies at the separate account level, which are described in the separate prospectuses issued by the insurance companies. Such charges will have the effect of reducing Account Value.
| | | | | | | | | | | | | | | | | | | |
| | Beginning
Account Value | | Ending
Account Value | | Expenses Paid
During Period* | | Annualized
Expense Ratio
During Period | |
| | | | | | | | |
| | 1/1/09 | | 6/30/09 | | 1/1/09 - 6/30/09 | | 1/1/09 - 6/30/09 | |
| | | | | | | | |
| | | | | | | | | | | | | | | | | | | |
Retirement U.S. Strategic Equity Portfolio | | | | | | | | | | | | | | | | | | | |
Service Shares | | | | | | | | | | | | | | | | | | | |
Actual | | | $ | 1,000.00 | | | | $ | 1,049.20 | | | | $ | 6.35 | | | 1.25 | % | |
Hypothetical (5% Return Before Expenses) | | | $ | 1,000.00 | | | | $ | 1,018.60 | | | | $ | 6.26 | | | 1.25 | % | |
| | | | | | | | | | | | | | | | | | | |
Retirement U.S. Small-Mid Cap Equity Portfolio | | | | | | | | | | | | | | | | | | | |
Service Shares | | | | | | | | | | | | | | | | | | | |
Actual | | | $ | 1,000.00 | | | | $ | 1,149.80 | | | | $ | 6.66 | | | 1.25 | % | |
Hypothetical (5% Return Before Expenses) | | | $ | 1,000.00 | | | | $ | 1,018.60 | | | | $ | 6.26 | | | 1.25 | % | |
| | | | | | | | | | | | | | | | | | | |
Retirement International Equity Portfolio | | | | | | | | | | | | | | | | | | | |
Service Shares | | | | | | | | | | | | | | | | | | | |
Actual | | | $ | 1,000.00 | | | | $ | 1,012.20 | | | | $ | 6.15 | | | 1.23 | % | |
Hypothetical (5% Return Before Expenses) | | | $ | 1,000.00 | | | | $ | 1,018.68 | | | | $ | 6.17 | | | 1.23 | % | |
| | | | | | | | | | | | | | | | | | | |
Retirement Emerging Markets Equity Portfolio | | | | | | | | | | | | | | | | | | | |
Service Shares | | | | | | | | | | | | | | | | | | | |
Actual | | | $ | 1,000.00 | | | | $ | 1,312.30 | | | | $ | 9.17 | | | 1.60 | % | |
Hypothetical (5% Return Before Expenses) | | | $ | 1,000.00 | | | | $ | 1,016.86 | | | | $ | 8.00 | | | 1.60 | % | |
|
Investor Shares | | | | | | | | | | | | | | | | | | | |
Actual | | | $ | 1,000.00 | | | | $ | 1,314.30 | | | | $ | 7.75 | | | 1.35 | % | |
Hypothetical (5% Return Before Expenses) | | | $ | 1,000.00 | | | | $ | 1,018.10 | | | | $ | 6.76 | | | 1.35 | % | |
| |
* | Expenses are equal to the Portfolio’s annualized expense ratio multiplied by the average account value over the period, multiplied by 181/365 (to reflect one-half year period). |
Semi-Annual Report 11
|
|
Lazard Retirement Series, Inc. Portfolio Holdings Presented by Sector June 30, 2009 (unaudited) |
|
| | | | | | | | | | | | | | | | | | | | | |
Sector* | | Lazard
Retirement
U.S. Strategic
Equity Portfolio | | Lazard
Retirement
U.S. Small-Mid Cap
Equity Portfolio | | Lazard
Retirement
International
Equity Portfolio | | Lazard
Retirement
Emerging Markets
Equity Portfolio | |
| | | | | | | | | | |
Consumer Discretionary | | | 9.4 | % | | | | 16.0 | % | | | | 3.8 | % | | | | 7.1 | % | | |
Consumer Staples | | | 13.0 | | | | | 6.8 | | | | | 13.2 | | | | | 11.0 | | | |
Energy | | | 13.0 | | | | | 6.0 | | | | | 11.2 | | | | | 9.7 | | | |
Financials | | | 11.4 | | | | | 14.4 | | | | | 22.9 | | | | | 21.2 | | | |
Health Care | | | 15.2 | | | | | 10.6 | | | | | 7.4 | | | | | — | | | |
Industrials | | | 11.5 | | | | | 19.1 | | | | | 12.0 | | | | | 7.5 | | | |
Information Technology | | | 18.0 | | | | | 16.7 | | | | | 8.5 | | | | | 12.3 | | | |
Materials | | | 3.9 | | | | | 6.1 | | | | | 1.8 | | | | | 8.6 | | | |
Telecommunication Services | | | 1.9 | | | | | — | | | | | 8.0 | | | | | 13.1 | | | |
Utilities | | | 1.4 | | | | | 2.1 | | | | | 4.9 | | | | | 1.5 | | | |
Short-Term Investments | | | 1.3 | | | | | 2.2 | | | | | 6.3 | | | | | 8.0 | | | |
| | | | | | | | | | | | | | | | | | | | | |
Total Investments | | | 100.0 | % | | | | 100.0 | % | | | | 100.0 | % | | | | 100.0 | % | | |
| | | | | | | | | | | | | | | | | | | | | |
| |
* | Represents percentage of total investments. |
12 Semi-Annual Report
|
|
Lazard Retirement Series, Inc. Portfolios of Investments June 30, 2009 (unaudited) |
|
| | | | | | | |
Description | | Shares | | Value | |
| | | | | | |
Lazard Retirement U.S. Strategic Equity Portfolio | | | | |
| | | | | | | |
Common Stocks—99.1% | | | | | | | |
| | | | | | | |
Aerospace & Defense—1.6% | | | | | | | |
Raytheon Co. | | | 1,420 | | $ | 63,091 | |
| | | | | | | |
| | | | | | | |
Alcohol & Tobacco—2.5% | | | | | | | |
Molson Coors Brewing Co., Class B | | | 2,290 | | | 96,936 | |
| | | | | | | |
| | | | | | | |
Banking—5.8% | | | | | | | |
Bank of America Corp. | | | 4,000 | | | 52,800 | |
Bank of New York Mellon Corp. | | | 2,100 | | | 61,551 | |
JPMorgan Chase & Co. | | | 3,260 | | | 111,199 | |
| | | | | | | |
| | | | | | 225,550 | |
| | | | | | | |
| | | | | | | |
Cable Television—4.2% | | | | | | | |
Comcast Corp., Class A | | | 11,460 | | | 161,586 | |
| | | | | | | |
| | | | | | | |
Chemicals—1.9% | | | | | | | |
Air Products & Chemicals, Inc. | | | 1,145 | | | 73,956 | |
| | | | | | | |
| | | | | | | |
Commercial Services—2.2% | | | | | | | |
Corrections Corp. of America (a) | | | 2,300 | | | 39,077 | |
Republic Services, Inc. | | | 1,980 | | | 48,332 | |
| | | | | | | |
| | | | | | 87,409 | |
| | | | | | | |
| | | | | | | |
Computer Software—7.0% | | | | | | | |
Google, Inc., Class A (a) | | | 90 | | | 37,943 | |
Microsoft Corp. | | | 4,920 | | | 116,948 | |
Oracle Corp. | | | 2,940 | | | 62,975 | |
Symantec Corp. (a) | | | 3,550 | | | 55,238 | |
| | | | | | | |
| | | | | | 273,104 | |
| | | | | | | |
| | | | | | | |
Construction & Engineering—0.6% | | | | | | | |
Foster Wheeler AG (a) | | | 900 | | | 21,375 | |
| | | | | | | |
| | | | | | | |
Consumer Products—2.1% | | | | | | | |
Mattel, Inc. | | | 4,990 | | | 80,089 | |
| | | | | | | |
| | | | | | | |
Drugs—6.4% | | | | | | | |
Gilead Sciences, Inc. (a) | | | 1,040 | | | 48,714 | |
Merck & Co., Inc. | | | 1,500 | | | 41,940 | |
Pfizer, Inc. | | | 5,620 | | | 84,300 | |
Wyeth | | | 1,650 | | | 74,893 | |
| | | | | | | |
| | | | | | 249,847 | |
| | | | | | | |
| | | | | | | |
Description | | Shares | | Value | |
| | | | | | |
Electric—1.4% | | | | | | | |
American Electric Power Co., Inc. | | | 1,910 | | $ | 55,180 | |
| | | | | | | |
| | | | | | | |
Energy Exploration & Production—4.9% | | | | | | | |
Apache Corp. | | | 1,040 | | | 75,036 | |
EOG Resources, Inc. | | | 655 | | | 44,488 | |
Occidental Petroleum Corp. | | | 1,110 | | | 73,049 | |
| | | | | | | |
| | | | | | 192,573 | |
| | | | | | | |
| | | | | | | |
Energy Integrated—6.9% | | | | | | | |
Chevron Corp. | | | 800 | | | 53,000 | |
Exxon Mobil Corp. | | | 1,825 | | | 127,586 | |
Marathon Oil Corp. | | | 1,340 | | | 40,374 | |
Massey Energy Co. | | | 1,570 | | | 30,678 | |
Valero Energy Corp. | | | 1,100 | | | 18,579 | |
| | | | | | | |
| | | | | | 270,217 | |
| | | | | | | |
| | | | | | | |
Energy Services—1.2% | | | | | | | |
BJ Services Co. | | | 3,535 | | | 48,182 | |
| | | | | | | |
| | | | | | | |
Financial Services—2.2% | | | | | | | |
Ameriprise Financial, Inc. | | | 2,350 | | | 57,034 | |
Morgan Stanley | | | 1,000 | | | 28,510 | |
| | | | | | | |
| | | | | | 85,544 | |
| | | | | | | |
| | | | | | | |
Food & Beverages—3.8% | | | | | | | |
Campbell Soup Co. | | | 2,100 | | | 61,782 | |
Kellogg Co. | | | 900 | | | 41,913 | |
The Coca-Cola Co. | | | 950 | | | 45,590 | |
| | | | | | | |
| | | | | | 149,285 | |
| | | | | | | |
| | | | | | | |
Forest & Paper Products—2.3% | | | | | | | |
Kimberly-Clark Corp. | | | 1,730 | | | 90,704 | |
| | | | | | | |
| | | | | | | |
Health Services—1.8% | | | | | | | |
UnitedHealth Group, Inc. | | | 2,800 | | | 69,944 | |
| | | | | | | |
| | | | | | | |
Insurance—2.2% | | | | | | | |
PartnerRe, Ltd. | | | 675 | | | 43,841 | |
The Travelers Cos., Inc. | | | 1,050 | | | 43,092 | |
| | | | | | | |
| | | | | | 86,933 | |
| | | | | | | |
| | | | | | | |
Leisure & Entertainment—1.3% | | | | | | | |
Starbucks Corp. (a) | | | 3,630 | | | 50,421 | |
| | | | | | | |
| | | | | | | |
Manufacturing—5.2% | | | | | | | |
Deere & Co. | | | 1,180 | | | 47,141 | |
Dover Corp. | | | 1,320 | | | 43,679 | |
Honeywell International, Inc. | | | 2,350 | | | 73,790 | |
|
The accompanying notes are an integral part of these financial statements. |
|
Semi-Annual Report 13 |
| | | | | | | |
Description | | Shares | | Value | |
| | | | | | |
Lazard Retirement U.S. Strategic Equity Portfolio
(concluded) |
|
Parker Hannifin Corp. | | | 860 | | $ | 36,945 | |
| | | | | | | |
| | | | | | 201,555 | |
| | | | | | | |
| | | | | | | |
Medical Products—7.1% | | | | | | | |
Becton, Dickinson & Co. | | | 600 | | | 42,786 | |
Johnson & Johnson | | | 3,280 | | | 186,304 | |
Medtronic, Inc. | | | 1,380 | | | 48,148 | |
| | | | | | | |
| | | | | | 277,238 | |
| | | | | | | |
| | | | | | | |
Metal & Glass Containers—2.0% | | | | | | | |
Ball Corp. | | | 1,700 | | | 76,772 | |
| | | | | | | |
| | | | | | | |
Real Estate—1.3% | | | | | | | |
Public Storage REIT | | | 745 | | | 48,783 | |
| | | | | | | |
| | | | | | | |
Retail—6.3% | | | | | | | |
CVS Caremark Corp. | | | 1,290 | | | 41,112 | |
The Gap, Inc. | | | 3,510 | | | 57,564 | |
The Kroger Co. | | | 1,700 | | | 37,485 | |
Tiffany & Co. | | | 690 | | | 17,499 | |
Walgreen Co. | | | 3,160 | | | 92,904 | |
| | | | | | | |
| | | | | | 246,564 | |
| | | | | | | |
| | | | | | | |
Semiconductors & Components—3.5% | | | | | | | |
Analog Devices, Inc. | | | 1,820 | | | 45,100 | |
Applied Materials, Inc. | | | 4,260 | | | 46,732 | |
Intel Corp. | | | 2,700 | | | 44,685 | |
| | | | | | | |
| | | | | | 136,517 | |
| | | | | | | |
| | | | | | | |
Technology—1.1% | | | | | | | |
eBay, Inc. (a) | | | 2,380 | | | 40,769 | |
| | | | | | | |
| | | | | | | |
Description | | Shares | | Value | |
| | | | | | |
Technology Hardware—6.5% | | | | | | | |
Cisco Systems, Inc. (a) | | | 5,000 | | $ | 93,200 | |
Hewlett-Packard Co. | | | 1,650 | | | 63,772 | |
International Business Machines Corp. | | | 940 | | | 98,155 | |
| | | | | | | |
| | | | | | 255,127 | |
| | | | | | | |
| | | | | | | |
Telecommunications—1.9% | | | | | | | |
Verizon Communications, Inc. | | | 2,370 | | | 72,830 | |
| | | | | | | |
| | | | | | | |
Transportation—1.9% | | | | | | | |
Union Pacific Corp. | | | 700 | | | 36,442 | |
United Parcel Service, Inc., Class B | | | 780 | | | 38,992 | |
| | | | | | | |
| | | | | | 75,434 | |
| | | | | | | |
| | | | | | | |
Total Common Stocks | | | | | | | |
(Identified cost $3,860,411) | | | | | | 3,863,515 | |
| | | | | | | |
| | | | | | | |
Short-Term Investment—1.3% | | | | | | | |
State Street Institutional Treasury | | | | | | | |
Money Market Fund, 0.02% | | | | | | | |
(Identified cost $51,889) (b) | | | 51,889 | | | 51,889 | |
| | | | | | | |
| | | | | | | |
Total Investments—100.4% | | | | | | | |
(Identified cost $3,912,300) (c) | | | | | $ | 3,915,404 | |
| | | | | | | |
Liabilities in Excess of Cash and | | | | | | | |
Other Assets—(0.4)% | | | | | | (17,257 | ) |
| | | | | | | |
| | | | | | | |
Net Assets—100.0% | | | | | $ | 3,898,147 | |
| | | | | | | |
|
The accompanying notes are an integral part of these financial statements. |
|
14 Semi-Annual Report |
| | | | | | | |
Description | | Shares | | Value | |
| | | | | | |
Lazard Retirement U.S. Small-Mid Cap Equity Portfolio |
| | | | | | | |
Common Stocks—38.4% | | | | | | | |
| | | | | | | |
Aerospace & Defense—0.2% | | | | | | | |
Spirit AeroSystems Holdings, Inc., | | | | | | | |
Class A (a) | | | 14,900 | | $ | 204,726 | |
| | | | | | | |
| | | | | | | |
Alcohol & Tobacco—0.4% | | | | | | | |
Molson Coors Brewing Co., Class B | | | 9,300 | | | 393,669 | |
| | | | | | | |
| | | | | | | |
Banking—1.6% | | | | | | | |
PacWest Bancorp | | | 46,700 | | | 614,572 | |
Prosperity Bancshares, Inc. | | | 19,300 | | | 575,719 | |
Wintrust Financial Corp. | | | 25,900 | | | 416,472 | |
| | | | | | | |
| | | | | | 1,606,763 | |
| | | | | | | |
| | | | | | | |
Chemicals—0.9% | | | | | | | |
Innospec, Inc. | | | 5,600 | | | 60,200 | |
Rockwood Holdings, Inc. (a) | | | 53,700 | | | 786,168 | |
| | | | | | | |
| | | | | | 846,368 | |
| | | | | | | |
| | | | | | | |
Commercial Services—1.8% | | | | | | | |
Corrections Corp. of America (a) | | | 44,100 | | | 749,259 | |
DST Systems, Inc. (a) | | | 8,800 | | | 325,160 | |
Team, Inc. (a) | | | 19,800 | | | 310,266 | |
Waste Connections, Inc. (a) | | | 16,300 | | | 422,333 | |
| | | | | | | |
| | | | | | 1,807,018 | |
| | | | | | | |
| | | | | | | |
Computer Software—1.5% | | | | | | | |
Ariba, Inc. (a) | | | 37,500 | | | 369,000 | |
Informatica Corp. (a) | | | 24,600 | | | 422,874 | |
j2 Global Communications, Inc. (a) | | | 17,400 | | | 392,544 | |
Quest Software, Inc. (a) | | | 23,100 | | | 322,014 | |
| | | | | | | |
| | | | | | 1,506,432 | |
| | | | | | | |
| | | | | | | |
Construction & Engineering—0.9% | | | | | | | |
Dycom Industries, Inc. (a) | | | 52,500 | | | 581,175 | |
Great Lakes Dredge & Dock Co. | | | 71,200 | | | 340,336 | |
| | | | | | | |
| | | | | | 921,511 | |
| | | | | | | |
| | | | | | | |
Consumer Products—3.9% | | | | | | | |
Bare Escentuals, Inc. (a) | | | 55,600 | | | 493,172 | |
Central Garden & Pet Co., Class A (a) | | | 32,200 | | | 317,170 | |
Chattem, Inc. (a) | | | 6,700 | | | 456,270 | |
Mattel, Inc. | | | 36,500 | | | 585,825 | |
Matthews International Corp., Class A | | | 27,300 | | | 849,576 | |
Polaris Industries, Inc. | | | 11,100 | | | 356,532 | |
Tempur-Pedic International, Inc. | | | 26,200 | | | 342,434 | |
| | | | | | | |
Description | | Shares | | Value | |
| | | | | | |
The Middleby Corp. (a) | | | 10,700 | | $ | 469,944 | |
| | | | | | | |
| | | | | | 3,870,923 | |
| | | | | | | |
| | | | | | | |
Drugs—1.3% | | | | | | | |
Myriad Genetics, Inc. (a) | | | 8,000 | | | 285,200 | |
United Therapeutics Corp. (a) | | | 5,000 | | | 416,650 | |
Warner Chilcott, Ltd., Class A (a) | | | 44,200 | | | 581,230 | |
| | | | | | | |
| | | | | | 1,283,080 | |
| | | | | | | |
| | | | | | | |
Electric—0.8% | | | | | | | |
Hawaiian Electric Industries, Inc. | | | 43,700 | | | 832,922 | |
| | | | | | | |
| | | | | | | |
Energy Exploration & Production—1.0% | | | | | | | |
Cabot Oil & Gas Corp. | | | 16,000 | | | 490,240 | |
Petrohawk Energy Corp. (a) | | | 22,700 | | | 506,210 | |
| | | | | | | |
| | | | | | 996,450 | |
| | | | | | | |
| | | | | | | |
Energy Services—1.0% | | | | | | | |
Helmerich & Payne, Inc. | | | 17,000 | | | 524,790 | |
Superior Energy Services, Inc. (a) | | | 26,000 | | | 449,020 | |
| | | | | | | |
| | | | | | 973,810 | |
| | | | | | | |
| | | | | | | |
Financial Services—1.7% | | | | | | | |
Genesis Lease, Ltd. ADS | | | 59,100 | | | 254,721 | |
Jefferies Group, Inc. (a) | | | 22,600 | �� | | 482,058 | |
Piper Jaffray Cos., Inc. (a) | | | 13,300 | | | 580,811 | |
Waddell & Reed Financial, Inc., Class A | | | 15,100 | | | 398,187 | |
| | | | | | | |
| | | | | | 1,715,777 | |
| | | | | | | |
| | | | | | | |
Food & Beverages—1.0% | | | | | | | |
American Italian Pasta Co., Class A (a) | | | 12,700 | | | 370,078 | |
McCormick & Co., Inc. | | | 18,600 | | | 605,058 | |
| | | | | | | |
| | | | | | 975,136 | |
| | | | | | | |
| | | | | | | |
Health Services—0.4% | | | | | | | |
Healthcare Services Group, Inc. | | | 24,700 | | | 441,636 | |
| | | | | | | |
| | | | | | | |
Housing—0.8% | | | | | | | |
Beacon Roofing Supply, Inc. (a) | | | 12,000 | | | 173,520 | |
Trex Co., Inc. (a) | | | 43,200 | | | 577,584 | |
| | | | | | | |
| | | | | | 751,104 | |
| | | | | | | |
| | | | | | | |
Insurance—1.0% | | | | | | | |
Max Capital Group, Ltd. | | | 33,800 | | | 623,948 | |
RenaissanceRe Holdings, Ltd. | | | 7,300 | | | 339,742 | |
| | | | | | | |
| | | | | | 963,690 | |
| | | | | | | |
| | | | | | | |
Leisure & Entertainment—1.5% | | | | | | | |
Burger King Holdings, Inc. | | | 21,200 | | | 366,124 | |
Lions Gate Entertainment Corp. (a) | | | 68,700 | | | 384,720 | |
Texas Roadhouse, Inc., Class A (a) | | | 26,200 | | | 285,842 | |
Viacom, Inc., Class B (a) | | | 18,400 | | | 417,680 | |
| | | | | | | |
| | | | | | 1,454,366 | |
| | | | | | | |
|
The accompanying notes are an integral part of these financial statements. |
|
Semi-Annual Report 15 |
| | | | | | | |
Description | | Shares | | Value | |
| | | | | | |
Lazard Retirement U.S. Small-Mid Cap Equity Portfolio (concluded) |
| | | | | | | |
Manufacturing—2.0% | | | | | | | |
Dover Corp. | | | 9,000 | | $ | 297,810 | |
Ener1, Inc. (a) | | | 35,400 | | | 193,284 | |
FLIR Systems, Inc. (a) | | | 17,700 | | | 399,312 | |
Force Protection, Inc. (a) | | | 30,600 | | | 270,504 | |
Kaman Corp. | | | 19,600 | | | 327,320 | |
Maxwell Technologies, Inc. (a) | | | 5,700 | | | 78,831 | |
Regal-Beloit Corp. | | | 9,700 | | | 385,284 | |
| | | | | | | |
| | | | | | 1,952,345 | |
| | | | | | | |
Medical Products—2.9% | | | | | | | |
Boston Scientific Corp. (a) | | | 27,700 | | | 280,878 | |
Hospira, Inc. (a) | | | 19,800 | | | 762,696 | |
Intuitive Surgical, Inc. (a) | | | 3,300 | | | 540,078 | |
Life Technologies Corp. (a) | | | 14,000 | | | 584,080 | |
Wright Medical Group, Inc. (a) | | | 41,700 | | | 678,042 | |
| | | | | | | |
| | | | | | 2,845,774 | |
| | | | | | | |
Metal & Glass Containers—0.5% | | | | | | | |
Ball Corp. | | | 11,100 | | | 501,276 | |
| | | | | | | |
| | | | | | | |
Metals & Mining—1.1% | | | | | | | |
AK Steel Holding Corp. | | | 11,300 | | | 216,847 | |
Freeport-McMoRan Copper & Gold, Inc. | | | 7,850 | | | 393,364 | |
Reliance Steel & Aluminum Co. | | | 11,400 | | | 437,646 | |
| | | | | | | |
| | | | | | 1,047,857 | |
| | | | | | | |
Real Estate—1.6% | | | | | | | |
Digital Realty Trust, Inc. REIT | | | 9,900 | | | 354,915 | |
Simon Property Group, Inc. REIT | | | 7,200 | | | 370,296 | |
Tanger Factory Outlet Centers, Inc. REIT | | | 18,100 | | | 586,983 | |
The Macerich Co. REIT | | | 14,972 | | | 263,657 | |
| | | | | | | |
| | | | | | 1,575,851 | |
| | | | | | | |
Retail—2.6% | | | | | | | |
American Eagle Outfitters, Inc. | | | 40,200 | | | 569,634 | |
Deckers Outdoor Corp. (a) | | | 4,400 | | | 309,188 | |
Iconix Brand Group, Inc. (a) | | | 42,300 | | | 650,574 | |
Liz Claiborne, Inc. | | | 92,500 | | | 266,400 | |
The Children’s Place Retail Stores, Inc. (a) | | | 16,200 | | | 428,166 | |
The Gymboree Corp. (a) | | | 11,500 | | | 408,020 | |
| | | | | | | |
| | | | | | 2,631,982 | |
| | | | | | | |
| | | | | | | |
Description | | Shares | | Value | |
| | | | | | | | |
Semiconductors & Components—1.6% | | | | | | | |
Analog Devices, Inc. | | | 12,800 | | $ | 317,184 | |
CPI International, Inc. (a) | | | 22,100 | | | 192,049 | |
ON Semiconductor Corp. (a) | | | 93,600 | | | 642,096 | |
Plexus Corp. (a) | | | 20,500 | | | 419,430 | |
| | | | | | | |
| | | | | | 1,570,759 | |
| | | | | | | |
Technology—0.4% | | | | | | | |
Solera Holdings, Inc. (a) | | | 16,700 | | | 424,180 | |
| | | | | | | |
| | | | | | | |
Technology Hardware—1.8% | | | | | | | |
Ingram Micro, Inc., Class A (a) | | | 38,400 | | | 672,000 | |
LogMeIn, Inc. | | | 900 | | | 14,400 | |
Polycom, Inc. (a) | | | 34,900 | | | 707,423 | |
Seagate Technology | | | 40,800 | | | 426,768 | |
| | | | | | | |
| | | | | | 1,820,591 | |
| | | | | | | |
Telecommunications—0.4% | | | | | | | |
Starent Networks Corp. (a) | | | 15,800 | | | 385,678 | |
| | | | | | | |
| | | | | | | |
Transportation—1.8% | | | | | | | |
Continental Airlines, Inc., Class B (a) | | | 56,000 | | | 496,160 | |
Genesee & Wyoming, Inc., Class A (a) | | | 18,000 | | | 477,180 | |
Tidewater, Inc. | | | 8,500 | | | 364,395 | |
UTI Worldwide, Inc. (a) | | | 41,500 | | | 473,100 | |
| | | | | | | |
| | | | | | 1,810,835 | |
| | | | | | | |
Total Common Stocks | | | | | | | |
(Identified cost $35,968,365) | | | | | | 38,112,509 | |
| | | | | | | |
| | | | | | | |
Short-Term Investment—0.8% | | | | | | | |
State Street Institutional Treasury | | | | | | | |
Money Market Fund, 0.02% | | | | | | | |
(Identified cost $851,545) (b) | | | 851,545 | | | 851,545 | |
| | | | | | | |
| | | | | | | |
Total Investments—39.2% | | | | | | | |
(Identified cost $36,819,910) (c) | | | | | $ | 38,964,054 | |
| | | | | | | |
Cash and Other Assets in Excess | | | | | | | |
of Liabilities—60.8% | | | | | | 60,358,058 | |
| | | | | | | |
| | | | | | | |
Net Assets—100.0% | | | | | $ | 99,322,112 | |
| | | | | | | |
The accompanying notes are an integral part of these financial statements.
16 Semi-Annual Report
| | | | | | | |
Description | | Shares | | Value | |
| | | | | | | | |
Lazard Retirement International Equity Portfolio | | | |
| | | | | | | |
Common Stocks—108.4% | | | | | | | |
| | | | | | | |
Belgium—2.0% | | | | | | | |
Anheuser-Busch InBev NV | | | 126,900 | | $ | 4,582,275 | |
| | | | | | | |
| | | | | | | |
Brazil—2.4% | | | | | | | |
Banco do Brasil SA | | | 280,600 | | | 3,032,972 | |
Cia Brasileira de Meios de Pagamento | | | 160,900 | | | 1,383,600 | |
Vale SA Sponsored ADR | | | 67,100 | | | 1,182,973 | |
| | | | | | | |
Total Brazil | | | | | | 5,599,545 | |
| | | | | | | |
| | | | | | | |
Canada—1.5% | | | | | | | |
Telus Corp. | | | 129,800 | | | 3,442,660 | |
| | | | | | | |
| | | | | | | |
China—1.1% | | | | | | | |
Industrial and Commercial Bank of
China, Ltd., Class H | | | 3,435,800 | | | 2,398,395 | |
| | | | | | | |
| | | | | | | |
Denmark—1.1% | | | | | | | |
Novo Nordisk A/S | | | 46,625 | | | 2,520,769 | |
| | | | | | | |
| | | | | | | |
Finland—2.9% | | | | | | | |
Nokia Corp. | | | 459,840 | | | 6,734,700 | |
| | | | | | | |
| | | | | | | |
France—13.3% | | | | | | | |
BNP Paribas | | | 90,100 | | | 5,845,848 | |
Bouygues SA | | | 69,200 | | | 2,601,668 | |
Danone SA | | | 49,408 | | | 2,438,395 | |
GDF Suez | | | 132,400 | | | 4,929,466 | |
Sanofi-Aventis | | | 111,780 | | | 6,565,655 | |
Total SA | | | 151,172 | | | 8,160,512 | |
| | | | | | | |
Total France | | | | | | 30,541,544 | |
| | | | | | | |
| | | | | | | |
Germany—10.6% | | | | | | | |
Allianz SE | | | 56,800 | | | 5,229,519 | |
Daimler AG | | | 70,900 | | | 2,564,130 | |
Deutsche Bank AG | | | 39,300 | | | 2,381,426 | |
E.ON AG | | | 172,600 | | | 6,106,563 | |
Merck KGaA | | | 24,030 | | | 2,444,009 | |
Siemens AG | | | 79,438 | | | 5,478,367 | |
| | | | | | | |
Total Germany | | | | | | 24,204,014 | |
| | | | | | | |
| | | | | | | |
Description | | Shares | | Value | |
| | | | | | | | |
Greece—1.3% | | | | | | | |
OPAP SA | | | 110,687 | | $ | 2,950,266 | |
| | | | | | | |
| | | | | | | |
Hong Kong—0.9% | | | | | | | |
Esprit Holdings, Ltd. | | | 359,000 | | | 2,012,703 | |
| | | | | | | |
| | | | | | | |
Ireland—1.6% | | | | | | | |
CRH PLC | | | 161,131 | | | 3,684,493 | |
| | | | | | | |
| | | | | | | |
Italy—3.7% | | | | | | | |
Atlantia SpA | | | 120,050 | | | 2,425,133 | |
Eni SpA | | | 260,195 | | | 6,150,492 | |
| | | | | | | |
Total Italy | | | | | | 8,575,625 | |
| | | | | | | |
| | | | | | | |
Japan—19.5% | | | | | | | |
Canon, Inc. | | | 159,100 | | | 5,218,830 | |
Daito Trust Construction Co., Ltd. | | | 102,600 | | | 4,856,553 | |
Fanuc, Ltd. | | | 30,800 | | | 2,481,009 | |
Hoya Corp. | | | 147,000 | | | 2,954,191 | |
Inpex Corp. | | | 339 | | | 2,716,645 | |
Japan Tobacco, Inc. | | | 1,396 | | | 4,376,312 | |
KDDI Corp. | | | 671 | | | 3,566,222 | |
Keyence Corp. | | | 14,500 | | | 2,965,174 | |
Kurita Water Industries, Ltd. | | | 67,900 | | | 2,199,076 | |
Mitsubishi Corp. | | | 186,100 | | | 3,454,059 | |
Mitsubishi Estate Co., Ltd. | | | 236,000 | | | 3,946,603 | |
Secom Co., Ltd. | | | 93,700 | | | 3,812,778 | |
T&D Holdings, Inc. | | | 35,400 | | | 1,017,886 | |
Tokio Marine Holdings, Inc. | | | 43,300 | | | 1,200,093 | |
| | | | | | | |
Total Japan | | | | | | 44,765,431 | |
| | | | | | | |
| | | | | | | |
Mexico—0.7% | | | | | | | |
Grupo Televisa SA Sponsored ADR | | | 91,800 | | | 1,560,600 | |
| | | | | | | |
| | | | | | | |
Netherlands—1.5% | | | | | | | |
TNT NV | | | 178,287 | | | 3,462,770 | |
| | | | | | | |
| | | | | | | |
Russia—1.2% | | | | | | | |
OAO LUKOIL Sponsored ADR | | | 64,050 | | | 2,841,898 | |
| | | | | | | |
| | | | | | | |
Singapore—2.3% | | | | | | | |
Singapore Telecommunications, Ltd. | | | 2,494,200 | | | 5,166,114 | |
| | | | | | | |
| | | | | | | |
Spain—1.7% | | | | | | | |
Banco Santander SA | | | 327,300 | | | 3,930,346 | |
| | | | | | | |
The accompanying notes are an integral part of these financial statements.
Semi-Annual Report 17
| | | | | | | |
Description | | Shares | | Value | |
| | | | | | | | |
Lazard Retirement International Equity Portfolio
(concluded) |
| | | | | | | |
Sweden—1.4% | | | | | | | |
Telefonaktiebolaget LM Ericsson, B Shares | | | 334,160 | | $ | 3,278,945 | |
| | | | | | | |
| | | | | | | |
Switzerland—11.2% | | | | | | | |
Credit Suisse Group AG | | | 138,700 | | | 6,331,527 | |
Nestle SA | | | 132,440 | | | 4,987,755 | |
Novartis AG | | | 90,000 | | | 3,647,876 | |
Roche Holding AG | | | 33,300 | | | 4,526,630 | |
UBS AG (a) | | | 172,700 | | | 2,112,358 | |
Zurich Financial Services AG | | | 22,790 | | | 4,014,547 | |
| | | | | | | |
Total Switzerland | | | | | | 25,620,693 | |
| | | | | | | |
| | | | | | | |
Turkey—1.5% | | | | | | | |
Turkcell Iletisim Hizmetleri AS ADR | | | 250,536 | | | 3,472,429 | |
| | | | | | | |
| | | | | | | |
United Kingdom—25.0% | | | | | | | |
BAE Systems PLC | | | 821,600 | | | 4,575,491 | |
Barclays PLC | | | 887,600 | | | 4,132,590 | |
BG Group PLC | | | 140,900 | | | 2,359,812 | |
BP PLC | | | 708,518 | | | 5,569,492 | |
British American Tobacco PLC | | | 90,370 | | | 2,487,361 | |
BT Group PLC | | | 772,100 | | | 1,289,312 | |
Cairn Energy PLC (a) | | | 45,900 | | | 1,768,553 | |
HSBC Holdings PLC | | | 677,291 | | | 5,599,251 | |
| | | | | | | |
Description | | Shares | | Value | |
| | | | | | | | |
Imperial Tobacco Group PLC | | | 174,002 | | $ | 4,517,309 | |
Informa PLC | | | 314,900 | | | 1,134,581 | |
National Grid PLC | | | 221,023 | | | 1,990,858 | |
Prudential PLC | | | 693,600 | | | 4,718,492 | |
Qinetiq Group PLC | | | 513,600 | | | 1,212,538 | |
Reckitt Benckiser Group PLC | | | 59,000 | | | 2,684,867 | |
Tesco PLC | | | 608,300 | | | 3,538,740 | |
Unilever PLC | | | 232,600 | | | 5,449,269 | |
Vodafone Group PLC | | | 2,167,866 | | | 4,180,023 | |
| | | | | | | |
Total United Kingdom | | | | | | 57,208,539 | |
| | | | | | | |
| | | | | | | |
Total Common Stocks | | | | | | | |
(Identified cost $274,417,622) | | | | | | 248,554,754 | |
| | | | | | | |
| | | | | | | |
Short-Term Investment—7.3% | | | | | | | |
State Street Institutional Treasury | | | | | | | |
Money Market Fund, 0.02% | | | | | | | |
(Identified cost $16,659,754) (b) | | | 16,659,754 | | | 16,659,754 | |
| | | | | | | |
| | | | | | | |
Total Investments—115.7% | | | | | | | |
(Identified cost $291,077,376) (c) | | | | | $ | 265,214,508 | |
| | | | | | | |
| | | | | | | |
Liabilities in Excess of Cash and | | | | | | | |
Other Assets—(15.7)% | | | | | | (36,032,010 | ) |
| | | | | | | |
| | | | | | | |
Net Assets—100.0% | | | | | $ | 229,182,498 | |
| | | | | | | |
The accompanying notes are an integral part of these financial statements.
18 Semi-Annual Report
| | | | | | | |
Description | | Shares | | Value | |
| |
Lazard Retirement Emerging Markets Equity Portfolio |
| | | | | | | |
Common Stocks—90.5% | | | | | | | |
| | | | | | | |
Argentina—1.1% | | | | | | | |
Tenaris SA ADR | | | 141,700 | | $ | 3,831,568 | |
| | | | | | | |
| | | | | | | |
Brazil—11.5% | | | | | | | |
Banco do Brasil SA | | | 1,051,800 | | | 11,368,780 | |
Cia Brasileira de Meios de | | | | | | | |
Pagamento | | | 459,900 | | | 3,954,741 | |
Companhia de Concessoes | | | | | | | |
Rodoviarias | | | 396,300 | | | 6,356,575 | |
Empresa Brasileira de Aeronautica | | | | | | | |
SA ADR | | | 90,300 | | | 1,495,368 | |
JHSF Participacoes SA | | | 610,100 | | | 572,893 | |
Redecard SA | | | 623,257 | | | 9,589,792 | |
Souza Cruz SA | | | 235,211 | | | 6,700,423 | |
| | | | | | | |
Total Brazil | | | | | | 40,038,572 | |
| | | | | | | |
| | | | | | | |
Egypt—4.1% | | | | | | | |
Commercial International Bank | | | 296,436 | | | 2,602,426 | |
Eastern Tobacco | | | 114,148 | | | 2,342,544 | |
Egyptian Company for Mobile Services | | | 100,987 | | | 3,504,036 | |
Orascom Construction Industries | | | 175,652 | | | 6,029,128 | |
| | | | | | | |
Total Egypt | | | | | | 14,478,134 | |
| | | | | | | |
| | | | | | | |
Hong Kong—1.0% | | | | | | | |
Huabao International Holdings, Ltd. | | | 1,355,000 | | | 1,311,282 | |
Shougang Concord International | | | | | | | |
Enterprises Co., Ltd. | | | 12,574,000 | | | 2,109,173 | |
| | | | | | | |
Total Hong Kong | | | | | | 3,420,455 | |
| | | | | | | |
| | | | | | | |
India—6.9% | | | | | | | |
Infosys Technologies, Ltd. | | | | | | | |
Sponsored ADR | | | 55,600 | | | 2,044,968 | |
Jindal Steel & Power, Ltd. | | | 50,467 | | | 2,649,294 | |
Oil and Natural Gas Corp., Ltd. | | | 584,585 | | | 12,999,252 | |
Punjab National Bank, Ltd. | | | 443,234 | | | 6,282,348 | |
| | | | | | | |
Total India | | | | | | 23,975,862 | |
| | | | | | | |
| | | | | | | |
Indonesia—5.5% | | | | | | | |
PT Astra International Tbk | | | 335,500 | | | 782,258 | |
PT Bank Mandiri Tbk | | | 20,179,200 | | | 6,276,656 | |
| | | | | | | |
Description | | Shares | | Value | |
| |
PT Telekomunikasi Indonesia Tbk | | | | | | | |
Sponsored ADR | | | 311,700 | | $ | 9,344,766 | |
PT United Tractors Tbk | | | 2,849,050 | | | 2,777,178 | |
| | | | | | | |
Total Indonesia | | | | | | 19,180,858 | |
| | | | | | | |
| | | | | | | |
Israel—3.9% | | | | | | | |
Bank Hapoalim BM (a) | | | 1,514,482 | | | 4,030,911 | |
Cellcom Israel, Ltd. | | | 20,200 | | | 536,714 | |
Delek Automotive Systems, Ltd. | | | 277,209 | | | 2,250,824 | |
Israel Chemicals, Ltd. | | | 668,173 | | | 6,632,425 | |
| | | | | | | |
Total Israel | | | | | | 13,450,874 | |
| | | | | | | |
| | | | | | | |
Malaysia—1.2% | | | | | | | |
British American Tobacco Malaysia | | | | | | | |
Berhad | | | 163,300 | | | 2,078,997 | |
PLUS Expressways Berhad | | | 2,524,200 | | | 2,297,992 | |
| | | | | | | |
Total Malaysia | | | | | | 4,376,989 | |
| | | | | | | |
| | | | | | | |
Mexico—7.9% | | | | | | | |
America Movil SAB de CV ADR,
Series L | | | 195,700 | | | 7,577,504 | |
Desarrolladora Homex SA de CV
ADR (a) | | | 157,190 | | | 4,384,029 | |
Fomento Economico Mexicano SAB | | | | | | | |
de CV Sponsored ADR | | | 215,090 | | | 6,934,501 | |
Grupo Televisa SA Sponsored ADR | | | 366,900 | | | 6,237,300 | |
Kimberly-Clark de Mexico SAB de CV, | | | | | | | |
Series A | | | 590,600 | | | 2,253,728 | |
| | | | | | | |
Total Mexico | | | | | | 27,387,062 | |
| | | | | | | |
| | | | | | | |
Pakistan—0.8% | | | | | | | |
Pakistan Petroleum, Ltd. | | | 1,142,770 | | | 2,665,481 | |
| | | | | | | |
| | | | | | | |
Philippines—3.0% | | | | | | | |
Philippine Long Distance Telephone | | | | | | | |
Co. Sponsored ADR | | | 207,300 | | | 10,306,956 | |
| | | | | | | |
| | | | | | | |
Russia—7.3% | | | | | | | |
Mobile TeleSystems Sponsored ADR | | | 260,800 | | | 9,631,344 | |
OAO LUKOIL Sponsored ADR | | | 255,600 | | | 11,340,972 | |
Oriflame Cosmetics SA SDR | | | 104,219 | | | 4,532,347 | |
| | | | | | | |
Total Russia | | | | | | 25,504,663 | |
| | | | | | | |
| | | | | | | |
South Africa—12.8% | | | | | | | |
Kumba Iron Ore, Ltd. | | | 312,413 | | | 7,333,020 | |
Massmart Holdings, Ltd. | | | 322,240 | | | 3,343,064 | |
Murray & Roberts Holdings, Ltd. | | | 1,056,508 | | | 6,850,433 | |
The accompanying notes are an integral part of these financial statements.
Semi-Annual Report 19
| | | | | | | |
Description | | Shares | | Value | |
| |
Lazard Retirement Emerging Markets Equity Portfolio (concluded) |
|
Nedbank Group, Ltd. | | | 568,567 | | $ | 7,229,437 | |
Pretoria Portland Cement Co., Ltd. | | | 1,096,993 | | | 4,128,350 | |
Sanlam, Ltd. | | | 3,457,910 | | | 7,748,767 | |
Tiger Brands, Ltd. | | | 137,066 | | | 2,561,350 | |
Truworths International, Ltd. | | | 1,120,660 | | | 5,377,133 | |
| | | | | | | |
Total South Africa | | | | | | 44,571,554 | |
| | | | | | | |
| | | | | | | |
South Korea—10.0% | | | | | | | |
Amorepacific Corp. | | | 4,581 | | | 2,456,001 | |
Hite Brewery Co., Ltd. | | | 30,783 | | | 3,793,658 | |
KT&G Corp. | | | 36,400 | | | 2,057,224 | |
NHN Corp. (a) | | | 37,555 | | | 5,203,075 | |
S1 Corp. | | | 22,848 | | | 972,065 | |
Samsung Electronics Co., Ltd.
GDR (d) | | | 22,876 | | | 5,335,827 | |
Shinhan Financial Group Co., Ltd. (a) | | | 363,588 | | | 9,204,218 | |
Woongjin Coway Co., Ltd. | | | 237,922 | | | 5,789,538 | |
| | | | | | | |
Total South Korea | | | | | | 34,811,606 | |
| | | | | | | |
| | | | | | | |
Taiwan—5.1% | | | | | | | |
Advanced Semiconductor | | | | | | | |
Engineering, Inc. | | | 4,957,011 | | | 2,863,010 | |
Hon Hai Precision Industry Co., Ltd. | | | 1,613,892 | | | 4,992,686 | |
HTC Corp. | | | 432,000 | | | 6,109,357 | |
Taiwan Semiconductor Manufacturing | | | | | | | |
Co., Ltd. | | | 2,188,699 | | | 3,648,944 | |
| | | | | | | |
Total Taiwan | | | | | | 17,613,997 | |
| | | | | | | |
| | | | | | | |
Thailand—2.1% | | | | | | | |
Banpu Public Co., Ltd. | | | 345,900 | | | 3,431,588 | |
Kasikornbank PCL | | | 1,865,300 | | | 3,969,306 | |
| | | | | | | |
Total Thailand | | | | | | 7,400,894 | |
| | | | | | | |
| | | | | | | |
Turkey—6.3% | | | | | | | |
Akbank TAS | | | 1,408,167 | | | 6,306,044 | |
| | | | | | | |
Description | | Shares | | Value | |
| |
Ford Otomotiv Sanayi AS | | | 75,653 | | $ | 294,599 | |
Turkcell Iletisim Hizmetleri AS | | | 1,024,786 | | | 5,686,605 | |
Turkiye Is Bankasi AS, C Shares | | | 3,232,216 | | | 9,523,793 | |
| | | | | | | |
Total Turkey | | | | | | 21,811,041 | |
| | | | | | | |
| | | | | | | |
Total Common Stocks | | | | | | | |
(Identified cost $334,701,110) | | | | | | 314,826,566 | |
| | | | | | | |
| | | | | | | |
Preferred Stocks—3.4% | | | | | | | |
| | | | | | | |
Brazil—3.4% | | | | | | | |
AES Tiete SA | | | 301,778 | | | 3,141,756 | |
Eletropaulo Metropolitana SA, B Shares | | | 125,900 | | | 2,231,440 | |
Fertilizantes Fosfatados SA | | | 26,700 | | | 203,708 | |
Klabin SA | | | 191,300 | | | 291,904 | |
Suzano Papel e Celulose SA (a) | | | 362,256 | | | 2,802,654 | |
Usinas Siderurgicas de Minas Gerais | | | | | | | |
SA, A Shares | | | 124,300 | | | 2,639,512 | |
Vale SA, A Shares | | | 36,200 | | | 551,452 | |
| | | | | | | |
Total Brazil | | | | | | 11,862,426 | |
| | | | | | | |
| | | | | | | |
Total Preferred Stocks | | | | | | | |
(Identified cost $12,964,149) | | | | | | 11,862,426 | |
| | | | | | | |
| | | | | | | |
Short-Term Investment—8.2% | | | | | | | |
State Street Institutional Treasury | | | | | | | |
Money Market Fund, 0.02% | | | | | | | |
(Identified cost $28,538,754) (b) | | | 28,538,754 | | | 28,538,754 | |
| | | | | | | |
| | | | | | | |
Total Investments—102.1% | | | | | | | |
(Identified cost $376,204,013) (c) | | | | | $ | 355,227,746 | |
| | | | | | | |
Liabilities in Excess of Cash and | | | | | | | |
Other Assets—(2.1)% | | | | | | (7,214,732 | ) |
| | | | | | | |
| | | | | | | |
Net Assets—100.0% | | | | | $ | 348,013,014 | |
| | | | | | | |
The accompanying notes are an integral part of these financial statements.
20 Semi-Annual Report
|
|
Lazard Retirement Series, Inc. Notes to Portfolios of Investments June 30, 2009 (unaudited) |
|
| |
(a) | Non-income producing security. |
(b) | Rate shown reflects 7 day yield as of June 30, 2009. |
(c) | For federal income tax purposes, the aggregate cost, aggregate gross unrealized appreciation, aggregate gross unrealized depreciation and the net unrealized appreciation (depreciation) are as follows: |
| | | | | | | | | | | | | | | |
| Portfolio | | | Aggregate
Cost | | Aggregate Gross
Unrealized
Appreciation | | Aggregate Gross
Unrealized
Depreciation | | Net Unrealized
Appreciation
(Depreciation) | |
| | | | | | | | | | | |
| Retirement U.S. Strategic Equity | | $ | 3,912,300 | | $ | 198,904 | | $ | 195,800 | | $ | 3,104 | |
| Retirement U.S. Small-Mid Cap Equity | | | 36,819,910 | | | 3,665,734 | | | 1,521,590 | | | 2,144,144 | |
| Retirement International Equity | | | 291,077,376 | | | 9,989,693 | | | 35,852,561 | | | (25,862,868 | ) |
| Retirement Emerging Markets Equity | | | 376,204,013 | | | 20,368,684 | | | 41,344,951 | | | (20,976,267 | ) |
| |
(d) | Pursuant to Rule 144A under the Securities Act of 1933, this security may only be traded among “qualified institutional buyers.” At June 30, 2009, it amounted to 1.5% of net assets of Lazard Retirement Emerging Markets Equity Portfolio and is considered to be liquid. |
Security Abbreviations:
|
ADR — American Depositary Receipt |
ADS — American Depositary Share |
GDR — Global Depositary Receipt |
REIT — Real Estate Investment Trust |
SDR — Swedish Depositary Receipt |
The accompanying notes are an integral part of these financial statements.
Semi-Annual Report 21
Portfolio holdings by industry (as percentage of net assets), for those Portfolios previously presented by country:
| | | | | | | | | | | | |
Industry | | | Lazard
Retirement
International
Equity Portfolio | | Lazard
Retirement
Emerging Markets
Equity Portfolio | |
| | | | | | | |
Agriculture | | | — | % | | | | 2.0 | % | | |
Alcohol & Tobacco | | | 7.0 | | | | | 4.9 | | | |
Automotive | | | 1.1 | | | | | 0.3 | | | |
Banking | | | 14.7 | | | | | 16.6 | | | |
Building Materials | | | — | | | | | 1.2 | | | |
Commercial Services | | | 3.2 | | | | | 0.9 | | | |
Computer Software | | | — | | | | | 1.5 | | | |
Construction & Engineering | | | 1.1 | | | | | 3.7 | | | |
Consumer Products | | | 1.2 | | | | | 4.0 | | | |
Drugs | | | 8.6 | | | | | — | | | |
Electric | | | 3.5 | | | | | 1.5 | | | |
Energy Exploration & Production | | | 2.0 | | | | | 4.5 | | | |
Energy Integrated | | | 10.9 | | | | | 4.2 | | | |
Energy Services | | | — | | | | | 1.1 | | | |
Financial Services | | | 1.5 | | | | | 8.8 | | | |
Food & Beverages | | | 5.6 | | | | | 2.7 | | | |
Forest & Paper Products | | | — | | | | | 1.5 | | | |
Gas Utilities | | | 2.2 | | | | | — | | | |
Housing | | | 3.7 | | | | | 1.3 | | | |
Insurance | | | 7.1 | | | | | — | | | |
Leisure & Entertainment | | | 2.5 | | | | | 1.8 | | | |
Manufacturing | | | 8.3 | | | | | 1.8 | | | |
Metals & Mining | | | 0.5 | | | | | 3.8 | | | |
Real Estate | | | 1.7 | | | | | 0.2 | | | |
Retail | | | 2.4 | | | | | 2.5 | | | |
Semiconductors & Components | | | 3.5 | | | | | 3.4 | | | |
Technology | | | — | | | | | 0.6 | | | |
Technology Hardware | | | 4.4 | | | | | 3.2 | | | |
Telecommunications | | | 9.2 | | | | | 13.4 | | | |
Transportation | | | 2.5 | | | | | 2.5 | | | |
| | | | | | | | | | | |
Subtotal | | | 108.4 | | | | | 93.9 | | | |
Short-Term Investments | | | 7.3 | | | | | 8.2 | | | |
| | | | | | | | | | | |
Total Investments | | | 115.7 | % | | | | 102.1 | % | | |
| | | | | | | | | | | |
The accompanying notes are an integral part of these financial statements.
22 Semi-Annual Report
|
|
Lazard Retirement Series, Inc. Statements of Assets and Liabilities (unaudited) |
|
| | | | | | | | | | | | | |
June 30, 2009 | | Lazard
Retirement
U.S. Strategic
Equity Portfolio | | Lazard
Retirement
U.S. Small-Mid Cap
Equity Portfolio | | Lazard
Retirement
International
Equity Portfolio | | Lazard
Retirement
Emerging Markets
Equity Portfolio | |
| | | | | | | | | | |
ASSETS | | | | | | | | | | | | | |
Investments in securities, at value | | $ | 3,915,404 | | $ | 38,964,054 | | $ | 265,214,508 | | $ | 355,227,746 | |
Foreign currency | | | — | | | — | | | 77,928 | | | 686,410 | |
Receivables for: | | | | | | | | | | | | | |
Capital stock sold | | | 6,352 | | | 60,087,263 | | | 1,856,297 | | | 2,291,850 | |
Investments sold | | | — | | | 1,238,704 | | | — | | | 2,309,987 | |
Dividends and interest | | | 4,409 | | | 6,977 | | | 1,337,784 | | | 1,173,914 | |
Amount due from Investment Manager (Note 3) | | | 8,166 | | | — | | | — | | | — | |
| | | | | | | | | | | | | |
Total assets | | | 3,934,331 | | | 100,296,998 | | | 268,486,517 | | | 361,689,907 | |
| | | | | | | | | | | | | |
| | | | | | | | | | | | | |
LIABILITIES | | | | | | | | | | | | | |
Payables for: | | | | | | | | | | | | | |
Management fees | | | — | | | 14,993 | | | 157,488 | | | 313,688 | |
Accrued distribution fees | | | 796 | | | 8,036 | | | 54,386 | | | 49,197 | |
Accrued directors’ fees | | | 53 | | | 575 | | | 3,496 | | | 3,883 | |
Capital stock redeemed | | | 566 | | | 372,099 | | | 30,132,657 | | | 6,559,369 | |
Investments purchased | | | — | | | 529,682 | | | 8,814,578 | | | 6,393,146 | |
Other accrued expenses and payables | | | 34,769 | | | 49,501 | | | 141,414 | | | 357,610 | |
| | | | | | | | | | | | | |
Total liabilities | | | 36,184 | | | 974,886 | | | 39,304,019 | | | 13,676,893 | |
| | | | | | | | | | | | | |
Net assets | | $ | 3,898,147 | | $ | 99,322,112 | | $ | 229,182,498 | | $ | 348,013,014 | |
| | | | | | | | | | | | | |
|
NET ASSETS | | | | | | | | | | | | | |
Paid in capital | | $ | 5,595,993 | | $ | 118,582,337 | | $ | 330,489,528 | | $ | 457,947,107 | |
Undistributed net investment income (loss) | | | 35,015 | | | (16,278 | ) | | 6,064,954 | | | 4,105,459 | |
Accumulated net realized loss | | | (1,735,965 | ) | | (21,388,091 | ) | | (81,544,775 | ) | | (92,950,429 | ) |
Net unrealized appreciation (depreciation) on: | | | | | | | | | | | | | |
Investments | | | 3,104 | | | 2,144,144 | | | (25,862,868 | ) | | (21,107,630 | ) |
Foreign currency | | | — | | | — | | | 35,659 | | | 18,507 | |
| | | | | | | | | | | | | |
Net assets | | $ | 3,898,147 | | $ | 99,322,112 | | $ | 229,182,498 | | $ | 348,013,014 | |
| | | | | | | | | | | | | |
Service Shares | | | | | | | | | | | | | |
Net assets | | $ | 3,898,147 | | $ | 99,322,112 | | $ | 229,182,498 | | $ | 244,876,242 | |
Shares of capital stock outstanding* | | | 570,883 | | | 13,625,309 | | | 27,534,787 | | | 16,101,807 | |
Net asset value, offering and redemption price per share | | $ | 6.83 | | $ | 7.29 | | $ | 8.32 | | $ | 15.21 | |
Investor Shares | | | | | | | | | | | | | |
Net assets | | | — | | | — | | | — | | $ | 103,136,772 | |
Shares of capital stock outstanding* | | | — | | | — | | | — | | | 6,796,223 | |
Net asset value, offering and redemption price per share | | | — | | | — | | | — | | $ | 15.18 | |
| | | | | | | | | | | | | |
Cost of investments in securities | | $ | 3,912,300 | | $ | 36,819,910 | | $ | 291,077,376 | | $ | 376,204,013 | |
Cost of foreign currency | | | — | | | — | | $ | 78,028 | | $ | 685,663 | |
* $0.001 par value 1,400,000,000 shares authorized for the Portfolios in total.
The accompanying notes are an integral part of these financial statements.
Semi-Annual Report 23
|
|
Lazard Retirement Series, Inc. Statements of Operations (unaudited) |
|
| | | | | | | | | | | | | |
For the Six Months Ended June 30, 2009 | | Lazard
Retirement
U.S. Strategic
Equity Portfolio | | Lazard
Retirement
U.S. Small-Mid Cap
Equity Portfolio | | Lazard
Retirement
International
Equity Portfolio | | Lazard
Retirement
Emerging Markets
Equity Portfolio | |
| | | | | | | | | | |
Investment Income (Loss) | | | | | | | | | | | | | |
|
Income | | | | | | | | | | | | | |
Dividends | | $ | 42,087 | | $ | 194,786 | | $ | 5,308,873 | | $ | 5,788,692 | |
Interest | | | 17 | | | 198 | | | 1,978 | | | 3,124 | |
| | | | | | | | | | | | | |
Total investment income* | | | 42,104 | | | 194,984 | | | 5,310,851 | | | 5,791,816 | |
| | | | | | | | | | | | | |
| | | | | | | | | | | | | |
Expenses | | | | | | | | | | | | | |
Management fees | | | 12,855 | | | 126,754 | | | 822,823 | | | 1,285,663 | |
Distribution fees (Service Shares) | | | 4,285 | | | 42,252 | | | 274,275 | | | 234,303 | |
Custodian fees | | | 26,187 | | | 34,637 | | | 81,804 | | | 299,872 | |
Professional services | | | 16,647 | | | 22,669 | | | 53,157 | | | 50,509 | |
Administration fees | | | 21,495 | | | 24,456 | | | 43,018 | | | 46,789 | |
Shareholders’ reports | | | 3,582 | | | 13,977 | | | 49,740 | | | 36,155 | |
Shareholders’ services | | | 6,812 | | | 7,995 | | | 10,473 | | | 15,890 | |
Directors’ fees and expenses | | | 128 | | | 1,335 | | | 8,958 | | | 9,033 | |
Other | | | 1,004 | | | 2,079 | | | 8,670 | | | 8,506 | |
| | | | | | | | | | | | | |
Total gross expenses | | | 92,995 | | | 276,154 | | | 1,352,918 | | | 1,986,720 | |
| | | | | | | | | | | | | |
Management fees waived and expenses reimbursed | | | (62,196 | ) | | (64,880 | ) | | — | | | (16,772 | ) |
Administration fees waived | | | (9,375 | ) | | — | | | — | | | — | |
Expense reductions | | | — | | | (12 | ) | | (81 | ) | | — | |
| | | | | | | | | | | | | |
Total net expenses | | | 21,424 | | | 211,262 | | | 1,352,837 | | | 1,969,948 | |
| | | | | | | | | | | | | |
Net investment income (loss) | | | 20,680 | | | (16,278 | ) | | 3,958,014 | | | 3,821,868 | |
| | | | | | | | | | | | | |
| | | | | | | | | | | | | |
Net Realized and Unrealized Gain (Loss) on Investments and Foreign Currency | | | | | | | | | | | | | |
Net realized loss on: | | | | | | | | | | | | | |
Investments | | | (546,670 | ) | | (6,405,424 | ) | | (71,064,154 | ) | | (64,459,321 | ) |
Foreign currency | | | — | | | — | | | (58,162 | ) | | (274,408 | ) |
Net change in unrealized appreciation on: | | | | | | | | | | | | | |
Investments** | | | 726,834 | | | 11,383,146 | | | 64,559,143 | | | 136,103,590 | |
Foreign currency | | | — | | | — | | | 42,421 | | | 17,108 | |
| | | | | | | | | | | | | |
Net realized and unrealized gain (loss) on investments and foreign currency | | | 180,164 | | | 4,977,722 | | | (6,520,752 | ) | | 71,386,969 | |
| | | | | | | | | | | | | |
Net increase (decrease) in net assets resulting from operations | | $ | 200,844 | | $ | 4,961,444 | | $ | (2,562,738 | ) | $ | 75,208,837 | |
| | | | | | | | | | | | | |
| | | | | | | | | | | | | |
* Net of foreign withholding taxes of | | $ | — | | $ | — | | $ | 593,243 | | $ | 356,614 | |
| | | | | | | | | | | | | |
** Includes net change in unrealized foreign capital gains taxes of | | $ | — | | $ | — | | $ | — | | $ | (131,363 | ) |
| | | | | | | | | | | | | |
The accompanying notes are an integral part of these financial statements.
24 Semi-Annual Report
|
|
Lazard Retirement Series, Inc. Statements of Changes in Net Assets |
|
| | | | | | | | | | | | | |
| | Lazard Retirement
U.S. Strategic Equity Portfolio | | Lazard Retirement
U.S. Small-Mid Cap Equity Portfolio |
| | | | | |
| | Six Months Ended
June 30, 2009
(unaudited) | | Year Ended
December 31,
2008 | | Six Months Ended
June 30, 2009
(unaudited) | | Year Ended
December 31,
2008 | |
| | | | | | | | | | |
Increase (Decrease) in Net Assets | | | | | | | | | | | | | |
|
Operations | | | | | | | | | | | | | |
Net investment income (loss) | | $ | 20,680 | | $ | 49,312 | | $ | (16,278 | ) | $ | (53,668 | ) |
Net realized loss on investments | | | (546,670 | ) | | (1,147,981 | ) | | (6,405,424 | ) | | (14,364,336 | ) |
Net change in unrealized appreciation (depreciation) on investments | | | 726,834 | | | (501,960 | ) | | 11,383,146 | | | (6,798,323 | ) |
| | | | | | | | | | | | | |
Net increase (decrease) in net assets resulting from operations | | | 200,844 | | | (1,600,629 | ) | | 4,961,444 | | | (21,216,327 | ) |
| | | | | | | | | | | | | |
| | | | | | | | | | | | | |
Distributions to shareholders | | | | | | | | | | | | | |
Service Shares | | | | | | | | | | | | | |
From net investment income | | | — | | | (34,641 | ) | | — | | | — | |
| | | | | | | | | | | | | |
Net decrease in net assets resulting from distributions | | | — | | | (34,641 | ) | | — | | | — | |
| | | | | | | | | | | | | |
| | | | | | | | | | | | | |
Capital stock transactions | | | | | | | | | | | | | |
Service Shares | | | | | | | | | | | | | |
Net proceeds from sales | | | 1,268,493 | | | 1,511,286 | | | 64,445,796 | | | 7,873,436 | |
Net proceeds from reinvestment of distributions | | | — | | | 34,641 | | | — | | | — | |
Cost of shares redeemed | | | (883,100 | ) | | (1,557,278 | ) | | (5,054,267 | ) | | (14,459,743 | ) |
| | | | | | | | | | | | | |
Net increase (decrease) in net assets from capital stock transactions | | | 385,393 | | | (11,351 | ) | | 59,391,529 | | | (6,586,307 | ) |
| | | | | | | | | | | | | |
Total increase (decrease) in net assets | | | 586,237 | | | (1,646,621 | ) | | 64,352,973 | | | (27,802,634 | ) |
Net assets at beginning of period | | | 3,311,910 | | | 4,958,531 | | | 34,969,139 | | | 62,771,773 | |
| | | | | | | | | | | | | |
Net assets at end of period* | | $ | 3,898,147 | | $ | 3,311,910 | | $ | 99,322,112 | | $ | 34,969,139 | |
| | | | | | | | | | | | | |
*Includes undistributed (accumulated) net investment income (loss) of | | $ | 35,015 | | $ | 14,335 | | $ | (16,278 | ) | $ | — | |
| | | | | | | | | | | | | |
| | | | | | | | | | | | | |
Shares issued and redeemed | | | | | | | | | | | | | |
Service Shares | | | | | | | | | | | | | |
Shares outstanding at beginning of period | | | 508,605 | | | 487,596 | | | 5,516,390 | | | 6,288,141 | |
| | | | | | | | | | | | | |
Shares sold | | | 208,409 | | | 189,289 | | | 8,930,735 | | | 928,162 | |
Shares issued to shareholders from reinvestment of distributions | | | — | | | 5,525 | | | — | | | — | |
Shares redeemed | | | (146,131 | ) | | (173,805 | ) | | (821,816 | ) | | (1,699,913 | ) |
| | | | | | | | | | | | | |
Net increase (decrease) | | | 62,278 | | | 21,009 | | | 8,108,919 | | | (771,751 | ) |
| | | | | | | | | | | | | |
Shares outstanding at end of period | | | 570,883 | | | 508,605 | | | 13,625,309 | | | 5,516,390 | |
| | | | | | | | | | | | | |
The accompanying notes are an integral part of these financial statements.
Semi-Annual Report 25
| | | | | | | | | | | | | |
| | Lazard Retirement
International Equity Portfolio | | Lazard Retirement
Emerging Markets Equity Portfolio |
| | | | | |
| | Six Months Ended
June 30, 2009
(unaudited) | | Year Ended
December 31,
2008 | | Six Months Ended
June 30, 2009
(unaudited) | | Year Ended
December 31,
2008 | |
| | | | | | | | | | |
Increase (Decrease) in Net Assets | | | | | | | | | | | | | |
| | | | | | | | | | | | | |
Operations | | | | | | | | | | | | | |
Net investment income | | $ | 3,958,014 | | $ | 7,320,909 | | $ | 3,821,868 | | $ | 10,238,064 | |
Net realized loss on investments and foreign currency | | | (71,122,316 | ) | | (10,691,049 | ) | | (64,733,729 | ) | | (19,096,811 | ) |
Net change in unrealized appreciation (depreciation) on investments and foreign currency | | | 64,601,564 | | | (152,332,505 | ) | | 136,120,698 | | | (209,715,224 | ) |
| | | | | | | | | | | | | |
Net increase (decrease) in net assets resulting from operations | | | (2,562,738 | ) | | (155,702,645 | ) | | 75,208,837 | | | (218,573,971 | ) |
| | | | | | | | | | | | | |
| | | | | | | | | | | | | |
Distributions to shareholders | | | | | | | | | | | | | |
From net investment income | | | | | | | | | | | | | |
Service Shares | | | — | | | (4,879,768 | ) | | — | | | (6,056,978 | ) |
Investor Shares | | | — | | | — | | | — | | | (2,518,065 | ) |
From net realized gains | | | | | | | | | | | | | |
Service Shares | | | — | | | (1,221,739 | ) | | — | | | (16,793,277 | ) |
Investor Shares | | | — | | | — | | | — | | | (7,726,819 | ) |
| | | | | | | | | | | | | |
Net decrease in net assets resulting from distributions | | | — | | | (6,101,507 | ) | | — | | | (33,095,139 | ) |
| | | | | | | | | | | | | |
| | | | | | | | | | | | | |
Capital stock transactions | | | | | | | | | | | | | |
Net proceeds from sales | | | | | | | | | | | | | |
Service Shares | | | 94,488,067 | | | 130,466,403 | | | 67,765,109 | | | 119,788,045 | |
Investor Shares | | | — | | | — | | | 28,873,754 | | | 59,675,312 | |
Net proceeds from reinvestment of distributions | | | | | | | | | | | | | |
Service Shares | | | — | | | 6,101,507 | | | — | | | 22,850,255 | |
Investor Shares | | | — | | | — | | | — | | | 10,244,884 | |
Cost of shares redeemed | | | | | | | | | | | | | |
Service Shares | | | (146,883,280 | ) | | (82,087,848 | ) | | (46,824,896 | ) | | (58,289,994 | ) |
Investor Shares | | | — | | | — | | | (6,801,629 | ) | | (70,002,969 | ) |
| | | | | | | | | | | | | |
Net increase (decrease) in net assets from capital stock transactions | | | (52,395,213 | ) | | 54,480,062 | | | 43,012,338 | | | 84,265,533 | |
| | | | | | | | | | | | | |
Total increase (decrease) in net assets | | | (54,957,951 | ) | | (107,324,090 | ) | | 118,221,175 | | | (167,403,577 | ) |
Net assets at beginning of period | | | 284,140,449 | | | 391,464,539 | | | 229,791,839 | | | 397,195,416 | |
| | | | | | | | | | | | | |
Net assets at end of period* | | $ | 229,182,498 | | $ | 284,140,449 | | $ | 348,013,014 | | $ | 229,791,839 | |
| | | | | | | | | | | | | |
*Includes undistributed net investment income of | | $ | 6,064,954 | | $ | 2,106,940 | | $ | 4,105,459 | | $ | 283,591 | |
| | | | | | | | | | | | | |
| | | | | | | | | | | | | |
Shares issued and redeemed | | | | | | | | | | | | | |
Service Shares | | | | | | | | | | | | | |
Shares outstanding at beginning of period | | | 34,537,314 | | | 29,327,972 | | | 14,562,340 | | | 9,815,695 | |
| | | | | | | | | | | | | |
Shares sold | | | 12,568,380 | | | 12,211,062 | | | 5,291,022 | | | 5,944,455 | |
Shares issued to shareholders from reinvestment of distributions | | | — | | | 732,337 | | | — | | | 1,632,619 | |
Shares redeemed | | | (19,570,907 | ) | | (7,734,057 | ) | | (3,751,555 | ) | | (2,830,429 | ) |
| | | | | | | | | | | | | |
Net increase (decrease) | | | (7,002,527 | ) | | 5,209,342 | | | 1,539,467 | | | 4,746,645 | |
| | | | | | | | | | | | | |
Shares outstanding at end of period | | | 27,534,787 | | | 34,537,314 | | | 16,101,807 | | | 14,562,340 | |
| | | | | | | | | | | | | |
| | | | | | | | | | | | | |
Investor Shares | | | | | | | | | | | | | |
Shares outstanding at beginning of period | | | | | | | | | 5,281,810 | | | 5,685,568 | |
| | | | | | | | | | | | | |
Shares sold | | | | | | | | | 2,132,419 | | | 2,499,956 | |
Shares issued to shareholders from reinvestment of distributions | | | | | | | | | — | | | 701,832 | |
Shares redeemed | | | | | | | | | (618,006 | ) | | (3,605,546 | ) |
| | | | | | | | | | | | | |
Net increase (decrease) | | | | | | | | | 1,514,413 | | | (403,758 | ) |
| | | | | | | | | | | | | |
Shares outstanding at end of period | | | | | | | | | 6,796,223 | | | 5,281,810 | |
| | | | | | | | | | | | | |
The accompanying notes are an integral part of these financial statements.
26 Semi-Annual Report
|
|
Lazard Retirement Series, Inc. Financial Highlights |
|
| | | | | | | | | | | | | | | | | | | |
LAZARD RETIREMENT U.S. STRATEGIC EQUITY PORTFOLIO |
| | | | | | | | | | | | | | | | | | | |
Selected data for a share of capital
stock outstanding throughout each period | | Six Months
Ended
6/30/09† | | | |
| | Year Ended | |
| | | |
| | 12/31/08 | | 12/31/07 | | 12/31/06 | | 12/31/05 | | 12/31/04 | |
| | | | | | | | | | | | | | | | | | | |
Service Shares | | | | | | | | | | | | | | | | | | | |
Net asset value, beginning of period | | $ | 6.51 | | $ | 10.17 | | $ | 12.86 | | $ | 11.02 | | $ | 10.74 | | $ | 9.67 | |
| | | | | | | | | | | | | | | | | | | |
Income (loss) from investment operations: | | | | | | | | | | | | | | | | | | | |
Net investment income | | | 0.03 | | | 0.10 | | | 0.07 | | | 0.09 | | | 0.08 | | | 0.08 | |
Net realized and unrealized gain (loss) | | | 0.29 | | | (3.69 | ) | | (0.14 | ) | | 1.83 | | | 0.28 | | | 1.05 | |
| | | | | | | | | | | | | | | | | | | |
Total from investment operations | | | 0.32 | | | (3.59 | ) | | (0.07 | ) | | 1.92 | | | 0.36 | | | 1.13 | |
| | | | | | | | | | | | | | | | | | | |
Less distributions from: | | | | | | | | | | | | | | | | | | | |
Net investment income | | | — | | | (0.07 | ) | | (0.15 | ) | | (0.08 | ) | | (0.08 | ) | | (0.06 | ) |
Net realized gains | | | — | | | — | | | (2.47 | ) | | — | | | — | | | — | |
| | | | | | | | | | | | | | | | | | | |
Total distributions | | | — | | | (0.07 | ) | | (2.62 | ) | | (0.08 | ) | | (0.08 | ) | | (0.06 | ) |
| | | | | | | | | | | | | | | | | | | |
Net asset value, end of period | | $ | 6.83 | | $ | 6.51 | | $ | 10.17 | | $ | 12.86 | | $ | 11.02 | | $ | 10.74 | |
| | | | | | | | | | | | | | | | | | | |
Total Return (a) | | | 4.92% | | | (35.28)% | | | (0.95)% | | | 17.48% | | | 3.38% | | | 11.79% | |
Ratios and Supplemental Data: | | | | | | | | | | | | | | | | | | | |
Net assets, end of period (in thousands) | | $ | 3,898 | | $ | 3,312 | | $ | 4,959 | | $ | 5,078 | | $ | 4,311 | | $ | 4,883 | |
Ratios to average net assets: | | | | | | | | | | | | | | | | | | | |
Net expenses (c) | | | 1.25% | | | 1.25% | | | 1.25% | | | 1.25% | | | 1.25% | | | 1.25% | |
Gross expenses (c) | | | 5.43% | | | 4.88% | | | 4.21% | | | 4.45% | | | 3.57% | | | 3.58% | |
Net investment income (c) | | | 1.21% | | | 1.27% | | | 0.62% | | | 0.68% | | | 0.59% | | | 0.75% | |
Portfolio turnover rate | | | 44% | | | 86% | | | 101% | | | 102% | | | 75% | | | 59% | |
| | | | | | | | | | | | | | | | | | | |
LAZARD RETIREMENT U.S. SMALL-MID CAP EQUITY PORTFOLIO |
| | | | | | | | | | | | | | | | | | | |
Selected data for a share of capital
stock outstanding throughout each period | | Six Months
Ended
6/30/09† | | | |
| | Year Ended | |
| | | |
| | 12/31/08 | | 12/31/07 | | 12/31/06 | | 12/31/05 | | 12/31/04 | |
| | | | | | | | | | | | | | | | | | | |
Service Shares | | | | | | | | | | | | | | | | | | | |
Net asset value, beginning of period | | $ | 6.34 | | $ | 9.98 | | $ | 17.31 | | $ | 16.31 | | $ | 16.90 | | $ | 14.71 | |
| | | | | | | | | | | | | | | | | | | |
Income (loss) from investment operations: | | | | | | | | | | | | | | | | | | | |
Net investment loss | | | — | (b) | | (0.01 | ) | | (0.02 | ) | | (0.06 | ) | | (0.04 | ) | | — | (b) |
Net realized and unrealized gain (loss) | | | 0.95 | | | (3.63 | ) | | (0.87 | ) | | 2.49 | | | 0.69 | | | 2.19 | |
| | | | | | | | | | | | | | | | | | | |
Total from investment operations | | | 0.95 | | | (3.64 | ) | | (0.89 | ) | | 2.43 | | | 0.65 | | | 2.19 | |
| | | | | | | | | | | | | | | | | | | |
Less distributions from: | | | | | | | | | | | | | | | | | | | |
Net realized gains | | | — | | | — | | | (6.44 | ) | | (1.43 | ) | | (1.24 | ) | | — | |
| | | | | | | | | | | | | | | | | | | |
Total distributions | | | — | | | — | | | (6.44 | ) | | (1.43 | ) | | (1.24 | ) | | — | |
| | | | | | | | | | | | | | | | | | | |
Net asset value, end of period | | $ | 7.29 | | $ | 6.34 | | $ | 9.98 | | $ | 17.31 | | $ | 16.31 | | $ | 16.90 | |
| | | | | | | | | | | | | | | | | | | |
Total Return (a) | | | 14.98% | | | (36.47)% | | | (7.20)% | | | 16.07% | | | 3.99% | | | 14.89% | |
Ratios and Supplemental Data: | | | | | | | | | | | | | | | | | | | |
Net assets, end of period (in thousands) | | $ | 99,322 | | $ | 34,969 | | $ | 62,772 | | $ | 82,514 | | $ | 136,970 | | $ | 110,982 | |
Ratios to average net assets: | | | | | | | | | | | | | | | | | | | |
Net expenses (c) | | | 1.25% | | | 1.25% | | | 1.25% | | | 1.18% | | | 1.22% | | | 1.25% | |
Gross expenses (c) | | | 1.63% | | | 1.41% | | | 1.33% | | | 1.18% | | | 1.22% | | | 1.28% | |
Net investment loss (c) | | | (0.10)% | | | (0.11)% | | | (0.17)% | | | (0.22)% | | | (0.26)% | | | (0.35)% | |
Portfolio turnover rate | | | 126% | | | 139% | | | 102% | | | 87% | | | 93% | | | 98% | |
| |
† | Unaudited. |
(a) | Total returns reflect reinvestment of all dividends and distributions, if any. Certain expenses of the Portfolio have been waived or reimbursed by the Portfolio’s Investment Manager or Administrator; without such waiver/reimbursement of expenses, the Portfolio’s returns would have been lower. |
| Performance information does not reflect the fees and charges imposed by participating insurance companies at the separate account level, and such charges will have the effect of reducing performance. Period of less than one year is not annualized. |
(b) | Amount is less than $0.01 per share. |
(c) | Annualized for period of less than one year. |
The accompanying notes are an integral part of these financial statements.
Semi-Annual Report 27
| | | | | | | | | | | | | | | | | | | |
LAZARD RETIREMENT INTERNATIONAL EQUITY PORTFOLIO | |
| | | | | | | | | | | | | | | | | | | |
Selected data for a share of capital
stock outstanding throughout each period | | Six Months
Ended
6/30/09† | | | |
| | Year Ended | |
| | | |
| | 12/31/08 | | 12/31/07 | | 12/31/06 | | 12/31/05 | | 12/31/04 | |
| | | | | | | | | | | | | | | | | | | |
Service Shares | | | | | | | | | | | | | | | | | | | |
Net asset value, beginning of period | | $ | 8.23 | | $ | 13.35 | | $ | 14.89 | | $ | 12.83 | | $ | 11.88 | | $ | 10.39 | |
| | | | | | | | | | | | | | | | | | | |
Income (loss) from investment operations: | | | | | | | | | | | | | | | | | | | |
Net investment income | | | 0.16 | | | 0.21 | | | 0.19 | | | 0.21 | | | 0.15 | | | 0.09 | |
Net realized and unrealized gain (loss) | | | (0.07 | ) | | (5.15 | ) | | 1.24 | | | 2.61 | | | 1.08 | | | 1.46 | |
| | | | | | | | | | | | | | | | | | | |
Total from investment operations | | | 0.09 | | | (4.94 | ) | | 1.43 | | | 2.82 | | | 1.23 | | | 1.55 | |
| | | | | | | | | | | | | | | | | | | |
Less distributions from: | | | | | | | | | | | | | | | | | | | |
Net investment income | | | — | | | (0.14 | ) | | (0.37 | ) | | (0.15 | ) | | (0.11 | ) | | (0.06 | ) |
Net realized gains | | | — | | | (0.04 | ) | | (2.60 | ) | | (0.61 | ) | | (0.17 | ) | | — | |
| | | | | | | | | | | | | | | | | | | |
| | | | | | | | | | | | | | | | | | | |
Total distributions | | | — | | | (0.18 | ) | | (2.97 | ) | | (0.76 | ) | | (0.28 | ) | | (0.06 | ) |
| | | | | | | | | | | | | | | | | | | |
Net asset value, end of period | | $ | 8.32 | | $ | 8.23 | | $ | 13.35 | | $ | 14.89 | | $ | 12.83 | | $ | 11.88 | |
| | | | | | | | | | | | | | | | | | | |
Total Return (a) | | | 1.22% | | | (37.02)% | | | 10.78% | | | 22.53% | | | 10.65% | | | 14.98% | |
Ratios and Supplemental Data: | | | | | | | | | | | | | | | | | | | |
Net assets, end of period (in thousands) | | $ | 229,182 | | $ | 284,140 | | $ | 391,465 | | $ | 308,693 | | $ | 266,437 | | $ | 206,625 | |
Ratios to average net assets: | | | | | | | | | | | | | | | | | | | |
Net expenses (b) | | | 1.23% | | | 1.17% | | | 1.18% | | | 1.19% | | | 1.21% | | | 1.25% | |
Gross expenses (b) | | | 1.23% | | | 1.17% | | | 1.18% | | | 1.19% | | | 1.21% | | | 1.29% | |
Net investment income (b) | | | 3.61% | | | 2.15% | | | 1.60% | | | 1.51% | | | 1.45% | | | 1.05% | |
Portfolio turnover rate | | | 53% | | | 43% | | | 48% | | | 75% | | | 54% | | | 53% | |
| |
† | Unaudited. |
(a) | Total returns reflect reinvestment of all dividends and distributions, if any. Certain expenses of the Portfolio have been waived or reimbursed by the Portfolio’s Investment Manager or Administrator; without such waiver/reimbursement of expenses, the Portfolio’s returns would have been lower. |
| Performance information does not reflect the fees and charges imposed by participating insurance companies at the separate account level, and such charges will have the effect of reducing performance. Period of less than one year is not annualized. |
(b) | Annualized for period of less than one year. |
The accompanying notes are an integral part of these financial statements.
28 Semi-Annual Report
LAZARD RETIREMENT EMERGING MARKETS EQUITY PORTFOLIO
| | | | | | | | | | | | | | | | | | | |
Selected data for a share of capital
stock outstanding throughout each period | | Six Months
Ended
6/30/09† | | | |
| | Year Ended | |
| | | |
| | 12/31/08 | | 12/31/07 | | 12/31/06 | | 12/31/05 | | 12/31/04 | |
| | | | | | | | | | | | | | | | | | | |
Service Shares | | | | | | | | | | | | | | | | | | | |
Net asset value, beginning of period | | $ | 11.59 | | $ | 25.64 | | $ | 22.69 | | $ | 18.81 | | $ | 13.91 | | $ | 10.73 | |
| | | | | | | | | | | | | | | | | | | |
Income (loss) from investment operations: | | | | | | | | | | | | | | | | | | | |
Net investment income (a) | | | 0.18 | | | 0.58 | | | 0.29 | | | 0.27 | | | 0.13 | | | 0.05 | |
Net realized and unrealized gain (loss) | | | 3.44 | | | (12.77 | ) | | 7.03 | | | 5.08 | | | 5.41 | | | 3.21 | |
| | | | | | | | | | | | | | | | | | | |
Total from investment operations | | | 3.62 | | | (12.19 | ) | | 7.32 | | | 5.35 | | | 5.54 | | | 3.26 | |
| | | | | | | | | | | | | | | | | | | |
Less distributions from: | | | | | | | | | | | | | | | | | | | |
Net investment income | | | — | | | (0.47 | ) | | (0.30 | ) | | (0.10 | ) | | (0.05 | ) | | (0.08 | ) |
Net realized gains | | | — | | | (1.39 | ) | | (4.07 | ) | | (1.37 | ) | | (0.59 | ) | | — | |
| | | | | | | | | | | | | | | | | | | |
Total distributions | | | — | | | (1.86 | ) | | (4.37 | ) | | (1.47 | ) | | (0.64 | ) | | (0.08 | ) |
| | | | | | | | | | | | | | | | | | | |
Net asset value, end of period | | $ | 15.21 | | $ | 11.59 | | $ | 25.64 | | $ | 22.69 | | $ | 18.81 | | $ | 13.91 | |
| | | | | | | | | | | | | | | | | | | |
Total Return (b) | | | 31.23% | | | (48.72)% | | | 33.30% | | | 29.95% | | | 40.78% | | | 30.59% | |
Ratios and Supplemental Data: | | | | | | | | | | | | | | | | | | | |
Net assets, end of period (in thousands) | | $ | 244,876 | | $ | 168,787 | | $ | 251,665 | | $ | 129,306 | | $ | 82,812 | | $ | 31,710 | |
Ratios to average net assets: | | | | | | | | | | | | | | | | | | | |
Net expenses (c) | | | 1.60% | | | 1.52% | | | 1.57% | | | 1.60% | | | 1.60% | | | 1.60% | |
Gross expenses (c) | | | 1.61% | | | 1.52% | | | 1.57% | | | 1.69% | | | 1.95% | | | 2.36% | |
Net investment income (c) | | | 2.92% | | | 2.81% | | | 1.12% | | | 1.30% | | | 1.39% | | | 1.13% | |
Portfolio turnover rate | | | 28% | | | 53% | | | 52% | | | 48% | | | 51% | | | 43% | |
| | | | | | | | | | | | | | | | | | | |
| | | | | | | | | | | | | |
Selected data for a share of capital
stock outstanding throughout each period | | Six Months
Ended
6/30/09† | | | | For the Period
5/1/06* to
12/31/06 | |
| | Year Ended | | |
| | | | |
| | 12/31/08 | | 12/31/07 | | |
| | | | | | | | | | | | | |
Investor Shares | | | | | | | | | | | | | |
Net asset value, beginning of period | | $ | 11.55 | | $ | 25.60 | | $ | 22.71 | | $ | 22.13 | |
| | | | | | | | | | | | | |
Income (loss) from investment operations: | | | | | | | | | | | | | |
Net investment income (a) | | | 0.19 | | | 0.64 | | | 0.35 | | | 0.19 | |
Net realized and unrealized gain (loss) | | | 3.44 | | | (12.78 | ) | | 7.04 | | | 1.88 | |
| | | | | | | | | | | | | |
Total from investment operations | | | 3.63 | | | (12.14 | ) | | 7.39 | | | 2.07 | |
| | | | | | | | | | | | | |
Less distributions from: | | | | | | | | | | | | | |
Net investment income | | | — | | | (0.52 | ) | | (0.43 | ) | | (0.12 | ) |
Net realized gains | | | — | | | (1.39 | ) | | (4.07 | ) | | (1.37 | ) |
| | | | | | | | | | | | | |
Total distributions | | | — | | | (1.91 | ) | | (4.50 | ) | | (1.49 | ) |
| | | | | | | | | | | | | |
Net asset value, end of period | | $ | 15.18 | | $ | 11.55 | | $ | 25.60 | | $ | 22.71 | |
| | | | | | | | | | | | | |
Total Return (b) | | | 31.43% | | | (48.59)% | | | 33.63% | | | 10.64% | |
Ratios and Supplemental Data: | | | | | | | | | | | | | |
Net assets, end of period (in thousands) | | $ | 103,137 | | $ | 61,005 | | $ | 145,530 | | $ | 42,009 | |
Ratios to average net assets: | | | | | | | | | | | | | |
Net expenses (c) | | | 1.35% | | | 1.28% | | | 1.32% | | | 1.35% | |
Gross expenses (c) | | | 1.37% | | | 1.28% | | | 1.32% | | | 1.54% | |
Net investment income (c) | | | 3.12% | | | 3.02% | | | 1.34% | | | 1.38% | |
Portfolio turnover rate | | | 28% | | | 53% | | | 52% | | | 48% | |
| |
† | Unaudited. |
* | The inception date for Investor Shares was May 1, 2006. |
(a) | Beginning with the fiscal year ended 12/31/06, net investment income has been computed using the average shares method. |
(b) | Total returns reflect reinvestment of all dividends and distributions, if any. Certain expenses of the Portfolio have been waived or reimbursed by the Portfolio’s Investment Manager or Administrator; without such waiver/reimbursement of expenses, the Portfolio’s returns would have been lower. |
| Performance information does not reflect the fees and charges imposed by participating insurance companies at the separate account level, and such charges will have the effect of reducing performance. Periods of less than one year are not annualized. |
(c) | Annualized for periods of less than one year. |
The accompanying notes are an integral part of these financial statements.
Semi-Annual Report 29
|
|
Lazard Retirement Series, Inc. Notes to Financial Statements June 30, 2009 (unaudited) |
|
1. Organization
Lazard Retirement Series, Inc. (the “Fund”) was incorporated in Maryland on February 13, 1997 and is registered under the Investment Company Act of 1940, as amended (the “Act”), as an open-end management investment company. The Fund is comprised of ten no-load portfolios (each referred to as a “Portfolio”), which are offered only to separate accounts established by insurance companies to fund variable annuity contracts and variable life insurance policies. The Fund may also be offered to certain qualified pension and retirement plans and accounts permitting accumulation of assets on a tax-deferred basis. Effective January 31, 2006, the Fund designated its existing class of shares as Service Shares and commenced offering Investor Shares. Investor Shares and Service Shares are identical, except as to the services offered to and expenses borne by each class of shares. Currently, only the following four Portfolios, each of which is “diversified,” as defined in the Act, are offered: Lazard Retirement U.S. Strategic Equity Portfolio (formerly Lazard Retirement Equity Portfolio) (“U.S. Strategic Equity Portfolio”), Lazard Retirement U.S. Small-Mid Cap Equity Portfolio (formerly Lazard Retirement Small Cap Portfolio and Lazard Retirement U.S. Small Cap Equity Portfolio) (“U.S. Small-Mid Cap Equity Portfolio”), Lazard Retirement International Equity Portfolio (“International Equity Portfolio”) and Lazard Retirement Emerging Markets Equity Portfolio (formerly Lazard Retirement Emerging Markets Portfolio) (“Emerging Markets Equity Portfolio”). Each of the other six Portfolios had not commenced operations as of June 30, 2009.
2. Significant Accounting Policies
The following is a summary of significant accounting policies:
(a) Valuation of Investments—Market values for securities listed on the New York Stock Exchange (“NYSE”), NASDAQ national market or other U.S. exchanges or markets are generally based on the last reported sales price on the principal exchange or market on which the security is traded, generally as of the close of regular trading on the NYSE (normally 4:00 p.m. Eastern time) on each valuation date; securities not traded on the valuation date are valued at the closing bid price. The Fund values NASDAQ-traded securities at the NASDAQ Official Closing Price, which may not be the last reported sales price in certain instances. Any securities not listed, for which current over-the-counter mar-
ket quotations or bids are readily available, are valued at the last quoted bid price or, if available, the mean of two such prices. Securities listed on foreign exchanges are valued at the last reported sales price except as described below; securities listed on foreign exchanges that are not traded on the valuation date are valued at the last quoted bid price.
If a significant event materially affecting the value of securities occurs between the close of the exchange or market on which the security is principally traded and the time when a Portfolio’s net asset value is calculated, or when current market quotations otherwise are determined not to be readily available or reliable, such securities will be valued at their fair values as determined by, or in accordance with procedures approved by, the Board of Directors (the “Board”). The Valuation Committee of Lazard Asset Management LLC, the Fund’s investment manager (the “Investment Manager”) and a wholly-owned subsidiary of Lazard Frères & Co. LLC, may evaluate a variety of factors to determine the fair value of securities for which current market quotations are determined not to be readily available or reliable. These factors include, but are not limited to, the type of security, the value of comparable securities, observations from financial institutions and relevant news events. Input from the Investment Manager’s analysts will also be considered. Fair valuing of foreign securities may be determined with the assistance of a pricing service, using correlations between the movement of prices of such securities and indices of domestic securities and other appropriate indicators, such as closing market prices of relevant ADRs or futures contracts. The effect of using fair value pricing is that the net asset value of a Portfolio will reflect the affected securities’ values as determined in the judgment of the Board, or its designee, instead of being determined by the market. Using a fair value pricing methodology to price securities may result in a value that is different from the most recent closing price of a security and from the prices used by other investment companies to calculate their portfolios’ net asset values.
(b) Portfolio Securities Transactions and Investment Income—Portfolio securities transactions are accounted for on trade date. Realized gain (loss) on sales of investments are recorded on a specific identification basis. Dividend income is recorded on the ex-dividend date and interest income is accrued daily.
The Portfolios may be subject to taxes imposed by foreign countries in which they invest. Such taxes are generally based upon income earned or capital gains, realized or unrealized. The Portfolios accrue and apply such taxes to net investment income, net realized gains and net unrealized gains concurrent with the recognition of income or capital gains (realized and unrealized) from the applicable portfolio securities.
(c) Repurchase Agreements—In connection with transactions in repurchase agreements, the Fund’s custodian takes possession of the underlying collateral securities, the fair value of which at all times is required to be at least equal to the principal amount, plus accrued interest, of the repurchase transaction. If the seller defaults, and the fair value of the collateral declines, realization of the collateral by a Portfolio may be delayed or limited.
(d) Foreign Currency Translation—The accounting records of the Portfolios are maintained in U.S. dollars. Portfolio securities and other assets and liabilities denominated in a foreign currency are translated daily into U.S. dollars at the prevailing rates of exchange. Purchases and sales of securities, income receipts and expense payments are translated into U.S. dollars at the prevailing exchange rates on the respective transaction dates.
The Portfolios do not isolate the portion of operations resulting from changes in foreign exchange rates on investments from the fluctuations arising from changes in their market prices. Such fluctuations are included in net realized and unrealized gain (loss) on investments. Net realized gain (loss) on foreign currency transactions represents net foreign currency gain (loss) from disposition of foreign currencies, currency gain (loss) realized between the trade and settlement dates on securities transactions, and the difference between the amount of dividends, interest and foreign withholding taxes recorded on a Portfolio’s accounting records and the U.S. dollar equivalent amounts actually received or paid. Net unrealized foreign currency gain (loss) arises from changes in the value of assets and liabilities, other than investments in securities, as a result of changes in exchange rates.
(e) Federal Income Taxes—The Fund’s policy is to continue to have each Portfolio qualify as a regulated investment company under Subchapter M of the Internal Revenue Code and to distribute all of its taxable income, including any net
realized capital gains, to shareholders. Therefore, no federal income tax provision is required.
At December 31, 2008, the following Portfolios had available for federal income tax purposes unused realized capital losses which can be used to offset future realized capital gains as follows:
| | | | | |
Portfolio | | | Expiring 2016 | |
U.S. Strategic Equity | | $ | 772,185 | |
U.S. Small-Mid Cap Equity | | | 9,185,255 | |
International Equity | | | 6,022,728 | |
Under current tax law, certain capital and net foreign currency losses realized after October 31 within the taxable year may be deferred and treated as occurring on the first day of the following tax year. For the tax year ended December 31, 2008, the following Portfolios elected to defer net capital losses arising between November 1, 2008 and December 31, 2008 as follows:
| | | | | |
Portfolio | | | Amount | |
U.S. Strategic Equity | | $ | 355,043 | |
U.S. Small-Mid Cap Equity | | | 4,493,577 | |
International Equity | | | 2,954,641 | |
Emerging Markets Equity | | | 23,978,505 | |
The Fund follows the provisions of the Financial Accounting Standards Board (“FASB”) Interpretation No. 48 (“FIN 48”) Accounting for Uncertainty in Income Taxes. FIN 48 sets forth a minimum threshold for financial statement recognition of the benefit of a tax position taken or expected to be taken in a tax return. There are no unrecognized tax benefits in the accompanying financial statements. If applicable, the Fund recognizes interest accrued related to unrecognized tax benefits in interest expense and penalties in other expenses in the Statement of Operations. Each of the tax years in the four year period ended December 31, 2008, remains subject to examination by taxing authorities.
(f) Dividends and Distributions—Each Portfolio intends to declare and to pay dividends annually from net investment income. During any particular year, net realized gains from investment transactions in excess of available capital loss carryforwards would be taxable to the Portfolio, if not distributed. The Portfolios intend to declare and distribute these amounts, at least annually, to shareholders; however, to avoid taxation, a second distribution may be required.
Income dividends and capital gains distributions are determined in accordance with federal income tax regulations which may differ from U.S. generally accepted accounting principles. These book/tax differences, which may result in distribution reclassifications, are primarily due to differing treatments of foreign currency transactions, wash sales and distributions from real estate investment trusts. Book/tax differences relating to shareholder distributions may result in reclassifications among certain capital accounts.
(g) Allocation of Expenses—Expenses not directly chargeable to a specific Portfolio are allocated among the Portfolios primarily on the basis of relative net assets. A Portfolio accrues distribution and service (12b-1) fees to its Service Shares. Each Portfolio’s income, expenses (other than class specific expenses) and realized and unrealized gains and losses are allocated proportionally each day between the classes based upon the relative net assets of each class.
(h) Expense Reductions—Portfolios leaving excess cash in demand deposit accounts may receive credits which are available to offset custody expenses. The Statements of Operations report gross custody expenses, and report the amount of such credits separately as an expense reduction.
(i) Estimates—The preparation of financial statements in conformity with U.S. generally accepted accounting principles requires the Fund to make estimates and assumptions that affect the reported amounts of assets and liabilities and disclosure of contingent assets and liabilities at the date of the financial statements and the reported amounts of increases and decreases in net assets from operations during the reporting period. Actual results could differ from those estimates.
3. Investment Management, Administrative and Distribution Agreements
The Fund, on behalf of the Portfolios, has entered into an investment management agreement (the “Management Agreement”) with the Investment Manager. Pursuant to the Management Agreement, the Investment Manager regularly provides each Portfolio with investment research, advice and supervision and furnishes continuously an investment program for each Portfolio consistent with its investment objective and policies, including the purchase, retention and disposition of securities. For its services provided to the Fund, the Investment Manager earns a management fee,
accrued daily and payable by each Portfolio monthly, at the annual rate set forth below as a percentage of its average daily net assets:
| | | | | |
Portfolio | | | Annual Rate | |
U.S. Strategic Equity | | 0.75 | % | |
U.S. Small-Mid Cap Equity | | 0.75 | | |
International Equity | | 0.75 | | |
Emerging Markets Equity | | 1.00 | | |
The Investment Manager has voluntarily agreed to reduce its fees and, if necessary, reimburse the following Portfolios if annualized operating expenses exceed the following percentages of average daily net assets for the respective Shares:
| | | | | | | | |
Portfolio | | | Service Shares | | Investor Shares | |
U.S. Strategic Equity | | 1.25 | % | | N/A | | |
U.S. Small-Mid Cap Equity | | 1.25 | | | N/A | | |
International Equity | | 1.25 | | | N/A | | |
Emerging Markets Equity | | 1.60 | | | 1.35 | % | |
During the period ended June 30, 2009, the Investment Manager waived its management fee and reimbursed the following Portfolios for other expenses as follows:
| | | | | | | | | | | | |
Portfolio | | | Service Shares | | Investor Shares | |
U.S. Strategic Equity | | | | $ 62,196 | | | | | N/A | | |
U.S. Small-Mid Cap Equity | | | | 64,880 | | | | | N/A | | |
Emerging Markets Equity | | | | 10,774 | | | | $ | 5,998 | | |
The Fund has entered into an administrative agreement with State Street Bank and Trust Company (“State Street”) to provide certain administrative services. Each Portfolio bears the cost of such services at a fixed annual rate of $42,500, plus 0.02% of average daily net assets up to $1 billion and 0.01% of average daily net assets over $1 billion. State Street has agreed to waive $18,750 of its fee annually for the U.S. Strategic Equity Portfolio until the Portfolio’s net assets reach $25 million.
The Fund has a distribution agreement with Lazard Asset Management Securities LLC (the “Distributor”), a wholly-owned subsidiary of the Investment Manager, to serve as the distributor for shares of each Portfolio, and bears the cost of printing and mailing prospectuses to potential investors and of certain expenses in connection with the offering of Portfolio shares.
Under a Distribution and Servicing Plan in accordance with Rule 12b-1 under the Act, each Portfolio pays a monthly fee to the Distributor, at an annual rate of 0.25% of the average daily net assets of its Service Shares, for distribution and servicing of accounts. The Distributor may make payments to participating insurance companies, certain financial institutions, securities dealers and other industry professionals for providing these services.
4. Directors’ Compensation
Certain Directors of the Fund are officers of the Investment Manager. The Fund pays each Director who is not an employee or an affiliated person of the Investment Manager (the “Independent Directors”) an annual aggregate fee of $60,000, plus $4,000 per meeting attended in person ($1,500 per meeting attended by telephone) for the Fund, The Lazard Funds, Inc., Lazard Global Total Return and Income Fund, Inc. and Lazard World Dividend & Income Fund, Inc. (collectively, the “Lazard Funds”), each a registered management investment company advised by the Investment Manager, and reimburses them for travel and other out of pocket expenses for attending Board and committee meetings. The Independent Directors also are paid $1,000 for each committee, subcommittee or other special meeting not held in conjunction with a Board meeting. In addition, the Chairman of the Audit Committees of the Boards of the Lazard Funds also receives an additional annual fee of $5,000.
5. Securities Transactions and Transactions with Affiliates
Purchases and sales of portfolio securities (excluding short-term securities) for the period ended June 30, 2009 were as follows:
| | | | | | | | |
Portfolio | | | Purchases | | Sales | |
U.S. Strategic Equity | | $ | 1,977,210 | | $ | 1,472,007 | |
U.S. Small-Mid Cap Equity | | | 41,314,846 | | | 41,173,094 | |
International Equity | | | 113,581,120 | | | 133,430,846 | |
Emerging Markets Equity | | | 107,920,434 | | | 67,779,225 | |
For the period ended June 30, 2009, no brokerage commissions were paid to affiliates of the Investment Manager or other affiliates of the Fund for portfolio transactions executed on behalf of the Fund.
6. Foreign Securities Investment Risks
Certain Portfolios invest in securities of foreign entities and in instruments denominated in foreign currencies which involve risks not typically experienced with investments in domestic securities. Foreign investments carry special risks, such as exposure to currency fluctuations, less developed or less efficient trading markets, political instability, a lack of company information, differing auditing and legal standards and, potentially, less liquidity. A Portfolio’s investments in emerging markets are exposed to additional volatility. A Portfolio’s performance will be influenced by political, social and economic factors affecting emerging markets. Emerging market countries generally have economic structures that are less diverse and mature, and political systems that are less stable, than those of developed countries.
7. Fair Value Measurements
The Fund adopted FASB Statement of Financial Accounting Standards No. 157, Fair Value Measurements (“SFAS 157”), effective January 1, 2008. In accordance with SFAS 157, fair value is defined as the price that a Portfolio would receive to sell an asset, or would pay to transfer a liability, in an orderly transaction between market participants at the date of measurement. SFAS 157 also establishes a framework for measuring fair value, and a three-level hierarchy for fair value measurement that is based upon the transparency of inputs to the valuation of an asset or liability. Inputs may be observable or unobservable and refer, broadly, to the assumptions that market participants would use in pricing the asset or liability. Observable inputs reflect the assumptions that market participants would use in pricing the asset or liability based on market data obtained from sources independent of the Fund. Unobservable inputs reflect the Fund’s own assumptions about the assumptions that market participants would use in pricing the asset or liability, developed based on the best information available in the circumstances. Each investment’s fair value measurement level within the fair value hierarchy is based on the lowest level of any input that is significant to the overall fair value measurement. The three-level hierarchy of inputs is summarized below.
| |
• | Level 1 – quoted prices in active markets for identical investments |
•
|
Level 2 – other significant observable inputs (including quoted prices for similar investments, interest rates, prepayment speeds, credit risk, etc.)
|
| |
• | Level 3 – significant unobservable inputs (including the Fund’s own assumptions in determining the fair value of investments) |
The inputs or methodolgy used for valuing securities are not necessarily an indication of the risks associated with investing in these securities.
The following tables summarize the valuation of the Portfolios’ investments by each fair value hierarchy level as of June 30, 2009:
| | | | | | | | | | | | | | |
Description | | | Quoted Prices
Active Markets
for Identical
Investments
(Level 1) | | Significant
Other
Observable
Inputs
(Level 2) | | Significant
Unobservable
Inputs
(Level 3) | | Balance as of
June 30, 2009 | |
U.S. Strategic Equity Portfolio | | | | | | | | | | | | | |
| | | | | | | | | | | | | |
Common Stocks | | $ | 3,863,515 | | $ | — | | $ | — | | $ | 3,863,515 | |
Short-Term | | | | | | | | | | | | | |
Investment | | | — | | | 51,889 | | | — | | | 51,889 | |
Total | | $ | 3,863,515 | | $ | 51,889 | | $ | — | | $ | 3,915,404 | |
| | | | | | | | | | | | | |
U.S. Small-Mid Cap Equity Portfolio | | | | | | | | | | | | | |
| | | | | | | | | | | | | |
Common Stocks | | $ | 38,112,509 | | $ | — | | $ | — | | $ | 38,112,509 | |
Short-Term | | | | | | | | | | | | | |
Investment | | | — | | | 851,545 | | | — | | | 851,545 | |
Total | | $ | 38,112,509 | | $ | 851,545 | | $ | — | | $ | 38,964,054 | |
| | | | | | | | | | | | | |
International Equity Portfolio | | | | | | | | | | | | | |
| | | | | | | | | | | | | |
Common Stocks | | $ | 248,554,754 | | $ | — | | $ | — | | $ | 248,554,754 | |
Short-Term | | | | | | | | | | | | | |
Investment | | | — | | | 16,659,754 | | | — | | | 16,659,754 | |
Total | | $ | 248,554,754 | | $ | 16,659,754 | | $ | — | | $ | 265,214,508 | |
| | | | | | | | | | | | | |
Emerging Markets Equity Portfolio | | | | | | | | | | | | | |
| | | | | | | | | | | | | |
Common Stocks | | $ | 314,826,566 | | $ | — | | $ | — | | $ | 314,826,566 | |
Preferred Stocks | | | 11,862,426 | | | — | | | — | | | 11,862,426 | |
Short-Term | | | | | | | | | | | | | |
Investment | | | — | | | 28,538,754 | | | — | | | 28,538,754 | |
Total | | $ | 326,688,992 | | $ | 28,538,754 | | $ | — | | $ | 355,227,746 | |
8. Accounting Pronouncements
In March 2008, the FASB issued Statement of Financial Accounting Standards No. 161, Disclosures about Derivative Instruments and Hedging Activities, an amendment of FASB Statement No. 133 (“SFAS 161”), which is effective for fiscal years beginning after November 15, 2008 and interim periods within those fiscal years. SFAS 161 is intended to improve financial reporting for derivative instruments and hedging activities by requiring enhanced disclosure that enables investors to better understand how and why an entity uses derivatives, how derivatives are accounted for, and how derivatives affect an entity’s results of operations and financial position. On January 1, 2009, the Fund adopted SFAS 161. The Fund did not engage in derivative transactions during the six months ended June 30, 2009.
In accordance with the provisions set forth in FASB Statement of Financial Accounting Standards No. 165, Subsequent Events, which is effective for interim and annual periods ending after June 15, 2009, management has evaluated, through August 14, 2009, the possibility of subsequent events affecting the Fund’s financial statements. Management has determined that there are no such subsequent events that would require disclosure in the Fund’s financial statements through the above date, at which time the financial statements were available for distribution.
|
|
The Lazard Funds, Inc. Board of Directors and Officers Information (unaudited) |
|
| | | | |
Name (Age)
Address (1) | | Position(s) with the Fund
(Since) and Term (2) | | Principal Occupation(s) During Past 5 Years
and Other Directorships Held (2)
|
Non-Interested Directors: | | | | |
|
Kenneth S. Davidson (64) | | Director
(April 1997) | | President, Davidson Capital Management Corporation; President, Aquiline Advisors LLC; Trustee, The Juilliard School; Chairman of the Board, Bridgehampton Chamber Music Festival; Trustee, American Friends of the National Gallery, London |
| | | | |
Nancy A. Eckl (46) | | Director
(May 2007) | | Former Vice President, Trust Investments, American Beacon Advisers, Inc. (“American Beacon”) and Vice President of certain funds advised by American Beacon; Trustee, College Retirement Equities Fund (eight accounts); Trustee, TIAA-CREF Funds (26 funds) and TIAA-CREF Life Funds (10 funds), and Member of the Management Committee of TIAA Separate Account VA-1 |
| | | | |
Lester Z. Lieberman (79) | | Director
(April 1997) | | Private Investor; Chairman, Healthcare Foundation of New Jersey; Director, Cives Steel Co.; Director, Northside Power Transmission Co.; Advisory Trustee, New Jersey Medical School; Director, Public Health Research Institute; Trustee Emeritus, Clarkson University; Council of Trustees, New Jersey Performing Arts Center |
| | | | |
Leon M. Pollack (68) | | Director
(August 2006) | | Former Managing Director, Donaldson, Lufkin & Jenrette; Trustee, Adelphi University |
| | | | |
Richard Reiss, Jr. (65) | | Director
(April 1997) | | Chairman, Georgica Advisors LLC, an investment manager; Director, O’Charley’s, Inc., a restaurant chain |
| | | | |
Robert M. Solmson (61) | | Director
(September 2004) | | Director, Colonial Williamsburg Co.; Former Chief Executive Officer and Chairman, RFS Hotel Investors, Inc.; Former Director, Morgan Keegan & Co., Inc.; Former Director, Independent Bank, Memphis |
| | | | |
Interested Directors(3): | | | | |
|
Charles Carroll (48) | | Chief Executive Officer,
President and Director
(June 2004) | | Deputy Chairman and Head of Global Marketing of the Investment Manager |
| | | | |
Ashish Bhutani (49) | | Director
(July 2005) | | Chief Executive Officer of the Investment Manager |
| |
(1) | The address of each Director is Lazard Asset Management LLC, 30 Rockefeller Plaza, New York, New York 10112-6300. |
| |
(2) | Each Director also serves as a Director for each of the Lazard Funds (comprised of 18 investment portfolios). All of the Independent Directors, except Mr. Lieberman, are also board members of Lazard Alternative Strategies Fund, L.L.C., a privately-offered fund registered under the Act and advised by an affiliate of the Investment Manager. Each Director serves for an indefinite term, until his or her successor is elected, and each Director serves in the same capacity for the other Lazard Funds. |
| |
(3) | Messrs. Bhutani and Carroll are “interested persons” (as defined in the Act) of the Fund because of their positions with the Investment Manager. |
| |
The Fund’s Statement of Additional Information contains further information about the Directors and is available without charge by calling 800-823-6300. |
| | |
Name (Age)
Address (1) | Position(s) with the Fund
(Since) and Term (2) |
Principal Occupation(s) During Past 5 Years
|
Officers(3): | | |
|
Nathan A. Paul (36) | Vice President
and Secretary
(April 2002) | Managing Director and General Counsel of the Investment Manager |
| | |
Stephen St. Clair (50) | Treasurer
(May 2003) | Vice President of the Investment Manager |
| | |
Brian D. Simon (47) | Chief Compliance Officer
(January 2009) and
Assistant Secretary
(November 2002) | Director and Chief Compliance Officer of the Investment Manager |
| | |
Tamar Goldstein (34) | Assistant Secretary
(February 2009) | Vice President of the Investment Manager; Associate at Schulte Roth & Zabel LLP, a law firm, from May 2004 to October 2006 |
| | |
Cesar A. Trelles (34) | Assistant Treasurer
(December 2004) | Fund Administration Manager of the Investment Manager |
| |
(1) | The address of each officer is Lazard Asset Management LLC, 30 Rockefeller Plaza, New York, New York 10112-6300. |
| |
(2) | Each officer serves for an indefinite term, until his or her successor is elected and qualified, and serves in the same capacity for the other Lazard Funds. |
| |
(3) | In addition to Charles Carroll, President, whose information is included in the Interested Directors section. |
36 Semi-Annual Report
|
|
Lazard Retirement Series, Inc. Other Information (unaudited) |
|
Proxy Voting
A description of the policies and procedures used to determine how proxies relating to Fund portfolio securities are voted is available (1) without charge, upon request, by calling (800) 823-6300 or (2) on the Securities and Exchange Commission (the “SEC”) website at http://www.sec.gov.
The Fund’s proxy voting record for the most recent 12-month period ended June 30 is available (1) without charge, upon request, by calling (800) 823-6300 or (2) on the SEC’s website at http://www.sec.gov. Information as of June 30 each year will generally be available by the following August 31.
Form N-Q
The Fund files a complete schedule of each Portfolio’s holdings for the first and third quarters of its fiscal year with the SEC on Form N-Q. The Fund’s Forms N-Q are available on the SEC’s website at http://www.sec.gov and may be reviewed and copied at the SEC’s Public Reference Room in Washington, D.C. Information on the operation of the SEC’s Public Reference Room may be obtained by calling 1-800-SEC-0330.
Semi-Annual Report 37
|
Lazard Retirement Series, Inc. |
30 Rockefeller Plaza |
New York, New York 10112-6300 |
Telephone: 800-823-6300 |
http://www.LazardNet.com |
|
Investment Manager |
Lazard Asset Management LLC |
30 Rockefeller Plaza |
New York, New York 10112-6300 |
Telephone: 800-823-6300 |
|
Distributor |
Lazard Asset Management Securities LLC |
30 Rockefeller Plaza |
New York, New York 10112-6300 |
|
Custodian |
State Street Bank and Trust Company |
One Lincoln Street |
Boston, Massachusetts 02111 |
|
Transfer Agent and Dividend Disbursing Agent |
Boston Financial Data Services, Inc. |
P.O. Box 8514 |
Boston, Massachusetts 02266-8514 |
Telephone: 800-986-3455 |
|
Independent Registered Public Accounting Firm |
Anchin, Block & Anchin LLP |
1375 Broadway |
New York, New York 10018 |
http://www.anchin.com |
|
Legal Counsel |
Stroock & Stroock & Lavan LLP |
180 Maiden Lane |
New York, New York 10038-4982 |
http://www.stroock.com |

Performance information as of the most recent month end is available online at www.LazardNet.com.
Lazard Asset Management LLC
30 Rockefeller Plaza
New York, NY 10112-6300
800-823-6300
www.LazardNet.com
© 2009 Lazard Asset Management LLC
6/09 LZDPS010
ITEM 2. CODE OF ETHICS.
Not applicable.
ITEM 3. AUDIT COMMITTEE FINANCIAL EXPERT.
Not applicable.
ITEM 4. PRINCIPAL ACCOUNTANT FEES AND SERVICES.
Not applicable.
ITEM 5. AUDIT COMMITTEE OF LISTED REGISTRANTS.
Not applicable.
ITEM 6. INVESTMENTS
Not applicable.
ITEM 7. DISCLOSURE OF PROXY VOTING POLICIES AND PROCEDURES FOR CLOSED END MANAGEMENT INVESTMENT COMPANIES.
Not applicable.
ITEM 8. PORTFOLIO MANAGERS OF CLOSED-END MANAGEMENT INVESTMENT COMPANIES.
Not applicable.
ITEM 9. PURCHASES OF EQUITY SECURITIES BY CLOSED-END MANAGEMENT INVESTMENT COMPANY AND AFFILIATED PURCHASERS.
Not applicable.
ITEM 10. SUBMISSION OF MATTERS TO A VOTE OF SECURITY HOLDERS.
There were no material changes to the procedures by which shareholders may recommend nominees to the Registrant’s Board of Directors during the period covered by this report.
ITEM 11. CONTROLS AND PROCEDURES.
(a) The Registrant's principal executive and principal financial officers have concluded, based on their evaluation of the Registrant's disclosure controls and procedures as of a date within 90 days of the filing date of this report, that the Registrant's disclosure controls and procedures are reasonably designed to ensure that information required to be disclosed by the Registrant on Form N-CSR is recorded, processed, summarized and reported within the required time periods and that information required to be disclosed by the Registrant in the reports that it files or submits on Form N-CSR is accumulated and communicated to the Registrant's management, including its principal executive and principal financial officers, as appropriate to allow timely decisions regarding required disclosure.
(b) There were no changes to the Registrant's internal control over financial reporting that occurred during the second fiscal quarter of the period covered by this report that have materially affected, or are reasonably likely to materially affect, the Registrant's internal control over financial reporting.
ITEM 12. EXHIBITS.
(a)(1) Not applicable.
(a)(2) Certifications of principal executive and principal financial officers as required by Rule 30a-2(a) under the Investment Company Act of 1940.
(a)(3) Not applicable.
(b) Certifications of principal executive and principal financial officers as required by Rule 30a-2(b) under the Investment Company Act of 1940.
SIGNATURES
Pursuant to the requirements of the Securities Exchange Act of 1934 and the Investment Company Act of 1940, the registrant has duly caused this report to be signed on its behalf by the undersigned, thereunto duly authorized.
Lazard Retirement Series, Inc.
| | |
| By | /s/ Charles Carroll | |
| | Charles Carroll | |
| | Chief Executive Officer | |
| |
| Date | September 1, 2009 | |
Pursuant to the requirements of the Securities Exchange Act of 1934 and the Investment Company Act of 1940, this report has been signed below by the following persons on behalf of the registrant and in the capacities and on the dates indicated.
| | |
| By | /s/ Charles Carroll | |
| | Charles Carroll | |
| | Chief Executive Officer | |
| |
| Date | September 1, 2009 | |
| |
| By | /s/ Stephen St. Clair | |
| | Stephen St. Clair | |
| | Chief Financial Officer | |
| |
| Date | September 1, 2009 | |