Review
of
Strategic Alternatives
July 1, 2003
DUFF&PHELPS, LLC
311 SOUTH WACKER DRIVE, SUITE 4200 CHICAGO, ILLINOIS 60606 312-697-4600 FAX 312-697-0115
The information contained herein is of a confidential nature and is intended for the exclusive use of the persons or firm to whom it is furnished by us. Reproduction, publication, or dissemination of portions hereof may not be made without prior approval of Duff & Phelps, LLC.
- 2 -
DUFF&PHELPS,LLC
Table of Contents
I. Introduction
II. Pro Forma Analysis reflecting Sale of Unified Banking Company
III. Restructuring Alternatives
A. Split of Company into Trust and Fund Services
B. Employee Buyout of Fund Services
C. Remain in Current Corporate Structure
D. Summary Comparison
IV. Share Buyback
V. Recommendations
Appendix
A. Discounted Cash Flow Analysis as of December 31, 2002
Trust
Fund Services
B. Comparable Company Analysis as of December 31, 2002
C. Premiums Paid for Self Tender Offers
D. Review of Sale Alternatives
- 3 -
DUFF&PHELPS,LLC
I. Introduction
Duff & Phelps, LLC (“Duff & Phelps”) has been retained as independent financial advisor to Unified Financial Services, Inc. (“Unified Financial”) to provide an analysis of particular alternatives to maximize shareholder value, among other items. Specifically Duff & Phelps has been retained to provide an analysis of:
a split-off of the Company into two main business lines, including trust/wealth management (“Trust”) and fund services (“Fund Services”);
an employee buyout of Fund Services;
whether a repurchase of shares of common stock is a reasonable use of the Company’s capital; and
a fair price for the repurchase of such shares of common stock in a tender offer made to all stockholders of the Company.
We did not consider sale of either Trust or Fund Services to a third-party buyer. Both scenarios were determined not to be a good way to maximize shareholder value.
- 4 -
DUFF&PHELPS,LLC
II. Pro Forma Analysis
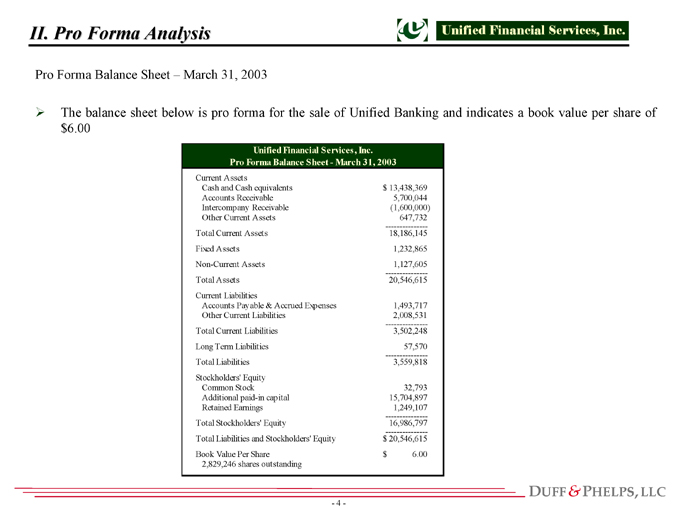
The balance sheet below is pro forma for the sale of Unified Banking and indicates a book value per share of $6.00
Current Assets
Cash and Cash equivalents 13,438,369 $
Accounts Receivable 5,700,044
Intercompany Receivable (1,600,000)
Other Current Assets 647,732
Total Current Assets 18,186,145
Fixed Assets 1,232,865
Non-Current Assets 1,127,605
Total Assets 20,546,615
Current Liabilities
Accounts Payable & Accrued Expenses 1,493,717
Other Current Liabilities 2,008,531
Total Current Liabilities 3,502,248
Long Term Liabilities 57,570
Total Liabilities 3,559,818
Stockholders’ Equity
Common Stock 32,793
Additional paid-in capital 15,704,897
Retained Earnings 1,249,107
Total Stockholders’ Equity 16,986,797
Total Liabilities and Stockholders’ Equity 20,546,615 $
Book Value Per Share 6.00 $
2,829,246 shares outstanding
Unified Financial Services, Inc.
Pro Forma Balance Sheet—March 31, 2003
Pro Forma Balance Sheet – March 31, 2003
- 5 -
DUFF&PHELPS,LLC
II. Pro Forma Analysis
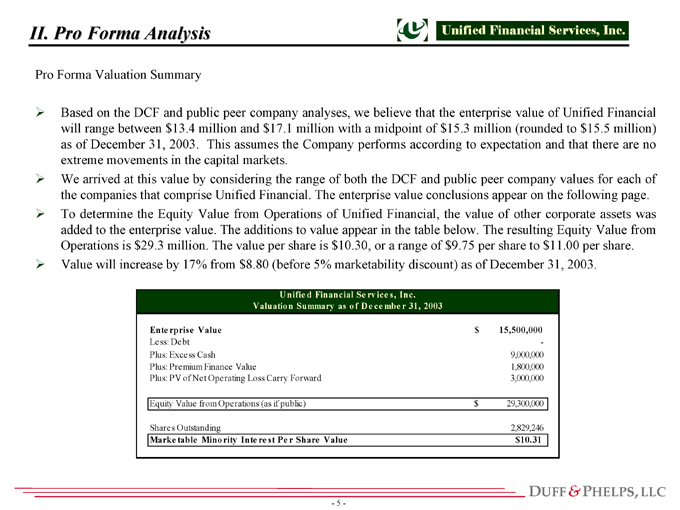
Pro Forma Valuation Summary
Based on the DCF and public peer company analyses, we believe that the enterprise value of Unified Financial will range between $13.4 million and $17.1 million with a midpoint of $15.3 million (rounded to $15.5 million) as of December 31, 2003. This assumes the Company performs according to expectation and that there are no extreme movements in the capital markets.
We arrived at this value by considering the range of both the DCF and public peer company values for each of the companies that comprise Unified Financial. The enterprise value conclusions appear on the following page.
To determine the Equity Value from Operations of Unified Financial, the value of other corporate assets was added to the enterprise value. The additions to value appear in the table below. The resulting Equity Value from Operations is $29.3 million. The value per share is $10.30, or a range of $9.75 per share to $11.00 per share.
Value will increase by 17% from $8.80 (before 5% marketability discount) as of December 31, 2003.
Enterprise Value 15,500,000 $
Less: Debt -
Plus: Excess Cash 9,000,000
Plus: Premium Finance Value 1,800,000
Plus: PV of Net Operating Loss Carry Forward 3,000,000
Equity Value from Operations (as if public) 29,300,000 $
Shares Outstanding 2,829,246
Marke table Minority Inte re st Pe r Share Value $10.31
Unified Financial Se rvice s, Inc.
Valuation Summary as of De cembe r 31, 2003
- 6 -
DUFF&PHELPS,LLC
II. Pro Forma Analysis
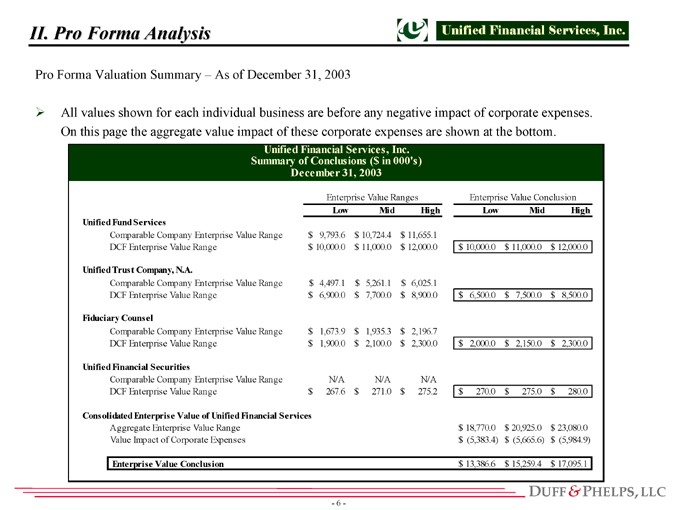
Pro Forma Valuation Summary – As of December 31, 2003
All values shown for each individual business are before any negative impact of corporate expenses.
On this page the aggregate value impact of these corporate expenses are shown at the bottom.
Low Mid High Low Mid High
Unified Fund Services
Comparable Company Enterprise Value Range 9,793.6 $ 10,724.4 $ 11,655.1 $
DCF Enterprise Value Range 10,000.0 $ 11,000.0 $ 12,000.0 $ 10,000.0 $ 11,000.0 $ 12,000.0 $
Unified Trust Company, N.A.
Comparable Company Enterprise Value Range 4,497.1 $ 5,261.1 $ 6,025.1 $
DCF Enterprise Value Range 6,900.0 $ 7,700.0 $ 8,900.0 $ 6,500.0 $ 7,500.0 $ 8,500.0 $
Fiduciary Counsel
Comparable Company Enterprise Value Range 1,673.9 $ 1,935.3 $ 2,196.7 $
DCF Enterprise Value Range 1,900.0 $ 2,100.0 $ 2,300.0 $ 2,000.0 $ 2,150.0 $ 2,300.0 $
Unified Financial Securities
Comparable Company Enterprise Value Range N/A N/A N/A
DCF Enterprise Value Range 267.6 $ 271.0 $ 275.2 $ 270.0 $ 275.0 $ 280.0 $
Consolidated Enterprise Value of Unified Financial Services
Aggregate Enterprise Value Range 18,770.0 $ 20,925.0 $ 23,080.0 $
Value Impact of Corporate Expenses (5,383.4) $ (5,665.6) $ (5,984.9) $
Enterprise Value Conclusion 13,386.6 $ 15,259.4 $ 17,095.1 $
Unified Financial Services, Inc.
Summary of Conclusions ($ in 000’s)
December 31, 2003
Enterprise Value Ranges Enterprise Value Conclusion
- 7 -
DUFF&PHELPS,LLC
II. Pro Forma Analysis
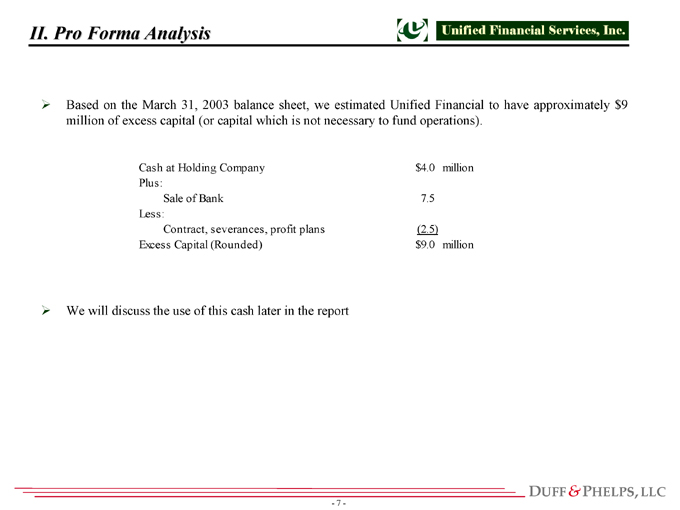
Based on the March 31, 2003 balance sheet, we estimated Unified Financial to have approximately $9
million of excess capital (or capital which is not necessary to fund operations).
We will discuss the use of this cash later in the report
Cash at Holding Company $4.0 million
Plus:
Sale of Bank 7.5
Less:
Contract, severances, profit plans (2.5)
Excess Capital (Rounded) $9.0 million
- 8 -
DUFF&PHELPS,LLC
III. Restructuring Alternatives
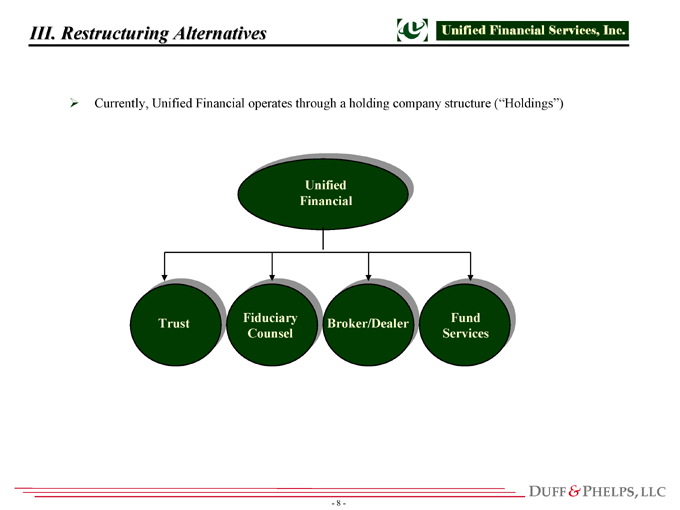
Currently, Unified Financial operates through a holding company structure (“Holdings”)
Trust Fiduciary
Counsel
Broker/Dealer Fund
Services
Unified
Financial
- 9 -
DUFF&PHELPS,LLC
III. Restructuring Alternatives
The Company is considering various restructuring alternatives
A. Split Unified Financial into two separate companies: (i) Trust/Fiduciary Counsel and (ii) Fund Services (including
Broker/Dealer) and operate these businesses independently. Shareholders exchange one share of Unified Financial
for shares each of Trust and Fund Services. Simultaneously, Unified Financial would complete a tender offer/stock
buyback to reduce its shareholder base and eliminate SEC filing requirements.
B. Sell Fund Services to its employees (which would also reduce number of shareholders to less than 300).
C. Do nothing and remain in current corporate structure.
- 10 -
DUFF&PHELPS,LLC
III. Restructuring Alternatives
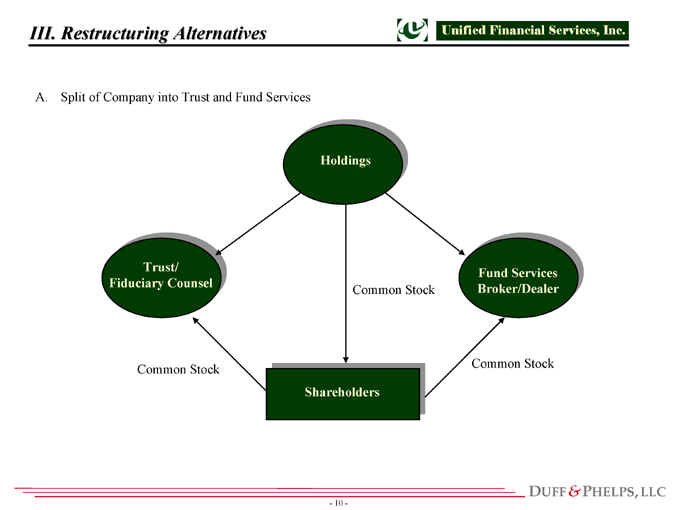
A. Split of Company into Trust and Fund Services
Holdings
Trust/
Fiduciary Counsel
Fund Services
Broker/Dealer
Shareholders
Common Stock Common Stock
Common Stock
- 11 -
DUFF&PHELPS,LLC
III. Restructuring Alternatives
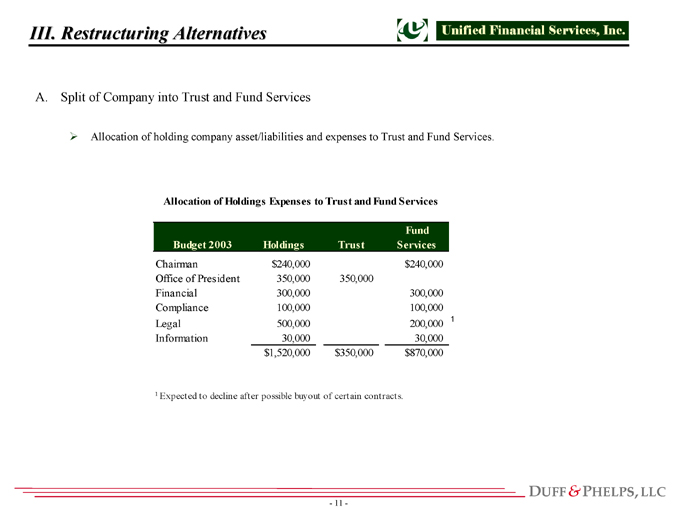
A. Split of Company into Trust and Fund Services
Allocation of holding company asset/liabilities and expenses to Trust and Fund Services.
Fund
Budget 2003 Holdings Trust Services
Chairman $240,000 $240,000
Office of President 350,000 350,000
Financial 300,000 300,000
Compliance 100,000 100,000
Legal 500,000 200,000 1
Information 30,000 30,000
$1,520,000 $350,000 $870,000
1 Expected to decline after possible buyout of certain contracts.
Allocation of Holdings Expenses to Trust and Fund Services
- 12 -
DUFF&PHELPS,LLC
III. Restructuring Alternatives
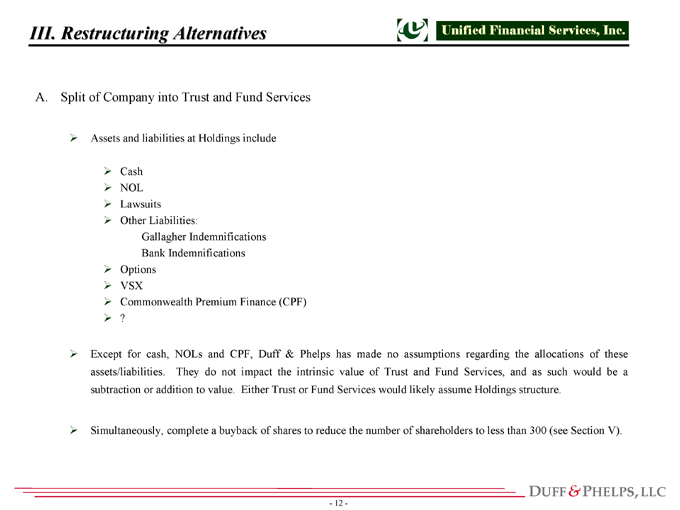
A. Split of Company into Trust and Fund Services
Assets and liabilities at Holdings include
Cash
NOL
Lawsuits
Other Liabilities:
Gallagher Indemnifications
Bank Indemnifications
Options
VSX
Commonwealth Premium Finance (CPF)
???
Except for cash, NOLs and CPF, Duff & Phelps has made no assumptions regarding the allocations of these
assets/liabilities. They do not impact the intrinsic value of Trust and Fund Services, and as such would be a
subtraction or addition to value. Either Trust or Fund Services would likely assume Holdings structure.
Simultaneously, complete a buyback of shares to reduce the number of shareholders to less than 300 (see Section V).
- 13 -
DUFF&PHELPS,LLC
III. Restructuring Alternatives
A. Split of Company into Trust and Fund Services
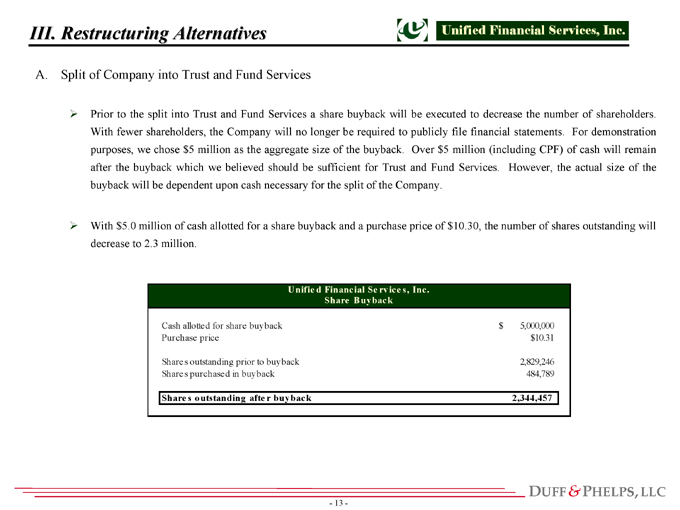
Prior to the split into Trust and Fund Services a share buyback will be executed to decrease the number of shareholders.
With fewer shareholders, the Company will no longer be required to publicly file financial statements. For demonstration
purposes, we chose $5 million as the aggregate size of the buyback. Over $5 million (including CPF) of cash will remain
after the buyback which we believed should be sufficient for Trust and Fund Services. However, the actual size of the
buyback will be dependent upon cash necessary for the split of the Company.
With $5.0 million of cash allotted for a share buyback and a purchase price of $10.30, the number of shares outstanding will
decrease to 2.3 million.
Cash allotted for share buyback 5,000,000 $
Purchase price $10.31
Shares outstanding prior to buyback 2,829,246
Shares purchased in buyback 484,789
Share s outstanding afte r buyback 2,344,457
Unifie d Financial Se rvice s, Inc.
Share Buyback
- 14 -

DUFF&PHELPS,LLC
III. Restructuring Alternatives
A. Split of Company into Trust and Fund Services
The Net Operating Losses (NOLs) are assumed to remain with Fund Services, while Trust will retain Commonwealth
Premium Finance. Excess cash is allocated to equalize the value of the two separate companies. However, the cash
allocation will be based upon capital cushion determined necessary for each business on a stand-alone basis. Also, the
enterprise value for each business has been reduced to reflect the impact of the allocated holding Company expenses.
Enterprise Value before Corporate Expenses 1 11,220,000 $
Capitalized Corporate Expenses 2 (4,100,000)
Ente rprise Value 7,120,000 $
Less: Debt -
Plus: PV of Net Operating Loss Carry Forward 3,000,000
Plus: Excess Cash 2,010,000
Equity Value from Operations (as if public) 12,090,000 $
Shares Outstanding 2,344,457
Marke table Minority Inte re st Pe r Share Value $5.16
1 See page 6
2 Corporate expenses of $870,000 ($565,000 after-tax) capitalized at 16% as of 12/31/03
Enterprise Value before Corporate Expenses 1 9,870,000 $
Capitalized Corporate Expenses 2 (1,570,000)
Ente rprise Value 8,300,000 $
Less: Debt -
Plus: Premium Finance Value 1,800,000
Plus: Excess Cash 1,990,000
Equity Value from Operations (as if public) 12,090,000 $
Shares Outstanding 2,344,457
Marke table Minority Inte re st Pe r Share Value $5.16
1 See page 6
2 Corporate expenses of $350,000 ($227,000 after-tax) capitalized at 17% as of 12/31/03
Unifie d Trust Company & Fiduciary Counse l
Valuation Summary (Post Split Transaction) as o f De cembe r 31, 2003
Unifie d Fund Se rvice s, Inc.
Valuation Summary (Post Split Transaction) as o f De cembe r 31, 2003
- 15 -
DUFF&PHELPS,LLC
III. Restructuring Alternatives
A. Split of Company into Trust and Fund Services
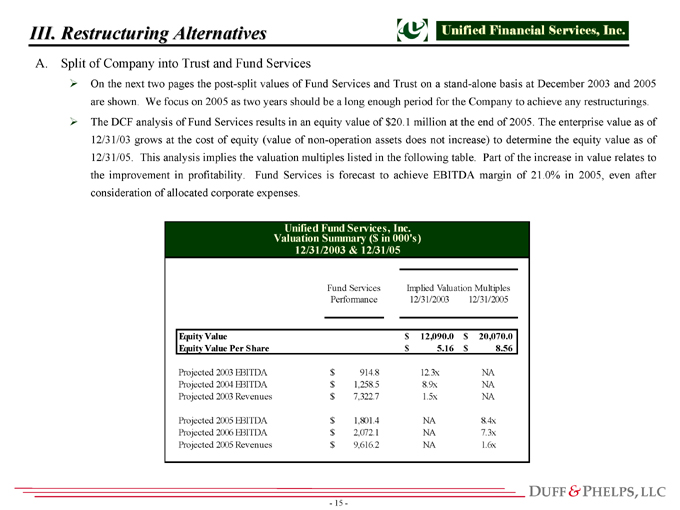
On the next two pages the post-split values of Fund Services and Trust on a stand-alone basis at December 2003 and 2005
are shown. We focus on 2005 as two years should be a long enough period for the Company to achieve any restructurings.
The DCF analysis of Fund Services results in an equity value of $20.1 million at the end of 2005. The enterprise value as of
12/31/03 grows at the cost of equity (value of non-operation assets does not increase) to determine the equity value as of
12/31/05. This analysis implies the valuation multiples listed in the following table. Part of the increase in value relates to
the improvement in profitability. Fund Services is forecast to achieve EBITDA margin of 21.0% in 2005, even after
consideration of allocated corporate expenses.
Fund Services Implied Valuation Multiples
Performance 12/31/2003 12/31/2005
Equity Value 12,090.0 $ 20,070.0 $
Equity Value Per Share 5.16 $ 8.56 $
Projected 2003 EBITDA 914.8 $ 12.3x NA
Projected 2004 EBITDA 1,258.5 $ 8.9x NA
Projected 2003 Revenues 7,322.7 $ 1.5x NA
Projected 2005 EBITDA 1,801.4 $ NA 8.4x
Projected 2006 EBITDA 2,072.1 $ NA 7.3x
Projected 2005 Revenues 9,616.2 $ NA 1.6x
Unified Fund Services, Inc.
Valuation Summary ($ in 000’s)
12/31/2003 & 12/31/05
- 16 -
DUFF&PHELPS,LLC
III. Restructuring Alternatives
A. Split of Company into Trust and Fund Services
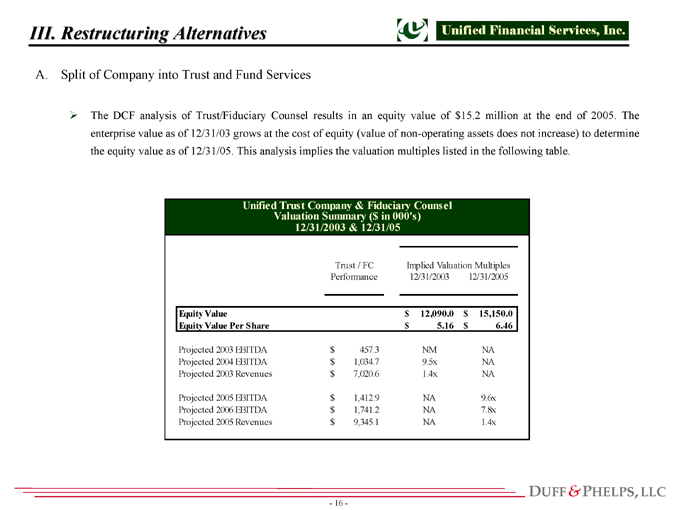
The DCF analysis of Trust/Fiduciary Counsel results in an equity value of $15.2 million at the end of 2005. The
enterprise value as of 12/31/03 grows at the cost of equity (value of non-operating assets does not increase) to determine
the equity value as of 12/31/05. This analysis implies the valuation multiples listed in the following table.
Trust / FC Implied Valuation Multiples
Performance 12/31/2003 12/31/2005
Equity Value 12,090.0 $ 15,150.0 $
Equity Value Per Share 5.16 $ 6.46 $
Projected 2003 EBITDA 457.3 $ NM NA
Projected 2004 EBITDA 1,034.7 $ 9.5x NA
Projected 2003 Revenues 7,020.6 $ 1.4x NA
Projected 2005 EBITDA 1,412.9 $ NA 9.6x
Projected 2006 EBITDA 1,741.2 $ NA 7.8x
Projected 2005 Revenues 9,345.1 $ NA 1.4x
Unified Trust Company & Fiduciary Counsel
Valuation Summary ($ in 000’s)
12/31/2003 & 12/31/05
- 17 -
DUFF&PHELPS,LLC
III. Restructuring Alternatives
A. Split of Company into Trust and Fund Services
Duff & Phelps valuation of Unified Financial as of December 31, 2002 was a sum of the parts analysis, therefore,
there should be no value creation by breaking up the Company into its pieces.
However, there are reasons to split up Unified Financial which could create value:
Easier to attract merger/strategic partners. On the following pages we present analysis of a merger partner for
Trust and Fiduciary Counsel. In particular, a merger for Fiduciary Counsel may be a solution for its difficult
situation
Increase employee motivation.
- 18 -
DUFF&PHELPS,LLC
III. Restructuring Alternatives
A. Split of Company into Trust and Fund Services
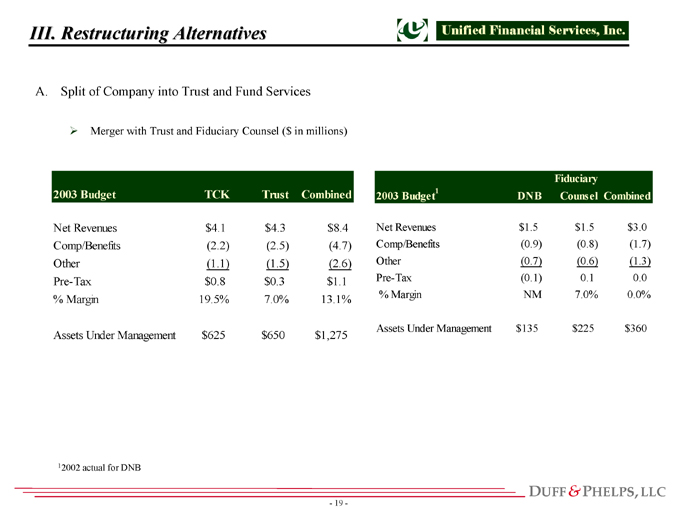
Merger with Trust and Fiduciary Counsel
Any merger of a trust or wealth management company would be done on same valuation basis as Trust and
Fiduciary Counsel. Therefore, we assume there would be no value creation from merger.
Value creation would be derived from:
(i) Revenue or cost synergies; and/or
(ii) Valuation multiple expansion due to increased scale of business.
On the following pages we show value creation from a potential merger of Trust with Trust Company of
Knoxville (“TCK”), which is one of three identified merger partners for Trust, and from a potential merger of
Fiduciary Counsel with DNB.
- 19 -
DUFF&PHELPS,LLC
III. Restructuring Alternatives
A. Split of Company into Trust and Fund Services
Merger with Trust and Fiduciary Counsel ($ in millions)
2003 Budget TCK Trust Combined
Net Revenues $4.1 $4.3 $8.4
Comp/Benefits (2.2) (2.5) (4.7)
Other (1.1) (1.5) (2.6)
Pre-Tax $0.8 $0.3 $1.1
% Margin 19.5% 7.0% 13.1%
Assets Under Management $625 $650 $1,275
Fiduciary
2003 Budget1 DNB Counsel Combined
Net Revenues $1.5 $1.5 $3.0
Comp/Benefits (0.9) (0.8) (1.7)
Other (0.7) (0.6) (1.3)
Pre-Tax (0.1) 0.1 0.0
% Margin NM 7.0% 0.0%
Assets Under Management $135 $225 $360
12002 actual for DNB
- 20 -
DUFF&PHELPS,LLC
III. Restructuring Alternatives
A. Split of Company into Trust and Fund Services
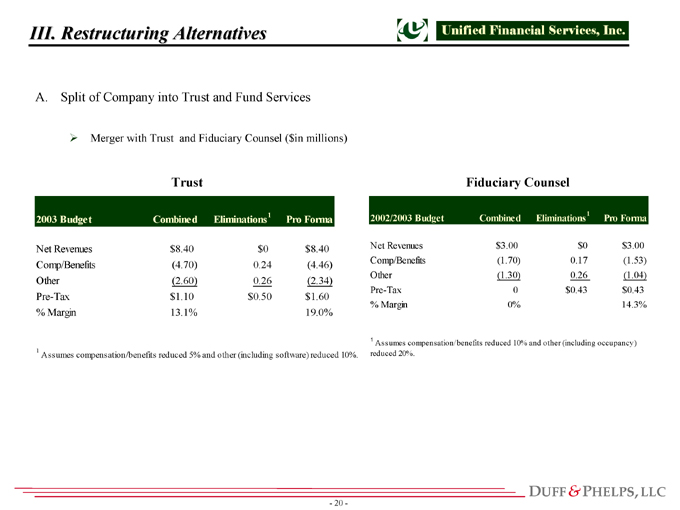
Merger with Trust and Fiduciary Counsel ($in millions)
2003 Budget Combined Eliminations1 Pro Forma
Net Revenues $8.40 $0 $8.40
Comp/Benefits (4.70) 0.24 (4.46)
Other (2.60) 0.26 (2.34)
Pre-Tax $1.10 $0.50 $1.60
% Margin 13.1% 19.0%
1
Assumes compensation/benefits reduced 5% and other (
including software) reduced 10%.
2002/2003 Budget Combined Eliminations1 Pro Forma
Net Revenues $3.00 $0 $3.00
Comp/Benefits (1.70) 0.17 (1.53)
Other (1.30) 0.26 (1.04)
Pre-Tax 0 $0.43 $0.43
% Margin 0% 14.3%
1 Assumes compensation/benefits reduced 10% and other (including occupancy)
reduced 20%.
Trust Fiduciary Counsel
- 21 -
DUFF&PHELPS,LLC
III. Restructuring Alternatives
A. Split of Company into Trust and Fund Services
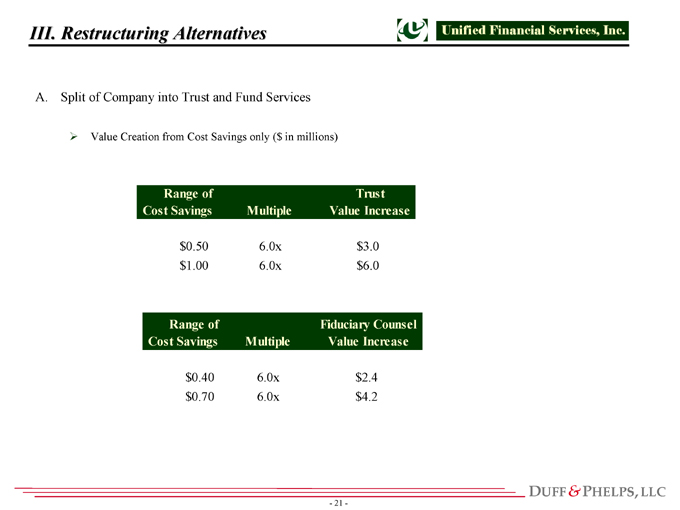
Value Creation from Cost Savings only ($ in millions)
Range of
Cost Savings Multiple
Trust
Value Increase
$0.50 6.0x $3.0
$1.00 6.0x $6.0
Range of
Cost Savings Multiple
Fiduciary Counsel
Value Increase
$0.40 6.0x $2.4
$0.70 6.0x $4.2
- 22 -
DUFF&PHELPS,LLC
III. Restructuring Alternatives
A. Split of Company into Trust and Fund Services
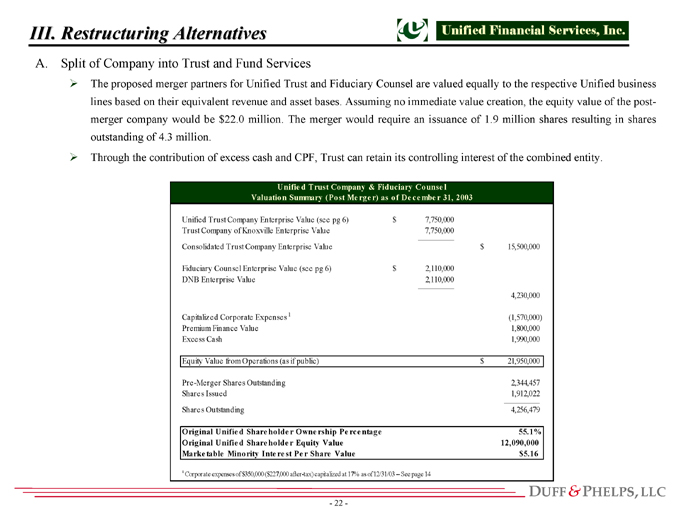
The proposed merger partners for Unified Trust and Fiduciary Counsel are valued equally to the respective Unified business
lines based on their equivalent revenue and asset bases. Assuming no immediate value creation, the equity value of the postmerger
company would be $22.0 million. The merger would require an issuance of 1.9 million shares resulting in shares
outstanding of 4.3 million.
Through the contribution of excess cash and CPF, Trust can retain its controlling interest of the combined entity.
Unified Trust Company Enterprise Value (see pg 6) 7,750,000 $
Trust Company of Knoxville Enterprise Value 7,750,000
Consolidated Trust Company Enterprise Value 15,500,000 $
Fiduciary Counsel Enterprise Value (see pg 6) 2,110,000 $
DNB Enterprise Value 2,110,000
4,230,000
Capitalized Corporate Expenses 1 (1,570,000)
Premium Finance Value 1,800,000
Excess Cash 1,990,000
Equity Value from Operations (as if public) 21,950,000 $
Pre-Merger Shares Outstanding 2,344,457
Shares Issued 1,912,022
Shares Outstanding 4,256,479
Original Unified Share holder Owne rship Pe rce ntage 55.1%
Original Unifie d Share holde r Equity Value 12,090,000
Marke table Minority Inte re st Pe r Share Value $5.16
1 Corporate expenses of $350,000 ($227,000 after-tax) capitalized at 17% as of 12/31/03 — See page 14
Unifie d Trust Company & Fiduciary Counse l
Valuation Summary (Post Me rge r) as o f De cembe r 31, 2003
- 23 -
DUFF&PHELPS,LLC
III. Restructuring Alternatives
A. Split of Company into Trust and Fund Services
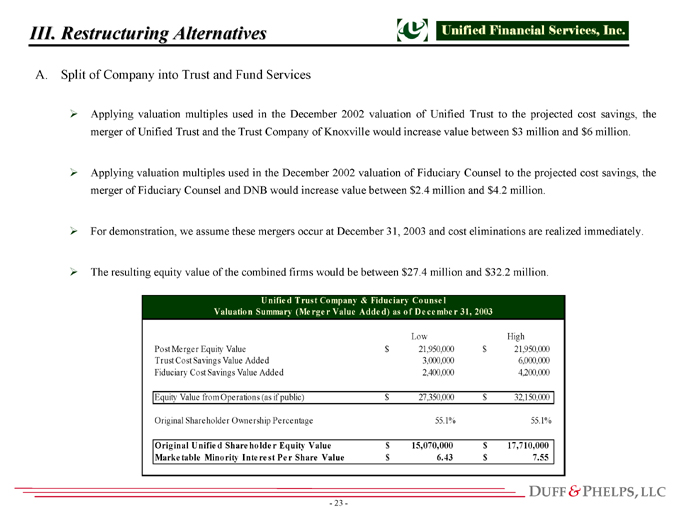
Applying valuation multiples used in the December 2002 valuation of Unified Trust to the projected cost savings, the
merger of Unified Trust and the Trust Company of Knoxville would increase value between $3 million and $6 million.
Applying valuation multiples used in the December 2002 valuation of Fiduciary Counsel to the projected cost savings, the
merger of Fiduciary Counsel and DNB would increase value between $2.4 million and $4.2 million.
For demonstration, we assume these mergers occur at December 31, 2003 and cost eliminations are realized immediately.
The resulting equity value of the combined firms would be between $27.4 million and $32.2 million.
Low High
Post Merger Equity Value 21,950,000 $ 21,950,000 $
Trust Cost Savings Value Added 3,000,000 6,000,000
Fiduciary Cost Savings Value Added 2,400,000 4,200,000
Equity Value from Operations (as if public) 27,350,000 $ 32,150,000 $
Original Shareholder Ownership Percentage 55.1% 55.1%
Original Unifie d Share holde r Equity Value 15,070,000 $ 17,710,000 $
Marke table Minority Inte re st Pe r Share Value 6.43 $ 7.55 $
Unifie d Trust Company & Fiduciary Counse l
Valuation Summary (Me rge r Value Adde d) as of De cembe r 31, 2003
- 24 -
DUFF&PHELPS,LLC
III. Restructuring Alternatives
A. Split of Company into Trust and Fund Services
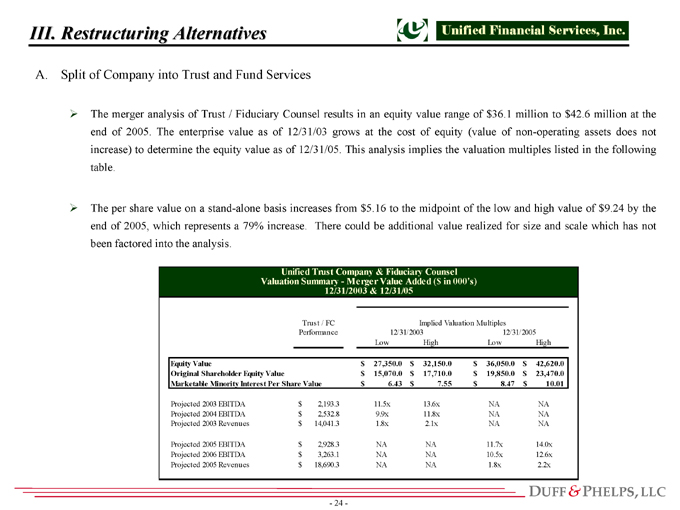
The merger analysis of Trust / Fiduciary Counsel results in an equity value range of $36.1 million to $42.6 million at the
end of 2005. The enterprise value as of 12/31/03 grows at the cost of equity (value of non-operating assets does not
increase) to determine the equity value as of 12/31/05. This analysis implies the valuation multiples listed in the following
table.
The per share value on a stand-alone basis increases from $5.16 to the midpoint of the low and high value of $9.24 by the
end of 2005, which represents a 79% increase. There could be additional value realized for size and scale which has not
been factored into the analysis.
Trust / FC Implied Valuation Multiples
Performance 12/31/2003 12/31/2005
Low High Low High
Equity Value 27,350.0 $ 32,150.0 $ 36,050.0 $ 42,620.0 $
Original Shareholder Equity Value 15,070.0 $ 17,710.0 $ 19,850.0 $ 23,470.0 $
Marketable Minority Interest Per Share Value 6.43 $ 7.55 $ 8.47 $ 10.01 $
Projected 2003 EBITDA 2,193.3 $ 11.5x 13.6x NA NA
Projected 2004 EBITDA 2,532.8 $ 9.9x 11.8x NA NA
Projected 2003 Revenues 14,041.3 $ 1.8x 2.1x NA NA
Projected 2005 EBITDA 2,928.3 $ NA NA 11.7x 14.0x
Projected 2006 EBITDA 3,263.1 $ NA NA 10.5x 12.6x
Projected 2005 Revenues 18,690.3 $ NA NA 1.8x 2.2x
Unified Trust Company & Fiduciary Counsel
Valuation Summary—Merger Value Added ($ in 000’s)
12/31/2003 & 12/31/05
- 25 -
DUFF&PHELPS,LLC
III. Restructuring Alternatives
A. Split of Company into Trust and Fund Services
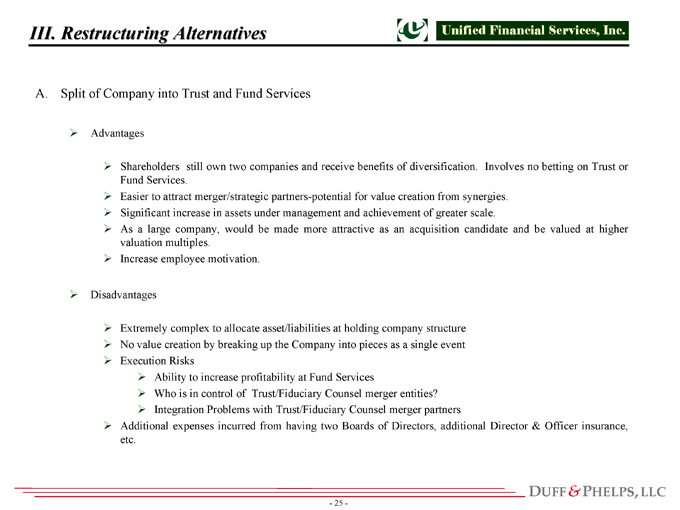
Advantages
Shareholders still own two companies and receive benefits of diversification. Involves no betting on Trust or
Fund Services.
Easier to attract merger/strategic partners-potential for value creation from synergies.
Significant increase in assets under management and achievement of greater scale.
As a large company, would be made more attractive as an acquisition candidate and be valued at higher
valuation multiples.
Increase employee motivation.
Disadvantages
Extremely complex to allocate asset/liabilities at holding company structure
No value creation by breaking up the Company into pieces as a single event
Execution Risks
Ability to increase profitability at Fund Services
Who is in control of Trust/Fiduciary Counsel merger entities?
Integration Problems with Trust/Fiduciary Counsel merger partners
Additional expenses incurred from having two Boards of Directors, additional Director & Officer insurance,
etc.
- 26 -
DUFF&PHELPS,LLC
III. Restructuring Alternatives
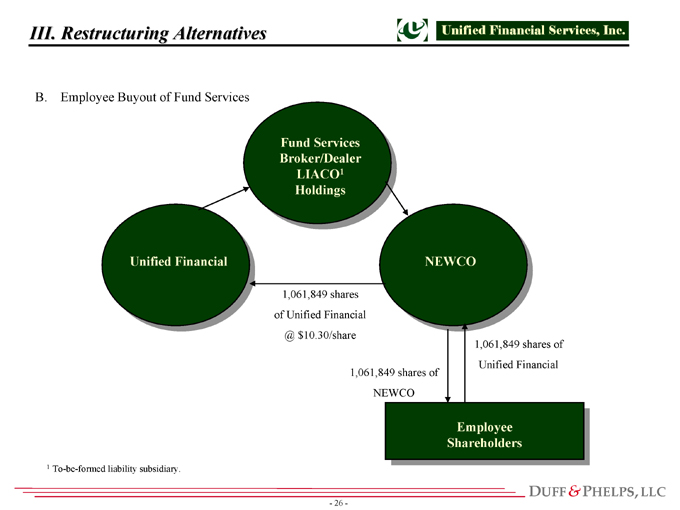
B. Employee Buyout of Fund Services
Fund Services
Broker/Dealer
LIACO1
Holdings
Unified Financial NEWCO
Employee
Shareholders
1,061,849 shares
of Unified Financial
@ $10.30/share
1,061,849 shares of
Unified Financial
1,061,849 shares of
NEWCO
1 To-be-formed liability subsidiary.
- 27 -

DUFF&PHELPS,LLC
III. Restructuring Alternatives
B. Employee Buyout of Fund Services
Steps
Employee shareholders (28) contribute 1,061,849 shares of Unified Financial to NEWCO.
NEWCO exchanges 1,061,849 shares of Unified Financial for 100% of the stock of Fund Services, Securities, to
be formed liabilities subsidiary to house some of contingent liabilities now at Holdings called LIACO and
Holdings itself.
Unified Financial purchases these shares into treasury.
Stock consideration to NEWO currently estimated at approximately $11.0 million (at $10.30) in exchange for
purchase of Fund Services currently estimated at $7.12 million.
Valuation of LIACO as well as NOLs and allocation of excess capital at Holdings necessary to equalize purchase
price and value of stock consideration.
On the following page we only use NOLs and excess capital at Holdings to equalize valuations. Dependent upon
the value of NOLs and capital requirements of Fund Services, the allocation of cash may be greater.
- 28 -
DUFF&PHELPS,LLC
III. Restructuring Alternatives
B. Employee Buyout of Fund Services
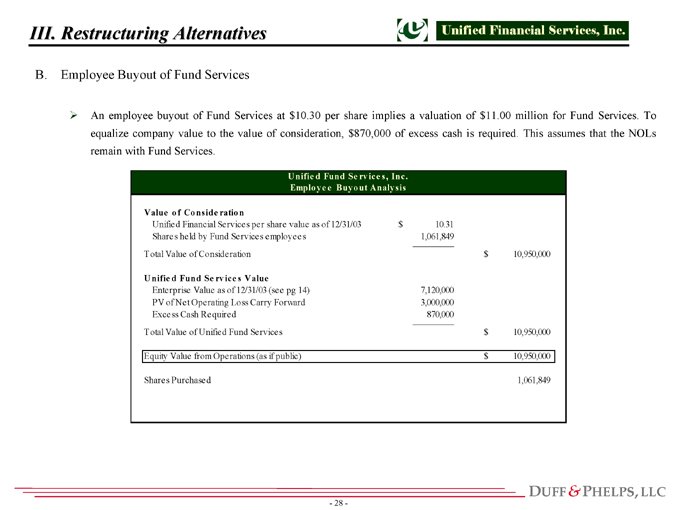
An employee buyout of Fund Services at $10.30 per share implies a valuation of $11.00 million for Fund Services. To
equalize company value to the value of consideration, $870,000 of excess cash is required. This assumes that the NOLs
remain with Fund Services.
Value o f Conside ration
Unified Financial Services per share value as of 12/31/03 10.31 $
Shares held by Fund Services employees 1,061,849
Total Value of Consideration 10,950,000 $
Unifie d Fund Se rvice s Value
Enterprise Value as of 12/31/03 (see pg 14) 7,120,000
PV of Net Operating Loss Carry Forward 3,000,000
Excess Cash Required 870,000—
Total Value of Unified Fund Services 10,950,000 $
Equity Value from Operations (as if public) 10,950,000 $
Shares Purchased 1,061,849
Unifie d Fund Se rvice s, Inc.
Employe e Buyout Analysis
- 29 -
DUFF&PHELPS,LLC
III. Restructuring Alternatives
B. Employee Buyout of Fund Services
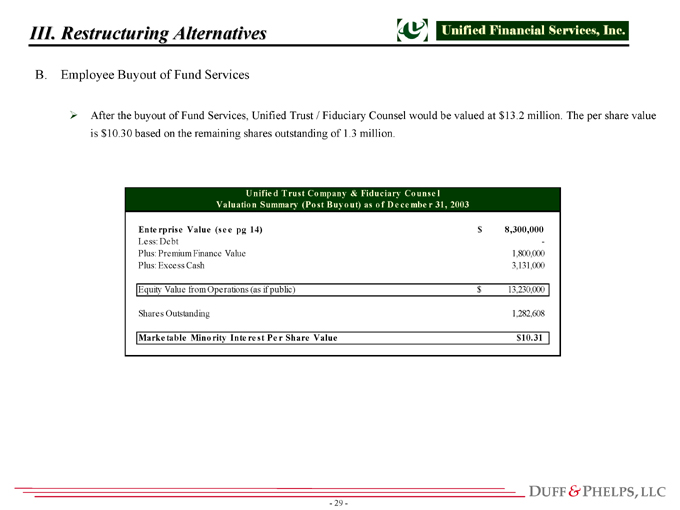
After the buyout of Fund Services, Unified Trust / Fiduciary Counsel would be valued at $13.2 million. The per share value
is $10.30 based on the remaining shares outstanding of 1.3 million.
Ente rprise Value (se e pg 14) 8,300,000 $
Less: Debt -
Plus: Premium Finance Value 1,800,000
Plus: Excess Cash 3,131,000
Equity Value from Operations (as if public) 13,230,000 $
Shares Outstanding 1,282,608
Marke table Minority Inte re st Pe r Share Value $10.31
Unifie d Trust Company & Fiduciary Counse l
Valuation Summary (Post Buyout) as of De cembe r 31, 2003
- 30 -
DUFF&PHELPS,LLC
III. Restructuring Alternatives
B. Employee Buyout of Fund Services
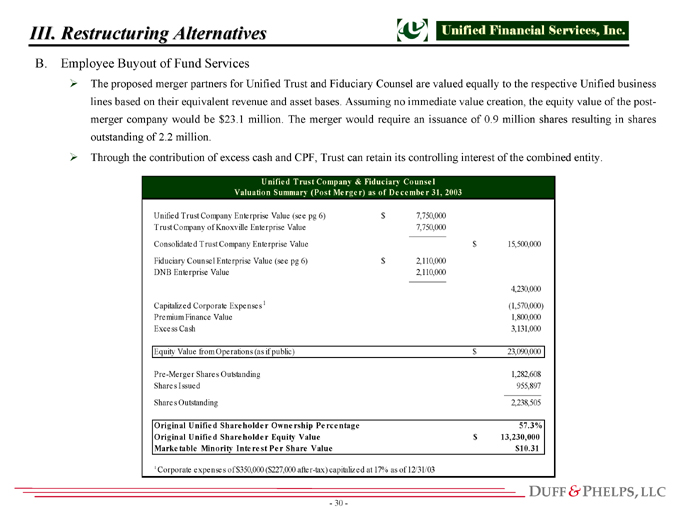
The proposed merger partners for Unified Trust and Fiduciary Counsel are valued equally to the respective Unified business
lines based on their equivalent revenue and asset bases. Assuming no immediate value creation, the equity value of the postmerger
company would be $23.1 million. The merger would require an issuance of 0.9 million shares resulting in shares
outstanding of 2.2 million.
Through the contribution of excess cash and CPF, Trust can retain its controlling interest of the combined entity.
Unified Trust Company Enterprise Value (see pg 6) 7,750,000 $
Trust Company of Knoxville Enterprise Value 7,750,000
Consolidated Trust Company Enterprise Value 15,500,000 $
Fiduciary Counsel Enterprise Value (see pg 6) 2,110,000 $
DNB Enterprise Value 2,110,000
4,230,000
Capitalized Corporate Expenses 1 (1,570,000)
Premium Finance Value 1,800,000
Excess Cash 3,131,000
Equity Value from Operations (as if public) 23,090,000 $
Pre-Merger Shares Outstanding 1,282,608
Shares Issued 955,897
Shares Outstanding 2,238,505
Original Unifie d Share holde r Owne rship Pe rce ntage 57.3%
Original Unifie d Share holde r Equity Value 13,230,000 $
Marke table Minority Inte re st Pe r Share Value $10.31
1 Corporate expenses of $350,000 ($227,000 after-tax) capitalized at 17% as of 12/31/03
Unifie d Trust Company & Fiduciary Counse l
Valuation Summary (Post Me rge r) as of De cembe r 31, 2003
- 31 -
DUFF&PHELPS,LLC
III. Restructuring Alternatives
B. Employee Buyout of Fund Services
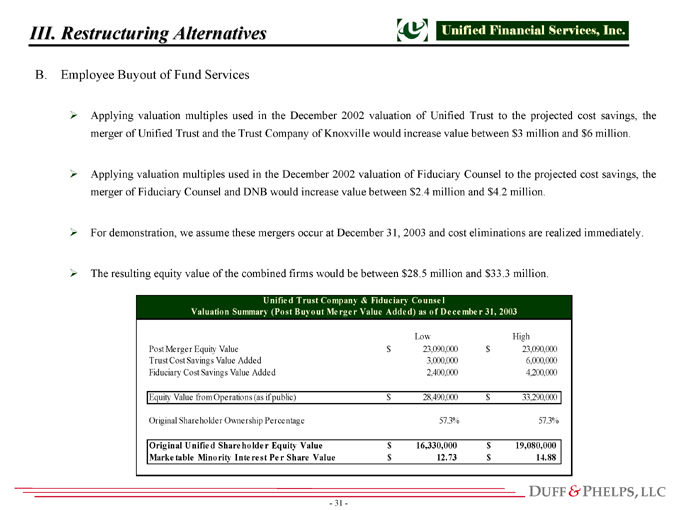
Applying valuation multiples used in the December 2002 valuation of Unified Trust to the projected cost savings, the
merger of Unified Trust and the Trust Company of Knoxville would increase value between $3 million and $6 million.
Applying valuation multiples used in the December 2002 valuation of Fiduciary Counsel to the projected cost savings, the
merger of Fiduciary Counsel and DNB would increase value between $2.4 million and $4.2 million.
For demonstration, we assume these mergers occur at December 31, 2003 and cost eliminations are realized immediately.
The resulting equity value of the combined firms would be between $28.5 million and $33.3 million.
Low High
Post Merger Equity Value 23,090,000 $ 23,090,000 $
Trust Cost Savings Value Added 3,000,000 6,000,000
Fiduciary Cost Savings Value Added 2,400,000 4,200,000
Equity Value from Operations (as if public) 28,490,000 $ 33,290,000 $
Original Shareholder Ownership Percentage 57.3% 57.3%
Original Unifie d Share holde r Equity Value 16,330,000 $ 19,080,000 $
Marke table Minority Inte re st Pe r Share Value 12.73 $ 14.88 $
Unifie d Trust Company & Fiduciary Counse l
Valuation Summary (Post Buyout Me rge r Value Adde d) as of De cembe r 31, 2003
- 32 -
DUFF&PHELPS,LLC
III. Restructuring Alternatives
B. Employee Buyout of Fund Services
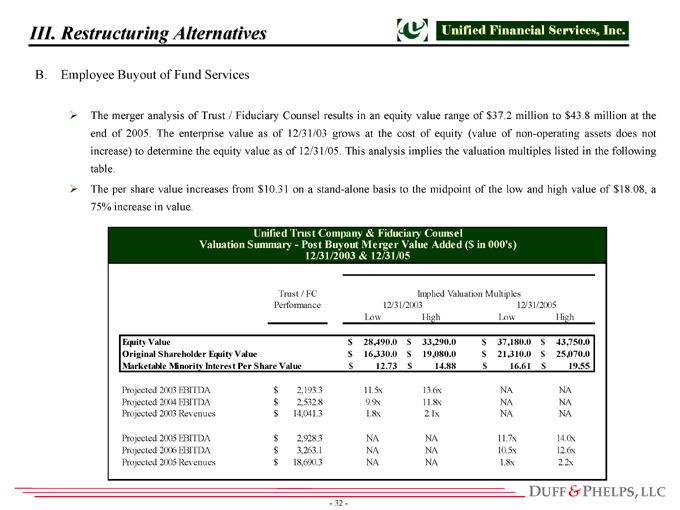
The merger analysis of Trust / Fiduciary Counsel results in an equity value range of $37.2 million to $43.8 million at the
end of 2005. The enterprise value as of 12/31/03 grows at the cost of equity (value of non-operating assets does not
increase) to determine the equity value as of 12/31/05. This analysis implies the valuation multiples listed in the following
table.
The per share value increases from $10.31 on a stand-alone basis to the midpoint of the low and high value of $18.08, a
75% increase in value.
Trust / FC Implied Valuation Multiples
Performance 12/31/2003 12/31/2005
Low High Low High
Equity Value 28,490.0 $ 33,290.0 $ 37,180.0 $ 43,750.0 $
Original Shareholder Equity Value 16,330.0 $ 19,080.0 $ 21,310.0 $ 25,070.0 $
Marketable Minority Interest Per Share Value 12.73 $ 14.88 $ 16.61 $ 19.55 $
Projected 2003 EBITDA 2,193.3 $ 11.5x 13.6x NA NA
Projected 2004 EBITDA 2,532.8 $ 9.9x 11.8x NA NA
Projected 2003 Revenues 14,041.3 $ 1.8x 2.1x NA NA
Projected 2005 EBITDA 2,928.3 $ NA NA 11.7x 14.0x
Projected 2006 EBITDA 3,263.1 $ NA NA 10.5x 12.6x
Projected 2005 Revenues 18,690.3 $ NA NA 1.8x 2.2x
Unified Trust Company & Fiduciary Counsel
Valuation Summary—Post Buyout Merger Value Added ($ in 000’s)
12/31/2003 & 12/31/05
- 33 -
DUFF&PHELPS,LLC
III. Restructuring Alternatives
B. Employee Buyout of Fund Services
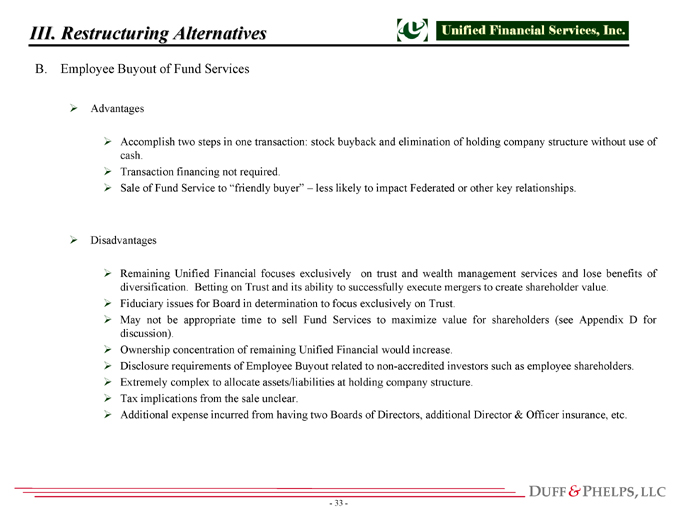
Advantages
Accomplish two steps in one transaction: stock buyback and elimination of holding company structure without use of
cash.
Transaction financing not required.
Sale of Fund Service to “friendly buyer” – less likely to impact Federated or other key relationships.
Disadvantages
Remaining Unified Financial focuses exclusively on trust and wealth management services and lose benefits of
diversification. Betting on Trust and its ability to successfully execute mergers to create shareholder value.
Fiduciary issues for Board in determination to focus exclusively on Trust.
May not be appropriate time to sell Fund Services to maximize value for shareholders (see Appendix D for
discussion).
Ownership concentration of remaining Unified Financial would increase.
Disclosure requirements of Employee Buyout related to non-accredited investors such as employee shareholders.
Extremely complex to allocate assets/liabilities at holding company structure.
Tax implications from the sale unclear.
Additional expense incurred from having two Boards of Directors, additional Director & Officer insurance, etc.
- 34 -
DUFF&PHELPS,LLC
III. Restructuring Alternatives
C. Remain in Current Corporate Structure
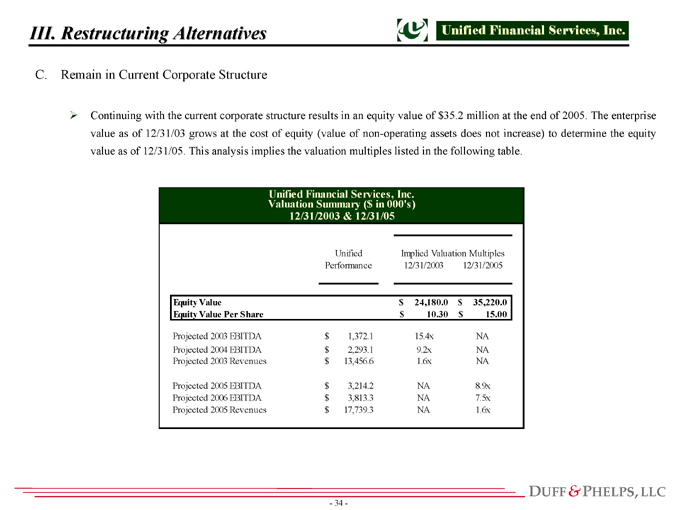
Continuing with the current corporate structure results in an equity value of $35.2 million at the end of 2005. The enterprise
value as of 12/31/03 grows at the cost of equity (value of non-operating assets does not increase) to determine the equity
value as of 12/31/05. This analysis implies the valuation multiples listed in the following table.
Unified Implied Valuation Multiples
Performance 12/31/2003 12/31/2005
Equity Value 24,180.0 $ 35,220.0 $
Equity Value Per Share 10.30 $ 15.00 $
Projected 2003 EBITDA 1,372.1 $ 15.4x NA
Projected 2004 EBITDA 2,293.1 $ 9.2x NA
Projected 2003 Revenues 13,456.6 $ 1.6x NA
Projected 2005 EBITDA 3,214.2 $ NA 8.9x
Projected 2006 EBITDA 3,813.3 $ NA 7.5x
Projected 2005 Revenues 17,739.3 $ NA 1.6x
Unified Financial Services, Inc.
Valuation Summary ($ in 000’s)
12/31/2003 & 12/31/05
- 35 -

DUFF&PHELPS,LLC
III. Restructuring Alternatives
C. Remain in Current Corporate Structure
Advantages of a holding company structure include:
Trust and Fund Services are not highly correlated so there are benefits to shareholders from diversification.
Trust revenue and profits are driven directly by the stock market, whereas Fund Services is only partially tied
to the stock market as its revenues are generated by assets under management, number of mutual fund accounts
and various other services.
Holdings provides a source of capital to fund internal operations or acquisitions for either Trust of Fund
Services.
Synergies or benefits derived by businesses by being under common ownership. For example, selling
synergies or operational synergies like computer, accounting, etc.
Holdings has historically been the owner for the enterprise of such liabilities as lawsuits, indemnifications, etc.
Structure is already in place and “if it is not broken, why fix it?”. No restructuring expenses incurred.
- 36 -
DUFF&PHELPS,LLC
III. Restructuring Alternatives
C. Remain in Current Corporate Structure
Disadvantages of holding company structure include:
From a shareholder perspective, benefits of diversification can be achieved owning two separate stocks of
Trust and Fund Services.
Questionable synergies between two businesses-no purpose for a holding company structure.
Potentially there are excess corporate expenses reducing company profits and returns. Allocation of these
expenses to each business is appropriate to understand “true” profitability and value proposition.
Employee stockholders do not have a direct ownership stake in respective entity, thus potentially reducing
incentive to maximize value for respective business.
More difficult to complete stock mergers as target company may not want to own stock in a diversified
company in which it has little influence over stock price performance.
- 37 -
DUFF&PHELPS,LLC
III. Restructuring Alternatives
D. Summary Comparison
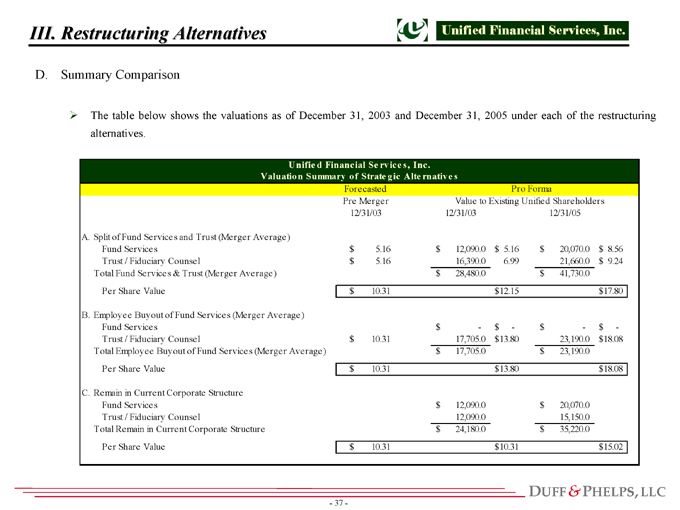
The table below shows the valuations as of December 31, 2003 and December 31, 2005 under each of the restructuring
alternatives.
Forecasted
Pre Merger Value to Existing Unified Shareholders
12/31/03 12/31/03 12/31/05
A. Split of Fund Services and Trust (Merger Average)
Fund Services 5.16 $ 12,090.0 $ 5.16 $ 20,070.0 $ 8.56 $
Trust / Fiduciary Counsel 5.16 $ 16,390.0 6.99 21,660.0 9.24 $
Total Fund Services & Trust (Merger Average) 28,480.0 $ 41,730.0 $
Per Share Value 10.31 $ 12.15 $ 17.80 $
B. Employee Buyout of Fund Services (Merger Average)
Fund Services—$—$—$—$
Trust / Fiduciary Counsel 10.31 $ 17,705.0 13.80 $ 23,190.0 18.08 $
Total Employee Buyout of Fund Services (Merger Average) 17,705.0 $ 23,190.0 $
Per Share Value 10.31 $ 13.80 $ 18.08 $
C. Remain in Current Corporate Structure
Fund Services 12,090.0 $ 20,070.0 $
Trust / Fiduciary Counsel 12,090.0 15,150.0
Total Remain in Current Corporate Structure 24,180.0 $ 35,220.0 $
Per Share Value 10.31 $ 10.31 $ 15.02 $
Unifie d Financial Se rvice s, Inc.
Valuation Summary o f Strate gic Alte rnative s
Pro Forma
- 38 -
DUFF&PHELPS,LLC
III. Restructuring Alternatives
D. Summary Comparison
The per share value conclusions of 2005 for Alternative A, split up the Company into Trust and Fund Services, and
Alternative B, the employee buyout of Fund Services, assuming the remaining Trust completes mergers, are close.
Therefore, we conclude that neither of these alternatives is superior from a financial point of view to maximize value
to shareholders.
The Employee Buyout with subsequent mergers of Trust and Fiduciary Counsel demonstrates a slightly higher per
share value at the end of 2005, as all cost savings and value creation from merger partners for Trust and Fiduciary
Counsel are assumed to occur immediately beginning on December 31, 2003. The ultimate driver of value creation
under either scenario depends upon successful execution of increasing profitability at Trust and Fund Services and of
merger strategies.
Our recommendation then considers other non-financial issues to determine which restructuring alternative
maximizes value to shareholders. See Recommendations in Section V.
- 39 -
DUFF&PHELPS,LLC
IV. Share Buyback
A. Split of Company into Trust and Fund Services
Review of Stock Buyback
How to efficiently deploy the excess capital of $9 million.
Option #1-Reinvest in business segments
Option #2-Return the capital to shareholders
Option #1
Neither Trust or Fund Services needs significant capital to fund their businesses. Excess capital could
be used to fund add-on acquisitions. However, the Company has not identified any small add-on
acquisitions to pursue and the benefits of scale take longer to achieve through this model (versus a
strategic merger of equals).
Fund Services likely needs more capital than Trust as a stand-alone entity. As of March 31, 2003 it had
negative shareholder’s equity.
Conclusion: Option #1 not a material use of Company capital
- 40 -
DUFF&PHELPS,LLC
IV. Share Buyback
A. Split of Company into Trust and Fund Services
Option #2
Returning the capital to shareholders can be accomplished through either (i) a tender offer/stock buy-back, or (ii)
the payment of a special dividend. The size of the buyback or dividend will be dependent upon the ultimate cash
necessary to equalize the stock exchange ratios for Trust and Fund Services. Valuation of Trust and Fund
Services, the capital needs of these businesses, and the division of the expenses, assets and liabilities at Holdings
will drive the exchange ratios.
(i) Review of tender offer/stock buy-back:
Advantages
Could total approximately $5,000,000 or approximately 500,000 shares (based upon pro forma price
of $10.30 estimated for December 31, 2003);
Provides liquidity to those shareholders desiring to sell shares;
Reduces the numbers of shareholders; and
Eliminates SEC filing expenses and certifications under Sarbanes Oxley (and accountant’s time).
Disadvantages
No apparent one
- 41 -
DUFF&PHELPS,LLC
IV. Share Buyback
A. Split of Company into Trust and Fund Services
(ii) Review of Payment of Special Dividend
Advantages
Declare a special dividend;
Implies a yield to shareholders of approximately 15% and some current return is better than no return at
all; and
Possibly viewed by shareholders as a positive signal; i.e., Company is confident enough of future
prospects to return capital to shareholders.
Disadvantages
Tax-inefficient as subject to ordinary income tax (versus capital losses under a stock buyback); and
Not large enough to provide meaningful return to shareholders.
- 42 -
DUFF&PHELPS,LLC
IV. Share Buyback
A. Split of Company into Trust and Fund Services
Conclusions
A stock buyback/tender offer is a reasonable use of the Company’s capital.
We believe Unified Financial should offer a price reflective of its marketable, minority value. Any premium over
this price would be value dilutive to the remaining shareholders. Conversely, the selling shareholders will be
receiving an implicit premium since the price does not reflect a discount for lack of marketability. For a stock
which has been illiquid, we would typically attach a discount of 35% to its marketable, minority price.
However, if preliminary feedback from shareholders is not overwhelming in favor of a tender offer, a premium
may be necessary. As shown in Appendix C, a premium of 10%-20% is not unreasonable. This range of a
premium equals a per share value of $11.30 to $12.36, or aggregate premium value of approximately $450,000 to
$800,000 (assuming a $5 million buyback).
The Company needs to consult its legal advisors on how best to structure a buyout to achieve the desired results.
- 43 -
DUFF&PHELPS,LLC
V. Recommendations
1. Complete a Share Buyback
Company has no significant better use for its capital
Eliminate SEC filing requirements
Provide liquidity to some shareholders
2. Allocate all Corporate Expenses
Buyout some existing employee contracts
Understand true profitability and value of each business
Operate each business on a stand-alone basis
Any capital provided through an inter-company loan
3. Split up Company with Trust and Fund Services
Not betting on either Trust or Fund Services
Upside potential
Fund Services-increased profitability and scale
Trust Services-potential success with merger partners and scale
Benefits of Diversification
- 44 -
DUFF&PHELPS,LLC
V. Recommendations
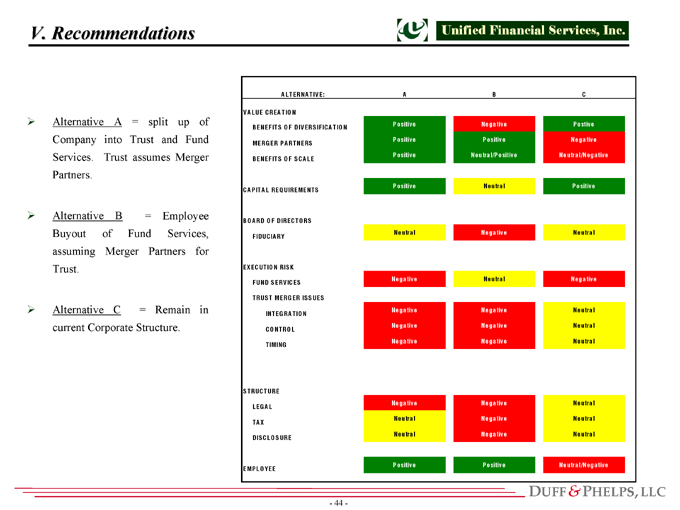
A B C
VALUE CREATION
BENEFITS OF DIVERSIFICATION Positive Negative Postive
MERGER PARTNERS Positive Positive Negative
BENEFITS O F SCALE
Positive Neutral/P ositive Neutral/Negative
CAPITAL REQUIREMENTS Positive Neutral Positive
BOARD O F DIRECTORS
FIDUCIARY Neutral Negative Neutral
EXECUTION RISK
FUND SERVICES Negative Neutral Negative
TRUST MERGER ISSUES
INTEGRATION Negative Negative Neutral
CONTROL Negative Negative Neutral
T IMING Negative Negative Neutral
STRUCTURE \
LEGAL Negative Negative Neutral
TAX
Neutral Negative Neutral
DISCLOSURE Neutral Negative Neutral
EMPLOYEE
Positive Positive Neutral/Negative
ALTERNATIVE:
Alternative A = split up of
Company into Trust and Fund
Services. Trust assumes Merger
Partners.
Alternative B = Employee
Buyout of Fund Services,
assuming Merger Partners for
Trust.
Alternative C = Remain in
current Corporate Structure.
- 45 -
Fund Services and Brokerage
Discounted Cash Flow Analysis
Fiscal Years Ending December 31, 2003—2012
| Projected | |||||||||||||||||||||||||||||||||||||||
VALUATION ASSUMPTIONS | 2000 | 2001 | 2002 | 2003 | 2004 | 2005 | 2006 | 2007 | 2008 | 2009 | 2010 | 2011 | 2012 | ||||||||||||||||||||||||||
OPERATING ASSUMPTIONS | |||||||||||||||||||||||||||||||||||||||
Revenue Growth: | |||||||||||||||||||||||||||||||||||||||
Mutual Fund Administration | 76.8 | % | 13.5 | % | 12.1 | % | 7.0 | % | 15.0 | % | 15.0 | % | 15.0 | % | 10.0 | % | 10.0 | % | 5.0 | % | 5.0 | % | 5.0 | % | 5.0 | % | |||||||||||||
Brokerage | -30.4 | % | -23.5 | % | -20.0 | % | -58.5 | % | 12.5 | % | 10.0 | % | 10.0 | % | 5.0 | % | 5.0 | % | 5.0 | % | 5.0 | % | 5.0 | % | 5.0 | % | |||||||||||||
Total Revenue Growth | 9.7 | % | -1.2 | % | 2.3 | % | -8.8 | % | 14.7 | % | 14.5 | % | 14.5 | % | 9.5 | % | 9.5 | % | 5.0 | % | 5.0 | % | 5.0 | % | 5.0 | % | |||||||||||||
Cost of Sales as % of revs: | |||||||||||||||||||||||||||||||||||||||
Mutual Fund Administration | 15.6 | % | 12.8 | % | 12.6 | % | 12.0 | % | 11.5 | % | 11.5 | % | 11.5 | % | 11.5 | % | 11.5 | % | 11.5 | % | 11.5 | % | 11.5 | % | 11.5 | % | |||||||||||||
Brokerage | 61.8 | % | 67.7 | % | 65.7 | % | 50.0 | % | 50.0 | % | 50.0 | % | 50.0 | % | 50.0 | % | 50.0 | % | 50.0 | % | 50.0 | % | 50.0 | % | 50.0 | % | |||||||||||||
Total Operating Expenses as % of total revs | 34.0 | % | 29.6 | % | 25.4 | % | 16.2 | % | 15.6 | % | 15.5 | % | 15.3 | % | 15.2 | % | 15.0 | % | 15.0 | % | 15.0 | % | 15.0 | % | 15.0 | % | |||||||||||||
Operating Expenses as % of revs: | |||||||||||||||||||||||||||||||||||||||
Mutual Fund Administration | 74.1 | % | 77.1 | % | 86.5 | % | 72.5 | % | 71.0 | % | 67.5 | % | 67.5 | % | 67.5 | % | 67.5 | % | 67.5 | % | 67.5 | % | 67.5 | % | 67.5 | % | |||||||||||||
Brokerage | 46.9 | % | 37.3 | % | 31.5 | % | 62.0 | % | 56.0 | % | 51.0 | % | 51.0 | % | 51.0 | % | 51.0 | % | 51.0 | % | 51.0 | % | 51.0 | % | 51.0 | % | |||||||||||||
Total Cost of Sales as % of total revenues | 34.0 | % | 29.6 | % | 25.4 | % | 16.2 | % | 15.6 | % | 15.5 | % | 15.3 | % | 15.2 | % | 15.0 | % | 15.0 | % | 15.0 | % | 15.0 | % | 15.0 | % | |||||||||||||
WORKING CAPITAL INVESTMENT |
| ||||||||||||||||||||||||||||||||||||||
Accounts receivables — DSO | 80.7 | 67.1 | 48.0 | 55.9 | 56.0 | 56.1 | 56.3 | 56.4 | 56.6 | 56.6 | 56.6 | 56.6 | 56.6 | ||||||||||||||||||||||||||
Prepaid accounts as % of revenue | 1.2 | % | 2.6 | % | 4.4 | % | 2.3 | % | 2.3 | % | 2.3 | % | 2.3 | % | 2.3 | % | 2.3 | % | 2.3 | % | 2.3 | % | 2.3 | % | 2.3 | % | |||||||||||||
Deposits/accts pay. & accr. exp. as % of revs | 16.8 | % | 16.8 | % | 15.1 | % | 17.7 | % | 17.7 | % | 17.6 | % | 17.5 | % | 17.4 | % | 17.3 | % | 17.3 | % | 17.3 | % | 17.3 | % | 17.3 | % | |||||||||||||
Other current liabilities / operating expenses | 7.7 | % | 11.0 | % | 13.5 | % | 7.6 | % | 7.8 | % | 8.3 | % | 8.3 | % | 8.3 | % | 8.3 | % | 8.3 | % | 8.3 | % | 8.3 | % | 8.3 | % | |||||||||||||
Net working capital as a % of revs | 1.6 | % | -2.9 | % | -7.4 | % | -5.5 | % | -5.5 | % | -5.3 | % | -5.2 | % | -5.1 | % | -5.0 | % | -5.0 | % | -5.0 | % | -5.0 | % | -5.0 | % | |||||||||||||
FIXED CAPITAL INVESTMENT |
| ||||||||||||||||||||||||||||||||||||||
Capital expenditures | 93,343 | 32,841 | 200,873 | 154,004 | 117,007 | 134,332 | 154,234 | 169,385 | 186,038 | 195,340 | 205,107 | 215,362 | 226,130 | ||||||||||||||||||||||||||
— % of revenues | 1.2 | % | 0.4 | % | 2.5 | % | 2.1 | % | 1.4 | % | 1.4 | % | 1.4 | % | 1.4 | % | 1.4 | % | 1.4 | % | 1.4 | % | 1.4 | % | 1.4 | % | |||||||||||||
Depreciation & amortization | 117,036 | 126,611 | 140,898 | 209,000 | 173,537 | 153,925 | 147,083 | 149,428 | 156,160 | 166,264 | 175,982 | 185,607 | 195,336 | ||||||||||||||||||||||||||
— Depr. / Prior yr. NFA | 24.1 | % | 26.9 | % | 37.5 | % | 38.2 | % | 35.3 | % | 35.4 | % | 35.4 | % | 35.4 | % | 35.3 | % | 35.2 | % | 35.1 | % | 35.0 | % | 34.9 | % | |||||||||||||
IMPLIED RATIOS |
| ||||||||||||||||||||||||||||||||||||||
NOPAT / Invested Capital (ROIC) | 10.2 | % | 128.0 | % | 41.3 | % | 485.2 | % | -2847.6 | % | -1018.9 | % | -762.3 | % | -740.9 | % | -754.8 | % | -775.4 | % | -790.8 | % | -803.1 | % | -813.4 | % | |||||||||||||
Incr NOPAT / Incr Invested Capital | 109.7 | % | -27.9 | % | 105.5 | % | 322.3 | % | -206.6 | % | -455.2 | % | -305.6 | % | -586.1 | % | -920.4 | % | -1756.7 | % | -1323.7 | % | -1165.3 | % | -1098.2 | % | |||||||||||||
Sales / Average Fixed Assets | 16.6x | 18.6x | 17.4x | 14.1x | 18.1x | 22.6x | 26.3x | 27.9x | 28.9x | 28.5x | 28.2x | 28.0x | 27.1x | ||||||||||||||||||||||||||
Sales / Average Working Capital | 80.2x | -150.7x | NM | NM | -19.5x | -19.8x | -20.2x | -20.2x | -20.7x | -20.5x | -20.5x | -20.5x | -20.0x | ||||||||||||||||||||||||||
Return On Equity (ROE) | NA | 25.0 | % | 9.2 | % | -474.7 | % | -326.6 | % | -361.4 | % | -352.1 | % | -366.2 | % | -388.3 | % | -403.0 | % | -416.6 | % | -429.7 | % | -442.5 | % | ||||||||||||||
A-1
Fund Services and Brokerage
Discounted Cash Flow Analysis
Fiscal Years Ending December 31, 2003—2012
| Projected | |||||||||||||||||||||||||||||||||||||||
INCOME STATEMENT | 2000 | 2001 | 2002 | 2003 | 2004 | 2005 | 2006 | 2007 | 2008 | 2009 | 2010 | 2011 | 2012 | ||||||||||||||||||||||||||
Revenues: | |||||||||||||||||||||||||||||||||||||||
Mutual Fund Administration | 4,790,365 | 5,435,884 | 6,095,184 | 6,521,847 | 7,500,124 | 8,625,142 | 9,918,914 | 10,910,805 | 12,001,886 | 12,601,980 | 13,232,079 | 13,893,683 | 14,588,367 | ||||||||||||||||||||||||||
Brokerage | 3,153,618 | 2,412,174 | 1,929,754 | 800,848 | 900,954 | 991,049 | 1,090,154 | 1,144,662 | 1,201,895 | 1,261,990 | 1,325,089 | 1,391,344 | 1,460,911 | ||||||||||||||||||||||||||
Total Revenues | 7,943,983 | 7,848,058 | 8,024,938 | 7,322,695 | 8,401,078 | 9,616,192 | 11,009,068 | 12,055,467 | 13,203,781 | 13,863,970 | 14,557,168 | 15,285,027 | 16,049,278 | ||||||||||||||||||||||||||
Cost of Sales | |||||||||||||||||||||||||||||||||||||||
Mutual Fund Administration | 748,716 | 693,682 | 768,778 | 782,622 | 862,514 | 991,891 | 1,140,675 | 1,254,743 | 1,380,217 | 1,449,228 | 1,521,689 | 1,597,774 | 1,677,662 | ||||||||||||||||||||||||||
Brokerage | 1,950,336 | 1,632,249 | 1,268,311 | 400,424 | 450,477 | 495,525 | 545,077 | 572,331 | 600,948 | 630,995 | 662,545 | 695,672 | 730,455 | ||||||||||||||||||||||||||
Total Cost of Sales | 2,699,052 | 2,325,931 | 2,037,089 | 1,183,046 | 1,312,991 | 1,487,416 | 1,685,752 | 1,827,074 | 1,981,164 | 2,080,223 | 2,184,234 | 2,293,445 | 2,408,118 | ||||||||||||||||||||||||||
Gross Profit | 5,244,930 | 5,522,127 | 5,987,849 | 6,139,649 | 7,088,087 | 8,128,776 | 9,323,316 | 10,228,394 | 11,222,616 | 11,783,747 | 12,372,935 | 12,991,581 | 13,641,160 | ||||||||||||||||||||||||||
Gross Margin | 66.0 | % | 70.4 | % | 74.6 | % | 83.8 | % | 84.4 | % | 84.5 | % | 84.7 | % | 84.8 | % | 85.0 | % | 85.0 | % | 85.0 | % | 85.0 | % | 85.0 | % | |||||||||||||
Operating Expenses: | |||||||||||||||||||||||||||||||||||||||
Mutual Fund Administration | 3,547,418 | 4,188,793 | 5,274,394 | 4,728,339 | 5,325,088 | 5,821,971 | 6,695,267 | 7,364,794 | 8,101,273 | 8,506,337 | 8,931,653 | 9,378,236 | 9,847,148 | ||||||||||||||||||||||||||
Brokerage | 1,480,431 | 898,851 | 607,326 | 496,526 | 504,534 | 505,435 | 555,979 | 583,778 | 612,966 | 643,615 | 675,796 | 709,585 | 745,065 | ||||||||||||||||||||||||||
Total Operating Expenses1 | 5,027,849 | 5,087,644 | 5,881,720 | 5,224,865 | 5,829,622 | 6,327,406 | 7,251,246 | 7,948,571 | 8,714,239 | 9,149,951 | 9,607,449 | 10,087,821 | 10,592,212 | ||||||||||||||||||||||||||
EBITDA | 217,082 | 434,483 | 106,129 | 914,785 | 1,258,464 | 1,801,369 | 2,072,070 | 2,279,822 | 2,508,377 | 2,633,796 | 2,765,486 | 2,903,760 | 3,048,948 | ||||||||||||||||||||||||||
EBITDA Margin | 2.7 | % | 5.5 | % | 1.3 | % | 12.5 | % | 15.0 | % | 18.7 | % | 18.8 | % | 18.9 | % | 19.0 | % | 19.0 | % | 19.0 | % | 19.0 | % | 19.0 | % | |||||||||||||
Less: Depreciation & amortization | 117,036 | 126,611 | 140,898 | 209,000 | 173,537 | 153,925 | 147,083 | 149,428 | 156,160 | 166,264 | 175,982 | 185,607 | 195,336 | ||||||||||||||||||||||||||
EBIT | 100,046 | 307,872 | (34,769 | ) | 705,785 | 1,084,928 | 1,647,445 | 1,924,987 | 2,130,394 | 2,352,217 | 2,467,532 | 2,589,504 | 2,718,153 | 2,853,612 | |||||||||||||||||||||||||
EBIT Margin | 1.3 | % | 3.9 | % | -0.4 | % | 9.6 | % | 12.9 | % | 17.1 | % | 17.5 | % | 17.7 | % | 17.8 | % | 17.8 | % | 17.8 | % | 17.8 | % | 17.8 | % | |||||||||||||
Pro Forma Taxes | 39,518 | 121,610 | (13,734 | ) | 278,785 | 428,546 | 650,741 | 760,370 | 841,506 | 929,126 | 974,675 | 1,022,854 | 1,073,671 | 1,127,177 | |||||||||||||||||||||||||
Net Operating Profit After Taxes | 60,528 | 186,263 | (21,035 | ) | 427,000 | 656,381 | 996,704 | 1,164,617 | 1,288,889 | 1,423,091 | 1,492,857 | 1,566,650 | 1,644,483 | 1,726,435 | |||||||||||||||||||||||||
| 1 | Operating expenses exclude Intercompany Fees. |
A-2
Fund Services and Brokerage
Discounted Cash Flow Analysis
Fiscal Years Ending December 31, 2003—2012
| Projected | ||||||||||||||||||||||||||||||||||||||
BALANCE SHEET | 2000 | 2001 | 2002 | 2003 | 2004 | 2005 | 2006 | 2007 | 2008 | 2009 | 2010 | 2011 | 2012 | |||||||||||||||||||||||||
Accounts receivable | 1,757,154 | 1,443,178 | 1,055,129 | 1,121,452 | 1,288,435 | 1,478,924 | 1,697,708 | 1,864,118 | 2,047,002 | 2,149,352 | 2,256,820 | 2,369,661 | 2,488,144 | |||||||||||||||||||||||||
Prepaid and sundry accounts | 95,488 | 200,380 | 351,673 | 170,479 | 195,050 | 222,055 | 252,886 | 275,449 | 300,132 | 315,139 | 330,896 | 347,441 | 364,813 | |||||||||||||||||||||||||
Total Current Assets | 1,852,642 | 1,643,558 | 1,406,802 | 1,291,931 | 1,483,486 | 1,700,979 | 1,950,594 | 2,139,568 | 2,347,135 | 2,464,491 | 2,587,716 | 2,717,102 | 2,852,957 | |||||||||||||||||||||||||
Deposits/accounts payable & accured exp. | 1,337,286 | 1,315,762 | 1,211,139 | 1,298,616 | 1,485,400 | 1,690,191 | 1,923,899 | 2,094,486 | 2,281,041 | 2,395,093 | 2,514,848 | 2,640,590 | 2,772,619 | |||||||||||||||||||||||||
Other current liabilities | 389,382 | 557,896 | 793,179 | 396,845 | 456,131 | 524,010 | 602,017 | 661,565 | 727,035 | 763,386 | 801,556 | 841,634 | 883,715 | |||||||||||||||||||||||||
Total Current Liabilities | 1,726,668 | 1,873,658 | 2,004,318 | 1,695,461 | 1,941,531 | 2,214,202 | 2,525,916 | 2,756,051 | 3,008,076 | 3,158,479 | 3,316,403 | 3,482,224 | 3,656,335 | |||||||||||||||||||||||||
Net Working Capital | 125,974 | (230,100 | ) | (597,516 | ) | (403,530 | ) | (458,046 | ) | (513,222 | ) | (575,322 | ) | (616,483 | ) | (660,941 | ) | (693,988 | ) | (728,687 | ) | (765,122 | ) | (803,378 | ) | |||||||||||||
Net Fixed Assets | 470,070 | 375,618 | 546,522 | 491,526 | 434,996 | 415,404 | 422,555 | 442,512 | 472,390 | 501,466 | 530,590 | 560,346 | 591,139 | |||||||||||||||||||||||||
Invested Capital | 596,044 | 145,518 | (50,994 | ) | 87,996 | (23,050 | ) | (97,819 | ) | (152,767 | ) | (173,971 | ) | (188,551 | ) | (192,522 | ) | (198,097 | ) | (204,776 | ) | (212,238 | ) | |||||||||||||||
Shareholders' Equity (NOPAT-FCF) | NA | 745,427 | (228,945 | ) | (89,955 | ) | (201,001 | ) | (275,770 | ) | (330,718 | ) | (351,922 | ) | (366,502 | ) | (370,473 | ) | (376,048 | ) | (382,727 | ) | (390,189 | ) | ||||||||||||||
| 1 | Excludes Intercompany receivables and payables, and working capital investment at Brokerage and Premium Finance. |
A-3
Fund Services and Brokerage
Discounted Cash Flow Analysis
Fiscal Years Ending December 31, 2003—2012
DISCOUNTED CASH FLOW ANALYSIS | 2003 | 2004 | 2005 | 2006 | 2007 | 2008 | 2009 | 2010 | 2011 | 2012 | |||||||||||||||||||||||
Net Operating Profit After Taxes | 427,000 | 656,381 | 996,704 | 1,164,617 | 1,288,889 | 1,423,091 | 1,492,857 | 1,566,650 | 1,644,483 | 1,726,435 | |||||||||||||||||||||||
Plus: Depreciation & Amortization | 209,000 | 173,537 | 153,925 | 147,083 | 149,428 | 156,160 | 166,264 | 175,982 | 185,607 | 195,336 | |||||||||||||||||||||||
Total Sources | 636,000 | 829,918 | 1,150,629 | 1,311,700 | 1,438,317 | 1,579,251 | 1,659,121 | 1,742,632 | 1,830,089 | 1,921,771 | |||||||||||||||||||||||
Working Capital Investment | 193,986 | (54,516 | ) | (55,177 | ) | (62,100 | ) | (41,161 | ) | (44,458 | ) | (33,047 | ) | (34,699 | ) | (36,434 | ) | (38,256 | ) | ||||||||||||||
Capital Expenditures | 154,004 | 117,007 | 134,332 | 154,234 | 169,385 | 186,038 | 195,340 | 205,107 | 215,362 | 226,130 | |||||||||||||||||||||||
Free Cash Flow | 288,009 | 767,427 | 1,071,473 | 1,219,566 | 1,310,092 | 1,437,672 | 1,496,828 | 1,572,225 | 1,651,162 | 1,733,897 | |||||||||||||||||||||||
Discount Rate Range | 17.00% | 16.00% | 15.00% | ||||||||||||||||||||||||||||||
Continuing Value | 15,177,435 | 16,557,776 | 18,214,327 | ||||||||||||||||||||||||||||||
Present Value of Continuing Value | 3,415,330 | 4,042,510 | 4,828,182 | ||||||||||||||||||||||||||||||
Present Value of FYE 2003—2012 Cash Flows | 5,401,507 | 5,631,652 | 5,876,704 | ||||||||||||||||||||||||||||||
Capitalized Corporate Expenses | $ | 565,500 | (3,326,471 | ) | (3,534,375 | ) | (3,770,000 | ) | |||||||||||||||||||||||||
Enterprise Value as of 12/31/02 | 5,490,367 | 6,139,787 | 6,934,886 | ||||||||||||||||||||||||||||||
Enterprise Value as of 12/31/03 | 6,423,729 | 7,122,153 | 7,975,119 | ||||||||||||||||||||||||||||||
EV (less corporate exp) 12/31/03 | 10,315,700 | 11,222,028 | 12,310,619 | ||||||||||||||||||||||||||||||
Enterprise Value as of 12/31/02 (rounded) | 5,490,000 | 6,140,000 | 6,930,000 | ||||||||||||||||||||||||||||||
Enterprise Value as of 12/31/03 (rounded) 1 | 6,420,000 | 7,120,000 | 7,980,000 | ||||||||||||||||||||||||||||||
Implied Valuation Multiples | Results | ||||||||||||||||||||||||||||||||
Enterprise Value / Projected 2003 EBITDA | $ | 914,785 | 11.3x | 12.3x | 13.5x | ||||||||||||||||||||||||||||
Enterprise Value / Projected 2004 EBITDA | $ | 1,258,464 | 8.2x | 8.9x | 9.8x | ||||||||||||||||||||||||||||
Enterprise Value / Projected 2003 EBIT | $ | 705,785 | 14.6x | 15.9x | 17.4x | ||||||||||||||||||||||||||||
Enterprise Value / Projected 2004 EBIT | $ | 1,084,928 | 9.5x | 10.3x | 11.3x | ||||||||||||||||||||||||||||
Enterprise Value / Projected 2003 Revenues | $ | 7,322,695 | 1.4x | 1.5x | 1.7x | ||||||||||||||||||||||||||||
| 1 | Value as of 12/31/02 grown at the cost of capital |
A-4
Trust & Fiduciary Counsel
Discounted Cash Flow Analysis
Fiscal Years Ending December 31, 2003—2012
| Actual | Projected | ||||||||||||||||||||||||||||||||||||||
VALUATION ASSUMPTIONS | 2000 | 2001 | 2002 | 2003 | 2004 | 2005 | 2006 | 2007 | 2008 | 2009 | 2010 | 2011 | 2012 | ||||||||||||||||||||||||||
OPERATING ASSUMPTIONS | |||||||||||||||||||||||||||||||||||||||
Revenue Growth: | |||||||||||||||||||||||||||||||||||||||
Trust and Retirement | 2.5 | % | 10.2 | % | 1.5 | % | 12.4 | % | 17.4 | % | 17.4 | % | 12.2 | % | 12.2 | % | 12.2 | % | 12.2 | % | 12.2 | % | 12.2 | % | 12.2 | % | |||||||||||||
Investment Advisory | 9.3 | % | 0.2 | % | -20.3 | % | -6.4 | % | 7.4 | % | 7.4 | % | 7.4 | % | 7.4 | % | 7.4 | % | 7.4 | % | 7.4 | % | 7.4 | % | 7.4 | % | |||||||||||||
Total Revenue Growth | 4.5 | % | 7.2 | % | -4.8 | % | 7.9 | % | 15.3 | % | 15.4 | % | 11.4 | % | 11.4 | % | 11.4 | % | 11.4 | % | 11.5 | % | 11.5 | % | 11.5 | % | |||||||||||||
Cost of Sales as% of revs: | |||||||||||||||||||||||||||||||||||||||
Trust and Retirement | 8.9 | % | 15.8 | % | 18.4 | % | 16.0 | % | 16.0 | % | 16.0 | % | 16.0 | % | 16.0 | % | 16.0 | % | 16.0 | % | 16.0 | % | 16.0 | % | 16.0 | % | |||||||||||||
Investment Advisory | 12.4 | % | 9.7 | % | 18.2 | % | 18.1 | % | 14.5 | % | 14.5 | % | 14.5 | % | 14.5 | % | 14.5 | % | 14.5 | % | 14.5 | % | 14.5 | % | 14.5 | % | |||||||||||||
Total Operating Expenses as% of total revs | 10.0 | % | 14.0 | % | 18.4 | % | 16.4 | % | 15.7 | % | 15.7 | % | 15.7 | % | 15.7 | % | 15.7 | % | 15.7 | % | 15.7 | % | 15.7 | % | 15.8 | % | |||||||||||||
Operating Expenses as % of revs: | |||||||||||||||||||||||||||||||||||||||
Trust and Retirement | 83.7 | % | 89.9 | % | 84.9 | % | 77.5 | % | 73.0 | % | 70.0 | % | 68.0 | % | 68.0 | % | 68.0 | % | 68.0 | % | 68.0 | % | 68.0 | % | 68.0 | % | |||||||||||||
Investment Advisory | 72.9 | % | 74.2 | % | 75.0 | % | 75.5 | % | 65.5 | % | 65.5 | % | 65.5 | % | 65.5 | % | 65.5 | % | 65.5 | % | 65.5 | % | 65.5 | % | 65.5 | % | |||||||||||||
Total Cost of Sales as % of total revenues | 10.0 | % | 14.0 | % | 18.4 | % | 16.4 | % | 15.7 | % | 15.7 | % | 15.7 | % | 15.7 | % | 15.7 | % | 15.7 | % | 15.7 | % | 15.7 | % | 15.8 | % | |||||||||||||
WORKING CAPITAL INVESTMENT | |||||||||||||||||||||||||||||||||||||||
Accounts receivables — DSO | 76.3 | 59.9 | 68.6 | 64.6 | 65.5 | 66.4 | 66.8 | 67.2 | 67.6 | 68.0 | 68.3 | 68.7 | 69.0 | ||||||||||||||||||||||||||
Prepaid accounts as % of revenue | 0.5 | % | 1.9 | % | 3.2 | % | 1.8 | % | 1.8 | % | 1.8 | % | 1.8 | % | 1.8 | % | 1.7 | % | 1.7 | % | 1.7 | % | 1.7 | % | 1.7 | % | |||||||||||||
Deposits/accts pay. & accr. exp. as % of revs | 11.2 | % | 9.7 | % | 12.5 | % | 10.1 | % | 9.9 | % | 9.8 | % | 9.7 | % | 9.6 | % | 9.5 | % | 9.4 | % | 9.4 | % | 9.3 | % | 9.2 | % | |||||||||||||
Other current liabilities / operating expenses | 0.4 | % | 0.8 | % | 0.3 | % | 1.5 | % | 1.6 | % | 1.7 | % | 1.7 | % | 1.7 | % | 1.8 | % | 1.8 | % | 1.8 | % | 1.8 | % | 1.8 | % | |||||||||||||
Net working capital as a % of revs | 9.9 | % | 7.9 | % | 9.3 | % | 8.2 | % | 8.6 | % | 9.0 | % | 9.2 | % | 9.4 | % | 9.6 | % | 9.7 | % | 9.9 | % | 10.0 | % | 10.2 | % | |||||||||||||
FIXED CAPITAL INVESTMENT | |||||||||||||||||||||||||||||||||||||||
Capital expenditures | 271,810 | 151,073 | 48,818 | 89,216 | 104,147 | 121,631 | 136,186 | 152,498 | 170,781 | 191,273 | 214,243 | 239,992 | 268,858 | ||||||||||||||||||||||||||
— % of revenues | 4.3 | % | 2.2 | % | 0.8 | % | 1.3 | % | 1.3 | % | 1.3 | % | 1.3 | % | 1.3 | % | 1.3 | % | 1.3 | % | 1.3 | % | 1.3 | % | 1.3 | % | |||||||||||||
Depreciation & amortization | 202,444 | 155,482 | 169,030 | 143,200 | 116,538 | 114,373 | 116,004 | 120,130 | 126,603 | 135,348 | 146,353 | 159,659 | 175,360 | ||||||||||||||||||||||||||
— Depr. / Prior yr. NFA | 69.5 | % | 35.3 | % | 22.0 | % | 22.1 | % | 19.6 | % | 19.7 | % | 19.7 | % | 19.7 | % | 19.8 | % | 19.8 | % | 19.7 | % | 19.7 | % | 19.7 | % | |||||||||||||
IMPLIED RATIOS | |||||||||||||||||||||||||||||||||||||||
NOPAT / Invested Capital (ROIC) | 23.4 | % | -5.5 | % | -11.0 | % | 16.2 | % | 43.4 | % | 54.9 | % | 62.8 | % | 63.6 | % | 63.9 | % | 64.0 | % | 63.7 | % | 63.4 | % | 62.9 | % | |||||||||||||
Incr NOPAT / Incr Invested Capital | -39.3 | % | -139.2 | % | 121.0 | % | -410.2 | % | 331.6 | % | 152.4 | % | 146.5 | % | 71.4 | % | 67.2 | % | 64.1 | % | 61.9 | % | 60.3 | % | 59.0 | % | |||||||||||||
Sales / Average Fixed Assets | 17.4x | 11.3x | 9.2x | 11.3x | 13.8x | 16.0x | 17.4x | 18.6x | 19.5x | 20.2x | 20.7x | 21.1x | 20.3x | ||||||||||||||||||||||||||
Sales / Average Working Capital | 17.2x | 11.7x | 11.4x | 11.9x | 12.7x | 12.1x | 11.6x | 11.3x | 11.1x | 10.9x | 10.8x | 10.6x | 9.8x | ||||||||||||||||||||||||||
Return On Equity (ROE) | NA | -1.9 | % | -4.1 | % | 5.8 | % | 16.5 | % | 22.3 | % | 26.9 | % | 28.8 | % | 30.6 | % | 32.4 | % | 34.1 | % | 35.7 | % | 37.2 | % | ||||||||||||||
A-5
Trust & Fiduciary Counsel
Discounted Cash Flow Analysis
Fiscal Years Ending December 31, 2003—2012
| Actual | Projected | ||||||||||||||||||||||||||||||||||||||
INCOME STATEMENT | 2000 | 2001 | 2002 | 2003 | 2004 | 2005 | 2006 | 2007 | 2008 | 2009 | 2010 | 2011 | 2012 | ||||||||||||||||||||||||||
Revenues: | |||||||||||||||||||||||||||||||||||||||
Trust and Retirement | 4,417,483 | 4,869,711 | 4,943,732 | 5,557,615 | 6,524,285 | 7,659,093 | 8,596,397 | 9,648,407 | 10,829,160 | 12,154,411 | 13,641,844 | 15,311,305 | 17,185,072 | ||||||||||||||||||||||||||
Investment Advisory | 1,956,879 | 1,961,321 | 1,562,608 | 1,463,023 | 1,570,584 | 1,686,054 | 1,810,013 | 1,943,085 | 2,085,940 | 2,239,299 | 2,403,932 | 2,580,669 | 2,770,400 | ||||||||||||||||||||||||||
Total Revenues | 6,374,362 | 6,831,032 | 6,506,340 | 7,020,638 | 8,094,869 | 9,345,147 | 10,406,410 | 11,591,492 | 12,915,100 | 14,393,710 | 16,045,775 | 17,891,974 | 19,955,472 | ||||||||||||||||||||||||||
Cost of Sales | |||||||||||||||||||||||||||||||||||||||
Trust and Retirement | 392,710 | 769,266 | 910,728 | 886,767 | 1,041,007 | 1,222,076 | 1,371,631 | 1,539,489 | 1,727,888 | 1,939,344 | 2,176,677 | 2,443,054 | 2,742,030 | ||||||||||||||||||||||||||
Investment Advisory | 243,107 | 189,344 | 284,268 | 264,807 | 227,735 | 244,478 | 262,452 | 281,747 | 302,461 | 324,698 | 348,570 | 374,197 | 401,708 | ||||||||||||||||||||||||||
Total Cost of Sales | 635,817 | 958,610 | 1,194,996 | 1,151,574 | 1,268,742 | 1,466,554 | 1,634,083 | 1,821,236 | 2,030,349 | 2,264,042 | 2,525,247 | 2,817,251 | 3,143,738 | ||||||||||||||||||||||||||
Gross Profit | 5,738,545 | 5,872,422 | 5,311,344 | 5,869,065 | 6,826,127 | 7,878,593 | 8,772,327 | 9,770,256 | 10,884,751 | 12,129,668 | 13,520,529 | 15,074,723 | 16,811,734 | ||||||||||||||||||||||||||
Gross Margin | 90.0 | % | 86.0 | % | 81.6 | % | 83.6 | % | 84.3 | % | 84.3 | % | 84.3 | % | 84.3 | % | 84.3 | % | 84.3 | % | 84.3 | % | 84.3 | % | 84.2 | % | |||||||||||||
Operating Expenses: | |||||||||||||||||||||||||||||||||||||||
Trust and Retirement | 3,696,008 | 4,379,960 | 4,196,729 | 4,307,152 | 4,762,728 | 5,361,365 | 5,845,550 | 6,560,917 | 7,363,829 | 8,264,999 | 9,276,454 | 10,411,687 | 11,685,849 | ||||||||||||||||||||||||||
Investment Advisory | 1,425,823 | 1,455,438 | 1,172,507 | 1,104,582 | 1,028,733 | 1,104,365 | 1,185,558 | 1,272,720 | 1,366,291 | 1,466,741 | 1,574,575 | 1,690,338 | 1,814,612 | ||||||||||||||||||||||||||
Total Operating Expenses1 | 5,121,831 | 5,835,398 | 5,369,236 | 5,411,734 | 5,791,461 | 6,465,730 | 7,031,108 | 7,833,637 | 8,730,120 | 9,731,740 | 10,851,029 | 12,102,026 | 13,500,461 | ||||||||||||||||||||||||||
EBITDA | 616,714 | 37,024 | -57,892 | 457,330 | 1,034,667 | 1,412,863 | 1,741,219 | 1,936,619 | 2,154,631 | 2,397,928 | 2,669,500 | 2,972,698 | 3,311,273 | ||||||||||||||||||||||||||
EBITDA Margin | 9.7 | % | 0.5 | % | -0.9 | % | 6.5 | % | 12.8 | % | 15.1 | % | 16.7 | % | 16.7 | % | 16.7 | % | 16.7 | % | 16.6 | % | 16.6 | % | 16.6 | % | |||||||||||||
Less: Depreciation & amortization | 202,444 | 155,482 | 169,030 | 143,200 | 116,538 | 114,373 | 116,004 | 120,130 | 126,603 | 135,348 | 146,353 | 159,659 | 175,360 | ||||||||||||||||||||||||||
EBIT | 414,270 | (118,458 | ) | (226,922 | ) | 314,130 | 918,129 | 1,298,490 | 1,625,215 | 1,816,489 | 2,028,028 | 2,262,580 | 2,523,147 | 2,813,038 | 3,135,913 | ||||||||||||||||||||||||
EBIT Margin | 6.5 | % | -1.7 | % | -3.5 | % | 4.5 | % | 11.3 | % | 13.9 | % | 15.6 | % | 15.7 | % | 15.7 | % | 15.7 | % | 15.7 | % | 15.7 | % | 15.7 | % | |||||||||||||
Pro Forma Taxes | 163,636 | (46,791 | ) | (89,634 | ) | 124,081 | 362,661 | 512,903 | 641,960 | 717,513 | 801,071 | 893,719 | 996,643 | 1,111,150 | 1,238,685 | ||||||||||||||||||||||||
Net Operating Profit After Taxes | 250,633 | (71,667 | ) | (137,288 | ) | 190,049 | 555,468 | 785,586 | 983,255 | 1,098,976 | 1,226,957 | 1,368,861 | 1,526,504 | 1,701,888 | 1,897,227 | ||||||||||||||||||||||||
| 1 | Operating expenses exclude Intercompany Fees. |
A-6
Trust & Fiduciary Counsel
Discounted Cash Flow Analysis
Fiscal Years Ending December 31, 2003—2012
| Actual | Projected | |||||||||||||||||||||||||
BALANCE SHEET | 2000 | 2001 | 2002 | 2003 | 2004 | 2005 | 2006 | 2007 | 2008 | 2009 | 2010 | 2011 | 2012 | |||||||||||||
Accounts receivable | 1,331,789 | 1,121,195 | 1,223,201 | 1,241,767 | 1,452,321 | 1,699,099 | 1,903,984 | 2,133,719 | 2,391,328 | 2,680,204 | 3,004,156 | 3,367,454 | 3,774,893 | |||||||||||||
Prepaid and sundry accounts | 34,199 | 128,203 | 210,713 | 127,255 | 144,982 | 165,468 | 183,246 | 203,019 | 225,016 | 249,495 | 276,746 | 307,090 | 340,888 | |||||||||||||
Total Current Assets | 1,365,989 | 1,249,397 | 1,433,914 | 1,369,022 | 1,597,303 | 1,864,567 | 2,087,230 | 2,336,738 | 2,616,343 | 2,929,699 | 3,280,901 | 3,674,544 | 4,115,781 | |||||||||||||
Deposits/accounts payable & accured exp. | 714,474 | 664,359 | 814,362 | 709,426 | 803,438 | 911,643 | 1,006,732 | 1,112,247 | 1,229,375 | 1,359,441 | 1,503,925 | 1,664,482 | 1,842,960 | |||||||||||||
Other current liabilities | 19,373 | 48,298 | 16,843 | 82,710 | 94,375 | 109,667 | 122,500 | 136,862 | 152,934 | 170,924 | 191,062 | 213,606 | 238,849 | |||||||||||||
Total Current Liabilities | 733,847 | 712,657 | 831,205 | 792,136 | 897,813 | 1,021,309 | 1,129,233 | 1,249,109 | 1,382,309 | 1,530,364 | 1,694,986 | 1,878,088 | 2,081,809 | |||||||||||||
Net Working Capital | 632,142 | 536,741 | 602,709 | 576,886 | 699,489 | 843,257 | 957,998 | 1,087,628 | 1,234,034 | 1,399,335 | 1,585,915 | 1,796,456 | 2,033,972 | |||||||||||||
Net Fixed Assets | 440,768 | 767,726 | 647,514 | 593,530 | 581,139 | 588,396 | 608,579 | 640,947 | 685,125 | 741,050 | 808,941 | 889,274 | 982,771 | |||||||||||||
Invested Capital | 1,072,911 | 1,304,466 | 1,250,223 | 1,170,416 | 1,280,628 | 1,431,654 | 1,566,576 | 1,728,575 | 1,919,159 | 2,140,386 | 2,394,857 | 2,685,730 | 3,016,744 | |||||||||||||
Shareholders' Equity (NOPAT-FCF) | NA | 3,725,805 | 3,337,188 | 3,257,381 | 3,367,593 | 3,518,619 | 3,653,541 | 3,815,540 | 4,006,124 | 4,227,351 | 4,481,822 | 4,772,695 | 5,103,709 | |||||||||||||
| 1 | Excludes Intercompany receivables and payables, and working capital investment at Brokerage and Premium Finance. |
A-7
Trust & Fiduciary Counsel
Discounted Cash Flow Analysis
Fiscal Years Ending December 31, 2003—2012
DISCOUNTED CASH FLOW ANALYSIS | 2003 | 2004 | 2005 | 2006 | 2007 | 2008 | 2009 | 2010 | 2011 | 2012 | ||||||||||||||||
Net Operating Profit After Taxes | 190,049 | 555,468 | 785,586 | 983,255 | 1,098,976 | 1,226,957 | 1,368,861 | 1,526,504 | 1,701,888 | 1,897,227 | ||||||||||||||||
Plus: Depreciation & Amortization | 143,200 | 116,538 | 114,373 | 116,004 | 120,130 | 126,603 | 135,348 | 146,353 | 159,659 | 175,360 | ||||||||||||||||
Total Sources | 333,249 | 672,006 | 899,959 | 1,099,259 | 1,219,106 | 1,353,560 | 1,504,209 | 1,672,857 | 1,861,547 | 2,072,588 | ||||||||||||||||
Working Capital Investment | (25,823 | ) | 122,604 | 143,768 | 114,740 | 129,631 | 146,406 | 165,301 | 186,580 | 210,541 | 237,516 | |||||||||||||||
Capital Expenditures | 89,216 | 104,147 | 121,631 | 136,186 | 152,498 | 170,781 | 191,273 | 214,243 | 239,992 | 268,858 | ||||||||||||||||
Free Cash Flow | 269,856 | 445,255 | 634,561 | 848,332 | 936,977 | 1,036,373 | 1,147,634 | 1,272,033 | 1,411,015 | 1,566,214 | ||||||||||||||||
Discount Rate Range | 18.00% | 17.00% | 16.00% | |||||||||||||||||||||||
Continuing Value | 17,800,530 | 19,918,499 | 22,617,172 | |||||||||||||||||||||||
Present Value of Continuing Value | 3,694,485 | 4,482,197 | 5,521,886 | |||||||||||||||||||||||
Present Value of FYE 2003—2012 Cash Flows | �� | 3,782,156 | 3,948,214 | 4,125,260 | ||||||||||||||||||||||
Capitalized Corporate Expenses | $ | 227,500 | (1,263,889 | ) | (1,338,235 | ) | (1,421,875 | ) | ||||||||||||||||||
Enterprise Value as of 12/31/02 | 6,212,752 | 7,092,175 | 8,225,270 | |||||||||||||||||||||||
Enterprise Value as of 12/31/03 | 7,331,048 | 8,297,845 | 9,541,313 | |||||||||||||||||||||||
EV(less corporate) 12/31/03 | 8,822,436 | 9,863,580 | 11,190,688 | |||||||||||||||||||||||
Enterprise Value as of 12/31/02 (rounded) | 6,210,000 | 7,090,000 | 8,230,000 | |||||||||||||||||||||||
Enterprise Value as of 12/31/03 (rounded) 1 | 7,330,000 | 8,300,000 | 9,540,000 | |||||||||||||||||||||||
Implied Valuation Multiples | Results | |||||||||||||||||||||||||
Enterprise Value / Projected 2003 EBITDA | $ | 457,330 | 19.3x | 21.6x | 24.5x | |||||||||||||||||||||
Enterprise Value / Projected 2004 EBITDA | $ | 1,034,667 | 8.5x | 9.5x | 10.8x | |||||||||||||||||||||
Enterprise Value / Projected 2003 EBIT | $ | 314,130 | 28.1x | 31.4x | 35.6x | |||||||||||||||||||||
Enterprise Value / Projected 2004 EBIT | $ | 918,129 | 9.6x | 10.7x | 12.2x | |||||||||||||||||||||
Enterprise Value / Projected 2003 Revenues | $ | 7,020,638 | 1.3x | 1.4x | 1.6x | |||||||||||||||||||||
| 1 | Value as of 12/31/02 grown at the cost of capital |
A-8
UNIFIED FINANCIAL SERVICES, INC.
UNIFIED FUND SERVICES, INC.
COMPARABLE COMPANY ANALYSIS
December 31, 2002
Company (Ticker) | Common Stock | Equity Value (in millions) | Enterprise Value (in millions) | Debt / Total Capital * | LTM Revenues (in millions) | Common Stock Price as a Multiple of | Enterprise Value as a Multiple of | |||||||||||||||||||||||||||||||||||||
LTM EPS | Projected EPS | Book Value Per Share | LTM EBITDA | Projected EBITDA | LTM EBIT | Projected EBIT | LTM Revenues | |||||||||||||||||||||||||||||||||||||
BISYS Group, Inc. (BSG) 1 | $ | 15.90 | $ | 1,889 | $ | 2,250 | 18.5 | % | $ | 897 | 16.2 | x | 15.1 | x | 2.8 | x | 8.9 | x | 8.2 | x | 10.7 | x | 9.8 | x | 2.5 | x | ||||||||||||||||||
DST Systems, Inc. (DST) 2 | 35.55 | 4,250 | 3,572 | 10.0 | 1,648 | 20.4 | 18.2 | 3.2 | 7.7 | 7.3 | 11.5 | 10.4 | 2.2 | |||||||||||||||||||||||||||||||
Federated Investors, Inc. (FII) 3 | 25.37 | 2,883 | 2,822 | 2.1 | 732 | 14.4 | 13.4 | 8.8 | 7.7 | 7.6 | 8.2 | 8.1 | 3.9 | |||||||||||||||||||||||||||||||
Fiserv, Inc. (FISV) 4 | 33.95 | 6,496 | 6,725 | 6.4 | 2,180 | 26.5 | 21.4 | 3.7 | 12.9 | 10.4 | 16.1 | 13.3 | 3.1 | |||||||||||||||||||||||||||||||
SEI Investments (SEIC) 5 | 27.18 | 2,882 | 2,701 | 1.5 | 636 | 21.9 | 19.4 | 9.9 | 12.1 | 10.7 | 13.2 | 11.6 | 4.2 | |||||||||||||||||||||||||||||||
Sungard Data Systems (SDS) 6 | 23.56 | 6,671 | 6,564 | 3.3 | 2,161 | 36.8 | 18.3 | 3.2 | 8.8 | 7.2 | 13.3 | 10.8 | 3.0 | |||||||||||||||||||||||||||||||
Highest | 6,671 | 6,725 | 18.5 | 2,180 | 36.8 | 21.4 | 9.9 | 12.9 | 10.7 | 16.1 | 13.3 | 4.2 | ||||||||||||||||||||||||||||||||
Lowest | 1,889 | 2,250 | 1.5 | 636 | 14.4 | 13.4 | 2.8 | 7.7 | 7.2 | 8.2 | 8.1 | 2.2 | ||||||||||||||||||||||||||||||||
Mean | 4,179 | 4,106 | 7.0 | 1,376 | 22.7 | 17.6 | 5.3 | 9.7 | 8.6 | 12.1 | 10.7 | 3.1 | ||||||||||||||||||||||||||||||||
Median | 3,567 | 3,197 | 4.9 | 1,272 | 21.1 | 18.2 | 3.4 | 8.8 | 7.9 | 12.3 | 10.6 | 3.1 | ||||||||||||||||||||||||||||||||
Company (Ticker) | Growth Rates | Margin Analysis | Return Analysis | |||||||||||||||||||||||||||||||||||||||||
LTM Revenues | 3-yr. CAGR Revenues | LTM EBITDA | 3-yr. CAGR EBITDA | Long-term Proj. EPS | LTM EBITDA | 3-yr. Avg. EBITDA | LTM Net Income | 3-yr. Avg. Net Income | LTM ROE | 3-yr. Avg. ROE | LTM ROI | 3-yr. Avg. ROI | ||||||||||||||||||||||||||||||||
BISYS Group, Inc. (BSG) 1 | 21.7 | % | 22.3 | % | 23.0 | % | 27.9 | % | 20.0 | % | 28.2 | % | 27.2 | % | 13.5 | % | 12.9 | % | 19.6 | % | 20.3 | % | 13.0 | % | 14.6 | % | ||||||||||||||||||
DST Systems, Inc. (DST) 2 | -23.0 | 14.0 | 5.1 | 20.6 | 18.0 | 28.1 | 27.6 | 12.9 | 12.1 | 16.2 | 11.8 | 11.0 | 8.7 | |||||||||||||||||||||||||||||||
Federated Investors, Inc. (FII) 3 | 4.4 | 11.7 | 13.3 | 19.2 | 15.0 | 50.2 | 44.9 | 28.4 | 22.7 | 74.8 | 109.7 | 44.3 | 35.6 | |||||||||||||||||||||||||||||||
Fiserv, Inc. (FISV) 4 | 6.6 | 15.3 | 14.2 | 13.0 | 19.0 | 24.0 | 25.1 | 11.5 | 10.8 | 15.7 | 14.9 | 12.8 | 11.1 | |||||||||||||||||||||||||||||||
SEI Investments (SEIC) 5 | -2.3 | 21.6 | 14.6 | 30.6 | 17.8 | 35.2 | 28.1 | 22.0 | 16.9 | 54.4 | 74.8 | 45.6 | 56.1 | |||||||||||||||||||||||||||||||
Sungard Data Systems (SDS) 6 | NA | NA | NA | NA | 20.0 | 34.5 | 28.3 | 8.6 | 11.4 | NA | 17.1 | NA | 17.0 | |||||||||||||||||||||||||||||||
Highest | 21.7 | 22.3 | 23.0 | 30.6 | 20.0 | 50.2 | 44.9 | 28.4 | 22.7 | 74.8 | 109.7 | 45.6 | 56.1 | |||||||||||||||||||||||||||||||
Lowest | -23.0 | 11.7 | 5.1 | 13.0 | 15.0 | 24.0 | 25.1 | 8.6 | 10.8 | 15.7 | 11.8 | 11.0 | 8.7 | |||||||||||||||||||||||||||||||
Mean | 1.5 | 17.0 | 14.0 | 22.3 | 18.3 | 33.4 | 30.2 | 16.2 | 14.5 | 36.1 | 41.4 | 25.3 | 23.9 | |||||||||||||||||||||||||||||||
Median | 4.4 | 15.3 | 14.2 | 20.6 | 18.5 | 31.4 | 27.9 | 13.2 | 12.5 | 19.6 | 18.7 | 13.0 | 15.8 | |||||||||||||||||||||||||||||||
Index | Price | Price One- Year Ago | % Change in Price | LTM EPS | Projected EPS | Price as a Multiple of | ||||||||||||||||||||||||||||||||||||||
| LTM EPS | Proj. EPS | |||||||||||||||||||||||||||||||||||||||||||
| $ | 8,341.63 | $ | 10,021.50 | -16.8 | % | $ | 384.60 | $ | 530.00 | 21.7 | x | 15.7 | x | |||||||||||||||||||||||||||||||
S&P 500 | 879.82 | 1,148.08 | -23.4 | 30.34 | 53.25 | 29.0 | 16.5 | |||||||||||||||||||||||||||||||||||||
| * | Total capital equals the sum of the market value of common equity, the book value of total debt, preferred stock, and minority interest. |
| Note: | Projected results exclude amortization of goodwill; historical results include amortization of goodwill, if any, as reported. |
| 1 | Projections per Stifel, Nicolaus report dated 12/20/02. |
| 2 | Projections per CSFB report dated 12/9/02. |
| 3 | Projections per Morgan Stanley report dated 11/5/02. |
| 4 | Projections per Needham & Co. report dated 12/10/02. |
| 5 | Projections per Robert Baird report dated 12/19/02. |
| 6 | Projections per Robert Baird report dated 10/25/02. LTM and 2001 financials are pro forma for acquisition of Guardian iT plc on 7/1/02. Prior years are not pro forma. On 9/30/02, SDS acquired the Availability Solutions Business of Comdisco, Inc. |
| Source: | Standard & Poor's Compustat Services, Inc., Duff & Phelps, LLC and First Call Corporation. |
B-1
UNIFIED FINANCIAL SERVICES, INC.
FIDUCIARY COUNSEL, INC.
COMPARABLE PUBLIC COMPANY ANALYSIS
December 31, 2002
Company | Common Stock | Equity Value (in millions) | Value of Operations (in millions) | Debt / Enterprise Value | LTM Revenues (in millions) | Common Stock Price as a Multiple of | Value of Operations as a Multiple of | (as a % of) | |||||||||||||||||||||||||||||||||||||||
LTM EPS | Projected EPS | Book Value Per Share | LTM EBITDA | Projected EBITDA | LTM EBIT | Projected EBIT | LTM Revenues | Latest AUM | |||||||||||||||||||||||||||||||||||||||
Affiliated Managers Group, Inc. (AMG) 1 | $ | 50.30 | $ | 1,101 | $ | 1,583 | 32.1 | % | $ | 475 | 20.8 | x | 10.5 | x | 2.0 | x | 7.3 | x | 7.2 | x | 8.2 | x | 8.1 | x | 3.3 | x | 2.3 | % | |||||||||||||||||||
BlackRock, Inc. (BLK) | 39.40 | 2,551 | 2,157 | 0.0 | 569 | 20.2 | 17.0 | 4.3 | 9.5 | 8.3 | 10.6 | 9.1 | 3.8 | 0.9 | % | ||||||||||||||||||||||||||||||||
Eaton Vance Corp. (EV) | 28.25 | 1,957 | 1,861 | 6.3 | 523 | 16.6 | 15.9 | 5.3 | 6.8 | 6.4 | 10.1 | 9.3 | 3.6 | 3.3 | % | ||||||||||||||||||||||||||||||||
Franklin Resources, Inc. (BEN) | 34.08 | 8,812 | 7,241 | 6.2 | 2,519 | 18.7 | 18.3 | 2.1 | 10.3 | 8.4 | 12.4 | 9.8 | 2.9 | 2.9 | % | ||||||||||||||||||||||||||||||||
Gabelli Asset Management Inc. (GBL) | 30.04 | 906 | 576 | 16.8 | 216 | 16.2 | 16.8 | 2.9 | 6.0 | 6.1 | 6.1 | 6.2 | 2.7 | 2.9 | % | ||||||||||||||||||||||||||||||||
Neuberger Berman Inc. (NEU) | 33.49 | 2,338 | 1,613 | 7.2 | 593 | 18.7 | 18.5 | 6.5 | 7.6 | 8.0 | 8.1 | 8.6 | 2.7 | 3.0 | % | ||||||||||||||||||||||||||||||||
T. Rowe Price Group, Inc. (TROW) | 27.28 | 3,337 | 3,066 | 1.7 | 943 | 18.2 | 18.2 | 3.0 | 7.0 | 7.1 | 8.0 | 8.3 | 3.3 | 2.3 | % | ||||||||||||||||||||||||||||||||
Waddell & Reed Financial, Inc. (WDR) | 19.67 | 1,579 | 1,699 | 15.0 | 447 | 16.7 | 16.4 | 11.2 | 10.2 | 9.6 | 10.8 | 10.1 | 3.8 | 6.6 | % | ||||||||||||||||||||||||||||||||
W.P. Stewart & Co. (WPL) | 17.92 | 811 | 797 | 2.1 | 140 | 13.1 | 14.7 | 7.4 | 9.8 | 7.7 | 10.8 | 8.3 | 5.7 | 10.9 | % | ||||||||||||||||||||||||||||||||
Highest | 8,812 | 7,241 | 32.1 | 2,519 | 20.8 | 18.5 | 11.2 | 10.3 | 9.6 | 12.4 | 10.1 | 5.7 | 10.9 | % | |||||||||||||||||||||||||||||||||
Lowest | 811 | 576 | 0.0 | 140 | 13.1 | 10.5 | 2.0 | 6.0 | 6.1 | 6.1 | 6.2 | 2.7 | 0.9 | % | |||||||||||||||||||||||||||||||||
Mean | 2,599 | 2,288 | 9.7 | 714 | 17.7 | 16.2 | 5.0 | 8.3 | 7.7 | 9.5 | 8.6 | 3.5 | 3.9 | % | |||||||||||||||||||||||||||||||||
Median | 1,957 | 1,699 | 6.3 | 523 | 18.2 | 16.8 | 4.3 | 7.6 | 7.7 | 10.1 | 8.6 | 3.3 | 2.9 | % | |||||||||||||||||||||||||||||||||
Company | Growth Rates | Margin Analysis | Assets Under Management | ||||||||||||||||||||||||||||||||||||||||||||
LTM Revenues | 3-yr. CAGR Revenues | LTM EBITDA | 3-yr. CAGR EBITDA | Long-term Proj. EPS | LTM EBITDA | 3-yr. Avg. EBITDA | LTM Net Income | 3-yr. Avg. Net Income | LTM Rev/AUM | 3-yr. Avg. Rev/AUM | LTM TOE/AUM | 3-yr. Avg. TOE/AUM | |||||||||||||||||||||||||||||||||||
Affiliated Managers Group, Inc. (AMG) 1 | 15.1 | % | 19.6 | % | 15.5 | % | 18.6 | % | NA | 45.9 | % | 45.7 | % | 11.6 | % | 12.8 | % | 0.7 | % | 0.6 | % | 0.4 | % | 0.3 | % | ||||||||||||||||||||||
BlackRock, Inc. (BLK) | 7.0 | 16.2 | 18.6 | 26.7 | 16.0 | 39.7 | 34.8 | 22.4 | 18.0 | 0.2 | 0.2 | 0.1 | 0.1 | ||||||||||||||||||||||||||||||||||
Eaton Vance Corp. (EV) | 4.1 | 24.8 | -0.4 | 32.4 | 15.0 | 52.1 | 52.8 | 23.1 | 22.6 | 0.9 | 0.9 | 0.5 | 0.4 | ||||||||||||||||||||||||||||||||||
Franklin Resources, Inc. (BEN) | 7.0 | -3.0 | -5.5 | NA | 14.5 | 27.9 | 34.6 | 18.6 | 21.6 | 1.0 | 1.0 | 0.7 | 0.7 | ||||||||||||||||||||||||||||||||||
Gabelli Asset Management Inc. (GBL) | -8.1 | 17.5 | 0.7 | 27.1 | 12.0 | 44.4 | 39.3 | 26.1 | 26.7 | 1.1 | 0.9 | 0.6 | 0.5 | ||||||||||||||||||||||||||||||||||
Neuberger Berman Inc. (NEU) | 2.6 | NA | -6.9 | NA | 13.5 | 36.0 | 40.2 | 21.3 | 30.1 | 1.1 | 1.0 | 0.7 | 0.7 | ||||||||||||||||||||||||||||||||||
T. Rowe Price Group, Inc. (TROW) | -9.9 | NA | -0.6 | NA | 12.0 | 46.8 | 45.5 | 20.5 | 22.3 | 0.7 | 0.6 | 0.4 | 0.4 | ||||||||||||||||||||||||||||||||||
Waddell & Reed Financial, Inc. (WDR) | -9.7 | 19.7 | -21.0 | 13.8 | 14.0 | 37.1 | 45.2 | 21.7 | 26.2 | 1.7 | 1.3 | 1.1 | 0.7 | ||||||||||||||||||||||||||||||||||
W.P. Stewart & Co. (WPL) | -18.6 | 1.6 | -25.6 | 7.5 | 10.0 | 58.1 | 59.8 | 45.4 | 50.6 | 1.9 | 0.8 | NA | NA | ||||||||||||||||||||||||||||||||||
Highest | 15.1 | 24.8 | 18.6 | 32.4 | 16.0 | 58.1 | 59.8 | 45.4 | 50.6 | 1.9 | 1.3 | 1.1 | 0.7 | ||||||||||||||||||||||||||||||||||
Lowest | -18.6 | -3.0 | -25.6 | 7.5 | 10.0 | 27.9 | 34.6 | 11.6 | 12.8 | 0.2 | 0.2 | 0.1 | 0.1 | ||||||||||||||||||||||||||||||||||
Mean | -1.2 | 13.8 | -2.8 | 21.0 | 13.4 | 43.1 | 44.2 | 23.4 | 25.7 | 1.0 | 0.8 | 0.6 | 0.5 | ||||||||||||||||||||||||||||||||||
Median | 2.6 | 17.5 | -0.6 | 22.7 | 13.8 | 44.4 | 45.2 | 21.7 | 22.6 | 1.0 | 0.9 | 0.5 | 0.5 | ||||||||||||||||||||||||||||||||||
Index | Price | Price One- Year Ago | % Change in Price | LTM EPS | Projected EPS | Price as a Multiple of | |||||||||||||||||||||||||||||||||||||||||
| LTM EPS | Proj. EPS | ||||||||||||||||||||||||||||||||||||||||||||||
Dow Jones Industrial Average | 8,386.0 | 9,823.6 | -14.6 | % | 370.0 | 507.5 | 22.7 | 16.5 | |||||||||||||||||||||||||||||||||||||||
S&P 500 | 883.0 | 1,141.2 | -22.6 | 38.7 | 43.7 | 22.8 | 20.2 | ||||||||||||||||||||||||||||||||||||||||
| Note: | Projected results exclude amortization of goodwill; historical results include amortization of goodwill, if any, as reported. |
| 1 | Projected EPS is cash EPS consensus per First Call. Cash EPS includes depreciation and amortization and deferred income taxes. |
| Source: | Standard & Poor's Compustat Services, Inc., Duff & Phelps, LLC and First Call Corporation. |
B-2
UNIFIED FINANCIAL SERVICES, INC.
TRASACTION PREMIUMS
PREMIUMS PAID FOR SELF-TENDER OFFERS
Date Announced | Date of Transaction | Target | Shares Authorized | Actual Shares | Acquisition Premium 1 | |||||
06/16/2003 | Pending | Superior Consultant Holdings Corp. 3 | 650,000 | N/A | 18.8% | |||||
06/09/2003 | Pending | Century Business Services, Inc. 3 | 14,000,000 | N/A | 15.0% | |||||
05/28/2003 | Pending | Harrodsburg First Financial Bancorp 3 | 300,000 | N/A | 10.1% | |||||
04/29/2003 | 06/09/2003 | Vodavi Technology, Inc. | 1,000,000 | 829,199 | 34.1% | |||||
04/25/2003 | Pending | Rent-A-Center, Inc. 3 | 2,200,000 | N/A | 31.0% | |||||
04/14/2003 | 05/12/2003 | Tyler Technologies, Inc. | 4,200,000 | 5,107,000 | 9.3% | |||||
04/11/2003 | 05/16/2003 | Chester Bancorp, Inc. 2 | 100,000 | 69,861 | 0.2% | |||||
03/20/2003 | 04/21/2003 | QAD, Inc. | 2,600,000 | 2,900,000 | 28.9% | |||||
03/18/2003 | 04/14/2003 | Atrion Corp. | 350,000 | 173,614 | 11.2% | |||||
03/13/2003 | 04/23/2003 | Rare Medium Group, Inc. | 2,500,000 | 993,052 | 54.1% | |||||
03/12/2003 | 05/16/2003 | Keynote Systems, Inc. | 7,500,000 | 4,300,000 | 8.9% | |||||
02/28/2003 | 04/11/2003 | WorldPort Communications, Inc. 2 | All outstanding stock | 6,147,044 | 4.2% | |||||
02/24/2003 | 03/25/2003 | Digitas, Inc. | 6,426,735 | 6,426,735 | 0.0% | |||||
02/18/2003 | 03/17/2003 | Libbey, Inc. | 1,500,000 | 1,500,000 | 7.8% | |||||
02/05/2003 | 03/04/2003 | Brown-Forman Corp.—Class A | 1,500,000 | 470,673 | 9.4% | |||||
02/05/2003 | 03/04/2003 | Brown-Forman Corp.—Class B | 6,800,000 | 7,590,607 | 9.0% | |||||
01/31/2003 | 03/18/2003 | BayCorp Holdings, Ltd. 2 | 8,500,000 | 8,673,887 | 0.6% | |||||
01/30/2003 | 03/14/2003 | German American Bancorp | 1,000,000 | 1,057,566 | 27.3% | |||||
| High | 54.1 | % | |
| Low | 0.0 | % | |
| Mean | 15.6 | % | |
| Median | 9.7 | % |
| 1 | Acquisition premium based on 20 day trading average before the announcement |
| 2 | Going private transactions |
| 3 | Acquisition premium based on the higher price. |
C-1
DUFF&PHELPS,LLC
Review of Sale Alternatives(to a Third Party Buyer)
Fund Services
Advantages
Streamline Unified Financial
Eliminate execution risk associated with Fund Services’ current business plan
Disadvantage
Current valuation is approximately $7.0 million after allocation of corporate overhead and approximately $11
million before this allocation. Embedded within the valuation is a significant improvement in profitability.
Unclear whether sale price would be higher than the $7.0 million to $11.0 million valuation range as a buyer
would likely have to consolidate technology and invest in management to achieve projections.
Potential loss of key customer relationships and of key employees would potentially reduce the sales price.
Unified Financial is not in need of capital.
D-1
DUFF&PHELPS,LLC
Review of Sale Alternatives(to a Third Party Buyer)
Trust
Advantages
Streamline Unified Financial
Disadvantages
Would not likely maximize sale value for these businesses, as both have poor track records over last few years.
With recent improvement in market conditions, both Trust and Fiduciary Counsel are performing better. Why
sell when markets are rebounding?
Unified Financial does not need cash or capital
Sale likely structured with an earn-out which would be of no benefit to the Company today
D-2