UNITED STATES
SECURITIES AND EXCHANGE COMMISSION
Washington, D.C. 20549
FORMN-CSR
CERTIFIED SHAREHOLDER REPORT OF REGISTERED
MANAGEMENT INVESTMENT COMPANIES
Investment Company Act File Number: 811-08059
Cohen & Steers Global Realty Shares, Inc.
(Exact name of registrant as specified in charter)
280 Park Avenue, New York, NY 10017
(Address of principal executive offices) (Zip code)
Dana A. DeVivo
Cohen & Steers Capital Management, Inc.
280 Park Avenue
New York, New York 10017
(Name and address of agent for service)
Registrant’s telephone number, including area code: (212)832-3232
Date of fiscal year end: December 31
Date of reporting period: December 31, 2018
Item 1. Reports to Stockholders.
COHEN & STEERS GLOBAL REALTY SHARES, INC.
To Our Shareholders:
We would like to share with you our report for the year ended December 31, 2018. The total returns for Cohen & Steers Global Realty Shares, Inc. (the Fund) and its comparative benchmarks were:
| | | | | | | | |
| | | Six Months Ended
December 31, 2018 | | | Year Ended
December 31, 2018 | |
Cohen & Steers Global Realty Shares: | | | | | | | | |
Class A | | | –4.30 | % | | | –4.20 | % |
Class C | | | –4.63 | % | | | –4.84 | % |
Class I | | | –4.14 | % | | | –3.89 | % |
Class R | | | –4.36 | % | | | –4.34 | % |
Class Z | | | –4.12 | % | | | –3.86 | % |
FTSE EPRA Nareit Developed Real Estate Index—neta | | | –5.97 | % | | | –5.63 | % |
S&P 500 Indexa | | | –6.85 | % | | | –4.38 | % |
The performance data quoted represent past performance. Past performance is no guarantee of future results. The investment return and the principal value of an investment will fluctuate and shares, if redeemed, may be worth more or less than their original cost. Current performance may be lower or higher than the performance data quoted. Current total returns of the Fund can be obtained by visiting our website at cohenandsteers.com. All share class returns assume the reinvestment of all dividends and distributions at net asset value (NAV). Fund performance figures reflect fee waivers and/or expense reimbursements, where applicable, without which the performance would have been lower. Performance quoted does not reflect the deduction of the maximum 4.50% initial sales charge on Class A shares or the 1.00% maximum contingent deferred sales charge on Class C shares. The 1.00% maximum contingent deferred sales charge on Class C shares applies if redemption occurs on or before the one year anniversary date of their purchase. If such charges were included, returns would have been lower. Index performance does not reflect the deduction of any fees, taxes or expenses. An investor cannot invest directly in an index. Performance figures for periods shorter than one year are not annualized.
Please note that distributions paid by the Fund to shareholders are subject to recharacterization for tax purposes and are taxable up to the amount of the Fund’s investment company taxable income and net realized gains. Distributions in excess of the Fund’s investment company taxable income and net realized gains are a return of capital distributed from the Fund’s assets.
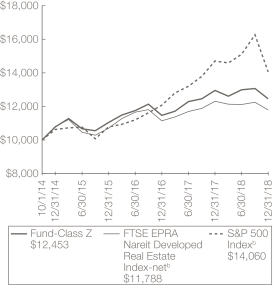
| a | The FTSE EPRA Nareit Developed Real Estate Index—net is an unmanaged market-capitalization-weighted total return index, which consists of publicly traded equity real estate investment trusts (REITs) and listed property companies from developed markets and is net of dividend witholding taxes. The S&P 500 Index is an unmanaged index of 500 large-capitalization stocks that is frequently used as a general measure of U.S. stock market performance. |
1
COHEN & STEERS GLOBAL REALTY SHARES, INC.
Market Review
Global real estate securities had a negative total return in 2018, in what was a difficult year for investments in general. Following a period of steady gains after a sharp correction in February, equity and credit markets again encountered turbulence in October amid tightening financial conditions, rising global trade tensions and slowing economic growth. The broad global equity market suffered its largest annual decline since 2008.
Although economic growth remained above trend globally, momentum slowed across most regions. Europe and China particularly showed signs of deceleration. Inflation remained subdued, but indications that price pressures were building prompted the U.S. Federal Reserve (the Fed) to continue to normalize interest rates. The Fed also began to unwind its balance sheet, while the European Central Bank ended its bond buying program. Additionally, the strengthening U.S. dollar led indirectly to tighter credit conditions globally, especially in emerging markets.
The fourth quarter saw a significant shift in investor preferences toward more defensive assets. After trailing the broad equity market for much of the year, real estate stocks began to outperform as investors generally favored them for their stable cash flows, high dividend yields and attractive relative valuations.
Fund Performance
The Fund had a negative total return in the period, although it outperformed its benchmark. U.S. real estate stocks had an overall decline, although returns varied widely by property type. Regional mall and shopping center REITs had significant declines amid secular concerns over loss of market share to online retailers and shifting consumer behaviors. Health care property companies were a positive standout, favored for their relatively stable cash flows tied to long-term leases. Stock selection in the U.S. aided the Fund’s relative performance, led by overweights in health care company Welltower and apartment landlord UDR, which had gains.
The U.K. had mostly negative performance amid uncertainty regarding ongoing Brexit negotiations that by the end of the period were in disarray. Our emphasis on less-cyclical companies contributed to relative performance, as they generally outperformed more economically sensitive stocks. The Fund’s overweight in self storage operator Big Yellow Group contributed to performance, as did its overweight in industrial landlord Segro. In addition, the Fund did not own Intu Properties, a retail landlord that fell more than 50% on tenant bankruptcy concerns.
Australia saw rallies in most property stocks. The country’s REITs are considered to be a safe haven alternative to other equities when local investors are concerned about growth. Stock selection in the country aided performance, mostly reflecting an out-of-index position in Charter Hall Group that rallied in the period. The company’s assets include high-quality office and non-discretionary retail properties.
The Netherlands had a substantial decline, brought lower by retail landlord Unibail-Rodamco-Westfield, the country’s largest weight in the index. The stock was negatively impacted by poorer results from the company’s malls in Europe and the U.S. In addition, management tempered its future growth expectations and outlook for development returns. The Fund’s limited investment in the company, and the Netherlands more broadly, contributed to relative performance.
2
COHEN & STEERS GLOBAL REALTY SHARES, INC.
Most real estate stocks in Japan advanced, with large J-REITs such as Nippon Building Fund among the stronger performers as investors sought safety. Stock selection in Japan detracted from relative performance, largely due to an overweight in Tokyo Tatemono, a mid-cap developer that declined in the period. An out-of-index allocation to Brazil that declined also hindered relative performance, as did stock selection in Canada.
Impact of Foreign Currency on Fund Performance
The currency impact of the Fund’s investments in foreign securities detracted from absolute performance during the period. Although the Fund reports its NAV and pays dividends in U.S. dollars, the Fund’s investments denominated in foreign currencies are subject to foreign currency risk. Most currencies depreciated against the U.S. dollar, including the euro and U.K. pound. Consequently, changes in the exchange rates between foreign currencies and the U.S. dollar were a net headwind for absolute returns.
Fund Reorganization Increased Its Assets
Effective close of business on March 23, 2018, Cohen & Steers Institutional Global Realty Shares, Inc. (IGRS) was reorganized with and into the Fund. IGRS had substantially similar investment policies and the same investment objective of total return. We believe the reorganization, which increased the Fund’s assets by more than $450 million, is beneficial to shareholders of the Fund by reducing annual operating gross and net expense ratios, increasing marketability and providing portfolio management and operational efficiencies. In connection with the reorganization, the Fund’s investment advisory fee was lowered from an annual rate of 0.80% to 0.75% of average daily net assets of the Fund. In addition, the Fund’s expense cap was lowered by 0.05% across all share classes.
Sincerely,
| | |

| | 
|
| |
| JON CHEIGH | | WILLIAM LEUNG |
| Portfolio Manager | | Portfolio Manager |

ROGIER QUIRIJNS
Portfolio Manager
3
COHEN & STEERS GLOBAL REALTY SHARES, INC.
The views and opinions in the preceding commentary are subject to change without notice and are as of the date of the report. There is no guarantee that any market forecast set forth in the commentary will be realized. This material represents an assessment of the market environment at a specific point in time, should not be relied upon as investment advice and is not intended to predict or depict performance of any investment.
Visit Cohen & Steers online at cohenandsteers.com
For more information about the Cohen & Steers family of mutual funds, visit cohenandsteers.com. Here you will find fund net asset values, fund fact sheets and portfolio highlights, as well as educational resources and timely market updates.
Our website also provides comprehensive information about Cohen & Steers, including our most recent press releases, profiles of our senior investment professionals and their investment approach to each asset class. The Cohen & Steers family of mutual funds invests in major real asset categories including real estate securities, listed infrastructure, commodities and natural resource equities, as well as preferred securities and other income solutions.
4
COHEN & STEERS GLOBAL REALTY SHARES, INC.
Performance Review (Unaudited)
| | |
Class A—Growth of a $10,000 Investment 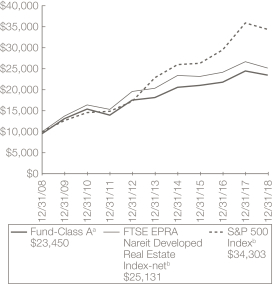
| | Class C—Growth of a $10,000 Investment 
|
| | |
Class I—Growth of a $100,000 Investment 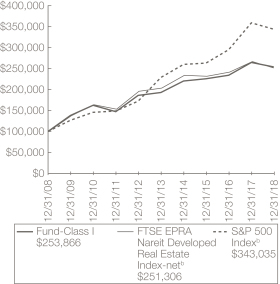
| | Class R—Growth of a $10,000 Investment 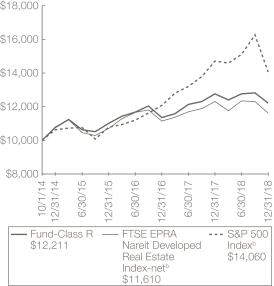
|
5
COHEN & STEERS GLOBAL REALTY SHARES, INC.
Performance Review (Unaudited)—(Continued)
Class Z—Growth of a $10,000 Investment
Average Annual Total Returns—For Periods Ended December 31, 2018.
| | | | | | | | | | | | | | | | | | | | |
| | | Class A
Shares | | | Class C
Shares | | | Class I
Shares | | | Class R
Shares | | | Class Z
Shares | |
1 Year (with sales charge) | | | –8.51 | %a | | | –5.79 | %c | | | — | | | | — | | | | — | |
1 Year (without sales charge) | | | –4.20 | % | | | –4.84 | % | | | –3.89 | % | | | –4.34 | % | | | –3.86 | % |
5 Years (with sales charge) | | | 4.31 | %a | | | 4.59 | % | | | — | | | | — | | | | — | |
5 Years (without sales charge) | | | 5.28 | % | | | 4.59 | % | | | 5.65 | % | | | — | | | | — | |
10 Years (with sales charge) | | | 8.90 | %a | | | 8.69 | % | | | — | | | | — | | | | — | |
10 Years (without sales charge) | | | 9.40 | % | | | 8.69 | % | | | 9.77 | % | | | — | | | | — | |
Since Inceptiond (with sales charge) | | | 4.67 | %a | | | 4.32 | % | | | — | | | | — | | | | — | |
Since Inceptiond (without sales charge) | | | 5.00 | % | | | 4.32 | % | | | 7.94 | % | | | 4.81 | % | | | 5.30 | % |
The performance data quoted represent past performance. Past performance is no guarantee of future results. The investment return and principal value of an investment will fluctuate and shares, if redeemed, may be worth more or less than their original cost. Current performance may be lower or higher than the performance data quoted. Performance information current to the most recent month end can be obtained by visiting our website at cohenandsteers.com. All share class returns assume the reinvestment of all dividends and distributions at NAV. The performance graph and tables do not reflect the deduction of taxes that a shareholder would pay on Fund distributions or the redemption of Fund shares. During certain periods presented above, the investment advisor waived fees and/or reimbursed expenses. Without this arrangement, performance would have been lower.
6
COHEN & STEERS GLOBAL REALTY SHARES, INC.
Performance Review (Unaudited)—(Continued)
As disclosed in the April 1, 2017 prospectus, prior to close of business on March 23, 2018, the annualized gross and net expense ratios were as follows: Class A—1.31% and 1.30%; Class C—1.96% and 1.95%; Class I—1.03% and 0.95%; Class R—1.46% and 1.45%; and Class Z—0.96% and 0.95%. In connection with the reorganization of Cohen & Steers Institutional Global Realty Shares, Inc. (IGRS) into the Fund, effective close of business on March 23, 2018, as disclosed in the prospectus dated April 1, 2017, as supplemented March 23, 2018, and the prospectus dated May 1, 2018, as supplemented January 22, 2019, the annualized gross and net expense ratios were as follows: Class A—1.22% and 1.22%; Class C—1.87% and 1.87%; Class I—0.93% and 0.90%; Class R—1.37% and 1.37%; and Class Z—0.87% and 0.87%. Through June 30, 2020, the investment advisor has contractually agreed to waive its fee and/or reimburse expenses so that the Fund’s total annual operating expenses (excluding acquired fund fees and expenses, taxes and extraordinary expenses) do not exceed 1.25% for Class A shares, 1.90% for Class C shares, 0.90% for Class I shares, 1.40% for Class R shares and 0.90% for Class Z shares. This contractual agreement can be amended at any time by agreement of the Fund’s Board of Directors and the investment advisor and will terminate automatically in the event of termination of the investment advisory agreement between the investment advisor and the Fund.
In addition, on December 5, 2017, the Board of Directors of the Fund approved an amendment to the Fund’s investment advisory agreement in connection with the reorganization of IGRS with and into the Fund, reducing the investment advisory fee that the Fund pays to the investment advisor to an annual rate of 0.75% of the average daily net assets of the Fund, effective close of business March 23, 2018.
| a | Reflects a 4.50%front-end sales charge. |
| b | The comparative indexes are not adjusted to reflect expenses or other fees that the U.S. Securities and Exchange Commission (SEC) requires to be reflected in the Fund’s performance. Index performance does not reflect the deduction of any fees, taxes or expenses. An investor cannot invest directly in an index. The Fund’s performance assumes the reinvestment of all dividends and distributions at NAV. For more information, including charges and expenses, please read the prospectus carefully before you invest. |
| c | Reflects a contingent deferred sales charge of 1.00%. |
| d | Inception dates: September 30, 2004 for Class A and C shares, May 8, 1997 for Class I shares and October 1, 2014 for Class R and Z shares. |
7
COHEN & STEERS GLOBAL REALTY SHARES, INC.
Expense Example (Unaudited)
As a shareholder of the Fund, you incur two types of costs: (1) transaction costs, including sales charges (loads) on purchase payments; and (2) ongoing costs including investment advisory fees; distribution and/or service(12b-1) fees; and other Fund expenses. This example is intended to help you understand your ongoing costs (in dollars) of investing in the Fund and to compare these costs with the ongoing costs of investing in other mutual funds.
The example is based on an investment of $1,000 invested at the beginning of the period and held for the entire period July 1, 2018—December 31, 2018.
Actual Expenses
The first line of the following table provides information about actual account values and expenses. You may use the information in this line, together with the amount you invested, to estimate the expenses that you paid over the period. Simply divide your account value by $1,000 (for example, an $8,600 account value divided by $1,000 = 8.6), then multiply the result by the number in the first line under the heading entitled “Expenses Paid During Period” to estimate the expenses you paid on your account during this period.
Hypothetical Example for Comparison Purposes
The second line of the following table provides information about hypothetical account values and hypothetical expenses based on the Fund’s actual expense ratio and an assumed rate of return of 5% per year before expenses, which is not the Fund’s actual return. The hypothetical account values and expenses may not be used to estimate the actual ending account balance or expenses you paid for the period. You may use this information to compare the ongoing cost of investing in the Fund and other funds. To do so, compare this 5% hypothetical example with the 5% hypothetical examples that appear in the shareholder reports of other funds.
Please note that the expenses shown in the table are meant to highlight your ongoing costs only and do not reflect any transaction costs, such as sales charges (loads). Therefore, the second line of the table is useful in comparing ongoing costs only, and will not help you determine the relative total costs of owning different funds. In addition, if these transactional costs were included, your costs would have been higher.
8
COHEN & STEERS GLOBAL REALTY SHARES, INC.
Expense Example (Unaudited)—(Continued)
| | | | | | | | | | | | |
| | | Beginning
Account Value
July 1, 2018 | | | Ending
Account Value
December 31, 2018 | | | Expenses Paid
During Perioda
July 1, 2018—
December 31, 2018 | |
Class A | |
Actual (–4.30% return) | | $ | 1,000.00 | | | $ | 957.00 | | | $ | 6.02 | |
Hypothetical (5% annual return before expenses) | | $ | 1,000.00 | | | $ | 1,019.06 | | | $ | 6.21 | |
|
Class C | |
Actual (–4.63% return) | | $ | 1,000.00 | | | $ | 953.70 | | | $ | 9.21 | |
Hypothetical (5% annual return before expenses) | | $ | 1,000.00 | | | $ | 1,015.78 | | | $ | 9.50 | |
|
Class I | |
Actual (–4.14% return) | | $ | 1,000.00 | | | $ | 958.60 | | | $ | 4.44 | |
Hypothetical (5% annual return before expenses) | | $ | 1,000.00 | | | $ | 1,020.67 | | | $ | 4.58 | |
|
Class R | |
Actual (–4.36% return) | | $ | 1,000.00 | | | $ | 956.40 | | | $ | 6.76 | |
Hypothetical (5% annual return before expenses) | | $ | 1,000.00 | | | $ | 1,018.30 | | | $ | 6.97 | |
|
Class Z | |
Actual (–4.12% return) | | $ | 1,000.00 | | | $ | 958.80 | | | $ | 4.30 | |
Hypothetical (5% annual return before expenses) | | $ | 1,000.00 | | | $ | 1,020.82 | | | $ | 4.43 | |
| a | Expenses are equal to the Fund’s Class A, Class C, Class I, Class R and Class Z annualized net expense ratios of 1.22%, 1.87%, 0.90%, 1.37% and 0.87%, respectively, multiplied by the average account value over the period, multiplied by 184/365 (to reflect theone-half year period). |
9
COHEN & STEERS GLOBAL REALTY SHARES, INC.
December 31, 2018
Top Ten Holdings
(Unaudited)
| | | | | | | | |
Security | | Value | | | % of
Net
Assets | |
| | |
UDR, Inc. | | $ | 60,277,908 | | | | 5.0 | |
Welltower, Inc. | | | 51,492,503 | | | | 4.2 | |
Prologis, Inc. | | | 46,338,242 | | | | 3.8 | |
Essex Property Trust, Inc. | | | 36,677,776 | | | | 3.0 | |
Link REIT | | | 36,069,443 | | | | 2.9 | |
Deutsche Wohnen SE | | | 34,109,529 | | | | 2.8 | |
CK Asset Holdings Ltd. | | | 33,239,197 | | | | 2.7 | |
Realty Income Corp. | | | 29,159,972 | | | | 2.4 | |
Digital Realty Trust, Inc. | | | 27,038,022 | | | | 2.2 | |
Extra Space Storage, Inc. | | | 26,152,249 | | | | 2.2 | |
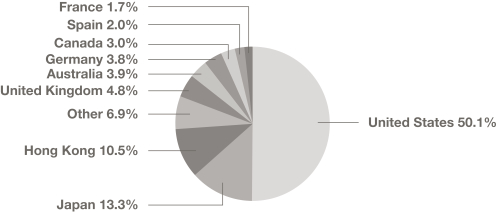
Country Breakdown
(Based on Net Assets)
(Unaudited)
10
COHEN & STEERS GLOBAL REALTY SHARES, INC.
SCHEDULE OF INVESTMENTS
December 31, 2018
| | | | | | | | | | | | |
| | | | Shares | | | Value | |
COMMON STOCK | | | 97.5% | | | | | | | | | |
AUSTRALIA | | | 3.9% | | | | | | | | | |
REAL ESTATE | | | | | | | | | | | | |
DIVERSIFIED | | | 3.1% | | | | | | | | | |
BGP Holdings PLC (EUR)a,b | | | | 11,893,063 | | | $ | 0 | |
Charter Hall Group | | | | 2,436,168 | | | | 12,737,992 | |
GPT Group | | | | 6,636,583 | | | | 24,973,731 | |
| | | | | | | | | |
| | | | 37,711,723 | |
| | | | | |
INDUSTRIALS | | | 0.8% | | | | | | | | | |
Goodman Group | | | | 1,242,692 | | | | 9,308,834 | |
| | | | | | | | | |
TOTAL AUSTRALIA | | | | | | | | 47,020,557 | |
| | | | | |
AUSTRIA | | | 0.5% | | | | | | | | | |
REAL ESTATE—DIVERSIFIED | | | | | | | | | | | | |
CA Immobilien Anlagen AG | | | | 180,570 | | | | 5,714,247 | |
| | | | | | | | | |
BELGIUM | | | 0.3% | | | | | | | | | |
REAL ESTATE—RESIDENTIAL | | | | | | | | | | | | |
Aedifica SA | | | | 43,098 | | | | 3,885,224 | |
| | | | | | | | | |
BRAZIL | | | 0.6% | | | | | | | | | |
REAL ESTATE—RETAIL | | | | | | | | | | | | |
BR Malls Participacoes SA | | | | 1,093,335 | | | | 3,683,150 | |
Iguatemi Empresa de Shopping Centers SA | | | | 340,235 | | | | 3,648,477 | |
| | | | | | | | | |
| | | | | | | | 7,331,627 | |
| | | | | |
CANADA | | | 3.0% | | | | | | | | | |
REAL ESTATE | | | | | | | | | | | | |
OFFICE | | | 1.5% | | | | | | | | | |
Allied Properties REIT | | | | 568,127 | | | | 18,443,736 | |
| | | | | | | | | |
RESIDENTIAL | | | 1.5% | | | | | | | | | |
Boardwalk REIT | | | | 668,988 | | | | 18,528,008 | |
| | | | | | | | | |
TOTAL CANADA | | | | | | | | 36,971,744 | |
| | | | | |
FRANCE | | | 1.7% | | | | | | | | | |
REAL ESTATE | | | | | | | | | | | | |
DIVERSIFIED | | | 1.0% | | | | | | | | | |
Covivio | | | | 124,512 | | | | 12,013,306 | |
| | | | | | | | | |
See accompanying notes to financial statements.
11
COHEN & STEERS GLOBAL REALTY SHARES, INC.
SCHEDULE OF INVESTMENTS—(Continued)
December 31, 2018
| | | | | | | | | | | | |
| | | | Shares | | | Value | |
OFFICE | | | 0.7% | | | | | | | | | |
Gecina SA | | | | 64,223 | | | $ | 8,313,661 | |
| | | | | | | | | |
TOTAL FRANCE | | | | | | | | 20,326,967 | |
| | | | | |
GERMANY | | | 3.8% | | | | | | | | | |
REAL ESTATE | | | | | | | | | | | | |
OFFICE | | | 0.4% | | | | | | | | | |
Alstria Office REIT AG | | | | 370,200 | | | | 5,183,067 | |
| | | | | | | | | |
RESIDENTIAL | | | 3.4% | | | | | | | | | |
ADO Properties SA, 144Ac | | | | 122,831 | | | | 6,390,317 | |
Deutsche Wohnen SE | | | | 746,367 | | | | 34,109,529 | |
| | | | | | | | | |
| | | | 40,499,846 | |
| | | | | |
TOTAL GERMANY | | | | | | | | 45,682,913 | |
| | | | | |
HONG KONG | | | 10.5% | | | | | | | | | |
REAL ESTATE | | | | | | | | | | | | |
DIVERSIFIED | | | 7.6% | | | | | | | | | |
China Overseas Land & Investment Ltd. | | | | 2,818,000 | | | | 9,715,929 | |
China Resources Land Ltd. | | | | 1,807,825 | | | | 6,954,111 | |
CK Asset Holdings Ltd. | | | | 4,543,000 | | | | 33,239,197 | |
Hang Lung Properties Ltd. | | | | 4,982,000 | | | | 9,469,411 | |
New World Development Co., Ltd. | | | | 12,518,000 | | | | 16,533,390 | |
Swire Properties Ltd. | | | | 4,613,600 | | | | 16,210,529 | |
| | | | | | | | | |
| | | | 92,122,567 | |
| | | | | |
RETAIL | | | 2.9% | | | | | | | | | |
Link REIT | | | | 3,557,944 | | | | 36,069,443 | |
| | | | | | | | | |
TOTAL HONG KONG | | | | | | | | 128,192,010 | |
| | | | | |
JAPAN | | | 13.3% | | | | | | | | | |
REAL ESTATE | | | | | | | | | | | | |
DIVERSIFIED | | | 10.6% | | | | | | | | | |
Activia Properties, Inc. | | | | 4,118 | | | | 16,730,912 | |
Invincible Investment Corp. | | | | 23,733 | | | | 9,788,484 | |
Mitsubishi Estate Co., Ltd. | | | | 1,574,197 | | | | 24,767,633 | |
Mitsui Fudosan Co., Ltd. | | | | 389,707 | | | | 8,656,133 | |
Orix JREIT, Inc. | | | | 13,284 | | | | 22,091,373 | |
Sumitomo Realty & Development Co., Ltd. | | | | 595,157 | | | | 21,787,860 | |
Tokyo Tatemono Co., Ltd. | | | | 1,587,409 | | | | 16,456,050 | |
See accompanying notes to financial statements.
12
COHEN & STEERS GLOBAL REALTY SHARES, INC.
SCHEDULE OF INVESTMENTS—(Continued)
December 31, 2018
| | | | | | | | | | | | |
| | | | Shares | | | Value | |
Tokyu Fudosan Holdings Corp. | | | | 1,686,733 | | | $ | 8,313,954 | |
| | | | | | | | | |
| | | | 128,592,399 | |
| | | | | |
INDUSTRIALS | | | 1.3% | | | | | | | | | |
Nippon Prologis REIT, Inc. | | | | 7,165 | | | | 15,121,539 | |
| | | | | | | | | |
OFFICE | | | 1.4% | | | | | | | | | |
Nippon Building Fund, Inc. | | | | 2,756 | | | | 17,354,042 | |
| | | | | | | | | |
TOTAL JAPAN | | | | | | | | 161,067,980 | |
| | | | | |
NORWAY | | | 1.0% | | | | | | | | | |
REAL ESTATE—OFFICE | | | | | | | | | | | | |
Entra ASA, 144Ac | | | | 886,015 | | | | 11,800,025 | |
| | | | | | | | | |
SINGAPORE | | | 0.5% | | | | | | | | | |
REAL ESTATE—DIVERSIFIED | | | | | | | | | | | | |
CapitaLand Ltd. | | | | 2,529,600 | | | | 5,768,570 | |
| | | | | | | | | |
SPAIN | | | 2.0% | | | | | | | | | |
REAL ESTATE | | | | | | | | | | | | |
DIVERSIFIED | | | 0.8% | | | | | | | | | |
Merlin Properties Socimi SA | | | | 787,128 | | | | 9,723,668 | |
| | | | | | | | | |
OFFICE | | | 1.2% | | | | | | | | | |
Inmobiliaria Colonial Socimi SA | | | | 1,522,449 | | | | 14,192,235 | |
| | | | | | | | | | | | |
TOTAL SPAIN | | | | | | | | 23,915,903 | |
| | | | | |
SWEDEN | | | 1.5% | | | | | | | | | |
REAL ESTATE | | | | | | | | | | | | |
DIVERSIFIED | | | 1.0% | | | | | | | | | |
Castellum AB | | | | 645,589 | | | | 11,929,614 | |
| | | | | | | | | |
RETAIL | | | 0.5% | | | | | | | | | |
Catena AB | | | | 273,815 | | | | 6,832,905 | |
| | | | | | | | | |
TOTAL SWEDEN | | | | | | | | 18,762,519 | |
| | | | | |
UNITED KINGDOM | | | 4.8% | | | | | | | | | |
REAL ESTATE | | | | | | | | | | | | |
DIVERSIFIED | | | 1.5% | | | | | | | | | |
British Land Co., PLC | | | | 1,595,145 | | | | 10,847,407 | |
LondonMetric Property PLC | | | | 3,217,247 | | | | 7,132,659 | |
| | | | | | | | | |
| | | | 17,980,066 | |
| | | | | |
See accompanying notes to financial statements.
13
COHEN & STEERS GLOBAL REALTY SHARES, INC.
SCHEDULE OF INVESTMENTS—(Continued)
December 31, 2018
| | | | | | | | | | | | |
| | | | Shares | | | Value | |
HEALTH CARE | | | 0.6% | | | | | | | | | |
Assura PLC | | | | 11,267,109 | | | $ | 7,589,300 | |
| | | | | | | | | |
INDUSTRIALS | | | 1.1% | | | | | | | | | |
Segro PLC | | | | 1,788,459 | | | | 13,426,213 | |
| | | | | | | | | |
RESIDENTIAL | | | 0.5% | | | | | | | | | |
UNITE Group PLC | | | | 561,712 | | | | 5,775,272 | |
| | | | | | | | | |
SELF STORAGE | | | 1.1% | | | | | | | | | |
Big Yellow Group PLC | | | | 669,436 | | | | 7,449,942 | |
Safestore Holdings PLC | | | | 1,025,457 | | | | 6,620,195 | |
| | | | | | | | | |
| | | | 14,070,137 | |
| | | | | |
TOTAL UNITED KINGDOM | | | | | | | | 58,840,988 | |
| | | | | |
UNITED STATES | | | 50.1% | | | | | | | | | |
COMMUNICATIONS—TOWERS | | | 1.0% | | | | | | | | | |
SBA Communications Corp.b | | | | 75,935 | | | | 12,293,117 | |
| | | | | | | | | |
REAL ESTATE | | | 49.1% | | | | | | | | | |
DATA CENTERS | | | 3.3% | | | | | | | | | |
CyrusOne, Inc. | | | | 244,641 | | | | 12,936,616 | |
Digital Realty Trust, Inc. | | | | 253,759 | | | | 27,038,022 | |
| | | | | | | | | |
| | | | 39,974,638 | |
| | | | | |
HEALTH CARE | | | 6.8% | | | | | | | | | |
Sabra Health Care REIT, Inc. | | | | 555,592 | | | | 9,156,156 | |
Ventas, Inc. | | | | 366,348 | | | | 21,464,329 | |
Welltower, Inc. | | | | 741,860 | | | | 51,492,503 | |
| | | | | | | | | |
| | | | 82,112,988 | |
| | | | | |
HOTEL | | | 2.6% | | | | | | | | | |
Park Hotels & Resorts, Inc. | | | | 405,260 | | | | 10,528,655 | |
Pebblebrook Hotel Trust | | | | 425,630 | | | | 12,049,585 | |
Sunstone Hotel Investors, Inc. | | | | 683,073 | | | | 8,886,780 | |
| | | | | | | | | |
| | | | 31,465,020 | |
| | | | | |
INDUSTRIALS | | | 4.6% | | | | | | | | | |
Americold Realty Trust | | | | 366,410 | | | | 9,358,111 | |
Prologis, Inc. | | | | 789,139 | | | | 46,338,242 | |
| | | | | | | | | |
| | | | 55,696,353 | |
| | | | | |
See accompanying notes to financial statements.
14
COHEN & STEERS GLOBAL REALTY SHARES, INC.
SCHEDULE OF INVESTMENTS—(Continued)
December 31, 2018
| | | | | | | | | | | | |
| | | | Shares | | | Value | |
NET LEASE | | | 3.6% | | | | | | | | | |
Agree Realty Corp. | | | | 149,494 | | | $ | 8,838,085 | |
VEREIT, Inc. | | | | 3,364,216 | | | | 24,054,145 | |
VICI Properties, Inc. | | | | 604,949 | | | | 11,360,942 | |
| | | | | | | | | |
| | | | 44,253,172 | |
| | | | | |
OFFICE | | | 4.1% | | | | | | | | | |
Empire State Realty Trust, Inc., Class A | | | | 587,553 | | | | 8,360,879 | |
Kilroy Realty Corp. | | | | 356,906 | | | | 22,442,249 | |
Vornado Realty Trust | | | | 310,091 | | | | 19,234,945 | |
| | | | | | | | | |
| | | | 50,038,073 | |
| | | | | |
RESIDENTIAL | | | 14.3% | | | | | | | | | |
APARTMENT | | | 9.4% | | | | | | | | | |
Apartment Investment & Management Co., Class A | | | | 396,790 | | | | 17,411,145 | |
Essex Property Trust, Inc. | | | | 149,577 | | | | 36,677,776 | |
UDR, Inc. | | | | 1,521,401 | | | | 60,277,908 | |
| | | | | | | | | | | | |
| | | | 114,366,829 | |
| | | | | |
MANUFACTURED HOME | | | 3.1% | | | | | | | | | |
Equity LifeStyle Properties, Inc. | | | | 175,373 | | | | 17,033,979 | |
Sun Communities, Inc. | | | | 198,969 | | | | 20,237,137 | |
| | | | | | | | | |
| | | | 37,271,116 | |
| | | | | |
SINGLE FAMILY | | | 1.8% | | | | | | | | | |
Invitation Homes, Inc. | | | | 1,069,122 | | | | 21,467,970 | |
| | | | | | | | | |
TOTAL RESIDENTIAL | | | | | | | | 173,105,915 | |
| | | | | |
SELF STORAGE | | | 3.4% | | | | | | | | | |
Extra Space Storage, Inc. | | | | 289,039 | | | | 26,152,249 | |
Life Storage, Inc. | | | | 164,069 | | | | 15,256,776 | |
| | | | | | | | | |
| | | | 41,409,025 | |
| | | | | |
SHOPPING CENTERS | | | 6.4% | | | | | | | | | |
COMMUNITY CENTER | | | 3.4% | | | | | | | | | |
Regency Centers Corp. | | | | 363,830 | | | | 21,349,544 | |
SITE Centers Corp. | | | | 480,222 | | | | 5,316,058 | |
Weingarten Realty Investors | | | | 612,946 | | | | 15,207,190 | |
| | | | | | | | | |
| | | | 41,872,792 | |
| | | | | |
See accompanying notes to financial statements.
15
COHEN & STEERS GLOBAL REALTY SHARES, INC.
SCHEDULE OF INVESTMENTS—(Continued)
December 31, 2018
| | | | | | | | | | | | |
| | | | Shares | | | Value | |
FREE STANDING | | | 2.4% | | | | | | | | | |
Realty Income Corp. | | | | 462,563 | | | $ | 29,159,972 | |
| | | | | | | | | |
REGIONAL MALL | | | 0.6% | | | | | | | | | |
Taubman Centers, Inc. | | | | 149,525 | | | | 6,801,892 | |
| | | | | | | | | |
TOTAL SHOPPING CENTERS | | | | | | | | 77,834,656 | |
| | | | | |
TOTAL REAL ESTATE | | | | | | | | 595,889,840 | |
| | | | | |
TOTAL UNITED STATES | | | | | | | | 608,182,957 | |
| | | | | |
TOTAL COMMON STOCK
(Identified cost—$1,130,956,934) | | | | | | | | 1,183,464,231 | |
| | | | | |
SHORT-TERM INVESTMENTS | | | 1.3% | | | | | | | | | |
MONEY MARKET FUNDS | | | | | | | | | | | | |
State Street Institutional Treasury Money Market Fund, Premier Class, 2.24%d | | | | 16,086,435 | | | | 16,086,435 | |
| | | | | | | | | | | | |
TOTAL SHORT-TERM INVESTMENTS
(Identified cost—$16,086,435) | | | | | | | | 16,086,435 | |
| | | | | | | | | | | | |
TOTAL INVESTMENTSIN SECURITIES
(Identified cost—$1,147,043,369) | | | 98.8% | | | | | | | | 1,199,550,666 | |
OTHER ASSETSIN EXCESSOF LIABILITIES | | | 1.2 | | | | | | | | 14,050,554 | |
| | | | | | | | | | | | |
NET ASSETS | | | 100.0% | | | | | | | $ | 1,213,601,220 | |
| | | | | | | | | | | | |
Glossary of Portfolio Abbreviations
| | |
EUR | | Euro Currency |
REIT | | Real Estate Investment Trust |
Note: Percentages indicated are based on the net assets of the Fund.
| a | Security value is determined based on significant unobservable inputs (Level 3). |
| b | Non-income producing security. |
| c | Securities exempt from registration under Rule 144A of the Securities Act of 1933. These securities may only be resold to qualified institutional buyers. Aggregate holdings amounted to $18,190,342 which represents 1.5% of the net assets of the Fund, of which 0.0% are illiquid. |
| d | Rate quoted represents the annualizedseven-day yield. |
See accompanying notes to financial statements.
16
COHEN & STEERS GLOBAL REALTY SHARES, INC.
SCHEDULE OF INVESTMENTS—(Continued)
December 31, 2018
| | | | |
Sector Summary | | % of Net
Assets | |
Diversified | | | 26.6 | |
Residential | | | 20.0 | |
Office | | | 10.3 | |
Industrials | | | 7.8 | |
Health Care | | | 7.4 | |
Shopping Centers | | | 6.4 | |
Self Storage | | | 4.5 | |
Retail | | | 4.0 | |
Net Lease | | | 3.6 | |
Data Centers | | | 3.3 | |
Hotel | | | 2.6 | |
Other | | | 2.5 | |
Towers | | | 1.0 | |
| | | | |
| | | 100.0 | |
| | | | |
See accompanying notes to financial statements.
17
COHEN & STEERS GLOBAL REALTY SHARES, INC.
STATEMENT OF ASSETS AND LIABILITIES
December 31, 2018
| | | | |
ASSETS: | |
Investments in securities, at value (Identified cost—$1,147,043,369) | | $ | 1,199,550,666 | |
Foreign currency, at value (Identified cost—$70) | | | 69 | |
Receivable for: | | | | |
Fund shares sold | | | 14,953,002 | |
Dividends | | | 5,651,743 | |
Investment securities sold | | | 1,398,965 | |
Other assets | | | 27,281 | |
| | | | |
Total Assets | | | 1,221,581,726 | |
| | | | |
LIABILITIES: | |
Payable for: | | | | |
Fund shares redeemed | | | 5,203,352 | |
Investment securities purchased | | | 1,558,179 | |
Investment advisory fees | | | 718,880 | |
Shareholder servicing fees | | | 189,292 | |
Administration fees | | | 42,143 | |
Distribution fees | | | 5,257 | |
Directors’ fees | | | 191 | |
Other liabilities | | | 263,212 | |
| | | | |
Total Liabilities | | | 7,980,506 | |
| | | | |
NET ASSETS | | $ | 1,213,601,220 | |
| | | | |
NET ASSETS consist of: | |
Paid-in capital | | $ | 1,174,977,604 | |
Total distributable earnings/(accumulated loss) | | | 38,623,616 | |
| | | | |
| | $ | 1,213,601,220 | |
| | | | |
See accompanying notes to financial statements.
18
COHEN & STEERS GLOBAL REALTY SHARES, INC.
STATEMENT OF ASSETS AND LIABILITIES—(Continued)
December 31, 2018
| | | | |
CLASS A SHARES: | |
NET ASSETS | | $ | 68,686,360 | |
Shares issued and outstanding ($0.001 par value common stock outstanding) | | | 1,383,682 | |
| | | | |
Net asset value and redemption price per share | | $ | 49.64 | |
| | | | |
Maximum offering price per share ($49.64 ÷ 0.955)a | | $ | 51.98 | |
| | | | |
CLASS C SHARES: | |
NET ASSETS | | $ | 40,857,644 | |
Shares issued and outstanding ($0.001 par value common stock outstanding) | | | 828,173 | |
| | | | |
Net asset value and offering price per shareb | | $ | 49.33 | |
| | | | |
CLASS I SHARES: | |
NET ASSETS | | $ | 1,087,232,084 | |
Shares issued and outstanding ($0.001 par value common stock outstanding) | | | 21,801,506 | |
| | | | |
Net asset value, offering and redemption price per share | | $ | 49.87 | |
| | | | |
CLASS R SHARES: | |
NET ASSETS | | $ | 375,357 | |
Shares issued and outstanding ($0.001 par value common stock outstanding) | | | 7,507 | |
| | | | |
Net asset value, offering and redemption price per share | | $ | 50.00 | |
| | | | |
CLASS Z SHARES: | |
NET ASSETS | | $ | 16,449,775 | |
Shares issued and outstanding ($0.001 par value common stock outstanding) | | | 329,798 | |
| | | | |
Net asset value, offering and redemption price per share | | $ | 49.88 | |
| | | | |
| a | On investments of $100,000 or more, the offering price is reduced. |
| b | Redemption price per share is equal to the net asset value per share less any applicable contingent deferred sales charge of 1.00% on shares held for less than one year. |
See accompanying notes to financial statements.
19
COHEN & STEERS GLOBAL REALTY SHARES, INC.
STATEMENT OF OPERATIONS
For the Year Ended December 31, 2018
| | | | |
Investment Income: | |
Dividend income (net of $1,585,435 of foreign withholding tax) | | $ | 32,163,982 | |
| | | | |
Expenses: | |
Investment advisory fees | | | 8,228,242 | |
Shareholder servicing fees—Class A | | | 73,708 | |
Shareholder servicing fees—Class C | | | 117,053 | |
Shareholder servicing fees—Class I | | | 617,584 | |
Administration fees | | | 554,825 | |
Distribution fees—Class A | | | 184,269 | |
Distribution fees—Class C | | | 351,159 | |
Distribution fees—Class R | | | 1,912 | |
Transfer agent fees and expenses | | | 206,648 | |
Registration and filing fees | | | 169,474 | |
Custodian fees and expenses | | | 136,107 | |
Reorganization expenses | | | 128,324 | |
Professional fees | | | 95,588 | |
Shareholder reporting expenses | | | 88,181 | |
Directors’ fees and expenses | | | 63,524 | |
Litigation expense | | | 58,986 | |
Miscellaneous | | | 42,056 | |
| | | | |
Total Expenses | | | 11,117,640 | |
Reduction of Expenses (See Note 2) | | | (374,506 | ) |
| | | | |
Net Expenses | | | 10,743,134 | |
| | | | |
Net Investment Income (Loss) | | | 21,420,848 | |
| | | | |
Net Realized and Unrealized Gain (Loss): | |
Net realized gain (loss) on: | |
Investments in securities | | | 16,607,886 | |
Foreign currency transactions | | | (98,421 | ) |
| | | | |
Net realized gain (loss) | | | 16,509,465 | |
| | | | |
Net change in unrealized appreciation (depreciation) on: | |
Investments in securities | | | (60,906,539 | ) |
Foreign currency translations | | | 14,397 | |
| | | | |
Net change in unrealized appreciation (depreciation) | | | (60,892,142 | ) |
| | | | |
Net Realized and Unrealized Gain (Loss) | | | (44,382,677 | ) |
| | | | |
Net Increase (Decrease) in Net Assets Resulting from Operations | | $ | (22,961,829 | ) |
| | | | |
See accompanying notes to financial statements.
20
COHEN & STEERS GLOBAL REALTY SHARES, INC.
STATEMENT OF CHANGES IN NET ASSETS
| | | | | | | | |
| | | For the
Year Ended
December 31, 2018 | | | For the
Year Ended
December 31, 2017 | |
Change in Net Assets: | | | | | | | | |
From Operations: | | | | | | | | |
Net investment income (loss) | | $ | 21,420,848 | | | $ | 7,962,022 | |
Net realized gain (loss) | | | 16,509,465 | | | | 5,339,490 | |
Net change in unrealized appreciation (depreciation) | | | (60,892,142 | ) | | | 46,262,125 | |
| | | | | | | | |
Net increase (decrease) in net assets resulting from operations | | | (22,961,829 | ) | | | 59,563,637 | |
| | | | | | | | |
Distributions to Shareholders:a | | | | | | | | |
Class A | | | (2,494,069 | ) | | | (1,327,020 | ) |
Class C | | | (1,265,515 | ) | | | (950,516 | ) |
Class I | | | (32,252,825 | ) | | | (11,490,618 | ) |
Class R | | | (12,511 | ) | | | (4,740 | ) |
Class Z | | | (328,034 | ) | | | (11,537 | ) |
Tax Return of Capital to Shareholders: | | | | | | | | |
Class A | | | (37,573 | ) | | | — | |
Class C | | | (24,013 | ) | | | — | |
Class I | | | (485,602 | ) | | | — | |
Class R | | | (194 | ) | | | — | |
Class Z | | | (3,861 | ) | | | — | |
| | | | | | | | |
Total distributions | | | (36,904,197 | ) | | | (13,784,431 | ) |
| | | | | | | | |
Capital Stock Transactions: | | | | | | | | |
Increase (decrease) in net assets from Fund share transactions | | | 663,405,143 | b | | | 125,447,594 | |
| | | | | | | | |
Total increase (decrease) in net assets | | | 603,539,117 | | | | 171,226,800 | |
Net Assets: | | | | | | | | |
Beginning of year | | | 610,062,103 | | | | 438,835,303 | |
| | | | | | | | |
End of year | | $ | 1,213,601,220 | | | $ | 610,062,103 | |
| | | | | | | | |
See accompanying notes to financial statements.
21
COHEN & STEERS GLOBAL REALTY SHARES, INC.
STATEMENT OF CHANGES IN NET ASSETS—(Continued)
| a | Distributions to shareholders from net investment income and net realized gain for the year ended December 31, 2017 have been reclassified to distributions to shareholders to reflect required amendments to RegulationS-X and to conform to the current year presentation. The amounts reported within the December 31, 2017 annual report were as follows: |
| | | | |
| | | For the
Year Ended
December 31, 2017 | |
Distributions to Shareholders from: | | | | |
Net investment income: | | | | |
Class A | | $ | (971,556 | ) |
Class C | | | (593,894 | ) |
Class I | | | (9,030,619 | ) |
Class R | | | (3,909 | ) |
Class Z | | | (9,476 | ) |
Net realized gain: | | | | |
Class A | | | (355,464 | ) |
Class C | | | (356,622 | ) |
Class I | | | (2,459,999 | ) |
Class R | | | (831 | ) |
Class Z | | | (2,061 | ) |
| | | | |
Total distributions to shareholders | | $ | (13,784,431 | ) |
| | | | |
See accompanying notes to financial statements.
22
COHEN & STEERS GLOBAL REALTY SHARES, INC.
FINANCIAL HIGHLIGHTS
The following tables include selected data for a share outstanding throughout each year and otherperformance information derived from the financial statements. They should be read in conjunction with the financial statements and notes thereto.
| | | | | | | | | | | | | | | | | | | | |
| | | Class A | |
| | | For the Year Ended December 31, | |
Per Share Operating Performance: | | 2018 | | | 2017 | | | 2016 | | | 2015 | | | 2014 | |
Net asset value, beginning of year | | | $53.63 | | | | $48.89 | | | | $50.37 | | | | $50.46 | | | | $45.08 | |
| | | | | | | | | | | | | | | | | | | | |
Income (loss) from investment operations: | |
| | | | | |
Net investment income (loss)a | | | 0.80 | | | | 0.73 | | | | 0.76 | | | | 0.49 | | | | 0.87 | b |
Net realized and unrealized gain (loss) | | | (2.99 | )c | | | 5.34 | | | | 0.96 | | | | 0.58 | | | | 5.22 | |
| | | | | | | | | | | | | | | | | | | | |
Total from investment operations | | | (2.19 | ) | | | 6.07 | | | | 1.72 | | | | 1.07 | | | | 6.09 | |
| | | | | | | | | | | | | | | | | | | | |
Less dividends and distributions to shareholders from: | |
| | | | | |
Net investment income | | | (1.33 | ) | | | (0.98 | ) | | | (1.73 | ) | | | (1.16 | ) | | | (0.71 | ) |
Net realized gain | | | (0.44 | ) | | | (0.35 | ) | | | (1.47 | ) | | | — | | | | — | |
Tax return of capital | | | (0.03 | ) | | | — | | | | — | | | | — | | | | — | |
| | | | | | | | | | | | | | | | | | | | |
Total dividends and distributions to shareholders | | | (1.80 | ) | | | (1.33 | ) | | | (3.20 | ) | | | (1.16 | ) | | | (0.71 | ) |
| | | | | | | | | | | | | | | | | | | | |
Net increase (decrease) in net asset value | | | (3.99 | ) | | | 4.74 | | | | (1.48 | ) | | | (0.09 | ) | | | 5.38 | |
| | | | | | | | | | | | | | | | | | | | |
Net asset value, end of year | | | $49.64 | | | | $53.63 | | | | $48.89 | | | | $50.37 | | | | $50.46 | |
| | | | | | | | | | | | | | | | | | | | |
| | | | | |
| | | | | | | | | | | | | | | | | | | | | |
Total returnd,e | | | –4.20 | %c | | | 12.53 | % | | | 3.40 | % | | | 2.18 | % | | | 13.54 | % |
| | | | | | | | | | | | | | | | | | | | |
| | | | | |
| | | | | | | | | | | | | | | | | | | | | |
See accompanying notes to financial statements.
23
COHEN & STEERS GLOBAL REALTY SHARES, INC.
FINANCIAL HIGHLIGHTS—(Continued)
| | | | | | | | | | | | | | | | | | | | |
| | | Class A | |
| | | For the Year Ended December 31, | |
Ratios/Supplemental Data: | | 2018 | | | 2017 | | | 2016 | | | 2015 | | | 2014 | |
Net assets, end of year (in millions) | | | $68.7 | | | | $64.6 | | | | $51.3 | | | | $54.6 | | | | $73.2 | |
| | | | | | | | | | | | | | | | | | | | |
Ratios to average daily net assets: | |
| | | | | |
Expenses (before expense reduction) | | | 1.26 | %c,f | | | 1.31 | %f | | | 1.40 | % | | | 1.42 | % | | | 1.41 | % |
| | | | | | | | | | | | | | | | | | | | |
Expenses (net of expense reduction) | | | 1.26 | %c,f | | | 1.31 | %f | | | 1.39 | % | | | 1.41 | % | | | 1.40 | % |
| | | | | | | | | | | | | | | | | | | | |
Net investment income (loss) (before expense reduction) | | | 1.54 | % | | | 1.42 | % | | | 1.47 | % | | | 0.95 | % | | | 1.78 | % |
| | | | | | | | | | | | | | | | | | | | |
Net investment income (loss) (net of expense reduction) | | | 1.54 | % | | | 1.42 | % | | | 1.48 | % | | | 0.96 | % | | | 1.79 | % |
| | | | | | | | | | | | | | | | | | | | |
Portfolio turnover rate | | | 76 | % | | | 75 | % | | | 104 | % | | | 82 | % | | | 105 | % |
| | | | | | | | | | | | | | | | | | | | |
| a | Calculation based on average shares outstanding. |
| b | 23.6% of gross income was attributable to dividends paid by Westfield Corp. |
| c | During the reporting period the Fund settled legal claims against an issuer of securities previously held by the Fund. As a result, the net realized and unrealized gain (loss) on investments per share includes proceeds received from the settlement. Without these proceeds the net realized and unrealized gain (loss) on investments per share would have been $(3.01). Additionally, the expense ratio includes extraordinary expenses related to the direct action. Without these expenses, the ratio of expenses to the average daily net assets would have been 1.25%. Excluding the proceeds from and expenses relating to the settlements, the total return (before expense reduction and net of expense reduction) would have been –4.22%. |
| d | Return assumes the reinvestment of all dividends and distributions at net asset value. |
| e | Does not reflect sales charges, which would reduce return. |
| f | Includes extraordinary expenses, approved by the Board of Directors pursuant to the Fund’s expense reimbursement agreement, related to the reorganization discussed further in Note 6. Without these expenses, the ratio of expenses to average daily net assets (before expense reduction and net of expense reduction) would have been 1.24% for the year ended December 31, 2018 and 1.30% for the year ended December 31, 2017. |
See accompanying notes to financial statements.
24
COHEN & STEERS GLOBAL REALTY SHARES, INC.
FINANCIAL HIGHLIGHTS—(Continued)
| | | | | | | | | | | | | | | | | | | | |
| | | Class C | |
| | | For the Year Ended December 31, | |
Per Share Operating Performance: | | 2018 | | | 2017 | | | 2016 | | | 2015 | | | 2014 | |
Net asset value, beginning of year | | | $53.31 | | | | $48.56 | | | | $50.04 | | | | $50.13 | | | | $44.82 | |
| | | | | | | | | | | | | | | | | | | | |
Income (loss) from investment operations: | |
| | | | | |
Net investment income (loss)a | | | 0.42 | | | | 0.34 | | | | 0.40 | | | | 0.18 | | | | 0.54 | b |
Net realized and unrealized gain (loss) | | | (2.95 | )c | | | 5.36 | | | | 0.96 | | | | 0.58 | | | | 5.18 | |
| | | | | | | | | | | | | | | | | | | | |
Total from investment operations | | | (2.53 | ) | | | 5.70 | | | | 1.36 | | | | 0.76 | | | | 5.72 | |
| | | | | | | | | | | | | | | | | | | | |
Less dividends and distributions to shareholders from: | |
| | | | | |
Net investment income | | | (0.98 | ) | | | (0.60 | ) | | | (1.37 | ) | | | (0.85 | ) | | | (0.41 | ) |
Net realized gain | | | (0.44 | ) | | | (0.35 | ) | | | (1.47 | ) | | | — | | | | — | |
Tax return of capital | | | (0.03 | ) | | | — | | | | — | | | | — | | | | — | |
| | | | | | | | | | | | | | | | | | | | |
Total dividends and distributions to shareholders | | | (1.45 | ) | | | (0.95 | ) | | | (2.84 | ) | | | (0.85 | ) | | | (0.41 | ) |
| | | | | | | | | | | | | | | | | | | | |
Net increase (decrease) in net asset value | | | (3.98 | ) | | | 4.75 | | | | (1.48 | ) | | | (0.09 | ) | | | 5.31 | |
| | | | | | | | | | | | | | | | | | | | |
Net asset value, end of year | | | $49.33 | | | | $53.31 | | | | $48.56 | | | | $50.04 | | | | $50.13 | |
| | | | | | | | | | | | | | | | | | | | |
| | | | | |
| | | | | | | | | | | | | | | | | | | | | |
Total returnd,e | | | –4.84 | %c | | | 11.83 | % | | | 2.71 | % | | | 1.54 | % | | | 12.78 | % |
| | | | | | | | | | | | | | | | | | | | |
| | | | | |
| | | | | | | | | | | | | | | | | | | | | |
See accompanying notes to financial statements.
25
COHEN & STEERS GLOBAL REALTY SHARES, INC.
FINANCIAL HIGHLIGHTS—(Continued)
| | | | | | | | | | | | | | | | | | | | |
| | | Class C | |
| | | For the Year Ended December 31, | |
Ratios/Supplemental Data: | | 2018 | | | 2017 | | | 2016 | | | 2015 | | | 2014 | |
Net assets, end of year (in millions) | | | $40.9 | | | | $51.6 | | | | $60.5 | | | | $78.0 | | | | $82.2 | |
| | | | | | | | | | | | | | | | | | | | |
Ratios to average daily net assets: | |
| | | | | |
Expenses (before expense reduction) | | | 1.91 | %c,f | | | 1.96 | %f | | | 2.05 | % | | | 2.07 | % | | | 2.06 | % |
| | | | | | | | | | | | | | | | | | | | |
Expenses (net of expense reduction) | | | 1.91 | %c,f | | | 1.96 | %f | | | 2.04 | % | | | 2.06 | % | | | 2.05 | % |
| | | | | | | | | | | | | | | | | | | | |
Net investment income (loss) (before expense reduction) | | | 0.81 | % | | | 0.66 | % | | | 0.77 | % | | | 0.34 | % | | | 1.12 | % |
| | | | | | | | | | | | | | | | | | | | |
Net investment income (loss) (net of expense reduction) | | | 0.81 | % | | | 0.66 | % | | | 0.78 | % | | | 0.35 | % | | | 1.13 | % |
| | | | | | | | | | | | | | | | | | | | |
Portfolio turnover rate | | | 76 | % | | | 75 | % | | | 104 | % | | | 82 | % | | | 105 | % |
| | | | | | | | | | | | | | | | | | | | |
| a | Calculation based on average shares outstanding. |
| b | 23.6% of gross income was attributable to dividends paid by Westfield Corp. |
| c | During the reporting period the Fund settled legal claims against an issuer of securities previously held by the Fund. As a result, the net realized and unrealized gain (loss) on investments per share includes proceeds received from the settlement. Without these proceeds the net realized and unrealized gain (loss) on investments per share would have been $(2.97). Additionally, the expense ratio includes extraordinary expenses related to the direct action. Without these expenses, the ratio of expenses to the average daily net assets would have been 1.90%. Excluding the proceeds from and expenses relating to the settlements, the total return (before expense reduction and net of expense reduction) would have been –4.86%. |
| d | Return assumes the reinvestment of all dividends and distributions at net asset value. |
| e | Does not reflect sales charges, which would reduce return. |
| f | Includes extraordinary expenses, approved by the Board of Directors pursuant to the Fund’s expense reimbursement agreement, related to the reorganization discussed further in Note 6. Without these expenses, the ratio of expenses to average daily net assets (before expense reduction and net of expense reduction) would have been 1.89% for the year ended December 31, 2018 and 1.95% for the year ended December 31, 2017. |
See accompanying notes to financial statements.
26
COHEN & STEERS GLOBAL REALTY SHARES, INC.
FINANCIAL HIGHLIGHTS—(Continued)
| | | | | | | | | | | | | | | | | | | | |
| | | Class I | |
| | | For the Year Ended December 31, | |
Per Share Operating Performance: | | 2018 | | | 2017 | | | 2016 | | | 2015 | | | 2014 | |
Net asset value, beginning of year | | | $53.87 | | | | $49.08 | | | | $50.56 | | | | $50.66 | | | | $45.26 | |
| | | | | | | | | | | | | | | | | | | | |
Income (loss) from investment operations: | |
| | | | | |
Net investment income (loss)a | | | 1.08 | | | | 0.91 | | | | 0.98 | | | | 0.70 | | | | 1.01 | b |
Net realized and unrealized gain (loss) | | | (3.11 | )c | | | 5.38 | | | | 0.92 | | | | 0.55 | | | | 5.28 | |
| | | | | | | | | | | | | | | | | | | | |
Total from investment operations | | | (2.03 | ) | | | 6.29 | | | | 1.90 | | | | 1.25 | | | | 6.29 | |
| | | | | | | | | | | | | | | | | | | | |
Less dividends and distributions to shareholders from: | |
| | | | | |
Net investment income | | | (1.50 | ) | | | (1.15 | ) | | | (1.91 | ) | | | (1.35 | ) | | | (0.89 | ) |
Net realized gain | | | (0.44 | ) | | | (0.35 | ) | | | (1.47 | ) | | | — | | | | — | |
Tax return of capital | | | (0.03 | ) | | | — | | | | — | | | | — | | | | — | |
| | | | | | | | | | | | | | | | | | | | |
Total dividends and distributions to shareholders | | | (1.97 | ) | | | (1.50 | ) | | | (3.38 | ) | | | (1.35 | ) | | | (0.89 | ) |
| | | | | | | | | | | | | | | | | | | | |
Net increase (decrease) in net asset value | | | (4.00 | ) | | | 4.79 | | | | (1.48 | ) | | | (0.10 | ) | | | 5.40 | |
| | | | | | | | | | | | | | | | | | | | |
Net asset value, end of year | | | $49.87 | | | | $53.87 | | | | $49.08 | | | | $50.56 | | | | $50.66 | |
| | | | | | | | | | | | | | | | | | | | |
| | | | | |
| | | | | | | | | | | | | | | | | | | | | |
Total returnd | | | –3.89 | %c | | | 12.95 | % | | | 3.75 | % | | | 2.54 | % | | | 13.93 | % |
| | | | | | | | | | | | | | | | | | | | |
| | | | | |
| | | | | | | | | | | | | | | | | | | | | |
See accompanying notes to financial statements.
27
COHEN & STEERS GLOBAL REALTY SHARES, INC.
FINANCIAL HIGHLIGHTS—(Continued)
| | | | | | | | | | | | | | | | | | | | |
| | | Class I | |
| | | For the Year Ended December 31, | |
Ratios/Supplemental Data: | | 2018 | | | 2017 | | | 2016 | | | 2015 | | | 2014 | |
Net assets, end of year (in millions) | | | $1,087.2 | | | | $492.8 | | | | $326.7 | | | | $295.0 | | | | $292.0 | |
| | | | | | | | | | | | | | | | | | | | |
Ratios to average daily net assets: | |
| | | | | |
Expenses (before expense reduction) | | | 0.96 | %c,e | | | 1.02 | %e | | | 1.11 | % | | | 1.12 | % | | | 1.14 | % |
| | | | | | | | | | | | | | | | | | | | |
Expenses (net of expense reduction) | | | 0.93 | %c,e | | | 0.96 | %e | | | 1.04 | % | | | 1.06 | % | | | 1.05 | % |
| | | | | | | | | | | | | | | | | | | | |
Net investment income (loss) (before expense reduction) | | | 2.03 | % | | | 1.69 | % | | | 1.83 | % | | | 1.31 | % | | | 2.00 | % |
| | | | | | | | | | | | | | | | | | | | |
Net investment income (loss) (net of expense reduction) | | | 2.06 | % | | | 1.75 | % | | | 1.90 | % | | | 1.37 | % | | | 2.09 | % |
| | | | | | | | | | | | | | | | | | | | |
Portfolio turnover rate | | | 76 | % | | | 75 | % | | | 104 | % | | | 82 | % | | | 105 | % |
| | | | | | | | | | | | | | | | | | | | |
| a | Calculation based on average shares outstanding. |
| b | 23.6% of gross income was attributable to dividends paid by Westfield Corp. |
| c | During the reporting period the Fund settled legal claims against an issuer of securities previously held by the Fund. As a result, the net realized and unrealized gain (loss) on investments per share includes proceeds received from the settlement. Without these proceeds the net realized and unrealized gain (loss) on investments per share would have been $(3.13). Additionally, the expense ratio includes extraordinary expenses related to the direct action. Without these expenses, the ratio of expenses to the average daily net assets would have been 0.95% and 0.92%, respectively. Excluding the proceeds from and expenses relating to the settlements, the total return (before expense reduction and net of expense reduction) would have been –3.91%. |
| d | Return assumes the reinvestment of all dividends and distributions at net asset value. |
| e | Includes extraordinary expenses, approved by the Board of Directors pursuant to the Fund’s expense reimbursement agreement, related to the reorganization discussed further in Note 6. Without these expenses, the ratio of expenses to average daily net assets (before expense reduction and net of expense reduction) would have been 0.94% and 0.91%, respectively, for year ended December 31, 2018 and 1.01% and 0.95%, respectively, for the year ended December 31, 2017. |
See accompanying notes to financial statements.
28
COHEN & STEERS GLOBAL REALTY SHARES, INC.
FINANCIAL HIGHLIGHTS—(Continued)
| | | | | | | | | | | | | | | | | | | | |
| | | Class R | |
| | | For the Year Ended December 31, | | | For the Period
October 1, 2014a
through
December 31,
2014 | |
Per Share Operating Performance: | | 2018 | | | 2017 | | | 2016 | | | 2015 | |
Net asset value, beginning of period | | | $54.01 | | | | $49.27 | | | | $50.76 | | | | $50.66 | | | | $47.36 | |
| | | | | | | | | | | | | | | | | | | | |
Income (loss) from investment operations: | |
| | | | | |
Net investment income (loss)b | | | 0.73 | | | | 0.78 | | | | 0.82 | | | | 0.55 | | | | 0.07 | |
Net realized and unrealized gain (loss) | | | (3.01 | )c | | | 5.26 | | | | 0.83 | | | | 0.55 | | | | 3.54 | |
| | | | | | | | | | | | | | | | | | | | |
Total from investment operations | | | (2.28 | ) | | | 6.04 | | | | 1.65 | | | | 1.10 | | | | 3.61 | |
| | | | | | | | | | | | | | | | | | | | |
Less dividends and distributions to shareholders from: | | | | | | | | | | | | | | | | | | | | |
| | | | | |
Net investment income | | | (1.26 | ) | | | (0.95 | ) | | | (1.67 | ) | | | (1.00 | ) | | | (0.31 | ) |
Net realized gain | | | (0.44 | ) | | | (0.35 | ) | | | (1.47 | ) | | | — | | | | — | |
Tax return of capital | | | (0.03 | ) | | | — | | | | — | | | | — | | | | — | |
| | | | | | | | | | | | | | | | | | | | |
Total dividends and distributions to shareholders | | | (1.73 | ) | | | (1.30 | ) | | | (3.14 | ) | | | (1.00 | ) | | | (0.31 | ) |
| | | | | | | | | | | | | | | | | | | | |
Net increase (decrease) in net asset value | | | (4.01 | ) | | | 4.74 | | | | (1.49 | ) | | | 0.10 | | | | 3.30 | |
| | | | | | | | | | | | | | | | | | | | |
Net asset value, end of period | | | $50.00 | | | | $54.01 | | | | $49.27 | | | | $50.76 | | | | $50.66 | |
| | | | | | | | | | | | | | | | | | | | |
| | | | | |
| | | | | | | | | | | | | | | | | | | | | |
Total returnd | | | –4.34 | %c | | | 12.37 | % | | | 3.25 | % | | | 2.23 | % | | | 7.63 | %e |
| | | | | | | | | | | | | | | | | | | | |
|
| | |
See accompanying notes to financial statements.
29
COHEN & STEERS GLOBAL REALTY SHARES, INC.
FINANCIAL HIGHLIGHTS—(Continued)
| | | | | | | | | | | | | | | | | | | | |
| | | Class R | |
| | | For the Year Ended December 31, | | | For the Period
October 1, 2014a
through
December 31,
2014 | |
Ratios/Supplemental Data: | | 2018 | | | 2017 | | | 2016 | | | 2015 | |
Net assets, end of period (in 000s) | | | $375.4 | | | | $374.2 | | | | $108.7 | | | | $22.3 | | | | $11.0 | |
| | | | | | | | | | | | | | | | | | | | |
Ratios to average daily net assets: | |
| | | | | |
Expenses (before expense reduction) | | | 1.41 | %c,f | | | 1.46 | %f | | | 1.55 | % | | | 1.54 | % | | | 1.57 | %g |
| | | | | | | | | | | | | | | | | | | | |
Expenses (net of expense reduction) | | | 1.41 | %c,f | | | 1.46 | %f | | | 1.54 | % | | | 1.54 | % | | | 1.55 | %g |
| | | | | | | | | | | | | | | | | | | | |
Net investment income (loss) (before expense reduction) | | | 1.38 | % | | | 1.50 | % | | | 1.55 | % | | | 1.07 | % | | | 0.58 | %g |
| | | | | | | | | | | | | | | | | | | | |
Net investment income (loss) (net of expense reduction) | | | 1.38 | % | | | 1.50 | % | | | 1.56 | % | | | 1.07 | % | | | 0.60 | %g |
| | | | | | | | | | | | | | | | | | | | |
Portfolio turnover rate | | | 76 | % | | | 75 | % | | | 104 | % | | | 82 | % | | | 105 | %e |
| | | | | | | | | | | | | | | | | | | | |
| b | Calculation based on average shares outstanding. |
| c | During the reporting period the Fund settled legal claims against an issuer of securities previously held by the Fund. As a result, the net realized and unrealized gain (loss) on investments per share includes proceeds received from the settlement. Without these proceeds the net realized and unrealized gain (loss) on investments per share would have been $(3.02). Additionally, the expense ratio includes extraordinary expenses related to the direct action. Without these expenses, the ratio of expenses to the average daily net assets would have been 1.40%. Excluding the proceeds from and expenses relating to the settlements, the total return (before expense reduction and net of expense reduction) would have been –4.36%. |
| d | Return assumes the reinvestment of all dividends and distributions at net asset value. |
| f | Includes extraordinary expenses, approved by the Board of Directors pursuant to the Fund’s expense reimbursement agreement, related to the reorganization discussed further in Note 6. Without these expenses, the ratio of expenses to average daily net assets (before expense reduction and net of expense reduction) would have been 1.39% for the year ended December 31, 2018 and 1.45% for the year ended December 31, 2017. |
See accompanying notes to financial statements.
30
COHEN & STEERS GLOBAL REALTY SHARES, INC.
FINANCIAL HIGHLIGHTS—(Continued)
| | | | | | | | | | | | | | | | | | | | |
| | | Class Z | |
| | | For the Year Ended December 31, | | | For the Period
October 1, 2014a
through
December 31,
2014 | |
Per Share Operating Performance: | | 2018 | | | 2017 | | | 2016 | | | 2015 | |
Net asset value, beginning of period | | | $53.88 | | | | $49.09 | | | | $50.57 | | | | $50.66 | | | | $47.36 | |
| | | | | | | | | | | | | | | | | | | | |
Income (loss) from investment operations: | | | | | | | | | | | | | | | | | | | | |
| | | | | |
Net investment income (loss)b | | | 1.13 | | | | 0.95 | | | | 1.03 | | | | 0.70 | | | | 0.13 | |
Net realized and unrealized gain (loss) | | | (3.14 | )c | | | 5.34 | | | | 0.87 | | | | 0.56 | | | | 3.55 | |
| | | | | | | | | | | | | | | | | | | | |
Total from investment operations | | | (2.01 | ) | | | 6.29 | | | | 1.90 | | | | 1.26 | | | | 3.68 | |
| | | | | | | | | | | | | | | | | | | | |
Less dividends and distributions to shareholders from: | | | | | | | | | | | | | | | | | | | | |
Net investment income | | | (1.52 | ) | | | (1.15 | ) | | | (1.91 | ) | | | (1.35 | ) | | | (0.38 | ) |
Net realized gain | | | (0.44 | ) | | | (0.35 | ) | | | (1.47 | ) | | | — | | | | — | |
Tax return of capital | | | (0.03 | ) | | | — | | | | — | | | | — | | | | — | |
| | | | | | | | | | | | | | | | | | | | |
Total dividends and distributions to shareholders | | | (1.99 | ) | | | (1.50 | ) | | | (3.38 | ) | | | (1.35 | ) | | | (0.38 | ) |
| | | | | | | | | | | | | | | | | | | | |
Net increase (decrease) in net asset value | | | (4.00 | ) | | | 4.79 | | | | (1.48 | ) | | | (0.09 | ) | | | 3.30 | |
| | | | | | | | | | | | | | | | | | | | |
Net asset value, end of period | | | $49.88 | | | | $53.88 | | | | $49.09 | | | | $50.57 | | | | $50.66 | |
| | | | | | | | | | | | | | | | | | | | |
|
| | |
Total returnd | | | –3.86 | %c | | | 12.96 | % | | | 3.75 | % | | | 2.56 | % | | | 7.77 | %e |
| | | | | | | | | | | | | | | | | | | | |
| | | | | |
| | | | | | | | | | | | | | | | | | | | | |
| |
See accompanying notes to financial statements.
31
COHEN & STEERS GLOBAL REALTY SHARES, INC.
FINANCIAL HIGHLIGHTS—(Continued)
| | | | | | | | | | | | | | | | | | | | |
| | | Class Z | |
| | | For the Year Ended December 31, | | | For the Period
October 1, 2014a
through
December 31,
2014 | |
Ratios/Supplemental Data: | | 2018 | | | 2017 | | | 2016 | | | 2015 | |
Net assets, end of period (in 000s) | | | $16,449.8 | | | | $607.3 | | | | $258.3 | | | | $10.7 | | | | $11.0 | |
| | | | | | | | | | | | | | | | | | | | |
Ratios to average daily net assets: | |
| | | | | |
Expenses (before expense reduction) | | | 0.90 | %c,f | | | 0.96 | %f | | | 1.05 | % | | | 1.07 | % | | | 1.07 | %g |
| | | | | | | | | | | | | | | | | | | | |
Expenses (net of expense reduction) | | | 0.90 | %c,f | | | 0.96 | %f | | | 1.04 | % | | | 1.06 | % | | | 1.05 | %g |
| | | | | | | | | | | | | | | | | | | | |
Net investment income (loss) (before expense reduction) | | | 2.17 | % | | | 1.83 | % | | | 1.94 | % | | | 1.36 | % | | | 1.03 | %g |
| | | | | | | | | | | | | | | | | | | | |
Net investment income (loss) (net of expense reduction) | | | 2.17 | % | | | 1.83 | % | | | 1.95 | % | | | 1.37 | % | | | 1.05 | %g |
| | | | | | | | | | | | | | | | | | | | |
Portfolio turnover rate | | | 76 | % | | | 75 | % | | | 104 | % | | | 82 | % | | | 105 | %e |
| | | | | | | | | | | | | | | | | | | | |
| b | Calculation based on average shares outstanding. |
| c | During the reporting period the Fund settled legal claims against an issuer of securities previously held by the Fund. As a result, the net realized and unrealized gain (loss) on investments per share includes proceeds received from the settlement. Without these proceeds the net realized and unrealized gain (loss) on investments per share would have been $(3.15). Additionally, the expense ratio includes extraordinary expenses related to the direct action. Without these expenses, the ratio of expenses to the average daily net assets would have been 0.89%. Excluding the proceeds from and expenses relating to the settlements, the total return (before expense reduction and net of expense reduction) would have been –3.88%. |
| d | Return assumes the reinvestment of all dividends and distributions at net asset value. |
| f | Includes extraordinary expenses, approved by the Board of Directors pursuant to the Fund’s expense reimbursement agreement, related to the reorganization discussed further in Note 6. Without these expenses, the ratio of expenses to average daily net assets (before expense reduction and net of expense reduction) would have been 0.88% for the year ended December 31, 2018 and 0.95% for the year ended December 31, 2017. |
See accompanying notes to financial statements.
32
COHEN & STEERS GLOBAL REALTY SHARES, INC.
NOTES TO FINANCIAL STATEMENTS
Note 1. Organization and Significant Accounting Policies
Cohen & Steers Global Realty Shares, Inc. (the Fund) was incorporated under the laws of the State of Maryland on February 14, 1997 and was registered under the Investment Company Act of 1940 (the 1940 Act) as anon-diversified,open-end management investment company. On December 17, 2018, the Fund’s diversification status under the 1940 Act changed from a non-diversified fund to a diversified fund. The Fund’s investment objective is total return. The authorized shares of the Fund are divided into seven classes designated Class A, C, F, I, R, T and Z shares. Each of the Fund’s shares has equal dividend, liquidation and voting rights (except for matters relating to distribution and shareholder servicing of such shares). Class F shares and Class T shares are currently not available for purchase.
The following is a summary of significant accounting policies consistently followed by the Fund in the preparation of its financial statements. The Fund is an investment company and, accordingly, follows the investment company accounting and reporting guidance of the Financial Accounting Standards Board Accounting Standards Codification (ASC) Topic 946—Investment Companies. The accounting policies of the Fund are in conformity with accounting principles generally accepted in the United States of America (GAAP). The preparation of the financial statements in accordance with GAAP requires management to make estimates and assumptions that affect the reported amounts of assets and liabilities at the date of the financial statements and the reported amounts of income and expenses during the reporting period. Actual results could differ from those estimates.
Portfolio Valuation: Investments in securities that are listed on the New York Stock Exchange (NYSE) are valued, except as indicated below, at the last sale price reflected at the close of the NYSE on the business day as of which such value is being determined. If there has been no sale on such day, the securities are valued at the mean of the closing bid and ask prices on such day or, if no ask price is available, at the bid price.
Securities not listed on the NYSE but listed on other domestic or foreign securities exchanges (including NASDAQ) are valued in a similar manner. Securities traded on more than one securities exchange are valued at the last sale price reflected at the close of the exchange representing the principal market for such securities on the business day as of which such value is being determined. If after the close of a foreign market, but prior to the close of business on the day the securities are being valued, market conditions change significantly, certainnon-U.S. equity holdings may be fair valued pursuant to procedures established by the Board of Directors.
Readily marketable securities traded in theover-the-counter (OTC) market, including listed securities whose primary market is believed by Cohen & Steers Capital Management, Inc. (the investment advisor) to be OTC, are valued on the basis of prices provided by a third-party pricing service or third-party broker-dealers when such prices are believed by the investment advisor, pursuant to delegation by the Board of Directors, to reflect the fair value of such securities.
Short-term debt securities with a maturity date of 60 days or less are valued at amortized cost, which approximates fair value. Investments inopen-end mutual funds are valued at net asset value (NAV).
The policies and procedures approved by the Fund’s Board of Directors delegate authority to make fair value determinations to the investment advisor, subject to the oversight of the Board of Directors. The investment advisor has established a valuation committee (Valuation Committee) to
33
COHEN & STEERS GLOBAL REALTY SHARES, INC.
NOTES TO FINANCIAL STATEMENTS—(Continued)
administer, implement and oversee the fair valuation process according to the policies and procedures approved annually by the Board of Directors. Among other things, these procedures allow the Fund to utilize independent pricing services, quotations from securities and financial instrument dealers and other market sources to determine fair value.
Securities for which market prices are unavailable, or securities for which the investment advisor determines that the bid and/or ask price or a counterparty valuation does not reflect market value, will be valued at fair value, as determined in good faith by the Valuation Committee, pursuant to procedures approved by the Fund’s Board of Directors. Circumstances in which market prices may be unavailable include, but are not limited to, when trading in a security is suspended, the exchange on which the security is traded is subject to an unscheduled close or disruption or material events occur after the close of the exchange on which the security is principally traded. In these circumstances, the Fund determines fair value in a manner that fairly reflects the market value of the security on the valuation date based on consideration of any information or factors it deems appropriate. These may include, but are not limited to, recent transactions in comparable securities, information relating to the specific security and developments in the markets.
Foreign equity fair value pricing procedures utilized by the Fund may cause certainnon-U.S. equity holdings to be fair valued on the basis of fair value factors provided by a pricing service to reflect any significant market movements between the time the Fund values such securities and the earlier closing of foreign markets.
The Fund’s use of fair value pricing may cause the NAV of Fund shares to differ from the NAV that would be calculated using market quotations. Fair value pricing involves subjective judgments and it is possible that the fair value determined for a security may be materially different than the value that could be realized upon the sale of that security.
Fair value is defined as the price that the Fund would expect to receive upon the sale of an investment or expect to pay to transfer a liability in an orderly transaction with an independent buyer in the principal market or, in the absence of a principal market, the most advantageous market for the investment or liability. The hierarchy of inputs that are used in determining the fair value of the Fund’s investments is summarized below.
| | • | | Level 1—quoted prices in active markets for identical investments |
| | • | | Level 2—other significant observable inputs (including quoted prices for similar investments, interest rates, credit risk, etc.) |
| | • | | Level 3—significant unobservable inputs (including the Fund’s own assumptions in determining the fair value of investments) |
The inputs or methodology used for valuing investments may or may not be an indication of the risk associated with those investments. Changes in valuation techniques may result in transfers into or out of an assigned level within the disclosure hierarchy.
34
COHEN & STEERS GLOBAL REALTY SHARES, INC.
NOTES TO FINANCIAL STATEMENTS—(Continued)
The following is a summary of the inputs used as of December 31, 2018 in valuing the Fund’s investments carried at value:
| | | | | | | | | | | | | | | | |
| | | Total | | | Quoted Prices
in Active
Markets for
Identical
Investments
(Level 1) | | | Other
Significant
Observable
Inputs
(Level 2) | | | Significant
Unobservable
Inputs
(Level 3) | |
Common Stock: | | | | | | | | | | | | | | | | |
Australia | | $ | 47,020,557 | | | $ | — | | | $ | 47,020,557 | | | $ | 0 | a |
Belgium | | | 3,885,224 | | | | — | | | | 3,885,224 | | | | — | |
Brazil | | | 7,331,627 | | | | — | | | | 7,331,627 | | | | — | |
France | | | 20,326,967 | | | | — | | | | 20,326,967 | | | | — | |
Germany | | | 45,682,913 | | | | — | | | | 45,682,913 | | | | — | |
Hong Kong | | | 128,192,010 | | | | — | | | | 128,192,010 | | | | — | |
Japan | | | 161,067,980 | | | | — | | | | 161,067,980 | | | | — | |
Norway | | | 11,800,025 | | | | — | | | | 11,800,025 | | | | — | |
Singapore | | | 5,768,570 | | | | — | | | | 5,768,570 | | | | — | |
Spain | | | 23,915,903 | | | | — | | | | 23,915,903 | | | | — | |
Sweden | | | 18,762,519 | | | | — | | | | 18,762,519 | | | | — | |
United Kingdom | | | 58,840,988 | | | | 6,620,195 | | | | 52,220,793 | | | | — | |
Other Countries | | | 650,868,948 | | | | 650,868,948 | | | | — | | | | — | |
Short-Term Investments | | | 16,086,435 | | | | — | | | | 16,086,435 | | | | — | |
| | | | | | | | | | | | | | | | |
Total Investments in Securitiesb | | $ | 1,199,550,666 | | | $ | 657,489,143 | | | $ | 542,061,523 | | | $ | 0 | |
| | | | | | | | | | | | | | | | |
| a | BGP Holdings PLC was acquired via a spinoff and has been fair valued at $0, by the Valuation Committee, pursuant to the Fund’s fair value procedures and classified as a Level 3 security. |
| b | Portfolio holdings are disclosed individually on the Schedule of Investments. |
Security Transactions, Investment Income and Expense Allocations: Security transactions are recorded on trade date. Realized gains and losses on investments sold are recorded on the basis of identified cost. Interest income, which includes the amortization of premiums and accretion of discounts, is recorded on the accrual basis. Dividend income is recorded on theex-dividend date, except for certain dividends on foreign securities, which are recorded as soon as the Fund is informed after theex-dividend date. Distributions from REITs are recorded as ordinary income, net realized capital gain or return of capital based on information reported by the REITs and management’s estimates of such amounts based on historical information. These estimates are adjusted when the actual source of distributions is disclosed by the REITs and actual amounts may differ from the estimated amounts. Income, expenses (other than expenses attributable to a specific class) and realized and unrealized gains or losses on investments are allocated to each class of shares based on its relative net assets.
35
COHEN & STEERS GLOBAL REALTY SHARES, INC.
NOTES TO FINANCIAL STATEMENTS—(Continued)
Foreign Currency Translation: The books and records of the Fund are maintained in U.S. dollars. Investment securities and other assets and liabilities denominated in foreign currencies are translated into U.S. dollars based upon prevailing exchange rates on the date of valuation. Purchases and sales of investment securities and income and expense items denominated in foreign currencies are translated into U.S. dollars based upon prevailing exchange rates on the respective dates of such transactions. The Fund does not isolate that portion of the results of operations resulting from fluctuations in foreign exchange rates on investments from the fluctuations arising from changes in market prices of securities held. Such fluctuations are included with the net realized and unrealized gain or loss on investments.
Net realized foreign currency transaction gains or losses arise from sales of foreign currencies, (excluding gains and losses on forward foreign currency exchange contracts, which are presented separately, if any), currency gains or losses realized between the trade and settlement dates on securities transactions, and the difference between the amounts of dividends, interest, and foreign withholding taxes recorded on the Fund’s books and the U.S. dollar equivalent of the amounts actually received or paid. Net unrealized foreign currency translation gains and losses arise from changes in the values of assets and liabilities, other than investments in securities, on the date of valuation, resulting from changes in exchange rates. Pursuant to U.S. federal income tax regulations, certain foreign currency gains/losses included in realized and unrealized gains/losses are included in or are a reduction of ordinary income for federal income tax purposes.
Dividends and Distributions to Shareholders: Dividends from net investment income and capital gain distributions are determined in accordance with U.S. federal income tax regulations, which may differ from GAAP. Dividends from net investment income, if any, are declared and paid semi-annually. Net realized capital gains, unless offset by any available capital loss carryforward, are typically distributed to shareholders at least annually. Dividends and distributions to shareholders are recorded on theex-dividend date and are automatically reinvested in full and fractional shares of the Fund based on the NAV per share at the close of business on the payable date, unless the shareholder has elected to have them paid in cash.
Dividends from net investment income are subject to recharacterization for tax purposes. Based upon the results of operations for the year ended December 31, 2018, a portion of the dividends has been reclassified to distributions from net realized gain and tax return of capital.
Income Taxes: It is the policy of the Fund to continue to qualify as a regulated investment company (RIC), if such qualification is in the best interest of the shareholders, by complying with the requirements of Subchapter M of the Internal Revenue Code applicable to RICs, and by distributing substantially all of its taxable earnings to its shareholders. Also, in order to avoid the payment of any federal excise taxes, the Fund will distribute substantially all of its net investment income and net realized gains on a calendar year basis. Accordingly, no provision for federal income or excise tax is necessary. Dividend and interest income from holdings innon-U.S. securities is recorded net ofnon-U.S. taxes paid. Management has analyzed the Fund’s tax positions taken on federal and applicable state income tax returns as well as its tax positions innon-U.S. jurisdictions in which it trades for all open tax years and has concluded that as of December 31, 2018, no additional provisions for income tax are required in the Fund’s financial statements. The Fund’s tax positions for the tax years for which the applicable statutes of limitations have not expired are subject to examination by the Internal Revenue Service, state departments of revenue and by foreign tax authorities.
36
COHEN & STEERS GLOBAL REALTY SHARES, INC.
NOTES TO FINANCIAL STATEMENTS—(Continued)
Note 2. Investment Advisory, Administration Fees and Other Transactions with Affiliates
Investment Advisory Fees: Cohen & Steers Capital Management, Inc. serves as the Fund’s investment advisor pursuant to an investment advisory agreement (the investment advisory agreement). Under the terms of the investment advisory agreement, the investment advisor provides the Fund withday-to-day investment decisions and generally manages the Fund’s investments in accordance with the stated policies of the Fund, subject to the supervision of the Board of Directors.
For the services provided to the Fund, the investment advisor receives a fee, accrued daily and paid monthly at an annual rate of 0.75% of the average daily net assets of the Fund. Prior to close of business on March 23, 2018, the investment advisor received a fee at an annual rate of 0.80% of the average daily net assets. On December 5, 2017, the Board of Directors of the Fund approved an amendment to the Fund’s investment advisory agreement in connection with the reorganization of Cohen & Steers Institutional Global Realty Shares, Inc. (the Acquired Fund or IGRS) with and into the Fund, reducing the investment advisory fee that the Fund pays to the investment advisor to an annual rate of 0.75% of the average daily net assets of the Fund, effective close of business March 23, 2018.
Prior to close of business on March 23, 2018, the investment advisor contractually agreed to waive its fee and/or reimburse expenses so that the Fund’s total annual operating expenses, (excluding acquired fund fees and expenses, taxes and extraordinary expenses) do not exceed 1.30% for Class A shares, 1.95% for Class C shares, 0.95% for Class I shares, 1.45% for Class R shares and 0.95% for Class Z shares. On December 5, 2017, the Fund’s Board of Directors approved an amendment to the Fund’s fee waiver/expense reimbursement agreement in connection with the reorganization of IGRS with and into the Fund, effective close of business March 23, 2018. Through June 30, 2020 the Advisor has contractually agreed to waive its fee and/or reimburse expenses so that the Fund’s total annual fund operating expenses (excluding acquired fund fees and expenses, taxes and extraordinary expenses) do not exceed 1.25% for Class A shares, 1.90% for Class C shares, 0.90% for Class F shares, 0.90% for Class I shares, 1.40% for Class R shares, 1.25% for Class T shares and 0.90% for Class Z shares. This contractual agreement can be amended at any time by agreement of the Fund’s Board of Directors and the investment advisor and will terminate automatically in the event of termination of the investment advisory agreement between the investment advisor and the Fund. For the year ended December 31, 2018, fees waived and/or expenses reimbursed totaled $374,506.
Under subadvisory agreements between the investment advisor and each of Cohen & Steers Asia Limited and Cohen & Steers UK Limited (collectively, the subadvisors), affiliates of the investment advisor, the subadvisors are responsible for managing the Fund’s investments in certainnon-U.S. holdings. For their services provided under the subadvisory agreements, the investment advisor (not the Fund) pays the subadvisors. The investment advisor allocates 50% of the investment advisory fee received from the Fund among itself and each subadvisor based on the portion of the Fund’s average daily net assets managed by the investment advisor and each subadvisor.
Administration Fees: The Fund has entered into an administration agreement with the investment advisor under which the investment advisor performs certain administrative functions for the Fund and receives a fee, accrued daily and paid monthly, at the annual rate of 0.04% of the average daily net assets of the Fund. For the year ended December 31, 2018, the Fund incurred $435,019 in fees under
37
COHEN & STEERS GLOBAL REALTY SHARES, INC.
NOTES TO FINANCIAL STATEMENTS—(Continued)
this administration agreement. Additionally, the Fund pays State Street Bank and Trust Company asco-administrator under a fund accounting and administration agreement.
Distribution Fees: Shares of the Fund are distributed by Cohen & Steers Securities, LLC (the distributor), an affiliated entity of the investment advisor. The Fund has adopted an amended distribution and service plan (the plan) pursuant toRule 12b-1 under the 1940 Act. The plan provides that the Fund will pay the distributor a fee, accrued daily and paid monthly, at an annual rate of up to 0.25% of the average daily net assets attributable to Class A shares, up to 0.75% of the average daily net assets attributable to Class C shares, and up to 0.50% of the average daily net assets attributable to Class R shares. In addition, with respect to Class R shares, such amounts may also be used to pay for services to Fund shareholders or services related to the maintenance of shareholder accounts.
There is a maximum initial sales charge of 4.50% for Class A shares. There is a maximum contingent deferred sales charge (CDSC) of 1.00% on purchases of $1 million or more of Class A shares, which applies if redemption occurs within one year from purchase. There is a CDSC of 1.00% on Class C shares, which applies if redemption occurs within one year from purchase. For the year ended December 2018, the Fund has been advised that the distributor received $5,099, which represents a portion of the sales commissions paid by shareholders from the sale of Class A shares, and $197 of CDSC relating to redemptions of Class C shares. The distributor has advised the Fund that proceeds from the CDSC on these classes are used by the distributor to defray its expenses related to providing distribution-related services to the Fund in connection with the sale of these classes, including payments to dealers and other financial intermediaries for selling these classes. The payment of a CDSC may result in the Distributor receiving amounts greater or less than the upfront commission paid by the Distributor to the financial intermediary.
Shareholder Servicing Fees: For shareholder services, the Fund pays the distributor or its affiliates a fee, accrued daily, at an annual rate of up to 0.10% of the average daily net assets of the Fund’s Class A and Class I shares and up to 0.25% of the average daily net assets of the Fund’s Class C shares. The distributor is responsible for paying qualified financial institutions for shareholder services.
Directors’ and Officers’ Fees: Certain directors and officers of the Fund are also directors, officers and/or employees of the investment advisor. The Fund does not pay compensation to directors and officers affiliated with the investment advisor except for the Chief Compliance Officer, who received compensation from the investment advisor, which was reimbursed by the Fund, in the amount of $13,146 for the year ended December 31, 2018.
Note 3. Purchases and Sales of Securities
Purchases and sales of securities, excluding short-term investments, for the year ended December 31, 2018, totaled $992,267,399 and $804,945,961, respectively.
38
COHEN & STEERS GLOBAL REALTY SHARES, INC.
NOTES TO FINANCIAL STATEMENTS—(Continued)
Note 4. Income Tax Information
The tax character of dividends and distributions paid was as follows:
| | | | | | | | |
| | | For the Year Ended
December 31, | |
| | | 2018 | | | 2017 | |
Ordinary income | | $ | 28,171,884 | | | $ | 10,609,454 | |
Long-term capital gain | | | 8,181,070 | | | | 3,174,977 | |
Tax return of capital | | | 551,243 | | | | — | |
| | | | | | | | |
Total dividends and distributions | | $ | 36,904,197 | | | $ | 13,784,431 | |
| | | | | | | | |
As of December 31, 2018, the tax-basis components of accumulated earnings, the federal tax cost and net unrealized appreciation (depreciation) in value of investments held were as follows:
| | | | |
Cost of investments in securities for federal income tax purposes | | $ | 1,159,067,228 | |
| | | | |
Gross unrealized appreciation on investments | | $ | 91,072,355 | |
Gross unrealized depreciation on investments | | | (50,571,897 | ) |
| | | | |
Net unrealized appreciation (depreciation) on investments | | $ | 40,500,458 | |
| | | | |
The Fund incurred short-term capital losses of $4,403,118 and long-term capital gains of $396,757 after October 31, 2018 that it has elected to treat as arising in the following year.
During the year ended December 31, 2018, the Fund utilized net capital loss carryforwards of $4,529,849 that it acquired in connection with the reorganization with IGRS. See Note 6.
As of December 31, 2018, the Fund had temporary book/tax differences primarily attributable to wash sales on portfolio securities and unrealized appreciation on passive foreign investment companies and permanent book/tax differences primarily attributable merger related items. To reflect reclassifications arising from the permanent differences, paid in capital was credited $11,057,035, and total distributable earnings/(accumulated loss) was charged $11,057,035. Net assets were not affected by this reclassification.
Note 5. Capital Stock
The Fund is authorized to issue 400 million shares of capital stock, at a par value of $0.001 per share, classified in seven classes as follows: 50 million of Class A capital stock, 50 million of Class C capital stock, 50 million of Class F capital stock, 100 million of Class I capital stock, 50 million of Class R capital stock, 50 million of Class T capital stock and 50 million of Class Z capital stock. Class F and Class T shares are currently not available for purchase.
39
COHEN & STEERS GLOBAL REALTY SHARES, INC.
NOTES TO FINANCIAL STATEMENTS—(Continued)
The Fund’s Board of Directors may increase or decrease the number of shares of common stock that the Fund has authority to issue. Transactions in Fund shares were as follows:
| | | | | | | | | | | | | | | | |
| | | For the
Year Ended
December 31, 2018 | | | For the
Year Ended
December 31, 2017 | |
| | | Shares | | | Amount | | | Shares | | | Amount | |
Class A: | | | | | | | | | | | | |
Sold | | | 689,497 | | | $ | 35,988,625 | | | | 611,029 | | | $ | 32,013,822 | |
Issued as reinvestment of dividends and distributions | | | 41,670 | | | | 2,159,681 | | | | 21,613 | | | | 1,118,443 | |
Redeemed | | | (552,535 | ) | | | (28,586,002 | ) | | | (477,558 | ) | | | (24,396,826 | ) |
| | | | | | | | | | | | | | | | |
Net increase (decrease) | | | 178,632 | | | $ | 9,562,304 | | | | 155,084 | | | $ | 8,735,439 | |
| | | | | | | | | | | | | | | | |
| | | | |
Class C: | | | | | | | | | | | | | | | | |
Sold | | | 94,509 | | | $ | 4,904,465 | | | | 99,440 | | | $ | 5,132,684 | |
Issued as reinvestment of dividends and distributions | | | 19,968 | | | | 1,026,915 | | | | 14,303 | | | | 734,703 | |
Redeemed | | | (254,488 | ) | | | (13,180,111 | ) | | | (390,444 | ) | | | (19,860,129 | ) |
| | | | | | | | | | | | | | | | |
Net increase (decrease) | | | (140,011 | ) | | $ | (7,248,731 | ) | | | (276,701 | ) | | $ | (13,992,742 | ) |
| | | | | | | | | | | | | | | | |
| | | | |
Class I: | | | | | | | | | | | | | | | | |
Sold | | | 9,444,723 | | | $ | 495,005,757 | | | | 4,435,725 | | | $ | 230,868,690 | |
Acquisition of IGRS | | | 9,051,506 | | | | 454,686,267 | | | | — | | | | — | |
Issued as reinvestment of dividends and distributions | | | 490,445 | | | | 25,705,680 | | | | 129,217 | | | | 6,728,105 | |
Redeemed | | | (6,333,828 | ) | | | (331,233,324 | ) | | | (2,071,888 | ) | | | (107,459,380 | ) |
| | | | | | | | | | | | | | | | |
Net increase (decrease) | | | 12,652,846 | | | $ | 644,164,380 | | | | 2,493,054 | | | $ | 130,137,415 | |
| | | | | | | | | | | | | | | | |
| | | | |
Class R: | | | | | | | | | | | | | | | | |
Sold | | | 2,324 | | | $ | 121,664 | | | | 6,858 | | | $ | 361,854 | |
Issued as reinvestments of dividends and distributions | | | 238 | | | | 12,431 | | | | 85 | | | | 4,466 | |
Redeemed | | | (1,983 | ) | | | (104,257 | ) | | | (2,221 | ) | | | (115,541 | ) |
| | | | | | | | | | | | | | | | |
Net increase (decrease) | | | 579 | | | $ | 29,838 | | | | 4,722 | | | $ | 250,779 | |
| | | | | | | | | | | | | | | | |
40
COHEN & STEERS GLOBAL REALTY SHARES, INC.
NOTES TO FINANCIAL STATEMENTS—(Continued)
| | | | | | | | | | | | | | | | |
| | | For the
Year Ended
December 31, 2018 | | | For the
Year Ended
December 31, 2017 | |
| | | Shares | | | Amount | | | Shares | | | Amount | |
| | | |
Class Z: | | | | | | | | | | | | |
Sold | | | 324,881 | | | $ | 17,226,656 | | | | 5,981 | | | $ | 315,163 | |
Issued as reinvestment of dividends and distributions | | | 6,282 | | | | 330,582 | | | | 215 | | | | 11,220 | |
Redeemed | | | (12,637 | ) | | | (659,886 | ) | | | (185 | ) | | | (9,680 | ) |
| | | | | | | | | | | | | | | | |
Net increase (decrease) | | | 318,526 | | | $ | 16,897,352 | | | | 6,011 | | | $ | 316,703 | |
| | | | | | | | | | | | | | | | |
Note 6. Reorganization
On December 5, 2017, the Boards of Directors of IGRS and the Fund each approved a proposal to reorganize IGRS with and into the Fund (the Reorganization). The investment advisor believes the Reorganization benefits shareholders of the Fund by reducing annual operating gross and net expense ratios, increasing marketability and providing portfolio management and operational efficiencies. The transaction was structured as a tax-free reorganization under the Internal Revenue Code. On March 15, 2018, IGRS’s stockholders approved the Reorganization.
After the close of business on March 23, 2018, the Fund acquired substantially all of the assets and liabilities of IGRS in exchange for Class I shares of common stock of the Fund, which were distributed to IGRS’s shareholders. The investment portfolio of IGRS, with a fair value of $455,071,697 and identified cost of $414,984,236 as of the date of the reorganization, was the principal asset acquired by the Fund. The acquisition was accomplished by a tax-free exchange of 18,144,491 shares of IGRS, valued at $454,686,267 for 9,051,506 shares of the Fund. The net assets of IGRS and the Fund immediately before the acquisition were $454,686,267 (including $40,114,030 of net unrealized appreciation) and $665,647,073, respectively. The combined net assets of the Fund immediately following the acquisition were $1,120,333,340. For financial reporting purposes, assets received and shares issued by the Fund were recorded at fair value; however the cost basis of the investments received from IGRS was carried forward to align ongoing reporting of the Fund’s realized and unrealized gains and losses with amounts distributable to shareholders for tax purposes.
Reorganization expenses were incurred by the Fund and IGRS in proportion to their net assets, and were approximately $269,751, of which $62,569 were accrued prior to January 1, 2018; $160,515 of reorganization expenses were borne by the Fund and $109,236 were borne by IGRS. Assuming the acquisition had been completed on January 1, 2018, the Fund’s pro-forma results of operations for the year ended December 31, 2018, are as follows:
| | | | |
Net investment income | | $ | 22,175,792 | |
Net realized and unrealized loss on investments in securities | | | (71,710,372 | ) |
| | | | |
Net increase in net assets resulting from operations | | $ | (49,534,580 | ) |
| | | | |
41
COHEN & STEERS GLOBAL REALTY SHARES, INC.
NOTES TO FINANCIAL STATEMENTS—(Continued)
Because the combined investment portfolios have been managed as a single integrated portfolio since the acquisition was completed, it is not practicable to separate the amounts of changes in revenue and earnings attributable to IGRS that have been included in the Fund’s Statement of Operations since March 23, 2018.
Note 7. Other Risks
Common Stock Risk: While common stocks have historically generated higher average returns than fixed income securities over the long-term, common stock has also experienced significantly more volatility in those returns, although under certain market conditions, fixed-income investments may have comparable or greater price volatility. An adverse event, such as an unfavorable earnings report, may depress the value of common stock held by the Fund. Also, the price of common stock is sensitive to general movements in the stock market. A drop in the stock market may depress the price of common stock held by the Fund.
Real Estate Market Risk: Since the Fund concentrates its assets in companies engaged in the real estate industry, an investment in the Fund will be closely linked to the performance of the real estate markets. Risks of investing in real estate securities include falling property values due to increasing vacancies, declining rents resulting from economic, legal, tax, political or technological developments, lack of liquidity, limited diversification, and sensitivity to certain economic factors such as interest-rate changes and market recessions. Real estate company prices also may drop because of the failure of borrowers to pay their loans and poor management, and residential developers, in particular, could be negatively impacted by falling home prices, slower mortgage origination and rising construction costs. The risks of investing in REITs are similar to those associated with direct investments in real estate securities.
REIT Risk: In addition to the risks of securities linked to the real estate industry, REITs are subject to certain other risks related to their structure and focus. REITs are dependent upon management skills and generally may not be diversified. REITs are also subject to heavy cash flow dependency, defaults by borrowers and self-liquidation. In addition, REITs could possibly fail to (i) qualify for pass-through of income under applicable tax law, or (ii) maintain their exemptions from registration under the 1940 Act. The above factors may also adversely affect a borrower’s or a lessee’s ability to meet its obligations to the REIT. In the event of a default by a borrower or lessee, the REIT may experience delays in enforcing its rights as a mortgagee or lessor and may incur substantial costs associated with protecting its investments.
Small- andMedium-Sized Companies Risk: Real estate companies in the industry tend to besmall-tomedium-sized companies in relation to the equity markets as a whole. There may be less trading in a smaller company’s stock, which means that buy and sell transactions in that stock could have a larger impact on the stock’s price than is the case with larger company stocks. Smaller companies also may have fewer lines of business so that changes in any one line of business may have a greater impact on a smaller company’s stock price than is the case for a larger company. Further, smaller company stocks may perform differently in different cycles than larger company stocks. Accordingly, real estate company shares can, and at times will, perform differently than large company stocks.
42
COHEN & STEERS GLOBAL REALTY SHARES, INC.
NOTES TO FINANCIAL STATEMENTS—(Continued)
Foreign(Non-U.S.) Securities Risk: The Fund directly purchases securities of foreign issuers. Risks of investing in foreign securities include currency risks, future political and economic developments and possible imposition of foreign withholding taxes on income or proceeds payable on the securities. In addition, there may be less publicly available information about a foreign issuer than about a domestic issuer, and foreign issuers may not be subject to the same accounting, auditing and financial recordkeeping standards and requirements as domestic issuers. Moreover, securities of many foreign issuers and their markets may be less liquid and their prices more volatile than securities of comparable U.S. issuers.
Foreign Currency and Currency Hedging Risk: Although the Fund will report its NAV and pay dividends in U.S. dollars, foreign securities often are purchased with and make any dividend and interest payments in foreign currencies. Therefore, the Fund’s investments in foreign securities will be subject to foreign currency risk, which means that the Fund’s NAV could decline as a result of changes in the exchange rates between foreign currencies and the U.S. dollar. Certain foreign countries may impose restrictions on the ability of issuers of foreign securities to make payment of principal, dividends and interest to investors located outside the country, due to blockage of foreign currency exchanges or otherwise. The Fund may, but is not required to, engage in various instruments that are designed to hedge the Fund’s foreign currency risks.
If the Fund were to utilize derivatives for the purpose of hedging foreign currency risks, it would be subject to risks different from, and possibly greater than, the risks associated with investing directly in traditional securities. Among the risks presented are counterparty risk, financial leverage risk, liquidity risk, OTC trading risk and tracking risk. The use of derivatives can lead to losses because of adverse movements in the price or value of the underlying asset, index or rate, which may be magnified by certain features of the derivatives.
Geopolitical Risk: Occurrence of global events similar to those in recent years, such as war, terrorist attacks, natural or environmental disasters, country instability, infectious disease epidemics, market instability, debt crises and downgrades, embargoes, tariffs, sanctions and other trade barriers and other governmental trade or market control programs, the potential exit of a country from its respective union and related geopolitical events, may result in market volatility and may have long-lasting impacts on both the U.S. and global financial markets. Additionally, those events, as well as other changes in foreign and domestic political and economic conditions, could adversely affect individual issuers or related groups of issuers, securities markets, interest rates, secondary trading, credit ratings, inflation, investor sentiment and other factors affecting the value of the Fund’s investments. The decision of the United Kingdom (UK) to exit from the European Union following the June 2016 vote on the matter (referred to as Brexit) may cause uncertainty and thus adversely impact financial results of the Fund and the global financial markets. Growing tensions, including trade disputes, between the United States and other nations, or among foreign powers, and possible diplomatic, trade or other sanctions could adversely impact the global economy, financial markets and the Fund. The strengthening or weakening of the U.S. dollar relative to other currencies may, among other things, adversely affect the Fund’s investments denominated innon-U.S. dollar currencies. It is difficult to predict when similar events affecting the U.S. or global financial markets may occur, the effects that such events may have, and the duration of those effects.
43
COHEN & STEERS GLOBAL REALTY SHARES, INC.
NOTES TO FINANCIAL STATEMENTS—(Continued)
Regulatory Risk: The U.S. government has proposed and adopted multiple regulations that could have a long-lasting impact on the Fund and on the mutual fund industry in general. The SEC’s final rules and amendments that modernize reporting and disclosure and to implement a Liquidity Risk Management Program, along with other potential upcoming regulations, could, among other things, restrict the Fund’s ability to engage in transactions, impact flows into the Fund and/or increase overall expenses of the Fund. In addition, the SEC, Congress, various exchanges and regulatory and self-regulatory authorities, both domestic and foreign, have undertaken reviews of the use of derivatives by registered investment companies, which could affect the nature and extent of derivatives used by the Fund. While the full extent of these regulations is still unclear, these regulations and actions may adversely affect both the Fund and the instruments in which the Fund invests and its ability to execute its investment strategy. Similarly, regulatory developments in other countries may have an unpredictable and adverse impact on the Fund.
This is not a complete list of the risks of investing in the Fund. For additional information concerning the risks of investing in the Fund, please consult the Fund’s prospectus.
Note 8. Other
In the normal course of business, the Fund enters into contracts that provide general indemnifications. The Fund’s maximum exposure under these arrangements is dependent on claims that may be made against the Fund in the future and, therefore, cannot be estimated; however, based on experience, the risk of material loss from such claims is considered remote.
Note 9. New Accounting Guidance
In August 2018, the Financial Accounting Standards Board (FASB) issued a new Accounting Standards Update (ASU) No. 2018-13,“Fair Value Measurement (Topic 820), DisclosureFramework- Changes to the Disclosure Requirements for Fair Value Measurement”. The amendments to ASU2018-13 are intended to improve the effectiveness of disclosures in the notes to financial statements through modifications to disclosure requirements on fair value measurements. ASU 2018-13 is effective for fiscal years, and interim periods within those fiscal years, beginning after December 15, 2019, with early adoption permitted. The Fund has adopted the amended disclosures permissible under the update. The adoption had no effect on the Fund’s net assets or results of operations.
In August 2018, the SEC adopted amendments to Regulation S-X which are intended to facilitate the disclosure of information to investors and simplify compliance without significantly altering the information provided to investors. The amendments include eliminating the requirement to: separately state book basis components of net assets on the Statement of Assets & Liabilities; separately state the sources of distributions paid (except tax return of capital distributions must still be separately disclosed) on the Statement of Changes in Net Assets; and state the book basis amount of undistributed net investment income on the Statement of Changes in Net Assets. The Fund adopted the amendments within the financial statements for the year ended December 31, 2018, which had no effect on the Fund’s net assets or results of operations.
44
COHEN & STEERS GLOBAL REALTY SHARES, INC.
NOTES TO FINANCIAL STATEMENTS—(Continued)
Note 10. Subsequent Events
Management has evaluated events and transactions occurring after December 31, 2018 through the date that the financial statements were issued, and has determined that no additional disclosure in the financial statements is required.
45
COHEN & STEERS GLOBAL REALTY SHARES, INC.
REPORT OF INDEPENDENT REGISTERED PUBLIC ACCOUNTING FIRM
To the Board of Directors and Shareholders of
Cohen & Steers Global Realty Shares, Inc.
Opinion on the Financial Statements
We have audited the accompanying statement of assets and liabilities, including the schedule of investments, of Cohen & Steers Global Realty Shares, Inc. (the “Fund”) as of December 31, 2018, the related statement of operations for the year ended December 31, 2018, the statement of changes in net assets for each of the two years in the period ended December 31, 2018, including the related notes, and the financial highlights for each of the periods indicated therein (collectively referred to as the “financial statements”). In our opinion, the financial statements present fairly, in all material respects, the financial position of the Fund as of December 31, 2018, the results of its operations for the year then ended, the changes in its net assets for each of the two years in the period ended December 31, 2018 and the financial highlights for each of the periods indicated therein in conformity with accounting principles generally accepted in the United States of America.
Basis for Opinion
These financial statements are the responsibility of the Fund’s management. Our responsibility is to express an opinion on the Fund’s financial statements based on our audits. We are a public accounting firm registered with the Public Company Accounting Oversight Board (United States) (PCAOB) and are required to be independent with respect to the Fund in accordance with the U.S. federal securities laws and the applicable rules and regulations of the Securities and Exchange Commission and the PCAOB.
We conducted our audits of these financial statements in accordance with the standards of the PCAOB. Those standards require that we plan and perform the audit to obtain reasonable assurance about whether the financial statements are free of material misstatement, whether due to error or fraud.
Our audits included performing procedures to assess the risks of material misstatement of the financial statements, whether due to error or fraud, and performing procedures that respond to those risks. Such procedures included examining, on a test basis, evidence regarding the amounts and disclosures in the financial statements. Our audits also included evaluating the accounting principles used and significant estimates made by management, as well as evaluating the overall presentation of the financial statements. Our procedures included confirmation of securities owned as of December 31, 2018 by correspondence with the custodian, transfer agent and brokers; when replies were not received from brokers, we performed other auditing procedures. We believe that our audits provide a reasonable basis for our opinion.
/s/ PricewaterhouseCoopers LLP
New York, New York
February 22, 2019
We have served as the auditor of one or more investment companies in the Cohen & Steers family of mutual funds since 1991.
46
COHEN & STEERS GLOBAL REALTY SHARES, INC.
TAX INFORMATION—2018 (Unaudited)
For the calendar year ended December 31, 2018, for individual taxpayers, the Fund designates $8,793,434 as qualified dividend income eligible for reduced tax rates, long-term capital gain distributions of $8,181,070 taxable at the maximum 20% rate and $9,344,963 as qualified business income eligible for the 20% deduction. In addition, for corporate taxpayers, 0.13% of the ordinary dividends paid qualified for the dividends received deduction (DRD).
OTHER INFORMATION
A description of the policies and procedures that the Fund uses to determine how to vote proxies relating to portfolio securities is available (i) without charge, upon request, by calling800-330-7348, (ii) on our website at cohenandsteers.com or (iii) on the SEC’s website at http://www.sec.gov. In addition, the Fund’s proxy voting record for the most recent12-month period ended June 30 is available by August 31 of each year (i) without charge, upon request, by calling800-330-7348 or (ii) on the SEC’s website at http://www.sec.gov.
The Fund files its complete schedule of portfolio holdings with the SEC for the first and third quarters of each fiscal year on FormN-Q. The Fund’s FormsN-Q are available (i) without charge, upon request, by calling800-330-7348 or (ii) on the SEC’s website at http://www.sec.gov. In addition, the FormsN-Q may be reviewed and copied at the SEC’s Public Reference Room in Washington, DC. Information on the operation of the Public Reference Room may be obtained by calling800-SEC-0330.
Please note that distributions paid by the Fund to shareholders are subject to recharacterization for tax purposes. The Fund may also pay distributions in excess of the Fund’s net investment company taxable income and net realized gains and this excess would be a tax free return of capital distributed from the Fund’s assets. The final tax treatment of all distributions is reported to shareholders on their1099-DIV forms, which are mailed after the close of each calendar year.
Changes to Portfolio Managers
Effective January 22, 2019, both Charles McKinley and Luke Sullivan no longer serve as portfolio managers to the Fund and Laurel Durkay was added as a portfolio manager of the Fund. Ms. Durkay joined the investment advisor in 2007 and currently serves as Senior Vice President of the investment advisor.
Change in Board of Directors
Frank K. Ross retired from the Board of Directors on December 31, 2018 pursuant to the Fund’s mandatory retirement policy.
Qualified REIT Dividends Paid by the Fund to Non-Corporate Shareholders
Starting in calendar year 2018, non-corporate taxpayers are permitted to deduct from their taxable income a portion of any amounts received from a REIT that are “qualified REIT dividends.” As of December 31, 2018, this deduction was not available with respect to such amounts paid by a REIT to the Fund and distributed by the Fund to its shareholders. As a result, non-corporate shareholders would have generally been subject to a higher effective tax rate on any such amounts received from the Fund compared to the effective rate applicable to any qualified REIT dividends a shareholder would receive if the shareholder invested directly in a REIT. However, on January 18, 2019, the Internal Revenue Service issued proposed regulations that would permit funds to pay qualified REIT dividends to their shareholders subject to certain holding period requirements. The regulation is effective beginning with calendar year 2018.
47
COHEN & STEERS GLOBAL REALTY SHARES, INC.
MANAGEMENT OF THE FUND
The business and affairs of the Fund are managed under the direction of the Board of Directors. The Board of Directors approves all significant agreements between the Fund and persons or companies furnishing services to it, including the Fund’s agreements with its investment advisor, administrator, co-administrator, custodian and transfer agent. The management of the Fund’s day-to-day operations is delegated to its officers, the investment advisor, administrator and co-administrator, subject always to the investment objective and policies of the Fund and to the general supervision of the Board of Directors.
The Board of Directors and officers of the Fund and their principal occupations during at least the past five years are set forth below. The statement of additional information (SAI) includes additional information about fund directors and is available, without charge, upon request by calling 800-330-7348.
| | | | | | | | | | | | |
Name, Address and
Year of Birth1 | | Position(s) Held
With Fund | | Term of
Office2 | | Principal Occupation During At Least The Past 5 Years
(Including Other Directorships Held) | | Number of
Funds Within
Fund
Complex
Overseen by
Director
(Including
the Fund) | | | Length
of Time
Served3 |
| | | | | |
| Interested Directors4 | | | | | | | | | | | | |
| | | | | |
Robert H. Steers 1953 | | Director, Chairman | | Until Next Election of Directors | | Chief Executive Officer of Cohen & Steers Capital Management, Inc. (CSCM or the Advisor) and its parent, Cohen & Steers, Inc. (CNS) since 2014. Prior to that, Co-Chairman and Co-Chief Executive Officer of the Advisor since 2003 and CNS since 2004. Prior to that, Chairman of the Advisor; Vice President of Cohen & Steers Securities, LLC. | | | 20 | | | Since 1991 |
| | | | | |
Joseph M. Harvey 1963 | | Director | | Until Next Election of Directors | | President and Chief Investment Officer of the Advisor (since 2003) and President of CNS (since 2004). Prior to that, Senior Vice President and Director of Investment Research of CSCM. | | | 20 | | | Since 2014 |
(table continued on next page)
48
COHEN & STEERS GLOBAL REALTY SHARES, INC.
(table continued from previous page)
| | | | | | | | | | | | |
Name, Address and
Year of Birth1 | | Position(s) Held
With Fund | | Term of
Office2 | | Principal Occupation During At Least The Past 5 Years
(Including Other Directorships Held) | | Number of
Funds Within
Fund
Complex
Overseen by
Director
(Including
the Fund) | | | Length
of Time
Served3 |
| | | | |
| Disinterested Directors | | | | | | | | | | |
| | | | | |
Michael G. Clark 1965 | | Director | | Until Next Election of Directors | | From 2006 to 2011, President and Chief Executive Officer of DWS Funds and Managing Director of Deutsche Asset Management. | | | 20 | | | Since 2011 |
| | | | | |
George Grossman 1953 | | Director | | Until Next Election of Directors | | Attorney-at-law. | | | 20 | | | Since 1993 |
| | | | | |
Dean A. Junkans 1959 | | Director | | Until Next Election of Directors | | C.F.A.; Advisor to SigFig since July, 2018; Adjunct Professor and Executive–In–Residence, Bethel University Since 2015; Chief Investment Officer at Wells Fargo Private Bank from 2004 to 2014 and Chief Investment Officer of the Wealth, Brokerage and Retirement group at Wells Fargo & Company from 2011 to 2014; Former member and Chair, Claritas Advisory Committee at the CFA Institute from 2013 to 2015; Board Member and Investment Committee member, Bethel University Foundation since 2010; formerly Corporate Executive Board Member of the National Chief Investment Officers Circle, 2010 to 2015; formerly, Member of the Board of Governors of the University of Wisconsin Foundation, River Falls, 1996 to 2004; U.S. Army Veteran, Gulf War. | | | 20 | | | Since 2015 |
(table continued on next page)
49
COHEN & STEERS GLOBAL REALTY SHARES, INC.
(table continued from previous page)
| | | | | | | | | | |
Name, Address and
Year of Birth1 | | Position(s) Held
With Fund | | Term of
Office2 | | Principal Occupation During At Least The Past 5 Years
(Including Other Directorships Held) | | Number of
Funds Within
Fund
Complex
Overseen by
Director
(Including
the Fund) | | Length
of Time
Served3 |
| | | | | |
Gerald J. Maginnis 1955 | | Director | | Until Next Election of Directors | | Philadelphia Office Managing Partner, KPMG LLP from 2006 to 2015; Partner in Charge, KPMG Pennsylvania Audit Practice from 2002 to 2008; President, Pennsylvania Institute of Certified Public Accountants (PICPA) from 2014 to 2015; member, PICPA Board of Directors from 2012 to 2016; member, Council of the American Institute of Certified Public Accountants (AICPA) from 2013 to 2017; member, Board of Trustees of AICPA Foundation since 2015. | | 20 | | Since 2015 |
| | | | | |
Jane F. Magpiong 1960 | | Director | | Until Next Election of Directors | | President, Untap Potential since 2013; Senior Managing Director, TIAA-CREF, from 2011 to 2013; National Head of Wealth Management, TIAA-CREF, from 2008 to 2011; and prior to that, President, Bank of America Private Bank from 2005 to 2008. | | 20 | | Since 2015 |
(table continued on next page)
50
COHEN & STEERS GLOBAL REALTY SHARES, INC.
(table continued from previous page)
| | | | | | | | | | |
Name, Address and
Year of Birth1 | | Position(s) Held
With Fund | | Term of
Office2 | | Principal Occupation During At Least The Past 5 Years
(Including Other Directorships Held) | | Number of
Funds Within
Fund
Complex
Overseen by
Director
(Including
the Fund) | | Length
of Time
Served3 |
| | | | | |
Daphne L. Richards 1966 | | Director | | Until Next Election of Directors | | Independent Director of Cartica Management, LLC since 2015; Member of the Investment Committee of the Berkshire Taconic Community Foundation since 2015; Member of the Advisory Board of Northeast Dutchess Fund since 2016; President and CIO of Ledge Harbor Management since 2016; Formerly, worked at Bessemer Trust Company from 1999 to 2014; Prior thereto, Ms. Richards held investment positions at Frank Russell Company from 1996 to 1999. Union Bank of Switzerland from 1993 to 1996; Credit Suisse from 1990 to 1993; and Hambros International Venture Capital Fund from 1988 to 1989. | | 20 | | Since 2017 |
(table continued on next page)
51
COHEN & STEERS GLOBAL REALTY SHARES, INC.
(table continued from previous page)
| | | | | | | | | | |
Name, Address and
Year of Birth1 | | Position(s) Held
With Fund | | Term of
Office2 | | Principal Occupation During At Least The Past 5 Years
(Including Other Directorships Held) | | Number of
Funds Within
Fund
Complex
Overseen by
Director
(Including
the Fund) | | Length
of Time
Served3 |
| | | | | |
Frank K. Ross 1943 | | Director | | —5 | | Visiting Professor of Accounting and Director of the Center for Accounting Education at Howard University School of Business since 2004; Board member and member of Audit Committee (Chairman from 2007 to 2012) and Human Resources and Compensation Committee Member, Pepco Holdings, Inc. (electric utility) from 2004 to 2014; Formerly, Mid-Atlantic Area Managing Partner for Assurance Services at KPMG LLP and Managing Partner of its Washington, DC offices from 1995 to 2003. | | 20 | | Since 2004 |
| | | | | |
C. Edward Ward, Jr. 1946 | | Director | | Until Next Election of Directors | | Member of The Board of Trustees of Manhattan College, Riverdale, New York from 2004 to 2014. Formerly, Director of closed-end fund management for the NYSE where he worked from 1979 to 2004. | | 20 | | Since 2004 |
| 1 | The address for each director is 280 Park Avenue, New York, NY 10017. |
| 2 | On March 12, 2008, the Board of Directors adopted a mandatory retirement policy stating a Director must retire from the Board on December 31st of the year in which he or she turns 75 years of age. |
| 3 | The length of time served represents the year in which the Director was first elected or appointed to any fund in the Cohen & Steers fund complex. |
| 4 | “Interested person” as defined in the 1940 Act, of the Fund because of affiliation with CSCM (Interested Directors). |
| 5 | Frank K. Ross retired from the Board of Directors on December 31, 2018 pursuant to the Fund’s mandatory retirement policy. |
52
COHEN & STEERS GLOBAL REALTY SHARES, INC.
The officers of the Fund (other than Messrs. Steers and Harvey, whose biographies are provided above), their address, their year of birth and their principal occupations for at least the past five years are set forth below.
| | | | | | |
Name, Address and Year
of Birth1 | | Position(s) Held
With Fund | | Principal Occupation During At Least the Past 5 Years | | Length
of Time
Served2 |
| | | |
Adam M. Derechin 1964 | | President and Chief Executive Officer | | Chief Operating Officer of CSCM since 2003 and CNS since 2004. | | Since
2005 |
| | | |
Jon Cheigh 1972 | | Vice President | | Executive Vice President of CSCM since 2012. Prior to that, Senior Vice President of CSCM since 2007. | | Since
2007 |
| | | |
Dana A. DeVivo 1981 | | Secretary and Chief Legal Officer | | Senior Vice President of CSCM since 2019. Prior to that, Vice President of CSCM since 2013. | | Since
2015 |
| | | |
James Giallanza 1966 | | Chief Financial Officer | | Executive Vice President of CSCM since 2014. Prior to that, Senior Vice President of CSCM since 2006. | | Since
2006 |
| | | |
Albert Laskaj 1977 | | Treasurer | | Senior Vice President of CSCM since 2019. Prior to that, Vice President of CSCM since 2015. Prior to that, Director of Legg Mason & Co. since 2013. | | Since
2015 |
| | | |
Lisa D. Phelan 1968 | | Chief Compliance Officer | | Executive Vice President of CSCM since 2015. Prior to that, Senior Vice President of CSCM since 2008. Chief Compliance Officer of CSCM, the Cohen & Steers funds, Cohen & Steers Asia Limited and CSSL since 2007, 2006, 2005 and 2004, respectively. | | Since
2006 |
| 1 | The address of each officer is 280 Park Avenue, New York, NY 10017. |
| 2 | Officers serveone-year terms. The length of time served represents the year in which the officer was first elected as an officer of any fund in the Cohen & Steers fund complex. All of the officers listed above are officers of one or more of the other funds in the complex. |
53
COHEN & STEERS GLOBAL REALTY SHARES, INC.
Cohen & Steers Privacy Policy
| | |
| | |
| Facts | | What Does Cohen & Steers Do With Your Personal Information? |
| |
| Why? | | Financial companies choose how they share your personal information. Federal law gives consumers the right to limit some but not all sharing. Federal law also requires us to tell you how we collect, share, and protect your personal information. Please read this notice carefully to understand what we do. |
| |
| What? | | The types of personal information we collect and share depend on the product or service you have with us. This information can include: • Social Security number and account balances • Transaction history and account transactions • Purchase history and wire transfer instructions |
| |
| How? | | All financial companies need to share customers’ personal information to run their everyday business. In the section below, we list the reasons financial companies can share their customers’ personal information; the reasons Cohen & Steers chooses to share; and whether you can limit this sharing. |
| | | | |
| Reasons we can share your personal information | | Does Cohen & Steers
share? | | Can you limit this
sharing? |
| | |
For our everyday business purposes— such as to process your transactions, maintain your account(s), respond to court orders and legal investigations, or reports to credit bureaus | | Yes | | No |
| | |
For our marketing purposes— to offer our products and services to you | | Yes | | No |
| | |
| For joint marketing with other financial companies— | | No | | We don’t share |
| | |
For our affiliates’ everyday business purposes— information about your transactions and experiences | | No | | We don’t share |
| | |
For our affiliates’ everyday business purposes— information about your creditworthiness | | No | | We don’t share |
| | |
| For our affiliates to market to you— | | No | | We don’t share |
| | |
| Fornon-affiliates to market to you— | | No | | We don’t share |
| | |
| | | | |
| | |
| Questions? Call 800.330.7348 | | | | |
54
COHEN & STEERS GLOBAL REALTY SHARES, INC.
Cohen & Steers Privacy Policy—(Continued)
| | |
| | |
| Who we are | | |
| |
| Who is providing this notice? | | Cohen & Steers Capital Management, Inc., Cohen & Steers Asia Limited, Cohen & Steers Japan, LLC, Cohen & Steers UK Limited, Cohen & Steers Securities, LLC, Cohen & Steers Private Funds and Cohen & Steers Open andClosed-End Funds (collectively, Cohen & Steers). |
| |
| What we do | | |
| |
| How does Cohen & Steers protect my personal information? | | To protect your personal information from unauthorized access and use, we use security measures that comply with federal law. These measures include computer safeguards and secured files and buildings. We restrict access to your information to those employees who need it to perform their jobs, and also require companies that provide services on our behalf to protect your information. |
| |
| How does Cohen & Steers collect my personal information? | | We collect your personal information, for example, when you: • Open an account or buy securities from us • Provide account information or give us your contact information • Make deposits or withdrawals from your account We also collect your personal information from other companies. |
| |
| Why can’t I limit all sharing? | | Federal law gives you the right to limit only: • sharing for affiliates’ everyday business purposes—information about your creditworthiness • affiliates from using your information to market to you • sharing fornon-affiliates to market to you State law and individual companies may give you additional rights to limit sharing. |
| |
| Definitions | | |
| |
| Affiliates | | Companies related by common ownership or control. They can be financial and nonfinancial companies. • Cohen & Steers does not share with affiliates. |
| |
| Non-affiliates | | Companies not related by common ownership or control. They can be financial and nonfinancial companies. • Cohen & Steers does not share withnon-affiliates. |
| |
| Joint marketing | | A formal agreement betweennon-affiliated financial companies that together market financial products or services to you. • Cohen & Steers does not jointly market. |
55
COHEN & STEERS GLOBAL REALTY SHARES, INC.
Cohen & Steers Investment Solutions
COHEN & STEERS REAL ASSETS FUND
| • | | Designed for investors seeking total return and the maximization of real returns during inflationary environments by investing primarily in real assets |
| • | | Symbols: RAPAX, RAPCX, RAPIX, RAPRX, RAPZX |
COHEN & STEERS GLOBAL REALTY SHARES
| • | | Designed for investors seeking total return, investing primarily in global real estate equity securities |
| • | | Symbols: CSFAX, CSFCX, CSSPX, GRSRX, CSFZX |
COHEN & STEERS REALTY SHARES
| • | | Designed for investors seeking total return, investing primarily in U.S. real estate securities |
COHEN & STEERS REAL ESTATE SECURITIES FUND
| • | | Designed for investors seeking total return, investing primarily in U.S. real estate securities |
| • | | Symbols: CSEIX, CSCIX, CREFX, CSDIX, CIRRX, CSZIX |
COHEN & STEERS INSTITUTIONAL REALTY SHARES
| • | | Designed for institutional investors seeking total return, investing primarily in U.S. real estate securities |
COHEN & STEERS INTERNATIONAL REALTY FUND
| • | | Designed for investors seeking total return, investing primarily in international(non-U.S.) real estate securities |
| • | | Symbols: IRFAX, IRFCX, IRFIX, IRFRX, IRFZX |
COHEN & STEERS GLOBAL INFRASTRUCTURE FUND
| • | | Designed for investors seeking total return, investing primarily in global infrastructure securities |
| • | | Symbols: CSUAX, CSUCX, CSUIX, CSURX, CSUZX |
COHEN & STEERS
MLP & ENERGY OPPORTUNITY FUND
| • | | Designed for investors seeking total return, investing primarily in midstream energy master limited partnership (MLP) units and related stocks |
| • | | Symbols: MLOAX, MLOCX, MLOIX, MLORX, MLOZX |
COHEN & STEERS
LOW DURATION PREFERREDAND INCOME FUND
| • | | Designed for investors seeking high current income and capital preservation by investing inlow-duration preferred and other income securities issued by U.S. andnon-U.S. companies |
| • | | Symbols: LPXAX, LPXCX, LPXIX, LPXRX, LPXZX |
COHEN & STEERS
PREFERRED SECURITIESAND INCOME FUND
| • | | Designed for investors seeking total return (high current income and capital appreciation), investing primarily in preferred and debt securities issued by U.S. andnon-U.S. companies |
| • | | Symbols: CPXAX, CPXCX, CPXFX, CPXIX, CPRRX, CPXZX |
COHEN & STEERS DIVIDEND VALUE FUND
| • | | Designed for investors seeking long-term growth of income and capital appreciation, investing primarily in dividend paying common stocks and preferred stocks |
| • | | Symbols: DVFAX, DVFCX, DVFIX, DVFRX, DVFZX |
Distributed by Cohen & Steers Securities, LLC.
COHEN & STEERS GLOBAL REALTY MAJORS ETF
| • | | Designed for investors who seek a relativelylow-cost passive approach for investing in a portfolio of global real estate equity securities of companies in a specified index |
Distributed by ALPS Portfolio Solutions Distributor, Inc.
ISHARES COHEN & STEERS
REALTY MAJORS INDEX FUND
| • | | Designed for investors who seek a relativelylow-cost passive approach for investing in a portfolio of U.S. real estate equity securities of companies in a specified index |
Distributed by BlackRock Investments, LLC.
Please consider the investment objectives, risks, charges and expenses of any Cohen & Steers U.S. registeredopen-end fund carefully before investing. A summary prospectus and prospectus containing this and other information can be obtained by calling800-330-7348 or by visiting cohenandsteers.com. Please read the summary prospectus and prospectus carefully before investing.
56
COHEN & STEERS GLOBAL REALTY SHARES, INC.
OFFICERS AND DIRECTORS
Robert H. Steers
Director and Chairman
Joseph M. Harvey
Director and Vice President
Michael G. Clark
Director
George Grossman
Director
Dean A. Junkans
Director
Gerald J. Maginnis
Director
Jane F. Magpiong
Director
Daphne L. Richards
Director
Frank K. Ross
Director
C. Edward Ward, Jr.
Director
Adam M. Derechin
President and Chief Executive Officer
Jon Cheigh
Vice President
Dana A. DeVivo
Secretary and Chief Legal Officer
James Giallanza
Chief Financial Officer
Albert Laskaj
Treasurer
Lisa D. Phelan
Chief Compliance Officer
KEY INFORMATION
Investment Advisor
Cohen & Steers Capital Management, Inc.
280 Park Avenue
New York, NY 10017
(212)832-3232
Co-administrator and Custodian
State Street Bank and Trust Company
One Lincoln Street
Boston, MA 02111
Transfer Agent
DST Asset Manager Solutions, Inc.
P.O. Box 219953
Kansas City, MO 64121-9953
(800)437-9912
Legal Counsel
Ropes & Gray LLP
1211 Avenue of the Americas
New York, NY 10036
Distributor
Cohen & Steers Securities, LLC
280 Park Avenue
New York, NY 10017
| | |
| NASDAQ Symbol: Class | | A—CSFAX |
| | C—CSFCX |
| | F—GRSFX* |
| | I—CSSPX |
| | R—GRSRX |
| | T—GRSTX* |
| | Z—CSFZX |
Website: cohenandsteers.com
This report is authorized for delivery only to shareholders of Cohen & Steers Global Realty Shares, Inc. unless accompanied or preceded by the delivery of a currently effective prospectus setting forth details of the Fund. Performance data quoted represent past performance. Past performance is no guarantee of future results and your investment may be worth more or less at the time you sell your shares.
| * | Class F and Class T shares are currently not available for purchase. |
57
eDelivery AVAILABLE
Stop traditional mail delivery;
receive your shareholder reports
and prospectus online.
Sign up at cohenandsteers.com

Cohen & Steers
Global Realty
Shares
Annual Report December 31, 2018
Beginning on January 1, 2021, as permitted by regulations adopted by the U.S. Securities and Exchange Commission, paper copies of the Fund’s annual and semi-annual shareholder reports will no longer be sent by mail, unless you specifically request paper copies of the reports. Instead, the reports will be made available on the Fund’s website at www.cohenandsteers.com, and you will be notified by mail each time a report is posted and provided with a website link to access the report.
If you have already elected to receive shareholder reports electronically, you will not be affected by this change and you need not take any action. You may elect to receive shareholder reports and other communications from a Fund electronically anytime by contacting your financial intermediary or, if you are a direct investor, by signing up at www.cohenandsteers.com.
Beginning on January 1, 2019, you may elect to receive all future reports in paper free of charge. If you invest through a financial intermediary, you can contact your financial intermediary or, if you are a direct investor, you can call (800) 330-7348 to let the Fund know you wish to continue receiving paper copies of your shareholder reports. Your election to receive reports in paper will apply to all Funds held in your account if you invest through your financial intermediary or all Funds held within the fund complex if you invest directly with the Fund.
CSFAXAR
Item 2. Code of Ethics.
The registrant has adopted an Amended and Restated Code of Ethics that applies to its Principal Executive Officer and Principal Financial Officer. The Code of Ethics was in effect during the reporting period. The registrant amended the personal trading ‘blackout period’ in the Code of Ethics during the reporting period to reflect changes to the timeline for processing Fund distributions. The registrant has not granted any waiver, including an implicit waiver, from a provision of the Code of Ethics as described in FormN-CSR during the reporting period. A current copy of the Code of Ethics is available on the registrant’s website at https://www.cohenandsteers.com/assets/content/uploads/Code_of_Ethics_for_Principal_Executive_and_Principal_Financial_Officers_of_the_Funds.pdf. Upon request, a copy of the Code of Ethics can be made by calling800-330-7348 or writing to the Secretary of the registrant, 280 Park Avenue, 10th floor, New York, NY 10017.
Item 3. Audit Committee Financial Expert.
The registrant’s board has determined that Gerald J. Maginnis and Frank K. Ross qualify as audit committee financial experts based on their years of experience in the public accounting profession. The registrant’s board has determined that Michael G. Clark qualifies as an audit committee financial expert based on his years of experience in the public accounting profession and the investment management and financial services industry. Until December 31, 2018, each of Messrs. Clark, Ross and Maginnis was a member of the board’s audit committee, and each was “independent” as such term is defined in FormN-CSR. Mr. Ross retired from the registrant’s board on December 31, 2018 pursuant to the Fund’s mandatory retirement policy and is no longer a member of the board’s audit committee. Effective January 1, 2019, each of Messrs. Clark and Maginnis is a member of the board’s audit committee, and each is independent as such term is defined in FormN-CSR.
Item 4. Principal Accountant Fees and Services.
(a) – (d) Aggregate fees billed to the registrant for the last two fiscal years ended December 31, 2018 and December 31, 2017 for professional services rendered by the registrant’s principal accountant were as follows:
| | | | | | | | |
| | | 2018 | | | 2017 | |
Audit Fees | | $ | 44,910 | | | $ | 44,030 | |
Audit-Related Fees | | $ | 0 | | | $ | 9,250 | |
Tax Fees | | $ | 5,660 | | | $ | 5,550 | |
All Other Fees | | $ | 0 | | | $ | 0 | |
Audit-Related Fees were billed in connection with the registrant’s reorganization with Cohen & Steers Institutional Global Realty Shares, Inc.
Tax fees were billed in connection with tax compliance services, including the preparation and review of federal and state tax returns.
(e)(1) The audit committee is required to pre-approve audit andnon-audit services performed for the registrant by the principal accountant. The audit committee also is required to pre-approvenon-audit services performed by the registrant’s principal accountant for the registrant’s investment advisor and anysub-advisor (not including anysub-advisor whose role is primarily portfolio management and is subcontracted with or overseen by another investment advisor) and/or to any entity controlling, controlled by or under common control with the registrant’s investment advisor that provides ongoing services to the registrant, if the engagement for services relates directly to the operations and financial reporting of the registrant.
The audit committee may delegate pre-approval authority to one or more of its members who are independent members of the board of directors of the registrant. The member or members to whom such authority is delegated shall report any pre-approval decisions to the audit committee at its next scheduled meeting. The audit committee may not delegate its responsibility topre-approve services to be performed by the registrant’s principal accountant to the investment advisor.
(e)(2) No services included in (b) – (d) above were approved by the audit committee pursuant to paragraphs (c)(7)(i)(C) of Rule2-01 of RegulationS-X.
(f) Not applicable.
(g) For the fiscal years ended December 31, 2018 and December 31, 2017, the aggregate fees billed by the registrant’s principal accountant fornon-audit services rendered to the registrant and fornon-audit services rendered to the registrant’s investment advisor (not including anysub-advisor whose role is primarily portfolio management and is subcontracted with or overseen by another investment advisor) and/or to any entity controlling, controlled by or under common control with the registrant’s investment advisor that provides ongoing services to the registrant were:
| | | | | | | | |
| | | 2018 | | | 2017 | |
Registrant | | $ | 5,660 | | | $ | 5,550 | |
Investment Advisor | | $ | 0 | | | $ | 0 | |
(h) The registrant’s audit committee considered whether the provision ofnon-audit services that were rendered to the registrant’s investment advisor (not including anysub-advisor whose role is primarily portfolio management and is subcontracted with or overseen by another investment advisor) and/or to any entity controlling, controlled by or under common control with the registrant’s investment advisor that provides ongoing services to the registrant that were not required to bepre-approved pursuant to paragraph (c)(7)(ii) of Rule2-01 of RegulationS-X was compatible with maintaining the principal accountant’s independence.
Item 5. Audit Committee of Listed Registrants.
Not applicable.
Item 6. Schedule of Investments.
Included in Item 1 above.
Item 7. Disclosure of Proxy Voting Policies and Procedures forClosed-End Management Investment Companies.
Not applicable.
Item 8. Portfolio Managers ofClosed-End Investment Companies.
Not applicable.
Item 9. Purchases of Equity Securities byClosed-End Management Investment Company and Affiliated Purchasers.
Not applicable.
Item 10. Submission of Matters to a Vote of Security Holders.
None.
Item 11. Controls and Procedures.
(a) The registrant’s principal executive officer and principal financial officer have concluded that the registrant’s disclosure controls and procedures are reasonably designed to ensure that information required to be disclosed by the registrant in this FormN-CSR was recorded, processed, summarized and reported within the time periods specified in the Securities and Exchange Commission’s rules and forms, based upon such officers’ evaluation of these controls and procedures as of a date within 90 days of the filing date of this report.
(b) There were no changes in the registrant’s internal control over financial reporting that occurred during the period covered by this report that have materially affected, or are reasonably likely to materially affect, the registrant’s internal control over financial reporting.
Item 12. Disclosure of Securities Lending Activities forClosed-End Management Investment Companies.
Not applicable.
Item 13. Exhibits.
(a)(1) Incorporated by reference to registrant’s Post-Effective Amendment No. 41 to its Registration Statement on FormN-1A filed with the Securities and Exchange Commission on April 27, 2018 (AccessionNo. 0001193125-18-139268).
(a)(2) Certifications of principal executive officer and principal financial officer as required by Rule30a-2(a) under the Investment Company Act of 1940.
(a)(3) Not applicable.
(a)(4) Not applicable.
(b) Certifications of chief executive officer and chief financial officer as required by Rule30a- 2(b) under the Investment Company Act of 1940.
SIGNATURES
Pursuant to the requirements of the Securities Exchange Act of 1934 and the Investment Company Act of 1940, the registrant has duly caused this report to be signed on its behalf by the undersigned, thereunto duly authorized.
COHEN & STEERS GLOBAL REALTY SHARES, INC.
| | | | |
| | |
| | By: | | /s/ Adam M. Derechin |
| | | | Name: Adam M. Derechin Title: President and Chief Executive Officer |
| |
| | Date: March 7, 2019 |
Pursuant to the requirements of the Securities Exchange Act of 1934 and the Investment Company Act of 1940, this report has been signed below by the following persons on behalf of the registrant and in the capacities and on the dates indicated.
| | | | |
| | |
| | By: | | /s/ Adam M. Derechin |
| | | | Name: Adam M. Derechin Title: President and Chief Executive Officer (Principal Executive Officer) |
| | |
| | By: | | /s/ James Giallanza |
| | | | Name: James Giallanza Title: Chief Financial Officer (Principal Financial Officer) |
| |
| | Date: March 7, 2019 |