Exhibit 99.1
SBA Communications Corporation October 2004
Introduction
Jeff Stoops
President & Chief Executive Officer and
Tony Macaione
Chief Financial Officer
2
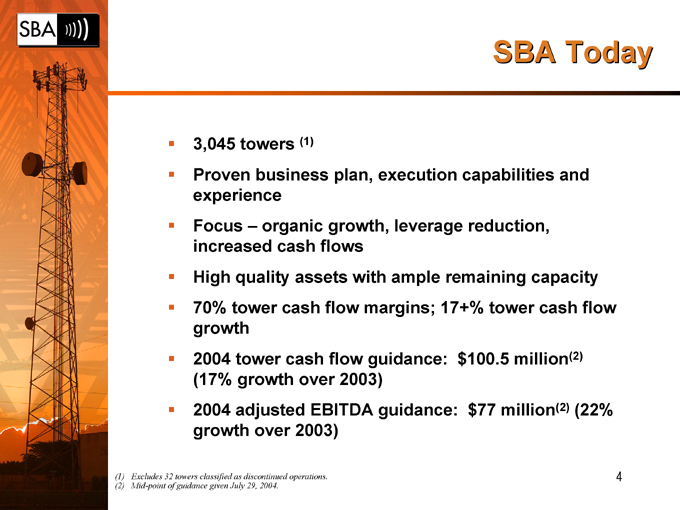
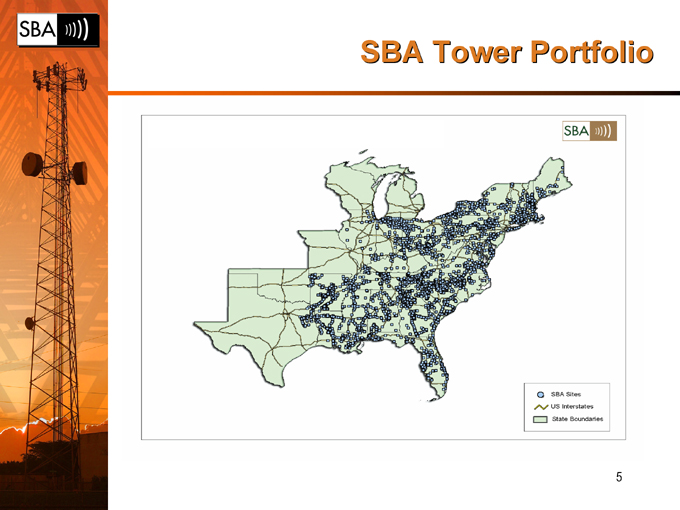
SBA Tower Portfolio
5
Tower Industry Fundamentals
Industry Dynamics Remain Strong
Mission critical to wireless carrier industry
Strong recurring cash flow from multi-year lease contracts High margins and significant projected free cash flow Substantial barriers to entry Exclusive assets provide pricing power Low maintenance capex No overcapacity No material threat of technical or operational obsolescence Highly scalable business / leveragable overhead
6
Asset Quality – Key Strength
60% of portfolio built by SBA
All towers built or bought with multi-tenant focus Average capacity – 4+ tenants Current use – 2.3 tenants per tower
Maintenance capex – approximately $1,000 per tower per year
Average remaining ground lease term (with renewal options) – 32 years
Average height – 226’
Structure – 74% guyed or lattice towers
Low monthly operating expense per tower
Result: Strong Lease-up and Tower Cash Flow Growth
7
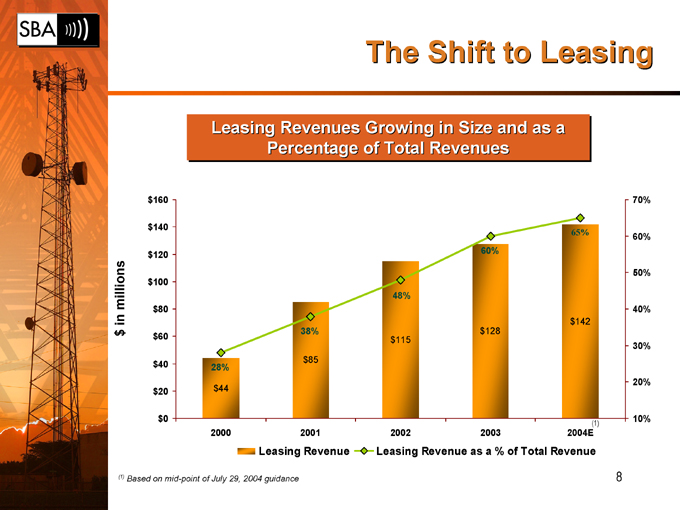
The Shift to Leasing
Leasing Revenues Growing in Size and as a Percentage of Total Revenues
$ in millions
$160 $140 $120 $100 $80 $60 $40 $20 $0
28%
$44
38%
$85
48%
$115
60%
$128
65%
$142
70% 60% 50% 40% 30% 20% 10%
(1)
2000 2001 2002 2003 2004E
Leasing Revenue
Leasing Revenue as a % of Total Revenue
(1) Based on mid-point of July 29, 2004 guidance
8
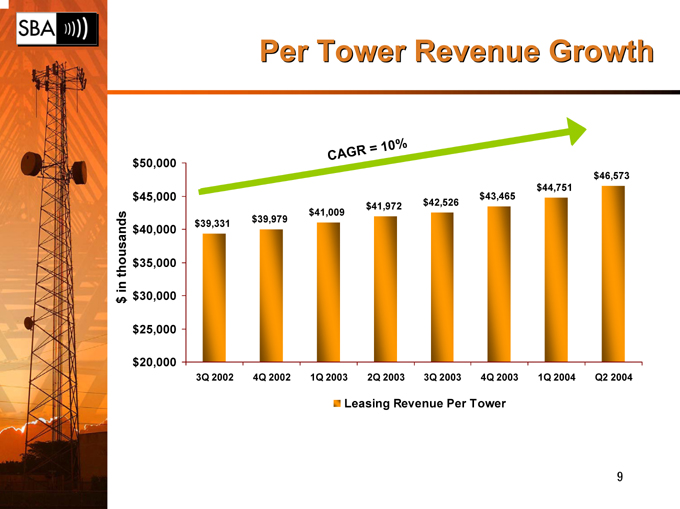
Per Tower Revenue Growth
$ in thousands
$50,000 $45,000 $40,000 $35,000 $30,000 $25,000 $20,000
CAGR = 10%
$46,573 $44,751 $43,465 $41,972 $42,526 $41,009 $39,331 $39,979
3Q 2002 4Q 2002 1Q 2003 2Q 2003 3Q 2003 4Q 2003 1Q 2004 Q2 2004
Leasing Revenue Per Tower
9
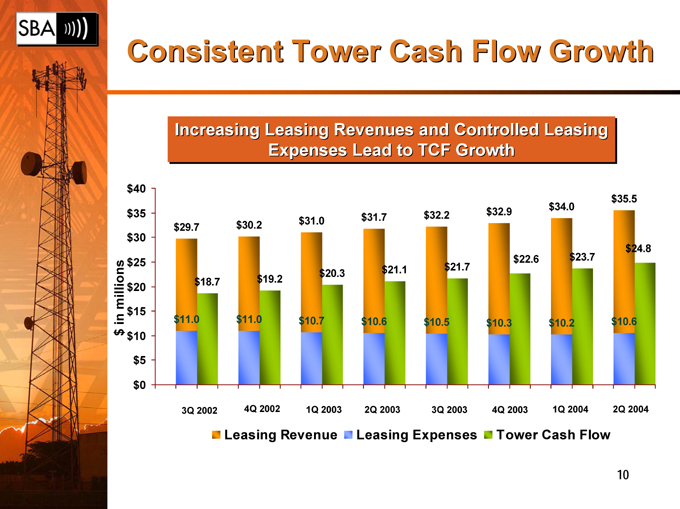
Consistent Tower Cash Flow Growth
Increasing Leasing Revenues and Controlled Leasing Expenses Lead to TCF Growth
$ in millions
$40 $35 $30 $25 $20 $15 $10 $5 $0
$35.5 $34.0 $32.2 $32.9 $31.0 $31.7 $29.7 $30.2
$24.8 $22.6 $23.7 $21.1 $21.7 $20.3 $18.7 $19.2
$11.0 $11.0 $10.7 $10.6 $10.5 $10.3 $10.2 $10.6
3Q 2002 4Q 2002 1Q 2003 2Q 2003 3Q 2003 4Q 2003 1Q 2004 2Q 2004
Leasing Revenue
Leasing Expenses
Tower Cash Flow
10
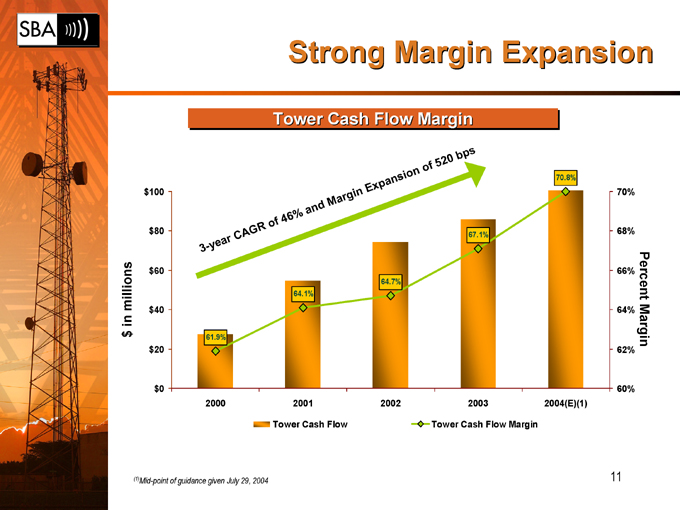
Strong Margin Expansion
Tower Cash Flow Margin
$ in millions
$100
$80
$60
$40
$20
$0
3-year
CAGR o f
and Margin Expansion of 520 bps
61.9%
64.1%
64.7%
67.1%
70.8%
70%
68%
66%
64%
62%
60%
Percent Margin
2000 2001 2002 2003 2004(E)(1)
Tower Cash Flow Tower Cash Flow Margin
(1)Mid-point of guidance given July 29, 2004 11
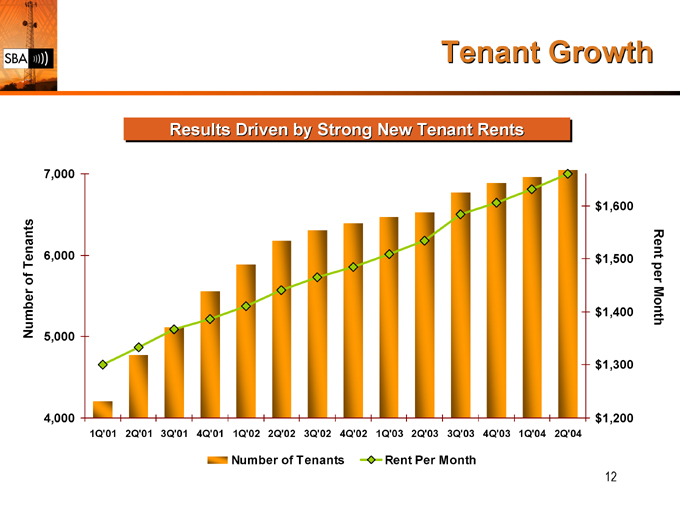
Tenant Growth
Results Driven by Strong New Tenant Rents
Number of Tenants
7,000 6,000 5,000 4,000
Rent per Month
$1,600 $1,500 $1,400 $1,300 $1,200
1Q’01 2Q’01 3Q’01 4Q’01 1Q’02 2Q’02 3Q’02 4Q’02 1Q’03 2Q’03 3Q’03 4Q’03 1Q’04 2Q’04
Number of Tenants Rent Per Month
12
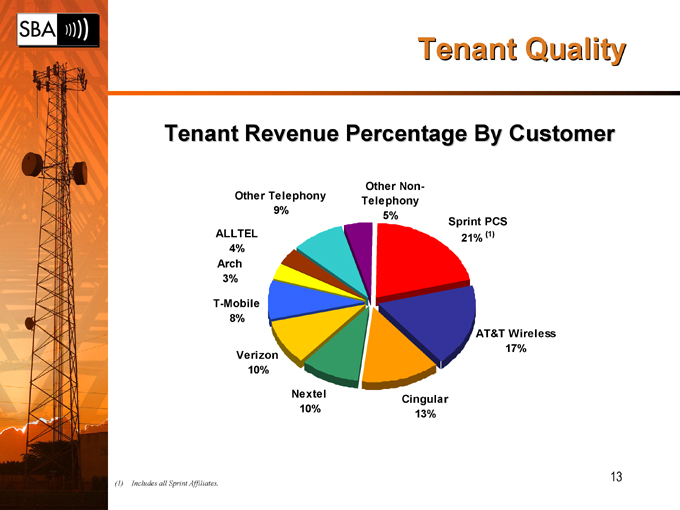
Tenant Quality
Tenant Revenue Percentage By Customer
Other Non-Telephony 5%
Sprint PCS
21% (1)
AT&T Wireless 17%
Cingular 13%
Nextel 10%
Verizon 10%
T-Mobile 8%
Arch 3%
ALLTEL
4%
Other Telephony 9%
(1) Includes all Sprint Affiliates.
13
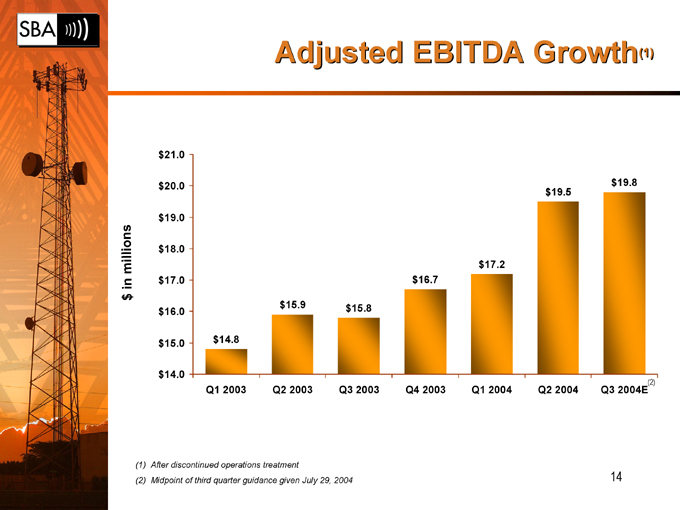
Adjusted EBITDA Growth(1)
$ in millions
$21.0 $20.0 $19.0 $18.0 $17.0 $16.0 $15.0 $14.0
$14.8
$15.9
$15.8
$16.7
$17.2
$19.5
$19.8
Q1 2003 Q2 2003 Q3 2003 Q4 2003 Q1 2004 Q2 2004 Q3 2004E(2)
(1) After discontinued operations treatment
(2) Midpoint of third quarter guidance given July 29, 2004
14
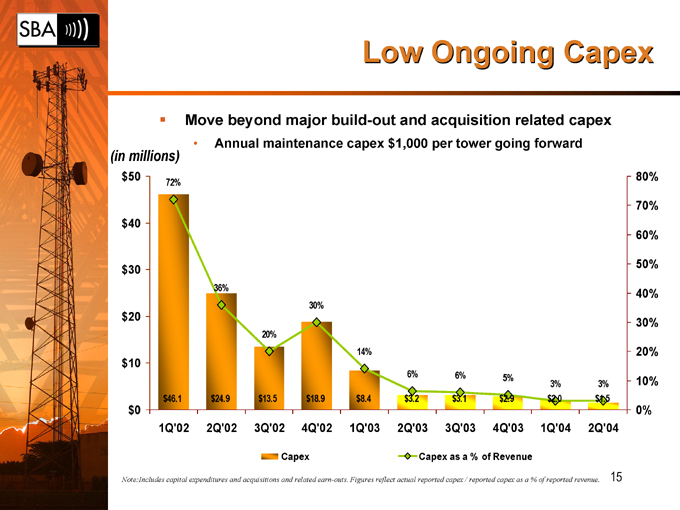
Low Ongoing Capex
Move beyond major build-out and acquisition related capex
Annual maintenance capex $1,000 per tower going forward
(in millions)
$50 $40 $30 $20 $10 $0
72%
36%
20%
30%
14%
6% 6% 5%
3% 3%
$46.1 $24.9 $13.5 $18.9 $8.4 $3.2 $3.1 $2.9 $2.0 $1.5
80% 70% 60% 50% 40% 30% 20% 10% 0%
1Q’02 2Q’02 3Q’02 4Q’02 1Q’03 2Q’03 3Q’03 4Q’03 1Q’04 2Q’04
Capex Capex as a % of Revenue
Note:Includes capital expenditures and acquisitions and related earn-outs. Figures reflect actual reported capex / reported capex as a % of reported revenue. 15
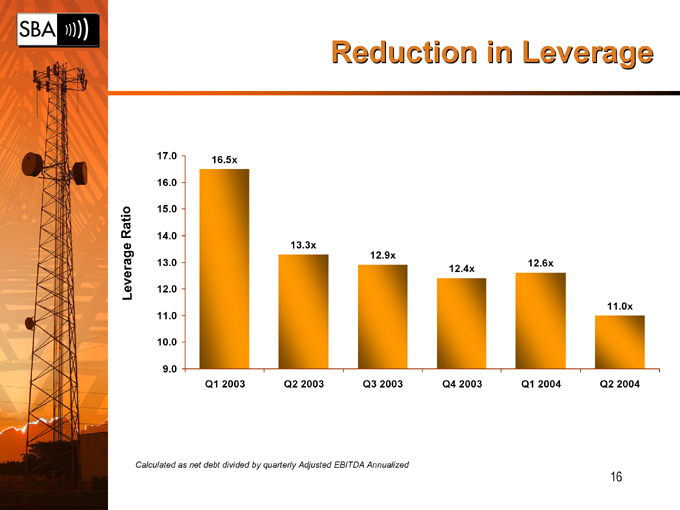
Reduction in Leverage
Leverage Ratio
17.0
16.0
15.0
14.0
13.0
12.0
11.0
10.0
9.0
16.5x
13.3x
12.9x
12.4x
12.6x
11.0x
Q1 2003 Q2 2003 Q3 2003 Q4 2003 Q1 2004 Q2 2004
Calculated as net debt divided by quarterly Adjusted EBITDA Annualized
16
SBA – Goals For The Foreseeable Future
Reduce leverage each year and transfer enterprise value to shareholders
Resume discretionary portfolio growth while maintaining comfortable liquidity cushion
Maximize tower cash flow and adjusted EBITDA growth
Steadily increase equity free cash flow per share
Opportunistically refinance to reduce weighted average cost of debt
A Growth Company in a Growth Industry
17
Multiple Paths to Increase Free Cash Flow
More tenants
More equipment from existing tenants
Escalators and renewals Reduce tower expense Reduce capex Increase services revenue Increase services margin
Refinance debt at lower rates Reduce overhead expense Buy underlying ground leases Repurchase high yield debt
Reinvest in additional tower assets
18