SBA Communications SBA Communications Corporation Corporation Exhibit 99.1 |
2 SEC Disclosures SEC Disclosures SEC Disclosures Statements made in the course of this presentation that state the Company’s or management’s intentions, hopes, beliefs, expectations or predictions of the future are forward-looking statements. It is important to note that the Company’s actual results could differ materially from those projected in such forward-looking statements. Additional information concerning factors that could cause actual results to differ materially from those in the forward-looking statements is contained from time to time in the Company’s SEC filings, including but not limited to the Company’s report on Form 10-K dated March 16, 2005 and 10-Q dated November 9, 2005. Our comments will include non-GAAP financial measures, as defined in Regulation G. The reconciliations of these non-GAAP financial measures to their most comparable GAAP financial measures and other information required by Regulation G are included in our press release issued on February 20, 2006 and prior press releases, and have been posted on our website – www.sbasite.com. Copies of which may be obtained by contacting the Company or the SEC. |
3 Why SBAC? Why SBAC? Why SBAC? Wireless is the fastest growing segment of Telecom Exclusive tower assets of high quality protected by high barriers to entry Strong organic tower cash flow and adjusted EBITDA growth Potential for accelerated growth through adding new assets at accretive prices Value creation through continuous use of appropriate leverage, reinvestment and return to shareholders The Answer is High Quality Growth The Answer is High Quality Growth |
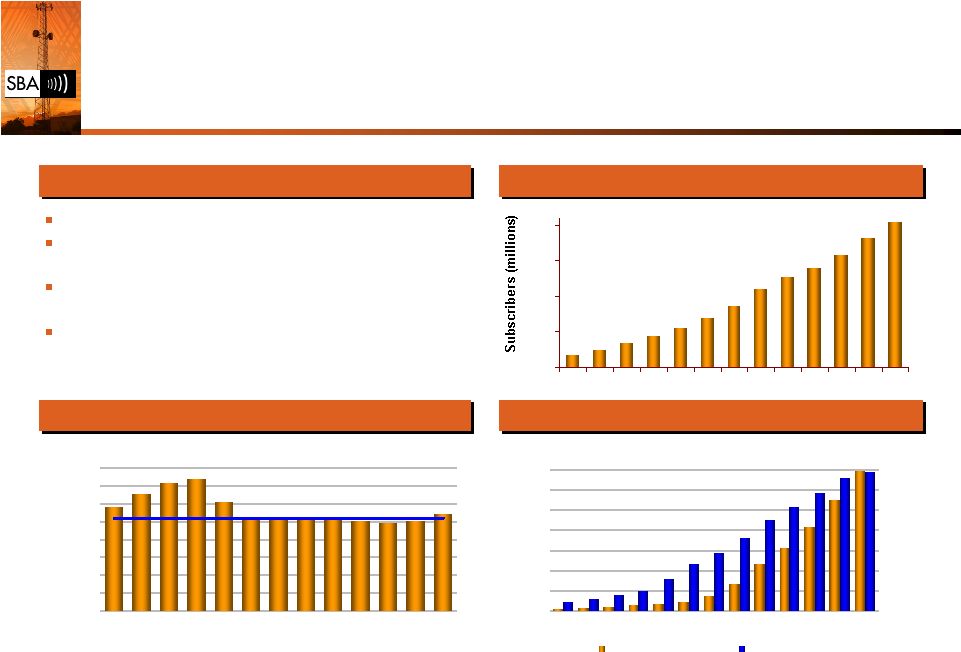
4 1,169 1,306 1,427 1,477 1,217 1,060 1,052 1,051 1,026 1,008 991 1,006 1,089 0 200 400 600 800 1,000 1,200 1,400 1,600 '93 '94 '95 '96 '97 '98 '99 '00 '01 '02 '03 '04 '05 (1) Kagan Tower Investor, December 2005. (2) CTIA, 2005 Semi-Annual Wireless Industry Survey. Demand Drivers Demand Drivers Summary Summary Wireless Subscriber Growth (1)(2) Wireless Subscriber Growth (1)(2) Historical Subs per Cell Site (1)(2) Historical Historical Subs Subs per per Cell Cell Site Site (1)(2) (1)(2) Historical MOUs and Cell Sites (1)(2) Historical MOUs and Cell Sites (1)(2) ~25 mm net adds in 2005 Over 1 trillion MOUs in 2004 and over 2 trillion projected by 2008 (1) ~70% wireless penetration today and 78% projected by 2008 (1) 182 mm subscribers in 2004 (2) and 239 mm projected by 2008 (1) Cell Site = 1,038 Subscribers (r² = 99%) Avg. Cell Sites (thousands) Total MOUs (billions) Avg. Subs / Avg. Cell Site 19 27 38 148 1389 89 63 52 830 1101 620 259 457 12 15 20 26 41 59 74 151 169 178 133 116 93 0 200 400 600 800 1,000 1,200 1,400 '93 '94 '95 '96 '97 '98 '99 '00 '01 '02 '03 '04 '05 0 20 40 60 80 100 120 140 160 180 MOUs Average Cell Sites 16 24 34 44 55 69 86 109 128 141 159 182 206 0 50 100 150 200 '93 '94 '95 '96 '97 '98 '99 '00 '01 '02 '03 '04 '05 |
5 Future Expectations Future Expectations Increased subscribers and minutes of use Increased penetration rates – U.S. (70%) still well below Europe and Japan (95%+) Basic voice network enhancements Data network rollouts and enhancements Additional spectrum deployments New market entrants as tower customers New wireless products and technologies from current customers Towers are essential to delivery of wireless Towers are essential to delivery of wireless |
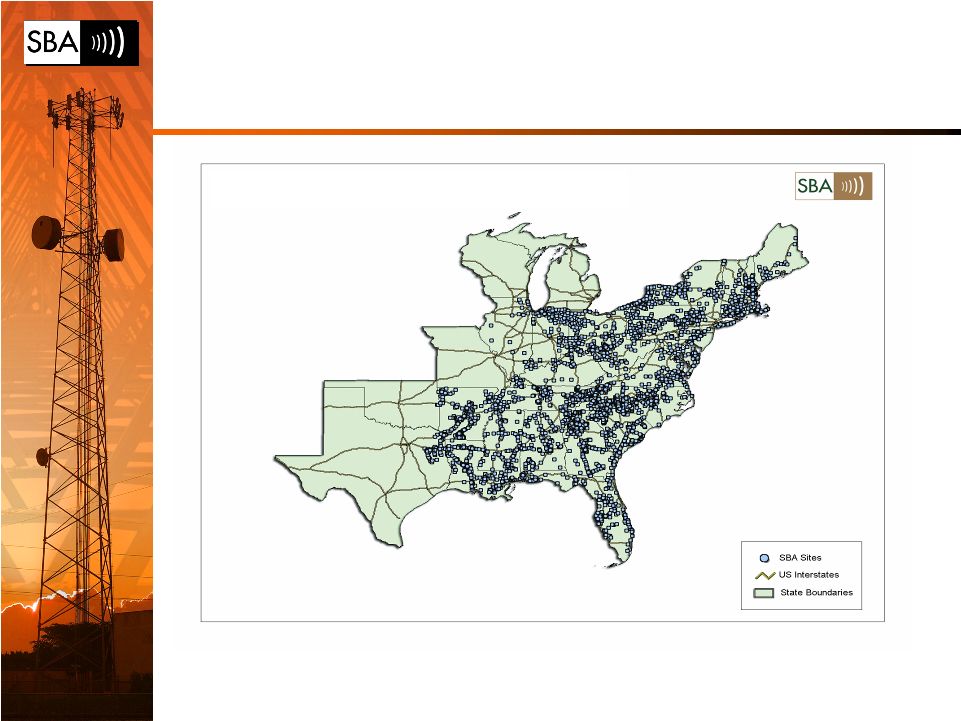
6 SBA Tower Portfolio SBA Tower Portfolio SBA Tower Portfolio |
7 Asset Quality – Key Strength Asset Quality – Asset Quality – Key Strength Key Strength Substantial majority of portfolio built by SBA or other tower developers All towers built or bought with multi-tenant focus Average capacity – 4+ telephony tenants Ample remaining capacity - current use – 2.5 tenants per tower Maintenance capex – less than $1,000 per tower per year Average remaining ground lease term (with renewal options) – 36 years Average height – approximately 228’ Structure – 74% guyed or lattice towers Low monthly operating expense per tower |
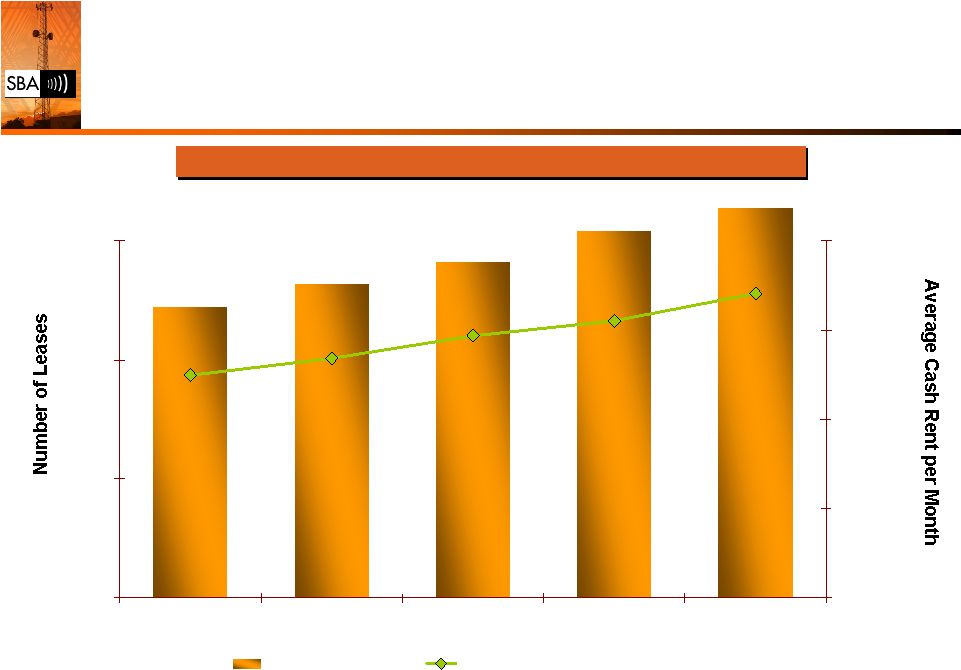
Solid Tenant Growth Solid Tenant Growth Solid Tenant Growth 5,000 6,000 7,000 8,000 4Q 04 Q1 05 Q2 05 Q3 05 Q4 05 $1,400 $1,500 $1,600 $1,700 $1,800 Number of Leases Average Cash Rent Per Month 8 Results Driven by Strong New Tenant Rents Results Driven by Strong New Tenant Rents Results Driven by Strong New Tenant Rents $1,649 7,449 7,640 $1,668 7,823 $1,694 8,086 $1,711 $1,741 8,278 |
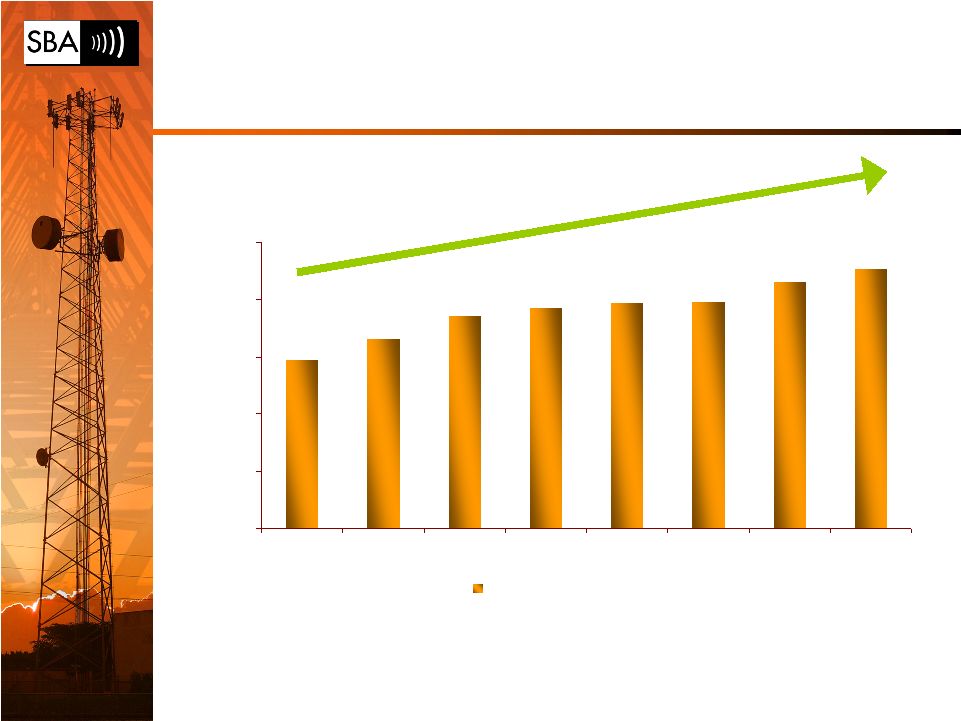
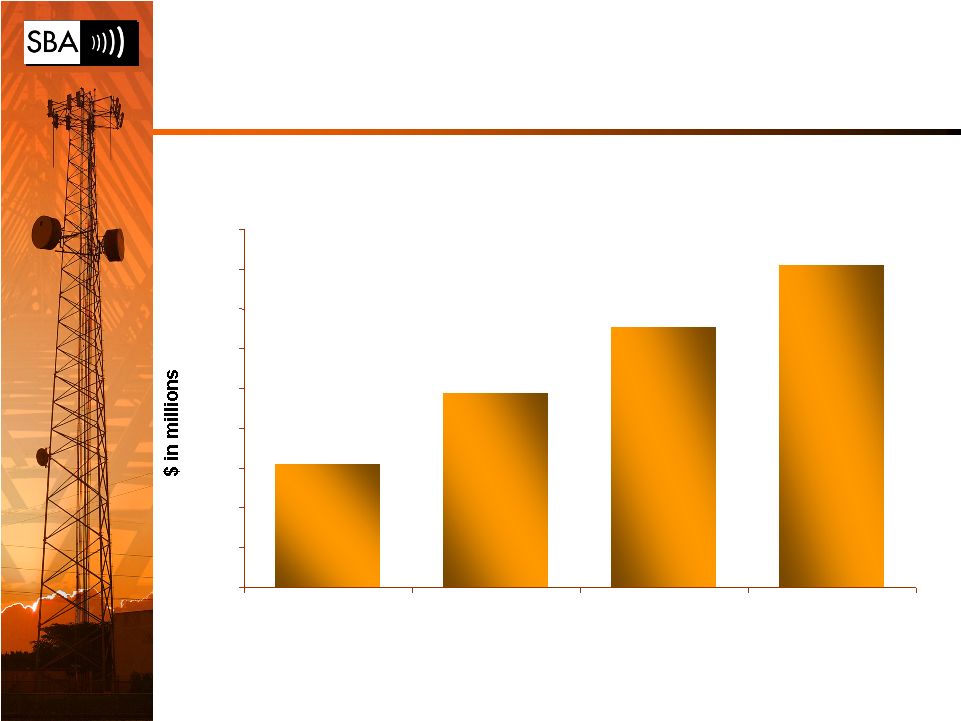
9 Per Tower Revenue Growth (1) Per Per Tower Tower Revenue Revenue Growth Growth (1) (1) $44,751 $46,573 $48,588 $49,682 $49,836 $51,557 $52,643 $49,218 $30,000 $35,000 $40,000 $45,000 $50,000 $55,000 1Q 04 2Q 04 3Q 04 4Q 04 1Q 05 2Q 05 3Q 05 4Q 05 Leasing Revenue Per Tower (1) Revenue as reported divided by average number of towers. |
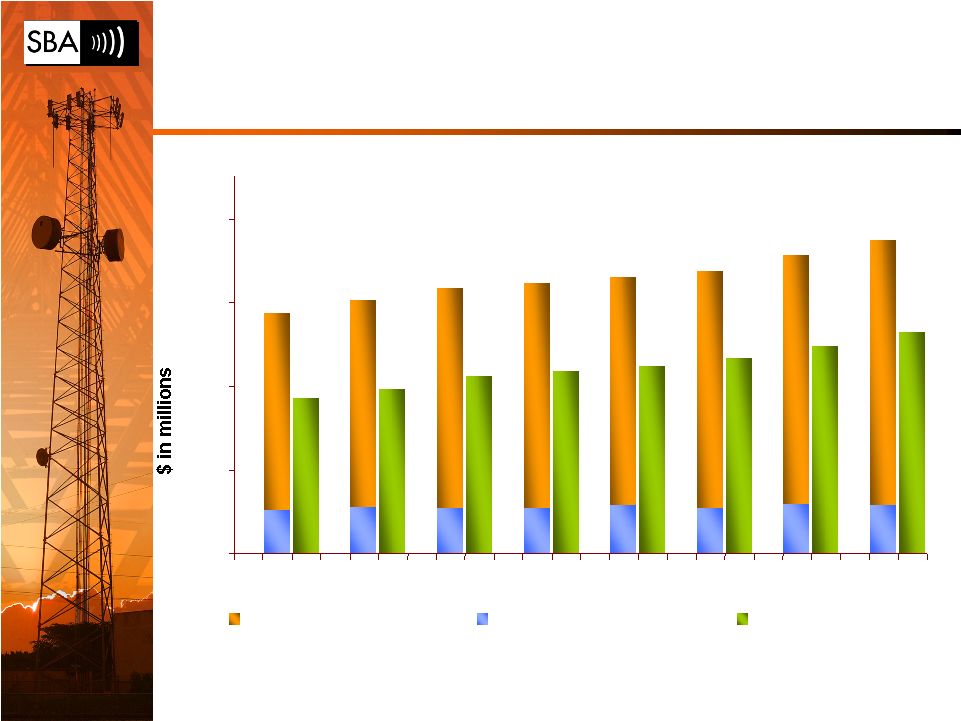
Consistent Tower Cash Flow Growth Consistent Tower Cash Flow Growth Consistent Tower Cash Flow Growth 1Q 04 2Q 04 3Q 04 4Q 04 10 1Q 05 2Q O5 3Q O5 4Q 05 $33.6 $35.2 $37.3 $37.9 $38.7 $40.6 $42.3 $10.2 $10.6 $10.5 $10.5 $10.7 $10.4 $10.8 $10.7 $23.5 $24.6 $26.2 $26.8 $27.3 $36.7 $29.8 $31.5 $28.4 $5 $15 $25 $35 $45 Cash Leasing Revenue Cash Leasing Expenses Tower Cash Flow |
11 Strong TCF Margin Expansion Strong TCF Margin Expansion Strong TCF Margin Expansion 69.8% 69.9% 71.4% 72.0% 71.9% 74.6% 73.5% 73.3% $0 $10 $20 $30 $40 Q1 04 Q2 04 Q3 04 Q4 04 Q1 05 Q2 05 Q3 05 Q4 05 60% 65% 70% 75% 80% 85% Tower Cash Flow Tower Cash Flow Margin |
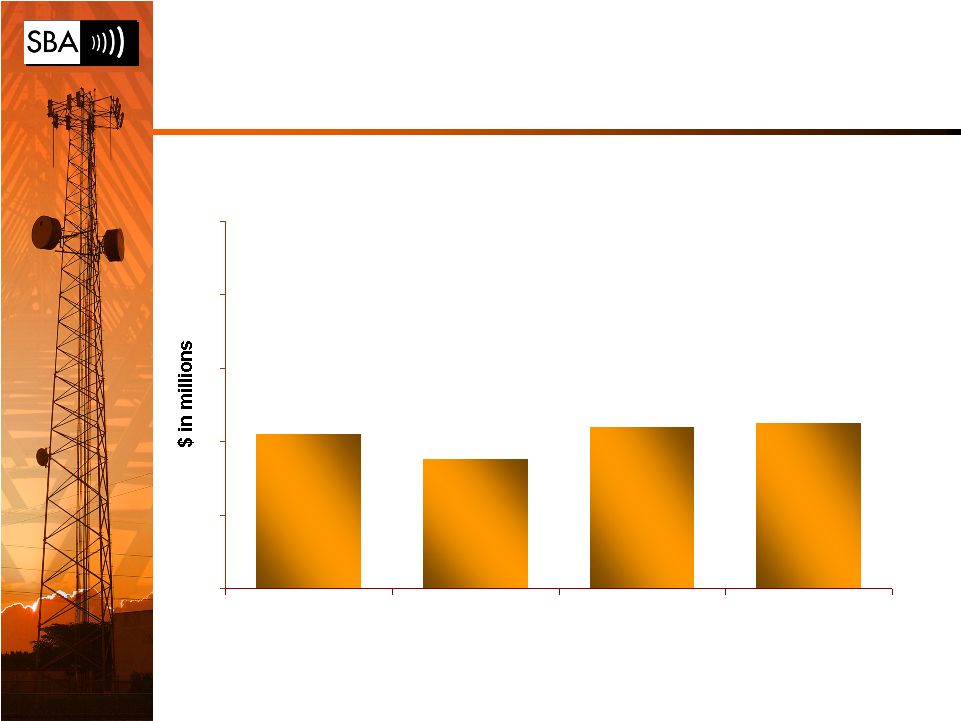
12 Low Non-Discretionary Capex (1) Low Non-Discretionary Capex Low Non-Discretionary Capex (1) (1) (1) Includes maintenance and general corporate capital expenditures. Does not include discretionary capital expenditures. (2) Based on mid-point of guidance given February 20, 2006 (2) $4.5 $4.4 $3.5 $4.2 $0 $2 $4 $6 $8 $10 2003 2004 2005 2006(E) |
13 Strong Adjusted EBITDA Growth Strong Adjusted EBITDA Growth (1) (1) (1) From continuing operations (2) Mid-point of guidance given February 20, 2006 (2) $61.0 $78.8 $95.3 $111.0 $30.0 $40.0 $50.0 $60.0 $70.0 $80.0 $90.0 $100.0 $110.0 $120.0 2003 2004 2005 2006(E) |
14 New Asset Growth New Asset Growth New Asset Growth 5 36 90 10 164 208 0 25 50 75 100 125 150 175 200 225 250 275 2004 2005 2006 Constructed Acquired (2) (1) 15 244 254 (1) Mid point of guidance given February 20, 2006 (2) Acquisitions announced in February 20, 2006 press release |
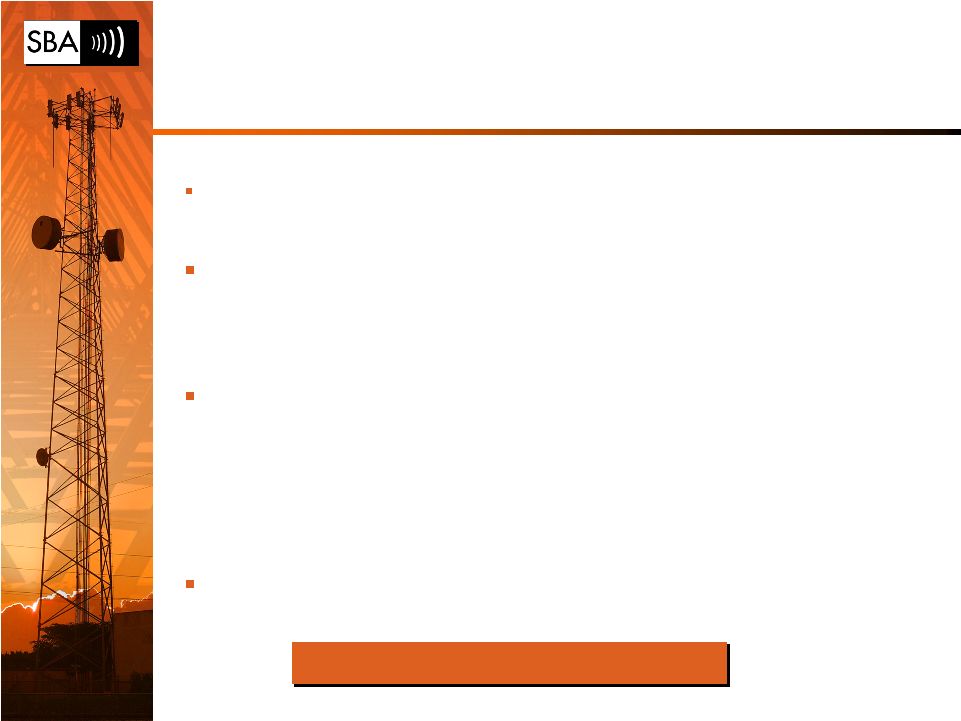
15 Adding Towers Adding Towers Highly competent at identifying, buying and building quality towers Discretionary portfolio growth while maintaining comfortable liquidity position within target leverage range Criteria for new tower builds - One tenant on day one at fair market rent - Second tenant expectation within one year - Five-year IRR greater than 20% 15% target five-year IRR for acquisitions Accretive Transactions Accretive Transactions Accretive Transactions |
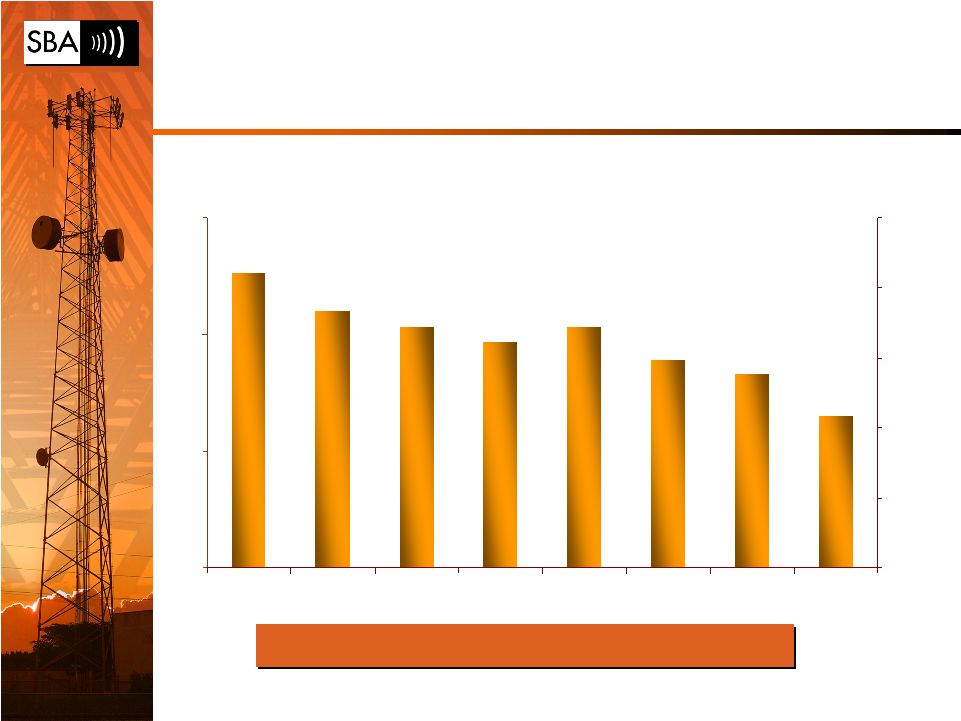
16 Rapid Deleveraging Rapid Deleveraging Rapid Deleveraging 0 5 10 15 Q1 04 Q2 04 Q3 04 Q4 04 Q1 05 Q2 05 Q3 05 Q4 05 60% 65% 70% 75% 80% 85% (1) Net debt divided by Annualized Adjusted EBITDA 12.6x 11.0x 10.3x 9.7x 10.3x 8.9x 8.3x 6.5x Target Leverage Range 6.0x – 8.0x Target Leverage Range 6.0x – Target Leverage Range 6.0x – 8.0x 8.0x |
17 Where We Are Heading Where We Are Heading Where We Are Heading Continued Growth • Organic • New Assets • Acquisitions • New builds • Ground lease purchases Continued operational excellence Further interest rate reductions Appropriate leverage Accelerated equity free cash flow growth |
SBA Communications Corporation SBA Communications SBA Communications Corporation Corporation |