 1 Information provided in this presentation represents confidential and privileged information of Noble International, Ltd. and may not be distributed without express permission of an authorized representative of Noble International, Ltd. Annual Shareholder Meeting Annual Shareholder Meeting July 17, 2008 July 17, 2008 Tom Saeli – Chief Executive Officer Exhibit 99.1 |
 2 Information provided in this presentation represents confidential and privileged information of Noble International, Ltd. and may not be distributed without express permission of an authorized representative of Noble International, Ltd. Noble International in a Changing Environment Noble Transformation Industry Trends and Challenges – How Noble Responds ArcelorMittal Relationship |
 3 Information provided in this presentation represents confidential and privileged information of Noble International, Ltd. and may not be distributed without express permission of an authorized representative of Noble International, Ltd. Who are we? World’s largest supplier of Laser Welded Blanks (LWB) Leading supplier of Roll Formed products Global footprint 23 manufacturing facilities in 12 countries spanning 4 continents Designs and builds custom-made Laser Welding systems |
 4 Information provided in this presentation represents confidential and privileged information of Noble International, Ltd. and may not be distributed without express permission of an authorized representative of Noble International, Ltd. Recent Growth Focused on Diversification $0 $200 $400 $600 $800 $1,000 $1,200 1986 1990 1995 2000 2005 2007 Develop North American LWB Market and Customers Globalization & Diversification |
 5 Information provided in this presentation represents confidential and privileged information of Noble International, Ltd. and may not be distributed without express permission of an authorized representative of Noble International, Ltd. Global Footprint (4 in Michigan) |
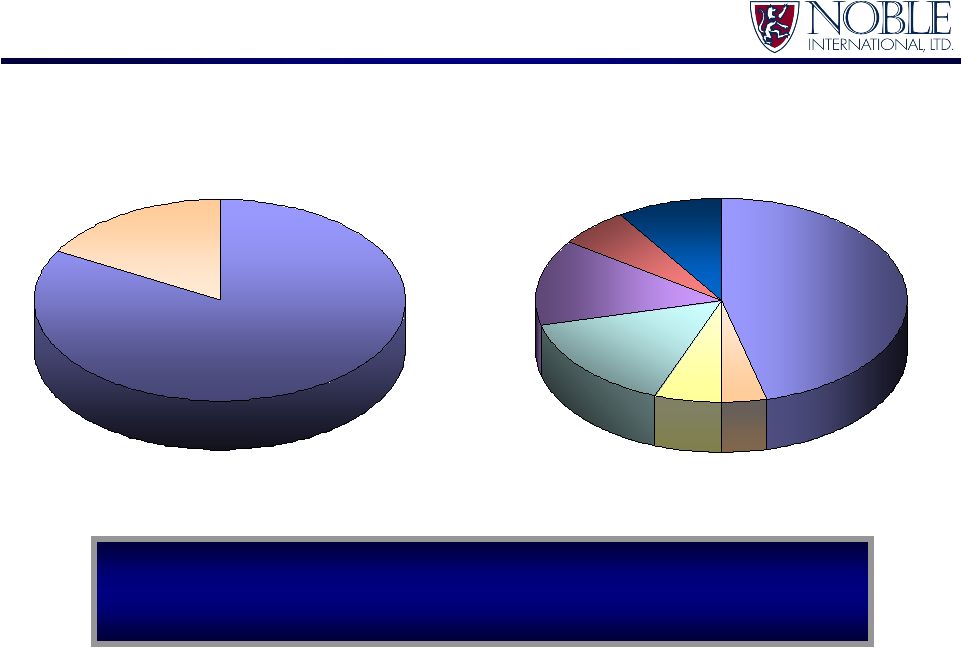 6 Information provided in this presentation represents confidential and privileged information of Noble International, Ltd. and may not be distributed without express permission of an authorized representative of Noble International, Ltd. Detroit 3 83% Other 17% Customer Diversification No single customer is > 17% of Noble’s annual revenue. Before Combination Today Source: Company Management Nissan-Renault 6% Peugeot (PSA) 13% Volkswagen 15% Ford (EU) 6% Other 9% Detroit 3 47% GM (EU) 4% |
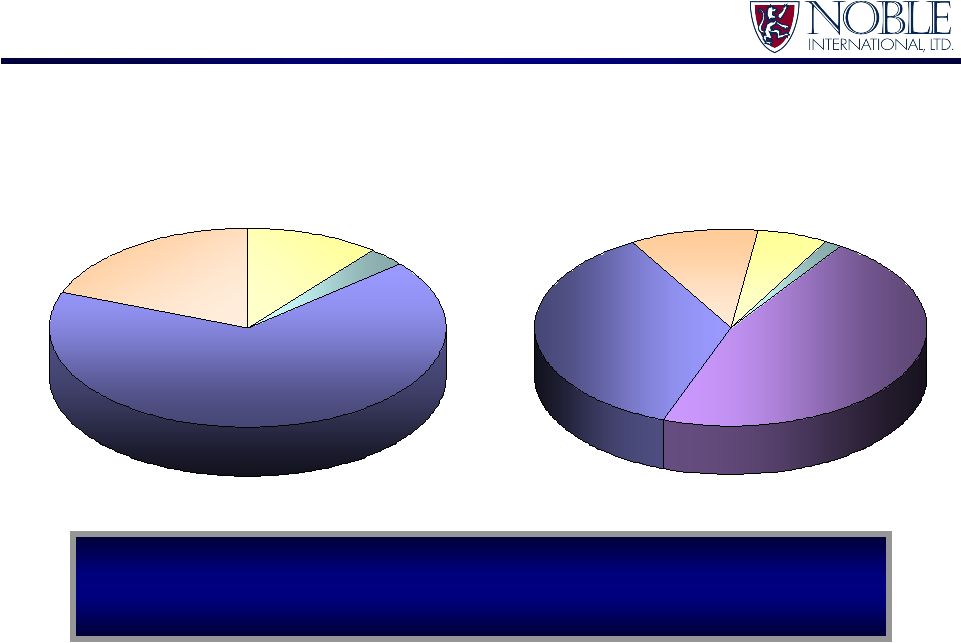 7 Information provided in this presentation represents confidential and privileged information of Noble International, Ltd. and may not be distributed without express permission of an authorized representative of Noble International, Ltd. Geographic Diversification Today Source: Company Management Noble’s revenue base is spread evenly between North America & Europe. USA 67% Canada 19% Mexico 11% Other 3% Europe 45% USA 36% Canada 11% Mexico 6% Other 2% Before Combination |
 8 Information provided in this presentation represents confidential and privileged information of Noble International, Ltd. and may not be distributed without express permission of an authorized representative of Noble International, Ltd. Platform Penetration 2007 Production Noble Nameplate (units) Content 1 Chevrolet Silverado 549,139 2 Ford F-Series Lt. Duty 509,510 3 Toyota Camry 447,934 4 Honda Civic 402,406 5 Honda Accord 382,654 6 Toyota Corolla 359,491 7 Nissan Altima 338,609 8 Chevrolet Impala 315,114 9 Ford F-Series Super Duty 294,517 10 Volkwagen Bora 272,054 11 Toyota Tundra 240,101 12 Chevrolet Cobalt 226,314 13 Ford Escape 209,774 14 Dodge Caravan 209,135 15 Dodge Ram Pickup Heavy Duty 207,389 16 GMC Sierra 203,478 17 Dodge Ram Pickup Lt. Duty 198,224 18 Honda Odyssey 196,043 19 Toyota Tacoma 192,425 20 Ford Focus 191,115 Source: Automotive News Data Center and Company Management Top 20 light vehicles in the United States 2007 Production Noble Nameplate (units) Content 1 Ford Focus C307 529,461 2 Volkswagen Golf VW350/360 501,572 3 BMW 3 Series E90 498,843 4 Opel Astra A3300 488,642 5 Peugeot 207 A7 482,911 6 Opel Corsa S4400 479,375 7 Ford Fiesta B256/B257 426,865 8 Volkswagen Passat VW461/2 395,493 9 Renault Clio BC85 351,074 10 Fiat Grande Punto 199 339,737 11 Volkswagen Polo VW240 329,665 12 Audi A4 AU461/2 282,640 13 Renault Megane X84 280,435 14 Renault Scenic J84 268,519 15 Toyota Yaris 970M/980M 263,203 16 Fiat New Panda 169 260,695 17 VAZ 2104 Range 254,612 18 Ford Transit V347/348 243,312 19 BMW 5 Series E60 237,356 20 Mercedes-Benz C-Class W204 235,623 Source: Automotive News Data Center and Company Management Top 20 light vehicles in Europe Noble supplies 70% of the top 20 light vehicle platforms in North America & Europe. |
 9 Information provided in this presentation represents confidential and privileged information of Noble International, Ltd. and may not be distributed without express permission of an authorized representative of Noble International, Ltd. Automotive Industry: Trends & Challenges |
 10 Information provided in this presentation represents confidential and privileged information of Noble International, Ltd. and may not be distributed without express permission of an authorized representative of Noble International, Ltd. Auto Industry Evolution Competitive and regulatory pressure to build lighter but safer vehicles CAFE standards Crash standards Emission standards / environment concerns Rising commodity prices Steel prices 60% over the past four years Fuel prices OEMs producing more global platforms One design produced in multiple locations around the world Requirements of suppliers with a global footprint Noble’s products and technologies address the automotive industry’s challenges. |
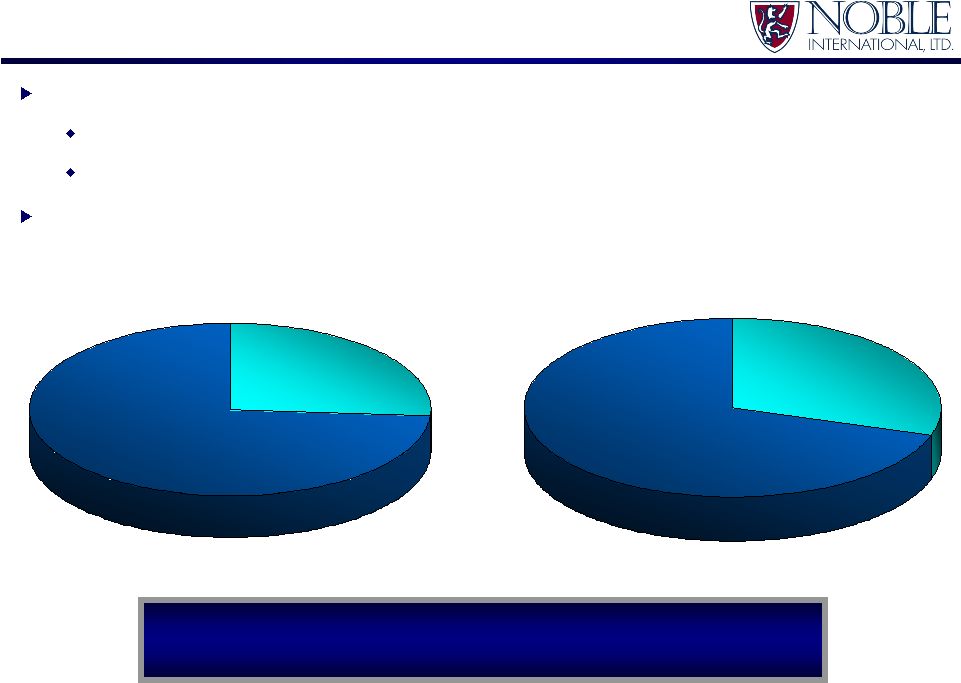 11 Information provided in this presentation represents confidential and privileged information of Noble International, Ltd. and may not be distributed without express permission of an authorized representative of Noble International, Ltd. Mega Global Platforms Definition A common design manufactured in more than one region of the world More than one million vehicles produced per year Mega Global Platforms growing at 7.3% annually; all other vehicles at 2.4% All Other Platforms 74% Global Platforms 26% Global Platforms 30% All Other Platforms 70% 2008 2013 Growth in Mega Global Platforms will increase need for global suppliers. |
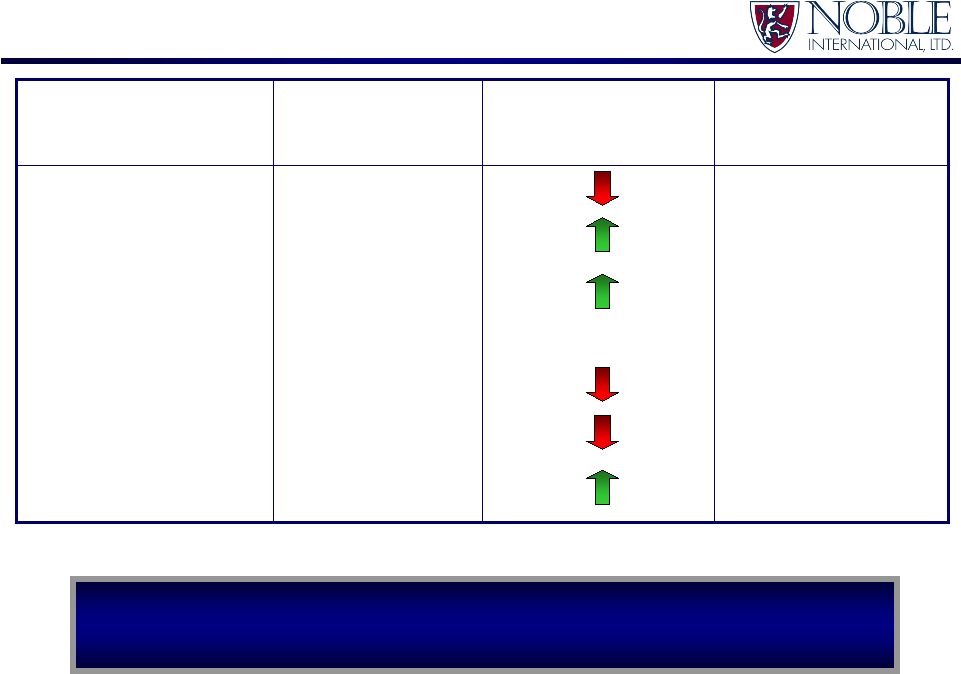 12 Information provided in this presentation represents confidential and privileged information of Noble International, Ltd. and may not be distributed without express permission of an authorized representative of Noble International, Ltd. Global Vehicle Production (72M Expected for 2008) 10% 10% 22% 22% 15% 15% 22% 22% 9% 9% 22% 22% % Today’s Total 11% 11% Rest of World 17% 17% North America 10% 10% Japan 38% 38% Asia/Pacific (excluding Japan) 10% 10% Eastern Europe 14% 14% Western Europe % Total in 2022 15 Year Trend Region Growth will occur in Asia/Pacific (excl. Japan) and Eastern Europe. Source: JD Power & Associates |
 13 Information provided in this presentation represents confidential and privileged information of Noble International, Ltd. and may not be distributed without express permission of an authorized representative of Noble International, Ltd. North American Environment Extremely Challenging Weak Economy Fuel prices, banking issues, unemployment trends Less auto demand generally, in particular for SUVs and Trucks Weak economy hurts GM, Ford, Chrysler turnaround plans GM July 15 announcement to generate $15 Billion in cash through 2009: Personnel reductions, change in retiree benefits, delayed UAW payments Further reductions in Truck volumes Reduced discretionary sales/marketing spending Suspended dividend Capital spending reductions Tighter working capital management th |
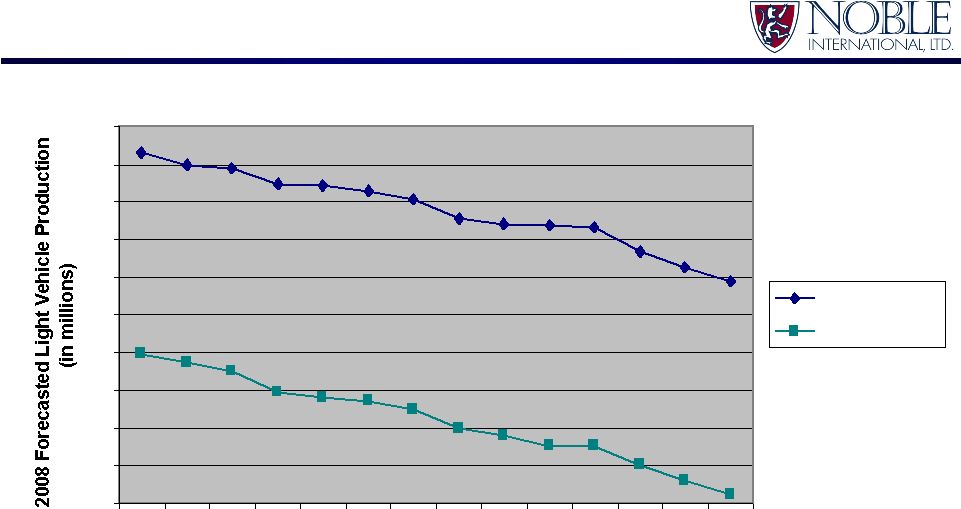 14 Information provided in this presentation represents confidential and privileged information of Noble International, Ltd. and may not be distributed without express permission of an authorized representative of Noble International, Ltd. 19.1% Reduction 31.1% Reduction 2008 North American Light Vehicle Production 8 9 10 11 12 13 14 15 16 17 18 Qtr1- 05 Qtr2- 05 Qtr3- 05 Qtr4-Qtr1- 05 06 Qtr2- 06 Qtr3- 06 Qtr4- 06 Qtr1- 07 Qtr2-Qtr3- 07 07 Qtr4- 07 Qtr1- 08 Qtr2- 08 North America "Big 3" |
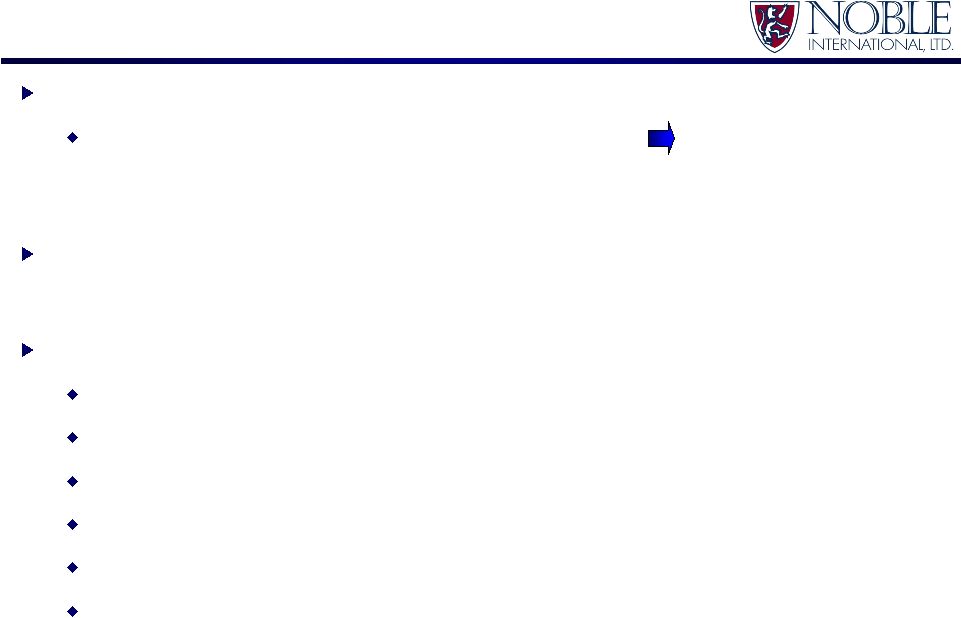
 15 Information provided in this presentation represents confidential and privileged information of Noble International, Ltd. and may not be distributed without express permission of an authorized representative of Noble International, Ltd. Noble Negatively Affected by Regional Volatility Automotive Production 2008 v. 2007 Europe: Overall volumes up slightly, particularly in Eastern Europe. Asia: Noble’s active markets, particularly China and India, up over 13%. North America: Production volumes volatile. 2008 original projections of 15.3M units. Production volumes now projected at 13.9M units. Largest volume declines from Ford, GM and Chrysler. Reduces Noble North America revenues by $100M compared to 2007. |
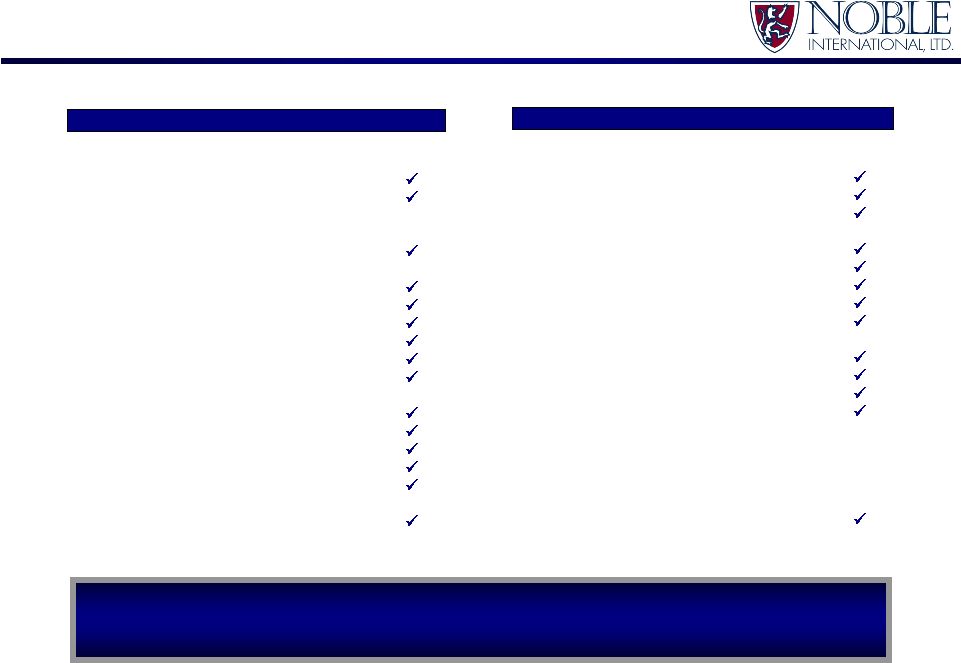
 16 Information provided in this presentation represents confidential and privileged information of Noble International, Ltd. and may not be distributed without express permission of an authorized representative of Noble International, Ltd. Noble Responding Aggressively to Market Conditions Conserving Cash Dividends suspended - $7.6M annual savings Capital spending reduced through launch activity Cash Generation - $30M YTD Sale of non-core assets (i.e. SET Enterprises) - $3.5M Working capital management (inventory, past due AR) Plant Rationalizations - $11M annualized savings in 2009 Closure of two US facilities Restructuring of two contract manufacturing operations in Europe Operating Efficiencies (scrap, quality, labor, etc.) - $12M savings in 2009 Overhead Reductions - $1.5M annualized YTD Investing in Growing Markets & Opportunities (i.e. China, Thailand, India, Slovakia) Management Focused on Cash Generation, Expense Reduction. |
 17 Information provided in this presentation represents confidential and privileged information of Noble International, Ltd. and may not be distributed without express permission of an authorized representative of Noble International, Ltd. ArcelorMittal & Noble International |
 18 Information provided in this presentation represents confidential and privileged information of Noble International, Ltd. and may not be distributed without express permission of an authorized representative of Noble International, Ltd. ArcelorMittal Snapshot Largest steel company in the world Operations in 60 countries 2007 financial information $105 billion of revenues $19.4 billion of EBITDA #1 market share in every region of the world except Asia Automotive R&D spend of $65 million per year World’s #1 steel company is Noble’s strategic partner and largest shareholder. |
 19 Information provided in this presentation represents confidential and privileged information of Noble International, Ltd. and may not be distributed without express permission of an authorized representative of Noble International, Ltd. ArcelorMittal Relationship Timeline August 2007 ArcelorMittal becomes a 40% shareholder in Noble via Tailored Blank Arcelor transaction. March 2008 ArcelorMittal invests additional $50 million in Noble via convertible notes. Five year term; 6% fixed coupon; conversion floor of $10.40 per share. April 2008 ArcelorMittal acquires additional 2.4 million shares from Noble’s founder and then Chairman, Robert Skandalaris. As a result, ArcelorMittal’s ownership stake increased to 49.4%. If conversion was exercised on convertible notes, ownership stake would be 58.5%. May 2008 ArcelorMittal invests additional €20 million in Noble via subordinated note in Europe. |
 20 Information provided in this presentation represents confidential and privileged information of Noble International, Ltd. and may not be distributed without express permission of an authorized representative of Noble International, Ltd. Benefits of ArcelorMittal / Noble Relationship Combined Research & Application Development UHSS, Usibor®, Ductibor® Steel Supply Diverse Customer Base Leading Market Share in North America, Europe & China Financial Stability Global Sales Network Combined Research & Application Development UHSS, Usibor®, Ductibor® Steel Supply Diverse Customer Base Leading Market Share in North America, Europe & China Financial Stability Global Sales Network |