Exhibit 99.1

Investor Presentation May 2019
2 This investor presentation contains statements concerning Bay Banks of Virginia, Inc.’s expectations, plans, objectives, future financial performance and other statements that are not historical facts. These statements may constitute "forward - looking statements" as defined by federal securities laws. These statements may address issues that involve estimates and assumptions made by management, risks and uncertainties, and actual results could differ materially from historical results or those anticipated by such statements. Factors that could have a material adverse effect on the operations and future prospects of Bay Banks of Virginia, Inc. include, but are not limited to, our ability to achieve the cost savings associated with the recent and planned initiatives and the expenses associated with those initiatives; our ability to successfully manage our growth or implement our growth strategy; changes in interest rates and general economic conditions; the legislative/regulatory climate; monetary and fiscal policies of the U. S. Government, including policies of the U.S . Treasury and Federal Reserve Board; the quality or composition of the loan or investment portfolios; demand for loan products; deposit flows; competition; demand for financial services in the company's market areas; acquisitions and dispositions; and tax and accounting rules, principles, polices and guidelines; and other risks and uncertainties described from time to time in Bay Banks of Virginia Inc.’s reports filed with the Securities and Exchange Commission. These risks and uncertainties should be considered in evaluating the forward - looking statements contained herein, and readers are cautioned not to place undue reliance on such statements, which speak only as of the date they are made. Except to the extent required by applicable law or regulation, Bay Banks of Virginia, Inc. undertakes no obligation to revise or update publicly any forward - looking statements for any reason. Caution Forward - Looking Statements
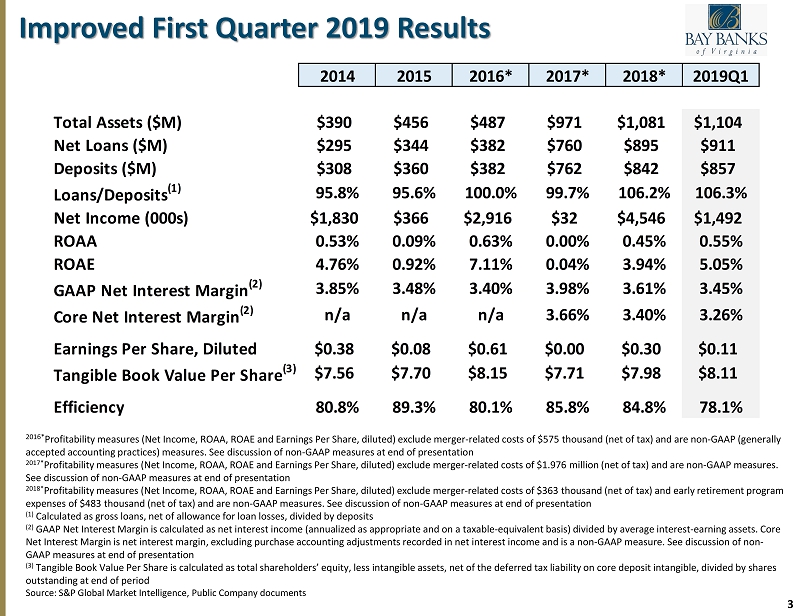
3 Improved First Quarter 2019 Results 2016* P rofitability measures (Net Income, ROAA, ROAE and Earnings Per Share, diluted) exclude merger - related costs of $575 thousand (net of tax) and are non - GAAP (generally accepted accounting practices) measures. S ee discussion of non - GAAP measures at end of presentation 2017* P rofitability measures (Net Income, ROAA, ROAE and Earnings Per Share, diluted) exclude merger - related costs of $1.976 million (net of tax) and are non - GAAP measures. See discussion of non - GAAP measures at end of presentation 2018* Profitability measures (Net Income, ROAA, ROAE and Earnings Per Share, diluted) exclude merger - related costs of $363 thousand (net of tax) and early retirement program expenses of $483 thousand (net of tax) and are non - GAAP measures. See discussion of non - GAAP measures at end of presentation (1) Calculated as gross loans, net of allowance for loan losses, divided by deposits (2) GAAP Net Interest Margin is calculated as net interest income (annualized as appropriate and on a taxable - equivalent basis) divided by average interest - earning assets. Core Net Interest Margin is net interest margin, excluding p urchase a ccounting adjustments recorded in net interest income and is a non - GAAP measure. See discussion of non - GAAP measures at end of presentation (3) Tangible Book Value Per Share is calculated as total shareholders’ equity, less intangible assets, net of the deferred tax liability on core deposit intangible, divided by sha res outstanding at end of period Source: S&P Global Market Intelligence , Public Company documents 2014 2015 2016* 2017* 2018* 2019Q1 2014 2015 2016 2017 2018 2019Q1 Total Assets ($M) $390 $456 $487 $971 $1,081 $1,104 Net Loans ($M) $295 $344 $382 $760 $895 $911 Deposits ($M) $308 $360 $382 $762 $842 $857 Loans/Deposits (1) 95.8% 95.6% 100.0% 99.7% 106.2% 106.3% Net Income (000s) $1,830 $366 $2,916 $32 $4,546 $1,492 ROAA 0.53% 0.09% 0.63% 0.00% 0.45% 0.55% ROAE 4.76% 0.92% 7.11% 0.04% 3.94% 5.05% GAAP Net Interest Margin (2) 3.85% 3.48% 3.40% 3.98% 3.61% 3.45% Core Net Interest Margin (2) n/a n/a n/a 3.66% 3.40% 3.26% Earnings Per Share, Diluted $0.38 $0.08 $0.61 $0.00 $0.30 $0.11 Tangible Book Value Per Share (3) $7.56 $7.70 $8.15 $7.71 $7.98 $8.11 Efficiency 80.8% 89.3% 80.1% 85.8% 84.8% 78.1%

4 Balance Sheet Trends * Calculated as gross loans, net of allowance for loan losses, divided by deposits Source: S&P Global Market Intelligence, Public Company documents
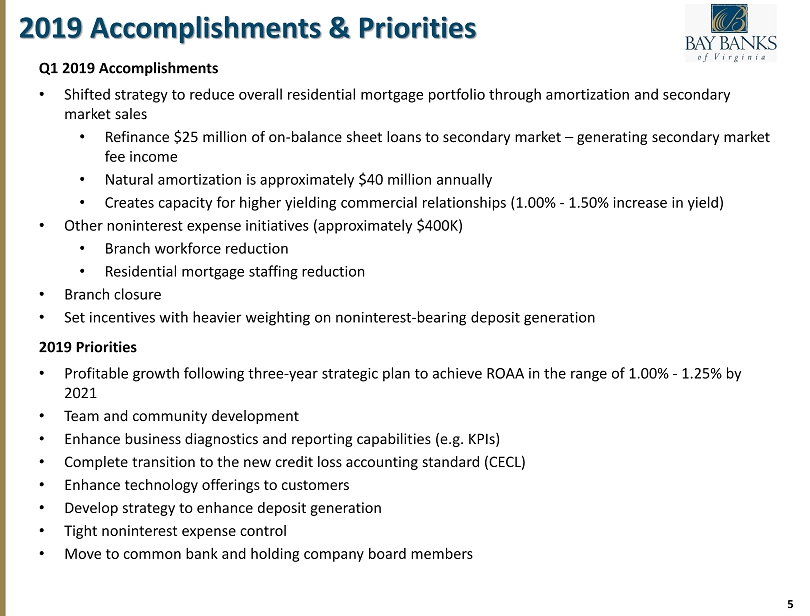
5 Q1 2019 Accomplishments • Shifted strategy to reduce overall residential mortgage portfolio through amortization and secondary market sales • Refinance $25 million of on - balance sheet loans to secondary market – generating secondary market fee income • Natural amortization is approximately $40 million annually • Creates capacity for higher yielding commercial relationships (1.00% - 1.50% increase in yield) • Other noninterest expense initiatives (approximately $400K ) • Branch workforce reduction • Residential mortgage staffing reduction • Branch c losure • Set incentives with heavier weighting on noninterest - bearing deposit generation 2019 Priorities • Profitable growth following three - year strategic plan to achieve ROAA in the range of 1.00% - 1.25% by 2021 • Team and community development • Enhance business diagnostics and reporting capabilities (e.g. KPIs) • Complete transition to the new credit loss accounting standard (CECL) • Enhance technology offerings to customers • Develop strategy to enhance deposit generation • Tight noninterest expense control • Move to common bank and holding company board members 2019 Accomplishments & Priorities
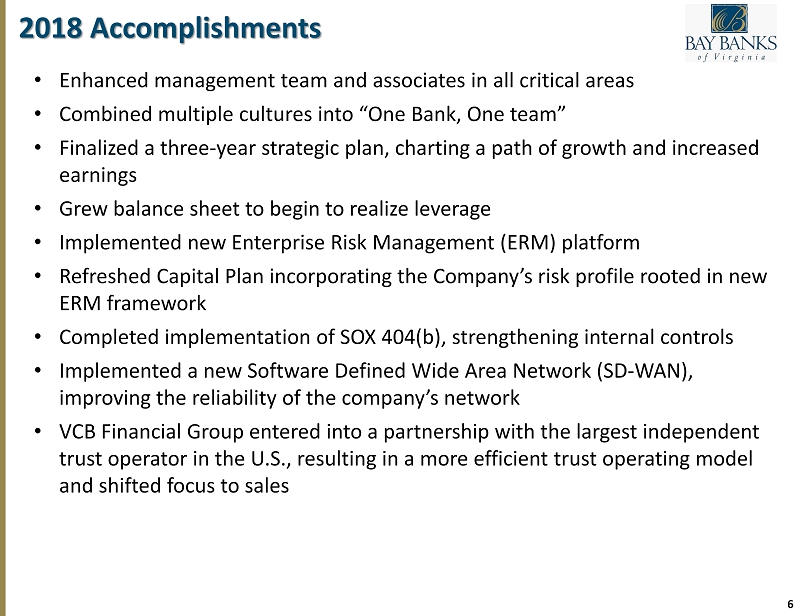
6 2018 Accomplishments • Enhanced management team and associates in all critical areas • Combined multiple cultures into “One Bank, One team” • Finalized a three - year strategic plan, charting a path of growth and increased earnings • Grew balance sheet to begin to realize leverage • Implemented new Enterprise Risk Management (ERM) platform • Refreshed Capital Plan incorporating the Company’s risk profile rooted in new ERM framework • Completed implementation of SOX 404(b), strengthening internal controls • Implemented a new Software Defined Wide Area Network (SD - WAN), improving the reliability of the company’s network • VCB Financial Group entered into a partnership with the largest independent trust operator in the U.S., resulting in a more efficient trust operating model and shifted focus to sales
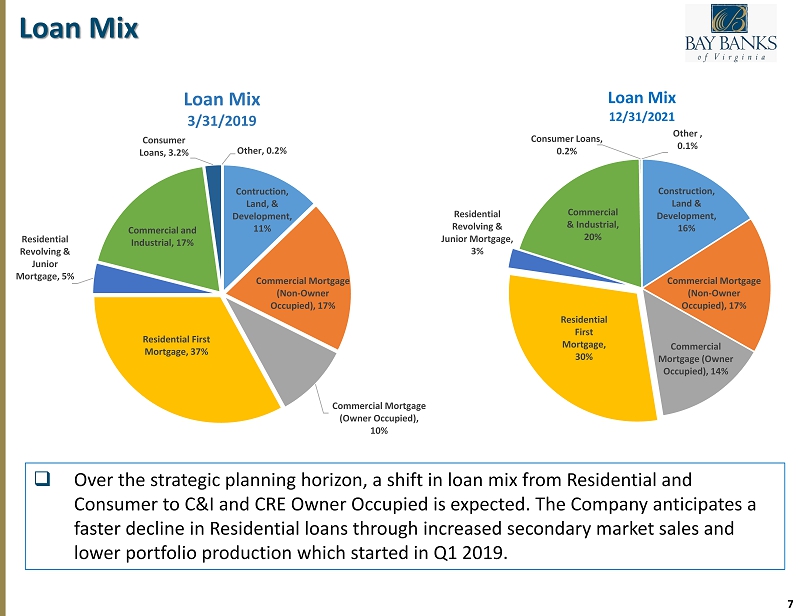
7 Loan Mix Construction, Land & Development , 16% Commercial Mortgage (Non - Owner Occupied) , 17% Commercial Mortgage (Owner Occupied) , 14% Residential First Mortgage , 30% Residential Revolving & Junior Mortgage , 3% Commercial & Industrial , 20% Consumer Loans , 0.2% Other , 0.1% Loan Mix 12/31/2021 □ Over the strategic planning horizon, a shift in loan mix from Residential and Consumer to C&I and CRE Owner Occupied is expected. The Company anticipates a faster decline in Residential loans through increased secondary market sales and lower portfolio production which started in Q1 2019. Contruction, Land, & Development , 11% Commercial Mortgage (Non - Owner Occupied) , 17% Commercial Mortgage (Owner Occupied) , 10% Residential First Mortgage , 37% Residential Revolving & Junior Mortgage , 5% Commercial and Industrial , 17% Consumer Loans , 3.2% Other , 0.2% Loan Mix 3/31/2019
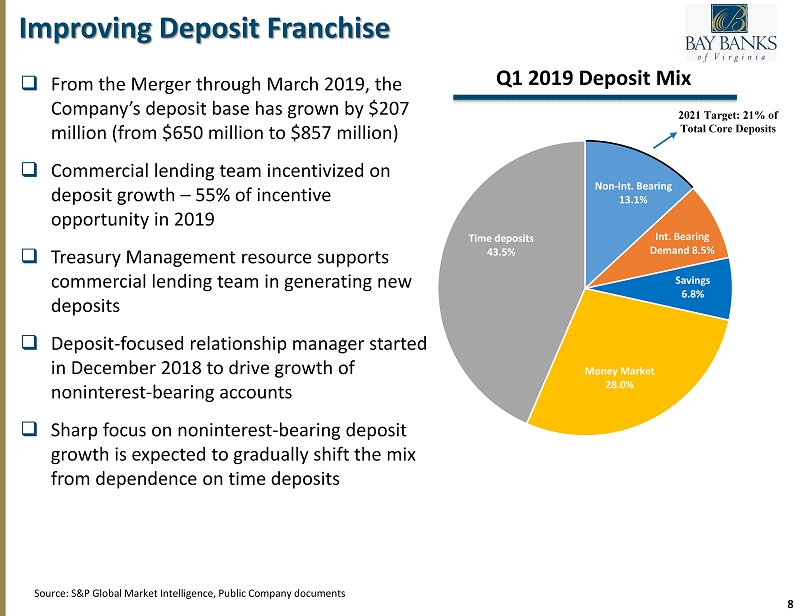
8 Non - Int. Bearing 13.1% Int. Bearing Demand 8.5% Savings 6.8% Money Market 28.0% Time deposits 43.5% Source : S&P Global Market Intelligence, Public Company documents Improving Deposit Franchise Q1 2019 Deposit Mix □ From the Merger through March 2019, the Company’s deposit base has grown by $207 million (from $650 million to $857 million) □ Commercial lending team incentivized on deposit growth – 55% of incentive opportunity in 2019 □ Treasury Management resource supports commercial lending team in generating new deposits □ Deposit - focused relationship manager started in December 2018 to drive growth of noninterest - bearing accounts □ Sharp focus on noninterest - bearing deposit growth is expected to gradually shift the mix from dependence on time deposits 2021 Target: 21% of Total Core Deposits
9 Investment Opportunity x With over $1.0 billion in assets, Bay Banks of Virginia, Inc. (BAYK) is the 3rd largest community bank headquartered in Richmond and 16 th largest in the Commonwealth of Virginia x Deep, talented leadership team with the ability to take the Company to the next level x Emerging growth story with significant opportunities in Richmond and Hampton Roads markets x The Company expects continued improving profitability in near term future quarters as investments in Richmond and Hampton Roads markets are realized and results of certain noninterest expense initiatives are achieved

10 Company History x Bay Banks of Virginia, Inc. (the “Company”) is the holding company for Virginia Commonwealth Bank (VCB) and VCB Financial Group x With nearly 170 years of combined history as independent community banks, Bank of Lancaster and Virginia Commonwealth Bank merged on April 1, 2017 (the “Merger”) to enhance their shared mission of providing outstanding banking services to the local communities in which they operate, while improving returns to shareholders • Bank of Lancaster was the acquiring bank and subsequent to the Merger assumed the Virginia Commonwealth Bank name x VCB currently has 19 banking offices located throughout the Richmond metro area, the Northern Neck and the Hampton Roads regions of Virginia, serving businesses, professionals and consumers with a wide variety of financial services, including retail banking, commercial banking and mortgage lending x VCB Financial Group provides management services for personal and corporate trusts, including estate planning, estate settlement, trust administrations, wealth management and insurance services
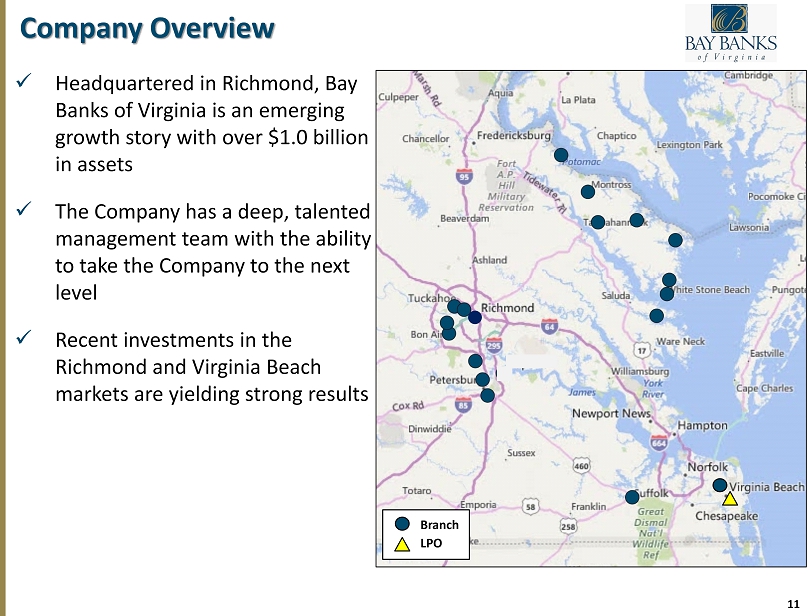
11 Company Overview x Headquartered in Richmond, Bay Banks of Virginia is an emerging growth story with over $1.0 billion in assets x The Company has a deep, talented management team with the ability to take the Company to the next level x Recent investments in the Richmond and Virginia Beach markets are yielding strong results Branch LPO
12 Randal R. “Randy” Greene – Vice Chairman, President & Chief Executive Officer Mr. Greene is the President and CEO of Bay Banks of Virginia. He serves on the Boards of Bay Banks, Virginia Commonwealth Bank and VCB Financial Group. He joined the family of companies in the fall of 2011. Randy received his Bachelor of Business Administration from East Tennessee State University in 1982 and began his banking career in 1984. Prior to joining Bay Banks, Randy was a Regional President of State of Franklin Bank, a division of Jefferson Federal Bank in Johnson City, Tennessee. From 1996 to 2008, he was President and CEO, Director and Founder of State of Franklin Savings Bank and Chairman of its Executive Committee. Randy has substantial knowledge of successfully growing a community bank with experience in all areas of banking, including managing multiple teams, as a senior credit officer with years of direct experience working with regulator y agencies, 25 years of lending experience, and has been directly responsible for managing the asset quality of a $350 million community bank. He was awarded 2015 Outstanding Alumni for the College of Business at Eastern Tennessee State University. C. Frank Scott, III – Chairman of the Board, Chairman of VCB Financial Group & President of Virginia Commonwealth Bank Mr. Scott is currently the Chairman of the Board, Chairman of VCB Financial Group and President of Virginia Commonwealth Bank. Before the merger with Virginia Bancorp, he was the Chief Executive Officer of Virginia Commonwealth Bank and served on the Board since 1987. He worked at Virginia Commonwealth Bank since 1999, before becoming CEO in 2011. He is the past President of the Petersburg Lions Club, the Southside Virginia Association of Realtors, and the Tri Cities Independent Insura nce Agent’s Association. He is currently a Member of the Board of the Appomattox Educational Foundation, the Prince George Alliance for Education Association, and the Richard Bland College Foundation. He is a Member of Redeemer Lutheran Church in Midlothian, Virginia and currently serves as a Member of the Board and as Treasurer. He received his BS degree in Finance from Virginia Tech in 1974 and his MA from the Charles F. Dolan School of Business at Fairfield University in Fairfield, Connecticut in 2003. Judy C. Gavant, CPA – Chief Financial Officer Ms. Gavant joined in March 2018 as Chief Financial Officer of Bay Banks of Virginia, Virginia Commonwealth Bank and VCB Financial Group. She brings more than 36 years experience in accounting, taxation, finance, and M&A. Ms. Gavant most recently served as Senior Vice President, Controller, and Chief Accounting Officer at Xenith Bankshares, Inc., which grew fro m $350 million in assets to over $3.0 billion in assets during her seven - year tenure. Prior to Xenith, Ms. Gavant served in a variety of leadership roles with both early - stage businesses and Fortune 500 corporations. She began her career with PriceWaterhouseCoopers LLP, where she served in the firm’s audit and tax practices over a nine - year period, and holds a BS in Accounting from Louisiana State University and a MS in Taxation from Virginia Commonwealth University. Leadership
13 Douglas F. Jenkins, Jr. – Chief Banking Officer Mr. Jenkins serves as Executive Vice President and Chief Banking Officer of Virginia Commonwealth Bank and Bay Banks of Virginia. Prior to the merger with Virginia Bancorp, he was Executive Vice President and Chief Banking Officer of Bank of Lancaster. Mr. Jenkins served as Senior Vice President of Bank of Lancaster from December 2009 until December 2011 and served as Senior Lending Officer from May 2008 until April 2013. From June 2011 until April 2013, he served as Retail Delivery Administrator. Prior to joining Bank of Lancaster in 2006 as a Vice President and Business Development Officer, Mr. Jenkins was a Vice President at SunTrust Bank, where he was a member of its Financial Institutions Group. Andrew G . Ferguson – Chief Credit Officer Mr . Ferguson a 33 - year banking veteran, has joined Virginia Commonwealth Bank as Executive Vice President, Chief Credit Officer . Prior to joining Virginia Commonwealth Bank , Mr . Ferguson began his banking career in Richmond at First Market Bank . He most recently served as Chief Credit Officer at The Heritage Bank in Georgia and previously worked as Executive Vice President, Chief Credit Officer at First Capital Bank in Richmond . Mr . Ferguson is a graduate of the University of Virginia and earned an MBA in Economics from the University of Richmond – Robins School of Business . C . Rodes “Dusty” Boyd, Jr . – Chief Lending Officer Mr. Boyd has served as Executive Vice President and Chief Lending Officer of Virginia Commonwealth Bank since April 2017. Mr. Boyd joined Virginia Commonwealth Bank in April 2011 as Executive Vice President and Chief Credit Officer, a role he served in until July 2012. Prior to joining Virginia Commonwealth Bank, Mr. Boyd was a Vice President in Commercial Banking with The Bank of Richmond and Gateway Bank from 2002 until 2009, and was the Richmond Market President for the Bank of Hampton Roads from March 2009 through December 2010. Mr. Boyd is currently serving a two - year term as Chairman of the Lending Executive Committee for the Virginia Bankers Association. Leadership
14 William (Bill) J. Callaghan – Chief Administrative Officer A 38 - year banking veteran, Mr. Callaghan joined Virginia Commonwealth Bank in March 2018 as Executive Vice President, Chief Administrative Officer. In this position, he is one of our executives who oversees day - to - day administrative operations of our Bank, which includes deposits, loans, mortgages, wealth management, human resources and compliance. Callaghan has over 35 years of progressive management experience within the financial services industry. He has been responsible for managing and overseeing 15+ core system conversions successfully. Callaghan most recently served as Senior Vice President, Chief Information Officer of Xenith Bank in Richmond. He was one of the original members of their Executive Team to assist in the start - up of Xenith . One of his initial tasks was to build the Technology and Operations platform. Callaghan built the infrastructure to be scalable and flexible to support a fast growing multi - billion - dollar financial institut ion without compromising on efficiency, productivity or security. Eric F . Nost – President & Chief Executive Officer of VCB Financial Group Mr. Nost, a financial services executive with over 30 years experience, leads Bay Banks’ wealth management subsidiary, VCB Financial Group, as President and CEO. Prior to Bay Banks, he managed a bank - owned investment firm, C&F Wealth Management Corp., building it to over $400 million in assets under management. A U.S. Navy veteran, Mr. Nost is a graduate of Virginia Military Institute, earned an MBA degree from Liberty University, and is a Certified Financial Planner. Leadership
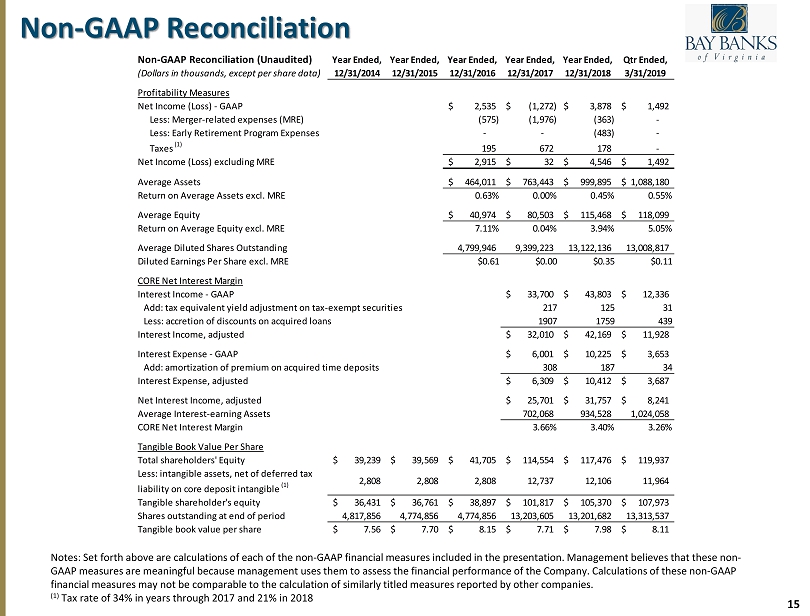
15 Non - GAAP Reconciliation Notes: Set forth above are calculations of each of the non - GAAP financial measures included in the presentation. Management believes that these non - GAAP measures are meaningful because management uses them to assess the financial performance of the Company . Calculations of these non - GAAP financial measures may not be comparable to the calculation of similarly titled measures reported by other companies . (1) Tax rate of 34% in years through 2017 and 21% in 2018 Non-GAAP Reconciliation (Unaudited) Year Ended, Year Ended, Year Ended, Year Ended, Year Ended, Qtr Ended, (Dollars in thousands, except per share data) 12/31/2014 12/31/2015 12/31/2016 12/31/2017 12/31/2018 3/31/2019 Profitability Measures Net Income (Loss) - GAAP 2,535$ (1,272)$ 3,878$ 1,492$ Less: Merger-related expenses (MRE) (575) (1,976) (363) - Less: Early Retirement Program Expenses - - (483) - Taxes (1) 195 672 178 - Net Income (Loss) excluding MRE 2,915$ 32$ 4,546$ 1,492$ Average Assets 464,011$ 763,443$ 999,895$ 1,088,180$ Return on Average Assets excl. MRE 0.63% 0.00% 0.45% 0.55% Average Equity 40,974$ 80,503$ 115,468$ 118,099$ Return on Average Equity excl. MRE 7.11% 0.04% 3.94% 5.05% Average Diluted Shares Outstanding 4,799,946 9,399,223 13,122,136 13,008,817 Diluted Earnings Per Share excl. MRE $0.61 $0.00 $0.35 $0.11 CORE Net Interest Margin Interest Income - GAAP 33,700$ 43,803$ 12,336$ Add: tax equivalent yield adjustment on tax-exempt securities 217 125 31 Less: accretion of discounts on acquired loans 1907 1759 439 Interest Income, adjusted 32,010$ 42,169$ 11,928$ Interest Expense - GAAP 6,001$ 10,225$ 3,653$ Add: amortization of premium on acquired time deposits 308 187 34 Interest Expense, adjusted 6,309$ 10,412$ 3,687$ Net Interest Income, adjusted 25,701$ 31,757$ 8,241$ Average Interest-earning Assets 702,068 934,528 1,024,058 CORE Net Interest Margin 3.66% 3.40% 3.26% Tangible Book Value Per Share Total shareholders' Equity 39,239$ 39,569$ 41,705$ 114,554$ 117,476$ 119,937$ Less: intangible assets, net of deferred tax liability on core deposit intangible (1) 2,808 2,808 2,808 12,737 12,106 11,964 Tangible shareholder's equity 36,431$ 36,761$ 38,897$ 101,817$ 105,370$ 107,973$ Shares outstanding at end of period 4,817,856 4,774,856 4,774,856 13,203,605 13,201,682 13,313,537 Tangible book value per share 7.56$ 7.70$ 8.15$ 7.71$ 7.98$ 8.11$
www.baybanks.com www.vcb.bank Contact Information Randy Greene Vice Chairman, President & Chief Executive Officer 804 - 435 - 4102 Randal.Greene@vcb.bank Judy Gavant Executive Vice President & Chief Financial Officer 804 - 518 - 2606 Judy.Gavant@vcb.bank