Exhibit 99.1

Investor Presentation September 2019
2 This investor presentation contains statements concerning Bay Banks of Virginia, Inc.’s expectations, plans, objectives, future financial performance and other statements that are not historical facts. These statements may constitute "forward - looking statements" as defined by federal securities laws. These statements may address issues that involve estimates and assumptions made by management, risks and uncertainties, and actual results could differ materially from historical results or those anticipated by such statements. Factors that could have a material adverse effect on the operations and future prospects of Bay Banks of Virginia, Inc. include, but are not limited to, our ability to achieve the cost savings associated with the recent and planned initiatives and the expenses associated with those initiatives; our ability to successfully manage our growth or implement our growth strategy; changes in interest rates and general economic conditions; the legislative/regulatory climate; monetary and fiscal policies of the U. S. Government, including policies of the U.S. Treasury and Federal Reserve Board; the quality or composition of the loan or investment portfolios; demand for loan products; deposit flows; competition; demand for financial services in the company's market areas; acquisitions and dispositions; and tax and accounting rules, principles, polices and guidelines; and other risks and uncertainties described from time to time in Bay Banks of Virginia Inc.’s reports filed with the Securities and Exchange Commission. These risks and uncertainties should be considered in evaluating the forward - looking statements contained herein, and readers are cautioned not to place undue reliance on such statements, which speak only as of the date they are made. Except to the extent required by applicable law or regulation, Bay Banks of Virginia, Inc. undertakes no obligation to revise or update publicly any forward - looking statements for any reason. Caution Forward - Looking Statements

3 Company Overview
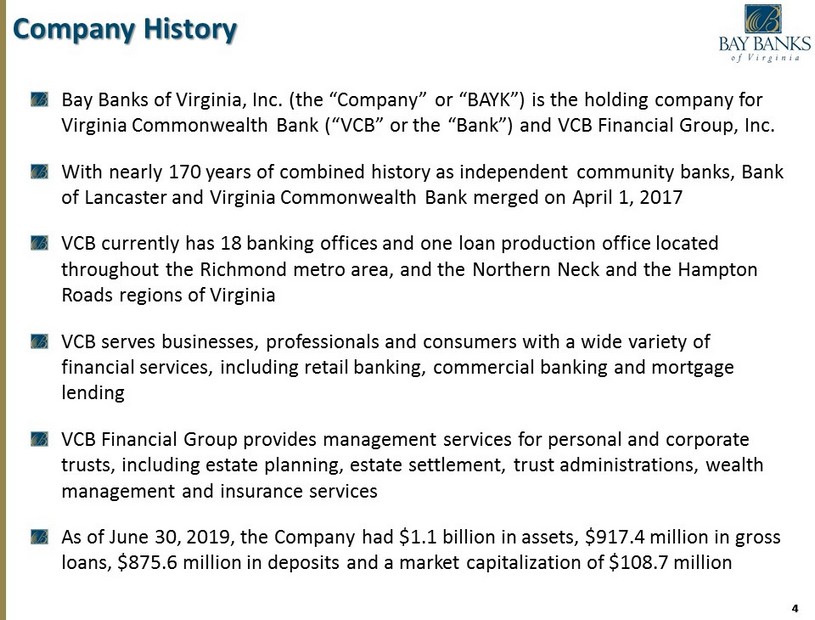
4 4 Company History Bay Banks of Virginia, Inc. (the “Company” or “BAYK”) is the holding company for Virginia Commonwealth Bank (“VCB” or the “Bank”) and VCB Financial Group, Inc. With nearly 170 years of combined history as independent community banks, Bank of Lancaster and Virginia Commonwealth Bank merged on April 1, 2017 VCB currently has 18 banking offices and one loan production office located throughout the Richmond metro area, and the Northern Neck and the Hampton Roads regions of Virginia VCB serves businesses, professionals and consumers with a wide variety of financial services, including retail banking, commercial banking and mortgage lending VCB Financial Group provides management services for personal and corporate trusts, including estate planning, estate settlement, trust administrations, wealth management and insurance services As of June 30, 2019, the Company had $1.1 billion in assets, $917.4 million in gross loans, $875.6 million in deposits and a market capitalization of $108.7 million
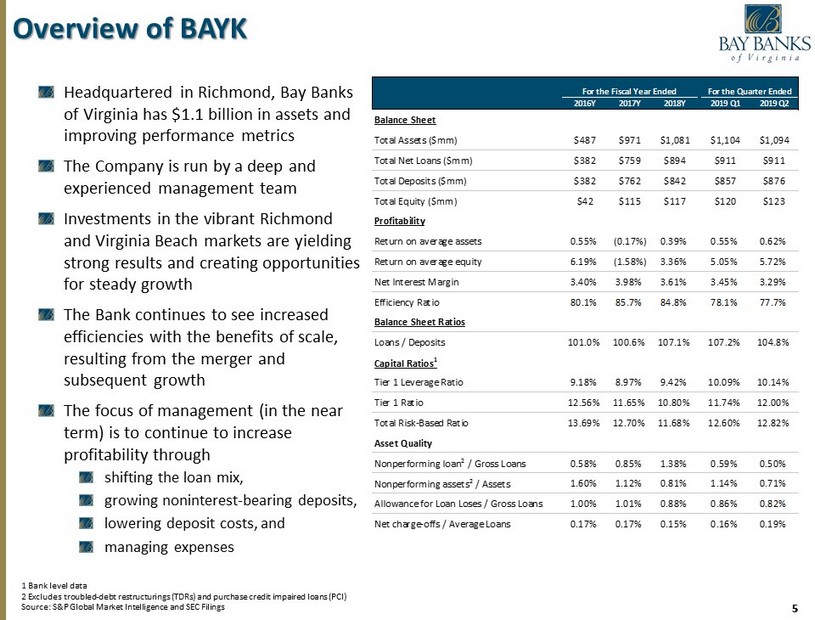
5 5 Overview of BAYK Headquartered in Richmond, Bay Banks of Virginia has $1.1 billion in assets and improving performance metrics The Company is run by a deep and experienced management team Investments in the vibrant Richmond and Virginia Beach markets are yielding strong results and creating opportunities for steady growth The Bank continues to see increased efficiencies with the benefits of scale, resulting from the merger and subsequent growth The focus of management (in the near term) is to continue to increase profitability through shifting the loan mix, growing noninterest - bearing deposits, lowering deposit costs, and managing expenses 1 Bank level data 2 Excludes troubled - debt restructurings (TDRs) and purchase credit impaired loans (PCI) Source: S&P Global Market Intelligence and SEC Filings For the Fiscal Year Ended For the Quarter Ended 2016Y 2017Y 2018Y 2019 Q1 2019 Q2 Balance Sheet Total Assets ($mm) $487 $971 $1,081 $1,104 $1,094 Total Net Loans ($mm) $382 $759 $894 $911 $911 Total Deposits ($mm) $382 $762 $842 $857 $876 Total Equity ($mm) $42 $115 $117 $120 $123 Profitability Return on average assets 0.55% (0.17%) 0.39% 0.55% 0.62% Return on average equity 6.19% (1.58%) 3.36% 5.05% 5.72% Net Interest Margin 3.40% 3.98% 3.61% 3.45% 3.29% Efficiency Ratio 80.1% 85.7% 84.8% 78.1% 77.7% Balance Sheet Ratios Loans / Deposits 101.0% 100.6% 107.1% 107.2% 104.8% Capital Ratios 1 Tier 1 Leverage Ratio 9.18% 8.97% 9.42% 10.09% 10.14% Tier 1 Ratio 12.56% 11.65% 10.80% 11.74% 12.00% Total Risk-Based Ratio 13.69% 12.70% 11.68% 12.60% 12.82% Asset Quality Nonperforming loan 2 / Gross Loans 0.58% 0.85% 1.38% 0.59% 0.50% Nonperforming assets 2 / Assets 1.60% 1.12% 0.81% 1.14% 0.71% Allowance for Loan Loses / Gross Loans 1.00% 1.01% 0.88% 0.86% 0.82% Net charge-offs / Average Loans 0.17% 0.17% 0.15% 0.16% 0.19%
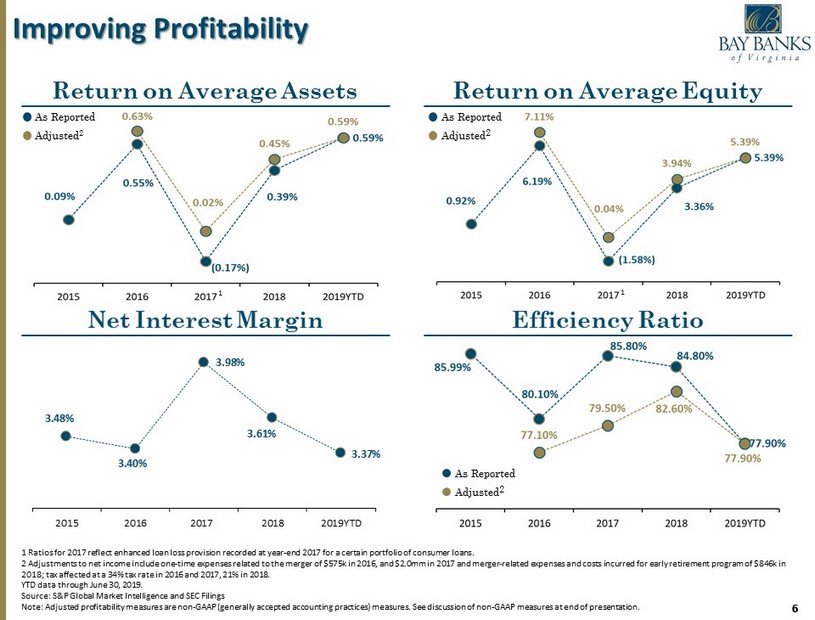
6 6 Improving Profitability Return on Average Assets Return on Average Equity Efficiency Ratio Net Interest Margin 3.48% 3.40% 3.98% 3.61% 3.37% 2015 2016 2017 ¹ 2018 2019YTD 1 Ratios for 2017 reflect enhanced loan loss provision recorded at year - end 2017 for a certain portfolio of consumer loans. 2 Adjustments to net income include one - time expenses related to the merger of $575k in 2016, and $2.0mm in 2017 and merger - rela ted expenses and costs incurred for early retirement program of $846k in 2018; tax affected at a 34% tax rate in 2016 and 2017, 21% in 2018. YTD data through June 30, 2019. Source: S&P Global Market Intelligence and SEC Filings Note: Adjusted profitability measures are non - GAAP (generally accepted accounting practices) measures. See discussion of non - GAA P measures at end of presentation. Adjusted 2 As Reported Adjusted 2 As Reported Adjusted 2 As Reported 1 1
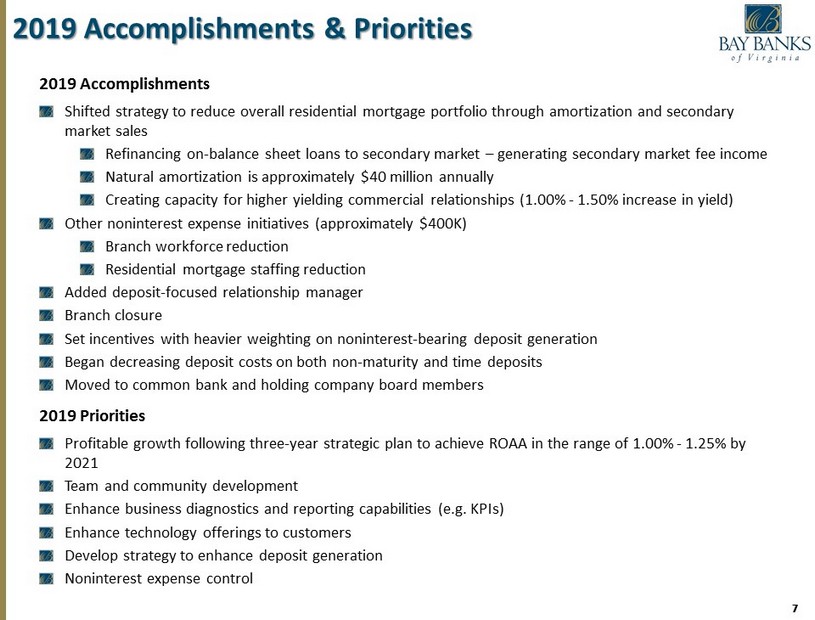
7 7 2019 Accomplishments & Priorities 2019 Accomplishments Shifted strategy to reduce overall residential mortgage portfolio through amortization and secondary market sales Refinancing on - balance sheet loans to secondary market – generating secondary market fee income Natural amortization is approximately $40 million annually Creating capacity for higher yielding commercial relationships (1.00% - 1.50% increase in yield) Other noninterest expense initiatives (approximately $400K) Branch workforce reduction Residential mortgage staffing reduction Added deposit - focused relationship manager Branch closure Set incentives with heavier weighting on noninterest - bearing deposit generation Began decreasing deposit costs on both non - maturity and time deposits Moved to common bank and holding company board members 2019 Priorities Profitable growth following three - year strategic plan to achieve ROAA in the range of 1.00% - 1.25% by 2021 Team and community development Enhance business diagnostics and reporting capabilities (e.g. KPIs) Enhance technology offerings to customers Develop strategy to enhance deposit generation Noninterest expense control
8 8 2018 Accomplishments Enhanced management team and associates in all critical areas Combined multiple cultures into “One Bank, One team” Finalized a three - year strategic plan, charting a path of growth and increased earnings Grew balance sheet to begin to realize leverage Implemented new Enterprise Risk Management (ERM) platform Refreshed Capital Plan incorporating the Company’s risk profile rooted in new ERM framework Completed implementation of SOX 404(b), strengthening internal controls Implemented a new Software Defined Wide Area Network (SD - WAN), improving the reliability of the company’s network VCB Financial Group entered into a partnership with the largest independent trust operator in the U.S., resulting in a more efficient trust operating model and shifted focus to sales

9 Financial Highlights

10 10 Balance Sheet Trends Total Assets Total Net Loans Tangible Book Value Per Share 1 Total Deposits $456 $487 $971 $1,081 $1,094 $326 $319 2015 2016 2017 2018 2019Q2 $344 $382 $760 $895 $911 $247 $267 2015 2016 2017 2018 2019Q2 $360 $382 $762 $842 $876 $238 $258 2015 2016 2017 2018 2019Q2 Dollars in millions, except per share data 1 Tangible Book Value Per Share is a non - GAAP measure. See discussion of non - GAAP measures at end of presentation. Source: S&P Global Market Intelligence and SEC Filings Legacy VCB Legacy VCB Legacy VCB Book value per share
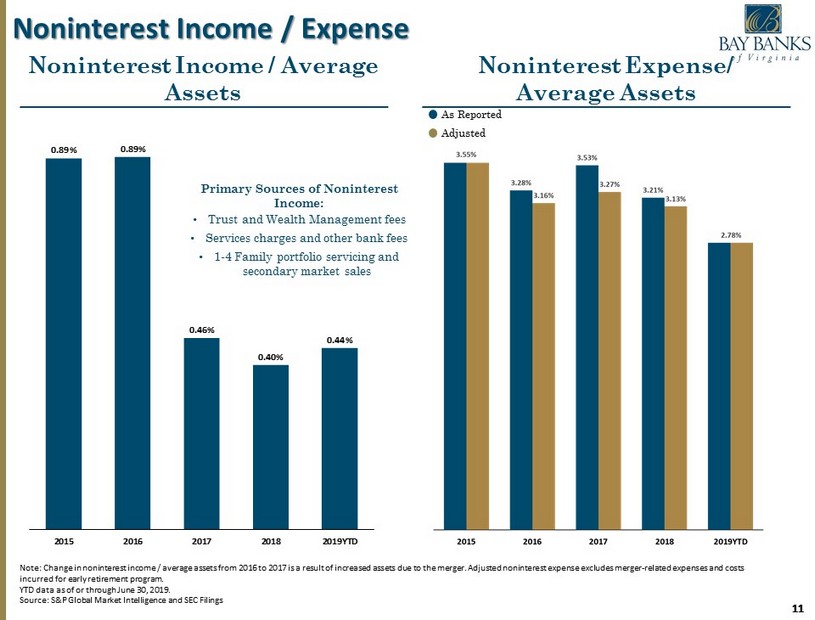
11 11 Noninterest Income / Expense Noninterest Expense/ Average Assets Noninterest Income / Average Assets 0.89% 0.89% 0.46% 0.40% 0.44% 2015 2016 2017 2018 2019YTD Note: Change in noninterest income / average assets from 2016 to 2017 is a result of increased assets due to the merger. Adju ste d noninterest expense excludes merger - related expenses and costs incurred for early retirement program. YTD data as of or through June 30, 2019. Source: S&P Global Market Intelligence and SEC Filings Primary Sources of Noninterest Income: • Trust and Wealth Management fees • Services charges and other bank fees • 1 - 4 Family portfolio servicing and secondary market sales Adjusted As Reported
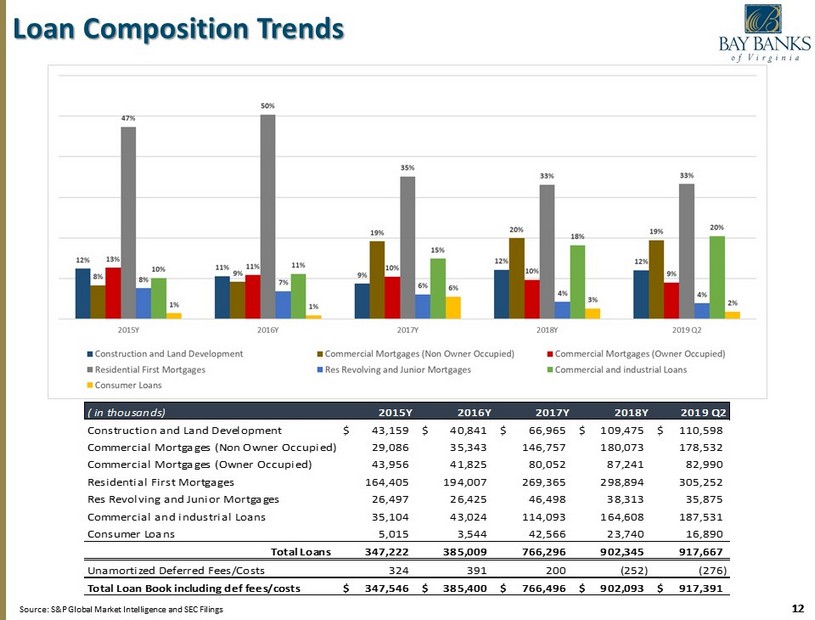
12 12 Loan Composition Trends Source: S&P Global Market Intelligence and SEC Filings ( in thousands) 2015Y 2016Y 2017Y 2018Y 2019 Q2 Construction and Land Development 43,159$ 40,841$ 66,965$ 109,475$ 110,598$ Commercial Mortgages (Non Owner Occupied) 29,086 35,343 146,757 180,073 178,532 Commercial Mortgages (Owner Occupied) 43,956 41,825 80,052 87,241 82,990 Residential First Mortgages 164,405 194,007 269,365 298,894 305,252 Res Revolving and Junior Mortgages 26,497 26,425 46,498 38,313 35,875 Commercial and industrial Loans 35,104 43,024 114,093 164,608 187,531 Consumer Loans 5,015 3,544 42,566 23,740 16,890 Total Loans 347,222 385,009 766,296 902,345 917,667 Unamortized Deferred Fees/Costs 324 391 200 (252) (276) Total Loan Book including def fees/costs 347,546$ 385,400$ 766,496$ 902,093$ 917,391$
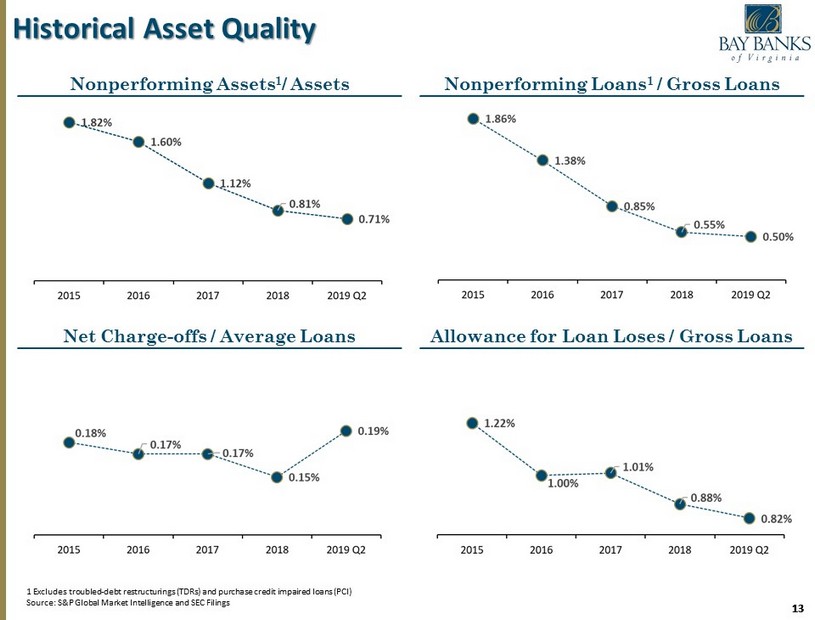
13 13 Historical Asset Quality Nonperforming Assets 1 / Assets Nonperforming Loans 1 / Gross Loans Net Charge - offs / Average Loans Allowance for Loan Loses / Gross Loans 1 Excludes troubled - debt restructurings (TDRs) and purchase credit impaired loans (PCI) Source: S&P Global Market Intelligence and SEC Filings
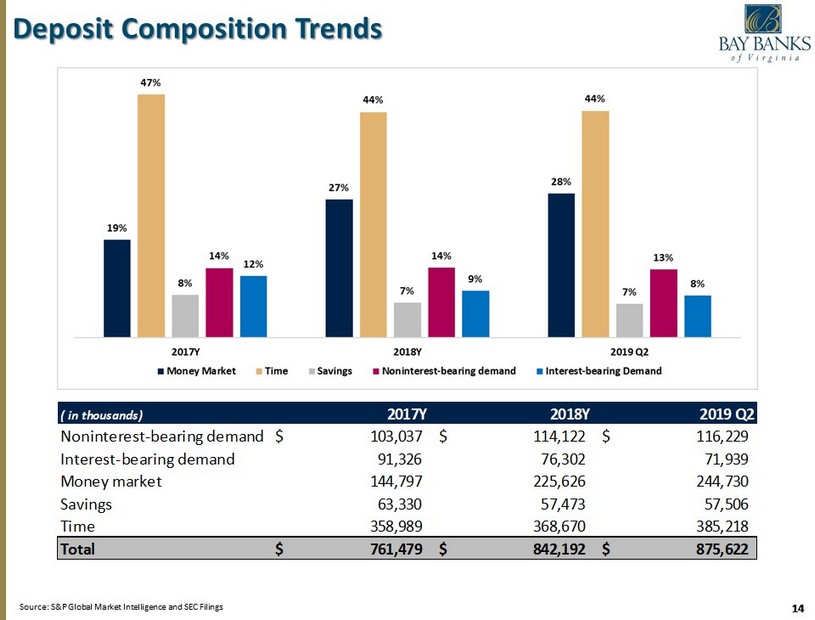
14 14 Deposit Composition Trends Source: S&P Global Market Intelligence and SEC Filings ( in thousands) 2017Y 2018Y 2019 Q2 Noninterest-bearing demand 103,037$ 114,122$ 116,229$ Interest-bearing demand 91,326 76,302 71,939 Money market 144,797 225,626 244,730 Savings 63,330 57,473 57,506 Time 358,989 368,670 385,218 Total 761,479$ 842,192$ 875,622$

15 Deposit Market Share & Branch Footprint Branch LPO MSA Deposit Market Share Total Total RankInstitution Branches Deposits Mkt Share Richmond, VA 1 Bank of America Corporation (NC) 22 14,168,280 37.99 2 BB&T Corp. (NC) 71 7,668,347 20.56 3 Wells Fargo & Co. (CA) 56 6,820,013 18.29 4 Atlantic Union Bkshs Corp. (VA) 30 2,998,326 8.04 5 TowneBank (VA) 9 860,265 2.31 6 C&F Financial Corp. (VA) 15 840,473 2.25 7 Community Bankers Trust Corp (VA) 12 609,395 1.63 8 Southern National Bncp of VA (VA) 12 494,358 1.33 9 Bay Banks of Virginia Inc. (VA) 8 463,331 1.24 10 Village Bank & Trust Finl Corp (VA) 9 426,930 1.14 Total For Institutions In Market 304 37,298,319 Total Total RankInstitution Branches Deposits Mkt Share Virginia Beach-Norfolk-Newport News, VA-NC 1 BB&T Corp. (NC) 73 7,402,204 28.85 2 TowneBank (VA) 27 5,688,966 22.18 3 Wells Fargo & Co. (CA) 44 4,823,135 18.80 4 Bank of America Corporation (NC) 29 3,165,086 12.34 5 Atlantic Union Bkshs Corp. (VA) 25 1,112,720 4.34 6 Old Point Financial Corp. (VA) 21 842,299 3.28 7 Southern BancShares (NC) (NC) 11 468,882 1.83 8 Chesapeake Financial Shares (VA) 8 404,553 1.58 9 PNC Financial Services Group (PA) 10 395,858 1.54 10 Farmers Bankshares Inc. (VA) 7 364,057 1.42 16 Bay Banks of Virginia Inc. (VA) 2 34,377 0.13 Total For Institutions In Market 307 25,653,234 Note: Deposit data as of June 30, 2018 Source: S&P Global Market Intelligence, FDIC
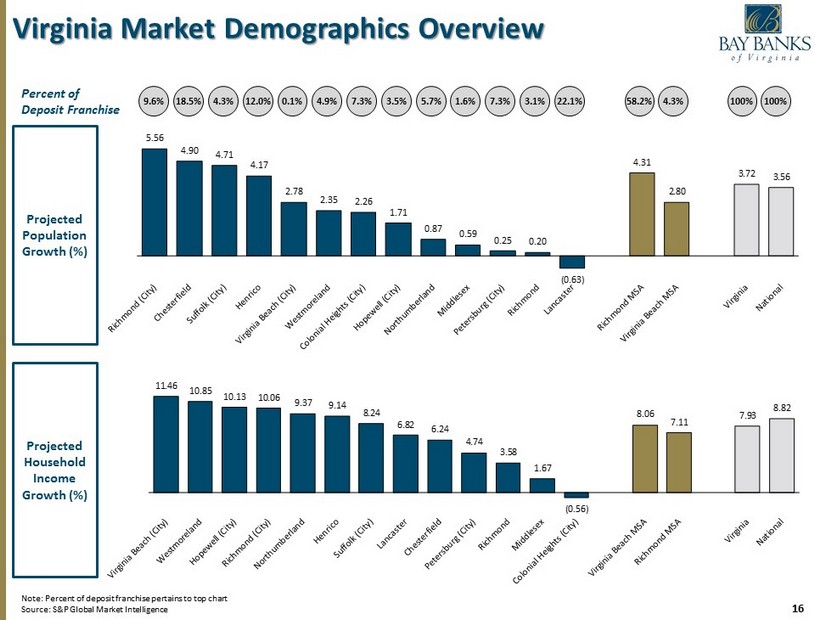
16 Virginia Market Demographics Overview Projected Population Growth (%) Projected Household Income Growth (%) 5.56 4.90 4.71 4.17 2.78 2.35 2.26 1.71 0.87 0.59 0.25 0.20 (0.63) 4.31 2.80 3.72 3.56 11.46 10.85 10.13 10.06 9.37 9.14 8.24 6.82 6.24 4.74 3.58 1.67 (0.56) 8.06 7.11 7.93 8.82 Note: Percent of deposit franchise pertains to top chart Source: S&P Global Market Intelligence 9.6% Percent of Deposit Franchise 18. 5% 4.3% 12.0% 0.1% 4.9% 7.3 % 3.5% 5.7% 1.6% 7.3% 3.1% 22.1% 58.2% 4.3% 100% 100%
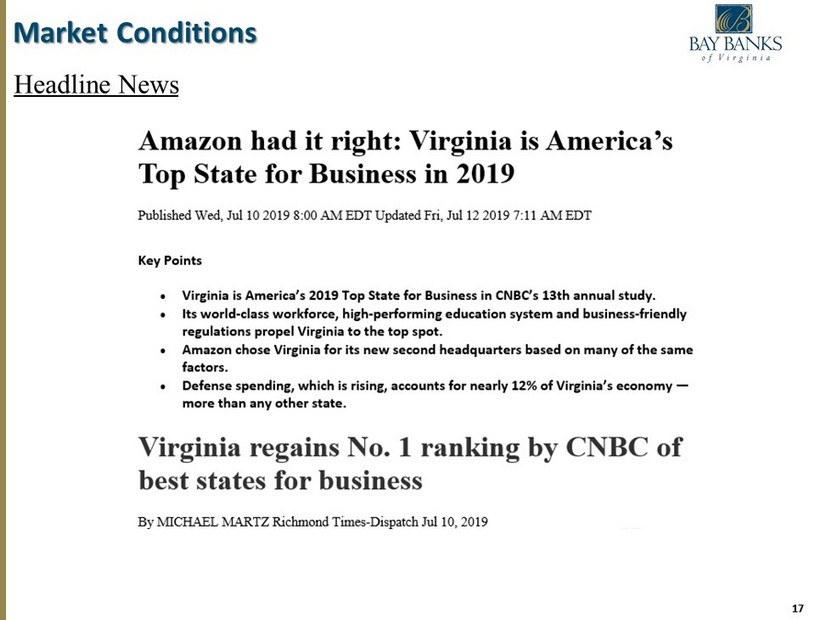
17 Market Conditions Headline News
18 Investment Opportunity x With over $1.0 billion in assets, Bay Banks of Virginia, Inc. (BAYK) is the 3rd largest community bank headquartered in Richmond and 16 th largest in the Commonwealth of Virginia x Deep, talented leadership team with the ability to take the Company to the next level x Emerging growth story with significant opportunities in Richmond and Hampton Roads markets x The Company expects continued improving profitability in near term future quarters as investments in Richmond and Hampton Roads markets are realized and additional scale is realized from investments in infrastructure

Leadership
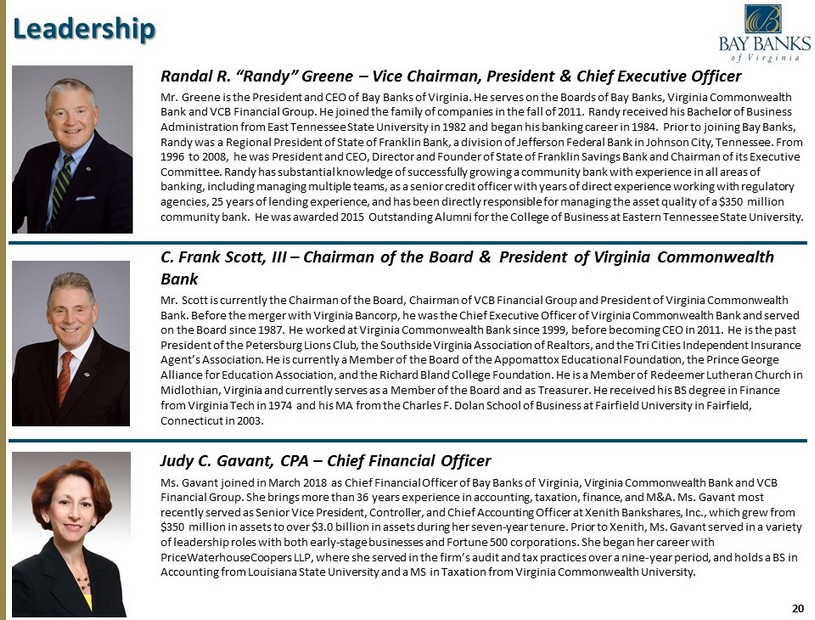
20 Randal R. “Randy” Greene – Vice Chairman, President & Chief Executive Officer Mr. Greene is the President and CEO of Bay Banks of Virginia. He serves on the Boards of Bay Banks, Virginia Commonwealth Bank and VCB Financial Group. He joined the family of companies in the fall of 2011. Randy received his Bachelor of Business Administration from East Tennessee State University in 1982 and began his banking career in 1984. Prior to joining Bay Banks, Randy was a Regional President of State of Franklin Bank, a division of Jefferson Federal Bank in Johnson City, Tennessee. Fr om 1996 to 2008, he was President and CEO, Director and Founder of State of Franklin Savings Bank and Chairman of its Executive Committee. Randy has substantial knowledge of successfully growing a community bank with experience in all areas of banking, including managing multiple teams, as a senior credit officer with years of direct experience working with regulator y agencies, 25 years of lending experience, and has been directly responsible for managing the asset quality of a $350 million community bank. He was awarded 2015 Outstanding Alumni for the College of Business at Eastern Tennessee State University. C. Frank Scott, III – Chairman of the Board & President of Virginia Commonwealth Bank Mr. Scott is currently the Chairman of the Board, Chairman of VCB Financial Group and President of Virginia Commonwealth Bank. Before the merger with Virginia Bancorp, he was the Chief Executive Officer of Virginia Commonwealth Bank and served on the Board since 1987. He worked at Virginia Commonwealth Bank since 1999, before becoming CEO in 2011. He is the past President of the Petersburg Lions Club, the Southside Virginia Association of Realtors, and the Tri Cities Independent Insura nce Agent’s Association. He is currently a Member of the Board of the Appomattox Educational Foundation, the Prince George Alliance for Education Association, and the Richard Bland College Foundation. He is a Member of Redeemer Lutheran Church in Midlothian, Virginia and currently serves as a Member of the Board and as Treasurer. He received his BS degree in Finance from Virginia Tech in 1974 and his MA from the Charles F. Dolan School of Business at Fairfield University in Fairfield, Connecticut in 2003. Judy C. Gavant, CPA – Chief Financial Officer Ms. Gavant joined in March 2018 as Chief Financial Officer of Bay Banks of Virginia, Virginia Commonwealth Bank and VCB Financial Group. She brings more than 36 years experience in accounting, taxation, finance, and M&A. Ms. Gavant most recently served as Senior Vice President, Controller, and Chief Accounting Officer at Xenith Bankshares, Inc., which grew fro m $350 million in assets to over $3.0 billion in assets during her seven - year tenure. Prior to Xenith, Ms. Gavant served in a vari ety of leadership roles with both early - stage businesses and Fortune 500 corporations. She began her career with PriceWaterhouseCoopers LLP, where she served in the firm’s audit and tax practices over a nine - year period, and holds a BS in Accounting from Louisiana State University and a MS in Taxation from Virginia Commonwealth University. Leadership

21 Douglas F. Jenkins, Jr. – Chief Banking Officer Mr. Jenkins serves as Executive Vice President and Chief Banking Officer of Virginia Commonwealth Bank and Bay Banks of Virginia. Prior to the merger with Virginia Bancorp, he was Executive Vice President and Chief Banking Officer of Bank of Lancaster. Mr. Jenkins served as Senior Vice President of Bank of Lancaster from December 2009 until December 2011 and served as Senior Lending Officer from May 2008 until April 2013. From June 2011 until April 2013, he served as Retail Delivery Administrator. Prior to joining Bank of Lancaster in 2006 as a Vice President and Business Development Officer, Mr. Jenkins was a Vice President at SunTrust Bank, where he was a member of its Financial Institutions Group. Andrew G . Ferguson – Chief Credit Officer Mr . Ferguson a 33 - year banking veteran, has joined Virginia Commonwealth Bank as Executive Vice President, Chief Credit Officer . Prior to joining Virginia Commonwealth Bank, Mr . Ferguson began his banking career in Richmond at First Market Bank . He most recently served as Chief Credit Officer at The Heritage Bank in Georgia and previously worked as Executive Vice President, Chief Credit Officer at First Capital Bank in Richmond . Mr . Ferguson is a graduate of the University of Virginia and earned an MBA in Economics from the University of Richmond – Robins School of Business . C . Rodes “Dusty” Boyd, Jr . – Chief Lending Officer Mr. Boyd has served as Executive Vice President and Chief Lending Officer of Virginia Commonwealth Bank since April 2017. Mr. Boyd joined Virginia Commonwealth Bank in April 2011 as Executive Vice President and Chief Credit Officer, a role he served in until July 2012. Prior to joining Virginia Commonwealth Bank, Mr. Boyd was a Vice President in Commercial Banking with The Bank of Richmond and Gateway Bank from 2002 until 2009, and was the Richmond Market President for the Bank of Hampton Roads from March 2009 through December 2010. Mr. Boyd is currently serving a two - year term as Chairman of the Lending Executive Committee for the Virginia Bankers Association. Mr. Boyd is a graduate of the Virginia Military Institute and earned an MBA in Economics from the University of Richmond – Robins School of Business. Leadership (continued)
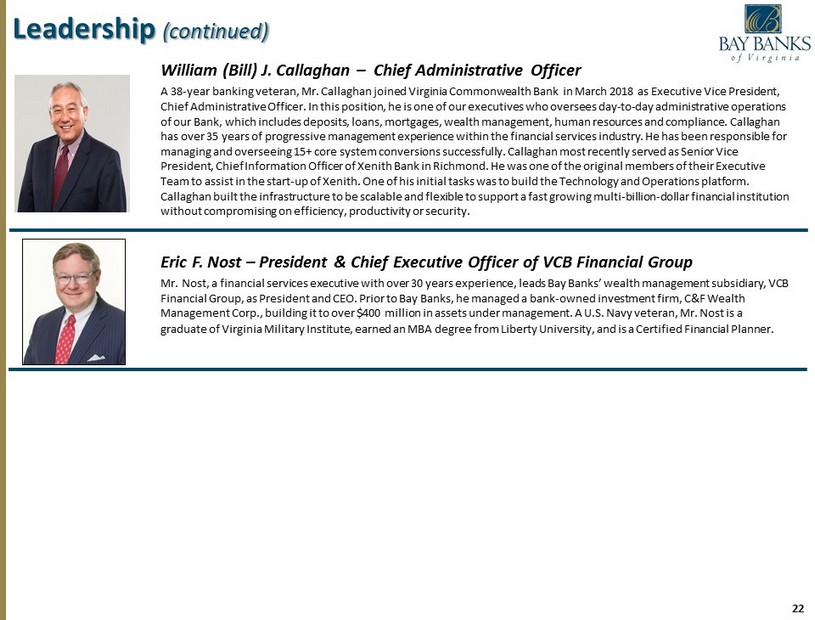
22 Leadership (continued) William (Bill) J. Callaghan – Chief Administrative Officer A 38 - year banking veteran, Mr. Callaghan joined Virginia Commonwealth Bank in March 2018 as Executive Vice President, Chief Administrative Officer. In this position, he is one of our executives who oversees day - to - day administrative operations of our Bank, which includes deposits, loans, mortgages, wealth management, human resources and compliance. Callaghan has over 35 years of progressive management experience within the financial services industry. He has been responsible for managing and overseeing 15+ core system conversions successfully. Callaghan most recently served as Senior Vice President, Chief Information Officer of Xenith Bank in Richmond. He was one of the original members of their Executive Team to assist in the start - up of Xenith. One of his initial tasks was to build the Technology and Operations platform. Callaghan built the infrastructure to be scalable and flexible to support a fast growing multi - billion - dollar financial institut ion without compromising on efficiency, productivity or security. Eric F . Nost – President & Chief Executive Officer of VCB Financial Group Mr. Nost, a financial services executive with over 30 years experience, leads Bay Banks’ wealth management subsidiary, VCB Financial Group, as President and CEO. Prior to Bay Banks, he managed a bank - owned investment firm, C&F Wealth Management Corp., building it to over $400 million in assets under management. A U.S. Navy veteran, Mr. Nost is a graduate of Virginia Military Institute, earned an MBA degree from Liberty University, and is a Certified Financial Planner.

Appendix
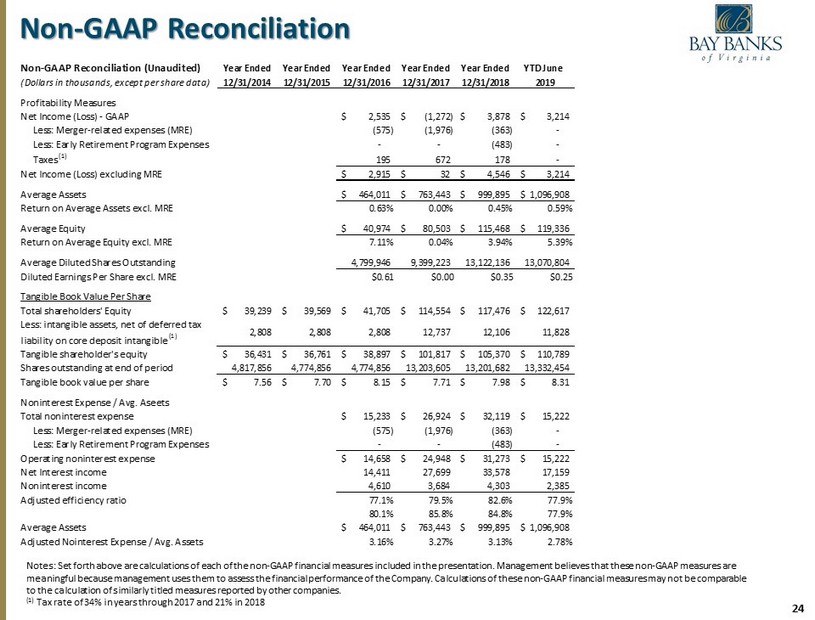
24 Non - GAAP Reconciliation Notes: Set forth above are calculations of each of the non - GAAP financial measures included in the presentation. Management beli eves that these non - GAAP measures are meaningful because management uses them to assess the financial performance of the Company. Calculations of these non - GAAP finan cial measures may not be comparable to the calculation of similarly titled measures reported by other companies. (1) Tax rate of 34% in years through 2017 and 21% in 2018 Non-GAAP Reconciliation (Unaudited) Year Ended Year Ended Year Ended Year Ended Year Ended YTD June (Dollars in thousands, except per share data) 12/31/2014 12/31/2015 12/31/2016 12/31/2017 12/31/2018 2019 Profitability Measures Net Income (Loss) - GAAP 2,535$ (1,272)$ 3,878$ 3,214$ Less: Merger-related expenses (MRE) (575) (1,976) (363) - Less: Early Retirement Program Expenses - - (483) - Taxes (1) 195 672 178 - Net Income (Loss) excluding MRE 2,915$ 32$ 4,546$ 3,214$ Average Assets 464,011$ 763,443$ 999,895$ 1,096,908$ Return on Average Assets excl. MRE 0.63% 0.00% 0.45% 0.59% Average Equity 40,974$ 80,503$ 115,468$ 119,336$ Return on Average Equity excl. MRE 7.11% 0.04% 3.94% 5.39% Average Diluted Shares Outstanding 4,799,946 9,399,223 13,122,136 13,070,804 Diluted Earnings Per Share excl. MRE $0.61 $0.00 $0.35 $0.25 Tangible Book Value Per Share Total shareholders' Equity 39,239$ 39,569$ 41,705$ 114,554$ 117,476$ 122,617$ Less: intangible assets, net of deferred tax liability on core deposit intangible (1) 2,808 2,808 2,808 12,737 12,106 11,828 Tangible shareholder's equity 36,431$ 36,761$ 38,897$ 101,817$ 105,370$ 110,789$ Shares outstanding at end of period 4,817,856 4,774,856 4,774,856 13,203,605 13,201,682 13,332,454 Tangible book value per share 7.56$ 7.70$ 8.15$ 7.71$ 7.98$ 8.31$ Noninterest Expense / Avg. Aseets Total noninterest expense 15,233$ 26,924$ 32,119$ 15,222$ Less: Merger-related expenses (MRE) (575) (1,976) (363) - Less: Early Retirement Program Expenses - - (483) - Operating noninterest expense 14,658$ 24,948$ 31,273$ 15,222$ Net Interest income 14,411 27,699 33,578 17,159 Noninterest income 4,610 3,684 4,303 2,385 Adjusted efficiency ratio 77.1% 79.5% 82.6% 77.9% 80.1% 85.8% 84.8% 77.9% Average Assets 464,011$ 763,443$ 999,895$ 1,096,908$ Adjusted Nointerest Expense / Avg. Assets 3.16% 3.27% 3.13% 2.78%

www.baybanks.com www.vcb.bank Contact Information Randy Greene Vice Chairman, President & Chief Executive Officer 804 - 435 - 4102 Randal.Greene@vcb.bank Judy Gavant Executive Vice President & Chief Financial Officer 804 - 518 - 2606 Judy.Gavant@vcb.bank