UNITED STATES
SECURITIES AND EXCHANGE COMMISSION
Washington, D.C. 20549
SCHEDULE 14A
Proxy Statement Pursuant to Section 14(a) of the Securities
Exchange Act of 1934 (Amendment No. )
Filed by the Registrantx Filed by a Party other than the Registrant¨
Check the appropriate box:
| ¨ | Preliminary Proxy Statement |
| ¨ | Confidential, for Use of the Commission only (as permitted by Rule 14a-6(e)(2)) |
| ¨ | Definitive Proxy Statement |
| x | Definitive Additional Materials |
| ¨ | Soliciting Material Pursuant to Section 240.14a-12 |
Fisher Communications, Inc.
(Name of Registrant as Specified In Its Charter)
(Name of Person(s) Filing Proxy Statement if other than the Registrant)
Payment of Filing Fee (check the appropriate box):
| ¨ | Fee computed on table below per Exchange Act Rules 14a-6(i)(4) and 0-11. |
| | 1) | Title of each class of securities to which transaction applies: |
| | 2) | Aggregate number of securities to which transaction applies: |
| | 3) | Per unit price or other underlying value of transaction computed pursuant to Exchange Act Rule 0-11 (set forth the amount on which the filing fee is calculated and state how it was determined): |
| | 4) | Proposed maximum aggregate value of transaction: |
| ¨ | Fee paid previously with preliminary materials. |
| ¨ | Check box if any part of the fee is offset as provided by Exchange Act Rule 0-11(a)(2) and identify the filing for which the offsetting fee was paid previously. Identify the previous filing by registration statement number, or the Form or Schedule and the date of its filing. |
| | 1) | Amount Previously Paid: |
| | 2) | Form, Schedule or Registration Statement No.: |
Fisher Communications, Inc. (“Fisher”), has a made a definitive filing with the Securities and Exchange Commission of a proxy statement and accompanying proxy card to be used to solicit votes in connection with Fisher’s 2011 annual meeting of shareholders to be held on May 11, 2011. On April 21, 2011, Fisher presented the following at an investor forum hosted by Gabelli & Company, Inc.:

INVESTOR PRESENTATION April 2011
FORWARD LOOKING STATEMENTS
This presentation contains information that is confidential or proprietary information of Fisher Communications, Inc., and it includes forward-looking statements. We have based these forward-looking statements on our current expectations and projections about future events. Forward-looking statements include information preceded by, followed by, or that includes the words “guidance,” “believes,” “expects,” “anticipates,” or “could,” or similar expressions. For these statements, the Company claims the protection of the safe harbor for forward-looking statements contained in the Private Securities Litigation Reform Act of 1995. The forward-looking statements contained in this document, concerning, among other things, changes in revenue, cash flow and operating expenses, involve risks and uncertainties, and are subject to change based on various important factors, including the impact of changes in national and regional economies, our ability to service and refinance our outstanding debt, successful integration of acquired television stations (including achievement of synergies and cost reductions), pricing fluctuations in local and national advertising, future regulatory actions and conditions in the television stations’ operating areas, competition from others in the broadcast television markets served by the Company, volatility in programming costs, the effects of governmental regulation of broadcasting, industry consolidation, technological developments and major world news events. Unless required by law, we undertake no obligation to update or revise any forward-looking statements, whether as a result of new information, future events or otherwise. In light of these risks, uncertainties and assumptions, the forward-looking events discussed in this document might not occur. You should not place undue reliance on these forward-looking statements, which speak only as of the date of this document. For more details on factors that could affect these expectations, please see the risk factors in our Annual Report on Form 10-K for the year ended December 31, 2010, which we have filed with the Securities and Exchange Commission.
Certain pro forma measures included in this presentation such as EBITDA are non-GAAP financial measures under Regulation G. Definitions of these non-GAAP financial measures, the importance of these measures to investors and reconciliations of these measures to the most directly comparable GAAP measures can be found in the appendix to the presentation.
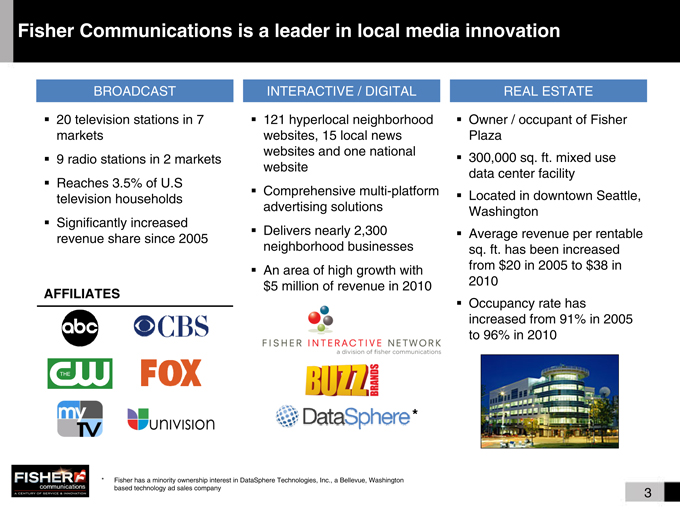
Fisher Communications is a leader in local media innovation
BROADCAST INTERACTIVE / DIGITAL REAL ESTATE
20 television stations in 7 markets 9 radio stations in 2 markets Reaches 3.5% of U.S television households Significantly increased revenue share since 2005
121 hyperlocal neighborhood websites, 15 local news websites and one national website Comprehensive multi-platform advertising solutions Delivers nearly 2,300 neighborhood businesses An area of high growth with $5 million of revenue in 2010
Owner / occupant of Fisher Plaza 300,000 sq. ft. mixed use data center facility Located in downtown Seattle, Washington Average revenue per rentable sq. ft. has been increased from $20 in 2005 to $38 in 2010 Occupancy rate has increased from 91% in 2005 to 96% in 2010
AFFILIATES
* Fisher has a minority ownership interest in DataSphere Technologies, Inc., a Bellevue, Washington based technology ad sales company
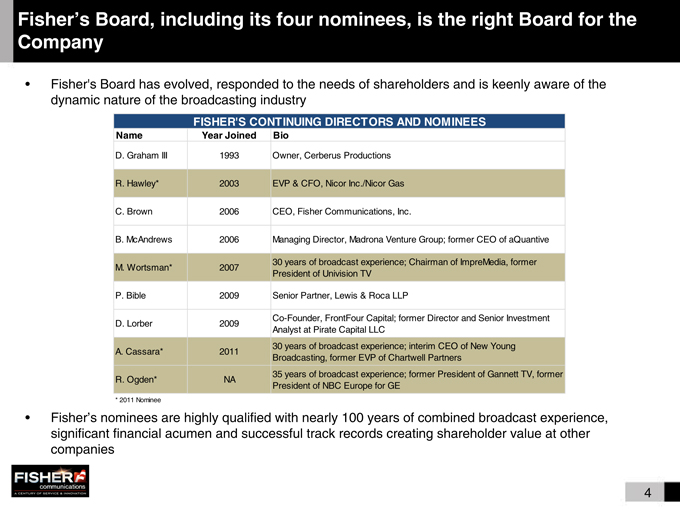
Fisher’s Board, including its four nominees, is the right Board for the Company
• Fisher’s Board has evolved, responded to the needs of shareholders and is keenly aware of the dynamic nature of the broadcasting industry
FISHER’S CONTINUING DIRECTORS AND NOMINEES
Name Year Joined Bio
D. Graham III 1993 Owner, Cerberus Productions
R. Hawley* 2003 EVP & CFO, Nicor Inc./Nicor Gas
C. Brown 2006 CEO, Fisher Communications, Inc.
B. McAndrews 2006 Managing Director, Madrona Venture Group; former CEO of aQuantive
M. Wortsman* 2007 30 years of broadcast experience; Chairman of ImpreMedia, former
President of Univision TV
P. Bible 2009 Senior Partner, Lewis & Roca LLP
D. Lorber 2009 Co-Founder, FrontFour Capital; former Director and Senior Investment
Analyst at Pirate Capital LLC
A. Cassara* 2011 30 years of broadcast experience; interim CEO of New Young
Broadcasting, former EVP of Chartwell Partners
R. Ogden* NA 35 years of broadcast experience; former President of Gannett TV, former
President of NBC Europe for GE
• Fisher’s nominees are highly qualified with nearly 100 years of combined broadcast experience, significant financial acumen and successful track records creating shareholder value at other companies
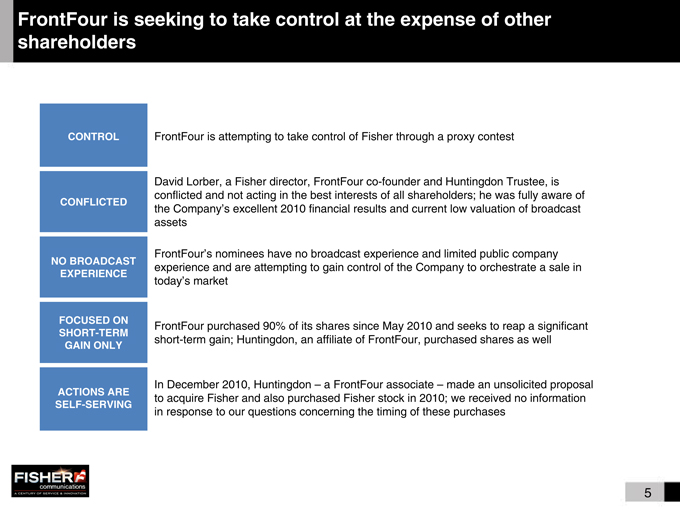
FrontFour is seeking to take control at the expense of other shareholders
CONTROL
CONFLICTED
NO BROADCAST EXPERIENCE
FOCUSED ON SHORT-TERM
GAIN ONLY
ACTIONS ARE SELF-SERVING
FrontFour is attempting to take control of Fisher through a proxy contest
David Lorber, a Fisher director, FrontFour co-founder and Huntingdon Trustee, is conflicted and not acting in the best interests of all shareholders; he was fully aware of the Company’s excellent 2010 financial results and current low valuation of broadcast assets
FrontFour’s nominees have no broadcast experience and limited public company experience and are attempting to gain control of the Company to orchestrate a sale in today’s market
FrontFour purchased 90% of its shares since May 2010 and seeks to reap a significant short-term gain; Huntingdon, an affiliate of FrontFour, purchased shares as well
In December 2010, Huntingdon – a FrontFour associate – made an unsolicited proposal to acquire Fisher and also purchased Fisher stock in 2010; we received no information in response to our questions concerning the timing of these purchases
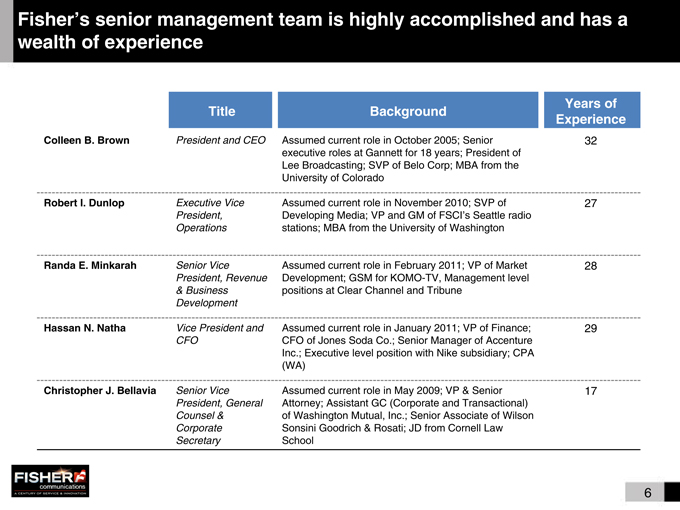
Fisher’s senior management team is highly accomplished and has a wealth of experience
Title Background Years of Experience
Colleen B. Brown President and CEO Assumed current role in October 2005; Senior 32
executive roles at Gannett for 18 years; President of
Lee Broadcasting; SVP of Belo Corp; MBA from the
University of Colorado
Robert I. Dunlop Executive Vice Assumed current role in November 2010; SVP of 27
President, Developing Media; VP and GM of FSCI’s Seattle radio
Operations stations; MBA from the University of Washington
Randa E. Minkarah Senior Vice Assumed current role in February 2011; VP of Market 28
President, Revenue Development; GSM for KOMO-TV, Management level
& Business positions at Clear Channel and Tribune
Development
Hassan N. Natha Vice President and Assumed current role in January 2011; VP of Finance; 29
CFO CFO of Jones Soda Co.; Senior Manager of Accenture
Inc.; Executive level position with Nike subsidiary; CPA
(WA)
Christopher J. Bellavia Senior Vice Assumed current role in May 2009; VP & Senior 17
President, General Attorney; Assistant GC (Corporate and Transactional)
Counsel & of Washington Mutual, Inc.; Senior Associate of Wilson
Corporate Sonsini Goodrich & Rosati; JD from Cornell Law
Secretary School
The Board and management team are keenly focused on increasing shareholder value
• Continued execution of our strategic plan
• Leveraging localism and diversifying business mix
• Optimizing the value of our asset portfolio
• Significant balance sheet deleveraging over the past two years
• Cultural innovation and industry leadership
• Maintaining best in class corporate leadership and further enhancing our board with industry experts and thought leadership
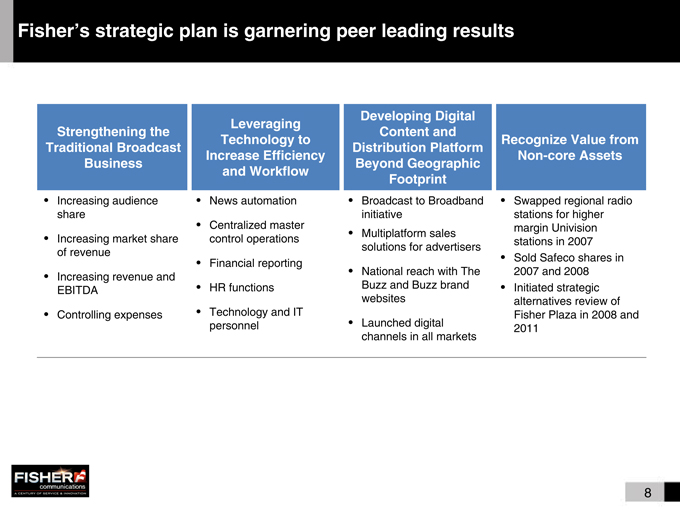
Fisher’s strategic plan is garnering peer leading results
Strengthening the Traditional Broadcast Business
• Increasing audience share
• Increasing market share of revenue
• Increasing revenue and EBITDA
• Controlling expenses
Leveraging Technology to Increase Efficiency and Workflow
• News automation
• Centralized master control operations
• Financial reporting
• HR functions
• Technology and IT personnel
Developing Digital Content and Distribution Platform Beyond Geographic Footprint
• Broadcast to Broadband initiative
• Multiplatform sales solutions for advertisers
• National reach with The Buzz and Buzz brand websites
• Launched digital channels in all markets
Recognize Value from Non-core Assets
• Swapped regional radio stations for higher margin Univision stations in 2007
• Sold Safeco shares in 2007 and 2008
• Initiated strategic alternatives review of Fisher Plaza in 2008 and 2011
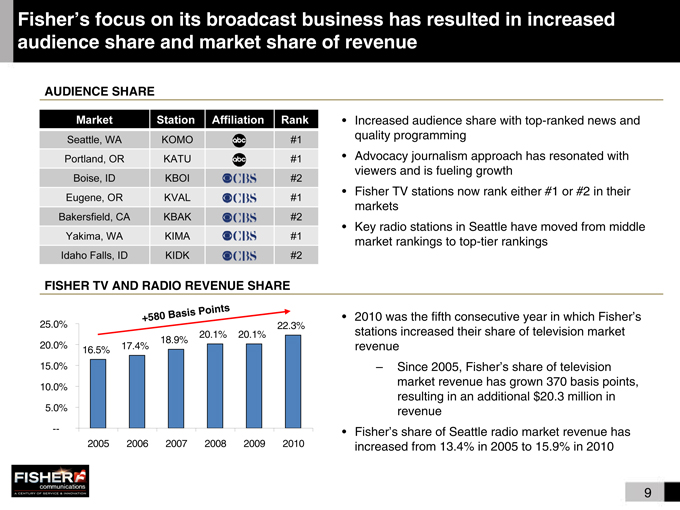
Fisher’s focus on its broadcast business has resulted in increased audience share and market share of revenue
AUDIENCE SHARE
Market Station Affiliation Rank
Seattle, WA KOMO #1
Portland, OR KATU #1
Boise, ID KBOI #2
Eugene, OR KVAL #1
Bakersfield, CA KBAK #2
Yakima, WA KIMA #1
Idaho Falls, ID KIDK #2
• Increased audience share with top-ranked news and quality programming
• Advocacy journalism approach has resonated with viewers and is fueling growth
• Fisher TV stations now rank either #1 or #2 in their markets
• Key radio stations in Seattle have moved from middle market rankings to top-tier rankings
FISHER TV AND RADIO REVENUE SHARE is Points
+580 Bas • 2010 was the fifth consecutive year in which Fisher’s
25.0% 22.3%
20.1% 20.1% stations increased their share of television market
18.9%
20.0% 16.5% 17.4% revenue
15.0% – Since 2005, Fisher’s share of television
10.0% market revenue has grown 370 basis points, resulting in an additional $20.3 million in
5.0% revenue
— • Fisher’s share of Seattle radio market revenue has 2005 2006 2007 2008 2009 2010 increased from 13.4% in 2005 to 15.9% in 2010
9
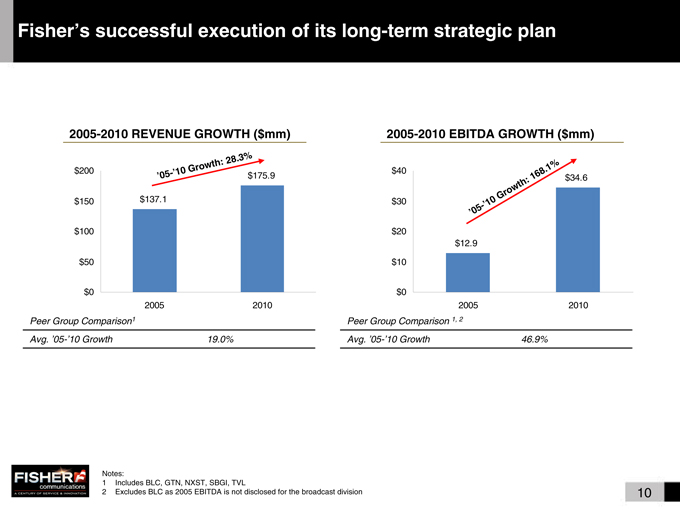
Fisher’s successful execution of its long-term strategic plan
2005-2010 REVENUE GROWTH ($mm)
‘05-’10 Growth: 28.3%
‘05-’10 Growth: 168.1%
$200 0 $175.9
$150 $137.1 $100 $50
$0
2005 2010
Peer Group Comparison1
Avg. ‘05-’10 Growth 19.0%
2005-2010 EBITDA GROWTH ($mm)
$34.6
$30
-
$20
$12.9 $10
$0
2005 2010
Peer Group Comparison 1, 2
Avg. ‘05-’10 Growth 46.9%
Notes:
1 Includes BLC, GTN, NXST, SBGI, TVL
2 Excludes BLC as 2005 EBITDA is not disclosed for the broadcast division 10
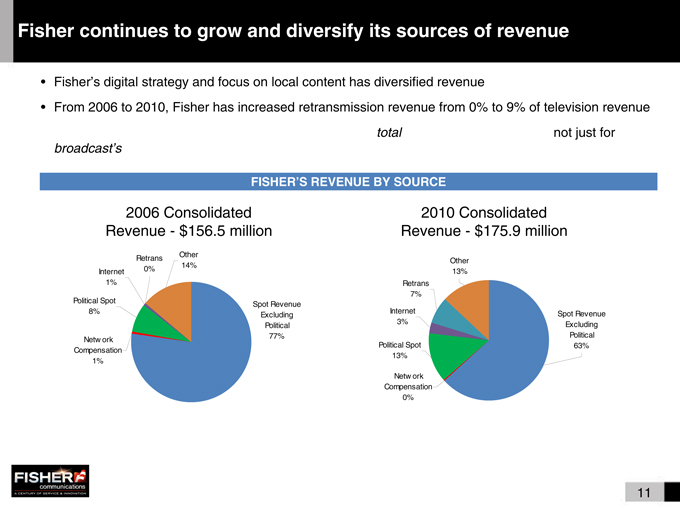
Fisher continues to grow and diversify its sources of revenue
• Fisher’s digital strategy and focus on local content has diversified revenue
• From 2006 to 2010, Fisher has increased retransmission revenue from 0% to 9% of television revenue
• Fisher is also growing its revenue by competing for the total local advertising spend – not just for broadcast’s share of the pie
FISHER’S REVENUE BY SOURCE
2006 Consolidated Revenue - $156.5 million
Retrans Other
0% 14% Internet 1%
Political Spot Spot Revenue
8% Excluding Political Network 77% Compensation 1%
2010 Consolidated Revenue - $175.9 million
Other 13% Retrans 7%
Internet Spot Revenue
3% Excluding Political Political Spot 63% 13%
Network Compensation 0%
11
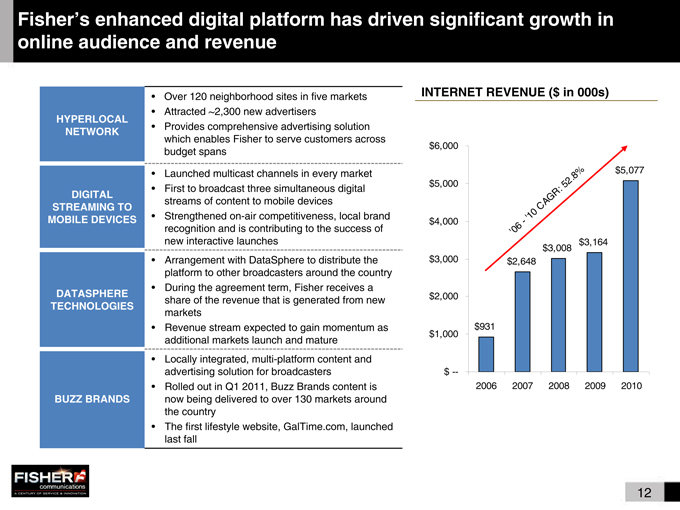
Fisher’s enhanced digital platform has driven significant growth in online audience and revenue
HYPERLOCAL NETWORK
DIGITAL STREAMING TO MOBILE DEVICES
DATASPHERE TECHNOLOGIES
BUZZ BRANDS
Over 120 neighborhood sites in five markets Attracted ~2,300 new advertisers Provides comprehensive advertising solution which enables Fisher to serve customers across budget spans
Launched multicast channels in every market First to broadcast three simultaneous digital streams of content to mobile devices Strengthened on-air competitiveness, local brand recognition and is contributing to the success of new interactive launches Arrangement with DataSphere to distribute the platform to other broadcasters around the country During the agreement term, Fisher receives a share of the revenue that is generated from new markets Revenue stream expected to gain momentum as additional markets launch and mature Locally integrated, multi-platform content and advertising solution for broadcasters Rolled out in Q1 2011, Buzz Brands content is now being delivered to over 130 markets around the country The first lifestyle website, GalTime.com, launched last fall
INTERNET REVENUE ($ in 000s)
$6,000
$5,077
$5,000
$4,000
$3,164 $3,008 $3,000 $2,648
$2,000
$931 $1,000
$ --
‘06-’10 CAGR: 52.8%
2006 2007 2008 2009 2010
12
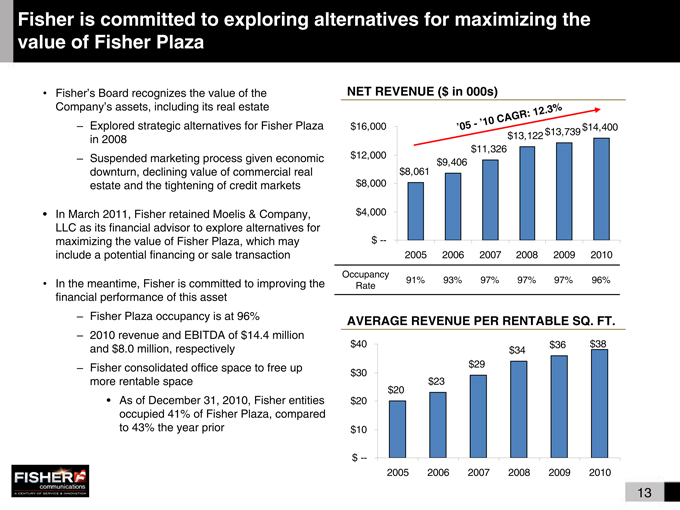
Fisher is committed to exploring alternatives for maximizing the value of Fisher Plaza
• Fisher’s Board recognizes the value of the Company’s assets, including its real estate
– Explored strategic alternatives for Fisher Plaza in 2008
– Suspended marketing process given economic downturn, declining value of commercial real estate and the tightening of credit markets
• In March 2011, Fisher retained Moelis & Company, LLC as its financial advisor to explore alternatives for maximizing the value of Fisher Plaza, which may include a potential financing or sale transaction
• In the meantime, Fisher is committed to improving the financial performance of this asset
– Fisher Plaza occupancy is at 96%
– 2010 revenue and EBITDA of $14.4 million and $8.0 million, respectively
– Fisher consolidated office space to free up more rentable space
• As of December 31, 2010, Fisher entities occupied 41% of Fisher Plaza, compared to 43% the year prior
NET REVENUE ($ in 000s)
12.3% AGR: -’10 C
$16,000 ‘05 $14,400 $13,122 $13,739 $11,326 $12,000 $8,061 $9,406 $8,000
$4,000
$ --
2005 2006 2007 2008 2009 2010 Occupancy 91% 93% 97% 97% 97% 96% Rate
AVERAGE REVENUE PER RENTABLE SQ. FT.
$40 $36 $38 $34 $29 $30 $23 $20 $20
$10
$ --
2005 2006 2007 2008 2009 2010
13
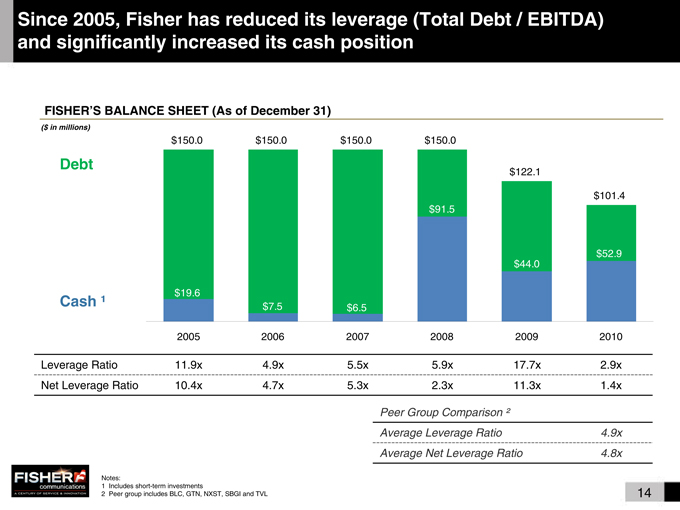
Since 2005, Fisher has reduced its leverage (Total Debt / EBITDA) and significantly increased its cash position
FISHER’S BALANCE SHEET (As of December 31)
($ in millions)
$150.0 $150.0 $150.0 $150.0
Debt
$122.1
$101.4
$91.5
$52.9
$44.0
$19.6
Cash ¹ $7.5 $6.5
2005 2006 2007 2008 2009 2010
Leverage Ratio 11.9x 4.9x 5.5x 5.9x 17.7x 2.9x Net Leverage Ratio 10.4x 4.7x 5.3x 2.3x 11.3x 1.4x
Peer Group Comparison ²
Average Leverage Ratio 4.9x Average Net Leverage Ratio 4.8x
Notes:
1 | | Includes short-term investments |
2 | | Peer group includes BLC, GTN, NXST, SBGI and TVL 14 |
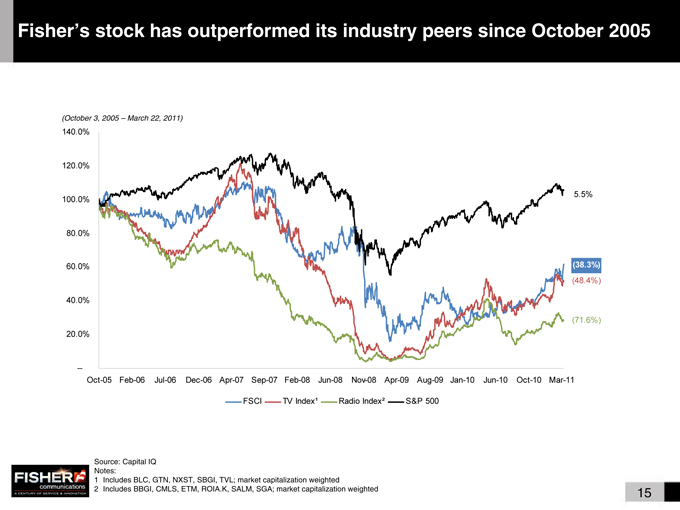
Fisher’s stock has outperformed its industry peers since October 2005
(October 3, 2005 – March 22, 2011)
140.0%
120.0%
5.5% 100.0%
80.0%
60.0% (38.3%)
(48.4%)
40.0%
(71.6%)
20.0%
—
Oct-05 Feb-06 Jul-06 Dec-06 Apr-07 Sep-07 Feb-08 Jun-08 Nov-08 Apr-09 Aug-09 Jan-10 Jun-10 Oct-10 Mar-11
FSCI TV Index¹ Radio Index² S&P 500
Source: Capital IQ Notes:
1 | | Includes BLC, GTN, NXST, SBGI, TVL; market capitalization weighted |
2 | | Includes BBGI, CMLS, ETM, ROIA.K, SALM, SGA; market capitalization weighted 15 |
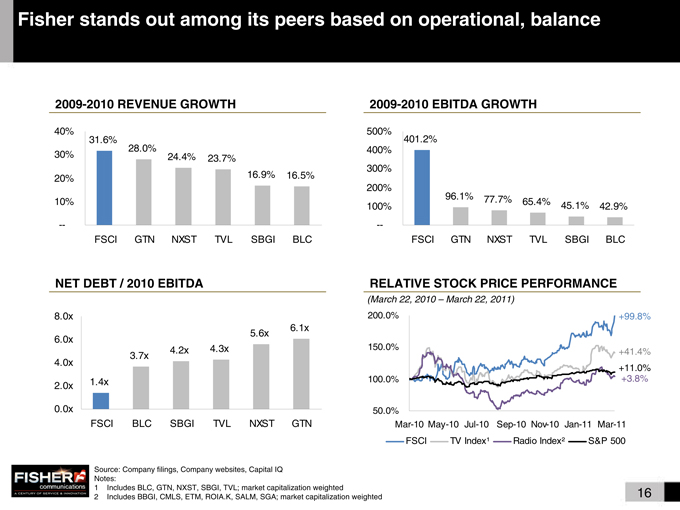
Fisher stands out among its peers based on operational, balance sheet and stock price performance
2009-2010 REVENUE GROWTH
40%
31.6%
28.0%
30% 24.4% 23.7%
20% 16.9% 16.5% 10%
- -
FSCI GTN NXST TVL SBGI BLC
2009-2010 EBITDA GROWTH
500%
401.2% 400% 300% 200%
96.1% 77.7%
100% 65.4% 45.1% 42.9% - - FSCI GTN NXST TVL SBGI BLC
NET DEBT / 2010 EBITDA
8.0x
6.1x
5.6x
6.0x 4.3x
4.2x
3.7x
4.0x
2.0x 1.4x
0.0x
FSCI BLC SBGI TVL NXST GTN
RELATIVE STOCK PRICE PERFORMANCE
(March 22, 2010 – March 22, 2011)
200.0% +99.8%
150.0%
+41.4% +11.0% 100.0% +3.8%
50.0%
Mar-10 May-10 Jul-10 Sep-10 Nov-10 Jan-11 Mar-11 FSCI TV Index¹ Radio Index² S&P 500
Source: Company filings, Company websites, Capital IQ Notes:
1 Includes BLC, GTN, NXST, SBGI, TVL; market capitalization weighted 16
2 Includes BBGI, CMLS, ETM, ROIA.K, SALM, SGA; market capitalization weighted
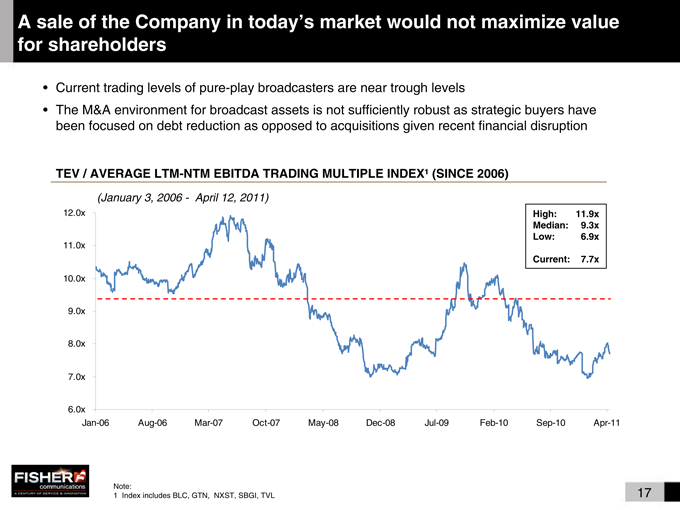
A sale of the Company in today’s market would not maximize value for shareholders
• Current trading levels of pure-play broadcasters are near trough levels
• The M&A environment for broadcast assets is not sufficiently robust as strategic buyers have been focused on debt reduction as opposed to acquisitions given recent financial disruption
TEV / AVERAGE LTM-NTM EBITDA TRADING MULTIPLE INDEX¹ (SINCE 2006)
(January 3, 2006 - April 12, 2011)
12.0x High: 11.9x Median: 9.3x
11.0x Low: 6.9x Current: 7.7x
10.0x
9.0x
8.0x
7.0x
6.0x
Jan-06 Aug-06 Mar-07 Oct-07 May-08 Dec-08 Jul-09 Feb-10 Sep-10 Apr-11
Note: 17
1 | | Index includes BLC, GTN, NXST, SBGI, TVL |

Fisher’s Board, including its four nominees, is the right Board for the Company
• Fisher’s Board has evolved, responded to the needs of shareholders and is keenly aware of the dynamic nature of the broadcasting industry
FISHER’S CONTINUING DIRECTORS AND NOMINEES
Name Year Joined Bio
D. Graham III 1993 Owner, Cerberus Productions
R. Hawley* 2003 EVP & CFO, Nicor Inc./Nicor Gas
C. Brown 2006 CEO, Fisher Communications, Inc.
B. McAndrews 2006 Managing Director, Madrona Venture Group; former CEO of aQuantive
M. Wortsman* 2007 30 years of broadcast experience; Chairman of ImpreMedia, former
President of Univision TV
P. Bible 2009 Senior Partner, Lewis & Roca LLP
D. Lorber 2009 Co-Founder, FrontFour Capital; former Director and Senior Investment
Analyst at Pirate Capital LLC
A. Cassara* 2011 30 years of broadcast experience; interim CEO of New Young
Broadcasting, former EVP of Chartwell Partners
R. Ogden* NA 35 years of broadcast experience; former President of Gannett TV, former
President of NBC Europe for GE
• Fisher’s nominees are highly qualified with nearly 100 years of combined broadcast experience, significant financial acumen and successful track records creating shareholder value at other companies
18
APPENDIX
19
The Company reports and discusses its operating results using financial measures consistent with generally accepted accounting principles (GAAP) and believes this should be the primary basis for evaluating its performance. These non-GAAP measures should not be viewed as alternatives or substitutes for GAAP reporting.
The Company believes the presentation of these non-GAAP measures is useful to investors because they are used by lenders to measure the Company’s ability to service debt; by industry analysts to determine the market value of stations and their operating performance; and by management to identify the cash available to service debt, make strategic acquisitions and investments, maintain capital assets and fund ongoing operations and working capital needs; and, because they reflect the most up-to-date operating results of the stations inclusive of pending acquisitions, time brokerage agreements or local marketing agreements. Management believes they also provide an additional basis from which investors can establish forecasts and valuations for the Company’s business.
20
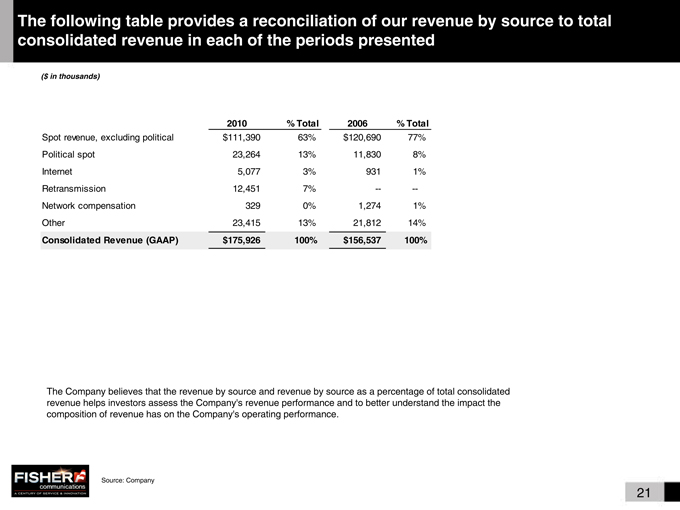
The following table provides a reconciliation of our revenue by source to total consolidated revenue in each of the periods presented
($ in thousands)
2010 % Total 2006 % Total
Spot revenue, excluding political $111,390 63% $120,690 77%
Political spot 23,264 13% 11,830 8%
Internet 5,077 3% 931 1%
Retransmission 12,451 7% -- --
Network compensation 329 0% 1,274 1%
Other 23,415 13% 21,812 14%
Consolidated Revenue (GAAP) $175,926 100% $156,537 100%
The Company believes that the revenue by source and revenue by source as a percentage of total consolidated revenue helps investors assess the Company’s revenue performance and to better understand the impact the composition of revenue has on the Company’s operating performance.
Source: Company
21
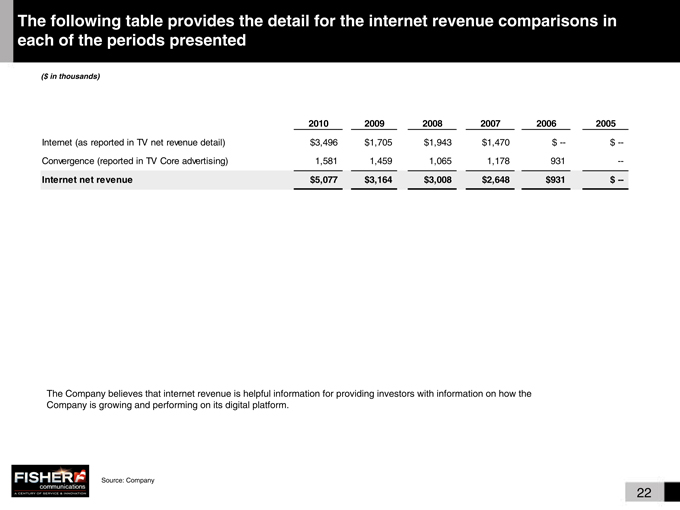
The following table provides the detail for the internet revenue comparisons in each of the periods presented
($ in thousands)
2010 2009 2008 2007 2006 2005
Internet (as reported in TV net revenue detail) $3,496 $1,705 $1,943 $1,470 $ -- $ --
Convergence (reported in TV Core advertising) 1,581 1,459 1,065 1,178 931 --
Internet net revenue $5,077 $3,164 $3,008 $2,648 $931 $ --
The Company believes that internet revenue is helpful information for providing investors with information on how the Company is growing and performing on its digital platform.
Source: Company
22
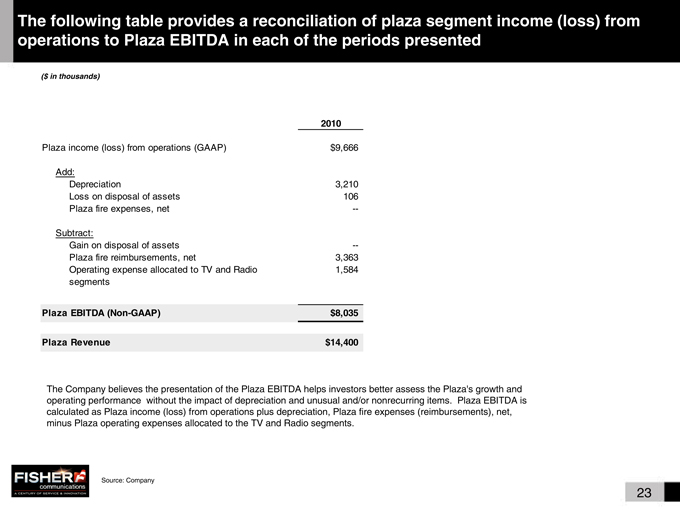
The following table provides a reconciliation of plaza segment income (loss) from operations to Plaza EBITDA in each of the periods presented
($ in thousands)
2010
Plaza income (loss) from operations (GAAP) $9,666
Add:
Depreciation 3,210
Loss on disposal of assets 106
Plaza fire expenses, net --
Subtract:
Gain on disposal of assets --
Plaza fire reimbursements, net 3,363
Operating expense allocated to TV and Radio 1,584
segments
Plaza EBITDA (Non-GAAP) $8,035
Plaza Revenue $14,400
The Company believes the presentation of the Plaza EBITDA helps investors better assess the Plaza’s growth and operating performance without the impact of depreciation and unusual and/or nonrecurring items. Plaza EBITDA is calculated as Plaza income (loss) from operations plus depreciation, Plaza fire expenses (reimbursements), net, minus Plaza operating expenses allocated to the TV and Radio segments.
Source: Company
23
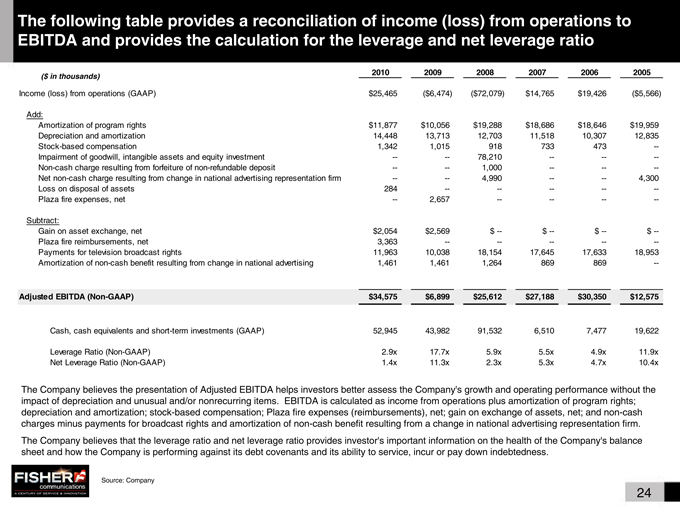
The following table provides a reconciliation of income (loss) from operations to EBITDA and provides the calculation for the leverage and net leverage ratio
($ in thousands) 2010 2009 2008 2007 2006 2005
Income (loss) from operations (GAAP) $25,465 ($6,474) ($72,079) $14,765 $19,426 ($5,566)
Add:
Amortization of program rights $11,877 $10,056 $19,288 $18,686 $18,646 $19,959
Depreciation and amortization 14,448 13,713 12,703 11,518 10,307 12,835
Stock-based compensation 1,342 1,015 918 733 473 —
Impairment of goodwill, intangible assets and equity investment — — 78,210 — — —
Non-cash charge resulting from forfeiture of non-refundable deposit — — 1,000 — — —
Net non-cash charge resulting from change in national advertising representation firm — — 4,990 — — 4,300
Loss on disposal of assets 284 — — — — —
Plaza fire expenses, net — 2,657 — — — —
Subtract:
Gain on asset exchange, net $2,054 $2,569 $ — $ — $ — $ —
Plaza fire reimbursements, net 3,363 — — — — —
Payments for television broadcast rights 11,963 10,038 18,154 17,645 17,633 18,953
Amortization of non-cash benefit resulting from change in national advertising 1,461 1,461 1,264 869 869 —
Adjusted EBITDA (Non-GAAP) $34,575 $6,899 $25,612 $27,188 $30,350 $12,575
Cash, cash equivalents and short-term investments (GAAP) 52,945 43,982 91,532 6,510 7,477 19,622
Leverage Ratio (Non-GAAP) 2.9x 17.7x 5.9x 5.5x 4.9x 11.9x
Net Leverage Ratio (Non-GAAP) 1.4x 11.3x 2.3x 5.3x 4.7x 10.4x
The Company believes the presentation of Adjusted EBITDA helps investors better assess the Company’s growth and operating performance without the impact of depreciation and unusual and/or nonrecurring items. EBITDA is calculated as income from operations plus amortization of program rights; depreciation and amortization; stock-based compensation; Plaza fire expenses (reimbursements), net; gain on exchange of assets, net; and non-cash charges minus payments for broadcast rights and amortization of non-cash benefit resulting from a change in national advertising representation firm. The Company believes that the leverage ratio and net leverage ratio provides investor’s important information on the health of the Company’s balance sheet and how the Company is performing against its debt covenants and its ability to service, incur or pay down indebtedness.
Source: Company
24