Exhibit 99.1
Financial Report
July - September 2023
Stockholm, Sweden, October 20, 2023
(NYSE: ALV and SSE: ALIV.sdb)


|
Financial Report July - September 2023 |
Q3 2023: Another strong quarter
| | |
Financial highlights Q3 2023 $2,596 million net sales 13% net sales increase 11% organic sales growth* 8.9% operating margin 9.4% adjusted operating margin* $1.57 EPS, 30% increase $1.66 adjusted EPS*, 35% increase | | Updated full year 2023 indications Around 17% organic sales growth Around 1% positive FX effect on net sales Around 8.5% - 9.0% adjusted operating margin Around $900 million operating cash flow |
All change figures in this release compare to the same period of the previous year except when stated otherwise.
Key business developments in the third quarter of 2023
•Sales increased organically* by 11%, which was 7pp better than global LVP growth of 3.8% (S&P Global October 2023). We outperformed in all regions, mainly due to new product launches and higher prices.
•Profitability improved substantially, positively impacted by price increases, organic growth, and our cost reduction activities. Operating income was $232 million and operating margin was 8.9%. Adjusted operating income* improved from $173 million to $243 million and adjusted operating margin* increased from 7.5% to 9.4%, despite inflationary pressure and adverse FX effects. Return on capital employed was 24% and adjusted return on capital employed* was 25%.
•Operating cash flow remained strong, albeit declining from $232 million to $202 million, mainly due to temporary negative working capital effects. Free cash flow* decreased to $50 million from $68 million. The leverage ratio* was unchanged at 1.3X compared to the second quarter of 2023. A dividend of $0.66 per share was paid, and 1.23 million shares were repurchased and retired in the quarter.
|
*For non-U.S. GAAP measures see enclosed reconciliation tables. |
Key Figures
| | | | | | |
(Dollars in millions, except per share data) | Q3 2023 | Q3 2022 | Change | 9M 2023 | 9M 2022 | Change |
Net sales | $2,596 | $2,302 | 13% | $7,724 | $6,507 | 19% |
Operating income | 232 | 171 | 36% | 453 | 429 | 5.5% |
Adjusted operating income1) | 243 | 173 | 40% | 586 | 365 | 60% |
Operating margin | 8.9% | 7.4% | 1.5pp | 5.9% | 6.6% | (0.7)pp |
Adjusted operating margin1) | 9.4% | 7.5% | 1.8pp | 7.6% | 5.6% | 2.0pp |
Earnings per share2) | 1.57 | 1.21 | 30% | 3.04 | 3.06 | (0.5)% |
Adjusted earnings per share1,2) | 1.66 | 1.23 | 35% | 4.48 | 2.58 | 73% |
Operating cash flow | $202 | $232 | (13)% | $535 | $251 | 114% |
Return on capital employed3) | 24.2% | 18.0% | 6.2pp | 15.6% | 15.3% | 0.3pp |
Adjusted return on capital employed1,3) | 24.5% | 18.4% | 6.2pp | 19.8% | 13.1% | 6.7pp |
1) Excluding effects from capacity alignments, antitrust related matters and the Andrews litigation settlement. Non-U.S. GAAP measure, see reconciliation table. 2) Assuming dilution when applicable and net of treasury shares. 3) Annualized operating income and income from equity method investments, relative to average capital employed. |
| | | |
Comments from Mikael Bratt, President & CEO | | |

| Our performance in the third quarter was very encouraging. Our organic sales growth continued to significantly outperform LVP and the adjusted operating income was a new third quarter record since the spin-off in 2018. I am pleased that our strong performance in the third quarter was broad based, with improvements in several key areas - both | nine months, we increased our sales to this group by more than 50% year over year. We increase our full year sales indication to reflect that LVP has developed better than expected, even with the UAW strike in the U.S. We have continued to see an improvement of supply chain stability throughout the year, with reduced customer call off volatility. However, the improvement is slower than we had expected, as it deteriorated somewhat in Europe in Q3. This, together with the higher sales and adverse FX development, means that we expect a fourth quarter adjusted operating margin improvement year-over-year of around 1.5-2pp, in line with the previously communicated improvement pattern of around 2pp each quarter throughout 2023. Our performance in the first nine months and the outlook for the final quarter of the year makes me confident that we will deliver a substantial full year increase in sales, operating cash flow and adjusted operating income. Together with the advancement of our structural cost reduction activities, the improving position with fast growing OEMs, the continued gradual improvement of supply chain stability, and the development of inflation compensation, we have a solid foundation for a continued strong development in the years to come, that support our medium-term targets. |
year-over-year and sequentially - including gross and operating margin, labor efficiency and SG&A and RD&E costs in relation to sales. Cash flow was strong, and the debt leverage remained well within our target range while maintaining our dividend and almost tripling the number of shares repurchased compared to Q2. We continue to work hard to secure a strong medium- and long-term competitive position. In the quarter, we detailed a large part of our structural cost reduction intentions of reducing our indirect workforce by up to 2,000. In addition, the ongoing reorganization of our global functions and European operations is expected to lead to a reduced normalized tax rate. It is also encouraging for our medium- and long-term potential that we continue to improve our position in China with the fast-growing domestic OEMs. In the first |
2
|
Financial Report July - September 2023 |
Full year 2023 indications
Our outlook indications for 2023 are mainly based on our customer call-offs, a full year 2023 global LVP growth of around 7%, achievement of our targeted cost compensation effects, and a reduction of customer call-off volatility. Our full year 2023 indications are also based on the assumption that the UAW strike is not prolonged beyond what is included in the S&P Global October outlook.
| | | |
| Full Year Indication | | Full Year Indication |
Organic sales growth | Around 17% | Tax rate2) | Around 20% |
FX impact on net sales | Around 1% positive | Operating cash flow3) | Around $900 million |
Adjusted operating margin1) | Around 8.5%-9% | Capex, net, of sales | Around 6% |
1) Excluding effects from capacity alignments, antitrust related matters, the Andrews litigation settlement and other discrete items. 2) Excluding unusual tax items. 3) Excluding unusual items. |
The forward-looking non-U.S. GAAP financial measures above are provided on a non-U.S. GAAP basis. Autoliv has not provided a U.S. GAAP reconciliation of these measures because items that impact these measures, such as costs and gains related to capacity alignments and antitrust matters, cannot be reasonably predicted or determined. As a result, such reconciliation is not available without unreasonable efforts and Autoliv is unable to determine the probable significance of the unavailable information.
Conference call and webcast
An earnings conference call will be held at 2:00 p.m. CET today, October 20, 2023. Information regarding how to participate is available on www.autoliv.com. The presentation slides for the conference call will be available on our website shortly after the publication of this financial report.
3
|
Financial Report July - September 2023 |
Business and market condition update
Supply Chain
Global light vehicle production growth year-over-year was 3.8% (according to S&P Global October 2023) in the third quarter, with all major regions growing except China. We saw continued gradual improvement in call-off volatility as supply chains are less strained compared to a year earlier. However, volatility is still significantly higher than pre-pandemic levels, and low customer demand visibility and changes to customer call-offs with short notice still had a negative impact on our production efficiency and profitability in the quarter. We expect the current industry-wide supply chain disruptions to continue to fade in the fourth quarter of 2023, but not enough to return to pre-pandemic levels of efficiency by year-end.
Inflation
In Q3 2023, cost pressures from labor, logistics, utilities, and other items had a negative impact on our profitability. Most of the inflationary cost pressure was offset by customer price and other compensations in the quarter. Raw material cost inflation and its impact on our profitability was negligible in Q3 2023. We expect the raw material price changes in 2023 to be largely reflected in price changes in our products, albeit with delays of several months. We also expect continued cost pressure from broad based inflation relating to labor, logistics, utilities and other items, especially in Europe. We continue to execute on productivity and cost reduction activities to offset these cost pressures, and we continue to have challenging discussions with our customers on non-raw material cost inflation.
Other matters
Autoliv expects its tax rate for full year 2023 to be lower than previously anticipated. The full year tax rate is now projected to be around 20% for full year 2023. This is due to the ongoing reorganization of our global functions and European operations, which is expected to lead to a reduced tax rate for 2023. These changes are also expected to reduce the normalized tax rate to be within a range of around 25-30% from 2024 onwards.
The UAW strike has had negligible impact on our sales and profitability in the third quarter, with around $2 million in lost sales. We estimate that the current strike actions, as known as of October 19, 2023, by UAW are currently negatively impacting our weekly sales by around $6 million.
In June, 2023 Autoliv communicated a cost reduction framework which included the intention of reducing our indirect headcount by up to 2,000. We announced more details on these initiatives on July 13, 2023 and followed up with another announcement with details on October 5, 2023. Based on the intended work force reductions in these two announcements, we estimate that the annual cost reductions will amount to around $35 million in 2024, $65 million in 2025 and reaching $85 million when fully implemented. We expect to announce further details, as plans materialize further.
We expect 2024 to be an important step towards our medium-term target of 12% adjusted operating margin*. We intend, as usual, to come back with a full year indication in connection with our fourth quarter earnings release in January next year.
This report includes content supplied by S&P Global; Copyright © Light Vehicle Production Forecast, January, July and October 2023. All rights reserved.
4
|
Financial Report July - September 2023 |
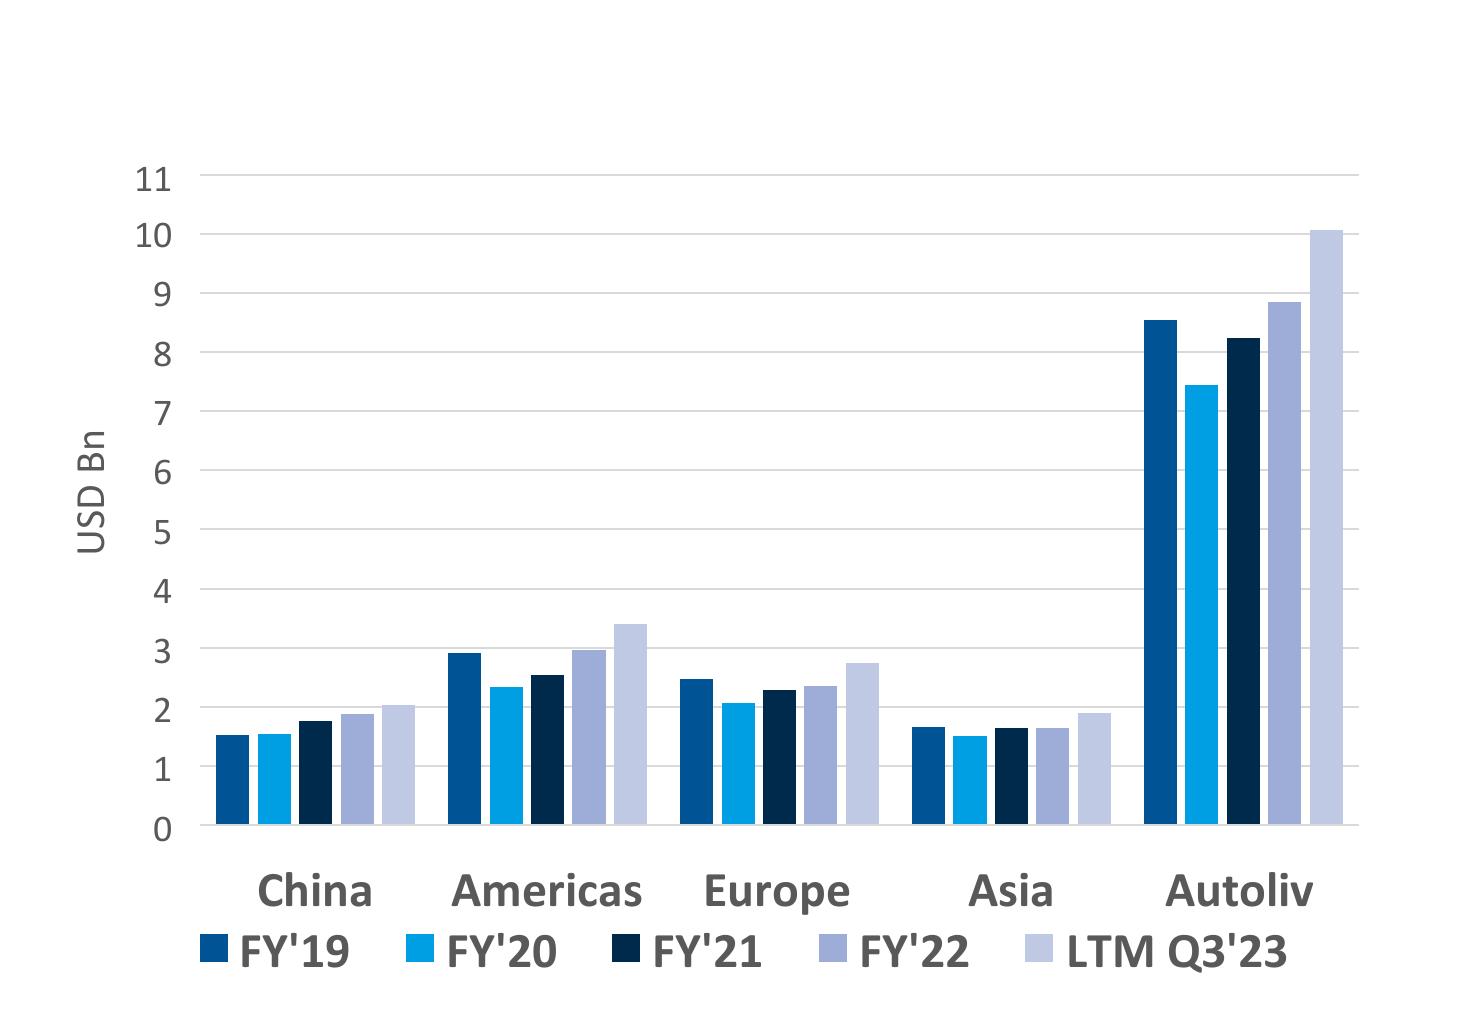
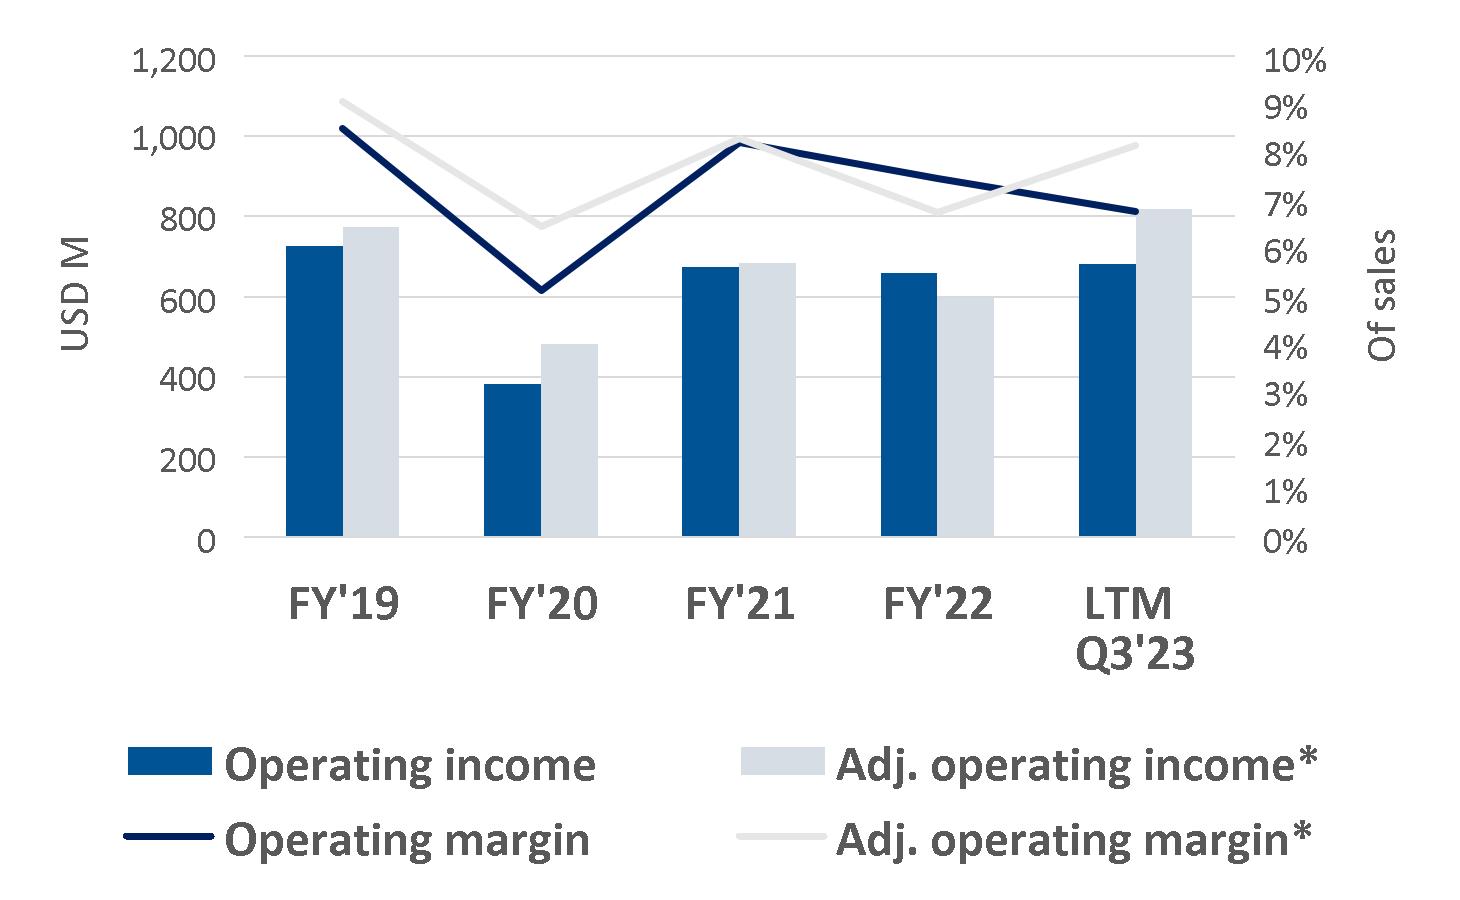
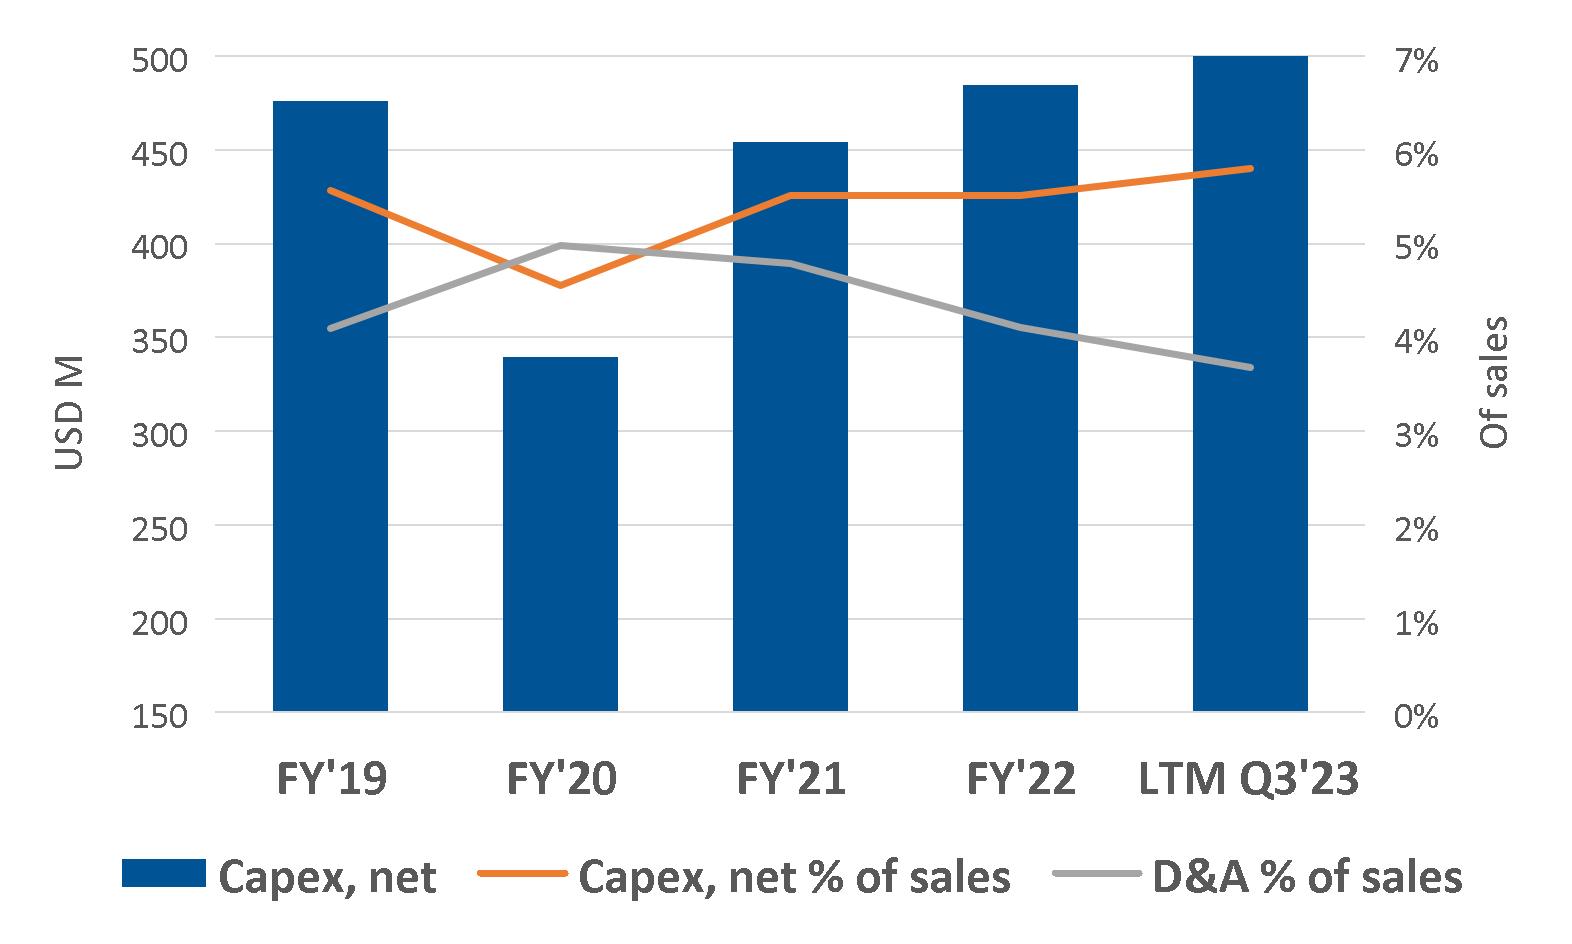
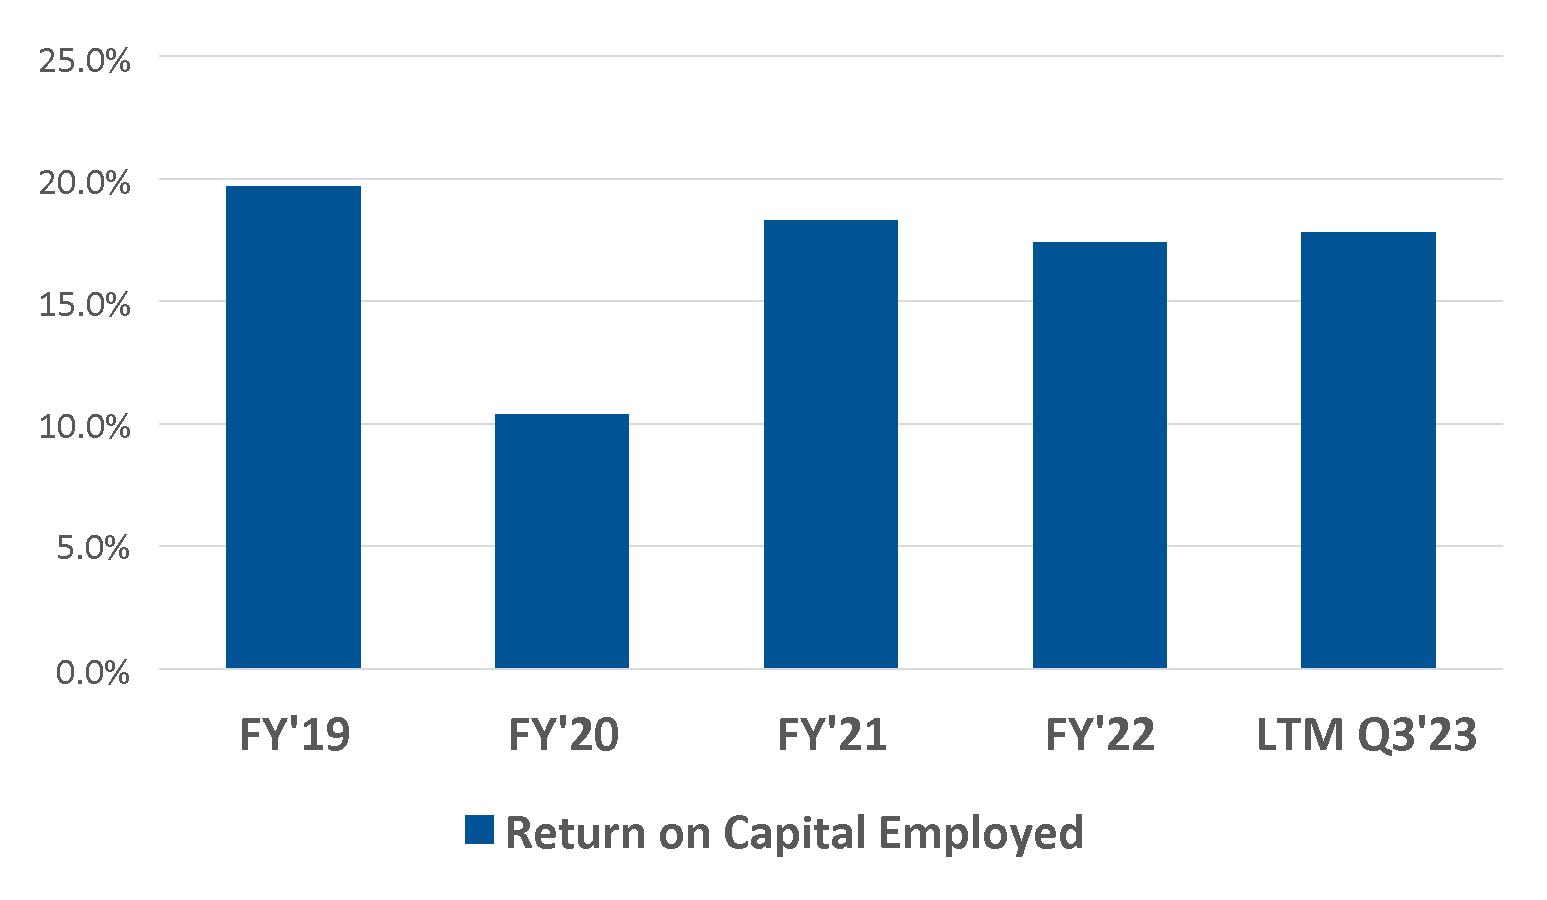
Key Performance Trends
| |
Net Sales Development by region | Operating and adjusted operating income* and margins |
| |
| 
|
| |
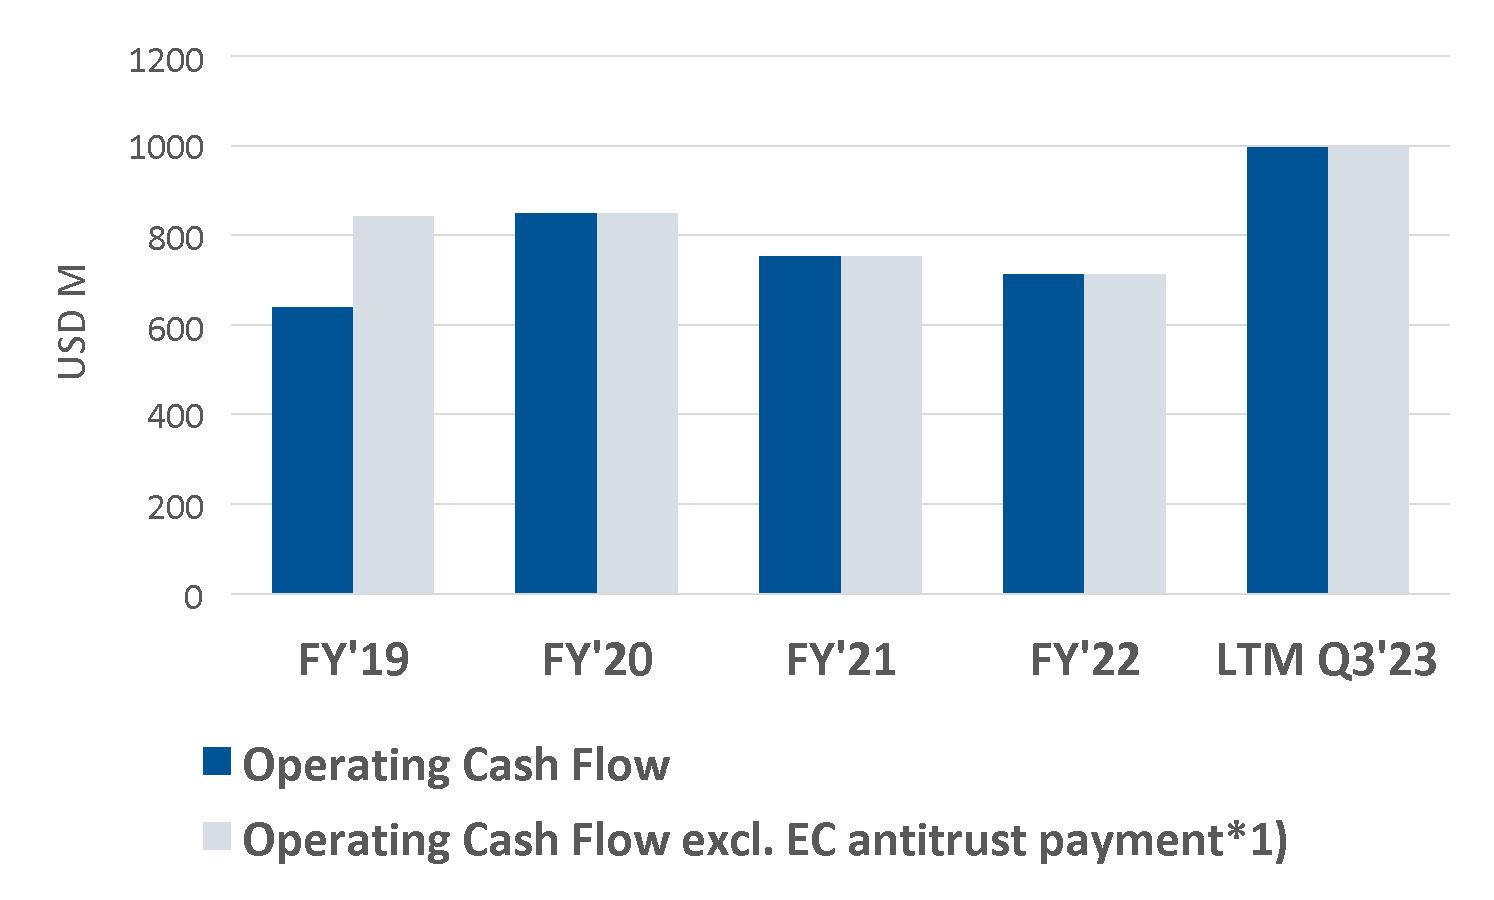
Capex and D&A | Operating and adjusted operating Cash Flow |
| |
| 
|
| |
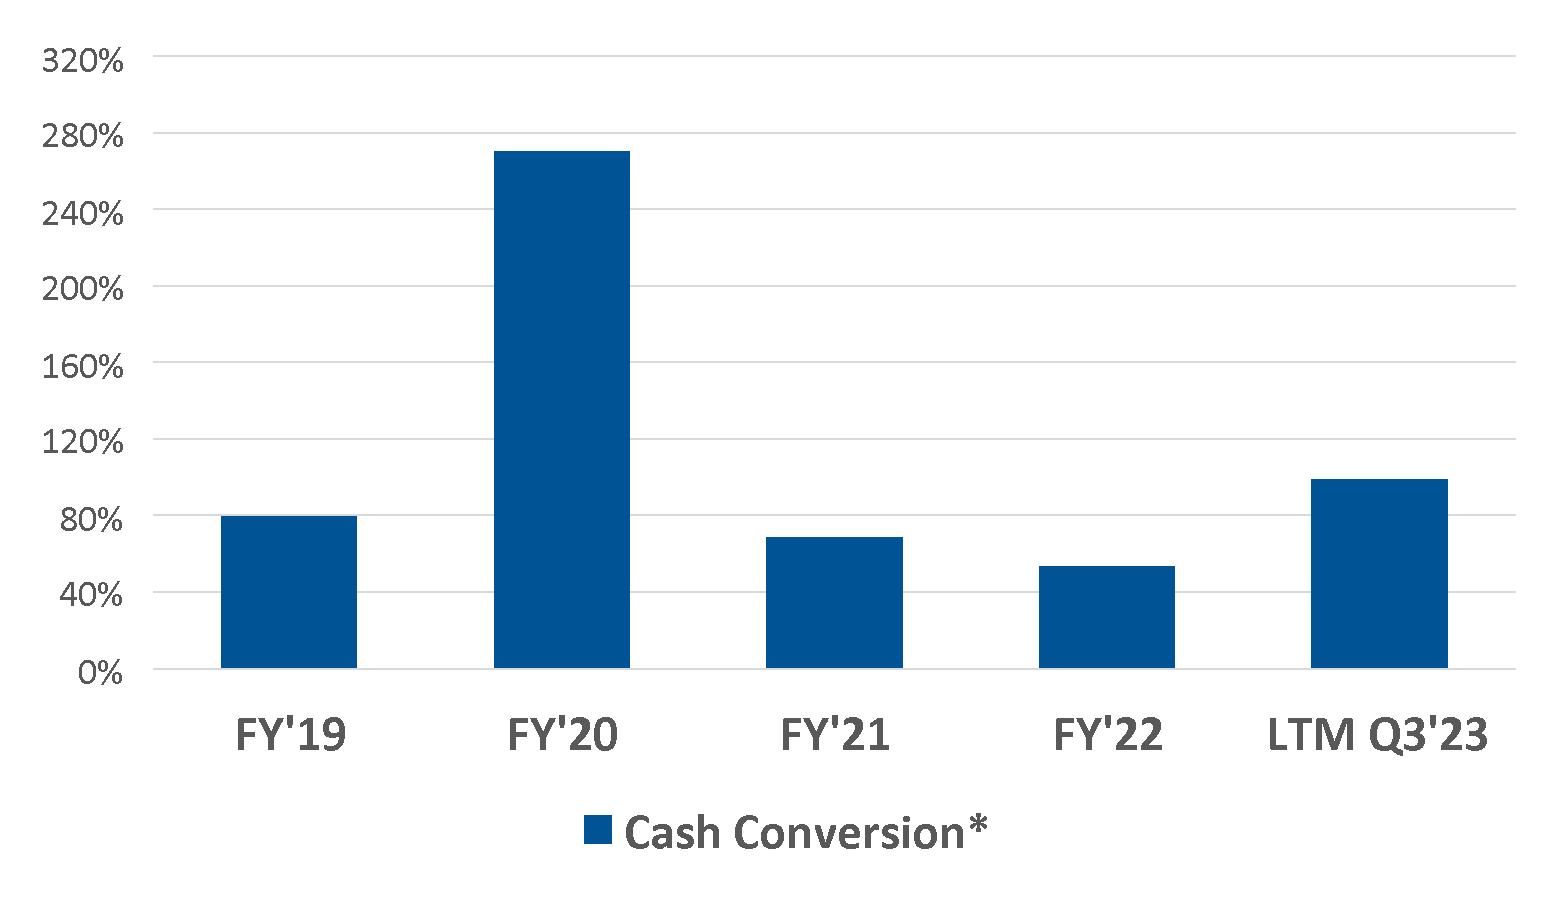
Return on Capital Employed | Cash Conversion* |
| |
| 
|
Key definitions ------------------------------------------------------------------------------------------------------------
| | |
Capex, net: Capital Expenditure, net. D&A: Depreciation and Amortization. Adj. operating income and margin*: Operating income adjusted for capacity alignments, antitrust related matters and the Andrews litigation settlement. Capacity alignments include non-recurring costs related to our structural efficiency and business cycle management programs. | | Operating cash flow excluding EC antitrust payment*: Adjusted for EC antitrust payment of $203 million in 2019. Cash conversion*: Free cash flow* in relation to net income adjusted for EC antitrust payment in 2019. Free cash flow defined as operating cash flow less capital expenditure, net. |
5
|
Financial Report July - September 2023 |
Consolidated sales development
Third quarter 2023
| | | | | | |
Consolidated sales | | Third quarter | Reported | Currency | Organic |
(Dollars in millions) | | 2023 | 2022 | (U.S. GAAP) | effects1) | change* |
Airbags, Steering Wheels and Other2) | | $1,761 | $1,510 | 17% | 1.9% | 15% |
Seatbelt Products and Other2) | | 835 | 792 | 5.5% | 2.9% | 2.6% |
Total | | $2,596 | $2,302 | 13% | 2.2% | 11% |
| | | | | | |
Asia | | $1,033 | $955 | 8.1% | (3.7)% | 12% |
Whereof: | China | 538 | 537 | 0.1% | (5.4)% | 5.6% |
| Asia excl. China | 495 | 418 | 18% | (1.5)% | 20% |
Americas | | 918 | 794 | 16% | 5.0% | 11% |
Europe | | 646 | 552 | 17% | 8.4% | 8.5% |
Total | | $2,596 | $2,302 | 13% | 2.2% | 11% |
1) Effects from currency translations. 2) Including Corporate sales. |
| | |
Sales by product – Airbags, Steering Wheels and Other Sales for all major product categories increased organically* in the quarter. The largest contributor to the increase was steering wheels, followed by inflatable curtains, side airbags, and passenger airbags. | | Sales by product - Seatbelt Products and Other The main contributor to Seatbelt Products organic sales growth* was Asia excl. China and Europe, followed by Americas. |
| | |
Sales by region Our global organic sales* increased by 11% compared to the global LVP increase of 3.8% (according to S&P Global, October 2023). The 7pp outperformance was mainly driven by price increases and new product launches. | | Autoliv organic sales growth outperformed LVP growth by 15pp in Asia excl. China, by 6pp in China, by 3pp in Americas and by 2pp in Europe. |
| | | | | |
Q3 2023 organic growth* | Americas | Europe | China | Asia excl. China | Global |
Autoliv | 11% | 8.5% | 5.6% | 20% | 11% |
Main growth drivers | Mercedes, Nissan, Honda | Mercedes, BMW | Lixiang, GWM, Chery | Toyota, Hyundai, Subaru | Honda, Toyota, Mercedes |
Main decline drivers | BMW, Ford, Stellantis | Volvo, Ford, VW | VW, Nissan, GM | Renault, Bodrin, Stellantis | VW, Renault, Ford |
Light vehicle production development
Change vs same period last year according to S&P Global
| | | | | |
Q3 2023 | Americas | Europe | China | Asia excl. China | Global |
LVP (Oct 2023) | 7.9% | 6.5% | (0.6)% | 4.5% | 3.8% |
LVP (Jul 2023) | 4.4% | 6.1% | (16)% | 2.6% | (3.5)% |
6
|
Financial Report July - September 2023 |
Consolidated sales development
First nine months 2023
| | | | | | |
Consolidated sales | | First 9 months | Reported | Currency | Organic |
(Dollars in millions) | | 2023 | 2022 | (U.S. GAAP) | effects1) | change* |
Airbags, Steering Wheels and Other2) | | $5,191 | $4,226 | 23% | (0.6)% | 23% |
Seatbelt Products and Other2) | | 2,533 | 2,281 | 11% | (0.0)% | 11% |
Total | | $7,724 | $6,507 | 19% | (0.4)% | 19% |
| | | | | | |
Asia | | $2,937 | $2,544 | 15% | (5.5)% | 21% |
Whereof: | China | 1,488 | 1,347 | 10% | (6.1)% | 17% |
| Asia excl. China | 1,449 | 1,197 | 21% | (4.7)% | 26% |
Americas | | 2,665 | 2,225 | 20% | 3.6% | 16% |
Europe | | 2,122 | 1,738 | 22% | 2.0% | 20% |
Total | | $7,724 | $6,507 | 19% | (0.4)% | 19% |
1) Effects from currency translations. 2) Including Corporate sales. |
| | |
Sales by product – Airbags, Steering Wheels and Other Sales for all major product categories increased organically* in the first nine months. The largest contributor to the increase was inflatable curtains and steering wheels, followed by side airbags and passenger airbags. | | Sales by product - Seatbelt Products and Other The main contributor to Seatbelt Products organic sales growth* was Europe, followed by Americas, Asia excl. China, and China. |
| | |
|
Sales by region Our global organic sales* increased by 19% compared to the global LVP increase of 9.1% (according to S&P Global, October 2023). The 10pp outperformance was mainly driven by new product launches and price increases. | | Autoliv outperformed LVP by around 15pp in Asia excl. China, by 12pp in China, by 6pp in Europe and in Americas. |
| | | | | |
9M 2023 organic growth* | Americas | Europe | China | Asia excl. China | Global |
Autoliv | 16% | 20% | 17% | 26% | 19% |
Main growth drivers | Honda, GM, Nissan | VW, Stellantis, Renault | Honda, Lixiang, BYD | Toyota, Hyundai, Subaru | Honda, Toyota, Hyundai |
Main decline drivers | Ford, BMW | Mitsubishi | Nissan, VW, Renault | Renault, KG Mobility, Stellantis | Ford |
Light vehicle production development
Change vs same period last year according to S&P Global
| | | | | |
First 9 months 2023 | Americas | Europe | China | Asia excl. China | Global |
LVP (Oct 2023) | 11% | 14% | 4.5% | 11% | 9.1% |
LVP (Jan 2023) | 6.5% | 5.7% | (3.1)% | 5.8% | 2.8% |
7
|
Financial Report July - September 2023 |
Key launches in the third quarter 2023
| | | | | |
BMW 5-series/i5  | | Honda Elevate | | Dodge RAM Rampage | |

| | 
| | 
| |
     
| |    
| |   
| |
| | | | | |
Changan A07 | | WEY High Mountain | | Volvo EX30 | |

| | 
| | 
| |
  
| |   
| | | |
| | | | | |
Peugeot e-308  | | Rolls Royce Spectre  | | Haval H5 | |

| | 
| | 
| |
    
| |  | |  
| |
| | | | | | |
| 
| Driver/Passenger Airbags | 
| Seatbelts | 
| Side Airbags |
| 
| Head/Inflatable Curtain Airbags | 
| Steering Wheel | 
| Knee Airbag |
| 
| Front Center Airbag | 
| Bag-in-Belt | 
| Pyrotechnical Safety Switch |
| 
| Pedestrian Airbag | 
| Hood Lifter | 
| Available as EV/PHEV |
8
|
Financial Report July - September 2023 |
Financial development
Selected Income Statement items
| | | | | | | |
Condensed income statement | Third quarter | | First 9 months |
(Dollars in millions, except per share data) | 2023 | 2022 | Change | | 2023 | 2022 | Change |
Net sales | $2,596 | $2,302 | 13% | | $7,724 | $6,507 | 19% |
Cost of sales | (2,131) | (1,918) | 11% | | (6,432) | (5,510) | 17% |
Gross profit | $465 | $383 | 21% | | $1,291 | $998 | 29% |
S,G&A | (118) | (105) | 12% | | (379) | (333) | 14% |
R,D&E, net | (107) | (106) | 1.0% | | (343) | (325) | 5.7% |
Amortization of intangibles | (1) | (0) | 28% | | (1) | (2) | (36)% |
Other income (expense), net | (8) | (1) | 756% | | (115) | 91 | n/a |
Operating income | $232 | $171 | 36% | | $453 | $429 | 5.5% |
Adjusted operating income1) | $243 | $173 | 40% | | $586 | $365 | 60% |
Financial and non-operating items, net | (30) | (18) | 68% | | (60) | (40) | 50% |
Income before taxes | $201 | $153 | 32% | | $393 | $389 | 0.9% |
Income taxes | (67) | (47) | 43% | | (131) | (121) | 8.5% |
Net income | $134 | $106 | 27% | | $262 | $268 | (2.5)% |
Earnings per share2) | $1.57 | $1.21 | 30% | | $3.04 | $3.06 | (0.5)% |
Adjusted earnings per share1,2) | $1.66 | $1.23 | 35% | | $4.48 | $2.58 | 73% |
| | | | | | | |
Gross margin | 17.9% | 16.7% | 1.3pp | | 16.7% | 15.3% | 1.4pp |
S,G&A, in relation to sales | (4.6)% | (4.6)% | 0.0pp | | (4.9)% | (5.1)% | 0.2pp |
R,D&E, net in relation to sales | (4.1)% | (4.6)% | 0.5pp | | (4.4)% | (5.0)% | 0.5pp |
Operating margin | 8.9% | 7.4% | 1.5pp | | 5.9% | 6.6% | (0.7)pp |
Adjusted operating margin1) | 9.4% | 7.5% | 1.8pp | | 7.6% | 5.6% | 2.0pp |
Tax Rate | 33.4% | 30.8% | 2.6pp | | 33.4% | 31.1% | 2.3pp |
| | | | | | | |
Other data | | | | | | | |
No. of shares at period-end in millions3) | 84.1 | 86.8 | (3.1)% | | 84.1 | 86.8 | (3.1)% |
Weighted average no. of shares in millions4) | 84.9 | 87.0 | (2.5)% | | 85.5 | 87.2 | (2.0)% |
Weighted average no. of shares in millions, diluted4) | 85.0 | 87.2 | (2.5)% | | 85.7 | 87.4 | (2.0)% |
1) Non-U.S. GAAP measure, excluding effects from capacity alignments, antitrust related matters and the Andrews litigation settlement. See reconciliation table. 2) Assuming dilution when applicable and net of treasury shares. 3) Excluding dilution and net of treasury shares. 4) Net of treasury shares. |
| | |
Third quarter 2023 development Gross profit increased by $82 million, and the gross margin increased by 1.3pp compared to the same quarter 2022. The gross profit increase was primarily driven by price increases, volume growth, lower costs for material and premium freight. This was partly offset by increased costs for personnel related to volume growth and wage inflation. S,G&A costs increased by $13 million compared to the prior year, mainly due to increased costs for personnel as well as adverse FX translation effects. S,G&A costs in relation to sales was unchanged at 4.6%. R,D&E, net costs was almost unchanged compared to the prior year, as higher costs for personnel and adverse FX translation effects were almost offset by higher engineering income. R,D&E, net, in relation to sales decreased from 4.6% to 4.1%. Other income (expense), net was negative $8 million compared to negative $1 million in the same period last year. The difference was mainly related to higher capacity alignment accruals in Q3 2023. Operating income increased by $61 million compared to the same period in 2022, mainly due to the increase in gross profit, partly offset by higher costs for S,G&A. | | Adjusted operating income* increased by $70 million compared to the prior year, mainly due to higher gross profit, partly offset by the higher costs for S,G&A. Financial and non-operating items, net, was negative $30 million compared to negative $18 million a year earlier. The difference was mainly due to increased interest expense as an effect of higher debt and higher interest rates and FX revaluation effects. Income before taxes increased by $49 million compared to the prior year, mainly due to the increase in operating income, partly offset by a larger Financial and non-operating items, net. Tax rate was 33.4% compared to 30.8% in the same period last year. Discrete tax items, net, increased the tax rate this quarter by 0.2pp. Discrete tax items increased the tax rate by 1.4pp in the same period last year. Earnings per share, diluted increased by $0.36 compared to a year earlier. The main drivers were $0.49 from operating income partly offset by $0.10 from financial items. |
9
|
Financial Report July - September 2023 |
| | |
First nine months 2023 development Gross profit increased by $294 million, and the gross margin increased by 1.4pp compared to the same period in 2022. The gross profit increase was primarily driven by price increases, volume growth and lower costs for premium freight. This was partly offset by increased costs for personnel related to higher volumes and wage inflation as well as adverse effects from FX and higher costs for energy. S,G&A costs increased by $46 million compared to the prior year, mainly due to increased costs for personnel projects. S,G&A costs in relation to sales decreased from 5.1% to 4.9%. R,D&E, net costs increased by around $19 million compared to the prior year, mainly due to higher costs for personnel. R,D&E, net, in relation to sales decreased from 5.0% to 4.4%. Other income (expense), net was negative $115 million compared to positive $91 million in the prior year. The prior year was positively impacted by around an $80 million gain from the sale of a property in Japan and around $20 million from a patent litigation settlement, partly offset by around $10 million in capacity alignment provisions for the closure of a plant in South Korea while the first nine months of 2023 was negatively impacted by around $105 million in accruals for capacity alignments. Operating income increased by $24 million compared to the same period in 2022, mainly due to higher gross profit, partly offset by the changes in Other income (expense), net and the higher costs for S,G&A and R,D&E, net. | | Adjusted operating income* increased by $221 million compared to the prior year, mainly due to higher gross profit, partly offset by the higher costs for S,G&A and R,D&E, net. Financial and non-operating items, net, was negative $60 million compared to negative $40 million a year earlier, mainly due to increased interest expense as an effect of higher debt and higher interest rates. Income before taxes increased by $3 million compared to the prior year, mainly due to the higher operating income partly offset by the increased interest expense. Tax rate was 33.4% compared to 31.1% in the same period last year. Discrete tax items, net, decreased the tax rate this year by 0.6pp. Discrete tax items increased the tax rate by 1.2pp in the same period last year. Earnings per share, diluted decreased by $0.02 compared to a year earlier. The main drivers behind the decrease were $0.17 from financial items and $0.14 from lower operating income, partly offset by $0.23 from taxes. |
10
|
Financial Report July - September 2023 |
Selected Balance Sheet and Cash Flow items
| | | |
Selected Balance Sheet items | Third quarter |
(Dollars in millions) | 2023 | 2022 | Change |
Trade working capital1) | $1,303 | $1,314 | (0.8)% |
Trade working capital in relation to sales2) | 12.5% | 14.3% | (1.7)pp |
- Receivables outstanding in relation to sales3) | 21.0% | 20.6% | 0.4pp |
- Inventory outstanding in relation to sales4) | 9.5% | 10.0% | (0.6)pp |
- Payables outstanding in relation to sales5) | 17.9% | 16.3% | 1.6pp |
Cash & cash equivalents | 475 | 483 | (1.7)% |
Gross Debt6) | 1,867 | 1,729 | 8.0% |
Net Debt7) | 1,375 | 1,288 | 6.8% |
Capital employed8) | 3,861 | 3,779 | 2.2% |
Return on capital employed9) | 24.2% | 18.0% | 6.2pp |
Total equity | $2,486 | $2,491 | (0.2)% |
Return on total equity10) | 21.3% | 16.8% | 4.5pp |
Leverage ratio11) | 1.3 | 1.6 | (0.3) |
1) Outstanding receivables and outstanding inventory less outstanding payables. 2) Outstanding receivables and outstanding inventory less outstanding payables relative to annualized quarterly sales. 3) Outstanding receivables relative to annualized quarterly sales. 4) Outstanding inventory relative to annualized quarterly sales. 5) Outstanding payables relative to annualized quarterly sales. 6) Short- and long-term interest-bearing debt. 7) Short- and long-term debt less cash and cash equivalents and debt-related derivatives. Non U.S. GAAP measure. See reconciliation table. 8) Total equity and net debt. 9) Annualized operating income and income from equity method investments, relative to average capital employed. 10) Annualized net income relative to average total equity. 11) Net debt adjusted for pension liabilities in relation to EBITDA. Non U.S. GAAP measure. See reconciliation table. |
| | | | | | | |
Selected Cash Flow items | Third quarter | | First 9 months |
(Dollars in millions) | 2023 | 2022 | Change | | 2023 | 2022 | Change |
Net income | $134 | $106 | 27% | | $262 | $268 | (2.5)% |
Changes in operating working capital | (36) | 89 | n/a | | (8) | (168) | (95)% |
Depreciation and amortization | 95 | 87 | 8.6% | | 281 | 273 | 2.9% |
Gain on divestiture of property | - | - | n/a | | - | (80) | (100)% |
Other, net | 9 | (51) | n/a | | 1 | (44) | n/a |
Operating cash flow | $202 | $232 | (13)% | | $535 | $251 | 114% |
Capital expenditure, net | (151) | (164) | (7.6)% | | (419) | (319) | 31% |
Free cash flow1) | $50 | $68 | (26)% | | $117 | $(69) | n/a |
Cash conversion2) | 37% | 64% | (27)pp | | 45% | n/a | n/a |
Shareholder returns | | | | | | | |
- Dividends paid | (56) | (56) | 0.1% | | (169) | (167) | 0.8% |
- Share repurchases | (120) | (20) | 500% | | (202) | (60) | 237% |
Cash dividend paid per share | $(0.66) | $(0.64) | 2.6% | | $(1.98) | $(1.92) | 3.4% |
Capital expenditures, net in relation to sales | 5.8% | 7.1% | (1.3)pp | | 5.4% | 4.9% | 0.5pp |
1) Operating cash flow less Capital expenditure, net. Non U.S. GAAP measure. See enclosed reconciliation table. 2) Free cash flow relative to Net income. Non U.S. GAAP measure. See reconciliation table. |
| | |
Third quarter 2023 development Trade working capital* decreased by $11 million compared to the same period last year, where the main drivers were $354 million in higher accounts payable partly offset by $286 million in higher receivables and $58 million in higher inventories. Compared to Q2 2023, trade working capital increased by $11 million, driven by $35 million in higher inventories, partly offset by $14 million in higher accounts payable and $10 million in lower receivables. Operating cash flow decreased by $30 million to $202 million compared to the same period last year, mainly due to less favorable working capital effects partly offset by higher net income. | | Capital expenditure, net decreased by $12 million compared to the same period the previous year. Capital expenditure, net in relation to sales was 5.8% vs. 7.1% a year earlier. Free cash flow* was $50 million compared to $68 million in the same period prior year. The decrease was mainly due to the lower operating cash flow partly offset by lower capital expenditure, net. |
11
|
Financial Report July - September 2023 |
| | |
Cash conversion* defined as free cash flow* in relation to net income, was 37% in the period. Net debt* was $1,375 million as of September 30, 2023, which was $87 million higher than a year earlier. Liquidity position. As of September 30, 2023, our cash balance was around $0.5 billion, and including committed, unused loan facilities, our liquidity position was around $1.6 billion. | | Leverage ratio*. As of September 30, 2023, the Company had a leverage ratio of 1.3x compared to 1.6x as of September 30, 2022, as the 12 months trailing adjusted EBITDA* increased more than the net debt* increased. Total equity decreased by $5 million compared to September 30, 2022. This was mainly due to $226 million in dividend payment and stock repurchases of $257 million partly offset by $418 million from net income and $36 million in positive currency translation effects. |
| | |
First nine months 2023 development Operating cash flow increased by $285 million compared to the same period last year to $535 million, mainly due to higher adjusted operating income and less negative working capital effects. Capital expenditure, net increased by $99 million, mainly due to the impact on the prior year of $95 million from the sale of property, plant and equipment. Capital expenditure, net in relation to sales was 5.4% vs. 4.9% the prior year period. | | Free cash flow* was $117 million, compared to negative $69 million in the same period last year. The improvement was due to the higher operating cash flow partly offset by higher capital expenditure, net. Cash conversion* defined as free cash flow* in relation to net income, was 45% in the period. |
Headcount
| | | |
| Sep 30 | Jun 30 | Sep 30 |
| 2023 | 2023 | 2022 |
Headcount | 71,200 | 71,200 | 67,800 |
Whereof: Direct headcount in manufacturing | 52,900 | 52,600 | 49,600 |
Indirect headcount | 18,200 | 18,600 | 18,300 |
Temporary personnel | 11% | 11% | 11% |
| | |
At September 30, 2023, total headcount increased by 3,400 compared to a year earlier. The indirect workforce decreased by 1% while the direct workforce increased by 7%, reflecting that sales grew organically by 11% in the third quarter compared to a year earlier. | | Compared to June 30, 2023, total headcount was unchanged, with a 1% increase in direct headcount and 2% decrease in indirect headcount. |
12
|
Financial Report July - September 2023 |
Other Items
| | |
•On September 22, 2023, Autoliv China and Great Wall Motor announced their intention to collaborate to address opportunities in the rapidly evolving global automotive landscape. The strategic cooperation aims to drive innovation through collaboration around advanced technologies with a special quality focus such as overhead passenger airbags and airbags for zero gravity seats with integrated seatbelts. •On September 28, 2023, Autoliv announced that Klaus Kompass, former VP Vehicle Safety at BMW Group, and Seigo Kuzumaki, former Fellow of Advanced R&D and Engineering, Toyota Motor Corporation, joined the Autoliv Research Advisory Board. | | •On October 5, 2023, Autoliv announced an update on its ongoing initiatives to reduce its global headcount, including a downsizing of 300 employees in China, Japan, Sweden, the United States and the closure of an office in the Netherlands. •In Q3 2023, Autoliv repurchased and retired 1.23 million shares of common stock at an average price of $97.23 per share under the Autoliv 2022-2024 stock repurchase program. |
| | |
Next Report Autoliv intends to publish the quarterly earnings report for the fourth quarter of 2023 on Friday, January 26, 2024. | | Footnotes *Non-U.S. GAAP measure, see enclosed reconciliation tables. |
Inquiries: Investors and Analysts Anders Trapp Vice President Investor Relations Tel +46 (0)8 5872 0671 Henrik Kaar Director Investor Relations Tel +46 (0)8 5872 0614 Inquiries: Media Gabriella Etemad Senior Vice President Communications Tel +46 (0)70 612 6424 Autoliv, Inc. is obliged to make this information public pursuant to the EU Market Abuse Regulation. The information was submitted for publication, through the agency of the VP of Investor Relations set out above, at 12.00 CET on October 20, 2023. | Definitions and SEC Filings Please refer to www.autoliv.com or to our Annual Report for definitions of terms used in this report. Autoliv’s annual report to stockholders, annual report on Form 10-K, quarterly reports on Form 10Q, proxy statements, management certifications, press releases, current reports on Form 8-K and other documents filed with the SEC can be obtained free of charge from Autoliv at the Company’s address. These documents are also available at the SEC’s website www.sec.gov and at Autoliv’s corporate website www.autoliv.com. This report includes content supplied by S&P Global; Copyright © Light Vehicle Production Forecast, January, July and October 2023. All rights reserved. S&P Global is a global supplier of independent industry information. The permission to use S&P Global copyrighted reports, data and information does not constitute an endorsement or approval by S&P Global of the manner, format, context, content, conclusion, opinion or viewpoint in which S&P Global reports, data and information or its derivations are used or referenced herein. |
13
|
Financial Report July - September 2023 |
“Safe Harbor Statement”
| | |
This report contains statements that are not historical facts but rather forward-looking statements within the meaning of the Private Securities Litigation Reform Act of 1995. Such forward-looking statements include those that address activities, events or developments that Autoliv, Inc. or its management believes or anticipates may occur in the future. All forward-looking statements are based upon our current expectations, various assumptions and/or data available from third parties. Our expectations and assumptions are expressed in good faith and we believe there is a reasonable basis for them. However, there can be no assurance that such forward-looking statements will materialize or prove to be correct as forward-looking statements are inherently subject to known and unknown risks, uncertainties and other factors which may cause actual future results, performance or achievements to differ materially from the future results, performance or achievements expressed in or implied by such forward-looking statements. In some cases, you can identify these statements by forward-looking words such as “estimates”, “expects”, “anticipates”, “projects”, “plans”, “intends”, “believes”, “may”, “likely”, “might”, “would”, “should”, “could”, or the negative of these terms and other comparable terminology, although not all forward-looking statements contain such words. Because these forward-looking statements involve risks and uncertainties, the outcome could differ materially from those set out in the forward-looking statements for a variety of reasons, including without limitation, general economic conditions, including inflation; changes in light vehicle production; fluctuation in vehicle production schedules for which the Company is a supplier; global supply chain disruptions, including port, transportation and distribution delays or interruptions; supply chain disruptions and component shortages specific to the automotive industry or the Company; disruptions and impacts relating to the ongoing war between Russia and Ukraine; changes in general industry and market conditions or regional growth or decline; changes in and the successful execution of our capacity alignment, restructuring, cost reduction and efficiency initiatives and the market reaction thereto; loss of business from increased competition; higher raw material, fuel and energy costs; changes in consumer and customer preferences for end products; customer losses; changes in | | regulatory conditions; customer bankruptcies, consolidations, or restructuring or divestiture of customer brands; unfavorable fluctuations in currencies or interest rates among the various jurisdictions in which we operate; market acceptance of our new products; costs or difficulties related to the integration of any new or acquired businesses and technologies; continued uncertainty in pricing and other negotiations with customers; successful integration of acquisitions and operations of joint ventures; successful implementation of strategic partnerships and collaborations; our ability to be awarded new business; product liability, warranty and recall claims and investigations and other litigation, civil judgments or financial penalties and customer reactions thereto; higher expenses for our pension and other postretirement benefits, including higher funding needs for our pension plans; work stoppages or other labor issues; possible adverse results of pending or future litigation or infringement claims and the availability of insurance with respect to such matters; our ability to protect our intellectual property rights; negative impacts of antitrust investigations or other governmental investigations and associated litigation relating to the conduct of our business; tax assessments by governmental authorities and changes in our effective tax rate; dependence on key personnel; legislative or regulatory changes impacting or limiting our business; our ability to meet our sustainability targets, goals and commitments; political conditions; dependence on and relationships with customers and suppliers; the conditions necessary to hit our medium term financial targets; and other risks and uncertainties identified under the headings “Risk Factors” and “Management’s Discussion and Analysis of Financial Condition and Results of Operations” in our Annual Reports and Quarterly Reports on Forms 10-K and 10-Q and any amendments thereto. For any forward-looking statements contained in this or any other document, we claim the protection of the safe harbor for forward-looking statements contained in the Private Securities Litigation Reform Act of 1995, and we assume no obligation to update publicly or revise any forward-looking statements in light of new information or future events, except as required by law. |
14
|
Financial Report July - September 2023 |
Consolidated Statements of Income
| | | | | | | |
(Dollars in millions, except per share data, unaudited) | Third quarter | | First 9 months | Latest 12 | Full Year |
| 2023 | 2022 | | 2023 | 2022 | months | 2022 |
Airbags, Steering Wheels and Other1) | $1,761 | $1,510 | | $5,191 | $4,226 | $6,771 | $5,807 |
Seatbelt products and Other1) | 835 | 792 | | 2,533 | 2,281 | 3,287 | 3,035 |
Total net sales | $2,596 | $2,302 | | $7,724 | $6,507 | $10,059 | $8,842 |
| | | | | | | |
Cost of sales | (2,131) | (1,918) | | (6,432) | (5,510) | (8,369) | (7,446) |
Gross profit | $465 | $383 | | $1,291 | $998 | $1,690 | $1,396 |
| | | | | | | |
Selling, general & administrative expenses | (118) | (105) | | (379) | (333) | (484) | (437) |
Research, development & engineering expenses, net | (107) | (106) | | (343) | (325) | (409) | (390) |
Amortization of intangibles | (1) | (0) | | (1) | (2) | (2) | (3) |
Other income (expense), net | (8) | (1) | | (115) | 91 | (113) | 93 |
Operating income | $232 | $171 | | $453 | $429 | $682 | $659 |
| | | | | | | |
Income from equity method investments | 1 | 1 | | 4 | 3 | 4 | 3 |
Interest income | 3 | 2 | | 10 | 4 | 13 | 6 |
Interest expense | (24) | (15) | | (68) | (41) | (88) | (60) |
Other non-operating items, net | (11) | (6) | | (6) | (5) | (5) | (5) |
Income before income taxes | $201 | $153 | | $393 | $389 | $606 | $603 |
| | | | | | | |
Income taxes | (67) | (47) | | (131) | (121) | (188) | (178) |
Net income | $134 | $106 | | $262 | $268 | $418 | $425 |
| | | | | | | |
Less: Net income attributable to non-controlling interest | 1 | 1 | | 1 | 1 | 1 | 2 |
Net income attributable to controlling interest | $134 | $105 | | $261 | $267 | $417 | $423 |
| | | | | | | |
Earnings per share2) | $1.57 | $1.21 | | $3.04 | $3.06 | $4.85 | $4.85 |
1) Including Corporate sales. 2) Assuming dilution when applicable and net of treasury shares. |
15
|
Financial Report July - September 2023 |
Consolidated Balance Sheets
| | | | | | |
| | Sep 30 | Jun 30 | Mar 31 | Dec 31 | Sep 30 |
(Dollars in millions, unaudited) | | 2023 | 2023 | 2023 | 2022 | 2022 |
Assets | | | | | | |
Cash & cash equivalents | | $475 | $475 | $713 | $594 | $483 |
Receivables, net | | 2,179 | 2,189 | 2,106 | 1,907 | 1,893 |
Inventories, net | | 982 | 947 | 986 | 969 | 924 |
Prepaid expenses | | 180 | 166 | 166 | 160 | 218 |
Other current assets | | 63 | 120 | 90 | 84 | 69 |
Total current assets | | $3,879 | $3,898 | $4,061 | $3,714 | $3,587 |
| | | | | | |
Property, plant & equipment, net | | 2,067 | 2,047 | 2,045 | 1,960 | 1,795 |
Operating leases right-of-use assets | | 162 | 149 | 169 | 160 | 116 |
Goodwill | | 1,372 | 1,375 | 1,376 | 1,375 | 1,364 |
Intangible assets, net | | 6 | 6 | 7 | 7 | 5 |
Investments and other non-current assets | | 500 | 484 | 528 | 502 | 467 |
Total assets | | $7,987 | $7,959 | $8,185 | $7,717 | $7,334 |
| | | | | | |
Liabilities and equity | | | | | | |
Short-term debt | | 590 | 481 | 577 | 711 | 692 |
Accounts payable | | 1,858 | 1,844 | 1,683 | 1,693 | 1,503 |
Accrued expenses | | 1,093 | 1,122 | 969 | 915 | 965 |
Operating lease liabilities - current | | 37 | 35 | 41 | 39 | 35 |
Other current liabilities | | 274 | 274 | 258 | 283 | 263 |
Total current liabilities | | $3,851 | $3,756 | $3,529 | $3,642 | $3,458 |
| | | | | | |
Long-term debt | | 1,277 | 1,290 | 1,601 | 1,054 | 1,037 |
Pension liability | | 152 | 152 | 159 | 154 | 149 |
Operating lease liabilities - non-current | | 125 | 113 | 127 | 119 | 81 |
Other non-current liabilities | | 96 | 91 | 128 | 121 | 118 |
Total non-current liabilities | | $1,649 | $1,645 | $2,015 | $1,450 | $1,385 |
| | | | | | |
Total parent shareholders’ equity | | 2,473 | 2,545 | 2,627 | 2,613 | 2,478 |
Non-controlling interest | | 13 | 13 | 14 | 13 | 13 |
Total equity | | $2,486 | $2,557 | $2,641 | $2,626 | $2,491 |
| | | | | | |
Total liabilities and equity | | $7,987 | $7,959 | $8,185 | $7,717 | $7,334 |
16
|
Financial Report July - September 2023 |
Consolidated Statements of Cash Flow
| | | | | | | |
| Third quarter | | First 9 months | Latest 12 | Full Year |
(Dollars in millions, unaudited) | 2023 | 2022 | | 2023 | 2022 | months | 2022 |
Net income | $134 | $106 | | $262 | $268 | $418 | $425 |
Depreciation and amortization | 95 | 87 | | 281 | 273 | 371 | 363 |
Gain on divestiture of property | - | - | | - | (80) | - | (80) |
Other, net | 9 | (51) | | 1 | (44) | (9) | (54) |
Changes in operating working capital, net | (36) | 89 | | (8) | (168) | 218 | 58 |
Net cash provided by operating activities | $202 | $232 | | $535 | $251 | $998 | $713 |
| | | | | | | |
Expenditures for property, plant and equipment | (152) | (164) | | (420) | (418) | (588) | (585) |
Proceeds from sale of property, plant and equipment | 0 | (0) | | 1 | 98 | 4 | 101 |
Net cash used in investing activities | $(151) | $(164) | | $(419) | $(319) | $(584) | $(485) |
| | | | | | | |
Net cash before financing1) | $50 | $68 | | $117 | $(69) | $414 | $228 |
| | | | | | | |
Net increase (decrease) in short term debt | 110 | 167 | | 115 | (110) | 392 | 167 |
Decrease in short-term part of long-term debt | - | - | | (533) | (302) | (533) | (302) |
Net increase (decrease) in long-term debt | 1 | (17) | | 557 | 251 | 251 | (55) |
Dividends paid | (56) | (56) | | (169) | (167) | (226) | (224) |
Share repurchases | (120) | (20) | | (202) | (60) | (257) | (115) |
Common stock options exercised | 0 | 0 | | 1 | 0 | 1 | 0 |
Dividend paid to non-controlling interests | - | (1) | | (1) | (1) | (1) | (2) |
Net cash (used in) provided by financing activities | $(64) | $73 | | $(232) | $(389) | $(374) | $(531) |
| | | | | | | |
Effect of exchange rate changes on cash | 14 | 15 | | (3) | (28) | (48) | (73) |
(Decrease) increase in cash and cash equivalents | $0 | $156 | | $(119) | $(486) | $(8) | $(375) |
Cash and cash equivalents at period-start | 475 | 327 | | 594 | 969 | 483 | 969 |
Cash and cash equivalents at period-end | $475 | $483 | | $475 | $483 | $475 | $594 |
1) Non-U.S. GAAP measure comprised of "Net cash provided by operating activities" and "Net cash used in investing activities". See reconciliation table. |
17
|
Financial Report July - September 2023 |
RECONCILIATION OF U.S. GAAP TO NON-U.S. GAAP MEASURES
In this report we sometimes refer to non-U.S. GAAP measures that we and securities analysts use in measuring Autoliv's performance. We believe that these measures assist investors and management in analyzing trends in the Company's business for the reasons given below. Investors should not consider these non-U.S. GAAP measures as substitutes, but rather as additions, to financial reporting measures prepared in accordance with U.S. GAAP. It should be noted that these measures, as defined, may not be comparable to similarly titled measures used by other companies.
Components in Sales Increase/Decrease
Since the Company historically generates approximately 75% of sales in currencies other than in the reporting currency (i.e. U.S. dollars) and currency rates have been volatile, we analyze the Company's sales trends and performance as changes in organic sales growth. This presents the increase or decrease in the overall U.S. dollar net sales on a comparable basis, allowing separate discussions of the impact of acquisitions/divestitures and exchange rates. The tables on pages 6 and 7 present changes in organic sales growth as reconciled to the change in the total U.S. GAAP net sales.
Trade Working Capital
Due to the need to optimize cash generation to create value for shareholders, management focuses on operationally derived trade working capital as defined in the table below. The reconciling items used to derive this measure are, by contrast, managed as part of our overall management of cash and debt, but they are not part of the responsibilities of day-to-day operations' management.
| | | | | |
| Sep 30 | Jun 30 | Mar 31 | Dec 31 | Sep 30 |
(Dollars in millions) | 2023 | 2023 | 2023 | 2022 | 2022 |
Receivables, net | $2,179 | $2,189 | $2,106 | $1,907 | $1,893 |
Inventories, net | 982 | 947 | 986 | 969 | 924 |
Accounts payable | (1,858) | (1,844) | (1,683) | (1,693) | (1,503) |
Trade Working capital | $1,303 | $1,292 | $1,409 | $1,183 | $1,314 |
Net Debt
Autoliv from time to time enters into “debt-related derivatives” (DRDs) as a part of its debt management and as part of efficiently managing the Company’s overall cost of funds. Creditors and credit rating agencies use net debt adjusted for DRDs in their analyses of the Company’s debt, therefore we provide this non-U.S. GAAP measure. DRDs are fair value adjustments to the carrying value of the underlying debt. Also included in the DRDs is the unamortized fair value adjustment related to a discontinued fair value hedge that will be amortized over the remaining life of the debt. By adjusting for DRDs, the total financial liability of net debt is disclosed without grossing debt up with currency or interest fair values.
| | | | | |
| Sep 30 | Jun 30 | Mar 31 | Dec 31 | Sep 30 |
(Dollars in millions) | 2023 | 2023 | 2023 | 2022 | 2022 |
Short-term debt | $590 | $481 | $577 | $711 | $692 |
Long-term debt | 1,277 | 1,290 | 1,601 | 1,054 | 1,037 |
Total debt | $1,867 | $1,771 | $2,179 | $1,766 | $1,729 |
Cash & cash equivalents | (475) | (475) | (713) | (594) | (483) |
Debt issuance cost/Debt-related derivatives, net | (17) | 4 | 12 | 12 | 42 |
Net debt | $1,375 | $1,299 | $1,477 | $1,184 | $1,288 |
|
| | Dec 31 | Dec 31 | Dec 31 | Dec 31 |
(Dollars in millions) | | 2021 | 2020 | 2019 | 2018 |
Short-term debt | | $346 | $302 | $368 | $621 |
Long-term debt | | 1,662 | 2,110 | 1,726 | 1,609 |
Total debt | | $2,008 | $2,411 | $2,094 | $2,230 |
Cash & cash equivalents | | (969) | (1,178) | (445) | (616) |
Debt issuance cost/Debt-related derivatives, net | | 13 | (19) | 0 | 5 |
Net debt | | $1,052 | $1,214 | $1,650 | $1,619 |
18
|
Financial Report July - September 2023 |
Leverage ratio
The non-U.S. GAAP measure “net debt” is also used in the non-U.S. GAAP measure “Leverage ratio”. Management uses this measure to analyze the amount of debt the Company can incur under its debt policy. Management believes that this policy also provides guidance to credit and equity investors regarding the extent to which the Company would be prepared to leverage its operations. Autoliv’s policy is to maintain a leverage ratio commensurate with a strong investment grade credit rating. The Company measures its leverage ratio as net debt* adjusted for pension liabilities in relation to adjusted EBITDA*. The long-term target is to maintain a leverage ratio of around 1.0x within a range of 0.5x to 1.5x.
| | | | | | |
| Sep 30 | Jun 30 | Mar 31 | Dec 31 | Sep 30 | Jun 30 |
(Dollars in millions) | 2023 | 2023 | 2023 | 2022 | 2022 | 2022 |
Net debt1) | $1,375 | $1,299 | $1,477 | $1,184 | $1,288 | $1,318 |
Pension liabilities | 152 | 152 | 159 | 154 | 149 | 155 |
Debt per the Policy | $1,527 | $1,451 | $1,636 | $1,338 | $1,437 | $1,473 |
| | | | | | |
Net income2) | 418 | 390 | 416 | 425 | 384 | 338 |
Income taxes2) | 188 | 168 | 176 | 178 | 163 | 143 |
Interest expense, net2, 3) | 75 | 67 | 60 | 54 | 51 | 51 |
Other non-operating items, net2) | 5 | 1 | 4 | 5 | 9 | 2 |
Income from equity method investments2) | (4) | (4) | (4) | (3) | (4) | (3) |
Depreciation and amortization of intangibles2) | 371 | 363 | 359 | 363 | 370 | 381 |
Adjustments2), 4) | 136 | 127 | 10 | (61) | (61) | (59) |
EBITDA per the Policy (Adjusted EBITDA) | $1,189 | $1,112 | $1,021 | $961 | $912 | $854 |
| | | | | | |
Leverage ratio | 1.3 | 1.3 | 1.6 | 1.4 | 1.6 | 1.7 |
1) Short- and long-term debt less cash and cash equivalents and debt-related derivatives. 2) Latest 12 months. 3) Interest expense including cost for extinguishment of debt, if any, less interest income. 4) Capacity alignments, antitrust related matters and the Andrews litigation settlement. See items Affecting Comparability below. | | | |
19
|
Financial Report July - September 2023 |
Free Cash Flow, Net Cash Before Financing and Cash Conversion
Management uses the non-U.S. GAAP measure “free cash flow” to analyze the amount of cash flow being generated by the Company’s operations after capital expenditure, net. This measure indicates the Company’s cash flow generation level that enables strategic value creation options such as dividends or acquisitions. For details on free cash flow, see the reconciliation table below. Management uses the non-U.S. GAAP measure “net cash before financing” to analyze and disclose the cash flow generation available for servicing external stakeholders such as shareholders and debt stakeholders. For details on net cash before financing, see the reconciliation table below. Management uses the non-U.S. GAAP measure “cash conversion” to analyze the proportion of net income that is converted into free cash flow. The measure is a tool to evaluate how efficiently the Company utilizes its resources. For details on cash conversion, see the reconciliation table below.
| | | | | | | |
| Third quarter | | First 9 months | Latest 12 | Full Year |
(Dollars in millions) | 2023 | 2022 | | 2023 | 2022 | months | 2022 |
Net income | $134 | $106 | | $262 | $268 | $418 | $425 |
Changes in operating working capital | (36) | 89 | | (8) | (168) | 218 | 58 |
Depreciation and amortization | 95 | 87 | | 281 | 273 | 371 | 363 |
Gain on divestiture of property | - | - | | - | (80) | - | (80) |
Other, net | 9 | (51) | | 1 | (44) | (9) | (54) |
Operating cash flow | $202 | $232 | | $535 | $251 | $998 | $713 |
Capital expenditure, net | (151) | (164) | | (419) | (319) | (584) | (485) |
Free cash flow1) | $50 | $68 | | $117 | $(69) | $414 | $228 |
Net cash before financing | $50 | $68 | | $117 | $(69) | $414 | $228 |
Cash conversion2) | 37% | 64% | | 45% | n/a | 99% | 54% |
1) Operating cash flow less Capital expenditure, net. 2) Free cash flow relative to Net income. |
| | | | | |
| Full year | Full year | | Full year | Full year |
(Dollars in millions) | 2021 | 2020 | | 2019 | 20181) |
Net income | $437 | $188 | | $463 | $184 |
Changes in operating assets and liabilities | (63) | 277 | | 47 | (229) |
Depreciation and amortization | 394 | 371 | | 351 | 397 |
Other, net2) | (15) | 13 | | (220) | 239 |
Operating cash flow | $754 | $849 | | $641 | $591 |
EC antitrust payment | - | - | | (203) | - |
Operating cash flow excl antitrust | $754 | $849 | | $844 | $591 |
Capital expenditure, net | (454) | (340) | | (476) | (555) |
Free cash flow3) | $300 | $509 | | $165 | $36 |
Free cash flow excl antitrust payment4) | $300 | $509 | | $368 | $36 |
Acquisitions of businesses and other, net | - | - | | - | (73) |
Net cash before financing | $300 | $509 | | $165 | $(37) |
Cash conversion5) | 69% | 270% | | 36% | 20% |
Cash conversion excl antitrust6) | 69% | 270% | | 79% | 20% |
1) Including Discontinued Operations. 2) Including EC antitrust non-cash provision 2018 and EC antitrust payment 2019. 3) Operating cash flow less Capital expenditure, net. 4) For 2019, Operating cash flow excluding EC antitrust payment less Capital expenditures, net. 5) Free cash flow relative to Net income. 6) For 2019, Free cash flow excluding EC antitrust payment relative to Net income. |
20
|
Financial Report July - September 2023 |
Items Affecting Comparability
We believe that comparability between periods is improved through the exclusion of certain items. To assist investors in understanding the operating performance of Autoliv's business, it is useful to consider certain U.S. GAAP measures exclusive of these items.
The following table reconciles Income before income taxes, Net income attributable to controlling interest, capital employed, which are inputs utilized to calculate Return on Capital Employed (“ROCE”), adjusted ROCE and Return on Total Equity (“ROE”). The Company believes this presentation may be useful to investors and industry analysts who utilize these adjusted non-U.S. GAAP measures in their ROCE and ROE calculations to exclude certain items for comparison purposes across periods. Autoliv’s management uses the ROCE, adjusted ROCE and ROE measures for purposes of comparing its financial performance with the financial performance of other companies in the industry and providing useful information regarding the factors and trends affecting the Company’s business.
As used by the Company, ROCE is annualized operating income and income from equity method investments, relative to average capital employed. Adjusted ROCE is annualized operating income and income from equity method investments, relative to average capital employed as adjusted to exclude certain non-recurring items. The Company believes ROCE and adjusted ROCE are useful indicators of long-term performance both absolute and relative to the Company's peers as it allows for a comparison of the profitability of the Company’s capital employed in its business relative to that of its peers.
ROE is the ratio of annualized income (loss) relative to average total equity for the periods presented. The Company’s management believes that ROE is a useful indicator of how well management creates value for its shareholders through its operating activities and its capital management.
With respect to the Andrews litigation settlement, the Company has treated this specific settlement as a non-recurring charge because of the unique nature of the lawsuit, including the facts and legal issues involved.
Accordingly, the tables below reconcile from U.S. GAAP to the equivalent non-U.S. GAAP measure.
| | | | | | | |
| Third quarter 2023 | | Third quarter 2022 |
(Dollars in millions, except per share data) | Reported
U.S. GAAP | Adjust-ments1) | Non-U.S.
GAAP | | Reported
U.S. GAAP | Adjust-ments1) | Non-U.S.
GAAP |
Operating income | $232 | $11 | $243 | | $171 | $2 | $173 |
Operating margin | 8.9% | 0.4% | 9.4% | | 7.4% | 0.1% | 7.5% |
Income before taxes | 201 | 11 | 212 | | 153 | 2 | 155 |
Net income attributable to controlling interest | 134 | 8 | 141 | | 105 | 2 | 107 |
Return on capital employed2) | 24.2% | 0.4% | 24.5% | | 18.0% | 0.4% | 18.4% |
Return on total equity3) | 21.3% | 0.2% | 21.5% | | 16.8% | 0.6% | 17.3% |
Earnings per share4) | $1.57 | $0.09 | $1.66 | | $1.21 | $0.02 | $1.23 |
1) Effects from capacity alignments, antitrust related matters and the Andrews litigation settlement. 2) Annualized operating income and income from equity method investments, relative to average capital employed. 3) Annualized income relative to average total equity. 4) Assuming dilution and net of treasury shares. |
| | | | | | | |
| First 9 months 2023 | | First 9 months 2022 |
| Reported
U.S. GAAP | Adjust-ments1) | Non-U.S.
GAAP | | Reported
U.S. GAAP | Adjust-ments1) | Non-U.S.
GAAP |
Operating income | $453 | $133 | $586 | | $429 | $(64) | $365 |
Operating margin | 5.9% | 1.7% | 7.6% | | 6.6% | (1.0)% | 5.6% |
Income before taxes | 393 | 133 | 526 | | 389 | (64) | 325 |
Net income attributable to controlling interest | 261 | 123 | 384 | | 267 | (41) | 226 |
Capital employed | 3,861 | 123 | 3,985 | | 3,779 | (41) | 3,738 |
Return on capital employed2) | 15.6% | 4.2% | 19.8% | | 15.3% | (2.2)% | 13.1% |
Return on total equity3) | 13.5% | 5.9% | 19.5% | | 13.8% | (2.0)% | 11.8% |
Earnings per share4, 5) | $3.04 | $1.44 | $4.48 | | $3.06 | $(0.47) | $2.58 |
1) Effects from capacity alignments, antitrust related matters and the Andrews litigation settlement. 2) Annualized operating income and income from equity method investments, relative to average capital employed. 3) Annualized income relative to average total equity. 4) Assuming dilution and net of treasury shares. |
21
|
Financial Report July - September 2023 |
| | | | | | | |
| Latest 12 months | | Full year 2022 |
| Reported
U.S. GAAP | Adjust-ments1) | Non-U.S.
GAAP | | Reported
U.S. GAAP | Adjust-ments1) | Non-U.S.
GAAP |
Operating income | $682 | $136 | $819 | | $659 | $(61) | $598 |
Operating margin | 6.8% | 1.4% | 8.1% | | 7.5% | (0.7)% | 6.8% |
1) Effects from capacity alignments, antitrust related matters and the Andrews litigation settlement. |
| | | | | | | |
| Full year 2021 | | Full year 2020 |
| Reported
U.S. GAAP | Adjust-ments1) | Non-U.S.
GAAP | | Reported
U.S. GAAP | Adjust-ments1) | Non-U.S.
GAAP |
Operating income | $675 | $8 | $683 | | $382 | $99 | $482 |
Operating margin | 8.2% | 0.1% | 8.3% | | 5.1% | 1.4% | 6.5% |
1) Costs for capacity alignments and antitrust related matters. |
| | | | | | | |
| Full year 2019 | | Full year 2018 |
(Dollars in millions, except per share data) | Reported
U.S. GAAP | Adjust-ments1) | Non-U.S.
GAAP | | Reported
U.S. GAAP | Adjust-ments1) | Non-U.S.
GAAP |
Operating income | $726 | $49 | $774 | | $686 | $222 | $908 |
Operating margin, % | 8.5% | 0.6% | 9.1% | | 7.9% | 2.6% | 10.5% |
1) Costs for capacity alignments and antitrust related matters. |
| | | | | |
Items included in non-U.S. GAAP adjustments | Third quarter 2023 | | Third quarter 2022 |
| Adjustment
Million | Adjustment
Per share | | Adjustment
Million | Adjustment
Per share |
Capacity alignments | $10 | 0.12 | | $2 | $0.02 |
The Andrews litigation settlement | (0) | (0.00) | | - | - |
Antitrust related matters | 1 | 0.01 | | - | - |
Total adjustments to operating income | $11 | $0.13 | | $2 | $0.02 |
Tax on non-U.S. GAAP adjustments1) | (3) | (0.04) | | (0) | (0.01) |
Total adjustments to net income | $8 | 0.09 | | $2 | $0.02 |
| | | | | |
Average number of shares outstanding - diluted2) | | 85.9 | | | 87.5 |
| | | | | |
Annualized adjustment on return on capital employed | 44 | | | 9 | |
Adjustment on return on capital employed | 0.4% | | | 0.4% | |
| | | | | |
Annualized adjustment on return on total equity | $31 | | | $7 | |
Adjustment on return on total equity | 0.2% | | | 0.6% | |
1) The tax is calculated based on the tax laws in the respective jurisdiction(s) of the adjustment(s). 2) Annualized average number of outstanding shares |
| | | | | |
Items included in non-GAAP adjustments | First 9 months 2023 | | First 9 months 2022 |
| Adjustment
Million | Adjustment
Per share | | Adjustment
Million | Adjustment
Per share |
Capacity alignments | $122 | 1.42 | | $(64) | $(0.73) |
The Andrews litigation settlement | 8 | 0.09 | | - | - |
Antitrust related matters | 3 | 0.04 | | - | - |
Total adjustments to operating income | $133 | $1.55 | | $(64) | $(0.73) |
Tax on non-U.S. GAAP adjustments1) | (10) | (0.11) | | 23 | 0.26 |
Total adjustments to net income | $123 | 1.44 | | $(41) | $(0.47) |
| | | | | |
Average number of shares outstanding - diluted2) | | 85.9 | | | 87.5 |
| | | | | |
Annualized adjustment on return on capital employed | 177 | | | (85) | |
Adjustment on return on capital employed | 4.2% | | | (2.2)% | |
| | | | | |
Annualized adjustment on return on total equity | $164 | | | $(55) | |
Adjustment on return on total equity | 5.9% | | | (2.0)% | |
1) The tax is calculated based on the tax laws in the respective jurisdiction(s) of the adjustment(s). 2) Annualized average number of outstanding shares |
22
|
Financial Report July - September 2023 |
| | | | | |
(Dollars in millions, unaudited) | 2022 | 2021 | 2020 | 2019 | 2018 |
Sales and Income | | | | | |
Net sales | $8,842 | $8,230 | $7,447 | $8,548 | $8,678 |
Airbag sales1) | 5,807 | 5,380 | 4,824 | 5,676 | 5,699 |
Seatbelt sales | 3,035 | 2,850 | 2,623 | 2,871 | 2,980 |
Operating income | 659 | 675 | 382 | 726 | 686 |
Net income attributable to controlling interest | 423 | 435 | 187 | 462 | 376 |
Earnings per share (USD) – basic | 4.86 | 4.97 | 2.14 | 5.29 | 4.32 |
Earnings per share (USD) – assuming dilution2) | 4.85 | 4.96 | 2.14 | 5.29 | 4.31 |
Gross margin3) | 15.8% | 18.4% | 16.7% | 18.5% | 19.7% |
R,D&E net in relation to sales | (4.4)% | (4.7)% | (5.0)% | (4.7)% | (4.8)% |
S,G&A in relation to sales | (4.9)% | (5.3)% | (5.2)% | (4.7)% | (4.5)% |
Operating margin4) | 7.5% | 8.2% | 5.1% | 8.5% | 7.9% |
Adjusted operating margin5,6) | 6.8% | 8.3% | 6.5% | 9.1% | 10.5% |
Balance Sheet |
Trade working capital7) | 1,183 | 1,332 | 1,366 | 1,417 | 1,396 |
Trade working capital in relation to sales8) | 12.7% | 15.7% | 13.6% | 16.2% | 15.9% |
Receivables outstanding in relation to sales9) | 20.4% | 20.0% | 18.1% | 18.6% | 19.0% |
Inventory outstanding in relation to sales10) | 10.4% | 9.2% | 7.9% | 8.5% | 8.6% |
Payables outstanding in relation to sales11) | 18.1% | 13.5% | 12.5% | 10.8% | 11.7% |
Total equity | 2,626 | 2,648 | 2,423 | 2,122 | 1,897 |
Total parent shareholders’ equity per share (USD) | 30.30 | 30.10 | 27.56 | 24.19 | 21.63 |
Current assets excluding cash | 3,119 | 2,705 | 3,091 | 2,557 | 2,670 |
Property, plant and equipment, net | 1,960 | 1,855 | 1,869 | 1,816 | 1,690 |
Intangible assets (primarily goodwill) | 1,382 | 1,395 | 1,412 | 1,410 | 1,423 |
Capital employed | 3,810 | 3,700 | 3,637 | 3,772 | 3,516 |
Net debt6) | 1,184 | 1,052 | 1,214 | 1,650 | 1,619 |
Total assets | 7,717 | 7,537 | 8,157 | 6,771 | 6,722 |
Long-term debt | 1,054 | 1,662 | 2,110 | 1,726 | 1,609 |
Return on capital employed12,13) | 17.5% | 18.3% | 10.0% | 20.0% | 17.0% |
Return on total equity13,14) | 16.3% | 17.1% | 9.0% | 23.0% | 13.0% |
Total equity ratio | 34% | 35% | 30% | 31% | 28% |
Cash flow and other data |
Operating Cash flow15) | 713 | 754 | 849 | 641 | 591 |
Depreciation and amortization15) | 363 | 394 | 371 | 351 | 397 |
Capital expenditures, net15) | 485 | 454 | 340 | 476 | 555 |
Capital expenditures, net in relation to sales15) | 5.5% | 5.5% | 4.6% | 5.6% | 5.7% |
Free Cash flow6,15,16) | 228 | 300 | 509 | 165 | 36 |
Cash conversion6,15,17) | 54% | 69% | 270% | 36% | 20% |
Direct shareholder return15,18) | 339 | 165 | 54 | 217 | 214 |
Cash dividends paid per share (USD) | $2.58 | $1.88 | $0.62 | $2.48 | $2.46 |
Number of shares outstanding (millions)19) | 86.2 | 87.5 | 87.4 | 87.2 | 87.1 |
Number of employees, December 31 | 61,700 | 55,900 | 61,000 | 58,900 | 57,700 |
1) Including steering wheels, inflators and initiators. 2) Assuming dilution and net of treasury shares. 3) Gross profit relative to sales. 4) Operating income relative to sales. 5) Excluding costs for capacity alignments, antitrust related matters and separation of our business segments. 6) Non-US GAAP measure, for reconciliation see tables above. 7) Outstanding receivables and outstanding inventory less outstanding payables. 8) Outstanding receivables and outstanding inventory less outstanding payables relative to annualized fourth quarter sales. 9) Outstanding receivables relative to annualized fourth quarter sales. 10) Outstanding inventory relative to annualized fourth quarter sales. 11) Outstanding payables relative to annualized fourth quarter sales. 12) Operating income and income from equity method investments, relative to average capital employed. 13) The Company has decided not to recalculate prior periods since the distribution of Veoneer had a significant impact on total equity and capital employed making the comparison less meaningful. 14) Income relative to average total equity. 15) Including Discontinued Operations 2018. 16) Operating cash flow less Capital expenditures, net. 17) Free cash flow relative to Net income. 18) Dividends paid and Shares repurchased. 19) At year end, excluding dilution and net of treasury shares. |
23