Exhibit 13
ANNUAL REPORT 2012
Making Driving Safer
Theactive safety system continuously checks the environment around the vehicle for potential dangerous objects using radar and/or cameras and the information is shown using a Head-up Display on the inside of the windshield. The system can be used for many different applications, some of them are described below.
AUTONOMOUS EMERGENCY BRAKING
Many accidents are caused by late braking and/or braking with insufficient force. Autoliv’s autonomous braking system uses radar sensors to help the driver avoid these kinds of accidents or, at least, to reduce their severity.
When the radar sensors detect an obstacle ahead of the car, the driver will be warned, typically 2.5 seconds, before a potential impact. If the driver fails to react, the system will autonomously apply the brakes with full power approximately one second later and, as a precaution, tighten the active seatbelts using reversible electrical pretensioners.
ADAPTIVE CRUISE CONTROL
The radar sensors can also be used for Adaptive Cruise Control (ACC). The ACC is similar to traditional cruise control in that it keeps the vehicle’s pre-set speed automatically. The biggest difference between the two, however, is that ACC can also automatically adjust the vehicle’s speed to keep a pre-set distance from vehicles ahead. For example, if the vehicle ahead slows down, or if another vehicle comes into the lane, the ACC sends a signal to the engine or brake system to keep the pre-set distance. When the road is clear again, the ACC will accelerate the vehicle up to the pre-set speed.
READER’S GUIDE
Autoliv, Inc. is incorporated in Delaware, USA, and follows Generally Accepted Accounting Principles in the United States (U.S. GAAP). This annual report also contains certain non-U.S. GAAP measures, see page 42 and page 54 in the Annual Report. All amounts in this annual report are in U.S. dollars unless otherwise indicated.
“We”, “the Company” and “Autoliv” refer to “Autoliv Inc.” as defined in Note 1 “Principles of Consolidation” on page 60 in the Annual Report. For forward-looking information, refer to the “Safe Harbor Statement” on page 55 in the Annual Report.
Data on markets and competitors are Autolivs’ estimates (unless otherwise indicated). The estimates are based on orders awarded to us or our competitors or other information put out by third parties as well as plans announced by vehicle manufacturers and regulatory agencies.
FINANCIAL INFORMATION
Every year, Autoliv publishes an annual report and a proxy statement prior to the Annual General Meeting of Shareholders, see page 36 in the Annual Report.
The proxy statement provides information not only on the agenda for the meeting, but also on the work of the Board and its committees as well as on compensation paid to and presentation of directors and certain senior executive officers.
For financial information, please also refer to the Form 10-K and Form 10-Q reports and Autoliv’s other filings with the Securities and Exchange Commission (SEC) and the New York Stock Exchange (NYSE). These filings (including the CEO/CFO Section 302 Certifications, Section 16 Insider Filings) are available at www.autoliv.com under Investors/Filings.
The annual and quarterly reports, the proxy statement and Autoliv’s filings with the SEC as well as the Company’s Corporate Governance Guidelines, Charters, Codes of Ethics and other documents governing the Company can be downloaded from the Company’s corporate website. Hard copies of the above-mentioned documents can be obtained free of charge from the Company at the addresses on page 88 in the Annual Report.
CONTENT
|
| President’s Letter |
| Autoliv’s Targets |
| Autoliv in Brief |
| Safety Systems |
| Innovations |
| Testing Capabilities |
| Social Responsibility |
| Employees |
| Global Presence |
| Market |
| Customers |
| Manufacturing & Purchasing |
| Quality |
| Shareholders |
| Share Performance |
Management’s Discussion and Analysis |
| Consolidated Statements of Income |
| Consolidated Balance Sheets |
| Consolidated Statements of Cash Flows |
| Consolidated Statements of Total Equity |
| Notes to Consolidated Financial Statements |
| Auditor’s Reports |
| Glossary and Definitions |
| Corporate Governance |
| Board of Directors |
| Executive Management |
| Contact Information & Calendar |
| Selected Financial Data |
2012 in Summary
– Organic sales1) up 4% with sales of active safety up nearly 40%
– Action program to align capacity in Europe
– Dividends raised to record levels
– The world’s first pedestrian protection airbag introduced
– New “green” airbag inflator with 20% less weight
Over the past ten years, Autoliv’s sales have become better balanced with Europe, the Americas and Asia accounting for 32%, 35% and 33%, respectively, of sales. Compared to 56%, 31% and 13% in 2003.
| 1) | Non-U.S. GAAP measure, see page 42 of the Annual Report. |
Dear Shareholder,
In 2012, we continued to deliver on our growth strategy. Our organic sales grew by 4% despite the fact that light vehicle production (LVP) in the important Western European market dropped by 8%.
We managed to offset this effect with strong performance in China and in active safety where our sales increased by 36%.
We also benefitted from the continued LVP recovery in North America since the 2008-09 financial crisis and the Japanese LVP rebound after the 2011 tsunami. As a result, we achieved new record sales of $8.3 billion. This was in spite of negative currency effects and a small divestiture.
In addition, 2012 was another year with record order intake which confirms our market leadership position.
In light of these achievements, I would like to thank our employees for their hard work and strong contributions in 2012.
ALIGNING CAPACITY LOCALLY
In response to the sharp drop in Western European LVP, we started to implement a capacity alignment program. We announced it at the beginning of the year, before most companies announced their restructuring programs.
Initially, we estimated the cost for our program as “more than $50 million.” In response to the further deterioration in the outlook for European LVP, we raised in April the expected cost to $60-80 million and, in October, to the higher end of that range. Eventually, the cost for the capacity alignment program ended up at $79 million.
We have also decided to expand the program into 2013 and expect capacity alignments to cost another $25-50 million.
These actions should ensure that we have the right resources in the right place at the right time.
HIGHER DIVIDENDS AND INVESTMENTS
Another important achievement during 2012, was our operating cash flow of $689 million. This allowed us – in combination with a strong balance sheet – to continue to raise the quarterly dividends to shareholders. The dividend per share was first raised from 45 cents to 47 cents for the second and the third quarters and then to 50 cents for the fourth quarter. This came after three dividend increases during 2011. In total, the dividend was raised by 15% between 2011 and 2012, which had the effect of returning 54% of the 2012 “free cash flow” (i.e. net cash provided by operating activities less net cash used in investing activities) to shareholders.
The healthy cash flow has also allowed us to invest for the future and to continue to spend almost 4.5% of sales in capital expenditures. These capital investments will not only provide much-needed additional manufacturing capacity in China and other growth markets but also increase our vertical integration. This will thereby enhance our competitive edge and mitigate the pricing pressure effect in our industry.
In 2012, we announced Autoliv’s largest capital investment ever – a $33 million new gas generant plant in China. This investment, in combination with an expansion of our North American gas generant plant, will provide the potential to grow our global airbag manufacturing capacity by approximately 30%. In addition, we are increasing our North American manufacturing capacity for initiators for airbags and for micro gas generators for pyrotechnic seatbelt pretensioners. These capital expenditures will increase our vertical integration and reduce costs, in addition to providing necessary additional manufacturing capacity.
In 2012, we also began the extensions of our technical center in China and of our seatbelt assembly plant in Hungary. A new assembly facility for airbags and seatbelts was completed in Indonesia and a new steering wheel plant in Romania as well as a new seatbelt assembly plant in Russia.
A PRO-ACTIVE BALANCE SHEET
Despite these higher investments for the future and higher dividends, Autoliv’s net cash increased by almost $270 million to more than $360 million at the end of 2012. At present, we believe it is appropriate to maintain a strong balance sheet for the following reasons. The uncertain macro environment could lead to additional needs for capacity alignments. We cannot yet estimate how much the ongoing antitrust investigations (see page 43 in the Annual Report) will cost us. Last, but not least, we want to make acquisitions to accelerate Autoliv’s growth.
However, when it is possible to assess the financial outcome of these three uncertain variables, it could turn out that our company will have more funds than it will need for its operations. In that case, we could be returning even more funds to shareholders than we currently do.
STRATEGY FOR GROWTH
Looking ahead, our strategy is based on the expected growth of global LVP as seen from the graph below. LVP is expected by IHS to grow by 23% or almost 20 million light vehicles to nearly 100 million by 2017. However, virtually all of this growth will be concentrated in China and other growth markets, while the traditional light vehicle markets (Western Europe, North America and Japan) are expected to merely rebound to their historical LVP levels before the financial crisis in 2008-2009. As a result of this shift in global LVP, we and the entire automotive industry need to invest in increased capacity in growth markets, where there still is a significant untapped market potential for our passive safety systems. Hence, our relatively high current capital expenditure level.
We also want to grow in the traditional markets in order to expand faster than the automotive safety market, in line with our strategy. The only way to do this is to introduce new technologies, thereby increasing the safety content per vehicle. Therefore, we are increasing our R,D&E expenses, net; from 5.0% of sales in 2010 and 5.5% in 2012 to more than 5.5% expected in 2013.
Our R,D&E undertakings are paying off in terms of growing sales. For instance, during the past three years, sales of active safety have grown by 73% in 2010 to $85 million, 89% in 2011 to $160 million and by 36% in 2012 to $218 million and are targeted to reach half a billion dollars by 2015.
Our R,D&E spending is also paying off in terms of new products. For instance, in 2012, we, in collaboration with Volvo, introduced the world’s first pedestrian airbag (see photo), which was introduced on the Volvo V40.
Another result of our investments in R,D&E was a new “green” airbag inflator. It leaves no waste products, except for 100% clean water vapor since it uses hydrogen and oxygen to inflate the airbag instead of a traditional “powder”. Additionally, the new airbag inflator has 20% less weight than the inflator it is replacing, thereby reducing fuel consumption and emissions during the long life of a vehicle.
OUTLOOK 2013
2013 is also likely to be a mixed year with continued challenges in Western Europe, balanced by continued growth in the Americas, China, Rest of Asia and Active Safety. Therefore, we are pleased that we initiated our capacity alignment program early since it will help us meet the challenges in Europe, although most of the cost savings will be realized in 2014 and 2015.
For the full year 2013, our current data indicates an organic sales growth in the range of 1-3%. This is despite an expected organic sales decline of 4% in the first quarter due to a 14% drop in Western European LVP. Based on this assumption, consolidated sales are expected to grow in the range of 2-4% during 2013, provided that the mid-January currency exchange rates prevail.
The indication for the operating margin is around 9% for 2013, excluding costs for capacity alignments and antitrust investigations. The capacity alignment costs are currently assumed to reach at least $25 million but not exceed $50 million.
The effective tax rate is projected to be around 27%, excluding discrete items.
Operations are expected to continue to generate a strong cash flow in the magnitude of $0.7 billion, while capital expenditures are expected to amount to approximately 4.5% of sales.
Yours sincerely,
Jan Carlson
Stockholm, February 22, 2013
Autoliv’s Targets
| | |
| LONG TERM TARGETS | | COMMENTS |
| |
Organic Growth Exceed growth of the global light vehicle production (LVP). Definition on page 42 in the Annual Report (Non-U.S. GAAP measure) | | Since there is no public data on the global automotive safety market, we use global LVP as a proxy to measure our sales performance and market share development. Both in 2010 and 2011, we outperformed global LVP by 6 percentage points and grew our market share. However, in 2012 when global LVP grew by 7%, our organic sales growth of 4% was 3 percentage points less than the global LVP growth. This underperformance was due to an 8% decline in Western European LVP. |
| |
Operating Working Capital Less than 10% of last 12-month sales. Definition on page 42 in the Annual Report (Non-U.S. GAAP measure) | | Our operating working capital in relation to sales continues to trend well below our target of less than 10% of sales. This is due to our continued focus on inventory and overall capital management. For 2012, when working capital was 7.0% of sales, we beat our target by 3.0 percentage points (p.p.). |
| |
Labor Productivity At least 5% per year. | | We managed to reach our productivity improvement target of at least 5% per year in 2010-2012 when productivity in manufacturing improved by 6.1%, 6.0% and 6.1%, respectively. This is thanks to the strong focus on continued improvements and standardization in all of our plants world wide. |
| |
Direct Material Cost Reduction At least 3% per year. | | In 2012, we reduced our direct material prices (i.e. component costs) by 3.9%, well in line with our target of 3%. In 2011, we reduced direct material prices by 2.1%, thereby missing our target by 0.9 percentage points. This was due to a 1.6 percentage point negative effect from higher commodity prices. Commodities make up 51% of our direct material costs. |
60 years of innovation
For 60 years Autoliv has been in the business of saving lives and has accounted for virtually all of the major industry break-throughs. This proud tradition spurs us on to develop new ingenious safety innovations and save even more lives.
1956 - Seatbelt
Lennart Lindblad, the founder of Autoliv, develops the Company’s first seatbelt, a 2-point static belt.
1980 - Airbag
Morton ASP, which became an Autoliv company in 1997, starts airbag production.
1989 - Pretensioner
Mercedes introduces our innovation that tightens the seatbelt mechanically at the onset of a crash.
1994 - Side Airbag
Volvo introduces our new airbag that reduces thorax injuries in side-impact collisions.
1995 - Knee Airbag
KIA introduces our new airbag that reduces knee injuries.
1998 - Side Curtain Airbag
Mercedes and Volvo introduce our curtain airbag that covers an upper side of the vehicle in a side impact to protect the occupants’ heads.
2005 - Pedestrian Protection
Jaguar introduces our hood lifter that creates clearance between the hood and the hard engine block underneath when the pedestrian’s head hits the vehicle hood.
2006 - Active Seatbelt
A reversible seatbelt that tightens, as a precaution, immediately before a very likely crash and then releases again if the driver manages to avoid the crash.
2008 - Pedestrian Warning
BMW introduces our second generation of Night Vision Systems which can warn the driver of pedestrians.
2012 - Pedestrian Protection Airbag
Volvo introduces an outside airbag for pedestrian protection. The product helps car manufacturers meet the stricter 2014 EuroNCAP requirements.
OUR VISION
To substantially reduce traffic accidents, fatalities and injuries.
OUR MISSION
To create, manufacture and sellstate-of-the-art automotivesafety systems.
OUR VALUES
Life – we have a passion for saving lives.
Customers – we are dedicated to providing satisfaction for our customers and value for the driving public.
Innovation – we are driven for innovation and continuous improvement.
Employees – we are committed to the development of our employees’ skills, knowledge and creative potential.
Ethics – we adhere to the highest level of ethical and social behavior.
Culture – we are founded on global thinking and local actions.
Who We Are, What We Do
While human suffering cannot be measured, monetary costs to society from automobile accidents are estimated to be in the hundreds of billions of dollars each year for health care, rehabilitation and loss of income.
Innovation and focus on saving lives have been the hallmarks for Autoliv from its inception 60 years ago. Now our products save over 25,000 lives every year and prevent ten times as many severe injuries. The next step is to further reduce road traffic accidents with active safety systems that can assist the driver to avoid an accident or, at least, reduce the speed of impact, thereby substantially mitigating the severity of injuries.
Autoliv, Inc. is incorporated in the state of Delaware, and its global headquarters is located in Stockholm, Sweden.
We are a Fortune 500 company and the world’s largest automotive safety supplier with sales to all the leading car manufacturers in the world. We develop, manufacture and market airbags, seatbelts, steering wheels, passive safety electronics and active safety systems such as radar, night vision and camera vision systems. We also produce anti-whiplash systems, pedestrian protection systems and child seats.
Our leading market position in automotive safety includes a global market share of approximately 36% in passive safety and around 20% in active safety. In 2012, we produced around 140 million seatbelts and around 110 million airbags. Statistically, there were almost two seatbelts and 1.5 airbags from Autoliv in every vehicle produced globally, despite many vehicles not having airbags.
ABOUT AUTOLIV
| | | | |
| OUR PRODUCTS SAVE | | OPERATIONS IN | | CRASH TEST TRACKS |
| >25,000 | | 29 | | 20 |
| Lives annually | | Countries | | Worldwide |
| | |
| AIRBAGS | | FACILITIES | | ASSOCIATES |
| ~110 | | >80 | | >50,000 |
| Million units in 2012 | | Globally | | worldwide |
| | |
| SEATBELTS | | PREVENT/REDUCE SEVERE INJURIES | | TECH CENTERS IN |
| ~140 | | 250,000 | | 18 |
| Million units in 2012 | | Annually | | locations |
ACTIVE SAFETY SYSTEMS
Our Active Safety systems are designed to intervene before a crash by adjusting engine output, steering and braking. These systems can create a “Virtual Crash Zone” using our radar and vision technologies to monitor the environment around the vehicle, in addition to making driving easier and more comfortable.
THANKS TO PASSIVE SAFETY SYSTEMS such as seatbelts and airbags, vehicle safety has substantially improved. Although these systems are effective in mitigating the human consequences of an accident, they can never prevent the accident from occurring.
With the introduction of active safety systems, many accidents and collisions will become avoidable or at least less severe by reducing the speed of impact. This will also result in significant improvements in the protection provided by the passive safety system.
NIGHT DRIVING ASSIST
Thenight driving assist displays an image of the road scene ahead to make night-driving easier and safer. The image generated in the heat-sensing device is processed using different filters to obtain a black and white image with sharp light or dark outlines, in which shapes are easily detected. The system also analyzes the scene content with respect to the motion of the vehicle to determine if a pedestrian or an object is at risk of being hit by the vehicle. It can detect pedestrians and animals up to two times further away than the typical headlight range and, if a threat exists, the driver is warned. The latest generation of our night vision, calledDynamic Spot Light, has a revolutionary function that selectively illuminates pedestrians and animals with a separate marking headlight (see page 17).
RADAR SYSTEMS
Short and medium range radar system provides all-weather object detection and can be used effectively in all directions around the vehicle. By scanning up to 30 meters, the system can provide an advanced warning of an imminent collision. The radar is also used for detecting objects in the blind spots of a vehicle and to control stop-and-go functions in queue assist systems. Ourlong range radarsare utilized for adaptive cruise control systems.
VISION SYSTEMS
Autoliv’s pioneering work with camera-basedvision systems gives the driver, in effect, an additional pair of eyes scanning the road ahead for danger.
Advanced algorithms enable the camera to recognize and track other vehicles, speed signs and lane markings. They can also warn the driver when the car is in danger of colliding with pedestrians, other vehicles or straying out of lane.
To provide a free view, the camera is typically located at the upper edge of the wind shield.
ACTIVE SEATBELTS
An active seatbelt has an electrically driven pretensioner that tightens the belt as a precaution in hazardous situations. The belt system then releases some webbing if the driver manages to avoid the traffic hazard.
This function also warns the driver by letting the pretensioner vibrate the seatbelt webbing.
This technology also offers improved comfort to the occupants while using the seatbelt.
BRAKE CONTROL/ESC
Autoliv has developed the world’s first Integrated Inertial Measurement Unit that combines the controls of the vehicle’s restraint system with those controls for the vehicle’s brakes that can provide Electronic Stability Control (ESC), Anti-locking Brakes (ABS) and Automatic Traction Control (ATC). This merger of the control systems, which will be launched in 2014, provides significant savings and enhanced performance.
ACTIVE AND PASSIVE SAFETY INTEGRATION
To monitor the environment around the vehicle and control the vehicle motion, Autoliv is developing the next generation of electronic integration.
ThisElectronic Safety Domain Controller (ESDC) links all safety sensors (including the environmental sensor) and all actuators that control vehicle motion (brakes, steering, and engine/transmission).
ACTIVE SAFETY FUNCTIONS
Autonomous Emergency Braking (Radar or Vision)
Continuously monitors the area in front of the vehicle to detect slow moving vehicles and other objects.
Function: alerts the driver, tightens the active seatbelt, puts the brakes in an alert mode and applies the brakes autonomously.
Cross-Traffic Assist (Radar)
Helps detect cross traffic when reversing out of a parking space.
Function: acoustic alert.
High/Low Beam Assist (Vision)
The system identifies on-coming vehicles and determines when the head lights need to be dipped in order not to blind the on-coming driver.
Function: automatically switches between high and low beams.
Blind Spot Detection (Radar)
Monitors the presence, direction and velocity of vehicles in adjacent lanes.
Function: alerts the driver by lighting a warning indicator on the appropriate side.
Road/Lane Departure Assist (Vision)
Monitors the lane markings on the road and checks that the vehicle stays within its lane to avoid dangerous situations.
Function: alerts the driver with acoustical or haptic warnings and/or a symbol on the head-up display.
Pedestrian Detection/Warning (Vision)
Detects pedestrians who might be about to step into the road.
Function: warns the driver or even autonomously brakes the vehicle.
Queue Assist (Radar or Vision)
In slow-moving traffic and congestion it makes driving easy and comfortable.
Function: maintains a set speed/distance to a vehicle ahead down to a standstill.
Traffic Sign Recognition (Vision)
The system keeps the driver informed of the speed limit and other traffic signs on the road.
Function: a symbol is displayed in the instrument cluster or on the Head-up Display (on the inside of the vehicle’s windshield) showing the current speed limit or other important road signs.
Adaptive Cruise Control (Radar)
Automatically adjusts the vehicle speed to maintain a safe distance from vehicles ahead.
Function: maintains a set speed/distance to a vehicle ahead.
PASSIVE SAFETY SYSTEMS
Autoliv has accounted for virtually all major technological breakthroughs within passive safety over the last 60 years.
SEATBELT SYSTEMS
Modernseatbelts can reduce the overall risk of serious injuries in frontal crashes by as much as 60% thanks to advanced seatbelt technologies such as pretensioners and load limiters.
Retractor and buckle pretensioners tighten the belt at the onset of a frontal crash, using a small pyrotechnic charge. Slack is eliminated and the occupant is restrained as early as possible, thereby reducing the risk of rib fractures.
Lap pretensioners further tighten the webbing to avoid sliding under the belt which improves lower-leg protection and prevents abdominal injuries from a loose belt. In an accident,load limiters release some webbing in a controlled way to avoid the load on the occupant’s chest from becoming too high. When used in combination,pretensioners,load limiters,lap pretensioners andfrontal airbags, have a 75% reduction of the risk of life-threatening head or chest injuries in frontal crashes.
Supplemental belts prevent occupants from sliding out of the “open side” of the regular 3-point belt in roll overs and far-side collisions.
AIRBAGS AND STEERING WHEELS
Driver and the passenger airbags deploy in 50 milliseconds, half the time of the “blink of an eye”, and can be “smart”, i.e. the power of the airbags can be tuned to the severity of the crash and the size of the occupant, using adaptive output airbag inflators. The driver airbag reduces fatalities in frontal crashes by approximately 25% (for belted drivers) and reduces serious head injuries by over 60%. The airbag for the front-seat passenger reduces fatalities in frontal crashes by approximately 20% (for belted occupants).
Side curtain airbags reduce the risk of life-threatening head injuries in side impacts by approximately 50% for occupants who are sitting on the side of the vehicle that is struck. Curtain airbags cover the whole upper side of the vehicle.
Single-chamberside airbags reduce the risk for chest injuries by approximately 25%. With dual-chamber side airbags, both the pelvis and the chest areas are protected which further reduces the risk of serious injuries in side-impact crashes.
Rear side airbags reduce injuries for rear occupants.
Knee airbags significantly reduce the risk of injuries to the knee, thigh and hip. These injuries today represent 23% of the active-life years lost to injury in frontal crashes involving motor vehicles.
Anti-sliding airbags are installed in the seat cushion. In a crash, the airbag raises the front end of the seat cushion to prevent the occupant from sliding under the seatbelt. This reduces significantly the risk for knee, thigh, and hip injuries for belted occupants. In addition, by keeping the occupant in an upright position, the protection from the frontal airbag becomes more efficient.
Steering wheels offer a variety of control switches and different designs. Some of our steering wheels have an integrated electrical motor that can vibrate the steering wheel, thereby alerting the driver of a dangerous situation. To improve comfort in cold climate, the steering wheel can have a heated rim.
Far-side airbags that inflate between the seats can significantly reduce injuries by preventing the occupants to move sideways. Studies have shown that 30% of all serious injuries in side-impact collisions are related to the far-side occupant hitting the other occupant or hard objects.
Bag-in-belt is a combination of a seatbelt and an airbag to further reduce the load on the occupant’s ribcage in a frontal collision.
CRASH ELECTRONICS
The ECU (Electronic Control Unit) is the “brain” of the car’s safety system. It decides not only if, but also exactly when, the seatbelt pretensioners should be triggered and each airbag system should be deployed. The ECU contains crash sensors and a microprocessor, as well as back-up electricity in the event the connection to the car battery is cut off in the crash. The ECU is located in the middle of the vehicle where it is well protected during a crash. Autoliv’s latest ECU also contains sensors for the Electronic Stability Control System (see “Brake Control/ESC” on the previous page).
Satellite sensors are mounted in the door beam, the pillar between the doors, the rocker panel, and/or in various locations at the front of the vehicle, to quickly provide the ECU with acceleration data to enable appropriate deployment of the airbags and seatbelt pretensioners.
PEDESTRIAN PROTECTION
To protect the head, the hood needs to be able to act as a cushion. This can be achieved usingpyrotechnic hood-lifters that raise the rear end of the hood to create clearance above the rigid engine structure beneath. However, in many smaller vehicles, the hood is too short, and the head of a pedestrian will most likely hit the hard area between the hood and the windscreen or one of the windshield pillars. In this case an outsidepedestrian protection airbag can be used to create a cushion effect.
Pedestrian protection systems are deployed either by contact sensors in the bumper or by an active safety system. The latter systems have the advantage of being able to brake the car, thereby reducing the speed and the severity of impact.
ANTI WHIPLASH
Anti-whiplash systems are based on a yieldable backrest that tilts in a controlled way in a rear-end collision, thereby reducing the risk for neck injuries.
BATTERY DISCONNECT SAFETY SWITCH
ThePyrotechnic Safety Switch utilizes a pyrotechnic initiator to cut the electrical power to a designated portion of the vehicle in a crash. This minimizes the potential for a fire in a crash. It is especially important in electrical vehicles to automatically and safely cut-off the connection to the electrical power.
Innovations for the Future
Autoliv has 4,700 people, or almost 10% of all associates, in research, product development and application engineering.
SAFETY is one of the strongest sales drivers for new cars. In virtually all inquiries about what consumers want in their next vehicle, new safety products rank very high or at the top of their priorities.
Autoliv assists vehicle manufacturers in meeting these evolving safety trends by staying at the forefront of technology, crash-testing more vehicles than any other safety company and working as a development partner for new vehicles.
We have 4,700 people in Research, Product Development and Application Engineering (R,D&E).
Research (R) is conducted by some 30 dedicated specialists at our Swedish Safety Center. We also provide funding for another 30 scientists at universities and independent research institutes to work on special projects. We use accident databases (such as NASS-CDS in the U.S., as well as GIDAS in Europe and CIDAS in China both of which Autoliv is a member) to identify the types of traffic injuries to which we might apply Autoliv’s safety expertise. We also draw on our crash tests and trials, as well as on the vast expertise our specialists have gathered over many years.
Corporate development projects (D) are assigned to our leading tech centers in China, France, Germany, Japan, South Korea, Sweden and the United States. Our tech center in India has been assigned some corporate projects for the safety of small cars. Application engineering projects are completed in our tech centers in close cooperation with the manufacturing units.
Our R,D&E focuses both on inventing completely new technologies and on implementing further improvements and cost savings to existing products.
In total, Autoliv currently has thousands of R,D&E projects with the vast majority of the projects (and the associated costs) in application engineering to support the development of new vehicle models. No single project accounts for more than 3% of Autoliv’s total R,D&E spending.
INVESTMENTS
During 2012, we increased Research, Development and Application Engineering (R,D&E) expenses, net by $14 million, mainly to increase our engineering capability in Asia and to accelerate our efforts even further in active safety, thereby reinforcing our long-term commitment to innovation and technology.
Gross expenditures for R,D&E amounted to $598 million compared to $568 million in 2011, which corresponded to 7.2% of sales in 2012 and to 6.9% of sales in 2011 (see graph).
Of these amounts, $143 million in 2012 and $127 million in 2011 related to engineering projects and crash tests were paid by vehicle manufacturers, safety authorities, auto magazines and other external customers.
Net of this income, R,D&E expenditures amounted to $455 million in 2012 and $441 million in 2011 or to 5.5% and 5.4% of sales.
Of the gross R,D&E expense in 2012, 75% was for projects and programs for which we have customer orders, typically related to vehicle models in development. The remaining 25% was not only for completely new innovations but also for improvements of existing products, standardization and cost reduction projects.
PATENTS
Our commitment to technological leadership is evidenced by our strong patent position. In 2010, (the latest year with official statistics), Autoliv accounted for 5% of all new patent filings in passive automotive safety filed in more than one country.
Autoliv holds more than 6,500 patents covering a wide range of innovations and products in automotive safety and key supporting technologies, an increase from 6,300 in 2011.
DYNAMIC SPOT LIGHT
Autoliv’s new Dynamic Spot Light, which was developed in collaboration with BMW, can selectively illuminate pedestrians and animals without blinding on-coming drivers. It uses the heat-emission sensor in Autoliv’s infrared-based Night Vision system to detect a pedestrian or animal and two LED spot lights that act independent of each other.
DRIVER DISTRACTION
Autoliv’s Eyes-On-the-Road (EOR) camera can warn the driver and/or brake the vehicle if the driver is distracted or about to fall asleep. The EOR can also identify the driver to make sure the vehicle is not stolen, as well as adjust the seat automatically to the right position to the driver’s height and weight. The bars on the photos show three degrees of distraction.
Empty bar with driver’s eyes on the road. Driver busy texting. Distracted driver.
ADAPTABLE SEATBELTS
Heavier and taller vehicle occupants need—and can take—higher restraining forces in a crash than, for instance, a child. Therefore, adaptive load-limiters were developed a decade ago. One drawback with these features is their need for sensors, which are expensive. Existing adaptive load limiters could also be difficult to tune in real life to the occupant’s size and the severity of the crash.
Autoliv has now invented a new seatbelt retractor that can tune its restraining force individually to each vehicle occupant – without any sensor. This purely mechanical solution offers adaptability to the occupant size and the severity of a crash at a low cost.
Unique Testing Capabilities
With our technical centers in nine countries, we have one of the best global footprints in the industry to support our customers’ new vehicle development.
CRASH TESTING We are the only safety supplier with dedicated resources for crash testing of complete vehicles rather than just vehicle bodies in sled tests. Autoliv has six crash-test facilities with tracks for full-scale tests (one in China, France, Sweden, the U.S. and two in Germany). At these tracks, vehicles weighing up to five tons can be crash-tested at speeds up to 64 Km/h (40 mph).
The experience our experts gather from these full scale tests gives us a unique capability to work as a “safety consultant” to help support safety systems development with the vehicle manufacturers.
FIELD TESTS Autoliv’s engineers perform hundreds of thousands of kilometers of on-road testing and data gathering all over the world since active safety systems must work in all types of driving conditions and road sign layouts, lane markings etc. vary between countries and regions.
WINTER TESTING The region near the Arctic Circle provides ideal conditions for developing and testing brake control systems such as stability control and traction control.
ROLL-OVERS are dangerous accidents that have a higher fatality rate than other types of crashes.
Our roll-over tests use special rigs, ditches, sand beds and ramps to simulate various roll-over accidents. The in-door roll-over tests require huge open buildings with large high-intensity light ramps.
SIMULATION is a cost-efficient re-creation of a destructive crash test to examine the level of safety. To model real crash tests, today’s crash simulations include virtual models of the anatomy of the human body.
CARSON CITY is a unique outdoor test facility for pre-crash and active safety systems located in Vårgårda, Sweden. The facility can be used for advanced development of pedestrian protection systems, including autonomous braking systems.
SLED TESTING in a High-G Sled is a non-destructive cost-efficient test method. It uses a hydraulically powered piston that “strikes” the sled for repeatable comparisons of occupant motions and loadings in different crash situations.
Investing in Social Responsibility and Integrity
Helping to save more lives and preventing injuries is the most important contribution Autoliv can make to social responsibility. Therefore, corporate social responsibility is not new to us. It has been our core business for 60 years.
MORE THAN 1.2 MILLION PEOPLE perish every year on the world’s roads, and between 20 and 50 million suffer serious injuries, according to the World Health Organization (WHO).
In addition to the human suffering, these tragedies cost societies billions of dollars every year. The situation is aggravated by the fact that traffic accidents affect especially younger generations (they are a top-three cause of death for people aged 5 to 44) and often lead to life-long disabilities.
Consequently, saving more lives and preventing injuries is the most important contribution Autoliv can make to social responsibility. We therefore use our expertise to support and cooperate with government agencies, hospitals, insurance companies, non-governmental organizations and others who share our vision of zero traffic fatalities.
We also assume our social responsibility in several other ways.
INVESTING IN INTEGRITY
Our investment in integrity is demonstrated through our commitment to upholding our values, to adhering to the law, and fostering a culture that all employees act with the highest ethics and integrity.
We live our values every day, because how we do business is very important for a company that is in the business of saving lives. We have in place the elements of an effective compliance program, including executive sponsorship, Board of Directors’ oversight, a system for reporting potential or actual criminal conduct, and the Autoliv Standards of Business Conduct and Ethics.
Autoliv’s Standard of Business Conduct and Ethics draws on universal standards such as the “Global Sullivan Principles of Social Responsibilities”; the “U.N. Global Compact”; ILO’s Declaration on Fundamental Principles and Rights at Work; and OECD’s Guidelines for Multinational Enterprises. These standards apply to all operations and all employees worldwide and are available to view and download from www.autoliv.com.
We invest in our compliance and awareness program “Raise your hand for Integrity” to educate every employee of Autoliv’s expectations for acting with integrity and promoting ethical conduct and communicating that ethical breaches will not be tolerated. Our compliance education and awareness program empowers employees and conveys our expectations that employees are required to report any suspected, potential, or known violations of law, Autoliv policies and procedures, or concerns through one of the available channels. The awareness program educates employees that they can report concerns by speaking confidentially with a representative in Human Resources, the Legal department, a Corporate Compliance Officer, or by using the Autoliv Helpline.
The Autoliv Helpline is a multilingual third-party operated service where reports can be made confidentially, without fear of retaliation, 24 hours a day, 7 days a week, by phone or online athttp://helpline.Autoliv.com.
CONTRIBUTION TO PROTECTING THE ENVIRONMENT
The environmental impact from our operations is generally modest, since most of our manufacturing consists of the assembly of components. For instance, Life Cycle Assessments (LCA) show that CO2 emissions from Autoliv account for 1% of the 31.4 kg emitted during the life of a driver airbag and that the driving of the vehicle and the raw material production for the airbag generate almost 100 times more carbon dioxide.
As a consequence, the most important contribution we can make to the environment is to design and develop low-weight and environmentally-friendly safety systems. Even a small reduction in weight can result in substantial improvements through lower fuel use and emissions throughout the car’s entire life. Helping our customers in their efforts to meet the stringent CO2 and CAFE (Corporate Average Fuel Economy) requirements is important for them, and a competitive tool for us.
Although Autoliv’s CO2 emissions are low, we have launched several energy saving programs, ranging from automatic lighting systems to heat recovery of cooling water. The total energy consumption (incl. electricity and heating) by all Autoliv facilities was 715 GWh during 2012, which corresponds to 246,000 metric tons of CO2 (using the Greenhouse Gas Protocol), which was an increase from 2011 of 7% and in line with our unit sales increase.
With our strong global presence we can minimize the environmental impact imposed by logistics when procuring parts and supplying finished products to our customers. By improving the efficiency of our logistic systems we also benefit financially.
It is our policy that every Autoliv facility be certified according to ISO 14001. The few remaining non-certified plants are essentially new manufacturing facilities that have not yet been certified. All Autoliv facilities measure and work to continuously improve all of their relevant environmental measurables, such as energy and water consumption, emissions to air, transportation and the use of packaging materials.
ASSISTING CUSTOMERS
Since 2006, the European directive End of Life of Vehicle (ELV) requires that 85% of all material in new vehicle models must be recoverable. The level will be raised to 95% by 2015.
Although the directive on ELV only specifies recovery levels for the whole vehicle and not for individual components, we make sure that our products meet or exceed the legal requirements.
SUPPORTING SUPPLIERS
We also work closely with our suppliers to encourage them to implement an environmental management system, according to ISO 14001. We require them to adhere to our environmental policy (see www.autoliv.com).
Our leading suppliers are monitored as part of our regular quality audit process to ensure they are compliant with – or preferably exceed – the minimum basic working conditions as established in universal standards. This includes preventing child labor and forced labor, ensuring safe and healthy work environment for employees and fair work conditions, a commitment to adhere to laws and regulations, specifically those related to bribery and corruption, competition and money-laundering.
Supporting Governments
During 2012, Autoliv has supported the Dutch Ministry of Transportation in its efforts to reduce traffic injuries among bicyclists and other Vulnerable Road Users (VRU). We were a partner in a special government project along with the Dutch Cyclists’ Union, an insurance company and the R&D institute TNO. Our experts have contributed by providing analysis of cyclist accident data, helping draft the specifications of a pre-crash sensor and developing a prototype VRU-airbag that we have tested in our crash labs in vehicle-to-cyclist impacts for the government project.
Other examples of our support of governmental agencies and the public sector is cooperation with universities, authorities, traffic rescue organizations and insurance companies.
CO2-Emission from an airbag
Only 1% of the CO2-emissions from an airbag comes from Autoliv, according to Life Cycle Assessments.
Of the emissions, 73% are generated during the life of the vehicle and 25% are produced in steel mills and other parts of our supply chain.
Therefore, weight and material reductions are the most important contributions we can make to reduce CO2 (and other) emissions.
Investing in People
Our people are the foundation of our success. To find, develop and retain people with the right skills and talents for the right positions is therefore a top priority.
WE ARE ALWAYS SEARCHING for talented men and women who share our passion for saving lives and wish to build their careers and broaden their capabilities. This is paramount for a sustainable development of our company, particularly in our growth markets. In this pursuit of dedicated and motivated people we are helped by the fact that Autoliv, as the world leading automotive safety company, can offer challenging, rewarding careers in a dynamic, global industry that saves lives and social costs. Another attraction for many job seekers from other industries is our close relationship with all of the important vehicle manufacturers in the world. For potential employees in our tech centers, Autoliv’s close relationship with universities and colleges is another attraction factor.
We are committed to maintaining this environment that attracts high performers and keeps them motivated.
TALENT MANAGEMENT
To further strengthen our ability to be an attractive employer and continuously develop our people, we have an advanced talent management program. It is a solid process to identify and develop high potential individuals in order to meet our long-term business targets.
The talent management program is an annual activity among our 13,500 indirect employees in R&D, sales & administration and production overhead. Our talent management program begins with an employee performance and development dialog that supports our succession planning and future need of various competencies.
LEARNING AND DEVELOPMENT
To make sure we have enough skilled and talented people we are also focusing on the development of our employees. This leads, as well, to more engaged and motivated people.
Our global and regional training programs focus on building key leadership and management skills and knowledge where participants have the opportunity to network and collaborate with people from all over the world.
Our local training programs focus on developing functional skills and knowledge as well as basic leadership and management skills. The managers take the responsibility, along with the employee, for growth and development through one-on-one training, mentoring, coaching and support.
Additionally, we have effectiveness workshops to ensure that all leaders are role modeling the expected behaviors to drive a common culture throughout Autoliv.
All of our plants have on-the-job and skills development trainings, starting with job orientation for newly employees. In these trainings, work safety is an important element, in addition to understanding the manufacturing process and the product technologies. We also encourage job rotation and mobility across functions, plants and national boundaries.
We are committed to connecting talent management and succession planning processes to employee development activities to ensure that we focus on the right people in the right places. This connection not only reinforces Autoliv’s competitiveness as an employer but strengthens our ability to maximize customer and shareholder value, helping us grow our business and have continued success.
EMPLOYEE SAFETY
Our first important key performance indicator is employee safety. The target for each plant is of course zero injuries. In 2012, 13 plants managed to meet this target, an improvement from 8 plants five years ago.
From an already low level, our overall injury level globally continues to decline as seen in the graph on the next page. Since we are dedicated to the business of protecting people and saving lives, we feel a unique responsibility to ensure the safety, health and well-being of our associates. For instance, we have introduced a “first alert” system which uses our network of safety representatives to share information readily among all plants should a machine or process require any type of corrective process as a result of a safety concern.
With this timely notification, plants using similar equipment or processes can promptly analyze their own resources and work to minimize future risk.
EMPOWERING EMPLOYEES
Autoliv has a long track record of encouraging all employees to be creative and put forward their improvement ideas. This is a key element in our lean manufacturing philosophy and culture of continuous improvement.
We have asked ourselves: Who are better to propose improvements in, for instance, manufacturing, than the line operators themselves? We have therefore made the number of improvement suggestions per associate one of our operational key performance indicators (KPI) by which our approximately 80 facilities globally are benchmarked every quarter.
During 2012, this KPI continued to improve as seen by the index chart on the next page. Globally, more than half a million employee suggestions were received, helping us reduce waste and continue to improve labor efficiency by 6% and exceed our annual target of at least 5%. This trust in our employees not only improves our business performance, but it is highly motivating.
EMPLOYEE WELL-BEING
A third indicator of the well-being of Autoliv’s most valuable asset is labor absenteeism, although this indicator also often reflects the welfare systems and levels of sick leave compensation in the various countries in which we operate. We measure labor absenteeism as labor hours lost due to sickness in relation to total possible labor time.
This ratio has been declining for several years thanks to the dedicated efforts we have made. These efforts include various activities such as providing health care and programs to improve workplace ergonomics. As a result, labor absenteeism shows a favorable declining trend, despite a minor increase during 2012.
EMPLOYEE DIVERSITY
Due to Autoliv’s global presence, our workforce reflects the diversity of the 29 countries in which we operate. However, simply having diversity in our workforce is not enough. We work hard to create an inclusive environment where all people can contribute their best work regardless of age, gender, ethnicity or other differentiating factors, and we promote equal opportunities for all employees at all levels irrespective of color, race, gender, age, sexual orientation, ethnicity or religious beliefs.
We place special priorities on diversity in selection of professionals for our training program and succession planning to achieve balance and competence in our workforce and management.
The average age of our personnel is 34 years and nearly 50% are women. Around 71% of our 51,000 associates are direct workers and 16% other personnel in manufacturing, 9% are involved in R,D&E and 4% in sales and administration.
“At Autoliv we emphasize teamwork”
Good teamwork is essential for Rocio when she describes her role as Production Control Manager in Mexico.
WHAT IS MOST ATTRACTIVE AND/OR DIFFICULT PART OF YOUR JOB?
When you manufacture products designed to save lives, you feel an added weight of responsibility to make sure your products are built right the first time and every time. To ensure the highest quality, we utilize tools that drive our culture of continuous improvement and empower me and my fellow team members to find the right solutions to meet our customers’ needs.
DESCRIBE A NORMAL WORKING DAY.
Arriving at my office at 7 am, I quickly browse my e-mails and grab a quick cup of coffee. Then it’s down to the warehouse floor to “go and see” how teams are doing as they build and prepare orders for shipment. I handle the calls from suppliers or customers before stepping into planning meetings or workshops. I typically keep these activities up until the end of the day.
WHY DO YOU ENJOY WORKING FOR AUTOLIV?
I enjoy working at Autoliv because we truly care about people. I have worked at other companies, but I’ve never come across this same sense of belonging. At Autoliv, you don’t just build a professional career. You build friendships. Autoliv places a priority on building teams that work. Pressure exists, yes, but with our emphasis on teamwork principles such as respect and accountability, pressure really becomes a tool to help us reach our desired results.
Superior Global Presence
With operations in 29 countries and one of the broadest customer bases of any automotive supplier, Autoliv has the best global footprint in its industry.
| | | | |
| AMERICAS | | JAPAN | | REST OF ASIA |
| Sales1) +14% | | Sales1) +10% | | Sales1) +3% |
| | |
| EUROPE | | CHINA | | |
| Sales1) –7% | | Sales1) +9% | | |
LOCATIONS AND CAPABILITIES
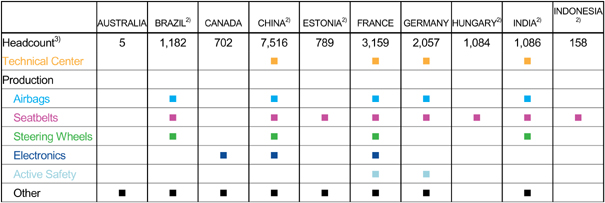
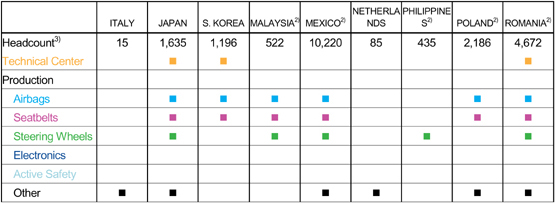
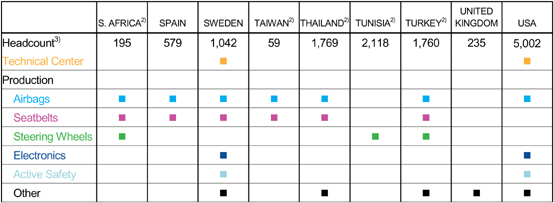
| 1) | Autoliv’s organic sales change in 2012 i.e. excluding currency effects and acquisitions/divestitures. 2) Defined as Low Cost Country. 3) Includes headcount in joint ventures. |
Our Market and Competitors
Autoliv’s market is expected to continue to grow at an average annual rate of approximately 5% over the next three years.
OUR MARKET is driven by two primary factors; light vehicle production (LVP) and content per vehicle (CPV). (CPV includes Seatbelts, Airbags, Steering Wheels, Electronic Control Unit, Crash sensors, Night Vision, Radar and Vision Systems).
The first growth driver, LVP, has risen at an average annual rate of 4% over the past ten years despite the cyclical nature of the automotive industry. Over the next five years, LVP is expected to continue to grow to almost 100 million light vehicles (LV) by 2017 from nearly 80 million in 2012, according to IHS. Virtually all of this expansion will be in the “Growth Markets”, predominately China, India, Thailand, Indonesia as well as Eastern Europe and Brazil.
Unlike LVP, which Autoliv cannot influence, we can affect the other growth driver of our market, CPV, by continuously developing new higher value-added products. This increases the long-term average safety content per vehicle and has caused the automotive safety market to grow faster than LVP. A steady flow of new technologies to the market has also enabled Autoliv to outpace the market and increase its market share. For instance, since the start of Autoliv Inc. in 1997, the Company’s sales have increased at a Compounded Annual Average Growth Rate (CAGR) of 6% compared to 5% for our market and 3% for LVP.
Historically, CPV has been driven by passive safety (mainly seatbelts and airbag products) in the developed markets of Western Europe, North America and Japan (Triad). Looking ahead, the CPV in the Triad will primarily be driven by active safety systems while new passive safety systems such as pedestrian protection, knee airbags and far-side side-impact airbags are expected to have a modest effect. However, in the Growth Markets, passive safety systems will still be the dominant growth driver for CPV for the next several years.
Several mega trends will continue to positively influence the overall safety content per vehicle. These include;
| 1) | Evolution of collision avoidance to reduce the society cost of accidents and fatalities on the roads, |
| 2) | Traffic fatalities as a cause of death will almost double to 2.4 million people by 2030, according to the World Health Organization (WHO), |
| 3) | Demographic trends of increased safety conscious consumers, aging driver population and higher LVP in the Growth Markets, |
| 4) | Government regulations and test rating systems to improve the safety of vehicles in the various markets, and |
| 5) | Trends toward lighter and alternative fuel vehicles. |
MARKET GROWTH BY REGION
In 2012, the global passive and active safety market, including steering wheels, grew by 7% to a new record of $23 billion. This was entirely due to record-high LVP, while the global average CPV stood unchanged at roughly $300. This flattish CPV was due to an 8% LVP decline in Western Europe, where the average CPV is around $400, while more than one third of the increase in global LVP occurred in the Growth Markets, where the average CPV is only around $200.
This CPV trend is likely to continue, at least for the next few years, since virtually all of the LPV growth is expected to be in the Growth Markets and as it takes two vehicles in the Growth Markets to equal the sales resulting from one vehicle in the Triad.
Despite this negative CPV mix effect, our market is expected to grow at a CAGR of approximately 5% during the next three years to about $27 billion, based on the current macro-economic outlook and business awarded Autoliv or other companies in our industry.
Most of the increase from $23 billion to $27 billion will be in the Growth Markets, which are expected to increase at a rate of 12% per year to $11 billion. This strong growth will be mitigated by an expected decline of the Japanese market of 4% per year. This geographical mix will result in a favorable effect for Autoliv since our market share in the Growth Markets is 34% and in the process of increasing, while our market share in Japan is approximately 20%. However, this favorable mix effect will be mitigated by the fact that the important Western European market is expected to expand at a rate that will be 3 percentage points less than the global average growth rate.
MARKET GROWTH BY PRODUCT
Our passive safety market is expected to grow at a CAGR of 4% with the highest growth rate expected for seatbelts.
This product line is expected to grow at a CAGR of 5% or by $1 billion to $7.5 billion. In seatbelts, Autoliv has reached a global market share of approximately 40%, primarily due to being the technology leader with several important innovations such as pretensioners and load limiters. Our strong market position is also a reflection of our superior global footprint. Seatbelts are the primary safety product and also an important requirement in low-end vehicles for the Growth Markets. This provides an excellent opportunity to benefit from the expected growth of this segment of the market.
The markets for frontal and side-impact airbags are expected to increase at an annual rate of 3% to $5.6 billion and $5.3 billion, respectively. Since Autoliv has relatively high dependence on the side-impact market (where we have a market share exceeding 40%) this relatively low growth rate will result in a relatively unfavorable product mix, while the 3% growth rate for frontal airbags (where we have a 30% market share) should have less of an impact.
The passive safety electronics and the steering wheel markets are both expected to grow by 4% annually, i.e. close to the expected average growth rate of our market. Our market share in passive safety electronics has doubled since 2001 to more than 20% and is expected to continue to increase. Our latest electronic control unit (ECU) for airbags is very competitive as it integrates active and passive safety (see page 12 in the Annual Report).
Our most recent market, active safety market, is expected to grow at a rate of 27% and to double in size to $2.2 billion by 2015. Through acquisitions and technology partnerships with our customers, Autoliv holds a strong number two market position with around 20% market share.
In summary, the winners in the automotive safety market during the next few years are likely to be companies that have built a strong position in active safety and a strong position in the Growth Markets, in line with Autoliv’s strategy.
OUR COMPETITORS
In passive safety, Autoliv’s major competitors are Takata and TRW, where we estimate that they account for roughly one fifth and one sixth of the market, respectively, while Autoliv leads the market with an approximate share of 36%.
TRW is a U.S. listed company on the New York Stock Exchange, with strong market positions in Europe and North America.
Takata is a family-controlled Japanese company with its shares listed on the Tokyo Stock Exchange. Takata has its strongest market position in Japan and North America.
In Japan, South Korea and China there are a number of local manufacturers that have close ties with the domestic vehicle manufacturers. For instance, Toyota has the “keiretsu” (in-house) suppliers Tokai Rika for seatbelts, Denso for electronics and Toyoda Gosei for airbags and steering wheels. These suppliers generally receive the majority of the Toyota business in Japan for these products, as does Mobis, a major supplier to Hyundai-Kia, in South Korea.
Other passive safety system competitors include US Private Equity owned KSS; Nihon Plast and Ashimori of Japan; Jinheng of China and Samsong of South Korea. Collectively, these competitors account for the majority of the remaining 25% global market share in passive safety.
The active safety market is relatively fragmented with more and bigger competitors than in the passive safety market and include Continental, Bosch, Delphi, Valeo, Gentex, Magna, Hella and Denso, of which we believe Continental has the leading market position today.
Continental, Bosch and Denso are also major competitors of Autoliv in passive safety electronics.
Our Customers
Our diversified customer base includes virtually every vehicle manufacturer in the world, due to our technological leadership and superior global footprint.
OURTOPFIVECUSTOMERS represented 54% of sales in 2012 and the ten largest customers 83%. This may seem to be a high concentration.
However, it is merely a reflection of the concentration in the vehicle industry. The five largest vehicle manufacturers (“OEMs”) in 2012 accounted for 52% of global light vehicle production (“LVP”) and the ten largest OEMs for 77%.
GM, RENAULT/NISSAN, FORD
General Motors is our largest customer, accounting for 15% of sales in 2012, while Ford and Renault/Nissan each account for 11%.
This is partly due to historical reasons since we have cooperated with these OEMs for many years and have developed a number of new safety innovations together with them. Autoliv’s strong global presence also fits these global OEMs very well, as well as our broad product offering. We have also acquired assets from Delphi and Visteon, which are spin-offs from GM and Ford, respectively.
VOLKSWAGEN, TOYOTA
In relation to their share of the global LVP, Autoliv is “under represented” with Volkswagen and Toyota. In 2012, Volkswagen and Toyota each accounted for roughly 12% of global LVP, while they accounted for slightly more than 8% and around 6% of our sales, respectively.
The larger the OEM, the more suppliers the OEM generally has to leverage prices with volumes. In addition, one of our major competitors, TRW has historically had close relations with Volkswagen and acquired companies that have been close to Volkswagen. Similarly, Toyota has in-house (“keiretsu”) suppliers that are awarded more than half of Toyota’s safety business.
BMW, DAIMLER, VOLVO
BMW and Daimler account for 5% each of our sales, despite the fact that they only account for 2% of global LVP. Volvo, another premium brand OEM, accounts for more than 2% of our sales compared to half a percentage of global LVP.
Our relatively high dependence on premium brand OEMs reflects higher safety content in their vehicles. It is also due to their strong pursuit of new safety innovations to advertise their new vehicle models along with Autoliv’s well-established position of being the technology leader in the automotive safety industry.
HYUNDAI/KIA, HONDA
Hyundai/Kia has been our fastest growing customer. Only five years ago, Hyundai/Kia accounted for 4% of our sales compared to 9% in 2012. Honda has grown during the last ten years and account now for more than 6% of our sales.
The reasons for this growth are both the success of these customers in the global LVP market and our long-term investments in their home markets, South Korea and Japan. These investments include the acquisition in 2009-2010 of Delphi’s assets in passive safety in South Korea.
FIAT/CHRYSLER, PEUGEOT/CITROËN
We have always had a relatively strong position with Chrysler and PSA, which is the owner of Peugeot and Citroën. Chrysler is an important customer for both our active and passive safety systems.
Our dependence on PSA has declined; both as a reflection of our lower market share with them and their lower share of the global LVP market.
For historical reasons, Fiat has not been a strong Autoliv customer within Italy. However, we are making inroads with Fiat, as we already are an important supplier to them in Turkey and have good possibilities to support them in Latin America.
CUSTOMER SALES TRENDS
Asian vehicle producers (including the Japanese)have steadily increased their importance to Autoliv. They now account for 35% of Autoliv’s global sales compared to less than 20% ten years ago. This reflects both their increasing share of the global LVP and our increasing share with them.
General Motors, Ford and Chrysler now account for 32% of our global sales, approximately the same as in 2002, after a decline to 23% in 2008. This swing primarily reflects their “come back” after the crisis in 2008-09 and our acquisition of Delphi’s passive safety assets.
Our high dependence on European and other customers has decreased significantly; from around 45% of sales in 2002 to 33% in 2012.
Therefore, our sales have become much more balanced than ten years ago.
Customer World’s Firsts with Autoliv
By being at the forefront of technology, by crash-testing more vehicles than any other safety company and by working as a development partner for new vehicles, Autoliv assists vehicle manufacturers not only to meet the evolving safety trends but also exploit the trends and become trend leaders. Over the years, we have contributed to:
Volvo becoming the first company in the world to introduce side airbags (1994),
Kia becoming the first company to offer knee airbags (1995),
BMW becoming the first company with side airbags for head protection (1997),
Volvo and Mercedes becoming the first companies, with side curtain airbags (1998),
Fordbecoming the first company to integrate the gyro-rollover sensor into the airbag ECU (2002),
Renault becoming the first company to receive the highest safety rating (i.e. five stars) in the EuroNCAP’s crash tests (the Laguna 2002),
BMW becoming the first company with seatbelts with adaptive load limiters (2002),
Jaguar becoming the first company with a pedestrian protection pop-up hood (2005),
Chryslerbecoming the first company with a Safety-Vent airbag (2006),
Renaultbecoming the first company with an Adaptive Multi-Volume Cushion airbag (2007),
Ford becoming the first company to integrate the inertia motion control ECU into the airbag Electronic Control Unit (ECU) (2008),
BMW becoming the first company with pedestrian warning (2009),
Volvo becoming the first company to introduce an external pedestrian protection airbag (2012).
Major Launches 2012
Illustrated below are the most significant model launches for us by our customers in 2012. A delivery contract is typically for the lifetime of a vehicle model, which is normally between 3 and 7 years.
None of our customer contracts account for more than 5% of our global sales.
Focus on Cost Control
Through our effective total cost management in manufacturing and purchasing we create customer and shareholder value.
OUR MAIN TARGETS for cost efficiency are to:
Reduce direct material costs at the same rate as our market prices decline, i.e. by at least 3% annually.
Consolidate the supply base by reducing the number of suppliers to optimize it in size, geography, service and knowledge.
Focus 90% of purchasing value to preferred suppliers.
Improve labor productivity by at least 5% per year.
REDUCE IMPACT OF RAW MATERIAL PRICES
Approximately half of our revenues are spent on direct materials (DM) from external suppliers. The raw material content in these components costs currently represents 51% of the direct material cost, while the other 49% represents the value added by our supply base (for more details on dependence on raw materials and component costs, see page 51 in the Annual Report).
The raw material value portion of our sales has increased from 22% in 2008 to 27% in 2012, primarily due to increasing raw material prices. Our strategy to mitigate higher commodity prices is to develop new more cost-efficient designs and components than the existing ones, for instance, by replacing steel with reinforced plastics. This often reduces weight which is an important added advantage in the permanent pursuit for more fuel-efficient vehicles.
REDUCING OTHER COMPONENT COSTS
We also mitigate the effect of higher commodity prices by reducing – in cooperation with our suppliers – the value added portion of our component costs.
During the five-year period 2008-2012, these costs added in our supply chain have been cut from 30% of sales to 26%, thereby offsetting most of the above-mentioned negative effect from higher raw materials. This has been achieved by several actions and programs.
For instance, we have actively increased our level of component sourcing in low-cost countries (LCC) from 39% in 2008 to 48% in 2012 (and from 15% in 2004 when the program was initiated).
We have increased the level of components sourced from our long-term strategic suppliers from 70% in 2008 to 75% in 2012.
We are continuously consolidating purchase volumes to fewer suppliers to help them reduce their prices to us. For instance, in 2012, we managed to reduce the number of suppliers by nearly 7% after a steady increase in prior years. This increase was due to acquisitions and the need to add new suppliers in Asia and other LCC. We are now on track to reach our target of reducing the number of supplier groups to 1,000 by 2016 from a peak of 1,600 in 2011.
We also standardize products and components, and phase out older, more complex products with low volumes to help suppliers reduce their costs and, consequently, our prices.
Through the above-mentioned strategies we have met our direct material cost reduction target of at least 3% every year, except in 2008 and 2011 when, in particular, steel prices sky-rocketed. In 2012, the estimated net savings for direct materials was 3.9% and 2.1% in 2011.
LABOR PRODUCTIVITY IMPROVEMENTS
The second most important type of cost is wages, salaries and other labor costs. In 2012, these costs corresponded to 22.0% of sales, which was a reduction from 26.0% in 2008.
This reduction has been achieved by continuous productivity improvements, restructuring of operations and by expansion as well as movement of production to LCC.
We measure productivity improvements in manufacturing in LMPU (labor minutes per produced unit). This measure is often affected by shifts of production to LCC where typically more labor-intensive manufacturing processes are used and less automation than in HCC (although the productivity in individual LCC may improve rapidly). Despite this, we have achieved LMPU reductions of approximately 6% every year during the last five-year period. Consequently, we managed to reach our productivity improvement target of at least 5% per year, both when LVP dropped sharply during the crisis, and in 2012 when LVP was erratic and depressed in Western Europe.
Manufacturing in LCC could offer significant cost saving opportunities, since our average headcount cost in LCC is only 20% of the same cost in HCC for direct personnel. However, we already have 78% of our direct workers in LCC, and the offsetting costs required for producing in one country and selling in another (such as freight and duty costs) should also be considered in addition to the labor cost difference. Consequently, most of this savings potential has now been achieved. In spite of this, we expect our headcount to continue to increase more in LCC than in HCC as a reflection of the mix in the expected LVP growth. This mix trend should continue to have a favorable impact on our cost structure in the future.
In addition, through automation and introduction of new higher value-added products (for instance in active safety) we should continue to be competitive in HCC and thereby continue to support our customers with manufacturing close to their assembly plants in North America, Western Europe and Japan. Going forward we also foresee a higher degree of automation in LCC to compensate for increasing labor and component costs.
Quality Excellence
We can never lose sight of our primary goal to save lives, and our products never get a second chance. This is why we can never compromise on quality.
IN ADDITION TO OUR PRIMARY GOAL of saving lives, quality is a key to our financial performance, since quality excellence is critical for winning new orders, preventing recalls and maintaining low scrap rates. For all of these reasons, we are fully committed to providing quality products and services to all our customers.
This pursuit of excellence is a continuous improvement process, driven by our ability to anticipate and respond to the challenges of a rapidly changing automotive industry.
OUR QUALITY CULTURE
Although quality has always been paramount in the automotive industry, especially for safety products, vehicle manufacturers have become even more quality-focused with no tolerance for deviations.
This trend is likely to continue as more and more vehicle manufacturers apply these stricter quality requirements.
In response to this trend and to improve our own quality, we are driving a program called “Q5” for shaping a proactive quality culture of zero defects. It is called “Q5” because it addresses quality in five dimensions: customers, products, growth, behavior and suppliers.
The goal of Q5 is to firmly tie together quality with value within all our processes, for all our employees, thereby leading to the best value for all our customers.
We believe this will advance our leadership position even further in automotive safety. When we get our customers’ acknowledgement and confirmation that our products and services are superior to anything else on the market, we know we are well on our way to reaching our goal.
FLAWLESS PRODUCTS AND DELIVERIES
In our pursuit of excellence we have developed a chain of four “defense lines” against quality issues that consist of 1) robust product designs, 2) flawless components from suppliers and our own in-house component companies, 3) manufacturing of flawless products and 4) implementing systems for verifying that our products conform with specifications and an advanced traceability system in the event of a recall. These “defense lines”, in combination with our Q5 behaviors, should ensure deliveries of flawless products on-time to our customers.
When quality deviations occur, they very rarely affect the protection provided by our products. Virtually all deviations are, instead, due to other requirements, such as flawless labeling, precise delivery of the right parts at the right moment, as well as correct color nuance and surface texture on steering wheels and other products where the look and feel is important to the car buyer.
OUR QUALITY PERFORMANCE
In our product conformity verifications, we register all deviations and include them in our quality measure, which is “parts per million” (ppm). Our target used to be less than 10 ppm. We have successfully reduced our actual ppm levels over the last several years. In 2011, we therefore tightened our goal to “not more than three products rejected by customers for every million parts delivered” (3 ppm). To illustrate how rigorous this new target is, it could be compared to not having a single rainy day in 912 years, i.e. since the year 1100.
Additionally, as we always challenge ourselves to even better performance, we introduced in 2010 a new quality measure—the number of non-conforming events—since one single quality issue affecting a high-volume vehicle model could result in the same ppm-figure as a much larger number of quality issues, affecting vehicle models that are only produced in low volumes.
This new, tougher, measure of the number of non-conforming events has improved since 2010 despite higher sales. This is an other step in our pursuit for the ultimate goal of zero defects.
SUPPLY BASE QUALITY IMPROVEMENTS
In our pursuit of zero defects, it is critical to prevent non-conforming components from entering our manufacturing plants. This is one of the most important “lines of defense” against quality issues.
With the Autoliv Sourcing and Purchasing Process (ASPP) we have a common way of working together with our suppliers. This strengthens our performance by working very closely with our suppliers, and set clear demands. An important part of ASPP is the early involvement of suppliers in projects to ensure robust component designs and lowest cost for function.
All requirements, policies and procedures for the collaboration between us and our suppliers are specified in the Autoliv Supplier Manual (ASM). As part of the qualification of suppliers they are required to sign and accept the ASM. The ASM has a strong focus on quality, ranging from the supplier pre-qualification requirements, through supplier development and component quality assurance, to regular supplier status reviews. It also encourages suppliers to maintain continuous improvement programs.
Suppliers are trained to comply with the ASM and all suppliers are rated in terms of quality and delivery performance on a monthly basis. The focus on quality in managing our supply base is necessary not only to ensure flawless parts but also to improve efficiency and cost in our operations.
Our Continuous Proactive Quality Work
1. PRODUCT DEVELOPMENT
Autoliv’s Product Development System (APDS) ensures that all new products pass five mandatory checkpoints: 1) project planning, 2) concept definition, 3) product and process development, 4) product and process validation and 5) product launch. In this way, we proactively prevent problems and ensure we deliver only the best designs to the market.
2. SUPPLY BASE
By involving our suppliers early in projects and by training them we ensure robust component designs and processes. This prevents non-conforming parts from being produced by our in-house and external suppliers and reaching our manufacturing lines.
3. PRODUCTION SYSTEM
Through the Autoliv Production System (APS), all our employees work according to the continuous improvement philosophy. Our associates are also trained to react to anomalies and to understand the critical connection between themselves and our lifesaving products.
4. MISTAKE PROOFING
Through the Autoliv Quality System we verify flawless quality by using mistake-proofing methods such as Poka-Yoke, in-line inspections, and cameras and sensors to prevent us from delivering non-conforming products. We also maintain an advanced product traceability system.
WE ALSO USE OUR Q5 PRINCIPLES AND BEHAVIORS WHICH MEANS THAT:
| | • | | we encourage our employees to take proactive actions to prevent potential problems before they occur, |
| | • | | we give our employees at all levels the authority to stop production to signal a quality issue and to find the root cause, |
| | • | | we quickly share all issues with all other appropriate and relevant teams and groups in Autoliv (Yokoten). |
Value-Creating Cash Flow
By creating customer satisfaction, maintaining tight cost control and developing new products, we generate cash for long-term growth, financial stability and competitive returns to our shareholders.
AUTOLIV HAS ALWAYS had a strong focus on cash flow and cash generation. Operating cash flow has always exceeded capital expenditures.
On average, operations have generated $695 million in cash per year over the last five years, while our capital expenditures, net have averaged $270 million.
CAPITAL EFFICIENCY IMPROVEMENTS
Autoliv’s strong cash flow reflects both the Company’s earnings performance and improvements in capital efficiency. During 2008-2012, when we increased sales by 28%, the average annual capital employed had to be increased by only 1%. Therefore, Autoliv’s capital turnover rate improved by more than 25% to 2.4 times. Whether this trend will continue or not will depend on two conflicting trends.
On one hand, the trend will be driven by continued organic sales growth. Our market is expected to grow at a rate of 5% per year. Consequently, we should be able to grow our sales and revenues without acquisitions that increase goodwill and intangibles (although we want to do acquisitions as a means of accelerating growth). During the last five years, goodwill and other intangibles even declined slightly. This was a major reason for the improving capital turnover rate and strong cash flow from 2008 to 2012.
On the other hand, property, plant and equipment (PPE) is likely to grow faster than sales, despite our utilization improvement strategies. This has been the trend since a trough in 2010 and reflects the fact that capital expenditures are likely to continue to exceed depreciation and amortization due to the need for additional manufacturing capacity in response to the growth of our market and sales. Our strategy for improving Autoliv’s fixed asset utilization rate include plant consolidations, expansion in low-cost countries (where less capital-intensive manufacturing processes can be used) and simplification of manufacturing processes.
We will also need additional cash for working capital to support the expected organic sales growth. However, we should still meet our policy that working capital should remain below 10% of sales. At the end of 2012, this ratio was 7.0%.
In summary, we still expect to generate a strong cash flow, albeit we may not be able to continue to improve Autoliv’s capital turnover rate.
OUR CASH FLOW MODEL
When analyzing how to best use each year’s cash flows from operations, Autoliv’s Board uses the model depicted to the right. To identify shareholder value, the model takes all important variables into account such as the marginal cost of borrowing, the return on marginal investments and the price of Autoliv shares. When evaluating the various uses of cash, the Board weighs these decisions against the need for flexibility due to the cyclical nature of the automotive industry.
INVESTING IN OPERATIONS
To create long-term shareholder value, cash flow from operations should only be used to finance investments in operations until the point when the return on investment no longer exceeds the cost of capital. In Autoliv’s case, our historic cost of capital has been approximately 12% before taxes. Autoliv’s return on capital employed has always exceeded this level, except during the financial crisis in 2008-2009. During the last three years, return on capital employed has varied between 21% and 28%, i.e. approximately twice the level of cost of capital.
Consequently, in 2012, $360 million was re-invested in the form of capital expenditures. This was more than 50% of the year’s operating cash flow of $689 million. It was also 32% more than depreciation and amortization due to our strong order intake and need for additional manufacturing capacity, primarily in Asia and other growth markets. Another reason for capital expenditures exceeding depreciation is our strategy to increase vertical integration (i.e. the level of in-house component sourcing) as a means to offset the continuous price erosion in our industry.
ACQUISITIONS
In order to accelerate the Company’s growth, we typically use some of the generated cash flow for acquisitions. However, in 2012, there were no major acquisitions but instead a divestiture of a non-core business. As a result, the net of acquisitions and divestitures was a release of cash of $3 million. This is not indicative of our expected long-term need of cash for acquisitions or our historical acquisition rate. During the prior four years, we made acquisitions totaling $255 million.
These acquisitions were made to consolidate our industry, increase our vertical integration and expand into new markets. For instance, during the crisis, we acquired the passive safety assets of Delphi which added annual sales of more than half a billion dollars (for a purchase price of $115 million). We integrated our steel component company Norma by buying the outstanding shares in the subsidiary, and we expanded into a new market by acquiring Tyco’s radar business, which now is one of our core areas in active safety.
SHAREHOLDER RETURNS
In 2012, $178 million of the year’s cash flow was used to pay dividends to shareholders. This corresponds to 54% of the “free cash flow” of $329 million, i.e. cash flow after capital expenditures.
The total dividend paid in 2012 was an increase of 15% from the 2011 level and reflects the strategy of the Board that Autoliv should have an attractive dividend and dividend yield. Historically, the dividend has represented a yield of 2-3% in relation to the Autoliv share price. During 2012, this yield was 3.1% in relation to the average price of the Autoliv stock. After the latest dividend increase to 50 cents per share, the annualized run rate of $191 million is 54% higher than the highest amount paid before the crisis in 2008-2009.
In 2009, the Company suspended dividend payments until the third quarter of 2010.
We also have the possibility to return funds to shareholders using share repurchases, although we have not used this possibility since September 15, 2008 when the financial crisis began. By using the remainder of our existing mandate, 3.2 million Company shares could be repurchased.
Repurchases of shares could create more value for shareholders than dividends, if the share price appreciates long-term. For Autoliv this has been the case as the Company’s existing 7.3 million treasury shares have been repurchased at an average cost of $42.93 per share, while the closing price in 2012 was $67.39 per share. This represents an appreciation of 57%.
DIVIDEND POLICY
Since Autoliv has historically used both dividend payments and share buybacks to create shareholder value, the Company has no set dividend policy.
Instead, the Board of Directors regularly analyzes which method is most efficient, at each instance, to create shareholder value.
CHANGE IN DEBT
In 2012, we also made some changes in the long-term debt structure of Autoliv. A $110 million note at 5.6% fixed interest rate that became due was repaid. Half of this amount was replaced by a new 5-year SEK denominated note at only 2.5% fixed interest rate. The other half of the repayment was from cash to improve Autoliv’s capital efficiency as we believe it is important for every company to have an efficient capital structure.
Our debt policies are to have a leverage ratio significantly below 3.0 and an interest coverage ratio significantly above 2.75 (for definitions, see page 54 in the Annual Report). Except for 2009 and the first quarter 2010, the Company has been in compliance with its financial policies. We also want Autoliv to have a long-term credit rating that is a “strong investment grade”. During the financial crisis, Standard and Poor’s reduced its credit rating for Autoliv to “BBB- with a negative outlook”. Since July 2010, the rating has been “BBB+ with a stable outlook”, in line with our policy.
Currently, Autoliv’s financial position is stronger than we deem necessary for the long term. This is for three reasons:
First, to have adequate resources for acquisitions. Second, there is still a significant uncertainty associated with the macroeconomic outlook, especially in Europe. Third, the antitrust investigations of the automotive supplier industry are still ongoing (see page 43 in the Annual Report) and the financial impact on Autoliv is not yet possible to estimate.
Given the fact that the Company may need cash for all three of these purposes within a relatively short time span and given that the amounts needed for each one of them are not estimable, we deem it prudent to maintain, for the time being, a high level of financial flexibility until more transparency has been obtained regarding the outcome of these events.
Share Performance and Shareholder Information
The Autoliv stock recorded a 26% increase in 2012 and outperformed both the S&P 500 and the S&P Auto Components indices.
SHARE PERFORMANCE
On the primary market for the Autoliv securities, the NYSE, Autoliv’s stock increased by 26% during 2012 which compares favorably to the S&P 1500 Auto Components Index which decreased by 2% and the S&P 500 index which increased 13%.
From the beginning of 2008 to the end of 2012, Autoliv’s share price increased by 29%. This performance of the Autoliv share compares favorably to the peer group as the S&P 1500 Auto Components index decreased by 12% during the same period and a decrease of 1% for the S&P 500 Index.
The average daily trading volume in Autoliv shares on the NYSE decreased by 39% to 201,323 in 2012 from 330,494 in 2011.
STOCKHOLM
In Stockholm, the price of Autoliv Swedish Depository Receipts (SDR) increased by 16% to 432.50 SEK during 2012 compared to a 12% increase in the OMX All Share Index and a 9% increase in the OMX Automotive Index in Sweden.
In Stockholm, the average daily trading volume in Autoliv shares decreased by 32% to 290,355 in 2012 from 428,054 in 2011. In 2012, the Autoliv SDR was the 28th most traded security in Stockholm. Of the total exchange trading, the Autoliv stock accounted for 1.0% in 2012 as compared to 1.3% during 2011.
In Stockholm, Autoliv’s SDRs are traded on the stock exchange’s list for large market cap companies.
NUMBER OF SHARES
During 2012, the number of shares outstanding increased by 6.2 million to 95.5 million at year end. The number of shares outstanding increased mainly due to the settlement of the remaining equity units on April 30, 2012. This increased the number of shares outstanding by approximately 5.8 million (see Note 13 in the Annual Report).
The weighted average number of shares outstanding for the full year 2012, assuming dilution, increased to 95.1 million from 93.7 million in 2011.
Stock options, if exercised, and granted Restricted Stock Units (RSUs) could increase the number of shares outstanding by 1,012,230 and 211,618, respectively, which would be a 1.3% increase in the current number of shares outstanding.
In November 2007, the Board of Directors authorized a fourth Share Repurchase Program for up to 7.5 million of the Company’s shares. On December 31, 2012, 3.2 million shares remained of this mandate for repurchase. On December 31, 2012, the Company had 7.3 million treasury shares.
NUMBER OF SHAREHOLDERS
Autoliv estimates that the total number of beneficial Autoliv owners on December 31, 2012 to be close to 70,000 and that one third of the Autoliv securities were held in the U.S. and approximately 58% in Sweden. Most of the remaining Autoliv securities were held in the U.K., Central Europe, Japan and Canada.
On December 31, 2012, Autoliv’s U.S. stock registrar had close to 2,300 holders of Autoliv stock, and according to our transfer agent, there were nearly 44,000 beneficial holders that held Autoliv shares in a “street name” through a bank, broker or other nominee.
According to the depository bank in Sweden, there were close to 19,000 record holders of record of the Autoliv SDRs and according to the Swedish soliciting agent nearly 3,400 “street names” of the SDRs. Many of these holders are nominees for other, non-Swedish nominees.
The largest shareholders known to the Company are shown in the table below.
STOCK INCENTIVE PLAN
Under the Autoliv, Inc. 1997 Stock Incentive Plan adopted by the shareholders and as further amended, awards have been made to selected executive officers of the Company and other key employees in the form of stock options and RSUs.
All options are granted for ten-year terms, have an exercise price equal to the fair market value of the share at the date of the grant, and become exercisable after one year of continued employment following the grant date.
Each RSU represents a promise to transfer one of the Company’s shares to the employee after three years of service following the date of grant or upon retirement (see Note 15 in the Annual Report).
Autoliv has adopted a Stock Ownership Policy for Executives requiring the Company’s CEO to accumulate and hold Autoliv shares having a value of twice his annual base salary. For other executives, the minimum requirement is a holding equal to each executive’s annual base salary.
DIVIDENDS
If declared by the Board, quarterly dividends are usually paid on the first Thursday in the last month of each quarter. The record date is typically two weeks before the payment day and the ex-date (when the stock trades without the right to the dividend) typically two days before the record date.
Quarterly dividends are declared separately by the Board, announced in press releases and published on Autoliv’s corporate website.
For the Preliminary Dividend Plan 2013, refer to page 88 in the Annual Report.
ANNUAL GENERAL MEETING
Autoliv’s next Annual General Meeting of Stockholders will be held on, May 7, 2013, at the Ritz-Carlton Hotel 160 East Pearson Street, Chicago, Illinois, 60611-2308, USA. Stockholders are encouraged to vote on the Internet regardless of whether they plan to attend the meeting.
PUBLIC INFORMATION DISCLOSURE
We report significant events to shareholders, analysts, media and interested members of the public in a timely and transparent manner and give all constituencies the information simultaneously.
All relevant public information is reported objectively. Information communicated by Investor Relations is authorized by management.
| | |
2013 FINANCIAL CALENDAR |
DATE | | EVENT |
| April 26, 2013 | | Q1 Report |
| May 7, 2013 | | Shareholder AGM |
| July 19, 2013 | | Q2 Report |
| October 24, 2013 | | Q3 Report |
| | | | |
KEY STOCK PRICE DATA |
New York | | Price ($) | | Date |
| Opening | | 55.69 | | Jan 3, 2012 |
| Year high | | 69.61 | | Mar 16, 2012 |
| Year low | | 51.31 | | Jun 26, 2012 |
| Closing | | 67.39 | | Dec 31, 2012 |
| All-time high | | 83.86 | | Jan 12, 2011 |
| All-time low | | 12.01 | | Mar 6, 2009 |
| | |
Stockholm | | Price (SEK) | | Date |
| Opening | | 371.10 | | Jan 2, 2012 |
| Year high | | 472.30 | | Mar 15, 2012 |
| Year low | | 358.50 | | Jul 26, 2012 |
| Closing | | 432.50 | | Dec 28, 2012 |
| All-time high | | 569.00 | | Jan 12, 2011 |
| All-time low | | 113.25 | | Mar 9, 2009 |
| | | | |
THE LARGEST SHAREHOLDERS |
% | | No. of Shares | | Holder Name1) |
| 9.6 | | 9,139,000 | | Alecta Pension Insurance Mutual |
7.1 | | 6,771,695 | | AMF Pensionforsakring AB |
| 4.2 | | 4,056,076 | | Nordea Investment Manager |
| 4.0 | | 3,790,119 | | Swedbank Robur Fonder AB |
| 3.6 | | 3,462,167 | | Vanguard Group |
| 0.6 | | 618,716 | | Management/Directors as a group2) |
| 100.0 | | 95,493,456 | | Total December 31, 2012 |
| 1) | Known to the Company, out of approximately 70,000 shareholders. 2) As of February 20, 2013. Includes 354,537 shares issuable upon exercise of options that are exercisable within 60 days. |
| | |
| ANALYSTS (29) |
| |
| US (11) | | |
| BUCKINGHAM RESEARCH | | Joseph Amaturo |
| DEUTSCHE BANK | | Rod Lache |
| GABELLI & CO. | | Brian Sponheimer |
| GUGGENHEIM PARTNERS | | Matthew Stover |
| JP MORGAN | | Ryan Brinkman |
| JEFFERIES | | Peter Nesvold |
| KEY BANC | | Brett Hoselton |
| |
| MORGAN STANLEY | | Ravi Shanker |
| RW BAIRD | | David Leiker |
| SIDOTI & CO, LLC | | Adam Brooks |
| |
| SWEDEN (9) | | |
| ABG SUNDAL COLLIER | | Erik Pettersson |
| CARNEGIE | | Agnieszka Vilela |
| DANSKE BANK | | Björn Enarson |
| HANDELSBANKEN | | Hampus Engellau |
| NORDEA EQUITIES | | Andreas Koski |
| PARETO OHMAN | | David Jacobson |
| PENSER | | Johan Dahl |
| SEB ENSKILDA SECURITIES | | Anders Trapp |
| SWEDBANK | | Fredrik Nilhov |
| |
| UK (4) | | |
| CITIGROUP | | Philip Watkins |
| CREDIT SUISSE | | George Galliers |
| GOLDMAN SACHS | | Stephan Puetter |
| UBS WARBURG | | David Lesne |
| |
| FRANCE (3) | | |
| CHEUVREUX | | Thomas Besson |
| CM-CIC SECURITIES | | Florent Couvreur |
| SOCIETE GENERALE | | Philippe Barrier |
| |
| JAPAN (1) | | |
| DAIWA SECURITIES | | Takuo Katayawa |
| |
NORWAY (1) DNB | | Christer Magnergard |
| | | | | | | | | | | | | | | | | | | | | | | | | | | | | | | | |
SHARE PRICE AND DIVIDENDS | |
| | | New York (US$) | | | Stockholm (SEK) | | | Dividend | | | Dividend | |
PERIOD | | High | | | Low | | | Close | | | High | | | Low | | | Close | | | declared | | | paid | |
Q1 2012 | | | 69.61 | | | | 54.98 | | | | 67.05 | | | | 472.30 | | | | 371.10 | | | | 442.50 | | | $ | 0.47 | | | $ | 0.45 | |
Q2 2012 | | | 69.44 | | | | 51.31 | | | | 54.66 | | | | 458.20 | | | | 364.00 | | | | 379.30 | | | $ | 0.47 | | | $ | 0.47 | |
Q3 2012 | | | 66.62 | | | | 51.63 | | | | 61.97 | | | | 439.00 | | | | 358.50 | | | | 404.70 | | | $ | 0.50 | | | $ | 0.47 | |
Q4 2012 | | | 67.58 | | | | 54.72 | | | | 67.39 | | | | 432.50 | | | | 371.00 | | | | 432.50 | | | $ | 0.50 | | | $ | 0.50 | |
Q1 2011 | | | 83.86 | | | | 67.32 | | | | 74.23 | | | | 569.00 | | | | 419.00 | | | | 465.00 | | | $ | 0.43 | | | $ | 0.40 | |
Q2 2011 | | | 81.08 | | | | 68.06 | | | | 78.45 | | | | 502.50 | | | | 428.30 | | | | 499.90 | | | $ | 0.45 | | | $ | 0.43 | |
Q3 2011 | | | 80.05 | | | | 46.06 | | | | 48.50 | | | | 505.00 | | | | 303.90 | | | | 336.80 | | | $ | 0.45 | | | $ | 0.45 | |
Q4 2011 | | | 60.46 | | | | 44.38 | | | | 53.49 | | | | 393.00 | | | | 310.00 | | | | 374.20 | | | $ | 0.45 | | | $ | 0.45 | |
Content Financials
| | | | |
PAGE1) | | | | |
| 39 | | Management’s Discussion and Analysis |
| 55 | | Management’s Report on Internal Control over Financial Reporting |
| 56 | | Consolidated Statements of Net Income |
| 56 | | Consolidated Statements of Comprehensive Income |
| 57 | | Consolidated Balance Sheets |
| 58 | | Consolidated Statements of Cash Flows |
| 59 | | Consolidated Statements of Total Equity |
| |
PAGE1) | | NOTES TO CONSOLIDATED FINANCIAL STATEMENTS |
| | |
| 60 | | Note 1 | | Summary of Significant Accounting Policies |
| 63 | | Note 2 | | Business Combinations |
| 63 | | Note 3 | | Fair Value Measurements |
| 66 | | Note 4 | | Income Taxes |
| 67 | | Note 5 | | Receivables |
| 68 | | Note 6 | | Inventories |
| 68 | | Note 7 | | Investments and Other Non-current Assets |
| 68 | | Note 8 | | Property, Plant & Equipment |
| 68 | | Note 9 | | Goodwill and Intangible Assets |
| 69 | | Note 10 | | Restructuring and Other Liabilities |
| 70 | | Note 11 | | Product Related Liabilities |
| 70 | | Note 12 | | Debt and Credit Agreements |
| 71 | | Note 13 | | Shareholders’ Equity |
| 72 | | Note 14 | | Supplemental Cash Flow Information |
| 73 | | Note 15 | | Stock Incentive Plan |
| 74 | | Note 16 | | Contingent Liabilities |
| 75 | | Note 17 | | Lease Commitments |
| 76 | | Note 18 | | Retirement Plans |
| 80 | | Note 19 | | Segment Information |
| 80 | | Note 20 | | Earnings Per Share |
| 80 | | Note 21 | | Subsequent Events |
| 81 | | Note 22 | | Quarterly Financial Data (unaudited) |
| 82 | | | | Auditor’s Reports |
Important Trends
Autoliv, Inc. (the “Company”) provides advanced technology products for the automotive market. In the three-year period from 2010-2012 (the time period required by the SEC to be reviewed in this analysis), a number of factors have influenced the Company’s operations. The most notable factors have been:
| | • | | Significant changes in global light vehicle production (LVP) |
| | • | | Capacity alignment requirements |
| | • | | Rapid growth of active safety market |
| | • | | Continued pricing pressure |
| | • | | Building a proactive balance sheet |
| | | | | | | | | | | | | | | | | | | | | | | | |
| | | 20121) | | | 2011 | | | 2010 | |
YEARS ENDED DEC. 31 (DOLLARS IN MILLIONS, EXCEPT EPS) | | Reported | | | % change | | | Reported | | | % change | | | Reported | | | % change | |
Global light vehicle production (in thousands) | | | 79,722 | | | | 7 | | | | 74,813 | | | | 4 | | | | 72,275 | | | | 25 | |
Consolidated net sales | | $ | 8,267 | | | | 0 | | | $ | 8,232 | | | | 15 | | | $ | 7,171 | | | | 40 | |
Operating income | | $ | 705 | | | | (21 | ) | | $ | 889 | | | | 2 | | | $ | 869 | | | | 1,159 | |
Operating margin, % | | | 8.5 | | | | (2.3 | ) | | | 10.8 | | | | (1.3 | ) | | | 12.1 | | | | 10.8 | |
Net income attributable to controlling interest | | $ | 483 | | | | (22 | ) | | $ | 623 | | | | 5 | | | $ | 591 | | | | 5,810 | |
Net margin, % | | | 5.8 | | | | (1.8 | ) | | | 7.6 | | | | (0.6 | ) | | | 8.2 | | | | 8.0 | |
Earnings per share, EPS | | $ | 5.08 | | | | (24 | ) | | $ | 6.65 | | | | 4 | | | $ | 6.39 | | | | 5,225 | |
Return on capital employed, % | | | 21.3 | | | | (6.2 | ) | | | 27.5 | | | | (0.7 | ) | | | 28.2 | | | | 26.0 | |
| 1) | Capacity alignment and antitrust investigations costs were unusually high in 2012, reducing operating income by $98 million and net income by $71 million, which reduced operating margin by 1.2% and net margin by 0.9%. The impact on earnings per share (EPS) was $0.74, while return on equity was reduced by 1.8%. In 2011 and 2010, the restructuring costs were consistent with levels before the 2008 crisis. See also table on page 41 “Items affecting comparability” and Notes 10 and 16 of the Notes to the Consolidated Financial Statements included herein. |
LVP AND MARKET SHIFTS
The most important driver for Autoliv’s sales is light vehicle production (LVP).
This growth driver has been very erratic. In 2010, LVP dramatically increased by 25% to a new all-time record of 72 million light vehicles (LVs) from an exceptionally low level of 58 million in 2009 due to the financial crisis. In 2011, LVP growth continued but only at a rate of 4% and then accelerated to a rate of nearly 7% in 2012 when LVP reached almost 80 million.
Virtually all markets contributed to global LVP growth, especially North America, China and the Rest of Asia region (RoA). In North America, LVP rose by 29% or 3.5 million LVs between 2010 and 2012, in China by 12% or 1.8 million LVs and in our Rest of Asia region (i.e. excluding China and Japan) by 19% or 2.0 million LVs. In contrast, in Western Europe, which is a very important market for automotive safety, LVP decreased by 4% or by 0.6 million LVs during the same three-year period due to an 8% drop in 2012 of more than one million LVs (after having increased by 0.4 million during 2011). Therefore, Europe’s share (both Western and Eastern Europe) of global LVP decreased from 26% in 2010 to 24% in 2012, while the other regions increased their respective share of global LVP. The Americas’ share increased from 22% to almost 25%, China’s share rose from 21% to 22% and the RoA region’s share advanced from 15% to nearly 16% in 2012. These market shifts have impacted our market – the global automotive safety market – as the average safety content per vehicles varies between the regions (see Safety Content per Vehicle below).
Within the three-year period, regional LVPs have also been inconsistent. In Japan, LVP dropped in 2011 by 14% due to the tsunami in March of that year, while LVP in Japan rebounded and increased in the subsequent year by 20%. There were also swings in Japanese LVP outside Japan due to component shortages caused by the tsunami. Similarly, the flooding in Thailand in 2011 caused Thai LVP to drop by 11% that year and, subsequently, to increase by 66% in 2012.
AUTOLIV IS BETTER BALANCED
Although Autoliv’s sales were affected by the short-term consequences of the Japanese tsunami and the Thai flooding, we have proactively adapted to the longer-term market changes between 2010 and 2012. This has been achieved through: 1) timely investments in growth markets, 2) early introduction and fast execution of our restructuring and capacity alignment activities (see below), and 3) acquisitions, including acquisitions of minority shares in joint ventures (to secure a higher portion of the growth of the joint ventures which often operate in the growth markets), see page 46 in the Annual Report.
We continue to, as we have for many years, strengthen Autoliv’s position globally with the Asian vehicle manufacturers. We have also made substantial investments in China, South Korea, India, Thailand and Indonesia, both in additional manufacturing capacity and in acquisitions (see below).
As a result, Autoliv now has a more balanced sales mix with 32% of sales in Europe, 35% in the Americas and 33% in Asia in 2012, compared to 38% in Europe and 31% in both the Americas and Asia in 2010. Our Chinese sales have expanded to 13% of total sales in 2012 from 11% in 2010, and sales in the RoA region have grown to 10% of sales in 2012 from less than 9% in 2010. This improved position in Asia is important as it not only provides a more diversified sales mix, but these markets are expected to experience the strongest growth during the next several years.
As a reflection of the recovery in North American LVP, Autoliv’s dependence on General Motors (GM), Ford and Chrysler has increased again after having declined for many years. In 2012, these customers accounted globally for 32% of our overall sales compared to 28% in 2010. In comparison, our dependence on Renault/Nissan and Peugeot/Citroen has declined to 15% combined from 18% in 2010, mainly due to these customers’ reliance on the depressed European market. Despite the weak European LVP, both BMW and Daimler have slightly increased their share of Autoliv’s sales (to 5% each). This is both due to their superior performance and to our successful introductions of active safety systems in BMW and Daimler vehicles (see below). However, the swings in our European customer sales mix have affected our capacity utilization and the profitability, of many of our European plants (see more below).
Asian vehicle manufacturers continued to account for 35% of our sales as in 2010, despite the fact that Hyundai/Kia grew to account for nearly 9% of our sales in 2012 from 7% in 2010. However, this was offset by lower dependence on Japanese vehicle manufacturers. For additional information on Autoliv’s dependence on certain customers and vehicle models, see page 52 in the Annual Report.
SAFETY CONTENT PER VEHICLE
The other growth driver of Autoliv’s market is the trend of vehicle manufacturers installing more airbags and other safety systems in their vehicles, generally when new models are introduced. Despite this positive worldwide trend, the average global content per LV of safety systems (airbags, seatbelts, steering wheels and related electronics, radar, night vision systems and cameras) remained relatively flat at around $300 during the period 2010-12. This is due to the fact that growth in global LVP is highly concentrated in markets such as China and India where the average safety content per vehicle is only approximately $200 and $60, respectively, which reduces the global average of safety content per vehicle. In addition, there is a negative effect from pricing pressure from vehicle manufacturers (see below).
However, the safety standards of vehicles are increasing in China, India and other growth markets, partially due to new regulations and crash test rating programs. For instance, Latin America introduced a rating program for crash performance of new vehicles in 2010. Brazil mandated frontal airbags in all new vehicles sold by 2014, while India is considering introducing a crash test rating program for new vehicles and has decided to up-grade its seatbelt regulations. Additionally, NHTSA upgraded the U.S. crash-test rating programs in 2010 and, in Europe, the Euro NCAP program will be upgraded between 2014 and 2017. All of these trends, in combination with the introduction of various active safety systems, should enable our market, i.e. the global automotive safety market, to grow at least in line with the global LVP during the next three years and, possibly, to grow faster than LVP when the safety content per vehicle in growth markets has improved.
TAKE-OFF OF NEW MARKET
In addition to our commitment to enhance passive safety, we are driving – mainly for the medium and upper-end vehicle models – the rapid expansion of the market for active safety systems. The market segments of active safety that we address grew by more than 30% during 2012 to more than one billion dollars and are expected to continue to grow rapidly.
To capitalize on this strong growth, we have increased our research, development and engineering (R,D&E) activities related to active safety. From the 2010-level, our overall R,D&E expense, net has been increased by 26% to $455 million, a significant portion of which is for active safety projects. As a result of these undertakings in R,D&E and as a result of our investments in additional manufacturing capacity, sales in active safety grew by 73% in 2010 to $85 million, by 89% in 2011 to $160 million and by 36% to $218 million in 2012 and are targeted to reach half a billion dollars by 2015.
In addition, Autoliv will enter another market within active safety, the $6 billion market for brake control systems. In 2011, we received our first order for this market. The order is for a new cost-efficient technology that could offer better performance in electronic stability control (ESC) for vehicles compared to many existing ESC-systems on the market. This order is expected to result in sales beginning in 2014.
CAPACITY ALIGNMENTS
In 2010, our operating margin reached an all-time record of 12.1% following our comprehensive restructuring programs in 2008 and 2009, while also expanding in growth markets such as China. Our restructuring actions generated estimated cost savings of $70 million in 2010 and $21 million in 2011.
In the latter year, operating margin fell to 10.8%, primarily due to a 1.2 percentage point negative effect from higher raw materials prices and a 0.4 negative effect from higher R,D&E expense, net. In 2012, operating margin declined to 8.5% due to a 1.0 percentage point (p.p.) negative effect from capacity alignment programs, a 1.1 p.p. negative effect mainly due to the depressed Western European market and a 0.2 p.p. negative effect from higher R,D&E expense, net. The capacity alignment programs are our response to the uneven capacity utilization in many of our European plants resulting from rapidly deteriorating and patchy Western European vehicle demand in 2012, especially for vehicle models in the volume market segments. As a reflection of this deteriorating trend during the year, the expected cost of capacity alignment programs was raised from initially “more than $50 million” at the beginning of 2012 to “in the range of $60-80 million” in April and to “the higher end of the range” by October. The capacity alignment cost ended up at $79 million. See also Note 10 to Consolidated Financial Statements included herein for further information on our restructuring activities.
Our capacity alignment program will be expanded into 2013, and we expect these costs to reach at least $25 million but not exceed $50 million for 2013. The current capacity alignment programs are expected to have a payback period of 2-3 years.
PRICE EROSION TRENDS
Pricing pressure is an inherent part of the automotive supplier business. The reductions in our market prices are generally higher on newer products with strong volume growth than on older products, where both the possibilities to re-design the product to reduce costs and market growth are less. The price reductions also depend on the business cycle. For the 2010-2012 period, we estimate the average reduction in our market prices to have been in the range of 2-4%. To meet these price reductions we have several programs and actions addressing every item in our cost structure.
For instance, to reduce costs for components from external suppliers, we are continuously increasing the level of components sourced in Low-Cost Countries (LCC), consolidating purchase volumes to fewer suppliers, improving productivity in our supply chain, standardizing components and redesigning our products (which also reduces weight and raw material content of our products in addition to reducing costs). However, in 2011, raw material prices rose so sharply that Autoliv’s commodity costs increased by nearly $100 million. In 2012, raw material inflation moderated, but commodity costs were still more than $100 million higher than in 2010. This was the main reason for our component costs to increase to 53.8% of sales in 2012, an increase of 1.9 p.p. from the 2010-level.
To reduce labor costs while offsetting the price erosion on our products, we continuously implement productivity improvement programs, expand in LCC and institute restructuring and capacity alignment activities. The productivity improvements in Autoliv’s manufacturing were approximately 6% for every year during the last three-year period. This is well in line with our productivity improvement target of at least 5% per year, which should be enough to both offset the price erosion from customers and provide for normal salary increases for Autoliv’s employees. The level of employees in the LCC has increased to 69% in 2012 from 63% in 2010. These changes in combination with our restructuring activities and several other actions were almost enough to offset the market price erosion during the three-year period. As a result, total labor costs in relation to sales were virtually unchanged at 22.0% in 2012 compared to 21.8% in 2010. This modest increase was due to the higher R,D&E expenses, net that rose to 5.5% of sales from 5.0% in 2010 as labor costs are by far the largest cost of our R,D&E expense.
ACQUISITIONS AND DIVESTITURES
During the three-year period, we have continued Autoliv’s strategy to grow through strategic acquisitions and to divest non-core operations. We focus on two primary growth areas with the greatest potential: active safety systems and growth markets.
In the wake of the global financial crisis of 2008-2009, we made several acquisitions to participate in a consolidation of the automotive safety industry. For instance, during 2009-2010, we acquired virtually all of Delphi’s assets for airbags, seatbelts and steering wheels. In 2010, we also acquired the outstanding 49% of the shares in our Estonian subsidiary Norma, which is the leading supplier in the Russian market. We also acquired the automotive radar business of Visteon.
In 2011, Autoliv acquired two technologies related to active safety: 1) Software from Hella for camera-based forward-looking systems such as Traffic Sign Recognition (TSR), Lane Detection (LD) and Light Source Recognition (LSR), and 2) a license from Astyx for its long-range radar that will supplement Autoliv’s existing short and medium range radar in Adaptive Cruise Control (ACC), Emergency Braking (EB) and Forward Collision-Warning (FCW). These acquisitions are expected to start to generate sales in 2014 and 2015, respectively.
BUILDING A PRO-ACTIVE BALANCE SHEET
Autoliv entered the three-year period 2010-2012 with a net debt on January 1, 2010 of $662 million. At the end of the period, on December 31, 2012, the Company had a net cash position of $361 million. This transformation reflects the Company’s strong cash flow.
Operations generated $924 million in cash in 2010, $758 million in 2011 and $689 million in 2012, while capital expenditures amounted to $224 million, $357 million and $360 million, respectively.
Due to this strong cash flow, dividend payments, which were suspended in the second quarter of 2009 due to the financial crisis, were resumed in the third quarter of 2010. The dividend was subsequently raised six times, so that the current annualized total dividend of $191 million is 54% higher than the highest dividend amount paid before the dividend suspension in 2009.
Furthermore, due to Autoliv’s strong balance sheet, the Company has been able to complete a number of strategic acquisitions. This has accelerated sales growth and increased the Company’s vertical integration and thereby saved costs. It also allowed Autoliv to pioneer the new market of active safety sensing technologies. These acquisitions totaled $166 million during the three year period 2010-2012.
The Company began to strengthen its financial position in order to have adequate resources for additional acquisitions. Subsequently, two additional reasons have emerged for maintaining a strong balance sheet. First, uncertainties surrounding the global macroeconomic outlook. Second, in 2011, the Company became subject to two antitrust investigations involving the automotive supplier industry (see page 43 in the Annual Report). Although the U.S. antitrust investigation with respect to Autoliv was resolved during 2012, the investigation in Europe is still ongoing. In addition, the Company has become subject to a number of antitrust class-action suits in the U.S. and Canada, and antitrust investigations in Canada and South Korea. It is currently not possible to estimate the costs for these investigations and legal disputes.
Given the fact that the Company may need funds for each of these reasons within a relatively short time span and given that the amount needed for each one of them could become substantial, we believe it is prudent to maintain, for the time being, a high level of financial flexibility until more transparency has been obtained regarding the outcome of these events.
| | | | | | | | | | | | | | | | | | | | | | | | |
ITEMS AFFECTING COMPARABILITY (Dollars in millions, except EPS) | | Reported | | | Effect of capacity alignment and antitrust
investigations | |
| | 2012 | | | 2011 | | | 2010 | | | 2012 | | | 2011 | | | 2010 | |
Operating income | | $ | 705 | | | $ | 889 | | | $ | 869 | | | $ | (98 | ) | | $ | (19 | ) | | $ | (21 | ) |
Operating margin, % | | | 8.5 | | | | 10.8 | | | | 12.1 | | | | (1.2 | ) | | | (0.2 | ) | | | (0.3 | ) |
Income before income taxes | | $ | 669 | | | $ | 828 | | | $ | 806 | | | $ | (98 | ) | | $ | (19 | ) | | $ | (21 | ) |
Net income | | $ | 486 | | | $ | 627 | | | $ | 595 | | | $ | (71 | ) | | $ | (14 | ) | | $ | (16 | ) |
Earnings per share | | $ | 5.08 | | | $ | 6.65 | | | $ | 6.39 | | | $ | (0.74 | ) | | $ | (0.15 | ) | | $ | (0.17 | ) |
Net cash provided by operating activities | | $ | 689 | | | $ | 758 | | | $ | 924 | | | $ | (50 | ) | | $ | (36 | ) | | $ | (66 | ) |
Outlook for 2013
During the first quarter of 2013, LVP in the important Western European market is expected to decline sharply year-over-year to levels not seen since the financial crisis in 2008-2009. As a result, Autoliv’s organic sales are expected to decline by 4% in the first quarter of 2013 compared to the same quarter of 2012. This forecast is based on our call-offs from customers. Provided that mid-January exchange rates prevail, a small positive currency effect will offset a negative effect from a minor divestiture in 2012. Consequently, consolidated sales are expected to decline in line with organic sales of 4% compared to the first quarter of 2012.
An operating margin of around 8% is expected for the first quarter, excluding costs for capacity alignments and the antitrust investigations.
For the full year 2013, our indication for organic sales growth is in the range of 1% to 3% and an operating margin of around 9%, excluding costs for capacity alignments and antitrust investigations. Currencies will have a positive effect of 1% on consolidated sales provided mid-January exchange rates prevail. Consequently, consolidated sales growth is expected to be in the range of 2-4%.
As earlier indicated, our capacity alignment program will be expanded into 2013, and we now expect these costs to reach at least $25 million but not to exceed $50 million for 2013.
The projected effective tax rate for the full year 2013, excluding discrete items, is expected to be around 27%.
Operations are expected to continue to generate a strong cash flow in the magnitude of $0.7 billion during 2013, while capital expenditures are expected to amount to approximately 4.5% of sales.
Non-U.S. GAAP Performance Measures
In this annual report, we sometimes refer to non-U.S. GAAP measures that we and securities analysts use in measuring Autoliv’s performance.
We believe that these measures assist investors in analyzing trends in the Company’s business for the reasons given below. Investors should not consider these non-U.S. GAAP measures as substitutes, but rather as additions to financial reporting measures prepared in accordance with U.S. GAAP.
These non-U.S. GAAP measures have been identified, as applicable, in each section of this annual report with tabular presentations on this page and page 54 in the Annual Report, reconciling them to U.S. GAAP.
It should be noted that these measures, as defined, may not be comparable to similarly titled measures used by other companies.
ORGANIC SALES
We analyze the Company’s sales trends and performance as changes in “organic sales growth”, because the Company currently generates approximately 75% of net sales in currencies other than the reporting currency (i.e. U.S. dollars) and currency rates have proven to be very volatile. We also use organic sales to reflect the fact that the Company has made several acquisitions and divestitures.
Organic sales present the increase or decrease in the overall U.S. dollar net sales on a comparable basis, allowing separate discussions of the impact of acquisitions/divestitures and exchange rates.
The tabular reconciliation below presents changes in “organic sales growth” as reconciled to the change in total U.S. GAAP net sales.
| | | | | | | | | | | | | | | | | | | | | | | | | | | | | | | | | | | | | | | | | | | | | | | | |
COMPONENTS IN SALES INCREASE/DECREASE (DOLLARS IN MILLIONS) | |
| | | Europe | | | Americas | | | Japan | | | China | | | RoA1) | | | Total | |
2012 VS. 2011 | | % | | | $ | | | % | | | $ | | | % | | | $ | | | % | | | $ | | | % | | | $ | | | % | | | $ | |
Organic change | | | (6.9 | ) | | $ | (214.6 | ) | | | 14.0 | | | $ | 357.7 | | | | 9.7 | | | $ | 73.8 | | | | 9.4 | | | $ | 92.8 | | | | 2.6 | | | $ | 22.0 | | | | 4.0 | | | $ | 331.7 | |
Currency effects | | | (7.1 | ) | | | (221.3 | ) | | | (1.8 | ) | | | (46.7 | ) | | | (0.2 | ) | | | (1.9 | ) | | | 2.4 | | | | 22.9 | | | | (3.1 | ) | | | (25.9 | ) | | | (3.3 | ) | | | (272.9 | ) |
Acquisitions/divestitures | | | (0.7 | ) | | | (21.5 | ) | | | — | | | | — | | | | — | | | | — | | | | — | | | | — | | | �� | (0.3 | ) | | | (3.0 | ) | | | (0.3 | ) | | | (24.5 | ) |
| | | | | | | | | | | | | | | | | | | | | | | | | | | | | | | | | | | | | | | | | | | | | | | | |
Reported change | | | (14.7 | ) | | $ | (457.4 | ) | | | 12.2 | | | $ | 311.0 | | | | 9.5 | | | $ | 71.9 | | | | 11.8 | | | $ | 115.7 | | | | (0.8 | ) | | $ | (6.9 | ) | | | 0.4 | | | $ | 34.3 | |
| | | | | | |
| | | Europe | | | Americas | | | Japan | | | China | | | RoA1) | | | Total | |
2011 VS. 2010 | | % | | | $ | | | % | | | $ | | | % | | | $ | | | % | | | $ | | | % | | | $ | | | % | | | $ | |
Organic change | | | 6.3 | | | $ | 173.8 | | | | 16.0 | | | $ | 351.3 | | | | (14.2 | ) | | $ | (112.7 | ) | | | 13.4 | | | $ | 108.8 | | | | 17.9 | | | $ | 109.7 | | | | 8.8 | | | $ | 630.9 | |
Currency effects | | | 5.8 | | | | 161.1 | | | | 0.6 | | | | 13.7 | | | | 10.2 | | | | 80.3 | | | | 4.8 | | | | 39.4 | | | | 4.2 | | | | 26.0 | | | | 4.5 | | | | 320.5 | |
Acquisitions/divestitures | | | 0.3 | | | | 8.4 | | | | — | | | | — | | | | — | | | | — | | | | 2.5 | | | | 20.5 | | | | 13.3 | | | | 81.5 | | | | 1.5 | | | | 110.4 | |
| | | | | | | | | | | | | | | | | | | | | | | | | | | | | | | | | | | | | | | | | | | | | | | | |
Reported change | | | 12.4 | | | $ | 343.3 | | | | 16.6 | | | $ | 365.0 | | | | (4.0 | ) | | $ | (32.4 | ) | | | 20.7 | | | $ | 168.7 | | | | 35.4 | | | $ | 217.2 | | | | 14.8 | | | $ | 1,061.8 | |
RECONCILIATION OF “OPERATING WORKING CAPITAL” TO U.S. GAAP MEASURE
(DOLLARS IN MILLIONS)
| | | | | | | | | | | | |
DECEMBER 31 | | 2012 | | | 2011 | | | 2010 | |
Total current assets | | $ | 3,289.2 | | | $ | 3,000.3 | | | $ | 2,688.6 | |
Total current liabilities | | | (1,849.8 | ) | | | (2,085.9 | ) | | | (1,834.5 | ) |
Working capital | | $ | 1,439.4 | | | $ | 914.4 | | | $ | 854.1 | |
Cash and cash equivalents | | | (977.7 | ) | | | (739.2 | ) | | | (587.7 | ) |
Short-term debt | | | 69.8 | | | | 302.8 | | | | 87.1 | |
Derivative (asset) and liability, current | | | 0.0 | | | | (4.0 | ) | | | (0.7 | ) |
Dividends payable | | | 47.7 | | | | 40.2 | | | | 35.6 | |
| | | | | | | | | | | | |
Operating working capital | | $ | 579.2 | | | $ | 514.2 | | | $ | 388.4 | |
RECONCILIATION OF “NET DEBT” TO U.S. GAAP MEASURE
(DOLLARS IN MILLIONS)
| | | | | | | | | | | | |
DECEMBER 31 | | 2012 | | | 2011 | | | 2010 | |
Short-term debt | | $ | 69.8 | | | $ | 302.8 | | | $ | 87.1 | |
Long-term debt | | | 562.9 | | | | 363.5 | | | | 637.7 | |
Total debt | | $ | 632.7 | | | $ | 666.3 | | | $ | 724.8 | |
Cash and cash equivalents | | | (977.7 | ) | | | (739.2 | ) | | | (587.7 | ) |
Debt-related derivatives | | | (15.8 | ) | | | (19.1 | ) | | | (10.0 | ) |
| | | | | | | | | | | | |
Net (cash) debt | | $ | (360.8 | ) | | $ | (92.0 | ) | | $ | 127.1 | |
OPERATING WORKING CAPITAL
Due to the need to optimize cash generation to create value for shareholders, management focuses on operating working capital as defined in the table above.
The reconciling items used to derive this measure are, by contrast, managed as part of our overall management of cash and debt, but they are not part of the responsibilities of day-to-day operations’ management.
NET DEBT
As part of efficiently managing the Company’s overall cost of funds, we routinely enter into “debt-related derivatives” (DRD) as part of our debt management.
Creditors and credit rating agencies use net debt (or cash) adjusted for DRD in their analyses of the Company’s debt (or cash) and therefore we provide this non-U.S. GAAP measure.
By adjusting for DRD, the total financial liability of net debt is disclosed without grossing it up with currency or interest fair values that are offset by DRD reported in other balance sheet captions.
Significant Litigation
GENERAL LITIGATION
In 2009, Autoliv initiated a closure of its Normandy Precision Components (“NPC”) plant located in France. Most of the former NPC-employees that were not “protected” (i.e. not union representatives) filed claims in a French court claiming damages in an aggregate amount of €12 million (approximately $16 million) and/or other remedies. In February 2012, the French court ruled in favor of plaintiffs in an aggregate amount of €5.6 million (approximately $7 million), while rejecting certain other claims. Both sides have appealed the decision as far as not in their favor. As required under French law, Autoliv has paid the €5.6 million award pending the appeal.
In May 2008, a French court placed Eric Molleux Technologies Composants (“EMT”) into receivership, and liquidation proceedings were initiated in July 2009. As a result of Autoliv’s previous relationship with EMT, in March 2012 the liquidator initiated proceedings against Autoliv France and requested payment of €16.3 million (approximately $22 million), which represents the total amount of debt owed by EMT to its creditors (including Autoliv). The liquidator also requested an additional €4 million (approximately $5 million) corresponding to the debts of Autoliv Turkey towards EMT. Autoliv disputes the claims.
ANTITRUST MATTERS
Authorities in several jurisdictions are currently conducting broad, and in some cases, long-running investigations of suspected anti-competitive behavior among parts suppliers in the global automotive vehicle industry. These investigations include, but are not limited to, segments in which the Company operates. In addition to pending matters, authorities of other countries with significant light vehicle manufacturing or sales may initiate similar investigations. It is the Company’s policy to cooperate with governmental investigations.
On February 8, 2011, a Company subsidiary received a grand jury subpoena from the Antitrust Division of the U.S. Department of Justice (“DOJ”) related to its investigation of anti-competitive behavior among suppliers of occupant safety systems. On June 6, 2012, the Company entered into a plea agreement with the DOJ and subsequently pled guilty to two counts of antitrust law violations involving a Japanese subsidiary and paid a fine of $14.5 million. Under the terms of the agreement the Company will continue to cooperate with the DOJ in its investigation of other suppliers, but the DOJ will not otherwise prosecute Autoliv or any of its subsidiaries, present or former directors, officers or employees for the matters investigated (the DOJ did reserve the option to prosecute three specific employees, none of whom is a member of the senior management of the Company).
On June 7-9, 2011, representatives of the European Commission (“EC”), the European antitrust authority, visited two facilities of a Company subsidiary in Germany to gather information for a similar investigation. The investigation is still pending and the Company remains unable to estimate the financial impact such investigation will have or predict the reporting periods in which such financial impact may be recorded and has consequently not recorded a provision for loss as of December 31, 2012. However, management has concluded that it is probable that the Company’s operating results and cash flows will be materially adversely impacted for the reporting periods in which the EC investigation is resolved or becomes estimable.
On October 3, 2012, the Company received a letter from the Competition Bureau of Canada related to the subjects investigated by the DOJ and EC, seeking the voluntary production of certain corporate records and information related to sales subject to Canadian jurisdiction. On November 6, 2012, the Korean Fair Trade Commission visited one of the Company’s South Korean subsidiaries to gather information for a similar investigation. The Company cannot predict the duration, scope or ultimate outcome of either of these investigations and is unable to estimate the financial impact they may have, or predict the reporting periods in which any such financial impacts may be recorded. Consequently, the Company has not recorded a provision for loss as of December 31, 2012 with respect to either of these investigations. Also, since the Company’s plea agreement with the DOJ, involved the actions of employees of a Japanese subsidiary, the Japan Fair Trade Commission is evaluating whether to initiate an investigation.
The Company is also subject to civil litigation alleging anti-competitive conduct. Notably, the Company, several of its subsidiaries and its competitors are defendants in a total of twelve purported antitrust class action lawsuits, eleven of which are pending in the United States District Court for the Eastern District of Michigan (Brad Zirulnik v. Autoliv, Inc. et al. filed on June 6, 2012; A1A Airport & Limousine Service, Inc. v. Autoliv, Inc. et al. and Frank Cosenza v. Autoliv, Inc. et al. each filed on June 8, 2012; Meetesh Shah v. Autoliv, Inc., et al. filed on June 12, 2012; Martens Cars of Washington, Inc., et al. v. Autoliv, Inc., et al. and Richard W. Keifer, Jr. v. Autoliv, Inc. et al. each filed on June 26, 2012; Findlay Industries, Inc. v. Autoliv, Inc. filed on July 12, 2012; Beam’s Industries, Inc. v. Autoliv, Inc., et al. filed on July 21, 2012; Melissa Barron et al. v. Autoliv, Inc. et al. filed on July 24, 2012; Stephanie Kaleuha Petras v. Autoliv, Inc. et al. filed on August 14, 2012; and Superstore Automotive, Inc. et al. v. Autoliv, Inc. et al. filed on November 1, 2012). The twelfth lawsuit is pending under Canadian law in the Ontario Superior Court of Justice in Canada (Sheridan Chevrolet Cadillac Ltd. et al. v. Autoliv Inc. et al., filed on January 18, 2013).
Plaintiffs in these cases generally allege that the defendants have engaged in long-running global conspiracies to fix the prices of occupant safety systems or components thereof in violation of various antitrust laws and unfair or deceptive trade practice statutes. Plaintiffs seek to recover, on behalf of themselves and various purported classes of direct and indirect purchasers of occupant safety systems and purchasers or lessees of vehicles in which such systems have been installed, injunctive relief, treble damages and attorneys’ fees. The plaintiffs in these cases make allegations that extend significantly beyond the specific admissions of the plea discussed above. The Company denies these overly broad allegations and intends to actively defend itself against the same. While it is probable that the Company will incur losses as a result of these cases, the duration or ultimate outcome of these cases currently cannot be predicted or estimated and no provision for a loss has been recorded as of December 31, 2012.
Year Ended December 31, 2012 Versus 2011
| | | | | | | | | | | | | | | | |
COMPONENT OF CHANGE IN NET SALES | | Airbag Products1) | | | Seatbelt Products2) | | | Active Safety | | | Total | |
Organic change | | | 2.9 | % | | | 4.3 | % | | | 38.3 | % | | | 4.0 | % |
Currency effects | | | (2.9 | )% | | | (4.3 | )% | | | (2.1 | )% | | | (3.3 | )% |
Acquisitions/divestitures | | | — | | | | (0.9 | )% | | | — | | | | (0.3 | )% |
| | | | | | | | | | | | | | | | |
Reported change | | | 0.0 | % | | | (0.9 | )% | | | 36.2 | % | | | 0.4 | % |
| 1) | Includes passive safety electronics, steering wheels, inflators and initiators; 2) Includes seat components until June 2012. |
NET SALES
Net sales for 2012 of $8,267 million were virtually flat compared to 2011 despite organic sales (non-U.S. GAAP measure, see page 42 in the Annual Report) growing by 4% or $332 million. Currency effects reduced sales by more than 3% or $273 million and divestitures by $24 million (see page 46 in the Annual Report).
The organic sales increase was 3 percentage points (p.p.) less than the 7% increase in global LVP primarily due to Autoliv’s (and the automotive safety market’s) higher dependence on the European market (in particular Western Europe where LVP declined by 8%) and the fact that the strongest increase in global LVP was in Japan where Autoliv’s market share is lower than in Europe. This negative effect was partially offset by a positive vehicle model mix primarily with Ford, General Motors and Chrysler in North America and strong performance in active safety and China.
Organic sales of airbag products rose by 3% to $5,392 million, mainly driven by strong LVP in North America along with Autoliv’s strong performance in side-impact airbags, higher market share for steering wheels and new business for knee airbags.
Organic sales of seatbelt products increased by 4% to $2,657 million despite the 5% LVP decline in the important European market. Seatbelt sales were driven by strong sales in Asia and North America and by the global trend towards more advanced and higher value-added seatbelt systems.
Sales of active safety systems rose by 38% organically to $218 million, mainly due to new radar business with Mercedes and General Motors along with new camera business with BMW.
In Europe, sales dropped by 15% to $2,645 million including negative currency effects of 7% and a small divestiture effect. Organic sales declined by 7%, which was 2 p.p. more than the decrease in European LVP due to a 8% decline in the important Western European LVP.
In the Americas, consolidated sales rose by 12% to $2,870 million, despite negative currency effects of 2%. The organic sales growth of 14% was slightly higher than the 13% increase in the region’s LVP driven by Autoliv’s strong performance with Honda, Ford and Chrysler.
In China, sales increased by 12% to $1,098 million including positive currency effects of 2%. The organic sales growth of 9% was 2 p.p. higher than the increase in China’s LVP, mainly due to vehicle launches such as Great Wall’s Haval H6.
In Japan, sales increased by 10% to $830 million. The organic sales increase was also 10%. This was 10 p.p. less than the increase in Japanese LVP, which reflects the fact that Autoliv had relatively little sales to the vehicle models whose production rebounded the most. It also reflects delays in model shifts of a few important vehicles.
In the Rest of Asia (RoA) sales decreased by 1% to $824 million due to currency effects and a small divestiture in 2011. The organic sales increase of 3% was 10 p.p. less than the growth in the region’s LVP. This was mainly due to a 2% LVP decline in the important South Korean market coupled with an unfavorable vehicle model mix.
GROSS PROFIT
Gross profit declined by 5%, or $82 million, to $1,646 million, primarily due to negative currency effects of $47 million. Gross margin declined to 19.9% from 21.0% in 2011 mainly due to the depressed Western European LVP.
OPERATING INCOME
Operating income declined by $184 million to $705 million and operating margin by 2.3 p.p. to 8.5% compared to 2011, primarily due to $79 million higher costs for capacity alignments and the antitrust investigations, which had a negative margin effect of 1.0 p.p. (see page 43 in the Annual Report).
Operating margin was also negatively affected by $14 million higher Research, Development and Engineering (R,D&E) expense, net, which reduced the margin by 0.2 percentage points. Higher R,D&E expense, net was primarily used for more active safety projects in response to strong order intake.
INTEREST EXPENSE, NET
Interest expense, net decreased by 33%, or $19 million, to $38 million compared to 2011. This reflects the remarketing in March of our senior notes due in 2014. This remarketing reduced Autoliv’s cost of borrowing by $11 million in 2012 (see page 48 in the Annual Report).
In addition, during 2012, Autoliv had a net cash position of $214 million on average, while the Company had a net debt during 2011 of $67 million on average (see Treasury Activities on page 48 in the Annual Report).
INCOME TAXES
Income before taxes decreased by $160 million to $669 million. This was $24 million less than the decline in operating income, primarily due to $19 million lower interest expense, net and by a debt extinguishment cost of $6 million in 2011.
Income tax expense was $183 million, including discrete tax items, net of $4 million that reduced the tax rate by 0.6 p.p. The effective tax rate was 27.4% compared to 24.3% for 2011, when discrete tax items reduced the rate by 3.0 p.p. See Note 4 to Consolidated Financial Statements included herein.
NET INCOME AND EARNINGS PER SHARE
Net income attributable to controlling interest declined by $140 million to $483 million, resulting in a net income margin of 5.8% compared to 7.6% in 2011.
Earnings per share assuming dilution declined by $1.57 to $5.08. In addition to the lower underlying operating profit, earnings per share was reduced by 60 cents due to higher costs for capacity alignments and the antitrust investigations, the higher effective tax rate had a negative effect of 22 cents, unfavorable currency translation effects had a negative impact of 13 cents and more shares outstanding had a negative impact of 8 cents. This was partially offset by 18 cents from lower interest expense, net.
The weighted average number of shares outstanding assuming dilution increased by 1% to 95.1 million.
Year Ended December 31, 2011 Versus 2010
| | | | | | | | | | | | | | | | |
COMPONENT OF CHANGE IN NET SALES | | Airbag Products1) | | | Seatbelt Products2) | | | Active Safety | | | Total | |
Organic change | | | 8.3 | % | | | 7.0 | % | | | 86.9 | % | | | 8.8 | % |
Currency effects | | | 4.4 | % | | | 4.7 | % | | | 2.1 | % | | | 4.5 | % |
Acquisitions/divestitures | | | 1.5 | % | | | 1.6 | % | | | — | | | | 1.5 | % |
| | | | | | | | | | | | | | | | |
Reported change | | | 14.2 | % | | | 13.3 | % | | | 89.0 | % | | | 14.8 | % |
| 1) | Includes passive safety electronics, steering wheels, inflators and initiators; 2) Includes seat components |
NET SALES
Net sales for 2011 increased by 15%, or $1,061 million, to $8,232 million, primarily due to a 9%, or $631 million, increase in organic sales (non-U.S. GAAP measure, see page 42 in the Annual Report). Currency effects increased sales by $321 million, or more than 4%, and acquisitions by nearly 2%, or $110 million (see page 46 in the Annual Report).
The organic sales increase of 9% was 6 percentage points (p.p.) more than the increase in global LVP. This was mainly due to Autoliv’s strong performance in South Korea, China and North America, where organic sales grew 21 p.p., 10 p.p. and 8 p.p. more than LVP in each respective market.
Organic sales of airbag products rose by 8% compared to the 3% increase in global LVP. Autoliv’s outperformance primarily reflects the Company’s strong position in side-impact airbags, a market that is growing faster than the market for frontal airbags.
Organic sales of seatbelt products increased by 7% which was more than twice as much as the increase in global LVP partly due to market share gains in the expanding Chinese market.
Sales of active safety systems almost doubled from $85 million to $160 million, mainly due to new radar business with Chrysler and higher optional take-rates at Mercedes.
In Europe, sales rose by 12% to $3,102 million including positive currency effects of 6%. Organic sales increased by 6%, which was 1 p.p. more than the increase in European LVP of 5%.
In the Americas, consolidated sales rose by slightly less than 17% to $2,559 million, while organic sales rose by 16% and currency effects added slightly less than 1%. The growth in organic sales was twice as much as the 8% increase in LVP in the Americas, mainly due to new business with Ford, Chrysler and GM.
In China, sales increased by 21% to $982 million. Excluding currency effects and acquisitions, which added 5% and 3%, organic sales grew by 13% which was 10 p.p. more than China’s LVP.
In Japan, sales declined by 4% to $758 million despite favorable currency effects of 10%. The decline in organic sales of 14% was in line with the 14% decline in Japan’s LVP. Both declines were mainly due to the earthquake in the first quarter of 2011.
In the Rest of Asia (RoA) sales increased by 35% to $831 million. Excluding acquisitions and currency effects that added 13% and 4%, respectively, sales grew organically by 18%, which was 13 p.p. more than the growth in the region’s LVP. This was mainly due to Autoliv’s strong performance in the important South Korean market and to new business from Hyundai/KIA and GM. Both LVP and sales were affected by the flooding in Thailand and by component shortage due to the Japanese earthquake.
GROSS PROFIT
Gross profit increased by 9%, or $136 million, to $1,728 million, primarily due to higher sales. However, gross margin declined to 21.0% from 22.2% in 2010. This was mainly due to a 1.2 p.p. negative effect from higher raw material prices and to costs for step-up of the manufacturing capacity in our growth markets.
OPERATING INCOME
Operating income improved by 2%, or $20 million, to $889 million while operating margin declined by 1.3 p.p. to 10.8%, almost in line with the 1.2 p.p. decline in gross margin, despite the fact that $80 million higher Research, Development and Engineering (R,D&E) expense, net, had a 1.0 p.p. negative effect. Legal fees of $14 million for the on-going antitrust investigations (see page 43 in the Annual Report) had a 0.2 p.p. negative effect.
R,D&E expense, net rose by 22% to $441 million and, in relation to sales, to 5.4% from 5.0% in 2010, primarily due to our increased undertakings in active safety. Selling, General & Administrative (S,G&A) expense rose by 13% to $369 million, but continued to decline in relation to sales to 4.5% from 4.6%.
INTEREST EXPENSE, NET
Interest expense, net increased by 12%, or $6 million, to $57 million compared to 2010 as a reflection of higher Swedish Krona floating interest rates. This more than offset a favorable effect from a lower average net debt (non-U.S. GAAP measure, see page 42 in the Annual Report). Average net debt during the year was reduced to $67 million during 2011 from $433 million during 2010. Pre-tax income also included a charge of $6 million for debt extinguishment costs.
The higher interest expense, net and the lower average net debt reflects the fact that strong cash flow from operations reduced primarily short-term debt which has lower interest rates compared to primarily fixed rate long-term debt. It also reflects the fact that the return on the cash on deposit is significantly lower than the average borrowing cost with the highest interest rate for some of the remaining debt at 15%. This loan was remarketed in March 2012, see page 48 in the Annual Report.
INCOME TAXES
Income before taxes increased by 3% or $23 million to $828 million primarily due to higher operating income. Income tax expense was $201 million, net of discrete tax items of $25 million, resulting in an effective tax rate of 24.3%, compared to 26.1% for 2010.
During 2011, the Company completed the formalities to close the tax audits on the Company’s U.S. tax returns for 2003-2008. As a result of the conclusion of the U.S. tax audits and other proceedings, the Company released $24 million of its tax reserves in the second quarter in 2011.
NET INCOME AND EARNINGS PER SHARE
Net income attributable to controlling interest improved by 6% or $33 million to $623 million, resulting in a net income margin of 7.6% compared to 8.2% in 2010.
Earnings per share assuming dilution improved by $0.26 to $6.65 due to higher net income, partially offset by more shares outstanding.
The weighted average number of shares outstanding assuming dilution increased by 1% to 93.7 million primarily as a result of the exchange of 2.3 million equity units in 2010 and a dilutive effect from the remaining equity units. The higher number of shares outstanding had a 10 cent negative effect on earnings per share.
Liquidity, Resources and Financial Position
CASH FROM OPERATIONS
Cash flow from operations, together with available financial resources and credit facilities, are expected to be sufficient to fund Autoliv’s anticipated working capital requirements, capital expenditures and future dividend payments.
Cash provided by operating activities was $689 million in 2012, $758 million in 2011 and $924 million in 2010.
While management of cash and debt is important to the overall business, it is not part of the operational management’s day-to-day responsibilities. We therefore focus on operationally derived working capital and have set a policy that the operating working capital should not exceed 10% of the last 12-month net sales.
At December 31, 2012, operating working capital (non-U.S. GAAP measure see page 42 in the Annual Report) stood at $579 million corresponding to 7.0% of net sales compared to $514 million and 6.2%, respectively, at December 31, 2011. These ratios were reduced by 0.9 percentage points (p.p.) in 2012 and by 0.4 p.p. in 2011 from provisions for capacity alignment and other restructuring charges, and favorably impacted by 1.2 and 1.0 p.p., respectively, from the sale of receivables and discounting of notes totaling $95 million in 2012 and $83 million in 2011 (see “Treasury Activities” on page 48 in the Annual Report).
Days receivables outstanding (see page 83 in the Annual Report for definition) decreased to 66 at December 31, 2012 from 67 days on December 31, 2011. Factoring agreements did not have any material effect on days receivables outstanding for 2012, 2011 or 2010.
Days inventory outstanding (definition on page 83 in the Annual Report) decreased to 30 at December 31, 2012 from 32 one year earlier.
CAPITAL EXPENDITURES
Cash generated by operating activities continued to sufficiently cover capital expenditures for property, plant and equipment.
Capital expenditures, gross were $365 million in 2012, $367 million in 2011 and $236 million in 2010, corresponding to 4.4%, 4.5% and 3.3% of net sales, respectively.
Capital expenditures, net of $360 million were $87 million higher than depreciation and amortization of $273 million in 2012 and $89 million higher than depreciation and amortization of $268 million in 2011.
Capital expenditures for 2013 are expected to be around 4.5% of sales to support the increasing need for manufacturing capacity in China and other growth markets.
During 2012, construction was commenced on a new gas generant facility in China and on an expansion of the existing generant and initiator facilities in North America. These investments will allow us to increase long term our airbag production capacity by up to 30%. In 2012, we also began the extension of our seatbelt assembly plant in Hungary and Autoliv’s technical center in China; a new assembly facility for seatbelts was completed in Indonesia; a new steering wheel plant was brought into operation in Romania; and a new seatbelt assembly plant was brought into operation in Russia.
During 2011, two plants were expanded in China and two other Chinese plants were transferred to new buildings. Additionally, to meet the growing unit sales and the need for additional manufacturing capacity, a seatbelt webbing facility was opened in India, a steering wheel plant was expanded in Brazil, an airbag cushion plant was opened in Thailand and an airbag cushion plant moved to a larger building in Brazil.
BUSINESS COMBINATIONS, ACQUISITIONS AND DIVESTMENTS
Historically, the Company has made many acquisitions. Generally, we focus on two principal growth areas around our core business with the greatest potential: active safety systems and growth markets. In the wake of the financial crisis in 2008 and 2009, we also made several acquisitions to participate in a consolidation of the automotive safety industry.
The total acquisitions of businesses, net of cash acquired, amounted to $2 million in 2012 (prior year acquisitions), to $23 million in 2011 and to $141 million in 2010. No business combinations or acquisitions were made in 2012 although Autoliv did divest Autoliv Mekan AB in Sweden, which manufactures seat components, primarily for seats in Volvo vehicles. This non-core subsidiary had sales of SEK 260 million (approximately $37 million) and slightly less than 200 employees.
In 2011, Autoliv acquired two technologies related to active safety: 1) software from Hella for camera-based forward-looking systems such as Traffic Sign Recognition (TSR), Lane Detection (LD) and Light Source Recognition (LSR) and 2) a license from Astyx for long-range radar that will supplement Autoliv’s existing short and medium range radar in Adaptive Cruise Control (ACC), Emergency Braking (EB) and Forward Collision-Warning (FCW). These acquisitions are expected to generate sales in 2014 and 2015, respectively.
In 2010, we acquired the automotive radar business of Visteon. This acquisition generated sales of $2 million during 2010.
Also in 2010, Autoliv acquired the remaining 49% of the shares in AS Norma in Estonia for $50 million. Norma is the leading automotive safety company in the Russian market, and had annual sales of $56 million in 2010. However, since Norma was already a consolidated entity, the acquisition did not impact Autoliv’s consolidated sales.
Furthermore, in 2010, Autoliv acquired the remaining 40% of the shares in its Japanese inflator subsidiary Autoliv Nichiyu Co. Ltd (ANC) for $7 million and Delphi’s Pyrotechnic Safety Switch (PSS) business. Since ANC was already consolidated, this acquisition did not affect Autoliv’s consolidated sales, while PSS added annualized sales of $8 million.
In 2009 and the beginning of 2010, Autoliv acquired virtually all of Delphi’s assets for airbags, steering wheels and seatbelts following Delphi’s announcement in the spring of 2009 that they intended to exit these markets. These acquired Delphi assets were located in North America, South Korea and Europe. Finally, in August 2010, Autoliv acquired Delphi’s remaining assets in passive safety, which was a 51% interest in the Chinese seatbelt joint venture Beijing Delphi Safety Product Co. Ltd (BDS). The purchase price of all of the Delphi assets that Autoliv acquired during 2009 and 2010 was approximately $107 million, while the acquisitions added annual sales of approximately $570 million.
FINANCING ACTIVITIES
Cash used in financing activities amounted to $91 million in 2012 and to $223 million in 2011. Cash and cash equivalents increased by $239 million to $978 million in 2012 and by $151 million to $739 million in 2011. Gross debt decreased by $33 million to $633 million at December 31, 2012 and by $59 million to $666 million at December 31, 2011.
Net cash (non-U.S. GAAP measure see page 42 in the Annual Report) increased during 2012 by $269 million to $361 million at December 31, 2012. During 2011, net debt decreased by $219 million to a positive net cash position of $92 million at December 31, 2011.
INCOME TAXES
The Company has reserves for taxes that may become payable in future periods as a result of tax audits.
At any given time, the Company is undergoing tax audits in several tax jurisdictions and covering multiple years. Ultimate outcomes are uncertain but could, in future periods, have a significant impact on the Company’s cash flows. See discussions of income taxes under “Accounting Policies” on page 60 and also Note 4 to Consolidated Financial Statements included herein.
PENSION ARRANGEMENTS
The Company has defined benefit pension plans covering most U.S. employees, although the Company froze participation in the U.S. plans to exclude employees hired after December 31, 2003. Many of the Company’s non-U.S. employees are also covered by pension arrangements.
At December 31, 2012, the Company’s pension liability (i.e. the actual funded status) for its U.S. and non-U.S. plans was $255 million and $193 million one year earlier. The plans had a net unamortized actuarial loss of $171 million recorded in Accumulated other comprehensive income (loss) in the Consolidated Statement of Equity at December 31, 2012, compared to $133 million at December 31, 2011. The amortization of this loss is expected to be $12 million in 2013.
The liability increase in 2012 of $62 million was mainly due to a decrease in the discount rate for all significant plans, except for the plan in Japan. The liability increase in 2011 of $57 million was primarily due to a $63 million increase in the U.S. plans mainly caused by a decrease in the discount rate and changes in other actuarial assumptions offset by a decrease in the Japanese defined benefit plans, which were partially converted into a new defined contribution plan in October 2011.
Pension expense associated with the defined benefit plans was $36 million in 2012, $33 million in 2011 and $22 million in 2010 and is expected to be $39 million in 2013. The increase in pension expense associated with the defined benefit plans in 2012 of $3 million is mainly due to a $7 million increase in the U.S. plans as a result of the decrease in discount rate, offset by a decrease in Japan due to the Japanese plan conversion in 2011. The increase in pension expense associated with the defined benefit plans in 2011 of $11 million was mainly due to a $3 million increase in the U.S. plans and a $4 million increase in the Japanese plans as part of the plan conversion.
The Company contributed $19 million to its defined benefit plans in 2012 which was $7 million more than expected mainly caused by an increased contribution in South Korea due to a change in governmental regulation. In 2011, the contribution amounted to $30 million and to $16 million in 2010. The increase in defined benefit plan contributions in 2011 was mainly due to the Japanese plan conversion, resulting in an increase in contributions of $13 million compared to 2010. The Company expects to contribute $13 million to these plans in 2013 and is currently projecting a yearly funding at approximately the same level in the subsequent years.
For further information about retirement plans see Note 18 to the Consolidated Financial Statements.
DIVIDENDS
Total cash dividends paid were $178 million in 2012, $154 million in 2011 and $58 million in 2010. The annualized dividend amount of $191 million (based on 50 cents per share and the number of shares outstanding at December 31, 2012) is 54% higher than the highest amount paid before the crises in 2008 and 2009.
Before the global financial crisis, the Company paid quarterly dividends of 39 cents per share. However, as of the second quarter of 2009, dividend payments were suspended to preserve cash.
Dividend payments were resumed in the third quarter 2010 as a result of the Company’s fast recovery and efficient cash management. Subsequently, the dividend per share was raised from 30 cents to 35 cents for the fourth quarter of 2010, to 40 cents for the first quarter of 2011, to 43 cents for the second quarter and to 45 cents for the third and the fourth quarter of 2011 and the first quarter of 2012. During 2012, the dividend per share was raised to 47 cents for the second and the third quarter and to 50 cents for the fourth quarter.
The board has declared a dividend of 50 cents per share for the first quarter of 2013.
EQUITY
During 2012, total equity increased by 13% or $427 million to $3,776 million. This was due to net income of $486 million, a $105 million net effect from the settlement of the purchase contracts related to the Equity Units, a $28 million positive currency effect and nearly a $21 million effect related to stock incentives. Equity was reduced by $186 million due to dividends and by $26 million due to changes in pension liabilities.
During 2011, total equity increased by 14% or $410 million to $3,349 million. This was due to net income of $627 million and a $20 million effect from the issuance of shares and other effects related to stock compensation. Equity was reduced by $159 million due to dividends, by $42 million due to negative currency effects and by $36 million due to changes in pension liabilities.
IMPACT OF INFLATION
Except for raw materials, inflation has generally not had a significant impact on the Company’s financial position or results of operations. However, increases in raw material prices had a negative impact of $6 million in 2012, of almost $100 million in 2011 and of almost $20 million in 2010. For 2013, we currently expect a favorable impact of around $3 million from declining raw material prices.
Changes in most raw material prices affect the Company with a time lag, which is usually three to six months for most materials (see Component Costs on page 51 in the Annual Report).
In many growth markets, inflation is relatively high, especially labor inflation. We have managed to offset this negative effect mainly by labor productivity improvements. However, no assurance can be given that this will continue to be possible going forward.
PERSONNEL
During the past three years, total headcount (permanent employees and temporary personnel) has risen by 35% to 51,000 from the beginning of 2010. This reflects the rebound in the cyclical automotive business as well as the combined effect of long-term growth of global LVP, strong demand for safer vehicles and Autoliv’s market share gains, which all drive the need for additional manufacturing personnel.
During 2012, headcount increased by 3,000 despite a decrease of 200 due to divestitures and no impact from acquisitions. During 2011, when headcount increased by 4,600 there were no impacts from acquisitions or divestitures. Acquisitions added 800 during 2010 when headcount increased by 5,400. Excluding acquisitions and divestitures, headcount increased by 7% during 2012, 11% during 2011 and 12% during 2010, which should be compared to increases in organic sales of 4%, 9% and 31% for the same years. During 2012 and 2011, Autoliv’s vertical integration and manufacturing in low-cost-countries (LCC) increased as a means to offset price erosion in the automotive industry, which caused headcount to increase faster than sales.
At the end of 2012, 69% of total headcount was in LCC compared to 60% at the beginning of 2010. Furthermore, 71% of total headcount at December 31, 2012 was direct workers in manufacturing compared to 68% at the beginning of 2010, while 18% of total headcount at December 31, 2012 was temporaries, compared to 20% at the beginning of 2010.
Compensation to directors and executive officers is reported, as is customary for U.S. public companies, in Autoliv’s proxy statement, which will be available to shareholders in March 2013.
Treasury Activities
CREDIT FACILITIES
During the last three years, credit markets have eased significantly after the peak of the financial crisis in 2008 and 2009. Although the Company did not have to issue any significant long-term debt during the crisis, Autoliv has taken advantage of the improved credit margins in recent years.
In 2010, the terms of the back-up commitment from the European Investment Bank (EIB) were favorably amended and renegotiated again in 2011 on more favorable terms (see below). Also in 2010, Autoliv signed a new revolving credit facility (RCF) of SEK 2 billion ($306 million equivalent) with a term of seven years and another RCF of €155 million ($205 million equivalent) with a term of five years. Both facilities had a margin of 1.4% on the applicable LIBOR or IBOR when utilized. In addition, in 2010, Autoliv conducted, at favorable terms, a number of accelerated equity units exchange transactions (see below).
In 2011, credit margins continued to improve during the beginning of the year. However, mid-year, the margins started to widen again as a result of the Euro and sovereign debt worries. Before this change in market sentiment, Autoliv refinanced its $1.1 billion RCF, which was scheduled to mature in November 2012. The new facility, syndicated among 14 banks, has a margin of 0.55% on the applicable LIBOR or IBOR when utilized. After the RCF-refinancing in 2011, Autoliv cancelled the two above-mentioned facilities from 2010 which were no longer cost efficient. Additionally before the change in market sentiment, a SEK 600 million ($92 million equivalent) bond was repurchased at a discount. The Company recorded, in 2011, a debt extinguishment cost of $6 million related to this transaction, but the transaction will reduce interest expense by $8 million through 2014 (i.e. $2 million more than the cost). In connection with the bond buy-back, the Company issued a SEK 300 million ($46 million equivalent) 6-year bond with an interest rate of 3-month STIBOR + 0.95%. Furthermore, the EIB loan commitment was renegotiated again in 2011 and the terms were further improved.
In 2012, as a result of the Euro and sovereign debt concerns, credit margins have increased slightly while interest rates have been at historically low levels. In April 2012, Autoliv extended essentially all of its $1.1 billion RCF from April 2016 to April 2017 with unchanged terms and conditions. In November 2012, a U.S. private placement note of $110 million matured, which had a fixed interest rate of 5.6%. Although Autoliv does not have immediate funding needs, a new fixed-rate note was issued in December 2012 of 350 million SEK ($54 million equivalent) at historically low interest levels. The 5-year note matures in December 2017 and carries interest rates of EIB’s cost of funds plus 0.3% which represents a fixed interest rate of 2.49%. The remainder of EIB’s commitment was cancelled in December 2012. At December 31, 2012, Autoliv’s unutilized long-term credit facilities were $1.1 billion, represented by the RCF. The facility is not subject to any financial covenants nor is any other substantial financing of Autoliv. The Company had a net cash position at year end 2012 and 2011 of $361 million and $92 million, respectively. See Note 12 to Consolidated Financial Statements included herein for additional information.
During 2012 and 2011, the Company sold receivables and discounted notes related to selected customers. These factoring arrangements increase cash while reducing accounts receivable and customer risks. At December 31, 2012, the Company had received $95 million for sold receivables without recourse and discounted notes with a discount of $2 million during the year, compared to $83 million at year end 2011 with a discount of $2 million recorded in Other financial items, net.
Autoliv’s long-term credit rating from Standard and Poor’s has been BBB+ with stable outlook since July 2010, when the rating was upgraded from BBB. Consequently, Autoliv’s credit rating remains in line with its objective of maintaining a strong investment grade rating.
EQUITY AND EQUITY UNITS
In March 2009, we decided to strengthen Autoliv’s equity base, primarily to (i) be in a position to participate in a very likely consolidation of our industry resulting from the financial crisis, (ii) stabilize the Company’s credit rating because GM and Chrysler were at risk of going into bankruptcy and S&P’s down-grading of Autoliv between November 2008 and February 2009 from A- to BBB-, and (iii) have a strong negotiating position with the European Investment Bank (EIB). Autoliv therefore sold 14,687,500 treasury shares at $16.00 and 6,600,000 equity units at $25.00, which generated net proceeds of $377 million. Each equity unit consisted of one mandatory purchase contract and one 8% senior note due on April 30, 2014.
Originally, the face value of the debt related to these notes amounted to $165 million, and the number of shares that would have been issued as a result of the equity units was 8.6 million to 10.3 million. However, some holders of the equity units contacted us in the spring of 2010 and proposed to exchange their units for cash and common stock at a discount compared to the original terms of the agreement. We therefore conducted various accelerated exchange transactions totaling 36% of the then outstanding equity units. The price represented a 22% discount compared to the agreed cash coupon. This reduced our debt by $54 million and increased equity by $57 million due to the issuance of 3,058,735 Autoliv treasury shares. As a result, the face value of the debt related to the equity units was reduced to $106 million. In 2010, the Company also recorded a debt extinguishment cost of $12 million related to the transaction, but the transaction saved $16 million in interest expense through April 2012.
In March 2012, Autoliv completed the remarketing of the senior notes and the coupon of the notes was reset to 3.854% with a yield of 2.875%. This reduced interest expense by around $11 million in 2012 compared to 2011. At the time of the remarketing, 4,250,920 equity units were outstanding.
On April 30, 2012, Autoliv settled the purchase contracts underlying the equity units. Under the terms of the purchase contracts, Autoliv delivered 5.8 million of its treasury shares to the holders of the 4,250,920 outstanding equity units and, in return, received $106 million in cash. As a result, the Company’s net cash position and equity were increased by $106 million, and the total number of shares outstanding increased from 89.5 million to 95.3 million. Following the settlement of the purchase contracts no equity units were outstanding.
For dilution effects from these transactions, see “Number of Shares” below. For an additional description of our equity units, see Note 13 to Consolidated Financial Statements included herein.
NUMBER OF SHARES
At December 31, 2012, there were 95.5 million shares outstanding (net of 7.3 million treasury shares), a 7% increase from 89.3 million one year earlier.
Due to the settlement of the remaining equity units, the number of shares outstanding increased on April 30, 2012 by 5.8 million. The number of shares outstanding is expected to further increase by 1.2 million when all Restricted Stock Units (RSU) vest and if all stock options to key employees are exercised, see Note 15 to Consolidated Financial Statements included herein.
For calculating earnings per share assuming dilution, Autoliv follows the Treasury Stock Method. As a result, the dilutive effect from the equity units has varied with the price of the Autoliv share. For 2012 and 2011, 1.3 million and 4.0 million shares, respectively, were included in the dilutive weighted average share amount related to the equity units, see Note 20 to Consolidated Financial Statements included herein.
In 2007, the Board authorized a share repurchase program of which 3.2 million shares remained on December 31, 2012 for repurchases. Purchases can be made from time to time as market and business conditions warrant in open market, negotiated or block transactions. There is no expiration date for the repurchase program to provide management flexibility in the Company’s share repurchases. The Company started to buy back shares in 2000 but has not repurchased any shares since the Lehman Brothers collapse on September 15, 2008. The average cost for all repurchased shares to date is $42.93.
Contractual Obligations and Commitments
| | | | | | | | | | | | | | | | | | | | |
AGGREGATE CONTRACTUAL OBLIGATIONS1) (DOLLARS IN MILLIONS) | | Payments due by Period | |
| | Total | | | Less than 1 year | | | 1-3 years | | | 3-5 years | | | More than 5 years | |
Debt obligations including DRD2) | | $ | 617 | | | $ | 70 | | | $ | 282 | | | $ | 205 | | | $ | 60 | |
Fixed-interest obligations including DRD2) | | | 61 | | | | 19 | | | | 27 | | | | 15 | | | | — | |
Operating lease obligations | | | 111 | | | | 33 | | | | 44 | | | | 22 | | | | 12 | |
Unconditional purchase obligations | | | — | | | | — | | | | — | | | | — | | | | — | |
Pension contribution requirements3) | | | 13 | | | | 13 | | | | — | | | | — | | | | — | |
Other non-current liabilities reflected on the balance sheet | | | 21 | | | | — | | | | 12 | | | | 5 | | | | 4 | |
| | | | | | | | | | | | | | | | | | | | |
Total | | $ | 823 | | | $ | 135 | | | $ | 365 | | | $ | 247 | | | $ | 76 | |
| | | | | | | | | | | | | | | | | | | | |
| 1) | Excludes contingent liabilities arising from litigation, arbitration, income taxes or regulatory actions. 2) Debt-Related Derivatives (DRD), see Note 12 to the Consolidated Financial Statements included herein. 3) Expected contributions for funded and unfunded defined benefit plans excludes payments beyond 2013 |
Contractual obligations include debt, lease and purchase obligations that are enforceable and legally binding on the Company. Non-controlling interests and restructuring obligations are not included in this table. The major employee obligations as a result of restructuring are disclosed in Note 10 to Consolidated Financial Statements included herein.
Debt obligations including Debt-Related Derivatives (DRD): For material contractual provisions, see Note 12 to Consolidated Financial Statements included herein. The debt obligations include capital lease obligations, which mainly relate to property and plants in Europe, as well as the impact of revaluation to fair value of Debt-Related Derivatives (DRD).
Fixed-interest obligations including DRD: These obligations include interest on debt and credit agreements relating to periods after December 31, 2012, as adjusted by DRD, excluding fees on the revolving credit facility and interest on debts with no defined amortization plan.
Operating lease obligations: The Company leases certain offices, manufacturing and research buildings, machinery, automobiles and data processing and other equipment. Such operating leases, some of which are non-cancelable and include renewals, expire on various dates. See Note 17 to Consolidated Financial Statements included herein.
Unconditional purchase obligations: There are no unconditional purchase obligations other than short-term obligations related to inventory, services, tooling, and property, plant and equipment purchased in the ordinary course of business.
Purchase agreements with suppliers entered into in the ordinary course of business do not generally include fixed quantities. Quantities and delivery dates are established in “call off plans” accessible electronically for all customers and suppliers involved. Communicated “call off plans” for production material from suppliers are normally reflected in equivalent commitments from Autoliv customers.
Pension contribution requirements: The Company sponsors defined benefit plans that cover a significant portion of our U.S. employees and certain non-U.S. employees. The pension plans in the U.S. are funded in conformity with the minimum funding requirements of the Pension Protection Act of 2006. Funding for our pension plans in other countries is based upon plan provisions, actuarial recommendations and/or statutory requirements.
In 2013, the expected contribution to all plans, including direct payments to retirees, is $13 million, of which the major contribution is $7 million for our U.S. pension plans. Due to volatility associated with future changes in interest rates and plan asset returns, the Company cannot predict with reasonable reliability the timing and amounts of future funding requirements, and therefore the above excludes payments beyond 2013. We may elect to make contributions in excess of the minimum funding requirements for the U.S. plans in response to investment performance and changes in interest rates, or when we believe that it is financially advantageous to do so and based on other capital requirements.
Excluded from the above are expected contributions of $1 million due in 2013 with respect to our other post-employment benefit (OPEB) plans, which represents the expected benefit payments to participants as costs are incurred. See Note 18 to Consolidated Financial Statements included herein.
Other non-current liabilities reflected on the balance sheet: These consist mainly of local governmental liabilities.
OFF-BALANCE SHEET ARRANGEMENTS
The Company does not have any off-balance sheet arrangements that have, or are reasonably likely to have, a material current or future effect on its financial position, results of operations or cash flows.
Accounting Policies
NEW ACCOUNTING PRONOUNCEMENTS
The Company has evaluated all applicable recently issued accounting guidance. None of these recently issued pronouncements have had, or are expected to have, a significant impact on the Company’s future Consolidated Financial Statements.
APPLICATION OF CRITICAL ACCOUNTING POLICIES
The Company’s significant accounting policies are disclosed in Note 1 to the Consolidated Financial Statements included herein.
Senior management has discussed the development and selection of critical accounting estimates and disclosures with the Audit Committee of the Board of Directors. The application of accounting policies necessarily requires judgments and the use of estimates by a company’s management. Actual results could differ from these estimates.
Management considers it important to assure that all appropriate costs are recognized on a timely basis. In cases where capitalization of costs is required (e.g., certain pre-production costs), stringent realization criteria are applied before capitalization is permitted. The depreciable lives of fixed assets are intended to reflect their true economic life, taking into account such factors as product life cycles and expected changes in technology. Assets are periodically reviewed for realizability and appropriate valuation allowances are established when evidence of impairment exists. Impairment of long-lived assets has generally not been significant.
REVENUE RECOGNITION
Revenues are recognized when there is evidence of a sales agreement, delivery of goods has occurred, the sales price is fixed and determinable and the collectability of revenue is reasonably assured. The Company records revenue from the sale of manufactured products upon shipment to customers and transfer of title and risk of loss under standard commercial terms.
Accruals are made for retroactive price adjustments if probable and can be reasonably estimated. Net sales exclude taxes assessed by a governmental authority that are directly imposed on revenue-producing transactions between the Company and its customers.
BAD DEBT AND INVENTORY RESERVES
The Company has reserves for bad debts as well as for excess and obsolete inventories.
The Company has guidelines for calculating provisions for bad debts based on the age of receivables. In addition, the accounts receivable are evaluated on a specific identification basis. In determining the amount of a bad debt reserve, management uses its judgment to consider factors such as the prior experience with the customer, the experience with other enterprises in the same industry, the customer’s ability to pay and/or an appraisal of current economic conditions.
Inventories are evaluated based on individual or, in some cases, groups of inventory items. Reserves are established to reduce the value of inventories to the lower of cost or market, with market generally defined as net realizable value for finished goods and replacement cost for raw materials and work-in-process. Excess inventories are quantities of items that exceed anticipated sales or usage for a reasonable period. The Company has guidelines for calculating provisions for excess inventories based on the number of months of inventories on hand compared to anticipated sales or usage. Management uses its judgment to forecast sales or usage and to determine what constitutes a reasonable period.
There can be no assurance that the amount ultimately realized for receivables and inventories will not be materially different than that assumed in the calculation of the reserves.
GOODWILL IMPAIRMENT
The Company performs an annual impairment review of goodwill in the fourth quarter of each year following the Company’s annual forecasting process. The estimated fair market value of goodwill is determined by the discounted cash flow method. The Company discounts projected operating cash flows using its weighted average cost of capital.
To supplement this analysis, the Company compares the market value of its equity, calculated by reference to the quoted market prices of its shares, with the book value of its equity. There were no goodwill impairments in 2010-2012. See “Goodwill and Intangible Assets” in Note 1 to Consolidated Financial Statements included herein.
RESTRUCTURING PROVISIONS
The Company defines restructuring expense to include costs directly associated with rightsizing, exit or disposal activities. Estimates of restructuring charges are based on information available at the time such charges are recorded. In general, management anticipates that restructuring activities will be completed within a time frame such that significant changes to the exit plan are not likely.
Due to inherent uncertainty involved in estimating restructuring expenses, actual amounts paid for such activities may differ from amounts initially estimated. See Note 10 to the Consolidated Financial Statements included herein.
DEFINED BENEFIT PENSION PLANS
The Company has defined benefit pension plans in thirteen countries. The most significant plans exist in the U.S. and cover most U.S. employees. These plans represent 62% of the Company’s total pension benefit obligation. See Note 18 to Consolidated Financial Statements included herein.
The Company, in consultation with its actuarial advisors, determines certain key assumptions to be used in calculating the projected benefit obligation and annual pension expense. For the U.S. plans, the assumptions used for calculating the 2012 pension expense were a discount rate of 4.60%, expected rate of increase in compensation levels of 3.50%, and an expected long-term rate of return on plan assets of 7.50%.
The assumptions used in calculating the U.S. benefit obligations disclosed as of December 31, 2012 were a discount rate of 4.05% and an expected age-based rate of increase in compensation levels of 3.50%. The discount rate for the U.S. plans has been set based on the rates of return of high-quality fixed-income investments currently available at the measurement date and are expected to be available during the period the benefits will be paid. The expected rate of increase in compensation levels and long-term return on plan assets are determined based on a number of factors and must take into account long-term expectations and reflect the financial environment in the respective local markets. The Company assumes a long-term rate of return on U.S. plan assets of 7.50% for calculating the 2012 expense as in 2011. At December 31, 2012, 65% of the U.S. plan assets were invested in equities, which is in line with the target of 65%.
A one percentage point (p.p.) decrease in the long-term rate of return on plan assets would result in an increase in the 2012 U.S. benefit cost of $1 million. A one p.p. decrease in the discount rate would have increased the 2012 U.S. benefit cost by $7 million and would have increased the December 31, 2012 U.S. benefit obligation by $77 million. A one p.p. increase in the expected rate of increase in compensation levels would have increased 2012 U.S. benefit cost by $4 million and would have increased the December 31, 2012 U.S. benefit obligation by $31 million.
INCOME TAXES
Significant judgment is required in determining the worldwide provision for income taxes. In the ordinary course of a global business, there are many transactions for which the ultimate tax outcome is uncertain. Many of these uncertainties arise as a consequence of inter-company transactions and arrangements.
Although the Company believes that its tax return positions are supportable, no assurance can be given that the final outcome of these matters will not be materially different than that which is reflected in the historical income tax provisions and accruals. Such differences could have a material effect on the income tax provisions or benefits in the periods in which such determinations are made. See Note 4 to Consolidated Financial Statements included herein.
CONTINGENT LIABILITIES
Various claims, lawsuits and proceedings are pending or threatened against the Company or its subsidiaries, covering a range of matters that arise in the ordinary course of its business activities with respect to commercial, product liability or other matters. Because we are unable to estimate the financial impact of ongoing and potential antitrust investigations and related civil litigation or the periods during which such impact would be recorded, the Company has not recorded a provision for those matters as of December 31, 2012. See Note 16 to the Consolidated Financial Statements included herein and Item 3 – “Legal Proceedings” in our 10-K for the year ended December 31, 2012.
The Company diligently defends itself in such matters and, in addition, carries insurance coverage to the extent reasonably available against insurable risks.
The Company records liabilities for claims, lawsuits and proceedings when they are identified and it is possible to reasonably estimate the cost of such liabilities. Legal costs expected to be incurred in connection with a loss contingency are expensed as such costs are incurred.
Risks and Risk Management
The Company is exposed to several categories of risks. They can broadly be categorized as operational risks, strategic risks and financial risks. Some of the major risks in each category are described below. There are also other risks that could have a material effect on the Company’s results and financial position and the description below is not complete but should be read in conjunction with the discussion of risks in our 10-K filed with the SEC, which contains a description of our material risks.
As described below, the Company has taken several mitigating actions, applied many strategies, adopted policies, and introduced control and reporting systems to reduce and mitigate these risks. In addition, the Company from time to time identifies and evaluates emerging or changing risks to the Company in order to ensure that identified risk and related risk management are updated in this fast moving environment.
Operational Risks
LIGHT VEHICLE PRODUCTION
Since nearly 30% of Autoliv’s costs are relatively fixed, short-term earnings are highly dependent on capacity utilization in the Company’s plants and are, therefore, sales dependent.
Global LVP is an indicator of the Company’s sales development. Ultimately, however, sales are determined by the production levels for the individual vehicle models for which Autoliv is a supplier (see Dependence on Customers). The Company’s sales are split over several hundred contracts covering approximately 1,300 vehicle models which generally moderates the effect of changes in vehicle demand of individual countries and regions or stops in production, due to for instance natural disasters. The risk in fluctuating sales has also been mitigated by Autoliv’s rapid expansion in Asia and other rapidly growing markets, which has reduced the Company’s former high dependence on Europe from more than 50% of sales to a diversified mix with Europe, the Americas and Asia each accounting for about one third of 2012 sales.
It is also the Company’s strategy to reduce this risk in fluctuating sales by using a high number of temporary employees instead of permanent employees. During 2010-2012, the level of temporary personnel in relation to total headcount varied between 18.1% at December 31, 2012 and 22.4% at September 30, 2010.
However, when there is a dramatic reduction in the production of vehicle models supplied by the Company as occurred during the financial crisis in 2008 and 2009 and during 2012 when Western European LVP declined by 8%, it takes time to reduce the level of permanent employees and even longer to reduce fixed production capacity. As a result, our sales and margin could drop significantly and materially impact earnings and cash flow. Therefore, it is our strategy to have a strong financial position and high level of manufacturing in low-cost countries where more flexible labor-intensive production lines can be used than highly automated lines with fixed costs in high-cost countries.
PRICING PRESSURE
Pricing pressure from customers is an inherent part of the automotive components business. The extent of pricing reductions varies from year to year, and takes the form of reductions in direct sales prices as well as discounted reimbursements for engineering work.
In response, Autoliv is continuously engaged in efforts to reduce costs and to provide customers added value by developing new products. Generally, the speed by which these cost-reduction programs generate results will, to a large extent, determine the future profitability of the Company. The various cost-reduction programs are, to a considerable extent, interrelated. This interrelationship makes it difficult to isolate the impact of any single program on costs. Therefore, we monitor key measures such as costs in relation to sales and geographical employee mix.
COMPONENT COSTS
Changes in these component costs and raw material prices could have a major impact on margins, since the cost of direct materials is approximately 54% of sales. Autoliv does not generally buy raw materials, but rather purchases manufactured components (such as stamped steel parts and sewn airbag cushions). In spite of this, raw material price changes in Autoliv’s supply chain could have a major impact on our profitability since approximately 51% of the Company’s component costs (corresponding to 27% of net sales) are comprised of raw materials. (The remaining 49% are value added by the supply chain.)
Currently, 36% of the raw material cost (or 10% of net sales) is based on steel prices; 32% on oil prices (i.e. nylon, polyester and engineering plastics) (9% of net sales); 15% on electronic components, such as circuit boards (4% of net sales); and 7% on zinc, aluminum and other non-ferrous metals (2% of net sales).
Changes in most raw material prices affect the Company with a time lag. This lag used to be six to twelve months but now more often is three to six months. For non-ferrous industrial metals like aluminum and zinc, we have quarterly and sometimes monthly price adjustments.
The Company’s strategy is to offset price increases on cost of materials by taking several actions such as the re-design of products to reduce material content (as well as weight), material standardization to globally available raw materials, consolidating volumes to fewer suppliers and moving components sourcing to low-cost countries. However, should these actions not be sufficient to offset component price increases, our earnings could be materially impacted.
LEGAL
The Company is involved from time to time in regulatory, commercial and contractual legal proceedings that may be significant, and the Company’s business may suffer as a result of adverse outcomes of current or future legal proceedings. These claims may include, without limitation, commercial or contractual disputes, including disputes with the Company’s suppliers, intellectual property matters, regulatory matters and governmental investigations, personal injury claims, environmental issues, tax and customs matters, and employment matters.
The Company is currently subject to ongoing antitrust investigations by the European Commission and Canadian and South Korean authorities, as well as civil litigation in the United States and Canada alleging anti-competitive conduct. In addition, management believes that additional antitrust authorities are evaluating whether to commence investigations. Such legal proceedings, including regulatory actions and government investigations, may seek recovery of very large indeterminate amounts or limit the Company’s operations, and the possibility that such proceedings may arise and their magnitude may remain unknown for substantial periods of time.
A substantial legal liability or adverse regulatory outcome and the substantial cost to defend the litigation or regulatory proceedings may have an adverse effect on the Company’s business, operating results, financial condition, cash flows and reputation.
No assurances can be given that such proceedings and claims will not have a material adverse impact on the Company’s profitability and consolidated financial position or that reserves or insurance will mitigate such impact. See Note 16 Contingent Liabilities to the Consolidated Financial Statements and Item 3 – “Legal Proceedings” in our 10-K for the year ended December 31, 2012.
PRODUCT WARRANTY AND RECALLS
The Company is exposed to various claims for damages and compensation, if our products fail to perform as expected. Such claims can be made, and result in costs and other losses to the Company, even where the relevant product is eventually found to have functioned properly. If a product (actually or allegedly) fails to perform as expected, we may face warranty and recall claims. If such actual or alleged failure results in bodily injury and/or property damage, we may in addition face product-liability and other claims. The Company may experience material warranty, recall or product-liability claims or losses in the future, and the Company may incur significant cost to defend against such claims. The Company may also be required to participate in a recall involving its products. Each vehicle manufacturer has its own practices regarding product recalls and other product-liability actions relating to its suppliers. As suppliers become more integrally involved in the vehicle design process and assume more vehicle assembly functions, vehicle manufacturers are increasingly looking to their suppliers for contribution when faced with recalls and product-liability claims. In addition, with global platforms and procedures, vehicle manufacturers are increasingly evaluating our quality performance on a global basis. Any one or more quality, warranty or other recall issue(s) (also the ones affecting few units and/or having a small financial impact) may cause a vehicle manufacturer to implement measures which may have a severe impact on the Company’s operations, such as a temporary or prolonged suspension of new orders.
In addition, there is a risk that the number of vehicles affected by a failure or defect will increase significantly (as would the Company’s costs), since our products more frequently use global designs and are increasingly based on or utilize the same or similar parts, components or solutions.
A warranty, recall or a product-liability claim brought against the Company in excess of the Company’s insurance may have a material adverse effect on its business and/or financial results. Vehicle manufacturers are also increasingly requiring their external suppliers to guarantee or warrant their products and bear the costs of repair and replacement of such products under new vehicle warranties. A vehicle manufacturer may attempt to hold the Company responsible for some or all of the repair or replacement costs of defective products under new vehicle warranties when the product supplied did not perform as represented. Additionally, a customer may not allow us to bid for expiring or new business until certain remedial steps have been taken. Accordingly, the future costs of warranty claims by the Company’s customers may be material. We believe our established reserves are adequate to cover potential warranty settlements typically seen in our business.
The Company’s warranty reserves are based upon management’s best estimates of amounts necessary to settle future and existing claims. Management regularly evaluates the appropriateness of these reserves, and adjusts them when we believe it is appropriate to do so. However, the final amounts determined to be due could differ materially from the Company’s recorded estimates.
The Company’s strategy is to follow a stringent procedure when developing new products and technologies and to apply a proactive “zero-defect” quality policy (see page 32 in the Annual Report). In addition, the Company carries product-liability and product-recall insurance at levels that management believes are generally sufficient to cover the risks. However, such insurance may not always be available in appropriate amounts or in all markets. Management’s decision regarding what insurance to procure is also impacted by the cost for such insurance. As a result, the Company may face material losses in excess of the insurance coverage procured. A substantial recall or liability in excess of coverage levels could therefore have a material adverse effect on the Company.
ENVIRONMENTAL
Most of the Company’s manufacturing processes consist of the assembly of components. As a result, the environmental impact from the Company’s plants is generally modest. While the Company’s businesses from time to time are subject to environmental investigations, there are no material environmental-related cases pending against the Company. Therefore, Autoliv does not incur (or expect to incur) any material costs or capital expenditures associated with maintaining facilities compliant with U.S. or non-U.S. environmental requirements. To reduce environmental risk, the Company has implemented an environmental management system and has adopted an environmental policy (see corporate website www.autoliv.com) that requires, for instance, that all plants should be ISO-14001 certified.
However, environmental requirements are complex, change and are generally becoming more stringent over time. Accordingly, there can be no assurance that these requirements will not change in the future, or that we will at all times be in compliance with all such requirements and regulations, despite our intention to be. The Company may also find itself subject, possibly due to changes in legislation, to environmental liabilities based on the activities of its predecessor entities or of businesses acquired. Such liability could be based on activities which are not at all related to the Company’s current activities.
SOVEREIGN DEBT CRISIS
Of Autoliv’s global sales, 3% are connected with customer plants in Portugal, Italy, Ireland, Greece or Spain. In addition, there are many vehicles imported to these countries from other plants to which Autoliv is a supplier. Consequently, a significant further drop in vehicle demand in these countries could have a significant impact on Autoliv’s revenues, even if such an effect may be partially offset by export to other markets from the so-called PIIGS countries.
None of the banks in Autoliv’s syndicated revolving credit facility (RCF) and none of the primary relationship banks are domiciled in PIIGS countries.
However, a default of one of these countries or a default of a systemically important bank could have a substantial negative effect on Autoliv’s sales, our customers’ ability to pay their bills to us and Autoliv’s possibility to utilize its financial back-up facilities.
Strategic Risks
REGULATIONS
In addition to vehicle production, the Company’s market is driven by the safety content per vehicle, which is affected by new regulations and new vehicle rating programs, in addition to consumer demand for new safety technologies.
The most important regulation is the U.S. federal law that, since 1997, requires frontal airbags for both the driver and the front-seat passenger in all new vehicles sold in the U.S. Seatbelt installation laws exist in all vehicle-producing countries. Many countries also have strict enforcement laws on the wearing of seatbelts. The U.S. adopted, in 2007, new regulations for side-impact protection to be phased-in by 2015. China introduced a vehicle rating program in 2006, and Latin America introduced a similar program in 2010. The United States upgraded its vehicle rating program in 2010 and Europe completed an upgrade of its Euro NCAP rating system in 2012 and has initiated a further upgrade, which will be fully implemented by 2017. There are also other plans for improved automotive safety, both in these countries and many other countries that could affect the Company’s market.
However, there can be no assurance that changes in regulations will not adversely affect the demand for the Company’s products or, at least, result in a slower increase in the demand for them.
DEPENDENCE ON CUSTOMERS
The five largest vehicle manufacturers account for 52% of global light vehicle production and the ten largest manufacturers for 77%.
As a result of this highly consolidated market, the Company is dependent on a relatively small number of customers with strong purchasing power.
In 2012, the Company’s five largest customers accounted for 54% of revenues and the ten largest customers for 83% of revenues. For a list of the largest customers, see Note 19 to the Consolidated Financial Statements on page 80.
Our largest customer contract accounted for 4% of sales in 2012.
Although business with every major customer is split into several contracts (usually one contract per vehicle platform) and although the customer base has become more balanced and diversified as a result of Autoliv’s significant expansion in China and other rapidly-growing markets, the loss of all business from a major customer (whether by a cancellation of existing contracts or not awarding us new business), the consolidation of one or more major customers or a bankruptcy of a major customer could have a material adverse effect on the Company. In addition, a quality issue, shortcomings in our service to a customer or uncompetitive prices or products could result in the customer not awarding us new business, which will gradually have a negative impact on our sales when current contracts start to expire.
CUSTOMER PAYMENT RISK
Another risk related to our customers is the risk that one or more customers will be unable to pay invoices that become due. We seek to limit this customer payment risk by invoicing major customers through their local subsidiaries in each country, even for global contracts. We thus try to avoid having the receivables with a multinational customer group exposed to the risk that a bankruptcy or similar event in one country puts all receivables with the customer group at risk. In each country, we also monitor invoices becoming overdue.
Even so, if a major customer would be unable to fulfill its payment obligations, it is likely that we will be forced to record a substantial loss on such receivables.
DEPENDENCE ON SUPPLIERS
Autoliv, at each stage of production, relies on internal or external suppliers in order to meet its delivery commitments. In some cases, customers require that the suppliers are qualified and approved by them. Autoliv’s supplier consolidation program seeks to reduce costs but increases our dependence on the remaining suppliers. As a result, the Company is dependent, in several instances, on a single supplier for a specific component. However, this dependence is mitigated by the fact that we seldom are dependent on a specific manufacturing technology. Consequently, we can often change suppliers, albeit with some costs and time for validation and customer approval.
Consequently, there is a risk that disruptions in the supply chain could lead to the Company not being able to meet its delivery commitments and, as a consequence, to extra costs. This risk increases as suppliers are being squeezed between higher raw material prices and the continuous pricing pressure in the automotive industry. This risk also increases when our internal and external suppliers are to a higher degree located in countries which have a higher political risk.
The Company’s strategy is to reduce these supplier risks by seeking to maintain an optimal number of suppliers in all significant component technologies, by standardization and by developing alternative suppliers around the world.
However, for various reasons including costs involved in maintaining alternative suppliers, this is not always possible. As a result, difficulties with a single supplier could impact more than one customer and product, and thus materially impact our earnings.
NEW COMPETITION
The market for occupant restraint systems has undergone a significant consolidation during the past ten years and Autoliv has strengthened its position in this passive safety market.
However, in the future, the most attractive growth opportunities may be in the active safety systems markets, which include and are likely to include other and often larger companies than Autoliv’s traditional competitors. Additionally, there is no guarantee our customers will adopt our new products or technologies.
Autoliv is reducing the risk of this trend by utilizing its leadership in passive safety to develop a strong position in active and especially integrated safety (see page 12 in the Annual Report).
PATENTS AND PROPRIETARY TECHNOLOGY
The Company’s strategy is to protect its innovations with patents, and to vigorously protect and defend its patents, trademarks and know-how against infringement and unauthorized use. At the end of 2012, the Company held more than 6,500 patents. These patents expire on various dates during the period from 2013 to 2032. The expiration of any single patent is not expected to have a material adverse effect on the Company’s financial results.
Although the Company believes that its products and technology do not infringe upon the proprietary rights of others, there can be no assurance that third parties will not assert infringement claims against the Company in the future. Also, there can be no assurance that any patent now owned by the Company will afford protection against competitors that develop similar technology.
Financial Risks
The Company is exposed to financial risks through its international operations and normally debt-financed activities. Most of the financial risks are caused by variations in the Company’s cash flow generation resulting from, among other things, changes in exchange rates and interest rate levels, as well as from refinancing risk and credit risk.
In order to reduce the financial risks and to take advantage of economies of scale, the Company has a central treasury department supporting operations and management. The treasury department handles external financial transactions and functions as the Company’s in-house bank for its subsidiaries.
The Board of Directors monitors compliance with the financial policy on an on-going basis.
CURRENCY RISKS
1. Transaction Exposure
Transaction exposure arises because the cost of a product originates in one currency and the product is sold in another currency.
The Company’s gross transaction exposure forecasted for 2013 is approximately $2.4 billion. A part of the flows have counter-flows in the same currency pair, which reduces the net exposure to approximately $1.7 billion per year. In the three largest net exposures, Autoliv expects to sell U.S dollars against Mexican Peso for the equivalent of $291 million, Euros against the Swedish Krona for the equivalent of $225 million and sell South Korean Won against U.S. dollars for the equivalent of $183 million. Together these currencies will account for almost 40 percent of the Company’s net currency transaction exposure.
Since the Company can only effectively hedge these flows in the short term, periodic hedging would only reduce the impact of fluctuations temporarily. Over time, periodic hedging would postpone but not reduce the impact of fluctuations. In addition, the net exposure is limited to less than one quarter of net sales and is made up of more than 40 different currency pairs with exposures in excess of $1 million each. Consequently, the income statement effects related to transaction exposures are generally modest.
As a result, Autoliv does not hedge these flows.
2. Translation Exposure in the Income Statement
Another effect of exchange rate fluctuations arises when the income statements of non-U.S. subsidiaries are translated into U.S. dollars. Outside the U.S., the Company’s most significant currency is the Euro. We estimate that slightly more than 30% of the Company’s net sales will be denominated in Euro or other European currencies during 2013, while approximately a quarter of net sales is estimated to be denominated in U.S. dollars.
The Company estimates that a one-percent increase in the value of the U.S. dollar versus the European currencies will decrease reported U.S. dollar annual net sales in 2013 by $27 million or by 0.3% while operating income for 2013 will also decline by approximately 0.3% or by about $2 million.
The Company’s policy is not to hedge this type of translation exposure since there is no cash flow effect to hedge.
3. Translation Exposure in the Balance Sheet
A translation exposure also arises when the balance sheets of non-U.S. subsidiaries are translated into U.S. dollars. The policy of the Company is to finance major subsidiaries in the country’s local currency and to minimize the amounts held by subsidiaries in foreign currency accounts.
Consequently, changes in currency rates relating to funding and foreign currency accounts normally have a small impact on the Company’s income.
INTEREST RATE RISK
Interest rate risk refers to the risk that interest rate changes will affect the Company’s borrowing costs.
Autoliv’s interest rate risk policy states that an increase in floating interest rates of one percentage point should not increase the annual net interest expense by more than $10 million in the following year and not by more than $15 million in the second year.
Given the Company’s current capital structure, we estimate that a one-percentage point interest rate increase would reduce net interest expense by approximately $6 million, both in 2013 and 2014. This is based on the capital structure at the end of 2012 when the gross fixed-rate debt was $449 million while the Company had a net cash position of $361 million (non-U.S. GAAP measure, see page 42 in the Annual Report).
Fixed interest rate debt is achieved both by issuing fixed rate notes and through interest rate swaps. The most notable debt carrying fixed interest rates is the $230 million U.S. private placement notes issued in 2007, the note related to the equity units of $108 million repriced in April 2012 and the EIB note issued in 2012 of SEK 350 million ($54 million equivalent), see Note 12 to Consolidated Financial Statements included herein.
The entire 2007 U.S. private placement was issued carrying fixed interest rates. Initially, $200 million of this placement was swapped into floating interest rates, $140 million of these swaps were subsequently cancelled resulting in a cash-flow gain and therefore lower fixed rate debt was achieved when considering the amortization of this gain, see Note 12 to Consolidated Financial Statements included herein.
REFINANCING RISK
Refinancing risk or borrowing risk refers to the risk that it could become difficult to refinance outstanding debt.
While this risk continuously decreased from the spring of 2009 after the elevated credit margins during the financial crisis in 2008, these levels started to increase again in the second half of 2011 and during 2012.
In 2010, we amended Autoliv’s refinancing risk policy. The policy now requires the Company to maintain long-term facilities with an average maturity of at least three years (drawn or undrawn) corresponding to 150% (previously 100%) of total net debt (non-U.S. GAAP measure, see page 42 in the Annual Report). Meeting this policy can be achieved by raising long-term debt or debt commitments or by using cash flow to repay debt.
During the past four years, Autoliv has reduced its net debt by $1,556 million and was, at December 31, 2012, in a net cash position, and has been in a net cash position since December 31, 2011, which reduces the Company’s refinancing risk significantly. In addition to this net cash position of $361 million, the Company had undrawn long-term debt facilities of $1.1 billion at the end of 2012 with an average remaining life of 4.2 years. Furthermore, the Company has no significant financing with financial covenants (i.e. performance-related restrictions).
DEBT LIMITATION POLICY
To manage the inherent risks and cyclicality in Autoliv’s business, the Company maintains a relatively conservative financial leverage.
Our policy is to always maintain a leverage ratio significantly below three and an interest coverage ratio significantly above 2.75. At December 31, 2012, the leverage ratio was not applicable, since the Company was in a net cash position. At the same date, the interest coverage ratio stood at 19.0 times. Following the Lehman Brothers collapse, the Company was incompliant with these policies but regained compliance with its leverage policy at the end of 2009 and with its interest rate coverage policy at March 31, 2010.
For details on leverage ratio and interest-coverage, refer to the tables below which reconcile these two non-U.S. GAAP measures to U.S. GAAP measures. In addition to these ratios, it is the objective of Autoliv to have a strong investment grade rating. We have met this objective during all periods since the Company was initially rated in 2000 except for between February 2009 and July 2010 when the Company’s long-term credit rating was reduced by Standard and Poor’s to BBB- following the drop in LVP and the Company’s rapid increase of its restructuring reserves as a result of the financial crisis. Since July 2010, the rating has been restored to investment grade, BBB+ with stable outlook.
CREDIT RISK IN FINANCIAL MARKETS
Credit risk refers to the risk of a financial counterparty being unable to fulfill an agreed-upon obligation. This risk was increased for almost all companies as a result of the deterioration of the credit quality of many banks during 2008 and 2009 and again starting in the second half of 2011 and continuing into 2012.
In the Company’s financial operations, this risk arises when cash is deposited with banks and when entering into forward exchange agreements, swap contracts or other financial instruments.
The policy of the Company is to work with banks that have a high credit rating and that participate in Autoliv’s financing. None of the banks in our syndicated revolving credit facility (RCF) and none of the primary relationship banks are domiciled in the so called PIIGS-countries (Portugal, Ireland, Italy, Greece and Spain).
In order to further reduce credit risk, deposits and financial instruments can only be entered into with core banks up to a calculated risk amount of $150 million per bank for banks rated A- or above and up to $50 million for banks rated BBB+. In addition, deposits can be made in U.S. and Swedish government short-term notes and certain AAA rated money market funds as approved by the Company’s Board. At year-end 2012, the Company was compliant with this policy and held $307 million in AAA rated money market funds and $200 million directly in U.S. Treasury Bills.
IMPAIRMENT RISK
Impairment risk refers to the risk that the Company will be obliged to write down a material amount of its goodwill of approximately $1.6 billion. This risk is assessed, at least, annually in the fourth quarter each year when the Company performs an impairment test. The impairment testing is based on two reporting units: 1) Passive Safety Systems to which virtually all of the goodwill is related; and 2) Active Safety Systems with $8 million in goodwill.
The discounted cash flow method is used for determining the fair value of these reporting units. The Company also compares the market value of its equity to the value derived from the discounted cash flow method. However, due to the combined effects of the cyclicality in the automotive industry and the volatility of stock markets, this method is only used as a supplement. The Company has concluded that presently none of its reporting units are “at risk” of failing the goodwill impairment test. See also discussion under Goodwill and Intangible Assets in Note 1 to Consolidated Financial Statements included herein.
Not even during the unprecedented challenges for the global automotive industry in 2009 and 2008 was the Company required to record a goodwill impairment charge. However, there can be no assurance that goodwill will not be impaired due to future significant drops in light vehicle production, or due to our technologies or products becoming obsolete or for any other reason. We could also acquire companies where goodwill could turn out to be less resilient to deteriorations in external conditions.
RECONCILIATIONS TO U.S. GAAP (DOLLARS IN MILLIONS)
| | | | | | | | | | |
Interest coverage ratio Full year 2012 | | | | | Leverage ratio December 31, 2012 | | | |
Operating income | | $ | 705.4 | | | Net debt (cash)3) | | $ | (360.8 | ) |
Amortization of intangibles1) | | | 20.2 | | | Pension liabilities | | | 255.4 | |
Operating profit per the Policy | | $ | 725.6 | | | Debt (cash) per the Policy | | $ | (105.4 | ) |
| | | | | | Income before income taxes | | $ | 668.6 | |
Interest expense net2) | | $ | 38.2 | | | Plus: Interest expense net2) | | | 38.2 | |
| | | | | | Depreciation and amortization of intangibles1) | | | 273.2 | |
Interest coverage ratio | | | 19.0 | | | EBITDA per the Policy | | $ | 980.0 | |
| | | | | | Leverage ratio4) | | | N/A | |
| 1) | Including impairment write-offs, if any. 2) Interest expense, net is interest expense including cost for extinguishment of debt less interest income. 3) Net debt (cash) is short- and long-term debt and debt-related derivatives (see Note 12) less cash and cash equivalents. 4) Leverage ratio is not applicable due to net cash position. |
Management’s Report on Internal Control over Financial Reporting
Management of the Company is responsible for establishing and maintaining adequate internal control over financial reporting.
Internal control over financial reporting is defined in Rules 13a-15(f) and 15d-15(f) under the Securities Exchange Act of 1934, as amended, as a process designed by, or under the supervision of, the company’s principal executive and principal financial officers and effected by the company’s board of directors, management and other personnel to provide reasonable assurance regarding the reliability of financial reporting and the preparation of financial statements for external purposes in accordance with generally accepted accounting principles and includes those policies and procedures that:
| | • | | pertain to the maintenance of records that in reasonable detail accurately and fairly reflect the transactions and dispositions of the assets of the company; |
| | • | | provide reasonable assurance that transactions are recorded as necessary to permit preparation of financial statements in accordance with generally accepted accounting principles, and that receipts and expenditures of the company are being made only in accordance with authorizations of management and directors of the company; and |
| | • | | provide reasonable assurance regarding prevention or timely detection of unauthorized acquisition, use or disposition of the company’s assets that could have a material effect on the financial statements. |
Because of its inherent limitations, internal control over financial reporting may not prevent or detect misstatements. Projections of any evaluation of effectiveness to future periods are subject to the risks that controls may become inadequate because of changes in conditions, or that the degree of compliance with the policies or procedures may deteriorate.
Management assessed the effectiveness of Autoliv’s internal control over financial reporting as of December 31, 2012. In making this assessment, we used the criteria set forth by the Committee of Sponsoring Organizations of the Treadway Commission (COSO) in Internal Control – Integrated Framework.
Based on our assessment, we believe that, as of December 31, 2012, the Company’s internal control over financial reporting is effective.
The Company’s independent auditors – Ernst & Young AB, an independent registered public accounting firm – have issued an audit report on the effectiveness of the Company’s internal control over financial reporting, which is included herein, see page 82 in the Annual Report.
There have not been any changes in the Company’s internal control over financial reporting (as such term is defined in Rules 13a-15(f) and 15d-15(f) under the Exchange Act) during the quarter ended December 31, 2012 that have materially affected, or are reasonably likely to materially affect, the Company’s internal control over financial reporting.
“Safe Harbor Statement”
This Annual Report contains statements that are not historical facts but rather forward-looking statements within the meaning of the Private Securities Litigation Reform Act of 1995. Such forward-looking statements include those that address activities, events or developments that Autoliv, Inc. or its management believes or anticipates may occur in the future. For example, forward-looking statements include, without limitation, statements relating to industry trends, business opportunities, sales contracts, sales backlog, and on-going commercial arrangements and discussions, as well as any statements about future operating performance or financial results.
In some cases, you can identify these statements by forward-looking words such as “estimates,” “expects,” “anticipates,” “projects,” “plans,” “intends,” “believes,” “may,” “might,” “will,” “should,” or the negative of these terms and other comparable terminology, although not all forward-looking statements contain such words.
All forward-looking statements, including without limitation, management’s examination of historical operating trends and data, are based upon our current expectations, various assumptions and data available from third parties. Our expectations and assumptions are expressed in good faith and we believe there is a reasonable basis for them. However, there can be no assurance that such forward-looking statements will materialize or prove to be correct as forward-looking statements are inherently subject to known and unknown risks, uncertainties and other factors which may cause actual future results, performance or achievements to differ materially from the future results, performance or achievements expressed in or implied by such forward-looking statements.
Because these forward-looking statements involve risks and uncertainties, the outcome could differ materially from those set out in the forward-looking statements for a variety of reasons, including without limitation, changes in and the successful execution of our capacity alignment, restructuring and cost reduction initiatives discussed herein and the market reaction thereto; changes in general industry market conditions or regional growth or declines; loss of business from increased competition; higher raw material, fuel and energy costs; changes in consumer and customer preferences for end products; customer losses; changes in regulatory conditions; customer bankruptcies; consolidations or restructuring; divestiture of customer brands; unfavorable fluctuations in currencies or interest rates among the various jurisdictions in which we operate; fluctuation in vehicle production schedules for which the Company is a supplier; component shortages; market acceptance of our new products; costs or difficulties related to the integration of any new or acquired businesses and technologies; continued uncertainty in program awards and performance; the financial results of companies in which Autoliv has made technology investments or joint-venture arrangements; pricing negotiations with customers; our ability to be awarded new business; product liability, warranty and recall claims and other litigation and customer reactions thereto; higher expenses for our pension and other postretirement benefits including higher funding requirements of our pension plans; work stoppages or other labor issues at our facilities or at the facilities of our customers or suppliers; possible adverse results of pending or future litigation or infringement claims; negative impacts of antitrust investigations or other governmental investigations and associated litigation relating to the conduct of our business; tax assessments by governmental authorities dependence on key personnel; legislative or regulatory changes limiting our business; political conditions; dependence on customers and suppliers; and other risks and uncertainties identified in Item 1A “Risk Factors” and Item 7 “Management’s Discussion and Analysis of Financial Condition and Results of Operations” in our 10-K for the year ended December 31, 2012. The Company undertakes no obligation to update publicly or revise any forward-looking statements in light of new information or future events.
For any forward-looking statements contained in this or any other document, we claim the protection of the safe harbor for forward-looking statements contained in the Private Securities Litigation Reform Act of 1995, and we assume no obligation to update any such statement.
Consolidated Statements of Net Income
| | | | | | | | | | | | | | | | |
| | | | | | Years ended December 31 | |
(DOLLARS AND SHARES IN MILLIONS, EXCEPT PER SHARE DATA) | | | | | 2012 | | | 2011 | | | 2010 | |
| | | | |
Net sales | | | Note 19 | | | $ | 8,266.7 | | | $ | 8,232.4 | | | $ | 7,170.6 | |
Cost of sales | | | | | | | (6,620.5 | ) | | | (6,504.5 | ) | | | (5,578.5 | ) |
| | | | | | | | | | | | | | | | |
Gross profit | | | | | | | 1,646.2 | | | | 1,727.9 | | | | 1,592.1 | |
| | | | | | | | | | | | | | | | |
| | | | |
Selling, general and administrative expenses | | | | | | | (366.7 | ) | | | (368.7 | ) | | | (327.2 | ) |
Research, development and engineering expenses, net | | | | | | | (455.4 | ) | | | (441.5 | ) | | | (361.3 | ) |
Amortization of intangibles | | | Note 9 | | | | (20.2 | ) | | | (18.6 | ) | | | (18.0 | ) |
Other income (expense), net | | | Notes 10, 16 | | | | (98.5 | ) | | | (9.9 | ) | | | (16.4 | ) |
| | | | | | | | | | | | | | | | |
Operating income | | | | | | | 705.4 | | | | 889.2 | | | | 869.2 | |
| | | | | | | | | | | | | | | | |
| | | | |
Equity in earnings of affiliates, net of tax | | | | | | | 8.1 | | | | 6.8 | | | | 5.5 | |
Interest income | | | Note 12 | | | | 3.4 | | | | 4.9 | | | | 3.4 | |
Interest expense | | | Note 12 | | | | (41.7 | ) | | | (62.0 | ) | | | (54.3 | ) |
Loss on extinguishment of debt | | | Notes 12, 13 | | | | — | | | | (6.2 | ) | | | (12.3 | ) |
Other financial items, net | | | | | | | (6.6 | ) | | | (4.4 | ) | | | (6.0 | ) |
| | | | | | | | | | | | | | | | |
Income before income taxes | | | | | | | 668.6 | | | | 828.3 | | | | 805.5 | |
| | | | | | | | | | | | | | | | |
| | | | |
Income tax expense | | | Note 4 | | | | (183.0 | ) | | | (201.3 | ) | | | (210.0 | ) |
| | | | | | | | | | | | | | | | |
Net income | | | | | | $ | 485.6 | | | $ | 627.0 | | | $ | 595.5 | |
| | | | | | | | | | | | | | | | |
| | | | |
Less: Net income attributable to non-controlling interests | | | | | | | 2.5 | | | | 3.6 | | | | 4.9 | |
| | | | | | | | | | | | | | | | |
Net income attributable to controlling interest | | | | | | $ | 483.1 | | | $ | 623.4 | | | $ | 590.6 | |
| | | | | | | | | | | | | | | | |
| | | | |
Earnings per common share | | | | | | | | | | | | | | | | |
- basic | | | | | | $ | 5.17 | | | $ | 6.99 | | | $ | 6.77 | |
- assuming dilution | | | | | | $ | 5.08 | | | $ | 6.65 | | | $ | 6.39 | |
Weighted average number of shares | | | | | | | | | | | | | | | | |
- basic | | | | | | | 93.5 | | | | 89.2 | | | | 87.3 | |
- assuming dilution | | | | | | | 95.1 | | | | 93.7 | | | | 92.4 | |
Cash dividend per share—declared | | | | | | $ | 1.94 | | | $ | 1.78 | | | $ | 1.05 | |
Cash dividend per share—paid | | | | | | $ | 1.89 | | | $ | 1.73 | | | $ | 0.65 | |
Consolidated Statements of Comprehensive Income
| | | | | | | | | | | | |
| | | Years ended December 31 | |
(DOLLARS IN MILLIONS) | | 2012 | | | 2011 | | | 2010 | |
| | | |
Net income | | $ | 485.6 | | | $ | 627.0 | | | $ | 595.5 | |
| | | |
Other comprehensive income (loss) before tax: | | | | | | | | | | | | |
Net change in cash flow hedges | | | — | | | | — | | | | 0.2 | |
Change in cumulative translation adjustments | | | 28.1 | | | | (41.8 | ) | | | (30.0 | ) |
Net change in unrealized components of defined benefit plans | | | (40.6 | ) | | | (56.9 | ) | | | (12.2 | ) |
| | | | | | | | | | | | |
Other comprehensive loss, before tax | | | (12.5 | ) | | | (98.7 | ) | | | (42.0 | ) |
| | | | | | | | | | | | |
| | | |
Benefit for taxes related to defined benefit plans | | | 14.5 | | | | 20.5 | | | | 4.4 | |
| | | | | | | | | | | | |
Other comprehensive income (loss), net of tax | | | 2.0 | | | | (78.2 | ) | | | (37.6 | ) |
| | | | | | | | | | | | |
| | | |
Comprehensive income | | | 487.6 | | | | 548.8 | | | | 557.9 | |
Less: Comprehensive income attributable to non-controlling interest | | | 2.7 | | | | 4.1 | | | | 5.2 | |
| | | | | | | | | | | | |
Comprehensive income attributable to controlling interest | | $ | 484.9 | | | $ | 544.7 | | | $ | 552.7 | |
| | | | | | | | | | | | |
See Notes to Consolidated Financial Statements.
Consolidated Balance Sheets
| | | | | | | | | | | | |
| | | | | | At December 31 | |
(DOLLARS AND SHARES IN MILLIONS) | | | | | 2012 | | | 2011 | |
| | | |
Assets | | | | | | | | | | | | |
Cash and cash equivalents | | | | | | $ | 977.7 | | | $ | 739.2 | |
Receivables, net | | | Note 5 | | | | 1,509.3 | | | | 1,457.8 | |
Inventories, net | | | Note 6 | | | | 611.0 | | | | 623.3 | |
Income tax receivables | | | Note 4 | | | | 27.6 | | | | 25.5 | |
Prepaid expenses | | | | | | | 59.6 | | | | 56.4 | |
Other current assets | | | | | | | 104.0 | | | | 98.1 | |
| | | | | | | | | | | | |
Total current assets | | | | | | | 3,289.2 | | | | 3,000.3 | |
| | | | | | | | | | | | |
| | | |
Property, plant and equipment, net | | | Note 8 | | | | 1,232.8 | | | | 1,121.2 | |
Investments and other non-current assets | | | Note 7 | | | | 341.3 | | | | 279.6 | |
Goodwill | | | Note 9 | | | | 1,610.8 | | | | 1,607.0 | |
Intangible assets, net | | | Note 9 | | | | 96.2 | | | | 109.2 | |
| | | | | | | | | | | | |
Total assets | | | | | | $ | 6,570.3 | | | $ | 6,117.3 | |
| | | | | | | | | | | | |
| | | |
Liabilities and equity | | | | | | | | | | | | |
Short-term debt | | | Note 12 | | | $ | 69.8 | | | $ | 302.8 | |
Accounts payable | | | | | | | 1,055.9 | | | | 1,083.9 | |
Accrued expenses | | | Notes 10, 11 | | | | 497.1 | | | | 465.9 | |
Income tax payable | | | Note 4 | | | | 53.9 | | | | 63.8 | |
Other current liabilities | | | | | | | 173.1 | | | | 169.5 | |
| | | | | | | | | | | | |
Total current liabilities | | | | | | | 1,849.8 | | | | 2,085.9 | |
| | | | | | | | | | | | |
| | | |
Long-term debt | | | Note 12 | | | | 562.9 | | | | 363.5 | |
Pension liability | | | Note 18 | | | | 255.4 | | | | 193.1 | |
Other non-current liabilities | | | | | | | 126.1 | | | | 125.8 | |
| | | | | | | | | | | | |
Total non-current liabilities | | | | | | | 944.4 | | | | 682.4 | |
| | | | | | | | | | | | |
| | | |
Commitments and contingencies | | | Notes 16, 17 | | | | | | | | | |
| | | |
Common stock1) | | | | | | | 102.8 | | | | 102.8 | |
Additional paid-in capital | | | | | | | 1,329.3 | | | | 1,472.8 | |
Retained earnings | | | | | | | 2,672.5 | | | | 2,374.6 | |
Accumulated other comprehensive loss | | | | | | | (40.5 | ) | | | (42.3 | ) |
Treasury stock (7.3 and 13.5 shares) | | | | | | | (305.5 | ) | | | (574.5 | ) |
| | | | | | | | | | | | |
Total parent shareholders’ equity | | | | | | | 3,758.6 | | | | 3,333.4 | |
| | | | | | | | | | | | |
| | | |
Non-controlling interests | | | | | | | 17.5 | | | | 15.6 | |
| | | | | | | | | | | | |
Total equity | | | Note 13 | | | | 3,776.1 | | | | 3,349.0 | |
| | | | | | | | | | | | |
| | | |
Total liabilities and equity | | | | | | $ | 6,570.3 | | | $ | 6,117.3 | |
| | | | | | | | | | | | |
| 1) | Number of shares: 350 million authorized, 102.8 million issued for both years, and 95.5 and 89.3 million outstanding, net of treasury shares, for 2012 and 2011, respectively. |
See Notes to Consolidated Financial Statements.
Consolidated Statements of Cash Flows
| | | | | | | | | | | | | | | | |
| | | | | | Years ended December 31 | |
(DOLLARS IN MILLIONS) | | | | | 2012 | | | 2011 | | | 2010 | |
| | | | |
Operating activities | | | | | | | | | | | | | | | | |
Net income | | | | | | $ | 485.6 | | | $ | 627.0 | | | $ | 595.5 | |
Adjustments to reconcile net income to net cash provided by operating activities: | | | | | | | | | | | | | | | | |
Depreciation and amortization | | | | | | | 273.2 | | | | 268.3 | | | | 281.7 | |
Deferred income taxes | | | | | | | (31.8 | ) | | | 5.0 | | | | 17.8 | |
Loss on extinguishment of debt | | | Notes 12, 13 | | | | — | | | | 6.2 | | | | 12.3 | |
Undistributed earnings from affiliated companies, net of dividends | | | | | | | (3.3 | ) | | | (0.4 | ) | | | 5.1 | |
Net change in: | | | | | | | | | | | | | | | | |
Receivables and other assets, gross | | | | | | | (48.4 | ) | | | (114.3 | ) | | | (227.8 | ) |
Inventories, gross | | | | | | | 6.9 | | | | (65.5 | ) | | | (50.4 | ) |
Accounts payable and accrued expenses | | | | | | | (28.0 | ) | | | 35.4 | | | | 230.4 | |
Income taxes | | | | | | | (10.6 | ) | | | (30.8 | ) | | | 37.3 | |
Other, net | | | | | | | 44.9 | | | | 27.3 | | | | 22.5 | |
| | | | | | | | | | | | | | | | |
Net cash provided by operating activities | | | | | | | 688.5 | | | | 758.2 | | | | 924.4 | |
| | | | | | | | | | | | | | | | |
| | | | |
Investing activities | | | | | | | | | | | | | | | | |
Expenditures for property, plant and equipment | | | | | | | (365.4 | ) | | | (367.3 | ) | | | (236.4 | ) |
Proceeds from sale of property, plant and equipment | | | | | | | 5.0 | | | | 10.3 | | | | 12.0 | |
Acquisition of businesses, net of cash acquired | | | Note 14 | | | | (1.8 | ) | | | (23.2 | ) | | | (77.4 | ) |
Net proceeds from divestitures | | | Note 14 | | | | 5.2 | | | | 5.4 | | | | — | |
Other | | | | | | | (1.2 | ) | | | 2.1 | | | | 4.6 | |
| | | | | | | | | | | | | | | | |
Net cash used in investing activities | | | | | | | (358.2 | ) | | | (372.7 | ) | | | (297.2 | ) |
| | | | | | | | | | | | | | | | |
| | | | |
Financing activities | | | | | | | | | | | | | | | | |
Net (decrease) increase in short-term debt | | | | | | | (119.8 | ) | | | 103.1 | | | | (278.6 | ) |
Issuance of long-term debt | | | | | | | 98.5 | | | | 47.1 | | | | 19.8 | |
Repayments and other changes in long-term debt | | | | | | | (9.4 | ) | | | (219.7 | ) | | | (170.8 | ) |
Cash paid for extinguishment of debt | | | | | | | — | | | | (6.3 | ) | | | (8.3 | ) |
Dividends paid to non-controlling interests | | | | | | | (0.8 | ) | | | (0.4 | ) | | | — | |
Capital contribution from non-controlling interests | | | | | | | — | | | | — | | | | 1.2 | |
Acquisition of subsidiary shares from non-controlling interest | | | | | | | — | | | | — | | | | (63.7 | ) |
Dividends paid | | | | | | | (177.6 | ) | | | (154.3 | ) | | | (57.7 | ) |
Common stock and purchase contract issue | | | | | | | 106.3 | | | | — | | | | — | |
Common stock options exercised | | | Note 15 | | | | 12.9 | | | | 12.9 | | | | 29.2 | |
Other, net | | | | | | | (1.4 | ) | | | (5.3 | ) | | | — | |
| | | | | | | | | | | | | | | | |
Net cash used in financing activities | | | | | | | (91.3 | ) | | | (222.9 | ) | | | (528.9 | ) |
| | | | | | | | | | | | | | | | |
| | | | |
Effect of exchange rate changes on cash and cash equivalents | | | | | | | (0.5 | ) | | | (11.1 | ) | | | 16.7 | |
| | | | | | | | | | | | | | | | |
Increase in cash and cash equivalents | | | | | | | 238.5 | | | | 151.5 | | | | 115.0 | |
| | | | |
Cash and cash equivalents at beginning of year | | | | | | | 739.2 | | | | 587.7 | | | | 472.7 | |
| | | | | | | | | | | | | | | | |
Cash and cash equivalents at end of year | | | | | | $ | 977.7 | | | $ | 739.2 | | | $ | 587.7 | |
| | | | | | | | | | | | | | | | |
See Notes to Consolidated Financial Statements.
Consolidated Statements of Total Equity
| | | | | | | | | | | | | | | | | | | | | | | | | | | | | | | | | | | | |
(DOLLARS AND SHARES IN
MILLIONS) | | Number of
shares | | | Common
stock | | | Additional
paid in
capital | | | Retained
earnings | | | Accumulated
other
comprehensive
income (loss) | | | Treasury
stock | | | Total parent
shareholders’
equity | | | Non-
controlling
interests | | | Total
equity1) | |
| | | | | | | | | |
Balance at December 31, 2009 | | | 102.8 | | | $ | 102.8 | | | $ | 1,559.0 | | | $ | 1,412.8 | | | $ | 74.3 | | | $ | (760.7 | ) | | $ | 2,388.2 | | | $ | 47.8 | | | $ | 2,436.0 | |
| | | | | | | | | | | | | | | | | | | | | | | | | | | | | | | | | | | | |
| | | | | | | | | |
Comprehensive Income: | | | | | | | | | | | | | | | | | | | | | | | | | | | | | | | | | | | | |
Net income | | | | | | | | | | | | | | | 590.6 | | | | | | | | | | | | 590.6 | | | | 4.9 | | | | 595.5 | |
Net change in cash flow hedges | | | | | | | | | | | | | | | | | | | 0.2 | | | | | | | | 0.2 | | | | | | | | 0.2 | |
Foreign currency translation | | | | | | | | | | | | | | | | | | | (30.3 | ) | | | | | | | (30.3 | ) | | | 0.3 | | | | (30.0 | ) |
Pension liability | | | | | | | | | | | | | | | | | | | (7.8 | ) | | | | | | | (7.8 | ) | | | | | | | (7.8 | ) |
Total Comprehensive Income | | | | | | | | | | | | | | | | | | | | | | | | | | | 552.7 | | | | 5.2 | | | | 557.9 | |
Common stock incentives2) | | | | | | | | | | | | | | | | | | | | | | | 34.6 | | | | 34.6 | | | | | | | | 34.6 | |
Cash dividends declared | | | | | | | | | | | | | | | (93.3 | ) | | | | | | | | | | | (93.3 | ) | | | | | | | (93.3 | ) |
Common stock issuance, net | | | | | | | | | | | (74.2 | ) | | | | | | | | | | | 131.3 | | | | 57.1 | | | | | | | | 57.1 | |
Investment in subsidiary by non-controlling interests | | | | | | | | | | | | | | | | | | | | | | | | | | | | | | | 1.2 | | | | 1.2 | |
Acquisition of non-controlling interests | | | | | | | | | | | | | | | | | | | | | | | | | | | | | | | 4.2 | | | | 4.2 | |
Purchase of subsidiary shares from non-controlling interests | | | | | | | | | | | (12.0 | ) | | | | | | | | | | | | | | | (12.0 | ) | | | (46.5 | ) | | | (58.5 | ) |
| | | | | | | | | | | | | | | | | | | | | | | | | | | | | | | | | | | | |
Balance at December 31, 2010 | | | 102.8 | | | $ | 102.8 | | | $ | 1,472.8 | | | $ | 1,910.1 | | | $ | 36.4 | | | $ | (594.8 | ) | | $ | 2,927.3 | | | $ | 11.9 | | | $ | 2,939.2 | |
| | | | | | | | | | | | | | | | | | | | | | | | | | | | | | | | | | | | |
| | | | | | | | | |
Comprehensive Income: | | | | | | | | | | | | | | | | | | | | | | | | | | | | | | | | | | | | |
Net income | | | | | | | | | | | | | | | 623.4 | | | | | | | | | | | | 623.4 | | | | 3.6 | | | | 627.0 | |
Foreign currency translation | | | | | | | | | | | | | | | | | | | (42.3 | ) | | | | | | | (42.3 | ) | | | 0.5 | | | | (41.8 | ) |
Pension liability | | | | | | | | | | | | | | | | | | | (36.4 | ) | | | | | | | (36.4 | ) | | | | | | | (36.4 | ) |
Total Comprehensive Income | | | | | | | | | | | | | | | | | | | | | | | | | | | 544.7 | | | | 4.1 | | | | 548.8 | |
Common stock incentives2) | | | | | | | | | | | | | | | | | | | | | | | 20.3 | | | | 20.3 | | | | | | | | 20.3 | |
Cash dividends declared | | | | | | | | | | | | | | | (158.9 | ) | | | | | | | | | | | (158.9 | ) | | | | | | | (158.9 | ) |
Dividends paid to non-controlling interests on subsidiary shares | | | | | | | | | | | | | | | | | | | | | | | | | | | | | | | (0.4 | ) | | | (0.4 | ) |
| | | | | | | | | | | | | | | | | | | | | | | | | | | | | | | | | | | | |
Balance at December 31, 2011 | | | 102.8 | | | $ | 102.8 | | | $ | 1,472.8 | | | $ | 2,374.6 | | | $ | (42.3 | ) | | $ | (574.5 | ) | | $ | 3,333.4 | | | $ | 15.6 | | | $ | 3,349.0 | |
| | | | | | | | | | | | | | | | | | | | | | | | | | | | | | | | | | | | |
| | | | | | | | | |
Comprehensive Income: | | | | | | | | | | | | | | | | | | | | | | | | | | | | | | | | | | | | |
Net income | | | | | | | | | | | | | | | 483.1 | | | | | | | | | | | | 483.1 | | | | 2.5 | | | | 485.6 | |
Foreign currency translation | | | | | | | | | | | | | | | | | | | 27.9 | | | | | | | | 27.9 | | | | 0.2 | | | | 28.1 | |
Pension liability | | | | | | | | | | | | | | | | | | | (26.1 | ) | | | | | | | (26.1 | ) | | | | | | | (26.1 | ) |
Total Comprehensive Income | | | | | | | | | | | | | | | | | | | | | | | | | | | 484.9 | | | | 2.7 | | | | 487.6 | |
Common stock incentives2) | | | | | | | | | | | | | | | | | | | | | | | 20.7 | | | | 20.7 | | | | | | | | 20.7 | |
Cash dividends declared | | | | | | | | | | | | | | | (185.2 | ) | | | | | | | | | | | (185.2 | ) | | | | | | | (185.2 | ) |
Common stock issuance, net | | | | | | | | | | | (143.5 | ) | | | | | | | | | | | 248.3 | | | | 104.8 | | | | | | | | 104.8 | |
Dividends paid to non-controlling interests on subsidiary shares | | | | | | | | | | | | | | | | | | | | | | | | | | | | | | | (0.8 | ) | | | (0.8 | ) |
| | | | | | | | | | | | | | | | | | | | | | | | | | | | | | | | | | | | |
Balance at December 31, 2012 | | | 102.8 | | | $ | 102.8 | | | $ | 1,329.3 | | | $ | 2,672.5 | | | $ | (40.5 | ) | | $ | (305.5 | ) | | $ | 3,758.6 | | | $ | 17.5 | | | $ | 3,776.1 | |
| | | | | | | | | | | | | | | | | | | | | | | | | | | | | | | | | | | | |
| 1) | See Note 13 for further details – includes tax effects where applicable. 2) See Notes 1 and 15 for further details – includes tax effects. |
See Notes to Consolidated Financial Statements.
Notes to Consolidated Financial Statements
1. Summary of Significant Accounting Policies
(Dollars in millions, except per share data)
Nature of Operations
Through its operating subsidiaries, Autoliv is a supplier of automotive safety systems, with a broad range of product offerings, including modules and components for passenger and driver-side airbags, side-impact airbag protection systems, seatbelts, steering wheels, safety electronics, whiplash protection systems and child seats, including components for such systems, as well as night vision systems, radar and other active safety systems. Autoliv has approximately 80 production facilities and operates in 29 countries. Our customers include the world’s largest car manufacturers.
Principles of Consolidation
The consolidated financial statements have been prepared in accordance with United States (U.S.) Generally Accepted Accounting Principles (GAAP) and include Autoliv, Inc. and all companies over which Autoliv, Inc. directly or indirectly exercises control, which as a general rule means that the Company owns more than 50% of the voting rights. Since January 1, 2010, consolidation is also required when the Company has both the power to direct the activities of a variable interest entity (VIE) and the obligation to absorb losses or right to receive benefits from the VIE that could be significant to the VIE.
All intercompany accounts and transactions within the Company have been eliminated from the consolidated financial statements.
Investments in affiliated companies in which the Company exercises significant influence over the operations and financial policies, but does not control, are reported using the equity method of accounting. Generally, the Company owns between 20 and 50 percent of such investments.
Business Combinations
From January 1, 2009 transactions in which the Company obtains control of a business are accounted for according to the acquisition method as described in Financial Accounting Standards Board (FASB) Accounting Standards Codification (ASC) 805, Business Combinations. The assets acquired and liabilities assumed are recognized and measured at their full fair values as of the date control is obtained, regardless of the percentage ownership in the acquired entity or how the acquisition was achieved. Acquisition related costs in connection with a business combination are expensed as incurred. Contingent considerations are recognized and measured at fair value at the acquisition date and classified as either liabilities or equity based on appropriate GAAP.
Use of Estimates
The preparation of consolidated financial statements in conformity with GAAP requires management to make estimates and assumptions that affect the reported amounts of assets and liabilities, disclosures of contingent assets and liabilities at the date of the consolidated financial statements, and the reported amounts of net sales and expenses during the reporting period. The accounting estimates that require management’s most significant judgments include the estimation of retroactive price adjustments, valuation of stock based payments, assessment of recoverability of goodwill and intangible assets, estimation of pension benefit obligations based on actuarial assumptions, estimation of accruals for warranty and product liabilities, restructuring charges, uncertain tax positions, valuation allowances and legal proceedings. Actual results could differ from those estimates.
Revenue Recognition
Revenues are recognized when there is evidence of a sales agreement, delivery of goods has occurred, the sales price is fixed and determinable and the collectability of revenue is reasonably assured. The Company records revenue from the sale of manufactured products upon shipment to customers and transfer of title and risk of loss under standard commercial terms (typically F.O.B. shipping point). In those limited instances where other terms are negotiated and agreed, revenue is recorded when title and risk of loss are transferred to the customer.
Accruals are made for retroactive price adjustments when probable and able to be reasonably estimated.
Net sales exclude taxes assessed by a governmental authority that are directly imposed on revenue-producing transactions between the Company and its customers.
Cost of Sales
Shipping and handling costs are included in Cost of sales in the Consolidated Statements of Net Income. Contracts to supply products which extend for periods in excess of one year are reviewed when conditions indicate that costs may exceed selling prices, resulting in losses. Losses on long-term supply contracts are recognized when probable and estimable.
Research, Development and Engineering (R,D&E)
Research and development and most engineering expenses are expensed as incurred. These expenses are reported net of income from contracts to perform engineering design and product development services. Such income is not significant in any period presented.
Certain engineering expenses related to long-term supply arrangements are capitalized when the defined criteria, such as the existence of a contractual guarantee for reimbursement, are met. The aggregate amount of such assets is not significant in any period presented.
Tooling is generally agreed upon as a separate contract or a separate component of an engineering contract, as a pre-production project. Capitalization of tooling costs is made only when the specific criteria for capitalization of customer-funded tooling are met or the criteria for capitalization as Property, Plant & Equipment (P,P&E) for tools owned by the Company are fulfilled. Depreciation on the Company’s own tooling is recognized in the Consolidated Statements of Net Income as Cost of sales.
Stock Based Compensation
The compensation costs for all of the Company’s stock-based compensation awards are determined based on the fair value method as defined in ASC 718, Compensation—Stock Compensation. The Company records the compensation expense for Restricted Stock Units (RSUs), awards under the Stock Incentive Plan, and stock options over the vesting period.
Income Taxes
Current tax liabilities and assets are recognized for the estimated taxes payable or refundable on the tax returns for the current year. In certain circumstances, payments or refunds may extend beyond twelve months, in such cases amounts would be classified as non-current taxes payable or refundable. Deferred tax liabilities or assets are recognized for the estimated future tax effects attributable to temporary differences and carry-forwards that result from events that have been recognized in either the financial statements or the tax returns, but not both. The measurement of current and deferred tax liabilities and assets is based on provisions of enacted tax laws. Deferred tax assets are reduced by the amount of any tax benefits that are not expected to be realized. Current and non-current components of deferred tax balances are reported separately based on financial statement classification of the related asset or liability giving rise to the temporary difference. If a deferred tax asset or liability is not related to an asset or liability that exists for financial reporting purposes, including deferred tax assets related to carry forwards, the deferred tax asset or liability would be classified based on the expected reversal date of the temporary differences. Tax assets and liabilities are not offset unless attributable to the same tax jurisdiction and netting is possible according to law and expected to take place in the same period.
Tax benefits associated with tax positions taken in the Company’s income tax returns are initially recognized and measured in the financial statements when it is more likely than not that those tax positions will be sustained upon examination by the relevant taxing authorities. The Company’s evaluation of its tax benefits is based on the probability of the tax position being upheld if challenged by the taxing authorities (including through negotiation, appeals, settlement and litigation). Whenever a tax position does not meet the initial recognition criteria, the tax benefit is subsequently recognized and measured if there is a substantive change in the facts and circumstances that cause a change in judgment concerning the sustainability of the tax position upon examination by the relevant taxing authorities. In cases where tax benefits meet the initial recognition criterion, the Company continues, in subsequent periods, to assess its ability to sustain those positions. A previously recognized tax benefit is derecognized when it is no longer more likely than not that the tax position would be sustained upon examination. Liabilities for unrecognized tax benefits are classified as non-current unless the payment of the liability is expected to be made within the next 12 months.
Earnings per Share
The Company calculates basic earnings per share (EPS) by dividing net income attributable to controlling interest by the weighted-average number of common shares outstanding for the period (net of treasury shares). When it would not be antidilutive (such as during periods of net loss), the diluted EPS also reflects the potential dilution that could occur if common stock were issued for awards under the Stock Incentive Plan and for common stock issued upon conversion of the equity units.
Cash Equivalents
The Company considers all highly liquid investment instruments purchased with a maturity of three months or less to be cash equivalents.
Receivables
The Company has guidelines for calculating the allowance for bad debts. In determining the amount of a bad debt allowance, management uses its judgment to consider factors such as the age of the receivables, the Company’s prior experience with the customer, the experience of other enterprises in the same industry, the customer’s ability to pay, and/or an appraisal of current economic conditions. Collateral is typically not required. There can be no assurance that the amount ultimately realized for receivables will not be materially different than that assumed in the calculation of the allowance.
Financial Instruments
The Company uses derivative financial instruments, “derivatives”, as part of its debt management to mitigate the market risk that occurs from its exposure to changes in interest and foreign exchange rates. The Company does not enter into derivatives for trading or other speculative purposes. The use of such derivatives is in accordance with the strategies contained in the Company’s overall financial policy. The derivatives outstanding at year-end are either interest rate swaps or foreign exchange swaps. All swaps principally match the terms and maturity of the underlying debt and no swaps have a maturity beyond 2019.
All derivatives are recognized in the consolidated financial statements at fair value. Certain derivatives are from time to time designated either as fair value hedges or cash flow hedges in line with the hedge accounting criteria. For certain other derivatives hedge accounting is not applied either because non-hedge accounting treatment creates the same accounting result or the hedge does not meet the hedge accounting requirements, although entered into applying the same rationale concerning mitigating market risk that occurs from changes in interest and foreign exchange rates.
When a hedge is classified as a fair value hedge, the change in the fair value of the hedge is recognized in the Consolidated Statements of Net Income along with the offsetting change in the fair value of the hedged item. When a hedge is classified as a cash flow hedge, any change in the fair value of the hedge is initially recorded in equity as a component of Other Comprehensive Income, (OCI), and reclassified into the Consolidated Statements of Net Income when the hedge transaction affects net earnings. There were no material reclassifications from OCI to the Consolidated Statements of Net Income in 2012 and, likewise, no material reclassifications are expected in 2013. Any ineffectiveness has been immaterial.
For further details on the Company’s financial instruments, see Note 3.
Inventories
The cost of inventories is computed according to the first-in, first-out method (FIFO). Cost includes the cost of materials, direct labor and the applicable share of manufacturing overhead. Inventories are evaluated based on individual or, in some cases, groups of inventory items. Reserves are established to reduce the value of inventories to the lower of cost or market, with the market generally defined as net realizable value for finished goods and replacement cost for raw materials and work-in-process. Excess inventories are quantities of items that exceed anticipated sales or usage for a reasonable period. The Company has guidelines for calculating provisions for excess inventories based on the number of months of inventories on hand compared to anticipated sales or usage. Management uses its judgment to forecast sales or usage and to determine what constitutes a reasonable period. There can be no assurance that the amount ultimately realized for inventories will not be materially different than that assumed in the calculation of the reserves.
Property, Plant and Equipment
Property, Plant and Equipment are recorded at historical cost. Construction in progress generally involves short-term projects for which capitalized interest is not significant. The Company provides for depreciation of property, plant and equipment computed under the straight-line method over the assets’ estimated useful lives. Depreciation on capital leases is recognized in the Consolidated Statements of Net Income over the shorter of the assets’ expected life or the lease contract terms. Repairs and maintenance are expensed as incurred.
The Company evaluates the carrying value of long-lived assets other than goodwill when indications of impairment are evident. Impairment testing is primarily done by using the cash flow method based on undiscounted future cash flows.
Goodwill and Intangible Assets
Goodwill represents the excess of the fair value of consideration transferred over the fair value of net assets of businesses acquired. Goodwill is not amortized, but is subject to at least an annual review for impairment. Other intangible assets, principally related to acquired technology and contractual relationships, are amortized over their useful lives which range from 3 to 25 years.
As of December 31, 2012 and 2011, the Company recorded goodwill of approximately $1.6 billion which nearly all is associated with the reporting unit Airbag & Seatbelt Systems. Approximately $1.2 billion is goodwill associated with the 1997 merger of Autoliv AB and the Automotive Safety Products Division of Morton International, Inc. The Company performs its annual impairment testing in the fourth quarter of each year. Impairment testing is required more often than annually if an event or circumstance indicates that an impairment, or decline in value, may have occurred. The impairment testing of goodwill is based on two different reporting units: 1) Airbag & Seatbelt Systems and 2) Active Safety Systems.
In conducting its impairment testing, the Company compares the estimated fair value of each of its reporting units to the related carrying value of the reporting unit. If the estimated fair value of a reporting unit exceeds its carrying value, goodwill is considered not to be impaired. If the carrying value of a reporting unit exceeds its estimated fair value, an impairment loss is measured and recognized by the amount which the carrying amount of the goodwill exceeds the implied fair value of the goodwill determined by assigning the fair value of the reporting unit to all of the assets and liabilities of that unit.
The estimated fair value of the reporting unit is determined by the discounted cash flow method taking into account expected long-term operating cash-flow performance. The Company discounts projected operating cash flows using its weighted average cost of capital, including a risk premium to adjust for market risk. The estimated fair value is based on automotive industry volume projections which are based on third-party and internally developed forecasts and discount rate assumptions. Significant assumptions include terminal growth rates, terminal operating margin rates, future capital expenditures and working capital requirements.
To supplement this analysis, the Company compares the market value of its equity, calculated by reference to the quoted market prices of its shares, to the book value of its equity.
There were no impairments of goodwill from 2010 through 2012.
Insurance Deposits
The Company has entered into liability and recall insurance contracts to mitigate the risk of costs associated with product recalls. These are accounted for under the deposit method of accounting based on the existing contractual terms.
Warranties and Recalls
The Company records liabilities for product recalls when probable claims are identified and when it is possible to reasonably estimate costs. Recall costs are costs incurred when the customer decides to formally recall a product due to a known or suspected safety concern. Product recall costs typically include the cost of the product being replaced as well as the customer’s cost of the recall, including labor to remove and replace the defective part.
Provisions for warranty claims are estimated based on prior experience, likely changes in performance of newer products and the mix and volume of products sold. The provisions are recorded on an accrual basis.
Restructuring Provisions
The Company defines restructuring expense to include costs directly associated with rightsizing, exit or disposal activities.
Estimates of restructuring charges are based on information available at the time such charges are recorded. In general, management anticipates that restructuring activities will be completed within a timeframe such that significant changes to the exit plan are not likely. Due to inherent uncertainty involved in estimating restructuring expenses, actual amounts paid for such activities may differ from amounts initially estimated.
Pension Obligations
The Company provides for both defined contribution plans and defined benefit plans. A defined contribution plan generally specifies the periodic amount that the employer must contribute to the plan and how that amount will be allocated to the eligible employees who perform services during the same period. A defined benefit pension plan is one that contains pension benefit formulas, which generally determine the amount of pension benefit that each employee will receive for services performed during a specified period of employment.
The amount recognized as a defined benefit liability is the net total of projected benefit obligation (PBO) minus the fair value of plan assets (if any) (see Note 18). The plan assets are measured at fair value. The inputs to the fair value measurement of the plan assets are mainly level 2 inputs (see Note 3).
Contingent Liabilities
Various claims, lawsuits and proceedings are pending or threatened against the Company or its subsidiaries, covering a range of matters that arise in the ordinary course of its business activities with respect to commercial, product liability or other matters (see Note 16).
The Company diligently defends itself in such matters and, in addition, carries insurance coverage to the extent reasonably available against insurable risks.
The Company records liabilities for claims, lawsuits and proceedings when they are probable and it is possible to reasonably estimate the cost of such liabilities. Legal costs expected to be incurred in connection with a loss contingency are expensed as such costs are incurred.
The Company believes, based on currently available information, that the resolution of outstanding matters, other than the antitrust matters, after taking into account recorded liabilities and available insurance coverage, should not have a material effect on the Company’s financial position or results of operations.
However, due to the inherent uncertainty associated with such matters, there can be no assurance that the final outcomes of these matters will not be materially different than currently estimated.
Translation of Non-U.S. Subsidiaries
The balance sheets of subsidiaries with functional currency other than U.S. dollars are translated into U.S. dollars using year-end rates of exchange.
The statement of operations of these subsidiaries is translated into U.S. dollars at the average rates of exchange for the year. Translation differences are reflected in equity as a component of OCI.
Receivables and Liabilities in Non-Functional Currencies
Receivables and liabilities not denominated in functional currencies are converted at year-end rates of exchange. Net transaction gains/(losses), reflected in the Consolidated Statements of Net Income amounted to $(5.6) million in 2012, $(11.1) million in 2011 and (9.1) million in 2010, and are recorded in operating income if they relate to operational receivables and liabilities or are recorded in other financial items, net if they relate to financial receivables and liabilities.
Recently Issued Accounting Pronouncements
In December 2011, the Financial Accounting Standards Board (FASB) issued Accounting Standards Update (ASU) No. 2011-12, “Deferral of the Effective Date for Amendments to the Presentation of Reclassifications of Items Out of Accumulated Other Comprehensive Income in ASU 2011-05”, which defers the requirement in ASU 2011-05 that companies present reclassification adjustment for each component of accumulated other comprehensive income (AOCI) in both net income and other comprehensive income (OCI) on the face of the financial statements. The effective dates of ASU 2011-12 are consistent with the effective dates of ASU 2011-05, which is effective for fiscal years and interim periods beginning after December 15, 2011. The adoption of ASU No. 2011-12 had no impact on the Company’s consolidated financial statements, other than presentation of comprehensive income.
In December 2011, the FASB issued ASU No. 2011-11, “Disclosures about Offsetting Assets and Liabilities”, which requires disclosure of financial instruments and derivatives that are either offset on the balance sheet in accordance with ASC 210-20-45 or ASC 815-10-45, or subject to a master netting arrangement, irrespective of whether they are offset on the balance sheet. ASU No. 2011-11 is effective for annual periods beginning on or after January 1, 2013 and interim periods within those annual periods. Entities should provide the disclosures required by this ASU retrospectively for all comparative periods presented. The adoption of ASU 2011-11 will have an impact on the Company’s disclosures about its financial instruments to the consolidated financial statements.
In June 2011, the FASB issued ASU No. 2011-05, “Presentation of Comprehensive Income,” which updates Accounting Standards Codification (“ASC”) Topic 220. The adoption of ASU No. 2011-05 eliminates the ability of reporting entities to present changes in other comprehensive income as a component of stockholders’ equity, and requires that changes in other comprehensive income be shown either in a continuous statement of comprehensive income or as a statement immediately following the statement of earnings. ASU No. 2011-05 is effective for interim and annual periods beginning after December 15, 2011. The adoption of ASU No. 2011-05 had no impact on the Company’s consolidated financial statements, other than presentation of comprehensive income.
In May 2011, the FASB issued ASU No. 2011-04, “Amendments to Achieve Common Fair Value Measurement and Disclosure Requirements in U.S. GAAP and IFRSs”, which updates ASC Topic 820. ASU No. 2011-04 clarifies the intent of ASC 820 around the highest and best use concept being relevant only to nonfinancial assets, the fair value of instruments in shareholders’ equity should be measured from the perspective of a market participant holding the instrument as an asset, and the appropriate usage of premiums and discounts in a fair value measurement. ASU No. 2011-04 is effective for interim and annual periods beginning after December 15, 2011. The adoption of ASU No. 2011-04 did not have an impact on the Company’s consolidated financial statements, other than disclosures related to fair value measurements.
Reclassifications
Certain prior-year amounts have been reclassified to conform to current year presentation.
2. Business Combinations
Business combinations generally take place to either gain key technology or strengthen Autoliv’s position in a certain geographical area or with a certain customer.
No significant business combinations have taken place during 2012 or 2011.
As of March 31, 2010, Autoliv acquired Delphi’s Occupant Protection Systems (OPS) operations in South Korea and China. The purchase price for this acquisition was $73 million and this acquisition did not result in any goodwill. The assets and liabilities assumed from these businesses were included in the Company’s consolidated financial statements as of March 31, 2010. The results from the operations have been included in the Consolidated Statements of Net Income from April 1, 2010.
3. Fair Value Measurements
Assets and liabilities measured at fair value on a recurring basis
The Company records derivatives at fair value. Any gains and losses on derivatives recorded at fair value are reflected in the Consolidated Statement of Net Income with the exception of cash flow hedges where an immaterial portion of the fair value is reflected in Other Comprehensive Income. The degree of judgment utilized in measuring the fair value of the instruments generally correlates to the level of pricing observability. Pricing observability is impacted by a number of factors, including the type of asset or liability, whether the asset or liability has an established market and the characteristics specific to the transaction. Derivatives with readily active quoted prices or for which fair value can be measured from actively quoted prices generally will have a higher degree of pricing observability and a lesser degree of judgment utilized in measuring fair value. Conversely, assets rarely traded or not quoted will generally have less, or no, pricing observability and a higher degree of judgment utilized in measuring fair value.
Under existing GAAP, there is a hierarchal disclosure framework associated with the level of pricing observability utilized in measuring assets and liabilities at fair value. The three broad levels defined by the hierarchy are as follows:
Level 1—Quoted prices are available in active markets for identical assets or liabilities as of the reported date.
Level 2—Pricing inputs are other than quoted prices in active markets, which are either directly or indirectly observable as of the reported date. The nature of these assets and liabilities include items for which quoted prices are available but traded less frequently, and items that are fair valued using other financial instruments, the parameters of which can be directly observed.
Level 3—Assets and liabilities that have little to no pricing observability as of the reported date. These items do not have two-way markets and are measured using management’s best estimate of fair value, where the inputs into the determination of fair value require significant management judgment or estimation.
The following table summarizes the valuation of the Company’s derivatives by the above pricing observability levels:
| | | | | | | | | | | | | | | | | | | | | | | | | | | | | | | | |
| | | Total carrying amount in Consolidated
Balance Sheets December 31 | | | Fair value measurement at December 31, using: | |
| | | | 2012 | | | 2011 | |
| DESCRIPTION | | 2012 | | | 2011 | | | Level 1 | | | Level 2 | | | Level 3 | | | Level 1 | | | Level 2 | | | Level 3 | |
Assets | | | | | | | | | | | | | | | | | | | | | | | | | | | | | | | | |
Derivatives | | $ | 16.5 | | | $ | 19.7 | | | | — | | | $ | 16.5 | | | | — | | | | — | | | $ | 19.7 | | | | — | |
| | | | | | | | | | | | | | | | | | | | | | | | | | | | | | | | |
Total Assets | | $ | 16.5 | | | $ | 19.7 | | | | — | | | $ | 16.5 | | | | — | | | | — | | | $ | 19.7 | | | | — | |
| | | | | | | | | | | | | | | | | | | | | | | | | | | | | | | | |
| | | | | | | | |
Liabilities | | | | | | | | | | | | | | | | | | | | | | | | | | | | | | | | |
Derivatives | | $ | 0.7 | | | $ | 0.6 | | | | — | | | $ | 0.7 | | | | — | | | | — | | | $ | 0.6 | | | | — | |
| | | | | | | | | | | | | | | | | | | | | | | | | | | | | | | | |
Total Liabilities | | $ | 0.7 | | | $ | 0.6 | | | | — | | | $ | 0.7 | | | | — | | | | — | | | $ | 0.6 | | | | — | |
| | | | | | | | | | | | | | | | | | | | | | | | | | | | | | | | |
The carrying value of cash and cash equivalents, accounts receivable, accounts payable, other current liabilities and short-term debt approximate their fair value because of the short-term maturity of these instruments. The fair value of long-term debt is determined either from quoted market prices as provided by participants in the secondary market or for long-term debt without quoted market prices estimated using a discounted cash flow method based on the Company’s current borrowing rates for similar types of financing. The fair value of derivatives is estimated using a discounted cash flow method based on quoted market prices. The Company has determined that each of these fair value measurements of debt reside within level 2 of the fair value hierarchy. The discount rates for all derivative contracts are based on bank deposit or swap interest rates. Credit risk has been considered when determining the discount rates used for the derivative contracts which, when aggregated by counterparty, are in a liability position.
The fair value and carrying value of debt is summarized in the table below. For further details on the Company’s debt, see Note 12.
FAIR VALUE OF DEBT, DECEMBER 31
| | | | | | | | | | | | | | | | |
| | | Carrying value1) | | | Fair value | | | Carrying value1) | | | Fair value | |
| DESCRIPTION | | 2012 | | | 2012 | | | 2011 | | | 2011 | |
Long-term debt | | | | | | | | | | | | | | | | |
U.S. private placement | | $ | 305.8 | | | $ | 329.5 | | | $ | 305.1 | | | $ | 331.9 | |
Medium-term notes | | | 99.8 | | | | 99.4 | | | | 43.3 | | | | 40.6 | |
Notes2) | | | 107.6 | | | | 108.9 | | | | — | | | | — | |
Other long-term debt | | | 49.7 | | | | 49.7 | | | | 15.1 | | | | 15.1 | |
| | | | | | | | | | | | | | | | |
Total | | $ | 562.9 | | | $ | 587.5 | | | $ | 363.5 | | | $ | 387.6 | |
| | | | | | | | | | | | | | | | |
| | | | |
Short-term debt | | | | | | | | | | | | | | | | |
Overdrafts and other short-term debt | | $ | 60.3 | | | $ | 60.3 | | | $ | 63.2 | | | $ | 63.2 | |
Short-term portion of long-term debt3) | | | 9.5 | | | | 9.5 | | | | 132.4 | | | | 136.5 | |
Notes2) | | | — | | | | — | | | | 107.2 | | | | 109.9 | |
| | | | | | | | | | | | | | | | |
Total | | $ | 69.8 | | | $ | 69.8 | | | $ | 302.8 | | | $ | 309.6 | |
| | | | | | | | | | | | | | | | |
| 1) | Debt as reported in balance sheet. |
| 2) | Notes issued as part of the equity units offering were remarketed in April 2012, final maturity in April 2014 (for further information see Note 12 and 13). |
| 3) | $110 million carrying value of U.S. private placement note matured in 2012. |
The tables below present information about the Company’s financial assets and liabilities measured at fair value on a recurring basis as of December 31, 2012 and 2011 and amount of gain (loss) recognized in the Consolidated Statement of Net Income for the years ending December 31, 2012, 2011 and 2010. Although the Company is party to close-out netting agreements with most derivative counterparties, the fair values in the tables below and in the Consolidated Balance Sheets at December 31, 2012 and 2011, have been presented on a gross basis.
FAIR VALUE MEASUREMENTS AT DECEMBER 31, 2012
| | | | | | | | | | | | | | |
DESCRIPTION | | Nominal volume | | | Derivative asset | | | Derivative liability | | | Balance Sheet location |
Derivatives designated as hedging instruments | | | | | | | | | | | | | | |
Interest rate swaps, less than 7 years (fair value hedge) | | $ | 60.0 | | | $ | 15.8 | | | $ | — | | | Other non-current asset |
| | | | | | | | | | | | | | |
Total derivatives designated as hedging instruments | | $ | 60.0 | | | $ | 15.8 | | | $ | — | | | |
| | | | | | | | | | | | | | |
| | | | |
Derivatives not designated as hedging instruments | | | | | | | | | | | | | | |
Foreign exchange swaps, less than 6 months | | $ | 700.8 | | | $ | 0.7 | | | $ | 0.7 | | | Other current assets/liabilities |
Total derivatives not designated as hedging instruments | | $ | 700.8 | | | $ | 0.7 | | | $ | 0.7 | | | |
| | | | | | | | | | | | | | |
Total derivatives | | $ | 760.8 | | | $ | 16.5 | | | $ | 0.7 | | | |
| | | | | | | | | | | | | | |
FAIR VALUE MEASUREMENTS AT DECEMBER 31, 2011
| | | | | | | | | | | | | | |
DESCRIPTION | | Nominal volume | | | Derivative asset | | | Derivative liability | | | Balance Sheet location |
Derivatives designated as hedging instruments | | | | | | | | | | | | | | |
Interest rate swaps, less than 8 years (fair value hedge) | | $ | 60.0 | | | $ | 15.1 | | | $ | — | | | Other non-current asset |
| | | | | | | | | | | | | | |
Total derivatives designated as hedging instruments | | $ | 60.0 | | | $ | 15.1 | | | $ | — | | | |
| | | | | | | | | | | | | | |
| | | | |
Derivatives not designated as hedging instruments | | | | | | | | | | | | | | |
Foreign exchange swaps, less than 6 months | | $ | 845.2 | 1) | | $ | 4.6 | | | $ | 0.6 | | | Other current assets/liabilities |
Total derivatives not designated as hedging instruments | | $ | 845.2 | | | $ | 4.6 | | | $ | 0.6 | | | |
| | | | | | | | | | | | | | |
Total derivatives | | $ | 905.2 | | | $ | 19.7 | | | $ | 0.6 | | | |
| | | | | | | | | | | | | | |
| 1) | The nominal value is netted for offsetting swaps with a counterpart with which Autoliv has a master netting agreement. The gross nominal value is $1,241.9 million. |
AMOUNT OF GAIN (LOSS) RECOGNIZED IN THE CONSOLIDATED STATEMENTS OF NET INCOME JANUARY-DECEMBER 2012
| | | | | | | | | | | | | | | | | | | | | | | | |
| | | Nominal
volume | | | Other
financial
items, net | | | Interest
expense | | | Interest income | | | Amount of gain (loss)
recognized in OCI on
derivative effective
portion | | | Amount of gain (loss)
reclassified from
accumulated OCI into
interest expense | |
Derivatives designated as hedging instruments | | | | | | | | | | | | | | | | | | | | | | | | |
Interest rate swaps, less than 7 years (fair value hedge) | | $ | 60.0 | | | | — | | | $ | 0.7 | | | | — | | | | — | | | | — | |
Total derivatives designated as hedging instruments | | $ | 60.0 | | | | | | | | | | | | | | | | | | | | | |
Hedged item (fair value hedge) | | | | | | | | | | | | | | | | | | | | | | | | |
Fixed rate private placement debt due 2019 | | $ | 60.0 | | | | — | | | $ | (0.7 | ) | | | — | | | | — | | | | — | |
Total gain (loss) in Consolidated Statement of Net Income | | | | | | | | | | $ | 0.0 | | | | | | | | | | | | | |
AMOUNT OF GAIN (LOSS) RECOGNIZED IN THE CONSOLIDATED STATEMENTS OF NET INCOME JANUARY-DECEMBER 2011
| | | | | | | | | | | | | | | | | | | | | | | | |
| | | Nominal
volume | | | Other
financial
items, net | | | Interest
expense | | | Interest income | | | Amount of gain (loss)
recognized in OCI on
derivative effective
portion | | | Amount of gain (loss)
reclassified from
accumulated OCI into
interest expense | |
Derivatives designated as hedging instruments | | | | | | | | | | | | | | | | | | | | | | | | |
Interest rate swaps, less than 8 years (fair value hedge) | | $ | 60.0 | | | | — | | | $ | 5.9 | | | | — | | | | — | | | | — | |
Total derivatives designated as hedging instruments | | $ | 60.0 | | | | | | | | | | | | | | | | | | | | | |
Hedged item (fair value hedge) | | | | | | | | | | | | | | | | | | | | | | | | |
Fixed rate private placement debt due 2019 | | $ | 60.0 | | | | — | | | $ | (5.9 | ) | | | — | | | | — | | | | — | |
Total gain (loss) in Consolidated Statement of Net Income | | | | | | | | | | $ | 0.0 | | | | | | | | | | | | | |
AMOUNT OF GAIN (LOSS) RECOGNIZED IN THE CONSOLIDATED STATEMENTS OF NET INCOME JANUARY-DECEMBER 2010
| | | | | | | | | | | | | | | | | | | | | | | | |
| | | Nominal
volume | | | Other
financial
items, net | | | Interest
expense | | | Interest income | | | Amount of gain (loss)
recognized in OCI on
derivative effective
portion | | | Amount of gain (loss)
reclassified from
accumulated OCI into
interest expense | |
Derivatives designated as hedging instruments | | | | | | | | | | | | | | | | | | | | | | | | |
Cross currency interest rate swaps, less than 1 year (cash flow hedge) | | $ | 54.0 | 1) | | $ | 1.9 | | | $ | — | | | $ | — | | | $ | — | | | $ | 0.2 | |
Interest rate swaps, less than 10 years (fair value hedge) | | | 60.0 | | | | — | | | | 2.8 | | | | — | | | | — | | | | — | |
Total derivatives designated as hedging instruments | | $ | 114.0 | | | | | | | | | | | | | | | | | | | | | |
Hedged item (fair value hedge) | | | | | | | | | | | | | | | | | | | | | | | | |
Fixed rate private placement debt due 2019 | | $ | 60.0 | | | | — | | | $ | (2.8 | ) | | | — | | | | — | | | | — | |
Total gain (loss) in Consolidated Statement of Net Income | | | | | | | | | | $ | 0.0 | | | | | | | | | | | | | |
| 1) | Cross currency interest rate swaps with a nominal value of $54 million have matured in 2010. |
AMOUNT OF GAIN (LOSS) RECOGNIZED IN THE CONSOLIDATED STATEMENTS OF NET INCOME JANUARY-DECEMBER
| | | | | | | | | | | | | | | | | | | | | | | | | | | | | | | | | | | | | | | | | | | | | | | | |
| | | Nominal volume | | | Other financial items,
net | | | Interest expense | | | Interest income | |
| | | 2012 | | | 2011 | | | 2010 | | | 2012 | | | 2011 | | | 2010 | | | 2012 | | | 2011 | | | 2010 | | | 2012 | | | 2011 | | | 2010 | |
Derivatives not designated as hedging instruments | | | | | | | | | | | | | | | | | | | | | | | | | | | | | | | | | | | | | | | | | | | | | | | | |
Cross currency interest rate swaps, less than 1 year | | $ | — | | | $ | — | | | $ | 40.3 | | | $ | — | | | $ | (3.8 | ) | | $ | 2.0 | | | $ | — | | | $ | 0.1 | | | $ | 0.2 | | | $ | — | | | $ | — | | | $ | — | |
Foreign exchange swaps | | | 700.8 | | | | 845.2 | 1) | | | 1,486.2 | | | | (4.0 | ) | | | 6.8 | | | | (1.0 | ) | | | (0.1 | ) | | | 0.2 | | | | (0.3 | ) | | | — | | | | — | | | | — | |
| | | | | | | | | | | | | | | | | | | | | | | | | | | | | | | | | | | | | | | | | | | | | | | | |
Total derivatives not designated as hedging instruments | | $ | 700.8 | | | $ | 845.2 | | | $ | 1,526.5 | | | | | | | | | | | | | | | | | | | | | | | | | | | | | | | | | | | | | |
| | | | | | | | | | | | | | | | | | | | | | | | | | | | | | | | | | | | | | | | | | | | | | | | |
| 1) | The nominal value is netted for offsetting swaps with a counterpart with which Autoliv has a master netting agreement. The gross nominal value is $1,241.9 million. |
All amounts recognized in the Consolidated Statements of Net Income related to derivatives, not designated as hedging instruments, relate to economic hedges and thus have been materially offset by an opposite statements of income effect of the related financial liabilities or financial assets.
Assets and liabilities measured at fair value on a non-recurring basis
In addition to assets and liabilities that are measured at fair value on a recurring basis, the Company also has assets and liabilities in its balance sheet that are measured at fair value on a non-recurring basis. Assets and liabilities that are measured at fair value on a non-recurring basis include long-lived assets, including investments in affiliates, and restructuring liabilities (see Note 10).
The Company has determined that the fair value measurements included in each of these assets and liabilities rely primarily on Company-specific inputs and the Company’s assumptions about the use of the assets and settlements of liabilities, as observable inputs are not available. The Company has determined that each of these fair value measurements reside within Level 3 of the fair value hierarchy. To determine the fair value of long-lived assets, the Company utilizes the projected cash flows expected to be generated by the long-lived assets, then discounts the future cash flows over the expected life of the long-lived assets. For restructuring obligations, the amount recorded represents the fair value of the payments expected to be made, and such provisions are discounted if the payments are expected to extend beyond one year.
As of December 31, 2012 and 2011, the Company had $75.8 million and $32.3 million, respectively, of restructuring reserves, which were measured at fair value upon initial recognition of the associated liability (see Note 10). The Company has not recorded any impairment charges on its long-lived assets during 2012 and 2011. In 2010, machinery and equipment with a carrying amount of $1.0 million was written down to its fair value of $0.0 million resulting in an impairment charge of $1.0 million, which was included in the Consolidated Statements of Net Income. There will be no future identifiable cash flows related to this group of impaired assets.
4. Income Taxes
| | | | | | | | | | | | |
INCOME BEFORE INCOME TAXES | | 2012 | | | 2011 | | | 2010 | |
U.S. | | $ | 171.2 | | | $ | 165.1 | | | $ | 132.8 | |
Non-U.S. | | | 497.4 | | | | 663.2 | | | | 672.7 | |
| | | | | | | | | | | | |
Total | | $ | 668.6 | | | $ | 828.3 | | | $ | 805.5 | |
| | | | | | | | | | | | |
| | | |
PROVISION FOR INCOME TAXES | | 2012 | | | 2011 | | | 2010 | |
Current | | | | | | | | | | | | |
U.S. federal | | $ | 62.8 | | | $ | 32.3 | | | $ | 60.9 | |
Non-U.S. | | | 146.2 | | | | 157.6 | | | | 120.0 | |
U.S. state and local | | | 5.8 | | | | 6.5 | | | | 11.3 | |
Deferred | | | | | | | | | | | | |
U.S. federal | | | 0.2 | | | | 1.8 | | | | (8.9 | ) |
Non-U.S. | | | (29.6 | ) | | | 3.0 | | | | 28.2 | |
U.S. state and local | | | (2.4 | ) | | | 0.1 | | | | (1.5 | ) |
| | | | | | | | | | | | |
Total income tax expense (benefit) | | $ | 183.0 | | | $ | 201.3 | | | $ | 210.0 | |
| | | | | | | | | | | | |
| | | |
EFFECTIVE INCOME TAX RATE | | 2012 | | | 2011 | | | 2010 | |
U.S. federal income tax rate | | | 35.0 | % | | | 35.0 | % | | | 35.0 | % |
Net operating loss carry-forwards | | | (0.2 | ) | | | (1.3 | ) | | | (0.9 | ) |
Non-utilized operating losses | | | 3.2 | | | | 1.4 | | | | 0.1 | |
Foreign tax rate variances | | | (7.3 | ) | | | (7.5 | ) | | | (8.6 | ) |
State taxes, net of federal benefit | | | 0.3 | | | | 0.5 | | | | 0.8 | |
Earnings of equity investments | | | (0.4 | ) | | | (0.3 | ) | | | (0.2 | ) |
Tax credits | | | (3.2 | ) | | | (3.0 | ) | | | (3.3 | ) |
Changes in tax reserves | | | (0.0 | ) | | | (2.4 | ) | | | (0.4 | ) |
Cost of double taxation | | | 0.9 | | | | 0.7 | | | | 1.9 | |
Withholding taxes | | | 1.3 | | | | 1.9 | | | | 2.7 | |
Statutory Investment Allowances | | | (2.3 | ) | | | (1.4 | ) | | | 0.0 | |
Antitrust Settlement | | | 0.9 | | | | — | | | | — | |
Other, net | | | (0.8 | ) | | | 0.7 | | | | (1.0 | ) |
| | | | | | | | | | | | |
Effective income tax rate | | | 27.4 | % | | | 24.3 | % | | | 26.1 | % |
| | | | | | | | | | | | |
Deferred income taxes reflect the net tax effects of temporary differences between the carrying amounts of assets and liabilities for financial reporting purposes and the amounts used for income tax purposes. On December 31, 2012, the Company had net operating loss carry-forwards (NOL’s) of approximately $302 million, of which approximately $218 million have no expiration date. The remaining losses expire on various dates through 2030. The Company also has $3.9 million of U.S. Foreign Tax Credit carry forwards, which expire in 2022. The Company also has Investment Tax Credit carry forwards of $8.3 million, which expire on various dates through 2021.
Valuation allowances have been established which partially offset the related deferred assets. The Company provides valuation allowances against potential future tax benefits when, in the opinion of management, based on the weight of available evidence, it is more likely than not that some portion of the deferred tax assets will not be realized. Such allowances are primarily provided against NOL’s of companies that have perennially incurred losses, as well as the NOL’s of companies that are start-up operations and have not established a pattern of profitability.
The Company has benefited from “tax holidays” in certain of its subsidiaries, principally in China. The foreign tax rate variance includes the effect of these tax holidays. These tax holidays typically take the form of reduced rates of tax on income for a period of several years following the establishment of an eligible company. These tax holidays have resulted in income tax savings of approximately $12 million
($0.13 per share) in 2012, $10 million ($0.11 per share) in 2011 and $18 million ($0.20 per share) in 2010. These special holiday rates expired at the end of 2012.
The Company has reserves for income taxes that may become payable in future periods as a result of tax audits. These reserves represent the Company’s best estimate of the potential liability for tax exposures. Inherent uncertainties exist in estimates of tax exposures due to changes in tax law, both legislated and concluded through the various jurisdictions’ court systems. The Company files income tax returns in the United States federal jurisdiction, and various states and foreign jurisdictions.
At any given time, the Company is undergoing tax audits in several tax jurisdictions, covering multiple years. The Company is no longer subject to income tax examination by the U.S. Federal tax authorities for years prior to 2009. With few exceptions, the Company is no longer subject to income tax examination by U.S. state or local tax authorities or by non-U.S. tax authorities for years before 2003. The Company concluded U.S. Federal tax audits covering years 2003-2008 in June 2011, and as a result of the conclusion of the U.S. tax audits and other proceedings, the Company released approximately $24 million of its tax reserves in the second quarter of 2011. The Company is undergoing tax audits in several non-U.S. jurisdictions covering multiple years. As of December 31, 2012, as a result of those tax examinations, the Company is not aware of any proposed income tax adjustments that would have a material impact on the Company’s financial statements, however, other audits could result in additional increases or decreases to the unrecognized tax benefits in some future period or periods.
The Company recognizes interest and potential penalties accrued related to unrecognized tax benefits in tax expense. As of January 1, 2012, the Company had recorded $15.6 million for unrecognized tax benefits related to prior years, including $2.5 million of accrued interest and penalties. During 2012, the Company recorded a net increase of $0.3 million to income tax reserves for unrecognized tax benefits based on tax positions related to the current and prior years and recorded a decrease of $0.3 million for interest and penalties related to unrecognized tax benefits of prior years. The Company had $2.2 million accrued for the payment of interest and penalties as of December 31, 2012. Of the total unrecognized tax benefits of $15.6 million recorded at December 31, 2012, $2.4 million is classified as current income tax payable, and $13.2 million is classified as non-current tax payable included in Other Non-Current Liabilities on the Consolidated Balance Sheet. Substantially all of these reserves would impact the effective tax rate if released into income.
| | | | | | | | | | | | |
TABULAR PRESENTATION OF
TAX BENEFITS UNRECOGNIZED | | 2012 | | | 2011 | | | 2010 | |
Unrecognized tax benefits at beginning of year | | $ | 14.0 | | | $ | 33.2 | | | $ | 37.1 | |
Gross amounts of increases and decreases: | | | | | | | | | | | | |
Increases as a result of tax positions taken during a prior period | | | 1.3 | | | | 5.1 | | | | 0.0 | |
Decreases as a result of tax positions taken during a prior period | | | (0.3 | ) | | | (4.0 | ) | | | (0.0 | ) |
Increases as a result of tax positions taken during the current period | | | 0.6 | | | | 1.9 | | | | 1.2 | |
Decreases as a result of tax positions taken during the current period | | | 0.0 | | | | 0.0 | | | | 0.0 | |
Decreases relating to settlements with taxing authorities | | | (0.3 | ) | | | (5.1 | ) | | | (1.0 | ) |
Decreases resulting from the lapse of the applicable statute of limitations | | | (1.3 | ) | | | (15.9 | ) | | | (4.2 | ) |
Translation Difference | | | 0.7 | | | | (1.2 | ) | | | 0.1 | |
| | | | | | | | | | | | |
Total unrecognized tax benefits at end of year | | $ | 14.7 | | | $ | 14.0 | | | $ | 33.2 | |
| | | | | | | | | | | | |
| | | | | | | | |
DEFERRED TAXES DECEMBER 31 | | 2012 | | | 2011 | |
Assets | | | | | | | | |
Provisions | | $ | 105.9 | | | $ | 96.1 | |
Costs capitalized for tax | | | 11.5 | | | | 5.9 | |
Property, plant and equipment | | | 26.1 | | | | 27.2 | |
Retirement Plans | | | 99.7 | | | | 79.8 | |
Tax receivables, principally NOL’s | | | 104.9 | | | | 80.8 | |
Deferred tax assets before allowances | | $ | 348.1 | | | $ | 289.8 | |
Valuation allowances | | | (44.8 | ) | | | (41.7 | ) |
| | | | | | | | |
Total | | $ | 303.3 | | | $ | 248.1 | |
| | | | | | | | |
| | |
Liabilities | | | | | | | | |
Acquired intangibles | | $ | (29.2 | ) | | $ | (31.9 | ) |
Statutory tax allowances | | | (1.5 | ) | | | (2.1 | ) |
Insurance deposit | | | (7.5 | ) | | | (7.6 | ) |
Distribution taxes | | | (43.0 | ) | | | (32.0 | ) |
Other | | | (2.5 | ) | | | (1.4 | ) |
| | | | | | | | |
Total | | $ | (83.7 | ) | | $ | (75.0 | ) |
| | | | | | | | |
Net deferred tax asset | | $ | 219.6 | | | $ | 173.1 | |
| | | | | | | | |
| | | | | | | | | | | | |
VALUATION ALLOWANCES AGAINST DEFERRED TAX ASSETS DECEMBER 31 | | 2012 | | | 2011 | | | 2010 | |
Allowances at beginning of year | | $ | 41.7 | | | $ | 30.1 | | | $ | 54.2 | |
Benefits reserved current year | | | 15.7 | | | | 31.2 | | | | 2.9 | |
Benefits recognized current year | | | (11.7 | ) | | | (15.1 | ) | | | (33.5 | ) |
Write-offs and other changes | | | (0.0 | ) | | | (1.5 | ) | | | 5.9 | |
Translation difference | | | (0.9 | ) | | | (3.0 | ) | | | 0.6 | |
Allowances at end of year | | $ | 44.8 | | | $ | 41.7 | | | $ | 30.1 | |
U.S. federal income taxes have not been provided on $4.0 billion of undistributed earnings of non-U.S. operations, which are considered to be permanently reinvested. Most of these undistributed earnings are not subject to withholding taxes upon distribution to intermediate holding companies. However, when appropriate, the Company provides for the cost of such distribution taxes. The Company has determined that it is not practicable to calculate the deferred tax liability if the entire $4.0 billion of earnings were to be distributed to the United States.
5. Receivables
| | | | | | | | | | | | |
DECEMBER 31 | | 2012 | | | 2011 | | | 2010 | |
Receivables | | $ | 1,516.6 | | | $ | 1,466.1 | | | $ | 1,375.1 | |
Allowance at beginning of year | | $ | (8.3 | ) | | $ | (7.5 | ) | | $ | (8.7 | ) |
Reversal of allowance | | | 2.1 | | | | 1.7 | | | | 2.2 | |
Addition to allowance | | | (2.1 | ) | | | (4.7 | ) | | | (2.1 | ) |
Write-off against allowance | | | 1.2 | | | | 2.0 | | | | 0.9 | |
Translation difference | | | (0.2 | ) | | | 0.2 | | | | 0.2 | |
Allowance at end of year | | $ | (7.3 | ) | | $ | (8.3 | ) | | $ | (7.5 | ) |
| | | | | | | | | | | | |
Total receivables, net of allowance | | $ | 1,509.3 | | | $ | 1,457.8 | | | $ | 1,367.6 | |
| | | | | | | | | | | | |
6. Inventories
| | | | | | | | | | | | |
DECEMBER 31 | | 2012 | | | 2011 | | | 2010 | |
Raw material | | $ | 287.7 | | | $ | 295.5 | | | $ | 271.8 | |
Work in progress | | | 225.9 | | | | 219.9 | | | | 216.7 | |
Finished products | | | 180.9 | | | | 184.0 | | | | 154.8 | |
Inventories | | $ | 694.5 | | | $ | 699.4 | | | $ | 643.3 | |
| | | |
Inventory reserve at beginning of year | | $ | (76.1 | ) | | $ | (81.6 | ) | | $ | (84.8 | ) |
Reversal of reserve | | | 5.3 | | | | 5.1 | | | | 8.1 | |
Addition to reserve | | | (22.9 | ) | | | (17.2 | ) | | | (16.1 | ) |
Write-off against reserve | | | 10.4 | | | | 16.9 | | | | 10.2 | |
Translation difference | | | (0.2 | ) | | | 0.7 | | | | 1.0 | |
Inventory reserve at end of year | | $ | (83.5 | ) | | $ | (76.1 | ) | | $ | (81.6 | ) |
| | | | | | | | | | | | |
Total inventories, net of reserve | | $ | 611.0 | | | $ | 623.3 | | | $ | 561.7 | |
| | | | | | | | | | | | |
7. Investments and Other Non-current Assets
As of December 31, 2012 the Company had invested in four affiliated companies, which it currently does not control, but in which it exercises significant influence over operations and financial position. These investments are accounted for under the equity method, which means that a proportional share of the affiliated company’s net income increases the investment, and a proportional share of losses and payment of dividends decreases it. In the Consolidated Statements of Net Income, the proportional share of the affiliated company’s net
income (loss) is reported as “Equity in earnings of affiliates”. The Company is applying deposit accounting for an insurance arrangement. For additional information on derivatives see Note 3.
| | | | | | | | |
DECEMBER 31 | | 2012 | | | 2011 | |
Investments in affiliated companies | | $ | 25.4 | | | $ | 21.0 | |
Deferred tax assets | | | 200.6 | | | | 162.1 | |
Income tax receivables | | | 50.8 | | | | 33.2 | |
Derivative assets | | | 15.8 | | | | 15.1 | |
Long-term interest bearing deposit (insurance arrangement) | | | 23.2 | | | | 22.6 | |
Other non-current assets | | | 25.5 | | | | 25.6 | |
| | | | | | | | |
Investments and other non-current assets | | $ | 341.3 | | | $ | 279.6 | |
| | | | | | | | |
The most significant investments in affiliated companies and the respective percentage of ownership are:
| | | | | | |
COUNTRY | | Ownership % | | | Company name |
France | | | 49 | % | | EAK SA Composants pour L’Industrie Automobile |
France | | | 49 | % | | EAK SNC Composants pour L’Industrie Automobile |
Malaysia | | | 49 | % | | Autoliv-Hirotako Safety Sdn Bhd (parent and subsidiaries) |
China | | | 30 | % | | Changchun Hongguang-Autoliv Vehicle Safety Systems Co. Ltd. |
8. Property, Plant and Equipment
| | | | | | | | | | | | |
DECEMBER 31 | | 2012 | | | 2011 | | | Estimated life | |
Land and land improvements | | $ | 119.3 | | | $ | 118.5 | | | | n/a to 15 | |
Machinery and equipment | | | 3,030.1 | | | | 2,819.2 | | | | 3-8 | |
Buildings | | | 764.3 | | | | 739.0 | | | | 20-40 | |
Construction in progress | | | 213.7 | | | | 177.8 | | | | n/a | |
| | | | | | | | | | | | |
Property, plant and equipment | | $ | 4,127.4 | | | $ | 3,854.5 | | | | | |
| | | | | | | | | | | | |
Less accumulated depreciation | | | (2,894.6 | ) | | | (2,733.3 | ) | | | | |
| | | | | | | | | | | | |
Net of depreciation | | $ | 1,232.8 | | | $ | 1,121.2 | | | | | |
| | | | | | | | | | | | |
| | | |
DEPRECIATION INCLUDED IN | | 2012 | | | 2011 | | | 2010 | |
Cost of sales | | $ | 225.4 | | | $ | 221.0 | | | $ | 233.6 | |
Selling, general and administrative expenses | | | 8.2 | | | | 8.7 | | | | 8.7 | |
Research, development and engineering expenses | | | 19.4 | | | | 20.0 | | | | 21.4 | |
| | | | | | | | | | | | |
Total | | $ | 253.0 | | | $ | 249.7 | | | $ | 263.7 | |
| | | | | | | | | | | | |
No fixed asset impairments were recognized during 2012 and 2011. Total fixed asset impairments in 2010 were $1.0 million, of which all were associated with restructuring activities.
The net book value of machinery and equipment under capital lease contracts recorded as of December 31, 2012 and 2011, amounted to $0.7 million and $0.9 million, respectively. The net book value of buildings and land under capital lease contracts recorded as of December 31, 2012 and 2011, amounted to $1.7 and $2.1 million, respectively.
9. Goodwill and Intangible Assets
| | | | | | | | |
UNAMORTIZED INTANGIBLES | | 2012 | | | 2011 | |
Goodwill | | | | | | | | |
Carrying amount at beginning of year | | $ | 1,607.0 | | | $ | 1,612.3 | |
Acquisitions and purchase price adjustments | | | — | | | | — | |
Translation differences | | | 3.8 | | | | (5.3 | ) |
| | | | | | | | |
Carrying amount at end of year | | $ | 1,610.8 | | | $ | 1,607.0 | |
| | | | | | | | |
| | |
AMORTIZED INTANGIBLES | | 2012 | | | 2011 | |
Gross carrying amount | | $ | 403.4 | | | $ | 393.6 | |
Accumulated amortization | | | (307.2 | ) | | | (284.4 | ) |
| | | | | | | | |
Carrying value | | $ | 96.2 | | | $ | 109.2 | |
| | | | | | | | |
No significant impairments were recognized during 2012, 2011 or 2010.
At December 31, 2012, goodwill assets include $1.2 billion associated with the 1997 merger of Autoliv AB and the Automotive Safety Products Division of Morton International, Inc.
At December 31, 2012, intangible assets subject to amortization mainly relate to acquired technology and contractual relationships. The aggregate amortization expense on intangible assets was $20.2 million in 2012, $18.6 million in 2011 and $18.0 million in 2010. The estimated amortization expense is as follows (in millions): 2013: $20.2; 2014: $16.2; 2015: $12.6; 2016: $11.6 and 2017: $10.7.
10. Restructuring and Other Liabilities
Restructuring
Restructuring provisions are made on a case-by-case basis and primarily include severance costs incurred in connection with headcount reductions and plant consolidations. The Company expects to finance restructuring programs over the next several years through cash generated from its ongoing operations or through cash available under existing credit facilities. The Company does not expect that the execution of these programs will have an adverse impact on its liquidity position. The tables below summarize the change in the balance sheet position of the restructuring reserves from December 31, 2009 to December 31, 2012.
2012
In 2012, the employee-related restructuring provisions, made on a case-by-case basis, relate mainly to headcount reductions in Europe. The cash payments mainly relate to high-cost countries in Europe. The changes in the employee-related reserves have been charged against Other income (expense), net in the Consolidated Statements of Net Income. The table below summarizes the change in the balance sheet position of the restructuring reserves from December 31, 2011 to December 31, 2012.
| | | | | | | | | | | | | | | | | | | | | | | | |
| | | December 31
2011 | | | Provision/
Charge | | | Provision/
Reversal | | | Cash
payments | | | Translation
difference | | | December 31
2012 | |
Restructuring employee-related | | $ | 31.4 | | | $ | 76.6 | | | $ | (1.8 | ) | | $ | (33.3 | ) | | $ | 2.0 | | | $ | 74.9 | |
Other | | | 0.9 | | | | 0.3 | | | | (0.3 | ) | | | (0.0 | ) | | | — | | | | 0.9 | |
| | | | | | | | | | | | | | | | | | | | | | | | |
Total reserve | | $ | 32.3 | | | $ | 76.9 | | | $ | (2.1 | ) | | $ | (33.3 | ) | | $ | 2.0 | | | $ | 75.8 | |
| | | | | | | | | | | | | | | | | | | | | | | | |
2011
In 2011, the employee-related restructuring provisions, made on a case-by-case basis, relate mainly to headcount reductions throughout Europe and North America. Reversals in 2011 mainly relate to restructuring reserves in Europe and were due to capacity reduction that was not as severe as originally estimated. The cash payments mainly relate to high-cost countries in Europe and in Australia. The changes in the employee-related reserves have been charged against Other income (expense), net in the Consolidated Statements of Net Income. The table below summarizes the change in the balance sheet position of the restructuring reserves from December 31, 2010 to December 31, 2011.
| | | | | | | | | | | | | | | | | | | | | | | | |
| | | December 31
2010 | | | Provision/
Charge | | | Provision/
Reversal | | | Cash
payments | | | Translation
difference | | | December 31
2011 | |
Restructuring employee-related | | $ | 48.4 | | | $ | 10.1 | | | $ | (4.9 | ) | | $ | (22.2 | ) | | $ | (0.0 | ) | | $ | 31.4 | |
Other | | | 0.2 | | | | 0.8 | | | | — | | | | (0.1 | ) | | | — | | | | 0.9 | |
| | | | | | | | | | | | | | | | | | | | | | | | |
Total reserve | | $ | 48.6 | | | $ | 10.9 | | | $ | (4.9 | ) | | $ | (22.3 | ) | | $ | (0.0 | ) | | $ | 32.3 | |
| | | | | | | | | | | | | | | | | | | | | | | | |
2010
In 2010, the employee-related restructuring provisions, made on a case-by-case basis, relate mainly to headcount reductions throughout Europe. Reversals in 2010 mainly relate to restructuring reserves in North America and Europe and were due to capacity reduction that was not as severe as originally estimated. The cash payments mainly relate to high-cost countries in Europe and in Australia. The
changes in the employee-related reserves have been charged against Other income (expense), net in the Consolidated Statements of Net Income. Impairment charges mainly relate to machinery and equipment impaired in connection with restructuring activities in Australia and Japan. The fixed asset impairments have been charged against Cost of sales in the Consolidated Statements of Net Income. The table below summarizes the change in the balance sheet position of the restructuring reserves from December 31, 2009 to December 31, 2010.
| | | | | | | | | | | | | | | | | | | | | | | | | | | | |
| | | December 31
2009 | | | Provision/
Charge | | | Provision/
Reversal | | | Cash
payments | | | Non-cash | | | Translation
difference | | | December 31
2010 | |
Restructuring employee-related | | $ | 100.1 | | | $ | 30.3 | | | $ | (10.2 | ) | | $ | (66.1 | ) | | $ | — | | | $ | (5.7 | ) | | $ | 48.4 | |
Fixed asset impairment | | | — | | | | 1.0 | | | | — | | | | — | | | | (1.0 | ) | | | — | | | | — | |
Other | | | 0.2 | | | | 0.2 | | | | — | | | | (0.2 | ) | | | — | | | | — | | | | 0.2 | |
| | | | | | | | | | | | | | | | | | | | | | | | | | | | |
Total reserve | | $ | 100.3 | | | $ | 31.5 | | | $ | (10.2 | ) | | $ | (66.3 | ) | | $ | (1.0 | ) | | $ | (5.7 | ) | | $ | 48.6 | |
| | | | | | | | | | | | | | | | | | | | | | | | | | | | |
11. Product Related Liabilities
Autoliv is exposed to product liability and warranty claims in the event that the Company’s products fail to perform as expected and such failure results, or is alleged to result, in bodily injury, and/or property damage or other loss. The Company has reserves for product risks. Such reserves are related to product performance issues including recall, product liability and warranty issues.
The Company records liabilities for product-related risks when probable claims are identified and when it is possible to reasonably estimate costs. Provisions for warranty claims are estimated based on prior experience, likely changes in performance of newer products, and the mix and volume of the products sold. The provisions are recorded on an accrual basis.
The increase in reserve in 2012 and 2011 mainly relates to warranty related issues. The increase in the reserve in 2010 mainly relates to recall related issues.
Cash payments in 2012 mainly relate to warranty related issues, and cash payments in 2011 mainly relate to recall related issues. Cash payments were made mainly for warranty related issues in 2010.
The table below summarizes the change in the balance sheet position of the product-related liabilities.
| | | | | | | | | | | | |
DECEMBER 31 | | 2012 | | | 2011 | | | 2010 | |
Reserve at beginning of the year | | $ | 33.0 | | | $ | 39.2 | | | $ | 30.6 | |
Change in reserve | | | 19.3 | | | | 14.8 | | | | 25.4 | |
Cash payments | | | (22.7 | ) | | | (21.2 | ) | | | (17.0 | ) |
Translation difference | | | 0.3 | | | | 0.2 | | | | 0.2 | |
| | | | | | | | | | | | |
Reserve at end of the year | | $ | 29.9 | | | $ | 33.0 | | | $ | 39.2 | |
| | | | | | | | | | | | |
12. Debt and Credit Agreements
As part of its debt management, the Company enters into derivatives to achieve economically effective hedges and to minimize the cost of its funding. In this note, short-term debt and long-term debt are discussed including Debt-Related Derivatives (DRD), i.e. debt including fair value adjustments from hedges. The Debt Profile table also shows debt excluding DRD, i.e. reconciled to debt as reported in the balance sheet.
SHORT-TERM DEBT
As of December 31, 2012, total short-term debt was $70 million including $9 million of short-term portion of long-term loans. On April 30, 2012, Autoliv settled the purchase contracts underlying the equity units by issuing approximately 5.8 million shares of common stock in exchange for $106 million in proceeds generated by the maturity of the U.S. Treasury securities purchased following the remarketing (see below). In November 2012, $110 million of the short-term portion of U.S. private placement notes, which carried fixed interest rates of 5.6%, matured. The short-term portion of long-term loans consists of loans and financing at the subsidiary level, primarily $6 million of loans in Brazil carrying interest rates of 4.5% and $3 million of loans in Japan carrying interest rates of 1.6%.
The Company’s subsidiaries also have credit agreements, principally in the form of overdraft facilities, with a number of local banks. Total available short-term facilities, as of December 31, 2012, excluding commercial paper facilities as described below, amounted to $344 million, of which $60 million was utilized. The aggregate amount of unused short-term lines of credit at December 31, 2012 was $284 million. The weighted average interest rate on total short-term debt outstanding at December 31, 2012 and 2011 excluding the short-term portion of long-term debt was 3.7% and 8.8%, respectively. The lower average interest rate in 2012 compared to 2011 is due to lower short-term borrowing in Brazil, where interest rates are relatively higher.
LONG-TERM DEBT – OUTSTANDING LOANS
Long-term debt of $547 million consists of $290 million of senior notes issued in 2007 as private placements by Autoliv ASP Inc., a wholly owned subsidiary of the Company. The notes were guaranteed by the Company and consist of 4 tranches of varying sizes maturing in 2012 (see above), 2014, 2017 and 2019 respectively, which all carried fixed interest rates between 5.6% and 6.2%. The Company entered into
swap arrangements with respect to part of the proceeds of the notes offering, most of which were cancelled in 2008 resulting in a mark-to-market gain. This gain is amortized through interest expense over the life of the respective notes.
As of December 31, 2012, only one interest rate swap with nominal value of $60 million remains outstanding. Consequently, $230 million of the long-term notes carry fixed interest rates varying between 4.6% and 5.8%, when including the amortization of the cancelled swaps, while $60 million carry floating interest rates at three-month LIBOR + 1.0%.
In March 2012, Autoliv completed the remarketing of the senior notes related to the equity units and the coupon of the notes was reset to 3.854% with a yield of 2.875%. The notes will have a carrying amount of $106 million at maturity, April 30, 2014. The remaining unamortized premium was $2 million at December 31, 2012.
In 2011, the Company repurchased a SEK 600 million note ($92 million equivalent) maturing in 2014 which carried a floating interest of STIBOR +3.9% at a discount and as a result reported $6.2 million as debt extinguishment cost. The Company also, to the same investor, issued a SEK 300 million note ($46 million equivalent) maturing in 2017 carrying a floating interest rate of STIBOR + 0.95%.
A new fixed-rate note was issued in December 2012 of 350 million SEK ($54 million equivalent). The 5-year note will mature in December 2017 and carries a fixed interest rate of 2.49%, which represents the European Investment Bank’s (EIB) cost of funds plus 0.3%. The remaining other long-term debt of $50 million, consisted primarily of $41 million equivalent loans borrowed by Autoliv do Brazil Ltda (a wholly-owned subsidiary), carrying an interest rate of 9.6%, of $4 million equivalent loans borrowed locally in Russia by Autoliv OOO (wholly-owned subsidiary) which carry an interest rate of 8.8% and of $4 million equivalent of loans borrowed from Japanese banks by Autoliv KK (a wholly-owned subsidiary), which carry an interest rate of 1.6%.
LONG-TERM DEBT – LOAN FACILITIES
In April 2011, the Company refinanced its revolving credit facility (RCF) of $1,100 million. The facility is syndicated among 14 banks and has two extension options where Autoliv can request the banks to extend the maturity to 2017 and 2018, respectively, on the first and second anniversary of the April 2011 loan facility, a so called 5+1+1 structure. In April 2012, Autoliv extended by one year essentially all of its $1,100 million RCF from April 2016 to April 2017 with unchanged terms and conditions. The Company pays a commitment fee of 0.19% (given the rating of BBB+ from Standard & Poor’s at December 31, 2012). Financing costs of $5 million were incurred in April 2011 and are amortized over the expected life of the facility. Borrowings under this facility are unsecured and bear interest based on the relevant LIBOR or IBOR rate. The commitment is available for general corporate purposes. Borrowings are prepayable at any time and are due at the respective expiration date. The extension fee of $0.5 million, incurred in April 2012, is amortized over the remaining expected life of the facility.
In June 2009, Autoliv AB, (a wholly-owned subsidiary) received an 18-month irrevocable loan commitment from the EIB of €225 million ($297 million equivalent). In July 2011, this commitment was amended and extended. In December 2012, a portion of this loan commitment was utilized (a SEK denominated note was issued, see above) and the remainder of the total €225 million EIB commitment expired.
In 2011, Autoliv also cancelled two other revolving credit facilities totaling $511 million as the Company’s refinanced credit facility and other commitments are more cost efficient.
As a result Autoliv has a $1.1 billion unutilized long-term debt facility available. The Company is not subject to any financial covenants, i.e. performance related restrictions, in any of its significant long-term borrowings or commitments.
The Company has two commercial paper programs: one SEK 7 billion (approx. $1,071 million) Swedish program and one $1,000 million U.S. program. Due to the cash position and the strong cash flow generation in 2012, both programs were unutilized at year-end. When notes have been outstanding under these programs, all of the notes have been classified as long-term debt because the Company has had the ability and intent to refinance these borrowings on a long-term basis either through continued commercial paper borrowings or utilization of the long-term credit facilities described above.
CREDIT RISK
In the Company’s financial operations, credit risk arises in connection with cash deposits with banks and when entering into forward exchange agreements, swap contracts or other financial instruments. In order to reduce this risk, deposits and financial instruments are only entered with a limited number of banks up to a calculated risk amount of $150 million per bank for banks rated A- or above and up to $50 million for banks rated BBB+. The policy of the Company is to work with banks that have a high credit rating and that participate in the Company’s financing. In addition to this, deposits can be placed in U.S. and Swedish government paper as well as up to $1,000 million in certain AAA rated money market funds. At year end 2012, the Company had $307 million in money market funds and $200 million in U.S. government paper.
The table below shows debt maturity as cash flow in the upper part which is reconciled with reported debt in the last row. For a description of hedging instruments used as part of debt management, see the Financial Instruments section of Note 1 and Note 3.
DEBT PROFILE
| | | | | | | | | | | | | | | | | | | | | | | | | | | | | | | | |
PRINCIPAL AMOUNT BY EXPECTED MATURITY | | 2013 | | | 2014 | | | 2015 | | | 2016 | | | 2017 | | | Thereafter | | | Total
long-term | | | Total | |
U.S. private placement notes (incl. DRD1))
(Weighted average interest rate 4.6%)2) | | $ | — | | | $ | 125.0 | | | $ | — | | | $ | — | | | $ | 105.0 | | | $ | 60.0 | | | $ | 290.0 | | | $ | 290.0 | |
Overdraft/Other short-term debt (incl. DRD1))
(Weighted average interest rate 3.7%) | | | 60.3 | | | | — | | | | — | | | | — | | | | — | | | | — | | | | — | | | | 60.3 | |
Notes issued as a part of Equity units3)
(Interest rate 3.9%) | | | — | | | | 107.6 | | | | — | | | | — | | | | — | | | | — | | | | 107.6 | | | | 107.6 | |
Medium-term notes
(Weighted average interest rate 2.4%) | | | — | | | | — | | | | — | | | | — | | | | 99.8 | | | | — | | | | 99.8 | | | | 99.8 | |
Other long-term loans, incl. current portion4)
(Weighted average interest rate 8.0%) | | | 9.5 | | | | 47.6 | | | | 2.1 | | | | — | | | | — | | | | — | | | | 49.7 | | | | 59.2 | |
| | | | | | | | | | | | | | | | | | | | | | | | | | | | | | | | |
Total debt as cash flow, (incl. DRD1)) | | $ | 69.8 | | | $ | 280.2 | | | $ | 2.1 | | | $ | — | | | $ | 204.8 | | | $ | 60.0 | | | $ | 547.1 | | | $ | 616.9 | |
| | | | | | | | | | | | | | | | | | | | | | | | | | | | | | | | |
DRD adjustment | | | — | | | | — | | | | — | | | | — | | | | — | | | | 15.8 | | | | 15.8 | | | | 15.8 | |
| | | | | | | | | | | | | | | | | | | | | | | | | | | | | | | | |
Total debt as reported | | $ | 69.8 | | | $ | 280.2 | | | $ | 2.1 | | | $ | — | | | $ | 204.8 | | | $ | 75.8 | | | $ | 562.9 | | | $ | 632.7 | |
| | | | | | | | | | | | | | | | | | | | | | | | | | | | | | | | |
| 1) | Debt Related Derivatives (DRD), i.e. the fair value adjustments associated with hedging instruments as adjustments to the carrying value of the underlying debt. 2) Interest rates will change as roll-overs occur prior to final maturity. 3) Repriced in 2012, final maturity in 2014. 4) Primarily external BRL and JPY loans drawn locally. |
13. Shareholders’ Equity
The number of shares outstanding as of December 31, 2012 was 95,493,456.
| | | | | | | | | | | | |
DIVIDENDS | | 2012 | | | 2011 | | | 2010 | |
Cash dividend paid per share | | $ | 1.89 | | | $ | 1.73 | | | $ | 0.65 | |
Cash dividend declared per share | | $ | 1.94 | | | $ | 1.78 | | | $ | 1.05 | |
| | | |
OTHER COMPREHENSIVE (LOSS) INCOME / ENDING BALANCE1) | | 2012 | | | 2011 | | | 2010 | |
Cumulative translation adjustments | | $ | 67.2 | | | $ | 38.4 | | | $ | 81.0 | |
Net gain/(loss) of cash flow hedge derivatives | | | — | | | | — | | | | 0.0 | |
Net pension liability | | | (107.7 | ) | | | (80.7 | ) | | | (44.6 | ) |
| | | | | | | | | | | | |
Total (ending balance) | | $ | (40.5 | ) | | $ | (42.3 | ) | | $ | 36.4 | |
| | | | | | | | | | | | |
Deferred taxes on cash flow hedge derivatives | | $ | — | | | $ | — | | | $ | 0.0 | |
Deferred taxes on the pension liability | | $ | 59.7 | | | $ | 45.5 | | | $ | 25.0 | |
| 1) | The components of Other Comprehensive (Loss) Income are net of any related income tax effects. |
Equity and Equity Units Offering
On March 30, 2009, the Company sold, in an underwritten registered public offering, approximately 14.7 million common shares from treasury stock and 6.6 million equity units (the Equity Units), listed on the NYSE as Corporate Units, for an aggregate stated amount and public offering price of $235 million and $165 million, respectively. “Equity Units” is a term that describes a security that is either a Corporate Unit or a Treasury Unit, depending upon what type of note is used by the holder to secure the forward purchase contract (either a Note or a Treasury Security, as described below). The Equity Units initially consisted of a Corporate Unit which is (i) a forward purchase contract obligating the holder to purchase from the Company for a price in cash of $25, on the purchase contract settlement date of April 30, 2012, subject to early settlement in accordance with the terms of the Purchase Contract and Pledge Agreement, a certain number (at the Settlement Rate outlined in the Purchase Contract and Pledge Agreement) of shares of Common Stock; and (ii) a 1/40, or 2.5%, undivided beneficial ownership interest in a $1,000 principal amount of the Company’s 8% senior notes due 2014 (the “Senior Notes”).
The Settlement Rate was based on the applicable market value of the Company’s common stock on the purchase contract settlement date. Because the applicable market value of the Company’s common stock was higher than $19.20, the final settlement rate on April 30, 2012 was 1.3607 shares of common stock per Equity Unit, giving effect to the dividends paid in 2010, 2011 and first quarter of 2012. On April 30, 2012, the Company issued approximately 5.8 million shares of common stock to settle the outstanding purchase contracts.The Company allocated proceeds received upon issuance of the Equity Units based on relative fair values at the time of issuance. The fair value of the purchase contract at issuance was $3.75 and the fair value of the note was $21.25. The discount on the notes is amortized using the effective interest rate method. Accordingly, the difference between the stated rate (i.e. cash payments of interest) and the effective interest rate is credited to the value of the notes. Thus, at the end of the three years, the notes were stated on the balance sheet at their face amount. The Company allocated 1% of the 6% of underwriting commissions paid to the debt as deferred charges based on commissions paid for similar debt issuances, but including factors for market conditions at the time of the offering and the Company’s credit rating. The deferred charges were being amortized over the life of the note (until the remarketing settlement date on March 15, 2012) using the effective interest rate method. The remaining underwriting commissions of 5% were allocated to the equity forward and recorded as a reduction to paid-in capital. The fees associated with the remarketing (described below) were allocated the same way and the deferred charges will be similarly amortized over the life of the notes until April 30, 2014.
In the second quarter of 2010, pursuant to separately negotiated exchange agreements with holders representing an aggregate of approximately 2.3 million Equity Units, the Company issued an aggregate of approximately 3.1 million shares of Autoliv’s common stock from its treasury and paid an aggregate of approximately $7.4 million in cash to these holders in exchange for their Equity Units. Following these accelerated exchanges, 4,250,920 Equity Units remained outstanding prior to settlement on April 30,2012.
The Company successfully completed the remarketing of the Senior Notes in March 2012, pursuant to which the interest rate on the Senior Notes was reset and certain other terms of the Senior Notes were modified. On March 15, 2012, the coupon was reset to 3.854% with a yield of 2.875% per annum which will be applicable until final maturity on April 30, 2014. Autoliv did not receive any proceeds from the remarketing until the settlement of the forward stock purchase contracts on April 30, 2012. On April 30, 2012, Autoliv settled the purchase contracts by issuing approximately 5.8 million shares of common stock in exchange for $106,273,000 in proceeds generated by
the maturity of the U.S. Treasury securities purchased following the remarketing. The settlement of the purchase contracts concluded Autoliv’s equity obligations under the Equity Units.
Share Repurchase Program
In total, Autoliv has repurchased 34.3 million shares between May 2000 and September 2008 for cash of $1,473.2 million, including commissions. Of the total amount of repurchased shares, 14.7 million shares were utilized for the equity offering in 2009, 3.1 million and 5.8 million shares were utilized for the repurchase of equity units in second quarter of 2010 and second quarter of 2012, respectively. In addition 3.5 million shares have been utilized by the Stock Incentive Plan whereof 0.4 million, 0.3 million and 0.8 million were utilized during 2012, 2011 and 2010, respectively. At December 31, 2012, 7.3 million of the repurchased shares remain in treasury stock.
In 2007, the Board of Directors approved an expansion of the Company’s existing Stock Repurchase Program. Under this mandate, another 3,188,045 Autoliv shares may still be repurchased.
14. Supplemental Cash Flow Information
The Company’s acquisitions and divestitures of businesses, net of cash acquired were as follows:
| | | | | | | | | | | | |
| | | 2012 | | | 2011 | | | 2010 | |
Acquisitions: | | | | | | | | | | | | |
Fair value of assets acquired excluding cash | | $ | — | | | $ | (32.4 | ) | | $ | (133.9 | ) |
Fair value of non-controlling interests | | | — | | | | — | | | | 4.2 | |
Liabilities assumed | | | — | | | | 9.2 | | | | 52.3 | |
Cash paid for prior year acquisitions | | | (1.8 | ) | | | — | | | | — | |
| | | | | | | | | | | | |
Acquisition of businesses, net of cash acquired | | $ | (1.8 | ) | | $ | (23.2 | ) | | $ | (77.4 | ) |
| | | | | | | | | | | | |
| | | | | | | | | | | | |
| | | 2012 | | | 2011 | | | 2010 | |
Divestitures of business, net of cash disposed | | $ | 5.2 | | | $ | 5.4 | | | $ | — | |
Payments for interest and income taxes were as follows:
| | | | | | | | | | | | |
| | | 2012 | | | 2011 | | | 2010 | |
Interest | | $ | 40 | | | $ | 68 | | | $ | 63 | |
Income taxes | | $ | 237 | | | $ | 257 | | | $ | 149 | |
15. Stock Incentive Plan
Under the amended and restated Autoliv, Inc. 1997 Stock Incentive Plan (the Plan) adopted by the Shareholders, awards have been made to selected executive officers of the Company and other key employees in the form of stock options and Restricted Stock Units (RSUs). All stock options are granted for 10-year terms, have an exercise price equal to the fair value of the share at the date of grant, and become exercisable after one year of continued employment following the grant date. Each RSU represents a promise to transfer one of the Company’s shares to the employee after three years of service following the date of grant or upon retirement, whichever is earlier. The source of the shares issued upon share option exercise or lapse of RSU service period is generally from treasury shares. The Plan provides for the issuance of up to 9,585,055 common shares for awards. At December 31, 2012, 5,374,823 of these shares have been issued for awards. For stock options and RSUs outstanding and options exercisable at year end, see below.
The fair value of the RSUs is calculated as the fair value of the shares at the RSU grant date. The grant date fair value for RSUs granted in 2009, 2008 and 2007 (vested in 2012, 2011 and 2010) was $3.3 million, $4.5 million and $5.8 million, respectively. The aggregate intrinsic value for RSU’s outstanding at December 31, 2012 was $14.3 million. The weighted average fair value of RSU’s granted in 2012, 2011 and 2010, are $61.58, $68.33 and $41.99, respectively.
The weighted average grant date fair value of stock options granted during 2012, 2011 and 2010 was estimated at $18.01, $23.27 and $13.67 per share, respectively, using the Black-Scholes option-pricing model based on the following assumptions:
| | | | | | | | | | | | |
| | | 2012 | | | 2011 | | | 2010 | |
Risk-free interest rate | | | 0.9 | % | | | 2.2 | % | | | 2.5 | % |
Dividend yield | | | 2.8 | % | | | 2.2 | % | | | 2.2 | % |
Expected life in years | | | 4.1 | | | | 4.1 | | | | 4.1 | |
Expected volatility | | | 42.0 | % | | | 45.0 | % | | | 42.0 | % |
The Company uses historical exercise data for determining the expected life assumption. Expected volatility is based on historical volatility.
The total stock (RSUs and stock options) compensation cost recognized in the Consolidated Statements of Net Income for 2012, 2011 and 2010 was $7.7 million, $7.4 million and $6.9 million, respectively.
The total compensation cost related to non-vested awards not yet recognized is $4.7 million for RSUs and the weighted average period over which this cost is expected to be recognized is approximately two years. There is no significant compensation cost not yet recognized for stock options.
Information on the number of RSUs and stock options related to the Plan during the period 2010 to 2012 is as follows:
| | | | | | | | | | | | |
RSUs | | 2012 | | | 2011 | | | 2010 | |
Outstanding at beginning of year | | | 320,122 | | | | 360,928 | | | | 351,659 | |
Granted | | | 72,900 | | | | 64,599 | | | | 102,120 | |
Shares issued | | | (172,212 | ) | | | (84,294 | ) | | | (83,243 | ) |
Cancelled/Forfeited/Expired | | | (9,192 | ) | | | (21,111 | ) | | | (9,608 | ) |
| | | | | | | | | | | | |
Outstanding at end of year | | | 211,618 | | | | 320,122 | | | | 360,928 | |
| | | | | | | | | | | | |
| | | | | | | | |
STOCK OPTIONS | | Number of
options | | | Weighted average
exercise price | |
Outstanding at Dec 31, 2009 | | | 1,586,618 | | | $ | 35.41 | |
Granted | | | 303,960 | | | | 44.80 | |
Exercised | | | (717,837 | ) | | | 30.90 | |
Cancelled/Forfeited/Expired | | | (16,775 | ) | | | 53.96 | |
| | | | | | | | |
Outstanding at Dec 31, 2010 | | | 1,155,966 | | | $ | 40.31 | |
| | | | | | | | |
Granted | | | 193,833 | | | | 72.95 | |
Exercised | | | (244,218 | ) | | | 40.32 | |
Cancelled/Forfeited/Expired | | | (32,579 | ) | | | 38.38 | |
| | | | | | | | |
Outstanding at Dec 31, 2011 | | | 1,073,002 | | | $ | 46.26 | |
| | | | | | | | |
Granted | | | 218,695 | | | | 67.00 | |
Exercised | | | (254,440 | ) | | | 33.26 | |
Cancelled/Forfeited/Expired | | | (25,027 | ) | | | 50.59 | |
| | | | | | | | |
Outstanding at Dec 31, 2012 | | | 1,012,230 | | | $ | 53.91 | |
| | | | | | | | |
| | |
OPTIONS EXERCISABLE | | | | | | | | |
At December 31, 2010 | | | 854,056 | | | $ | 38.73 | |
At December 31, 2011 | | | 886,605 | | | $ | 40.65 | |
At December 31, 2012 | | | 796,720 | | | $ | 50.37 | |
The following summarizes information about stock options outstanding and exercisable on December 31, 2012:
| | | | | | | | | | | | |
RANGE OF EXERCISE PRICES | | Number
outstanding | | | Remaining
contract life
(in years) | | | Weighted
average
exercise
price | |
$16.31 – $19.96 | | | 104,700 | | | | 6.14 | | | $ | 16.31 | |
$21.36 – $29.37 | | | 2,150 | | | | 0.01 | | | | 21.36 | |
$40.26 – $49.60 | | | 299,590 | | | | 4.86 | | | | 45.63 | |
$51.67 – $72.95 | | | 605,790 | | | | 7.32 | | | | 64.61 | |
| | | | | | | | | | | | |
| | | 1,012,230 | | | | 6.46 | | | $ | 53.91 | |
| | | | | | | | | | | | |
| | | | | | | | | | | | |
RANGE OF EXERCISE PRICES | | Number
exercisable | | | Remaining
contract
life (in
years) | | | Weighted
average
exercise
price | |
$16.31 – $19.96 | | | 104,700 | | | | 6.14 | | | $ | 16.31 | |
$21.36 – $29.37 | | | 2,150 | | | | 0.01 | | | | 21.36 | |
$40.26 – $49.60 | | | 299,590 | | | | 4.86 | | | | 45.63 | |
$51.67 – $72.95 | | | 390,280 | | | | 6.32 | | | | 63.30 | |
| | | | | | | | | | | | |
| | | 796,720 | | | | 5.73 | | | $ | 50.37 | |
| | | | | | | | | | | | |
The total aggregate intrinsic value, which is the difference between the exercise price and $67.39 (closing price per share at December 31, 2012), for all “in the money” stock options outstanding and exercisable was $14.9 million and $14.8 million, respectively.
16. Contingent Liabilities
Legal Proceedings
Various claims, lawsuits and proceedings are pending or threatened against the Company or its subsidiaries, covering a range of matters that arise in the ordinary course of its business activities with respect to commercial, product liability and other matters. Litigation is subject to many uncertainties, and the outcome of any litigation cannot be assured. After discussions with counsel, and with the exception of losses resulting from the antitrust matters described below, it is the opinion of management that the various legal proceedings and investigations to which the Company currently is a party will not have a material adverse impact on the consolidated financial position of Autoliv, but the Company cannot provide assurance that Autoliv will not experience material litigation, product liability or other losses in the future.
In 2009, Autoliv initiated a closure of its Normandy Precision Components (“NPC”) plant located in France. Most of the former NPC-employees that were not “protected” (i.e. not union representatives) filed claims in a French court claiming damages in an aggregate amount of €12 million (approximately $16 million) and/or other remedies. In February 2012, the French court ruled in favor of plaintiffs in an aggregate amount of €5.6 million (approximately $7 million), while rejecting certain other claims. Both sides have appealed the decision as far as not in their favor. As required under French law, Autoliv has paid the €5.6 million award pending the appeal.
In May 2008, a French court placed Eric Molleux Technologies Composants (“EMT”) into receivership, and liquidation proceedings were initiated in July 2009. As a result of Autoliv’s previous relationship with EMT, in March 2012 the liquidator initiated proceedings against Autoliv France and requested payment of €16.3 million (approximately $22 million), which represents the total amount of debt owed by EMT to its creditors (including Autoliv). The liquidator also requested an additional €4 million (approximately $5 million) corresponding to the debts of Autoliv Turkey towards EMT. Autoliv disputes the claims.
Antitrust Matters
Authorities in several jurisdictions are currently conducting broad, and in some cases, long-running investigations of suspected anti-competitive behavior among parts suppliers in the global automotive vehicle industry. These investigations include, but are not limited to, segments in which the Company operates. In addition to pending matters, authorities of other countries with significant light vehicle manufacturing or sales may initiate similar investigations. It is the Company’s policy to cooperate with governmental investigations.
On February 8, 2011, a Company subsidiary received a grand jury subpoena from the Antitrust Division of the U.S. Department of Justice (“DOJ”) related to its investigation of anti-competitive behavior among suppliers of occupant safety systems. On June 6, 2012, the Company entered into a plea agreement with the DOJ and subsequently pled guilty to two counts of antitrust law violations involving a Japanese subsidiary and paid a fine of $14.5 million. Under the terms of the agreement the Company will continue to cooperate with the DOJ in its investigation of other suppliers, but the DOJ will not otherwise prosecute Autoliv or any of its subsidiaries, present or former directors, officers or employees for the matters investigated (the DOJ did reserve the option to prosecute three specific employees, none of whom is a member of the senior management of the Company).
On June 7-9, 2011, representatives of the European Commission (“EC”), the European antitrust authority, visited two facilities of a Company subsidiary in Germany to gather information for a similar investigation. The investigation is still pending and the Company remains unable to estimate the financial impact such investigation will have or predict the reporting periods in which such financial impact may be recorded and has consequently not recorded a provision for loss as of December 31, 2012. However, management has concluded that it is probable that the Company’s operating results and cash flows will be materially adversely impacted for the reporting periods in which the EC investigation is resolved or becomes estimable.
On October 3, 2012, the Company received a letter from the Competition Bureau of Canada related to the subjects investigated by the DOJ and EC, seeking the voluntary production of certain corporate records and information related to sales subject to Canadian jurisdiction. On November 6, 2012, the Korean Fair Trade Commission visited one of the Company’s South Korean subsidiaries to gather information for a similar investigation. The Company cannot predict the duration, scope or ultimate outcome of either of these investigations and is unable to estimate the financial impact they may have, or predict the reporting periods in which any such financial impacts may be recorded. Consequently, the Company has not recorded a provision for loss as of December 31, 2012 with respect to either of these investigations. Also, since the Company’s plea agreement with the DOJ, involved the actions of employees of a Japanese subsidiary, the Japan Fair Trade Commission is evaluating whether to initiate an investigation.
The Company is also subject to civil litigation alleging anti-competitive conduct. Notably, the Company, several of its subsidiaries and its competitors are defendants in a total of twelve purported antitrust class action lawsuits, eleven of which are pending in the United States District Court for the Eastern
District of Michigan (Brad Zirulnik v. Autoliv, Inc. et al. filed on June 6, 2012; A1A Airport & Limousine Service, Inc. v. Autoliv, Inc. et al. and Frank Cosenza v. Autoliv, Inc. et al. each filed on June 8, 2012; Meetesh Shah v. Autoliv, Inc., et al. filed on June 12, 2012; Martens Cars of Washington, Inc., et al. v. Autoliv, Inc., et al. and Richard W. Keifer, Jr. v. Autoliv, Inc. et al. each filed on June 26, 2012; Findlay Industries, Inc. v. Autoliv, Inc. filed on July 12, 2012; Beam’s Industries, Inc. v. Autoliv, Inc., et al. filed on July 21, 2012; Melissa Barron et al. v. Autoliv, Inc. et al. filed on July 24, 2012; Stephanie Kaleuha Petras v. Autoliv, Inc. et al. filed on August 14, 2012; and Superstore Automotive, Inc. et al. v. Autoliv, Inc. et al. filed on November 1, 2012). The twelfth lawsuit is pending under Canadian law in the Ontario Superior Court of Justice in Canada (Sheridan Chevrolet Cadillac Ltd. et al. v. Autoliv Inc. et al., filed on January 18, 2013).
Plaintiffs in these cases generally allege that the defendants have engaged in long-running global conspiracies to fix the prices of occupant safety systems or components thereof in violation of various antitrust laws and unfair or deceptive trade practice statutes. Plaintiffs seek to recover, on behalf of themselves and various purported classes of direct and indirect purchasers of occupant safety systems and purchasers or lessees of vehicles in which such systems have been installed, injunctive relief, treble damages and attorneys’ fees. The plaintiffs in these cases make allegations that extend significantly beyond the specific admissions of the plea discussed above. The Company denies these overly broad allegations and intends to actively defend itself against the same. While it is probable that the Company will incur losses as a result of these cases, the duration or ultimate outcome of these cases currently cannot be predicted or estimated and no provision for a loss has been recorded as of December 31, 2012.
Product Warranty, Recalls and Intellectual Property
Autoliv is exposed to various claims for damages and compensation if products fail to perform as expected. Such claims can be made, and result in costs and other losses to the Company, even where the product is eventually found to have functioned properly. If a product (actually or allegedly) fails to perform as expected the Company faces warranty and recall claims. If such (actual or alleged) failure results in bodily injury and/or property damage, the Company may also face product-liability claims. There can be no assurance that the Company will not experience material warranty, recall or product (or other) liability claims or losses in the future, or that the Company will not incur significant costs to defend against such claims. The Company may be required to participate in a recall involving its products. Each vehicle manufacturer has its own practices regarding product recalls and other product liability actions relating to its suppliers. As suppliers become more integrally involved in the vehicle design process and assume more of the vehicle assembly functions, vehicle manufacturers are increasingly looking to their suppliers for contribution when faced with recalls and product liability claims. A warranty, recall or product-liability claim brought against the Company in excess of its insurance may have a material adverse effect on the Company’s business. Vehicle manufacturers are also increasingly requiring their outside suppliers to guarantee or warrant their products and bear the costs of repair and replacement of such products under new vehicle warranties. A vehicle manufacturer may attempt to hold the Company responsible for some, or all, of the repair or replacement costs of defective products under new vehicle warranties, when the product supplied did not perform as represented. Accordingly, the future costs of warranty claims by customers may be material. However, the Company believes its established reserves are adequate to cover potential warranty settlements. Autoliv’s warranty reserves are based upon the Company’s best estimates of amounts necessary to settle future and existing claims. The Company regularly evaluates the appropriateness of these reserves, and adjusts them when appropriate. However, the final amounts determined to be due related to these matters could differ materially from the Company’s recorded estimates.
In addition, the global platforms and procedures used by vehicle manufacturers have led to quality performance evaluations being conducted on an increasingly global basis. Any one or more quality, warranty or other recall issue(s) (including those affecting few units and/or having a small financial impact) may cause a vehicle manufacturer to implement measures such as a temporary or prolonged suspension of new orders, which may have a material impact on the Company’s results of operations.
The Company believes that it is currently reasonably insured against significant warranty, recall and product liability risks, at levels sufficient to cover potential claims that are reasonably likely to arise in our businesses. Autoliv cannot be assured that the level of coverage will be sufficient to cover every possible claim that can arise in our businesses, now or in the future, or that such coverage always will be available on our current market terms should we, now or in the future, wish to extend or increase insurance.
In its products, the Company utilizes technologies which may be subject to intellectual property rights of third parties. While the Company seeks to identify the intellectual property rights of relevance to its products, and, where relevant, tries to procure the necessary rights to utilize such intellectual property rights, we may fail to do so. When this happens, the Company may be exposed to material claims from the owners of such rights. If the Company has sold products which infringe upon such rights, our customers may be entitled to be indemnified by us for the claims they suffer as a result thereof. Such claims could be material.
17. Lease Commitments
Operating Lease
The Company leases certain offices, manufacturing and research buildings, machinery, automobiles, data processing and other equipment under operating lease contracts. The operating leases, some of which are non-cancellable and include renewals, expire at various dates through 2045. The Company pays most maintenance, insurance and tax expenses relating to leased assets. Rental expense for operating leases was $35.5 million for 2012, $36.4 million for 2011 and $29.4 million for 2010.
At December 31, 2012, future minimum lease payments for non-cancellable operating leases total $110.8 million and are payable as follows (in millions): 2013: $33.3; 2014: $26.1; 2015: $18.3; 2016: $13.5; 2017: $8.2; 2018 and thereafter: $11.4.
Capital Lease
The Company leases certain property, plant and equipment under capital lease contracts. The capital leases expire at various dates through 2015. At December 31, 2012, future minimum lease payments for non-cancellable capital leases total $1.3 million and are payable as follows (in millions): 2013: $0.6; 2014: $0.4; 2015: $0.3; 2016: $0.0; 2017: $0.0; 2018 and thereafter: $0.0.
18. Retirement Plans
Defined Contribution Plans
Many of the Company’s employees are covered by government sponsored pension and welfare programs. Under the terms of these programs, the Company makes periodic payments to various government agencies. In addition, in some countries the Company sponsors or participates in certain non-governmental defined contribution plans. Contributions to defined contribution plans for the years ended December 31, 2012, 2011 and 2010 were $16.4 million, $13.2 million and $13.2 million, respectively.
Multiemployer Plans
The Company participates in multiemployer plans in Sweden, Canada, Spain and the Netherlands, which are all deemed insignificant. The largest of these plans is in Sweden, the ITP-2 pension plan, which is funded through Alecta. For employees born before 1979, the plan provides a final pay pension benefit based on all service with participating employers. The Company must pay for pay increases in excess of inflation on service earned with previous employers. The plan also provides disability and family benefits. The plan is more than 100% funded. The Company contributions to the multiemployer plan in Sweden for the year ended December 31, 2012, 2011 and 2010 were $2.3 million, $1.8 million and $2.1 million respectively.
Defined Benefit Plans
The Company has a number of defined benefit pension plans, both contributory and non-contributory, in the U.S., Canada, Germany, France, Japan, Mexico, Sweden, South Korea, India, Turkey, Thailand, Philippines and the United Kingdom. There are funded as well as unfunded plan arrangements which provide retirement benefits to both U.S. and non-U.S. participants. The main plan is the U.S. plan for which the benefits are based on an average of the employee’s earnings in the years preceding retirement and on credited service. The Company has closed participation in the Autoliv ASP, Inc. Pension Plan to exclude those employees hired after December 31, 2003. Within the U.S. there is also a non-qualified restoration plan that provides benefits to employees whose benefits in the primary U.S. plan are restricted by limitations on the compensation that can be considered in calculating their benefits. For the Company’s non-U.S. defined benefit plans the most significant individual plan resides in the U.K. The Company has closed participation in the U.K. defined benefit plan to exclude all employees hired after April 30, 2003 with few members accruing benefits. In October 2011 approximately half of the benefit obligation and all plan assets in Japan were settled, requiring additional contributions, and converted into a new defined contribution plan.
CHANGES IN BENEFIT OBLIGATIONS AND PLAN ASSETS FOR THE PERIODS ENDED DECEMBER 31
| | | | | | | | | | | | | | | | |
| | | U.S. | | | Non-U.S. | |
| | | 2012 | | | 2011 | | | 2012 | | | 2011 | |
Benefit obligation at beginning of year | | $ | 257.0 | | | $ | 190.4 | | | $ | 160.5 | | | $ | 170.2 | |
Service cost | | | 8.3 | | | | 6.3 | | | | 12.0 | | | | 12.3 | |
Interest cost | | | 12.3 | | | | 10.0 | | | | 7.1 | | | | 7.6 | |
Actuarial (gain) loss due to: | | | | | | | | | | | | | | | | |
Change in discount rate | | | 34.1 | | | | 31.0 | | | | 16.3 | | | | 9.5 | |
Experience | | | 13.7 | | | | 5.9 | | | | (0.0 | ) | | | (0.1 | ) |
Other assumption changes | | | (5.9 | ) | | | 19.4 | | | | 1.3 | | | | (4.9 | ) |
Plan participants’ contributions | | | — | | | | — | | | | 0.2 | | | | 0.2 | |
Plan amendments | | | — | | | | — | | | | 0.1 | | | | 0.8 | |
Benefits paid | | | (5.3 | ) | | | (5.7 | ) | | | (5.6 | ) | | | (8.5 | ) |
Settlements | | | — | | | | (0.3 | ) | | | (7.0 | ) | | | (25.3 | ) |
Curtailments | | | — | | | | — | | | | 0.0 | | | | 0.3 | |
Special termination benefits | | | — | | | | — | | | | 0.1 | | | | 0.1 | |
Acquisitions | | | — | | | | — | | | | — | | | | — | |
Other | | | — | | | | — | | | | 6.2 | | | | (0.1 | ) |
Translation difference | | | — | | | | — | | | | 4.2 | | | | (1.6 | ) |
| | | | | | | | | | | | | | | | |
Benefit obligation at end of year | | $ | 314.2 | | | $ | 257.0 | | | $ | 195.4 | | | $ | 160.5 | |
| | | | | | | | | | | | | | | | |
| | | | | | | | | | | | | | | | |
Fair value of plan assets at beginning of year | | $ | 140.5 | | | $ | 136.9 | | | $ | 83.9 | | | $ | 87.7 | |
| | | | | | | | | | | | | | | | |
Actual return on plan assets | | | 17.5 | | | | 2.0 | | | | 8.0 | | | | 7.7 | |
Company contributions | | | 6.7 | | | | 7.3 | | | | 11.9 | | | | 22.8 | |
Plan participants’ contributions | | | — | | | | — | | | | 0.2 | | | | 0.2 | |
Benefits paid | | | (5.3 | ) | | | (5.7 | ) | | | (5.6 | ) | | | (8.5 | ) |
Settlements | | | — | | | | — | | | | (7.0 | ) | | | (25.3 | ) |
Acquisitions | | | — | | | | — | | | | — | | | | — | |
Other | | | — | | | | — | | | | (0.2 | ) | | | (0.1 | ) |
Translation difference | | | — | | | | — | | | | 3.6 | | | | (0.6 | ) |
| | | | | | | | | | | | | | | | |
Fair value of plan assets at year end | | $ | 159.4 | | | $ | 140.5 | | | $ | 94.8 | | | $ | 83.9 | |
| | | | | | | | | | | | | | | | |
Funded status recognized in the balance sheet | | $ | (154.8 | ) | | $ | (116.5 | ) | | $ | (100.6 | ) | | $ | (76.6 | ) |
| | | | | | | | | | | | | | | | |
The U.S. plan provides that benefits may be paid in the form of a lump sum if so elected by the participant. In order to more accurately reflect a market-derived pension obligation, Autoliv adjusts the assumed lump sum interest rate to reflect market conditions as of each December 31. This methodology is consistent with the approach required under the Pension Protection Act of 2006, which provides the rules for determining minimum funding requirements in the U.S.
The short-term portion of the pension liability is not significant.
COMPONENTS OF NET PERIODIC BENEFIT COST ASSOCIATED WITH THE DEFINED BENEFIT RETIREMENT PLANS
| | | | | | | | | | | | |
| | | U.S. | |
| | | 2012 | | | 2011 | | | 2010 | |
Service cost | | $ | 8.3 | | | $ | 6.3 | | | $ | 5.1 | |
Interest cost | | | 12.3 | | | | 10.0 | | | | 9.1 | |
Expected return on plan assets | | | (10.2 | ) | | | (9.9 | ) | | | (8.5 | ) |
Amortization of prior service credit | | | (1.0 | ) | | | (1.0 | ) | | | (1.0 | ) |
Amortization of actuarial loss | | | 8.5 | | | | 5.4 | | | | 3.4 | |
Settlement | | | — | | | | 0.4 | | | | — | |
| | | | | | | | | | | | |
Net periodic benefit cost | | $ | 17.9 | | | $ | 11.2 | | | $ | 8.1 | |
| | | | | | | | | | | | |
| | | | | | | | | | | | |
| | | Non-U.S. | |
| | | 2012 | | | 2011 | | | 2010 | |
Service cost | | $ | 12.0 | | | $ | 12.3 | | | $ | 10.0 | |
Interest cost | | | 7.1 | | | | 7.6 | | | | 6.5 | |
Expected return on plan assets | | | (3.9 | ) | | | (4.4 | ) | | | (4.2 | ) |
Amortization of prior service costs | | | 0.1 | | | | 0.1 | | | | 0.2 | |
Amortization of actuarial loss | | | 1.4 | | | | 1.0 | | | | 0.5 | |
Settlement loss (gain) | | | 1.0 | | | | 4.5 | | | | 0.5 | |
Curtailment loss (gain) | | | — | | | | 0.2 | | | | 0.3 | |
Special termination benefits | | | 0.1 | | | | 0.1 | | | | 0.2 | |
| | | | | | | | | | | | |
Net periodic benefit cost | | $ | 17.8 | | | $ | 21.4 | | | $ | 14.0 | |
| | | | | | | | | | | | |
The estimated prior service credit for the U.S. defined benefit pension plans that will be amortized from other comprehensive income into net benefit cost over the next fiscal year is $(1.0) million. Amortization of net actuarial losses is expected to be $9.7 million in 2013. Net periodic benefit cost associated with these U.S. plans was $17.9 million in 2012 and is expected to be around $18.9 million in 2013. The estimated prior service cost and net actuarial loss for the non-U.S. defined benefit pension plans that will be amortized from other
comprehensive income into net benefit cost over the next fiscal year are $0.2 and $2.5 million respectively. Net periodic benefit cost associated with these non-U.S. plans was $17.8 million in 2012 and is expected to be around $19.6 million in 2013. The amortization of the net actuarial loss is made over the estimated remaining service lives of the plan participants, 11 years for U.S. and 3-22 years for non-U.S. participants, varying between the different countries depending on the age of the work force.
COMPONENTS OF ACCUMULATED OTHER COMPREHENSIVE INCOME BEFORE TAX AS OF DECEMBER 31
| | | | | | | | | | | | | | | | |
| | | U.S. | | | Non-U.S. | |
| | | 2012 | | | 2011 | | | 2012 | | | 2011 | |
Net actuarial loss (gain) | | $ | 136.7 | | | $ | 110.6 | | | $ | 34.0 | | | $ | 21.9 | |
Prior service (credit) cost | | | (4.0 | ) | | | (5.0 | ) | | | 1.6 | | | | 1.6 | |
| | | | | | | | | | | | | | | | |
Total accumulated other comprehensive income recognized in the balance sheet | | $ | 132.7 | | | $ | 105.6 | | | $ | 35.6 | | | $ | 23.5 | |
| | | | | | | | | | | | | | | | |
CHANGES IN ACCUMULATED OTHER COMPREHENSIVE INCOME BEFORE TAX FOR THE PERIODS ENDED DECEMBER 31
| | | | | | | | | | | | | | | | |
| | | U.S. | | | Non-U.S. | |
| | | 2012 | | | 2011 | | | 2012 | | | 2011 | |
Total retirement benefit recognized in accumulated other comprehensive income at beginning of year | | $ | 105.6 | | | $ | 46.5 | | | $ | 23.5 | | | $ | 27.3 | |
Net actuarial loss (gain) | | | 34.6 | | | | 64.1 | | | | 13.5 | | | | 1.2 | |
Prior service cost (credit) | | | — | | | | — | | | | 0.1 | | | | 0.8 | |
Amortization of prior service costs | | | 1.0 | | | | 1.0 | | | | (0.1 | ) | | | (0.1 | ) |
Amortization of actuarial loss | | | (8.5 | ) | | | (6.0 | ) | | | (2.3 | ) | | | (5.4 | ) |
Translation difference | | | — | | | | — | | | | 0.9 | | | | (0.3 | ) |
| | | | | | | | | | | | | | | | |
Total retirement benefit recognized in accumulated other comprehensive income at end of year | | $ | 132.7 | | | $ | 105.6 | | | $ | 35.6 | | | $ | 23.5 | |
| | | | | | | | | | | | | | | | |
The accumulated benefit obligation for the U.S. non-contributory defined benefit pension plans was $262.1 and $198.5 million at December 31, 2012 and 2011, respectively. The accumulated benefit obligation for the non-U.S. defined benefit pension plans was $164.4 and $140.3 million at December 31, 2012 and 2011, respectively.
Pension plans for which the accumulated benefit obligation (ABO) is notably in excess of the plan assets reside in the following countries: the U.S., France, Germany, Japan, South Korea and Sweden.
PENSION PLANS FOR WHICH ABO EXCEEDS THE FAIR VALUE OF PLAN ASSETS AS OF DECEMBER 31
| | | | | | | | | | | | | | | | |
| | | U.S. | | | Non-U.S. | |
| | | 2012 | | | 2011 | | | 2012 | | | 2011 | |
Projected Benefit Obligation (PBO) | | $ | 314.2 | | | $ | 257.0 | | | $ | 125.0 | | | $ | 87.6 | |
Accumulated Benefit Obligation (ABO) | | $ | 262.1 | | | $ | 198.5 | | | $ | 101.8 | | | $ | 69.2 | |
Fair value of plan assets | | $ | 159.4 | | | $ | 140.5 | | | $ | 24.7 | | | $ | 5.9 | |
The Company, in consultation with its actuarial advisors, determines certain key assumptions to be used in calculating the projected benefit obligation and annual net periodic benefit cost.
ASSUMPTIONS USED TO DETERMINE THE BENEFIT OBLIGATIONS AS OF DECEMBER 31
| | | | | | | | | | | | | | | | |
| | | U.S. | | | Non-U.S.1) | |
% WEIGHTED AVERAGE | | 2012 | | | 2011 | | | 2012 | | | 2011 | |
Discount rate | | | 4.05 | | | | 4.60 | | | | 1.50-4.50 | | | | 1.50-5.50 | |
Rate of increases in compensation level | | | 3.50 | | | | 3.50 | | | | 2.25-5.00 | | | | 2.25-5.00 | |
ASSUMPTIONS USED TO DETERMINE THE NET PERIODIC BENEFIT COST FOR YEARS ENDED DECEMBER 31
| | | | | | | | | | | | |
| | | U.S. | |
% WEIGHTED AVERAGE | | 2012 | | | 2011 | | | 2010 | |
Discount rate | | | 4.60 | | | | 5.05 | | | | 5.80 | |
Rate of increases in compensation level | | | 3.50 | | | | 3.80 | | | | 4.00 | |
Expected long-term rate of return on assets | | | 7.50 | | | | 7.50 | | | | 7.50 | |
| | | | | | | | | | | | |
| | | Non-U.S.1) | |
% WEIGHTED AVERAGE | | 2012 | | | 2011 | | | 2010 | |
Discount rate | | | 1.50-5.50 | | | | 1.25–6.00 | | | | 1.75-7.00 | |
Rate of increases in compensation level | | | 2.25-5.00 | | | | 2.25-6.50 | | | | 2.25-5.00 | |
Expected long-term rate of return on assets | | | 3.75-5.75 | | | | 1.50-6.25 | | | | 2.00-6.25 | |
| 1) | The Non-U.S. weighted average plan ranges in the tables above have been prepared using significant plans only, which in total represent more than 90% of the total Non-U.S. projected benefit obligation. |
The discount rate for the U.S. plans has been set based on the rates of return on high-quality fixed-income investments currently available at the measurement date and expected to be available during the period the benefits will be paid. The expected timing of cash flows from the plan has also been considered in selecting the discount rate. In particular, the yields on bonds rated AA or better on the measurement date have been used to set the discount rate. The discount rate for the U.K. plan has been set based on the weighted average yields on long-term high-grade corporate bonds and is determined by reference to financial markets on the measurement date.
The expected rate of increase in compensation levels and long-term rate of return on plan assets are determined based on a number of factors and must take into account long-term expectations and reflect the financial environment in the respective local market.
The level of equity exposure is currently targeted at approximately 65% for the primary U.S. plan and approximately 50% for all plans combined. The investment objective is to provide an attractive risk-adjusted return that will ensure the payment of benefits while protecting against the risk of substantial investment losses. Correlations among the asset classes are used to identify an asset mix that Autoliv believes will provide the most attractive returns. Long-term return forecasts for each asset class using historical data and other qualitative considerations to adjust for projected economic forecasts are used to set the expected rate of return for the entire portfolio. The Company assumes a long-term rate of return on the U.S. plan assets of 7.5% for calculating the 2012 expense.
The Company has assumed a long-term rate of return on the non-U.S. plan assets in a range of 3.75-5.75% for 2012. The closed U.K. plan which has a targeted and actual allocation of almost 100% debt instruments accounts for approximately 53% of the total non-U.S. plan assets.
Autoliv made contributions to the U.S. plan during 2012 and 2011 amounting to $6.7 million and $7.3 million, respectively. Contributions to the U.K. plan during 2012 and 2011 amounted to $0.3 million and $0.3 million, respectively. The Company expects to contribute $7.0 million to its U.S. pension plan in 2013 and is currently projecting a yearly funding at approximately the same level in the years thereafter. For the UK plan, which is the most significant non-U.S. pension plan, the Company expects to contribute $0.3 million in 2013 and in the years thereafter.
FAIR VALUE OF TOTAL PLAN ASSETS FOR YEARS ENDED DECEMBER 31
| | | | | | | | | | | | | | | | | | | | |
ASSETS CATEGORY IN % WEIGHTED AVERAGE | | U.S. | | | U.S. | | | Non-U.S. | |
| | Target allocation | | | 2012 | | | 2011 | | | 2012 | | | 2011 | |
Equity securities | | | 65 | | | | 65 | | | | 66 | | | | 14 | | | | 12 | |
Debt instruments | | | 35 | | | | 35 | | | | 34 | | | | 60 | | | | 59 | |
Other assets | | | — | | | | — | | | | — | | | | 26 | | | | 29 | |
| | | | | | | | | | | | | | | | | | | | |
Total | | | 100 | | | | 100 | | | | 100 | | | | 100 | | | | 100 | |
| | | | | | | | | | | | | | | | | | | | |
The following table summarizes the valuation of the Company’s plan assets by the pricing observability levels:
| | | | | | | | | | | | | | | | |
| | | Total carrying
amount in
statement of
financial
position
December 31,
2012 | | | Fair value measurement at
December 31, 2012 using: | |
| | | Level 1 | | | Level 2 | | | Level 3 | |
Assets | | | | | | | | | | | | | | | | |
US Equity | | | | | | | | | | | | | | | | |
Large Cap | | $ | 66.9 | | | $ | — | | | $ | 66.9 | | | $ | — | |
Mid Cap | | | 8.1 | | | | — | | | | 8.1 | | | | — | |
Small Cap | | | 8.1 | | | | — | | | | 8.1 | | | | — | |
Non-US Equity | | | 33.7 | | | | — | | | | 33.7 | | | | — | |
US Bonds | | | | | | | | | | | | | | | | |
Government | | | — | | | | — | | | | — | | | | — | |
Corporate | | | — | | | | — | | | | — | | | | — | |
Aggregate | | | 55.5 | | | | — | | | | 55.5 | | | | — | |
Non-US Bonds | | | | | | | | | | | | | | | | |
Government | | | — | | | | — | | | | — | | | | — | |
Corporate | | | 50.7 | | | | — | | | | 50.7 | | | | — | |
Aggregate | | | 5.7 | | | | — | | | | 5.7 | | | | — | |
Insurance Contracts | | | 19.5 | | | | — | | | | 19.5 | | | | — | |
Other Investments | | | 6.0 | | | | — | | | | 6.0 | | | | — | |
| | | | | | | | | | | | | | | | |
Total | | $ | 254.2 | | | $ | — | | | $ | 254.2 | | | $ | — | |
| | | | | | | | | | | | | | | | |
| | | | | | | | | | | | | | | | |
| | | Total carrying
amount in
statement of
financial
position
December 31,
2011 | | | Fair value measurement at
December 31, 2011 using: | |
| | | Level 1 | | | Level 2 | | | Level 3 | |
Assets | | | | | | | | | | | | | | | | |
US Equity | | | | | | | | | | | | | | | | |
Large Cap | | $ | 60.5 | | | $ | — | | | $ | 60.5 | | | $ | — | |
Mid Cap | | | 7.2 | | | | — | | | | 7.2 | | | | — | |
Small Cap | | | 7.3 | | | | — | | | | 7.3 | | | | — | |
Non-US Equity | | | 27.8 | | | | — | | | | 27.8 | | | | — | |
US Bonds | | | | | | | | | | | | | | | | |
Government | | | 20.2 | | | | — | | | | 20.2 | | | | — | |
Corporate | | | 9.7 | | | | — | | | | 9.7 | | | | — | |
Aggregate | | | 16.3 | | | | — | | | | 16.3 | | | | — | |
Non-US Bonds | | | | | | | | | | | | | | | | |
Government | | | 4.5 | | | | — | | | | 4.5 | | | | — | |
Corporate | | | 46.4 | | | | — | | | | 46.4 | | | | — | |
Insurance Contracts | | | 18.0 | | | | — | | | | 18.0 | | | | — | |
Other Investments | | | 6.5 | | | | — | | | | 6.5 | | | | — | |
| | | | | | | | | | | | | | | | |
Total | | $ | 224.4 | | | $ | — | | | $ | 224.4 | | | $ | — | |
| | | | | | | | | | | | | | | | |
The fair value measurement level within the fair value hierarchy (see note 3) is based on the lowest level of any input that is significant to the fair value measurement. After further analysis of the characteristics of certain investments (e.g. fair values based on net asset values held by common collective trusts) we have evaluated the fair value of plan assets should be reported as Level 2. Prior year amounts have been reclassified to conform to current year presentation. These revisions in the disclosed classification had no effect on the reported fair values of these instruments.
The estimated future benefit payments for the pension benefits reflect expected future service, as appropriate. The amount of benefit payments in a given year may vary from the projected amount, especially for the U.S. plan since this plan pays the majority of benefits as a lump sum, where the lump sum amounts vary with market interest rates.
| | | | | | | | |
PENSION BENEFITS EXPECTED PAYMENTS | | U.S. | | | Non-U.S. | |
2013 | | $ | 9.9 | | | $ | 5.7 | |
2014 | | $ | 11.0 | | | $ | 6.2 | |
2015 | | $ | 12.4 | | | $ | 6.8 | |
2016 | | $ | 14.4 | | | $ | 7.6 | |
2017 | | $ | 15.9 | | | $ | 8.9 | |
Years 2018-2022 | | $ | 105.2 | | | $ | 53.0 | |
Postretirement Benefits Other than Pensions
The Company currently provides postretirement health care and life insurance benefits to most of its U.S. retirees. Such benefits in other countries are included in the tables below, but are not significant.
In general, the terms of the plans provide that U.S. employees who retire after attaining age 55, with five years of service (15 years after December 31, 2006), are eligible for continued health care and life insurance coverage. Dependent health care and life insurance coverage is also available. Most retirees contribute toward the cost of health care coverage with the contributions generally varying based on service. The plan was amended in 2003 to restrict participation to existing retirees who were eligible retirees as of December 31, 2003 and active employees who were eligible to participate in the Autoliv ASP, Inc. Pension Plan as of December 31, 2003. The plan provides a company paid subsidy based on service for all current and future retirees that qualify for retirement based on the restrictions stated above. Employees hired on or after January 1, 2004 are not eligible to participate in the plan. The amount of the company paid subsidy is frozen and will not change in the future. Generally, employees will need 15 years of service to qualify for a benefit from the plan in the future.
At present, there is no pre-funding of the postretirement benefits recognized. The Company has reviewed the impact of the Medicare Prescription Drug, Improvement and Modernization Act of 2003 (Medicare Part D) on its financial statements. Although the Plan may currently qualify for a subsidy from Medicare, the amount of the subsidy is so small that the expenses incurred to file for the subsidy may exceed the subsidy itself. Therefore the impact of any subsidy is ignored in the calculations as Autoliv will not be filing for any reimbursement from Medicare.
CHANGES IN BENEFIT OBLIGATIONS AND PLAN ASSETS FOR POSTRETIREMENT BENEFIT PLANS OTHER THAN PENSIONS AS OF DECEMBER 31
| | | | | | | | | | | | |
| | | 2012 | | | 2011 | | | 2010 | |
Benefit obligation at beginning of year | | $ | 30.8 | | | $ | 27.9 | | | $ | 28.1 | |
Service cost | | | 1.1 | | | | 1.3 | | | | 1.2 | |
Interest cost | | | 1.3 | | | | 1.5 | | | | 1.4 | |
Actuarial (gain) loss due to: | | | | | | | | | | | | |
Change in discount rate | | | 1.9 | | | | 3.1 | | | | 1.7 | |
Experience | | | (3.1 | ) | | | 0.5 | | | | (3.7 | ) |
Other assumption changes | | | 3.2 | | | | (2.7 | ) | | | — | |
Benefits paid | | | (0.5 | ) | | | (0.8 | ) | | | (0.8 | ) |
Other | | | (0.1 | ) | | | — | | | | — | |
| | | | | | | | | | | | |
Benefit obligation at end of year | | $ | 34.6 | | | $ | 30.8 | | | $ | 27.9 | |
| | | | | | | | | | | | |
| | | |
Fair value of plan assets at beginning of year | | $ | — | | | $ | — | | | $ | — | |
| | | | | | | | | | | | |
Company contributions | | | 0.5 | | | | 0.8 | | | | 0.8 | |
Benefits paid | | | (0.5 | ) | | | (0.8 | ) | | | (0.8 | ) |
| | | | | | | | | | | | |
Fair value of plan assets at end of year | | $ | — | | | $ | — | | | $ | — | |
| | | | | | | | | | | | |
Accrued postretirement benefit cost recognized in the balance sheet | | $ | (34.6 | ) | | $ | (30.8 | ) | | $ | (27.9 | ) |
| | | | | | | | | | | | |
The liability for postretirement benefits other than pensions is classified as other non-current liabilities in the balance sheet. The short-term portion of the liability for postretirement benefits other than pensions is not significant.
COMPONENTS OF NET PERIODIC BENEFIT COST ASSOCIATED WITH THE POSTRETIREMENT BENEFIT PLANS OTHER THAN PENSIONS
| | | | | | | | | | | | |
PERIOD ENDED DECEMBER 31 | | 2012 | | | 2011 | | | 2010 | |
Service cost | | $ | 1.1 | | | $ | 1.3 | | | $ | 1.2 | |
Interest cost | | | 1.3 | | | | 1.5 | | | | 1.4 | |
Amortization of prior service cost | | | (0.1 | ) | | | (0.1 | ) | | | (0.1 | ) |
Amortization of actuarial loss | | | (0.2 | ) | | | (0.1 | ) | | | (0.3 | ) |
| | | | | | | | | | | | |
Net periodic benefit cost | | $ | 2.1 | | | $ | 2.6 | | | $ | 2.2 | |
| | | | | | | | | | | | |
COMPONENTS OF ACCUMULATED OTHER COMPREHENSIVE INCOME BEFORE TAX ASSOCIATED WITH POSTRETIREMENT BENEFIT PLANS OTHER THAN PENSIONS AS OF DECEMBER 31
| | | | | | | | | | | | | | | | |
| | | U.S. | | | Non-U.S. | |
| | | 2012 | | | 2011 | | | 2012 | | | 2011 | |
Net actuarial loss (gain) | | $ | 0.1 | | | $ | (1.6 | ) | | $ | (0.7 | ) | | $ | (1.0 | ) |
Prior service cost (credit) | | | (0.3 | ) | | | (0.3 | ) | | | (0.0 | ) | | | — | |
| | | | | | | | | | | | | | | | |
Total accumulated other comprehensive income recognized in the balance sheet | | $ | (0.2 | ) | | $ | (1.9 | ) | | $ | (0.7 | ) | | $ | (1.0 | ) |
| | | | | | | | | | | | | | | | |
For measuring end-of-year obligations at December 31, 2012, health care trends are not needed due to the fixed-cost nature of the benefits provided in 2012 and beyond. After 2006, all retirees receive a fixed dollar subsidy toward the cost of their health benefits. The subsidy will not increase in future years.
The weighted average discount rate used to determine the U.S. postretirement benefit obligation was 4.25% in 2012 and 4.60% in 2011. The average discount rate used in determining the postretirement benefit cost was 4.60% in 2012, 5.40% in 2011 and 5.80% in 2010.
A one percentage point increase or decrease in the annual health care cost trend rates would have had no significant impact on the Company’s net benefit cost for the current period or on the accumulated postretirement benefit obligation at December 31, 2012. This is due to the fixed-dollar nature of the benefits provided under the plan.
The estimated net gain and prior service credit for the postretirement benefit plans that will be amortized from other comprehensive income into net benefit cost over the next fiscal year are approximately $0.1 million combined.
The estimated future benefit payments for the postretirement benefits reflect expected future service as appropriate.
| | | | |
POSTRETIREMENT BENEFITS PAYMENTS | | EXPECTED | |
2013 | | $ | 1.0 | |
2014 | | $ | 1.0 | |
2015 | | $ | 1.2 | |
2016 | | $ | 1.3 | |
2017 | | $ | 1.5 | |
Years 2018–2022 | | $ | 10.5 | |
19. Segment Information
The Company’s primary safety products (mainly various airbag and seatbelt products and components) are integrated complete systems that function together with common electronic and sensing systems. The Company has concluded that its operating segments meet the criteria for combination for reporting purposes into a single reportable segment.
The Company’s customers consist of all major European, U.S. and Asian automobile manufacturers. Sales to individual customers representing 10% or more of net sales were:
In 2012: GM 15% (incl. Opel, etc.), Ford 11% and Renault 11% (incl. Nissan).
In 2011: GM 15% (incl. Opel, etc.), Renault 12% (incl. Nissan) and Ford 10%.
In 2010: GM 14% (incl. Opel, etc.) and Renault 13% (incl. Nissan).
| | | | | | | | | | | | |
NET SALES | | 2012 | | | 2011 | | | 2010 | |
Europe | | $ | 2,645 | | | $ | 3,102 | | | $ | 2,759 | |
Americas | | | 2,870 | | | | 2,559 | | | | 2,194 | |
China | | | 1,098 | | | | 982 | | | | 813 | |
Japan | | | 830 | | | | 758 | | | | 791 | |
Rest of Asia | | | 824 | | | | 831 | | | | 614 | |
| | | | | | | | | | | | |
Total | | $ | 8,267 | | | $ | 8,232 | | | $ | 7,171 | |
| | | | | | | | | | | | |
The Company has attributed net sales to the geographic area based on the location of the entity selling the final product.
External sales in the U.S. amounted to $2,104 million, $1,920 million and $1,651 million in 2012, 2011 and 2010, respectively. Of the external sales, exports from the U.S. to other regions amounted to approximately $574 million, $535 million and $431 million in 2012, 2011 and 2010, respectively.
| | | | | | | | | | | | |
SALES BY PRODUCT | | 2012 | | | 2011 | | | 2010 | |
Airbags and associated products1) | | $ | 5,392 | | | $ | 5,393 | | | $ | 4,722 | |
Seatbelts and associated products | | | 2,657 | | | | 2,679 | | | | 2,364 | |
Active safety products | | | 218 | | | | 160 | | | | 85 | |
| | | | | | | | | | | | |
Total | | $ | 8,267 | | | $ | 8,232 | | | $ | 7,171 | |
| | | | | | | | | | | | |
| 1) | Includes sales of steering wheels, passive safety electronics, inflators and initiators. |
| | | | | | | | |
LONG-LIVED ASSETS | | 2012 | | | 2011 | |
Europe | | $ | 731 | | | $ | 641 | |
Americas | | | 1,977 | | | | 1,946 | |
China | | | 243 | | | | 198 | |
Japan | | | 130 | | | | 152 | |
Rest of Asia | | | 200 | | | | 180 | |
| | | | | | | | |
Total | | $ | 3,281 | | | $ | 3,117 | |
| | | | | | | | |
Long-lived assets in the U.S. amounted to $1,812 million and $1,774 million for 2012 and 2011, respectively. For 2012, $1,497 million (2011, $1,518 million) of the long-lived assets in the U.S. refers to intangible assets, principally from acquisition goodwill.
20. Earnings Per Share
The weighted average shares used in calculating earnings per share were:
| | | | | | | | | | | | |
| | | 2012 | | | 2011 | | | 2010 | |
Weighted average shares basic | | | 93.5 | | | | 89.2 | | | | 87.3 | |
Effect of dilutive securities: | | | | | | | | | | | | |
stock options/share awards | | | 0.3 | | | | 0.5 | | | | 0.6 | |
equity units | | | 1.3 | | | | 4.0 | | | | 4.5 | |
| | | | | | | | | | | | |
Weighted average shares diluted | | | 95.1 | | | | 93.7 | | | | 92.4 | |
| | | | | | | | | | | | |
For 2012 and 2011, 1.3 million and 4.0 million shares, respectively, were included in the dilutive weighted average share amount related to the equity units. The number of shares outstanding increased on April 30, 2012 by 5.8 million due to the settlement of the remaining equity units. For further information see Note 13.
Approximately 0.4 million, 0.2 million and 0.1 million common shares related to the Company’s Stock Incentive Plan, which were antidilutive during the respective year, but that could potentially dilute basic EPS in the future, are not included in the computation of the diluted EPS for 2012, 2011 and 2010, respectively.
21. Subsequent Events
There were no reportable events subsequent to December 31, 2012.
22. Quarterly Financial Data (unaudited)
| | | | | | | | | | | | | | | | |
2012 | | Q1 | | | Q2 | | | Q3 | | | Q4 | |
Net sales | | $ | 2,178.9 | | | $ | 2,088.8 | | | $ | 1,947.1 | | | $ | 2,051.9 | |
Gross profit | | | 441.1 | | | | 422.1 | | | | 387.6 | | | | 395.4 | |
Income before taxes | | | 141.1 | | | | 182.4 | | | | 175.1 | | | | 170.0 | |
Net income attributable to controlling interests | | | 100.5 | | | | 126.4 | | | | 117.5 | | | | 138.7 | |
Earnings per share | | | | | | | | | | | | | | | | |
– basic | | $ | 1.12 | | | $ | 1.35 | | | $ | 1.23 | | | $ | 1.45 | |
– diluted | | $ | 1.07 | | | $ | 1.33 | | | $ | 1.23 | | | $ | 1.45 | |
Dividends paid | | $ | 0.45 | | | $ | 0.47 | | | $ | 0.47 | | | $ | 0.50 | |
| | | | |
2011 | | Q1 | | | Q2 | | | Q3 | | | Q4 | |
Net sales | | $ | 2,108.6 | | | $ | 2,061.5 | | | $ | 2,017.6 | | | $ | 2,044.7 | |
Gross profit | | | 466.0 | | | | 421.6 | | | | 411.2 | | | | 429.1 | |
Income before taxes | | | 239.8 | | | | 185.0 | | | | 192.6 | | | | 210.9 | |
Net income attributable to controlling interests | | | 181.5 | | | | 145.0 | | | | 138.4 | | | | 158.5 | |
Earnings per share | | | | | | | | | | | | | | | | |
– basic | | $ | 2.04 | | | $ | 1.62 | | | $ | 1.55 | | | $ | 1.78 | |
– diluted | | $ | 1.93 | | | $ | 1.54 | | | $ | 1.48 | | | $ | 1.70 | |
Dividends paid | | $ | 0.40 | | | $ | 0.43 | | | $ | 0.45 | | | $ | 0.45 | |
EXCHANGE RATES FOR KEY CURRENCIES VS. U.S. DOLLAR
| | | | | | | | | | | | | | | | | | | | | | | | | | | | | | | | | | | | | | | | |
| | | 2012 | | | 2012 | | | 2011 | | | 2011 | | | 2010 | | | 2010 | | | 2009 | | | 2009 | | | 2008 | | | 2008 | |
| | | Average | | | Year end | | | Average | | | Year end | | | Average | | | Year end | | | Average | | | Year end | | | Average | | | Year end | |
EUR | | | 1.285 | | | | 1.322 | | | | 1.390 | | | | 1.292 | | | | 1.321 | | | | 1.323 | | | | 1.387 | | | | 1.435 | | | | 1.459 | | | | 1.411 | |
CNY | | | 0.159 | | | | 0.160 | | | | 0.155 | | | | 0.159 | | | | 0.148 | | | | 0.151 | | | | 0.146 | | | | 0.147 | | | | 0.144 | | | | 0.146 | |
JPY/1000 | | | 12.538 | | | | 11.607 | | | | 12.570 | | | | 12.881 | | | | 11.411 | | | | 12.268 | | | | 10.692 | | | | 10.877 | | | | 9.738 | | | | 11.093 | |
KRW/1000 | | | 0.888 | | | | 0.937 | | | | 0.904 | | | | 0.863 | | | | 0.864 | | | | 0.883 | | | | 0.783 | | | | 0.859 | | | | 0.911 | | | | 0.795 | |
MXN | | | 0.076 | | | | 0.077 | | | | 0.080 | | | | 0.071 | | | | 0.079 | | | | 0.081 | | | | 0.074 | | | | 0.076 | | | | 0.090 | | | | 0.074 | |
SEK | | | 0.148 | | | | 0.153 | | | | 0.154 | | | | 0.144 | | | | 0.139 | | | | 0.147 | | | | 0.131 | | | | 0.139 | | | | 0.152 | | | | 0.129 | |
Report of Independent Registered Public Accounting Firm
The Board of Directors and Shareholders of Autoliv, Inc.
We have audited the accompanying consolidated balance sheets of Autoliv, Inc. as of December 31, 2012 and 2011, and the related consolidated statements of net income and comprehensive income, shareholders’ equity, and cash flows for each of the three years in the period ended December 31, 2012. These financial statements are the responsibility of the Company’s management. Our responsibility is to express an opinion on these financial statements based on our audits.
We conducted our audits in accordance with the standards of the Public Company Accounting Oversight Board (United States). Those standards require that we plan and perform the audit to obtain reasonable assurance about whether the financial statements are free of material misstatement. An audit includes examining, on a test basis, evidence supporting the amounts and disclosures in the financial statements. An audit also includes assessing the accounting principles used and significant estimates made by management, as well as evaluating the overall financial statement presentation. We believe that our audits provide a reasonable basis for our opinion.
In our opinion, the financial statements referred to above present fairly, in all material respects, the consolidated financial position of Autoliv, Inc. at December 31, 2012 and 2011, and the consolidated results of its operations and its cash flows for each of the three years in the period ended December 31, 2012, in conformity with U.S. generally accepted accounting principles.
We also have audited, in accordance with the standards of the Public Company Accounting Oversight Board (United States), Autoliv, Inc.’s internal control over financial reporting as of December 31, 2012, based on criteria established in Internal Control-Integrated Framework issued by the Committee of Sponsoring Organizations of the Treadway Commission and our report dated February 22, 2013 expressed an unqualified opinion thereon.
Stockholm, Sweden
February 22, 2013 /s/ Ernst & Young AB
Report of Independent Registered Public Accounting Firm on Internal Control Over Financial Reporting
The Board of Directors and Shareholders of Autoliv, Inc.
We have audited Autoliv, Inc.’s internal control over financial reporting as of December 31, 2012, based on criteria established in Internal Control—Integrated Framework issued by the Committee of Sponsoring Organizations of the Treadway Commission (the COSO criteria). Autoliv, Inc.’s management is responsible for maintaining effective internal control over financial reporting, and for its assessment of the effectiveness of internal control over financial reporting included in the accompanying Management’s Report on Internal Control over Financial Reporting. Our responsibility is to express an opinion on the company’s internal control over financial reporting based on our audit.
We conducted our audit in accordance with the standards of the Public Company Accounting Oversight Board (United States). Those standards require that we plan and perform the audit to obtain reasonable assurance about whether effective internal control over financial reporting was maintained in all material respects. Our audit included obtaining an understanding of internal control over financial reporting, assessing the risk that a material weakness exists, testing and evaluating the design and operating effectiveness of internal control based on the assessed risk, and performing such other procedures as we considered necessary in the circumstances. We believe that our audit provides a reasonable basis for our opinion.
A company’s internal control over financial reporting is a process designed to provide reasonable assurance regarding the reliability of financial reporting and the preparation of financial statements for external purposes in accordance with generally accepted accounting principles. A company’s internal control over financial reporting includes those policies and procedures that (1) pertain to the maintenance of records that, in reasonable detail, accurately and fairly reflect the transactions and dispositions of the assets of the company; (2) provide reasonable assurance that transactions are recorded as necessary to permit preparation of financial statements in accordance with generally accepted accounting principles, and that receipts and expenditures of the company are being made only in accordance with authorizations of management and directors of the company; and (3) provide reasonable assurance regarding prevention or timely detection of unauthorized acquisition, use or disposition of the company’s assets that could have a material effect on the financial statements.
Because of its inherent limitations, internal control over financial reporting may not prevent or detect misstatements. Also, projections of any evaluation of effectiveness to future periods are subject to the risk that controls may become inadequate because of changes in conditions, or that the degree of compliance with the policies or procedures may deteriorate.
In our opinion, Autoliv, Inc. maintained, in all material respects, effective internal control over financial reporting as of December 31, 2012, based on the COSO criteria.
We also have audited, in accordance with the standards of the Public Company Accounting Oversight Board (United States), the consolidated balance sheets of Autoliv, Inc. as of December 31, 2012 and 2011, and the related consolidated statements of net income and comprehensive income, shareholders’ equity, and cash flows for each of the three years in the period ended December 31, 2012 of Autoliv, Inc. and our report dated February 22, 2013 expressed an unqualified opinion thereon.
Stockholm, Sweden
February 22, 2013 /s/ Ernst & Young AB
Glossary and Definitions
CAPITAL EMPLOYED
Total equity and net debt (net cash).
CAPITAL EXPENDITURES
Investments in property, plant and equipment.
CAPITAL TURN-OVER RATE
Annual sales in relation to average capital employed.
CPV
Content Per Vehicle, i.e. value of the safety products in a vehicle.
DAYS INVENTORY OUTSTANDING
Outstanding inventory relative to average daily sales.
DAYS RECEIVABLES OUTSTANDING
Outstanding receivables relative to average daily sales.
EARNINGS PER SHARE
Net income attributable to controlling interest relative to weighted average number of shares (net of treasury shares) assuming dilution and basic, respectively.
EBIT
Earnings before interest and taxes.
FREE CASH FLOW, NET
Cash flows from operating activities less capital expenditures, net.
TOTAL EQUITY RATIO
Total equity relative to total assets.
GROSS MARGIN
Gross profit relative to sales.
HCC
High-cost country (see pages 24-25 in the Annual Report for specification of our high-cost countries).
HEADCOUNT
Employees plus temporary, hourly personnel.
INTEREST-COVERAGE RATIO
Operating income relative to interest expense, see page 54 in the Annual Report for reconciliation of this non-U.S. GAAP measure.
LCC
Low-cost country (see pages 24-25 in the Annual Report for specification of our low-cost countries).
LEVERAGE RATIO
Net interest bearing debt in relation to EBITDA (Earnings Before Interest, Taxes, Depreciation and Amortization), see page 54 in the Annual Report for reconciliation of this non-U.S. GAAP measure.
LVP
Light vehicle production of light motor vehicles with a gross weight of up to 3.5 metric tons.
LMPU
Labor minutes per produced unit.
NET DEBT (NET CASH)
Short and long-term debt including debt-related derivatives less cash and cash equivalents, see page 42 in the Annual Report for reconciliation of this non-U.S. GAAP measure.
NET DEBT TO CAPITALIZATION
Net debt in relation to total equity (including non-controlling interest) and net debt.
NUMBER OF EMPLOYEES
Employees with a continuous employment agreement, recalculated to full time equivalent heads.
OPERATING MARGIN
Operating income relative to sales.
OPERATING WORKING CAPITAL
Current assets excluding cash and cash equivalents less current liabilities excluding short-term debt. Any current derivatives reported in current assets and current liabilities related to net debt are excluded from operating working capital. See page 42 in the Annual Report for reconciliation of this non-U.S. GAAP measure.
OUR MARKET
Passive Safety (occupant restraints) and Active Safety (collision avoidance). Passive safety products include seatbelts, airbags, steering wheels, electronic control units and crash sensors. Active safety products include radar and sensing technologies such as infrared night vision systems and camera systems.
PIIGS COUNTRIES
Portugal, Ireland, Italy, Greece and Spain combined.
PRETAX MARGIN
Income before taxes relative to sales.
PPM
Rejected parts per million parts supplied.
ROA
Rest of Asia includes all Asian countries except China and Japan.
RETURN ON CAPITAL EMPLOYED
Operating income and equity in earnings of affiliates, relative to average capital employed.
RETURN ON TOTAL EQUITY
Net income relative to average total equity.
TRIAD
Western Europe, North America and Japan combined.
Corporate Governance
This section should be read in conjunction with the proxy statement, which will be available at www.autoliv.com during the last week of March 2013. Please also refer to page 51-54 about Risk Management and page 55 about Internal Control in this Annual Report.
AUTOLIV IS A DELAWARE CORPORATION with its headquarters in Stockholm, Sweden. As a publicly traded U.S. corporation, the Company is subject primarily to U.S. state and federal corporate governance requirements as well as those of the New York Stock Exchange. Autoliv also has Swedish Depository Receipts traded on the NASDAQ OMX. In addition to, and consistent with, these statutory laws and regulations, Autoliv is governed by its own charter documents and internal standards and policies through its Restated Certificate of Incorporation, Restated By-laws, Corporate Governance Guidelines and Standards of Business Conduct and Ethics.
These documents guide and assist the Board in the exercise of its responsibilities and reflect the Board’s commitment to foster a culture of integrity and monitor the effectiveness of policy and decision-making, both at the Board and management level. The Board views corporate governance as an integral part of the basic operations of the Company and a necessary element for long-term sustainable growth in shareholder value.
SHAREHOLDERS’ MEETING
At the Annual Meeting of Shareholders each shareholder is entitled to one vote for each share of common stock owned. Shareholders can vote via the Internet, telephone or by proxy cards.
Business to be conducted at a Meeting shall only be that which has been properly brought before the Meeting and in compliance with our By-laws and Rule 14a-8 of the Exchange Act. For a shareholder proposal under Rule 14a-8 to be considered for inclusion in the proxy statement for our 2014 Shareholders’ Meeting, it must be received by us on or before November 25, 2013. If shareholders wish to present a proposal at our 2014 Shareholders’ Meeting but do not intend for the proposal to be included in our proxy statement, our By-laws provide that we must receive the written notice at our principal executive offices no earlier than the close of business on February 6, 2014 and no later than the close of business on March 8, 2014.
THE BOARD
The Board is entrusted with, and responsible for, overseeing the business and affairs of the Company.
The Board monitors the performance of the Company in relation to its goals, strategy, competitors, and the performance of the Chief Executive Officer (CEO) and provides constructive advice and feedback. While the Company currently has, and strongly prefers, an independent chairman, the Board is free under our Corporate Governance Guidelines to choose its chairman in a way that it deems best for the Company.
The Board has full access to management and to Autoliv’s outside advisors. The work of the Board is reported annually in the proxy statement (see www.autoliv.com/investors).
The Board has adopted Corporate Governance Guidelines that reflect its commitment to monitor the effectiveness of policy and decision-making both at the Board and management level. In order to ensure that the Company’s governing principles remain up-to-date and consistent with high levels of corporate governance, the Board periodically reviews the Company’s Corporate Governance Guidelines and amends them as appropriate.
According to the Restated Certificate of Incorporation, the number of directors may be fixed from time to time exclusively by the Board. Pursuant to our By-laws the directors are divided into three classes, each class serving for terms of three years. The Board believes that it should generally have no fewer than nine and no more than twelve directors.
Members of the Board of Directors are normally elected at the Annual Meeting of Shareholders. According to the By-laws, directors are elected by a plurality of the votes of the shares present at a shareholders’ meeting in person or by proxy and entitled to vote thereon. However, pursuant to the Company’s Corporate Governance Guidelines, if a director nominee in an uncontested election fails to receive the approval of a majority of the votes cast on his or her election by the Company shareholders, the nominee shall promptly offer his or her resignation to the Board. A committee consisting of the Board’s independent directors (which will specifically exclude any director who is required to offer his or her own resignation) shall consider all relevant factors and decide on behalf of the Board whether to accept the resignation or take other action.
DIRECTORS
Directors are expected to spend the time and effort necessary to properly discharge their responsibilities, and, accordingly, regular attendance of meetings of the Board and committees on which directors sit is expected. Directors are also expected to attend the Annual Meeting of Shareholders.
The Board is responsible for nominating members for election to the Board and for filling vacancies on the Board that may occur between annual meetings of shareholders.
The Nominating and Corporate Governance Committee is responsible for identifying, screening and recommending candidates to the Board. The Committee will consider director candidates nominated by shareholders.
Nominees for director are selected on the basis of many factors, including positions of leadership attained in the candidate’s area of expertise, business and financial experience relevant to the Company, possession of demonstrated sound business judgment, expertise relevant to the Company’s lines of business, independence from management, the ability to serve on standing committees and the ability to serve the interests of all shareholders. The Nominating and Corporate Governance Committee routinely considers board candidates with a broad range of educational and professional experience from a variety of countries. The Board must be comprised of a majority of directors who qualify as independent under the listing standards of the New York Stock Exchange. Currently, all board members are independent, with the exception of the CEO.
On an annual basis, the Board reviews the relations that each director has with the Company to assess independence. A director who is also an employee of the Company is generally expected to resign from the Board when his employment with the Company ends. New directors are provided information about Autoliv’s business and operations, strategic plans, significant financial, accounting and risk management issues, compliance programs and various codes and guidelines.
BOARD COMPENSATION
A director who is also an officer of the Company does not receive additional compensation for service as a director.
Board compensation is disclosed in Autoliv’s Proxy Statement together with the compensation of the five most highly-compensated senior executives. Directors’ fees are the only compensation that the directors, including all of the members of the Audit Committee, can receive from Autoliv. In February 2012, the Board adopted a policy that non-employee directors be expected to hold one year’s annual fees worth of Autoliv’s common stock, with a three year period to acquire such holdings.
Effective January 1, 2013, the Company adopted new stock ownership guidelines for its executive officers. Pursuant to these guidelines, and subject to other conditions, each executive officer is expected to accumulate and hold shares of Company common stock having a value at least equal to (i) 2x his annual base salary, in the case of the CEO, and (ii) 1x annual base salary, in the case of each executive other than the CEO.
BOARD MEETINGS
It is Autoliv policy that there be five regularly scheduled meetings of the Board each year, and at least one regularly scheduled meeting of the Board must be held in each quarter.
The meetings of the Board generally follow a master agenda which is discussed and agreed early each year, but any director is free to raise any other issues or subjects. The Nominating and Corporate Governance Committee initiates an annual self-assessment of the Board’s performance as well as the performance of each committee of the Board. The results of such assessments are discussed with the full Board and each committee.
The independent directors normally meet in executive sessions in conjunction with each meeting of the Board and shall meet at least four times a year. The Chairman of the Board, who is independent, normally leads the executive sessions of the independent directors.
COMMITTEE MATTERS
All directors serving on board committees have been determined by the Board to be independent directors. The committees operate under written charters and the standing committees issue yearly reports that are disclosed in the proxy statement.
There are three standing committees of the Board: Audit Committee, Compensation Committee and Nominating and Corporate Governance Committee. In June 2011 the Board also formed a special Compliance Committee.
Audit Committee
The Audit Committee appoints, at its sole discretion (subject to shareholder ratification), the Company’s independent auditors that audit the annual financial statements. The Audit Committee is also responsible for the compensation, retention and oversight of the work of the external auditors as well as for any special assignments given to the auditors.
The committee also reviews;
| | • | | the annual audit and its scope, including the independent auditors’ letter of comments and management’s responses thereto; |
| | • | | the policy with regard to risk oversight and risk management as part of its obligations under the NYSE’s listing standards; |
| | • | | possible violations of Autoliv’s business ethics and conflicts of interest policies; |
| | • | | any major accounting changes made or contemplated; |
| | • | | approves any Related Person Transaction; and |
| | • | | reviews the effectiveness and efficiency of Autoliv’s internal audit function. In addition, the committee confirms that no restrictions have been imposed by Company personnel in terms of the scope of the independent auditors’ examinations. |
Each member of the Audit Committee possesses financial literacy and accounting or related financial management expertise.
Currently, one member, Robert W. Alspaugh, the Chairman of the Audit Committee, has been determined to qualify as an audit committee financial expert.
Compensation Committee
The Compensation Committee advises the Board with respect to the compensation to be paid to the directors and senior executives and approves and advises the Board with respect to the terms of contracts to be entered into with the senior executives.
The committee also administers Autoliv’s incentive plans as well as perquisites and other benefits to the executive officers.
Nominating and Corporate Governance Committee
The Nominating and Corporate Governance Committee assists the Board in identifying potential candidates to the Board, reviewing the composition of the Board and its committees, monitoring a process to assess Board effectiveness and developing and implementing Autoliv’s Corporate Governance Guidelines.
The committee will consider shareholder nominees for election to the Board if timely advance written notice of such nominees is received by the Secretary of the Company, as detailed in the Company’s 2013 proxy statement.
Compliance Committee
The Compliance Committee was formed to assist the Board in overseeing the Company’s compliance program with respect to: (i) compliance with the laws and regulations applicable to the Company’s business and (ii) compliance with the Company’s Standards of Business Conduct and Ethics and related policies designed to support lawful and ethical business conduct by the Company and its employees and promote a culture of compliance. The Compliance Committee also oversees the investigation of any alleged non-compliance with applicable laws or the Company’s compliance policies (except those relating to financial compliance which are overseen by the Audit Committee).
LEADERSHIP DEVELOPMENT
The Board is responsible for identifying potential candidates for, as well as selecting, the CEO. The Board is also responsible for an annual performance review of the CEO, and a summary report is discussed among independent directors in executive sessions and thereafter with the CEO.
The Board is required to form succession plans for the CEO’s position, with the assistance of the CEO, who shall prepare and distribute to the Board an annual report on succession planning for senior officers.
The Board is also required to review and determine that satisfactory systems are in place for the education, development and succession of senior and mid-level management.
ETHICAL CODES
To maintain the highest legal and ethical standards, the Board has adopted a set of Standards of Business Conduct and Ethics, which applies to all directors, officers and employees. Additionally, the Board has adopted Corporate Governance Guidelines and a Code of Conduct and Ethics for Directors and Senior Officers. The Company also has a separate stand-alone related-person-transaction policy that applies to all directors, officers and employees of the Company.
Employees are encouraged to report any violations of law or of the Company’s ethical codes and policies, and policies are in place to prevent retaliation against any individual for reporting in good faith violations of law or the Company’s ethical codes and policies.
Reports can be made to Autoliv’s Compliance Officer or legal department (for contact information see page 88 in the Annual Report), or by using the Autoliv Helpline—a multilingual service where reports can be made anonymously, without fear of retaliation, 24 hours a day, 7 days a week, by phone or online athttp://helpline.autoliv.com.
Board of Directors
Lars Nyberg
Chairman (since December 2011). Born 1951. Director since 2004. Elected until 2014. Former President and CEO of TeliaSonera AB. Former Chairman and CEO of NCR Corp. Chairman of DataCard Corp. BBA.
Jan Carlson
Born 1960. President and CEO. Director since 2007. Elected until 2014. Former Vice President Engineering. Former President of Autoliv Europe, Autoliv Electronics, and of SAAB Combitech. Director of BorgWarner Inc. M.Sc.
Robert W. Alspaugh
Born 1947. Director since 2006. Elected until 2013. Former CEO of KPMG International. Former Deputy Chairman and COO of KPMG’s U.S. practice. Director of Ball Inc. and Verifone Holding. BBA.
Bo Andersson
Born 1955. Director since 2012. Elected until 2013. President and CEO of GAZ Group. Former group vice president of the GM Corporation in charge of global purchasing and supply chain. Director of GAZ OJSC. BBA.
George A. Lorch
Born 1941. Director since 2003. Elected until 2015. Former Chairman, President and CEO of Armstrong World Industries. Lead Director of Pfizer, Inc. Director of WPX Energy, Inc., HSBC North America Holdings Company and HSBC Finance Co. B.Sc.
Xiaozhi Liu
Born 1956. Director since 2011. Elected until 2015. CEO of ASL Automobile Science & Technology (Shanghai) Co., Ltd. Former Chairman of the Board of NeoTek China. Former Director of Viryd Technologies. Former CEO and Vice Chairman of Fuyao Glass Industry Group Co Ltd. Former Chairman & CEO of General Motors Taiwan. Former CTO and Chief Engineer of GM China. B.Sc., M.Sc., Ph.D.
James M. Ringler
Born 1945. Director since 2002. Elected until 2014. Former Vice Chairman of Illinois Tool Works Inc. Former Chairman, President and CEO of Premark International, Inc. Chairman of Teradata Corp. Director of Dow Chemical Company, FMC Technologies Inc., JBT Corporation, and Corn Products Corporation. B.Sc. and MBA.
Kazuhiko Sakamoto
Born 1945. Director since 2007. Elected until 2015. Former President of Marubeni Construction Material Lease Co. Ltd, an affiliate of Marubeni Corporation, for which he served as Counselor and senior corporate advisor. Currently an advisor at Pasona, Inc. Graduate of Keio University and participant of the Harvard University Research Institute for International Affairs.
Wolfgang Ziebart
Born 1950. Director since 2008. Elected until 2013. Former President & CEO of Infineon Technologies AG. Former member of the executive boards of BMW AG and of Continental AG. Member of the Board of Directors of ASML and Head of the Supervisory Board of Nordex and Novaled AG. Dr. Sc.
MEETINGS AND COMMITTEES 20121)
| | | | | | | | | | | | | | | | | | | | | | |
| | | Independent2) | | Board | | Audit | | | Compensation | | | Nominating &
Corp. Gov. | | | Compliance | | | Nationality |
Lars Nyberg | | Yes | | 5/5 | | | 8/9 | 4) | | | 5/5 | | | | 2/4 | 4) | | | 3/10 | 4) | | SWE |
Robert W. Alspaugh3) | | Yes | | 5/5 | | | 9/9 | | | | 1/5 | 4) | | | — | | | | 10/10 | | | US |
Bo I. Andersson | | Yes | | 5/5 | | | — | | | | 1/5 | 4) | | | 2/4 | 4) | | | — | | | SWE |
Jan Carlson | | No | | 5/5 | | | 9/9 | 4) | | | 5/5 | 4) | | | 4/4 | 4) | | | 2/10 | 4) | | SWE |
Walter Kunerth5) | | Yes | | 5/5 | | | 9/9 | | | | — | | | | — | | | | — | | | GER |
George A. Lorch | | Yes | | 5/5 | | | — | | | | 5/5 | | | | 4/4 | | | | — | | | US |
Xiaozhi Liu | | Yes | | 5/5 | | | — | | | | 1/5 | 4) | | | — | | | | — | | | GER |
James M. Ringler | | Yes | | 5/5 | | | — | | | | 5/5 | | | | — | | | | — | | | US |
Kazuhiko Sakamoto | | Yes | | 5/5 | | | — | | | | — | | | | 4/4 | | | | 9/10 | | | JPN |
Wolfgang Ziebart | | Yes | | 5/5 | | | 9/9 | | | | — | | | | 4/4 | | | | 10/10 | | | GER |
| 1) | Attended meetings in relation to total possible meetings for each member. 2) Under the rules of the New York Stock Exchange, the Sarbanes-Oxley Act and the SEC. 3) Qualifies/qualified as audit committee financial expert. 4) Not a member of this committee, attended at the invitation of the committee’s chair. 5) Retired from the Board on December 18, 2012. |
Executive Management Team
Jan Carlson
President & CEO.
Born 1960. Employed 1999
Mats Adamson
Vice President Human Resources.
Born 1959. Employed 2010
Henrik Arrland
Vice President Purchasing.
Born 1967. Employed 2011
Günter Brenner1)
President Autoliv Europe.
Born 1963. Employed 2009
George Chang
President Autoliv Asia.
Born 1964. Employed 1997
Steven Fredin
President Autoliv Americas.
Born 1962. Employed 1988
Johan Löfvenholm
Vice President Engineering.
Born 1969. Employed 1995
Svante Mogefors
Vice President Quality and Manufacturing.
Born 1955. Employed 1996
Mats Ödman2)
Vice President Corporate Communications.
Born 1950. Employed 1994
Jan Olsson
Vice President Research.
Born 1954. Employed 1987
Steven Rodé
President Electronics.
Born 1961. Employed 1984
Lars Sjöbring
Vice President Legal Affairs, General Counsel and Secretary.
Born 1967. Employed 2007
Mats Wallin
Vice President Finance, Chief Financial Officer.
Born 1964. Employed 2002
| | | | | | | | | | | | | | | | | | | | | | | | | | | | | | | | | | |
NAME | | SHARES3) | | | RSU’S3) | | | OPTIONS3) | | | TOTAL3) | | | | | SHARES3) | | | RSU’S3) | | | OPTIONS3) | | | TOTAL3) | |
Board of Directors | | | | | | | | | | | | | | | | | | Executive Management Team | | | | | | | | | |
Lars Nyberg | | | 6,638 | | | | — | | | | — | | | | 6,638 | | | Jan Carlson | | | 51,101 | | | | 16,058 | | | | 112,175 | | | | 179,334 | |
Robert W. Alspaugh | | | 3,919 | | | | — | | | | — | | | | 3,919 | | | Mats Adamson | | | — | | | | 5,940 | | | | 17,822 | | | | 23,762 | |
Bo I. Andersson | | | 751 | | | | — | | | | — | | | | 751 | | | Henrik Arrland | | | — | | | | 3,238 | | | | 9,716 | | | | 12,954 | |
Jan Carlson | | | 51,101 | | | | 16,058 | | | | 112,175 | | | | 179,334 | | | Günter Brenner | | | — | | | | — | | | | 8,955 | | | | 8,955 | |
Xiaozhi Liu | | | 819 | | | | — | | | | — | | | | 819 | | | George Chang | | | 2,666 | | | | 4,120 | | | | 14,862 | | | | 21,648 | |
George A. Lorch | | | 1,122 | | | | — | | | | — | | | | 1,122 | | | Steven Fredin | | | 2,333 | | | | 4,993 | | | | 24,980 | | | | 32,306 | |
James M. Ringler | | | 1,783 | | | | — | | | | — | | | | 1,783 | | | Johan Löfvenholm | | | — | | | | 3,716 | | | | 11,150 | | | | 14,866 | |
Kazuhiko Sakamoto | | | 819 | | | | — | | | | — | | | | 819 | | | Svante Mogefors | | | 5,500 | | | | 4,607 | | | | 53,222 | | | | 63,329 | |
Wolfgang Ziebart | | | 819 | | | | — | | | | — | | | | 819 | | | Mats Ödman | | | 17,636 | | | | 4,607 | | | | 65,222 | | | | 87,465 | |
| | | | | | | | | | | | | | | | | | Jan Olsson | | | 17,133 | | | | 4,607 | | | | 44,222 | | | | 65,962 | |
| | | | | | | | | | | | | | | | | | Steve Rodé | | | 2,329 | | | | 2,155 | | | | 6,466 | | | | 10,950 | |
| | | | | | | | | | | | | | | | | | Lars Sjöbring | | | — | | | | 4,607 | | | | 29,722 | | | | 34,329 | |
| | | | | | | | | | | | | | | | | | Mats Wallin | | | 4,508 | | | | 6,213 | | | | 35,465 | | | | 46,186 | |
| | | | | | | | | | | | | | | | | | | | | | | | | | | | | | | | | | |
SUBTOTAL | | | 67,771 | | | | 16,058 | | | | 112,175 | | | | 196,004 | | | SUBTOTAL | | | 103,206 | | | | 64,861 | | | | 433,979 | | | | 602,046 | |
| | | | | | | | | | | | | | | | | | | | | | | | | | | | | | | | | | |
| | | | | | | | | | | | | | | | | | GROSS TOTAL4) | | | 119,876 | | | | 64,861 | | | | 433,979 | | | | 618,716 | |
| | | | | | | | | | | | | | | | | | | | | | | | | | | | | | | | | | |
| 1) | As previously announced, Mr. Brenner has notified the Company that he will be resigning effective later in the spring of 2013. Mr. Franck Roussel will be serving as interim President Autoliv Europe following the effectiveness of Mr. Brenner’s resignation. Mr. Roussel is currently Vice President Operations of Autoliv Asia. 2) As previously announced, Mr. Ödman will be stepping down from his position on May 1, 2013 and will officially retire in the fall. Mr. Thomas Jönsson (former Vice President of Brand and External Communications for TeliaSonera) will replace Mr. Ödman. 3) Number of shares, RSUs and stock options as of February 20, 2013. For any changes thereafter please refer to Autoliv’s corporate website or each director’s or manager’s filings with the SEC. Insider filings are also made with Finansinspektionen in Sweden. 4) Gross total for all listed directors and executives. |
For presentations of the Executive Management Team, please refer to our filings, including in our proxy statement, on file with the U.S. Securities and Exchange Commission (SEC) and available at www.sec.gov, orwww.autoliv.com
Contact Information & Calendar
AUTOLIV INC.
Visiting address:
Vasagatan 11, 7th Floor, Stockholm, Sweden
Mail: P.O. Box 70381, SE-107 24 Stockholm, Sweden
Tel: +46 (0)8 587 20 600
E-mail: info@autoliv.com
Internet: www.autoliv.com
CONTACT INFORMATION BOARD AND CORPORATE COMPLIANCE COUNSEL
c/o Vice President Legal Affairs Autoliv, Inc. / Box 70381,
SE-107 24 Stockholm, Sweden
Tel: +46 (0)8 58 72 06 00
Fax: +46 (0)8 58 72 06 33
E-mail: legalaffairs@autoliv.com
The Board, the independent directors, as well as the committees of the Board can be contacted using the address above. Contact can be made anonymously and communication with the independent directors is not screened. The relevant chairman receives all such communication after it has been determined that the content represents a message to such chairman.
STOCK TRANSFER AGENT & REGISTRAR
Internet: www.computershare.com
INVESTOR REQUESTS AMERICAS
Autoliv, Inc., c/o Autoliv Electronics America,
26545 American Drive, Southfield, MI 48034
Tel: +1 (248) 223 8107
E-mail: ray.pekar@autoliv.com
INVESTOR REQUESTS REST OF THE WORLD
Autoliv, Inc., Box 70381, SE-107 24, Stockholm, Sweden
Tel: +46 (0)8 58 72 06 27
E-mail: thomas.jonsson@autoliv.com
MEDIA CONTACT
Autoliv, Inc., Box 70381, SE-107 24, Stockholm, Sweden
Tel: +46 (0)8 58 72 06 27
E-mail: mediacontact@autoliv.com
ACKNOWLEDGEMENTS
Concept and Design: PCG Stockholm, Sweden
Illustrations: Borgs Ingenjörsbyrå, Sweden
The raw material of this report supports responsibly managed forests. Paper Gallerie Art Matt, Colorit.
| | |
2013 FINANCIAL CALENDAR |
| |
DATE | | EVENT |
April 26, 2013 | | Q1 Report |
May 7, 2013 | | Shareholder AGM |
July 19, 2013 | | Q2 Report |
October 24, 2013 | | Q3 Report |
| | | | | | | | | | |
PRELIMINARY DIVIDEND PLAN 2013 | |
| | | |
PERIOD | | EX-DATE | | RECORD
DATE | | | PLANNED
PAYMENT DATE | |
1st quarter | | February 19 | | | February 21 | | | | March 7 | |
2nd quarter1) | | May 20 | | | May 22 | | | | June 7 | |
3rd quarter1) | | August 19 | | | August 21 | | | | September 5 | |
4th quarter1) | | November 18 | | | November 20 | | | | December 5 | |
| 1) | If declared by the Board. |
Selected Financial Data
| | | | | | | | | | | | | | | | | | | | |
(DOLLARS IN MILLIONS, EXCEPT PER SHARE DATA) | | 20121) | | | 20111) | | | 20101) | | | 20091) | | | 20081) | |
Sales and Income | �� | | | | | | | | | | | | | | | | | | | |
Net sales | | $ | 8,267 | | | $ | 8,232 | | | $ | 7,171 | | | $ | 5,121 | | | $ | 6,473 | |
Operating income | | | 705 | | | | 889 | | | | 869 | | | | 69 | | | | 306 | |
Income before income taxes | | | 669 | | | | 828 | | | | 806 | | | | 6 | | | | 249 | |
Net income attributable to controlling interest | | | 483 | | | | 623 | | | | 591 | | | | 10 | | | | 165 | |
| | | | | |
Financial Position | | | | | | | | | | | | | | | | | | | | |
Current assets excluding cash | | | 2,312 | | | | 2,261 | | | | 2,101 | | | | 1,707 | | | | 1,598 | |
Property, plant and equipment | | | 1,233 | | | | 1,121 | | | | 1,026 | | | | 1,042 | | | | 1,158 | |
Intangible assets (primarily goodwill) | | | 1,707 | | | | 1,716 | | | | 1,722 | | | | 1,729 | | | | 1,745 | |
Non-interest bearing liabilities | | | 2,162 | | | | 2,102 | | | | 2,001 | | | | 1,610 | | | | 1,361 | |
Capital employed2) | | | 3,415 | | | | 3,257 | | | | 3,066 | | | | 3,098 | | | | 3,369 | |
Net (cash) debt | | | (361 | ) | | | (92 | ) | | | 127 | | | | 662 | | | | 1,195 | |
Total equity2) | | | 3,776 | | | | 3,349 | | | | 2,939 | | | | 2,436 | | | | 2,174 | |
Total assets | | | 6,570 | | | | 6,117 | | | | 5,665 | | | | 5,186 | | | | 5,206 | |
Long-term debt | | | 563 | | | | 364 | | | | 638 | | | | 821 | | | | 1,401 | |
| | | | | |
Share data | | | | | | | | | | | | | | | | | | | | |
Earnings per share (US$) – basic | | | 5.17 | | | | 6.99 | | | | 6.77 | | | | 0.12 | | | | 2.29 | |
Earnings per share (US$) – assuming dilution | | | 5.08 | | | | 6.65 | | | | 6.39 | | | | 0.12 | | | | 2.28 | |
Total parent shareholders’ equity per share (US$)2) | | | 39.36 | | | | 37.33 | | | | 32.89 | | | | 28.06 | | | | 30.11 | |
Cash dividends paid per share (US$) | | | 1.89 | | | | 1.73 | | | | 0.65 | | | | 0.21 | | | | 1.60 | |
Cash dividends declared per share (US$) | | | 1.94 | | | | 1.78 | | | | 1.05 | | | | — | | | | 1.42 | |
Share repurchases | | | — | | | | — | | | | — | | | | — | | | | 174 | |
Number of shares outstanding (million)3) | | | 95.5 | | | | 89.3 | | | | 89.0 | | | | 85.1 | | | | 70.3 | |
| | | | | |
Ratios | | | | | | | | | | | | | | | | | | | | |
Gross margin (%) | | | 19.9 | | | | 21.0 | | | | 22.2 | | | | 16.6 | | | | 17.4 | |
Operating margin (%) | | | 8.5 | | | | 10.8 | | | | 12.1 | | | | 1.3 | | | | 4.7 | |
Pretax margin (%) | | | 8.1 | | | | 10.1 | | | | 11.2 | | | | 0.1 | | | | 3.8 | |
Return on capital employed (%)2) | | | 21 | | | | 28 | | | | 28 | | | | 2 | | | | 9 | |
Return on total equity (%)2) | | | 14 | | | | 20 | | | | 22 | | | | 1 | | | | 7 | |
Total equity ratio (%)2) | | | 57 | | | | 55 | | | | 52 | | | | 47 | | | | 42 | |
Net debt to capitalization (%) | | | n/a | | | | n/a | | | | 4 | | | | 21 | | | | 36 | |
Days receivables outstanding | | | 66 | | | | 67 | | | | 69 | | | | 75 | | | | 49 | |
Days inventory outstanding | | | 30 | | | | 32 | | | | 32 | | | | 40 | | | | 39 | |
| | | | | |
Other data | | | | | | | | | | | | | | | | | | | | |
Airbag sales4,6) | | | 5,392 | | | | 5,393 | | | | 4,723 | | | | 3,250 | | | | 4,130 | |
Seatbelt sales5) | | | 2,657 | | | | 2,679 | | | | 2,363 | | | | 1,822 | | | | 2,343 | |
Active Safety sales6) | | | 218 | | | | 160 | | | | 85 | | | | 49 | | | | n/a | |
Net cash provided by operating activities | | | 689 | | | | 758 | | | | 924 | | | | 493 | | | | 614 | |
Capital expenditures, net | | | 360 | | | | 357 | | | | 224 | | | | 130 | | | | 279 | |
Net cash used in investing activities | | | (358 | ) | | | (373 | ) | | | (297 | ) | | | (157 | ) | | | (321 | ) |
Net cash provided by (used in) financing activities | | | (91 | ) | | | (223 | ) | | | (529 | ) | | | (376 | ) | | | 98 | |
Number of employees, December 31 | | | 41,700 | | | | 38,500 | | | | 34,600 | | | | 30,200 | | | | 34,000 | |
| 1) | Costs in 2012, 2011, 2010, 2009 and 2008 for capacity aligments and antitrust investigations reduced operating income by (millions) $98, $19, $21, $133 and $80 and net income by (millions) $71, $14, $16, $96 and $55. This corresponds to 1.2%, 0.2%, 0.3%, 2.6% and 1.3% on operating margins and 0.9%, 0.2%, 0.2%, 1.9% and 0.8% on net margins. The impact on EPS was $0.74, $0.15, $0.17, $1.14 and $0.76 while return on total equity was reduced by 1.8%, 0.4%, 0.6%, 4.1% and 2.3% for the same five year period. 2) Adjusted in accordance with FASB ASC 810, adopted on January 1, 2009. 3) At year end, net of treasury shares. 4) Incl. passive electronics, steering wheels, inflators and initiators. 5) Includes seat components until a June 2012 divestiture. 6) In 2008 sales for active safety products were in Airbag sales. |