Exhibit 99.2
Autoliv’s Business Plan
Capital Market Day Vårgårda, May 14, 2013
Jan Carlson
President & CEO
Copyright Autoliv Inc., All Rights Reserved
Driven for Life.
Safe Harbor Statement *
Each of the presentations herein contain statements that are not historical facts but rather forward-looking statements within the meaning of the Private Securities Litigation Reform Act of 1995. Such forward-looking statements include those that address activities, events or developments that Autoliv, Inc. or its management believes or anticipates may occur in the future. All forward-looking statements, including without limitation, management’s examination of historical operating trends and data, are based upon our current expectations, various assumptions and data available from third parties. Our expectations and assumptions are expressed in good faith and we believe there is a reasonable basis for them. However, there can be no assurance that such forward-looking statements will materialize or prove to be correct as forward-looking statements are inherently subject to known and unknown risks, uncertainties and other factors which may cause actual future results, performance or achievements to differ materially from the future results, performance or achievements expressed in or implied by such forward-looking statements. The outcome of these forward-looking statements could differ materially from those stated for a variety of reasons, including without limitation, changes in and the successful execution of our capacity alignment, restructuring and cost reduction initiatives; changes in general industry or regional market conditions; loss of business from increased competition; higher raw material, fuel and energy costs; changes in consumer and customer preferences for end products; customer losses; changes in regulatory conditions; customer bankruptcies or divestiture of customer brands; unfavorable fluctuations in currencies or interest rates among the various jurisdictions in which we operate; fluctuation in vehicle production schedules; component shortages; market acceptance of our new products; continued uncertainty in pricing negotiations with customers, our ability to be awarded new business; product liability, warranty and recall claims and other litigation and customer reactions thereto; higher expenses for our pension and other postretirement benefits; work stoppages or other labor issues; possible adverse results of pending or future litigation or infringement claims; negative impacts of antitrust investigations or other governmental investigations and associated litigation (including securities litigation) relating to the conduct of our business; tax assessments by governmental authorities; dependence on key personnel; legislative or regulatory changes limiting our business; political conditions; dependence on customers and suppliers; and other risks and uncertainties identified under the headings “Risk Factors” and “Management’s Discussion and Analysis of Financial Condition and Results of Operations” in our Annual Reports and Quarterly Reports on Forms 10-K and 10-Q and any amendments thereto. The Company undertakes no obligation to update publicly or revise any forward-looking statements in light of new information or future events. For any forward-looking statements contained in this or any other document, we claim the protection of the safe harbor for forward-looking statements contained in the Private Securities Litigation Reform Act of 1995, and we assume no obligation to update any such statement.
(*) Non-US GAAP reconciliations are disclosed in our 8-K/10-K/10-Q filings available at www.sec.gov or www.autoliv.com
Page- 2 Copyright Autoliv Inc., All Rights Reserved
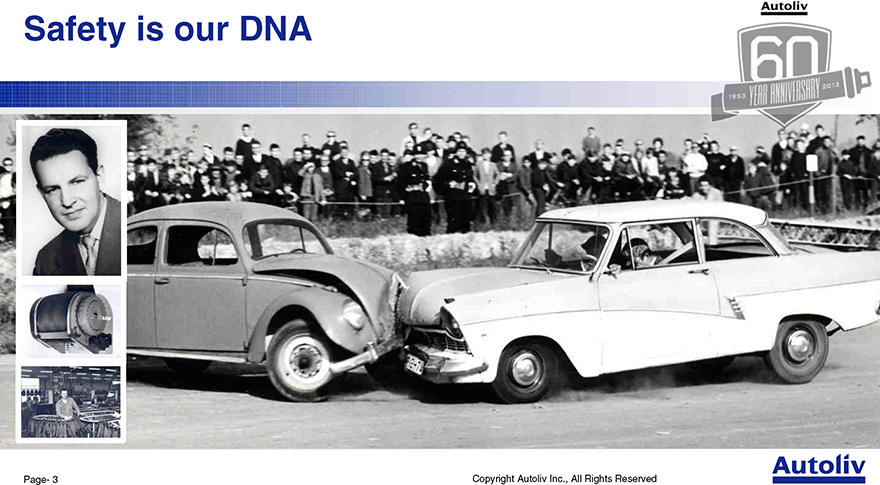
Safety is our DNA
Page- 3 Copyright Autoliv Inc., All Rights Reserved
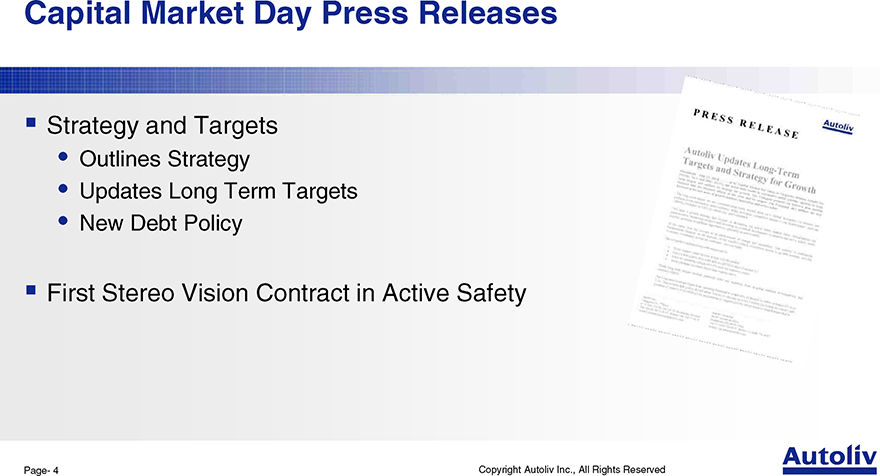
Capital Market Day Press Releases
Strategy and Targets
Outlines Strategy
Updates Long Term Targets
New Debt Policy
First Stereo Vision Contract in Active Safety
Page- 4 Copyright Autoliv Inc., All Rights Reserved
Today’s Program
Business Plan and Targets
Financials and New Debt Policy
Growth Markets
Innovations
Active Safety
Page- 5 Copyright Autoliv Inc., All Rights Reserved
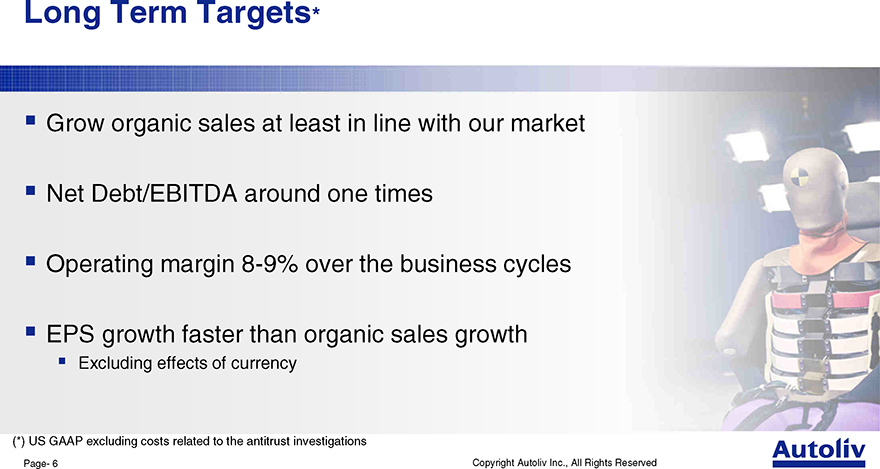
Long Term Targets*
Grow organic sales at least in line with our market Net Debt/EBITDA around one times Operating margin 8-9% over the business cycles EPS growth faster than organic sales growth
Excluding effects of currency
(*) US GAAP excluding costs related to the antitrust investigations
Page- 6 Copyright Autoliv Inc., All Rights Reserved
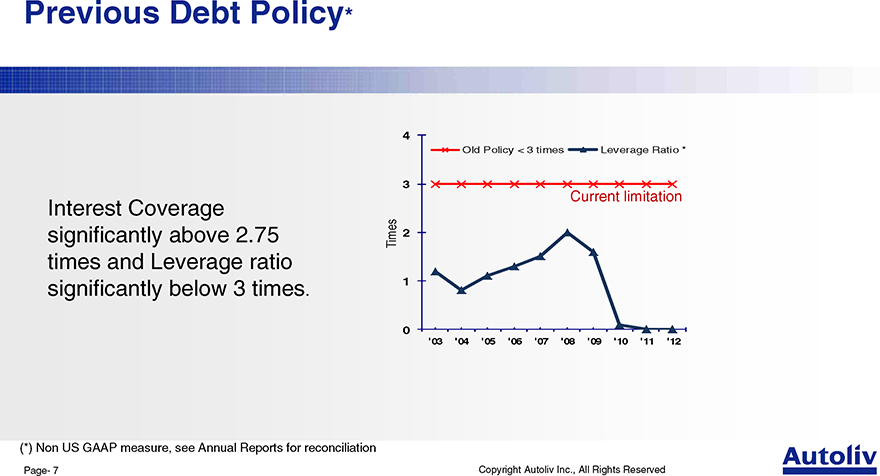
Previous Debt Policy*
Interest Coverage significantly above 2.75 times and Leverage ratio significantly below 3 times.
4 |
|
Old Policy < 3 times Leverage Ratio *
3 |
|
Current limitation
Times 2
1 |
|
0
‘03 ‘04 ‘05 ‘06 ‘07 ‘08 ‘09 ‘10 ‘11 ‘12
(*) Non US GAAP measure, see Annual Reports for reconciliation
Page- 7 Copyright Autoliv Inc., All Rights Reserved
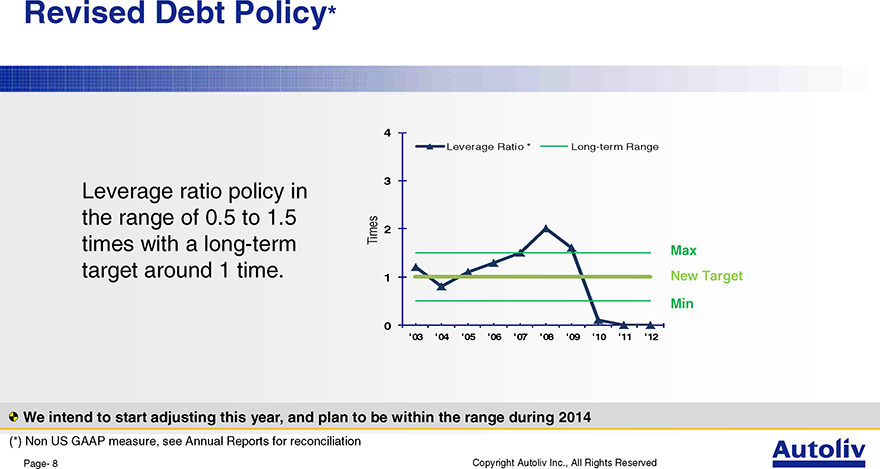
Revised Debt Policy*
Leverage ratio policy in the range of 0.5 to 1.5 times with a long-term target around 1 time.
4 |
|
Leverage Ratio * Long-term Range
3 |
|
Times 2
Max
1 |
| New Target |
Min
0
‘03 ‘04 ‘05 ‘06 ‘07 ‘08 ‘09 ‘10 ‘11 ‘12
We intend to start adjusting this year, and plan to be within the range during 2014
(*) Non US GAAP measure, see Annual Reports for reconciliation
Page- 8 Copyright Autoliv Inc., All Rights Reserved
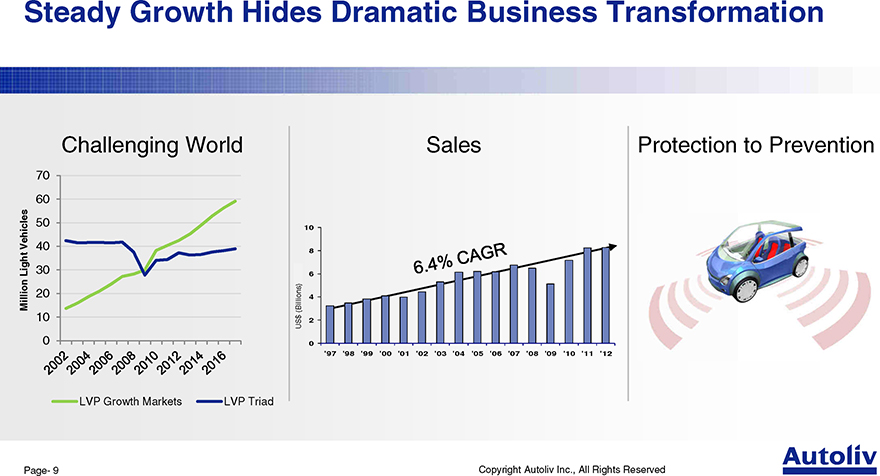
Steady Growth Hides Dramatic Business Transformation
Challenging World
70
60
Vehicles 50
40
Light 30
Million 20
10
0
LVP Growth Markets LVP Triad
Sales
10
8 |
|
(illions) 6
$
(Billions)US 4
$
US 2
0
‘97 ‘98 ‘99 ‘00 ‘01 ‘02 ‘03 ‘04 ‘05 ‘06 ‘07 ‘08 ‘09 ‘10 ‘11 ‘12
Protection to Prevention
Page- 9 Copyright Autoliv Inc., All Rights Reserved
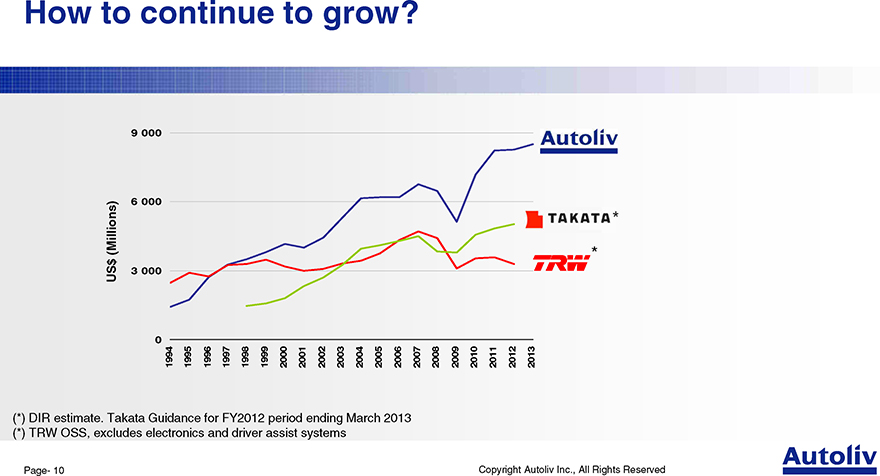
How to continue to grow?
US$ (Millions)
3 |
| 69 |
0 000 000 000
1994 1995 1996 1997 1998 1999 2000 2001 2002 2003 2004 2005 2006 2007 2008 2009 2010 2011 2012 2013
* |
|
(*) DIR estimate. Takata Guidance for FY2012 period ending March 2013 (*) TRW OSS, excludes electronics and driver assist systems
Page- 10 Copyright Autoliv Inc., All Rights Reserved
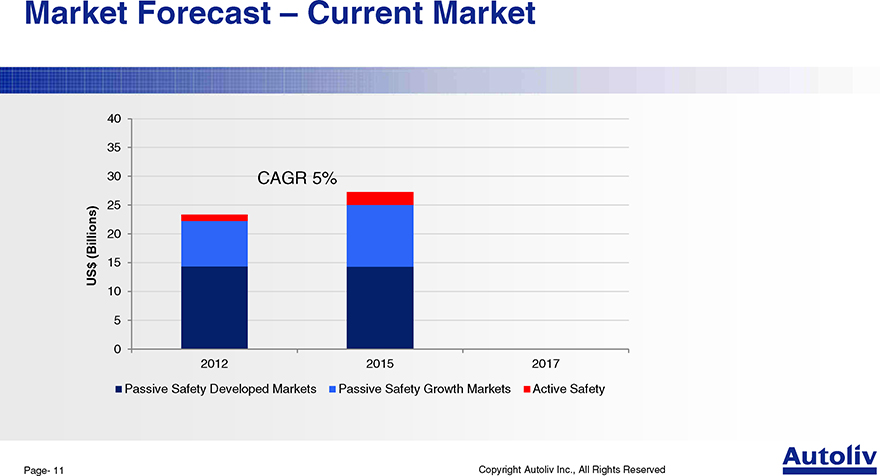
Market Forecast – Current Market
40
35
30 CAGR 5%
25
(Billions) 20
$ 15
US
10
5 |
|
0
2012 2015 2017
Passive Safety Developed Markets Passive Safety Growth Markets Active Safety
Page- 11 Copyright Autoliv Inc., All Rights Reserved
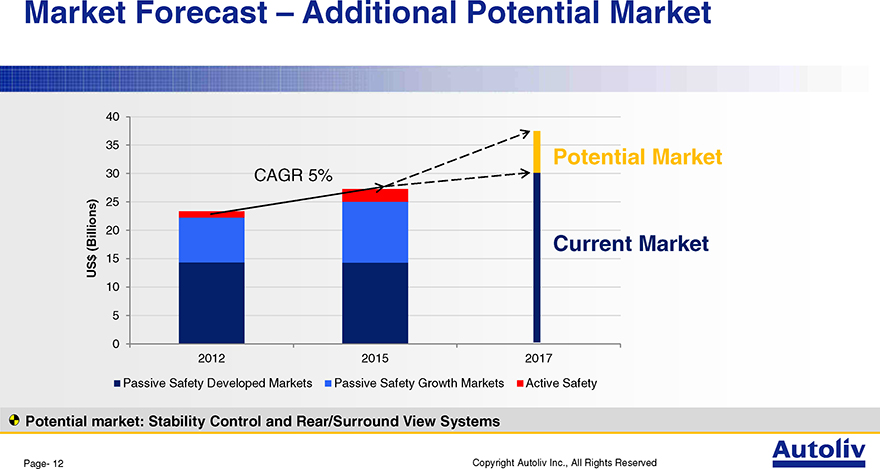
Market Forecast – Additional Potential Market
40
35 Potential Market
30 CAGR 5%
25
(Billions) 20
Current Market
US $ 15 10
5 |
|
0
2012 2015 2017
Passive Safety Developed Markets Passive Safety Growth Markets Active Safety
Potential market: Stability Control and Rear/Surround View Systems
Page- 12 Copyright Autoliv Inc., All Rights Reserved
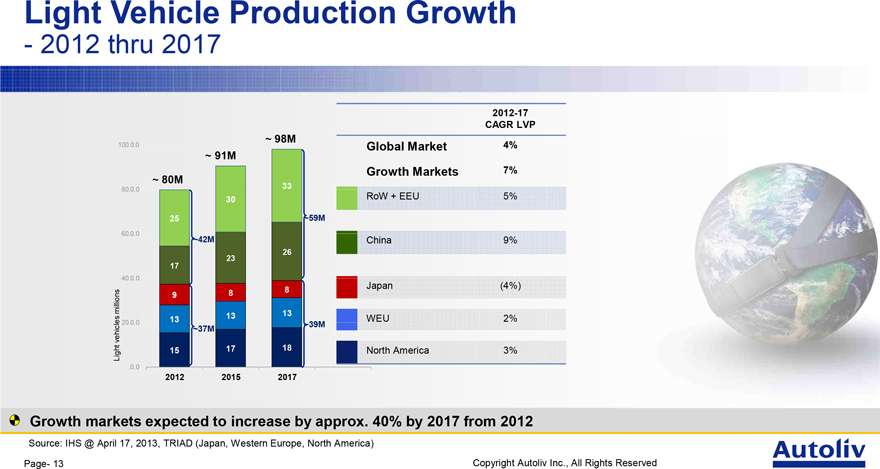
Light Vehicle Production Growth
- 2012 thru 2017
2012-17 CAGR LVP
100.0.0 ~ 98M
Global Market 4%
~ 91M
Growth Markets 7%
~ 80M 33
80.0.0
30 RoW + EEU 5%
25 ~59M
60.0.0 ~42M China 9%
23 26 17
40.0.0
Japan (4%)
8 millions 9 8
13 13
13 WEU 2%
20.0.0 ~39M vehicles ~37M
17 18
Light 15 North America 3%
.0.0
2012 2015 2017
Growth markets expected to increase by approx. 40% by 2017 from 2012
Source: IHS @ April 17, 2013, TRIAD (Japan, Western Europe, North America)
Page- 13 Copyright Autoliv Inc., All Rights Reserved
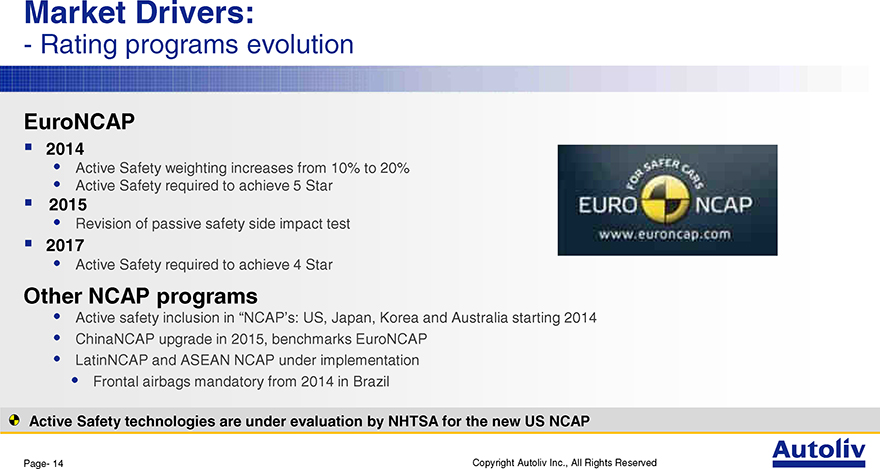
Market Drivers:
- Rating programs evolution
EuroNCAP
2014
Active Safety weighting increases from 10% to 20%
Active Safety required to achieve 5 Star
2015
Revision of passive safety side impact test
2017
Active Safety required to achieve 4 Star
Other NCAP programs
Active safety inclusion in “NCAP’s: US, Japan, Korea and Australia starting 2014
ChinaNCAP upgrade in 2015, benchmarks EuroNCAP
LatinNCAP and ASEAN NCAP under implementation
Frontal airbags mandatory from 2014 in Brazil
Active Safety technologies are under evaluation by NHTSA for the new US NCAP
Page- 14 Copyright Autoliv Inc., All Rights Reserved
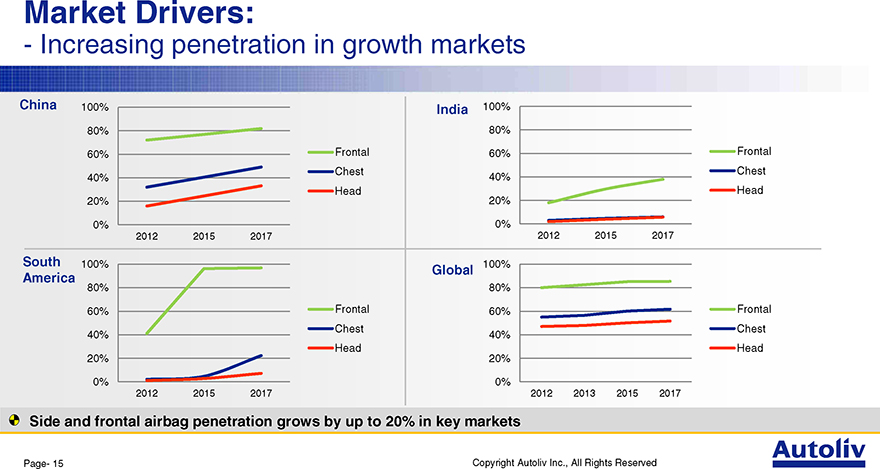
Market Drivers:
- Increasing penetration in growth markets
China 100% India 100%
80% 80%
60% Frontal 60% Frontal
Chest Chest
40% 40%
Head Head
20% 20%
0% 0%
2012 2015 2017 2012 2015 2017
South 100% 100%
Global
America
80% 80%
60% Frontal 60% Frontal
Chest Chest
40% 40%
Head Head
20% 20%
0% 0%
2012 2015 2017 2012 2013 2015 2017
Side and frontal airbag penetration grows by up to 20% in key markets
Page- 15 Copyright Autoliv Inc., All Rights Reserved
Market Drivers
- Innovation in Passive Safety
Strengthening market leadership through innovation
Pedestrian Protection Airbag Pre pretentioner Knee Airbag Rear seat safety
Page- 16 Copyright Autoliv Inc., All Rights Reserved

Sales Drivers:
- Strong presence in Growth Markets
30
25
Growth Markets excl.
20 China CAGR 11%
(Billions) China GAGR 14%
15
$ Japan CAGR (4%)
US
10
W.Europe CAGR 2%
5 |
|
North America CAGR
4%
0
2012 2015
2012 ALV Market Share Growth Markets
34%
Page- 17 Copyright Autoliv Inc., All Rights Reserved
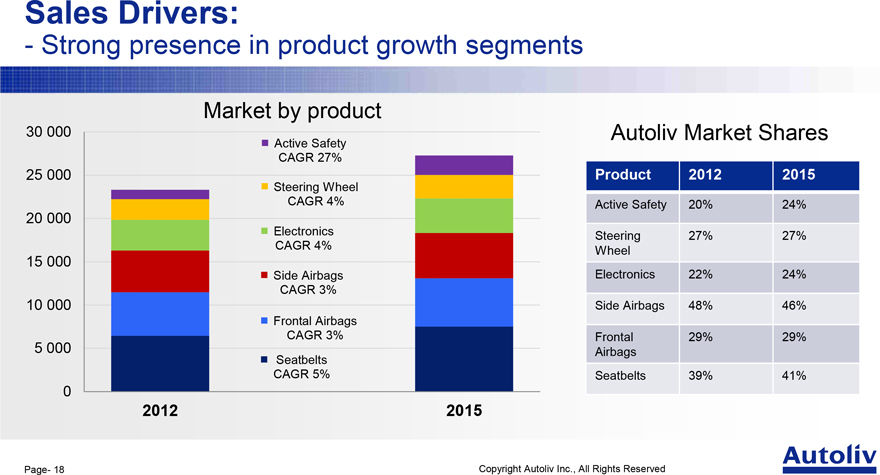
Sales Drivers:
- Strong presence in product growth segments
Market by product
30 000 Autoliv Market Shares
Active Safety CAGR 27%
25 000 Product 2012 2015
Steering Wheel
CAGR 4% Active Safety 20% 24%
20 000
Electronics Steering 27% 27% CAGR 4% Wheel
15 000
Side Airbags Electronics 22% 24% CAGR 3%
10 000 Side Airbags 48% 46% Frontal Airbags CAGR 3% Frontal 29% 29%
5 000 Airbags Seatbelts
CAGR 5% Seatbelts 39% 41%
0
2012 2015
Page- 18 Copyright Autoliv Inc., All Rights Reserved
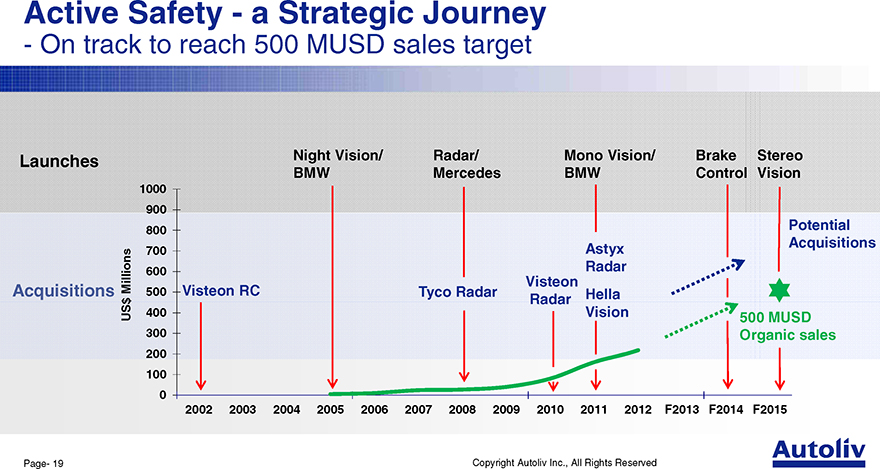
Active Safety—a Strategic Journey
- On track to reach 500 MUSD sales target
Launches Night Vision/ Radar/ Mono Vision/ Brake Stereo
BMW Mercedes BMW Control Vision
1000
900
800 Potential
700 Astyx Acquisitions
600 Radar
Millions Visteon
Acquisitions 500 Visteon RC Tyco Radar Radar Hella
$
US 400 Vision 500 MUSD
300 Organic sales
200
100
0
2002 2003 2004 2005 2006 2007 2008 2009 2010 2011 2012 F2013 F2014 F2015
Page- 19 Copyright Autoliv Inc., All Rights Reserved
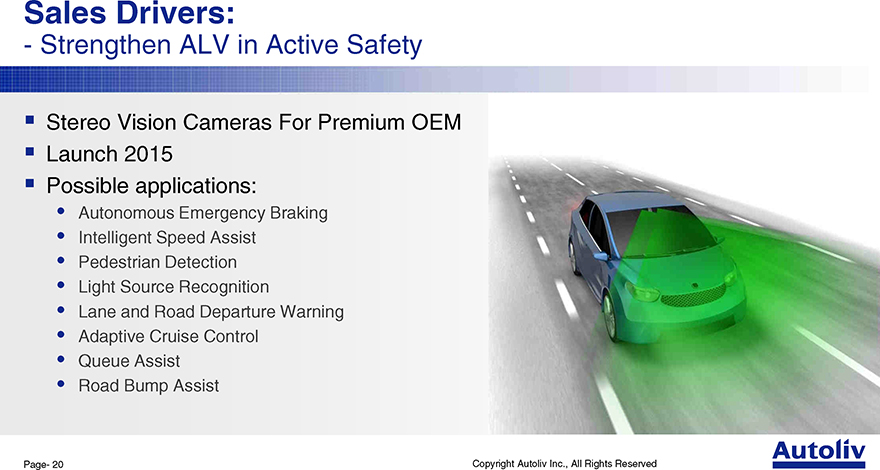
Sales Drivers:
- Strengthen ALV in Active Safety
Stereo Vision Cameras For Premium OEM Launch 2015 Possible applications:
Autonomous Emergency Braking Intelligent Speed Assist Pedestrian Detection Light Source Recognition Lane and Road Departure Warning Adaptive Cruise Control Queue Assist Road Bump Assist
Page- 20 Copyright Autoliv Inc., All Rights Reserved
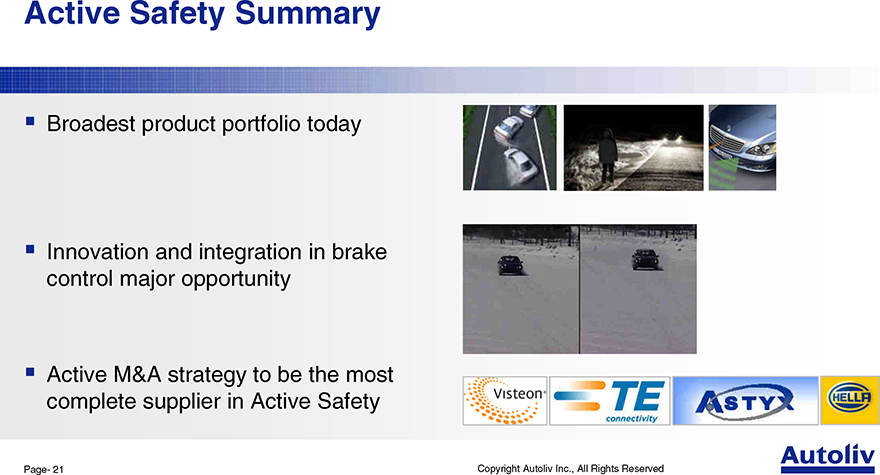
Active Safety Summary
Broadest product portfolio today
Innovation and integration in brake control major opportunity
Active M&A strategy to be the most complete supplier in Active Safety
Page- 21 Copyright Autoliv Inc., All Rights Reserved
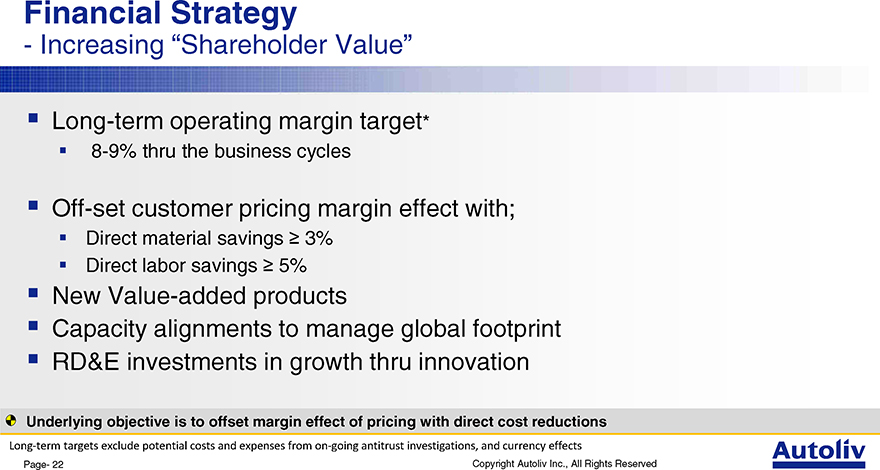
Financial Strategy
Increasing “Shareholder Value”
Long-term operating margin target*
?8-9% thru the business cycles
Off-set customer pricing margin effect with;
?Direct material savings ? 3%
Direct labor savings ? 5%
New Value-added products
Capacity alignments to manage global footprint RD&E investments in growth thru innovation
Underlying objective is to offset margin effect of pricing with direct cost reductions
Long-term targets exclude potential costs and expenses from on-going antitrust investigations, and currency effects
Page- 22 Copyright Autoliv Inc., All Rights Reserved
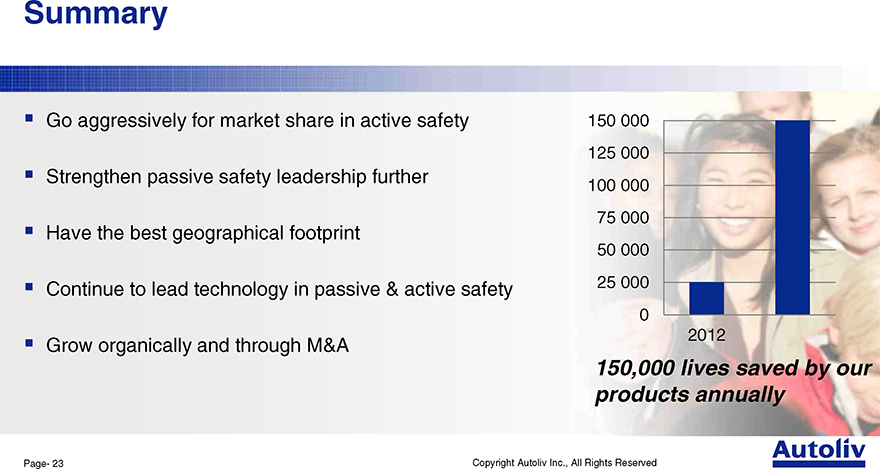
Summary
Go aggressively for market share in active safety Strengthen passive safety leadership further Have the best geographical footprint Continue to lead technology in passive & active safety Grow organically and through M&A
150,000 lives saved by our products annually
Page- 23 Copyright Autoliv Inc., All Rights Reserved
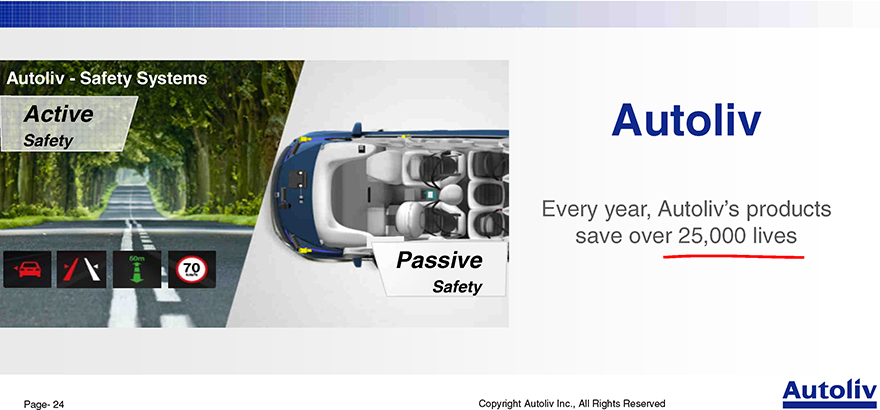
Autoliv—Safety Systems
Active Autoliv
Safety
Every year, Autoliv’s products
save over 25,000 lives
Passive
Safety
Page- 24 Copyright Autoliv Inc., All Rights Reserved
Financial Strategy
for Increasing
Shareholder Value
Capital Market Day
Vårgårda, May 14, 2013
Driven for Life. Mats Wallin
Vice President & CFO
Copyright Autoliv Inc., All Rights Reserved
Safe Harbor Statement *
This presentation contains statements that are not historical facts but rather forward-looking statements within the meaning of the Private Securities Litigation Reform Act of 1995. Such forward-looking statements include those that address activities, events or developments that Autoliv, Inc. or its management believes or anticipates may occur in the future. All forward-looking statements, including without limitation, management’s examination of historical operating trends and data, are based upon our current expectations, various assumptions and data available from third parties. Our expectations and assumptions are expressed in good faith and we believe there is a reasonable basis for them. However, there can be no assurance that such forward-looking statements will materialize or prove to be correct as forward-looking statements are inherently subject to known and unknown risks, uncertainties and other factors which may cause actual future results, performance or achievements to differ materially from the future results, performance or achievements expressed in or implied by such forward-looking statements. The outcome of these forward-looking statements could differ materially from those stated for a variety of reasons, including without limitation, changes in and the successful execution of our capacity alignment, restructuring and cost reduction initiatives; changes in general industry or regional market conditions; loss of business from increased competition; higher raw material, fuel and energy costs; changes in consumer and customer preferences for end products; customer losses; changes in regulatory conditions; customer bankruptcies or divestiture of customer brands; unfavorable fluctuations in currencies or interest rates among the various jurisdictions in which we operate; fluctuation in vehicle production schedules; component shortages; market acceptance of our new products; continued uncertainty in pricing negotiations with customers, our ability to be awarded new business; product liability, warranty and recall claims and other litigation and customer reactions thereto; higher expenses for our pension and other postretirement benefits; work stoppages or other labor issues; possible adverse results of pending or future litigation or infringement claims; negative impacts of antitrust investigations or other governmental investigations and associated litigation (including securities litigation) relating to the conduct of our business; tax assessments by governmental authorities; dependence on key personnel; legislative or regulatory changes limiting our business; political conditions; dependence on customers and suppliers; and other risks and uncertainties identified under the headings “Risk Factors” and “Management’s Discussion and Analysis of Financial Condition and Results of Operations” in our Annual Reports and Quarterly Reports on Forms 10-K and 10-Q and any amendments thereto. The Company undertakes no obligation to update publicly or revise any forward-looking statements in light of new information or future events. For any forward-looking statements contained in this or any other document, we claim the protection of the safe harbor for forward-looking statements contained in the Private Securities Litigation Reform Act of 1995, and we assume no obligation to update any such statement.
(*) Non-US GAAP reconciliations are disclosed in our 8-K/10-K/10-Q filings available at www.sec.gov or www.autoliv.com
Page—2 Copyright Autoliv Inc., All Rights Reserved

Financial Strategy
for Increasing Shareholder Value
Financial Guiding Principles Cash flow Generation
Margins
EPS
Free Cash Flow & RoCE
Capital Structure
Debt Policy & RoE
Page—3 Copyright Autoliv Inc., All Rights Reserved
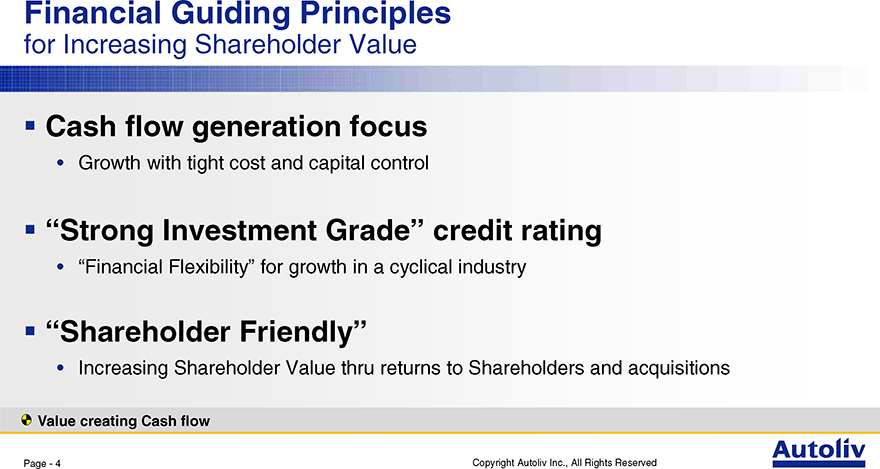
Financial Guiding Principles
for Increasing Shareholder Value
Cash flow generation focus
Growth with tight cost and capital control
“Strong Investment Grade” credit rating
“Financial Flexibility” for growth in a cyclical industry
“Shareholder Friendly”
Increasing Shareholder Value thru returns to Shareholders and acquisitions
Value creating Cash flow
Page—4 Copyright Autoliv Inc., All Rights Reserved
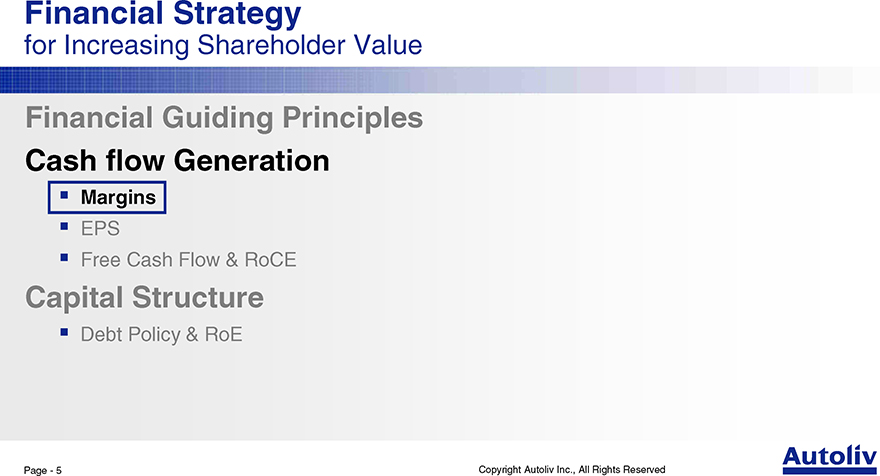
Financial Strategy
for Increasing Shareholder Value
Financial Guiding Principles Cash flow Generation
Margins
EPS
Free Cash Flow & RoCE
Capital Structure
Debt Policy & RoE
Page—5 Copyright Autoliv Inc., All Rights Reserved
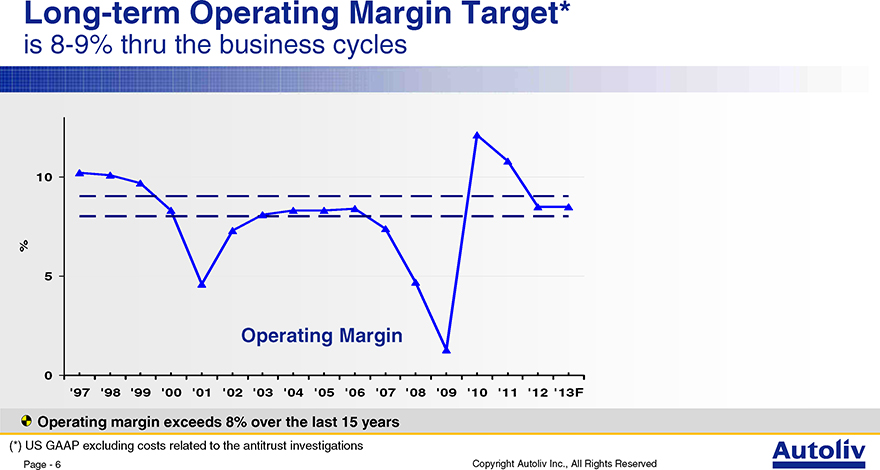
Long-term Operating Margin Target*
is 8-9% thru the business cycles
10
%
5 |
|
Operating Margin
0
‘97 ‘98 ‘99 ‘00 ‘01 ‘02 ‘03 ‘04 ‘05 ‘06 ‘07 ‘08 ‘09 ‘10 ‘11 ‘12 ‘13F
Operating margin exceeds 8% over the last 15 years
(*) US GAAP excluding costs related to the antitrust investigations
Page—6 Copyright Autoliv Inc., All Rights Reserved
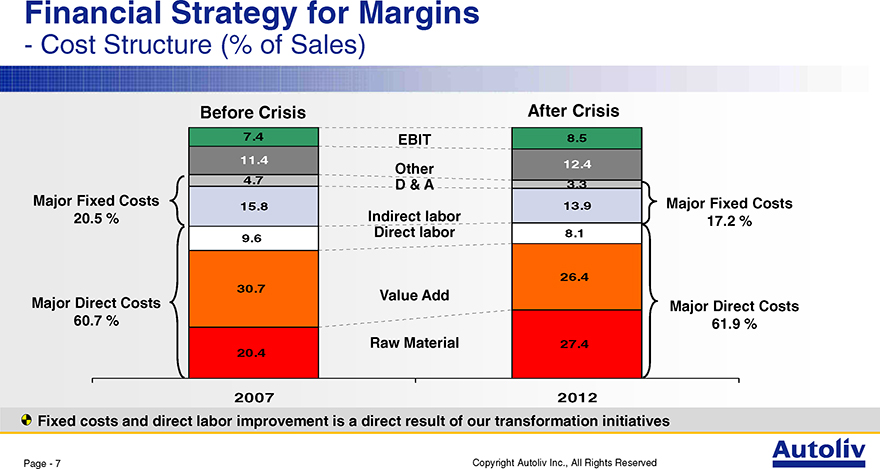
Financial Strategy for Margins
- Cost Structure (% of Sales)
Before Crisis After Crisis
7.4 EBIT 8.5
11.4
Other 12.4
4.7 D & A 3.3
Major Fixed Costs 15.8 13.9 Major Fixed Costs
20.5 % Indirect labor 17.2 %
9.6 Direct labor 8.1
26.4
30.7 Value Add
Major Direct Costs Major Direct Costs
60.7 % 61.9 %
Raw Material 27.4
20.4
2007 2012
Fixed costs and direct labor improvement is a direct result of our transformation initiatives
Page—7 Copyright Autoliv Inc., All Rights Reserved
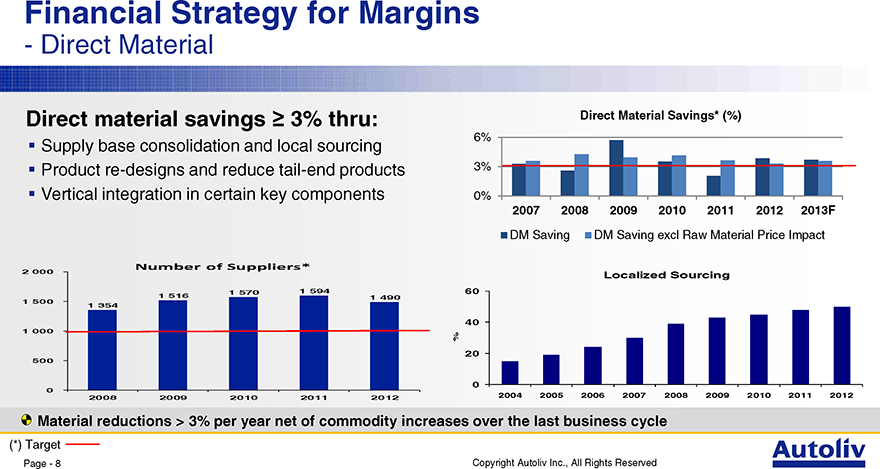
Financial Strategy for Margins
- Direct Material
Direct material savings ? 3% thru:
Supply base consolidation and local sourcing
Product re-designs and reduce tail-end products
Vertical integration in certain key components
Number of Suppliers*
2 |
| 000 |
1 |
| 570 1 594 |
1 |
| 516 1 490 |
1 |
| 500 |
1 |
| 354 |
1 |
| 000 |
500
0
2008 2009 2010 2011 2012
Direct Material Savings* (%)
6%
3%
0%
2007 2008 2009 2010 2011 2012 2013F
DM Saving DM Saving excl Raw Material Price Impact
Localized Sourcing
60
40
%
20
0
2004 2005 2006 2007 2008 2009 2010 2011 2012
Material reductions > 3% per year net of commodity increases over the last business cycle
(*) Target
Page—8 Copyright Autoliv Inc., All Rights Reserved
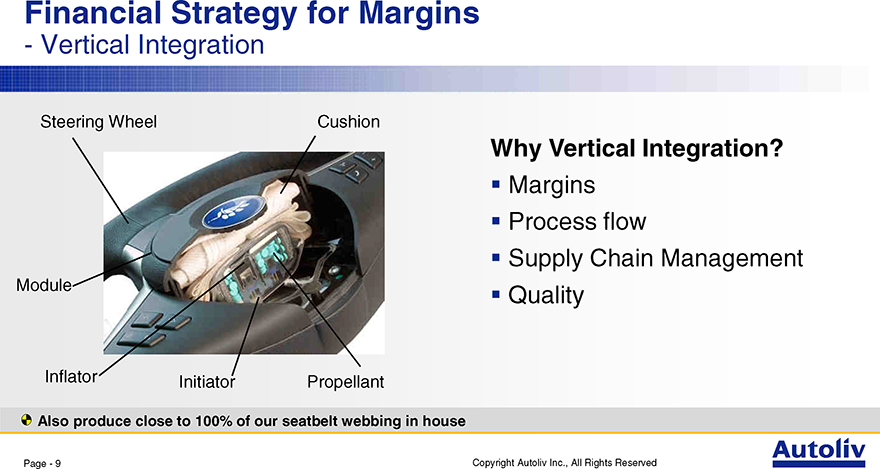
Financial Strategy for Margins
- Vertical Integration
Steering Wheel Cushion
Why Vertical Integration?
Margins
Process flow
Supply Chain Management
Module Quality
Inflator Initiator Propellant
Also produce close to 100% of our seatbelt webbing in house
Page—9 Copyright Autoliv Inc., All Rights Reserved
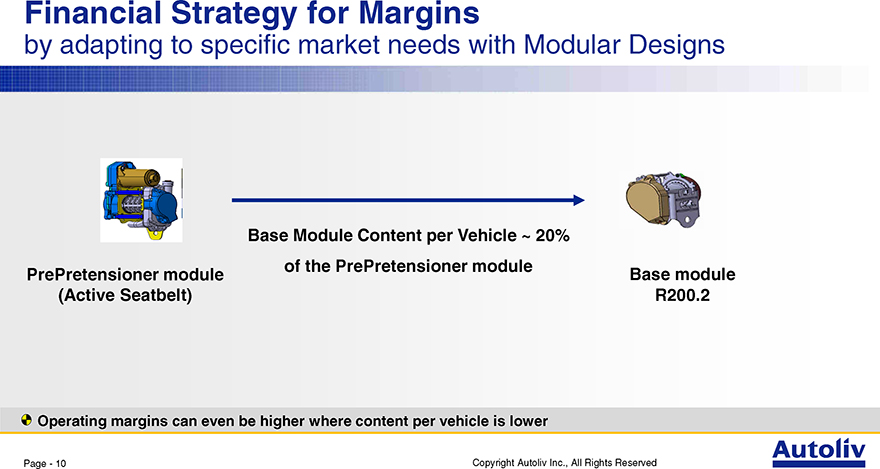
Financial Strategy for Margins
by adapting to specific market needs with Modular Designs
Base Module Content per Vehicle ~ 20%
of the PrePretensioner module
PrePretensioner module Base module (Active Seatbelt) R200.2
Operating margins can even be higher where content per vehicle is lower
Page—10 Copyright Autoliv Inc., All Rights Reserved
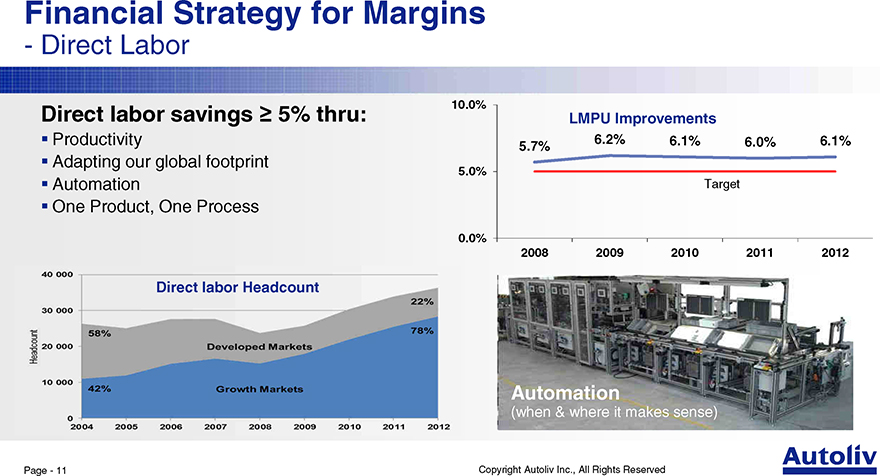
Financial Strategy for Margins
- Direct Labor
10.0%
Direct labor savings ? 5% thru: LMPU Improvements
Productivity 5.7% 6.2% 6.1% 6.0% 6.1%
Adapting our global footprint
5.0%
Automation Target
One Product, One Process
0.0%
2008 2009 2010 2011 2012
Direct labor Headcount
Automation
(when & where it makes sense)
Page—11 Copyright Autoliv Inc., All Rights Reserved
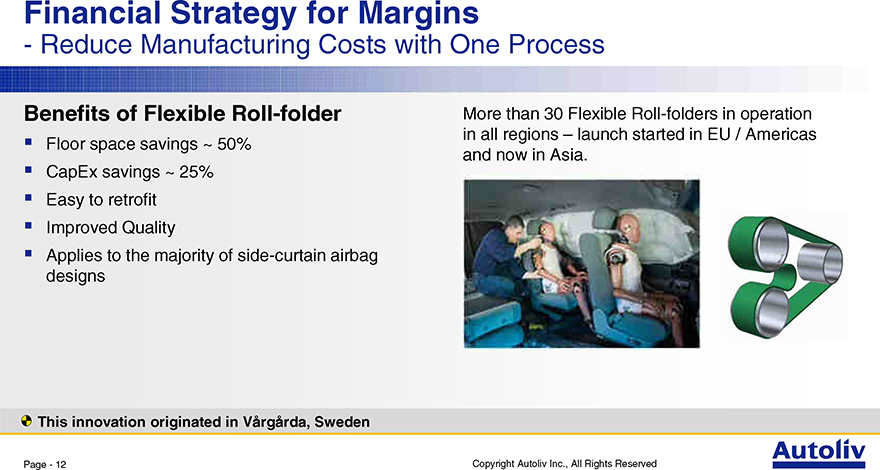
Financial Strategy for Margins
- Reduce Manufacturing Costs with One Process
Benefits of Flexible Roll-folder
Floor space savings ~ 50%
CapEx savings ~ 25%
Easy to retrofit
Improved Quality
Applies to the majority of side-curtain airbag designs
More than 30 Flexible Roll-folders in operation in all regions – launch started in EU / Americas and now in Asia.
This innovation originated in Vårgårda, Sweden
Page—12 Copyright Autoliv Inc., All Rights Reserved
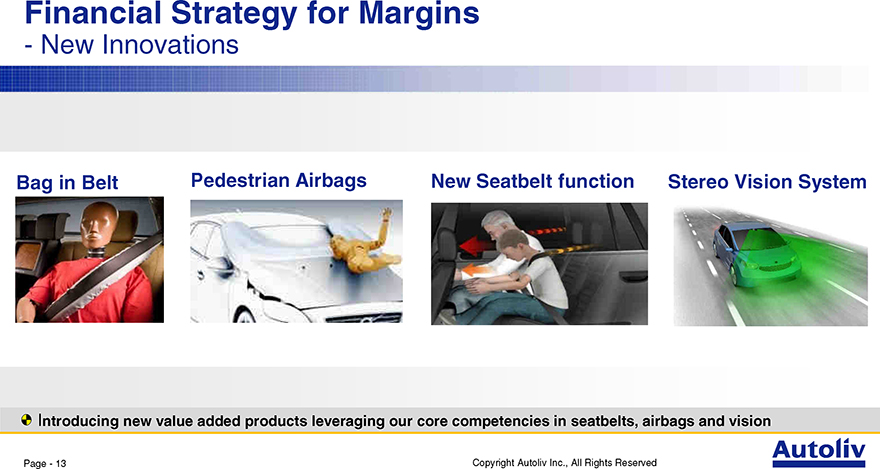
Financial Strategy for Margins
- New Innovations
Bag in Belt Pedestrian Airbags New Seatbelt function Stereo Vision System
Introducing new value added products leveraging our core competencies in seatbelts, airbags and vision
Page—13 Copyright Autoliv Inc., All Rights Reserved
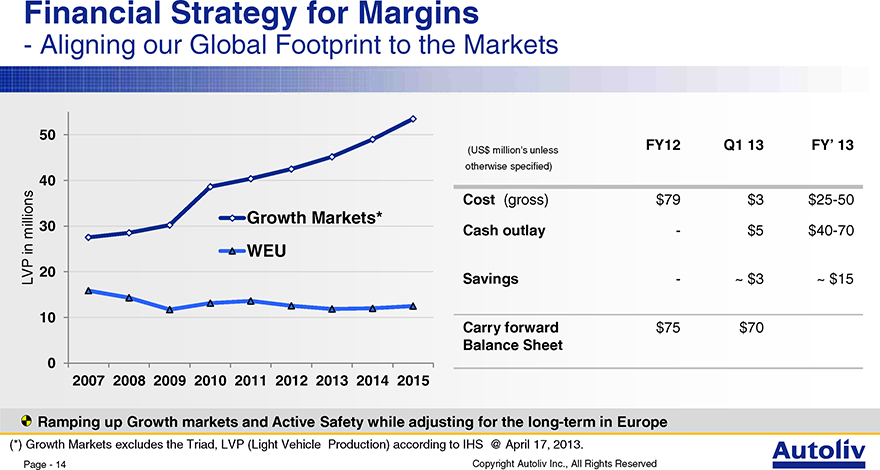
Financial Strategy for Margins
- Aligning our Global Footprint to the Markets
50
40
millions 30 Growth Markets*
in WEU
LVP 20
10
0
2007 2008 2009 2010 2011 2012 2013 2014 2015
FY12 Q1 13 FY’ 13
(US$ million’s unless
otherwise specified)
Cost (gross) $79 $3 $25-50
Cash outlay—$5 $40-70
Savings—~ $3 ~ $15
Carry forward $75 $70 Balance Sheet
Ramping up Growth markets and Active Safety while adjusting for the long-term in Europe
(*) Growth Markets excludes the Triad, LVP (Light Vehicle Production) according to IHS @ April 17, 2013.
Page—14 Copyright Autoliv Inc., All Rights Reserved
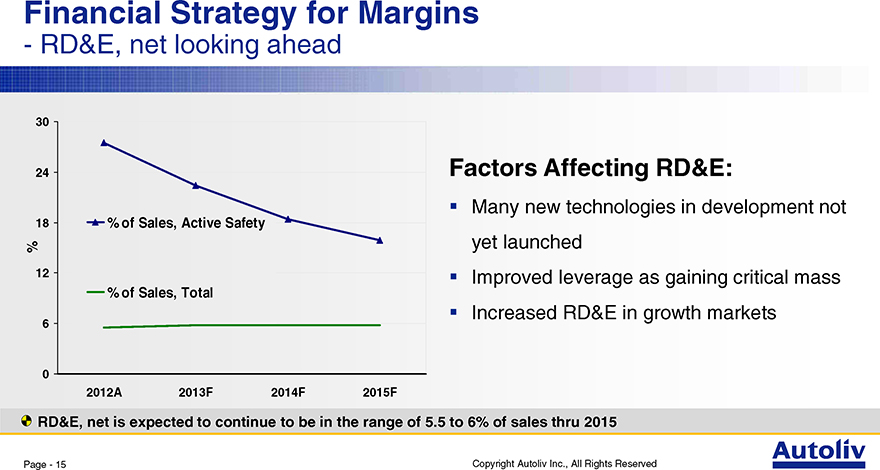
Financial Strategy for Margins
- RD&E, net looking ahead
30
24
18 % of Sales, Active Safety %
12
% of Sales, Total
6 |
|
0
2012A 2013F 2014F 2015F
Factors Affecting RD&E:
Many new technologies in development not yet launched
Improved leverage as gaining critical mass
Increased RD&E in growth markets
RD&E, net is expected to continue to be in the range of 5.5 to 6% of sales thru 2015
Page—15 Copyright Autoliv Inc., All Rights Reserved
Financial Strategy
for Increasing Shareholder Value
Financial Guiding Principles Cash flow Generation
Margins
EPS
Free Cash Flow & RoCE
Capital Structure
Debt Policy & RoE
Page—16 Copyright Autoliv Inc., All Rights Reserved
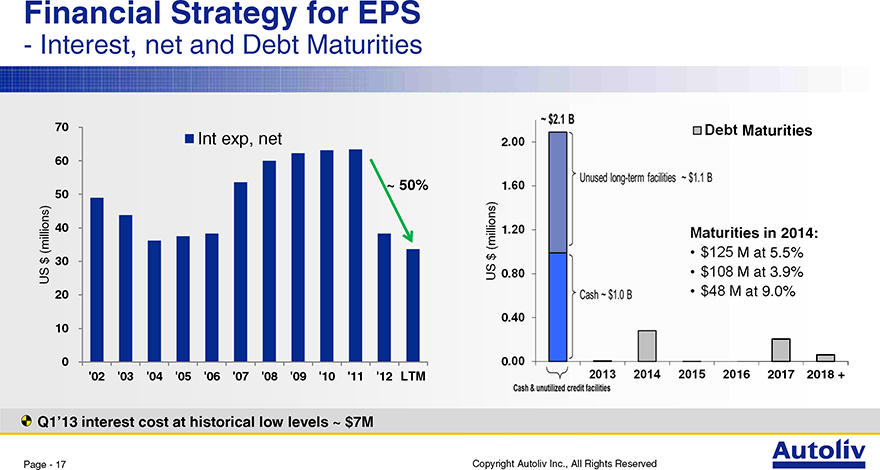
Financial Strategy for EPS
- Interest, net and Debt Maturities
70
Int exp, net
60
50 ~ 50%
(millions) 40 $
30
US
20
10
0
‘02 ‘03 ‘04 ‘05 ‘06 ‘07 ‘08 ‘09 ‘10 ‘11 ‘12 LTM
Maturities
2 |
|
1 |
|
(millions) 1 ies in 2014:
$ M at 5.5% US 0 M at 3.9% at 9.0%
0
0
16 2017 2018 +
Q1’13 interest cost at historical low levels ~ $7M
Page—17 Copyright Autoliv Inc., All Rights Reserved
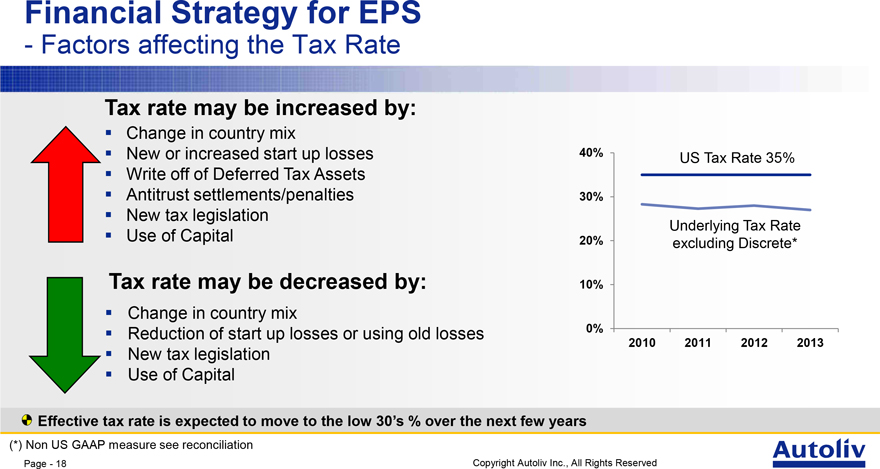
Financial Strategy for EPS
- Factors affecting the Tax Rate
Tax rate may be increased by:
Change in country mix
New or increased start up losses 40% US Tax Rate 35%
Write off of Deferred Tax Assets
Antitrust settlements/penalties 30%
New tax legislation
Underlying Tax Rate
Use of Capital 20%
excluding Discrete*
Tax rate may be decreased by: 10%
Change in country mix
Reduction of start up losses or using old losses 0%
New tax legislation 2010 2011 2012 2013
Use of Capital
Effective tax rate is expected to move to the low 30’s % over the next few years
(*) Non US GAAP measure see reconciliation
Page - 18 Copyright Autoliv Inc., All Rights Reserved
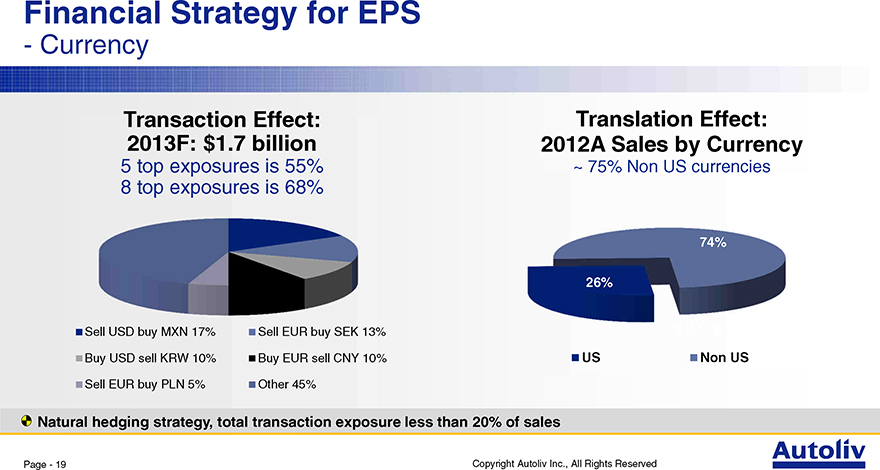
Financial Strategy for EPS
- Currency
Transaction Effect: Translation Effect: 2013F: $1.7 billion 2012A Sales by Currency
5 |
| top exposures is 55% ~ 75% Non US currencies |
8 |
| top exposures is 68% |
74%
26%
0 0
Sell USD buy MXN 17% Sell EUR buy SEK 13% 0 0 0 Buy USD sell KRW 10% Buy EUR sell CNY 10% US Non US Sell EUR buy PLN 5% Other 45%
Natural hedging strategy, total transaction exposure less than 20% of sales
Page—19 Copyright Autoliv Inc., All Rights Reserved
Financial Strategy
for Increasing Shareholder Value
Financial Guiding Principles Cash flow Generation
Margins
EPS
Free Cash Flow & RoCE
Capital Structure
Debt Policy & RoE
Page—20 Copyright Autoliv Inc., All Rights Reserved
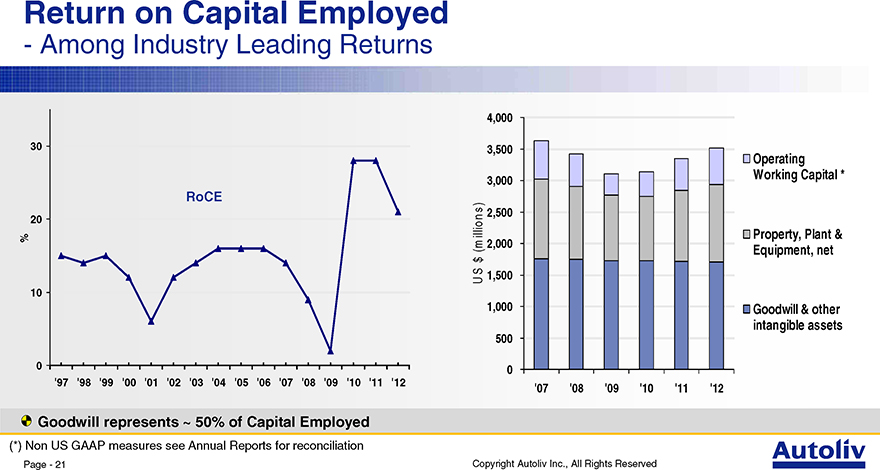
Return on Capital Employed
- Among Industry Leading Returns
30
RoCE
20
%
10
0
‘97 ‘98 ‘99 ‘00 ‘01 ‘02 ‘03 ‘04 ‘05 ‘06 ‘07 ‘08 ‘09 ‘10 ‘11 ‘12
4,000
3,500 Operating
Working Capital *
3,000
)
s 2,500
n illio Property, Plant &
(m 2,000
Equipment, net $
S 1,500
U
1,000 Goodwill & other intangible assets
500
0
‘07 ‘08 ‘09 ‘10 ‘11 ‘12
Goodwill represents ~ 50% of Capital Employed
(*) Non US GAAP measures see Annual Reports for reconciliation
Page—21 Copyright Autoliv Inc., All Rights Reserved
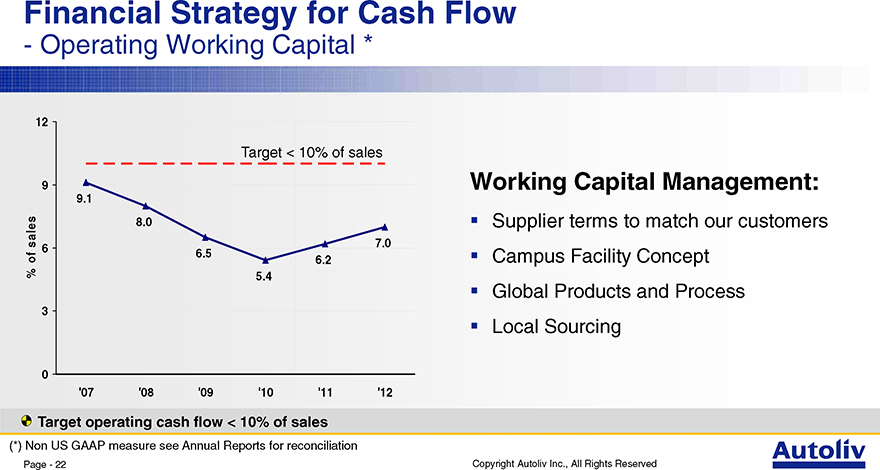
Financial Strategy for Cash Flow
- Operating Working Capital *
12
Target < 10% of sales
9
9.1
8.0 sales 7.0 of 6 6.5
6.2
% 5.4 3
0
‘07 ‘08 ‘09 ‘10 ‘11 ‘12
Working Capital Management:
Supplier terms to match our customers
Campus Facility Concept
Global Products and Process
Local Sourcing
Target operating cash flow < 10% of sales
(*) Non US GAAP measure see Annual Reports for reconciliation
Page—22 Copyright Autoliv Inc., All Rights Reserved
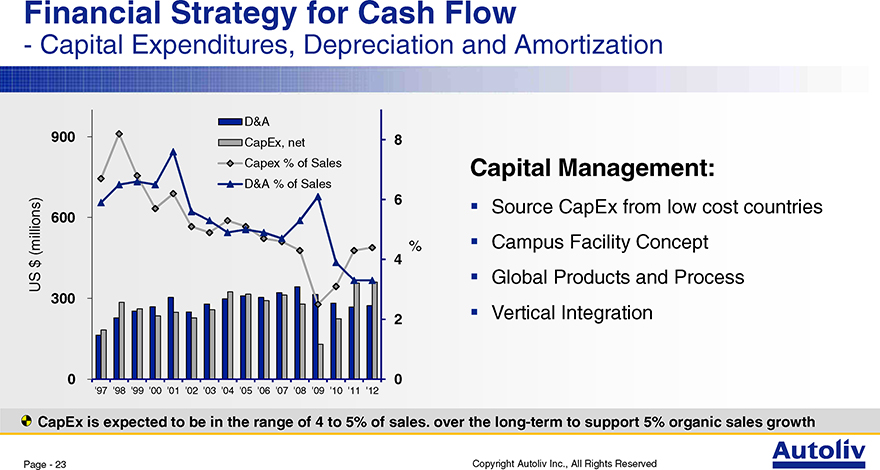
Financial Strategy for Cash Flow
- Capital Expenditures, Depreciation and Amortization
D&A
900 8
CapEx, net
Capex % of Sales Capital Management:
D&A % of Sales
6 |
|
Source CapEx from low cost countries
600
(millions) % Campus Facility Concept
$ 4
US Global Products and Process
300
2 |
| Vertical Integration |
0 0
‘97 ‘98 ‘99 ‘00 ‘01 ‘02 ‘03 ‘04 ‘05 ‘06 ‘07 ‘08 ‘09 ‘10 ‘11 ‘12
CapEx is expected to be in the range of 4 to 5% of sales. over the long-term to support 5% organic sales growth
Page—23 Copyright Autoliv Inc., All Rights Reserved
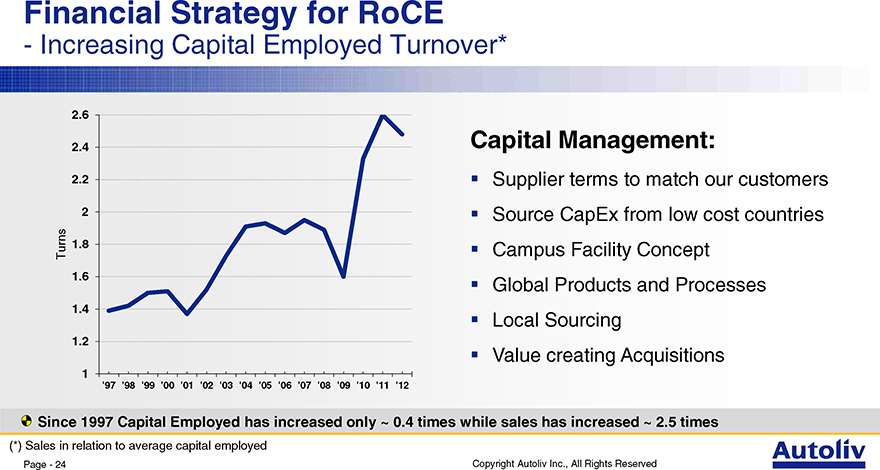
Financial Strategy for RoCE
- Increasing Capital Employed Turnover*
2.6
2.4 Capital Management:
2.2 Supplier terms to match our customers
2 |
| Source CapEx from low cost countries Turns 1.8 Campus Facility Concept |
1.6
Global Products and Processes 1.4 Local Sourcing
1.2
Value creating Acquisitions
1 |
|
‘97 ‘98 ‘99 ‘00 ‘01 ‘02 ‘03 ‘04 ‘05 ‘06 ‘07 ‘08 ‘09 ‘10 ‘11 ‘12
Since 1997 Capital Employed has increased only ~ 0.4 times while sales has increased ~ 2.5 times
(*) Sales in relation to average capital employed
Page—24 Copyright Autoliv Inc., All Rights Reserved
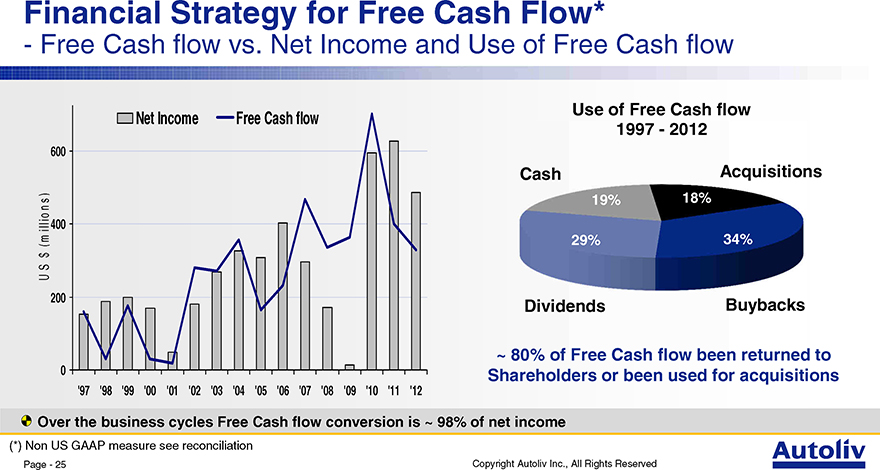
Financial Strategy for Free Cash Flow*
- Free Cash flow vs. Net Income and Use of Free Cash flow
Net Income Free Cash flow
600
)
s
n
illio 400
(m
$
S
U
200
0
‘97 ‘98 ‘99 ‘00 ‘01 ‘02 ‘03 ‘04 ‘05 ‘06 ‘07 ‘08 ‘09 ‘10 ‘11 ‘12
Use of Free Cash flow
1997—2012
Cash Acquisitions
19% 18%
29% 34%
Dividends Buybacks
~ 80% of Free Cash flow been returned to
Shareholders or been used for acquisitions
Over the business cycles Free Cash flow conversion is ~ 98% of net income
(*) Non US GAAP measure see reconciliation
Page—25 Copyright Autoliv Inc., All Rights Reserved
Financial Strategy
for Increasing Shareholder Value
Financial Guiding Principles Cash flow Generation
Margins
EPS
Free Cash Flow & RoCE
Capital Structure
Debt Policy & RoE
Page—26 Copyright Autoliv Inc., All Rights Reserved
Capital Structure
- Debt Limitation Policy
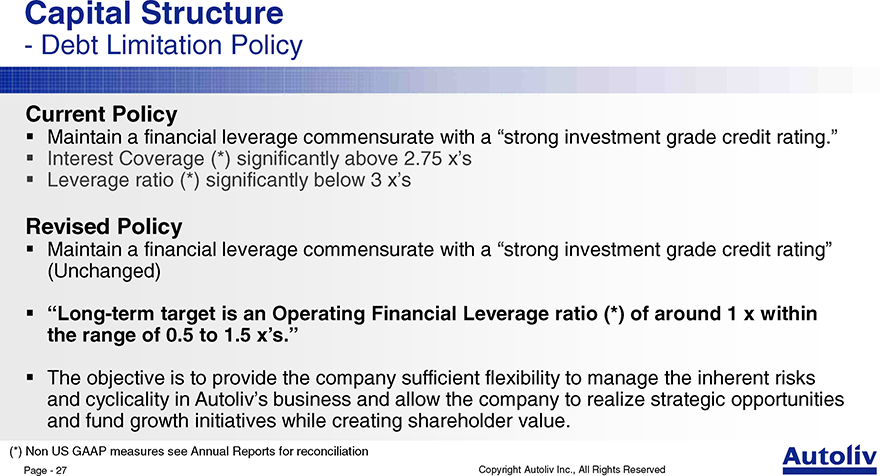
Current Policy
Maintain a financial leverage commensurate with a “strong investment grade credit rating.”
Interest Coverage (*) significantly above 2.75 x’s
Leverage ratio (*) significantly below 3 x’s
Revised Policy
Maintain a financial leverage commensurate with a “strong investment grade credit rating” (Unchanged)
“Long-term target is an Operating Financial Leverage ratio (*) of around 1 x within the range of 0.5 to 1.5 x’s.”
The objective is to provide the company sufficient flexibility to manage the inherent risks and cyclicality in Autoliv’s business and allow the company to realize strategic opportunities and fund growth initiatives while creating shareholder value.
(*) Non US GAAP measures see Annual Reports for reconciliation
Page—27 Copyright Autoliv Inc., All Rights Reserved
Capital Structure
- Debt Limitation Policy
4 |
| Old Policy < 3 times Leverage Ratio * |
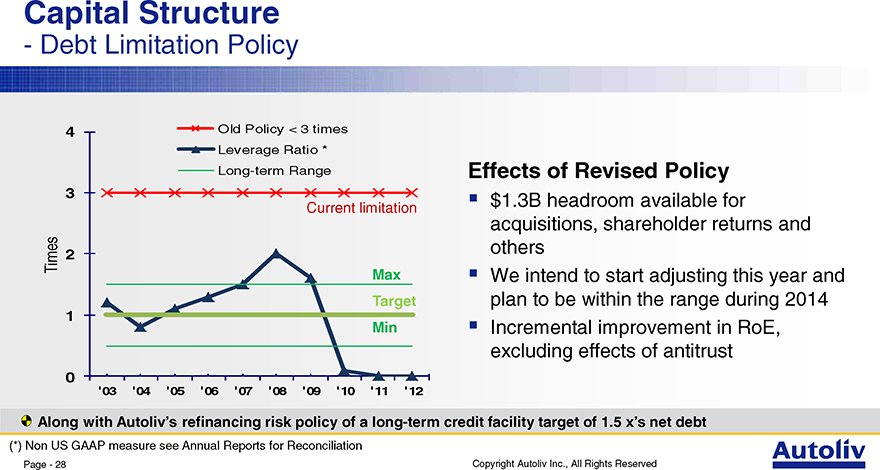
Long-term Range Effects of Revised Policy
3 |
| $1.3B headroom available for |
Current limitation
acquisitions, shareholder returns and others
Times 2
Max We intend to start adjusting this year and Target plan to be within the range during 2014
1 |
|
Min ?Incremental improvement in RoE, excluding effects of antitrust
0
‘03 ‘04 ‘05 ‘06 ‘07 ‘08 ‘09 ‘10 ‘11 ‘12
Along with Autoliv’s refinancing risk policy of a long-term credit facility target of 1.5 x’s net debt
(*) Non US GAAP measure see Annual Reports for Reconciliation
Page—28 Copyright Autoliv Inc., All Rights Reserved
Capital Structure
- Share Count vs. Earnings per Share and RoE
8 |
|
100
6 |
|
75
Shares
(millions) $
EPS US
Count 50 4 EPS
Share 25 2
0 0
‘97 ‘98 ‘99 ‘00 ‘01 ‘02 ‘03 ‘04 ‘05 ‘06 ‘07 ‘08 ‘09 ‘10 ‘11 ‘12
25
Return on Equity
20
15
%
10
5 |
|
0
‘97 ‘98 ‘99 ‘00 ‘01 ‘02 ‘03 ‘04 ‘05 ‘06 ‘07 ‘08 ‘09 ‘10 ‘11 ‘12
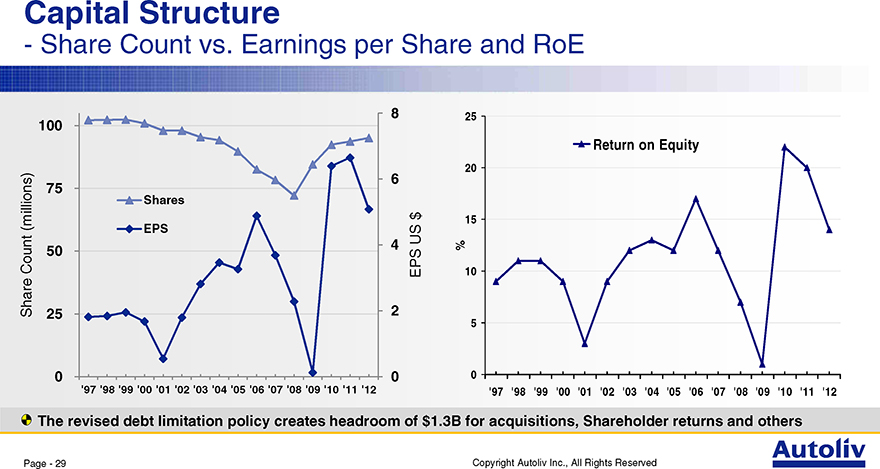
The revised debt limitation policy creates headroom of $1.3B for acquisitions, Shareholder returns and others
Page—29 Copyright Autoliv Inc., All Rights Reserved
Financial Strategy
- Continued focus on value creation
Solid growth with industry leading margins
Continued focus on cash flow and returns on capital
Increase Shareholder Value thru
acquisitions or returns in line with the revised debt limitation policy
Long-term EPS growth rate faster than organic sales* growth
EPS growth rate excludes effects of currency and antitrust investigations
Increasing Shareholder Value thru Value creating Cash flow and returns
(*) Non US GAAP measure
Page—30 Copyright Autoliv Inc., All Rights Reserved

Reconciliations
Page—31 Copyright Autoliv Inc., All Rights Reserved
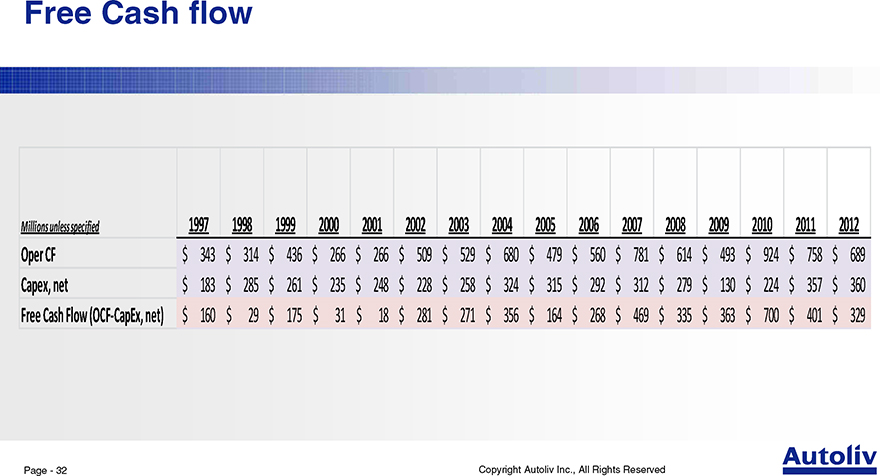
Free Cash flow
Millions unless specified 1997 1998 1999 2000 2001 2002 2003 2004 2005 2006 2007 2008 2009 2010 2011 2012
Oper CF $ 343 $ 314 $ 436 $ 266 $ 266 $ 509 $ 529 $ 680 $ 479 $ 560 $ 781 $ 614 $ 493 $ 924 $ 758 $ 689
Capex, net $ 183 $ 285 $ 261 $ 235 $ 248 $ 228 $ 258 $ 324 $ 315 $ 292 $ 312 $ 279 $ 130 $ 224 $ 357 $ 360
Free Cash Flow (OCF-CapEx, net) $ 160 $ 29 $ 175 $ 31 $ 18 $ 281 $ 271 $ 356 $ 164 $ 268 $ 469 $ 335 $ 363 $ 700 $ 401 $ 329
Page—32 Copyright Autoliv Inc., All Rights Reserved

Items Affecting the Tax Rate
2010 2011 2012
Reported Pre-Tax Income 805.5 828.3 668.6
U.S. Federal Income Tax Rate 35.0% 35.0% 35.0%
R&D and Other tax credits -3.3% -3.0% -3.2%
Foreign rate variance ex. holidays -6.4% -6.3% -5.5%
Withholding Taxes 2.7% 1.9% 1.3%
Cost of Double Taxation 1.9% 0.7% 0.9%
State taxes and Other-net -0.1% 0.4% -0.9%
Rate excluding holidays and losses* 29.8% 28.7% 27.6%
Tax holidays -2.2% -1.2% -1.8%
Other 0.0% -1.4% -2.3%
Tax losses -0.8% 1.0% 3.0%
Antitrust Settlement 0.0% 0.0% 0.9%
Reclassifications to Discrete 1.5% 0.2% 0.6%
Underlying Tax Rate Trend* 28.3% 27.3% 28.0%
Tax reserves, Other discrete -2.2% -3.0% -0.6%
Reported Effective Income Tax Rate 26.1% 24.3% 27.4%
*Non-US GAAP measures **2013 Current projection
Page—33 Copyright Autoliv Inc., All Rights Reserved

Thank you!
Autoliv—Safety Systems
Active Autoliv
Safety
Every year, Autoliv’s products
save over 25,000 lives
Passive
Safety
Page—34 Copyright Autoliv Inc., All Rights Reserved
Safety in the Growth Markets
Capital Market Day Vårgårda, May 14, 2013
George Chang
President Autoliv Asia
Copyright Autoliv Inc., All Rights Reserved
Driven for Life.

Safe Harbor Statement *
This presentation contains statements that are not historical facts but rather forward-looking statements within the meaning of the Private Securities Litigation Reform Act of 1995. Such forward-looking statements include those that address activities, events or developments that Autoliv, Inc. or its management believes or anticipates may occur in the future. All forward-looking statements, including without limitation, management’s examination of historical operating trends and data, are based upon our current expectations, various assumptions and data available from third parties. Our expectations and assumptions are expressed in good faith and we believe there is a reasonable basis for them. However, there can be no assurance that such forward-looking statements will materialize or prove to be correct as forward-looking statements are inherently subject to known and unknown risks, uncertainties and other factors which may cause actual future results, performance or achievements to differ materially from the future results, performance or achievements expressed in or implied by such forward-looking statements. The outcome of these forward-looking statements could differ materially from those stated for a variety of reasons, including without limitation, changes in and the successful execution of our capacity alignment, restructuring and cost reduction initiatives; changes in general industry or regional market conditions; loss of business from increased competition; higher raw material, fuel and energy costs; changes in consumer and customer preferences for end products; customer losses; changes in regulatory conditions; customer bankruptcies or divestiture of customer brands; unfavorable fluctuations in currencies or interest rates among the various jurisdictions in which we operate; fluctuation in vehicle production schedules; component shortages; market acceptance of our new products; continued uncertainty in pricing negotiations with customers, our ability to be awarded new business; product liability, warranty and recall claims and other litigation and customer reactions thereto; higher expenses for our pension and other postretirement benefits; work stoppages or other labor issues; possible adverse results of pending or future litigation or infringement claims; negative impacts of antitrust investigations or other governmental investigations and associated litigation (including securities litigation) relating to the conduct of our business; tax assessments by governmental authorities; dependence on key personnel; legislative or regulatory changes limiting our business; political conditions; dependence on customers and suppliers; and other risks and uncertainties identified under the headings “Risk Factors” and “Management’s Discussion and Analysis of Financial Condition and Results of Operations” in our Annual Reports and Quarterly Reports on Forms 10-K and 10-Q and any amendments thereto. The Company undertakes no obligation to update publicly or revise any forward-looking statements in light of new information or future events. For any forward-looking statements contained in this or any other document, we claim the protection of the safe harbor for forward-looking statements contained in the Private Securities Litigation Reform Act of 1995, and we assume no obligation to update any such statement.
(*) Non-US GAAP reconciliations are disclosed in our 8-K/10-K/10-Q filings available at www.sec.gov or www.autoliv.com
Page—2 Copyright Autoliv Inc., All Rights Reserved
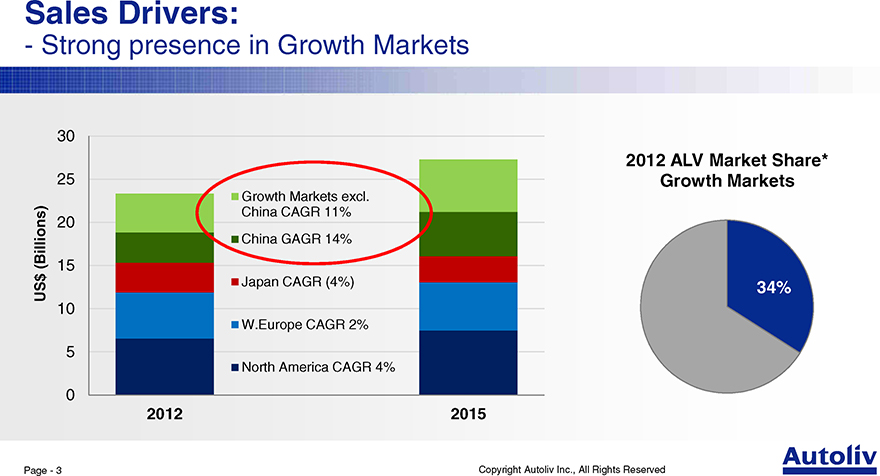
Sales Drivers:
- Strong presence in Growth Markets
30
25
Growth Markets excl.
China CAGR 11%
20
(Billions) China GAGR 14%
15
$ Japan CAGR (4%)
US
10
W.Europe CAGR 2%
5 |
|
North America CAGR 4%
0
2012 2015
2012 ALV Market Share* Growth Markets
34%
Page—3 Copyright Autoliv Inc., All Rights Reserved
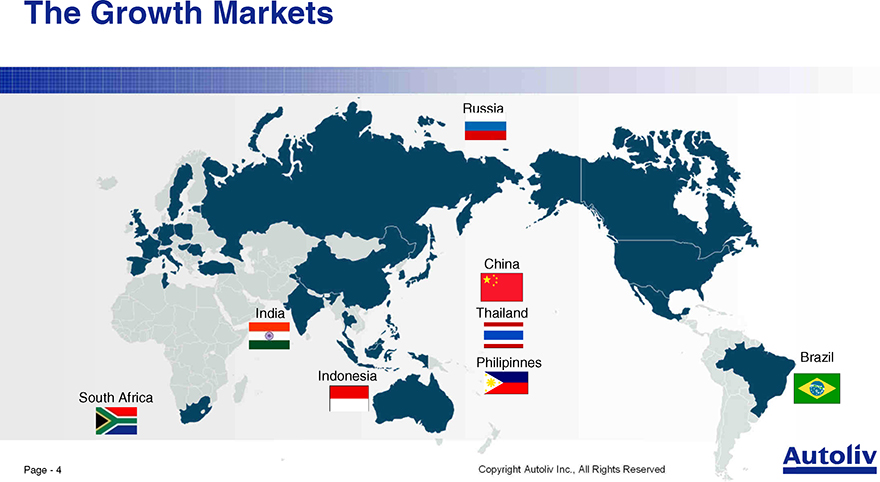
The Growth Markets
Russia
China
India Thailand
Brazil Philipinnes Indonesia South Africa
Page—4
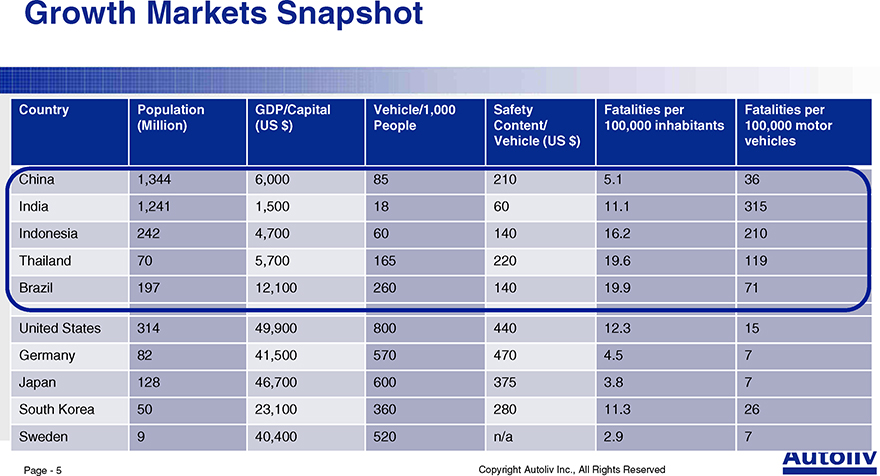
Growth Markets Snapshot
Country Population GDP/Capital Vehicle/1,000 Safety Fatalities per Fatalities per (Million) (US $) People Content/ 100,000 inhabitants 100,000 motor Vehicle (US $) vehicles
China 1,344 6,000 85 210 5.1 36 India 1,241 1,500 18 60 11.1 315 Indonesia 242 4,700 60 140 16.2 210 Thailand 70 5,700 165 220 19.6 119 Brazil 197 12,100 260 140 19.9 71
United States 314 49,900 800 440 12.3 15 Germany 82 41,500 570 470 4.5 7 Japan 128 46,700 600 375 3.8 7 South Korea 50 23,100 360 280 11.3 26 Sweden 9 40,400 520 n/a 2.9 7
Page—5 Copyright Autoliv Inc., All Rights Reserved
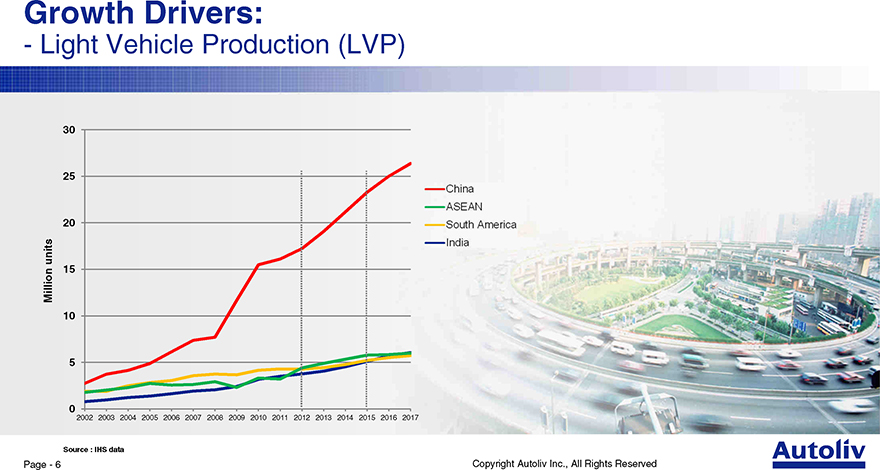
Growth Drivers:
- Light Vehicle Production (LVP)
30
25
20
units 15 Million 10
5 |
|
0
2002 2003 2004 2005 2006 2007 2008 2009 2010 2011 2012 2013 2014 2015 2016 2017
Source : IHS data
Page—6 Copyright Autoliv Inc., All Rights Reserved
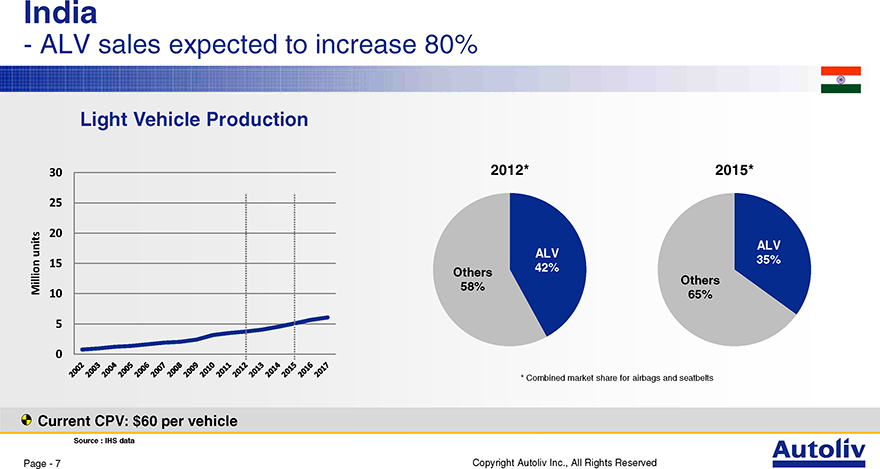
India
- ALV sales expected to increase 80%
Light Vehicle Production
30 2012* 2015*
25
20 units ALV
ALV
15 35% 42% Others Others
Million 58%
10 65%
5 |
|
0
* |
| Combined market share for airbags and seatbelts |
Current CPV: $60 per vehicle
Source : IHS data
Page—7 Copyright Autoliv Inc., All Rights Reserved
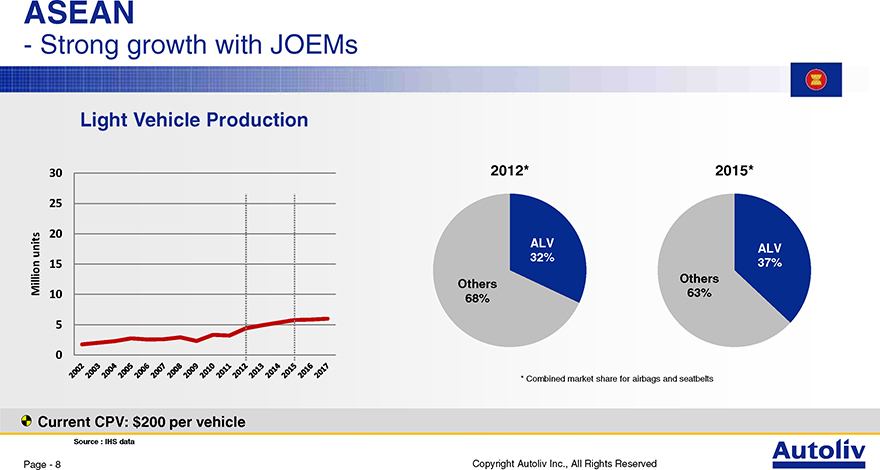
ASEAN
- Strong growth with JOEMs
Light Vehicle Production
30 2012* 2015*
25
20
ALV units ALV
15 32% 37% Others Million Others 63%
10 68%
5 |
|
0
* |
| Combined market share for airbags and seatbelts |
Current CPV: $200 per vehicle
Source : IHS data
Page—8 Copyright Autoliv Inc., All Rights Reserved
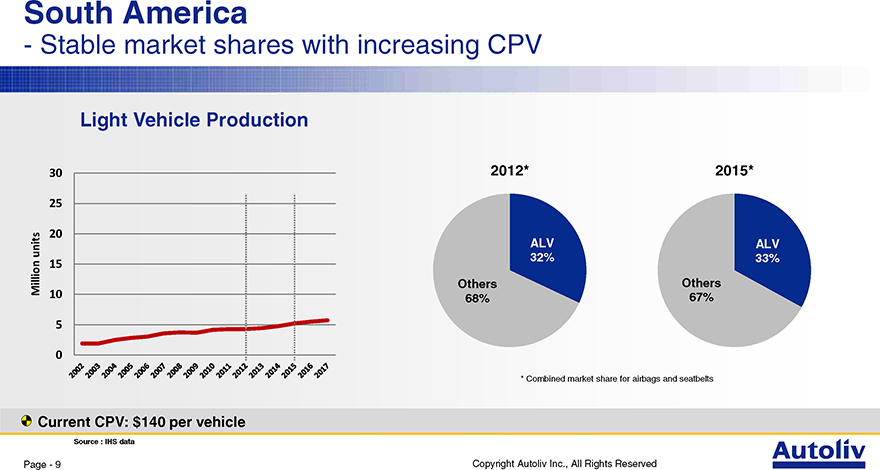
South America
- Stable market shares with increasing CPV
Light Vehicle Production
30 2012* 2015*
25
20 units ALV ALV
15 32% 33% Million Others Others
10 68% 67%
5 |
|
0
* |
| Combined market share for airbags and seatbelts |
Current CPV: $140 per vehicle
Source : IHS data
Page—9 Copyright Autoliv Inc., All Rights Reserved
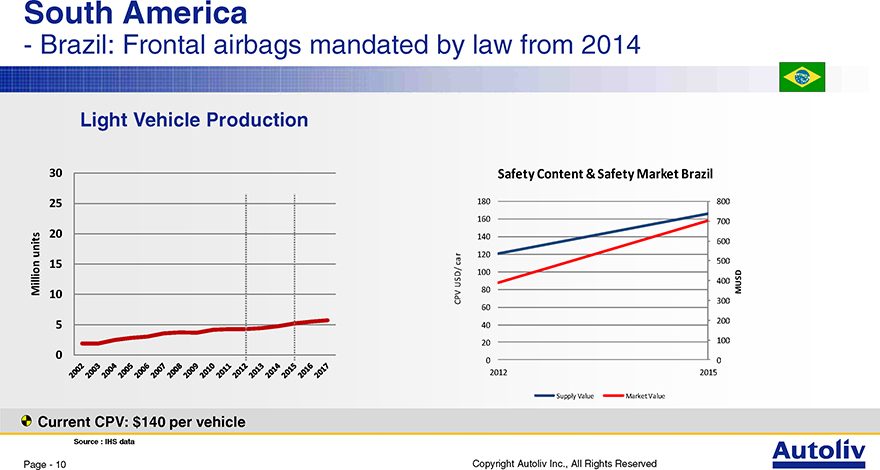
South America
- Brazil: Frontal airbags mandated by law from 2014
Light Vehicle Production
30 Safety Content & Safety Market Brazil
25 180 800 160 700
20 140 600 units car 120 500
15
100
USD/ 400
Million 10 80 MUSD
CPV 60 300 200
5 |
| 40 |
20 100
0
0 0 2012 2015
Supply Value Market Value
Current CPV: $140 per vehicle
Source : IHS data
Page—10 Copyright Autoliv Inc., All Rights Reserved
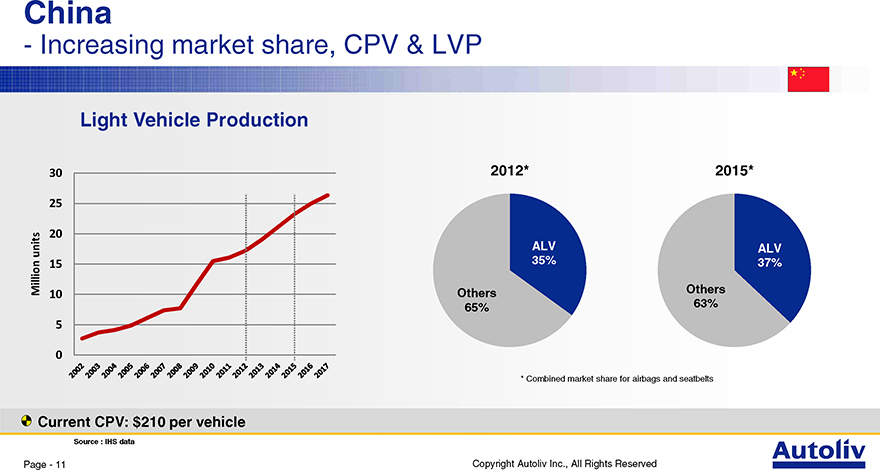
China
- Increasing market share, CPV & LVP
Light Vehicle Production
30 2012* 2015*
25
20 units ALV ALV
15 35% 37% Million Others Others
10 63% 65%
5 |
|
0
* |
| Combined market share for airbags and seatbelts |
Current CPV: $210 per vehicle
Source : IHS data
Page—11 Copyright Autoliv Inc., All Rights Reserved
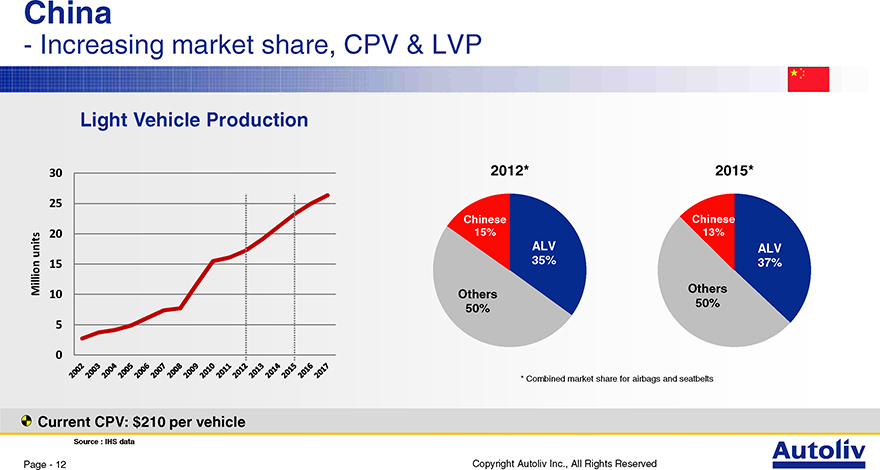
China
- Increasing market share, CPV & LVP
Light Vehicle Production
30 2012* 2015*
25
Chinese Chinese
20 15% 13% units ALV ALV
15 35% 37%
Million Others
10 Others 50% 50%
5 |
|
0
* |
| Combined market share for airbags and seatbelts |
Current CPV: $210 per vehicle
Source : IHS data
Page—12 Copyright Autoliv Inc., All Rights Reserved
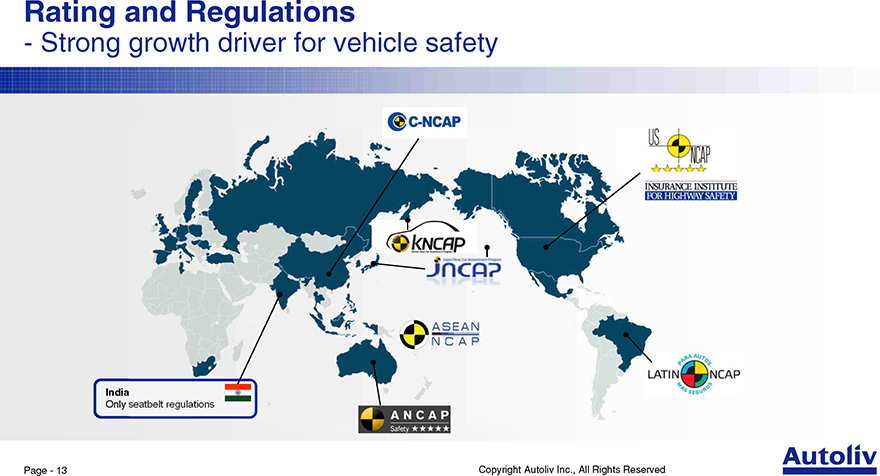
Rating and Regulations
- Strong growth driver for vehicle safety
India
Only
Page—13 Copyright Autoliv Inc., All Rights Reserved
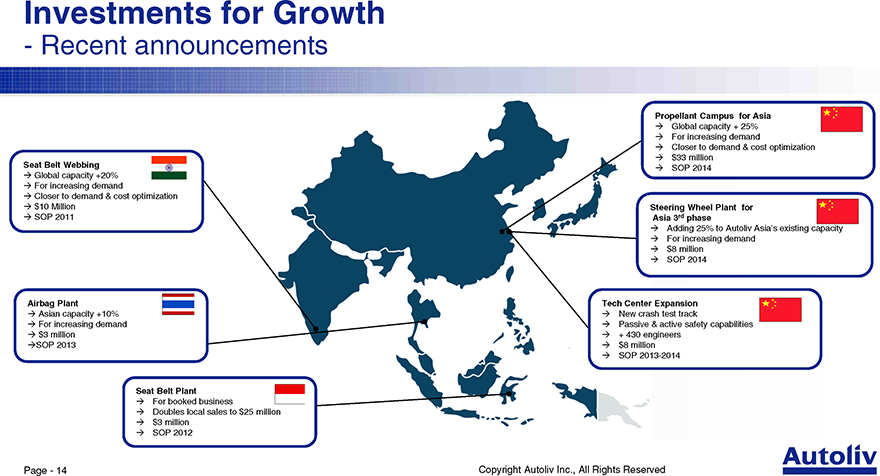
Investments for Growth
- Recent announcements
Propellant Campus for Asia
_ Global capacity + 25%
_ For increasing demand
_ Closer to demand & cost optimization
_ $33 million
Seat Belt Webbing _ SOP 2014
_ Global capacity +20%
_ For increasing demand
_ Closer to demand & cost optimization
_ $10 Million Steering Wheel Plant for
_ SOP 2011 Asia 3rd phase
_ Adding 25% to Autoliv Asia’s existing capacity
_ For increasing demand
_ $8 million
_ SOP 2014
Airbag Plant Tech Center Expansion
_ Asian capacity +10% _ New crash test track
_ For increasing demand _ Passive & active safety capabilities
_ $3 million _ + 430 engineers
_SOP 2013 _ $8 million
_ SOP 2013-2014
Seat Belt Plant
_ For booked business
_ Doubles local sales to $25 million
_ $3 million
_ SOP 2012
Page—14 Copyright Autoliv Inc., All Rights Reserved
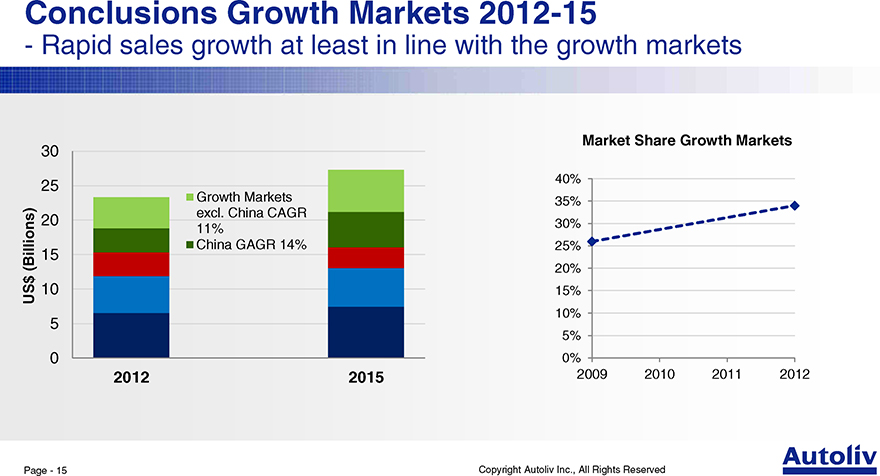
Conclusions Growth Markets 2012-15
- Rapid sales growth at least in line with the growth markets
30 Market Share Growth Markets
40%
25
Growth Markets 35% excl. China CAGR
20 30%
11%
China GAGR 14% 25%
(Billions) 15
20% $
US 10 15%
5 |
| 10% 5% |
0 0%
2012 2015 2009 2010 2011 2012
Page—15 Copyright Autoliv Inc., All Rights Reserved
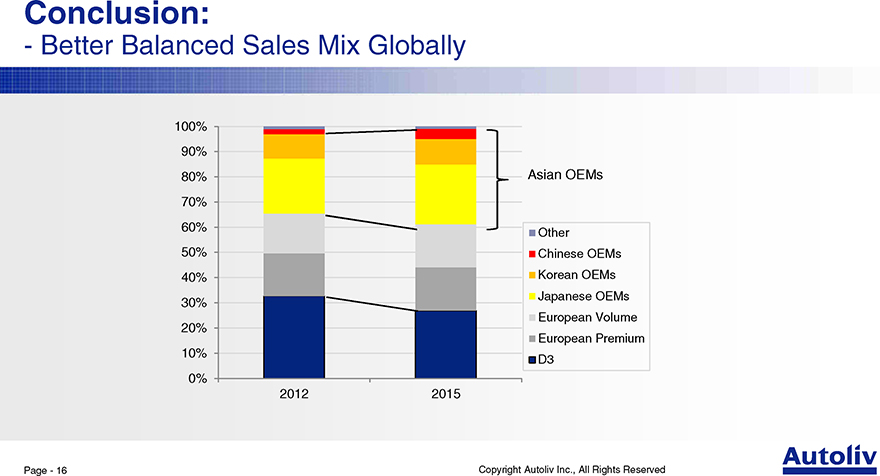
Conclusion:
- Better Balanced Sales Mix Globally
100%
90%
80% Asian OEMs
70%
60%
Other
50% Chinese OEMs 40% Korean OEMs Japanese OEMs
30%
European Volume
20%
European Premium
10%
D3
0%
2012 2015
Page—16 Copyright Autoliv Inc., All Rights Reserved
Thank you!
Autoliv—Safety Systems
Active Autoliv
Safety
Every year, Autoliv’s products save over 25,000 lives
Passive
Safety
Page—17 Copyright Autoliv Inc., All Rights Reserved
The Next Decade of Innovations
Capital Market Day Vårgårda, May 14, 2013
Driven for Life. Johan Löfvenholm
V.P. Engineering
Copyright Autoliv Inc., All Rights Reserved

Safe Harbor Statement *
This presentation contains statements that are not historical facts but rather forward-looking statements within the meaning of the Private Securities Litigation Reform Act of 1995. Such forward-looking statements include those that address activities, events or developments that Autoliv, Inc. or its management believes or anticipates may occur in the future. All forward-looking statements, including without limitation, management’s examination of historical operating trends and data, are based upon our current expectations, various assumptions and data available from third parties. Our expectations and assumptions are expressed in good faith and we believe there is a reasonable basis for them. However, there can be no assurance that such forward-looking statements will materialize or prove to be correct as forward-looking statements are inherently subject to known and unknown risks, uncertainties and other factors which may cause actual future results, performance or achievements to differ materially from the future results, performance or achievements expressed in or implied by such forward-looking statements. The outcome of these forward-looking statements could differ materially from those stated for a variety of reasons, including without limitation, changes in and the successful execution of our capacity alignment, restructuring and cost reduction initiatives; changes in general industry or regional market conditions; loss of business from increased competition; higher raw material, fuel and energy costs; changes in consumer and customer preferences for end products; customer losses; changes in regulatory conditions; customer bankruptcies or divestiture of customer brands; unfavorable fluctuations in currencies or interest rates among the various jurisdictions in which we operate; fluctuation in vehicle production schedules; component shortages; market acceptance of our new products; continued uncertainty in pricing negotiations with customers, our ability to be awarded new business; product liability, warranty and recall claims and other litigation and customer reactions thereto; higher expenses for our pension and other postretirement benefits; work stoppages or other labor issues; possible adverse results of pending or future litigation or infringement claims; negative impacts of antitrust investigations or other governmental investigations and associated litigation (including securities litigation) relating to the conduct of our business; tax assessments by governmental authorities; dependence on key personnel; legislative or regulatory changes limiting our business; political conditions; dependence on customers and suppliers; and other risks and uncertainties identified under the headings “Risk Factors” and “Management’s Discussion and Analysis of Financial Condition and Results of Operations” in our Annual Reports and Quarterly Reports on Forms 10-K and 10-Q and any amendments thereto. The Company undertakes no obligation to update publicly or revise any forward-looking statements in light of new information or future events. For any forward-looking statements contained in this or any other document, we claim the protection of the safe harbor for forward-looking statements contained in the Private Securities Litigation Reform Act of 1995, and we assume no obligation to update any such statement.
(*) Non-US GAAP reconciliations are disclosed in our 8-K/10-K/10-Q filings available at www.sec.gov or www.autoliv.com
Page—2 Copyright Autoliv Inc., All Rights Reserved
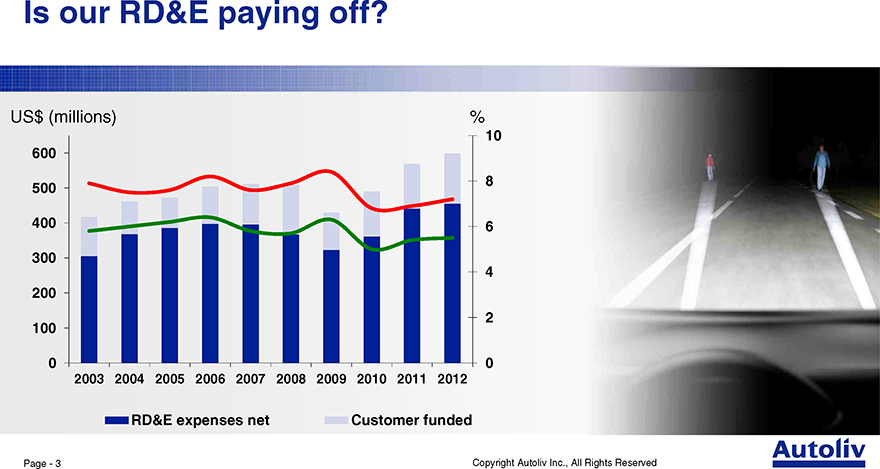
Is our RD&E paying off?
US$ (millions) %
10 600
8 |
| 500 |
400 6
300
4 |
| 200 |
100 2
0 0
2003 2004 2005 2006 2007 2008 2009 2010 2011 2012
RD&E expenses net Customer funded
Page—3 Copyright Autoliv Inc., All Rights Reserved
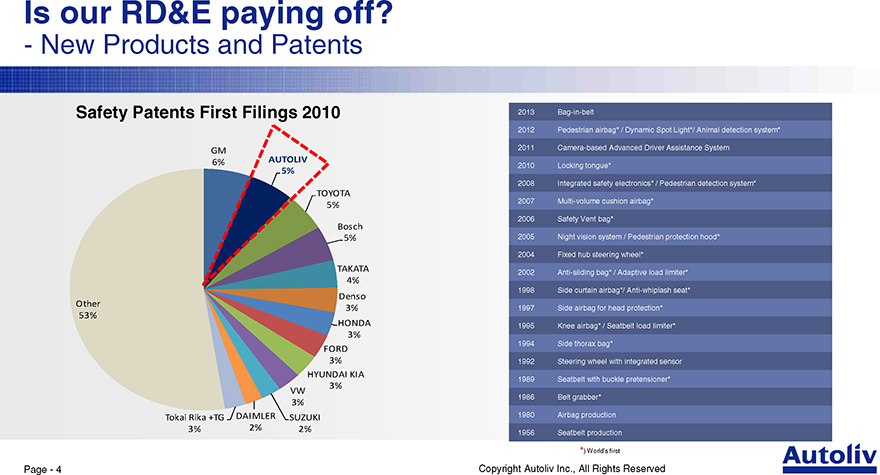
Is our RD&E paying off?
- New Products and Patents
Safety Patents First Filings 2010 2013 Bag-in-belt
2012 Pedestrian airbag* / Dynamic Spot Light*/ Animal detection system*
GM 2011 Camera-based Advanced Driver Assistance System
6% AUTOLIV 2010 Locking tongue*
5%
2008 Integrated safety electronics* / Pedestrian detection system*
TOYOTA
2007 Multi-volume cushion airbag*
5%
2006 Safety Vent bag*
Bosch
5% 2005 Night vision system / Pedestrian protection hood* 2004 Fixed hub steering wheel*
TAKATA
2002 Anti-sliding bag* / Adaptive load limiter*
4%
Denso 1998 Side curtain airbag*/ Anti-whiplash seat*
Other
3% 1997 Side airbag for head protection*
53%
HONDA 1995 Knee airbag* / Seatbelt load limiter*
3%
1994 Side thorax bag*
FORD
3% 1992 Steering wheel with integrated sensor
HYUNDAI KIA
3% 1989 Seatbelt with buckle pretensioner* VW 1986 Belt grabber*
3%
Tokai Rika +TG DAIMLER SUZUKI 1980 Airbag production
3% 2% 2% 1956 Seatbelt production
*) World’s first
Page—4 Copyright Autoliv Inc., All Rights Reserved
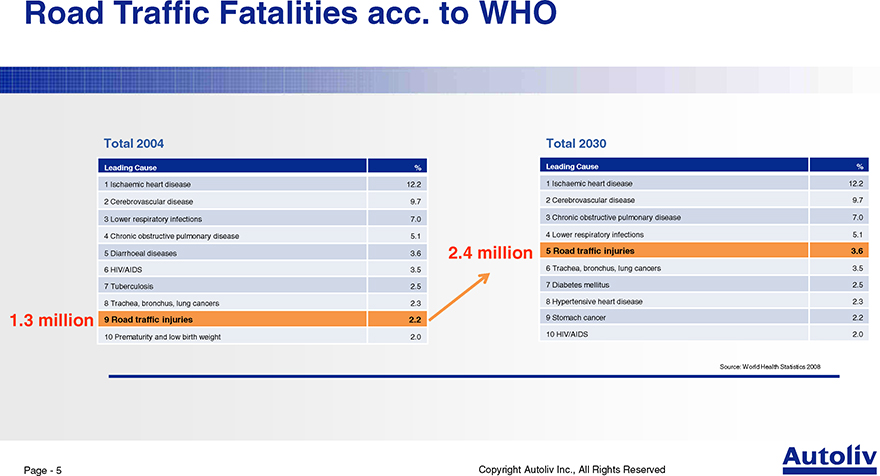
Road Traffic Fatalities acc. to WHO
Total 2004 Total 2030
Leading Cause % Leading Cause %
1 |
| Ischaemic heart disease 12.2 1 Ischaemic heart disease 12.2 |
2 |
| Cerebrovascular disease 9.7 2 Cerebrovascular disease 9.7 |
3 |
| Lower respiratory infections 7.0 3 Chronic obstructive pulmonary disease 7.0 |
4 |
| Chronic obstructive pulmonary disease 5.1 4 Lower respiratory infections 5.1 |
5 |
| Diarrhoeal diseases 3.6 2.4 million 5 Road traffic injuries 3.6 |
6 |
| HIV/AIDS 3.5 6 Trachea, bronchus, lung cancers 3.5 |
7 |
| Tuberculosis 2.5 7 Diabetes mellitus 2.5 |
8 |
| Trachea, bronchus, lung cancers 2.3 8 Hypertensive heart disease 2.3 |
1.3 million 9 Road traffic injuries 2.2 9 Stomach cancer 2.2
10 HIV/AIDS 2.0
10 Prematurity and low birth weight 2.0
Source: World Health Statistics 2008
Page—5 Copyright Autoliv Inc., All Rights Reserved
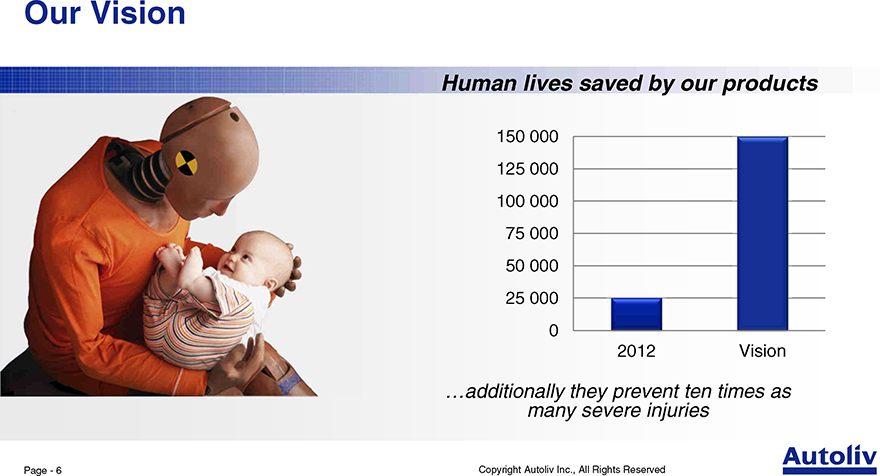
Our Vision
Human lives saved by our products
150 000 125 000 100 000
75 000
50 000
25 000
0
2012 Vision
…additionally they prevent ten times as many severe injuries
Page—6 Copyright Autoliv Inc., All Rights Reserved
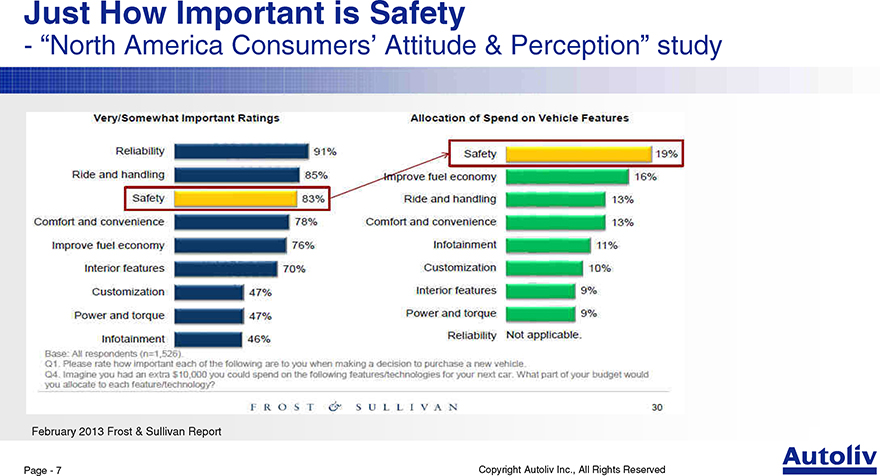
Just How Important is Safety
- “North America Consumers’ Attitude & Perception” study
February 2013 Frost & Sullivan Report
Page—7 Copyright Autoliv Inc., All Rights Reserved
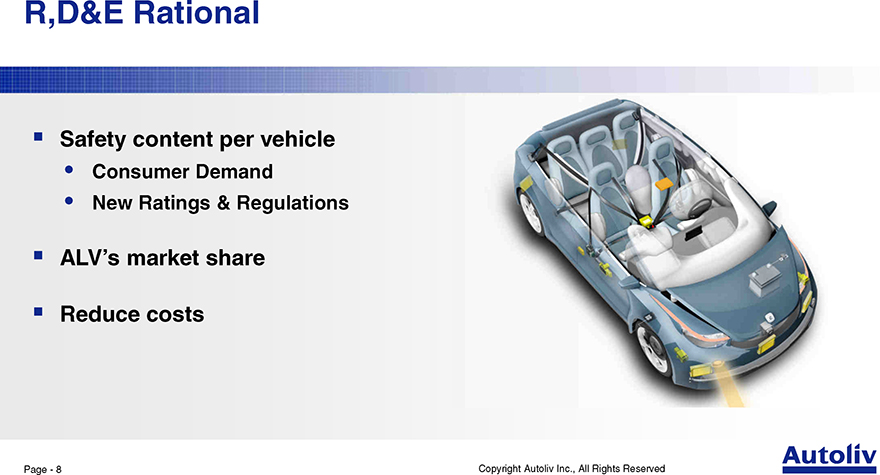
R,D&E Rational
_ Safety content per vehicle
• Consumer Demand
• New Ratings & Regulations
_ ALV’s market share
_ Reduce costs
Page—8 Copyright Autoliv Inc., All Rights Reserved
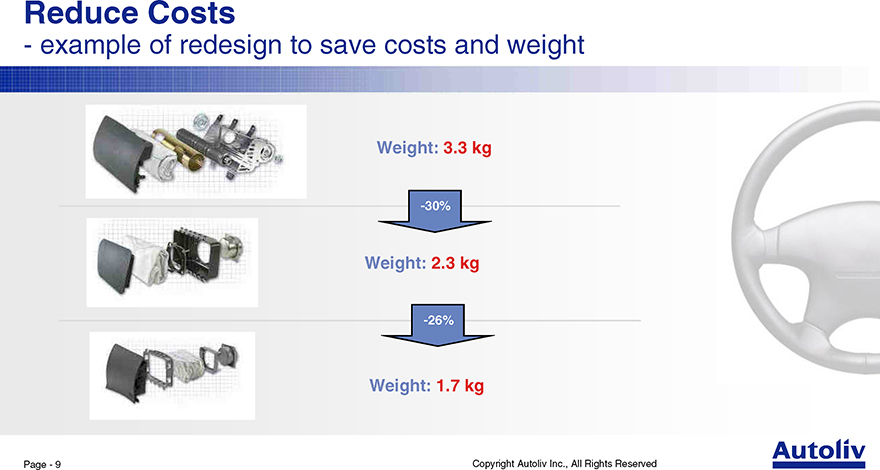
Reduce Costs
- example of redesign to save costs and weight
Weight: 3.3 kg
-30%
Weight: 2.3 kg
-26%
Weight: 1.7 kg
Page—9 Copyright Autoliv Inc., All Rights Reserved
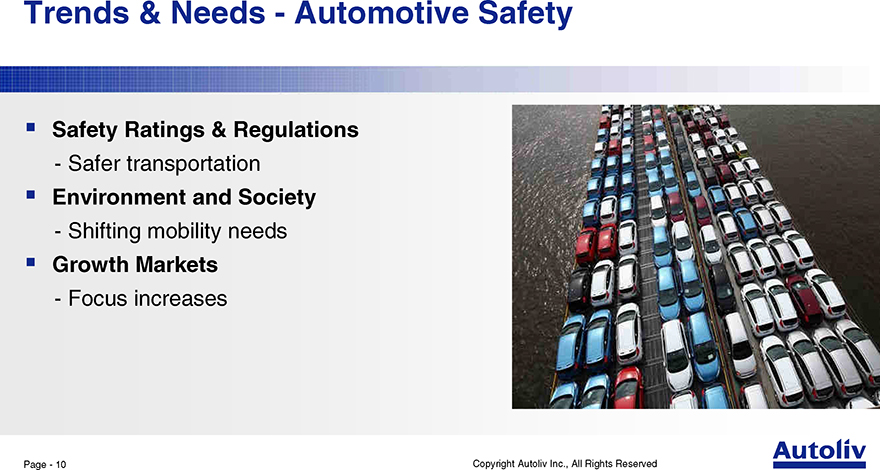
Trends & Needs—Automotive Safety
_ Safety Ratings & Regulations
- Safer transportation
_ Environment and Society
- Shifting mobility needs
_ Growth Markets
- Focus increases
Page—10 Copyright Autoliv Inc., All Rights Reserved
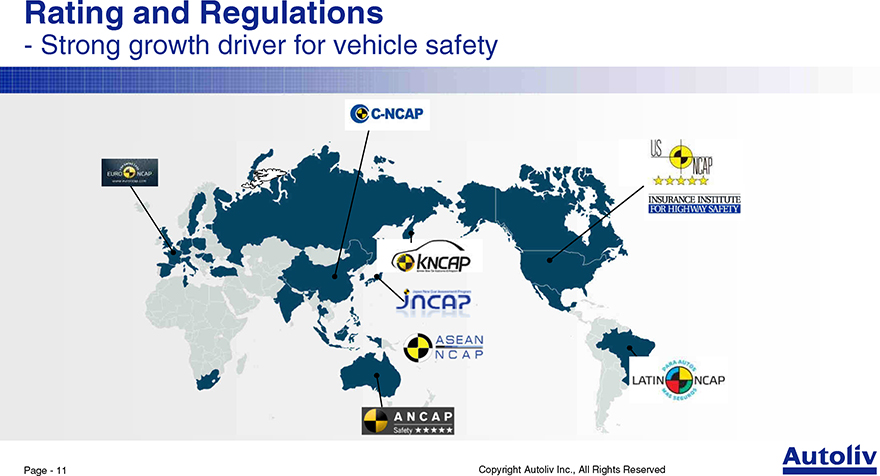
Rating and Regulations
- Strong growth driver for vehicle safety
Page—11 Copyright Autoliv Inc., All Rights Reserved
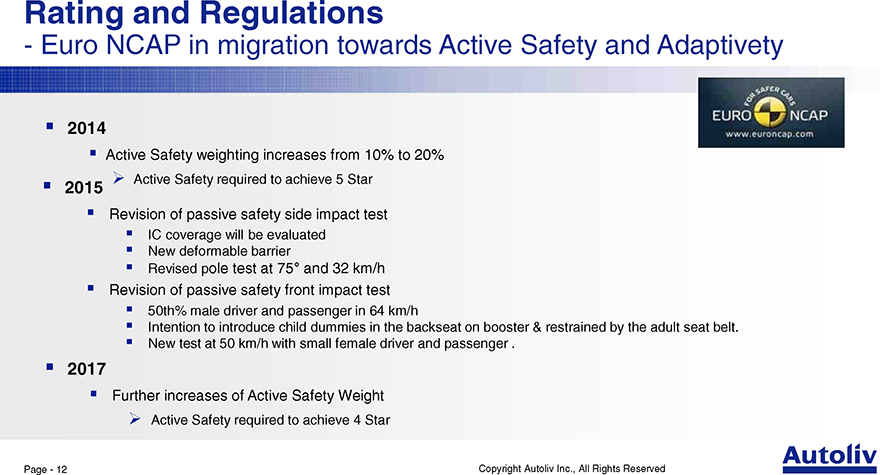
Rating and Regulations
- Euro NCAP in migration towards Active Safety and Adaptivety
_ 2014
_ Active Safety weighting increases from 10% to 20%
_ Active Safety required to achieve 5 Star
_ 2015
_ Revision of passive safety side impact test
_ IC coverage will be evaluated
_ New deformable barrier
_ Revised pole test at 75° and 32 km/h
_ Revision of passive safety front impact test
_ 50th% male driver and passenger in 64 km/h
_ Intention to introduce child dummies in the backseat on booster & restrained by the adult seat belt.
_ New test at 50 km/h with small female driver and passenger .
_ 2017
_ Further increases of Active Safety Weight
_ Active Safety required to achieve 4 Star
Page—12 Copyright Autoliv Inc., All Rights Reserved
Rating and Regulations
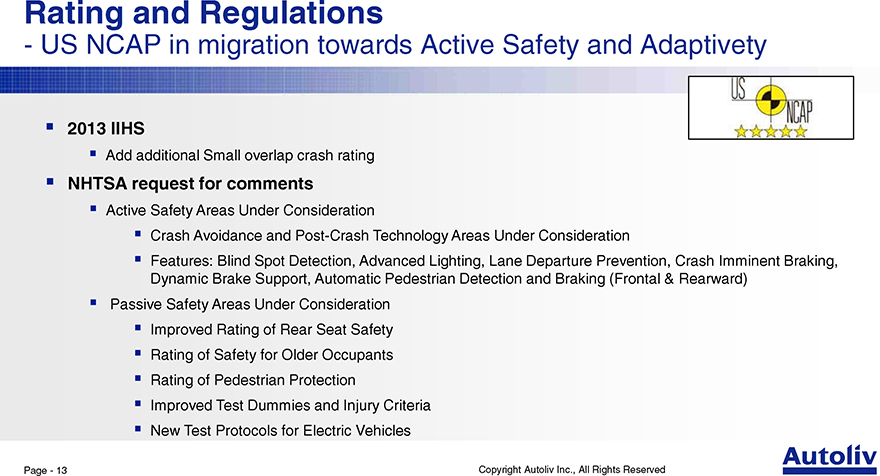
- US NCAP in migration towards Active Safety and Adaptivety
_ 2013 IIHS
_ Add additional Small overlap crash rating
_ NHTSA request for comments
_ Active Safety Areas Under Consideration
_ Crash Avoidance and Post-Crash Technology Areas Under Consideration
_ Features: Blind Spot Detection, Advanced Lighting, Lane Departure Prevention, Crash Imminent Braking, Dynamic Brake Support, Automatic Pedestrian Detection and Braking (Frontal & Rearward)
_ Passive Safety Areas Under Consideration
_ Improved Rating of Rear Seat Safety
_ Rating of Safety for Older Occupants
_ Rating of Pedestrian Protection
_ Improved Test Dummies and Injury Criteria
_ New Test Protocols for Electric Vehicles
Page—13 Copyright Autoliv Inc., All Rights Reserved
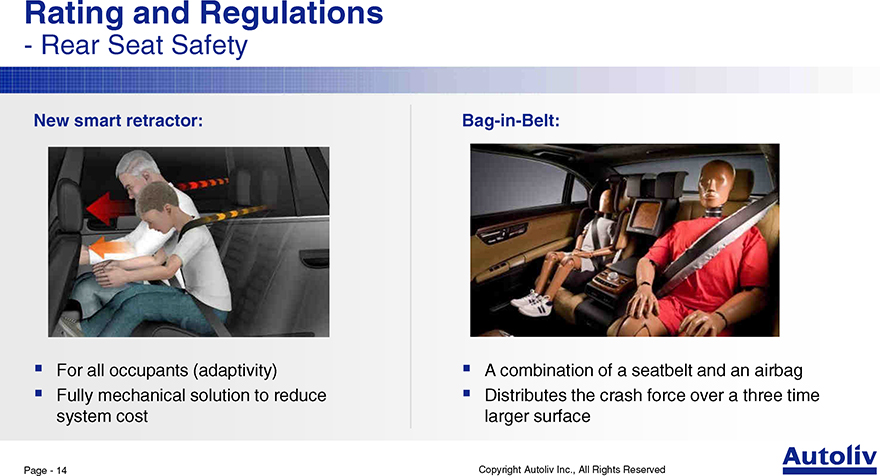
Rating and Regulations
- Rear Seat Safety
New smart retractor: Bag-in-Belt:
_ For all occupants (adaptivity) _ A combination of a seatbelt and an airbag
_ Fully mechanical solution to reduce _ Distributes the crash force over a three time system cost larger surface
Page—14 Copyright Autoliv Inc., All Rights Reserved
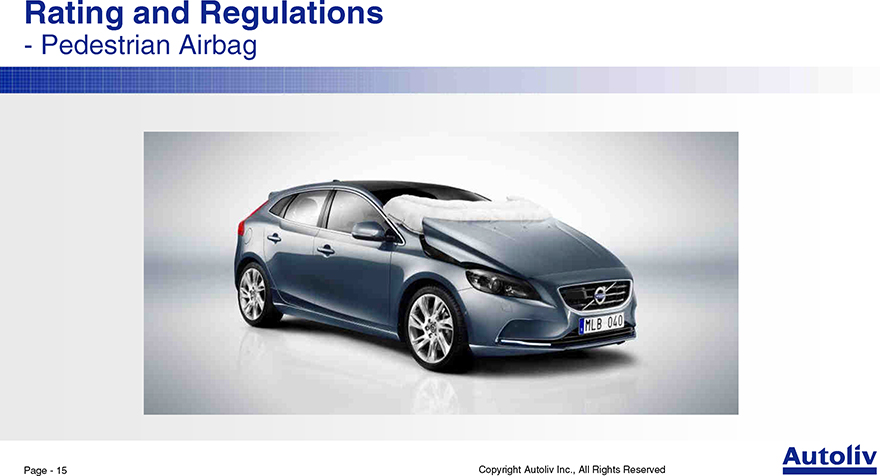
Rating and Regulations
- Pedestrian Airbag
Page—15 Copyright Autoliv Inc., All Rights Reserved
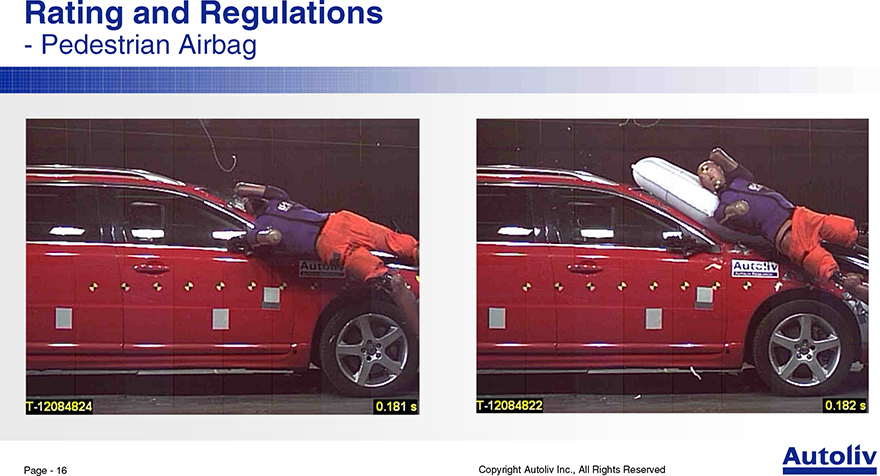
Rating and Regulations
- Pedestrian Airbag
Page—16 Copyright Autoliv Inc., All Rights Reserved
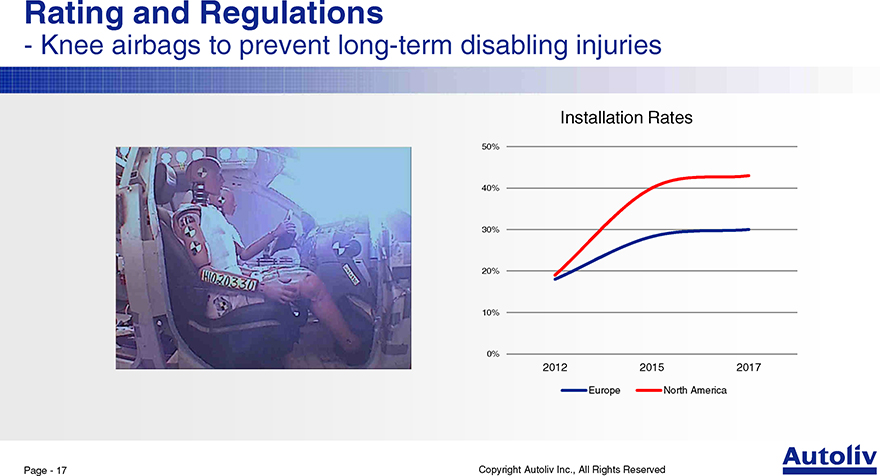
Rating and Regulations
- Knee airbags to prevent long-term disabling injuries
Installation Rates
50% 40% 30% 20% 10%
0%
2012 2015 2017
Europe North America
Page—17 Copyright Autoliv Inc., All Rights Reserved
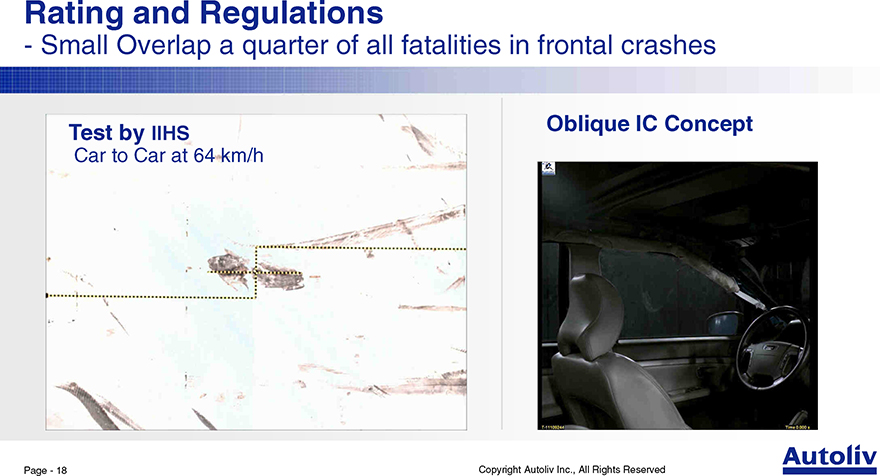
Rating and Regulations
- Small Overlap a quarter of all fatalities in frontal crashes
Oblique IC Concept Test by IIHS
Car to Car at 64 km/h
Page—18 Copyright Autoliv Inc., All Rights Reserved
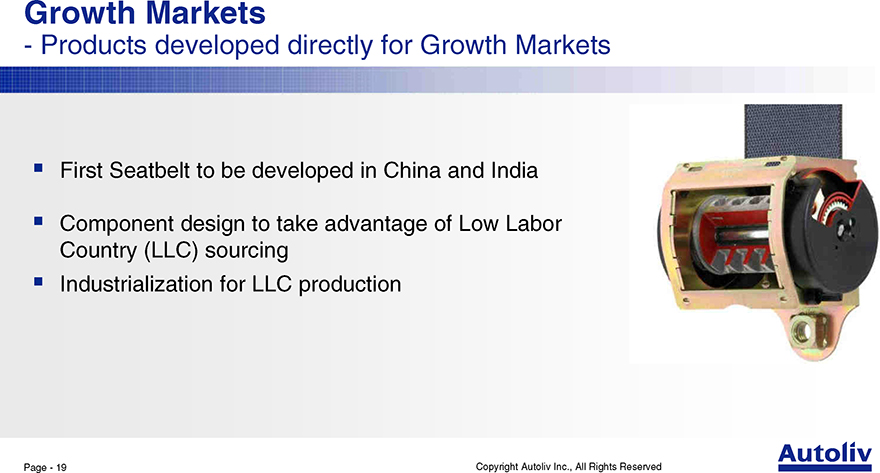
Growth Markets
- Products developed directly for Growth Markets
_ First Seatbelt to be developed in China and India
_ Component design to take advantage of Low Labor Country (LLC) sourcing
_ Industrialization for LLC production
Page—19 Copyright Autoliv Inc., All Rights Reserved
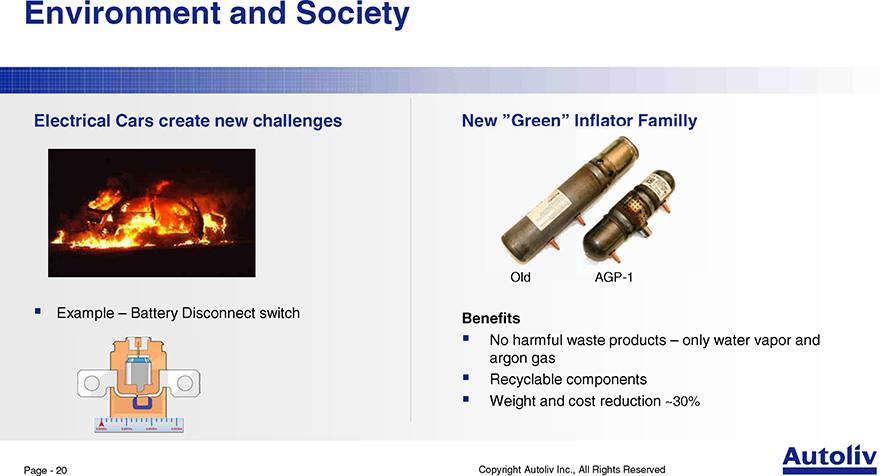
Environment and Society
Electrical Cars create new challenges New “Green” Inflator Familly
Old AGP-1
_ Example – Battery Disconnect switch
Benefits
_ No harmful waste products – only water vapor and argon gas
_ Recyclable components
_ Weight and cost reduction ~30%
Page—20 Copyright Autoliv Inc., All Rights Reserved
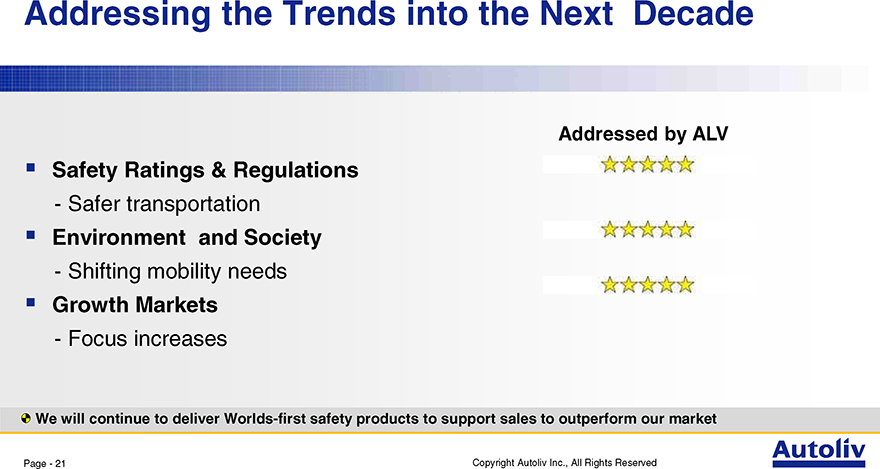
Addressing the Trends into the Next Decade
Addressed by ALV
_ Safety Ratings & Regulations
- Safer transportation
_ Environment and Society
- Shifting mobility needs
_ Growth Markets
- Focus increases
We will continue to deliver Worlds-first safety products to support sales to outperform our market
Page—21 Copyright Autoliv Inc., All Rights Reserved
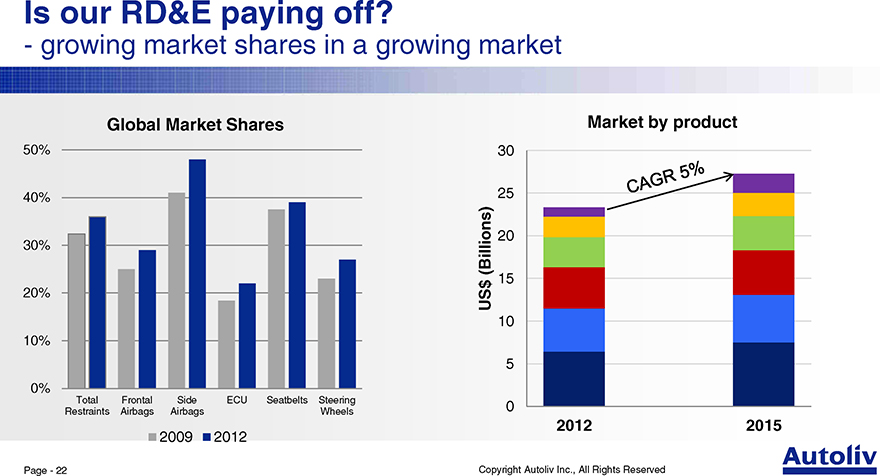
Is our RD&E paying off?
- growing market shares in a growing market
Global Market Shares Market by product
50% 30
40% 25
20
30% (Billions) $ 15
20% US
10
10%
5 |
|
0%
Total Frontal Side ECU Seatbelts Steering
Restraints Airbags Airbags Wheels 0
2009 2012 2012 2015
Page—22 Copyright Autoliv Inc., All Rights Reserved
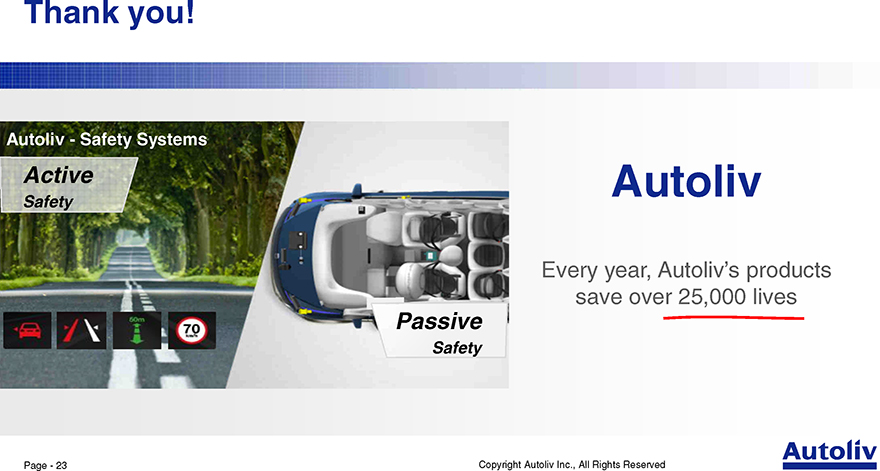
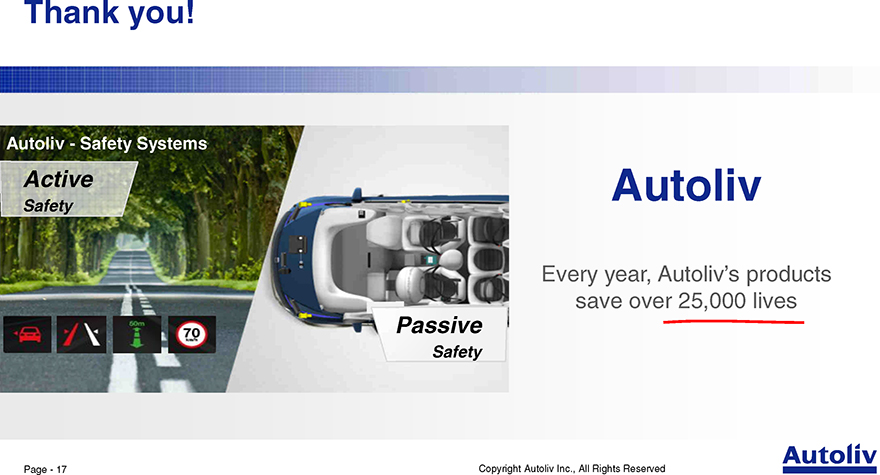
Thank you!
Autoliv—Safety Systems
Active Autoliv
Safety
Every year, Autoliv’s products save over 25,000 lives
Passive
Safety
Page—23 Copyright Autoliv Inc., All Rights Reserved
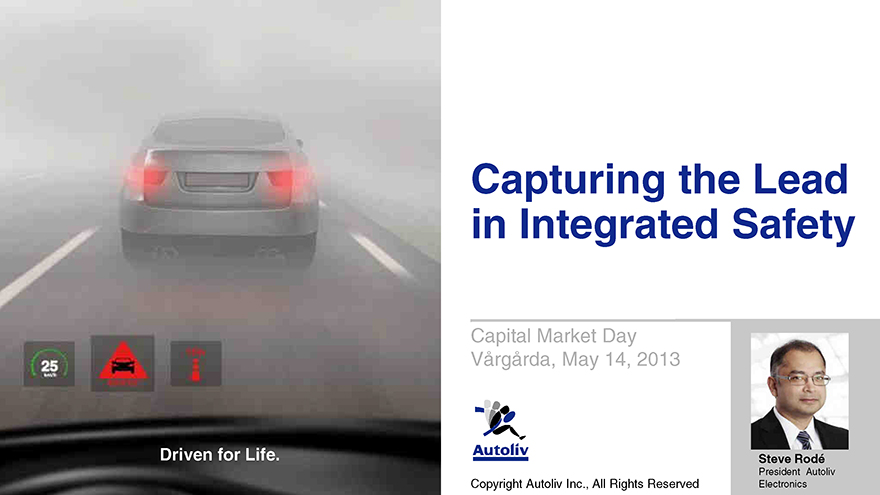
Capturing the Lead in Integrated Safety
Capital Market Day Vårgårda, May 14, 2013
Driven for Life. Steve Rodé
President Autoliv
Copyright Autoliv Inc., All Rights Reserved Electronics
Safe Harbor Statement *
This presentation contains statements that are not historical facts but rather forward-looking statements within the meaning of the Private Securities Litigation Reform Act of 1995. Such forward-looking statements include those that address activities, events or developments that Autoliv, Inc. or its management believes or anticipates may occur in the future. All forward-looking statements, including without limitation, management’s examination of historical operating trends and data, are based upon our current expectations, various assumptions and data available from third parties. Our expectations and assumptions are expressed in good faith and we believe there is a reasonable basis for them. However, there can be no assurance that such forward-looking statements will materialize or prove to be correct as forward-looking statements are inherently subject to known and unknown risks, uncertainties and other factors which may cause actual future results, performance or achievements to differ materially from the future results, performance or achievements expressed in or implied by such forward-looking statements. The outcome of these forward-looking statements could differ materially from those stated for a variety of reasons, including without limitation, changes in and the successful execution of our capacity alignment, restructuring and cost reduction initiatives; changes in general industry or regional market conditions; loss of business from increased competition; higher raw material, fuel and energy costs; changes in consumer and customer preferences for end products; customer losses; changes in regulatory conditions; customer bankruptcies or divestiture of customer brands; unfavorable fluctuations in currencies or interest rates among the various jurisdictions in which we operate; fluctuation in vehicle production schedules; component shortages; market acceptance of our new products; continued uncertainty in pricing negotiations with customers, our ability to be awarded new business; product liability, warranty and recall claims and other litigation and customer reactions thereto; higher expenses for our pension and other postretirement benefits; work stoppages or other labor issues; possible adverse results of pending or future litigation or infringement claims; negative impacts of antitrust investigations or other governmental investigations and associated litigation (including securities litigation) relating to the conduct of our business; tax assessments by governmental authorities; dependence on key personnel; legislative or regulatory changes limiting our business; political conditions; dependence on customers and suppliers; and other risks and uncertainties identified under the headings “Risk Factors” and “Management’s Discussion and Analysis of Financial Condition and Results of Operations” in our Annual Reports and Quarterly Reports on Forms 10-K and 10-Q and any amendments thereto. The Company undertakes no obligation to update publicly or revise any forward-looking statements in light of new information or future events. For any forward-looking statements contained in this or any other document, we claim the protection of the safe harbor for forward-looking statements contained in the Private Securities Litigation Reform Act of 1995, and we assume no obligation to update any such statement.
(*) Non-US GAAP reconciliations are disclosed in our 8-K/10-K/10-Q filings available at www.sec.gov or www.autoliv.com
Page—2 Copyright Autoliv Inc., All Rights Reserved
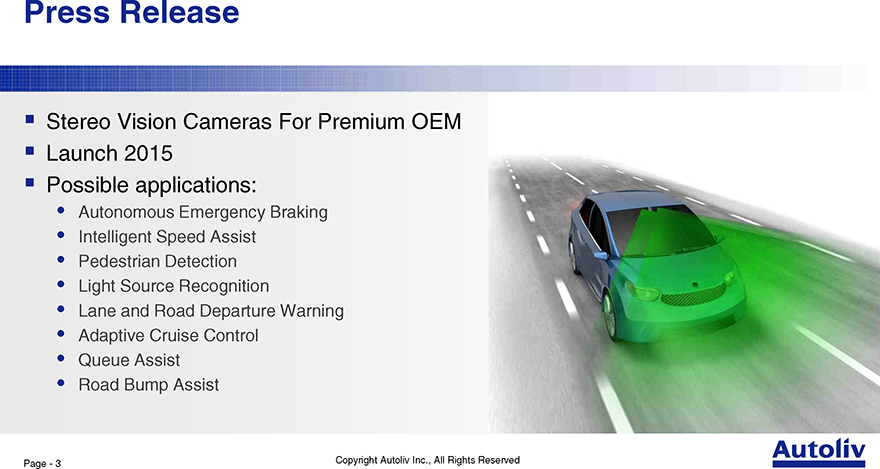
Press Release
_ Stereo Vision Cameras For Premium OEM
_ Launch 2015
_ Possible applications:
• Autonomous Emergency Braking
• Intelligent Speed Assist
• Pedestrian Detection
• Light Source Recognition
• Lane and Road Departure Warning
• Adaptive Cruise Control
• Queue Assist
• Road Bump Assist
Page—3 Copyright Autoliv Inc., All Rights Reserved
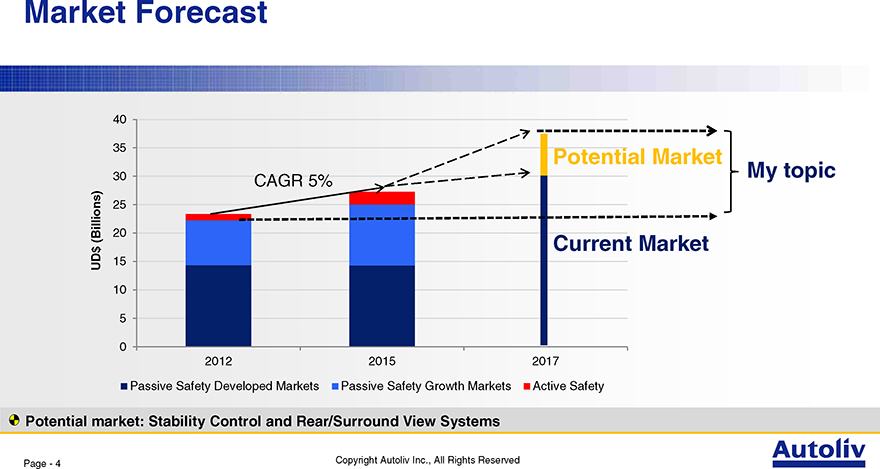
Market Forecast
40
35
Potential Market
30 My topic
CAGR 5%
25
(Billions) 20
$ Current Market
UD 15 10
5 |
|
0
2012 2015 2017
Passive Safety Developed Markets Passive Safety Growth Markets Active Safety
Potential market: Stability Control and Rear/Surround View Systems
Page—4 Copyright Autoliv Inc., All Rights Reserved
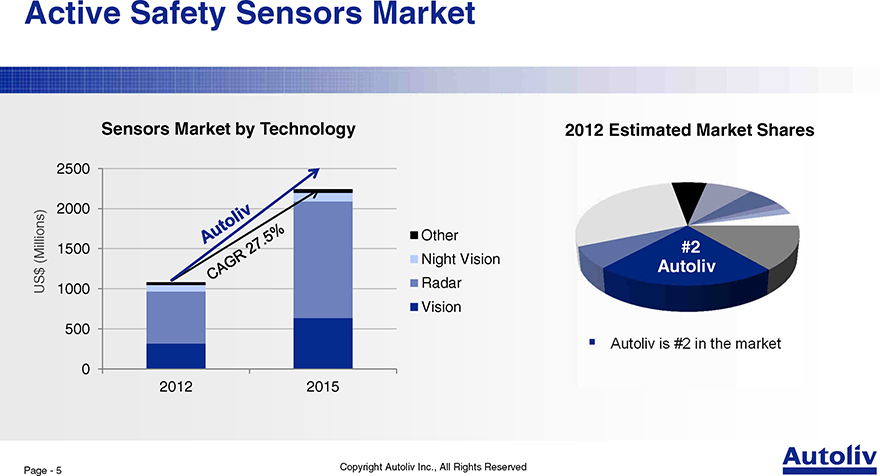
Active Safety Sensors Market
Sensors Market by Technology 2012 Estimated Market Shares
2500
2000
Other #2 (Millions) 1500 Night Vision
$ Autoliv
Radar US 1000 Vision 500
0
2012 2015
Page—5 Copyright Autoliv Inc., All Rights Reserved
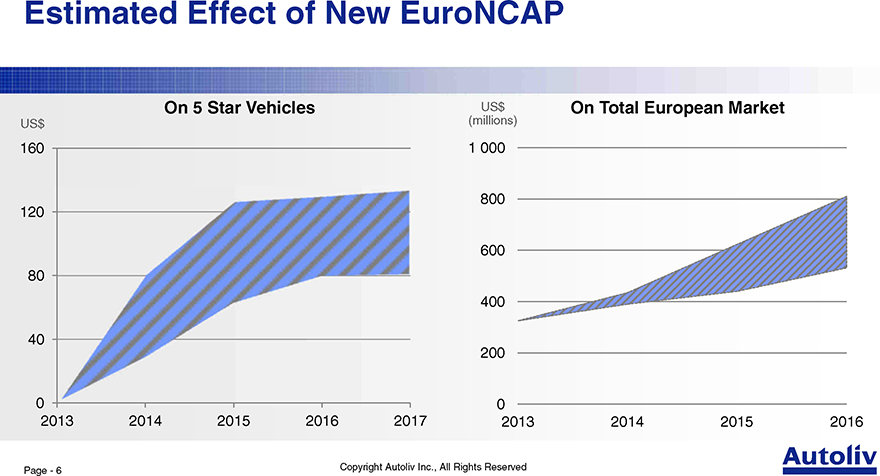
Estimated Effect of New EuroNCAP
On 5 Star Vehicles US$ On Total European Market
US$ (millions)
160 1 000
800 120
600 80 400
40
200
0 0
2013 2014 2015 2016 2017 2013 2014 2015 2016
Page—6 Copyright Autoliv Inc., All Rights Reserved
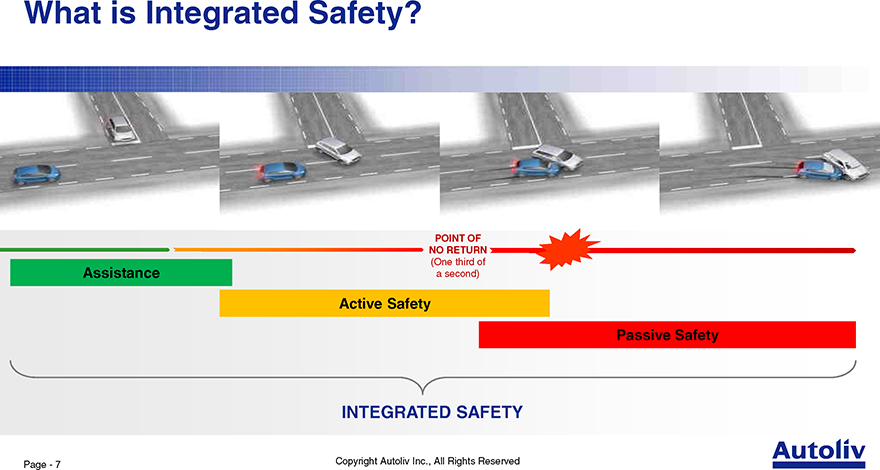
What is Integrated Safety?
POINT OF NO RETURN
(One third of
Assistance a second)
Active Safety
Passive Safety
INTEGRATED SAFETY
Page—7 Copyright Autoliv Inc., All Rights Reserved
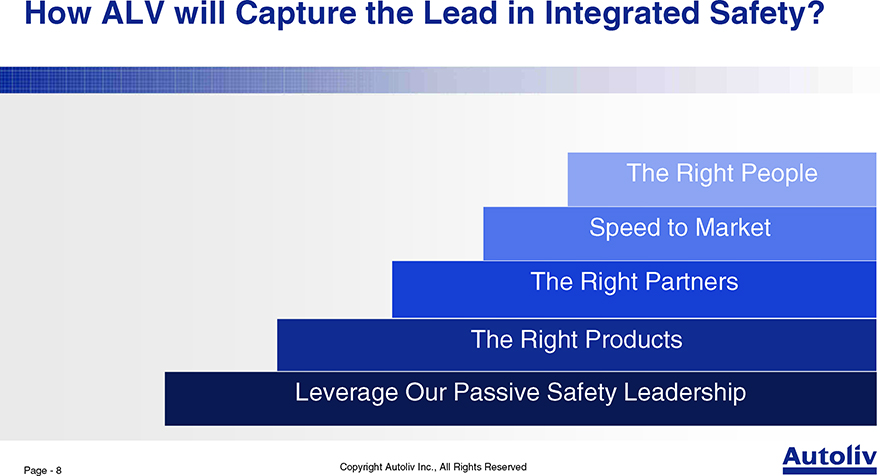
How ALV will Capture the Lead in Integrated Safety?
The Right People Speed to Market The Right Partners
The Right Products
Leverage Our Passive Safety Leadership
Page—8 Copyright Autoliv Inc., All Rights Reserved
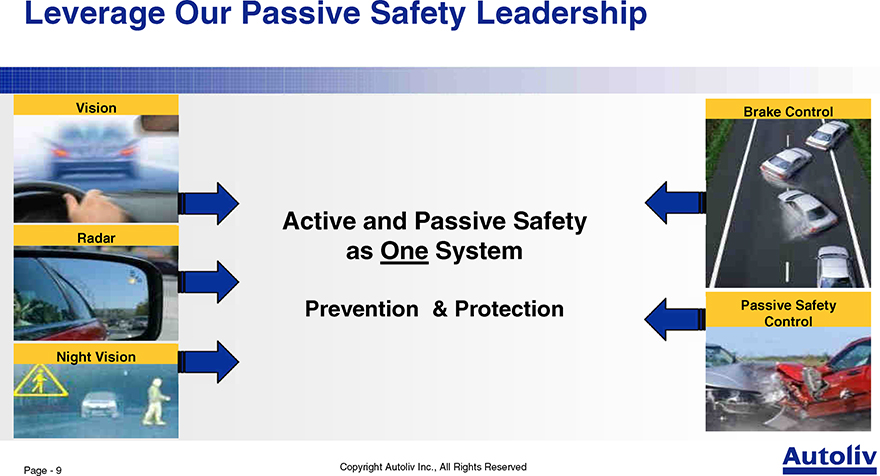
Leverage Our Passive Safety Leadership
Vision Brake Control
Active and Passive Safety
Radar
as One System
Prevention & Protection Passive Safety
Control
Night Vision
Page—9 Copyright Autoliv Inc., All Rights Reserved
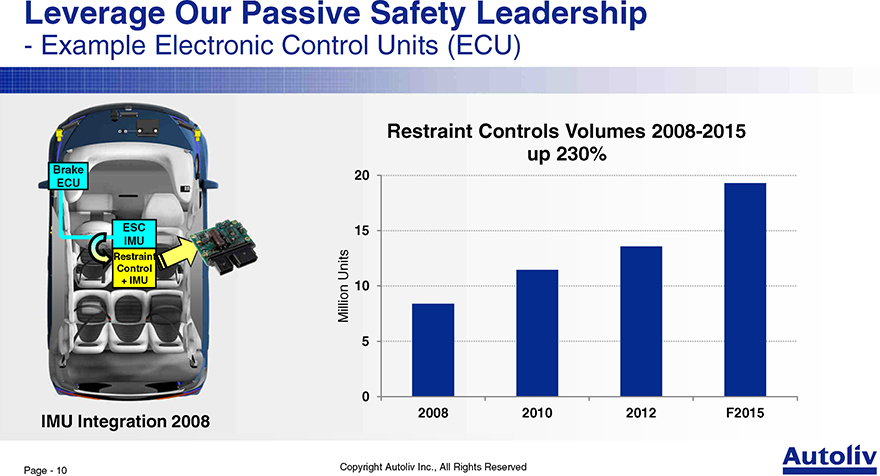
Leverage Our Passive Safety Leadership
- Example Electronic Control Units (ECU)
Restraint Controls Volumes 2008-2015 up 230%
Brake
20
ECU
ESC 15 IMU
Restraint
Control Units
+ IMU
Million 10 5
0
2008 2010 2012 F2015
IMU Integration 2008
Page—10 Copyright Autoliv Inc., All Rights Reserved
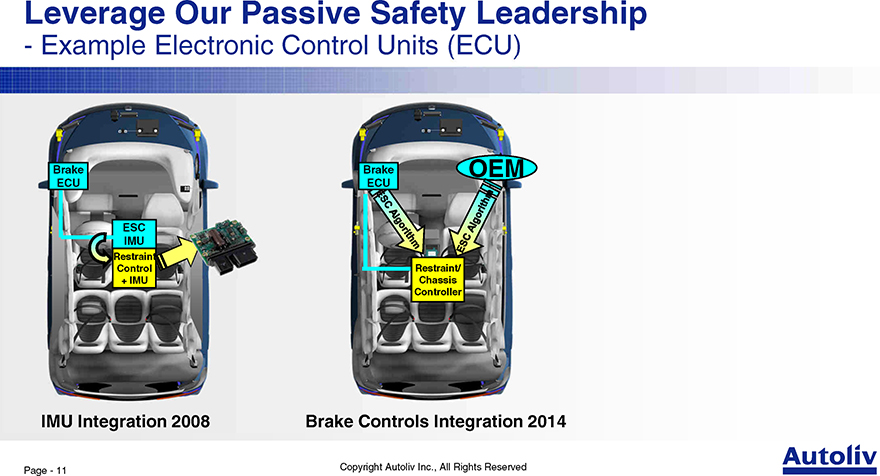
Leverage Our Passive Safety Leadership
- Example Electronic Control Units (ECU)
Brake Brake OEM ECU ECU
ESC IMU
Restraint
Control Restraint/
+ IMU Chassis Controller
IMU Integration 2008 Brake Controls Integration 2014
Page—11 Copyright Autoliv Inc., All Rights Reserved
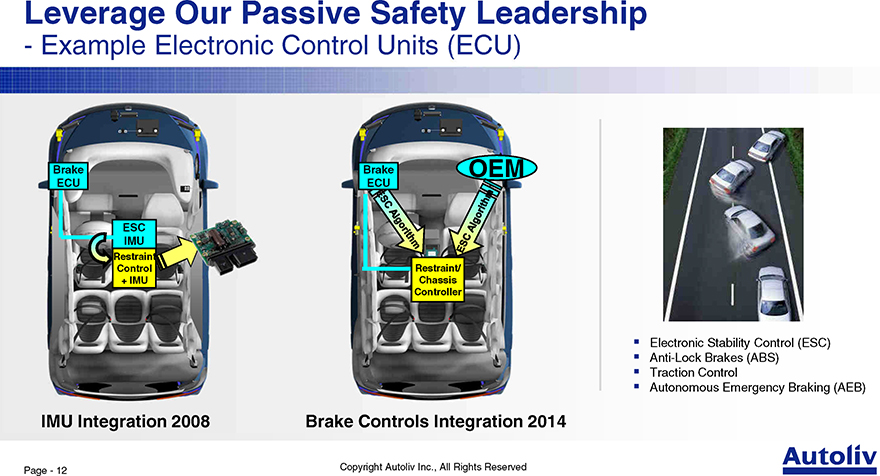
Leverage Our Passive Safety Leadership
- Example Electronic Control Units (ECU)
Brake Brake OEM ECU ECU
ESC IMU
Restraint
Control Restraint/
+ IMU Chassis Controller
_ Electronic Stability Control (ESC)
_ Anti-Lock Brakes (ABS)
_ Traction Control
_ Autonomous Emergency Braking (AEB)
IMU Integration 2008 Brake Controls Integration 2014
Page—12 Copyright Autoliv Inc., All Rights Reserved
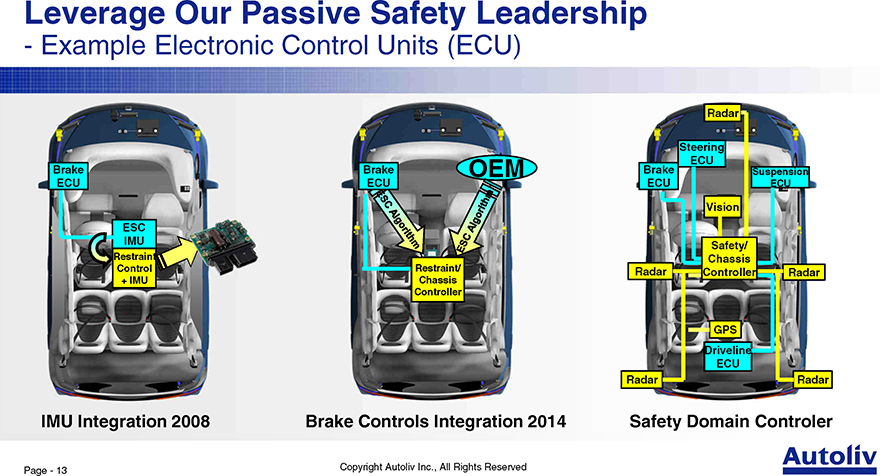
Leverage Our Passive Safety Leadership
- Example Electronic Control Units (ECU)
Radar
Steering ECU
Brake Brake OEM Brake Suspension ECU ECU ECU ECU
Vision
ESC IMU
Safety/
Restraint Chassis Control Restraint/ Radar
+ IMU Chassis Controller Radar
Controller
GPS
Driveline ECU
Radar Radar
IMU Integration 2008 Brake Controls Integration 2014 Safety Domain Controler
Page—13 Copyright Autoliv Inc., All Rights Reserved
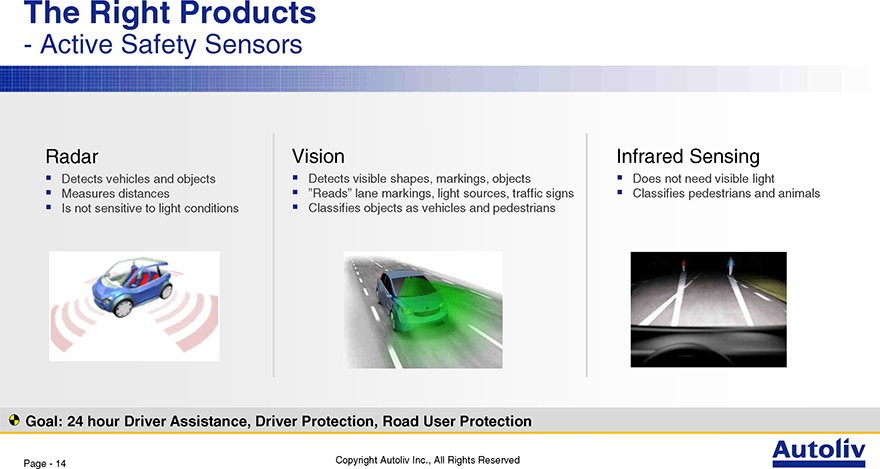
The Right Products
- Active Safety Sensors
Radar Vision Infrared Sensing
_ Detects vehicles and objects _ Detects visible shapes, markings, objects _ Does not need visible light
_ Measures distances _ “Reads” lane markings, light sources, traffic signs _ Classifies pedestrians and animals
_ Is not sensitive to light conditions _ Classifies objects as vehicles and pedestrians
Goal: 24 hour Driver Assistance, Driver Protection, Road User Protection
Page—14 Copyright Autoliv Inc., All Rights Reserved
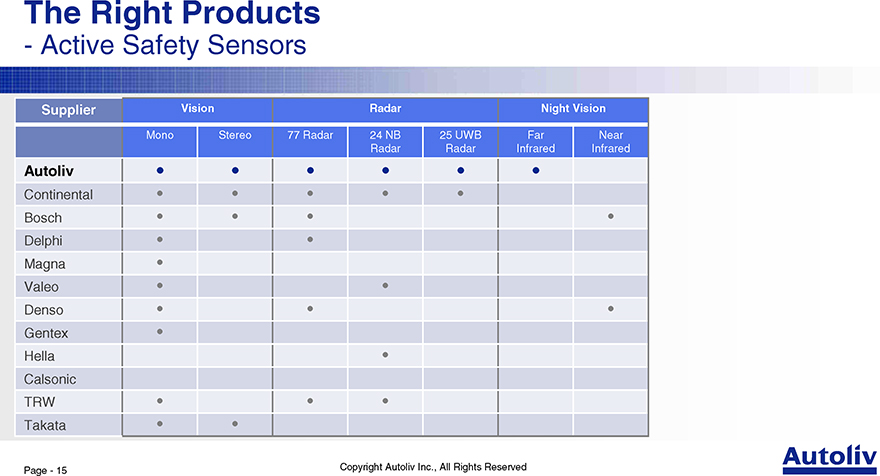
The Right Products
- Active Safety Sensors
Supplier Vision Radar Night Vision
Mono Stereo 77 Radar 24 NB 25 UWB Far Near Radar Radar Infrared Infrared
Autoliv • • • • • •
Continental • • • • •
Bosch • • • • Delphi • • Magna • Valeo • • Denso • • • Gentex • Hella • Calsonic TRW • • • Takata • •
Page—15 Copyright Autoliv Inc., All Rights Reserved
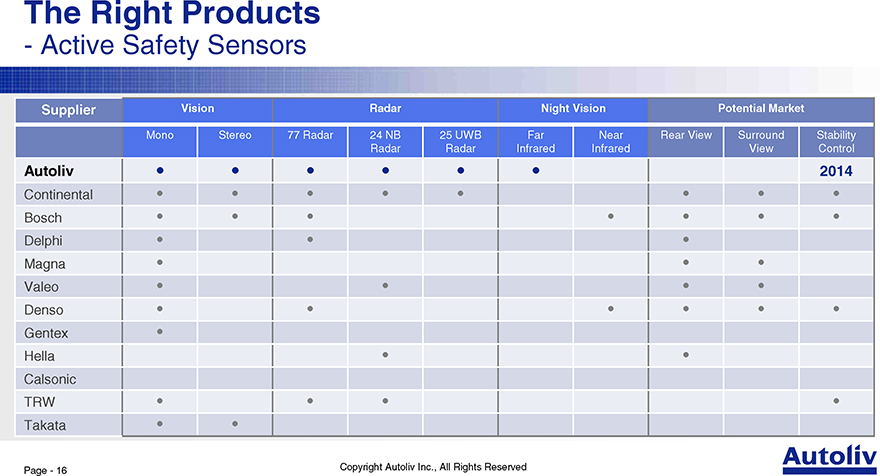
The Right Products
- Active Safety Sensors
Supplier Vision Radar Night Vision Potential Market
Mono Stereo 77 Radar 24 NB 25 UWB Far Near Rear View Surround Stability Radar Radar Infrared Infrared View Control
Autoliv • • • • • • 2014
Continental • • • • • • • •
Bosch • • • • • • •
Delphi • • •
Magna • • • Valeo • • • •
Denso • • • • • •
Gentex •
Hella • • Calsonic
TRW • • • •
Takata • •
Page—16 Copyright Autoliv Inc., All Rights Reserved
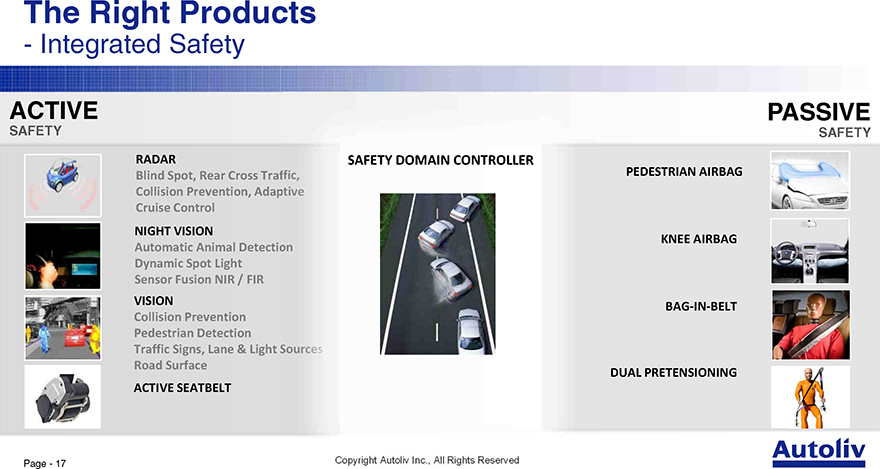
The Right Products
- Integrated Safety
ACTIVE PASSIVE
SAFETY SAFETY
RADAR SAFETY DOMAIN CONTROLLER
Blind Spot, Rear Cross Traf PEDESTRIAN AIRBAG Collision Prevention, Adap Cruise Control
NIGHT VISION
KNEE AIRBAG Automatic Animal Detectio Dynamic Spot Light Sensor Fusion NIR / FIR
VISION
BAG-IN-BELT Collision Prevention Pedestrian Detection Traffic Signs, Lane & Light Road Surface DUAL PRETENSIONING ACTIVE SEATBELT
Page—17
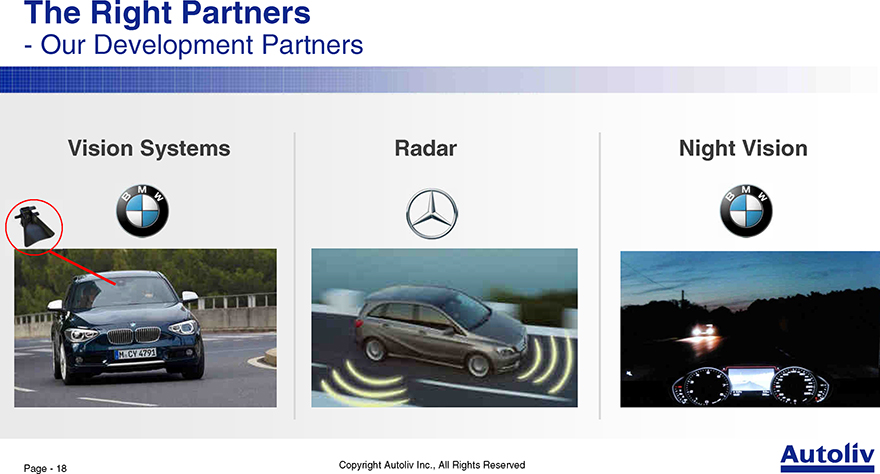
The Right Partners
- Our Development Partners
Vision Systems Radar Night Vision
Page—18 Copyright Autoliv Inc., All Rights Reserved
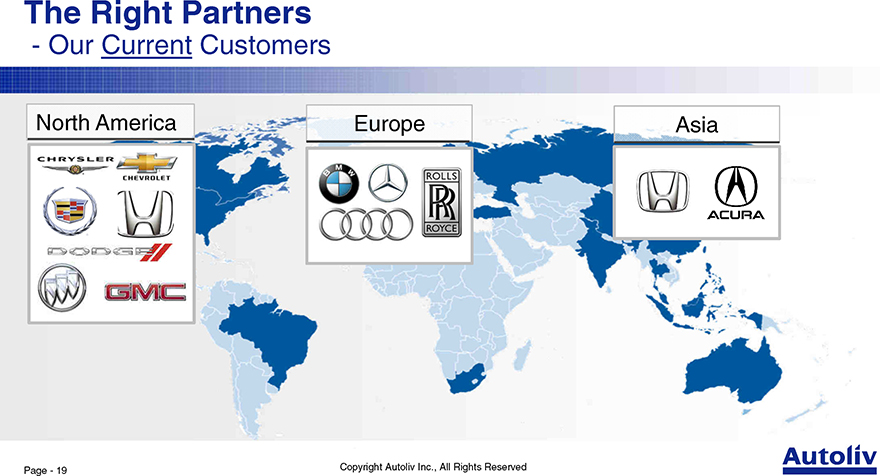
The Right Partners
- Our Current Customers
North America Europe Asia
Page—19 Copyright Autoliv Inc., All Rights Reserved
Co-development
- Mercedes’ Collision Prevention Assist (CPA)
Page—20 Copyright Autoliv Inc., All Rights Reserved
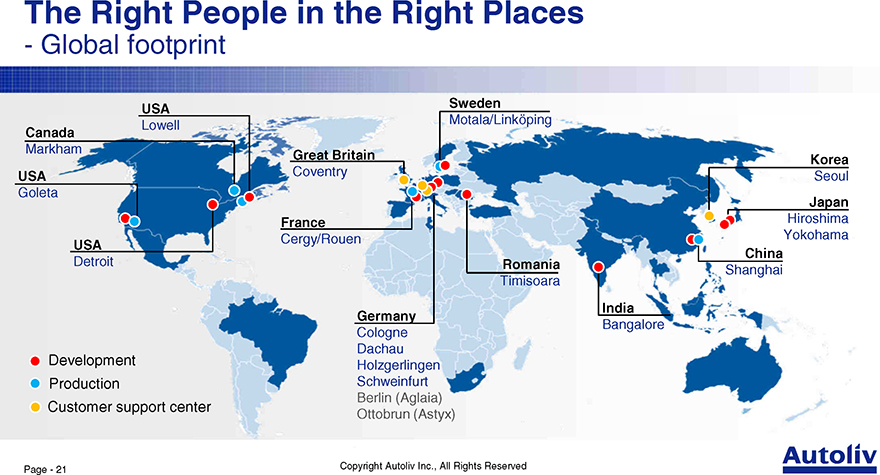
The Right People in the Right Places
- Global footprint
Sweden USA
Motala/Linköping Lowell
Canada
Markham
Great Britain Korea USA Coventry Seoul Goleta Japan France Hiroshima USA Cergy/Rouen Yokohama
China
Detroit Romania
Shanghai Timisoara
India Germany
Bangalore Cologne Dachau Development Holzgerlingen Production Schweinfurt Berlin (Aglaia)
Customer support center
Ottobrun (Astyx)
Page—21 Copyright Autoliv Inc., All Rights Reserved
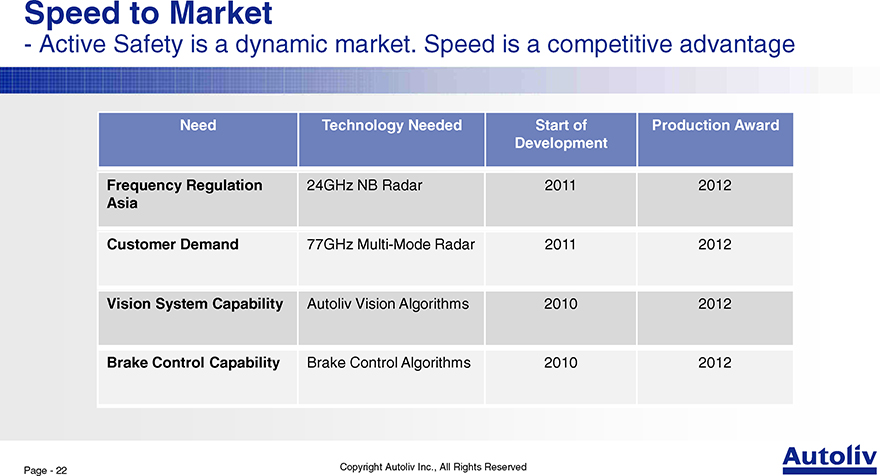
Speed to Market
- Active Safety is a dynamic market. Speed is a competitive advantage
Need Technology Needed Start of Production Award Development
Frequency Regulation 24GHz NB Radar 2011 2012
Asia
Customer Demand 77GHz Multi-Mode Radar 2011 2012 Vision System Capability Autoliv Vision Algorithms 2010 2012 Brake Control Capability Brake Control Algorithms 2010 2012
Page—22 Copyright Autoliv Inc., All Rights Reserved

Active Safety—a Strategic Journey
- On track to reach 500 MUSD sales target
Launches Night Vision/ Radar/ Mono Vision/ Brake Stereo BMW Mercedes BMW Control Vision
1000
900
Potential
800
Acquisitions 700 Astyx 600 Radar
Millions Visteon
Acquisitions 500 Visteon RC Tyco Radar $ Radar Hella
US 400 Vision 500 MUSD 300 Organic sales
200
100
0
2002 2003 2004 2005 2006 2007 2008 2009 2010 2011 2012 2013 F2014 F2015
Page—23 Copyright Autoliv Inc., All Rights Reserved
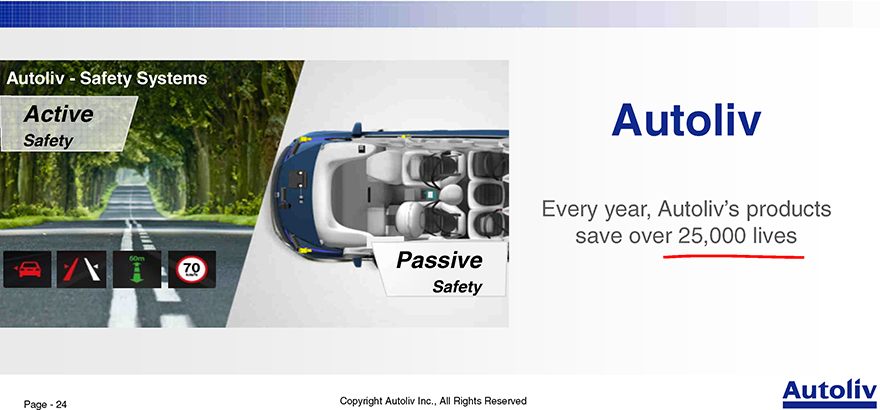
Autoliv—Safety Systems
Active Autoliv
Safety
Every year, Autoliv’s products save over 25,000 lives
Passive
Safety
Page—24 Copyright Autoliv Inc., All Rights Reserved