Effective tax rate of 27.4% was 19.3 pp higher than last year primarily because the second quarter 2018 was positively affected by the reversal of certain valuation allowances.
Earnings per share, diluted decreased by 95 cents primarily due to 44 cents from unusual tax items, 39 cents from lower operating income and 11 cents from costs related to capacity alignment and antitrust related matters.
Selected Balance Sheet and Cash Flow items
| | | |
Selected Balance Sheet items | Second quarter |
(Dollars in millions) | 2019 | 2018 | Change |
Operating working capital | $644.8 | $775.5 | (16.9)% |
Operating working capital % of sales1) | 7.5% | 9.1% | (1.6)pp |
Cash & cash equivalent | $406.4 | $507.5 | (19.9)% |
Gross Debt2) | $2,217.0 | $2,283.6 | (2.9)% |
Net Debt3) | $1,810.9 | $1,784.7 | 1.5% |
Total equity | $2,037.7 | $2,007.6 | 1.5% |
Leverage ratio | 1.8 | 1.6 | 12.5% |
1) Latest 12 months of net sales. 2) Short- and long-term interest-bearing debt. 3) Short- and long-term debt less cash and cash equivalents and debt-related derivatives. Non U.S. GAAP measure, see reconciliation table. |
| | | | | | |
Selected Cash Flow items | Second quarter | First 6 months |
(Dollars in millions) | 2019 | 20181) | Change | 2019 | 20181) | Change |
Net income | $109.4 | $193.2 | (43.4)% | $220.9 | $352.3 | (37.3)% |
Changes in operating assets and liabilities2) | $(17.1) | $(79.0) | (78.4)% | $(54.2) | $(263.5) | (79.4)% |
Depreciation and amortization | $85.9 | $86.5 | (0.7)% | $176.0 | $168.0 | 4.8% |
Other, net3) | $(198.8) | $0.3 | n/a | $(209.6) | $25.2 | (931.7)% |
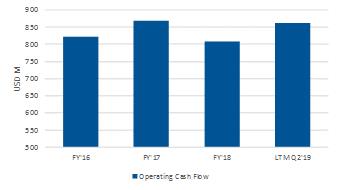
Operating cash flow | $(20.6) | $201.0 | (110.2)% | $133.1 | $282.0 | (52.8)% |
Capital expenditure, net | $(127.8) | $(125.2) | 2.1% | $(235.8) | $(235.3) | 0.2% |
Free cash flow4) | $(148.4) | $75.8 | (295.8)% | $(102.7) | $46.7 | (319.9)% |
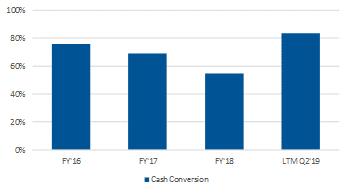
Cash conversion5) | (135.6)% | 39.2% | (174.8)pp | (46.5)% | 13.3% | (59.8)pp |
Dividends paid | $(54.2) | $(54.2) | 0.0% | $(108.5) | $(106.6) | 1.8% |
1) Management estimate for Continuing Operations derived from cash flow including Discontinued Operations. 2) 2018 including separation cost. 3) 2019 including EC antitrust non-cash provision and payment. 4) Operating cash flow less Capital expenditure, net. Non U.S. GAAP measure, see enclosed reconciliation table. 5) Free cash flow relative to Net income. Non U.S. GAAP measure, see reconciliation table. |
Second quarter 2019 development
Operating working capital* was 7.5% of sales compared to 9.1% of sales a year earlier, where the improvement mainly was a consequence of reduced account receivables. The Company targets that operating working capital in relation to the last 12-month sales should not exceed 10%.
Operating cash flow was negative $21 million compared to $201 million a year earlier, where the difference primarily was due to the payment of the EC antitrust fine of $203 million. Excluding this payment, operating cash flow was about $180 million.
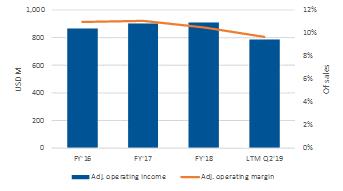
Capital expenditure, net, of $128 million was relatively unchanged, reflecting continued high investment requirements in support of the high level of new product launches.
Free cash flow, net* amounted to negative $148 million compared to positive $76 million a year earlier, where the decrease of $224 million is mainly due to the payment of the EC antitrust fine of $203 million.
Cash conversion* defined as free cash flow in relation to net income, amounted to negative 136% in the second quarter 2019 compared to 39% in the second quarter 2018. Excluding the impact of the payment of the EC antitrust fine, cash conversion improved to 50%.
Net debt* amounted to $1,811 million as of June 30, 2019, which was close to unchanged compared to a year earlier.