Q3 Report—2019 |
Q3 2019: Business cycle management yielding results
Financial highlights Q3 2019 |
| Full Year 2019 indications |
$2,028m net sales |
| Around (2)% net sales growth |
1.2% organic sales growth* |
| Around 1% organic sales growth |
7.6% operating margin |
| Around 9% adj. operating margin |
9.0% adj. operating margin* |
|
|
$0.98 EPS - a decline of 27% |
|
|
$1.30 adj. EPS* - a decline of 4% |
|
|
Key business developments in the third quarter of 2019
• | Organic growth outperformed global light vehicle production by 4.6pp mainly due to China and Americas. |
• | Profitability still impacted by global LVP decline and high raw material costs, although less than previous quarter, partly offset by total workforce decline of 800 vs. a quarter ago, or of 1,600 vs. a year ago. |
• | Established new customer collaborations; a North American road safety center with Great Wall Motor and presented next generation passenger airbag in cooperation with Honda. |
*For non-U.S. GAAP measures see enclosed reconciliation tables. All figures herein refer to continued operations, excluding former Electronics segment, unless stated otherwise. All change figures in this document compare to the same period of previous year, except when stated otherwise.
Key Figures
(Dollars in millions, except per share data) | Q3 2019 | Q3 2018 | Change | 9M 2019 | 9M 2018 | Change |
Net sales | $2,028 | $2,033 | (0.3)% | $6,356 | $6,485 | (2.0)% |
Operating income | $154 | $193 | (20)% | $497 | $665 | (25)% |
Adjusted operating income1) | $183 | $194 | (5.7)% | $532 | $668 | (20)% |
Adjusted operating margin1) | 9.0% | 9.5% | (0.5)pp | 8.4% | 10.3% | (1.9)pp |
Earnings per share, diluted2, 3) | $0.98 | $1.34 | (27)% | $3.50 | $5.37 | (35)% |
Adjusted earnings per share, diluted1, 2, 3) | $1.30 | $1.35 | (3.7)% | $3.87 | $5.40 | (28)% |
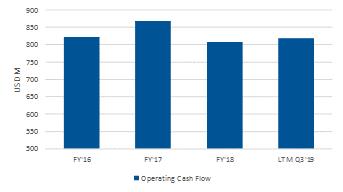
Operating cash flow4) | $195 | $238 | (18)% | $328 | $520 | (37)% |
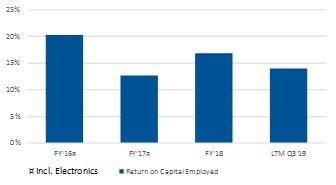
Return on capital employed5) | 16.2% | 20.4% | (4.2)pp | 18.0% | 20.9% | (2.9)pp |
1) Excluding costs for capacity alignment, antitrust related matters and separation of our business segments. 2) Assuming dilution and net of treasury shares. 3) Participating share awards with right to receive dividend equivalents are (under the two-class method) excluded from the EPS calculation. 4) For first 9 months 2018 management estimate for Continuing Operations derived from cash flow including Discontinued Operations. 5) Operating income and income from equity method investments, relative to average capital employed. | ||||||
| Comments from Mikael Bratt, President & CEO We experienced continued challenging market conditions in the quarter. Although the rate of decline in light vehicle production slowed down slightly, uncertainty remains high, market outlook by IHS continues to be |
| The cost improvement actions which enabled this performance will continue relentlessly. We reduced our workforce by an additional 800 in the quarter, or by 1,600 compared to a year ago, despite growing our sales organically* by 1.2%. Our program to reduce indirect labor costs by 5% is developing as planned and we expect it to impact our costs meaningfully as of the fourth quarter 2019. In addition to LVP and raw material headwinds, the strike at General Motors in North America is also affecting our sales. Being close to our customers supports our short- and long-term business opportunities and this quarter we announced two new customer collaborations - the North American road safety research lab together with Great Wall Motor and the next generation passenger airbag in cooperation with Honda. Our order intake share remained on a good level in the quarter, supporting a prolonged sales growth outperformance. As always, it is of utmost importance to focus on quality and execution to secure a strong long-term performance for our company. |
revised down and we do not see a turnaround in LVP in the near term. We continued to outperform light vehicle production, growing organically* about 4.6pp more than LVP in the third quarter, driven mainly by strong development in China and Americas. Our business cycle management actions are taking effect and the adjusted operating margin* decline year over year was substantially less than in recent quarters, and it improved sequentially. LVP has continued to slide however, and we now assume 6-7% global LVP decline for 2019, which moderates our outlook to around 1% for organic sales growth and to around 9% for adjusted operating margin. Although I am not pleased with this profit level, we achieved it in the context of LVP expectations declining by 7-8pp in just 9 months. |
| ||

Q3 Report—2019 |
Our organic sales growth and adjusted operating margin outlook indications for 2019 reflect the continuing high level of uncertainty in the automotive markets and are based on the assumption that global light vehicle production declines by 6-7% in full year 2019 compared to full year 2018.
| Full Year Indication |
| Full Year Indication |
Net sales growth | Around (2)% | Tax rate2) | Around 28% |
Organic sales growth | Around 1% | Operating cash flow excl. EC antitrust payment2) | $700-800 million |
Adjusted operating margin1) | Around 9% | Capital expenditure, net % of sales | Around 2018 level |
R,D&E, net % of sales | Around 2018 level | Leverage ratio at year end | Around 1.7x |
1) Excluding costs for capacity alignments, antitrust related matters and separation of our business segments. 2) Excluding unusual items.
The forward-looking non-U.S. GAAP financial measures above are provided on a non-U.S. GAAP basis. Autoliv has not provided a U.S. GAAP reconciliation of these measures because items that impact these measures, such as costs related to capacity alignments and antitrust matters, cannot be reasonably predicted or determined. As a result, such reconciliation is not available without unreasonable efforts and Autoliv is unable to determine the probable significance of the unavailable information.
Conference call and webcast
An earnings conference call will be held at 2:00 p.m. CET today, October 25, 2019. Information regarding how to participate is available on www.autoliv.com. The presentation slides for the conference call will be available on our website shortly after the publication of this financial report.
3
Q3 Report—2019 |
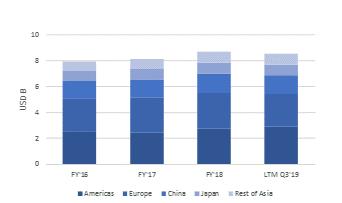
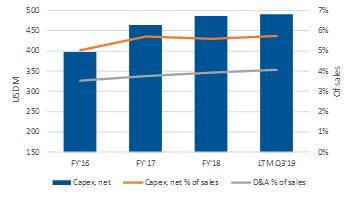
Sales Development by region | Capex and D&A |
|
|
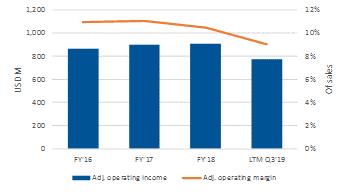
Adj. operating income and margin* | Operating Cash Flow* |
|
|
Return on Capital Employed | Cash Conversion* |
|
|
Key definitions ---------------------------------------------------------------------------------------------------------------------
Capex: Capital Expenditures, net.
D&A: Depreciation and Amortization.
Adj. operating income*: Operating income adjusted for capacity alignments, antitrust related matters and separation of our business segments. Capacity alignments include non-recurring costs related to our structural efficiency and business cycle management programs.
Operating cash flow*: Management estimate for Continuing Operations derived from cash flow including Discontinued Operations. Adjusted for EC antitrust payment in 2019.
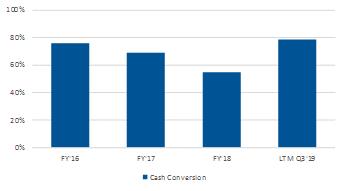
Cash conversion*: Free cash flow in relation to net income adjusted for EC antitrust accrual in 2018 and payment in 2019. Free cash flow defined as operating cash flow less capital expenditure, net.
4
Q3 Report—2019 |
Consolidated sales development
Third quarter 2019
Consolidated sales |
| Third quarter | Reported | Currency | Organic | |
(Dollars in millions) |
| 2019 | 2018 | |||
Airbag Products and Other2) |
| $1,349.3 | $1,357.4 | (0.6)% | (1.2)% | 0.6% |
Seatbelt Products2) |
| $678.4 | $675.6 | 0.4% | (1.9)% | 2.3% |
Total |
| $2,027.7 | $2,033.0 | (0.3)% | (1.5)% | 1.2% |
|
|
|
|
|
|
|
Asia |
| $777.7 | $749.1 | 3.8% | (0.4)% | 4.2% |
Whereof: | China | $381.7 | $351.9 | 8.5% | (2.7)% | 11.2% |
| Japan | $202.4 | $196.3 | 3.1% | 4.2% | (1.1)% |
| RoA | $193.6 | $200.9 | (3.6)% | (0.7)% | (2.9)% |
Americas |
| $713.1 | $684.8 | 4.1% | (0.7)% | 4.8% |
Europe |
| $536.9 | $599.1 | (10.4)% | (3.7)% | (6.7)% |
Total |
| $2,027.7 | $2,033.0 | (0.3)% | (1.5)% | 1.2% |
1) Effects from currency translations. 2) Including Corporate and other sales. | ||||||
First nine months 2019
Consolidated sales |
| First 9 months | Reported | Currency | Organic | |
(Dollars in millions) |
| 2019 | 2018 | |||
Airbag Products and Other2) |
| $4,232.7 | $4,234.9 | (0.1)% | (3.2)% | 3.1% |
Seatbelt Products2) |
| $2,123.7 | $2,250.5 | (5.6)% | (4.2)% | (1.4)% |
Total |
| $6,356.4 | $6,485.4 | (2.0)% | (3.5)% | 1.5% |
|
|
|
|
|
|
|
Asia |
| $2,286.1 | $2,333.5 | (2.0)% | (3.2)% | 1.2% |
Whereof: | China | $1,061.7 | $1,103.5 | (3.8)% | (5.1)% | 1.3% |
| Japan | $601.6 | $606.4 | (0.8)% | 0.4% | (1.2)% |
| RoA | $622.8 | $623.6 | (0.1)% | (3.3)% | 3.2% |
Americas |
| $2,214.2 | $2,034.3 | 8.8% | (0.8)% | 9.6% |
Europe |
| $1,856.1 | $2,117.6 | (12.4)% | (6.4)% | (6.0)% |
Total |
| $6,356.4 | $6,485.4 | (2.0)% | (3.5)% | 1.5% |
1) Effects from currency translations. 2) Including Corporate and other sales. | ||||||
Third quarter 2019 development
Sales by product- Airbags
Airbag sales organic growth* was mainly driven by strong performance for driver and knee airbags in North America, steering wheels in Americas and passenger airbags in China. Offsetting declines came mainly from most types of airbags in Europe and from inflators in North America and Japan.
We grew globally by 1.2% organically*, which is 4.6pp more than light vehicle production (according to IHS). The largest contributor to overall growth was China, followed by North America and South America. The largest organic sales decline was in Europe, followed by India, South Korea and Japan. Our organic sales growth
outperformed LVP by around 17pp in China and by 4.5pp in North America while we underperformed LVP by 7.5pp in Europe and by around 8pp in Japan. In South America we grew organically around 35pp more than LVP, while we outgrew LVP by around 8pp in Rest of Asia.
5
Q3 Report—2019 |
Q3 Organic growth* | Americas | Europe | China | Japan | Rest of Asia | Global |
Autoliv | 4.8% | (6.7)% | 11.2% | (1.1)% | (2.9)% | 1.2% |
Main growth drivers | Honda, GM, Nissan, BMW, Tesla | VW, Renault | Honda, VW, GM | Mazda, Honda, Subaru | Mitsubishi, Renault, Nissan | Honda, VW, GM |
Main decline drivers | Daimler, Hyundai/Kia | Daimler, JLR, BMW, Toyota | Geely, Ford, PSA | Mitsubishi, Toyota, Inflators | Hyundai/Kia, Isuzu, Tata, Toyota | Daimler, Hyundai/ Kia, Toyota |
Light vehicle production development
Change vs same period last year
| Americas | Europe | China | Japan | Rest of Asia | Global |
Third quarter 2019 |
|
|
|
|
|
|
IHS LVP (Oct 2019) | (1.6)% | 0.8% | (5.6)% | 6.8% | (10.5)% | (3.4)% |
IHS LVP (Jul 2019) | 2.5% | 2.7% | (4.5)% | 11.1% | (3.2)% | (0.1)% |
First nine months 2019 | ||||||
IHS LVP (Oct 2019) | (2.8)% | (3.8)% | (12.1)% | 4.0% | (5.3)% | (6.0)% |
6
Q3 Report—2019 |
Key launches in the third quarter 2019
Below are some of the key models which have been launched in the third quarter 2019.
Subaru Legacy | Land Rover Defender | BMW 1-Series |
|
|
|
|
|
|
Peugeot 208 | Chevrolet Trailblazer | Cadillac CT5 |
|
|
|
|
|
|
Ford Puma | BYD Song Pro | Subaru Outback |
|
|
|


| Driver and/or Passenger airbags |
| Seatbelts |
| Side airbags |
| Knee airbag |
|
|
|
| ||||
|
|
|
|
|
|
|
|
| Head/Inflatable Curtain airbags |
| Pyrotechnical Safety Switch |
| Pedestrian Airbag | ||
|
|
|
|
| |||
|
|
|
|
|
|
|
|
| Steering Wheel |
|
|
|
|
|
|
|
|
|
|
|
|
| |
|
|
|
|
|
|
|
|


7
Q3 Report—2019 |
Selected income statement items
Condensed income statement | Third quarter | First 9 months | ||||
(Dollars in millions, except per share data) | 2019 | 2018 | Change | 2019 | 2018 | Change |
Net sales | $2,027.7 | $2,033.0 | (0.3)% | $6,356.4 | $6,485.4 | (2.0)% |
Cost of sales | $(1,648.6) | $(1,646.9) | 0.1% | $(5,198.8) | $(5,199.3) | (0.0)% |
Gross profit | $379.1 | $386.1 | (1.8)% | $1,157.6 | $1,286.1 | (10.0)% |
S,G&A | $(97.7) | $(90.0) | 8.6% | $(300.2) | $(290.9) | 3.2% |
R,D&E, net | $(99.1) | $(101.9) | (2.7)% | $(323.5) | $(327.9) | (1.3)% |
Amortization of intangibles | $(2.9) | $(2.8) | 3.6% | $(8.6) | $(8.5) | 1.2% |
Other (expense) income, net | $(25.6) | $1.1 | n/a | $(28.8) | $6.2 | 564.5% |
Operating income | $153.8 | $192.5 | (20.1)% | $496.5 | $665.0 | (25.3)% |
Adjusted operating income1) | $182.5 | $193.6 | (5.7)% | $532.1 | $668.3 | (20.4)% |
Financial and non-operating items, net | $(19.4) | $(21.2) | (8.5)% | $(57.7) | $(54.7) | 5.5% |
Income before taxes | $134.4 | $171.3 | (21.5)% | $438.8 | $610.3 | (28.1)% |
Tax rate | 36.0% | 31.1% | 4.9pp | 30.1% | 23.0% | 7.1pp |
Net income | $86.0 | $118.0 | (27.1)% | $306.9 | $470.3 | (34.7)% |
Earnings per share2, 3) | $0.98 | $1.34 | (26.9)% | $3.50 | $5.37 | (34.8)% |
Adjusted earnings per share1, 2, 3) | $1.30 | $1.35 | (3.7)% | $3.87 | $5.40 | (28.3)% |
|
|
|
|
|
|
|
Gross margin | 18.7% | 19.0% | (0.3)pp | 18.2% | 19.8% | (1.6)pp |
S,G&A % of sales | (4.8)% | (4.4)% | 0.4pp | (4.7)% | (4.5)% | 0.2pp |
R,D&E, net % of sales | (4.9)% | (5.0)% | (0.1)pp | (5.1)% | (5.1)% | 0.0pp |
Operating margin | 7.6% | 9.5% | (1.9)pp | 7.8% | 10.3% | (2.5)pp |
Adjusted operating margin1) | 9.0% | 9.5% | (0.5)pp | 8.4% | 10.3% | (1.9)pp |
1) Non-U.S. GAAP measure, excluding costs for capacity alignment, antitrust related matters and separation of our business segments. See reconciliation table. 2) Assuming dilution and net of treasury shares. 3) Participating share awards with right to receive dividend equivalents are (under the two-class method) excluded from the EPS calculation. | ||||||
Third quarter 2019 development
Gross profit declined by $7 million and the gross margin declined by 0.3pp compared to the same quarter 2018. The gross margin was adversely impacted by the decline in global light vehicle production, resulting in a lower utilization of our production assets, and raw material headwinds. This was offset to some degree by organic growth* from launches of new products, which have a lower margin contribution in the early phase of the ramp-up.
S,G&A increased by $8 million, mainly driven by bonus accrual reversals prior year and a mix of minor expense items incurred in the current quarter.
R,D&E, net was close to unchanged in USD terms as well as in percent of sales.
Other (expense) income, net of negative $26 million was $27 million lower than in the prior year, mainly due to accruals relating to future reductions of our indirect workforce.
Operating income decreased by $39 million, as a consequence of the declines in other (expense) income, net and gross profit.
Adjusted operating income* decreased by $11 million, mainly due to the lower gross profit.
Financial and non-operating items, net was close to unchanged at $19 million compared to the prior year.
Income before taxes decreased by $37 million, mainly as a consequence of the lower operating income.
Effective tax rate of 36.0% was 4.9 pp higher than last year primarily due to costs accrued in the quarter related to the indirect workforce reduction program that are not fully tax deductible.
Earnings per share, diluted decreased by 36 cents where the main drivers were 31 cents from higher costs for capacity alignment and 8 cents from lower adjusted operating income.
8
Q3 Report—2019 |
Selected Balance Sheet and Cash Flow items
Selected Balance Sheet items | Third quarter | ||
(Dollars in millions) | 2019 | 2018 | Change |
Operating working capital | $619.5 | $759.4 | (18.4)% |
Operating working capital % of sales1) | 7.2% | 8.8% | (1.6)pp |
Cash & cash equivalents | $334.4 | $533.7 | (37.3)% |
Gross Debt2) | $2,105.0 | $2,250.5 | (6.5)% |
Net Debt3) | $1,781.3 | $1,724.4 | 3.3% |
Total equity | $1,999.3 | $2,053.4 | (2.6)% |
Leverage ratio | 1.8 | 1.5 | 20.0% |
1) Latest 12 months of net sales. 2) Short- and long-term interest-bearing debt. 3) Short- and long-term debt adjusted for cash and cash equivalents and debt-related derivatives. Non-U.S. GAAP measure. See reconciliation table. | |||
Selected Cash Flow items | Third quarter | First 9 months | ||||
(Dollars in millions) | 2019 | 2018 | Change | 2019 | 20181) | Change |
Net income | $86.0 | $118.0 | (27.1)% | $306.9 | $470.3 | (34.7)% |
Changes in operating assets and liabilities2) | $16.4 | $28.0 | (41.4)% | $(37.8) | $(220.2) | (82.8)% |
Depreciation and amortization | $84.1 | $85.1 | (1.2)% | $260.1 | $253.1 | 2.8% |
Other, net3) | $8.8 | $7.1 | 23.9% | $(200.8) | $17.0 | n/a |
Operating cash flow | $195.3 | $238.2 | (18.0)% | $328.4 | $520.2 | (36.9)% |
Capital expenditure, net | $(122.3) | $(117.4) | 4.2% | $(358.1) | $(352.7) | 1.5% |
Free cash flow4) | $73.0 | $120.8 | (39.6)% | $(29.7) | $167.5 | (117.7)% |
Cash conversion5) | 84.9% | 102.4% | (17.5)pp | (9.7)% | 35.6% | (45.3)pp |
Dividends paid | $(54.2) | $(54.1) | 0.2% | $(162.7) | $(160.7) | 1.2% |
1) Management estimate for Continuing Operations derived from cash flow including Discontinued Operations. 2) 2018 including separation costs. 3) First 9 months 2019 including EC antitrust payment. 4) Operating cash flow less Capital expenditure, net. Non-U.S. GAAP measure. See reconciliation table. 5) Free cash flow relative to Net income. Non-U.S. GAAP measure, see reconciliation table. | ||||||
Third quarter 2019 development
Operating working capital* was 7.2% of sales compared to 8.8% of sales a year earlier, where the change mainly was a consequence of a new accounting standard for operating leases and accruals related to future reductions of our indirect workforce. The Company targets that operating working capital in relation to the last 12-month sales should not exceed 10%.
Operating cash flow was $195 million compared to $238 million a year earlier, where the difference of $43 million primarily was due to the $32 million lower net income.
Capital expenditure, net of $122 million was relatively unchanged, reflecting continued high investment requirements in support of the high level of new product launches.
Free cash flow, net* amounted to $73 million compared to $121 million a year earlier, where the decrease of $48 million was mainly due to the lower operating cash flow.
Cash conversion* defined as free cash flow in relation to net income, amounted to 85% compared to 102% in the previous year, as free cash flow declined more than net income.
Net debt* amounted to $1,781 million as of September 30, 2019, which was close to unchanged compared to a year earlier.
Leverage ratio*. Autoliv’s policy is to maintain a leverage ratio commensurate with a strong investment grade credit rating. The Company measures its leverage ratio as net debt* adjusted for pension liabilities in relation to EBITDA. The long-term target is to maintain a leverage ratio of around 1x within a range of 0.5x to 1.5x. As of September 30, 2019, the Company had a leverage ratio of 1.8x, compared to 1.8x at June 30, 2019 and 1.5x at September 30, 2018.
Total equity decreased in the quarter by $38 million compared to June 30, 2019 mainly due to $54 million from dividends and $71 million in currency translation effects partly offset by $86 million in net income.
9
Q3 Report—2019 |
| September 30, 2019 | June 30, 2019 | September 30, 2018 |
Headcount | 64,868 | 65,670 | 66,479 |
Whereof: Direct workers in manufacturing | 71% | 71% | 71% |
Best cost countries | 80% | 80% | 80% |
Temporary personnel | 9% | 10% | 14% |
Compared to June 30, 2019, total headcount (permanent employees and temporary personnel) decreased by 802. The decrease in the quarter was driven by a reduction of both direct and indirect workforce. Compared to a year ago, headcount decreased by 1,611, with close to 80%
of the reduction being in the direct workforce. The headcount reductions reflect the balancing of cost reduction efforts to offset the decline in light vehicle markets and the support of the growth in organic sales* driven by new vehicle program launches.
10
Q3 Report—2019 |
| Third quarter | First 9 months | Latest 12 months | Full Year | ||
| 2019 | 2018 | 2019 | 2018 | 2018 | |
Income statement |
|
|
|
|
|
|
Earnings per share, basic1) | $0.98 | $1.35 | $3.51 | $5.38 | $2.44 | $4.32 |
Earnings per share, diluted1, 2) | $0.98 | $1.34 | $3.50 | $5.37 | $2.44 | $4.31 |
Gross margin, %3) | 18.7 | 19.0 | 18.2 | 19.8 | 18.5 | 19.7 |
Adjusted operating margin, %4) | 9.0 | 9.5 | 8.4 | 10.3 | 9.0 | 10.5 |
R,D&E net in relation to sales, % | (4.9) | (5.0) | (5.1) | (5.1) | (4.8) | (4.8) |
Balance Sheet |
|
|
|
|
|
|
Operating working capital in relation to sales, %5) | 7.2 | 8.8 | 7.2 | 8.8 | 7.2 | 7.9 |
Capital employed, $ in millions6) | 3,781 | 3,778 | 3,781 | 3,778 | 3,781 | 3,516 |
Return on total equity, %7) | 17.1 | 23.2 | 20.7 | 20.0 | 10.8 | 13.0 |
Return on capital employed, %8) | 16.2 | 20.4 | 18.0 | 20.9 | 14.0 | 16.8 |
Cash dividend paid per share | $0.62 | $0.62 | $1.86 | $1.84 | $2.48 | $2.46 |
Net debt, $ in millions9) | 1,781 | 1,724 | 1,781 | 1,724 | 1,781 | 1,619 |
Leverage ratio10) | 1.8 | 1.5 | 1.8 | 1.5 | 1.8 | 1.5 |
Days receivables outstanding11) | 75 | 80 | 72 | 76 | 71 | 71 |
Days inventory outstanding12) | 37 | 38 | 35 | 35 | 35 | 35 |
Cash flow |
|
|
|
|
|
|
Operating Cash flow, $ in millions13) | 195.3 | 238.2 | 328.4 | 301.2 | 617.8 | 590.6 |
Depreciation and amortization, $ in millions 13) | 84.1 | 85.1 | 260.1 | 308.4 | 348.8 | 397.1 |
Capital expenditures, net in relation to sales, %13) | (6.0) | (5.8) | (5.6) | (6.5) | (5.7) | (6.4) |
Free Cash flow, $ in millions 13, 14) | 73.0 | 120.8 | (29.7) | (120.2) | 126.3 | 35.8 |
Cash conversion, %13, 15) | 84.9 | 102.4 | (9.7) | (43.8) | 58.4 | 19.5 |
Direct shareholder return, $ in millions 16) | (54.2) | (54.1) | (162.7) | (160.7) | (216.3) | (214.3) |
Other |
|
|
|
|
|
|
No. of shares at period-end in millions17) | 87.2 | 87.1 | 87.2 | 87.1 | 87.2 | 87.1 |
Average no. of shares in millions2) | 87.3 | 87.4 | 87.4 | 87.3 | 87.4 | 87.3 |
1) Participating share awards with right to receive dividend equivalents are (under the two-class method) excluded from the EPS calculation. 2) Assuming dilution and net of treasury shares. 3) Gross profit relative to sales. 4) Excluding costs for capacity alignment, antitrust related matters and separation of our business segments. Non-U.S. GAAP measure, see reconciliation table. 5) Latest 12 months of net sales. Full year 2018 excluding antitrust provision accrual. 6) Total equity and net debt. 7) Net income relative to average total equity. 8) Operating income and income from equity method investments, relative to average capital employed. 9) Non-U.S. GAAP measure, see reconciliation table. 10) Net debt adjusted for pension liabilities in relation to EBITDA. Non-U.S. GAAP measure, see reconciliation table. 11) Outstanding receivables relative to average daily sales. 12) Outstanding inventory relative to average daily sales. 13) Including Discontinued Operations, which had a significant impact through YTD 2018. 14) Operating cash flow less Capital expenditures, net. Non-U.S. GAAP measure, see reconciliation table. 15) Free cash flow relative to Net income. Non-U.S. GAAP measure, see reconciliation table. 16) Dividends paid and Shares repurchased. 17) Excluding dilution and net of treasury shares. | ||||||
11
Q3 Report—2019 |
| Visiting Professor at University of Virginia School of Medicine. John Bolte IV is Professor at The Ohio State University and Director of the Injury Biomechanics Research Center. |
| • | On September 23, 2019, Autoliv announced that its interim CFO, Christian Hanke, notified the Company of his intent to resign as the Interim Chief Financial Officer and Vice President Corporate Control to pursue another opportunity outside of Autoliv. Mr. Hanke’s resignation will be effective no later than March 18, 2020. Until the time Mr. Hanke’s resignation becomes effective, he will continue to serve as the Interim Chief Financial Officer and Vice President Corporate Control. The Company expects that Mr. Hanke will remain with the Company through the filing of the Company’s 2019 annual report. The Company is continuing its search for a permanent replacement for the Chief Financial Officer position. |
| • | On September 27, 2019, S&P Global Ratings announced its downgrade of Autoliv Inc., from A- to BBB+ with outlook negative. |
On August 19, 2019, Autoliv declared a quarterly dividend to shareholders of 62 cents per share for the fourth quarter 2019, with the following payment schedule:
Ex-date (common stock) | November 19, 2019 |
Ex-date (SDRs) | November 19, 2019 |
Record Date | November 20, 2019 |
Payment Date | December 5, 2019 |
Next Report
Autoliv intends to publish the quarterly earnings report for the fourth quarter of 2019 on Tuesday, January 28, 2020.
Inquiries: Investors and Analysts
Anders Trapp
Vice President Investor Relations
Tel +46 (0)8 58 72 06 71
Henrik Kaar
Director Investor Relations
Tel +46 (0)8 58 72 06 14
Stina Thorman
Vice President Communications
Tel +46 (0)8 58 72 06 50
This information is information that Autoliv, Inc. is obliged to make public pursuant to the EU Market Abuse Regulation. The information was submitted for publication, through the agency of the VP of Investor Relations set out above, at 12.00 CET on October 25, 2019.
Footnotes
*Non-U.S. GAAP measure, see enclosed reconciliation tables.
Definitions and SEC Filings
Please refer to www.autoliv.com or to our Annual Report for definitions of terms used in this report. Autoliv’s annual report to stockholders, annual report on Form 10‑K, quarterly reports on Form 10‑Q, proxy statements, management certifications, press releases, current reports on Form 8-K and other documents filed with the SEC can be obtained free of charge from Autoliv at the Company’s address. These documents are also available at the SEC’s website www.sec.gov and at Autoliv’s corporate website www.autoliv.com.
12
Q3 Report—2019 |
This report contains statements that are not historical facts but rather forward-looking statements within the meaning of the Private Securities Litigation Reform Act of 1995. Such forward-looking statements include those that address activities, events or developments that Autoliv, Inc. or its management believes or anticipates may occur in the future. All forward-looking statements are based upon our current expectations, various assumptions and/or data available from third parties. Our expectations and assumptions are expressed in good faith and we believe there is a reasonable basis for them. However, there can be no assurance that such forward-looking statements will materialize or prove to be correct as forward-looking statements are inherently subject to known and unknown risks, uncertainties and other factors which may cause actual future results, performance or achievements to differ materially from the future results, performance or achievements expressed in or implied by such forward-looking statements. In some cases, you can identify these statements by forward-looking words such as “estimates”, “expects”, “anticipates”, “projects”, “plans”, “intends”, “believes”, “may”, “likely”, “might”, “would”, “should”, “could”, or the negative of these terms and other comparable terminology, although not all forward-looking statements contain such words. Because these forward-looking statements involve risks and uncertainties, the outcome could differ materially from those set out in the forward-looking statements for a variety of reasons, including without limitation, changes in light vehicle production; fluctuation in vehicle production schedules for which the Company is a supplier, changes in general industry and market conditions or regional growth or decline; changes in and the successful execution of our capacity alignment, restructuring and cost reduction initiatives and the market reaction thereto; loss of business from increased competition; higher raw material, fuel and energy costs; changes in consumer and customer preferences for end products; customer losses; changes in regulatory conditions; customer bankruptcies, consolidations,
or restructuring; divestiture of customer brands; unfavorable fluctuations in currencies or interest rates among the various jurisdictions in which we operate; component shortages; market acceptance of our new products; costs or difficulties related to the integration of any new or acquired businesses and technologies; continued uncertainty in pricing negotiations with customers; successful integration of acquisitions and operations of joint ventures; successful implementation of strategic partnerships and collaborations; our ability to be awarded new business; product liability, warranty and recall claims and investigations and other litigation and customer reactions thereto; (including the resolution of the Toyota recall); higher expenses for our pension and other postretirement benefits, including higher funding needs for our pension plans; work stoppages or other labor issues; possible adverse results of pending or future litigation or infringement claims; our ability to protect our intellectual property rights; negative impacts of antitrust investigations or other governmental investigations and associated litigation relating to the conduct of our business; tax assessments by governmental authorities and changes in our effective tax rate; dependence on key personnel; legislative or regulatory changes impacting or limiting our business; political conditions; dependence on and relationships with customers and suppliers; and other risks and uncertainties identified under the headings “Risk Factors” and “Management’s Discussion and Analysis of Financial Condition and Results of Operations” in our Annual Reports and Quarterly Reports on Forms 10-K and 10-Q and any amendments thereto. For any forward-looking statements contained in this or any other document, we claim the protection of the safe harbor for forward-looking statements contained in the Private Securities Litigation Reform Act of 1995, and we assume no obligation to update publicly or revise any forward-looking statements in light of new information or future events, except as required by law.
13
Q3 Report—2019 |
Consolidated Statements of Net Income
(Dollars in millions, except per share data) | Third quarter | First 9 months | Latest 12 months | Full Year | ||
(Unaudited) | 2019 | 2018 | 2019 | 2018 | 2018 | |
Airbag and Other products1) | $1,349.3 | $1,357.4 | $4,232.7 | $4,234.9 | $5,696.4 | $5,698.6 |
Seatbelt products1) | 678.4 | 675.6 | 2,123.7 | 2,250.5 | 2,852.8 | 2,979.6 |
Total net sales | $2,027.7 | $2,033.0 | $6,356.4 | $6,485.4 | $8,549.2 | $8,678.2 |
|
|
|
|
|
|
|
Cost of sales | (1,648.6) | (1,646.9) | (5,198.8) | (5,199.3) | (6,966.4) | (6,966.9) |
Gross profit | $379.1 | $386.1 | $1,157.6 | $1,286.1 | $1,582.8 | $1,711.3 |
|
|
|
|
|
|
|
Selling, general & administrative expenses | (97.7) | (90.0) | (300.2) | (290.9) | (399.6) | (390.3) |
Research, development & engineering expenses, net | (99.1) | (101.9) | (323.5) | (327.9) | (408.2) | (412.6) |
Amortization of intangibles | (2.9) | (2.8) | (8.6) | (8.5) | (11.4) | (11.3) |
Other (expense) income, net | (25.6) | 1.1 | (28.8) | 6.2 | (246.1) | (211.1) |
Operating income | $153.8 | $192.5 | $496.5 | $665.0 | $517.5 | $686.0 |
|
|
|
|
|
|
|
Income from equity method investments | 0.4 | 0.2 | 1.6 | 2.8 | 2.4 | 3.6 |
Interest income | 0.7 | 1.3 | 2.7 | 4.1 | 5.5 | 6.9 |
Interest expense | (17.1) | (18.9) | (52.6) | (46.2) | (72.5) | (66.1) |
Other non-operating items, net | (3.4) | (3.8) | (9.4) | (15.4) | (12.0) | (18.0) |
Income from Continuing Operations before income taxes | $134.4 | $171.3 | $438.8 | $610.3 | $440.9 | $612.4 |
|
|
|
|
|
|
|
Income taxes | (48.4) | (53.3) | (131.9) | (140.0) | (226.8) | (234.9) |
Net income from Continuing Operations | $86.0 | $118.0 | $306.9 | $470.3 | $214.1 | $377.5 |
|
|
|
|
|
|
|
Loss from Discontinued Operations, net of income taxes | – | – | – | (195.8) | 2.0 | (193.8) |
Net income | $86.0 | $118.0 | $306.9 | $274.5 | $216.1 | $183.7 |
|
|
|
|
|
|
|
Less; Net income from Continuing Operations attributable to non-controlling interest | 0.6 | 0.5 | 1.0 | 1.4 | 1.2 | 1.6 |
Less; Net loss from Discontinued Operations attributable to non-controlling interest | – | – | – | (8.3) | – | (8.3) |
Net income attributable to controlling interest | $85.4 | $117.5 | $305.9 | $281.4 | $214.9 | $190.4 |
|
|
|
|
|
|
|
Amounts attributable to controlling interest: |
|
|
|
|
|
|
Net Income from Continuing Operations | $85.4 | $117.5 | $305.9 | $468.9 | $212.9 | $375.9 |
Net Loss from Discontinued Operations, net of income taxes | – | – | – | (187.5) | 2.0 | (185.5) |
Net income attributable to controlling interest | $85.4 | $117.5 | $305.9 | $281.4 | $214.9 | $190.4 |
|
|
|
|
|
|
|
Earnings per share Continuing Operations2, 3) | $0.98 | $1.34 | $3.50 | $5.37 | $2.44 | $4.31 |
Earnings per share Discontinued Operations2, 3) | $ - | $ - | $ - | $(2.15) | $0.02 | $(2.13) |
Earnings per share2, 3) | $0.98 | $1.34 | $3.50 | $3.22 | $2.46 | $2.18 |
1) Including Corporate and other sales. 2) Assuming dilution and net of treasury shares. 3) Participating share awards with right to receive dividend equivalents are (under the two-class method) excluded from EPS calculation. | ||||||
14
Q3 Report—2019 |
| Sep 30 | Jun 30 | Mar 31 | Dec 31 | Sep 30 |
(Dollars in millions, unaudited) | 2019 | 2019 | 2019 | 2018 | 2018 |
Assets |
|
|
|
|
|
Cash & cash equivalents | $334.4 | $406.4 | $436.6 | $615.8 | $533.7 |
Receivables, net | 1,656.2 | 1,695.5 | 1,749.6 | 1,667.1 | 1,784.5 |
Inventories, net | 731.8 | 736.1 | 741.1 | 757.9 | 758.7 |
Other current assets | 186.4 | 214.2 | 183.8 | 244.6 | 271.2 |
Total current assets | $2,908.8 | $3,052.2 | $3,111.1 | $3,285.4 | $3,348.1 |
|
|
|
|
|
|
Property, plant & equipment, net | 1,747.9 | 1,765.0 | 1,710.9 | 1,690.1 | 1,654.8 |
Investments and other non-current assets | 371.1 | 386.7 | 384.3 | 323.5 | 331.3 |
Right-of-use assets - operating leases | 154.1 | 165.0 | 147.3 | – | – |
Goodwill assets | 1,383.3 | 1,388.8 | 1,388.3 | 1,389.9 | 1,391.0 |
Intangible assets, net | 24.3 | 27.8 | 30.7 | 32.7 | 35.3 |
Total assets | $6,589.5 | $6,785.5 | $6,772.6 | $6,721.6 | $6,760.5 |
|
|
|
|
|
|
Liabilities and equity |
|
|
|
|
|
Short-term debt | $289.9 | $366.8 | $437.6 | $620.7 | $573.0 |
Accounts payable | 900.2 | 956.6 | 981.7 | 1,029.0 | 992.4 |
Other current liabilities | 1,077.0 | 1,055.4 | 1,282.2 | 1,215.8 | 1,118.4 |
Operating lease liabilities - current | 37.7 | 39.6 | 37.0 | – | – |
Total current liabilities | $2,304.8 | $2,418.4 | $2,738.5 | $2,865.5 | $2,683.8 |
|
|
|
|
|
|
Long-term debt | 1,815.1 | 1,850.2 | 1,598.1 | 1,609.0 | 1,677.5 |
Pension liability | 199.9 | 202.8 | 200.4 | 198.2 | 204.3 |
Other non-current liabilities | 153.4 | 150.5 | 151.1 | 152.1 | 141.5 |
Operating lease liabilities - non-current | 117.0 | 125.9 | 110.5 | – | – |
Total non-current liabilities | $2,285.4 | $2,329.4 | $2,060.1 | $1,959.3 | $2,023.3 |
|
|
|
|
|
|
Total parent shareholders’ equity | 1,986.7 | 2,024.1 | 1,960.5 | 1,883.7 | 2,040.4 |
Non-controlling interest | 12.6 | 13.6 | 13.5 | 13.1 | 13.0 |
Total equity | $1,999.3 | $2,037.7 | $1,974.0 | $1,896.8 | $2,053.4 |
|
|
|
|
|
|
Total liabilities and equity | $6,589.5 | $6,785.5 | $6,772.6 | $6,721.6 | $6,760.5 |
15
Q3 Report—2019 |
Consolidated Statements of Cash Flow
| Third quarter | First 9 months | Latest 12 months | Full Year | ||
(Dollars in millions, unaudited) | 2019 | 2018 | 2019 | 20181) | 20181) | |
Net income Continuing Operations | $86.0 | $118.0 | $306.9 | $470.3 | $214.1 | $377.5 |
Net loss Discontinued Operations | – | – | – | (195.8) | 2.0 | (193.8) |
Depreciation and amortization | 84.1 | 85.1 | 260.1 | 308.4 | 348.8 | 397.1 |
Legal provision2) | – | – | – | – | – | 210.0 |
Other, net3) | 8.8 | 7.1 | (200.8) | 19.7 | 18.6 | 29.1 |
Changes in operating assets and liabilities4) | 16.4 | 28.0 | (37.8) | (301.4) | 34.3 | (229.3) |
Net cash provided by operating activities | $195.3 | $238.2 | $328.4 | $301.2 | $617.8 | $590.6 |
|
|
|
|
|
|
|
Capital expenditures, net | (122.3) | (117.4) | (358.1) | (421.4) | (491.5) | (554.8) |
Acquisitions of businesses and other, net | – | – | – | (72.9) | - | (72.9) |
Net cash used in investing activities | $(122.3) | $(117.4) | $(358.1) | $(494.3) | $(491.5) | $(627.7) |
|
|
|
|
|
|
|
Net cash before financing5) | $73.0 | $120.8 | $(29.7) | $(193.1) | $126.3 | $(37.1) |
|
|
|
|
|
|
|
Net (decrease) increase in short-term debt | (58.6) | (35.1) | (309.4) | 374.9 | (328.9) | 355.4 |
Issuance of long-term debt6) | (1.7) | – | 243.5 | 582.2 | 243.5 | 582.2 |
Debt issuance costs | – | – | (0.3) | (2.6) | (0.3) | (2.6) |
Dividends paid | (54.2) | (54.1) | (162.7) | (160.7) | (216.3) | (214.3) |
Common stock options exercised | 0.1 | 0.6 | 0.3 | 8.2 | 0.3 | 8.2 |
Dividend paid to non-controlling interests | (1.1) | – | (1.1) | (2.0) | (1.2) | (2.1) |
Capital contribution to Veoneer | – | 7.9 | – | (971.8) | – | (971.8) |
Net cash used in financing activities | $(115.5) | $(80.7) | $(229.7) | $(171.8) | $(302.9) | $(245.0) |
|
|
|
|
|
|
|
Effect of exchange rate changes on cash | (29.5) | (13.9) | (22.0) | (60.9) | (22.7) | (61.6) |
(Decrease) increase in cash and cash equivalents | $(72.0) | $26.2 | $(281.4) | $(425.8) | $(199.3) | $(343.7) |
Cash and cash equivalents at period-start | 406.4 | 507.5 | 615.8 | 959.5 | 533.7 | 959.5 |
Cash and cash equivalents at period-end | $334.4 | $533.7 | $334.4 | $533.7 | $334.4 | $615.8 |
1) Including Discontinued Operations. 2) EC antitrust non-cash provision. 3) First nine months 2019 including EC antitrust payment. 4) 2018 including separation costs. 5) Non-U.S. GAAP measure comprised of "Net cash provided by operating activities" and "Net cash used in investing activities". See reconciliation table 6) Reclassification of long term debt. | ||||||
16
Q3 Report—2019 |
RECONCILIATION OF U.S. GAAP TO NON-U.S. GAAP MEASURES
In this report we sometimes refer to non-U.S. GAAP measures that we and securities analysts use in measuring Autoliv's performance. We believe that these measures assist investors and management in analyzing trends in the Company's business for the reasons given below. Investors should not consider these non-U.S. GAAP measures as substitutes, but rather as additions, to financial reporting measures prepared in accordance with U.S. GAAP. It should be noted that these measures, as defined, may not be comparable to similarly titled measures used by other companies.
Components in Sales Increase/Decrease
Since the Company generates approximately 75% of sales in currencies other than in the reporting currency (i.e. U.S. dollars) and currency rates have been rather volatile, we analyze the Company's sales trends and performance as changes in organic sales growth. This presents the increase or decrease in the overall U.S. dollar net sales on a comparable basis, allowing separate discussions of the impact of acquisitions/divestitures and exchange rates. The tables on page 5 present changes in organic sales growth as reconciled to the change in the total U.S. GAAP net sales.
Operating Working Capital
Due to the need to optimize cash generation to create value for shareholders, management focuses on operationally derived working capital as defined in the table below. The reconciling items used to derive this measure are, by contrast, managed as part of our overall management of cash and debt, but they are not part of the responsibilities of day-to-day operations' management.
| Sep 30 | Jun 30 | Mar 31 | Dec 31 | Sep 30 |
(Dollars in millions) | 2019 | 2019 | 2019 | 2018 | 2018 |
Total current assets | $2,908.8 | $3,052.2 | $3,111.1 | $3,285.4 | $3,348.1 |
Total current liabilities1) | (2,304.8) | (2,418.4) | (2,535.3) | (2,655.5) | (2,683.8) |
Working capital | $604.0 | $633.8 | $575.8 | $629.9 | $664.3 |
Cash and cash equivalents | (334.4) | (406.4) | (436.6) | (615.8) | (533.7) |
Short-term debt | 289.9 | 366.8 | 437.6 | 620.7 | 573.0 |
Derivative asset and liability, current | 5.9 | (3.5) | 2.4 | (0.8) | 1.8 |
Dividends payable | 54.1 | 54.1 | 54.0 | 54.0 | 54.0 |
Operating working capital | $619.5 | $644.8 | $633.2 | $688.0 | $759.4 |
1) March 2019 and December 2018 excluding the EC antitrust accrual. |
|
|
|
| |
17
Q3 Report—2019 |
As part of efficiently managing the Company’s overall cost of funds, Autoliv from time to time enter into “debt-related derivatives” (DRD) as a part of our debt management. Creditors and credit rating agencies use net debt adjusted for DRD in their analyses of the Company’s debt and therefore we provide this non-U.S. GAAP measure. DRD are fair value adjustments to the carrying value of the underlying debt. Also included in the DRD is the unamortized fair value adjustment related to a discontinued fair value hedge which will be amortized over the remaining life of the debt. By adjusting for DRD, the total financial liability of net debt is disclosed without grossing debt up with currency or interest fair values.
| Sep 30 | Jun 30 | Mar 31 | Dec 31 | Sep 30 |
(Dollars in millions) | 2019 | 2019 | 2019 | 2018 | 2018 |
Short-term debt | $289.9 | $366.8 | $437.6 | $620.7 | $573.0 |
Long-term debt | 1,815.1 | 1,850.2 | 1,598.1 | 1,609.0 | 1,677.5 |
Total debt | $2,105.0 | $2,217.0 | $2,035.7 | $2,229.7 | $2,250.5 |
Cash & cash equivalents | (334.4) | (406.4) | (436.6) | (615.8) | (533.7) |
Debt issuance cost/Debt-related derivatives, net | 10.7 | 0.3 | 8.1 | 4.9 | 7.6 |
Net debt | $1,781.3 | $1,810.9 | $1,607.2 | $1,618.8 | $1,724.4 |
|
|
| Dec 31 | Dec 31 | Dec 31 |
(Dollars in millions) |
|
| 2017 | 2016 | 2015 |
Short-term debt |
|
| $19.7 | $216.3 | $39.6 |
Long-term debt |
|
| 1,310.7 | 1,312.5 | 1,499.4 |
Total debt |
|
| $1,330.4 | $1,528.8 | $1,539.0 |
Cash & cash equivalents |
|
| (959.5) | (1,226.7) | (1,333.5) |
Debt issuance cost/Debt-related derivatives, net |
|
| (2.5) | (3.4) | (3.9) |
Net debt |
|
| $368.4 | $298.7 | $201.6 |
18
Q3 Report—2019 |
The non-U.S. GAAP measure net debt is also used in the non-U.S. GAAP measure “Leverage ratio”. Management uses this measure to analyze the amount of debt the Company can incur under its debt policy. Management believes that this policy also provides guidance to credit and equity investors regarding the extent to which the Company would be prepared to leverage its operations. For details on leverage ratio refer to the table.
| Sep 30 | Dec 31 | Sep 30 |
(Dollars in millions) | 2019 | 2018 | 2018 |
Net debt1) | $1,781.3 | $1,618.8 | $1,724.4 |
Pension liabilities | 199.9 | 198.2 | 204.3 |
Debt per the Policy | $1,981.2 | $1,817.0 | $1,928.7 |
|
|
|
|
Net income2) | 216.1 | 183.7 | 218.9 |
Less; Net loss, Discontinued Operations2) | (2.0) | 193.8 | 448.8 |
Net income, Continuing Operations2) | $214.1 | $377.5 | $667.7 |
Income taxes2) | 226.8 | 234.9 | 183.4 |
Interest expense, net2, 3) | 67.0 | 59.2 | 54.8 |
Depreciation and amortization of intangibles2) | 348.8 | 342.0 | 332.6 |
Antitrust related matters, capacity alignments and separation costs2) | 254.5 | 216.5 | 6.7 |
EBITDA per the Policy | $1,111.2 | $1,230.1 | $1,245.2 |
|
|
|
|
Leverage ratio | 1.8 | 1.5 | 1.5 |
1) Short- and long-term debt less cash and cash equivalents and debt-related derivatives. 2) Latest 12 months. 3) Interest expense including cost for extinguishment of debt, if any, less interest income. | |||
19
Q3 Report—2019 |
Free Cash Flow, Net Cash Before Financing and Cash Conversion
Management uses the non-U.S. GAAP measure free cash flow to analyze the amount of cash flow being generated by the Company’s operations after capital expenditure, net. This measure indicates the Company’s cash flow generation level that enables strategic value creation options such as dividends or acquisitions. For details on free cash flow see the reconciliation table below. Management uses the non-U.S. GAAP measure net cash before financing to analyze and disclose the cash flow generation available for servicing external stakeholders such as shareholders and debt stakeholders. For details on net cash before financing, see the reconciliation table below. Management uses the non-U.S. GAAP measure cash conversion to analyze the proportion of net income that is converted into free cash flow. The measure is a tool to evaluate how efficient the Company utilizes its resources. For details on cash conversion, see the reconciliation table below.
| Third quarter | First 9 months | First 9 months | ||
(Dollars in millions) | 2019 | 2018 | 2019 | 20181) | 20182) |
Net income | $86.0 | $118.0 | $306.9 | $274.5 | $470.3 |
Changes in operating assets and liabilities3) | 16.4 | 28.0 | (37.8) | (301.4) | (220.2) |
Depreciation and amortization | 84.1 | 85.1 | 260.1 | 308.4 | 253.1 |
Other, net4) | 8.8 | 7.1 | (200.8) | 19.7 | 17.0 |
Operating cash flow | $195.3 | $238.2 | $328.4 | $301.2 | $520.2 |
Capital expenditure, net | (122.3) | (117.4) | (358.1) | (421.4) | (352.7) |
Free cash flow5) | $73.0 | $120.8 | $(29.7) | $(120.2) | $167.5 |
Acquisitions of businesses and other, net | - | - | - | (72.9) | - |
Net cash before financing | $73.0 | $120.8 | $(29.7) | $(193.1) | $167.5 |
Cash conversion6) | 84.9% | 102.4% | (9.7)% | (43.8)% | 35.6% |
1) Including Discontinued Operations. 2) For Q2 2018 and first six months 2018 management estimate for Continuing Operations based on operations that includes Discontinued Operations. 3) 2018 including separation cost. 4) First nine months 2019 including EC antitrust payment. 5) Operating cash flow less Capital expenditures, net. 6) Free cash flow relative to Net income.
| Latest 12 | Full year | Full year | Full year | Full year |
(Dollars in millions) | months1) | 20181) | 20171) | 20161) | 20151) |
Net income | $216.1 | $183.7 | $303.0 | $561.6 | $457.5 |
Changes in operating assets and liabilities2) | 34.3 | (229.3) | (0.3) | (77.8) | (26.1) |
Depreciation and amortization | 348.8 | 397.1 | 425.8 | 383.0 | 319.1 |
Goodwill impairment charges | - | - | 234.2 | - | - |
Other, net3) | 18.6 | 239.1 | (26.8) | 1.6 | (0.0) |
Operating cash flow | $617.8 | $590.6 | $935.9 | $868.4 | $750.5 |
Capital expenditure, net | (491.5) | (554.8) | (569.6) | (498.6) | (449.6) |
Free cash flow4) | $126.3 | $35.8 | $366.3 | $369.8 | $300.9 |
Acquisitions of businesses and other, net | - | (72.9) | (127.7) | (227.4) | (141.5) |
Net cash before financing | $126.3 | $(37.1) | $238.6 | $142.4 | $159.4 |
Cash conversion5) | 58.4% | 19.5% | 120.9% | 65.8% | 65.8% |
1) Including Discontinued Operations. 2) 2018 including separation cost. 3) 2019 and 2018 including EC antitrust non-cash provision and payment. 4) Operating cash flow less Capital expenditures, net. 5) Free cash flow relative to Net income. | |||||
20
Q3 Report—2019 |
We believe that comparability between periods is improved through the exclusion of certain items. To assist investors in understanding the operating performance of Autoliv's business, it is useful to consider certain U.S. GAAP measures exclusive of these items. Accordingly, the tables below reconcile from U.S. GAAP to the equivalent non-U.S. GAAP measure.
| Third quarter 2019 | Third quarter 2018 | ||||
(Dollars in millions, except per share data) | Reported |
ments1) | Non-U.S. | Reported |
ments1) | Non-U.S. |
Operating income | $153.8 | $28.7 | $182.5 | $192.5 | $1.1 | $193.6 |
Operating margin, % | 7.6 | 1.4 | 9.0 | 9.5 | 0.0 | 9.5 |
Income before taxes from Continuing Operations | $134.4 | $28.7 | $163.1 | $171.3 | $1.1 | $172.4 |
Net income attributable to controlling interest from Continuing Operations | $85.4 | $28.3 | $113.7 | $117.5 | $0.8 | $118.3 |
Return on capital employed, %2) | 16.2 | 2.9 | 19.1 | 20.4 | 0.1 | 20.5 |
Return on total equity, %3) | 17.1 | 5.4 | 22.5 | 23.2 | 0.2 | 23.4 |
Earnings per share, Continuing Operations4, 5) | $0.98 | $0.32 | $1.30 | $1.34 | $0.01 | $1.35 |
1) Excluding costs for capacity alignment, antitrust related matters and separation of our business segments. 2) Operating income and income from equity method investments, relative to average capital employed. 3) Net income relative to average total equity. 4) Assuming dilution and net of treasury shares. 5) Participating share awards with right to receive dividend equivalents are (under the two-class method) excluded from the EPS calculation. | ||||||
| First 9 months 2019 | First 9 months 2018 | ||||
(Dollars in millions, except per share data) | Reported |
ments1) | Non-U.S. | Reported |
ments1) | Non-U.S. |
Operating income | $496.5 | $35.6 | $532.1 | $665.0 | $3.3 | $668.3 |
Operating margin, % | 7.8 | 0.6 | 8.4 | 10.3 | 0.0 | 10.3 |
Income before taxes from Continuing operations | $438.8 | $35.6 | $474.4 | $610.3 | $3.3 | $613.6 |
Net income attributable to controlling interest from Continuing operations | $305.9 | $32.6 | $338.5 | $468.9 | $2.6 | $471.5 |
Capital employed | $3,781 | $32 | $3,813 | $3,778 | $2.0 | $3,780 |
Return on capital employed, %2) | 18.0 | 1.3 | 19.3 | 20.9 | 0.1 | 21.0 |
Return on total equity, % 3) | 20.7 | 2.1 | 22.8 | 20.0 | 0.1 | 20.1 |
Earnings per share continuing operations, diluted4, 5) | $3.50 | $0.37 | $3.87 | $5.37 | $0.03 | $5.40 |
Total parent shareholders' equity per share | $22.78 | $0.37 | $23.15 | $23.42 | $0.03 | $23.45 |
1) Excluding costs for capacity alignment, antitrust related matters and separation of our business segments. 2) Operating income and income from equity method investments continuing operations, relative to average capital employed. 3) Income from continuing operations relative to average total equity. 4) Assuming dilution and net of treasury shares. 5) Participating share awards with right to receive dividend equivalents are (under the two-class method) excluded from the EPS calculation.
| ||||||
21
Q3 Report—2019 |
|
| Latest 12 months | ||||
|
|
|
| Reported |
| Non-U.S. |
Operating income |
|
|
| $517.5 | $254.5 | $772.0 |
Operating margin, % |
|
|
| 6.1 | 2.9 | 9.0 |
1) Excluding costs for capacity alignment, antitrust related matters and separation of our business segments. | ||||||
| Full year 2018 | Full year 2017 | ||||
| Reported |
| Non-U.S. | Reported |
| Non-U.S. |
Operating income | $686.0 | $222.2 | $908.2 | $859.6 | $39.7 | $899.3 |
Operating margin, % | 7.9 | 2.6 | 10.5 | 10.6 | 0.5 | 11.1 |
1) Excluding costs for capacity alignment and antitrust related matters in 2017 and 2018, and separation of our business segments in 2018. | ||||||
|
|
|
|
|
|
|
| Full year 2016 | Full year 2015 | ||||
| Reported |
| Non-U.S. | Reported |
| Non-U.S. |
Operating income | $831.0 | $34.5 | $865.5 | $707.7 | $166.4 | $874.1 |
Operating margin, % | 10.5 | 0.4 | 10.9 | 9.3 | 2.2 | 11.5 |
1) Excluding costs for capacity alignment and antitrust related matters. | ||||||
Items included in Non-U.S. GAAP adjustments | Third quarter 2019 |
| Third quarter 2018 | |||
| Adjustment | Adjustment |
| Adjustment | Adjustment | |
Capacity alignment | $27.4 | $0.31 |
| $(0.2) | $(0.00) | |
Antitrust related matters | 0.1 | 0.00 |
| 0.2 | 0.00 | |
Separations costs | 1.2 | 0.01 |
| 1.1 | 0.01 | |
Total adjustments to operating income | $28.7 | $0.32 |
| $1.1 | $0.01 | |
Tax on non-U.S. GAAP adjustments1) | (0.4) | 0.00 |
| (0.3) | (0.00) | |
Total adjustments to net income | $28.3 | $0.32 |
| $0.8 | $0.01 | |
|
|
|
|
|
| |
Weighted average number of shares outstanding - diluted |
| 87.3 |
|
| 87.4 | |
|
|
|
|
|
| |
Return on capital employed2, 3) | $114.8 |
|
| $4.4 |
| |
Adjustment return on capital employed | 2.9% |
|
| 0.1% |
| |
|
|
|
|
|
| |
Return on total equity4, 5) | $113.2 |
|
| $3.2 |
| |
Adjustment return on total equity | 5.4% |
|
| 0.2% |
| |
1) The tax is calculated based on the tax laws in the respective jurisdiction(s) of the adjustment(s). 2) After adjustment for annualized Q3 non-U.S. GAAP EBIT adjustment. 3) Operating income and income from equity method investments, relative to average capital employed. 4) Income relative to average total equity. 5) After adjustment for annualized Q3 non-U.S. GAAP Net income adjustment. | ||||||
22
Q3 Report—2019 |
Items included in Non-GAAP adjustments | First 9 months 2019 |
| First 9 months 2018 | ||||
| Adjustment | Adjustment |
| Adjustment | Adjustment | ||
Capacity alignment | $40.5 | $0.46 |
| $1.0 | $0.01 | ||
Antitrust related matters | (6.1) | (0.07) |
| 1.2 | 0.01 | ||
Separation costs | 1.2 | 0.01 |
| 1.1 | 0.01 | ||
Total adjustments to operating income | $35.6 | $0.40 |
| $3.3 | $0.03 | ||
Tax on non-U.S. GAAP adjustments1) | (3.0) | (0.03) |
| (0.7) | (0.00) | ||
Total adjustments to Income from Continuing operations | $32.6 | $0.37 |
| $2.6 | $0.03 | ||
|
|
|
|
|
| ||
Weighted average number of shares outstanding - diluted |
| 87.4 |
|
| 87.3 | ||
|
|
|
|
|
| ||
Return on capital employed2, 3) | $47.5 |
|
| $4.4 |
| ||
Adjustment return on capital employed | 1.3% |
|
| 0.1% |
| ||
|
|
|
|
|
| ||
Return on total equity4, 5) | $43.5 |
|
| $3.5 |
| ||
Adjustment return on total equity | 2.1% |
|
| 0.1% |
| ||
1) The tax is calculated based on the tax laws in the respective jurisdiction(s) of the adjustment(s). 2) After adjustment for annualized non-U.S. GAAP EBIT adjustment. 3) Operating income and income from equity method investments Continuing Operations, relative to average capital employed. 4) Income from Continuing Operations relative to average total equity. 5) After adjustment for annualized non-U.S. GAAP Net income adjustment. | |||||||
23
Q3 Report—2019 |
Multi-year Summary
Continuing Operations unless noted
(Dollars in millions, except per share data) | 2018 | 2017 | 2016 | 2015 |
Sales and Income |
|
|
|
|
Net sales | $8,678 | $8,137 | $7,922 | $7,636 |
Airbag sales1) | 5,699 | 5,342 | 5,256 | 5,036 |
Seatbelt sales | 2,980 | 2,794 | 2,665 | 2,599 |
Operating income | 686 | 860 | 831 | 708 |
Net income attributable to controlling interest | 376 | 586 | 558 | 443 |
Earnings per share (US$) – basic2) | 4.32 | 6.70 | 6.33 | 5.03 |
Earnings per share (US$) – assuming dilution2, 3) | 4.31 | 6.68 | 6.32 | 5.02 |
Gross margin, %4) | 19.7 | 20.6 | 20.6 | 20.5 |
R,D&E net in relation to sales, % | (4.8) | (4.6) | (4.5) | (4.1) |
S,G&A net in relation to sales, % | (4.5) | (5.0) | (5.0) | (4.8) |
Operating margin, %5) | 7.9 | 10.6 | 10.5 | 9.3 |
Adjusted operating margin, %6, 7) | 10.5 | 11.1 | 10.9 | 11.5 |
Balance Sheet |
|
|
|
|
Operating working capital | 478 | 581 | 488 | 525 |
Days receivables outstanding8) | 71 | 76 | 70 | 71 |
Days inventory outstanding9) | 35 | 35 | 32 | 31 |
Total equity | 1,897 | 4,169 | 3,926 | 3,468 |
Total parent shareholders’ equity per share (US$) | 21.63 | 46.38 | 41.69 | 39.22 |
Current assets excluding cash | 2,670 | 2,598 | 2,269 | 2,259 |
Property, plant and equipment, net | 1,690 | 1,609 | 1,329 | 1,265 |
Intangible assets (primarily goodwill) | 1,423 | 1,440 | 1,430 | 1,445 |
Capital employed | 3,516 | 4,538 | 4,225 | 3,670 |
Net debt7) | 1,619 | 368 | 299 | 202 |
Total assets | 6,722 | 6,947 | 6,565 | 6,518 |
Long-term debt | 1,609 | 1,311 | 1,313 | 1,499 |
Operating working capital in relation to sales, % | 5.5 | 7.1 | 6.2 | 6.9 |
Return on capital employed, %10, 11) | 17 | n/a | n/a | n/a |
Return on total equity, %11, 12) | 13 | n/a | n/a | n/a |
Total equity ratio, % | 28 | 49 | 48 | 46 |
Cash flow |
|
|
|
|
Operating cash flow13) | 591 | 936 | 868 | 751 |
Depreciation and amortization13) | 397 | 426 | 383 | 319 |
Capital expenditures, net13) | 555 | 570 | 499 | 450 |
Capital expenditures, net in relation to sales, %13) | 5.7 | 5.5 | 4.9 | 4.9 |
Free cash flow7, 13, 14) | 36 | 366 | 369 | 301 |
Cash conversion, %7, 13, 15) | 19.5 | 120.8 | 65.7 | 65.8 |
Direct shareholder return13, 16) | (214) | (366) | (203) | (300) |
Cash dividends paid per share (US$) | 2.46 | 2.38 | 2.30 | 2.22 |
Other data |
|
|
|
|
Number of shares outstanding (million)17) | 87.1 | 87.0 | 88.2 | 88.1 |
Number of employees, December 31 | 57,700 | 56,700 | 55,800 | 51,300 |
1) Including steering wheels, inflators and initiators. 2) Participating share awards with right to receive dividend equivalents are (under the two-class method) excluded from the EPS calculation. 3) Assuming dilution and net of treasury shares. 4) Gross profit relative to sales. 5) Operating income relative to sales. 6) Excluding costs for capacity alignment, antitrust related matters and separation of our business segments. Non-U.S. GAAP measure, see reconciliation table. 7) Non-US GAAP measure, for reconciliation see tables above. 8) Outstanding receivables relative to average daily sales. 9) Outstanding inventory relative to average daily sales. 10) Operating income and income from equity method investments, relative to average capital employed. 11) The Company has decided not to recalculate prior periods since the distribution of Veoneer had a significant impact on total equity and capital employed making the comparison less meaningful. 12) Income relative to average total equity. 13) Including Discontinued Operations. 14) Operating cash flow less Capital expenditures, net. Non-U.S. GAAP measure, see reconciliation table. 15) Free cash flow relative to Net income. Non-U.S. GAAP measure, see reconciliation table. 16) Dividends paid and Shares repurchased. 17) At year end, excluding dilution and net of treasury shares. | ||||
24