Exhibit 99.1

| | |
Financial Report January – March 2021 | | |
Q1 2021: Good progress in sales, profits, balance sheet
Financial highlights Q1 2021 $2,242m net sales 17.9% organic sales growth* 10.6% operating margin 10.6% adjusted operating margin* $1.79 EPS - an increase of 108% $1.79 adjusted EPS* - an increase of 103% | | Full year 2021 indications Around 23% net sales growth Around 20% organic sales growth Around 10% adjusted operating margin |
Key business developments in the first quarter of 2021
| • | Strong organic sales growth*, fueled by good performance in all regions. Sales increased organically by 17.9%, outperforming global LVP by more than 4pp (according to IHS Markit April 2021) despite adverse geographical mix effects as LVP grew strongly in lower CPV markets. All regions outperformed LVP by 6-23pp driven by launches and positive vehicle mix. Our order intake was in line with a year earlier. |
| • | Strong improvement in operating income, driven by strong sales growth and continued cost control. Adjusted operating margin* improved by 3.2 pp to 10.6%. RoCE improved to 26.3%. |
| • | Strong cash flow and strengthened balance sheet. Operating cash flow increased to $186m and free cash flow* grew to $93m. Net debt* declined substantially and our leverage ratio* of 1.4x is now inside our target range of 0.5x-1.5x. |
*For non-U.S. GAAP measures see enclosed reconciliation tables. All change figures in this release compare to the same period of previous year except when stated otherwise.
Key Figures
(Dollars in millions, except per share data) | Q1 2021 | Q1 2020 | Change |
Net sales | $2,242 | $1,846 | 21% |
Operating income | $237 | $134 | 77% |
Adjusted operating income1) | $237 | $136 | 74% |
Operating margin, % | 10.6 | 7.3 | 3.3pp |
Adjusted operating margin, %1) | 10.6 | 7.4 | 3.2pp |
Earnings per share, diluted2, 3) | $1.79 | $0.86 | 108% |
Adjusted earnings per share, diluted1, 2, 3) | $1.79 | $0.88 | 103% |
Operating cash flow | $186 | $156 | 19% |
Return on capital employed, %4) | 26.3 | 14.5 | 11.8pp |
Adjusted return on capital employed, %5) | 26.3 | 14.6 | 11.7pp |
1) Excluding costs for capacity alignment. 2) Assuming dilution when applicable and net of treasury shares. 3) Participating share awards with right to receive dividend equivalents are (under the two-class method) excluded from the EPS calculation. 4) Annualized operating income and income from equity method investments, relative to average capital employed. 5) Annualized operating income and income from equity method investments, relative to average capital employed. Non-U.S. GAAP measure, see reconciliation table. |
Comments from Mikael Bratt, President & CEO | | |

| The COVID-19 pandemic is still affecting us in several ways and our first priority remains the health and safety of our employees. The industry is experiencing adverse business effects, with a supply-demand imbalance of certain input materials such as steel, chemicals and semiconductors. Temporary shortages of these materials limited the light vehicle production in the first quarter and we expect this situation to continue in the second and third quarter of this year. | | Our sales outperformed the global light vehicle production organically by more than 4pp in the quarter, despite adverse geographical mix effects as LVP mainly grew in lower CPV markets. Driven by new launches and positive vehicle mix our sales outperformed LVP significantly in all regions. Supported by new and recent vehicle launches such as Jeep Grand Cherokee L, Mitsubishi Outlander and Peugeot 308, we expect to outgrow LVP by mid-single digits in 2021. We are still in an uncertain environment and we continue to face challenges in 2021. We expect adverse cost development from rising raw material prices throughout 2021. We remain focused on responding to sudden changes in light vehicle production with agility and flexibility. Despite increased industry wide supply chain challenges, we are pleased to be able to reiterate our full year guidance of around 20% organic sales growth and an adjusted operating margin of around 10% as we expect effects of the supply chain challenges to be balanced with positive sales mix and cost reduction actions. We can see that our strategic initiatives gradually are yielding good results, and we expect 2021 to be a solid stepping stone towards our 2022-24 targets which include a significant growth above light vehicle production as well as a solid adjusted operating margin increase |
In this tough environment, I am proud that the Autoliv organization delivered a strong first quarter performance where we saw high sales growth and a significant improvement in profitability compared to the first quarter in both 2020 and 2019. I am also pleased that we continued to generate a strong cash flow, that our net debt declined further, and that our leverage ratio is now back inside our target range. Our progress in the past few quarters strengthens our confidence in the journey towards our medium term targets and our opportunities to create shareholder value. Our sales outperformed the global light vehicle production organically by more than 4pp in the quarter, despite adverse geographical mix effects as LVP mainly grew in lower CPV markets. Driven by new launches and positive vehicle mix our sales outperformed LVP significantly in all regions. Supported by new and recent vehicle launches such as Jeep Grand Cherokee L, Mitsubishi Outlander and Peugeot 308, we expect to outgrow LVP by mid-single digits in 2021. | |
| | |
2
| | |
Financial Report January – March 2021 | | |
Full year 2021 indications
Our outlook indications for 2021 reflect continuing uncertainty in the automotive markets and are mainly based on our customer call-offs and global LVP according to IHS Markit. As we are back inside our target range for leverage ratio, we no longer guide for this measure.
| | | |
| Full Year Indication | | Full Year Indication |
Net sales growth | Around 23% | Tax rate2) | Around 30% |
Organic sales growth | Around 20% | Operating cash flow3) | Similar level as 2020 |
Adjusted operating margin1) | Around 10% | Capex, net % of sales | Below 6% |
R,D&E, net % of sales | Around 4.5% | | |
1) Excluding costs for capacity alignments and antitrust related matters. 2) Excluding unusual tax items. 3) Excluding unusual items
The forward-looking non-U.S. GAAP financial measures above are provided on a non-U.S. GAAP basis. Autoliv has not provided a U.S. GAAP reconciliation of these measures because items that impact these measures, such as costs related to capacity alignments and antitrust matters, cannot be reasonably predicted or determined. As a result, such reconciliation is not available without unreasonable efforts and Autoliv is unable to determine the probable significance of the unavailable information.
Conference call and webcast
An earnings conference call will be held at 2:00 p.m. CET today, April 23, 2021. Information regarding how to participate is available on www.autoliv.com. The presentation slides for the conference call will be available on our website shortly after the publication of this financial report.
COVID-19 pandemic related business update
The COVID-19 pandemic impacted our business in the first quarter 2021 indirectly through limited light vehicle production by our customers caused by semiconductor and other industry supply chain disruptions, especially in North America and Europe. Although Autoliv has fulfilled its delivery commitments, the lower than anticipated LVP has negatively impacted our sales and profitability.
Direct COVID-19 related costs, such as personal protective equipment, quarantine costs, premium freight and other items were around $5 million in Q1 2021. Governmental support in connection with furloughing, short-term work weeks, and other similar activities was not material to our financial results in Q1 2021.
Current industry-wide semiconductor shortage is likely to continue to negatively impact LVP, and hence our sales and profitability, into the second half of the year and a stabilization of supply may not emerge until the fourth quarter. We expect adverse cost development from rising raw material prices throughout 2021.
3
| | |
Financial Report January – March 2021 | | |
Key Performance Trends
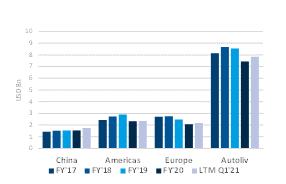
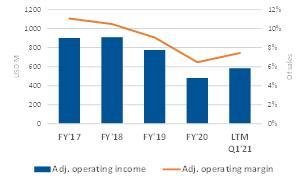
Sales Development by region | | Adj. operating income and margin* |
| | 
|
| | |
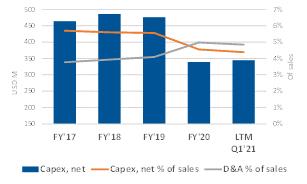
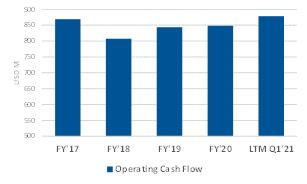
Capex and D&A | | Operating Cash Flow excl EC antitrust payment* |
| | 
|
| | |
Return on Capital Employed | | Cash Conversion* |

| | 
|
Key definitions ---------------------------------------------------------------------------------------------------------
Capex: Capital Expenditures, net.
D&A: Depreciation and Amortization.
Adj. operating income and margin*: Operating income adjusted for capacity alignments, antitrust related matters and separation of our business segments. Capacity alignments include non-recurring costs related to our structural efficiency and business cycle management programs.
Operating cash flow excluding EC antitrust payment*: Management estimate for Continuing Operations derived from cash flow including Discontinued Operations 2017-2018. Adjusted for EC antitrust payment of $203 million in 2019.
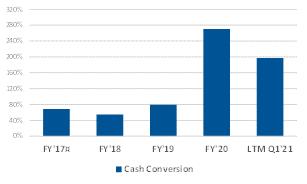
Cash conversion*: Free cash flow* in relation to net income adjusted for EC antitrust accrual in 2018 and payment in 2019. Free cash flow defined as operating cash flow less capital expenditure, net.
4
| | |
Financial Report January – March 2021 | | |
Consolidated sales development
First quarter 2021
Consolidated sales | | First quarter | Reported
(U.S. GAAP) | Currency
effects1) | Organic
change* |
(Dollars in millions) | | 2021 | 2020 |
Airbag Products and Other2) | | $1,463 | $1,202 | 21.7% | 3.0% | 18.7% |
Seatbelt Products2) | | $779 | $644 | 21.1% | 4.6% | 16.5% |
Total | | $2,242 | $1,846 | 21.5% | 3.5% | 17.9% |
| | | | | | |
Asia | | $877 | $597 | 46.8% | 4.7% | 42.1% |
Whereof: | China | $414 | $198 | 110% | 7.7% | 102% |
| Japan | $211 | $203 | 3.9% | 2.8% | 1.1% |
| RoA | $252 | $197 | 27.9% | 3.7% | 24.2% |
Americas | | $687 | $672 | 2.1% | (1.5)% | 3.7% |
Europe | | $679 | $576 | 17.8% | 8.2% | 9.6% |
Total | | $2,242 | $1,846 | 21.5% | 3.5% | 17.9% |
1) Effects from currency translations. 2) Including Corporate and other sales. |
Sales by product - Airbags
All major product categories within Airbags grew strongly organically* in the quarter. The largest contributor to growth was steering wheels and inflatable curtains, followed by passenger airbags, driver airbags and side airbags. The highest growth rate was in knee airbags, growing by almost 40%.
Sales by product - Seatbelts
The main contributor to Seatbelt products organic growth* was China, followed by Europe, India and ASEAN. Seatbelt products grew organically in all major regions, with China growing by more than 100%. Sales of more advanced and higher value-added seatbelts continued to be an important driver for growth, especially in China.
Sales by region
Our global organic sales* grew by 17.9% compared to the LVP growth of 13.6% (according to IHS Markit April 2021). This was more than 4pp outperformance despite an adverse geographical mix as LVP in lower safety CPV markets, such as China and India, grew
strongly while LVP in higher safety CPV markets, such as Western Europe and North America, declined. Our organic sales development outperformed LVP by 6-23pp in all regions fueled by new launches and positive vehicle mix.
| | | | | | |
Q1 2021 organic growth* | Americas | Europe | China | Japan | Rest of Asia | Global |
Autoliv | 3.7% | 9.6% | 102% | 1.1% | 24.2% | 17.9% |
Main growth drivers | Ford, Toyota, GM | Stellantis, VW, Toyota | VW, Great Wall, Honda | Toyota, Nissan, Subaru | Hyundai/Kia, Isuzu, Nissan | VW, Toyota, GM |
Main decline drivers | Subaru, Honda, Stellantis | Renault, Nissan, Ford | BYD | Honda, Mitsubishi, Mazda | SsangYong, Renault, Subaru | Renault, Subaru, Mazda |
Light vehicle production development
Change vs same period last year according to IHS Markit
| | | | | | |
Q1 2021 | Americas | Europe | China | Japan | Rest of Asia | Global |
LVP (Apr 2021) | (4.2)% | (0.9)% | 78.7% | (4.5)% | 9.8% | 13.6% |
LVP (Jan 2021) | 7.3% | 1.7% | 67.9% | (0.3)% | (0.1)% | 14.1% |
5
| | |
Financial Report January – March 2021 | | |
Key launches in the first quarter 2021
Jeep Grand Cherokee L | | Peugeot 308 | | Mitsubishi Outlander |

| | 
| | 
|

| | 
| | 
|
| | | | |
Hyundai Ioniq 5 | | Arcfox αS | | Hyundai Bayon |

| | 
| | 
|

| | 
| | 
|
WEY Mocha | | Mercedes C-Class | | Acura MDX |

| | 
| | 
|

| | 
| | 
|
| | | | | |

| Driver/Passenger Airbags | 
| Seatbelts | 
| Side Airbags |
| | | | | |

| Head/Inflatable Curtain Airbags | 
| Steering Wheel | 
| Knee Airbag |
| | | | | |

| Front Center Airbag | 
| Bag-in-Belt | 
| Pyrotechnical Safety Switch |
| | | | | |

| Pedestrian Airbag | 
| Hood Lifter | 
| Available as EV/PHEV |
6
| | |
Financial Report January – March 2021 | | |
Financial development
Selected income statement items
Condensed income statement | First quarter | |
(Dollars in millions, except per share data) | 2021 | 2020 | Change | |
Net sales | $2,242 | $1,846 | 21.5% | |
Cost of sales | $(1,784) | $(1,515) | 17.8% | |
Gross profit | $458 | $331 | 38.5% | |
S,G&A | $(108) | $(93) | 15.6% | |
R,D&E, net | $(107) | $(103) | 3.6% | |
Amortization of intangibles | $(3) | $(3) | (13.7)% | |
Other income (expense), net | $(4) | $2 | (314)% | |
Operating income | $237 | $134 | 77.0% | |
Adjusted operating income1) | $237 | $136 | 74.4% | |
Financial and non-operating items, net | $(20) | $(23) | (13.7)% | |
Income before taxes | $217 | $111 | 95.8% | |
Tax rate | 27.7% | 32.7% | (5.0)pp | |
Net income | $157 | $75 | 110% | |
Earnings per share2, 3) | $1.79 | $0.86 | 108% | |
Adjusted earnings per share1, 2, 3) | $1.79 | $0.88 | 103% | |
| | | | |
Gross margin | 20.4% | 17.9% | 2.5pp | |
S,G&A % of sales | (4.8)% | (5.1)% | (0.3)pp | |
R,D&E net in relation to sales, % | (4.8)% | (5.6)% | (0.8)pp | |
Operating margin | 10.6% | 7.3% | 3.3pp | |
Adjusted operating margin1) | 10.6% | 7.4% | 3.2pp | |
| | | | |
Other data | | | | |
No. of shares at period-end in millions4) | 87.4 | 87.3 | 0.1% | |
Weighted average no. of shares in millions5) | 87.4 | 87.3 | 0.1% | |
Weighted average no. of shares in millions, diluted5) | 87.6 | 87.4 | 0.2% | |
1) Non-U.S. GAAP measure, excluding costs for capacity alignment. See reconciliation table. 2) Assuming dilution when applicable and net of treasury shares. 3) Participating share awards with right to receive dividend equivalents are (under the two-class method) excluded from the EPS calculation. 4) Excluding dilution and net of treasury shares. 5) Net of treasury shares. |
First quarter 2021 development
Gross profit increased by $127 million and the gross margin increased by 2.5pp compared to the same quarter 2020. The gross margin increase was primarily driven by the higher sales and direct material efficiency.
S,G&A costs increased by $15 million compared to the prior year, mainly relating to FX effects and IT costs. Personnel costs were close to unchanged. In relation to sales, S,G&A costs decreased from 5.1% to 4.8%.
R,D&E, net. Costs increased by $4 million compared to the prior year, mainly due to negative FX effects. Personnel costs were close to unchanged. In relation to sales, R,D&E costs declined from 5.6% to 4.8%.
Other income (expense), net deteriorated by $6 million compared to prior year, mainly due to lower government income.
Operating income increased by $103 million compared to the same period in 2020, mainly as a consequence of
the higher gross profit partially offset by higher costs for S,G&A and R,D&E, net.
Adjusted operating income* increased by $101 million compared to the prior year, mainly due to higher gross profit partially offset by higher costs for S,G&A and R,D&E, net.
Financial and non-operating items, net. Costs were $3 million lower compared to the prior year, mainly due to higher income from equity method investments.
Income before taxes increased by $106 million compared to the prior year, mainly due to the higher operating income.
Tax rate was 27.7%, compared to 32.7% in the same quarter last year, when the tax rate was negatively impacted by about 5pp due to negative country mix.
Earnings per share, diluted increased by $0.93 compared to a year earlier, where the main drivers were $0.79 from higher adjusted operating income* and $0.13 from lower tax.
7
| | |
Financial Report January – March 2021 | | |
Selected Balance Sheet and Cash Flow items
Selected Balance Sheet items | First quarter |
(Dollars in millions) | 2021 | 2020 | Change |
Trade working capital | $1,487 | $1,337 | 11.2% |
Trade working capital in relation to sales, % | 16.6 | 18.1 | (1.5)pp |
Receivables outstanding in relation to sales, %1) | 20.6 | 19.3 | 1.3pp |
Inventory outstanding in relation to sales, %2) | 9.5 | 10.5 | (1.0)pp |
Payables outstanding in relation to sales, %3) | 13.5 | 11.7 | 1.8pp |
Cash & cash equivalents | $1,254 | $907 | 38.3% |
Gross debt4) | $2,330 | $2,528 | (7.8)% |
Net debt5) | $1,115 | $1,630 | (31.6)% |
Capital employed6) | $3,635 | $3,674 | (1.0)% |
Return on capital employed, %7) | 26.3 | 14.5 | 11.8pp |
Total equity | $2,521 | $2,044 | 23.3% |
Return on total equity, %8) | 25.4 | 14.4 | 11.0pp |
Leverage ratio9) | 1.4 | 1.7 | (17.6)% |
1) Outstanding receivables relative to annualized sales. 2) Outstanding inventory relative to annualized sales. 3) Outstanding payables relative to annualized sales. 4) Short- and long-term interest-bearing debt. 5) Short- and long-term debt less cash and cash equivalents and debt-related derivatives. Non U.S. GAAP measure. See reconciliation table. 6) Total equity and net debt. 7) Annualized operating income and income from equity method investments, relative to average capital employed. 8) Annualized net income relative to average total equity. 9) Net debt adjusted for pension liabilities in relation to EBITDA. Non U.S. GAAP measure. See reconciliation table. |
Selected Cash Flow items | First quarter | |
(Dollars in millions) | 2021 | 2020 | Change | |
Net income | $157 | $75 | 110% | |
Changes in operating working capital | $(89) | $(19) | 368% | |
Depreciation and amortization | $99 | $89 | 10.7% | |
Other, net | $19 | $11 | 70.0% | |
Operating cash flow | $186 | $156 | 18.9% | |
Capital expenditure, net | $(93) | $(88) | 5.7% | |
Free cash flow1) | $93 | $68 | 36.0% | |
Cash conversion2) | 58.8% | 90.3% | (31.5)pp | |
Dividends paid | – | $(54) | n/a | |
Cash dividend paid per share | – | $0.62 | n/a | |
Capital expenditures, net in relation to sales, % | 4.1% | 4.8% | (0.7)pp | |
1) Operating cash flow less Capital expenditures, net. Non U.S. GAAP measure. See reconciliation table. 2) Free cash flow relative to Net income. Non U.S. GAAP measure. See reconciliation table. |
First quarter 2021 development
Trade working capital* was 16.6% of sales compared to 18.1% of sales a year earlier, mainly a consequence of the higher sales and accounts payables increasing relatively more than receivables and inventories.
Operating cash flow was $186 million, compared to $156 million a year earlier. The improvement was mainly due to positive effects from higher net income, partially offset by adverse effects from changes in operating working capital.
Capital expenditure, net increased by 6%, supporting the organic growth. Capital expenditure, net in relation to sales was 4.1% vs. 4.8% a year earlier.
Free cash flow* amounted to $93 million, compared to
$68 million a year earlier. The increase was due to the higher operating cash flow, partially offset by the higher capital expenditure, net.
Cash conversion* defined as free cash flow* in relation to net income, declined to 59% compared to 90% a year earlier, mainly due to the adverse effects from changes in operating working capital.
Net debt* was $1,115 million as of March 31, 2021, which was $515 million lower than a year earlier and $100 million lower compared to December 31, 2020.
Liquidity position. At March 31, 2021, our cash balance was $1.3 billion, and including committed, unused loan facilities, our liquidity position was $2.4 billion.
8
| | |
Financial Report January – March 2021 | | |
Leverage ratio*. Autoliv’s policy is to maintain a leverage ratio commensurate with a strong investment grade credit rating. The Company measures its leverage ratio as net debt* adjusted for pension liabilities in relation to adjusted EBITDA*. The long-term target is to maintain a leverage ratio of around 1.0x within a range of 0.5x to 1.5x. As of March 31, 2021, the Company had a leverage ratio of 1.4x, compared to 1.7x at March 31, 2020 as the lower net debt was only partially offset by a
lower adjusted 12 months trailing EBITDA.
Total equity increased by $477 million compared to March 31, 2020 mainly due to $271 million in net income and $135 million from positive foreign exchange effects as well as positive effects from the cancellation of dividend declared in 2020 of $54 million and treasury stock of $13 million.
Headcount
| Mar 31 | Dec 31 | Mar 31 |
| 2021 | 2020 | 2020 |
Headcount | 66,600 | 68,200 | 65,500 |
Whereof: Direct employees in manufacturing | 48,700 | 50,300 | 46,700 |
Indirect employees | 17,900 | 17,900 | 18,700 |
Temporary personnel | 10% | 11% | 8% |
By March 31, 2021, total headcount increased by 2% compared to a year earlier, driven by an increase of around 4% of the direct workforce and a reduction of around 4% of the indirect workforce. Compared to December 31, 2020, total headcount (permanent
employees and temporary personnel) decreased by around 1,600. This was driven by a decrease of around 3% of the direct workforce reflecting a lower light vehicle production compared to fourth quarter 2020, while the indirect workforce was unchanged.
9
| | |
Financial Report January – March 2021 | | |
Other Items
| • | On February 16, 2021, Autoliv announced its plans to build a new inflator manufacturing plant in Chennai, India to serve the growing demand in India. |
| • | On February 19, 2021, Autoliv announced the approval of the renewal for one year of its €3 billion guaranteed euro medium term note programme originally established on April 11, 2019. |
| • | On March 22, 2021, Autoliv announced its nominees for election by the stockholders to the Board of Directors at the 2021 annual meeting of stockholders, including Mr. Martin Lundstedt, President and CEO of AB Volvo as a new nominee to the Board. Mr. Lundstedt is a member of the Board of the European Automobile Manufacturers |
| | Association (ACEA) and the Royal Swedish Academy of Engineering Sciences (IVA). The Board has determined that Mr. Lundstedt is “independent” according to the New York Stock Exchange’s rules and regulations. Mr. James Ringler and Mr. David Kepler, current members of the Board, will not stand for re-election. |
| • | On April 20, 2021, Autoliv and Mersen announced a joint collaboration to deliver high voltage disconnect devices to make electric vehicles safer. |
| • | The Company set May 12, 2021 as the date for its 2021 annual meeting of stockholders. The meeting will be a virtual-only meeting. Only the stockholders of record at the close of business on March 15, 2021 will be entitled to be present and vote at the meeting. |
Next Report
Autoliv intends to publish the quarterly earnings report for the second quarter of 2021 on Friday, July 16, 2021.
Inquiries: Investors and Analysts
Anders Trapp
Vice President Investor Relations
Tel +46 (0)8 5872 0671
Henrik Kaar
Director Investor Relations
Tel +46 (0)8 5872 0614
Inquiries: Media
Gabriella Ekelund
Senior Vice President Communications
Tel +46 (0)70 612 6424
Autoliv, Inc. is obliged to make this information public pursuant to the EU Market Abuse Regulation. The information was submitted for publication, through the agency of the VP of Investor Relations set out above, at 12.00 CET on April 23, 2021.
Footnotes
*Non-U.S. GAAP measure, see enclosed reconciliation tables.
Definitions and SEC Filings
Please refer to www.autoliv.com or to our Annual Report for definitions of terms used in this report. Autoliv’s annual report to stockholders, annual report on Form 10-K, quarterly reports on Form 10‑Q, proxy statements, management certifications, press releases, current reports on Form 8-K and other documents filed with the SEC can be obtained free of charge from Autoliv at the Company’s address. These documents are also available at the SEC’s website www.sec.gov and at Autoliv’s corporate website www.autoliv.com.
10
| | |
Financial Report January – March 2021 | | |
“Safe Harbor Statement”
This report contains statements that are not historical facts but rather forward-looking statements within the meaning of the Private Securities Litigation Reform Act of 1995. Such forward-looking statements include those that address activities, events or developments that Autoliv, Inc. or its management believes or anticipates may occur in the future. All forward-looking statements are based upon our current expectations, various assumptions and/or data available from third parties. Our expectations and assumptions are expressed in good faith and we believe there is a reasonable basis for them. However, there can be no assurance that such forward-looking statements will materialize or prove to be correct as forward-looking statements are inherently subject to known and unknown risks, uncertainties and other factors which may cause actual future results, performance or achievements to differ materially from the future results, performance or achievements expressed in or implied by such forward-looking statements. In some cases, you can identify these statements by forward-looking words such as “estimates”, “expects”, “anticipates”, “projects”, “plans”, “intends”, “believes”, “may”, “likely”, “might”, “would”, “should”, “could”, or the negative of these terms and other comparable terminology, although not all forward-looking statements contain such words. Because these forward-looking statements involve risks and uncertainties, the outcome could differ materially from those set out in the forward-looking statements for a variety of reasons, including without limitation, general economic conditions; the impacts of the coronavirus (COVID-19) pandemic on the Company’s financial condition, business operations, operating costs, liquidity and competition and on the global economy; changes in light vehicle production fluctuation in vehicle production schedules for which the Company is a supplier; supply chain disruptions and component shortages impacting the Company or the automotive industry; changes in general industry and market conditions or regional growth or decline; changes in and the successful execution of our capacity alignment, restructuring, cost reduction and efficiency initiatives and the market reaction thereto; loss of business from increased competition; higher raw material, fuel and energy costs; changes
in consumer and customer preferences for end products; customer losses; changes in regulatory conditions; customer bankruptcies, consolidations, or restructuring or divestiture of customer brands; unfavorable fluctuations in currencies or interest rates among the various jurisdictions in which we operate; market acceptance of our new products; costs or difficulties related to the integration of any new or acquired businesses and technologies; continued uncertainty in pricing negotiations with customers; successful integration of acquisitions and operations of joint ventures; successful implementation of strategic partnerships and collaborations; our ability to be awarded new business; product liability, warranty and recall claims and investigations and other litigation and customer reactions thereto; higher expenses for our pension and other postretirement benefits, including higher funding needs for our pension plans; work stoppages or other labor issues; possible adverse results of pending or future litigation or infringement claims; our ability to protect our intellectual property rights; negative impacts of antitrust investigations or other governmental investigations and associated litigation relating to the conduct of our business; tax assessments by governmental authorities and changes in our effective tax rate; dependence on key personnel; legislative or regulatory changes impacting or limiting our business; political conditions; dependence on and relationships with customers and suppliers; and other risks and uncertainties identified under the headings “Risk Factors” and “Management’s Discussion and Analysis of Financial Condition and Results of Operations” in our Annual Reports and Quarterly Reports on Forms 10-K and 10-Q and any amendments thereto. For any forward-looking statements contained in this or any other document, we claim the protection of the safe harbor for forward-looking statements contained in the Private Securities Litigation Reform Act of 1995, and we assume no obligation to update publicly or revise any forward-looking statements in light of new information or future events, except as required by law.
11
| | |
Financial Report January – March 2021 | | |
Consolidated Statements of Net Income
(Dollars in millions, except per share data) | First quarter | | Latest 12 | Full Year |
(Unaudited) | 2021 | 2020 | | months | 2020 |
Airbag and Other products1) | $1,463 | $1,202 | | $5,085 | $4,824 |
Seatbelt products1) | 779 | 644 | | 2,759 | 2,623 |
Total net sales | $2,242 | $1,846 | | $7,844 | $7,447 |
| | | | | |
Cost of sales | (1,784) | (1,515) | | (6,470) | (6,201) |
Gross profit | $458 | $331 | | $1,374 | $1,247 |
| | | | | |
Selling, general & administrative expenses | (108) | (93) | | (403) | (389) |
Research, development & engineering expenses, net | (107) | (103) | | (380) | (376) |
Amortization of intangibles | (3) | (3) | | (10) | (10) |
Other income (expense), net | (4) | 2 | | (96) | (90) |
Operating income | $237 | $134 | | $485 | $382 |
| | | | | |
Income from equity method investments | 2 | 0 | | 4 | 2 |
Interest income | 1 | 1 | | 4 | 5 |
Interest expense | (16) | (16) | | (73) | (73) |
Other non-operating items, net | (6) | (8) | | (23) | (25) |
Income before income taxes | $217 | $111 | | $397 | $291 |
| | | | | |
Income taxes | (60) | (36) | | (127) | (103) |
Net income | $157 | $75 | | $271 | $188 |
| | | | | |
Less: Net income attributable to non-controlling interest | 0 | 0 | | 2 | 1 |
Net income attributable to controlling interest | $157 | $75 | | $269 | $187 |
| | | | | |
Earnings per share2, 3) | $1.79 | $0.86 | | $3.07 | $2.14 |
1) Including Corporate and other sales. 2) Assuming dilution when applicable and net of treasury shares. 3) Participating share awards with right to receive dividend equivalents are (under the two-class method) excluded from EPS calculation. |
12
| | |
Financial Report January – March 2021 | | |
Consolidated Balance Sheets
| | Mar 31 | Dec 31 | Sep 30 | Jun 30 | Mar 31 |
(Dollars in millions, unaudited) | | 2021 | 2020 | 2020 | 2020 | 2020 |
Assets | | | | | | |
Cash & cash equivalents | | $1,254 | $1,178 | $1,477 | $1,223 | $907 |
Receivables, net | | 1,846 | 1,822 | 1,616 | 1,180 | 1,428 |
Inventories, net | | 856 | 798 | 714 | 758 | 772 |
Prepaid expenses and accrued income | | 183 | 164 | 179 | 172 | 145 |
Other current assets | | 260 | 307 | 52 | 50 | 55 |
Total current assets | | $4,399 | $4,269 | $4,037 | $3,383 | $3,307 |
| | | | | | |
Property, plant & equipment, net | | 1,810 | 1,869 | 1,779 | 1,753 | 1,750 |
Operating leases right-of-use assets | | 137 | 141 | 137 | 150 | 149 |
Goodwill | | 1,392 | 1,398 | 1,390 | 1,385 | 1,382 |
Intangible assets, net | | 14 | 14 | 15 | 17 | 19 |
Investments and other non-current assets | | 457 | 466 | 476 | 486 | 367 |
Total assets | | $8,210 | $8,157 | $7,833 | $7,175 | $6,974 |
| | | | | | |
Liabilities and equity | | | | | | |
Short-term debt1) | | $291 | $302 | $1,026 | $493 | $319 |
Accounts payable | | 1,215 | 1,254 | 912 | 616 | 863 |
Accrued expenses | | 1,323 | 1,270 | 1,011 | 848 | 807 |
Operating lease liabilities - current | | 38 | 37 | 36 | 37 | 36 |
Other current liabilities | | 321 | 284 | 237 | 159 | 202 |
Total current liabilities | | $3,188 | $3,147 | $3,221 | $2,152 | $2,226 |
| | | | | | |
Long-term debt1) | | 2,039 | 2,110 | 2,007 | 2,567 | 2,209 |
Pension liability | | 239 | 248 | 239 | 236 | 232 |
Operating lease liabilities - non-current | | 100 | 103 | 102 | 114 | 113 |
Other non-current liabilities | | 123 | 126 | 151 | 150 | 149 |
Total non-current liabilities | | $2,501 | $2,587 | $2,499 | $3,068 | $2,704 |
| | | | | | |
Total parent shareholders’ equity | | 2,507 | 2,409 | 2,100 | 1,942 | 2,031 |
Non-controlling interest | | 14 | 14 | 14 | 14 | 13 |
Total equity | | $2,521 | $2,423 | $2,113 | $1,955 | $2,044 |
| | | | | | |
Total liabilities and equity | | $8,210 | $8,157 | $7,833 | $7,175 | $6,974 |
1) As of September 30, 2020, $600 million of the revolving credit facility loan was classified as short-term debt since it was repaid on October 2, 2020. |
13
| | |
Financial Report January – March 2021 | | |
Consolidated Statements of Cash Flow
| First quarter | | Latest 12 | Full Year |
(Dollars in millions, unaudited) | 2021 | 2020 | | months | 2020 |
Net income | $157 | $75 | | $271 | $188 |
Depreciation and amortization | 99 | 89 | | 381 | 371 |
Other, net | 19 | 11 | | 21 | 13 |
Changes in operating working capital, net | (89) | (19) | | 207 | 277 |
Net cash provided by operating activities | $186 | $156 | | $879 | $849 |
| | | | | |
Expenditures for property, plant and equipment | (94) | (89) | | (348) | (344) |
Proceeds from sale of property, plant and equipment | 1 | 1 | | 4 | 4 |
Net cash used in investing activities | $(93) | $(88) | | $(344) | $(340) |
| | | | | |
Net cash before financing1) | $93 | $68 | | $534 | $509 |
| | | | | |
Net increase (decrease) in short-term debt | 47 | (27) | | (166) | (240) |
Repayment of long-term debt | – | – | | (723) | (723) |
(Decrease) increase in long-term debt | (26) | 500 | | 652 | 1,177 |
Dividends paid | – | (54) | | – | (54) |
Common stock options exercised | 1 | 0 | | 1 | 1 |
Dividend paid to non-controlling interests | – | – | | (1) | (1) |
Net cash (used in) provided by financing activities | $22 | $419 | | $(237) | $160 |
| | | | | |
Effect of exchange rate changes on cash | (39) | (24) | | 50 | 64 |
Increase in cash and cash equivalents | $76 | $463 | | $347 | $733 |
Cash and cash equivalents at period-start | 1,178 | 445 | | 907 | 445 |
Cash and cash equivalents at period-end | $1,254 | $907 | | $1,254 | $1,178 |
1) Non-U.S. GAAP measure comprised of "Net cash provided by operating activities" and "Net cash used in investing activities". See reconciliation table. |
14
| | |
Financial Report January – March 2021 | | |
RECONCILIATION OF U.S. GAAP TO NON-U.S. GAAP MEASURES
In this report we sometimes refer to non-U.S. GAAP measures that we and securities analysts use in measuring Autoliv's performance. We believe that these measures assist investors and management in analyzing trends in the Company's business for the reasons given below. Investors should not consider these non-U.S. GAAP measures as substitutes, but rather as additions, to financial reporting measures prepared in accordance with U.S. GAAP. It should be noted that these measures, as defined, may not be comparable to similarly titled measures used by other companies.
Components in Sales Increase/Decrease
Since the Company historically generates approximately 75% of sales in currencies other than in the reporting currency (i.e. U.S. dollars) and currency rates have been volatile, we analyze the Company's sales trends and performance as changes in organic sales growth. This presents the increase or decrease in the overall U.S. dollar net sales on a comparable basis, allowing separate discussions of the impact of acquisitions/divestitures and exchange rates. The table on page 5 present changes in organic sales growth as reconciled to the change in the total U.S. GAAP net sales.
Trade Working Capital
Due to the need to optimize cash generation to create value for shareholders, management focuses on operationally derived trade working capital as defined in the table below. The reconciling items used to derive this measure are, by contrast, managed as part of our overall management of cash and debt, but they are not part of the responsibilities of day-to-day operations' management.
| Mar 31 | Dec 31 | Sep 30 | Jun 30 | Mar 31 |
(Dollars in millions) | 2021 | 2020 | 2020 | 2020 | 2020 |
Receivables, net | $1,846 | $1,822 | $1,616 | $1,180 | $1,428 |
Inventories, net | $856 | $798 | $714 | $758 | $772 |
Accounts payable | $(1,215) | $(1,254) | $(912) | $(616) | $(863) |
Trade Working capital | $1,487 | $1,366 | $1,418 | $1,322 | $1,337 |
15
| | |
Financial Report January – March 2021 | | |
Net Debt
Autoliv from time to time enters into “debt-related derivatives” (DRD) as a part of our debt management, as part of efficiently managing the Company’s overall cost of funds. Creditors and credit rating agencies use net debt adjusted for DRD in their analyses of the Company’s debt and therefore we provide this non-U.S. GAAP measure. DRD are fair value adjustments to the carrying value of the underlying debt. Also included in the DRD is the unamortized fair value adjustment related to a discontinued fair value hedge which will be amortized over the remaining life of the debt. By adjusting for DRD, the total financial liability of net debt is disclosed without grossing debt up with currency or interest fair values.
| Mar 31 | Dec 31 | Sep 30 | Jun 30 | Mar 31 |
(Dollars in millions) | 2021 | 2020 | 2020 | 2020 | 2020 |
Short-term debt | $291 | $302 | $1,026 | $493 | $319 |
Long-term debt | 2,039 | 2,110 | 2,007 | 2,567 | 2,209 |
Total debt | $2,330 | $2,411 | $3,033 | $3,060 | $2,528 |
Cash & cash equivalents | (1,254) | (1,178) | (1,477) | (1,223) | (907) |
Debt issuance cost/Debt-related derivatives, net | 39 | (19) | 17 | 1 | 9 |
Net debt | $1,115 | $1,214 | $1,573 | $1,838 | $1,630 |
| | Dec 31 | Dec 31 | Dec 31 | Dec 31 |
(Dollars in millions) | | 2019 | 2018 | 2017 | 2016 |
Short-term debt | | $368 | $621 | $20 | $216 |
Long-term debt | | 1,726 | 1,609 | 1,311 | 1,313 |
Total debt | | $2,094 | $2,230 | $1,330 | $1,529 |
Cash & cash equivalents | | (445) | (616) | (960) | (1,227) |
Debt issuance cost/Debt-related derivatives, net | | 0 | 5 | (3) | (3) |
Net debt | | $1,650 | $1,619 | $368 | $299 |
16
| | |
Financial Report January – March 2021 | | |
Leverage ratio
The non-U.S. GAAP measure net debt is also used in the non-U.S. GAAP measure “Leverage ratio”. Management uses this measure to analyze the amount of debt the Company can incur under its debt policy. Management believes that this policy also provides guidance to credit and equity investors regarding the extent to which the Company would be prepared to leverage its operations. For details on leverage ratio refer to the table. In 2021, EBITDA calculation was redefined to exclude other non-operating items and income from equity method investments. Historic EBITDA and leverage ratio has been recalculated resulting in minor adjustments.
| Mar 31 | Dec 31 | Mar 31 |
(Dollars in millions) | 2021 | 2020 | 2020 |
Net debt1) | $1,115 | $1,214 | $1,630 |
Pension liabilities | 239 | 248 | 232 |
Debt per the Policy | $1,354 | $1,462 | $1,861 |
| | | |
Net income2) | $271 | $188 | $426 |
Income taxes2) | 127 | 103 | 180 |
Interest expense, net2, 3) | 69 | 68 | 64 |
Other non-operating items, net2) | 23 | 25 | 18 |
Income from equity method investments2) | (4) | (2) | (1) |
Depreciation and amortization of intangibles2) | 381 | 371 | 349 |
Capacity alignments and separation costs2, 4) | 98 | 99 | 56 |
EBITDA per the Policy (Adjusted EBITDA) | $964 | $852 | $1,092 |
| | | |
Leverage ratio | 1.4 | 1.7 | 1.7 |
1) Short- and long-term debt less cash and cash equivalents and debt-related derivatives. 2) Latest 12 months. 3) Interest expense including cost for extinguishment of debt, if any, less interest income. 4) No separation costs LTM Mar 31, 2021 and Dec 31, 2020. In LTM Mar 31, 2020, separation costs amounted to $1 million. |
17
| | |
Financial Report January – March 2021 | | |
Free Cash Flow, Net Cash Before Financing and Cash Conversion
Management uses the non-U.S. GAAP measure free cash flow to analyze the amount of cash flow being generated by the Company’s operations after capital expenditure, net. This measure indicates the Company’s cash flow generation level that enables strategic value creation options such as dividends or acquisitions. For details on free cash flow see the reconciliation table below. Management uses the non-U.S. GAAP measure net cash before financing to analyze and disclose the cash flow generation available for servicing external stakeholders such as shareholders and debt stakeholders. For details on net cash before financing, see the reconciliation table below. Management uses the non-U.S. GAAP measure cash conversion to analyze the proportion of net income that is converted into free cash flow. The measure is a tool to evaluate how efficient the Company utilizes its resources. For details on cash conversion, see the reconciliation table below.
| First quarter | | Latest 12 | Full Year |
(Dollars in millions) | 2021 | 2020 | | months | 2020 |
Net income | $157 | $75 | | $271 | $188 |
Changes in operating working capital | (89) | (19) | | 207 | 277 |
Depreciation and amortization | 99 | 89 | | 381 | 371 |
Other, net | 19 | 11 | | 21 | 13 |
Operating cash flow | $186 | $156 | | $879 | $849 |
Capital expenditure, net | (93) | (88) | | (344) | (340) |
Free cash flow1) | $93 | $68 | | $534 | $509 |
Net cash before financing | $93 | $68 | | $534 | $509 |
Cash conversion2) | 58.8% | 90.3% | | 197% | 270% |
1) Operating cash flow less Capital expenditures, net. 2) Free cash flow relative to Net income. |
| Full year | Full year | | Full year | Full year |
(Dollars in millions) | 2019 | 20181) | | 20171) | 20161) |
Net income | $463 | $184 | | $303 | $562 |
Changes in operating assets and liabilities | 47 | (229) | | (0) | (78) |
Depreciation and amortization | 351 | 397 | | 426 | 383 |
Goodwill impairment charges | – | – | | 234 | – |
Other, net4) | (220) | 239 | | (27) | 2 |
Operating cash flow | $641 | $591 | | $936 | $868 |
EC antitrust payment | (203) | – | | – | – |
Operating cash flow excl antitrust | $844 | $591 | | $936 | $868 |
Capital expenditure, net | (476) | (555) | | (570) | (499) |
Free cash flow2) | $165 | $36 | | $366 | $370 |
Free cash flow excl antitrust payment5) | $368 | $36 | | $366 | $370 |
Acquisitions of businesses and other, net | – | (73) | | (128) | (227) |
Net cash before financing | $165 | $(37) | | $239 | $142 |
Cash conversion3) | 35.6% | 19.5% | | 121% | 65.8% |
Cash conversion excl antitrust6) | 79.4% | 19.5% | | 121% | 65.8% |
1) Including Discontinued Operations. 2) Operating cash flow less Capital expenditures, net. 3) Free cash flow relative to Net income. 4) Including EC antitrust non-cash provision 2018 and EC antitrust payment 2019. 5) For 2019, Operating cash flow excluding EC antitrust payment less Capital expenditures, net. 6) For 2019, Free cash flow excluding EC antitrust payment relative to Net income. |
18
| | |
Financial Report January – March 2021 | | |
Items Affecting Comparability
We believe that comparability between periods is improved through the exclusion of certain items. To assist investors in understanding the operating performance of Autoliv's business, it is useful to consider certain U.S. GAAP measures exclusive of these items. Accordingly, the tables below reconcile from U.S. GAAP to the equivalent non-U.S. GAAP measure.
| First quarter 2021 | | First quarter 2020 |
(Dollars in millions, except per share data) | Reported
U.S. GAAP | Adjust-ments1) | Non-U.S.
GAAP | | Reported
U.S. GAAP | Adjust-ments1) | Non-U.S.
GAAP |
Operating income | $237 | – | $237 | | $134 | $2 | $136 |
Operating margin, % | 10.6 | – | 10.6 | | 7.3 | 0.1 | 7.4 |
Income before taxes | $217 | – | $217 | | $111 | $2 | $113 |
Net income attributable to controlling interest | $157 | – | $157 | | $75 | $2 | $76 |
Capital employed | $3,635 | – | $3,635 | | $3,674 | $2 | $3,676 |
Return on capital employed, %2) | 26.3 | – | 26.3 | | 14.5 | 0.1 | 14.6 |
Return on total equity, %3) | 25.4 | – | 25.4 | | 14.4 | 0.3 | 14.7 |
Earnings per share4, 5) | $1.79 | – | $1.79 | | $0.86 | $0.02 | $0.88 |
Total parent shareholders' equity per share | $28.68 | – | $28.68 | | $23.26 | $0.02 | $23.28 |
1) Costs for capacity alignment. 2) Annualized operating income and income from equity method investments, relative to average capital employed. 3) Annualized income relative to average total equity. 4) Assuming dilution and net of treasury shares. 5) Participating share awards with right to receive dividend equivalents are (under the two-class method) excluded from the EPS calculation. |
| Latest 12 months | | Full year 2020 |
(Dollars in millions) | Reported
U.S. GAAP | Adjust-ments1) | Non-U.S.
GAAP | | Reported
U.S. GAAP | Adjust-ments1) | Non-U.S.
GAAP |
Operating income | $485 | $98 | $583 | | $382 | $99 | $481 |
Operating margin, % | 6.2 | 1.2 | 7.4 | | 5.1 | 1.4 | 6.5 |
1) Costs for capacity alignment. |
| Full year 2019 | | Full year 2018 |
(Dollars in millions) | Reported
U.S. GAAP | Adjust-ments1) | Non-U.S.
GAAP | | Reported
U.S. GAAP | Adjust-ments1) | Non-U.S.
GAAP |
Operating income | $726 | $49 | $774 | | $686 | $222 | $908 |
Operating margin, % | 8.5 | 0.6 | 9.1 | | 7.9 | 2.6 | 10.5 |
1) Costs for capacity alignment and antitrust related matters and separation of our business segments. |
| Full year 2017 | | Full year 2016 |
(Dollars in millions) | Reported
U.S. GAAP | Adjust-ments1) | Non-U.S.
GAAP | | Reported
U.S. GAAP | Adjust-ments1) | Non-U.S.
GAAP |
Operating income | $860 | $40 | $899 | | $831 | $35 | $866 |
Operating margin, % | 10.6 | 0.5 | 11.1 | | 10.5 | 0.4 | 10.9 |
1) Costs for capacity alignment and antitrust related matters. |
19
| | |
Financial Report January – March 2021 | | |
Items included in Non-U.S. GAAP adjustments | First quarter 2021 | | First quarter 2020 |
| Adjustment
Millions | Adjustment
Per share | | Adjustment
Millions | Adjustment
Per share |
Capacity alignment | – | – | | $2 | $0.02 |
Total adjustments to operating income | – | – | | $2 | $0.02 |
Tax on non-U.S. GAAP adjustments1) | – | – | | 0 | 0.00 |
Total adjustments to net income | – | – | | $2 | $0.02 |
| | | | | |
Average number of shares outstanding - diluted2) | | n/a | | | 87.4 |
| | | | | |
Annualized adjustment on return on capital employed | n/a | | | $6 | |
Adjustment return on capital employed, % | n/a | | | 0.1 | |
| | | | | |
Annualized adjustment on return on total equity | n/a | | | $6 | |
Adjustment return on total equity, % | n/a | | | 0.3 | |
1) The tax is calculated based on the tax laws in the respective jurisdiction(s) of the adjustment(s). 2) Annualized average number of outstanding shares |
20
Multi-year Summary
Continuing Operations unless noted
| | | | | |
(Dollars in millions, unaudited) | 2020 | 2019 | 2018 | 2017 | 2016 |
Sales and Income | | | | | |
Net sales | $7,447 | $8,548 | $8,678 | $8,137 | $7,922 |
Airbag sales1) | 4,824 | 5,676 | 5,699 | 5,342 | 5,256 |
Seatbelt sales | 2,623 | 2,871 | 2,980 | 2,794 | 2,665 |
Operating income | 382 | 726 | 686 | 860 | 831 |
Net income attributable to controlling interest | 187 | 462 | 376 | 586 | 558 |
Earnings per share (US$) – basic2) | 2.14 | 5.29 | 4.32 | 6.70 | 6.33 |
Earnings per share (US$) – assuming dilution2, 3) | 2.14 | 5.29 | 4.31 | 6.68 | 6.32 |
Gross margin, %4) | 16.7 | 18.5 | 19.7 | 20.6 | 20.6 |
R,D&E net in relation to sales, % | (5.0) | (4.7) | (4.8) | (4.6) | (4.5) |
S,G &A net in relation to sales, % | (5.2) | (4.7) | (4.5) | (5.0) | (5.0) |
Operating margin, %5) | 5.1 | 8.5 | 7.9 | 10.6 | 10.5 |
Adjusted operating margin, %6, 7) | 6.5 | 9.1 | 10.5 | 11.1 | 10.9 |
Balance Sheet | | | | | |
Trade working capital | 1,366 | 1,417 | 1,396 | 1,444 | 1,245 |
Trade working capital in relation to sales, % | 18.3 | 16.6 | 16.1 | 17.7 | 15.7 |
Receivables outstanding in relation to sales, %8) | 24.5 | 19.0 | 19.2 | 20.9 | 19.1 |
Inventory outstanding in relation to sales, %9) | 10.7 | 8.7 | 8.7 | 8.7 | 7.7 |
Payables outstanding in relation to sales, %10) | 16.8 | 11.1 | 11.9 | 11.8 | 11.1 |
Total equity | 2,423 | 2,122 | 1,897 | 4,169 | 3,926 |
Total parent shareholders’ equity per share (US$) | 27.56 | 24.19 | 21.63 | 46.38 | 41.69 |
Current assets excluding cash | 3,091 | 2,557 | 2,670 | 2,598 | 2,269 |
Property, plant and equipment, net | 1,869 | 1,816 | 1,690 | 1,609 | 1,329 |
Intangible assets (primarily goodwill) | 1,412 | 1,410 | 1,423 | 1,440 | 1,430 |
Capital employed | 3,637 | 3,772 | 3,516 | 4,538 | 4,225 |
Net debt7) | 1,214 | 1,650 | 1,619 | 368 | 299 |
Total assets | 8,157 | 6,771 | 6,722 | 6,947 | 6,565 |
Long-term debt | 2,110 | 1,726 | 1,609 | 1,311 | 1,313 |
Return on capital employed, %11, 12) | 10 | 20 | 17 | n/a | n/a |
Return on total equity, %12, 13) | 9 | 23 | 13 | n/a | n/a |
Total equity ratio, % | 30 | 31 | 28 | 49 | 48 |
Cash flow and other data | | | | | |
Operating Cash flow14) | 849 | 641 | 591 | 936 | 868 |
Depreciation and amortization14) | 371 | 351 | 397 | 426 | 383 |
Capital expenditures, net14) | 340 | 476 | 555 | 570 | 499 |
Capital expenditures, net in relation to sales, %14) | 4.6 | 5.6 | 5.7 | 5.5 | 4.9 |
Free Cash flow7, 14, 15) | 509 | 165 | 36 | 366 | 369 |
Cash conversion, %7, 14, 16) | 270 | 35.6 | 19.5 | 121 | 65.7 |
Direct shareholder return14, 17) | 54 | 217 | 214 | 366 | 203 |
Cash dividends paid per share (US$) | 0.62 | 2.48 | 2.46 | 2.38 | 2.30 |
Number of shares outstanding (millions)18) | 87.4 | 87.2 | 87.1 | 87.0 | 88.2 |
Number of employees, December 31 | 61,000 | 58,900 | 57,700 | 56,700 | 55,800 |
1) Including steering wheels, inflators and initiators. 2) Participating share awards with right to receive dividend equivalents are (under the two-class method) excluded from the EPS calculation. 3) Assuming dilution and net of treasury shares. 4) Gross profit relative to sales. 5) Operating income relative to sales. 6) Excluding costs for capacity alignment, antitrust related matters and separation of our business segments. 7) Non-US GAAP measure, for reconciliation see tables above. 8) Outstanding receivables relative to annualized sales. 9) Outstanding inventory relative to annualized sales. 10) Outstanding payables relative to annualized sales. 11) Operating income and income from equity method investments, relative to average capital employed. 12) The Company has decided not to recalculate prior periods since the distribution of Veoneer had a significant impact on total equity and capital employed making the comparison less meaningful. 13) Income relative to average total equity. 14) Including Discontinued Operations. 15) Operating cash flow less Capital expenditures, net. 16) Free cash flow relative to Net income. 17) Dividends paid and Shares repurchased. 18) At year end, excluding dilution and net of treasury shares. |